2012 DUG Eagle Ford Conference The Pearsall Play Rusty...
19
2012 DUG Eagle Ford Conference The Pearsall Play Rusty Shepherd Chief Executive Officer Momentum Oil & Gas, LLC October 16, 2012 1
-
Upload
truongphuc -
Category
Documents
-
view
220 -
download
2
Transcript of 2012 DUG Eagle Ford Conference The Pearsall Play Rusty...
2012 DUG Eagle Ford Conference
The Pearsall Play
Rusty Shepherd Chief Executive Officer
Momentum Oil & Gas, LLC
October 16, 2012
1

2
The Pearsall Play Presentation Overview
Company Overview
What We Know about the Pearsall Play at This Time
Historical Pearsall Activity [1965-Present]
Log Analysis Across the Trend
Recent Industry Test Results
Predicting Hydrocarbon Windows
Play Outlook

3
The Pearsall Play Company Overview
Inception Founded by Rusty Shepherd & Loren Long; Jan 2011
Strategy Acquire Long-Life, Producing Oil and Gas Properties
with Significant, Previously Unrecognized Upside
Funding Kayne Anderson Fund V and Management Team
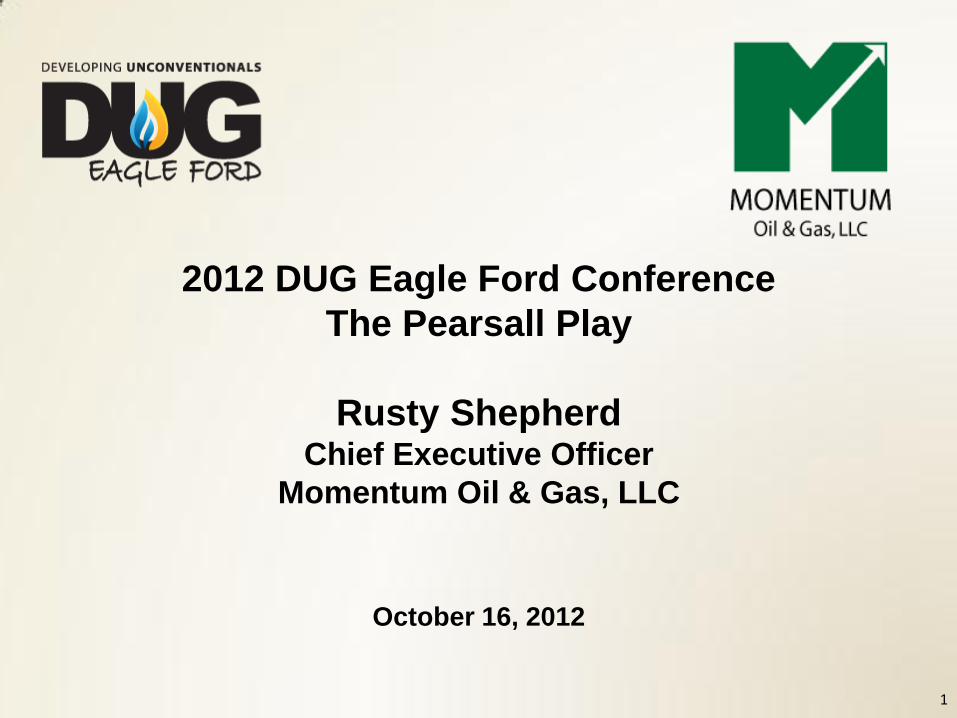
Highlights 1) Acquired Fashing Field in June 2011 from NFX
2) Commenced Leasing Pearsall Acreage in Jan 2012
Focus Continuing Pearsall Leasing Efforts [~20,000 Acres]
Preparing to Drill First Pearsall Well in 2013
4
Company Overview Fashing Field Was Acquired June 2011 from Newfield Exploration

5
Company Overview Momentum Core Areas Established with Non-Traditional Approach
FASHING
STAHL
LITTLE
FOUR CORNERS
Momentum Acreage 21,956 Gross Acres 18,885 Net Acres
6
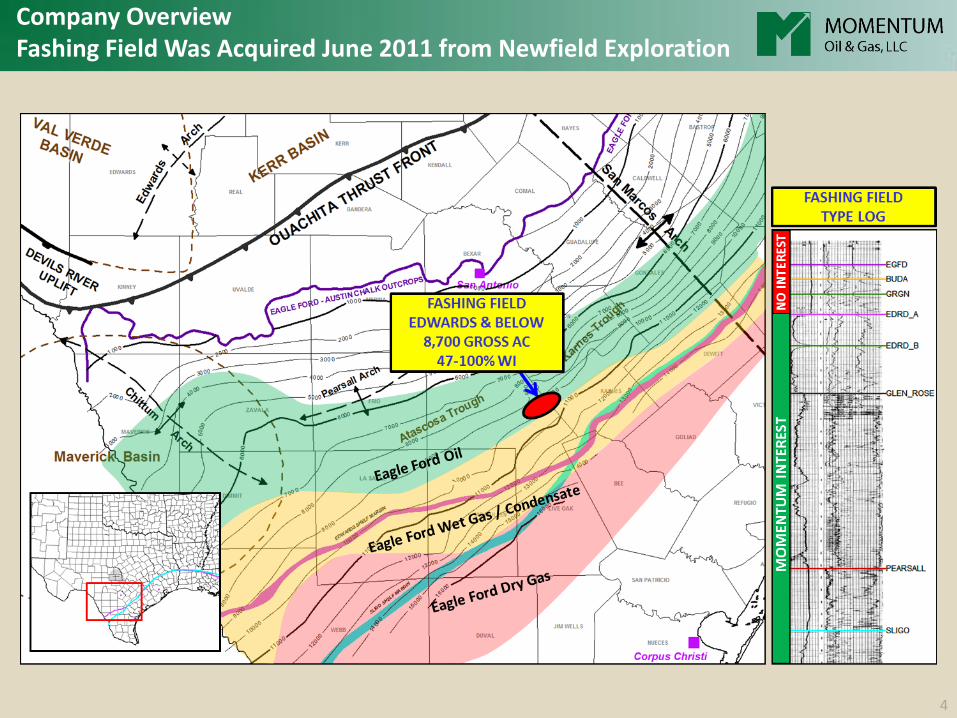
The Pearsall Play What We Know about the Pearsall at This Time
Relatively Thick and Lithologically Variable
Capable of Flowing Hydrocarbons
Dry Gas, Gas-Condensate, and Oil Productive Areas Have Been Identified
Regional Log Analysis Project Indicates the Thickest Apparent Net Pay is in SE Atascosa County
Industry Activity is Rapidly Increasing

7
What We Know about the Pearsall at This Time Regional Pearsall Stratigraphy
Contains Three Members Which Are Vertically and Laterally Variable:
Bexar Shale Cow Creek / James Limestone Pine Island Shale
Source: Loucks, 2002
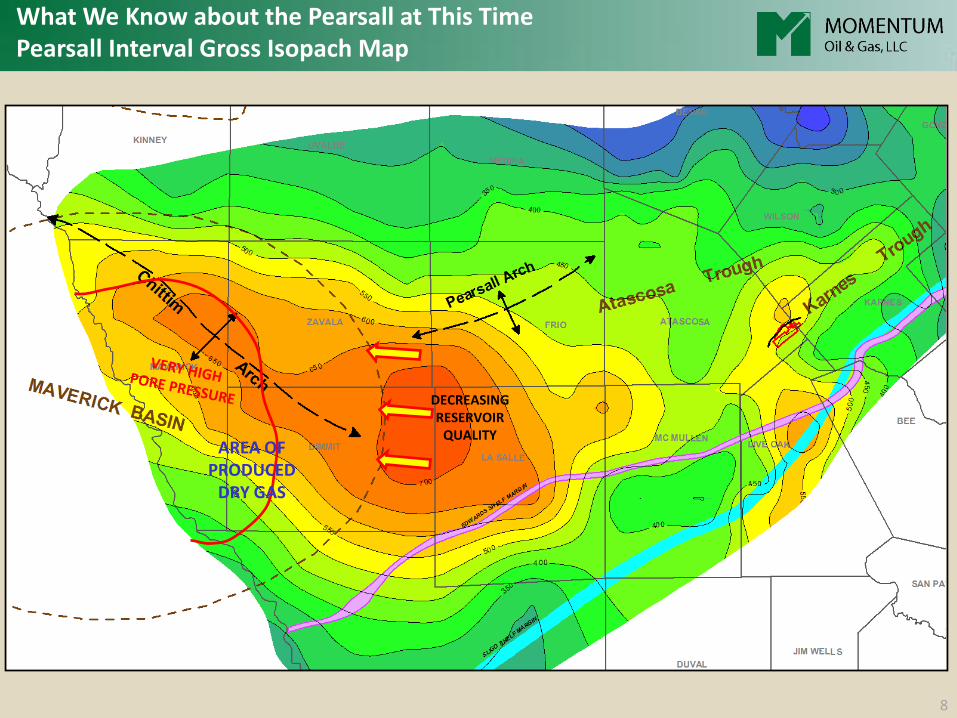
AREA OF PRODUCED
DRY GAS
DECREASING RESERVOIR
QUALITY
8
What We Know about the Pearsall at This Time Pearsall Interval Gross Isopach Map

9
What We Know about the Pearsall at This Time Top of the Pearsall Structure Map (MD)
10
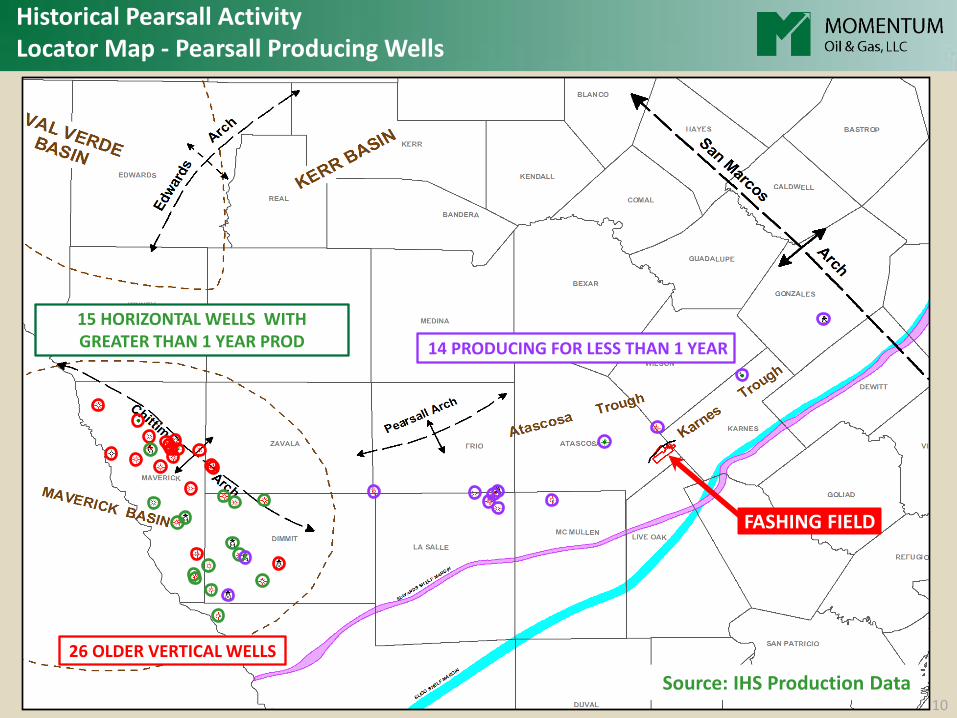
Historical Pearsall Activity Locator Map - Pearsall Producing Wells
26 OLDER VERTICAL WELLS
15 HORIZONTAL WELLS WITH GREATER THAN 1 YEAR PROD 14 PRODUCING FOR LESS THAN 1 YEAR
Source: IHS Production Data
FASHING FIELD
11
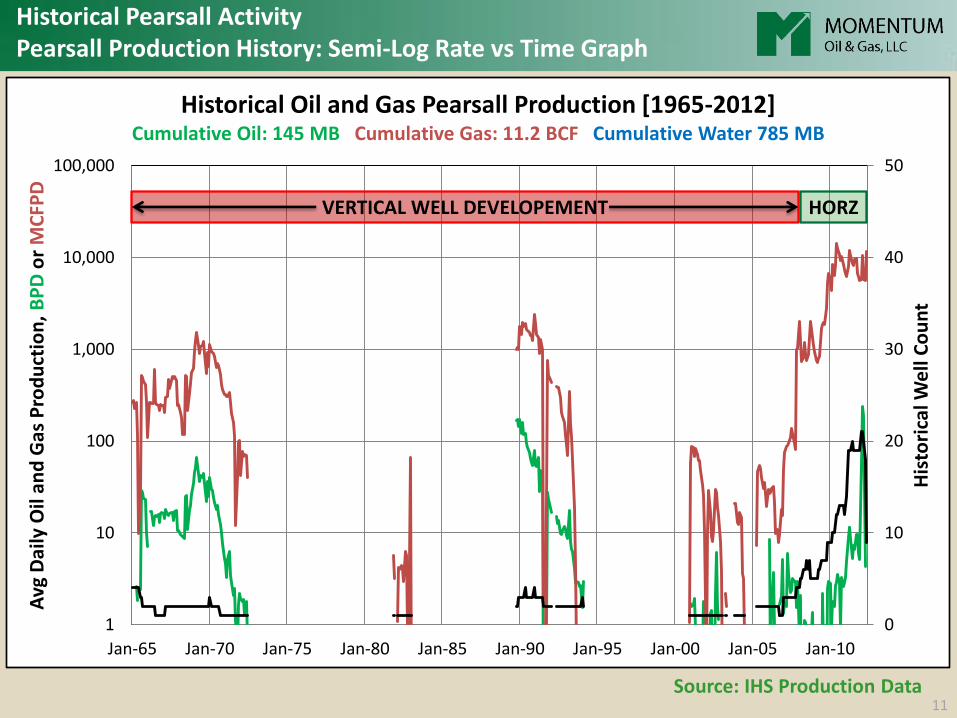
Historical Pearsall Activity Pearsall Production History: Semi-Log Rate vs Time Graph
0
10
20
30
40
50
1
10
100
1,000
10,000
100,000
Jan-65 Jan-70 Jan-75 Jan-80 Jan-85 Jan-90 Jan-95 Jan-00 Jan-05 Jan-10
His
tori
cal W
ell
Co
un
t
Avg
Dai
ly O
il an
d G
as P
rod
uct
ion
, B
PD
or
MC
FPD
Historical Oil and Gas Pearsall Production [1965-2012] Cumulative Oil: 145 MB Cumulative Gas: 11.2 BCF Cumulative Water 785 MB
VERTICAL WELL DEVELOPEMENT HORZ
Source: IHS Production Data

12
Historical Pearsall Activity Horizontal Well Performance: Semi-Log Rate vs Time Graph
10
100
1,000
10,000
1 3 5 7 9 11 13 15 17 19 21 23 25 27 29 31 33 35 37 39 41 43 45
Ave
rage
Dai
ly G
as R
ate
, MC
FPD
Months from Production Start
Normalized Individual Well Production Min of 1 Year Prod Start Date Range 4/08 to 3/11
Source: IHS Production Data
Statistics Avg High Low EUR 1.0 Bcf 3.5 Bcf 0.2 Bcf IP 2.3 MM/d 5.0 MM/d 0.4 MM/d Initial Decline 97.6% 89.0% 99.9% Hyperbolic ‘b’ 1.2 2.2 0.7 Yield 0.5 B/MM 28 B/MM 0.0 B/MM

13
The Pearsall Play Log Analysis Across the Trend
FASHING FIELD FOUR CORNERS

14
Log Analysis Across the Trend Variable Net Pay Seen Across the Trend
FASHING
BEST CALCULATED APPARENT GAS SATURATION IS IN THE FASHING FIELD AREA
FOUR CORNERS
UPPER COW CREEK
PINE ISLAND SHALE
APPARENT PAY DISTRIBUTION IS NOT NECESSARILY STRATIGRAPHICALLY RELATED
LOWER BEXAR
15
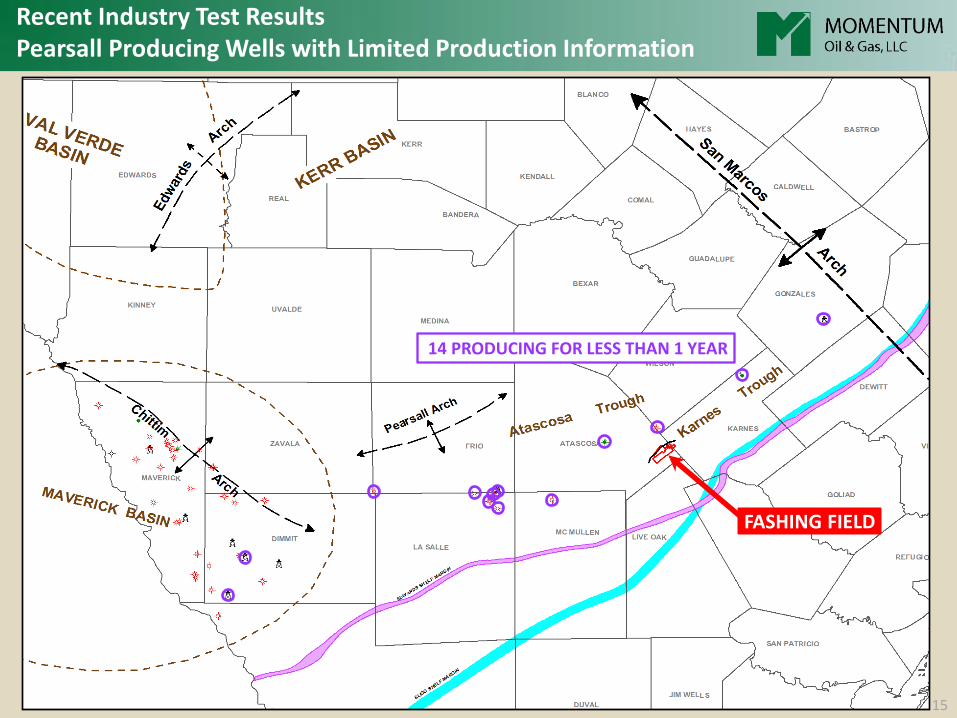
Recent Industry Test Results Pearsall Producing Wells with Limited Production Information
FASHING FIELD
14 PRODUCING FOR LESS THAN 1 YEAR
16
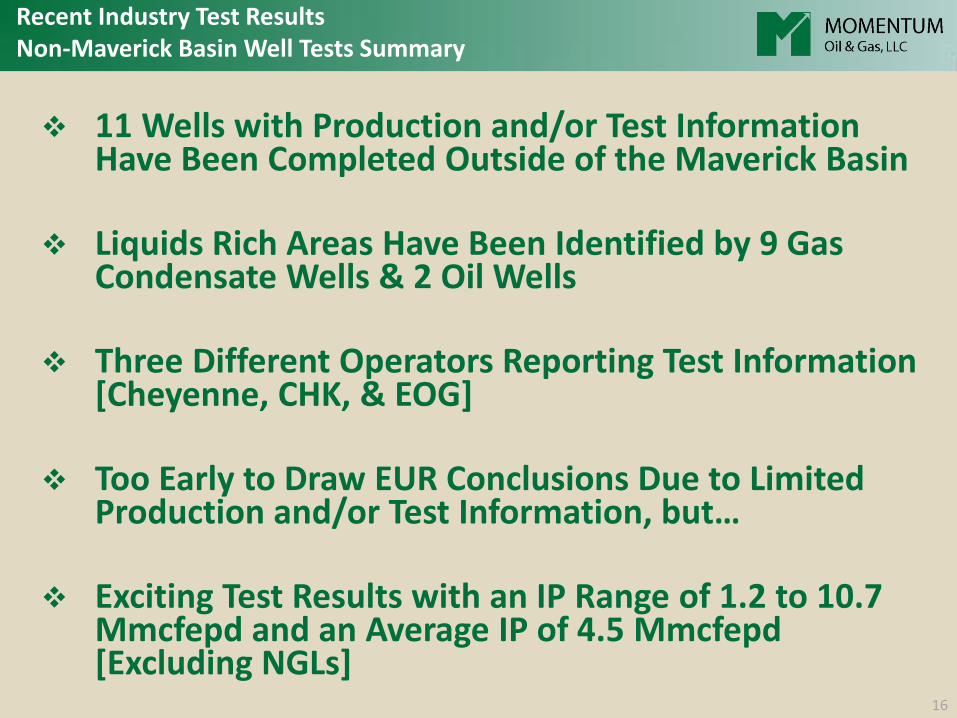
Recent Industry Test Results Non-Maverick Basin Well Tests Summary
11 Wells with Production and/or Test Information Have Been Completed Outside of the Maverick Basin
Liquids Rich Areas Have Been Identified by 9 Gas Condensate Wells & 2 Oil Wells
Three Different Operators Reporting Test Information [Cheyenne, CHK, & EOG]
Too Early to Draw EUR Conclusions Due to Limited Production and/or Test Information, but…
Exciting Test Results with an IP Range of 1.2 to 10.7 Mmcfepd and an Average IP of 4.5 Mmcfepd [Excluding NGLs]
17
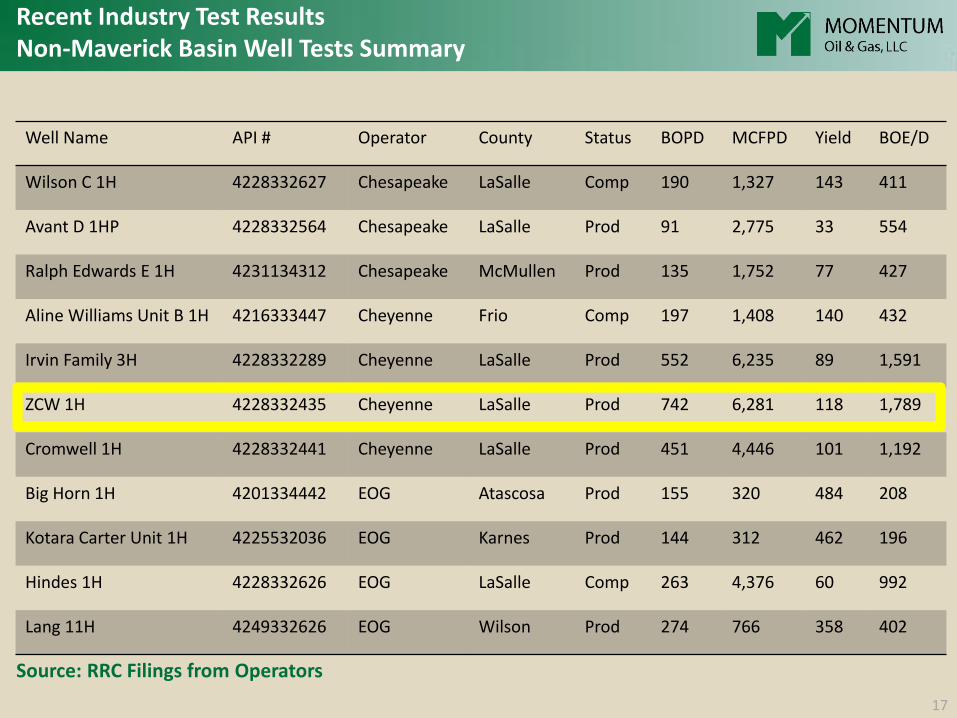
Recent Industry Test Results Non-Maverick Basin Well Tests Summary
Well Name API # Operator County Status BOPD MCFPD Yield BOE/D
Wilson C 1H 4228332627 Chesapeake LaSalle Comp 190 1,327 143 411
Avant D 1HP 4228332564 Chesapeake LaSalle Prod 91 2,775 33 554
Ralph Edwards E 1H 4231134312 Chesapeake McMullen Prod 135 1,752 77 427
Aline Williams Unit B 1H 4216333447 Cheyenne Frio Comp 197 1,408 140 432
Irvin Family 3H 4228332289 Cheyenne LaSalle Prod 552 6,235 89 1,591
ZCW 1H 4228332435 Cheyenne LaSalle Prod 742 6,281 118 1,789
Cromwell 1H 4228332441 Cheyenne LaSalle Prod 451 4,446 101 1,192
Big Horn 1H 4201334442 EOG Atascosa Prod 155 320 484 208
Kotara Carter Unit 1H 4225532036 EOG Karnes Prod 144 312 462 196
Hindes 1H 4228332626 EOG LaSalle Comp 263 4,376 60 992
Lang 11H 4249332626 EOG Wilson Prod 274 766 358 402
Source: RRC Filings from Operators
18
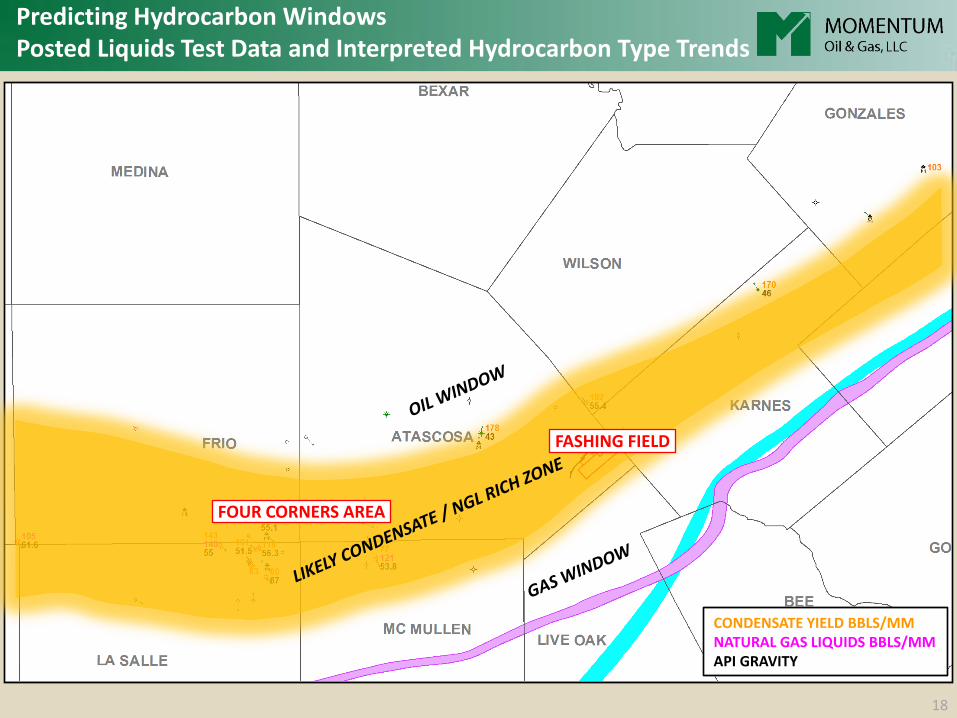
Predicting Hydrocarbon Windows Posted Liquids Test Data and Interpreted Hydrocarbon Type Trends
CONDENSATE YIELD BBLS/MM NATURAL GAS LIQUIDS BBLS/MM API GRAVITY
FASHING FIELD
FOUR CORNERS AREA

19
The Pearsall Play Summary and Outlook
The Central Gulf Coast Region Is Currently the Most Exciting Area of the Play
Existing Infrastructure Allows for Rapid Development Missing Ingredient Is Long-Term Well Performance
Multiple “World Class” Operators Are Working the
Play and Should Quickly Identify the Sweet Spot(s)
Due to the Limitation of Available Acreage in the Most Prospective Areas, the Play Will Be Difficult to Enter…
Look for M&A and JV’s to Continue


![&RQILJXUDWLRQ :L]DUG](https://static.fdocuments.in/doc/165x107/61a8afa4f70c766d3378a956/amprqiljxudwlrq-ldug.jpg)