2012 CHD Statistics Compendium
211
Coronary heart disease statistics A compendium of health statistics 2012 edition British Heart Foundation Health Promotion Research Group Department of Public Health, University of Oxford
-
Upload
stephtan91 -
Category
Documents
-
view
108 -
download
1
Transcript of 2012 CHD Statistics Compendium

Coronary heart disease statisticsA compendium of health statistics2012 editionBritish Heart Foundation Health Promotion Research Group Department of Public Health, University of Oxford

© British Heart Foundation, October 2012
ISBN 978-1-899088-12-6
All rights reserved. No part of this publication may be reproduced or transmitted, in any form or by any means, electronic, photocopying or otherwise without prior permission of the publishers. NHS workers and teachers may make photocopies for education purposes only, provided that no charge or profit is made for any course or event for which they are used.
Published by the British Heart Foundation, Greater London House, 180 Hampstead Road, London NW1 7AW www.bhf.org.uk
Registered Charity No 225971
Edited by Peter Weissberg, British Heart Foundation
Compiled by Nick Townsend, Kremlin Wickramasinghe, Prachi Bhatnagar, Kate Smolina, Mel Nichols, Jose Leal, Ramon Luengo-Fernandez and Mike Rayner, British Heart Foundation Health Promotion Research Group, Department of Public Health, University of Oxford, Old Rd Campus, Headington, Oxford OX3 7LF http://www.publichealth.ox.ac.uk/bhfhprg
Suggested citation:
Townsend N, Wickramasinghe K, Bhatnagar P, Smolina K, Nichols M, Leal J, Luengo-Fernandez R, Rayner M (2012). Coronary heart disease statistics 2012 edition. British Heart Foundation: London.

Coronary heart disease statisticsA compendium of health statistics2012 edition
Nick Townsend, Kremlin Wickramasinghe, Prachi Bhatnagar, Kate Smolina, Mel Nichols, Jose Leal, Ramon Luengo-Fernandez and Mike RaynerBritish Heart Foundation Health Promotion Research GroupDepartment of Public Health, University of Oxford

2 Coronary heart disease statistics 2012
Foreword 8
Introduction 9
Summary 10
Glossary 11
Chapter 1 Mortality 14
Targets
CVD mortality targets, by country, UK Table 1.1 16
Tracking English CVD target Figure 1.1a 17
Tracking English CVD inequalities target Figure 1.1b 17
Tracking Scottish CHD target Figure 1.1c 18
Tracking Welsh CHD target Figure 1.1d 18
Deaths by cause
Numbers of deaths, by sex and age, UK Table 1.2 19
Numbers of deaths, by sex and country, UK Table 1.3 20
Male deaths, by cause, all ages Figure 1.3a 21
Female deaths, by cause, all ages Figure 1.3b 21
Male deaths (premature), by cause, under 75 Figure 1.3c 21
Female deaths (premature), by cause, under 75 Figure 1.3d 21
Age-standardised death rates from myocardial infarction, England and Scotland Table 1.4, Figure 1.4 22, 23
Excess winter mortality
Excess winter CVD mortality, by sex, England and Wales Table 1.5 23
Time and geographical trends
Age-specific CHD time trends, UK Table 1.6, Figure 1.6a,b 24, 25
Time trends in myocardial infarction, by sex, England and Scotland Table 1.7 26
Time trends in sudden deaths from myocardial infarction, by sex, England Table 1.8, Figure 1.8 27
Time trends in CHD, by Government Office Region, UK Table 1.9a,b 28, 29
Time trends in myocardial infarction, by Government Office Region, England Table 1.10 30
CHD deaths and death rates (all ages and premature) by sex and local authority Table 1.11, 31–42 Figure 1.11a,b 43, 44
Socio-economic differences
CVD, CHD, Stroke mortality rates, by sex and socioeconomic status, England and Wales Table 1.12, Figure 1.12 45, 46
Time trends in CHD, by sex and deprivation quintile, Great Britain Table 1.13, Figure 1.13a,b 47, 48
Contents

British Heart Foundation and University of Oxford 3
International differences
Time trends in CVD death rates, Europe Table 1.14a,b 49
CVD death rates, selected European countries Figure 1.14 51
Time trends in CHD death rates, Europe Table 1.15a,b 52, 53
Changes in CHD death rates, selected European countries Figure 1.15 54
Chapter 2 Morbidity 56
Incidence
Time trends in myocardial infarction, by sex and age, England and Scotland Table 2.1, Figure 2.1 60, 61
Myocardial infarction, by Government Office Region, England Table 2.2, Figure 2.2 62
Time trends in hospitalised myocardial infarction, by sex and age, England Table 2.3, Figure 2.3 63
Myocardial infarction, by sex and age, England Table 2.4, Figure 2.4 64
Time trends in stroke, by sex and age, England and Scotland Table 2.5, Figure 2.5 65
Angina, by sex, age and country, UK Table 2.6 66
Heart Failure, by sex, age and country, UK Table 2.7 67
Case-fatality
Myocardial infarction, by sex, England and Scotland Table 2.8 68
Time trends in myocardial infarction, by sex and age, England Table 2.9, Figure 2.9 69
Time trends in myocardial infarction by Government Office Region, England Table 2.10, Figure 2.10 70
Myocardial infarction, by sex and age, England Table 2.11, Figure 2.11 71
Stroke, by sex and age, England and Scotland Table 2.12 72
Prevalence
CHD, stroke, myocardial infarction, angina, by sex and age, England Table 2.13 73
CHD, stroke, myocardial infarction, angina, by sex and age, Scotland Table 2.14 74
Heart conditions, stroke, myocardial infarction, angina, heart failure, by sex and age, Wales Table 2.15 75
Stroke, myocardial infarction, angina, by sex and age, Northern Ireland Table 2.16 76
Myocardial infarction, stroke, angina, by sex and country, UK Figure 2.16a,b,c 77–79
Angina, by sex, age and country, UK Table 2.17 80
Heart failure, by sex, age and country, UK Table 2.18 81
CHD, stroke, hypertension by health authority (region), UK Table 2.19 82
Time trend CVD, by sex and age, Great Britain Table 2.20, Figure 2.20 83, 84

4 Coronary heart disease statistics 2012
Contents (Continued)
Chapter 3 Treatment 86
Prescriptions for CVD
Time trends, England Table 3.1, Figure 3.1 89, 90
Number of prescriptions, by country, UK Table 3.2 91
Revascularisations
Time trends in CABGs, PCIs, UK Table 3.3, Figure 3.3 92, 93
Inpatient episodes
Main diagnosis, by sex, England, Scotland and Wales Table 3.4 94
Main diagnosis, England Figure 3.4a,b 95
Main diagnosis, Scotland Figure 3.4c,d 96
Hospital discharges
Time trends for CVD, by country, Europe Table 3.5 97
Time trends for CHD, by country, Europe Table 3.6, Figure 3.6 98, 99
Time trends for stroke, by country, Europe Table 3.7, Figure 3.7 100, 101
Smoking cessation
Time trends in smoking cessation service outcomes, England, Scotland and Northern Ireland Table 3.8 102
Ambulance services
Time trends in responses to emergency calls within eight minutes, England and Scotland Table 3.9 103
Treatment after a heart attack
Time trends in thrombolytic treatment and use of secondary prevention medication, England and Wales Table 3.10 104
Chapter 4 Behavioural risk factors 106
Smoking
Time trends in smoking prevalence, by sex and age, Great Britain Table 4.1, Figure 4.1 110–112
Time trends in smoking prevalence, by sex and age, Northern Ireland Table 4.2 113
Prevalence of cigarette smoking, by sex and region, UK Table 4.3 114
Prevalence of cigarette smoking, by sex and socioeconomic status, Great Britain and Northern Ireland Table 4.4, Figure 4.4a,b 115–117
Prevalence of cigarette smoking, by sex, age and ethnic group, England Table 4.5 118
Time trends in prevalence of smoking in young people, by sex and age, England, Scotland, Wales and Northern Ireland Table 4.6 119
Prevalence of tobacco use, by sex and country, the World Table 4.7 120

British Heart Foundation and University of Oxford 5
Diet
Time trends in consumption of fat, salt, sugar, fibre, fruit and vegetables, Great Britain Table 4.8 124
Time trends in consumption of selected foods, UK Table 4.9, Figure 4.9a,b,c 125–127
Quality of diet, by sex, UK Table 4.10 128
Consumption of salt, England, Scotland, Wales and UK Table 4.11 129
Consumption of fat, salt, sugar, fibre, fruit and vegetables, by Government Office Region Table 4.12 130
Consumption of fat, salt, sugar, fibre, fruit and vegetables, by income quintile, UK Table 4.13, Figure 4.13 131
Consumption of fat, salt, sugar, fibre, fruit and vegetables, by ethnic group, UK Table 4.14 132
Time trend in consumption of fruit and vegetables in children, by sex and age, England Table 4.15 133
Total energy available from fat and availability of fruit and vegetables, by country, Europe Table 4.16 134
Physical inactivity
Time trends in prevalence, England, Scotland, Wales and Northern Ireland Table 4.17 135
Prevalence, by sex and age, England, Scotland, Wales and Northern Ireland Table 4.18 136
Prevalence, by sex and strategic health authority, England Table 4.19 137
Prevalence, by sex and income quintile, England Table 4.20, Figure 4.20 138
Prevalence, by sex and ethnic group, England Table 4.21 139
Prevalence in children’s physical activity levels, England and Scotland Table 4.22 140
Prevalence of exercise and sport, by country, European Union Table 4.23, Figure 4.23 141, 142
Prevalence outside of sport, by country, European Union Table 4.24, Figure 4.24 143, 144
Alcohol
Consumption, by sex and age, Great Britain Table 4.25, Figure 4.25 145, 146
Time trends in heavy drinking, Great Britain Table 4.26, Figure 4.26 147, 148
Time trends in consumption in children, by sex and age, England Table 4.27 149
Time trends in consumption in children, by sex and age, Scotland Table 4.28 150
Heavy drinking, by sex and country or region, Great Britain Table 4.29, Figure 4.29a,b 151–153
Consumption, by sex and socioeconomic status, Great Britain Table 4.30, Figure 4.30 154, 155
Consumption, by sex and ethnic group, England Table 4.31 156
Frequency of heavy drinking, by country, European Union Table 4.32, Figure 4.32 157, 158

6 Coronary heart disease statistics 2012
Chapter 5 Medical risk factors 160
Blood pressure
Definitions and recommendation for treatment, UK Table 5.1 165
Time trends in prevalence of hypertension, by sex and age, England Table 5.2, Figure 5.2a,b 166, 167
Blood pressure levels, by sex and age, England Table 5.3, Figure 5.3 168, 169
Blood pressure levels, by sex and age, Scotland Table 5.4 170, 171
Prevalence of hypertension, by sex and age, Wales Table 5.5 172
Blood pressure levels, by sex and strategic health authority, England Table 5.6 172
Blood pressure levels, by sex and income, England Table 5.7 173
Prevalence of hypertension, by ethnic group, England Table 5.8 173
Prevalence of hypertension, by sex and country, Europe Table 5.9, Figure 5.9 174, 175
Cholesterol
Recommendations and target, UK Table 5.10 175
Time trends in high cholesterol prevalence, England Table 5.11, Figure 5.11 176, 177
Prevalence of low HDL-cholesterol, by sex and age, England Table 5.12 177
Prevalence of total cholesterol and low HDL-cholesterol, by sex, English Government Office Region and Scotland Table 5.13 178
Prevalence of total cholesterol and low HDL-cholesterol, by sex and income, England Table 5.14 179
Prevalence of total cholesterol and low HDL-cholesterol, by sex and ethnic group, England Table 5.15 180
Obesity
Targets, UK Table 5.16 181
Prevalence of BMI status categories, by sex and age, England Table 5.17, Figure 5.17 182, 183
Prevalence of raised waist circumference, by sex and age, England Table 5.18 183
Overweight and obesity in children, by sex and age, England Table 5.19 184
Prevalence of BMI status categories in children, by sex and school year, England Table 5.20 185
Time trends in prevalence of obesity, by sex and age, England Table 5.21, Figure 5.21 186, 187
Time trends in prevalence of overweight and obesity in children, by sex, England, Scotland, Wales and Northern Ireland Table 5.22, Figure 5.22 188, 189
Prevalence of BMI status categories, by sex and Government Office Region, England Table 5.23 190
Prevalence of BMI status categories, by sex and income, England Table 5.24 191
Prevalence of raised waist circumference, by sex and income, England Table 5.25 191
BMI, waist-hip ratio and waist circumference, by sex and ethnic group, England Table 5.26, Figure 5.26a,b 192, 193
Prevalence of overweight and obese in children, by sex, Europe Table 5.27 194
Contents (Continued)

British Heart Foundation and University of Oxford 7
Diabetes
Prevalence of diagnosed diabetes, by sex and age, England Table 5.28 195
Prevalence of diagnosed diabetes, by sex and age, Scotland Table 5.29 195
Prevalence of diagnosed diabetes, by sex and age, Wales Table 5.30 196
Prevalence of diagnosed diabetes, by sex and age, Northern Ireland Table 5.31 196
Time trends in the prevalence of diagnosed diabetes, by sex and country, UK Table 5.32, Figure 5.32a,b 197, 198
Prevalence of diagnosed diabetes, by sex and strategic health authority, England Table 5.33 199
Prevalence of diagnosed diabetes, by sex and income, England Table 5.34 199
Prevalence of diagnosed diabetes, by sex and ethnic group, England Table 5.35, Figure 5.35 200, 201
Time trends in prevalence of diabetes, by country, Europe Table 5.36 202
Chapter 6 Economic costs 204
Health care costs
CVD, CHD, stroke, UK Table 6.1, Figure 6.1a,b,c 205
Total costs
CVD, CHD, stroke, UK Table 6.2 206
International differences in costs
CVD, CHD, stroke, by country, European Union Table 6.3 207

8 Coronary heart disease statistics 2012
Foreword
This latest edition of Coronary Heart Disease Statistics documents major successes in the fight against coronary heart disease (CHD). However, it also highlights areas in which we must continue to make progress if we are to sustain and build on this good work.
Mortality rates from cardiovascular disease (CVD) continue to fall and in this publication we feature data showing that all countries in Great Britain have now reached mortality targets set by their governments. In England, the targets to reduce both premature CVD mortality and the inequality gap by 40% by 2010 were reached in 2005 and 2008 respectively. In Scotland the target to reduce premature CHD mortality by 60% by 2010 was achieved. Whilst in Wales the target of a one-third reduction in CHD mortality in 65 to 74 year olds by 2012 was met in 2006. These targets were achieved as a result of a concerted effort to tackle CVD, which has led to decreases in both the incidence of cardiovascular events and the case fatality associated with these events.
Any public health approach to tackle conditions such as CHD must be multifactorial and within this publication we present statistics for a number of factors which will have influenced these mortality rates. In the last decade the treatment has changed dramatically, with huge increases in the prescription of both lipid-lowering and antihypertensive drugs to counter the medical risk factors of CVD. At the same time the use of percutaneous coronary interventions, which improve survival rates after a CHD event, have become more commonplace. We have also seen population changes in behavioural risk factors linked to CVD. The prevalence of regular smoking has fallen dramatically in the last forty years. Over a similar period of time the consumption of dietary fat has decreased, and the intake of fresh fruit has risen.
These decreases in the mortality rates are not the only story. CVD still remains the biggest killer in the UK, resulting in more than 45,000 deaths amongst individuals aged less than 75 years in 2010. We still find regional and socioeconomic differences in both incidence and case fatality, along with behavioural inequalities. Regular smoking is more prevalent amongst the lower socioeconomic groups, whilst higher income individuals are more likely to eat fruit and vegetables and take physical activity. The United Kingdom also has one of the highest prevalence of heavy drinking amongst adults in Europe. Although mortality rates have fallen, the prevalence of some of the medical risk factors for CVD, including type 2 diabetes and obesity, has increased. If left unchecked these increases risk undoing the good work of the preceding decades. There are already signs that some of the improvements in behaviour, such as dietary choice, smoking and physical activity, have stalled and it is only with continued resolve that we will be able to maintain these.
Although we should celebrate our successes it would be premature and dangerous to rest on our laurels. We must continue to target inequalities where they exist and build on our work by tackling the root causes of coronary heart disease throughout the population.
Professor Peter WeissbergMedical Director, British Heart Foundation

British Heart Foundation and University of Oxford 9
Introduction
This is the eighteenth edition of Coronary Heart Disease Statistics published by the British Heart Foundation. The series of publications began over twenty years ago with the aim of documenting the burden of coronary heart disease (CHD) in the United Kingdom. Since then the publication has expanded to include information on other cardiovascular conditions including stroke and heart failure as well as dedicated sections on cardiovascular risk factors.
Coronary Heart Disease Statistics is designed for health professionals, medical researchers and anyone with an interest in CHD. It is a compendium of the latest statistics drawn from a variety of sources including national statistics, hospital episode statistics, national and international surveys and peer-reviewed journal articles. Most of the information that appears in the compendium has been previously published elsewhere, but there are a number of tables and figures that are new to this publication (for example: estimates of the incidence of heart attack by region in England).
The compendium is divided into six chapters. Chapter one describes social, ethnic and geographic patterns in mortality from cardiovascular diseases. Chapter two describes the morbidity burden of cardiovascular diseases in the UK, focusing on estimates of incidence, case fatality and prevalence. Chapter three describes treatment levels for cardiovascular diseases. Chapter four details the prevalence of behavioural risk factors for CHD (smoking, poor diet, physical inactivity and alcohol consumption), describing differences in prevalence by social group, ethnicity, geographic region and describing the burden amongst children. Chapter five details the prevalence of medical risk factors for CHD (raised blood pressure, raised cholesterol, overweight and obesity, diabetes), describing differences in prevalence by social group, ethnicity and geographic region. Chapter six provides estimates of the economic costs of cardiovascular diseases to the UK economy and health systems. Wherever possible, the situation in the UK is contrasted with international data.
Each chapter contains a set of tables and figures to illustrate key points and a brief review of the data presented. Where appropriate, public health targets for England, Wales, Scotland and Northern Ireland are also presented.
All of the tables and figures in the compendium are also available from the British Heart Foundation’s website at bhf.org.uk/research/statistics.aspx. This website aims to be the most comprehensive and up-to-date source of statistics on cardiovascular disease in the UK. The website is updated on an ongoing basis and contains a wider range of tables and figures than is available in the Coronary Heart Disease Statistics series of publications. Further copies of this publication can be downloaded from the website, as well as copies of recent supplements to the Coronary Heart Disease Statistics series, including:
– European Cardiovascular Disease Statistics (2012)
– Physical Activity Statistics (2012)
– Trends in Coronary Heart Disease, 1961–2011 (2011)
– Ethnic Differences in Cardiovascular Disease (2010)
– Stroke Statistics (2009)

10 Coronary heart disease statistics 2012
Summary
– In 2010, cardiovascular diseases (CVD) were the UK’s biggest killer.
– In 2010, almost 180,000 people died from CVD around 80,000 of these deaths being from coronary heart disease (CHD) and around 49,000 from strokes.
– In 2010, CVD caused around 46,000 premature deaths in the UK; 68% of these were men.
– In recent years CHD death rates have been falling more slowly in younger age groups.
– In England, death rates from heart attack have halved since 2002.
– Death rates from CHD are highest in Scotland and lowest in England.
– Within England, death rates from CHD and heart attacks are highest in the North West and lowest in the South East and South West.
– Death rates from CHD are highest in areas of greatest deprivation.
– The incidence of myocardial infarction has decreased in all regions of England; the North West still has the highest incidence rate.
– There are around 150,000 incidents of stroke every year in the UK.
– For men the incidence of angina is highest in Wales, for women it is highest in Scotland. It is lowest for both sexes in England.
– In 2011, around 292 million prescriptions were issued for CVD in England.
– Over 87,000 percutaneous coronary interventions (PCIs) are now carried out every year in the UK, more than three times as many as a decade ago.
– In 2010/11, the number of inpatient episodes for CHD was 405,000 in England, 50,200 in Scotland, 24,300 in Wales and 14,600 in Northern Ireland.
– The prevalence of smoking amongst adults is lower in England (20%) than in Northern Ireland (24%), Scotland (25%) and Wales (25%).
– Less than one-third of both men and women consume the recommended five or more portions of fruit and vegetables a day.
– Only around one-fifth of boys and girls aged 5 to 15 consume the recommended five or more portions of fruit and vegetables a day.
– A higher percentage of men meet government recommendations for physical activity than women, although this is still under half of men in the UK.
– In 2010, more than a third of men (36%) and over a quarter of women (28%) regularly exceeded the Government’s recommended alcohol intake.
– Around one in three adults in England and Scotland are hypertensive and nearly half of them are not receiving treatment.
– Around six in ten adults in England have high blood cholesterol levels (5mmol/l or above).
– More than a quarter of adults in England are obese.
– Around 30% of boys and girls aged 2-15 years in England and Scotland are overweight or obese.
– The prevalence of diabetes in the UK is around 5% among women and 6% among men.
– In 2009, CVD cost the UK health care system £8.7 billion.
– In 2009, CVD cost the UK economy £19 billion in total.
– The cost per capita for CVD in the UK is €156, which is lower than average for the European Union.
British Heart Foundation and University of Oxford 11
Glossary
This section provides a definition for some of the terms used throughout Coronary heart disease statistics 2012 edition.
Accelerometer – hip mounted motion sensor that measures acceleration in 1, 2 or 3 dimensions. Accelerometers are used as an objective measure of physical activity or exertion.
Age standardised rate – a measure of the rate that a population would experience if it had a standard age structure. It is useful to present rates as age standardised as it allows for comparisons between populations with very different age structures.
Angina – the most common form of coronary heart disease. It is characterised by a heaviness or tightness in the centre of the chest which may spread to the arms, neck, jaw, face, back or stomach. Angina occurs when the arteries become so narrow that not enough oxygen-containing blood can reach the heart when its demands are high, such as during exercise.
Angioplasty – a technique to widen a narrowed or obstructed blood vessel by inflating tightly folded balloons that have been passed into the narrowed location via a catheter. This technique squashes the fatty tissue that has caused the narrowing, hence widening the artery.
Atherosclerosis – a disease characterised by chronic inflammation in the artery walls. The disease is commonly referred to as ‘hardening’ or ‘furring’ of the arteries.
Blood pressure – Blood pressure is simply the physical pressure of blood in the blood vessels. It is similar to the concept of air pressure in a car tyre. These values are quoted in units known as millimetres of mercury (mmHg). See systolic pressure and diastolic pressure.
Body Mass Index (BMI) – a formula relating body weight to height to assess whether a person is overweight. BMI is calculated by dividing a person’s weight (in kilograms) by their height (in metres) squared. Adults with a BMI of 25-30 are considered to be overweight. Those with a BMI of over 30 are considered obese.
British National Formulary (BNF) – a publication that provides key information on the selection, prescribing, dispensing and administration of all medicines that are generally prescribed in the UK.
Cardiovascular disease (CVD) – the collective term for all diseases affecting the circulatory system (heart, arteries, blood vessels).
Case fatality rate – the ratio of the number of deaths caused by a specified disease to the number of diagnosed cases of that disease, it is commonly expressed as a percentage.
Cerebrovascular disease – the collective term for all diseases affecting blood vessels that supply the brain. Technically, stroke (and the many subtypes of stroke) is a subset of cerebrovascular disease, but the two terms are often used interchangeably.
Coronary Artery Bypass Graft (CABG) – an operation to bypass a narrowed section of a coronary artery and improve the blood supply to the heart.
Coronary Heart Disease (CHD) – the collective term for diseases that occur when the walls of the coronary arteries become narrowed by a gradual build-up of fatty material called atheroma. The two main forms of CHD are heart attack (also known as myocardial infarction) and angina.
Diabetes – a disease caused by a lack of insulin (type 1) or an increased resistance of the body to insulin (type 2). Diabetes is characterised by high blood glucose levels. The resulting chronic high blood glucose levels (hyperglycaemia) are associated with long-term damage, dysfunction and failure of various organs, especially the eyes, kidneys, nerves, heart and blood vessels.
Diastolic blood pressure – A common blood pressure reading might be 120/80 mmHg. The lower pressure (80) represents the pressure in the arteries when the heart is relaxed between beats. This pressure is called diastolic pressure.
HDL (High Density Lipoprotein) cholesterol – the fraction of cholesterol that removes cholesterol (via the liver) from the blood. Low levels of HDL-cholesterol are associated with an increased risk of atherosclerosis.
Heart attack – the condition caused by a blockage of one of the coronary arteries when the heart is starved of oxygen. A heart attack usually causes severe pain in the centre of the chest. The pain lasts for more than fifteen minutes, and may last for many hours. The pain usually feels like a heaviness or tightness which may also spread to the arms, neck, jaw, face, back or stomach. There may also be sweating, light-headedness, nausea or shortness of breath. Sometimes a heart attack can be ‘silent’ and produce little discomfort.
Heart failure – a clinical syndrome which occurs when the heart is unable to pump enough blood to meet the demands of the body. It occurs because the heart is damaged or overworked. Some people with moderate heart failure may have very few symptoms. People with moderate or severe heart failure suffer from a number of problems, including shortness of breath, general tiredness and swelling of the feet and ankles.
Hospital Inpatient Episodes – Periods of continuous admitted patient care under the same consultant.

12 Coronary heart disease statistics 2012
Hypertension – Hypertension is a clinical condition of having a high blood pressure. Mostly it is considered blood pressures of 140/90 mmHg and greater to be high although this is influenced by other factors. For example, in patients with diabetes, the definition of hypertension is considered by some to be pressures greater than 130/80.
Incidence – a measure of morbidity based on the number of new episodes of an illness arising in a population over a defined time period.
International Classification of Disease (ICD) – a coding system published by the World Health Organization that provides an internationally recognised method of coding diseases in order to categorise mortality and morbidity statistics. The ICD is revised approximately every ten years. The tenth and most recent revision (ICD-10) was introduced in 2000. Change between revisions can result in discontinuities in mortality and morbidity trends, such as the move from ICD-9 to ICD-10 which resulted in an artificial increase in the number of reported stroke incidents and mortalities.
LDL (Low Density Lipoprotein) cholesterol – the more harmful fraction of cholesterol which carries cholesterol from the liver to the cells of the body and causes atherosclerosis.
Meta-analysis – methods which allow results from a number of different studies to be contrasted and combined.
Myocardial infarction (MI) – see heart attack.
National Statistics Socio-Economic Classification (NS-SEC) – a statistical classification based on occupation and details of employment status.
Non-Milk Extrinsic Sugars (NMES) – generally added sugars that are not integrally present in the cells of food like fruit and vegetables, and that are not naturally present in milk.
Non-Starch Polysaccharides (NSP) – complex carbohydrates that are the major part of dietary fibre and can be measured more precisely than total dietary fibre.
Office of Population, Censuses and Surveys Classification of Surgical Operations and Procedures 4th Revision (OPCS-4) – a classification system for surgical operations and procedures conducted in the National Health Service.
Percutaneous Coronary Intervention (PCI) – A minimally invasive approach to open narrowed coronary arteries (see angioplasty) by accessing them through small needle-size punctures in the skin.
Prevalence – a measure of morbidity based on the current level of a disease in the population at any particular time.
Primary prevention – interventions aimed at reducing the risk of disease before the disease has presented. Primary prevention interventions are usually aimed at populations, such as regulation of tobacco advertising.
Secondary prevention – interventions aimed at reducing the risk of disease recurrence after the disease has initially presented. Secondary prevention interventions are therefore targeted at individuals already at high-risk of disease.
Stent – a short tube of expandable mesh which is inserted at the part of the artery that is to be widened by coronary angioplasty. It helps to keep the artery open and prevent re-narrowing.
Stroke – the consequence of an interruption to the flow of blood to the brain. A stroke can vary in severity from a passing weakness or tingling of a limb to a profound paralysis, coma and death.
Systolic blood pressure – A common blood pressure reading might be 120/80 mmHg. The higher pressure (120) represents the pressure in the arteries when the heart beats, pumping blood into the arteries. This pressure is called systolic pressure.
Waist Circumference (WC) – a measure of central obesity, where fat is concentrated in the abdomen. For men, central obesity is defined as a waist circumference greater than 102cm. For women, central obesity is defined as a waist circumference of greater than 88cm.
Waist to Hip Ratio (WHR) – a measure of central obesity, where fat is concentrated mainly in the abdomen. For men, central obesity is defined as a WHR of 0.95 or over. For women, central obesity is defined as a WHR of 0.85 or over.
Glossary (Continued)

British Heart Foundation and University of Oxford 13
1. Mortality

14 Coronary heart disease statistics 2012
1. Mortality
This chapter reports on mortality from cardiovascular disease (CVD), coronary heart disease (CHD) and heart attack in the UK. CVD and CHD mortality in the context of mortality from other chronic conditions are presented, as well as seasonal and temporal trends in CHD mortality. Regional, socioeconomic, and international differences are also described. Where possible, the latest data from routinely collected, national datasets have been used.
Public health targetsRecent trends indicate that the Our Healthier Nation target, set in 1999, to reduce the death rate from CHD, stroke and related diseases in people under 75 years in England by at least two fifths by 2010 will be met – in 2009, the figure was already below the target rate (Table 1.1, Figures 1.1a). The targets in Scotland and Wales have already been reached; the Scottish target for reduction in CVD death rates was met in 2010, and the Welsh target for a reduction in CHD deaths by 2012 was surpassed in 2006 (1.1c and 1.1d).
Progress towards the 2010 target for reducing CVD inequalities in England has also been successful. The aim was for a 40% reduction in the gap for death rates between the population as a whole and the 20% of the most deprived areas; this target was met in 2008 (Figure 1.1b).
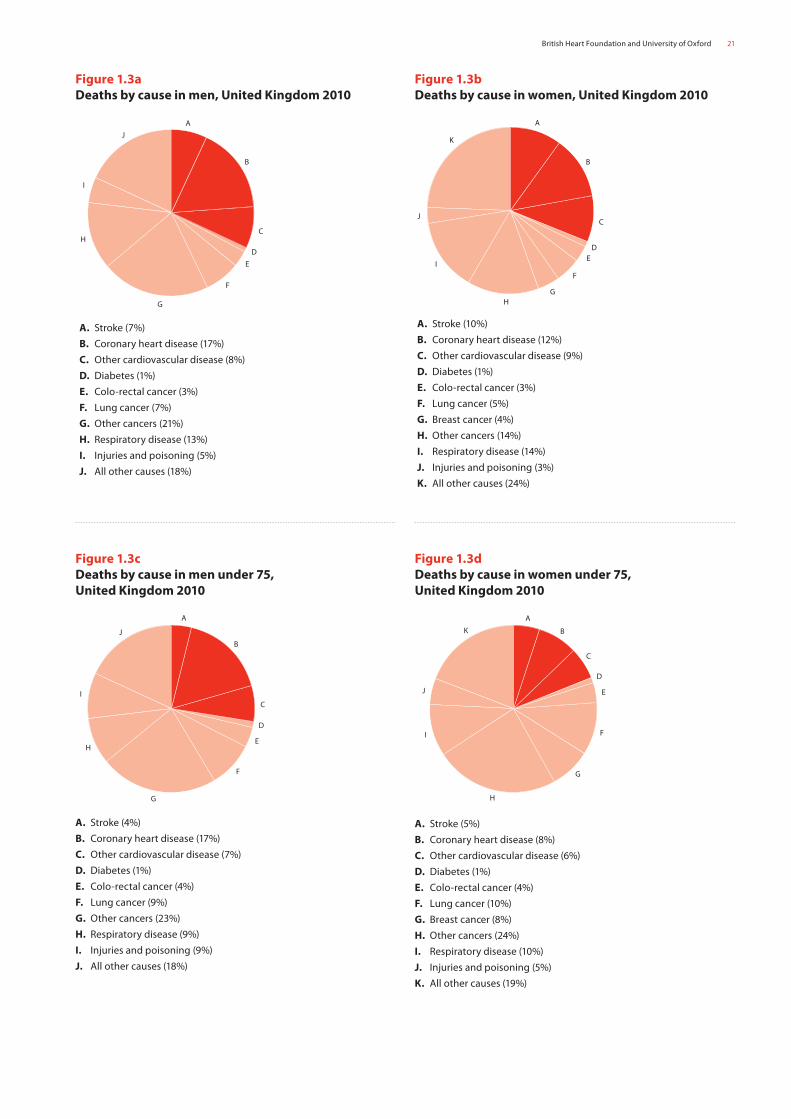
Total mortalityDiseases of the heart and circulatory system (cardiovascular disease or CVD) are the main cause of death in the UK and accounted for almost 180,000 deaths in 2010 – around one in three of all deaths that year (Table 1.2). The main forms of CVD are CHD and stroke. Almost half (45%) of all CVD deaths are from CHD and over a quarter (28%) are from stroke.
CHD by itself is the most common cause of death in the UK. In 2010, just below one in five male deaths and one in ten female deaths were from the disease – a total of around 80,000 deaths. Stroke caused almost 50,000 deaths in the UK, and there were a further 49,000 deaths from other circulatory diseases. Acute myocardial infarction (or heart attack) is also a significant cause of death in the UK, with the majority of deaths happening over the age of 85 (Tables 1.3 and 1.4, Figures 1.3a and 1.3b).
Premature mortalityCVD is one of the main causes of premature death in the UK (death before the age of 75). 28% of premature deaths in men and 19% of premature deaths in women were from CVD in 2010. CVD caused 46,000 premature deaths in the UK in 2010 (Table 1.3, Figures 1.3c and 1.3d).
CHD, by itself, is the most common cause of premature death in the UK. Just under one fifth (17%) of premature deaths in men and one in twelve (8%) premature deaths in women were from CHD, which caused over 25,000 premature deaths in the UK in 2010 (Table 1.3 and Figures 1.3c and 1.3d).
Excess winter mortalityThere is a pattern of excess winter cardiovascular mortality in the UK. In 2009/10, almost 10,000 more people died of CVD in the winter months compared to the summer months. This amounts to about 18% more male deaths and 21% more female deaths. Excess winter mortality tends to increase with age (Table 1.5) 1.
Recent trends in death rates in the UKDeath rates from CVD have been falling in the UK since the early 1970s. For people under 75 years, death rates have fallen by 44% in the last ten years (Figure 1.1a).
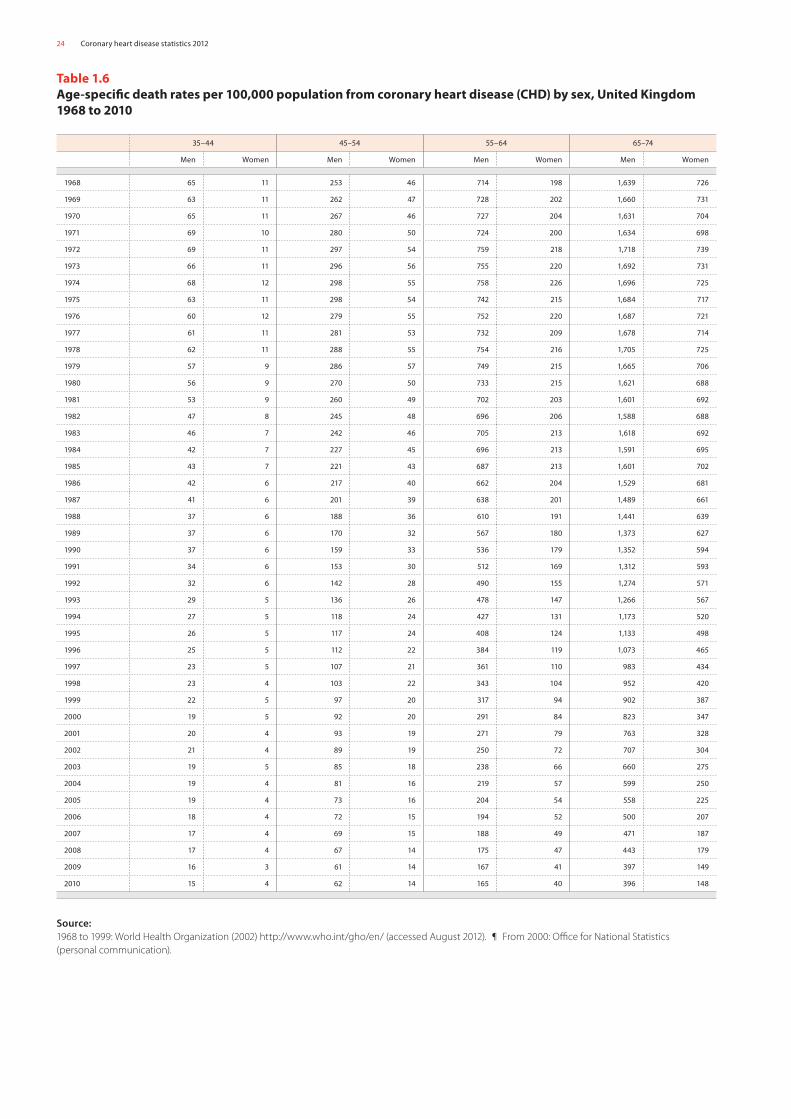
In recent years, CHD death rates have been falling more slowly in younger age groups and fastest in those aged 55 and over. For example, between 2000 and 2010 there was a 43% fall in the CHD death rate for men aged 55 to 64 in the UK, compared to a 21% fall in men aged 35 to 44 years. In women, there was a 52% fall in those aged 55 to 64 years and the rate in those aged 35 to 44 years barely changed. There is some evidence that these rates are beginning to level off in younger age groups 2. Death rates from all heart attacks and heart attacks that are immediately fatal have also declined, with around a 50% decrease in men and women since 2002. Premature death rates from heart attacks have also declined, with a 58% reduction between 2002 and 2010 (Tables 1.6 to 1.8, Figures 1.6a, 1.6b and 1.8).
A 2004 study aimed to explain the decline in mortality from CHD over the last two decades of the twentieth century in England and Wales. Combining and analysing data on uptake and effectiveness of cardiologic treatments and risk factor trends, the authors examined how much of the decline in CHD mortality in England and Wales between 1981 and 2000 could be attributed to medical and surgical treatments and how much to changes in cardiovascular risk factors.

British Heart Foundation and University of Oxford 15
They concluded that more than half (58%) of the CHD mortality decline in England and Wales during the 1980s and 1990s was attributable to reductions in major risk factors, principally smoking. Treatments to individuals, including secondary prevention, explained the remaining two-fifths (42%) of the mortality decline 3.
National and regional differencesDeath rates from CHD are highest for both men and women in Scotland and lowest in England. In 2010, the premature CHD death rate in Scotland was 37% higher for men and 60% for women, as compared to England. Within England, premature CHD death rates are highest in the North West and lowest in the South East and South West. These rates have been consistently higher in Scotland for more than 25 years (Table 1.9a and 1.9b).
A North-South gradient is apparent in death rates from myocardial infarction, as well as in maps of CHD mortality by local authority in the UK. These maps also demonstrate that the highest mortality rates are concentrated in urban areas of the UK (Tables 1.10 and 1.11, Figures 1.11a and 1.11b).
Socioeconomic differencesSocioeconomic differences in health can be measured using individual-level and area-level measures of socioeconomic status. Individual-level measures define socioeconomic status on the basis of an individual’s occupation, income, wealth, education or a combination of these factors. Area-level measures define socioeconomic status on the basis of where an individual lives and tend to be based on a ‘deprivation index’ – a score for an area that is constructed using data on an area’s population, resources, geographical features or a combination of these factors. Estimates of social differences in health are often based on area-level measures because deprivation indices are freely available and only require limited knowledge about individuals. However it should be remembered that not all people who live in affluent areas are themselves affluent, and vice versa.
The most recent data for individual-level measures comes from 2001/03; death rates in 2001/03 from CVD, CHD and stroke were all highest in the lowest socioeconomic group and lowest in the highest socioeconomic group, with a clear gradient across the social groups. This inequality was more striking in women than men, with the CHD death rate in female workers with routine jobs five times higher than those with managerial or professional jobs (Table 1.12 and Figure 1.12).
‘A more recent target within England concerns inequalities in CVD mortality on the basis of area-level measures of deprivation. This looks at the absolute difference in death rates between the most deprived groups and the rest of the population. Using this absolute measurement, inequalities in CVD mortality are declining, as the difference in the rate of deaths between these two groups is reducing. An alternative way of measuring inequality is to look at relative inequalities between the most and least deprived areas. When using the relative measure, Great Britain demonstrates a strong
positive relationship between CHD mortality rates and increasing level of deprivation. This relationship has persisted over the past 14 years, and shows little sign of improvement. While deaths from CHD have declined overall, there appears to have been no narrowing of the relative difference between the most deprived and the least deprived (Table 1.13, Figures 1.13a and 1.13b).
International differencesDespite the decline in death rates from CVD in the UK, rates are still relatively high compared to other Western European countries, at 211 per 100,000 CVD deaths in men in 2009. In Western Europe, only Ireland, Germany, Sweden and Luxembourg had a higher death rate than the UK in the same year. In countries of Eastern and Central Europe, where death rates have been rising rapidly recently, the death rates were generally higher than in the UK, with Russia and Ukraine having the highest CVD mortality in Europe for men; for women the Republic of Moldova and the Ukraine had the highest CVD death rates in 2009 (Tables 1.14a and 1.14b, Figure 1.14).
CHD mortality is declining across most of Europe, with the exception of some Eastern European countries. While there were some fluctuations in death rates between 1998 and 2008, overall Russia and Ukraine both experienced an increase in CHD mortality, most notably death rates for men in the Ukraine rose by 16% between 1998 and 2008. However, data from 2009 and 2010 indicate that CHD death rates in both countries have decreased since 2008. The death rate from CHD in the UK has been falling at one of the fastest rates in Europe and decreased by 45% between 1998 and 2008, with only Ireland, Norway and Austria having a larger decrease over this time. The decline in female CHD mortality tells a similar story (Tables 1.15a and 1.15b, Figure 1.15).
1. Excess winter deaths are calculated by subtracting the actual number of deaths in winter (usually December to March), from the number of deaths which would have been expected for this period, calculated on the basis of the actual number of deaths occurring in the surrounding non-winter months. It is postulated that excess winter mortality is partially preventable through improvements to cold damp housing – see Olsen N (2001) Prescribing warmer, healthier homes. BMJ, 322: 748-749.
2. Allender S, Scarborough P, O’Flaherty M, Capewell S (2008). 20th century CHD morality in England and Wales: population trends in CHD risk factors and coronary death. BMC Public Health 8: 148.
3. Unal B, Critchley JA, Capewell S (2004). Explaining the decline in coronary heart disease mortality in England and Wales between 1981 and 2000. Circulation, 109: 1101-1107.

16 Coronary heart disease statistics 2012
Table 1.1 Cardiovascular disease (CVD) mortality targets for the United Kingdom
England 1,2
CVD – TargetTarget set in 1999To reduce the death rate from CHD, stroke and related diseases in people under 75 years by at least two fifths by 2010 – saving up to 200,000 lives in total.
CVD – Inequalities target
Target set in 2004To reduce the inequalities gap in death rates from CHD, stroke and related diseases between the fifth of areas with the worst health and deprivation indicators and the population as a whole in people under 75 years by 40% by 2010.
Wales 3
CHD – Health outcome target Target set in 2004To reduce CHD mortality in 65-74 year olds from 600 per 100,000 in 2002 to 400 per 100,000 in 2012.
CHD – Health inequality target To improve CHD mortality in all groups and at the same time aim for a more rapid improvement in the most deprived groups.
Scotland 4
CHD – Target
Target set in 2007To reduce mortality rates from CHD among people under 75 years by 60% between 1995 and 2010, from the 1995 baseline of 124.6 to 49.8 per 100,000 population (standardised to the European Standard Population).
CHD – Inequalities targetTo reduce the death rate from CHD of those aged under 75 years living in the most deprived 15% of areas in Scotland. Reduce mortality from CHD among the under 75s in deprived areas.
Northern Ireland
No target set.
1. Department of Health (1999) Our Healthier Nation. DH: London. ¶ 2. Department of Health (2004) National Standards, Local Action: Health and Social Care Standards and Planning Framework 2005/06 and 2007/08. DH: London. ¶ 3. Welsh Assembly Government (2008) See Chief Medical Officer Wales website http://wales.gov.uk/topics/health/research/research/gain/targets/health-gain (Accessed June 2010). ¶ 4. Scottish Executive (2008). Spending Review 2007, Scottish Government. The Scottish Executive: http://www.scotland.gov.uk/Publications/2007/11/30090722/34 and http://www.scotland.gov.uk/Publications/2004/12/20325/47433 (Accessed June 2010)

British Heart Foundation and University of Oxford 17
Figure 1.1a Tracking the English cardiovascular disease (CVD) mortality target: Age-standardised death rates per 100,000 from CVD, under 75s, England 1970 to 2009
Figure 1.1b Tracking the English cardiovascular disease (CVD) inequality target: Absolute gap in CVD age-standardised death rates per 100,000 population between least and most deprived 20% of local authorities, under 75s, England 1996 to 2009
Dea
th ra
te p
er 1
00,0
00
0
50
100
150
200
250
300
Persons under 75 Target for 2010
1970
1971
1972
1973
1974
1975
1976
1977
1978
1979
1980
1981
1982
1983
1984
1985
1986
1987
1988
1989
1990
1991
1992
1993
1994
1995
1996
1997
1998
1999
2000
2001
2002
2003
2004
2005
2006
2007
2008
2009
Ab
solu
te g
ap in
dea
th ra
tes
per
100
,000
0
5
10
15
20
25
30
35
40
Persons under 75 Target for 2010
1996
1997
1998
1999
2000
2001
2002
2003
2004
2005
2006
2007
2008
2009

18 Coronary heart disease statistics 2012
Figure 1.1c Tracking the Scottish coronary heart disease (CHD) mortality target: Age-standardised death rates per 100,000 from CHD, under 75s, Scotland 1995 to 2010
Figure 1.1d Tracking the Welsh coronary heart disease (CHD) mortality target: Age-standardised death rates per 100,000 from CHD in adults aged 65 to 74, Wales 2001 to 2010
Dea
th ra
te p
er 1
00,0
00
0
20
40
60
80
100
120
140
Persons under 75 Target for 2010
1995
1996
1997
1998
1999
2000
2001
2002
2003
2004
2005
2006
2007
2008
2009
2010
Dea
th ra
te p
er 1
00,0
00
0
100
200
300
400
500
600
700
Persons under 75 Target for 2010
2001
2002
2003
2004
2005
2006
2007
2008
2009
2010

British Heart Foundation and University of Oxford 19
Table 1.2 Deaths by cause, by sex and age, United Kingdom 2010
All ages Under 35 35-44 45-54 55-64 65-74 75+
All causes Men 270,945 8,015 6,997 14,120 30,587 54,052 157,174
Women 290,721 4,639 4,209 9,531 20,366 38,205 213,771
Total 561,666 12,654 11,206 23,651 50,953 92,257 370,945
All diseases of the circulatory system(I00-I99)
Men 87,528 504 1,409 3,984 8,982 16,766 55,883
Women 91,550 274 566 1,523 3,382 9,004 76,801
Total 179,078 778 1,975 5,507 12,364 25,770 132,684
Coronary heart disease(I20-I25)
Men 46,591 102 681 2,539 5,899 9,952 27,418
Women 33,977 36 166 586 1,495 4,084 27,610
Total 80,568 138 847 3,125 7,394 14,036 55,028
Stroke(I60-I69)
Men 19,287 91 224 515 1,126 2,883 14,448
Women 30,079 62 131 425 813 2,326 26,322
Total 49,366 153 355 940 1,939 5,209 40,770
Other diseases of thecirculatory system(I00-I19, I26-I59, I70-I99)
Men 21,650 311 504 930 1,957 3,931 14,017
Women 27,494 176 269 512 1,074 2,594 22,869
Total 49,144 487 773 1,442 3,031 6,525 36,886
Diabetes(E10-E14)
Men 2,895 51 79 140 261 563 1,801
Women 3,285 40 58 85 168 386 2,548
Total 6,180 91 137 225 429 949 4,349
Cancer(C00-D48)
Men 84,373 682 1,131 4,108 12,604 23,033 42,815
Women 76,802 664 1,612 4,607 10,956 17,593 41,370
Total 161,175 1,346 2,743 8,715 23,560 40,626 84,185
Colo-rectal cancer(C18-C21)
Men 8,732 40 95 449 1,339 2,423 4,386
Women 7,323 30 96 360 782 1,419 4,636
Total 16,055 70 191 809 2,121 3,842 9,022
Lung cancer(C33, C34)
Men 19,453 13 160 841 3,301 6,220 8,918
Women 15,488 12 117 753 2,607 4,461 7,538
Total 34,941 25 277 1,594 5,908 10,681 16,456
Breast cancer(C50)
Men 78 1 0 5 11 17 44
Women 11,578 57 547 1,270 2,056 2,287 5,361
Total 11,656 58 547 1,275 2,067 2,304 5,405
Other cancers(C00-C17, C22-C32,C35-C49, C51-D48)
Men 56,110 628 876 2,813 7,953 14,373 29,467
Women 42,413 565 852 2,224 5,511 9,426 23,835
Total 98,523 1,193 1,728 5,037 13,464 23,799 53,302
Respiratory disease(J00-J99)
Men 35,499 216 261 670 2,416 6,092 25,844
Women 40,559 192 199 542 1,878 4,731 33,017
Total 76,058 408 460 1,212 4,294 10,823 58,861
Injuries and poisoning(V01-Y98)
Men 12,220 2,960 1,975 1,805 1,387 1,029 3,064
Women 7,680 871 597 683 601 652 4,276
Total 19,900 3,831 2,572 2,488 1,988 1,681 7,340
All other causes Men 48,430 3,602 2,142 3,413 4,937 6,569 27,767
Women 70,845 2,598 1,177 2,091 3,381 5,839 55,759
Total 119,275 6,200 3,319 5,504 8,318 12,408 83,526
Notes:ICD-10 codes in parentheses.
Source: England and Wales, Office for National Statistics (2010) Deaths registered by cause, sex and age. www.statistics.gov.uk (accessed April 2011). ¶ Scotland, General Register Office (2011) Registrar General Annual Report. GRO: Edinburgh. ¶ Northern Ireland, Statistics and Research Agency (2011) Registrar General Annual Report. NISRA: Belfast.

20 Coronary heart disease statistics 2012
Table 1.3 Deaths by cause in all adults and adults under 75, by sex, England, Wales, Scotland, Northern Ireland and United Kingdom 2010
All ages Under 75
England Wales Scotland NorthernIreland
UnitedKingdom
England Wales Scotland NorthernIreland
UnitedKingdom
All causes Men 222,966 14,950 25,963 7,066 270,945 91,814 6,227 12,322 3,408 113,771
Women 239,079 16,247 28,004 7,391 290,721 61,765 4,260 8,675 2,250 76,950
Total 462,045 31,197 53,967 14,457 561,666 153,579 10,487 20,997 5,658 190,721
All diseases of the circulatory system(I00-I99)
Men 72,247 5,013 8,068 2,200 87,528 25,663 1,747 3,354 881 31,645
Women 75,496 5,328 8,449 2,277 91,550 11,778 850 1,687 434 14,749
Total 147,743 10,341 16,517 4,477 179,078 37,441 2,597 5,041 1,315 46,394
Coronary heart disease(I20-I25)
Men 38,034 2,687 4,599 1,271 46,591 15,384 1,081 2,142 566 19,173
Women 27,439 2,036 3,539 963 33,977 4,976 359 839 193 6,367
Total 65,473 4,723 8,138 2,234 80,568 20,360 1,440 2,981 759 25,540
Stroke(I60-I69)
Men 15,824 1,085 1,889 489 19,287 3,927 246 526 140 4,839
Women 24,743 1,711 2,875 750 30,079 2,984 235 416 122 3,757
Total 40,567 2,796 4,764 1,239 49,366 6,911 481 942 262 8,596
Other diseases of the circulatory system(I00-I19, I26-I59, I70-I99)
Men 18,389 1,241 1,580 440 21,650 6,352 420 686 175 7,633
Women 23,314 1,581 2,035 564 27,494 3,818 256 432 119 4,625
Total 41,703 2,822 3,615 1,004 49,144 10,170 676 1,118 294 12,258
Diabetes(E10-E14)
Men 2,228 165 408 94 2,895 771 60 209 54 1,094
Women 2,664 166 346 109 3,285 532 38 138 29 737
Total 4,892 331 754 203 6,180 1,303 98 347 83 1,831
Cancer(C00-D48)
Men 69,789 4,478 7,941 2,165 84,373 34,002 2,239 4,129 1,188 41,558
Women 62,990 4,189 7,677 1,946 76,802 28,830 1,925 3,701 976 35,432
Total 132,779 8,667 15,618 4,111 161,175 62,832 4,164 7,830 2,164 76,990
Colo-rectal cancer(C18-C21)
Men 7,186 514 793 239 8,732 3,553 262 392 139 4,346
Women 6,002 400 736 185 7,323 2,170 147 294 76 2,687
Total 13,188 914 1,529 424 16,055 5,723 409 686 215 7,033
Lung cancer(C33,C34)
Men 15,781 1,026 2,107 539 19,453 8,484 549 1,175 327 10,535
Women 12,347 823 1,948 370 15,488 6,235 426 1,062 227 7,950
Total 28,128 1,849 4,055 909 34,941 14,719 975 2,237 554 18,485
Breast cancer(C50)
Men 56 7 10 5 78 26 3 4 1 34
Women 9,653 637 1,022 266 11,578 5,157 339 550 171 6,217
Total 9,709 644 1,032 271 11,656 5,183 342 554 172 6,251
Other cancers(C00-C17, C22-C32, C35-C49, C51-D48)
Men 46,766 2,931 5,031 1,382 56,110 21,939 1,425 2,558 721 26,643
Women 34,988 2,329 3,971 1,125 42,413 15,268 1,013 1,795 502 18,578
Total 81,754 5,260 9,002 2,507 98,523 37,207 2,438 4,353 1,223 45,221
Respiratory disease(J00-J99)
Men 29,566 1,997 3,080 856 35,499 7,896 575 940 209 9,620
Women 33,370 2,343 3,816 1,030 40,559 5,994 429 910 453 7,786
Total 62,936 4,340 6,896 1,886 76,058 13,890 1,004 1,850 662 17,406
Injuries and poisoning(V01-Y98)
Men 9,579 717 1,359 565 12,220 7,072 524 1,086 474 9,156
Women 6,108 443 854 275 7,680 2,650 189 404 161 3,404
Total 15,687 1,160 2,213 840 19,900 9,722 713 1,490 635 12,560
All other causes Men 39,557 2,580 5,107 1,186 48,430 16,410 1,082 2,604 602 20,698
Women 58,451 3,778 6,862 1,754 70,845 11,981 829 1,835 197 14,842
Total 98,008 6,358 11,969 2,940 119,275 28,391 1,911 4,439 799 35,540
Notes: ICD-10 codes in parentheses.
Source: England and Wales, Office for National Statistics (2012) Deaths registered by cause, sex and age. www.statistics.gov.uk (accessed April 2012). ¶ Scotland, General Register Office (2011) Registrar General Annual Report. GRO: Edinburgh. ¶ Northern Ireland, Statistics and Research Agency (2011) Registrar General Annual Report. NISRA: Belfast.
British Heart Foundation and University of Oxford 21
Figure 1.3a Deaths by cause in men, United Kingdom 2010
A. Stroke (7%)
B. Coronary heart disease (17%)
C. Other cardiovascular disease (8%)
D. Diabetes (1%)
E. Colo-rectal cancer (3%)
F. Lung cancer (7%)
G. Other cancers (21%)
H. Respiratory disease (13%)
I. Injuries and poisoning (5%)
J. All other causes (18%)
A B C D E F G
H I
J
Figure 1.3d Deaths by cause in women under 75, United Kingdom 2010
A. Stroke (5%)
B. Coronary heart disease (8%)
C. Other cardiovascular disease (6%)
D. Diabetes (1%)
E. Colo-rectal cancer (4%)
F. Lung cancer (10%)
G. Breast cancer (8%)
H. Other cancers (24%)
I. Respiratory disease (10%)
J. Injuries and poisoning (5%)
K. All other causes (19%)
A B C D E F G H
I
J
K
Figure 1.3b Deaths by cause in women, United Kingdom 2010
A. Stroke (10%)
B. Coronary heart disease (12%)
C. Other cardiovascular disease (9%)
D. Diabetes (1%)
E. Colo-rectal cancer (3%)
F. Lung cancer (5%)
G. Breast cancer (4%)
H. Other cancers (14%)
I. Respiratory disease (14%)
J. Injuries and poisoning (3%)
K. All other causes (24%)
A B C D E F G H
I
J
K
Figure 1.3c Deaths by cause in men under 75, United Kingdom 2010
A. Stroke (4%)
B. Coronary heart disease (17%)
C. Other cardiovascular disease (7%)
D. Diabetes (1%)
E. Colo-rectal cancer (4%)
F. Lung cancer (9%)
G. Other cancers (23%)
H. Respiratory disease (9%)
I. Injuries and poisoning (9%)
J. All other causes (18%)
A B C D E F G
H
I
J

22 Coronary heart disease statistics 2012
Table 1.4 Age-standardised death rates per 100,000 population for myocardial infarction, by sex and age, England and Scotland 2010
Men Women
England
30-54 1 0
55-64 6 2
65-74 14 6
75-84 35 19
85+ 85 58
Under 75 20 6
All ages 40 18
Number of events 14,980 11,069
Scotland
0-44 2 1
45-64 68 18
65-74 279 128
75+ 916 572
Under 75 40 14
All ages 75 37
Number of deaths 2,536 2,041
Notes:ICD-10 codes I21-22. ¶ England rates are age-standardised to the European Standard Population. ¶ Scotland rates are age-sex-standardised to the European Standard Population.
Source:Smolina K, Wright L, Rayner M, Goldacre M (2012). Determinants of the decline in mortality from acute myocardial infarction in England between 2002 and 2010: linked national database study. BMJ; 344. DOI: 10.1136/bmj.d8059 ¶ Unit of Health-Care Epidemiology, Department of Public Health, University of Oxford (2010) Personal communication. ¶ ISD Scotland Table MC1: Trends in mortality 2001-2010 (2012). http://www.isdscotland.org/Health-Topics/Heart-Disease/Topic-Areas/Mortality (Accessed September 2012)

British Heart Foundation and University of Oxford 23
Figure 1.4 Age-standardised death rates per 100,000 population for myocardial infarction, by sex and age, England 2010
Table 1.5 Excess winter cardiovascular disease (CVD) mortality, by sex, England and Wales 2009/10
Men Women
Excess winter mortality Excess winter mortality index Excess winter mortality Excess winter mortality index
0-64 380 9.1 240 15.1
65-74 780 16.9 400 16.4
75-84 1,610 19.6 1,540 20.4
85 + 1,610 22.5 3,070 22.5
All ages 4,370 18.1 5,240 20.8
Notes:Excess winter mortality calculation: winter deaths - average non-winter deaths. ¶ Excess winter mortality index calculation: (Excess winter mortality/average non-winter deaths) *100.
Source:
Office for National Statistics (2011). http://www.ons.gov.uk/ons/publications/re-reference-tables.html?edition=tcm%3A77-235062 (accessed September 2012).
Dea
th ra
te p
er 1
00,0
00
0
10
20
30
40
50
60
70
80
90
WomenMen
≥85<7575-8465-7455-6430-54
24 Coronary heart disease statistics 2012
Table 1.6 Age-specific death rates per 100,000 population from coronary heart disease (CHD) by sex, United Kingdom 1968 to 2010
35–44 45–54 55–64 65–74
Men Women Men Women Men Women Men Women
1968 65 11 253 46 714 198 1,639 726
1969 63 11 262 47 728 202 1,660 731
1970 65 11 267 46 727 204 1,631 704
1971 69 10 280 50 724 200 1,634 698
1972 69 11 297 54 759 218 1,718 739
1973 66 11 296 56 755 220 1,692 731
1974 68 12 298 55 758 226 1,696 725
1975 63 11 298 54 742 215 1,684 717
1976 60 12 279 55 752 220 1,687 721
1977 61 11 281 53 732 209 1,678 714
1978 62 11 288 55 754 216 1,705 725
1979 57 9 286 57 749 215 1,665 706
1980 56 9 270 50 733 215 1,621 688
1981 53 9 260 49 702 203 1,601 692
1982 47 8 245 48 696 206 1,588 688
1983 46 7 242 46 705 213 1,618 692
1984 42 7 227 45 696 213 1,591 695
1985 43 7 221 43 687 213 1,601 702
1986 42 6 217 40 662 204 1,529 681
1987 41 6 201 39 638 201 1,489 661
1988 37 6 188 36 610 191 1,441 639
1989 37 6 170 32 567 180 1,373 627
1990 37 6 159 33 536 179 1,352 594
1991 34 6 153 30 512 169 1,312 593
1992 32 6 142 28 490 155 1,274 571
1993 29 5 136 26 478 147 1,266 567
1994 27 5 118 24 427 131 1,173 520
1995 26 5 117 24 408 124 1,133 498
1996 25 5 112 22 384 119 1,073 465
1997 23 5 107 21 361 110 983 434
1998 23 4 103 22 343 104 952 420
1999 22 5 97 20 317 94 902 387
2000 19 5 92 20 291 84 823 347
2001 20 4 93 19 271 79 763 328
2002 21 4 89 19 250 72 707 304
2003 19 5 85 18 238 66 660 275
2004 19 4 81 16 219 57 599 250
2005 19 4 73 16 204 54 558 225
2006 18 4 72 15 194 52 500 207
2007 17 4 69 15 188 49 471 187
2008 17 4 67 14 175 47 443 179
2009 16 3 61 14 167 41 397 149
2010 15 4 62 14 165 40 396 148
Source: 1968 to 1999: World Health Organization (2002) http://www.who.int/gho/en/ (accessed August 2012). ¶ From 2000: Office for National Statistics (personal communication).

British Heart Foundation and University of Oxford 25
Figure 1.6a Age-specific death rates from coronary heart disease (CHD) as a percentage of the rate in 1968, in men, United Kingdom 1968 to 2010
Figure 1.6b Age-specific death rates from coronary heart disease (CHD) as a percentage of the rate in 1968 in women, United Kingdom 1968 to 2010
Dea
th ra
te a
s p
erce
ntag
e of
196
8 ra
te
0
20
40
60
80
100
120
140
65–7455–6445–5435–44
1968
1969
1970
1971
1972
1973
1974
1975
1976
1977
1978
1979
1980
1981
1982
1983
1984
1985
1986
1987
1988
1989
1990
1991
1992
1993
1994
1995
1996
1997
1998
1999
2000
2001
2002
2003
2004
2005
2006
2007
2008
2009
2010

26 Coronary heart disease statistics 2012
Table 1.7 Death rates from myocardial infarction per 100,000 population, by sex and age, England and Scotland 2002 to 2010
England Scotland
All ages Under 75 All ages Under 75
Men Women Men Women Men Women Men Women
2002 78.7 37.3 41.4 14.9 132.8 68.5 70.7 29.3
2003 73.6 35.2 38.0 13.3 125.9 64.6 68.0 26.7
2004 66.5 31.1 34.1 11.4 112.2 57.4 57.6 22.5
2005 60.3 28.5 30.9 10.5 107.4 53.4 57.0 21.3
2006 54.6 25.3 28.0 9.2 93.6 49.6 50.6 20.6
2007 49.9 23.2 25.8 8.2 93.8 44.7 51.4 18.2
2008 46.1 21.4 24.1 7.8 84.3 42.0 46.4 16.8
2009 42.7 19.2 22.4 6.8 77.9 38.5 40.5 15.4
2010 39.2 17.7 20.3 6.3 74.7 36.7 39.6 14.4
Notes:ICD-10 codes I21-22. ¶ England rates are age-standardised to the European Standard Population. ¶ Scotland rates are age-sex-standardised to the European Standard Population.
Source:Smolina K, Wright FL, Rayner M, Goldacre M. Determinants of the decline in mortality from acute myocardial infarction in England between 2002 and 2010: A linked database study. BMJ 2012; 344. DOI: 10.1136/bmj.d8059. ¶ Unit of Health-Care Epidemiology, Department of Public Health, University of Oxford (2012) Personal Communication. ¶ ISD Scotland Table MC1: Trends in mortality 2001-2010 (2012). http://www.isdscotland.org/Health-Topics/Heart-Disease/Topic-Areas/Mortality (Accessed September 2012)

British Heart Foundation and University of Oxford 27
Table 1.8 Age-standardised sudden death rate per 100,000 population for myocardial infarction, by sex and age, England 2002 to 2010
All ages Under 75
Men Women Men Women
2002 61 27 34 11
2003 57 26 31 10
2004 52 22 28 9
2005 47 20 26 8
2006 43 19 24 7
2007 39 17 21 6
2008 37 16 20 6
2009 34 14 19 5
2010 32 13 18 5
Number of events (most recent year)
11,018 7,369 5,000 1,609
Notes: Sudden deaths were those deaths with acute myocardial infarction coded as the underlying cause of death on the death certificate and with no linked hospital admission for acute myocardial infarction in the previous 30 days. ¶ Rates are age-standardised to the European Standard Population.
Source:Smolina K, Wright FL, Rayner M, Goldacre M. Determinants of the decline in mortality from acute myocardial infarction in England between 2002 and 2010: A linked database study. BMJ 2012; 344. DOI: 10.1136/bmj.d8059 Unit of Health-Care Epidemiology, Department of Public Health, University of Oxford (2012) Personal communication.
Figure 1.8 Age-standardised sudden death rate per 100,000 population for myocardial infarction, by sex and age, England 2002 to 2010
Sud
den
dea
th ra
te p
er 1
00,0
00
All ages menAll ages womenUnder 75 menUnder 75 women
2002 2003 2004 2005 2006 2007 2008 2009 2010
0
10
20
30
40
50
60
70

28 Coronary heart disease statistics 2012
Table 1.9a Age-standardised death rates from coronary heart disease (CHD) per 100,000 population in men, by country and region of England, United Kingdom 1978 to 2010
United King
dom
Englan
d
North East
North W
est
Yorkshire and the H
umb
er
East Mid
land
s
West M
idlan
ds
East of Englan
d
Lond
on
South East
South West
Wales
Scotland
Northern Irelan
d
Men aged 35-74
1978 266 241 282 281 277 246 239 212 214 225 289 302 300
1980 240 230 273 268 257 231 230 199 207 218 267 283 303
1982 228 220 259 264 251 225 229 177 193 200 245 279 262
1984 226 217 265 259 245 218 227 193 188 197 238 274 275
1986 216 207 248 248 243 205 221 176 177 192 231 267 277
1988 199 190 238 237 225 196 200 154 161 169 215 247 259
1990 181 173 215 212 201 177 191 141 147 153 197 221 222
1992 168 160 206 190 181 162 171 133 140 141 174 211 201
1994 149 141 173 172 157 138 147 124 125 126 158 188 175
1996 134 129 155 155 143 129 142 110 115 112 146 171 155
1997 136 120 155 144 134 120 131 100 114 100 103 135 160 149
1998 120 116 149 141 133 119 121 95 113 93 101 128 153 139
1999 112 108 130 128 117 110 119 93 106 91 91 128 146 133
2000 104 100 122 121 111 101 108 87 103 80 88 113 133 115
2001 98 94 114 115 109 92 104 81 92 77 80 109 120 105
2002 92 88 106 106 98 92 97 73 91 70 75 104 113 99
2003 87 83 103 101 92 87 90 69 87 69 67 95 112 90
2004 80 77 94 96 81 78 82 65 77 63 65 83 101 89
2005 74 71 86 88 79 71 78 60 73 58 57 82 98 80
2006 69 66 78 84 76 64 70 57 66 53 54 75 88 76
2007 65 62 75 76 70 63 68 53 64 51 52 69 89 74
2008 61 59 70 72 69 60 63 49 62 47 50 65 81 65
2009 56 54 61 66 63 57 59 48 54 46 44 65 71 54
2010 55 53 60 65 61 54 57 46 52 43 43 58 71 62
Notes:ICD-9 codes 410-414 for pre-2001 data, ICD-10 codes I20-25 thereafter. ¶ Age-standardised using the European Standard Population. ¶ Government Office Regions replaced Standard regions in England in 1997. ¶ Pre-1997, “North East” was “North”; “East Anglia was “East”. ¶ There was no data for London as a separate region. ¶ 1978 to 1996 are by standard region; 1997 to 2010 are by Government Office region.
Source: Pre 1997: Office for Population Censuses and Surveys (1994) Mortality Statistics 1992, DH5 series, HMSO: London and previous editions; Office for National Statistics 1993-1996 figures, personal communication. 1997-2010: England and Wales: Office for National Statistics, personal communication. ¶ Scotland and Northern Ireland: raw data from the General Register Office for Scotland, and the Northern Ireland Statistics and Research Agency.

British Heart Foundation and University of Oxford 29
Table 1.9b Age-standardised death rates from coronary heart disease (CHD) per 100,000 population in women, by country and region of England, United Kingdom 1978 to 2010
United King
dom
Englan
d
North East
North W
est
Yorkshire and the H
umb
er
East Mid
land
s
West M
idlan
ds
East of Englan
d
Lond
on
South East
South West
Wales
Scotland
Northern Irelan
d
Women aged 35-74
1978 93 79 108 101 94 78 81 67 64 68 90 118 107
1980 80 75 100 97 88 76 77 62 62 63 94 111 105
1982 79 73 101 94 90 74 77 57 60 58 84 113 104
1984 79 75 102 97 94 79 80 58 60 63 86 105 94
1986 77 72 97 94 87 77 77 56 59 61 83 101 95
1988 72 67 96 89 84 69 74 48 53 52 76 101 96
1990 67 63 90 82 80 65 67 46 49 52 71 93 81
1992 62 58 81 77 71 59 62 43 48 45 65 84 77
1994 55 50 73 66 58 48 53 39 41 40 58 74 70
1996 48 46 62 59 53 46 51 35 37 35 52 64 58
1997 45 42 61 53 51 44 47 33 38 31 32 50 63 53
1998 43 41 57 55 46 45 44 34 37 30 31 45 59 49
1999 39 37 52 48 41 39 42 29 36 29 30 41 54 46
2000 36 34 46 43 40 35 35 27 34 26 26 40 50 41
2001 35 32 40 41 38 33 36 26 32 24 25 39 45 38
2002 32 30 39 39 35 34 32 23 29 24 23 36 44 36
2003 30 28 38 33 30 29 32 22 28 21 23 33 41 30
2004 27 25 33 32 28 27 26 20 25 20 18 32 37 30
2005 24 23 29 29 27 25 24 18 22 17 18 27 35 28
2006 22 21 30 27 25 22 22 17 19 17 16 25 33 27
2007 21 19 26 26 22 20 20 14 20 15 15 23 30 23
2008 20 19 22 23 22 21 20 15 21 14 14 21 28 22
2009 17 16 20 22 19 16 17 12 17 12 12 21 25 22
2010 16 15 17 21 20 16 16 14 15 11 11 18 24 19
Notes:ICD-9 codes 410-414 for pre-2001 data, ICD-10 codes I20-25 thereafter. ¶ Age-standardised using the European Standard Population. ¶ Government Office Regions replaced Standard regions in England in 1997. ¶ Pre-1997, “North East” was “North”; “East Anglia was “East”. ¶ There was no data for London as a separate region. ¶ 1978 to 1996 are by standard region; 1997 to 2010 are by Government Office region.
Source:Pre 1997: Office for Population Censuses and Surveys (1994) Mortality Statistics 1992, DH5 series, HMSO: London and previous editions; Office for National Statistics 1993-1996 figures, personal communication. 1997-2010: England and Wales: Office for National Statistics, personal communication. ¶ Scotland and Northern Ireland: raw data from the General Register Office for Scotland, and the Northern Ireland Statistics and Research Agency.

30 Coronary heart disease statistics 2012
Table 1.10 Death rates from myocardial infarction per 100,000 population by Government Office Region, England 2002 to 2010
North East North West
Yorkshire and the
HumberEast
MidlandsWest
MidlandsEast of
England London South EastSouth
West
2002 65.2 67.9 69.4 55.3 58.3 48.0 47.9 45.2 51.7
2003 61.7 64.8 65.1 49.6 54.7 45.7 46.7 43.4 45.0
2004 53.3 58.1 57.0 44.3 49.1 41.9 42.3 39.4 40.7
2005 48.4 52.2 53.8 41.4 47.7 36.7 38.4 35.4 35.7
2006 43.2 48.8 48.3 37.5 42.7 34.5 32.4 30.5 33.3
2007 40.1 47.2 41.9 36.4 37.5 29.5 31.5 28.2 30.0
2008 36.3 41.7 40.5 33.2 34.3 28.1 30.7 26.4 26.6
2009 35.3 38.8 37.3 29.1 31.6 26.1 29.1 23.2 23.8
2010 29.0 35.4 34.7 27.0 30.1 25.2 27.0 21.2 21.3
Source: Smolina K, Wright FL, Rayner M, Goldacre M. Determinants of the decline in mortality from acute myocardial infarction in England between 2002 and 2010: A linked database study. BMJ 2012; 344. DOI: 10.1136/bmj.d8059. Unit of Health-Care Epidemiology, Department of Public Health, University of Oxford (2012) Personal Communication.

British Heart Foundation and University of Oxford 31
Table 1.11 Numbers of deaths and age-standardised death rates from coronary heart disease (CHD) in men and women, all ages and under 75, by local authority, United Kingdom 2008/10
Under 75 All ages
LA code LA name Men Women Men Women
Num
ber of d
eaths 2008-2010
Ag
e-stand
ardised d
eath rate/100,000
Num
ber of d
eaths 2008-2010
Ag
e-stand
ardised d
eath rate/100,000
Num
ber of d
eaths 2008-2010
Ag
e-stand
ardised d
eath rate/100,000
Num
ber of d
eaths 2008-2010
Ag
e-stand
ardised d
eath rate/100,000
United Kingdom 59,236 57.9 20,221 17.9 143,026 114.3 107,783 53.1
England 47,468 55.7 15,737 16.8 116,720 112.5 87,124 50.8
North East 2,902 64.0 985 19.9 6,611 123.7 4,743 55.8
00EJ County Durham 621 63.7 214 21.1 1,383 121.9 1,027 61.3
00EH Darlington 129 73.9 30 15.6 271 132.2 179 48.1
00CH Gateshead 232 68.2 84 22.0 512 130.7 399 62.5
00EB Hartlepool 106 69.9 28 16.2 213 127.2 148 52.7
00EC Middlesbrough 149 71.0 54 22.9 330 132.0 234 58.7
00CJ Newcastle upon Tyne 274 70.2 106 24.2 662 133.5 457 56.9
00CK North Tyneside 224 66.1 73 19.2 514 123.9 375 53.9
00EM Northumberland 348 54.2 97 14.4 858 113.4 595 49.2
00EE Redcar and Cleveland 141 54.7 47 16.6 329 107.8 229 47.1
00CL South Tyneside 168 64.3 66 21.7 428 131.4 329 59.8
00EF Stockton-on-Tees 193 61.2 60 17.4 393 112.0 233 44.0
00CM Sunderland 317 66.7 126 23.7 718 132.3 538 63.1
North West 8,119 68.4 2,911 22.5 17,972 131.4 13,792 62.4
16UB Allerdale 117 67.8 54 25.4 293 139.9 237 66.6
16UC Barrow-in-Furness 80 50.1 36 24.4 189 102.6 151 60.4
00EX Blackburn with Darwen 170 69.1 78 35.8 373 139.1 303 90.1
00EY Blackpool 244 101.3 70 23.4 484 175.5 324 62.5
00BL Bolton 310 71.8 112 23.9 684 141.5 476 61.2
30UD Burnley 135 82.8 31 20.2 266 140.3 187 66.2
00BM Bury 206 67.3 74 21.2 441 130.1 346 61.8
16UD Carlisle 130 68.0 47 22.1 322 141.8 241 61.8
00EQ Cheshire East 348 50.9 103 13.7 892 107.2 715 49.8
00EW Cheshire West and Chester 299 49.0 104 15.3 751 103.6 611 51.5
30UE Chorley 105 53.7 39 18.9 233 109.9 178 55.5
16UE Copeland 95 70.4 32 21.9 179 119.6 139 60.7
16UF Eden 57 40.6 19 15.5 166 99.1 130 58.7
30UF Fylde 62 40.3 23 12.3 206 96.6 184 44.9
00ET Halton 143 32.1 64 30.2 319 64.7 233 77.8
30UG Hyndburn 103 67.4 44 29.4 248 145.5 212 83.6

32 Coronary heart disease statistics 2012
00BX Knowsley 210 90.1 70 25.4 377 148.9 267 63.3
30UH Lancaster 171 82.5 48 18.5 397 152.2 274 53.3
00BY Liverpool 539 83.1 185 25.0 1,017 138.4 728 62.3
00BN Manchester 527 101.1 187 33.8 958 158.8 721 75.8
00BP Oldham 284 80.6 109 28.8 576 151.4 395 66.7
30UJ Pendle 108 73.1 47 29.5 232 139.0 206 74.5
30UK Preston 141 67.6 58 27.6 303 121.3 233 68.4
30UL Ribble Valley 70 53.5 19 15.4 175 116.8 138 60.5
00BQ Rochdale 256 79.2 103 28.9 531 145.4 394 70.4
30UM Rossendale 77 53.3 31 26.7 178 110.4 123 64.9
00BR Salford 312 91.8 88 23.1 615 157.0 447 66.0
00CA Sefton 309 60.9 109 17.3 761 119.8 557 49.8
16UG South Lakeland 103 51.6 37 15.4 309 124.7 271 51.8
30UN South Ribble 94 55.2 35 16.1 215 111.2 185 52.0
00BZ St. Helens 246 75.9 103 29.3 502 151.1 373 70.3
00BS Stockport 294 59.0 121 22.1 739 125.8 644 62.9
00BT Tameside 353 97.5 117 30.3 742 185.3 640 96.0
00BU Trafford 208 61.9 62 15.5 550 126.9 386 52.7
00EU Warrington 230 78.7 86 22.6 514 164.2 408 70.0
30UP West Lancashire 110 60.6 40 17.5 264 132.2 196 54.1
00BW Wigan 407 72.6 135 22.6 756 134.0 546 63.2
00CB Wirral 352 64.7 142 21.9 877 130.3 718 59.9
30UQ Wyre 114 52.2 49 17.1 338 121.4 275 52.3
Yorkshire & The Humber 5,605 64.8 1,960 20.4 13,357 130.7 10,016 59.4
00CC Barnsley 293 73.3 118 27.5 622 143.7 487 70.6
00CX Bradford 547 77.1 198 25.6 1,193 145.0 823 62.3
00CY Calderdale 190 56.2 61 16.5 442 113.7 357 54.0
36UB Craven 57 47.5 19 14.0 168 110.5 132 48.2
00CE Doncaster 362 71.6 125 21.8 850 142.6 571 60.9
00FB East Riding of Yorkshire 356 59.0 109 13.9 959 135.7 693 50.5
36UC Hambleton 78 47.1 34 15.9 214 108.9 162 47.8
36UD Harrogate 148 63.3 56 17.1 401 135.5 347 53.5
00FA Kingston upon Hull, City of 310 90.6 107 26.7 619 156.5 429 63.5
00CZ Kirklees 414 64.4 138 20.1 954 130.3 791 64.9
00DA Leeds 735 66.5 252 20.3 1,756 129.6 1,279 57.0
00FC North East Lincolnshire 186 44.8 68 21.8 437 88.6 322 60.0
Under 75 All ages
LA code LA name Men Women Men Women
Num
ber of d
eaths 2008-2010
Ag
e-stand
ardised d
eath rate/100,000
Num
ber of d
eaths 2008-2010
Ag
e-stand
ardised d
eath rate/100,000
Num
ber of d
eaths 2008-2010
Ag
e-stand
ardised d
eath rate/100,000
Num
ber of d
eaths 2008-2010
Ag
e-stand
ardised d
eath rate/100,000

British Heart Foundation and University of Oxford 33
00FD North Lincolnshire 191 65.5 66 19.7 447 129.6 321 57.2
36UE Richmondshire 60 48.4 13 12.5 138 96.3 75 42.2
00CF Rotherham 304 67.4 134 27.9 754 150.6 615 78.2
36UF Ryedale 65 36.5 23 17.5 183 81.7 152 64.9
36UG Scarborough 134 72.3 63 24.5 410 174.4 356 70.2
36UH Selby 68 48.2 18 11.5 176 111.4 139 52.3
00CG Sheffield 539 64.9 174 18.6 1,344 131.7 987 56.1
00DB Wakefield 410 72.3 131 21.7 875 138.0 602 60.0
00FF York 158 50.8 53 14.3 415 106.5 376 52.0
East Midlands 4,469 57.5 1,466 17.7 10,676 114.2 7,818 53.3
17UB Amber Valley 157 82.6 49 19.7 366 163.3 288 63.8
37UB Ashfield 135 62.0 43 19.3 290 115.8 226 58.9
37UC Bassetlaw 132 66.2 32 14.0 284 128.1 220 55.2
31UB Blaby 83 43.9 24 12.3 223 99.5 120 38.0
17UC Bolsover 104 61.7 38 25.2 234 115.0 180 71.2
32UB Boston 75 54.0 31 23.8 180 109.5 131 58.4
37UD Broxtowe 108 52.9 33 15.1 257 108.9 175 46.1
31UC Charnwood 120 46.9 42 15.1 336 103.5 245 48.2
17UD Chesterfield 129 65.3 35 17.4 319 133.7 201 50.6
34UB Corby 58 49.0 20 19.5 122 83.2 70 48.4
34UC Daventry 70 40.3 8 5.4 165 80.3 87 34.7
00FK Derby 245 70.1 111 28.9 612 136.0 530 71.3
17UF Derbyshire Dales 74 49.6 11 8.0 197 107.9 126 38.8
32UC East Lindsey 188 71.7 53 14.7 472 144.2 335 54.4
34UD East Northamptonshire 51 38.8 16 10.0 142 94.8 120 42.1
17UG Erewash 111 56.3 36 17.1 273 115.3 204 52.4
37UE Gedling 124 59.7 38 16.4 270 108.4 217 51.2
31UD Harborough 84 50.7 17 10.2 202 102.1 130 42.9
17UH High Peak 110 67.4 34 20.1 243 124.4 180 58.0
31UE Hinckley and Bosworth 85 38.4 26 12.2 213 81.1 144 39.8
34UE Kettering 83 56.2 27 16.5 187 110.0 121 41.7
00FN Leicester 342 91.8 135 33.0 723 162.3 508 74.9
32UD Lincoln 76 62.1 28 20.7 174 110.1 174 60.4
37UF Mansfield 124 67.2 54 28.0 269 124.1 224 70.4
31UG Melton 39 34.8 11 11.4 111 81.6 80 43.5
37UG Newark and Sherwood 121 56.0 44 19.1 283 110.8 208 51.6
Under 75 All ages
LA code LA name Men Women Men Women
Num
ber of d
eaths 2008-2010
Ag
e-stand
ardised d
eath rate/100,000
Num
ber of d
eaths 2008-2010
Ag
e-stand
ardised d
eath rate/100,000
Num
ber of d
eaths 2008-2010
Ag
e-stand
ardised d
eath rate/100,000
Num
ber of d
eaths 2008-2010
Ag
e-stand
ardised d
eath rate/100,000

34 Coronary heart disease statistics 2012
17UJ North East Derbyshire 104 51.1 45 20.5 261 109.7 236 64.7
32UE North Kesteven 107 42.3 27 11.8 271 87.9 171 42.6
31UH North West Leicestershire 101 56.2 33 18.9 234 113.6 155 52.4
34UF Northampton 170 66.6 57 17.2 404 133.2 290 49.5
00FY Nottingham 284 110.9 103 28.0 614 195.8 431 65.4
31UJ Oadby and Wigston 41 42.0 7 6.1 143 107.1 87 37.0
37UJ Rushcliffe 93 48.4 19 8.8 241 101.4 175 40.7
00FP Rutland 29 16.3 13 14.6 81 37.4 60 41.1
17UK South Derbyshire 88 53.4 28 16.6 188 102.6 170 60.6
32UF South Holland 90 54.4 34 16.3 244 113.3 201 53.5
32UG South Kesteven 114 47.2 34 12.1 305 103.7 245 48.9
34UG South Northamptonshire 65 40.3 16 9.6 157 89.6 114 41.8
34UH Wellingborough 70 36.7 18 13.0 164 74.8 100 41.7
32UH West Lindsey 85 45.7 36 18.3 222 97.1 139 44.9
West Midlands 5,510 59.9 1,803 17.9 12,654 115.0 8,776 49.4
00CN Birmingham 985 73.9 373 25.4 2,166 132.3 1,468 56.9
47UB Bromsgrove 84 44.8 30 15.1 209 89.0 154 41.8
41UB Cannock Chase 91 52.7 30 17.4 209 101.5 163 58.1
00CQ Coventry 273 62.0 88 17.7 626 113.2 391 43.4
00CR Dudley 323 57.3 104 16.7 683 105.7 509 47.7
41UC East Staffordshire 118 75.3 34 15.8 271 144.7 190 51.0
00GA Herefordshire, County of 192 52.6 61 16.0 539 115.8 347 44.8
41UD Lichfield 108 56.0 28 13.2 261 124.7 176 49.3
47UC Malvern Hills 64 33.1 23 12.6 199 78.5 150 40.0
41UE Newcastle-under-Lyme 121 55.6 43 16.9 319 124.3 232 51.9
44UB North Warwickshire 74 48.7 16 12.6 172 93.9 90 44.1
44UC Nuneaton and Bedworth 123 65.2 39 17.0 282 128.8 181 49.0
47UD Redditch 80 55.2 19 14.0 168 100.7 93 44.0
44UD Rugby 85 54.9 21 11.7 180 101.7 125 38.2
00CS Sandwell 371 82.1 152 31.0 761 143.0 551 66.5
00GG Shropshire 297 46.2 96 14.3 766 98.1 617 50.0
00CT Solihull 195 54.1 42 10.1 442 101.3 301 37.0
41UF South Staffordshire 104 45.7 23 9.5 285 113.7 156 37.3
41UG Stafford 107 46.3 41 14.7 281 100.3 232 47.2
41UH Staffordshire Moorlands 103 49.0 32 14.7 252 106.4 176 46.5
00GL Stoke-on-Trent 255 73.0 97 22.4 590 147.1 445 59.2
Under 75 All ages
LA code LA name Men Women Men Women
Num
ber of d
eaths 2008-2010
Ag
e-stand
ardised d
eath rate/100,000
Num
ber of d
eaths 2008-2010
Ag
e-stand
ardised d
eath rate/100,000
Num
ber of d
eaths 2008-2010
Ag
e-stand
ardised d
eath rate/100,000
Num
ber of d
eaths 2008-2010
Ag
e-stand
ardised d
eath rate/100,000

British Heart Foundation and University of Oxford 35
44UE Stratford-on-Avon 90 37.8 32 11.7 251 89.1 166 34.0
41UK Tamworth 83 50.0 24 18.1 140 78.1 112 59.5
00GF Telford and Wrekin 175 57.2 61 20.9 370 107.8 222 52.3
00CU Walsall 335 78.4 97 20.1 694 138.0 446 54.3
44UF Warwick 108 51.2 25 10.2 260 101.3 146 31.3
00CW Wolverhampton 254 67.3 85 20.5 569 118.2 430 56.0
47UE Worcester 97 61.6 31 18.9 203 109.3 148 52.9
47UF Wychavon 104 49.7 29 11.2 274 113.0 207 42.9
47UG Wyre Forest 111 58.9 27 12.9 232 108.8 152 40.6
East of England 4,734 47.7 1,499 13.6 13,039 104.7 9,804 47.0
42UB Babergh 84 45.0 16 8.2 245 107.2 177 43.3
22UB Basildon 148 60.0 44 13.5 385 121.1 277 49.2
00KB Bedford 141 54.0 43 16.4 332 111.2 249 54.7
22UC Braintree 95 35.3 49 18.5 283 83.6 262 53.7
33UB Breckland 121 45.3 45 15.7 401 117.6 269 47.9
22UD Brentwood 56 31.6 22 14.6 171 74.9 122 42.3
33UC Broadland 96 39.6 25 8.4 307 100.2 237 41.2
26UB Broxbourne 62 36.2 24 13.9 166 85.2 121 44.0
12UB Cambridge 59 46.2 15 9.6 159 93.2 139 39.1
22UE Castle Point 81 39.3 16 7.0 214 85.1 166 44.6
00KC Central Bedfordshire 209 49.7 70 15.0 517 109.4 387 50.8
22UF Chelmsford 108 47.2 28 8.8 300 107.5 229 40.2
22UG Colchester 108 43.8 35 11.4 291 99.6 237 40.8
26UC Dacorum 87 39.7 27 11.1 270 94.8 207 42.7
12UC East Cambridgeshire 57 29.7 22 14.1 170 72.4 139 47.4
26UD East Hertfordshire 89 45.1 27 11.4 260 110.5 201 46.4
22UH Epping Forest 117 49.5 33 13.6 333 112.4 255 53.2
12UD Fenland 104 60.3 29 15.7 257 121.6 163 45.3
42UC Forest Heath 44 40.3 21 21.2 126 98.5 99 56.3
33UD Great Yarmouth 89 41.3 46 22.1 259 92.6 227 59.1
22UJ Harlow 77 46.2 25 18.3 166 82.7 135 54.1
26UE Hertsmere 61 34.3 9 5.3 205 84.8 138 34.2
12UE Huntingdonshire 103 41.4 30 9.5 264 94.7 205 38.5
42UD Ipswich 105 56.9 44 21.2 333 133.6 237 58.7
33UE King’s Lynn and West Norfolk 171 59.2 50 15.2 447 118.6 321 50.8
00KA Luton 205 72.4 57 21.2 403 126.3 252 59.6
Under 75 All ages
LA code LA name Men Women Men Women
Num
ber of d
eaths 2008-2010
Ag
e-stand
ardised d
eath rate/100,000
Num
ber of d
eaths 2008-2010
Ag
e-stand
ardised d
eath rate/100,000
Num
ber of d
eaths 2008-2010
Ag
e-stand
ardised d
eath rate/100,000
Num
ber of d
eaths 2008-2010
Ag
e-stand
ardised d
eath rate/100,000

36 Coronary heart disease statistics 2012
22UK Maldon 53 32.1 13 9.3 125 66.5 91 38.7
42UE Mid Suffolk 94 55.9 24 11.7 256 128.9 178 47.4
26UF North Hertfordshire 98 45.9 31 14.1 284 106.2 272 57.3
33UF North Norfolk 109 48.2 33 11.6 367 113.3 262 43.2
33UG Norwich 115 53.8 42 21.7 308 105.8 240 54.7
00JA Peterborough 181 72.6 52 17.9 405 131.9 294 59.0
22UL Rochford 57 39.0 16 9.7 201 105.3 120 37.3
12UG South Cambridgeshire 90 40.0 26 10.0 239 84.7 171 34.8
33UH South Norfolk 104 43.5 27 9.4 286 88.9 198 38.7
00KF Southend-on-Sea 149 57.4 50 16.6 437 127.0 344 55.9
26UG St Albans 84 44.8 27 11.5 253 104.5 181 41.0
42UF St Edmundsbury 79 40.7 29 12.7 229 91.6 177 43.9
26UH Stevenage 72 48.3 27 19.7 184 101.0 127 56.1
42UG Suffolk Coastal 116 48.3 34 11.6 358 112.2 301 49.4
22UN Tendring 179 68.9 60 16.1 525 142.9 366 45.2
26UJ Three Rivers 66 40.5 11 6.7 193 90.6 117 31.3
00KG Thurrock 123 51.1 40 15.0 288 107.4 228 44.9
22UQ Uttlesford 49 33.6 12 8.3 141 80.1 106 38.6
26UK Watford 50 43.2 15 12.1 140 96.4 119 47.9
42UH Waveney 110 50.0 43 16.1 339 110.6 259 46.4
26UL Welwyn Hatfield 79 52.2 35 19.5 217 106.6 202 56.0
London 5,282 56.2 1,843 17.5 12,239 108.3 8,981 49.3
00AB Barking and Dagenham 151 75.1 53 24.3 347 137.9 274 62.0
00AC Barnet 218 47.4 47 8.9 612 102.3 502 43.6
00AD Bexley 175 50.1 65 15.7 454 103.3 392 51.8
00AE Brent 209 61.9 67 17.5 436 111.2 295 49.9
00AF Bromley 185 38.7 73 12.7 604 92.3 478 41.0
00AG Camden 150 66.8 41 15.7 325 121.5 185 44.5
00AA City of London 6 39.4 0 0.0 14 75.4 3 10.5
00AH Croydon 220 46.1 74 14.1 594 101.2 448 49.9
00AJ Ealing 293 75.4 86 20.3 546 122.7 310 48.0
00AK Enfield 204 51.8 72 16.3 486 102.0 386 48.8
00AL Greenwich 187 69.2 81 27.0 417 135.5 321 60.7
00AM Hackney 160 77.2 65 29.5 313 132.3 222 67.4
00AN Hammersmith and Fulham 96 53.7 33 15.4 198 92.0 152 42.0
00AP Haringey 161 66.5 63 22.9 324 126.9 227 58.7
Under 75 All ages
LA code LA name Men Women Men Women
Num
ber of d
eaths 2008-2010
Ag
e-stand
ardised d
eath rate/100,000
Num
ber of d
eaths 2008-2010
Ag
e-stand
ardised d
eath rate/100,000
Num
ber of d
eaths 2008-2010
Ag
e-stand
ardised d
eath rate/100,000
Num
ber of d
eaths 2008-2010
Ag
e-stand
ardised d
eath rate/100,000

British Heart Foundation and University of Oxford 37
00AQ Harrow 141 43.9 52 14.0 405 100.7 285 44.3
00AR Havering 225 59.6 72 15.7 571 116.9 423 48.5
00AS Hillingdon 187 53.1 50 12.8 419 100.4 315 43.4
00AT Hounslow 179 63.0 58 19.1 360 116.5 248 52.8
00AU Islington 156 86.0 58 28.2 304 147.2 172 59.6
00AW Kensington and Chelsea 70 30.5 23 8.1 176 57.6 118 24.3
00AX Kingston upon Thames 91 43.2 30 12.8 221 85.7 202 45.3
00AY Lambeth 167 65.4 65 22.0 342 115.5 242 56.5
00AZ Lewisham 184 66.4 82 26.0 438 138.6 314 63.1
00BA Merton 122 50.1 46 17.0 281 93.7 232 44.4
00BB Newham 223 89.3 73 28.6 393 148.3 223 64.3
00BC Redbridge 189 54.1 81 21.5 488 115.3 370 56.0
00BD Richmond upon Thames 97 37.6 25 9.0 265 83.9 198 34.3
00BE Southwark 153 55.9 47 15.4 324 101.0 224 43.7
00BF Sutton 96 35.5 45 14.9 279 82.0 286 48.1
00BG Tower Hamlets 180 99.3 44 23.3 338 156.6 169 61.3
00BH Waltham Forest 168 64.4 72 25.0 371 127.1 308 65.3
00BJ Wandsworth 129 48.6 48 15.8 344 102.1 286 48.8
00BK Westminster 110 38.8 52 16.4 250 70.0 171 35.5
South East 6,431 45.6 1,957 12.5 17,495 97.6 13,428 42.8
45UB Adur 45 26.9 18 12.4 150 70.9 133 44.1
45UC Arun 140 47.9 45 11.7 467 109.1 370 39.7
29UB Ashford 103 59.4 28 12.7 257 120.9 198 49.4
11UB Aylesbury Vale 122 44.9 36 11.7 310 103.5 222 42.3
24UB Basingstoke and Deane 116 46.8 43 15.4 294 105.8 249 56.0
00MA Bracknell Forest 76 40.7 14 5.2 173 86.1 96 22.0
00ML Brighton and Hove 197 62.2 48 12.8 493 122.7 353 44.1
29UC Canterbury 138 62.4 37 12.5 386 131.0 297 46.0
38UB Cherwell 96 43.5 19 7.8 252 97.4 156 34.0
45UD Chichester 111 56.6 25 8.8 320 117.7 249 39.5
11UC Chiltern 58 33.0 21 11.2 178 81.5 140 39.1
45UE Crawley 62 31.2 26 17.1 177 60.8 131 45.9
29UD Dartford 83 51.2 25 16.4 157 83.9 95 38.9
29UE Dover 119 52.1 39 15.6 326 111.8 260 54.2
24UC East Hampshire 65 33.5 23 9.9 233 95.0 178 39.2
21UC Eastbourne 95 71.6 17 8.1 300 147.4 234 38.3
Under 75 All ages
LA code LA name Men Women Men Women
Num
ber of d
eaths 2008-2010
Ag
e-stand
ardised d
eath rate/100,000
Num
ber of d
eaths 2008-2010
Ag
e-stand
ardised d
eath rate/100,000
Num
ber of d
eaths 2008-2010
Ag
e-stand
ardised d
eath rate/100,000
Num
ber of d
eaths 2008-2010
Ag
e-stand
ardised d
eath rate/100,000

38 Coronary heart disease statistics 2012
24UD Eastleigh 91 40.5 19 8.7 255 97.8 191 43.6
43UB Elmbridge 63 27.8 36 15.8 219 69.2 216 44.9
43UC Epsom and Ewell 37 23.3 13 9.7 130 58.2 105 36.5
24UE Fareham 83 40.6 19 7.3 235 87.1 175 35.8
24UF Gosport 66 42.5 22 13.7 154 81.5 141 47.4
29UG Gravesham 77 49.0 28 15.6 162 87.0 147 46.9
43UD Guildford 78 38.4 22 9.1 232 87.3 154 33.1
24UG Hart 46 26.2 14 8.4 125 58.6 97 34.1
21UD Hastings 95 68.0 22 13.0 223 132.4 165 43.7
24UH Havant 105 54.2 29 11.3 301 113.9 205 40.0
45UF Horsham 74 31.2 30 11.8 271 83.4 225 42.9
00MW Isle of Wight 147 49.8 37 11.2 424 107.6 290 38.6
21UF Lewes 46 24.3 20 9.2 236 74.1 175 32.4
29UH Maidstone 123 50.8 40 14.4 307 105.0 258 51.0
00LC Medway 266 73.4 80 21.4 519 131.0 417 69.3
45UG Mid Sussex 63 31.1 38 14.0 237 83.6 250 49.5
00MG Milton Keynes 218 71.7 74 23.5 464 144.8 305 64.0
43UE Mole Valley 62 42.9 17 9.4 195 99.3 150 39.5
24UJ New Forest 139 46.6 43 10.5 483 109.5 367 36.9
38UC Oxford 73 43.4 31 17.8 189 83.8 159 45.6
00MR Portsmouth 171 58.2 45 14.3 391 111.9 271 39.5
00MC Reading 130 74.5 29 13.4 264 127.7 172 41.4
43UF Reigate and Banstead 83 38.6 26 11.0 262 92.1 193 37.6
21UG Rother 105 55.8 22 9.7 294 109.1 263 41.3
43UG Runnymede 52 37.0 18 12.0 149 78.8 119 39.4
24UL Rushmoor 57 36.0 9 6.9 144 71.7 92 32.2
29UK Sevenoaks 52 26.1 21 8.8 195 79.1 157 34.3
29UL Shepway 117 51.3 30 13.8 328 116.3 224 49.0
00MD Slough 115 59.5 45 27.3 226 103.2 159 56.5
11UE South Bucks 44 25.0 14 10.4 151 68.3 105 39.9
38UD South Oxfordshire 79 34.7 25 10.1 221 80.6 150 33.2
00MS Southampton 178 55.4 60 19.4 437 104.9 317 50.2
43UH Spelthorne 67 38.3 21 12.3 178 77.1 155 45.9
43UJ Surrey Heath 66 46.9 11 6.9 151 91.8 109 38.0
29UM Swale 146 64.6 41 16.9 314 123.1 213 53.6
43UK Tandridge 47 31.1 22 13.5 145 69.4 125 37.5
24UN Test Valley 81 30.1 27 12.1 218 62.5 171 38.4
Under 75 All ages
LA code LA name Men Women Men Women
Num
ber of d
eaths 2008-2010
Ag
e-stand
ardised d
eath rate/100,000
Num
ber of d
eaths 2008-2010
Ag
e-stand
ardised d
eath rate/100,000
Num
ber of d
eaths 2008-2010
Ag
e-stand
ardised d
eath rate/100,000
Num
ber of d
eaths 2008-2010
Ag
e-stand
ardised d
eath rate/100,000

British Heart Foundation and University of Oxford 39
29UN Thanet 155 67.7 52 18.4 450 145.2 358 59.2
29UP Tonbridge and Malling 87 40.5 20 8.5 224 91.6 188 46.1
29UQ Tunbridge Wells 78 38.9 36 18.1 196 76.7 159 42.0
38UE Vale of White Horse 78 40.0 19 8.7 232 91.2 176 39.1
43UL Waverley 74 39.2 26 11.0 227 91.2 228 42.8
21UH Wealden 98 36.7 33 9.0 320 85.5 286 38.0
00MB West Berkshire 90 29.1 19 8.2 251 73.4 152 36.4
38UF West Oxfordshire 63 32.1 20 9.7 189 75.0 153 35.9
24UP Winchester 65 37.2 29 12.6 217 93.4 215 45.7
00ME Windsor and Maidenhead 108 51.3 32 14.3 285 107.7 235 56.2
43UM Woking 53 37.4 16 10.3 159 84.4 117 36.5
00MF Wokingham 99 44.4 29 10.7 239 93.9 148 33.9
45UH Worthing 87 43.7 29 14.2 316 109.9 261 46.5
11UF Wycombe 128 54.6 33 11.1 288 104.3 204 39.3
South West 4,416 45.6 1,313 12.4 12,677 99.5 9,766 44.2
00HA Bath and North East Somerset 121 36.9 33 9.7 381 86.9 281 38.7
00HN Bournemouth 138 45.9 41 14.1 458 102.3 375 47.6
00HB Bristol, City of 331 71.4 101 17.3 816 138.3 589 49.8
23UB Cheltenham 70 31.8 25 12.7 235 70.4 237 47.7
19UC Christchurch 33 28.7 12 8.7 158 82.3 126 38.3
00HE Cornwall 547 46.2 157 12.8 1,525 102.9 1,182 48.0
23UC Cotswold 65 39.6 27 14.3 202 95.7 204 52.4
18UB East Devon 112 40.8 26 7.8 425 103.8 342 37.9
19UD East Dorset 71 41.3 18 7.4 270 103.0 189 34.7
18UC Exeter 85 51.0 25 13.2 206 99.7 198 45.3
23UD Forest of Dean 80 46.1 25 14.0 200 95.4 164 49.9
23UE Gloucester 111 62.8 25 12.7 297 131.9 160 43.1
00HF Isles of Scilly UA 0 0.0 1 35.0 8 40.0 3 45.0
40UB Mendip 79 39.8 14 6.1 234 92.2 144 29.5
18UD Mid Devon 83 41.8 16 9.8 197 74.7 125 40.4
18UE North Devon 87 47.8 25 11.5 255 108.9 194 43.2
19UE North Dorset 48 38.3 13 8.8 153 83.4 118 38.5
00HC North Somerset 149 32.5 46 10.3 481 78.5 405 42.8
00HG Plymouth 267 64.5 77 25.5 597 122.0 427 75.7
00HP Poole 96 36.0 36 12.5 356 91.1 304 41.6
19UG Purbeck 31 23.6 14 11.9 118 59.8 78 35.5
Under 75 All ages
LA code LA name Men Women Men Women
Num
ber of d
eaths 2008-2010
Ag
e-stand
ardised d
eath rate/100,000
Num
ber of d
eaths 2008-2010
Ag
e-stand
ardised d
eath rate/100,000
Num
ber of d
eaths 2008-2010
Ag
e-stand
ardised d
eath rate/100,000
Num
ber of d
eaths 2008-2010
Ag
e-stand
ardised d
eath rate/100,000

40 Coronary heart disease statistics 2012
40UC Sedgemoor 111 59.3 37 15.8 304 129.1 236 50.8
00HD South Gloucestershire 192 44.7 58 12.3 487 92.6 356 43.4
18UG South Hams 75 44.3 30 14.9 225 103.2 186 47.9
40UD South Somerset 138 49.2 33 9.2 411 110.1 252 33.9
23UF Stroud 93 47.0 35 15.1 259 106.3 230 49.5
00HX Swindon 140 48.7 53 16.8 368 99.2 282 49.0
40UE Taunton Deane 93 45.1 29 12.6 279 101.9 213 42.8
18UH Teignbridge 121 51.7 53 17.5 343 106.0 306 48.1
23UG Tewkesbury 77 46.7 14 7.7 192 93.1 150 42.0
00HH Torbay 156 88.4 43 12.4 419 168.1 323 42.0
18UK Torridge 57 34.7 14 9.4 177 88.7 139 44.0
18UL West Devon 49 30.8 12 11.5 130 61.6 91 38.4
19UH West Dorset 73 38.0 27 11.4 277 97.7 225 39.4
40UF West Somerset 31 17.8 10 9.0 102 42.6 95 37.6
19UJ Weymouth and Portland 60 51.0 17 12.1 163 102.6 126 42.6
00HY Wiltshire 346 42.1 91 10.0 969 94.3 711 39.8
Wales 3,412 63.2 1,181 19.9 8,359 127.3 6,404 58.8
00PL Blaenau Gwent 106 90.1 42 20.5 200 150.7 187 55.8
00PB Bridgend 135 46.2 52 18.9 325 91.3 270 56.4
00PK Caerphilly 215 65.9 86 33.0 480 128.5 359 87.1
00PT Cardiff 259 73.7 91 22.1 599 138.7 461 59.7
00NU Carmarthenshire 230 76.3 78 22.1 572 156.3 501 75.0
00NQ Ceredigion 60 34.6 22 11.0 197 86.3 157 37.2
00NE Conwy 134 68.8 47 18.8 414 151.4 365 66.2
00NG Denbighshire 122 58.6 45 18.7 322 125.0 287 57.5
00NJ Flintshire 158 60.6 47 16.6 417 131.6 297 60.5
00NC Gwynedd 134 54.9 43 19.6 354 113.7 279 64.7
00NA Isle of Anglesey 70 34.4 21 10.1 208 81.9 148 33.7
00PH Merthyr Tydfil 96 68.5 32 14.7 181 112.5 130 35.3
00PP Monmouthshire 90 54.5 28 15.2 219 111.0 173 48.4
00NZ Neath Port Talbot 198 70.1 73 22.3 438 129.8 300 52.0
00PR Newport 171 81.4 55 23.5 385 155.3 279 64.5
00NS Pembrokeshire 158 61.5 56 23.8 402 125.4 288 67.5
00NN Powys 130 44.7 41 15.0 397 109.7 271 49.0
00PF Rhondda, Cynon, Taff 291 82.1 113 29.6 664 162.6 515 78.4
00NX Swansea 256 75.0 88 20.8 656 147.9 483 60.6
Under 75 All ages
LA code LA name Men Women Men Women
Num
ber of d
eaths 2008-2010
Ag
e-stand
ardised d
eath rate/100,000
Num
ber of d
eaths 2008-2010
Ag
e-stand
ardised d
eath rate/100,000
Num
ber of d
eaths 2008-2010
Ag
e-stand
ardised d
eath rate/100,000
Num
ber of d
eaths 2008-2010
Ag
e-stand
ardised d
eath rate/100,000

British Heart Foundation and University of Oxford 41
00PD The Vale of Glamorgan 118 49.8 35 12.9 300 103.8 196 42.1
00PM Torfaen 120 57.4 47 27.1 281 114.8 201 69.6
00NL Wrexham 161 71.5 39 13.8 348 135.1 257 51.8
Scotland 6,668 74.7 2,673 26.2 14,051 126.7 11,202 68.0
00QA Aberdeen City 202 69.1 79 19.6 457 120.4 404 53.5
00QB Aberdeenshire 230 51.1 102 23.3 553 96.6 481 67.4
00QC Angus 130 50.2 51 16.1 317 94.2 254 48.3
00QD Argyll & Bute 129 46.1 44 19.9 293 85.6 236 61.6
00QF Clackmannanshire 73 56.2 26 19.1 134 87.8 115 55.6
00QH Dumfries & Galloway 219 77.5 71 21.9 526 141.0 371 69.6
00QJ Dundee City 232 100.9 81 38.0 478 158.7 363 96.9
00QK East Ayrshire 172 99.8 77 34.6 335 160.6 258 78.2
00QL East Dunbartonshire 78 43.1 51 19.3 193 83.3 196 47.2
00QM East Lothian 114 52.6 52 22.2 282 98.6 228 58.2
00QN East Renfrewshire 82 44.8 38 18.4 212 84.6 190 55.8
00QP Edinburgh City 502 97.8 179 31.3 1,146 166.5 934 85.1
00RJ Eilean Siar 46 45.3 14 13.1 100 79.7 55 31.4
00QQ Falkirk 169 72.8 86 33.8 404 138.5 315 81.0
00QR Fife 437 90.9 182 24.1 989 158.2 783 61.9
00QS Glasgow City 897 119.7 370 56.3 1,607 179.8 1,327 122.5
00QT Highland 268 87.7 88 15.7 589 150.0 450 48.2
00QU Inverclyde 125 70.1 54 12.7 236 113.7 185 26.8
00QW Midlothian 103 33.4 38 15.1 221 60.7 162 40.5
00QX Moray 108 28.7 31 18.0 233 52.4 179 60.1
00QY North Ayrshire 221 70.0 94 35.8 408 110.5 337 88.6
00QZ North Lanarkshire 494 125.4 192 39.8 856 189.3 655 98.7
00RA Orkney Islands 20 25.7 11 8.1 50 54.7 44 21.8
00RB Perth & Kinross 161 65.5 61 13.9 407 121.6 348 49.8
00RC Renfrewshire 239 87.2 104 43.5 478 143.1 355 101.2
00QE Scottish Borders 153 46.6 65 23.7 393 95.9 269 60.4
00RD Shetland Islands 18 43.2 1 0.6 51 101.7 37 14.2
00RE South Ayrshire 188 76.3 61 33.6 403 127.3 302 94.0
00RF South Lanarkshire 414 92.0 161 32.3 836 151.9 661 84.3
00RG Stirling 87 74.3 34 9.9 187 129.9 158 29.4
00QG West Dunbartonshire 137 79.1 68 37.3 273 131.0 258 91.2
00RH West Lothian 220 61.5 107 35.5 404 101.8 292 78.6
Under 75 All ages
LA code LA name Men Women Men Women
Num
ber of d
eaths 2008-2010
Ag
e-stand
ardised d
eath rate/100,000
Num
ber of d
eaths 2008-2010
Ag
e-stand
ardised d
eath rate/100,000
Num
ber of d
eaths 2008-2010
Ag
e-stand
ardised d
eath rate/100,000
Num
ber of d
eaths 2008-2010
Ag
e-stand
ardised d
eath rate/100,000

42 Coronary heart disease statistics 2012
Northern Ireland 1,688 60.4 630 21.0 3,896 127.0 3,053 63.0
95T Antrim 45 32.2 17 20.8 95 62.9 85 75.0
95X Ards 76 47.7 73 50.4 168 96.7 318 139.7
95O Armagh 49 57.0 16 16.1 138 160.9 102 67.8
95G Ballymena 55 47.4 27 22.7 150 113.7 109 57.6
95D Ballymoney 28 45.7 20 36.4 79 112.5 114 137.4
95Q Banbridge 43 52.3 20 26.0 98 111.6 109 91.1
95Z Belfast 321 122.9 90 19.5 668 217.8 384 48.0
95V Carrickfergus 41 60.4 18 24.5 92 129.5 82 71.8
95Y Castlereagh 52 27.4 18 14.7 136 59.7 106 46.3
95C Coleraine 55 65.3 16 14.9 149 155.7 85 46.2
95I Cookstown 38 56.2 15 27.8 93 117.5 80 88.3
95N Craigavon 108 89.8 23 15.7 211 163.5 114 49.9
95A Derry 113 98.6 27 16.7 216 200.5 114 52.2
95R Down 60 52.2 20 17.6 146 113.6 94 50.9
95M Dungannon 43 42.4 18 22.6 114 110.4 77 62.1
95L Fermanagh 63 61.4 14 13.3 141 125.5 101 53.4
95F Larne 42 66.0 16 27.7 92 130.4 58 64.6
95B Limavady 29 44.0 17 34.3 66 96.4 64 91.0
95S Lisburn 77 59.2 43 22.8 219 157.0 198 71.2
95H Magherafelt 27 48.6 14 22.0 77 128.4 87 87.6
95E Moyle 17 21.7 12 39.6 38 47.0 55 106.6
95P Newry & Mourne 78 70.2 28 19.2 182 164.5 129 59.6
95U Newtownabbey 69 71.2 12 7.5 164 151.7 93 35.8
95W North Down 70 49.8 25 15.7 177 111.9 154 50.3
95K Omagh 53 57.2 15 19.2 110 110.4 73 60.8
95J Strabane 36 41.2 16 24.7 77 79.4 68 76.6
Notes:ICD-10 codes I20-I25; directly standardised using the European Standard Population.
Source:England and Wales: rates calculated in partnership with the Office for National Statistics. ¶ Scotland: Rates calculated in partnership with the General Register Office for Scotland. ¶ Northern Ireland: Rates calculated in partnership with Northern Ireland Statistics and Research Agency.
Under 75 All ages
LA code LA name Men Women Men Women
Num
ber of d
eaths 2008-2010
Ag
e-stand
ardised d
eath rate/100,000
Num
ber of d
eaths 2008-2010
Ag
e-stand
ardised d
eath rate/100,000
Num
ber of d
eaths 2008-2010
Ag
e-stand
ardised d
eath rate/100,000
Num
ber of d
eaths 2008-2010
Ag
e-stand
ardised d
eath rate/100,000

British Heart Foundation and University of Oxford 43
Figure 1.11a Age-standardised death rates from coronary heart disease (CHD) per 100,000, for men under 75 by local authority, 2008/10, United Kingdom
Contains Ordnance Survey data © Crown copyright and database right 2012
London
Under 46
47 to 55
56 to 66
66 to 77
Over 77

44 Coronary heart disease statistics 2012
Figure 1.11b Age-standardised death rates from coronary heart disease (CHD) per 100,000, for women under 75 by local authority, 2008/10, United Kingdom
Contains Ordnance Survey data © Crown copyright and database right 2012
London
Under 12
12 to 17
17 to 21
21 to 27
Over 27

British Heart Foundation and University of Oxford 45
Table 1.12 Cardiovascular disease (CVD) mortality rates, by sex and socioeconomic status, England and Wales 2001-03
CVD CHD Stroke
Men Women Men Women Men Women
High managerial and professional 61 13 41 5 8 5
Lower managerial and professional 84 19 56 7 12 7
Intermediate 90 19 60 7 12 7
Small employers and own account workers 100 27 66 10 15 9
Lower supervisory and technical 125 34 86 15 17 11
Semi-routine 158 35 107 15 23 11
Routine 172 51 119 24 23 14
Rate ratio 2.8 3.8 2.9 5.0 2.9 3.0
Notes:Rates are directly age-standardised to the European Standard Population, and presented per 100,000. ¶ Socioeconomic status categories defined by National Statistics Socio Economic Classification (NS-SEC). ¶ Age range for men is 25 to 64. ¶ Age range for women is 25 to 59. ¶ Rate ratio compares the ‘routine’ and ‘high managerial and professional’ categories.
Source: Langford A, Johnson B (2009). Social inequalities in female mortality by region and by selected causes of death, England and Wales, 2001–03. Health Statistics Quarterly; 44: 7-26 White C, Edgar G and Siegler V (2008). Social inequalities in male mortality for selected causes of death by the National Statistics Socio-economic Classification, England and Wales, 2001–03. Health Statistics Quarterly; 38: 34-46

46 Coronary heart disease statistics 2012
Figure 1.12 Coronary heart disease (CHD) death rates per 100,000 population, by sex and socioeconomic status, England and Wales 2001/03
Dea
th ra
te p
er 1
00,0
00
0
20
40
60
80
100
120
140
WomenMen
A. B. C. D. E. F. G.
A. High managerial and professional B. Lower managerial and professional C. Intermediate D. Small employers and own account workersE. Lower supervisory and technicalF. Semi-routineG. Routine

British Heart Foundation and University of Oxford 47
Table 1.13Trends in coronary heart disease (CHD) death rates per 100,000 population, by sex and deprivation quintile, Great Britain 1994 to 2008
1994 1995 1996 1997 1998 1999 2000 2001 2002 2003 2004 2005 2006 2007 2008
Men, all ages
Quintile 1 222 211 207 193 186 172 164 152 146 138 128 122 110 104 98
Quintile 2 240 233 223 209 199 191 181 167 164 154 146 131 122 116 105
Quintile 3 255 249 239 221 213 210 191 184 178 170 154 143 133 125 118
Quintile 4 276 272 259 248 236 226 210 203 192 182 171 157 145 140 131
Quintile 5 296 292 280 268 256 240 231 221 208 203 183 173 162 156 142
Ratio 1.3 1.4 1.4 1.4 1.4 1.4 1.4 1.4 1.4 1.5 1.4 1.4 1.5 1.5 1.5
Women, all ages
Quintile 1 105 98 96 92 86 82 74 72 67 66 60 55 52 47 44
Quintile 2 112 107 103 100 98 89 85 80 76 75 67 61 56 53 50
Quintile 3 119 117 115 104 103 95 91 85 85 81 71 69 63 59 55
Quintile 4 134 129 123 115 116 104 101 97 94 88 80 76 70 67 61
Quintile 5 146 140 132 130 124 119 108 105 101 96 89 84 76 72 69
Ratio 1.4 1.4 1.4 1.4 1.4 1.5 1.5 1.5 1.5 1.5 1.5 1.5 1.5 1.5 1.6
Men, under 75
Quintile 1 113 104 101 93 91 81 79 71 66 60 58 53 48 46 44
Quintile 2 124 121 114 105 98 94 88 79 76 69 66 58 56 52 48
Quintile 3 137 133 127 116 110 107 97 92 85 81 74 69 64 60 57
Quintile 4 156 151 142 134 128 123 109 104 97 91 85 79 72 69 68
Quintile 5 172 170 162 156 146 135 129 122 115 113 99 95 89 85 81
Ratio 1.5 1.6 1.6 1.7 1.6 1.7 1.6 1.7 1.7 1.9 1.7 1.8 1.8 1.9 1.8
Women, under 75
Quintile 1 37 34 33 31 28 26 23 22 20 18 16 15 15 12 12
Quintile 2 41 39 37 36 35 30 29 26 23 24 19 19 16 16 15
Quintile 3 47 45 44 39 40 36 33 31 30 27 22 23 20 18 17
Quintile 4 58 55 51 47 48 40 40 36 35 30 27 25 24 23 21
Quintile 5 66 63 59 59 54 52 47 45 42 39 37 33 31 28 28
Ratio 1.8 1.8 1.8 1.9 1.9 2.0 2.1 2.1 2.1 2.1 2.3 2.1 2.1 2.3 2.3
Notes:Quintile 1 is the least deprived and quintile 5 is the most deprived. ¶ Ratio refers to quintile 5 compared to quintile 1. Deprivation measured using the Carstairs index for local authorities.
Source:McCartney D, Scarborough P, Webster P, Rayner M (2012). Trends in social inequalities for premature coronary heart disease mortality in Great Britain, 1994 – 2008: a time trend ecological study. BMJ Open; 2: e000737.

48 Coronary heart disease statistics 2012
Figure 1.13a Trends in coronary heart disease (CHD) death rates per 100,000 population in men , by deprivation quintile, Great Britain 1994 to 2008
Figure 1.13b Trends in coronary heart disease (CHD) death rates per 100,000 population in women, by deprivation quintile, Great Britain 1994 to 2008
Dea
th ra
tes
per
100
,000
Quintile 4Quintile 3Quintile 2Quintile 1
1994
1995
1996
1997
1998
1999
2000
2001
2002
2003
2004
2005
2006
2007
2008
Quintile 5
0
20
40
60
80
100
120
140
160
180
200
Dea
th ra
tes
per
100
,000
Quintile 4Quintile 3Quintile 2Quintile 1
1994
1995
1996
1997
1998
1999
2000
2001
2002
2003
2004
2005
2006
2007
2008
Quintile 5
0
10
20
30
40
50
60
70

British Heart Foundation and University of Oxford 49
Table 1.14aAge-standardised cardiovascular disease (CVD) death rates per 100,000 population in men, WHO European region 1980 to 2010
Men 1980 1985 1990 1995 2000 2001 2002 2003 2004 2005 2006 2007 2008 2009 2010
Albania 514 656 450 479 525 491
Armenia 580 671 782 617 684 736 751 659 640
Austria 638 599 493 464 385 374 351 321 298 287 278 272 259 259 252
Azerbaijan 775 724 821 775 707 731 737 720 617
Belarus 830 704 856 901 953 991 988 967 996 866 874 894
Belgium 525 462 364 328 258 244 224
Bosnia and Herzegovina 492 614
Bulgaria 716 826 813 871 877 854 873 868 841 833 822 796 751 745 771
Croatia 701 668 586 680 586 590 601 498 526 505 499 486 461 440
Cyprus 298 291 261 268 245 235
Czech Republic 819 850 834 708 577 568 561 569 531 508 478 454 437 436 424
Denmark 555 513 473 408 316 321 307 300 278 258 244
Estonia 1,013 927 930 768 777 753 754 706 692 689 657 634 589 567
Finland 696 671 563 476 390 368 361 352 335 321 317 312 299 295 288
France 382 345 267 241 222 215 210 208 191 186 175 169 166
Georgia 873 777 1,012 694 817 796 768 744 638
Germany 510 443 365 355 349 346 315 304 286 277 264 257 246
Greece 403 424 416 398 380 365 361 355 344 321 310 299 282 271
Hungary 843 852 806 752 660 635 639 648 619 644 591 585 554 548
Iceland 470 421 360 376 274 280 283 264 281 220 229 230 220 219
Ireland 705 655 547 495 401 373 354 323 306 285 266 263 240 238
Israel 518 417 360 365 238 228 216 210 199 188 176 182 158 144
Italy 517 460 374 343 294 280 274 270 225 219 214
Kazakhstan 776 766 1,040 1,071 1033 1057 1135 1070 1091 1078 1068 977 818
Kyrgyzstan 689 666 826 809 788 831 841 775 841 870 872 841 836
Latvia 940 975 879 1,048 803 816 814 796 792 804 779 781 717 673
Lithuania 775 738 768 660 704 722 725 706 750 741 745 701 672
Luxembourg 600 594 454 375 316 301 314 341 290 271 284 255 248 247
Malta 1,270 629 474 349 398 334 349 351 294 317 318 273 274 263 213
Netherlands 473 461 391 358 303 287 283 274 253 239 222 210 197 187 181
Norway 510 505 464 396 319 310 301 273 255 237 222 223 214 198 191
Poland 738 781 768 687 576 560 531 536 510 493 480 473 464 465
Portugal 567 527 467 394 323 311 310 299 271 223 216 208
Republic of Moldova 978 682 910 1,001 980 1020 1015 965 1024 943 880 837 860 875
Romania 826 836 775 877 772 772 822 808 762 755 727 683 665 656 647
Russian Federation 946 950 863 1,065 1,056 1068 1109 1184 1126 1145 1053 994 979 927
San Marino 344 253 242
Serbia 733 677 681 676 647 670 633 604 578 562
Slovakia 743 729 774 722 662 669 660 655 627 635 628 607 583 559
Slovenia 663 557 464 407 387 373 376 354 360 322 322 290 278
Spain 445 401 337 289 239 231 227 227 211 209 195 193 184 175
Sweden 568 527 446 393 330 319 308 299 278 274 262 252 245 235 228
Switzerland 485 419 377 318 265 250 238 236 216 219 208 202
Tajikistan 507 558 711 664 672 726 762 712 673
TFYR Macedonia 670 657 631 689 682
Turkmenistan 831 833 1,033
Ukraine 931 742 1,000 1,002 986 1040 1063 1063 1094 1057 1038 970 957
United Kingdom 620 566 475 413 332 327 317 305 281 264 246 235 225 211
Uzbekistan 708 721 898 873 842 866 841 799 858
European Region 675 671 607 651 601 592 601 613 582 582 550 529 515 495 492
EU 570 551 497 453 384 374 368 362 338 328 310 300 289 282 280
Source: European Health for All database (HFA-DB). http://data.euro.who.int/hfadb/ (Accessed April 2012).

50 Coronary heart disease statistics 2012
Table 1.14b Age-standardised cardiovascular disease (CVD) death rates per 100,000 population in women, WHO European region 1980 to 2010
Women 1980 1985 1990 1995 2000 2001 2002 2003 2004 2005 2006 2007 2008 2009 2010
Albania 322 421 299 332 369 355
Armenia 472 489 556 497 477 537 536 463 451
Austria 434 391 321 304 262 252 241 231 210 203 192 186 177 177 171
Azerbaijan 509 463 527 565 529 541 563 553 489
Belarus 560 447 476 510 533 532 514 495 508 427 417 428
Belgium 331 285 227 207 169 162 149
Bosnia and Herzegovina 438 491
Bulgaria 568 636 586 601 620 591 602 587 560 551 541 526 500 492 504
Croatia 508 472 419 495 413 404 425 356 372 350 353 335 327 313
Cyprus 193 207 188 177 171 153
Czech Republic 543 552 513 455 379 382 379 384 357 351 318 307 292 296 282
Denmark 316 293 280 247 196 195 193 184 171 160 154
Estonia 647 558 530 448 432 435 427 393 377 360 343 337 320 311
Finland 383 356 312 267 220 207 209 198 182 178 171 168 164 158 154
France 230 206 159 139 127 126 123 125 111 110 101 97 96
Georgia 584 529 641 574 528 454 430 397 368
Germany 327 278 239 234 237 239 219 211 198 192 186 180 173
Greece 327 338 330 314 299 296 290 297 285 266 259 251 236 219
Hungary 574 557 524 476 421 409 408 410 394 401 366 354 339 331
Iceland 256 255 225 207 188 156 166 161 148 142 152 128 136 132
Ireland 452 402 319 297 244 221 213 200 186 169 160 164 150 151
Israel 427 336 273 268 165 156 153 146 139 139 130 128 113 102
Italy 354 309 249 228 195 184 179 182 151 148 142
Kazakhstan 524 499 651 621 659 667 697 666 679 659 643 595 493
Kyrgyzstan 510 457 568 570 561 620 616 578 609 620 597 595 575
Latvia 609 647 543 573 465 475 462 465 444 434 421 423 374 354
Lithuania 530 483 498 418 432 434 424 428 436 440 420 401 385
Luxembourg 432 369 306 224 190 209 200 213 189 191 193 178 158 144
Malta 959 461 383 291 271 247 245 240 222 233 218 196 187 172 167
Netherlands 270 251 217 205 182 174 173 165 156 148 139 134 129 121 119
Norway 288 268 252 217 190 182 179 169 159 141 144 138 130 124 119
Poland 464 494 462 421 353 344 329 331 314 304 292 285 277 276
Portugal 418 368 338 285 233 227 223 221 194 165 159 152
Republic of Moldova 781 519 658 731 715 756 759 701 750 683 656 629 613 628
Romania 719 718 645 641 581 573 601 592 558 557 531 493 472 462 454
Russian Federation 610 634 561 634 629 633 650 673 639 640 607 571 559 525
San Marino 165 147 156
Serbia 592 546 562 557 528 545 508 488 473 455
Slovakia 519 495 479 473 439 444 432 435 412 417 408 395 373 364
Slovenia 444 371 308 251 239 235 236 223 235 212 211 191 192
Spain 326 293 246 201 162 156 153 153 141 140 128 127 122 115
Sweden 324 295 256 221 197 194 192 183 172 163 163 159 154 148 145
Switzerland 308 247 225 187 168 156 153 152 141 137 131 129
Tajikistan 408 423 562 554 546 561 539 504 486
TFYR Macedonia 546 519 494 548 530
Turkmenistan 602 588 758
Ukraine 657 499 642 650 639 648 666 646 656 637 614 590 591
United Kingdom 367 334 281 248 204 202 198 193 177 167 156 149 144 134
Uzbekistan 526 517 698 690 669 690 659 612 662
European Region 451 452 400 415 388 381 385 388 366 364 347 333 324 311 309
EU 379 363 323 290 250 244 241 240 223 216 204 196 189 184 182
Source: European Health for All database (HFA-DB). http://data.euro.who.int/hfadb/ (Accessed April 2012).

British Heart Foundation and University of Oxford 51
Figure 1.14 Cardiovascular disease (CVD) death rates per 100,000, by sex, selected countries 2008
Death rate per 100,000WomenMen
0 200200 400400 600600 800800 1000 1200
IsraelFranceSpainNetherlandsItalyNorwayPortugalUnited KingdomIrelandSwedenAustriaGermanyGreeceSloveniaFinlandCzech RepublicPolandHungarySlovakiaEstoniaLithuaniaLatviaKazakhstanRussian FederationUkraine

52 Coronary heart disease statistics 2012
Table 1.15a Age-standardised coronary heart disease (CHD) death rates per 100,000 population in men, WHO European region 1980 to 2010
Men 1980 1985 1990 1995 2000 2001 2002 2003 2004 2005 2006 2007 2008 2009 2010
Albania 121 171 115 143 168 156
Armenia 389 463 533 435 480 480 491 417 407
Austria 229 240 221 212 183 176 175 162 152 147 145 142 131 131 133
Azerbaijan 481 524 576 543 492 515 481 352 149
Belarus 594 459 578 618 653 677 678 631 694 606 618 643
Belgium 196 171 129 127 104 99 87
Bosnia and Herzegovina 126 144
Bulgaria 233 296 288 306 247 244 254 240 225 219 203 188 174 159 156
Croatia 137 124 236 261 214 210 242 198 220 208 200 205 201 207
Cyprus 115 122 112 123 106 108 95
Czech Republic 410 439 439 355 256 253 243 238 220 231 223 239 227 218 213
Denmark 383 345 293 227 154 155 134 127 119 107 98
Estonia 686 608 594 468 488 460 445 414 388 376 350 330 299 295
Finland 434 427 359 304 255 237 234 222 211 203 201 193 182 179 177
France 112 112 91 81 76 72 70 68 64 62 57 55 53 52
Georgia 491 487 520 490 465 226 186 164 155
Germany 225 217 177 170 166 162 149 141 133 126 117 116 111
Greece 122 130 136 130 124 124 121 126 124 112 108 106 96 97
Hungary 318 333 332 345 302 299 293 309 309 347 319 303 289 289
Iceland 341 304 233 225 166 160 171 167 171 128 129 138 134 117
Ireland 387 399 339 307 234 213 203 180 174 159 148 159 144 144 131
Israel 272 231 188 194 128 116 109 110 95 92 89 96 82 74
Italy 179 149 135 127 106 102 102 106 89 86 84 80
Kazakhstan 437 422 582 589 576 594 615 512 525 510 511 475 334 266
Kyrgyzstan 396 355 428 437 422 454 476 428 476 501 497 494 520 534
Latvia 641 641 549 603 465 450 436 419 436 433 410 440 397 378 375
Lithuania 591 560 534 417 463 473 480 459 491 476 467 449 429 436
Luxembourg 200 223 163 142 120 104 108 129 109 90 103 86 87 69 69
Malta 518 260 280 215 228 204 190 189 173 199 194 162 161 155 132
Montenegro 96 111 93 86 83 83
Netherlands 258 248 194 164 125 117 109 106 93 87 80 73 68 63 59
Norway 309 317 278 224 164 160 155 138 126 115 104 103 99 92 88
Poland 173 174 194 168 205 194 182 181 170 164 160 151 148 140 133
Portugal 131 118 114 98 86 84 88 83 79 64 60 57 57
Republic of Moldova 677 426 607 700 676 718 704 662 710 639 582 550 578 597
Romania 184 230 241 311 283 282 295 290 277 273 269 255 248 240 238
Russian Federation 540 531 458 559 544 551 573 612 579 594 556 532 527 505 515
San Marino 57 20 31
Serbia 168 162 161 164 157 178 169 154 155 148 140
Slovakia 322 310 432 387 367 367 362 369 351 338 316 337 357 339 334
Slovenia 186 161 156 148 147 130 140 115 117 99 97 102 94 95
Spain 115 114 106 103 95 92 90 90 83 82 76 74 69 67 65
Sweden 405 354 270 230 176 171 167 161 147 144 137 130 125 116 111
Switzerland 184 174 163 157 129 118 113 112 101 103 98 93 89 85 80
Tajikistan 283 332 358 304 291 331 315 304 284
TFYR Macedonia 146 150 155 156 151 142 142 144 130 124 119 113
Turkmenistan 497 565 648
Ukraine 630 427 623 663 656 697 711 707 738 713 700 662 656
United Kingdom 380 367 309 260 200 191 182 174 161 150 138 132 124 116 114
Uzbekistan 475 472 559 521 473 467 453 431 454
European Region 331 331 292 325 303 297 301 306 288 290 274 264 258 246 245
EU 228 225 209 194 166 160 156 153 144 139 131 126 120 116 113
Source: European Health for All database (HFA-DB). http://data.euro.who.int/hfadb/ (Accessed October 2012).

British Heart Foundation and University of Oxford 53
Table 1.15b Age-standardised coronary heart disease (CHD) death rates per 100,000 population in women, WHO European region 1980 to 2010
Women 1980 1985 1990 1995 2000 2001 2002 2003 2004 2005 2006 2007 2008 2009 2010
Albania 53 90 61 78 94 90
Armenia 291 307 348 316 288 314 312 260 252
Austria 103 110 109 108 95 93 99 96 89 86 81 77 73 73 69
Azerbaijan 288 302 339 355 336 350 328 207 93
Belarus 378 262 287 321 339 333 325 307 13 276 275 284
Belgium 81 75 55 56 47 44 38
Bosnia and Herzegovina 62 68
Bulgaria 142 201 180 175 149 145 150 138 127 117 104 94 88 82 81
Croatia 52 44 146 158 125 121 147 121 130 124 119 120 124 131
Cyprus 47 51 49 52 44 36 35
Czech Republic 219 224 220 192 137 136 134 132 123 138 129 146 137 134 123
Denmark 187 166 148 116 79 79 71 66 59 55 52
Estonia 397 334 309 259 240 240 233 203 192 183 170 163 150 144
Finland 171 172 158 141 120 114 115 108 97 97 90 91 88 80 79
France 48 48 39 33 30 30 28 28 25 24 22 21 20 20
Georgia 313 310 306 301 286 113 86 73 77
Germany 107 108 92 89 89 88 81 76 71 66 62 59 57
Greece 45 53 61 58 56 56 56 59 57 49 48 47 41 41
Hungary 162 167 171 179 173 173 171 178 180 201 185 172 166 163
Iceland 143 147 118 97 90 70 78 71 66 63 68 49 61 55
Ireland 182 182 157 145 111 102 101 91 85 77 71 78 68 69 61
Israel 169 151 118 124 71 66 62 62 54 55 52 51 46 38
Italy 90 69 63 61 52 50 50 55 45 44 42 40
Kazakhstan 268 239 319 294 322 333 345 277 286 279 280 264 175 124
Kyrgyzstan 264 213 262 277 276 318 324 302 327 347 338 351 370 373
Latvia 377 370 293 288 233 218 207 212 206 199 196 211 184 178 174
Lithuania 379 340 318 240 266 261 257 260 267 263 255 240 229 239
Luxembourg 98 95 68 55 48 52 50 57 48 44 53 43 36 25 27
Malta 334 151 189 147 130 125 117 118 99 111 103 86 90 85 85
Montenegro 55 49 47 50 47 40
Netherlands 108 101 82 71 56 52 50 47 43 39 35 33 31 28 27
Norway 128 122 116 94 79 73 71 66 60 52 53 50 46 45 42
Poland 60 55 65 61 96 91 85 85 80 79 76 70 69 66 60
Portugal 65 57 59 50 45 43 44 46 39 34 32 31 30
Republic of Moldova 528 313 424 499 486 517 517 470 502 448 425 408 402 424
Romania 126 163 168 197 187 184 188 182 175 174 169 158 151 148 146
Russian Federation 314 315 251 272 268 269 280 294 280 285 280 269 266 256 263
San Marino 31 18 8
Serbia 93 92 100 98 95 107 103 94 91 91 82
Slovakia 185 169 240 220 234 232 229 236 221 219 197 216 223 217 210
Slovenia 89 95 81 75 68 62 63 58 54 45 44 42 42 41
Spain 51 50 48 46 41 40 39 39 37 36 32 31 29 28 27
Sweden 194 158 120 102 83 82 80 77 71 67 68 64 62 58 54
Switzerland 73 70 71 71 65 60 59 57 51 50 47 45 43 41 38
Tajikistan 205 230 254 219 204 229 182 186 173
TFYR Macedonia 71 74 72 75 79 80 72 74 70 64 63 57
Turkmenistan 324 376 426
Ukraine 422 253 370 405 400 408 421 409 425 416 402 390 391
United Kingdom 164 167 145 123 94 91 87 83 76 71 65 61 58 52 50
Uzbekistan 333 317 417 394 357 351 330 312 321
European Region 183 186 156 172 164 161 163 164 153 150 145 142 138 132 132
EU 108 107 101 95 84 82 80 79 74 71 67 64 61 58 56
Source: European Health for All database (HFA-DB). http://data.euro.who.int/hfadb/ (Accessed October 2012).

54 Coronary heart disease statistics 2012
Figure 1.15 Percentage change in coronary heart disease (CHD) death rates, by sex, selected countries 1998 to 2008
WomenMen
-50-60 -40 -30 -20 -10 0 10 403020
Percentage decrease Percentage increase
NetherlandsNorwayIsraelIrelandUnited KingdomGermanySloveniaEstoniaAustriaSwedenSpainFranceFinlandItalyLatviaGreeceKazakhstanCzech RepublicHungaryLithuaniaRussian FederationKyrgyzstanUkraine

British Heart Foundation and University of Oxford 55
2. Morbidity

56 Coronary heart disease statistics 2012
2. Morbidity
This chapter reports on country-level estimates of incidence, case fatality and prevalence of the following conditions: myocardial infarction (heart attack), stroke, angina and heart failure. Additional estimates for coronary heart disease (CHD) and cardiovascular disease (CVD) are provided where possible. Measuring the morbidity of a disease is much more complicated than counting the number of deaths that have occurred due to a disease. For example, people may be suffering from a disease and not be aware of it or the exact time of onset of disease may not be known. As such, the estimates provided in this chapter should be treated with more caution than those from chapter one, yet they represent the best available estimates of the morbidity from CHD for countries within the UK. The estimates provided in this chapter are drawn from a number of different data sources, including samples of GP registers, hospital episode and mortality statistics and national survey data, each of which have their own strengths and limitations.

British Heart Foundation and University of Oxford 57
IncidenceIncidence of myocardial infarction has decreased in a number of developed countries during the past three decades, including the UK, driven by favourable changes in risk factors. The most recent estimates of incidence of myocardial infarction in the UK are based on national-level data from linked hospital and mortality statistics. These suggest that in Scotland the incidence rate of myocardial infarction decreased by about 25% between 2000 and 2009 in both men and women whilst the incidence rate in England decreased by around a third between 2002 and 2010 (Table 2.1, Figure 2.1). Although decreases have been found for all regions in England over this period, some regional differences are still apparent with the highest incidence rates found in the North and the lowest in the South (Table 2.2, Figure 2.2). The incidence of acute myocardial infarction resulting in hospitalisation has also decreased in both sexes over this period of time (Table 2.3, Figure 2.3).
In general, incidence of myocardial infarction increases sharply with age. It is also higher in men than in women but the difference between sexes decreases with increasing age (Table 2,4, Figure 2.4).
Using the most recent data available from Scotland and England, we estimate that there are around 50,000 heart attacks in English men and 32,000 in English women every year, and 8,000 heart attacks in Scottish men and 5,000 in Scottish women every year. If the rates of heart attack in Wales and Northern Ireland were comparable to that in England, then there would be approximately 103,000 heart attacks in the UK every year (Table 2.1 and Figure 2.1).
Similar to rates of myocardial infarction, incidence of stroke has decreased in many developed countries during the past three decades, including the UK. On average around the world, stroke occurs around 30% more often in men than in women but the difference between sexes decreases with increasing age 2. Data from the South London Stroke Register suggest that stroke incidence decreased by 18% in men and by 24% in women from 1995/96 to 2003/04 3, while the Oxford Vascular Study reported a 40% reduction in stroke incidence over the past two decades 4,5. Recent national-level data from England and Scotland also show that stroke incidence rates are around 25% higher in men than in women and increase with age. They also show that the incidence of stroke is higher in Scotland than in England, but the difference is not as large as for myocardial infarction (Table 2.5 and Figure 2.5).
Using the most recent data available from Scotland and England, we estimate that there are around 57,000 strokes in English men and 68,000 in English women every year, and 6,500 strokes in Scottish men and 8,000 in Scottish women every year. Despite higher incidence rates in men than in women, there are a greater number of events in women because women tend to live longer than men. If the rates of stroke in Wales and Northern Ireland were comparable to that in England, then there would be approximately 152,000 strokes in the UK every year (Table 2.5).
Estimates of the incidence of angina and heart failure can be provided from representative samples of GP registries. The General Practice Research Database (GPRD) contains anonymised records from such a sample in England, Wales, Scotland and Northern Ireland. GPRD data suggest that in 2011 the incidence rate of angina was highest amongst men in Wales and highest amongst women in Scotland, it was lowest for both sexes in England. Overall in the UK, incidence rates were 80% higher in men compared to women. Incidence rates generally increase with age and are highest in the 65-74 age group in both men and women. Using these incidence rates, we estimate there are over 20,000 new cases of angina in the UK every year (Table 2.6).
Data from the GPRD were used to provide the most recent estimates of occurrence of heart failure in the UK. In 2011, incidence of heart failure was highest in Northern Ireland and lowest in England for both men and women. Overall in the UK, incidence rates of heart failure were about 60% higher in men compared to women. Incidence of heart failure increased with age and was highest in adults over 75 years. Using these incidence rates, we estimate there are over 25,000 new cases of heart failure in the UK every year (Table 2.7).
Case fatalityA case fatality rate is the ratio of the number of deaths caused by a specified disease to the number of diagnosed cases of that disease; it is commonly expressed as a percentage. In England, over 10% men and 15% of women who were admitted to hospital with myocardial infarction in 2010 had died within 30 days (Table 2.8). Case fatality rates in Scotland in 2008 were higher, with 12% of men and 19% of women admitted with myocardial infarction dying within 30 days. Case fatality rates in England have dropped since 2002 (Table 2.9, Figure 2.9). Although there have been decreases in all regions in England the highest case fatality rates are found in London and the West Midlands with the lowest rates found in the North East (Table 2.10, Figure 2.10).

58 Coronary heart disease statistics 2012
Case fatality from myocardial infarction increases with age and is higher in women than in men. However, this gender difference is largely a reflection of the different age distribution of the female patient population, with more elderly women surviving to be admitted for myocardial infarction compared to elderly men (Table 2.11, Figure 2.11).
Case fatality rates for stroke are higher than for myocardial infarction, but are measured over a different time period (60 days rather than 30 days). In England, estimates based on linked hospital and mortality data show that about 17% of men and 25% of women admitted to hospital for stroke in 2006 died within 60 days. In Scotland, similar analysis shows that 19% of men and 25% of women admitted to hospital for stroke in 2008 died within 60 days (Table 2.12).
In both England and Scotland, case fatality rates for myocardial infarction and stroke were substantially lower in individuals under 75 years of age compared to the rate in all age groups (Tables 2.8, 2.9, 2.11 and 2.12).
PrevalenceThe prevalence of cardiovascular conditions such as myocardial infarction, stroke and angina increases with age and is higher in men than in women. The most recent national survey data suggests that in comparison with the rest of the UK, the prevalence of previous myocardial infarction, those who have ever suffered a heart attack, is in Wales and Northern Ireland, whilst the prevalence of angina is highest in Northern Ireland. However, the differences between countries are not very large (Tables 2.13 to 2.16 and Figures 2.16a, b and c).
Age and sex-specific prevalence estimates from national surveys can be used to estimate the number of people living in the UK who have previously had a myocardial infarction or stroke, or are currently suffering from angina or coronary heart disease. It must be noted, however, that the most recent data from England and Northern Ireland come from 2006, whilst those from Wales and Scotland from 2010. This means that direct comparisons between countries are difficult and that data from different years are being used to calculate current population estimates for the UK. Using these figures, we estimate that there are around 1 million men and nearly 500,000 women who have had a myocardial infarction; nearly 600,000 individuals of each sex in the UK who have had a stroke; and over 1.6 million men and more than 1 million women in the UK with CHD (Tables 2.13 and 2.14).
The GPRD can also be used to estimate the prevalence of angina and heart failure within the UK, leading to different population estimates than obtained from national survey data. The prevalence of angina calculated using the GPRD data are lower than estimates provided by national survey data. For example, the prevalence of angina in English men aged 75 and over is estimated as 16% using 2010 GPRD data (Table 2.17) but 23% using the 2006 Health Survey for England (Table 2.13). Overall estimates on prevalence from health surveys results in national estimates of 1.2 million men and over 900,000 women in the UK suffering from the chronic condition angina (Tables 2.13 to 2.16), whilst estimates calculated from the GPRD suggests around 725,000 men and 575,000 women currently suffer from the condition (Table 2.17).
Using GPRD data to calculate the number of people in the UK suffering heart failure leads to an estimate of around 800,000 individuals. Comparing heart failure estimates from survey data in Wales to GPRD data from the same country and same year suggest that this leads to similar estimates in the number of men with heart failure (around 20,000) but a difference of around 5,000 individuals when calculating national estimates for women. National survey data suggests an estimated 16,000 women in Wales are currently being treated for heart failure; whilst the GPRD estimates that over 22,000 women in the country have been diagnosed with the condition (Tables 2.15 and 2.18). These discrepancies illustrate the difficulties in interpreting morbidity data and using them to calculate population estimates. This is complicated further as both data describe diagnosed conditions, therefore we are unable to estimate the hidden burden of heart disease which comes from undiagnosed CVD.
Estimates derived from national survey data of the number of people in the UK who have CHD or have had a stroke (given above) are broadly supported by results from the Quality Outcomes Framework. This framework became part of general practice contracts in 2004, and rewards GPs for keeping up-to-date records of the number of patients within their practices who are suffering from certain conditions. Data from the Quality Outcomes Framework suggest that in 2010/11 there were around 2.3 million people suffering from CHD and 1.1 million people suffering from stroke. The prevalence of CHD was higher in Scotland (4.4%), Wales (4.0%) and Northern Ireland (4.0%) than in England (3.4%). Prevalence rates were also higher in the North of England than in the South. Prevalence rates for stroke follow a similar geographic pattern. Prevalence rates for CHD show a wide variation, with lowest rates in London (2.2%) and highest rates in the Western Isles of Scotland (6.1%). However, these rates have not been adjusted to account for differences in the age structure of populations, and so differences in rates should be treated with caution (Table 2.19).

British Heart Foundation and University of Oxford 59
Temporal trends in the prevalence of CHD and CVD can be estimated using data from national health surveys. The Health Survey for England series suggest that between 1994 and 2006 the prevalence of CHD increased from 6.0% to 6.5% in men and remained stable for women (from 4.1% in 1994 to 4.0% in 2006). An increase in the prevalence of CVD (defined here as either CHD or stroke) was also obtained in the Health Survey for England, increasing from 7.1% to 8.1% in men and from 5.2% to 5.6% in women between 1994 and 2006. These increases were found in the majority of age groups in both men and women, with the most consistent increase in trend found in the oldest age group (75 years and over) 6.
Age-specific prevalence rates for CVD have been measured since 1988 in the General Household Survey series. They suggest that for men prevalence of CVD increased between 1988 and the mid-2000s. Although there have been some decreases since then 2010 data suggest that the prevalence for all men in 2010 (11.7%) is close to the peak found in 2002 (11.9%). For women, prevalence rates also peaked in the early to mid-2000s and have declined since. Although prevalence rates in 2010 were slightly higher than in recent years the overall prevalence of CVD in women in 2010 (10.1%) was still lower than the peak in 2002 (11.9%) (Table 2.20 and Figure 2.20).
1. Age-specific rates have been calculated but are not presented in this publication.
2. Appelros P, Stegmayr B, Terent A (2009). Sex differences in stroke epidemiology. A systematic review. Stroke, 40; 1082-1090.
3. Heuschmann P, Grieve A, Toschke A, Rudd A, Wolfe C (2008). Ethnic group disparities in 10-year trends in stroke incidence and vascular risk factors: The South London Stroke Register (SLSR). Stroke, 39: 2204-2210.
4. Rothwell P, Coull A, Giles M, Howard S, Silver L, Bull L, Gutnikov S, Edwards P, Mant D, Sackley C, Farmer A, Sandercock P, Dennis M, Warlow C, Bamford J, Anslow P (2004). Change in stroke incidence, mortality, case-fatality, severity and risk factors in Oxfordshire, UK, from 1981 to 2004 (Oxford Vascular Study). Lancet, 363 (9425): 1925-1933.
5. Scarborough P, Peto V, Bhatnagar P, Kaur A, Leal J, Luengo-Fernandez R, Gray A, Rayner M, Allender S (2009). Stroke Statistics. British Heart Foundation & The Stroke Association: London.
6. Joint Health Surveys Unit (2007). Health Survey for England 2006. The Information Centre: Leeds.

60 Coronary heart disease statistics 2012
Table 2.1 Incidence of myocardial infarction, by sex and age, Scotland 2000 to 2009 and England 2002 to 2010
Incidence rate per 100,000
2000 2001 2002 2003 2004 2005 2006 2007 2008 2009 2010Number of events (most recent year)
Scotland
Men
Under 75 242 190 175 172 179 183 5,026
All ages 334 275 252 245 248 255 7,971
Women
Under 75 90 71 66 62 61 67 2,087
All ages 152 127 118 107 109 113 5,330
England
Men
Under 75 156 149 145 134 129 124 118 115 104 29,027
All ages 230 222 215 201 191 183 175 168 154 50,071
Women
Under 75 95 93 90 85 80 77 74 71 66 10,478
All ages 52 49 47 44 42 40 39 37 34 32,181
Notes:Incident cases include all mortalities and hospital admissions for myocardial infarction (ICD-10 I21-22) with no previous hospital admission for the same condition in the previous 30 days. ¶ Incident cases potentially include misdiagnoses and further investigation of earlier myocardial infarctions. ¶ Rates are age-standardised to the European Standard Population.
Source:Smolina K, Wright FL, Rayner M, Goldacre M. Determinants of the decline in mortality from acute myocardial infarction in England between 2002 and 2010: A linked database study. BMJ 2012; 344. DOI: 10.1136/bmj.d8059. Unit of Health-Care Epidemiology, Department of Public Health, University of Oxford (2012) Personal communication. Information Services Division Scotland (2010) Personal communication.

British Heart Foundation and University of Oxford 61
Figure 2.1 Incidence of myocardial infarction, by sex and age, Scotland 2000 to 2009 and England 2002 to 2010
Inci
den
ce ra
te p
er 1
00,0
00
Men, EnglandWomen, EnglandMen, ScotlandWomen, Scotland
2000
2001
2002
2003
2004
2005
2006
2007
2008
2009
2010
0
50
100
150
200
250
300
350
400

62 Coronary heart disease statistics 2012
Table 2.2Incidence of acute myocardial infarction, by Government Office Region, England 2002-10
Incidence rate per 100,000
2002 2003 2004 2005 2006 2007 2008 2009 2010
Government Office Region
North East 206 205 187 171 155 138 125 150 143
North West 192 186 178 165 158 155 146 140 136
Yorkshire and the Humber 183 175 164 154 152 150 147 142 123
East Midlands 163 157 155 149 142 146 141 127 120
West Midlands 163 158 154 142 130 127 120 115 114
East of England 148 143 140 134 128 118 116 103 91
London 126 124 119 117 109 107 110 111 98
South East 129 126 126 120 113 105 101 95 82
South West 141 137 135 123 119 112 103 96 91
Notes: Incident cases include all mortalities and hospital admissions for myocardial infarction (ICD-10 I21-22) with no previous hospital admission for the same condition in the previous 30 days. ¶ Incident cases potentially include misdiagnoses and further investigation of earlier myocardial infarctions. ¶ Rates are age-standardised to the European Standard Population.
Source: Smolina K, Wright FL, Rayner M, Goldacre M. Determinants of the decline in mortality from acute myocardial infarction in England between 2002 and 2010: A linked database study. BMJ 2012; 344. DOI: 10.1136/bmj.d8059. Unit of Health-Care Epidemiology, Department of Public Health, University of Oxford (2012) Personal communication.
Figure 2.2 Incidence of acute myocardial infarction, by Government Office Region, England 2002 and 2010
Inci
den
ce ra
te p
er 1
00,0
00
250
20102002
0
50
100
150
200
North East North West Yorkshire and East West East of England London South East South West the Humber Midlands Midlands

British Heart Foundation and University of Oxford 63
Table 2.3 Incidence of hospitalised acute myocardial infarction, by sex and age, England 2002 to 2010
Incidence rate per 100,000
2002 2003 2004 2005 2006 2007 2008 2009 2010Number of events (most recent year)
England
Men
Under 75 123 117 117 108 106 103 98 96 86 24,027
All ages 169 165 163 154 148 144 138 134 122 39,053
Women
Under 75 41 39 38 36 35 34 32 32 29 8,869
All ages 68 68 67 65 62 60 59 56 53 24,811
Notes:Hospitalised acute myocardial infarction (AMI) was defined as a hospitalization for AMI an emergency hospital admission with a primary diagnosis of AMI (ICD-10 codes I21-I22) and a length of stay of more than one day for someone discharged alive. ¶ Rates are age-standardised to the European Standard Population.
Source:Smolina K, Wright FL, Rayner M, Goldacre M. Determinants of the decline in mortality from acute myocardial infarction in England between 2002 and 2010: A linked database study. BMJ 2012; 344. DOI: 10.1136/bmj.d8059. Unit of Health-Care Epidemiology, Department of Public Health, University of Oxford (2012) Personal communication.
Figure 2.3 Incidence of hospitalised acute myocardial infarction, by sex and age, England 2002 to 2010
Inci
den
ce ra
te p
er 1
00,0
00
Women under 75Men under 75Women all agesMen all ages
2002
2003
2004
2005
2006
2007
2008
2009
2010
0
50
100
150
200
250

64 Coronary heart disease statistics 2012
Table 2.4 Incidence of acute myocardial infarction, by sex and age, England 2010
Incidence per 100,000
Age Men Women
30-54 9 2
55-64 32 9
65-74 53 24
75-84 102 60
≥85 199 139
<75 104 34
All ages 154 66
Number of events 50,071 32,181
Notes: Incident cases include all mortalities and hospital admissions for myocardial infarction (ICD-10 I21-22) with no previous hospital admission for the same condition in the previous 30 days. ¶ Incident cases potentially include misdiagnoses and further investigation of earlier myocardial infarctions. ¶ Rates are age-standardised to the European Standard Population.
Source:Smolina K, Wright FL, Rayner M, Goldacre M. Determinants of the decline in mortality from acute myocardial infarction in England between 2002 and 2010: A linked database study. BMJ 2012; 344. DOI: 10.1136/bmj.d8059. Unit of Health-Care Epidemiology, Department of Public Health, University of Oxford (2012) Personal communication.
Figure 2.4 Incidence of acute myocardial infarction, by sex and age, England 2010
Inci
den
ce ra
te p
er 1
00,0
00
WomenMen
30-54 55-64 65-74 75-84 ≥85
0
50
100
150
200
250

British Heart Foundation and University of Oxford 65
Table 2.5Incidence of stroke, by sex and age, Scotland 2000 to 2009 and England 2005 to 2007
Incidence rate per 100,000
2000 2005 2006 2007 2008 2009 Number of events (most recent year)
Scotland
Men
Under 75 163 133 128 124 127 122 3,409
All ages 277 227 216 208 209 202 6,532
Women
Under 75 108 94 86 84 84 87 2,673
All ages 208 180 169 159 162 160 7,830
England
Men
Under 75 105 101 99 26,835
All ages 193 184 178 57,488
Women
Under 75 71 68 66 19,047
All ages 152 144 139 68,457
Notes: Incident cases include all mortalities and hospital admissions for stroke (ICD-10 I60-69) with no previous hospital admission for the same condition in the previous 60 days. ¶ Incident cases potentially include misdiagnoses and further investigation of earlier strokes. ¶ Rates are age-standardised to the European Standard Population. ¶ Estimates for England are provisional, and may be updated in future publications.
Source:Unit of Health-Care Epidemiology, Department of Public Health, University of Oxford (2010) Personal communication. Information Services Division Scotland (2010) Personal communication.
Figure 2.5 Incidence of stroke, by sex and age, England and Scotland 2007
Inci
den
ce ra
te p
er 1
00,0
00
EnglandScotland
Men Women Men Women
0
50
100
150
200
250
All ages Under 75s

66 Coronary heart disease statistics 2012
Table 2.6Incidence of angina, by sex and age, England, Scotland, Wales and Northern Ireland 2011
Incidence rate per 100,000
England Scotland Wales Northern Ireland United Kingdom
Men
0-44 3.2 1.7 4.6 1.4 3.2
45-54 44.7 59.2 55.1 56.8 47.0
55-64 109.3 142.8 195.0 134.4 119.7
65-74 151.5 263.5 225.4 248.1 169.3
75+ 98.3 125.9 139.5 155.6 105.2
All ages 34.9 48.6 53.5 47.2 37.9
Women
0-44 1.4 2.5 1.8 1.2 1.5
45-54 29.0 46.2 30.3 39.7 24.2
55-64 45.3 119.3 85.1 80.8 55.7
65-74 96.4 166.5 118.4 98.8 104.0
75+ 74.2 120.9 127.5 77.4 82.2
All ages 19.7 37.7 28.1 25.2 21.0
Number of cases
Men 1,695 231 260 72 2,258
Women 1,096 199 178 43 1,516
Notes:Estimates are based on records from a sample of general practices in each of the constituent countries of the United Kingdom. ¶ Incidence rates are provided per 100,000 person years, as opposed to per 100,000 persons per year. ¶ These two denominators are broadly comparable provided that mortality rates in the groups are reasonably low. ¶ Estimates for all ages are age-standardised to the European Standard Population.
Source:General Practice Research Database (2012) Personal communication. ¶ This table is based on data from the General Practice Research Database, 2012. ¶ Copyright and database rights over the data belong to the Crown. ¶ The interpretation and conclusions contained in this report are those of the authors alone.

British Heart Foundation and University of Oxford 67
Table 2.7Incidence of heart failure, by sex and age, England, Scotland, Wales and Northern Ireland 2011
Incidence rate per 100,000
England Scotland Wales Northern Ireland United Kingdom
Men
0-44 1.9 3.9 4.6 1.4 2.3
45-54 18.1 32.8 30.3 22.7 20.4
55-64 63.1 121.2 96.1 93.8 71.5
65-74 160.2 199.7 234.0 288.4 173.1
75+ 272.3 365.5 329.3 412.2 287.5
All ages 32.8 49.0 47.3 51.1 35.8
Women
0-44 0.9 2.5 2.7 0.0 1.2
45-54 9.4 19.5 10.1 17.0 10.5
55-64 26.6 46.5 48.3 64.3 31.0
65-74 90.2 114.9 144.7 154.2 98.7
75+ 229.4 303.9 263.8 306.3 239.8
All ages 20.3 29.6 29.1 32.5 22.1
Number of cases
Men 2,161 291 310 103 2,865
Women 1,916 242 260 89 2,507
Notes:Estimates are based on records from a sample of general practices in each of the constituent countries of the United Kingdom. ¶ Incidence rates are provided per 100,000 person years, as opposed to per 100,000 persons per year. ¶ These two denominators are broadly comparable provided that mortality rates in the groups are reasonably low. ¶ Estimates for all ages are age-standardised to the European Standard Population.
Source:General Practice Research Database (2012) Personal communication. ¶ This table is based on data from the General Practice Research Database, 2012. ¶ Copyright and database rights over the data belong to the Crown. ¶ The interpretation and conclusions contained in this report are those of the authors alone.

68 Coronary heart disease statistics 2012
Table 2.8 Case fatality rates of those admitted to hospital for myocardial infarction, by sex and age, Scotland 2008 and England 2010
Scotland England
% %
Men
Under 75 6.2 5.3
All ages 12.0 10.6
Women
Under 75 8.2 7.4
All ages 18.7 15.1
Number of events
Men
Under 75 236 1,255
All ages 651 4,014
Women
Under 75 118 657
All ages 626 3,716
Notes: Case fatality is defined as the percentage of all MI events that were sudden deaths from AMI or admissions to hospital for AMI that had a death record within 30 days of admission, irrespective of the cause or place of death. ¶ Estimates for England are provisional, and may be updated in future publications.
Source:Smolina K, Wright FL, Rayner M, Goldacre M. Determinants of the decline in mortality from acute myocardial infarction in England between 2002 and 2010: A linked database study. BMJ 2012; 344. DOI: 10.1136/bmj.d8059. Unit of Health-Care Epidemiology, Department of Public Health, University of Oxford (2012) Personal communication. Information Services Division Scotland (2010) Personal communication.

British Heart Foundation and University of Oxford 69
Table 2.9Case fatality rates of acute myocardial infarction, by sex and age, England 2002 to 2010
2002 2003 2004 2005 2006 2007 2008 2009 2010Number of events (most recent year)
% % % % % % % % %
England
Men
Under 75 28.9 27.8 26.0 25.5 24.3 23.3 23.0 22.1 22.1 29,027
All ages 42.0 41.0 38.6 37.1 36.2 34.6 33.2 32.3 32.1 50,071
Women
Under 75 29.2 28.1 25.2 25.1 22.9 22.0 21.7 19.7 19.9 32,181
All ages 42.2 40.6 37.4 36.5 34.5 33.5 31.9 30.3 29.9 10,478
Notes: Case fatality is defined as the percentage of all MI events that were sudden deaths from AMI or admissions to hospital for AMI that had a death record within 30 days of admission, irrespective of the cause or place of death. ¶ Estimates for England are provisional, and may be updated in future publications.
Source:Smolina K, Wright FL, Rayner M, Goldacre M. Determinants of the decline in mortality from acute myocardial infarction in England between 2002 and 2010: A linked database study. BMJ 2012; 344. DOI: 10.1136/bmj.d8059. Unit of Health-Care Epidemiology, Department of Public Health, University of Oxford (2012) Personal communication.
Figure 2.9 Case fatality rates as a percentage of all events of acute myocardial infarction, by sex and age, England 2002 to 2010
Cas
e fa
talit
y ra
te (%
)
Women under 75Men under 75 Women all agesMen all ages
2002
2003
2004
2005
2006
2007
2008
2009
2010
0
5
10
15
20
25
30
35
40
45

70 Coronary heart disease statistics 2012
Table 2.10Case fatality rates of myocardial infarction, by Government Office Region, England 2002 to 2010
2002 2003 2004 2005 2006 2007 2008 2009 2010
% % % % % % % % %
Government Office Region
North East 34.0 32.6 31.1 30.7 30.3 31.2 30.1 25.7 22.6
North West 37.0 36.4 34.1 33.8 33.1 32.7 30.8 29.9 28.3
Yorkshire and the Humber 39.3 38.1 36.0 36.1 33.6 30.1 29.6 28.6 30.1
East Midlands 34.1 33.4 32.1 29.4 29.1 27.2 26.5 26.7 28.7
West Midlands 38.7 37.0 34.9 36.1 35.4 33.2 31.4 30.7 29.4
East of England 35.7 33.4 30.8 30.1 28.7 27.3 26.3 25.2 24.8
London 40.9 40.2 37.9 35.2 32.7 31.8 30.2 28.7 29.2
South East 37.0 36.2 33.1 31.2 29.5 28.7 27.9 26.6 27.5
South West 37.9 34.5 31.7 30.6 29.9 29.1 27.8 26.9 25.3
Notes:Incident cases include all mortalities and hospital admissions for myocardial infarction (ICD-10 I21-22) with no previous hospital admission for the same condition in the previous 30 days. ¶ Incident cases potentially include misdiagnoses and further investigation of earlier myocardial infarctions. ¶ Rates are age-standardised to the European Standard Population. ¶ Estimates for England are provisional, and may be updated in future publications.
Source:Smolina K, Wright FL, Rayner M, Goldacre M. Determinants of the decline in mortality from acute myocardial infarction in England between 2002 and 2010: A linked database study. BMJ 2012; 344. DOI: 10.1136/bmj.d8059. Unit of Health-Care Epidemiology, Department of Public Health, University of Oxford (2012) Personal communication.
Figure 2.10 Case fatality rates of myocardial infarction, by Government Office Region, England 2002 and 2010
Cas
e fa
talit
y ra
te (%
)
20102002
North East North West Yorkshire and East West East of England London South East South West the Humber Midlands Midlands
0
5
10
15
20
25
30
35
40
45

British Heart Foundation and University of Oxford 71
Table 2.11Case fatality rates of myocardial infarction, by sex and age, England 2010
Case fatality %
Age Men Women
30-54 14 13
55-64 14 18
65-74 20 25
75-84 28 36
≥85 38 46
<75 22 20
All ages 32 30
Number of events 50,071 32,181
Notes: Case fatality is defined as the percentage of all acute myocardial infarction (AMI) events that were sudden deaths from AMI or admissions to hospital for AMI that had a death record within 30 days of admission, irrespective of the cause or place of death. ¶ Estimates for England are provisional, and may be updated in future publications.
Source:Smolina K, Wright FL, Rayner M, Goldacre M. Determinants of the decline in mortality from acute myocardial infarction in England between 2002 and 2010: A linked database study. BMJ 2012; 344. DOI: 10.1136/bmj.d8059. Unit of Health-Care Epidemiology, Department of Public Health, University of Oxford (2012) Personal communication.
Figure2.11 Case fatality rate as a percentage of all events of myocardial infarction, by sex and age, England 2010
Cas
e fa
talit
y ra
te (%
)
WomenMen
30-54 55-64 65-74 75-84 ≥85
0
5
10
15
20
25
30
35
40
45
50

72 Coronary heart disease statistics 2012
Table 2.12Case fatality rates of those admitted to hospital for stroke, by sex and age, Scotland 2008 and England 2006
Scotland England
% %
Men
Under 75 12.8 10.3
All ages 18.7 17.1
Women
Under 75 14.6 13.1
All ages 25.2 24.7
Number of events
Men
Under 75 406 2,404
All ages 1,009 7,615
Women
Under 75 349 2,188
All ages 1,463 12,119
Notes: Incident cases include all hospital admissions for stroke (ICD-10 I60-69) with no previous admission for the same condition in the previous 60 days. ¶ All mortalities from any cause are included in the numerator. ¶ Estimates for England are provisional, and may be updated in future publications.
Source:Unit of Health-Care Epidemiology, Department of Public Health, University of Oxford (2010) Personal communication. Information Services Division Scotland (2010) Personal communication.

British Heart Foundation and University of Oxford 73
Table 2.13Prevalence of CHD, stroke, myocardial infarction and angina, by sex and age, England 2006
CHD StrokeMyocardial
infarctionAngina CVD Base
% % % % %
Men
16-24 0.1 0.0 0.0 0.1 3.2 650
25-34 0.2 0.0 0.2 0.1 4.7 862
35-44 0.6 0.5 0.6 0.3 5.6 1,183
45-54 3.6 1.2 2.1 2.4 10.9 1,050
55-64 10.6 3.0 6.3 8.0 18.5 1,126
65-74 20.8 7.1 14.4 14.2 34.1 437
75+ 28.6 13.1 16.6 22.7 44.4 317
All ages 6.5 2.4 4.1 4.8 13.6 5,625
Women
16-24 0.1 0.2 0.0 0.1 4.5 794
25-34 0.1 0.1 0.0 0.1 5.7 1,148
35-44 0.3 0.4 0.1 0.2 7.8 1,494
45-54 1.3 0.9 0.7 1.2 10.3 1,279
55-64 3.5 2.3 1.6 3.2 15.2 1,269
65-74 10.0 4.2 3.3 8.3 21.2 470
75+ 19.3 10.7 9.1 15.9 36.9 471
All ages 4.0 2.2 1.7 3.3 13.0 6,925
Notes:Prevalence rates are weighted for non-response. ¶ Respondents were prompted to recall whether they had ever been diagnosed with each of the conditions by a doctor. ¶ Informants were classified as having any CVD condition if they reported ever having any of the following conditions confirmed by a doctor: angina, heart attack, stroke, heart murmur, or irregular heart rhythm.
Source:Joint Health Surveys Unit (2008). Health Survey for England 2006: Cardiovascular disease and risk factors. The Information Centre: Leeds. The Information Centre: Leeds. Copyright © 2010, Re-used with the permission of The Health and Social Care Information Centre. All rights reserved.

74 Coronary heart disease statistics 2012
Table 2.14Prevalence of CHD, stroke, myocardial infarction and angina, by sex and age, Scotland 2010
CHD StrokeMyocardial
infarctionAngina CVD Base
% % % % %
Men
16-24 0.0 0.1 0.0 0.0 5.2 274
25-34 0.5 0.4 0.5 0.0 4.1 421
35-44 0.9 1.2 0.7 0.2 8.1 478
45-54 4.4 1.5 2.8 3.1 12.2 565
55-64 11.0 5.8 7.4 7.3 23.0 555
65-74 22.6 8.5 13.0 18.1 37.9 488
75+ 31.0 12.7 19.2 20.2 49.4 331
All ages 7.5 3.3 4.7 5.2 16.3 3,112
Women
16-24 0.0 0.0 0.0 0.0 5.1 373
25-34 0.5 0.1 0.4 0.3 7.3 565
35-44 1.0 1.4 0.2 1.0 8.1 682
45-54 2.6 0.8 1.1 1.8 10.1 762
55-64 6.9 3.3 2.8 5.6 15.3 701
65-74 15.1 5.7 4.9 13.9 28.2 574
75+ 16.8 9.3 7.5 13.5 33.4 470
All ages 5.2 2.5 2.1 4.4 14.0 4,127
Notes: Prevalence rates are weighted for non-response. ¶ Respondents were prompted to recall whether they had ever been diagnosed with each of the conditions by a doctor. ¶ Participants were classified as having any CVD condition if they reported ever having any of the following conditions confirmed by a doctor: angina, heart attack, stroke, heart murmur, abnormal heart rhythm, or ‘other heart trouble’.
Source: Scottish Centre for Social Research (2012). Scottish Health Survey 2010. The Scottish Government: Edinburgh.

British Heart Foundation and University of Oxford 75
Table 2.15Prevalence of any heart condition, stroke, myocardial infarction, angina and heart failure, by sex and age, Wales 2010
Having ever been diagnosed with: Currently being treated for:
BaseMyocardial infarction
Stroke Angina Heart FailureAny heart condition
% % % % %
Men
16-24 0 0 0 0 0 882
25-34 0 0 0 0 1 831
35-44 1 0 0 0 2 1,082
45-54 2 2 2 1 5 1,333
55-64 7 4 5 2 12 1,361
65-74 14 9 12 5 27 1,109
75+ 23 10 19 8 42 822
All ages 5 3 4 2 9 7,420
Women
16-24 0 0 0 0 0 919
25-34 0 0 0 0 1 1,073
35-44 0 0 0 1 2 1,330
45-54 1 1 1 0 3 1,472
55-64 3 2 3 1 8 1,520
65-74 6 5 9 3 18 1,247
75+ 10 8 14 6 29 1,018
All ages 3 2 3 1 7 8,579
Notes:Prevalence rates are weighted for non-response. ¶ Respondents were prompted to recall whether they had ever been diagnosed with heart attack or stroke, and whether they are currently being treated for angina, heart failure or other heart conditions by a doctor. ¶ Prevalence of ‘any heart condition’ includes heart failure and is hence not comparable with estimates of the prevalence of coronary heart disease it does not include high blood pressure.
Source:Welsh Assembly Government (2011). Welsh Health Survey 2010. Welsh Assembly Government: Cardiff.

76 Coronary heart disease statistics 2012
Table 2.16Prevalence of stroke, myocardial infarction and angina, by sex and age, Northern Ireland 2005/06
Stroke Myocardial infarction Angina Base
% % %
Men
16-24 0 0 1 153
25-34 1 1 0 278
35-44 0 0 0 344
45-54 1 5 5 305
55-64 2 11 13 275
65-74 6 16 20 236
75+ 12 18 24 152
All ages 2 5 6 1,743
Women
16-24 0 0 0 254
25-34 0 0 0 428
35-44 0 0 0 501
45-54 1 0 4 417
55-64 2 2 2 334
65-74 3 6 15 312
75+ 6 11 24 251
All ages 1 2 5 2,497
Notes:Prevalence rates are weighted for non-response. ¶ Respondents were prompted to recall whether they had ever been diagnosed with each of the conditions by a doctor.
Source:Central Survey Unit (2007). Northern Ireland Health and Wellbeing Survey 2005/06. Northern Ireland Statistics and Research Agency: Belfast.

British Heart Foundation and University of Oxford 77
Figure 2.16a Prevalence of myocardial infarction, by sex and country, United Kingdom latest available year
Prev
alen
ce (%
)
England, 2006 Scotland, 2010 Wales, 2010 Northern Ireland, 2005/06
Men Women
0
1
2
3
4
5
6

78 Coronary heart disease statistics 2012
Figure 2.16b Prevalence of stroke, by sex and country, United Kingdom latest available year
Prev
alen
ce (%
)
England, 2006 Scotland, 2010 Wales, 2010 Northern Ireland, 2005/06
Men Women
0
1
2
3
4
5
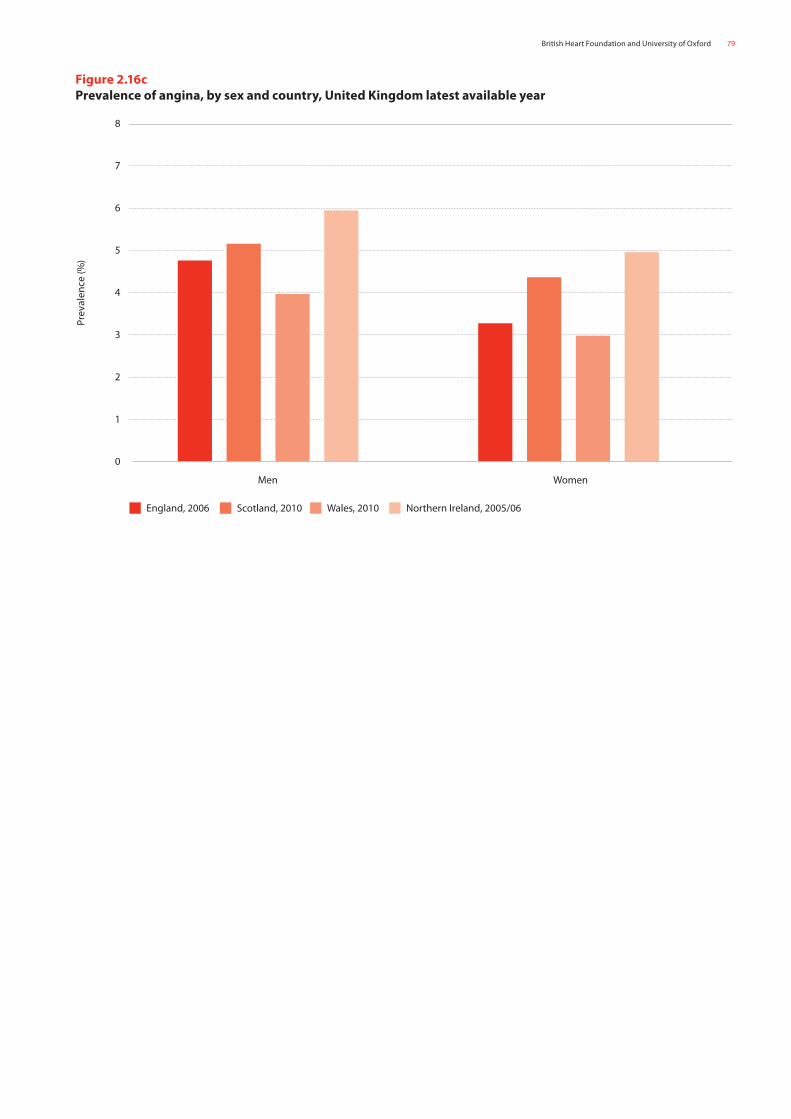
British Heart Foundation and University of Oxford 79
Figure 2.16c Prevalence of angina, by sex and country, United Kingdom latest available year
Prev
alen
ce (%
)
England, 2006 Scotland, 2010 Wales, 2010 Northern Ireland, 2005/06
Men Women
0
1
2
3
5
4
8
7
6

80 Coronary heart disease statistics 2012
Table 2.17Prevalence of angina, by sex and age, England, Scotland, Wales and Northern Ireland 2011
England Scotland Wales Northern Ireland United Kingdom
% % % % %
Men
0-44 0.1 0.0 0.0 0.0 0.0
45-54 0.9 0.9 0.9 0.9 0.9
55-64 3.4 4.2 4.1 4.2 3.6
65-74 8.4 10.5 10.4 11.2 8.8
75+ 16.2 18.1 17.5 20.6 16.6
All ages 1.8 2.1 2.0 2.2 1.9
Women
0-44 0.1 0.0 0.0 0.0 0.0
45-54 0.5 0.6 0.5 0.5 0.5
55-64 1.7 2.5 2.1 2.0 1.8
65-74 4.8 7.4 6.3 6.9 5.2
75+ 11.3 13.9 12.9 15.6 11.7
All ages 1.1 1.5 1.3 1.4 1.1
Number of cases
Men 123,559 13,367 14,859 4,834 156,619
Women 99,887 11,948 12,465 4,363 128,663
Notes:Estimates are based on records from a sample of general practices in each of the constituent countries of the United Kingdom. ¶ Estimates for all ages are age-standardised to the European Standard Population. ¶ Calculating the total number of cases should always take account of the prevalence rate in each age group, rather than applying the ‘all ages’ prevalence to national population figures.
Source:
General Practice Research Database (2012) Personal communication. ¶ This table is based on data from the General Practice Research Database, 2012. ¶ Copyright and database rights over the data belong to the Crown. ¶ The interpretation and conclusions contained in this report are those of the authors alone.

British Heart Foundation and University of Oxford 81
Table 2.18Prevalence of heart failure, by sex and age, England, Scotland, Wales and Northern Ireland 2011
England Scotland Wales Northern Ireland United Kingdom
% % % % %
Men
0-44 0.0 0.0 0.0 0.1 0.0
45-54 0.2 0.2 0.3 0.2 0.2
55-64 0.8 1.2 1.0 1.0 0.9
65-74 2.7 3.7 3.3 3.7 2.9
75+ 13.1 12.7 12.8 15.0 13.1
All ages 0.9 1.0 0.9 1.0 0.9
Women
0-44 0.0 0.0 0.0 0.0 0.0
45-54 0.1 0.1 0.1 0.1 0.1
55-64 0.3 0.4 0.4 0.6 0.4
65-74 1.3 2.0 1.8 2.2 1.5
75+ 11.9 11.4 12.1 13.5 11.9
All ages 0.6 0.7 0.7 0.8 0.7
Number of cases
Men 75,875 7,184 8,406 2,735 94,200
Women 84,844 7,555 9,527 3,188 105,114
Notes:Estimates are based on records from a sample of general practices in each of the constituent countries of the United Kingdom. ¶ Estimates for all ages are age-standardised to the European Standard Population. ¶ Calculating the total number of cases should always take account of the prevalence rate in each age group, rather than applying the ‘all ages’ prevalence to national population figures.
Source:General Practice Research Database (2012) Personal communication. ¶ This table is based on data from the General Practice Research Database, 2012. ¶ Copyright and database rights over the data belong to the Crown. ¶ The interpretation and conclusions contained in this report are those of the authors alone.

82 Coronary heart disease statistics 2012
Table 2.19Prevalence of coronary heart disease (CHD), stroke and hypertension, by health authority, England, Scotland, Wales and Northern Ireland 2010/11
Registered GP patientsCHD Stroke Hypertension
Register count Prevalence Register count Prevalence Register count Prevalence
United Kingdom 65,437,967 2,308,733 3.5% 1,151,994 1.8% 8,890,858 13.6%
England 55,169,643 1,877,518 3.4% 944,099 1.7% 7,460,497 13.5%
North East 2,678,976 124,394 4.6% 58,105 2.2% 410,357 15.3%
North West 7,381,814 298,317 4.0% 140,577 1.9% 1,030,582 14.0%
Yorkshire and the Humber 5,456,644 221,747 4.1% 105,683 1.9% 756,106 13.9%
East Midlands 4,636,678 169,105 3.6% 82,371 1.8% 652,882 14.1%
West Midlands 5,801,090 203,324 3.5% 103,944 1.8% 845,535 14.6%
East of England 5,986,835 198,148 3.3% 100,406 1.7% 834,662 13.9%
London 8,845,268 192,142 2.2% 93,927 1.1% 970,554 11.0%
South East 4,582,266 148,830 3.2% 80,903 1.8% 632,487 13.8%
South Central 4,333,806 126,415 2.9% 67,646 1.6% 543,580 12.5%
South West 5,466,266 195,096 3.6% 110,537 2.0% 783,752 14.3%
Scotland 5,216,925 228,074 4.4% 109,694 2.1% 705,994 13.5%
Ayrshire & Arran 387,577 20,723 5.3% 9,621 2.5% 59,329 15.3%
Borders 116,285 5,756 4.9% 2,870 2.5% 16,380 14.1%
Dumfries & Galloway 155,370 8,222 5.3% 3,756 2.4% 24,009 15.5%
Fife 375,671 16,268 4.3% 8,110 2.2% 53,841 14.3%
Forth Valley 302,146 14,143 4.7% 6,298 2.1% 41,739 13.8%
Grampian 573,533 22,661 4.0% 10,580 1.8% 74,117 12.9%
Greater Glasgow & Clyde 1,313,117 55,986 4.3% 26,784 2.0% 165,839 12.6%
Highland 322,350 14,754 4.6% 7,623 2.4% 48,358 15.0%
Lanarkshire 591,826 27,308 4.6% 12,047 2.0% 80,551 13.6%
Lothian 589,109 20,013 3.4% 10,489 1.8% 68,478 11.6%
Orkney 20,502 855 4.2% 355 1.7% 3,292 16.1%
Shetland 22,769 789 3.5% 351 1.5% 3,473 15.3%
Tayside 419,217 18,928 4.5% 10,134 2.4% 61,136 14.6%
Western Isles 27,453 1,668 6.1% 676 2.5% 5,452 19.9%
Wales 3,168,721 128,114 4.0% 65,203 2.1% 486,533 15.4%
Betsi Cadwaladr ULHB 704,259 30,025 4.3% 14,539 2.1% 111,496 15.8%
Powys Teaching LHB 138,580 5,803 4.2% 3,267 2.4% 23,274 16.8%
Hywel Dda LHB 390,645 17,147 4.4% 8,808 2.3% 63,318 16.2%
ABM ULHB 541,356 22,847 4.2% 12,101 2.2% 81,003 15.0%
Cwm Taf LHB 303,942 12,604 4.1% 6,159 2.0% 50,723 16.7%
Cardiff & Vale ULHB 494,659 15,169 3.1% 8,546 1.7% 62,294 12.6%
Aneurin Bevan LHB 595,280 24,519 4.1% 11,783 2.0% 94,425 15.9%
Northern Ireland 1,882,678 75,027 4.0% 32,998 1.8% 237,834 12.6%
Belfast 423,863 17,424 4.1% 7,811 1.8% 52,049 12.3%
Southern Eastern 323,465 13,666 4.2% 6,258 1.9% 42,986 13.3%
Northern 445,172 18,745 4.2% 8,008 1.8% 59,163 13.3%
Southern 370,927 13,525 3.6% 5,780 1.6% 44,947 12.1%
Western 319,251 11,667 3.7% 5,141 1.6% 38,689 12.1%
Notes:England - Copyright © Health and Social Care Information Centre 2009. ¶ Stroke refers to stroke and transient ischaemic attack. ¶ Prevalence (unadjusted) = (number on disease register / registered GP patients ) * 100%. ¶ Prevalence estimates for Shetland and Orkney are relatively unstable, due to their being based on a smaller number of patients.
Source:England - Information Centre QOF achievement data 2010/11. ¶ Wales - StatsWales. QOF 20010/11 achievement data. ¶ Scotland - ISD Scotland. QOF achievement data 2010/11. ¶ Northern Ireland - Department of Health, Social Services and Public Safety. QOF achievement data at health and social services board level.

British Heart Foundation and University of Oxford 83
Table 2.20Prevalence of cardiovascular disease, by sex and age, Great Britain 1988 to 2010
All ages 16-44 45-64 65-74 75+
% % % % %
Men
1988 7.3 1.7 14.3 24.7 22.3
1989 6.9 1.2 13.3 25.9 22.1
1994 9.3 1.6 13.8 24.6 23.6
1995 9.3 1.2 12.9 27.2 23.8
1996 9.9 1.4 14.1 26.8 24.9
1998 11.3 1.9 15.5 28.1 31.0
2000 10.7 1.8 13.7 29.0 30.8
2001 11.0 2.2 15.0 31.3 33.3
2002 11.9 1.7 15.2 33.0 39.8
2003 11.3 1.7 14.7 34.5 31.7
2004 11.1 1.4 14.6 29.5 37.3
2005 11.4 1.5 16.7 28.8 32.9
2006 11.5 2.3 12.8 29.0 33.3
2007 10.9 1.0 14.7 32.0 33.8
2008 11.1 1.4 15.6 31.2 31.1
2009 11.4 1.6 14.9 32.3 33.7
2010 11.7 1.5 14.6 33.9 35.5
Women
1988 7.7 1.7 10.8 22.8 26.5
1989 7.7 2.2 11.5 22.0 26.8
1994 9.2 1.7 10.6 23.9 25.1
1995 8.7 1.3 9.7 19.7 29.2
1996 9.5 1.5 12.4 22.4 25.4
1998 9.9 1.3 10.6 26.8 29.9
2000 10.4 1.8 11.7 26.2 30.6
2001 10.2 1.5 11.5 25.2 32.2
2002 11.9 1.9 12.9 29.1 37.9
2003 10.9 2.2 11.8 29.7 30.3
2004 11.0 1.7 13.2 26.6 31.9
2005 10.8 2.0 12.3 26.0 31.3
2006 11.5 2.3 12.8 29.0 33.3
2007 9.7 1.8 11.0 23.9 27.7
2008 9.4 1.2 9.9 23.0 32.5
2009 9.5 1.7 9.8 26.2 27.5
2010 10.1 2.1 10.6 22.3 31.7
Notes: From 2000 data are weighted for non-response. ¶ See source for details.
Source: Office for National Statistics (2011). General Lifestyle Survey 2010. Results published online at http://www.ons.gov.uk/ons/rel/ghs/general-lifestyle-survey/2010/index.html (Accessed May 2010).

84 Coronary heart disease statistics 2012
Figure 2.20 Prevalence of cardiovascular disease (CVD), by age, Great Britain 1988 to 2010
Prev
alen
ce (%
)
45
75+65–7445–6416–44
1988
1989
1990
1991
1992
1993
1994
1995
1996
1997
1998
1999
2000
2001
2002
2003
2004
2005
2006
2007
2008
2009
2010
0
5
10
15
20
25
30
35
40

British Heart Foundation and University of Oxford 85
3. Treatment

86 Coronary heart disease statistics 2012
3. Treatment
This chapter reports on different methods of treatment for cardiovascular disease (CVD), with a focus on treatments for coronary heart disease (CHD). The chapter includes tables and figures on the number of prescriptions, operations and hospital episodes for CVD in the UK, with temporal trends and comparisons with other countries in Europe where possible. The chapter also includes a discussion of the impact of the National Service Framework for Coronary Heart Disease 1, which was introduced in 2000 and covered different aspects of treatment for CHD within the NHS over a ten year period finishing in 2010. An assessment of staffing levels and rehabilitation for CHD is also provided.
PrescriptionsThe rapid increase in the number of prescriptions for the treatment and prevention of CVD began in the late 1980s. In 2011, around 292 million prescriptions were issued for CVD in England, nearly six times as many as issued in 1986, and an increase of 2% from the number of prescriptions in 2010 (Table 3.1). Total number of prescriptions issued for CVD in the UK was around 348 million (Table 3.2).
Since 1990, the number of prescriptions for antiplatelet drugs has increased steadily, and there are now over 38 million prescriptions for antiplatelet drugs in England every year. The increase in the number of prescriptions of lipid lowering drugs was slow until the late 1990s, but since then has been very rapid. The number of prescriptions for lipid lowering drugs is more than fifteen times higher than a decade ago (Table 3.1 and Figure 3.1). In 2011 antihypertensive drugs were the most prescribed drugs for CVD in England, Scotland and Wales. In Northern Ireland it was lipid lowering drugs followed by the antihypertensive drugs (Table 3.2).
The cost of prescriptions for hypertension and heart failure therapy decreased by approximately £64 million between 2010 and 2011, to just over £330 million 2. The cost of prescriptions for cardiovascular diseases may not increase at the same rate as the increase in the number of prescriptions, as when commonly used drugs come out of patent they can be replaced by cheaper generic drugs (Figure 3.1).
OperationsThe total number of operations carried out to treat CHD is increasing. The number of percutaneous coronary interventions (PCIs) carried out in the UK in 2010 was more than three times higher than a decade earlier; over 80,000 procedures are now carried out annually in the UK. But the amount of coronary artery bypass graft (CABG) surgery reached a plateau in the late 1990s, driven by more widespread use of less invasive procedures (e.g. stents). Currently around 25,000 CABG procedures are carried out in the UK each year (Table 3.3 and Figure 3.3).
Rates of CABG and PCI vary substantially across the UK. In the most recent atlas of coronary revascularisation rates for men and women by local authority in England in 2002 showed a greater than six fold difference between the lowest and highest rates 3. More recently, rates of operations for CHD have been shown to vary greatly around England for both men and women, with higher operation rates found in urban and metropolitan areas, and in rural areas in the North and South West of England 4.
Inpatient hospital episodesOverall, there were around 405,000 inpatient episodes of CHD in National Health Service hospitals in 2010/11 in England, and a further 50,000 in Scotland and 24,000 in Wales. These represent 3.4% of all inpatient episodes in men and 1.4% in women in England (4.8% and 2.3% for men and women respectively in Scotland). The number of inpatient episodes of CHD has increased by 7% in the last ten years 5 (Table 3.4 and Figures 3.4a, 3.4b, 3.4c and 3.4d).
Medical risk factors for CHD, such as diabetes and obesity, also result in a sizeable burden to the National Health Service. In 2010/11 there were around 38,000 inpatient episodes of diabetes, and over 12,000 of obesity in England (Table 3.4).

British Heart Foundation and University of Oxford 87
Staffing levelsIn 2002, a report on the provision of services for patients with heart disease in the UK claimed there was a shortage of all types of health care professionals involved in cardiovascular care 6. However, since then the numbers of consultant cardiologists and cardiothoracic surgeons have increased considerably. In 2011, there were 947 cardiologists and 306 cardiothoracic surgeons working in England 7. In the same time period, there were 165 and 62 in Scotland, 136 and 38 in Wales and 47 and 7 in Northern Ireland. The total number of cardiologists (full time equivalence) currently working in the UK is around 1,295 (which equates to around 20 per million). This level of staffing is around 80% higher than in 2002 8.
RehabilitationThe National Audit of Cardiac Rehabilitation monitors access to cardiac rehabilitation around the UK (except Scotland). Its most recent report (2011) 9 found that in 2009/10 only 42% of heart attack and revascularisation patients started a cardiac rehabilitation programme. The audit team also found large geographical inequalities in access to cardiac rehabilitation – for example, the percentage of myocardial infarction patients that started a rehabilitation programme ranged from 30% to 59% in different Strategic Health Authorities in England. In Scotland percentage of completing cardiac rehabilitation programmed ranged from 36% to 79% in different NHS Boards 10.
International differencesCountry-level rates of hospitalisation for CVD are dependent upon a number of factors including prevalence of disease, service provision and primary care referrals practice. Therefore, international comparisons of hospitalisation rates for CVD should be made with caution.
Rates of hospitalisations for CVD vary considerably across Europe. For example, the hospitalisation rate in Belarus is four times higher than in Portugal. In general, high hospitalisation rates for CVD, CHD and stroke are found in Eastern European and Scandinavian countries (Tables 3.5 to 3.7).
Within Europe, there is an East-West divide in temporal trends for hospitalisation for CVD. Rates in some Eastern European and former Soviet countries have increased rapidly since 1995, whereas rates in Western European countries have remained relatively stable. For example, the rate of hospitalisations for CHD in Ukraine has nearly trebled since 1995, whereas the United Kingdom rate has changed little over this time period (Tables 3.5 to 3.7, Figures 3.6 and 3.7).
National Service Framework for Coronary Heart DiseaseThe National Service Framework (NSF) outlined a series of priorities, milestones and goals to be achieved to improve service quality, tackle variations in care and reduce the number of deaths from CHD over the ten-year period 2000-2010. It is clear that there have been some impressive successes in implementing the programme outlined in the NSF. For example, three immediate priorities were achieved quickly: the introduction of specialist smoking cessation clinics by health authorities to help 150,000 people quit smoking; the setting up of 50 rapid-access chest pain clinics to assess people with new symptoms for angina within two weeks of referral; and the reduction of call-to-needle times for thrombolysis for heart attacks, by improving ambulance response times and increasing the proportion of accident and emergency (A&E) departments able to provide thrombolysis. By 2010/11, over 700,000 people in England attended NHS smoking cessation services, and of these, 49% reported that they were not smoking four weeks after their quit date (Table 3.8) 11. By June 2001, there were 150 rapid-access chest pain clinics open across England 12. By 2004/05, only the South East Coast had missed the target of 75% of category A (immediately life threatening) calls responded to within eight minutes 13. This is compared to only 3 out of 32 ambulance services achieving this target in 2000/01. From 2008/09, the measurement for response time was changed, but across England 74% of emergency and urgent calls were responded to in less than eight minutes. The Scottish Ambulance Service reported that they responded to 72% of emergency calls within eight minutes in 2010/11 14 (Table 3.9).
Further targets that were achieved by the NSF regarded treatment for CHD once patients arrived at hospital. These included targets to increase to 75% the proportion of heart attack patients receiving thrombolysis within 30 minutes of arriving at hospital; to improve the use of effective medicines after heart attack so that 80 to 90% of people discharged from hospital following a heart attack are prescribed aspirin, beta-blockers and statins; and to increase the total number of revascularisation procedures by 3,000. As discussed earlier, the number of revascularisation procedures carried out in the UK is still increasing – in 2008 there were nearly 45,000 more revascularisation procedures in the UK than in 2000.
The Myocardial Ischaemia National Audit Project (MINAP) has monitored the achievement of the other two targets. MINAP data show that by April 2002, 59% of eligible heart attack patients were receiving thrombolysis within 30 minutes of arriving in hospital. As the number of patients having primary angioplasty has increased, the number having thrombolytic treatment, either before or on arrival at hospital, has fallen. By 2010/11, the level was 75% in England and 62% in Wales. MINAP data further show that in 2010/11, at least 95% of people discharged from hospital following a heart attack in England were prescribed secondary prevention medicine (Table 3.10) 15.

88 Coronary heart disease statistics 2012
The NSF also outlined the importance of cardiac rehabilitation. It set an overall goal that in every hospital over 85% of people discharged with a primary diagnosis of heart attack or after coronary revascularisation should be offered cardiac rehabilitation. However, as discussed earlier, the rate of CHD patients actually starting cardiac rehabilitation programmes is still much lower than this level (42% in 2009/10) 9.
The Department of Health have monitored the implementation of the NSF for CHD, and periodically report on its findings. The most recent report in 2009 highlighted improvements in waiting time for CABGs: in April 2002, there were 7,558 people waiting for a CABG and 4,364 of them had been waiting three months or more; by December 2008, this had fallen to 1,670 people waiting and only six people had been waiting longer than three months 16. However, the review acknowledged that many things have changed since 2000 and identified several areas to be focussed on, such as preventing vascular disease and not just treating it, removing inequalities of access, and ensuring that those with chronic vascular conditions who require long-term and end-of-life care get the same level and quality of services that those with acute conditions are currently receiving.
1. Department of Health (2000). National Service Framework for Coronary Heart Disease. The Stationery Office: London.
2. Office for National Statistics (2008). Prescription cost analysis. The Information Centre: London, and previous editions.
3. Otreba P, Rayner M, Hill A, Goldacre M (2003) An atlas of coronary heart disease mortality, hospital admissions and coronary revascularisations in South East England. SEPHO: Oxford. This publication contains maps of CHD mortality, hospital admissions and coronary revascularisations by local authority across England as well as the South East Region. See www.heartstats.org/chd_atlas
4. Scarborough P, Allender S, Peto V, Rayner M (2008). Regional and social differences in Coronary Heart Disease 2008. British Heart Foundation: London. This publication contains maps of mortality, morbidity and treatment rates for coronary heart disease, and local estimates of the prevalence of behavioural risk factors for CHD. See www.heartstats.org/publications.
5. In 2000/2001, the number of inpatient episodes for CHD was 378,532 in National Health Service hospitals in England. See Table 3.5 in Petersen S, Peto V and Rayner M (2003) Coronary heart disease statistics. British Heart Foundation: London.
6. Hall R, More R, Camm J et al (2002). Fifth report on the provision of services for patients with heart disease. Heart; 88 (Suppl III): iii1-iii59.
7. Office for National Statistics (2012). Medical and Dental Workforce Census 2011. The Information Centre: Leeds.
8. Data from NHS workforce statistics (2011/12) and national statistical agencies.
9. National Audit of Cardiac Rehabilitation (2011). Annual Statistical Report 2011. British Heart Foundation: London.
10. Cardiac Rehabilitation in Scotland (2011). Information Services Division. Edinburgh.
11. Four week self-reported quit rates only give an indication of the true short-term quit rates achieved by smoking cessation services. In 2003/04, carbon monoxide (CO) validation was offered to clients of smoking cessation services as a tool to aid smoking cessation. Around 70% of those who reported having successfully quit smoking at the 4-week follow-up had the level of carbon monoxide in their bloodstream measured. In 88% of cases this test confirmed they were not smoking at 4-weeks. Longer term success rates are currently unknown.
12. Department of Health Heart Team, personal communication.
13. Department of Health Statistical Bulletin (2005) Ambulance services, England: 2004-2005. Department of Health: London.
14. Working for you, Scottish Ambulance Service Annual Report and Accounts 2010/2011. NHS Scotland: Edinburgh. (accessed August 2012).
15. For more results from the MINAP project, including hospital level data, see Royal College of Physicians (2011) How the NHS Manage Heart Attacks. Tenth Public Report of the Myocardial Infarction National Audit Project. Royal College of Physicians: London. Also available at www.rcplondon.ac.uk/pubs.
16. Department of Health (2009). The Coronary Heart Disease National service framework report. Building on excellence, maintaining progress. Progress report for 2008. Department of Health: London.

British Heart Foundation and University of Oxford 89
Table 3.1 Prescriptions used in the prevention and treatment of cardiovascular disease, England 1981 to 2011
Prescriptions (thousands) 1981 1986 1991 1996 2000 2001 2002 2003 2004 2005 2006 2007 2008 2009 2010 2011
Digoxin and other positive inotropic drugs (2.1)
4,243 3,722 3,822 3,871 3,983 4,031 4,029 4,043 4,088 4,103 4,126 4,141 4,149 4,119 4,088 4,006
Diuretics (2.2) 20,678 21,996 22,195 23,106 27,738 30,203 32,185 34,432 36,546 37,619 37,582 37,355 37,536 37,511 37,687 37,563
Anti-arrhythmic drugs (2.3) 232 334 532 840 1,214 1,292 1,338 1,343 1,325 1,292 1,265 1,247 1,226 1,188 1,174 1,156
Beta-adrenoreceptor blocking drugs (2.4)
9,827 12,525 14,282 14,375 18,321 20,439 22,439 24,336 26,361 27,460 27,378 26,810 27,634 28,529 29,686 30,924
Antihypertensive and heart failure drugs (2.5)
4,912 4,424 6,431 12,125 21,075 25,047 29,591 33,788 38,580 42,865 47,742 53,634 57,823 60,838 63,571 65,449
Nitrates, calcium blockers & other antianginal drugs (2.6)
5,156 10,314 16,718 21,971 25,394 26,814 27,994 29,156 30,715 32,309 34,707 37,214 39,100 40,575 42,043 43,086
Sympathomimetics (2.7) 15 6 19 7 3 2 2 3 4 4 5 6 8 12 16 17
Anticoagulants and protamine (2.8)
629 900 1,356 2,609 4,152 4,609 4,975 5,389 5,871 6,294 6,790 7,309 7,991 8,546 9,157 9,773
Antiplatelet drugs (2.9) 281 1,058 3,619 9,002 16,552 18,891 21,601 24,428 27,356 30,218 32,779 35,382 38,124 39,107 38,182 38,351
Anti-fibrinolytic drugs and haemostatics (2.11)
267 282 289 300 310 311 327 352 358 363 373 392
Lipid-lowering drugs (2.12) 295 247 1,066 3,138 10,331 13,523 17,604 22,655 29,444 35,568 42,098 47,412 52,190 56,452 59,550 61,649
Local sclerosants (2.13) 1 1 0 0 0 0 0 0 0 0 0 0
All prescriptions for disease of the circulatory system
46,267 55,526 70,041 91,044 129,030 145,134 162,046 179,872 200,598 218,043 234,798 250,862 266,138 277,244 285,530 292,370
Notes:The data up to 1990 are not consistent with data from 1991 onwards. ¶ Figures up to 1990 are based on fees and on a sample of 1 in 200 prescriptions dispensed by community pharmacists and appliance contractors only. ¶ Figures from 1991 are based on items and cover all prescriptions dispensed by community pharmacists, appliance contractors, dispensing doctors and prescriptions submitted by prescribing doctors for items personally administered. British National Formulary (BNF) codes in parentheses.
Source:Office for National Statistics (2012). Prescription cost analysis 2011. The Information Centre: Leeds, and previous editions.
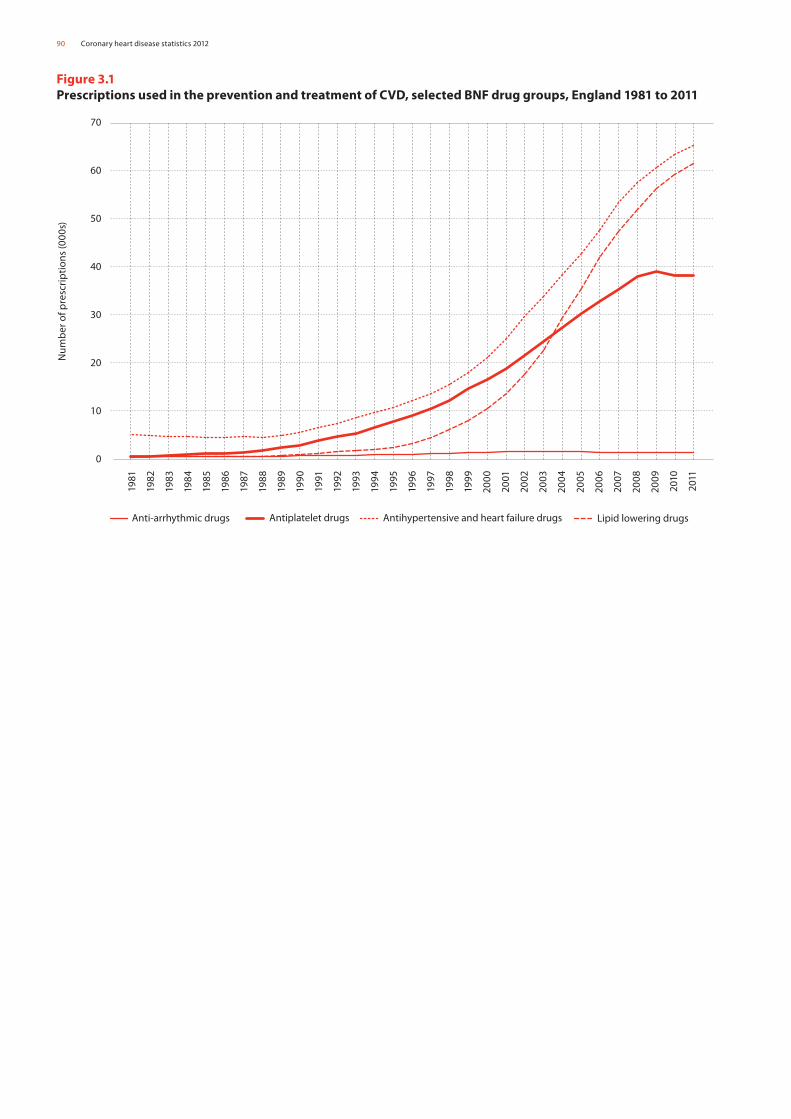
90 Coronary heart disease statistics 2012
Figure 3.1 Prescriptions used in the prevention and treatment of CVD, selected BNF drug groups, England 1981 to 2011
Num
ber
of p
resc
rip
tion
s (0
00s)
Lipid lowering drugsAntihypertensive and heart failure drugsAntiplatelet drugsAnti-arrhythmic drugs
1981
1982
1983
1984
1985
1986
1987
1988
1989
1990
1991
1992
1993
1994
1995
1996
1997
1998
1999
2000
2001
2002
2003
2004
2005
2006
2007
2008
2009
2010
2011
0
10
20
30
40
50
60
70

British Heart Foundation and University of Oxford 91
Table 3.2 Prescriptions used in the prevention and treatment of cardiovascular disease, UK latest available year
Prescriptions (thousands)England
2011Wales
2011Scotland
2011/12Northern
Ireland 2011UK
Digoxin and other positive inotropic drugs (2.1) 4,006 284 276 93 4,659
Diuretics (2.2) 37,563 2,960 3,382 1,002 44,907
Anti-arrhythmic drugs (2.3) 1,156 64 71 32 1,323
Beta-adrenoreceptor blocking drugs (2.4) 30,924 2,322 2,957 1,059 37,262
Antihypertensive and heart failure drugs (2.5) 65,449 4,920 5,045 1,640 77,054
Nitrates, calcium blockers & other antianginal drugs (2.6) 43,086 3,314 3,699 1,154 51,253
Sympathomimetics (2.7) 17 1 1 0 19
Anticoagulants and protamine (2.8) 9,773 808 819 274 11,674
Antiplatelet drugs (2.9) 38,351 2,904 3,506 1,223 45,984
Antifibrinolytic drugs & haemostatics (2.11) 392 33 44 15 484
Lipid-lowering drugs (2.12) 61,649 4,788 4,861 1,838 73,136
Local sclerosants (2.13) 0 0 0 0 0
All prescriptions for disease of the cardiovascular system 292,370 22,399 24,660 8,330 347,759
Notes: Numbers are rounded to nearest 000. ¶ Figures are based on items and cover all prescriptions dispensed by community pharmacists, appliance contractors, dispensing doctors and prescriptions submitted by prescribing doctors for items personally administered. ¶ British National Formulary (BNF) codes in parentheses.
Source: Office for National Statistics (2012). Prescription cost analysis 2011. The Information Centre: Leeds. ¶ Welsh Government (2012). Prescription Cost Analysis 2011. Health Statistics and Analysis Unit:Cardiff. ¶ ISD Scotland (2012). Prescription Cost Analysis 2011/12. NHS National Services: Edinburgh. ¶ HSC (2012). Prescription Cost Analysis 2011. Business Services Organisation: Belfast.

92 Coronary heart disease statistics 2012
Table 3.3Number of CABGs and PCIs, United Kingdom 1977 to 2010
Coronary artery bypass surgery (CABG) Percutaneous coronary interventions (PCI)
1977 2,297
1978 2,653
1979 2,918
1980 4,057
1981 5,130
1982 6,008
1983 8,332
1984 9,433
1985 10,667
1986 10,767
1987 11,521
1988* 11,113
1989 12,648
1990 14,431
1991 15,659 9,933
1992 19,241 11,575
1993 21,031 12,937
1994 22,056 14,624
1995 22,475 17,344
1996 22,160 20,511
1997 25,639 22,902
1998 25,083 24,899
1999 24,733 28,133
2000 25,127 33,256
2001 24,663 38,992
2002 25,277 44,913
2003 25,461 53,261
2004 25,160 62,780
2005 23,412 70,142
2006 23,623 73,692
2007 25,372 77,373
2008 22,846 80,331
2009 19,766 83,130
2010 17,822 87,676
Notes: Data are not available for PCIs until after 1990. ¶ * One centre did not make a return this year. ¶ Operations performed within the private sector are not included.
Source:British Cardiovascular Intervention Society (2009). Personal communication. ¶ British Cardiovascular Intervention Society (2012). BCIS Audit returns. Personal communication.

British Heart Foundation and University of Oxford 93
Figure 3.3 Number of coronary artery bypass operations and percutaneous coronary interventions per year, United Kingdom 1980 to 2010
Num
ber
of p
roce
dur
es p
er y
ear
Percutaneous coronary interventions (PCI)Coronary artery bypass surgery (CABG)
1977
1978
1979
1980
1981
1982
1983
1984
1985
1986
1987
1988
1989
1990
1991
1992
1993
1994
1995
1996
1997
1998
1999
2000
2001
2002
2003
2004
2005
2006
2007
2008
2009
2010
0
10,000
20,000
30,000
40,000
50,000
60,000
70,000
80,000
90,000

94 Coronary heart disease statistics 2012
Table 3.4 Inpatient episodes by main diagnosis in National Health Service hospitals, by sex, England, Scotland, Wales and Northern Ireland 2010/11
England Scotland Wales Northern Ireland
Men Women Men Women Men Women Men Women
All diagnoses 7,628,685 9,641,197 668,172 745,613 388,768 497,554 302,301 330,859
All diseases of the circulatory system (I00-I99)
767,889 603,920 83,249 65,620 44,492 36,410 26,019 20,265
Coronary heart disease (I20-I25) 263,538 141,558 32,378 17,809 15,621 8,679 9,903 4,732
Angina pectoris (I20) 60,496 43,692 5,457 3,979 3,883 2,834 2,343 1,245
Acute myocardial infarction (I21) 55,566 36,501 15,133 9,253 3,575 2,347 1,783 1,087
Other coronary heart disease 147,476 61,365 11,788 4,577 8,163 3,498 5,777 2,400
Heart failure (I50) 60,223 56,811 6,168 5,567 4,430 4,170 2,037 2,160
Stroke (I60-I69) 96,364 101,971 10,936 11,675 6,045 6,426 3,453 3,586
Diabetes (E10-E14) 19,742 18,545 3,851 3,542 2,668 2,065 2,431 1,987
Obesity (E66) 3,180 9,099 154 263 24 58 10 13
All cancer (C00-D48) 850,394 889,510 89,474 104,956 31,704 29,654 28,607 31,151
Colo-rectal cancer (C18-C21) 88,894 63,908 11,747 9,280 3,116 2,067 3,993 2,672
Lung cancer (C33-C34) 57,536 44,148 8,980 8,626 2,571 2,040 2,669 1,702
Breast cancer (C50) 948 180,151 130 23,577 14 3,486 33 6,898
Bladder cancer (C67) 65,549 21,207 3,624 1,483 3,030 1,141 1,991 604
All diseases of the nervous system (G00-G99)
178,326 207,224 15,123 18,356 8,239 10,369 4,146 5,159
All diseases of the respiratory system (J00-J99)
590,963 576,234 57,089 60,768 39,473 39,078 20,681 20,728
All diseases of the digestive system (K00-K93)
985,122 1,031,740 89,932 97,048 51,962 54,608 35,087 37,824
All diseases of the genitourinary system (N00-N99)
441,529 656,723 36,112 54,708 23,954 36,632 75,416 65,111
Injury and poisoning (S00-T98) 584,203 580,201 60,239 57,667 32,018 31,478 19,086 17,289
All other diagnoses 3,207,337 5,068,001 232,949 282,685 154,234 257,202 90,818 131,332
Notes:Finished consultant episodes; ordinary admissions and day cases combined. ¶ Pregnancy cases are not included. ¶ ICD-10 codes in parentheses.
Source:Department of Health (2012) Hospital Episode Statistics 2010/11. www.hesonline.nhs.uk (accessed May 2012). ¶ Information Services Division Scotland (2012) Main diagnosis discharges from hospital 2010/11. www.isdscotland.org (accessed May 2012). ¶ NHS Wales Informatics Service (2011) The Patient Episode Database for Wales - 2010/11. www.infoandstats.wales.nhs.uk (accessed May 2012). ¶ Hospital Information Branch(2012) Northern Ireland Episode Based Acute Inpatient and Day Case Activity Data 2010/11.Personal communication.

British Heart Foundation and University of Oxford 95
Figure 3.4a Inpatient episodes by main diagnosis in men for National Health Service hospitals, England 2010/11
A. Coronary heart disease (3%)
B. Stroke (1%)
C. Other cardiovascular disease (5%)
D. Nervous system disease (2%)
E. Respiratory disease (8%)
F. Cancer (11%)
G. Digestive system disease (13%)
H. Genitourinary disease (6%)
I. Injury and poisoning (8%)
J. All other causes (42%)
A B C D E F G H I
J
Figure 3.4bInpatient episodes by main diagnosis in women for National Health Service hospitals, England 2010/11
A. Coronary heart disease (1%)
B. Stroke (1%)
C. Other cardiovascular disease (4%)
D. Nervous system disease (2%)
E. Respiratory disease (6%)
F. Cancer (9%)
G. Digestive system disease (11%)
H. Genitourinary disease (7%)
I. Injury and poisoning (6%)
J. All other causes (53%)
A B C D E F G H I
J

96 Coronary heart disease statistics 2012
Figure 3.4dInpatient episodes by main diagnosis in women for National Health Service hospitals, Scotland 2010/11
A. Coronary heart disease (2%)
B. Stroke (2%)
C. Other cardiovascular disease (5%)
D. Nervous system disease (2%)
E. Respiratory disease (8%)
F. Cancer (14%)
G. Digestive system disease (13%)
H. Genitourinary disease (7%)
I. Injury and poisoning (8%)
J. All other causes (38%)
A B C D E F G H I
J
Figure 3.4c Inpatient episodes by main diagnosis in men for National Health Service hospitals, Scotland 2010/11
A. Coronary heart disease (5%)
B. Stroke (2%)
C. Other cardiovascular disease (5%)
D. Nervous system disease (2%)
E. Respiratory disease (9%)
F. Cancer (13%)
G. Digestive system disease (13%)
H. Genitourinary disease (5%)
I. Injury and poisoning (9%)
J. All other causes (36%)
A B C D E F G H I
J

British Heart Foundation and University of Oxford 97
Table 3.5 Age-standardised cardiovascular disease (CVD) hospital discharge rates per 100,000, Europe 1980 to 2009
1980 1985 1990 1995 2000 2005 2006 2007 2008 2009
Albania 417 540 623 668 719 705 785
Andorra 586 701 677 683 753 726
Armenia 1,092 1,236 1,225 762 639 931 972 1,035 1,142 1,224
Austria 3,004 3,320 3,630 3,746 3,769 3,804 3,777
Azerbaijan 1,481 595 472 572 616 641 672 653
Belarus 3,444 4,577 5,165 5,374 5,599 5,750 5,786
Belgium 2,235 2,356 2,233 2,204 2,168
Bosnia and Herzegovina 964 905
Bulgaria 1,451 1,790 1,779 1,774 1,869 2,835 3,024 3,180 3,331 3,712
Croatia 1,136 1,265 1,232 1,760 1,850 1,947 1,926 1,904 1,892
Cyprus 607 690 809 549 818 813 757 844 670
Czech Republic 3,051 3,261 3,514 3,368 3,254 3,151 3,168
Denmark 2,292 2,201 2,543 2,559 2,538 2,469 2,423 2,501
Estonia 2,338 2,664 3,239 3,243 3,360 3,372 3,494 3,327
Finland 3,293 3,858 3,785 3,121 3,033 2,913
France 2,307 2,283 2,302 2,268 2,273
Georgia 1,635 507 454 649 762 837 975 971
Germany 2,955 3,267 3,310 3,323 3,392 3,463
Greece 1,191 1,404 1,593 2,010 2,309 2,708 2,797
Hungary 3,171 4,239 4,495 4,376 3,861 3,863
Iceland 1,935 1,863 1,830 1,545 1,480
Ireland 1,440 1,420 1,268 1,241 1,202 1,181 1,163
Israel 1,754 2,047 1,911 1,638 1,600 1,502 1,482
Italy 2,128 2,349 2,582 2,363 2,330 2,248 2,179
Kazakhstan 1,597 1,207 1,314 1,805 1,856 1,817 1,899 1,970
Kyrgyzstan 1,158 1,217 1,257 903 1,041 1,130 1,257 1,385 1,326
Latvia 1,898 2,423 2,445 2,598 3,144 3,636 3,816 3,900 3,893 3,190
Lithuania 1,978 2,628 2,687 3,201 4,102 4,154 4,047 4,059 4,226 4,283
Luxembourg 2,612 2,236 2,249 2,172
Malta 666 727 751 656 942 1,183
Montenegro 1,059 1,249 1,400 1,636 1,710 1,670 1,654 1,677
Netherlands 1,338 1,414 1,583 1,403 1,558 1,572 1,580 1,626
Norway 2,194 2,349 2,467 2,495 2,449 2,452 2,368
Poland 1,344 1,530 1,814 2,052 2,556 2,645 2,550 3,085
Portugal 944 1,125 1,206 1,194 1,332 1,388
Republic of Moldova 1,316 1,626 1,727 1,580 1,315 2,023 2,100 2,153 2,300 2,327
Romania 1,784 1,914 1,737 2,024 2,422 2,589 3,159 2,826 3,057 3,178
Russian Federation 2,226 2,255 2,763 3,414 3,479
Serbia 1,455 1,812 1,823 1,932 2,094 2,160
Slovakia 2,534 2,443 2,679 2,688 2,463 2,684 2,697
Slovenia 1,286 1,391 1,424 1,560 1,685 1,851 1,960 1,940 1,918 1,976
Spain 537 691 775 1,059 1,333 1,339 1,323 1,323 1,315
Sweden 2,796 2,996 2,639 2,467 2,455 2,441
Switzerland 1,680 1,719 1,735 1,775
Tajikistan 939 653 533 771 879 918 925 933
TFYR Macedonia 759 1,184 1,267 1,556 1,430 1,443
Turkey 270 390 531 896 909 1,146 1,047 1,183 1,180
Turkmenistan 821 1,405 1,225 1,249 1,368 1,426 1,522
Ukraine 2,119 2,601 2,792 2,568 2,612 3,462 3,586 3,677 3,781 3,744
United Kingdom 1,422 1,353 1,321 1,304 1,311 1,305
Uzbekistan 1,217 959 1,394 1,444 1,552 1,558 1,586
European Region 1,920 2,021 2,226 2,430 2,458 2,453 2,494 2,498
EU 1,979 2,191 2,396 2,397 2,420 2,378 2,436
Notes: Blank cells indicate no data were available. ¶ Age standardised for European population
Source: WHO Europe (2010) Health for All Database (HFA-DB) http://data.euro.who.int/hfadb/ (Accessed June 2012).

98 Coronary heart disease statistics 2012
Table 3.6 Age-standardised coronary heart disease (CHD) hospital discharge rates per 100,000, Europe 1980 to 2009
1980 1985 1990 1995 2000 2005 2006 2007 2008 2009
Albania 121 157 187 188 204 196 250
Andorra 120 149 150 179 157
Armenia 334 437 521 318 282 382 411 434 469 505
Austria 391 587 748 982 994 990 954
Azerbaijan 499 201 154 175 179 186 214 230
Belarus 1,635 2,212 2,569 2,641 2,720 2,713 2,864
Belgium 689 736 678 653 632
Bosnia and Herzegovina 181 139
Bulgaria 460 524 545 553 542 721 854 932 1,017 1,273
Croatia 295 334 309 495 503 486 470 469 490
Cyprus 223 293 339 222 332 279 194 257 198
Czech Republic 1,223 1,041 983 905 851 776 771
Denmark 700 684 790 823 766 731 684 695
Estonia 936 990 1,117 998 1,090 1,002 999 900
Finland 1,153 1,369 1,160 923 865 791
France 503 513 519 504 497
Georgia 677 181 194 333 404 399 483 463
Germany 947 1,060 977 959 938 916
Greece 296 412 521 722 777 936 970
Hungary 961 1,113 876 857 791 808
Iceland 790 724 704 576 571
Ireland 477 457 422 418 392 375 354
Israel 834 938 823 619 577 516 501
Italy 493 520 600 582 570 550 529
Kazakhstan 522 436 419 606 533 547 684 721
Kyrgyzstan 324 321 365 156 322 385 364 394 497
Latvia 849 1,094 1,163 1,166 1,263 1,381 1,456 1,453 1,472 1,189
Lithuania 1,283 1,327 1,526 1,415 1,376 1,311 1,304 1,297 1,312
Luxembourg 819 738 689 606
Malta 184 271 238 188 288 351
Montenegro 342 421 541 555 521 509 565
Netherlands 500 543 612 523 539 529 527 526
Norway 890 876 952 981 972 952 899
Poland 332 397 541 598 774 778 742 884
Portugal 225 277 276 254 328 339
Republic of Moldova 508 689 665 562 419 547 588 592 656 659
Romania 637 752 473 492 364 367 374
Russian Federation 888 936 1,103 1,313 1,330
Serbia 373 490 507 570 629 644
Slovakia 1,089 955 884 836 737 810 780
Slovenia 309 313 349 347 366 411 433 417 397 411
Spain 102 164 202 278 363 338 328 317 302
Sweden 868 959 905 786 766 745
Switzerland 502 498 484 498
Tajikistan 174 122 217 249 264 265 266
TFYR Macedonia 141 321 480 666 605 551
Turkey 38 56 99 144 206 365 454 534 524
Turkmenistan 269 56 34 28 27 19 24
Ukraine 614 719 728 665 1,197 1,646 1,712 1,761 1,825 1,809
United Kingdom 523 488 471 458 444 421
Uzbekistan 321 300 443 472 588 448
European Region 609 643 738 795 802 801 804 803
EU 575 652 707 664 655 632 631
Notes: Blank cells indicate no data were available.
Source: WHO Europe. Health for All Database (HFA-DB) http://data.euro.who.int/hfadb/ (Accessed June 2012).

British Heart Foundation and University of Oxford 99
Figure 3.6 Age-standardised coronary heart disease (CHD) hospital discharge rates per 100,000, selected countries 1980 to 2009
Hos
pit
al d
isch
arg
es p
er 1
00,0
00
1980
1981
1982
1983
1984
1985
1986
1987
1988
1989
1990
1991
1992
1993
1994
1995
1996
1997
1998
1999
2000
2001
2002
2003
2004
2005
2006
2007
2008
2009
A. United Kingdom B. Ukraine C. Latvia D. Greece E. Spain
0
200
400
600
800
1000
1200
1400
1600
1800
2000
A.
D.
E.
C.
B.

100 Coronary heart disease statistics 2012
Table 3.7Age-standardised stroke hospital discharge rates per 100,000, Europe 1970 to 2009
1970 1975 1980 1985 1990 1995 2000 2005 2006 2007 2008 2009
Albania 45 80 94 108 124 130 150
Andorra 117 106 107 84 94
Armenia 101 128 194 132 130 172 162 177 187 195
Austria 194 427 671 577 570 559 549
Azerbaijan 113 53 45 52 62 65 71 73
Belarus 569 896 1,063 1,092 1,143 1,154 1,163
Belgium 362 390 368 363 358
Bosnia and Herzegovina 131 119
Bulgaria 134 268 293 323 426 592 616 615 622 613
Croatia 233 297 281 411 409 437 426 411 410
Cyprus 116 131 143 89 140 120 126 157 120
Czech Republic 558 619 615 601 572 543 550
Denmark 430 394 452 384 373 364 356 358
Estonia 380 497 502 619 613 639 705 714
Finland 681 820 658 561 564 550
France 222 228 227 223 229
Georgia 192 54 74 98 102 132 142 149
Germany 487 462 497 506 513 526
Greece 117 190 230 256 274 330 404 448 464
Hungary 598 832 1,276 1,217 1,051 1,053
Iceland 244 237 207 180 149
Ireland 234 250 171 169 165 166 168
Israel 203 253 259 247 246 237 235
Italy 394 436 489 475 470 457 446
Kazakhstan 176 169 210 351 355 362 377 405
Kyrgyzstan 91 107 145 124 153 174 188 229 236
Latvia 282 383 445 542 638 795 838 852 838 692
Lithuania 408 512 671 780 839 826 816 874 859
Luxembourg 233 167 165 168
Malta 79 54 71 58 68 107
Montenegro 163 169 197 183 192 203 206
Netherlands 181 175 193 184 224 229 226 229
Norway 382 320 342 345 331 331 309
Poland 130 159 191 232 345 355 344 388
Portugal 287 336 327 308 305 310
Republic of Moldova 181 230 293 270 271 475 518 540 543 608
Romania 280 328 523 669 629 580 587
Russian Federation 370 458 595 760 769
Serbia 338 431 420 410 419 459
Slovakia 491 452 518 515 458 483 462
Slovenia 219 268 249 255 230 228 235 226 218 232
Spain 89 107 112 176 213 223 225 223 223
Sweden 613 617 446 417 410 397
Switzerland 207 218 211 220
Tajikistan 109 31 38 56 65 66 64 69
TFYR Macedonia 121 199 218 243 247 261
Turkey 27 50 71 106 148 152 96 100 100
Turkmenistan 82 132 145 153 183 192 209
Ukraine 244 358 486 467 540 770 798 828 859 862
United Kingdom 204 212 210 207 213 223
Uzbekistan 112 79 116 117 116 127 120
European Region 299 333 380 440 442 438 442 443
EU 304 342 367 393 399 389 392
Notes: Blank cells indicate no data were available
Source: WHO Europe. Health for All Database (HFA-DB) http://data.euro.who.int/hfadb/ (Accessed June 2012).

British Heart Foundation and University of Oxford 101
Figure 3.7 Age-standardised stroke hospital discharge rates per 100,000, Europe 1980 to 2009
Hos
pit
al d
isch
arg
es p
er 1
00,0
00
D. GreeceC. LatviaB. UkraineA. United Kingdom
1980
1981
1982
1983
1984
1985
1986
1987
1988
1989
1990
1991
1992
1993
1994
1995
1996
1997
1998
1999
2000
2001
2002
2003
2004
2005
2006
2007
2008
2009
E. Spain
0
100
200
300
400
500
600
700
800
900
1000
A. E.
D.
C.
B.

102 Coronary heart disease statistics 2012
Table 3.8Outcome at 4 weeks in people using National Health Service smoking cessation services, England, Scotland and Northern Ireland 1999/00 to 2010/11
1999/00 2000/01 2001/02 2002/03 2003/04 2004/05 2005/06 2006/07 2007/08 2008/09 2010/11
England
Total number setting a quit date
14,600 132,500 227,335 234,858 361,224 529,567 602,820 600,410 680,289 671,259 787,527
% Who had successfully quit at 4 week follow-up (self report)
39% 49% 53% 53% 57% 56% 55% 53% 52% 50% 49%
Scotland
Total number setting a quit date
44,019 50,121 79,672
% Who had successfully quit at 4 week follow-up (self report)
38% 38% 39%
Northern Ireland
Total number setting a quit date
7,369 8,702 13,795 21,476 23,383 34,386
% Who had successfully quit at 4 weekFollow-up (self report)
51% 47% 52% 51% 51% 52%
Notes: A client is counted as having successfully quit smoking at the 4 week follow-up if he/she has not smoked at all since two weeks after the quit date. ¶ Scottish data are based on calendar years.
Source: Health and Social Care Information Centre (2011) Statistics on NHS stop smoking services in England, April 2010 to March 2011. Information Centre: Leeds and previous editions. ¶ Galbraith L, Hecht G (2011) NHS smoking cessation service statistics (Scotland) 1st January to 31st December 2010. The Scottish Public Health Observatory: Edinburgh, and previous editions. ¶ Northern Ireland Statistics & Research Agency (2011) Statistics on smoking cessation services in Northern Ireland: 2010/11. Department of Health, Social Services and Public Safety: Belfast.

British Heart Foundation and University of Oxford 103
Table 3.9 Responses to emergency calls within eight minutes by ambulance service, England 2004/05 to 2010/11 and Scotland 2010/11
Emergency calls Emergency and urgent calls
2004/05 2005/06 2006/07 2007/08 2008/09 2010/11
% % % % % %
Ambulance service
North East 77.3 75.2 76.3 78.5 75.7 75.8
North West 76.7 74.3 72.7 75.6 74.3 73.6
Yorkshire 75.1 72.7 72.4 73.5 69.4 73.7
East Midlands 75.8 75.1 75.9 79.5 76.0 72.4
West Midlands 79.4 77.9 77.2 80.9 75.4 76.8
East of England 76.3 76.6 75.2 75.0 74.6 74.6
London 76.6 75.1 75.2 78.9 75.5 75.1
South East Coast 74.8 76.0 75.1 77.2 75.2 76.0
South Central 76.2 76.0 73.8 75.1 72.6 77.5
Great Western 72.7 74.0 72.8 72.2 68.4 74.3
South Western 75.7 75.9 74.1 78.9 78.0 76.9
Isle of Wight 77.2 75.7 78.0 81.7 77.0 77.3
England 76.2 75.3 74.6 77.1 74.3 74.9
Scotland 72.0
Notes:From 2007/08 urgent calls are included (previous years relate to emergency calls only). ¶ From 2008/09 the starting point for response time measurement was changed – comparisons with earlier years should be treated with caution. ¶ Response to life-threatening Category A emergencies across Scotland within 8 minutes
Source:Office for National Statistics(2011) Ambulance services, England:2010-11. Leeds: Information Centre. ¶ Working for you,Scottish Ambulance Service Annual Report and Accounts 2010/2011. NHS Scotland: Edinburgh.

104 Coronary heart disease statistics 2012
Table 3.10Thrombolytic treatment, use of aspirins, beta blockers and statins after a heart attack, England and Wales 2004/05 to 20010/11
2004/05 2005/06 2006/07 2007/08 2008/09 2009/10 2010/11
% % % % % % %
Percentage of patients having thrombolytic treatment within 30 mins of arrival at hospital
Target 75 75 75 75 75 75 75
England National Average 84 83 84 84 83 79 75
Wales National Average 70 74 70 67 73 67 62
Percentage of patients having thrombolytic treatment within 60 mins of calling for help
England
Target 58 68 68 68 68 68 68
National Average 54 58 64 71 72 69 68
Wales
Target 70 70
National Average 28 30 41 49 48 55 53
Aspirin Beta blockers Statins ACE inhibitorsClopidogrel/
Thienopyridine inhibitor
% % % % %
Percentage of patients discharged on secondary prevention medication 2010/1
Target 80 80 80 n/a n/a
England National Average 99 96 97 94 95
Wales National Average 98 95 95 91 92
Belfast Average 99 99 99 97 98
Notes: Data are from the MINAP project, based at the Royal College of Physicians. ¶ For more details of the project see www.rcplondon.ac.uk/index.asp No national targets for ACE inhibitors and Clopidogrel.
Source: Royal College of Physicians (2011) Myocardial Infarction National Audit Project. How the NHS manages heart attacks. Tenth public report 2011. UCL: London, and previous editions.

British Heart Foundation and University of Oxford 105
4. Behavioural risk factors

106 Coronary heart disease statistics 2012
4. Behavioural risk factors
This chapter reports on the prevalence of behavioural risk factors for coronary heart disease (CHD), including sections on smoking, poor diet, physical inactivity and alcohol consumption. Patterns in the prevalence of each of these risk factors by age, sex, socio-economic status, geographic region and ethnicity are explored. Prevalence rates in the United Kingdom are compared against rates found in other countries. Temporal trends in the prevalence of these risk factors are also reported.
SmokingSmoking increases the risk of CHD. The long-term risk of smoking to individuals has been demonstrated by a 50-year cohort study of British doctors. This study found that CHD mortality was around 60% higher in smokers (and 80% higher in heavy smokers) compared to non-smokers. After observing smokers and non-smokers over a 50 year period, the study concluded that “about half of all regular smokers will eventually be killed by their habit” 1.
In Great Britain, 20% of adults smoke cigarettes. The younger age groups tend to have a higher prevalence, with men aged 25 to 34 and women aged 20 to 24 having the highest prevalence of smoking. The lowest prevalence is found in those aged over 60 in both sexes. In Northern Ireland, smoking prevalence is at 24%, with the highest rates being found in those aged 20 to 34 in men and 20 to 24 in women. Smoking has been declining since the 1970s in both Great Britain and since the 1980s in Northern Ireland. All countries of the United Kingdom now have a ban on smoking in enclosed public places, whilst England, Wales and Northern Ireland also have a ban on the sale of cigarettes in vending machines. It is hoped that this will lead to reductions in the prevalence rate of smoking amongst young people (Tables 4.1 and 4.2, Figure 4.1).
There is little variation in smoking rates by region of England, however rates are marginally higher in the North compared to the South. Scotland and Wales both have the highest rates at 25%, although prevalence in Northern Ireland is 24%, higher than England with 20% (Table 4.3).
Smoking is socially patterned, with the prevalence lower in the professional groups compared to the routine and manual groups. In Great Britain in 2008, 28% of those in the routine and manual group smoked, compared to 20% in the intermediate group and 13% of those in the managerial and professional group. Similar results are found for both sexes in Great Britain. While there is an overall gradient of this kind in Northern Ireland, the trend across the social groups is not as smooth. The gradient in men is slightly steeper compared to women, with 9% of professional men and 4% of professional women smoking compared to 44% of unskilled men and 33% of semi-skilled women (Table 4.4, Figures 4.4a and 4.4b).
Smoking rates vary noticeably between ethnic groups in the UK. In 2004, 40% of Bangladeshi men smoked, compared to 21% of Black African and Chinese men.
With the exception of Black Caribbean women, the prevalence of smoking among the ethnic minority women was low, with only 2% of Bangladeshi women and 10% of Black African women smoking. For all minority ethnic groups the prevalence of men smoking was 20% or over, for women this only occurred in the Irish and Black Caribbean ethnic groups. Chewing tobacco is more common in the Bangladeshi community and 16% of Bangladeshi women consume tobacco in this way 2 (Table 4.5).
In 2010, 4% of boys and 6% of girls in England aged 11 to 15 regularly smoked cigarettes. The latest data from Wales, Scotland and Northern Ireland all show a higher prevalence of smoking in girls than in boys. Since the early 1980s, there has been a decline in smoking amongst young people in England, Scotland and Northern Ireland. In Wales the prevalence has remained the same in boys and increased in girls (Table 4.6).
Data from the World Health Organization’s (WHO) Global Burden of Disease study show that smoking prevalence in men in the UK is well below the average for the European region (26% compared to 45%). For women the prevalence is comparable. The most recent data from the WHO show that smoking prevalence for men ranges from 70% in the Russian Federation to 9% in Ethiopia. In women the prevalence ranges from 0.2% in Algeria to 54% in Nauru (Table 4.7).
Poor dietA poor diet increases the risk of chronic diseases, particularly CVD and cancer. Diet affects CVD in a variety of ways. An energy imbalance, where more energy is taken in than expended can result in weight gain and obesity. High saturated fat raises cholesterol levels, high salt intake can raise blood pressure, and low intakes of fibre, fruit and vegetables can lead to a greater susceptibility to CVD.

British Heart Foundation and University of Oxford 107
The National Food Survey, and more recently the Family Food Survey, allows us to examine trends in diet over time in Great Britain. Overall intake of calories, fat and saturated fat has decreased since the 1970s. This trend is accompanied by a decrease in sugar and salt intake, and an increase in fibre and fruit and vegetable intake (Table 4.8).
This change in pattern may in part be due to a change in the type of foods purchased. Since the 1940s purchase of lard has dramatically reduced whilst the amount of butter purchased has also dropped, with more reduced fat spreads being purchased. Similarly, the purchase of whole milk has gradually been replaced with skimmed milks, reducing total fat and saturated fat content of the diet (Table 4.9, Figures 4.9a, 4.9b and 4.9c).
The latest National Diet and Nutrition Survey provides an estimate of the quality of the diet for adults in Great Britain. The results suggest that in 2008-10, the percentage of food energy obtained from fat was within dietary recommendations; however targets for percentage of food energy coming from saturated fat and non-milk extrinsic sugars (NMES) were not being met. NMES include the sugar released from fruit when it is blended or juiced, table sugar, the sugar in products such as honey and sugars that are added to foods, as well as some of the sugars in canned, stewed, dried or preserved fruits. Average intake of fibre is also too low (at 14g per day compared to a recommendation of 18g per day), and that less than one third of both men and women currently consume the recommended five portions of fruit and vegetables a day (Table 4.10).
The best estimates of salt intake levels are provided by analysis of urine samples. In 2006, urinary analyses were conducted for samples of the adult population in all countries of Great Britain, although more recent data were collected for the UK (2008), Scotland (2009) and England (2011). Results suggest that average salt intake in all countries was above the target of 6g per day. Average consumption in men was between 9g per day in Wales (2006) and England (2011) and 10g per day in Scotland (2009). Consumption levels in women were lower but still over the recommended levels (Table 4.11).
Consumption of fat, saturated fat, and non-milk extrinsic sugars is fairly similar around the UK. There is minimal variation of fibre and fruit and vegetable consumption. Calorie (kcal) consumption does vary considerably, with people in the North and London consuming the least amount of calories. People in the South West consume the most. Although differences between UK countries are small, people in Wales consume the most calories, the most fat and saturated fat, as well as the most sugars. They also purchase more fruit and vegetables than people in other UK countries (Table 4.12).
The Family Food Survey provides consumption by income quintile. A gradient can be observed in the consumption of fat, saturated fat, total sugars and non-milk extrinsic sugars, with those in the lower income groups consuming more of these than those on a higher income. An opposite gradient is found with fruit and vegetables purchased, with those with a higher income buying more (Table 4.13 and Figure 4.13).
Differences in consumption by ethnic group are also apparent. In 2008, the White group had the highest intake of saturated fat, both absolutely and as a percentage of total energy (15%) they also consumed more calories per day than other ethnic groups. The lowest intake of saturated fat as a percentage of total energy was in the Black and Black British group, at 11%. Salt consumption also varied considerably, with Asian and Asian British consuming 3.5 grams and the White group consuming 3 grams more at 6.5g per day 3 (Table 4.14).
In 2010, the Health Survey for England estimated that 19% of boys and 20% of girls aged 5 to 15, were consuming 5 or more portions of fruit and vegetables a day – the recommended daily amount. This is compared to 11% for both groups in 2001 (Table 4.15).
Data from the WHO for 2007 show that the availability of fruit and vegetables was generally higher in Southern European countries, as compared to Northern, Western, Central and Eastern European countries. The proportion of energy available from fat varied widely, ranging from 16% in Azerbaijan to 42% in France and Spain. At 38% the proportion of energy available from fat in the UK was higher than the European average of 36% (Table 4.16).
Physical inactivityPeople who are physically active are at lower risk of CHD. To produce the maximum benefit, exercise needs to be regular and aerobic. This should involve the use of the major large muscle groups steadily and rhythmically, so the heart rate and breathing increase significantly.
Guidelines issued by the four Chief Medical Officers (CMOs) of England, Scotland, Wales and Northern Ireland in 2011, emphasise for the first time the importance of physical activity for people of all ages. The guidelines bring different aspects of physical activity together including a life course approach, the flexibility to combine moderate and vigorous intensity activities and reduce sedentary behaviour 4. The guidelines also highlight the importance of minimising the amount of time spent being sedentary.
The new CMOs’ guidelines on physical activity were published in July 2011. Currently available data were collected in reference to the previous guidelines published in 2004. These guidelines recommended 30 minutes of physical activity on at least five days a week for adults 5 and at least one hour of moderate intensity activity a day for children aged 5 to 18 years 6. Data presented in this publication, therefore, correspond to the 2004 guidelines rather than those from 2011.

108 Coronary heart disease statistics 2012
The percentage of individuals of both sexes meeting physical activity recommendations in England increased between 1997 and 2008. Small increases have also been found in Scotland between 1998 and 2010. These figures seem to have remained stable in Wales whereas a new survey in Northern Ireland suggests large increases between 2001 and 2010, although as comparing between surveys can be problematic these findings should be viewed with caution. Despite these increases, physical activity levels in the UK still remain relatively low. Men in Scotland exercise the most, with 45% exercising above the recommended levels. However in Wales the percentage meeting the recommended levels is 36%. The percentage of women meeting the recommended levels is lower in all UK countries, at 33% in Scotland and 23% in Wales. There is also a considerable difference by age, with those aged 65 consistently showing the lowest percentage of those achieving the recommended. The highest levels tend to be found in those aged under 45 (Tables 4.17 and 4.18).
The 2008 Health Survey for England had a focus on physical activity 7. Physical activity levels are normally self-reported, however for this report a sub-sample was selected to use accelerometers to objectively measure their physical activity levels. Based on the accelerometry data, only 6% of men and 4% women met the government’s recommended levels of physical activity in comparison to the self-reported levels of 39% for men and 29% for women, suggesting that physical activity levels are often over-reported. Accelerometers measure frequency, intensity and duration of physical activity, but are not waterproof and may not accurately record activities such as cycling or rowing. People were asked to wear the accelerometers while awake for seven consecutive days, but to take them off when swimming or showering. Due to issues of consent, eligibility, compliance and faults with the devices only 49% of men and 46% of women from the 4,507 adults selected to wear accelerometers provided sufficient data to be included in the analyses of daily average wear. Of the 1,707 children aged 4 to 15 selected 43% of boys and 47% of girls provided sufficient data6. Despite its limitations, self-report is the most commonly used method of assessment and is therefore still reported on in this chapter.
There is some variation in those meeting the recommended levels by region of England, although it is not marked. In men, the lowest percentage is found in the North East (33%) and the highest in South West (44%). For women, the lowest is in the West Midlands (25%) and the highest is in the South East Coast (34%) (Table 4.19).
The Health Survey for England 2008 shows a substantial difference in physical activity levels by equivalised household income quintile. There were a higher percentage of men and women meeting the recommended levels in the highest income quintiles compared to the lowest. The gradient is stronger in men with 42% compared to 31%, but 34% compared to 26% in women (Table 4.20).
The 2004 Health Survey for England had a focus on the health of ethnic minorities, it is the most recent to do so. Compared with the general population in 2004, Indian, Pakistani, Bangladeshi and Chinese men and women were less likely to meet physical activity recommendations. Of the men, Bangladeshi and Pakistani men had the lowest prevalence of meeting the recommendations (26% and 28%). This pattern was also true of the women from these groups, at 11% and 14% respectively. Irish men and Black Caribbean women had the highest prevalence of meeting the recommendations (Table 4.21).
Self-reported levels of physical activity in children vary by country of the UK. In Scotland for children aged 2 to 15, 75% of boys and 72% of girls reported meeting the recommended levels of activity. For the same age group in England however, only 32% of boys and 24% of girls did. While the percentage of boys meeting the recommendations shows a varying pattern by age in both England and Scotland, for girls in these countries there was a notable decrease after age 10. Results between countries are not directly comparable, however, due to the differences in data collection (Table 4.22).
European levels of exercising or playing sport (defined as exercising at least five times a week) range from 3% in Bulgaria to 23% in Ireland. The UK is among the higher levels in Europe (14%) and is above the EU average of 9% (Table 4.23 and Figure 4.23). Differences are also found between countries in the levels of exercise outside of sport, ranging from the highest prevalence of regular exercise in Latvia (44%) to Italy (7%). The UK is again amongst the higher levels with 37%, higher than the EU average of 27% (Table 4.24, Figure 4.24).
Alcohol consumptionWhile moderate alcohol consumption (one or two drinks a day) does not increase the risk of CVD, at high levels of intake – particularly in ‘binges’ – the risk of CVD is increased. The World Health Report 2002 estimated that 2% of CHD and almost 5% of stroke in men in developed countries was due to alcohol. However, the impact of alcohol consumption in women in developed countries was estimated to be positive – if no alcohol were consumed, there would have been a 3% increase in CHD and a 16% increase in stroke 8.
The most recent Government advice is that regular consumption of between three and four units a day for men, and between two and three units a day for women will not lead to significant health risk 9. Consuming over these levels is not advised. The benchmark for heavy drinking is set at more than eight units in one day for a man and more than six units in one day for a woman.
In Great Britain in 2010 more than a third of men (36%) and over a quarter of women (28%) regularly exceeded the Government’s recommended level of alcohol intake. Nineteen percent of men and 13% of women exceeded the Government definition of heavy drinking – in both instances the highest rate of alcohol consumption was found in the 25 to 44 age group (Table 4.25, Figure 4.25).

British Heart Foundation and University of Oxford 109
Since 1998 the General Household Survey has measured the prevalence of heavy drinking in Great Britain. Consistently over this time period, 16 to 24 year olds were the most likely group to drink heavily, and men were more likely than women to drink heavily. However, the prevalence of heavy drinking in 16 to 24 year olds has decreased over the last ten years and now men and women aged 22 to 64 are more likely to drink than the younger age group (Table 4.26, Figure 4.26).
The prevalence of drinking alcohol in people aged under 16 also seems to be in decline from a peak in the mid 1990s. In England, alcohol consumption in 11 to 15 year old boys fell from 27% in 1996 to only 13% in 2010, and from 26% to 13% in girls of the same age. A similar pattern is found in Scotland, where prevalence of alcohol consumption in 15 year old boys fell from 48% to 35% between 1996 and 2010, and from 46% to 34% in girls of the same age. Alcohol consumption levels in girls and boys of the same age seem to be higher in England than in Scotland (Tables 4.27 and 4.28).
Within Great Britain, there is considerable geographic variation in the prevalence of heavy drinking. For both men and women, the highest prevalence rates are found in the North of England, with 24% of men in the North West regularly drinking more than eight units on the heaviest drinking day in 2010, compared to only 15% in the East and West Midlands. For women, the lowest prevalence rate of heavy drinking (more than six units) was found in the West Midlands (8%) and the highest rate was found in the North West (18%). Between countries, Scotland had the highest prevalence of heavy drinking for both men and women (Table 4.29, Figures 4.29a and 4.29b).
The socioeconomic gradient in exceeding drinking recommendations and heavy drinking in Great Britain is contrary to patterns in other behavioural risk factors. In 2010, for both men and women, the highest rate of both heavy drinking and exceeding recommendations was found in the managerial and professional social class although gradients across socio-economic classification were greater for women than men. Sixteen percent of women in the managerial and professional social class exceeded six units on their heaviest drinking day compared to only 10% of women in the routine and manual social class. This gradient was even steeper for exceeding recommendations in alcohol consumption (Table 4.30, Figure 4.30).
The amount of alcohol consumed on a regular basis varies dramatically by ethnic group. Drinking any alcohol at all is rare in the Pakistani and Bangladeshi ethnic groups, and abstention from alcohol is far more common in the Indian, Black and Chinese ethnic groups than in the general population. In England in 2004, a quarter of men (25%) and 14% of women regularly drink heavily – levels are much lower for the Black Caribbean, Black African, Indian, Pakistani, Bangladeshi and Chinese ethnic groups. Only the Irish ethnic group had a higher prevalence rate for heavy drinking (Table 4.31).
In 2009, more people in the United Kingdom reported drinking heavily (34%) than the average level for the 27 member states of the European Union (29%). The highest reported rate was in Ireland (44%). In general, countries in Eastern Europe had lower reported rates than in the rest of Europe (e.g. Latvia 11%, Poland 19%) (Table 4.32).
1. Doll R, Peto R, Boreham J, Sutherland I (2004) Mortality in relation to smoking: 50 years’ observations on male British doctors. BMJ; 328: 1519-27.
2. Department of Health (2005) Health Survey for England 2004. The Health of Minority Ethnic Groups - headline tables. NHS Health and Social Care Information Centre.
3. This is likely to be an underestimate of salt consumption, as it does not include salt added during cooking or at the table.
4. Department of Health, Physical Activity, Health Improvement and Protection (2011). ‘Start active, stay active: a report on physical activity from the four home countries’ Chief Medical Officers: London.
5. Department of Health (2004). At least five a week: evidence on the impact of physical activity and its relationship to health. Department of Health: London.
6. Department of Health (2005) Choosing Activity: a physical activity action plan. Department of Health: London.
7. Department of Health (2010) Health Survey for England 2008. The Stationery Office: London.
8. World Health Organization (2002). The World Health Report 2002. Reducing Risks, Promoting Healthy Life. World Health Organization: Geneva.
9. Department of Health (1995) Sensible drinking. The report of an inter-departmental working group. Department of Health: London. See also www.nhs.uk/LiveWell/Alcohol (accessed June 2010).

110 Coronary heart disease statistics 2012
Table 4.1 Cigarette smoking in adults, by sex and age, Great Britain 1972 to 2010
1972 1974 1976 1978 1980 1982 1984 1986 1988 1990 1992 1994
% % % % % % % % % % % %
Men
16-19 43 42 39 35 32 31 29 30 28 28 29 28
20-24 55 52 47 45 44 41 40 41 37 38 39 40
25-34 56 56 48 48 47 40 40 37 37 36 34 34
35-49 55 55 50 48 45 40 39 37 37 34 32 31
50-59 54 53 49 48 47 42 39 35 33 28 28 27
60+ 47 44 40 38 36 33 30 29 26 24 21 18
All ages 52 51 46 45 42 38 36 35 33 31 29 28
Unweighted base 10,351 9,852 10,888 10,480 10,454 9,199 8,417 8,874 8,673 8,106 8,417 7,642
Women
16-19 39 38 34 33 32 30 32 30 28 32 25 27
20-24 48 44 45 43 40 40 36 38 37 39 37 38
25-34 49 46 43 42 44 37 36 35 35 34 34 30
35-49 48 49 45 43 43 38 36 34 35 33 30 28
50-59 47 48 46 42 44 40 39 35 34 29 29 26
60+ 25 26 24 24 24 23 23 22 21 20 19 17
All ages 41 41 38 37 37 33 32 31 30 29 28 26
Unweighted base 12,143 11,480 12,554 12,156 12,100 10,641 9,788 10,304 10,122 9,445 9,764 9,108
Total
16-19 41 40 37 34 32 30 31 30 28 30 27 27
20-24 51 48 46 44 42 40 38 39 37 38 38 39
25-34 52 51 46 45 45 38 38 36 36 35 34 32
35-49 51 52 47 45 44 39 37 36 36 34 31 30
50-59 50 51 47 45 45 41 39 35 33 29 29 27
60+ 34 34 31 30 29 27 26 25 23 21 20 17
All ages 46 45 42 40 39 35 34 33 32 30 28 27
Unweighted base 22,494 21,332 23,442 22,636 22,554 19,840 18,205 19,178 18,795 17,551 18,181 16,750
Notes: From 2000 data are weighted for non-response. ¶ Pre-2000 data are unweighted. ¶ The effect of weighting on smoking data appears slight: it increased the overall prevalence of smoking in 2000 by one percentage point, from 26% to 27%.
Source: Office for National Statistics (2012) General Lifestyle Survey 2010. Results published online at http://www.ons.gov.uk/ons/rel/ghs/general-lifestyle-survey/2010/index.html (accessed May 2012).

British Heart Foundation and University of Oxford 111
1996 1998 2000 2001 2002 2003 2004 2005 2006 2007 2008 2009 2010
% % % % % % % % % % % % %
26 30 30 25 22 27 23 23 20 22 18 24 20
43 42 35 40 37 38 36 34 33 32 29 24 25
38 37 39 38 36 38 35 34 33 29 30 27 28
30 32 31 31 29 32 31 29 26 25 24 26 25
28 27 27 26 27 26 26 25 23 22 23 22 21
18 16 16 16 17 16 15 14 13 13 13 15 13
29 28 29 28 27 28 26 25 23 22 22 22 21
7,172 6,579 6,593 7,055 6,837 8,097 6,868 10,038 7,677 7,240 6,700 6,160 6,080
32 31 28 31 29 25 25 26 20 20 26 24 17
36 39 35 35 38 34 29 30 29 30 31 28 29
34 33 32 31 33 31 28 29 26 23 25 24 25
30 28 27 28 27 28 28 26 25 23 23 23 23
26 27 28 25 24 23 22 23 22 21 20 20 20
19 16 15 17 14 14 14 13 12 12 12 13 13
28 26 25 26 25 24 23 23 21 20 21 20 20
8,501 7,830 7,496 8,299 7,951 9,327 8,029 11,627 9,005 8,380 7,930 7,290 7,210
29 31 29 28 25 26 24 24 20 21 22 24 19
39 40 35 37 38 36 32 32 31 31 30 26 27
36 35 35 34 34 34 31 31 30 26 27 25 26
30 30 29 29 28 30 29 27 25 24 24 25 24
27 27 27 26 26 25 24 24 22 21 22 21 20
18 16 16 17 15 15 14 14 12 12 13 14 13
28 27 27 27 26 26 25 24 22 21 21 21 20
15,673 14,409 14,089 15,354 14,788 17,424 14,897 21,665 16,682 15,620 14,630 13,450 13,290

112 Coronary heart disease statistics 2012
Figure 4.1 Prevalence of smoking in adults, by sex, Great Britain 1972 to 2010
Prev
alen
ce (%
)
Men Women
1972
1974
1976
1978
1980
1982
1984
1986
1988
1990
1992
1994
1996
1998
2000
2001
2002
2003
2004
2005
2006
2007
2008
2009
2010
0
10
20
30
40
50
60

British Heart Foundation and University of Oxford 113
Table 4.2 Prevalence of cigarette smoking in adults, by sex and age, Northern Ireland 1983 to 2009-10
1983 1990-91 1992-93 1994-95 1996-97 1998-99 2000-01 2002-03 2004-05 2006-07 2007-08 2008-09 2009-10
% % % % % % % % % % % % %
Men
16-19 31 24 24 20 23 15 23 33 19 13 18 17 [11]
20-24 46 39 40 37 39 36 26 32 32 37 20 52 36
25-34 42 40 34 34 39 37 30 32 37 38 33 38 38
35-49 45 38 34 32 34 30 33 26 33 29 32 27 26
50-59 41 34 32 30 33 29 26 27 29 28 25 25 24
60+ 30 24 23 22 21 20 16 18 16 13 12 16 15
All ages 39 33 31 29 31 28 26 27 27 25 23 26 24
Base 2,498 2,629 2,475 2,323 2,074 1,916 1,811 2,454 1,710 1,500 1,465 1,296 1,491
Women
16-19 19 27 24 27 23 24 27 28 19 31 [12] 13 27
20-24 39 31 32 35 30 39 34 35 38 33 35 34 41
25-34 41 40 33 35 37 37 34 33 34 30 29 28 31
35-49 33 37 36 32 32 35 32 29 30 30 28 27 28
50-59 32 31 27 25 24 28 26 28 25 27 24 26 24
60+ 16 21 20 17 17 17 17 13 13 15 13 13 13
All ages 29 31 29 27 27 29 28 26 25 26 23 23 24
Base 3,077 3,216 3,097 3,059 2,727 2,654 2,591 2,722 2,328 2,175 1,938 1,855 2,088
Total
16-19 25 26 24 24 23 20 26 31 19 24 15 15 21
20-24 42 34 35 36 34 38 31 33 35 35 29 40 39
25-34 42 40 33 35 37 37 33 32 35 33 31 32 34
35-49 39 37 35 32 33 33 32 27 31 30 30 27 27
50-59 36 32 30 27 28 28 26 27 27 28 24 26 24
60+ 22 22 21 19 19 18 17 16 15 14 13 14 14
All ages 33 32 30 28 29 29 27 26 26 25 23 24 24
Base 5,575 5,845 5,572 5,382 4,801 4,570 4,402 5,176 4,038 3,675 3,403 3,151 3,579
Notes:Where the base is >50 percentages are shown in square brackets.
Source:Northern Ireland Statistics and Research Agency (2011). Continuous Household Survey 2009/10. NISRA: Belfast.

114 Coronary heart disease statistics 2012
Table 4.3 Prevalence of cigarette smoking in adults, by sex and region, United Kingdom 2010
Men Women Total
% % %
England 20 19 20
North East 17 25 21
North West 23 22 22
Yorkshire and the Humber 24 22 23
East Midlands 15 17 16
West Midlands 21 21 21
East of England 20 17 19
London 19 16 17
South East 21 18 19
South West 18 17 17
Wales 24 25 25
Scotland 25 24 25
Northern Ireland 24 24 24
Base
England 5,130 6,140 11,270
North East 250 340 600
North West 750 870 1,620
Yorkshire and the Humber 610 740 1,350
East Midlands 470 570 1,040
West Midlands 570 680 1,260
East of England 650 740 1,380
London 510 600 1,110
South East 800 950 1,760
South West 510 650 1,170
Wales 390 390 740
Scotland 590 720 1,270
Northern Ireland 1,491 2,088 3,579
Notes: Data are for adults aged 16 and over.
Source: Office for National Statistics (2011). General Lifestyle Survey 2010. Results published online at http://www.ons.gov.uk/ons/rel/ghs/general-lifestyle-survey/2010/index.html (Accessed May 2010). ¶ Northern Ireland Statistics and Research Agency (2011). Continuous Household Survey 2009/10. NISRA: Belfast,

British Heart Foundation and University of Oxford 115
Table 4.4Prevalence of cigarette smoking in adults, by sex and socioeconomic status, Great Britain and Northern Ireland 2010
Men Women Total
% % %
Great Britain
Managerial and professional 14 12 13
Intermediate 20 20 20
Routine and manual 29 28 28
Total 21 20 20
Northern Ireland
Professional 9 4 7
Employer, manager 16 13 15
Intermediate non-manual 23 15 18
Junior non manual 16 24 23
Skilled manual 26 25 26
Semi-skilled manual 36 33 34
Unskilled manual 44 31 36
No SEG, ref etc,armed forces 20 23 22
Total 24 24 24
Bases
Great Britain
Managerial and professional 2,670 2,940 5,600
Intermediate 1,040 1,340 3,870
Routine and manual 2,150 2,580 3,240
Total 6,060 7,160 13,220
Northern Ireland
Professional 108 54 162
Employer, manager 192 121 313
Intermediate non-manual 214 419 633
Junior non manual 140 535 675
Skilled manual 499 166 665
Semi-skilled manual 163 473 636
Unskilled manual 82 128 210
No SEG, ref etc,armed forces 93 192 285
Total 1,491 2,088 3,579
Notes:Adults aged 16 and over. ¶ Great Britain: Respondents whose household reference person was a full time student, had an inadequately described occupation, had never worked or was long-term unemployed are not shown as separate categories but are included in the total. ¶ Socio-economic classification is based on the current or last job of the household reference person. ¶ Northern Ireland: SEG refers to socio-economic group.
Source:Office for National Statistics (2011). General Lifestyle Survey 2010. Results published online at http://www.ons.gov.uk/ons/rel/ghs/general-lifestyle-survey/2010/index.html (Accessed May 2010). ¶ Northern Ireland Statistics and Research Agency (2011). Continuous Household Survey 2009/10. NISRA: Belfast.

116 Coronary heart disease statistics 2012
Figure 4.4a Smoking prevalence, by sex and socioeconomic group, Great Britain 2010
Prev
alen
ce (%
)
WomenMen
Managerial and professional Intermediate Routine and manual
0
5
10
15
20
25
30
35

British Heart Foundation and University of Oxford 117
Figure 4.4b Smoking prevalence, by sex and socioeconomic group, Northern Ireland 2010
Prev
alen
ce (%
)
WomenMen
A. B. C. D. E. F. G. H.
0
5
10
15
20
25
30
35
40
45
50
A. ProfessionalB. Employer, managerC. Intermediate non-manualD. Junior non manualE. Skilled manualF. Semi-skilled manualG. Unskilled manualH. No SEG, ref etc, armed forces

118 Coronary heart disease statistics 2012
Table 4.5 Cigarette smoking in adults, by sex, age and ethnic group, England 2004
Men Women
All ages 16-34 35-54 55+ All ages 16-34 35-54 55+
% % % % % % % %
Black Caribbean 25 27 34 12 24 44 21 5
Black African 21 21 20 25 10 15 6 2
Indian 20 18 22 19 5 8 4 3
Pakistani 29 28 34 18 5 5 7
Bangladeshi 40 35 49 29 2 1 4 3
Chinese 21 25 21 9 8 12 5 4
Irish 30 46 26 25 26 35 26 21
General population 24 32 26 14 23 28 26 15
Bases
Black Caribbean 403 114 165 124 637 186 289 162
Black African 379 172 169 38 457 224 189 44
Indian 547 199 230 118 630 237 274 119
Pakistani 423 213 145 65 497 268 164 65
Bangladeshi 396 198 149 49 453 287 117 49
Chinese 345 170 117 58 372 145 176 51
Irish 496 114 194 188 653 147 275 231
General population 2,855 721 973 1,161 3,805 895 1,374 1,536
Notes:General population refers to the whole population of England, regardless of ethnicity. ¶ Blank cells indicate too few respondents for accurate estimate.
Source:Joint Health Surveys Unit (2005) Health Survey for England 2004. The Health of Minority Ethnic Groups. ¶ The Information Centre: Leeds. Copyright © 2010, Re-used with the permission of The Health and Social Care Information Centre. All rights reserved.

British Heart Foundation and University of Oxford 119
Table 4.6 Regular cigarette smoking in young people aged 11 to 15, by sex, England, Scotland, Wales and Northern Ireland 1982 to 2010
1982
1983
1984
1986
1988
1990
1992
1994
1996
1998
1999
2000
2001
2002
2003
2004
2005
2006
2007
2008
2009
2010
% % % % % % % % % % % % % % % % % % % % % %
Boys
England 11 13 7 7 9 9 10 11 9 8 9 8 9 7 7 7 7 5 5 5 4
Wales 9 8 8 10 8 12 10 10 8 9
Scotland 15 16 10 11 10 11 14 11 10 11 9 8 9 7
Northern Ireland 14 13 12 11 9 5 7
Girls
England 11 13 12 9 11 10 13 15 12 10 12 11 11 11 10 10 10 8 8 7 6
Wales 12 11 12 13 13 16 17 16 14 13
Scotland 14 17 14 12 13 13 14 13 16 16 16 11 10 9
Northern Ireland 12 9 13 14 13 10 6
Notes: In Scotland, rates are for children aged 12-15 up to 1999, and aged 13-15 from 2000. ¶ From 2000 onwards, Northern Ireland data is taken from the Young Persons Behaviour & Attitudes Survey (school based survey of pupils in Years 8 to 12). ¶ Regular smokers are those pupils that report smoking cigarettes everyday or at least once a week.
Sources: Department of Health (2011) Smoking, drinking and drug use among young people in England in 2010. The Information Centre: Leeds. Copyright © 2010, Re-used with the permission of The Health and Social Care Information Centre. All rights reserved. ¶ National Assembly for Wales, Statistics for Wales: personal communication. ¶ National Centre for Social Research and the National Foundation for Educational Research (2001). ¶ Smoking, drinking & drug use among young people in Scotland in 2000. The Stationery Office: Edinburgh. Office for National Statistics (2011) Scottish schools adolescent lifestyle and substance use survey (SALSUS) national report. ¶ Smoking, drinking and drug use among 13 and 15 year olds in Scotland in 2010. NHS Scotland: Edinburgh. ¶ Department of Health and Social Security Northern Ireland (1991) Smoking and Drinking Amongst 11-15 year olds in Northern Ireland in 1990. ¶ DHSS NI: Belfast Northern Ireland Statistics and Research Agency (2002) Young Person’s Behaviour and Attitudes Survey. Personal communication NISRA 2010.

120 Coronary heart disease statistics 2012
Table 4.7Current tobacco use, by sex, all available countries the World 2009
WHO member states Men Women
% %
African Region 17 3
Benin 15 1
Burkina Faso 18 8
Cameroon 14 2
Cape Verde 14 3
Chad 22 3
Comoros 24 9
Congo 10 <1
Côte d’Ivoire 17 4
DR of Congo 10 2
Eritrea 10 2
Ethiopia 8 <1
Gabon 19 3
Gambia 31 3
Ghana 11 3
Guinea 25 2
Kenya 26 1
Liberia 14
Malawi 26 4
Mali 28 2
Mauritania 29 4
Mauritius 31 2
Mozambique 18 2
Namibia 30 9
Niger 9 <1
Nigeria 10 3
Sao Tome and Principe 9 2
Senegal 16 <1
Seychelles 24 5
Sierra Leone 39 8
South Africa 24 8
Swaziland 16 2
Uganda 16 3
Tanzania 21 3
Zambia 24 4
Zimbabwe 30 4
Region of the Americas 26 16
Argentina 32 22
Barbados 13 1
Belize 23 3

British Heart Foundation and University of Oxford 121
Bolivia 42 18
Brazil 22 13
Canada 24 17
Chile 38 33
Costa Rica 24 8
Cuba 11 4
Dominican Republic 17 13
Guatemala 22 4
Guyana 27 6
Honduras 3
Mexico 24 8
Paraguay 30 14
Peru 9
Saint Kitts and Nevis 12 2
Saint Lucia 28 12
Saint Vincent and the Grenadines 18 6
Trinidad and Tobago 27 11
United States of America 33 25
Uruguay 31 22
South-East Asia Region 33 4
Bangladesh 46 2
India 26 4
Indonesia 61 5
Maldives 43 11
Myanmar 40 8
Nepal 36 29
Sri Lanka 27 <1
Thailand 45 3
Western Pacific Region 51 4
Australia 22 19
Brunei Darussalam 32 4
Cambodia 42 3
China 51 2
Cook Islands 43 31
Fiji 18 3
Japan 42 12
Kiribati 71 43
Laos 51 4
Malaysia 50 2
Marshall Islands 36 7
Micronesia 30 18
Mongolia 48 6
WHO member states Men Women
% %

122 Coronary heart disease statistics 2012
Nauru 49 50
New Zealand 27 24
Palau 37 9
Papua New Guinea 58 31
Philippines 47 10
Republic of Korea 49 7
Samoa 58 23
Singapore 35 6
Solomon Islands 46 19
Tonga 44 13
Tuvalu 51 20
Vanuatu 43 8
Viet Nam 48 2
European Region 41 22
Albania 60 19
Andorra 38 32
Armenia 51 2
Austria 47 45
Azerbaijan 41
Belarus 49 9
Belgium 30 22
Bosnia and Herzegovina 47 36
Czech Republic 43 31
Denmark 30 28
Estonia 46 23
Finland 28 22
France 36 27
Georgia 57 6
Germany 33 25
Greece 63 41
Hungary 43 33
Iceland 27 21
Israel 29 13
Italy 33 19
Kazakhstan 40 9
Kyrgyzstan 45 2
Latvia 50 22
Lithuania 50 22
Malta 30 21
Netherlands 31 26
Norway 31 28
Poland 36 25
WHO member states Men Women
% %

British Heart Foundation and University of Oxford 123
Portugal 32 16
Republic of Moldova 43 5
Romania 46 24
Russian Federation 59 24
Serbia 38 27
Slovakia 39 19
Slovenia 30 22
Spain 36 27
Switzerland 31 21
Turkey 47 15
Ukraine 50 13
United Kingdom 25 23
Uzbekistan 22 3
Eastern Mediterranean Region 30 5
Bahrain 34 8
Egypt 40 <1
Iran 26 2
Iraq 31 4
Jordan 47 6
Kuwait 35 4
Lebanon 46 31
Libya 47 <1
Morocco 33 2
Oman 12 <1
Pakistan 34 6
Saudi Arabia 24 1
Sudan 24 2
Syrian Arab Republic 42
Tunisia 58 5
United Arab Emirates 19 2
Yemen 35 11
Global 36 8
Notes:Tobacco smoking includes cigarettes, cigars, pipes or any other smoked tobacco products. ¶ Current smoking includes both daily and non-daily or occasional smoking. ¶ Smoking prevalence data are sourced from surveys conducted in countries in different years. ¶ To obtain smoking prevalence estimates for 2006, trend information is used either to project into the future for countries with data older than 2006 or to backtrack for countries with data later than 2006. ¶ This is achieved by incorporating trend information from all available surveys for each country. ¶ For countries without historical data, trend information from the respective sub-region in which they fall is used. ¶ Prevalence is age-standardised to the WHO standard population.
Source:World Health Organization. Global Health Observatory http://apps.who.int/ghodata/# (Accessed August 2012). World Health Organization (2012) World Health Statistics 2012. Geneva: Switzerland.
WHO member states Men Women
% %
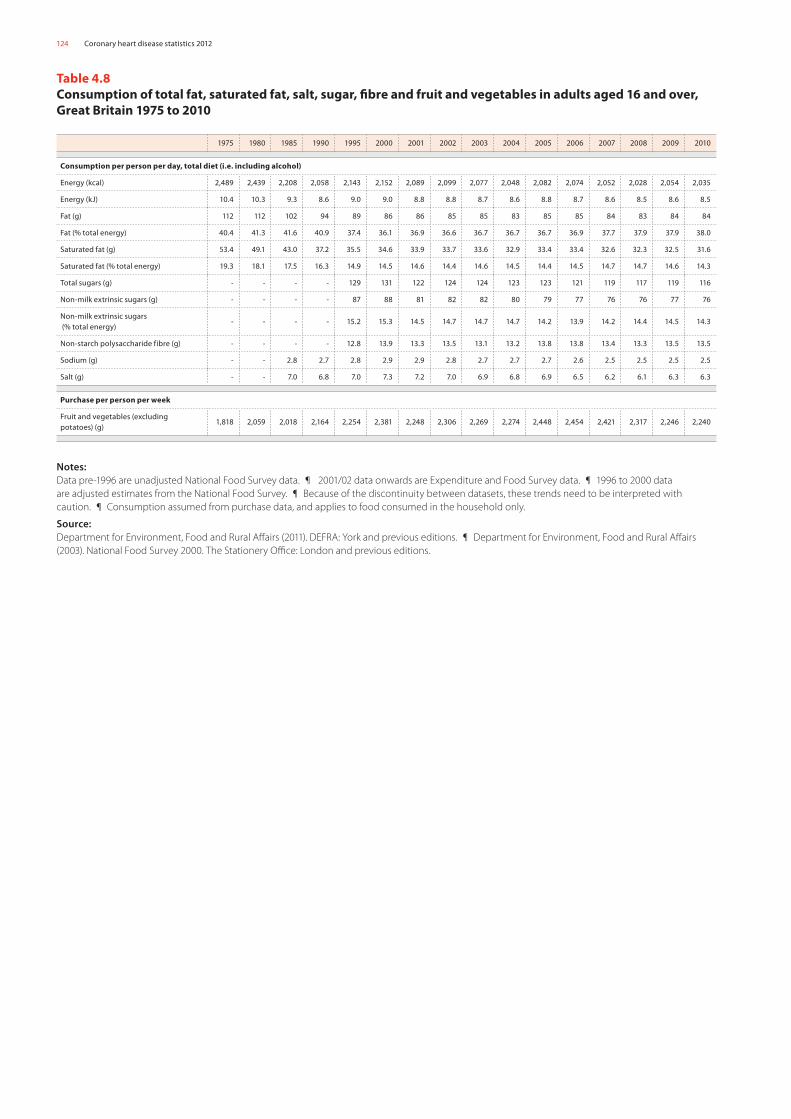
124 Coronary heart disease statistics 2012
Table 4.8Consumption of total fat, saturated fat, salt, sugar, fibre and fruit and vegetables in adults aged 16 and over, Great Britain 1975 to 2010
1975 1980 1985 1990 1995 2000 2001 2002 2003 2004 2005 2006 2007 2008 2009 2010
Consumption per person per day, total diet (i.e. including alcohol)
Energy (kcal) 2,489 2,439 2,208 2,058 2,143 2,152 2,089 2,099 2,077 2,048 2,082 2,074 2,052 2,028 2,054 2,035
Energy (kJ) 10.4 10.3 9.3 8.6 9.0 9.0 8.8 8.8 8.7 8.6 8.8 8.7 8.6 8.5 8.6 8.5
Fat (g) 112 112 102 94 89 86 86 85 85 83 85 85 84 83 84 84
Fat (% total energy) 40.4 41.3 41.6 40.9 37.4 36.1 36.9 36.6 36.7 36.7 36.7 36.9 37.7 37.9 37.9 38.0
Saturated fat (g) 53.4 49.1 43.0 37.2 35.5 34.6 33.9 33.7 33.6 32.9 33.4 33.4 32.6 32.3 32.5 31.6
Saturated fat (% total energy) 19.3 18.1 17.5 16.3 14.9 14.5 14.6 14.4 14.6 14.5 14.4 14.5 14.7 14.7 14.6 14.3
Total sugars (g) - - - - 129 131 122 124 124 123 123 121 119 117 119 116
Non-milk extrinsic sugars (g) - - - - 87 88 81 82 82 80 79 77 76 76 77 76
Non-milk extrinsic sugars (% total energy)
- - - - 15.2 15.3 14.5 14.7 14.7 14.7 14.2 13.9 14.2 14.4 14.5 14.3
Non-starch polysaccharide fibre (g) - - - - 12.8 13.9 13.3 13.5 13.1 13.2 13.8 13.8 13.4 13.3 13.5 13.5
Sodium (g) - - 2.8 2.7 2.8 2.9 2.9 2.8 2.7 2.7 2.7 2.6 2.5 2.5 2.5 2.5
Salt (g) - - 7.0 6.8 7.0 7.3 7.2 7.0 6.9 6.8 6.9 6.5 6.2 6.1 6.3 6.3
Purchase per person per week
Fruit and vegetables (excluding potatoes) (g)
1,818 2,059 2,018 2,164 2,254 2,381 2,248 2,306 2,269 2,274 2,448 2,454 2,421 2,317 2,246 2,240
Notes: Data pre-1996 are unadjusted National Food Survey data. ¶ 2001/02 data onwards are Expenditure and Food Survey data. ¶ 1996 to 2000 data are adjusted estimates from the National Food Survey. ¶ Because of the discontinuity between datasets, these trends need to be interpreted with caution. ¶ Consumption assumed from purchase data, and applies to food consumed in the household only.
Source:Department for Environment, Food and Rural Affairs (2011). DEFRA: York and previous editions. ¶ Department for Environment, Food and Rural Affairs (2003). National Food Survey 2000. The Stationery Office: London and previous editions.
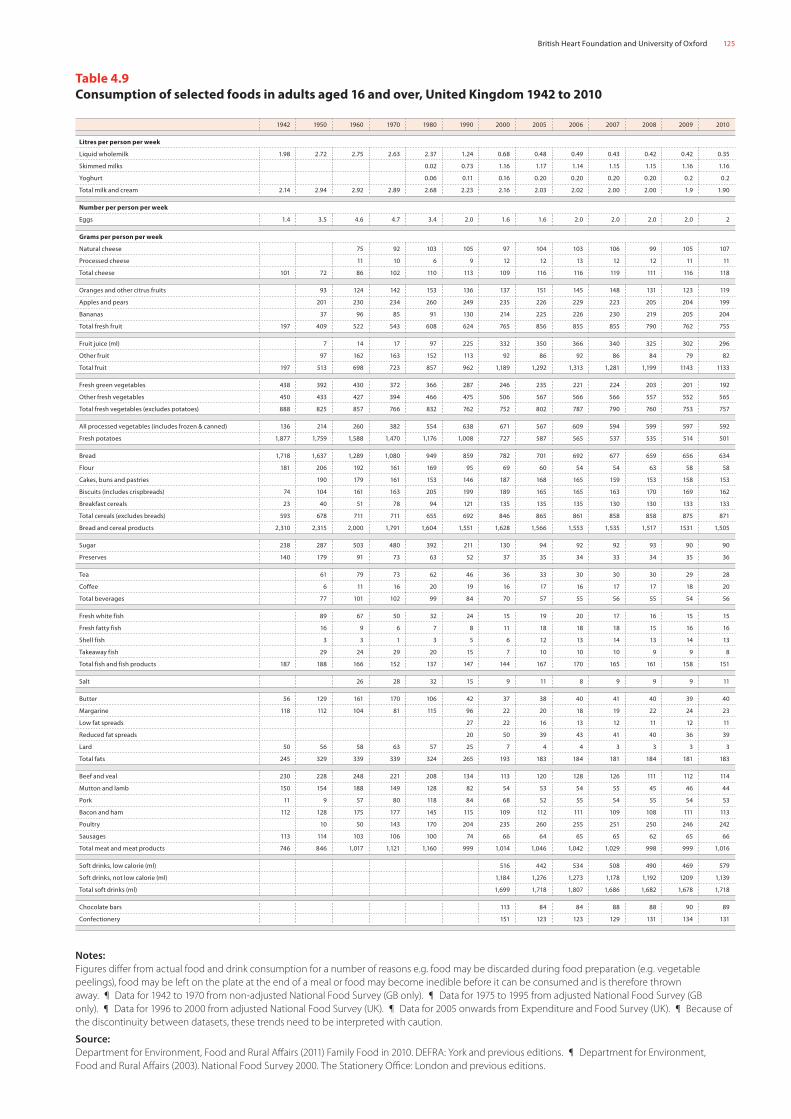
British Heart Foundation and University of Oxford 125
Table 4.9 Consumption of selected foods in adults aged 16 and over, United Kingdom 1942 to 2010
1942 1950 1960 1970 1980 1990 2000 2005 2006 2007 2008 2009 2010
Litres per person per week
Liquid wholemilk 1.98 2.72 2.75 2.63 2.37 1.24 0.68 0.48 0.49 0.43 0.42 0.42 0.35
Skimmed milks 0.02 0.73 1.16 1.17 1.14 1.15 1.15 1.16 1.16
Yoghurt 0.06 0.11 0.16 0.20 0.20 0.20 0.20 0.2 0.2
Total milk and cream 2.14 2.94 2.92 2.89 2.68 2.23 2.16 2.03 2.02 2.00 2.00 1.9 1.90
Number per person per week
Eggs 1.4 3.5 4.6 4.7 3.4 2.0 1.6 1.6 2.0 2.0 2.0 2.0 2
Grams per person per week
Natural cheese 75 92 103 105 97 104 103 106 99 105 107
Processed cheese 11 10 6 9 12 12 13 12 12 11 11
Total cheese 101 72 86 102 110 113 109 116 116 119 111 116 118
Oranges and other citrus fruits 93 124 142 153 136 137 151 145 148 131 123 119
Apples and pears 201 230 234 260 249 235 226 229 223 205 204 199
Bananas 37 96 85 91 130 214 225 226 230 219 205 204
Total fresh fruit 197 409 522 543 608 624 765 856 855 855 790 762 755
Fruit juice (ml) 7 14 17 97 225 332 350 366 340 325 302 296
Other fruit 97 162 163 152 113 92 86 92 86 84 79 82
Total fruit 197 513 698 723 857 962 1,189 1,292 1,313 1,281 1,199 1143 1133
Fresh green vegetables 438 392 430 372 366 287 246 235 221 224 203 201 192
Other fresh vegetables 450 433 427 394 466 475 506 567 566 566 557 552 565
Total fresh vegetables (excludes potatoes) 888 825 857 766 832 762 752 802 787 790 760 753 757
All processed vegetables (includes frozen & canned) 136 214 260 382 554 638 671 567 609 594 599 597 592
Fresh potatoes 1,877 1,759 1,588 1,470 1,176 1,008 727 587 565 537 535 514 501
Bread 1,718 1,637 1,289 1,080 949 859 782 701 692 677 659 656 634
Flour 181 206 192 161 169 95 69 60 54 54 63 58 58
Cakes, buns and pastries 190 179 161 153 146 187 168 165 159 153 158 153
Biscuits (includes crispbreads) 74 104 161 163 205 199 189 165 165 163 170 169 162
Breakfast cereals 23 40 51 78 94 121 135 135 135 130 130 133 133
Total cereals (excludes breads) 593 678 711 711 655 692 846 865 861 858 858 875 871
Bread and cereal products 2,310 2,315 2,000 1,791 1,604 1,551 1,628 1,566 1,553 1,535 1,517 1531 1,505
Sugar 238 287 503 480 392 211 130 94 92 92 93 90 90
Preserves 140 179 91 73 63 52 37 35 34 33 34 35 36
Tea 61 79 73 62 46 36 33 30 30 30 29 28
Coffee 6 11 16 20 19 16 17 16 17 17 18 20
Total beverages 77 101 102 99 84 70 57 55 56 55 54 56
Fresh white fish 89 67 50 32 24 15 19 20 17 16 15 15
Fresh fatty fish 16 9 6 7 8 11 18 18 18 15 16 16
Shell fish 3 3 1 3 5 6 12 13 14 13 14 13
Takeaway fish 29 24 29 20 15 7 10 10 10 9 9 8
Total fish and fish products 187 188 166 152 137 147 144 167 170 165 161 158 151
Salt 26 28 32 15 9 11 8 9 9 9 11
Butter 56 129 161 170 106 42 37 38 40 41 40 39 40
Margarine 118 112 104 81 115 96 22 20 18 19 22 24 23
Low fat spreads 27 22 16 13 12 11 12 11
Reduced fat spreads 20 50 39 43 41 40 36 39
Lard 50 56 58 63 57 25 7 4 4 3 3 3 3
Total fats 245 329 339 339 324 265 193 183 184 181 184 181 183
Beef and veal 230 228 248 221 208 134 113 120 128 126 111 112 114
Mutton and lamb 150 154 188 149 128 82 54 53 54 55 45 46 44
Pork 11 9 57 80 118 84 68 52 55 54 55 54 53
Bacon and ham 112 128 175 177 145 115 109 112 111 109 108 111 113
Poultry 10 50 143 170 204 235 260 255 251 250 246 242
Sausages 113 114 103 106 100 74 66 64 65 65 62 65 66
Total meat and meat products 746 846 1,017 1,121 1,160 999 1,014 1,046 1,042 1,029 998 999 1,016
Soft drinks, low calorie (ml) 516 442 534 508 490 469 579
Soft drinks, not low calorie (ml) 1,184 1,276 1,273 1,178 1,192 1209 1,139
Total soft drinks (ml) 1,699 1,718 1,807 1,686 1,682 1,678 1,718
Chocolate bars 113 84 84 88 88 90 89
Confectionery 151 123 123 129 131 134 131
Notes:Figures differ from actual food and drink consumption for a number of reasons e.g. food may be discarded during food preparation (e.g. vegetable peelings), food may be left on the plate at the end of a meal or food may become inedible before it can be consumed and is therefore thrown away. ¶ Data for 1942 to 1970 from non-adjusted National Food Survey (GB only). ¶ Data for 1975 to 1995 from adjusted National Food Survey (GB only). ¶ Data for 1996 to 2000 from adjusted National Food Survey (UK). ¶ Data for 2005 onwards from Expenditure and Food Survey (UK). ¶ Because of the discontinuity between datasets, these trends need to be interpreted with caution.
Source: Department for Environment, Food and Rural Affairs (2011) Family Food in 2010. DEFRA: York and previous editions. ¶ Department for Environment, Food and Rural Affairs (2003). National Food Survey 2000. The Stationery Office: London and previous editions.

126 Coronary heart disease statistics 2012
Figure 4.9a Consumption of fats in adults aged 16 and over, United Kingdom 1942 to 2010
Figure 4.9b Consumption of milk and milk products in adults aged 16 and over, United Kingdom 1942 to 2010
1942
1945
1950
1955
1960
1965
1970
1975
1980
1985
1990
1995
2000
2005
2010
Con
sum
pti
on p
er p
erso
n p
er w
eek
(g)
MargarineButterLow and reduced fat spreadsTotal fats
0
50
100
150
200
250
300
350
40019
42
1945
1950
1955
1960
1965
1970
1975
1980
1985
1990
1995
2000
2005
2010
Con
sum
pti
on p
er p
erso
n p
er w
eek
(litr
es)
Liquid wholemilkSkimmed milksTotal milk and cream
0.0
0.5
1.0
1.5
2.0
2.5
3.0
3.5

British Heart Foundation and University of Oxford 127
Figure 4.9c Consumption of fresh fruit and vegetables in adults aged 16 and over, United Kingdom 1942 to 2010
Con
sum
pti
on p
er p
erso
n p
er w
eek
(g)
Fruit juiceTotal fresh fruitTotal fresh vegetables (excludes potatoes)
0
100
200
300
400
500
600
700
800
900
1000
1942
1945
1950
1955
1960
1965
1970
1975
1980
1985
1990
1995
2000
2005
2010
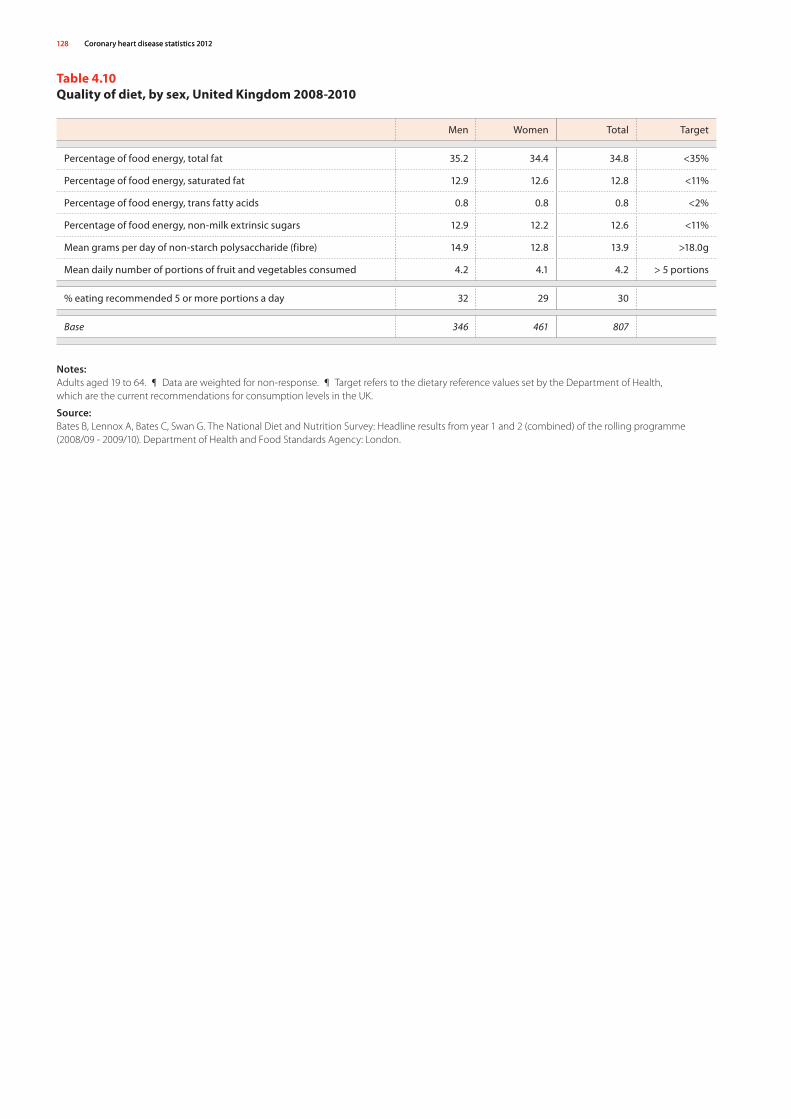
128 Coronary heart disease statistics 2012128 Coronary heart disease statistics 2012
Table 4.10Quality of diet, by sex, United Kingdom 2008-2010
Men Women Total Target
Percentage of food energy, total fat 35.2 34.4 34.8 <35%
Percentage of food energy, saturated fat 12.9 12.6 12.8 <11%
Percentage of food energy, trans fatty acids 0.8 0.8 0.8 <2%
Percentage of food energy, non-milk extrinsic sugars 12.9 12.2 12.6 <11%
Mean grams per day of non-starch polysaccharide (fibre) 14.9 12.8 13.9 >18.0g
Mean daily number of portions of fruit and vegetables consumed 4.2 4.1 4.2 > 5 portions
% eating recommended 5 or more portions a day 32 29 30
Base 346 461 807
Notes: Adults aged 19 to 64. ¶ Data are weighted for non-response. ¶ Target refers to the dietary reference values set by the Department of Health, which are the current recommendations for consumption levels in the UK.
Source: Bates B, Lennox A, Bates C, Swan G. The National Diet and Nutrition Survey: Headline results from year 1 and 2 (combined) of the rolling programme (2008/09 - 2009/10). Department of Health and Food Standards Agency: London.

British Heart Foundation and University of Oxford 129British Heart Foundation and University of Oxford 129
Table 4.11Consumption of salt in adults aged 16 and over, United Kingdon 2008, Wales 2006, Scotland 2009 and England 2011
Men Women
19-24 25-34 35-49 50-64 All ages 19-24 25-34 35-49 50-64 All ages
UK, 2008
Mean salt consumption (g/day) 10.7 10.2 9.5 9.3 9.7 10.0 8.1 7.4 7.0 7.7
% exceeding recommended daily consumption 86 87 81 80 82 79 72 62 61 65
Base 9 37 111 137 294 7 54 157 180 398
Wales, 2006
Mean salt consumption (g/day) 12.4 9.4 9.0 8.6 9.4 6.3 7.8 6.8 6.4 6.8
% exceeding recommended daily consumption 89 83 80 81 82 56 64 60 48 57
Base 6 19 64 66 155 6 38 89 119 252
Scotland, 2009
Mean salt consumption (g/day) 9.3 10.1 9.7 10.6 10.0 9.0 7.2 7.9 7.4 7.8
% exceeding recommended daily consumption 88 93 88 86 89 95 64 71 69 72
Base 46 70 123 104 342 44 71 126 121 361
Men Women
19-34 35-49 50-63 All ages 19-34 35-49 50-63 All ages
England, 2011
Mean salt consumption (g/day) 9.5 10.0 8.2 9.3 7.1 6.8 6.6 6.8
% exceeding recommended daily consumption 21 11 28 20 32 48 46 42
Base 43 84 123 250 43 101 153 297
Notes:The recommended daily consumption of salt for both men and women is 6g per day or less. ¶ The 2006 estimates should be viewed with caution due to poor survey response rates. ¶ Salt consumption based on 24 hour urine collection.
Source;National Centre for Social Research (2008) An assessment of dietary sodium levels among adults (aged 19-64) in the general population, based on analysis of dietary sodium samples. Food Standards Agency: London. ¶ National Centre for Social Research (2007) An assessment of dietary sodium levels among adults (aged 19-64) in the general population in Wales, based on analysis of dietary sodium in 24-hour urine samples. NatCen: London. ¶ Scottish Centre for Social Research (2011) A survey of 24 hour urinary sodium excretion in a representative sample of the Scottish population as a measure of salt intake. ScotCen: Edinburgh. ¶ National Centre for Social Research (2012) National Diet and Nutrition Survey - Assessment of dietary sodium in adults (aged 19 to 64 years) in England, 2011. NatCen: London.

130 Coronary heart disease statistics 2012
Table 4.12 Consumption of total fat, saturated fat, salt, sugar, fibre and fruit and vegetables, by Government Office Region 2008/10
No
rth East
No
rth West
Yorksh
ire and
The H
um
ber
East Mid
land
s
West M
idlan
ds
East of En
glan
d
Lon
do
n
Sou
th East
Sou
th West
Eng
land
Wales
Scotland
No
rthern
Ireland
Consumption per person per day, total diet (i.e. including alcohol)
Energy (kcal) 1,978 1,988 1,990 2,094 2,052 2,086 1,877 2,037 2,165 2,012 2,121 2,098 2,049
Fat (g) 80 82 82 85 84 86 78 85 90 83 87 85 82
Fat (% total energy) 37.3 38.1 38.0 37.7 37.7 37.9 38.2 38.3 38.3 38.0 37.9 37.3 36.9
Saturated fat (g) 31.0 31.4 31.7 32.9 31.7 33.2 27.9 32.8 35.1 31.8 33.9 33.3 32.4
Saturated fat (% total energy)
14.7 14.6 14.7 14.5 14.2 14.7 13.7 14.9 15.0 14.6 14.7 14.7 14.5
Total sugars (g) 113 113 115 123 117 123 103 120 127 117.0 128 124 115
Non-milk extrinsic sugars (g)
74 73 74 80 78 80 64 77 82 75 84 82 74
Non-milk extrinsic sugars (% total energy)
14.3 14.2 14.4 14.7 14.5 14.7 13.1 14.6 14.6 14.4 15.1 15.0 13.9
Non-starch polysaccharide fibre (g)
12.6 12.6 13.1 14.0 13.5 13.9 12.9 13.6 14.5 13.3 14.0 13.3 13.3
Sodium (g) 2.48 2.47 2.48 2.55 2.48 2.55 2.04 2.52 2.65 2.44 2.63 2.65 2.60
Salt (g) 6.2 6.2 6.2 6.4 6.2 6.4 5.1 6.3 6.6 6.1 6.6 6.6 6.5
Purchase per person per week
Fruit and vegetables (excluding potatoes) (g)
1,950 1,977 2,100 2,364 2,068 2,443 2,526 2,429 2,525 2,287 2,382 2,141 1,877
Base 730 1,771 1,460 1,211 1,467 1,546 1,413 2,186 1,516 13,300 798 1,512 1,323
Notes: Adults aged 16 and over. ¶ Consumption is assumed from purchase data, and applies to food consumed in the household only. ¶ Data are weighted for non-response. ¶ Base is number of households.
Source: Department for Environment, Food and Rural Affairs (2011) Family Food in 2010. DEFRA: York and previous editions.

British Heart Foundation and University of Oxford 131
Table 4.13Consumption of total fat, saturated fat, salt, sugar, fibre and fruit and vegetables, by income quintile, United Kingdom 2007/09
Quintile 1 (lowest income)
Quintile 2 Quintile 3 Quintile 4Quintile 5
(highest income)
Consumption per person per day, total diet (i.e. including alcohol)
Energy (kcal) 2,174 2,124 2,066 2,027 1,934
Fat (g) 91 88 85 82 78
Fat (% total energy) 38.2 38.2 38.1 37.6 37.5
Saturated fat (g) 35.3 34.2 32.7 31.9 30.4
Saturated fat (% total energy) 14.9 14.8 14.6 14.5 14.6
Total sugars (g) 129 126 120 116 110
Non-milk extrinsic sugars (g) 84 83 78 75 69
Non-milk extrinsic sugars (% total energy) 14.7 14.9 14.5 14.3 13.8
Non-starch polysaccharide fibre (g) 13.8 13.4 13.3 13.4 13.4
Sodium (g) 2.62 2.48 2.52 2.49 2.40
Salt (g) 6.6 6.2 6.3 6.2 6.0
Purchase per person per week
Fruit and vegetables (excluding potatoes) (g) 2,167 2,237 2,240 2,296 2,556
Notes: Adults aged 16 and over. ¶ Consumption is assumed from purchase data, and applies to food consumed in the household only.
Source: Department for Environment, Food and Rural Affairs (2011) Family Food in 2010. DEFRA: York and previous editions.
Figure 4.13 Consumption of fruit and vegetables in adults, by income quintile, UK 2007/09
Con
sum
pti
on p
er p
erso
n p
er d
ay (g
)
Quintile 1 Quintile 2 Quintile 3 Quintile 4 Quintile 5 (lowest income) (highest income)
0
500
1000
1500
2000
2500
3000

132 Coronary heart disease statistics 2012
Table 4.14Consumption of total fat, saturated fat, salt, sugar, fibre and fruit and vegetables in adults, by ethnic group, United Kingdom 2006/08
Asian & Asian British
Black & Black British
Chinese & Other
Mixed White
Consumption per person per day, total diet (i.e. including alcohol)
Energy (kcal) 1,975 1,641 1,676 1,524 2,075
Fat (g) 78 64 70 62 85
Fat (% total energy) 36.0 35.6 37.8 36.9 38.0
Saturated fat (g) 25.7 19.9 23.6 22.8 33.6
Saturated fat (% total energy) 11.8 11.0 12.8 13.7 15.0
Total sugars (g) 99 97 91 91 121
Non-milk extrinsic sugars (g) 60 65 55 60 78
Non-milk extrinsic sugars (% total energy) 11.4 15.1 12.5 14.9 14.5
Non-starch polysaccharide fibre (g) 13.2 10.4 11.4 10.2 13.6
Sodium (g) 1.41 1.51 1.60 1.75 2.61
Salt (g) 3.5 3.8 4.0 4.4 6.5
Purchase per person per week
Fruit and vegetables (excluding potatoes) (g) 2,348 2,143 2,535 1,987 2,462
Notes: Adults aged 16 and over. ¶ Consumption is assumed from purchase data, and applies to food consumed in the household only.
Source: Department for Environment, Food and Rural Affairs (2011) Family Food in 2010. DEFRA: York and previous editions.

British Heart Foundation and University of Oxford 133
Table 4.15 Consumption of fruit and vegetables in children aged 5 to 15, by sex and age, England 2001 to 2010
Age (Years)
5 6 7 8 9 10 11 12 13 14 15 Total
Boys
% consuming 5 or more portions per day
2001 9.2 11.3 8.6 8.4 10.9 12.7 11.6 7.0 13.3 14.5 18.1 11.4
2002 11.7 9.5 9.8 9.7 9.3 10.1 12.1 14.7 11.6 14.5 14.3 11.5
2003 9.3 4.2 10.8 5.7 10.8 14.4 9.9 10.2 8.8 10.8 11.2 9.6
2004 8.9 9.6 7.9 7.1 14.4 10.2 13.0 19.7 18.5 7.6 22.8 12.7
2005 17.7 18.4 18.3 13.6 22.6 21.2 6.7 20.3 21.9 16.3 13.5 17.4
2006 23.0 20.0 20.0 17.0 18.0 18.0 15.0 20.0 21.0 16.0 19.0 19.0
2007 21.0 25.1 17.1 21.7 26.0 18.3 18.9 19.4 23.3 18.2 19.2 20.7
2008 18.0 19.5 17.7 18.7 18.4 18.1 21.7 17.3 18.9 21.2 15.4 18.7
2009 22.1 22.7 21.5 24.1 14.8 20.5 15.7 18.8 21.7 25.0 24.0 20.9
2010 21.0 21.3 20.1 15.3 15.4 25.7 18.5 17.6 16.0 16.2 26.0 19.3
Base
2001 139 137 128 138 143 127 143 144 144 124 131 1,498
2002 287 304 336 317 296 331 322 299 290 309 275 3,367
2003 105 130 122 119 110 128 110 128 117 116 116 1,301
2004 56 63 52 61 63 61 43 61 59 52 50 621
2005 89 83 89 102 115 84 97 96 87 86 80 1,010
2006 253 208 247 182 265 244 222 231 231 239 214 2,536
2007 222 235 221 257 222 244 240 235 266 281 246 2,670
2008 224 233 215 235 235 248 239 237 258 275 242 2,640
2009 118 128 105 111 131 125 128 139 116 144 122 1,367
2010 176 190 161 168 165 166 180 171 191 194 172 1,934
Girls
% consuming 5 or more portions per day
2001 8.3 7.9 7.1 12.2 9.0 11.6 14.2 12.8 11.8 9.1 13.4 10.7
2002 11.4 8.6 13.0 10.6 9.5 11.1 13.1 12.9 11.4 15.3 14.4 11.9
2003 13.1 11.4 5.8 13.7 5.5 5.6 12.3 15.7 11.6 18.9 15.0 11.7
2004 10.0 9.0 2.0 17.9 9.0 18.9 6.0 18.8 19.0 6.3 11.7 12.2
2005 23.6 16.4 10.3 20.8 17.1 12.4 17.3 23.2 14.8 9.8 18.8 16.8
2006 19.0 19.0 20.0 19.0 24.0 20.0 21.0 23.0 20.0 25.0 27.0 22.0
2007 18.7 20.1 24.9 20.8 19.2 23.4 24.5 20.6 21.1 21.3 20.7 21.4
2008 13.7 12.4 18.8 22.6 25.1 22.0 16.0 23.6 25.3 20.8 21.1 20.3
2009 28.2 20.1 11.9 22.0 19.2 29.2 24.6 25.2 20.3 19.3 19.5 21.8
2010 23.9 15.0 18.3 20.8 19.4 18.7 20.7 18.1 25.3 21.8 19.4 20.2
Base
2001 147 125 146 154 146 160 149 128 132 131 142 1,560
2002 301 296 298 300 300 281 310 304 296 280 270 3,236
2003 123 112 118 118 126 128 122 128 128 127 112 1,342
2004 39 48 44 66 35 52 45 57 53 56 56 552
2005 95 102 93 75 89 97 108 99 81 94 95 1,027
2006 217 229 263 241 233 224 247 221 234 210 217 2,536
2007 214 218 219 226 232 236 226 225 249 255 241 2,541
2008 212 203 227 223 227 239 226 224 245 260 228 2,514
2009 120 114 110 117 114 116 126 120 123 132 119 1,312
2010 164 169 166 163 158 155 176 166 179 181 167 1,844
Notes: Data are weighted for child selection, but not for non-response. ¶ Comparisons over time should be made with caution, due to the relatively low sample size in 2004.
Source: Joint Health Surveys Unit (2012) Health Survey for England 2010. ¶ Updating of trend tables. The Information Centre: Leeds. Copyright © 2010, Re-used with the permission of The Health and Social Care Information Centre. All rights reserved.

134 Coronary heart disease statistics 2012
Table 4.16 Total energy available from fat and availability of fruit and vegetables, by country, Europe 2007
% energy from fatfruit and veg per person
per year (kg)
Albania 28.8 299
Armenia 24.9 394
Austria 39.4 251
Azerbaijan 15.5 222
Belarus 33.5 205
Belgium 40.0 201
Bosnia and Herzegovina 20.5 289
Bulgaria 30.9 132
Croatia 33.1 193
Cyprus 39.0 269
Czech Republic 35.9 144
Denmark 35.8 209
Estonia 25.4 174
Finland 36.0 172
France 41.8 214
Georgia 20.8 102
Germany 36.5 182
Greece 36.7 404
Hungary 39.2 195
Iceland 39.1 222
Ireland 34.6 219
Israel 37.0 317
Italy 39.0 295
Kazakhstan 27.6 190
Kyrgyzstan 20.1 178
Latvia 35.9 168
Notes: Data for these countries are for 2007. ¶ Fruit and vegetables do not include potatoes. ¶ Amount available refers to fruit and vegetables produced nationally, plus imports, minus exports.
Source: World Health Organization (2012). European Health for All statistical database. http://data.euro.who.int/hfadb/
% energy from fatfruit and veg per person
per year (kg)
Lithuania 27.2 187
Luxembourg 38.9 276
FYR Macedonia 36.2 256
Malta 28.9 318
Netherlands 37.3 239
Norway 35.3 220
Poland 29.7 180
Portugal 35.4 287
Republic of Moldova 21.1 108
Romania 27.9 209
Russia 25.1 184
Serbia 39.5 211
Slovakia 34.2 154
Slovenia 33.8 197
Spain 42.1 243
Sweden 35.6 205
Switzerland 40.3 169
Tajikistan 26.4 127
Turkey 27.1 333
Turkmenistan 22.7 173
Ukraine 26.2 153
United Kingdom 37.7 218
Uzbekistan 24.1 226
Europe average 35.9 240
EU average 37.3 225
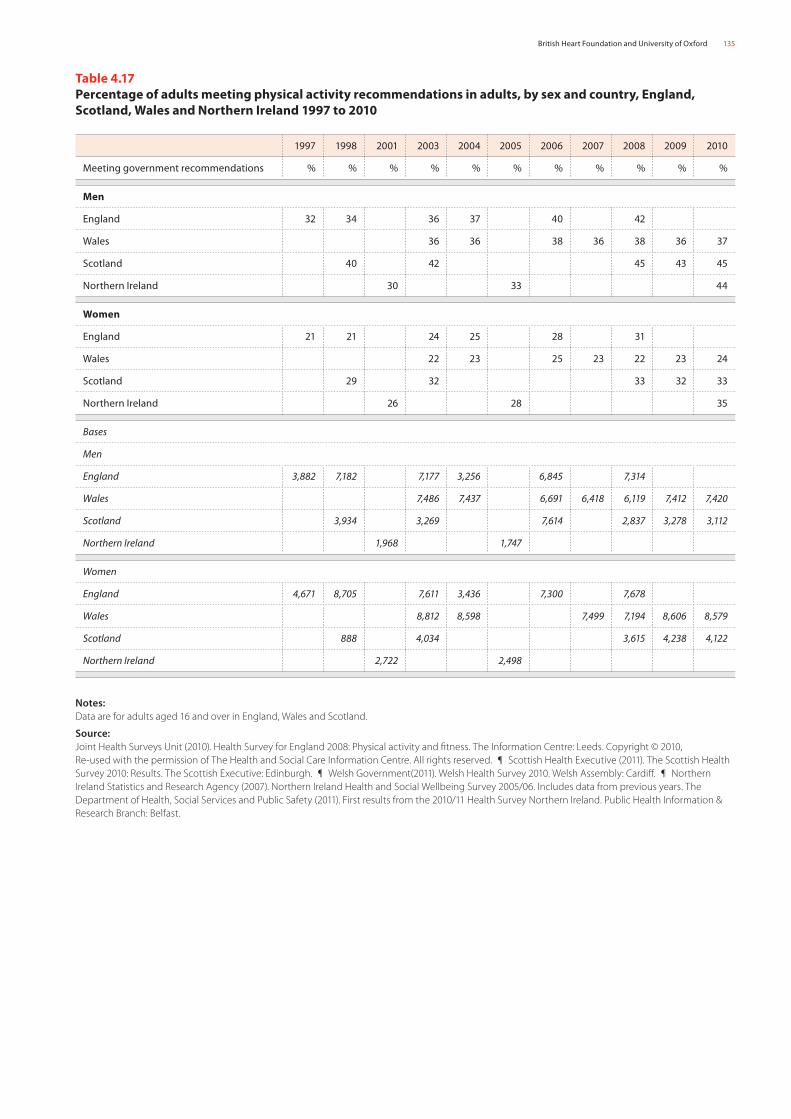
British Heart Foundation and University of Oxford 135
Table 4.17 Percentage of adults meeting physical activity recommendations in adults, by sex and country, England, Scotland, Wales and Northern Ireland 1997 to 2010
1997 1998 2001 2003 2004 2005 2006 2007 2008 2009 2010
Meeting government recommendations % % % % % % % % % % %
Men
England 32 34 36 37 40 42
Wales 36 36 38 36 38 36 37
Scotland 40 42 45 43 45
Northern Ireland 30 33 44
Women
England 21 21 24 25 28 31
Wales 22 23 25 23 22 23 24
Scotland 29 32 33 32 33
Northern Ireland 26 28 35
Bases
Men
England 3,882 7,182 7,177 3,256 6,845 7,314
Wales 7,486 7,437 6,691 6,418 6,119 7,412 7,420
Scotland 3,934 3,269 7,614 2,837 3,278 3,112
Northern Ireland 1,968 1,747
Women
England 4,671 8,705 7,611 3,436 7,300 7,678
Wales 8,812 8,598 7,499 7,194 8,606 8,579
Scotland 888 4,034 3,615 4,238 4,122
Northern Ireland 2,722 2,498
Notes:Data are for adults aged 16 and over in England, Wales and Scotland.
Source:Joint Health Surveys Unit (2010). Health Survey for England 2008: Physical activity and fitness. The Information Centre: Leeds. Copyright © 2010, Re-used with the permission of The Health and Social Care Information Centre. All rights reserved. ¶ Scottish Health Executive (2011). The Scottish Health Survey 2010: Results. The Scottish Executive: Edinburgh. ¶ Welsh Government(2011). Welsh Health Survey 2010. Welsh Assembly: Cardiff. ¶ Northern Ireland Statistics and Research Agency (2007). Northern Ireland Health and Social Wellbeing Survey 2005/06. Includes data from previous years. The Department of Health, Social Services and Public Safety (2011). First results from the 2010/11 Health Survey Northern Ireland. Public Health Information & Research Branch: Belfast.

136 Coronary heart disease statistics 2012
Table 4.18Self-reported physical activity levels in adults, by sex and age, England 2008, Scotland 2010, Wales 2010 and Northern Ireland 2010/11
All adults 16–24 25–34 35–44 45–54 55–64 65–74 75+
Summary physical activity level % % % % % % % %
England
Men
Meeting recommendations 39 53 49 44 41 32 20 9
Some activity 31 30 32 33 34 31 33 23
Low activity 30 16 19 23 25 37 47 68
Base 7,305 1,133 1,210 1,411 1,204 1,084 724 538
Women
Meeting recommendations 29 35 36 34 32 28 17 6
Some activity 34 33 39 39 35 34 30 16
Low activity 38 32 25 28 33 37 53 78
Base 7,660 1,088 1,212 1,428 1,230 1,119 798 785
Scotland
Men
Meeting recommendations 45 66 61 51 48 34 22 10
Some activity 26 22 24 29 25 29 29 20
Low activity 29 12 15 20 27 36 50 70
Base 3,112 274 420 478 566 555 488 331
Women
Meeting recommendations 33 37 42 45 40 30 17 7
Some activity 33 39 36 35 36 33 31 17
Low activity 33 25 22 19 24 36 52 76
Base 4,122 373 564 682 761 699 573 470
Wales
Men
Meeting recommendations 37 48 43 42 41 31 26 14
Some activity 26 26 29 29 24 26 24 17
Low activity 31 17 19 24 28 37 45 65
Base 7,420 882 831 1,082 1,333 1,361 1,109 822
Women
Meeting recommendations 24 28 27 28 28 25 19 7
Some activity 33 40 41 38 34 34 27 15
Low activity 36 23 24 25 32 35 48 76
Base 8,579 919 1,073 1,330 1,472 1,520 1,247 1,018
Northern Ireland
Men
Meeting recommendations 44 53 46 49 44 38 33 27
Below recommendations 56 47 54 51 56 62 67 73
Base 1,675 133 228 246 303 293 293 179
Women
Meeting recommendations 35 36 44 41 36 33 28 15
Below recommendations 65 64 56 59 64 67 72 85
Base 2,395 218 391 449 443 353 305 236
Notes:Meets recommendations: 30 minutes or more of moderate or vigorous activity on at least 5 days a week; Some activity: 30 minutes or more of moderate or vigorous activity on 1 to 4 days a week; Low activity: lower levels of activity. ¶ All data are self-reported.
Source: Joint Health Surveys Unit (2010). Health Survey for England 2008: Physical activity and fitness. The Information Centre: Leeds. Copyright © 2010, Re-used with the permission of The Health and Social Care Information Centre. All rights reserved. ¶ Scottish Health Executive (2011). The Scottish Health Survey 2010: Results. The Scottish Executive: Edinburgh. ¶ Welsh Government(2011). Welsh Health Survey 2010. Welsh Assembly: Cardiff. ¶ Northern Ireland Statistics and Research Agency (2007). Northern Ireland Health and Social Wellbeing Survey 2005/06. Includes data from previous years. The Department of Health, Social Services and Public Safety (2011). First results from the 2010/11 Health Survey Northern Ireland. Public Health Information & Research Branch: Belfast.

British Heart Foundation and University of Oxford 137
Table 4.19 Self-reported age-standardised physical activity levels in adults, by sex and strategic health authority, England 2008
Strategic Health Authority
North EastNorth West
Yorkshire & the
Humber
East Midlands
West Midlands
East of England
LondonSouth East
CoastSouth
CentralSouth
West
% % % % % % % % % %
Men
Meets recommendations 33 39 40 38 38 38 38 38 41 44
Some activity 33 30 29 35 33 31 29 35 33 30
Low activity 34 31 31 27 29 30 33 27 26 26
Women
Meets recommendations 26 29 26 27 25 27 29 34 30 32
Some activity 32 34 34 33 32 37 31 35 32 33
Low activity 41 37 40 39 43 35 40 31 38 35
Base
Men 429 965 714 637 676 820 755 532 527 682
Women 523 1,193 906 795 877 939 927 674 620 863
Notes:Meets recommendations: 30 minutes or more of moderate or vigorous activity on at least 5 days a week; Some activity: 30 minutes or more of moderate or vigorous activity on 1 to 4 days a week; Low activity: lower levels of activity. ¶ Episodes of activity less than 30 minutes have been excluded. ¶ Data are age-standardised to the mid-year 2007 population estimates for England; see source for details of method. ¶ All data are self-reported.
Source:Joint Health Surveys Unit (2010). Health Survey for England 2008: Physical activity and fitness. The Information Centre: Leeds. Copyright © 2010, Re-used with the permission of The Health and Social Care Information Centre. All rights reserved.

138 Coronary heart disease statistics 2012
Table 4.20 Self-reported age-standardised physical activity levels in adults, by sex and quintile of equivalised household income, England 2008
Highest Second Third Fourth Lowest
% % % % %
Men
Meets recommendations 42 41 42 39 31
Some activity 35 37 29 28 23
Low activity 23 23 29 33 46
Women
Meets recommendations 34 28 28 27 26
Some activity 37 38 34 32 29
Low activity 28 35 38 41 45
Base
Men 1,329 1,180 1,041 1,046 854
Women 1,313 1,285 1,310 1,397 1,274
Notes:Meets recommendations: 30 minutes or more of moderate or vigorous activity on at least 5 days a week; Some activity: 30 minutes or more of moderate or vigorous activity on 1 to 4 days a week; Low activity: lower levels of activity. ¶ Episodes of activity less than 30 minutes have been excluded. ¶ All data are self-reported.
Source:Joint Health Surveys Unit (2010). Health Survey for England 2008: Physical activity and fitness. The Information Centre: Leeds. Copyright © 2010, Re-used with the permission of The Health and Social Care Information Centre. All rights reserved.
Figure 4.20 Self-reported age-standardised physical activity levels in adults, by sex and quintile of equivalised household income, England 2008
Perc
enta
ge
WomenMen
Highest Second Third Fourth Lowest
0
5
10
15
20
25
30
35
40
45

British Heart Foundation and University of Oxford 139
Table 4.21 Self-reported physical activity in adults, by sex and ethnic group, England 2004
General population
Black Caribbean
Black African Indian Pakistani Bangladeshi Chinese Irish
% % % % % % % %
Men
High 37 37 35 30 28 26 30 39
Medium 31 29 30 26 21 23 32 28
Low 32 34 35 44 51 51 38 33
Base 2,873 409 386 549 429 408 348 497
Women
High 25 31 29 23 14 11 17 29
Medium 36 30 28 32 34 21 36 38
Low 39 39 43 45 52 68 47 33
Base 3,818 648 467 634 508 477 375 656
Notes:High = 30 minutes or more physical activity on at least 5 days a week (recommended level). ¶ Medium = 30 minutes or more on 1 to 4 days a week. ¶ Low = lower level of activity. ¶ Adults aged 16 and over. ¶ Data are weighted for-non-response. ¶ General population refers to the whole population of England, regardless of ethnicity.
Source: Joint Health Surveys Unit (2005). Health Survey for England 2004: The Information Centre: Leeds. Copyright © 2005, Re-used with the permission of The Health and Social Care Information Centre. All rights reserved.

140 Coronary heart disease statistics 2012
Table 4.22 Self-reported physical activity levels in children, by sex and age, England 2008 and Scotland 2010
All children 2 3 4 5 6 7 8 9 10 11 12 13 14 15
% % % % % % % % % % % % % % %
England
Boys
Meeting recommendations 32 43 32 28 32 34 36 32 33 31 29 29 27 32 32
Some activity 44 30 39 41 43 41 47 45 46 49 50 46 52 43 42
Low activity 24 27 25 30 25 25 18 23 22 20 21 25 21 24 26
Base 3,493 253 240 247 239 249 235 236 243 255 254 260 286 267 229
Girls
Meeting recommendations 24 35 33 28 31 28 28 23 25 27 16 19 20 12 15
Some activity 47 38 42 49 43 44 50 55 49 44 55 50 46 47 40
Low activity 29 27 24 23 26 27 22 23 26 29 29 31 34 41 45
Base 3,545 246 268 229 225 236 254 231 248 296 291 240 259 278 244
All children 2-4 5-7 8-10 11-12 13-15
% % % % % %
Scotland
Boys
Meeting recommendations 75 70 75 85 69 75
Base 811 188 190 170 104 159
Girls
Meeting recommendations 72 70 73 84 74 62
Base 694 174 143 132 100 145
Notes:Meets recommendations: 60 minutes or more on all 7 days of the week; Some activity: 30 to 59 minutes on all 7 days of the week; Low activity: lower levels of activity. ¶ All data are self-reported. ¶ Results between countries are not directly comparable due to the differences in data collection.
Source: Joint Health Surveys Unit (2010). Health Survey for England 2008: Physical activity and fitness. The Information Centre: Leeds. Copyright © 2010, Re-used with the permission of The Health and Social Care Information Centre. All rights reserved. ¶ Scottish Health Executive (2011). The Scottish Health Survey 2010: Results. The Scottish Executive: Edinburgh.

British Heart Foundation and University of Oxford 141
Table 4.23 Self-reported frequency of exercising or playing sport in adults, EU countries 2009
Never Seldom With some regularity Regularly Don’t know
% % % % %
Austria 59 33 33 5 0
Belgium 28 22 34 16 0
Bulgaria 58 28 10 3 1
Cyprus 46 13 25 16 0
Czech Republic 37 35 23 5 0
Denmark 18 18 49 15 0
Estonia 41 25 27 7 0
Finland 7 21 55 17 0
France 34 18 35 13 0
Germany 31 20 40 9 0
Greece 67 15 15 3 0
Hungary 53 24 18 5 0
Ireland 26 15 35 23 1
Italy 55 16 26 3 0
Latvia 44 29 19 8 0
Lithuania 44 20 22 14 0
Luxembourg 32 17 39 12 0
Malta 38 14 31 17 0
Netherlands 28 16 51 5 0
Poland 49 24 19 6 2
Portugal 55 11 24 9 1
Romania 49 28 13 8 2
Slovakia 35 35 25 5 0
Slovenia 22 26 39 13 0
Spain 42 19 27 12 0
Sweden 6 22 50 22 0
United Kingdom 32 22 32 14 0
EU 39 21 31 9 0
Notes:All adults aged 15 and above. ¶ “Regularly” means the respondent exercises at least 5 times a week. ¶ “With some regularity” means 3 to 4 or 1 to 2 times a week. ¶ “Seldom” means 1 to 3 times a month or less often. ¶ Adults aged 15 and over.
Source:European Commission (2010). Sport and Physical Activity: Special Eurobarometer 334 / Wave 72.3 – TNS Opinion & Social. http://ec.europa.eu/sport/news/eu-physical-activity-guidelines_en.htm (Accessed December 2011).

142 Coronary heart disease statistics 2012
Figure 4.23 Self-reported frequency of regularly exercising or playing sport in adults, EU countries 2009
Perc
enta
ge
Bulg
aria
Gre
ece
Ital
y
Aus
tria
Cze
ch R
epub
lic
Hun
gary
Slov
akia
Net
herla
nds
Pola
nd
Esto
nia
Latv
ia
Rom
ania
Ger
man
y
Port
ugal EU
Luxe
mb
ourg
Spai
n
Fran
ce
Slov
enia
Lith
uani
a
Uni
ted
King
dom
Den
mar
k
Belg
ium
Cyp
rus
Finl
and
Mal
ta
Swed
en
Irel
and
0
5
10
15
20
25

British Heart Foundation and University of Oxford 143
Table 4.24 Self-reported frequency of engaging in physical activity outside sport in adults, EU countries 2009
Never Seldom With some regularity Regularly Don’t know
% % % % %
Austria 5 26 54 15 0
Belgium 19 24 36 21 0
Bulgaria 3 27 40 25 5
Cyprus 32 17 31 20 0
Czech Republic 13 35 35 17 0
Denmark 4 11 42 43 0
Estonia 8 15 37 40 0
Finland 4 18 49 29 0
France 10 15 42 33 0
Germany 6 16 50 28 0
Greece 27 25 33 15 0
Hungary 10 18 31 41 0
Ireland 12 13 41 33 1
Italy 33 30 30 7 0
Latvia 9 14 32 44 1
Lithuania 14 19 26 39 0
Luxembourg 7 16 40 37 0
Malta 24 13 30 32 1
Netherlands 5 11 41 43 0
Poland 17 19 34 26 4
Portugal 36 15 31 17 1
Romania 27 26 24 19 4
Slovakia 8 25 40 27 0
Slovenia 5 15 41 39 0
Spain 10 19 38 33 0
Sweden 2 14 44 40 0
United Kingdom 12 15 36 37 0
EU 14 20 38 27 1
Notes: All adults aged 15 and above. ¶ Regularly means the respondent exercises at least 5 times a week. ¶ “With some regularity” means 3 to 4 or 1 to 2 times a week. ¶ Seldom means 1 to 3 times a month or less often. ¶ Adults aged 15 and over.
Source: European Commission (2010). Sport and Physical Activity: Special Eurobarometer 334 / Wave 72.3 – TNS Opinion & Social. http://ec.europa.eu/public_opinion/archives/ebs/ebs_334_en.pdf (Accessed December 2011).

144 Coronary heart disease statistics 2012
Figure 4.24 Self-reported frequency of engaging in physical activity outside sport in adults, EU countries 2009
Perc
enta
ge
Ital
y
Aus
tria
Gre
ece
Cze
ch R
epub
lic
Port
ugal
Rom
ania
Cyp
rus
Belg
ium
Bulg
aria
Pola
nd
Slov
akia EU
Ger
man
y
Finl
and
Mal
ta
Fran
ce
Irel
and
Spai
n
Luxe
mb
ourg
Uni
ted
King
dom
Lith
uani
a
Slov
enia
Esto
nia
Swed
en
Hun
gary
Den
mar
k
Net
herla
nds
Latv
ia
0
5
10
15
20
25
30
35
40
45
50

British Heart Foundation and University of Oxford 145
Table 4.25 Alcohol consumption in adults, by sex and age, Great Britain 2010
All ages 16-24 25-44 45-64 65+
% % % % %
Men
Number of days of drinking last week
None 33 51 31 27 35
5 or more 17 5 12 20 26
Maximum daily amount
Exceeded recommended amount (4 units +)
36 34 41 40 22
Heavy drinking (8 units +) 19 24 25 20 7
Unweighted base 6,070 560 1,620 2,170 1,710
Women
Number of days of drinking last week
None 47 54 44 40 57
5 or more 10 2 7 13 14
Maximum daily amount
Exceeded recommended amount (3 units +)
28 31 35 32 11
Heavy drinking (6 units +) 13 17 19 11 2
Base 7,200 630 2,090 2,510 1,970
Notes: Alcohol consumption levels are based on the number of units of alcohol consumed on the heaviest day during the previous week, the “maximum daily amount”.
Source:Office for National Statistics (2011). General Lifestyle Survey 2010. Results published online at http://www.ons.gov.uk/ons/rel/ghs/general-lifestyle-survey/2010/index.html (Accessed May 2010).

146 Coronary heart disease statistics 2012
Figure 4.25 Percentage of adults exceeding daily benchmarks for alcohol consumption, by sex and age, Great Britain 2010
Note: Recommended daily benchmark is 4 units for men and 3 units for women. ¶ Benchmark for heavy drinking is 8 units for men and 6 units for women.
Perc
enta
ge
WomenMen
16-24 25-44 45-64 65+ 16-24 25-44 45-64 65+
Exceeding recommended daily benchmark Exceeding benchmark for heavy drinking
0
5
10
15
20
25
30
35
40
45

British Heart Foundation and University of Oxford 147
Table 4.26Heavy drinking and drinking over recommended levels in adults, by sex and age, Great Britain 1998 to 2010
1998 2000 2001 2002 2003 2004 2005 2006 2007 2008 2009 2010
Maximum daily alcohol consumption
% % % % % % % % % % % %
Men
Exceeded recommended amount (4 units +)
16-24 52 50 50 49 51 47 46 42 44 42 36 34
25-44 48 45 49 46 47 48 48 48 48 42 44 41
45-64 37 38 37 38 41 37 42 42 44 41 41 40
65+ 16 16 18 16 19 20 21 21 23 21 20 22
All ages 39 39 40 38 40 39 40 40 41 37 37 36
Heavy drinking (8 units +)
16-24 39 37 37 35 37 32 32 30 32 30 24 24
25-44 29 27 30 28 30 31 30 31 31 27 27 25
45-64 17 17 17 18 20 18 22 21 24 21 21 20
65+ 4 5 5 5 6 7 6 7 8 7 5 7
All ages 22 21 22 21 23 22 19 23 24 21 20 19
Unweighted base 6,561 6,598 7,054 6,828 8,087 6,862 10,028 7,674 7,230 6,720 6,160 6,070
Women
Exceeded recommended amount (3 units +)
16-24 42 42 40 42 40 39 41 39 40 36 37 31
25-44 28 31 31 31 30 28 42 40 43 37 36 35
45-64 17 19 19 19 20 20 37 35 36 32 32 32
65+ 4 4 5 5 4 5 12 14 14 10 11 11
All ages 21 23 23 23 23 22 34 33 34 29 29 28
Heavy drinking (6 units +)
16-24 24 27 27 28 26 24 27 25 24 24 24 17
25-44 11 13 14 13 13 13 20 21 22 20 19 19
45-64 5 5 5 5 5 6 12 12 13 13 11 11
65+ 1 1 1 1 1 1 2 2 3 2 2 2
All ages 8 10 10 10 9 9 15 15 15 14 13 13
Unweighted base 7,821 7,491 8,299 7,942 9,304 8,012 11,617 9,013 8,380 7,950 7,290 7,200
Notes:Alcohol consumption levels are based on the number of units of alcohol consumed on the heaviest day during the previous week. ¶ Methods for estimating the number of units of alcohol consumed were updated in 2006. ¶ Estimates since 2006 are not directly comparable with estimates from before 2006.
Source:Office for National Statistics (2011). General Lifestyle Survey 2010. Results published online at http://www.ons.gov.uk/ons/rel/ghs/general-lifestyle-survey/2010/index.html (Accessed May 2010).

148 Coronary heart disease statistics 2012
Figure 4.26 Heavy drinking and drinking over recommended levels in young adults aged 16-24, Great Britain 1998 to 2010
Note: Estimates in 2006 to 2010 are not directly comparable with pre-2006 estimates due to changes in the methods used to estimate the number of units consumed.
Perc
enta
ge
Women heavy drinking
Women exceeding recommended levels
Men heavy drinking
Men exceeding recommended levels
1998
1999
2000
2001
2002
2003
2004
2005
2006
2007
2008
2009
2010
0
10
20
30
40
50
60

British Heart Foundation and University of Oxford 149
Table 4.27 Alcohol consumption in children, by sex and age, England 1988 to 2010
1988 1990 1992 1994 1996 1998 2000 2002 2004 2006 2008 2010
% % % % % % % % % % % %
Boys
11 Years 7 8 8 8 7 4 5 7 5 5 3 2
12 Years 12 9 13 10 12 14 11 12 11 8 6 3
13 Years 20 17 15 22 27 16 18 20 17 16 15 9
14 Years 25 32 32 34 37 28 34 34 32 29 24 15
15 Years 45 42 49 52 50 48 51 49 44 40 38 29
All ages 24 22 24 26 27 23 25 25 23 21 18 13
Girls
11 Years 4 4 5 4 6 2 5 4 3 2 2 1
12 Years 7 6 7 9 9 6 9 9 9 7 4 3
13 Years 11 19 11 16 22 14 19 21 19 15 13 9
14 Years 19 32 25 26 35 29 31 34 33 30 25 16
15 Years 36 39 40 48 55 40 45 45 46 41 37 30
All ages 17 20 17 22 26 18 23 23 23 20 17 13
Bases
Boys
11 Years 227 309 284 266 269 285 612 866 861 600 621 537
12 Years 279 340 335 307 296 336 740 1,003 1,024 818 769 725
13 Years 312 312 351 304 275 293 737 1,035 1,007 765 756 702
14 Years 306 300 310 306 297 597 750 950 977 805 756 691
15 Years 348 358 366 326 295 745 796 1,107 1,078 869 896 886
All ages 1,473 1,623 1,652 1,509 1,432 2,256 3,635 4,961 4,947 3,857 3,798 3,541
Girls
11 Years 225 289 304 231 266 291 564 798 820 636 612 534
12 Years 312 277 354 304 272 365 681 978 923 829 759 696
13 Years 296 290 333 326 277 383 696 935 941 826 718 673
14 Years 311 298 298 309 285 657 691 946 917 767 746 705
15 Years 374 302 317 341 291 666 764 1,012 1,024 978 845 859
All ages 1,518 1,459 1,614 1,511 1,391 2,362 3,396 4,669 4,625 4,036 3,680 3,468
Notes: Sample is drawn from children in years 7-11 in secondary schools in England. ¶ For 2008, the sample was drawn from 268 secondary schools including schools from both the maintained and non-maintained education sectors. ¶ Percentages refer to individuals who reported drinking alcohol at some point in the previous week.
Source: National Centre for Social Research (2011) Smoking, drinking and drug use among young people in England in 2010. The Information Centre: Leeds, and previous editions. Copyright © 2011, Re-used with the permission of The Health and Social Care Information Centre. All rights reserved.

150 Coronary heart disease statistics 2012
Table 4.28 Alcohol consumption in children, by sex and age, Scotland 1990 to 2010
1990 1992 1994 1996 1998 2000 2002 2004 2006 2008 2010
% % % % % % % % % % %
Boys
13 Years 10 14 18 21 19 19 23 20 13 11 15
15 Years 30 35 37 48 39 42 47 40 35 31 35
Girls
13 Years 10 12 13 18 15 20 23 20 15 12 14
15 Years 25 28 35 46 35 37 46 46 37 31 34
Bases
Boys
13 Years 301 380 358 303 369 621 1,429 1,787 5,790 2,604 9,715
15 Years 251 218 250 220 424 424 2,489 1,668 5,622 2,269 9,469
Girls
13 Years 324 343 348 309 389 555 1,481 1,730 5,805 2,665 9,085
15 Years 219 216 252 175 402 391 2,424 1,745 5,439 2,320 8,718
Notes: Sample is drawn from children in years S2 and S4 in secondary schools in Scotland. ¶ For 2008, the sample was drawn from 377 secondary schools including schools from both the maintained and non-maintained education sectors. ¶ Percentages refer to individuals who reported drinking alcohol at some point in the previous week.
Source: Office for National Statistics (2011) Scottish schools adolescent lifestyle and substance use survey (SALSUS) national report. Smoking, drinking and drug use among 13 and 15 year olds in Scotland in 2010. NHS Scotland: Edinburgh.

British Heart Foundation and University of Oxford 151
Table 4.29 Heavy drinking and drinking over recommended levels in adults, by sex and country or region, Great Britain 2010
Exceeded recommended amount (4 units +)
Heavy drinking (8 units +)
Base
Maximum daily amount % %
Men
North East 38 21 250
North West 41 24 750
Yorkshire and the Humber 38 22 610
East Midlands 33 15 470
West Midlands 27 15 570
East of England 33 16 650
London 33 19 510
South East 39 19 800
South West 34 18 510
England 35 19 5,120
Wales 36 19 350
Scotland 40 23 590
Great Britain 36 19 6,070
Exceeded recommended amount (3 units +)
Heavy drinking (6 units +)
Base
Maximum daily amount % %
Women
North East 30 12 340
North West 35 18 870
Yorkshire and the Humber 30 14 740
East Midlands 25 10 570
West Midlands 21 8 680
East of England 28 13 730
London 23 11 600
South East 31 13 950
South West 28 11 650
England 28 12 6,130
Wales 28 12 390
Scotland 31 14 680
Great Britain 28 13 7,200
Notes:Alcohol consumption levels are based on the number of units of alcohol consumed on the heaviest day during the previous week, the “maximum daily amount”. ¶ Data are weighted for non-response. ¶ Estimates are for adults aged 16 and over.
Source:Office for National Statistics (2011). General Lifestyle Survey 2010. Results published online at http://www.ons.gov.uk/ons/rel/ghs/general-lifestyle-survey/2010/index.html (Accessed May 2010).

152 Coronary heart disease statistics 2012
Figure 4.29a Heavy drinking by country or region, men, 2010, Great Britain
15% or less
Heavy drinking (8 units +)on heaviest drinking dayin previous week.
16% to 18%
19% to 21%
22% or more

British Heart Foundation and University of Oxford 153
Figure 4.29b Heavy drinking by country or region, women, 2010, Great Britain
10% or less
Heavy drinking (6 units +)on heaviest drinking dayin previous week.
11% to 13%
14% to 16%
17% or more

154 Coronary heart disease statistics 2012
Table 4.30 Alcohol consumption in adults, by sex and socioeconomic classification, Great Britain 2010
Exceeded recommended amount (4 units +)
Heavy drinking (8 units +)
Base
Maximum daily amount % %
Men
Managerial and professional 40 21 2,670
Large employers and higher managerial 48 26 440
Higher professional 39 19 600
Lower managerial and professional 38 20 1,630
Intermediate 36 20 1,030
Intermediate 36 19 420
Small employers and own account 37 21 610
Routine and manual 32 18 2,140
Lower supervisory and technical 34 19 760
Semi routine 31 19 690
Routine 30 15 690
Total 36 19 5,940
Exceeded recommended amount (3 units +)
Heavy drinking (6 units +)
Base
Maximum daily amount % %
Women
Managerial and professional 35 16 2,940
Large employers and higher managerial 42 19 460
Higher professional 39 18 560
Lower managerial and professional 33 14 1,920
Intermediate 28 13 1,340
Intermediate 25 12 720
Small employers and own account 32 14 620
Routine and manual 22 10 2,580
Lower supervisory and technical 27 13 730
Semi routine 21 9 1,080
Routine 18 8 770
Total 28 13 7,020
Notes: Alcohol consumption levels are based on the number of units of alcohol consumed on the heaviest drinking day during the previous week, the “maximum daily amount”. ¶ Data are weighted for non-response. ¶ Estimates are for adults aged 16 and over.
Source:Office for National Statistics (2011). General Lifestyle Survey 2010. Results published online at http://www.ons.gov.uk/ons/rel/ghs/general-lifestyle-survey/2010/index.html (Accessed May 2010).

British Heart Foundation and University of Oxford 155
Figure 4.30 Heavy drinking and drinking over recommended levels in adults, by sex and socioeconomic classification, Great Britain 2010
Perc
enta
ge
WomenMen
Managerial Intermediate Routine Managerial Intermediate Routineand professional and manual and professional and manual
Drinking over recommended levels (3 / 4 units +) on heaviest drinking day in previous week
Heavy drinking (6 / 8 units +) on heaviest drinking day in previous week
0
5
10
15
20
25
30
35
40
45

156 Coronary heart disease statistics 2012
Table 4.31 Alcohol consumption, by sex and ethnic group, England 2004
General population
Black Caribbean
Black African
Indian Pakistani Bangladeshi Chinese Irish
Alcohol consumed on the heaviest drinking day
% % % % % % % %
Men
None 24 40 62 53 93 99 52 20
Under 2 units 13 12 8 11 1 0 14 10
Up to 4 units 55 72 83 77 96 99 81 44
More than 4, up to 8 units 20 16 10 13 1 0 9 25
More than 8 units 25 12 7 9 3 0 10 32
% Exceeding 4 units 45 28 17 22 4 1 19 56
Base 2,829 397 369 531 416 395 337 490
Women
None 39 53 74 79 97 99 68 33
Under 2 units 18 17 11 8 1 0 15 18
Up to 3 units 70 81 92 92 98 99 88 64
More than 3, up to 6 units 16 12 5 4 0 0 8 20
More than 6 units 14 6 2 4 1 0 4 16
% Exceeding 3 units 30 18 7 8 1 1 12 36
Base 3,745 618 446 618 495 448 364 642
Notes: Data are weighted for non-response. ¶ Estimates are for adults aged 16 and over. ¶ General population refers to the whole population of England, regardless of minority ethnic group.
Source:Joint Health Surveys Unit (2005) Health Survey for England 2004. The Information Centre: Leeds. Copyright © 2005, Re-used with the permission of The Health and Social Care Information Centre. All rights reserved.

British Heart Foundation and University of Oxford 157
Table 4.32 Frequency of heavy drinking in adults, by country, European Union 2009
%
Austria 36
Belgium 28
Bulgaria 18
Cyprus 26
Czech Republic 24
Denmark 22
Estonia 18
Finland 22
France 20
Germany 36
Greece 34
Hungary 24
Ireland 44
Italy 30
Latvia 11
Lithuania 18
Luxembourg 14
Malta 26
Netherlands 23
Poland 19
Portugal 28
Romania 39
Slovakia 17
Slovenia 18
Spain 34
Sweden 13
United Kingdom 34
EU 29
Notes: Survey conducted in October 2009. ¶ Individuals were interviewed in their home using their native language. ¶ Approximately 1,000 interviews were conducted in each member state, with the exception of Germany (2,000), United Kingdom (1,300) and Luxembourg (600). ¶ Percentage refer to individuals who reported drinking 5 or more drinks on one occasion at least once a week in the last 12 months.
Source:TNS Opinion & Social (2010) Eurobarometer 72.3 EU citizens’ attitudes towards alcohol. European Commission: Brussels.

158 Coronary heart disease statistics 2012
Figure 4.32 Percentage of individuals reporting heavy drinking at least once a week in the last 12 months in adults, by country, European Union 2009
Perc
enta
ge
Latv
ia
Swed
en
Luxe
mb
ourg
Slov
akia
Bulg
aria
Esto
nia
Lith
uani
a
Slov
enia
Pola
nd
Fran
ce
Den
mar
k
Finl
and
Net
herla
nds
Cze
ch R
epub
lic
Hun
gary
Cyp
rus
Mal
ta
Belg
ium
Port
ugal
Euro
pea
n U
nion
Ital
y
Gre
ece
Spai
n
Uni
ted
King
dom
Aus
tria
Ger
man
y
Rom
ania
Irel
and
0
5
10
15
20
25
30
35
40
45
50

British Heart Foundation and University of Oxford 159
5. Medical risk factors

160 Coronary heart disease statistics 2012
5. Medical risk factors
This chapter reports on the prevalence of medical risk factors for coronary heart disease (CHD), including sections on blood pressure, blood cholesterol, overweight and obesity, and diabetes. Patterns in the prevalence of each of these risk factors by age, sex, socioeconomic status, geographic region and ethnicity are explored. Prevalence rates in the UK are compared against rates found in other countries. Where possible, temporal trends in the prevalence of these risk factors are reported.
Blood PressureRisk of CHD is directly related to higher levels of both systolic and diastolic blood pressure. Meta-analysis of prospective data on over one million adults has shown that for adults aged 40 to 69 years, each 20mmHg increase in usual systolic blood pressure, or 10mmHg increase in usual diastolic blood pressure, doubles the risk of death from CHD 1. At older ages the increase in risk of death from CHD is smaller, around 50% increase for every 20mmHg increase in usual systolic or 10mmHg increase in diastolic blood pressure in adults aged 80 to 89 years. Both drug treatment and lifestyle changes – particularly weight loss, increase in physical activity, and a reduction in salt and alcohol intake – can effectively lower blood pressure.
The World Health Report 2002 estimates that around 11% of all disease burden in developed countries is caused by raised blood pressure, and that over 50% of CHD and almost 75% of stroke in developed countries is due to systolic blood pressure levels in excess of 115mmHg 2.
In 2004, the INTERHEART study estimated that 22% of heart attacks in Western Europe and 25% of heart attacks in Central and Eastern Europe were due to a history of high blood pressure, and that those with a history of hypertension were at just under twice the risk of a heart attack compared to those with no history of hypertension 3.
The 2006 National Institute of Health and Clinical Excellence (NICE) guidelines recommended persistent high blood pressure of 160/100 mmHg (or 140/90 mmHg with higher CVD risk) as the threshold for offering drug treatments, and that optimal blood pressure treatment targets are 140/90 mmHg 4 (Table 5.1).
Rates of hypertension have dropped slightly in England since 1998, for both men and women at all ages. The largest decreases have occurred at older ages. For example, 73% of women aged 65 to 74 had hypertension in 1998 compared to 63% in 2010 (Table 5.2 and Figure 5.2).
In the 2010 Health Survey for England, 31% of men and 29% of women had hypertension (defined here as a systolic blood pressure of 140mmHg or over, or a diastolic blood pressure of 90mmHg or over) or were being treated for hypertension. Of those who were treated, 41% of men and 42% of women remained hypertensive (Table 5.3).
The prevalence of hypertension increases with age in both sexes. For example, only 3% of women aged 16 to 24 are hypertensive, compared to 47% aged 55 to 64 and 63% aged 65 to 74 (Table 5.3 and Figure 5.3).
Data from the Scottish Health Survey suggest that the prevalence of high blood pressure is similar in England and Scotland. In 2010, 32% of English men and 29% of English women were hypertensive compared to 35% of Scottish men and 30% of Scottish women 5 (Table 5.4).
Data from Wales and Northern Ireland are not comparable with those for England and Scotland, as they are not based on direct blood pressure measurements. The Welsh Health Survey 2010 showed that 20% of men and women reported being treated for raised blood pressure (Table 5.5).
For men in England, the lowest levels of hypertension are found in the West Midlands (27%), and the highest levels are found in the East Midlands and Yorkshire and the Humber (36%). For women, the lowest levels are found in London, South East, South Central and South West (25%) and the highest levels are found in the North East (33%) (Table 5.6).
The prevalence of hypertension in men does not seem to vary by income quintile. In 2006, the prevalence was around 30% for each quintile. This is not the case for women where the prevalence of high blood pressure in the lowest income quintile is about 50% higher than in the highest income quintile (Table 5.7).

British Heart Foundation and University of Oxford 161
Data from the Health Survey for England show that in 2004 the proportion of Bangladeshi men with high blood pressure was half that of the general population; in Pakistani and Chinese men the proportion was two thirds that of the general population. Pakistani and Chinese women were half as likely to have high blood pressure compared to women in the general population. The prevalence of untreated hypertension was lower among Pakistani, Bangladeshi and Chinese men and Indian, Pakistani, Bangladeshi and Chinese women than in the general population 6 (Table 5.8).
In 2008, the WHO Global Health Observatory published that in the WHO-Europe region the prevalence of hypertension ranged from 33% in Israel to 48% in Armenia. The prevalence in the UK was 37% (Table 5.9).
Blood CholesterolRisk of CHD is directly related to blood cholesterol levels. Blood cholesterol levels can be reduced by drugs, physical activity and by dietary changes, in particular a reduction in the consumption of saturated fat.
Research from the World Health Organization highlights the importance of raised blood cholesterol as a risk factor for CHD. The World Health Report 2002 estimates that around 8% of all disease burden in developed countries is caused by raised blood cholesterol, and that over 60% of CHD and around 40% of ischaemic stroke in developed countries is due to total blood cholesterol levels in excess of 3.8mmol/l 2.
More recently the INTERHEART case-control study estimated that 45% of heart attacks in Western Europe and 35% of heart attacks in Central and Eastern Europe are due to abnormal blood lipids, and that those with abnormal lipids are at over three times the risk of a heart attack compared to those with normal lipids 3.
Different guidelines give slightly different advice for managing high levels of blood cholesterol (hyperlipidaemia) 7,8. A joint publication by a series of UK cardiovascular societies in 2005 suggests that a threshold of 4.0mmol/l should be used to monitor treatment in individuals with CVD or at high risk of CVD. However, the National Institute of Health and Clinical Excellence recommends retaining the threshold of 5.0mmol/l for tracking levels of raised cholesterol, since many individuals will be unable to sustain a cholesterol level lower than 4.0mmol/l (Table 5.10).
High-density lipoprotein cholesterol (HDL-cholesterol) is the fraction of cholesterol that removes cholesterol (via the liver) from the blood. Low levels of HDL-cholesterol are associated with an increased risk of CHD and a worse prognosis after a heart attack. Guidelines on HDL-cholesterol generally recommend treatment for those with concentrations below 1.0mmol/l (Table 5.10).
The mean blood cholesterol level for men aged 16 and over in England in 2008 was 5.2mmol/l and for women 5.4mmol/l. Around 58% of men and 61% women had blood cholesterol levels of 5.0mmol/l and above 9. In Scotland, the mean blood cholesterol level in 2008 was 5.2mmol/l for men and 5.3mmol/l for women, and the proportion of people with levels of 5.0mmol/l and above continues to reduce with 57% of men and 58% of women aged 16 to 64 10 (Table 5.11 and Figure 5.11).
The prevalence of raised cholesterol increases with age in both men and women until the mid 50s. In 2008, the proportion of men with cholesterol levels of 5.0mmol/l or above was 25% in those aged 16 to 24 compared to around 76% in those aged 45 to 54. The proportion of women aged 16 to 24 with cholesterol levels of 5.0mmol/l or above was 36% compared to 83% in those aged 55 to 64, and slightly lower in those over 65 years (Table 5.11 and Figure 5.11).
The mean HDL-cholesterol level for those aged 16 and over in England in 2008 for women was 1.6mmol/l, and 1.3mmol/l for men 9. Overall, about 7% of men and 2% of women had HDL-cholesterol levels of less than 1.0mmol/l in England. In 2008, about 18% of men and 6% of women had HDL-cholesterol levels of less than 1.0mmol/l in Scotland 11 (Table 5.12).
The prevalence of low HDL-cholesterol showed less age-related variation, with no clear pattern. Rates of low HDL-cholesterol are much higher in men than women – over five times higher overall. The greatest difference being in the 65-74 group in which the rate of low HDL-cholesterol was 1.1% for women and 8.8% for men (Table 5.12).
In both England and Scotland, the prevalence of raised total cholesterol fell between 1994 and 2008 for both men and women. In England, the prevalence of raised total cholesterol in men decreased in all age groups between 2003 and 2008 with the largest decrease in the 75 and over group which experienced a 24% drop. Similarly for women, the over 75 group also experienced the biggest reduction (16%). The prevalence of raised total cholesterol in women deceased for all age groups except for the 16 to 24 group which was slightly higher than in 2003. In older age groups (55 and older in men and 65 and older in women) the prevalence of raised total cholesterol has fallen steadily over the past decade (Table 5.11) 10.
In 2008, the proportion of people with total cholesterol levels of 5mmol/l and over ranged between 52% and 64% for different regions of England for men, and between 56% and 68% for women. London had the lowest prevalence of raised cholesterol for men (52%) and North East had the lowest for women (56%). South Central had the highest prevalence in men (64%) but the East Midlands had the highest prevalence for women (68%) (Table 5.13).
162 Coronary heart disease statistics 2012
Total blood cholesterol levels show little socioeconomic variation in either sex. However, low HDL-cholesterol levels vary with income; those with higher incomes are less likely to have levels of HDL-cholesterol below 1.0mmol/l (Tables 5.14).
In 2004, the prevalence of blood cholesterol levels of 5.0mmol/l and above, was lower in all ethnic minority groups than the general population, with the exception of the Irish ethnic group. The highest rates of HDL-cholesterol below 1.0mmol/l for both sexes were found in the Indian, Pakistani and Bangladeshi communities. One fifth of Bangladeshi and Pakistani men had HDL-cholesterol levels of less than 1.0mmol/l compared to 6% of men in the general population. In contrast, Black African men and Black Caribbean women and Chinese women had a relatively low prevalence of low HDL-cholesterol (Table 5.15).
Overweight and ObesityOverweight and obesity increase the risk of CHD. As well as being an independent risk factor, obesity is also a major risk factor for high blood pressure, raised blood cholesterol, diabetes and impaired glucose tolerance 12. The adverse effects of excess weight are more pronounced when fat is concentrated in the abdomen. This is known as central or abdominal obesity and is assessed using the waist to hip ratio or waist circumference 13.
The World Health Report 2002 estimated that over 7% of all disease burden in developed countries was caused by raised body mass index (BMI), and that around a third of CHD and ischaemic stroke and almost 60% of hypertensive disease in developed countries was due to overweight 2.
The INTERHEART case-control study estimated that 63% of heart attacks in Western Europe and 28% of heart attacks in Central and Eastern Europe were due to abdominal obesity (a high waist to hip ratio), and those with abdominal obesity were at over twice the risk of a heart attack compared to those without 3. This study also found that abdominal obesity was a much more significant risk factor for heart attack than BMI.
In 2004, an obesity target for children in England was introduced by the Department of Health to halt the year-on-year rise in obesity in children under 11 by 2010. A more general aim to address the increasing rates of obesity in the population was also put forward. In Scotland a target was set to reduce the rate of increase in the proportion of children with their Body Mass Index outside a healthy range by 2018 and in Northern Ireland a target was to halt the rise in obesity in the general population by March 2010. There are currently no targets for overweight and obesity in Wales (Table 5.16).
In England in 2010, around 42% of men and 32% of women were overweight (a BMI of 25-30 kg/m2), and an additional 27% of men and 26% of women were obese (a BMI of more than 30 kg/m2). Central obesity was also common among adults in England. In 2008, data show that around 34% of men and 46% of women had central obesity (Tables 5.17 and 5.18).
Generally overweight and obesity increases with age. In 2010, about 35% of men and 32% of women aged 16 to 24 were overweight or obese compared to 81% of men and 74% of women aged 65 to 74 (Table 5.17 and Figure 5.17). The prevalence of central obesity also generally increased with age, especially in men. About 13% of men and 18% of women aged 16 to 24 had central obesity compared to 49% of men and 64% of women aged 65 to 74 (Table 5.18).
The classification of overweight and obesity in children and adolescents is more problematic than in adults. Constant changes in body composition during growth mean that the relationship between BMI and adiposity during childhood is age-dependent, and further complicated by race and gender. There is no clear agreement on the best way to define overweight and obesity in children. The International Obesity Taskforce (IOTF) has developed an international classification based on age and sex-specific BMI cut-off points. UK data is sometimes reported using the National BMI percentile classification where children are classified as overweight or obese using the 85th and 95th percentiles as cut points. These two methods of classification result in different estimates of childhood overweight and obesity 14.
The National BMI classification has been used in the 2010 Health Survey for England. This survey found just less than a third of boys (31%) and girls (29%) in England aged 2 to 15 years were either overweight or obese 15 (Table 5.19). The National Child Measurement Programme found that 22% of reception class (ages 4 to 5 years) and 33% of year 6 (ages 10 to 11 years) children were either overweight or obese (Tables 5.20).
Overweight and obesity has been increasing rapidly. In England, the percentage of men aged 16 and over who are obese rose from 14% in 1994 to 26% in 2010, and for women who are obese, from 17% in 1994 to 26% in 2010. The increase in obesity was particularly marked among men aged 45 to 74, approximately doubling between 1994 and 2008 (Table 5.21 and Figure 5.21).

British Heart Foundation and University of Oxford 163
The high levels of overweight and obesity among children are likely to exacerbate the trend towards overweight and obesity in the adult population, since compared to non-obese children, obese children have a high risk of becoming overweight adults 16. Between 1995 and 2010 the prevalence of obesity among English boys increased from 11% to 17% and from 12% to 15% among English girls, and overweight (including obesity) increased from 24% to 31% in boys and 25% to 29% in girls over the same time period. Less data are available for trends in overweight (including obesity) in Scotland, but estimates suggest a similar increase in the prevalence of overweight in boys – from 28% in 1998 to 36% in 2008 and decreased to 31% in 2010 . Over the same time period the prevalence of overweight in girls in both England and Scotland has remained reasonably stable (Table 5.22 and Figure 5.22).
In England in 2010, about two thirds of men were overweight or obese with very little variation by Government Office Region. The highest prevalence was found in the West Midlands (72%) and the lowest in London (64%). For women, the prevalence of overweight and obesity was lower than for men, with the highest prevalence in East and East Midlands (63%) and the lowest in South East (50%). Recent evidence suggests that rates of obesity among women are rising faster in the North than the South of England. This pattern is not observed in men, where rates appear to be rising uniformly across England 17 (Table 5.23).
Among women, obesity rates vary considerably by household income. In 2010, 34% of women from the lowest quintile of household income were obese compared to 17% in the highest quintile. Much less variation was found in men (Table 5.24). In both men and women, the prevalence of central obesity was higher among households with lower income. In 2010, 36% of men and 53% of women from the lowest quintile of household income had a raised waist circumference compared to 33% of men and 36% of women in the highest quintile. Much less variation was found in men (Table 5.25).
Levels of general and abdominal obesity vary with ethnicity in both men and women in England. Because individuals from different ethnic groups tend to store fat in different places of the body and therefore have different body shapes, it is useful to compare measurements generated by the different techniques when considering ethnic differences in obesity. Using the Body Mass Index (BMI) method, in 2004 the prevalence of obesity in men was substantially lower in the South Asian community, and also in Chinese men than in the general population. Using this definition as few as 6% of Chinese and Bangladeshi men were defined as obese, compared to 23% of men in the general population aged 16 and over. Similarly, the prevalence of obesity in Bangladeshi and Chinese women was lower than the general population when measured by BMI, although the difference was not as substantial. However, this difference is entirely removed when the Waist-to-Hip
Ratio (WHR) method is used – using this technique the prevalence of obesity in Bangladeshi men is similar to that of men in the general population (around one in three men), and the prevalence of obesity in Bangladeshi women is higher than that of women in the general population. Ethnic differences in obesity measured using Waist Circumference (WC) are similar to those found using the WHR method, with a few exceptions. For example, using WHR the prevalence of obesity in Indian men (38%) is more than double the prevalence in Black African men (16%) – however, the prevalence of obesity in these ethnic groups using the WC method is very similar (around one in five men in both ethnic groups) (Table 5.26 and Figures 5.26a and 5.26b).
Data from the WHO Global Infobase 18 suggest that the prevalence of adult overweight and obesity in the UK is among the highest in Europe. In 2006, the International Obesity Taskforce collated data on overweight and obesity in children worldwide. Caution should be used in interpreting these data as the studies used different age groups and different definitions of overweight and obesity. For boys, the countries with overweight (including obesity) levels of 30% or more were Cyprus (30.2%), Malta (31%), Spain (32.9%) and Italy (35.9%). For girls, Italy reported more than 35% as overweight or obese (Table 5.27).
DiabetesThere are two categories of diabetes: type 1 and type 2 19. Diabetes substantially increases the risk of CHD. Men with non-insulin dependent (Type 2) diabetes have a two to fourfold greater annual risk of CHD, with an even higher (three to fivefold) risk in women with Type 2 diabetes 20. The INTERHEART case-control study estimated that 15% of heart attacks in Western Europe are due to diagnosed diabetes, and that people with diagnosed diabetes are at three times the risk of a heart attack compared to those without 21.
The prevalence of diabetes increases with age and is higher in men than in women. The prevalence of diabetes in men is around 6% and in women is around 5%, although these rates vary around the UK. The prevalence of diabetes is highest in Wales, where 7% of men and 6% of women have been diagnosed with the disease. Most diagnosed cases of diabetes are type 2 diabetes – around 90% of diagnosed diabetes in England were type 2 in 2006 (Tables 5.28, 5.29, 5.30 and 5.31).
Not all diabetes is diagnosed. The Health Survey for England in 2003 measured blood glucose levels of all respondents aged over 35 and found that 3.1% of men and 1.5% of women had undiagnosed diabetes 21.

164 Coronary heart disease statistics 2012
The prevalence of diabetes has been measured sporadically since the early 1990s in a number of national health surveys in England, Wales, Scotland and Northern Ireland. Comparing the results of these surveys suggests that prevalence of diabetes has been increasing since the early 1990s and is still on the increase. In England, male and female prevalence rates have more than doubled since 1991. In Scotland prevalence of diabetes increased between 2003 and 2008 by 40% for men and just under 20% for women (Table 5.32, Figure 5.32).
There is substantial geographic variation in the prevalence of diabetes in the UK. As mentioned earlier, prevalence in Wales is higher than in Scotland, England and Northern Ireland. Within England, both male and female prevalence rates are generally lower in the South of England, with the exception of London. Female prevalence rates in Yorkshire and the Humber (5.4%) are more than double rates in the South West (2.6%) (Table 5.33).
For women, the prevalence of diabetes appears to be socially patterned. In 2009 the Health Survey for England showed that the prevalence of diabetes in women in the lowest quintile of income (6.3%) was far higher than for women in the highest quintile of income (1.2%). The pattern was not as clear for men (Table 5.34).
The prevalence of diabetes varies dramatically by ethnic group within the UK. In 2004, the prevalence of diabetes among some ethnic minority groups in England was much higher than in the general population. In Black Caribbean and Indian men, the prevalence of diagnosed diabetes was more than twice that found in the general population, in contrast the prevalence in Chinese and Irish men were lower than the general population. The prevalence for Black Caribbean and Pakistani women was two and a half times that of the general population. In contrast, the prevalence of diabetes in Black African and Irish women was substantially lower than in the general population (Table 5.35, Figure 5.35).
There is some variation in the prevalence of diabetes by country in Europe. In 2009, European Health for All Database found that national diabetes prevalence rates range from less than 1% to 4.8%. There does not appear to be a consistent geographic pattern to these prevalence rates (Table 5.36).
1. Prospective Studies Collaboration (2002) Age-specific relevance of usual blood pressure to vascular mortality: a meta analysis of individual data for one million adults in 61 prospective studies. The Lancet; 360: 1903-1913.
2. World Health Organization (2002) The World Health Report 2002. Reducing Risks, Promoting Healthy Life. World Health Organization: Geneva.
3. Yusuf S, Hawken S, Ounpuu S, Dans T, Avezum A, Lanas F, McQueen M, Budaj A, Pais P, Varigo J, Lisheng A, on behalf of the INTERHEART Study Investigators (2004) Effect of potentially modifiable risk factors associated with myocardial infarction in 52 countries (the INTERHEART Study): case-control study. The Lancet; 364: 937-952.
4. National Institute for Health and Clinical Excellence (2006) Hypertension: Management of hypertension in adults in primary care. NICE: London.
5. The Scottish Health Survey (SHS) uses the same methods as the Health Survey for England.
6. See Table 7.3, page 32 in The Health of Minority Ethnic Groups – headline tables (2005) Health Survey for England 2004. NHS Health and Social Care Information Centre.
7. Institute for Health and Clinical Excellence (2008) Lipid modification. NICE: London.
8. Department of Health (2000) National Service Framework for Coronary Heart Disease. DH: London.
9. Joint Health Surveys Unit (2009) Health Survey for England 2008. Physical activity and fitness. The Information Centre: Leeds.
10. The reporting trends in raised cholesterol levels in England are complicated due to different weighting of results in the 2003 and later surveys.
11. Scottish Executive (2010) The Scottish Health Survey 2008. Personal communication.
12. World Health Organization (2000) Obesity – preventing and managing the global epidemic. Report of a WHO Consultation on Obesity. World Health Organization: Geneva.
13. Central obesity is commonly defined as a waist-hip ratio of 0.95 and over in men and 0.85 and over in women. Raised waist circumference is defined as a waist measurement greater than 102cm for men and greater than 88cm for women.
14. For details of the International classification system see Department of Health (2003) Health Survey for England 2002. The Stationery Office: London. Because of differences in definition and measurement, direct comparison of adult (Table 11.2) and childhood (Table 11.6) tables in this chapter is inappropriate.
15. Overweight and obesity estimates derived using the alternative National BMI percentiles classification showed no marked sex differences whereas the International classification may under-estimate obesity prevalence among boys.
16. Serdula M, Ivery D, Coates R, Freedman D, Williamson D and Byers T (1993) Do obese children become obese adults? A review of the literature. Prev Med 22:167-177.
17. Scarborough P, Allender S (2008). The North - South gap in overweight and obesity in England. British Journal of Nutrition, 100; 677-684.
18. World Health Organization (2012) Global Infobase. Available at https://apps.who.int/infobase/ accessed July 2012.
19. See glossary for definition.
20. Garcia MJ, McNamara PM, Gordon T, Kannell WB (1974). Morbidity and mortality in the Framingham population. Sixteen year follow up. Diabetes; 23: 105-111.
21. Joint Health Surveys Unit (2004) Health Survey for England 2003. The Stationery Office: London.

British Heart Foundation and University of Oxford 165
Table 5.1 Blood pressure recommendations and hypertension definition for the United Kingdom
Recommendations
Systolic blood pressure – general population No greater than 140mmHg
Systolic blood pressure – diabetes or chronic renal failure sufferers No greater than 130mmHg
Diastolic blood pressure – general population No greater than 85mmHg
Diastolic blood pressure – diabetes or chronic renal failure sufferers No greater than 80mmHg
Hypertension
DefinitionSystolic blood pressure greater than or equal to 140mmHg, and / or diastolic blood pressure greater than or equal to 90mmHg
Threshold for drug treatmentSustained levels of systolic blood pressure greater than or equal to 160mmHg, and / or diastolic blood pressure greater than or equal to 100mmHg
Sources: Williams B, Poulter NR, Brown MJ et al (2004). Guidelines for management of hypertension: report of the fourth working party of the British Hypertension Society 2004-BHS IV. Journal of Human Hypertension. 18; 139-185. ¶ National Institute for Health and Clinical Excellence (2006). Hypertension: Management of hypertension in adults in primary care. NICE: London.

166 Coronary heart disease statistics 2012
Table 5.2Prevalence of high blood pressure, by sex and age, England 1998 to 2010
1998 2000 2001 2002 2003 2005 2006 2007 2008 2009 2010
% % % % % % % % % % %
Men
All ages 41 40 41 37 38 39 39 31 32 32 31
16-24 16 12 20 14 11 9 10 8 7 6 5
25-34 21 21 18 17 13 17 18 13 13 15 6
35-44 26 27 23 24 21 26 18 15 18 17 25
45-54 42 41 41 36 37 33 35 33 33 33 37
55-64 60 54 58 53 53 53 51 50 52 53 51
65-74 70 70 68 62 65 64 63 63 62 58 65
75 and over 73 65 70 71 67 69 68 62 68 73 79
Base
All ages 5,401 2,552 4,840 2,161 4,108 1,916 3,924 2,021 4,350 1,365 2,139
16-24 594 260 516 947 370 185 335 285 657 208 341
25-34 984 424 711 308 557 243 473 329 697 209 369
35-44 981 510 917 445 806 312 715 380 827 255 404
45-54 981 429 877 348 699 351 663 340 697 230 380
55-64 766 378 786 335 736 367 739 316 672 204 296
65-74 665 323 660 287 577 264 592 218 462 149 214
75 and over 430 228 373 184 363 194 407 154 338 110 135
Women
All ages 33 33 35 34 32 29 31 29 29 27 29
16-24 4 4 5 4 2 1 1 1 2 1 3
25-34 7 6 7 6 5 4 3 6 5 5 4
35-44 13 10 12 12 10 10 10 12 13 12 10
45-54 31 31 34 33 24 23 26 26 25 25 26
55-64 52 52 54 52 47 42 42 43 41 41 47
65-74 73 75 74 70 68 62 66 61 62 60 63
75 and over 78 81 79 79 77 73 73 74 73 64 79
Base
All ages 6,483 3,046 5,813 2,668 5,075 2,392 4,838 2,090 4,507 1,454 2,200
16-24 692 268 582 1,145 479 216 411 262 604 194 286
25-34 1,142 516 896 380 715 325 602 326 661 219 328
35-44 1,190 621 1,144 554 994 429 965 387 827 272 412
45-54 1,164 562 1,056 440 837 453 810 330 742 230 391
55-64 896 419 866 408 889 431 870 318 689 220 323
65-74 751 366 716 324 617 298 638 235 496 161 245
75 and over 648 294 553 274 544 240 542 230 488 159 215
Notes:Informants were classified as having high blood pressure if their systolic blood pressure was 140mmHg or over or their diastolic blood pressure was 90mmHg or over, or they were taking medicine prescribed for blood pressure. ¶ All data are presented unweighted for analysis of trends. ¶ The measurement of blood pressure in the Health Survey for England series changed in 2003.
Source:Joint Health Surveys Unit (2011) Health Survey for England 2010. Adult trend tables. www.ic.nhs.uk (accessed June 2012). Copyright © 2011, Re-used with the permission of The Health and Social Care Information Centre. All rights reserved

British Heart Foundation and University of Oxford 167
Figure 5.2a Prevalence of high blood pressure in men, by age, England 1998 to 2010
Figure 5.2b Prevalence of high blood pressure in women, by age, England 1998 to 2010
Prev
alen
ce (%
)
1998
2000
2001
2002
2003
2005
2006
2007
2008
2009
2010
0
10
20
30
40
50
60
70
80
90
16-24
25-34
35-44
45-54
55-64
65-74
75 and over
Prev
alen
ce (%
)
1998
2000
2001
2002
2003
2005
2006
2007
2008
2009
2010
0
10
20
30
40
50
60
70
80
90
16-24
25-34
35-44
45-54
55-64
65-74
75 and over

168 Coronary heart disease statistics 2012
Table 5.3 Blood pressure levels, by sex and age, England 2010
All ages 16–24 25–34 35–44 45–54 55–64 65–74 75+
Blood pressure level % % % % % % % %
Men
Normotensive untreated 69 95 94 75 63 49 35 21
Normotensive treated 10 4 10 18 27 42
Hypertensive treated 7 0 1 5 12 21 25
Hypertensive untreated 15 5 6 20 22 20 18 12
All with high blood pressure 32 5 6 25 37 51 65 79
Base 2,139 341 369 404 380 296 214 135
Women
Normotensive untreated 71 97 96 90 74 54 37 21
Normotensive treated 11 1 1 2 8 19 24 35
Hypertensive treated 8 0 0 1 4 11 19 31
Hypertensive untreated 10 2 3 6 14 17 20 14
All with high blood pressure 29 3 4 10 26 47 63 79
Base 2,200 286 328 412 391 323 245 215
Notes:Informants were classified as having high blood pressure if their systolic blood pressure was 140mmHg or over or their diastolic blood pressure was 90mmHg or over, or they were taking medicine affecting blood pressure. ¶ “Treated” means taking medication prescribed for high blood pressure. ¶ Data are weighted for non response.
Source:Joint Health Surveys Unit (2011) Health Survey for England 2010. The Information Centre: Leeds. Copyright © 2011, Re-used with the permission of The Health and Social Care Information Centre. All rights reserved.

British Heart Foundation and University of Oxford 169
Figure 5.3 Prevalence of high blood pressure, by sex and age, England 2010
Prev
alen
ce (%
)
WomenMen
16–24 25–34 35–44 45–54 55–64 65–74 75+
0
10
20
30
40
50
60
70
80
90

170 Coronary heart disease statistics 2012
Table 5.4 Blood pressure levels, by sex and age, Scotland 2008/09
All ages 16–24 25–34 35–44 45–54 55–64 65–74 75+
Blood pressure level % % % % % % % %
Men
Normotensive untreated 65 86 85 76 68 48 29 33
Normotensive treated 8 0 0 2 7 19 23 19
Hypertensive treated 6 0 0 3 7 6 22 19
Hypertensive untreated 20 15 12 19 19 28 26 30
All with high blood pressure 35 15 12 24 32 52 71 68
Base 953 63 100 162 169 193 168 98
Women
Normotensive untreated 70 99 94 89 70 52 33 30
Normotensive treated 8 0 0 3 8 12 20 21
Hypertensive treated 8 0 0 0 6 11 20 29
Hypertensive untreated 14 2 6 9 16 25 27 20
All with high blood pressure 30 2 6 11 30 48 67 70
Base 1,213 99 140 230 208 237 180 119
Notes: Aged 16 and over and with a valid blood pressure reading.
Source: Scottish Executive (2010). Scottish Health Survey. http://www.scotland.gov.uk/Publications (accessed June 2012).

British Heart Foundation and University of Oxford 171
Figure 5.4 Prevalence of high blood pressure, by sex and age, Scotland 2008/09
Prev
alen
ce (%
)
WomenMen
16–24 25–34 35–44 45–54 55–64 65–74 75+
0
10
20
30
40
50
60
70
80

172 Coronary heart disease statistics 2012
Table 5.5 Prevalence of high blood pressure, by sex and age, Wales 2010
All ages 16-24 25-34 35-44 45-54 55-64 65-74 75+
% % % % % % % %
Men 20 0 1 7 19 35 46 50
Base 7,420 882 831 1,082 1,333 1,361 1,109 822
Women 20 1 1 7 13 30 45 59
Base 8,579 919 1,073 1,330 1,472 1,520 1,247 1,018
Notes: Data refer to adults over 16 years of age who are currently being treated for high blood pressure, and are not based upon blood pressure measurements. ¶ Because of differences in data collection techniques, these results are incomparable with prevalence estimates for England and Scotland collected by the Health Survey series.
Source: Welsh Assembly Government (2011) Welsh Health Survey 2010. Welsh Assembly: Cardiff.
Table 5.6 Blood pressure levels, by sex and Strategic Health Authority, England 2008
North East
North West
Yorkshire and the
Humber
East Midlands
West Midlands
East of
EnglandLondon
South East
Coast
South Central
South West
% % % % % % % % % %
Men
Normotensive untreated 70 71 64 64 73 68 72 69 70 69
Normotensive treated 7 6 7 7 9 8 11 9 8 7
Hypertensive treated 7 5 8 8 5 6 5 7 7 5
Hypertensive untreated 16 18 20 21 13 19 12 15 15 19
All with high blood pressure 30 29 36 36 27 32 28 31 30 31
Base 294 530 428 425 396 468 417 338 323 422
Women
Normotensive untreated 67 70 71 69 70 70 75 75 75 75
Normotensive treated 11 7 9 9 11 10 11 8 8 7
Hypertensive treated 7 7 8 8 6 8 7 4 7 7
Hypertensive untreated 14 16 12 14 13 12 7 12 10 12
All with high blood pressure 33 30 29 31 30 30 25 25 25 25
Base 340 681 542 508 479 536 511 437 397 505
Notes: Data are weighted for non response. ¶ Informants were classified as having high blood pressure if their systolic blood pressure was 140mmHg or over or their diastolic blood pressure was 90mmHg or over, or they were taking medicine affecting blood pressure. ¶ “Treated” means taking medication prescribed for high blood pressure. ¶ Adults aged 16 and over.
Source:Joint Health Surveys Unit (2010). Health Survey for England 2008: Physical activity and fitness. The Information Centre: Leeds. Copyright © 2010, Re-used with the permission of The Health and Social Care Information Centre. All rights reserved
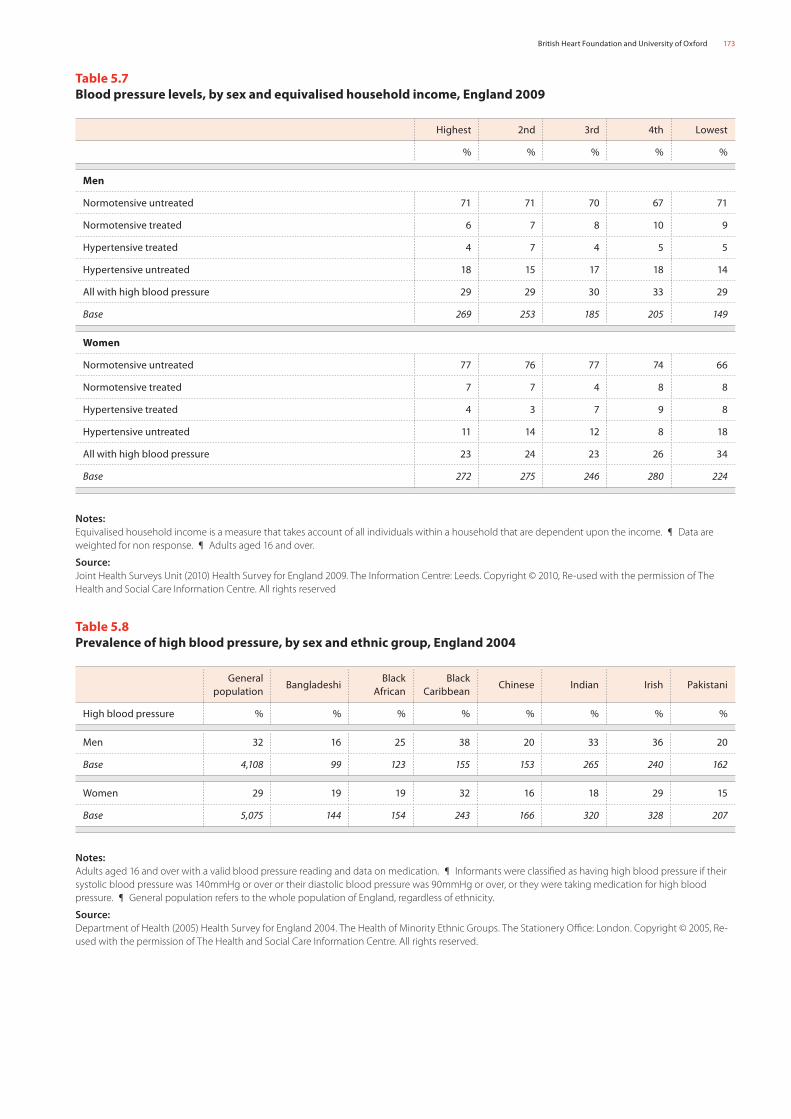
British Heart Foundation and University of Oxford 173
Table 5.7 Blood pressure levels, by sex and equivalised household income, England 2009
Highest 2nd 3rd 4th Lowest
% % % % %
Men
Normotensive untreated 71 71 70 67 71
Normotensive treated 6 7 8 10 9
Hypertensive treated 4 7 4 5 5
Hypertensive untreated 18 15 17 18 14
All with high blood pressure 29 29 30 33 29
Base 269 253 185 205 149
Women
Normotensive untreated 77 76 77 74 66
Normotensive treated 7 7 4 8 8
Hypertensive treated 4 3 7 9 8
Hypertensive untreated 11 14 12 8 18
All with high blood pressure 23 24 23 26 34
Base 272 275 246 280 224
Notes:Equivalised household income is a measure that takes account of all individuals within a household that are dependent upon the income. ¶ Data are weighted for non response. ¶ Adults aged 16 and over.
Source:Joint Health Surveys Unit (2010) Health Survey for England 2009. The Information Centre: Leeds. Copyright © 2010, Re-used with the permission of The Health and Social Care Information Centre. All rights reserved
Table 5.8 Prevalence of high blood pressure, by sex and ethnic group, England 2004
Generalpopulation
BangladeshiBlack
AfricanBlack
CaribbeanChinese Indian Irish Pakistani
High blood pressure % % % % % % % %
Men 32 16 25 38 20 33 36 20
Base 4,108 99 123 155 153 265 240 162
Women 29 19 19 32 16 18 29 15
Base 5,075 144 154 243 166 320 328 207
Notes:Adults aged 16 and over with a valid blood pressure reading and data on medication. ¶ Informants were classified as having high blood pressure if their systolic blood pressure was 140mmHg or over or their diastolic blood pressure was 90mmHg or over, or they were taking medication for high blood pressure. ¶ General population refers to the whole population of England, regardless of ethnicity.
Source:Department of Health (2005) Health Survey for England 2004. The Health of Minority Ethnic Groups. The Stationery Office: London. Copyright © 2005, Re-used with the permission of The Health and Social Care Information Centre. All rights reserved.

174 Coronary heart disease statistics 2012
Table 5.9 Prevalence of high blood pressure, by sex, Europe 2008
Men Women Total
% % %
Albania 48.0 42.0 44.9
Andorra 42.6 30.9 36.7
Armenia 49.8 46.0 47.8
Austria 42.6 33.4 38.0
Azerbaijan 46.0 41.1 43.4
Belarus 51.2 42.3 46.6
Belgium 39.3 30.4 34.8
Bosnia and Herzegovina 47.2 46.6 47.1
Bulgaria 48.1 40.9 44.5
Croatia 49.8 43.4 46.7
Cyprus 42.4 32.0 37.0
Czech Republic 47.6 37.6 42.7
Denmark 40.6 28.4 34.5
Estonia 52.9 42.2 47.3
Finland 47.4 36.3 41.9
France 42.3 29.3 35.7
Georgia 49.9 43.5 46.5
Germany 44.8 34.3 39.7
Greece 39.4 32.7 36.1
Hungary 50.0 41.0 45.5
Iceland 40.2 27.3 33.8
Ireland 47.0 34.2 40.6
Israel 37.4 29.9 33.6
Italy 42.2 33.6 37.9
Kazakhstan 48.5 41.4 44.8
Kyrgyzstan 47.1 42.8 45.0
Latvia 51.2 42.2 46.6
Lithuania 52.1 43.4 47.7
Luxembourg 42.1 31.3 36.7
Malta 43.3 33.8 38.6
Montenegro 49.6 42.0 45.6
Netherlands 42.4 30.8 36.6
Norway 46.3 35.2 40.9
Poland 49.3 42.4 46.0
Portugal 46.5 37.4 41.9
Republic of Moldova 48.4 43.3 45.9
Romania 47.1 41.7 44.5
Russian Federation 46.2 41.3 43.8
Serbia 50.1 43.0 46.6
Slovakia 49.6 42.0 45.8
Slovenia 50.4 42.3 46.4
Spain 41.5 31.7 36.7
Sweden 43.1 32.5 37.9
Switzerland 41.6 28.2 34.8
Tajikistan 46.4 43.3 44.8
TFYR Macedonia 48.0 42.6 45.4
Turkey 36.2 35.8 36.1
Turkmenistan 47.0 42.2 44.6
Ukraine 52.2 44.6 48.3
United Kingdom 42.2 32.8 37.5
Uzbekistan 41.5 36.5 39.1
Notes: Adults aged 25 years and over. ¶ Age-standardized estimate of prevalence of raised blood pressure (SBP≥140 OR DBP≥90 OR on medication).
Source: WHO Global Health Observatory. http://www.who.int/gho/ncd/risk_factors/blood_pressure_prevalence/en/index.html (Accessed June 2012).

British Heart Foundation and University of Oxford 175
Figure 5.9 Prevalence of high blood pressure, by country, Europe 2008
Table 5.10Cholesterol recommendations for the United Kingdom
United Kingdom
Total cholesterol 1 <4.0mmol/l in individuals with established cardiovascular disease, diabetes, or at high risk of developing cardiovascular disease.
HDL cholesterol 2 ≥ 1mmol/l in individuals with established cardiovascular disease, and those at high risk of the disease.
Target 3 An ‘audit’ level of total cholesterol of 5 mmol/l should be used to assess progress in people with CVD, in recognition that more than a half of patients will not achieve a total cholesterol of less than 4 mmol/l or an LDL cholesterol of less than 2 mmol/l.
Notes: The original recommendation for total cholesterol levels of less than 5mmol/l for individuals with cardiovascular disease, diabetes, or at high risk of developing cardiovascular disease, originally set in 1998 by the Joint British Societies is retained for audit purposes.
Source: 1. British Cardiac Society, British Hypertension Society, Diabetes UK, HEART UK, Primary Care Cardiovascular Society, The Stroke Association (2005). JBS2: Joint British Societies’ guidelines on prevention of cardiovascular diseases in clinical practices. Heart. 91 (suppl V): v1-v52. ¶ 2. Sacks FM, for the expert group on HDL-cholesterol (2002). The role of high density lipoprotein (HDL) cholesterol on the prevention of coronary heart disease; Expert group recommendations. American Journal of Cardiology. 90: 139-143. ¶ 3. National Institute for Health and Clinical Excellence (2008) Lipid modification. NICE: London.
Prev
alen
ce (%
)
Isra
elIc
elan
dD
enm
ark
Belg
ium
Switz
erla
ndFr
ance
Gre
ece
Turk
eyN
ethe
rland
sA
ndor
raLu
xem
bou
rgSp
ain
Cyp
rus
Uni
ted
King
dom
Ital
ySw
eden
Aus
tria
Mal
taU
zbek
ista
nG
erm
any
Irel
and
Nor
way
Finl
and
Port
ugal
Cze
ch R
epub
licA
zerb
aija
nRu
ssia
n Fe
dera
tion
Bulg
aria
Rom
ania
Turk
men
ista
nKa
zakh
stan
Tajik
ista
nA
lban
iaKy
rgyz
stan
TFYR
Mac
edon
iaH
unga
ryM
onte
negr
oSl
ovak
iaRe
pub
lic o
f Mol
dova
Pola
ndSl
oven
iaG
eorg
iaBe
laru
sLa
tvia
Serb
iaC
roat
iaBo
snia
and
Her
zego
vina
Esto
nia
Lith
uani
aA
rmen
iaU
krai
ne
0
10
20
30
40
50
60

176 Coronary heart disease statistics 2012
Table 5.11 Prevalence of high cholesterol levels, by sex and age, England 1994 to 2008
All ages 16–24 25–34 35–44 45–54 55–64 65–74 75+
% % % % % % % %
Men
1994 75 32 61 82 88 90 87 79
1998 66 23 50 70 78 81 76 72
2003 unweighted 70 28 60 77 82 81 69 63
2003 weighted 66 26 60 77 81 80 67 64
2006 57 20 53 68 74 73 54 47
2008 58 25 52 74 76 70 53 39
Women
1994 77 44 57 70 82 95 97 93
1998 67 27 44 59 74 88 91 89
2003 unweighted 71 34 50 62 78 88 87 82
2003 weighted 66 31 55 69 79 84 77 75
2006 61 31 42 58 78 84 76 67
2008 61 36 42 56 76 83 75 66
Unweighted base (2008):
Men 3,349 295 418 613 597 675 440 311
Women 3,925 276 501 741 730 781 489 407
Notes:Data from 1994 to 1998 are unweighted data, for 2003 weighted and unweighted data is shown, for 2006 only weighted data are presented. ¶ High cholesterol levels >5.0 mmol/l total cholesterol.
Source:Joint Health Surveys Unit (2009) Health Survey for England 2008. The Information Centre: Leeds, and previous editions. Copyright © 2009, Re-used with the permission of The Health and Social Care Information Centre. All rights reserved.

British Heart Foundation and University of Oxford 177
Figure 5.11 Prevalence of high cholesterol levels, of 5.0mmol/l and over, England 2008
Table 5.12 Low HDL cholesterol by sex and age, England 2008
All ages 16–24 25–34 35–44 45–54 55–64 65–74 75+
% % % % % % % %
Men 7.2 4.8 7.4 7.5 7.6 7.6 8.8 6.9
Women 1.7 3.4 2.1 1.1 1.6 1.0 1.1 1.4
Base
Men 3,349 295 418 613 597 675 440 311
Women 3,924 276 501 741 730 780 489 407
Notes:Data are weighted for non response. ¶ Low HDL cholesterol levels diagnosed by ≤1.0mmol/l total HDL cholesterol.
Source:Joint Health Surveys Unit (2009) Health Survey for England 2008. Physical activity and fitness. The Information Centre: Leeds. Copyright © 2009, Re-used with the permission of The Health and Social Care Information Centre. All rights reserved.
Prev
alen
ce (%
)
WomenMen
16–24 25–34 35–44 45–54 55–64 65–74 75+
0
10
20
30
40
50
60
70
80
90

178 Coronary heart disease statistics 2012
Table 5.13 Prevalence of high total cholesterol levels and low HDL cholesterol levels, by sex, English Strategic Health Authority and Scotland 2008
Scotland
North East
North
West
Yorkshire an
d the H
umb
er
East M
idlan
ds
West
Mid
land
s
East Eng
land
Lond
on
South East
Coast
South C
entral
South W
est
% % % % % % % % % % %
Men
≥ 5.0mmol/l total cholesterol 57 57 57 58 58 58 54 52 62 64 59
≤ 1.0mmol/l HDL cholesterol 18.3 7.9 7.3 4.6 7.8 7.3 8.5 7.6 9.0 4.7 7.4
Women
≥ 5.0mmol/l total cholesterol 58 56 60 61 68 61 61 57 65 61 64
≤ 1.0mmol/l HDL cholesterol 5.5 3.1 2.0 1.6 1.2 1.5 1.6 2.5 0.7 1.5 0.4
Base
Men 341 242 476 375 307 318 366 368 299 249 349
Women 344 260 558 448 353 402 374 409 380 299 441
Notes: Data are weighted for non-response, and estimates are age-standardised to account for differing age structures. ¶ Adults aged 16 and over.
Source:Joint Health Surveys Unit (2009) Health Survey for England 2008. Physical activity and fitness. The Information Centre: Leeds. Copyright © 2009, Re-used with the permission of The Health and Social Care Information Centre. All rights reserved. ¶ Scottish Executive (2010). Scottish Health Survey 2008.Personal communication.

British Heart Foundation and University of Oxford 179
Table 5.14 Prevalence of high total cholesterol levels and low HDL cholesterol levels, by sex and equivalised household income, England 2006
Equivalised household income quintile
Highest 2nd 3rd 4th Lowest
Men
Mean HDL cholesterol 1.4 1.4 1.3 1.3 1.3
% < 1.0 mmol/l HDL cholesterol 7.6 5.6 10.6 11.0 14.4
Mean total cholesterol 5.3 5.4 5.2 5.3 5.2
% ≥ 5.0 mmol/l total cholesterol 59 60 57 58 53
Women
Mean HDL cholesterol 1.7 1.6 1.6 1.5 1.5
% < 1.0 mmol/l HDL cholesterol 0.5 1.1 1.6 2.3 4.2
Mean total cholesterol 5.5 5.4 5.5 5.3 5.4
% ≥ 5.0 mmol/l total cholesterol 64 60 64 58 64
Base
Men 720 697 605 488 376
Women 708 724 732 731 515
Notes: Data are weighted for non response and age-standardised. ¶ Adults aged 16 and over. ¶ For method of age-standardisation see source.
Source:Joint Health Surveys Unit (2008) Health Survey for England 2006. Cardiovascular disease and risk factors. The Information Centre: Leeds. Copyright © 2008, Re-used with the permission of The Health and Social Care Information Centre. All rights reserved

180 Coronary heart disease statistics 2012
Table 5.15 Prevalence of high total cholesterol levels and low HDL cholesterol levels, by sex and ethnic group, England 2004
General
pop
ulation (2003)
Banglad
eshi
Black A
frican
Black C
aribb
ean
Chinese
Ind
ian
Irish
Pakistani
% % % % % % % %
Men
≥ 5.0mmol/l total cholesterol 66 60 55 51 60 60 67 55
≤ 1.0mmol/l HDL cholesterol 6 20 2 4 8 11 5 20
Women
≥ 5.0mmol/l total cholesterol 67 55 44 56 52 53 67 53
≤ 1.0mmol/l HDL cholesterol 2 8 3 1 1 4 2 6
Base
Men 3,814 87 103 137 101 234 244 137
Women 4,460 98 118 195 108 256 300 143
Notes:Data are weighted for non-response and age-standardised. ¶ General population refers to the whole population of England, regardless of ethnicity. ¶ For method of age-standardisation see source. ¶ Adults aged 16 and over.
Source:Department of Health (2006) Health Survey for England 2004. The Health of Minority Ethnic Groups. The Stationery Office: London. Copyright © 2006, Re-used with the permission of The Health and Social Care Information Centre. All rights reserved

British Heart Foundation and University of Oxford 181
Table 5.16 Obesity targets for the United Kingdom
England1
ChildrenTo halt the year-on-year rise in obesity among children under 11 by 2010 in the context of a broader strategy to tackle obesity in the population as a whole.
Scotland2
ChildrenReduce the rate of increase in the proportion of children with their Body Mass Index outside a healthy range by 2018.
Wales No target set.
Northern Ireland3 To halt the rise in obesity by March 2010.
Source: 1. Department of Health (2004) National Standards, Local Action: Health and Social Care Standards and Planning Framework 2005/06 and 2007/08. DH: London. PSA Target 3. ¶ 2. The Scottish Government (2007). National Indicators. The Scottish Government: Edinburgh ¶ 3. Northern Ireland Audit Office (2009). Obesity and Type 2 Diabetes in Northern Ireland. NIAO: Belfast.

182 Coronary heart disease statistics 2012
Table 5.17 Body mass index (BMI) by sex and age, England 2010
All ages 16–24 25–34 35–44 45–54 55–64 65–74 75+
% % % % % % % %
Men
Body Mass Index (kg/m2)
Less than 18.5 1 5 2 0 0 0 0 0
18.5 to less than 25 31 61 41 24 21 19 18 24
25 to less than 30 42 22 37 49 44 44 53 50
30 to less than 40 25 12 17 26 33 34 27 25
40 or more 2 0 2 2 2 2 1 1
Prevalence of obese (≥30 kg/m2) 26 13 19 28 35 37 28 26
Base 3,144 334 431 553 533 552 446 295
Women
Body Mass Index (kg/m2)
Less than 18.5 2 6 2 2 0 1 0 2
18.5 to less than 25 40 62 49 42 36 29 26 33
25 to less than 30 32 21 28 30 34 39 37 32
30 to less than 40 22 9 18 22 26 28 32 25
40 or more 4 2 3 4 5 4 5 2
Prevalence of obese (≥30 kg/m2) 26 11 21 26 30 32 37 27
Base 3,843 387 559 693 750 613 460 381
Notes: Adults with a valid height and weight measurement. ¶ Data are weighted for non-response. ¶ BMI Categories- Under weight: Less than 18.5, Normal weight: 18.5 to less than 25, Over weight: 25 to less than 30, Obese: more than 30
Source:Joint Health Surveys Unit (2011) Health Survey for England 2010. The Information Centre: Leeds. Copyright © 2011, Re-used with the permission of The Health and Social Care Information Centre. All rights reserved.

British Heart Foundation and University of Oxford 183
Figure 5.17 Prevalence of overweight and obesity, by sex and age, England 2010
Table 5.18 Mean waist circumference and percentage with raised waist circumference, by sex and age, England 2010
All ages 16-24 25-34 35-44 45-54 55-64 65-74 75+
% % % % % % % %
Men
Mean waist circumference (cm) 98 86 93 99 101 103 103 102
% raised waist circumference 34 13 17 35 42 50 49 47
Base 2,364 207 291 415 410 427 355 259
Women
Mean waist circumference (cm) 88.3 80 84 88 90 93 93 91
% raised waist circumference 46 18 34 45 50 62 64 59
Base 3,037 266 381 548 608 514 377 343
Notes: Raised waist circumference: greater than 102 cm in men and greater than 88 cm in women.
Source:Joint Health Surveys Unit (2011) Health Survey for England 2010. The Information Centre: Leeds. Copyright © 2011, Re-used with the permission of The Health and Social Care Information Centre. All rights reserved.
Prev
alen
ce (%
)
WomenMen
16–24 25–34 35–44 45–54 55–64 65–74 75+
0
10
20
30
40
50
60
70
80
90

184 Coronary heart disease statistics 2012
Table 5.19 Prevalence of overweight and obesity in children, by sex and age, England 2010
Age (years)
2 – 10 11 – 15 Total
Boys
Overweight 14 14 14
Obese 15 20 17
Total overweight and obese 30 34 31
Base 1,466 837 2,303
Girls
Overweight 13 17 14
Obese 14 17 15
Total overweight and obese 27 33 29
Base 1,453 766 2,219
Notes: Overweight is defined as ≥ 85th UK National BMI percentile; obese is defined as ≥95th UK National BMI percentile.
Source: Joint Health Surveys Unit (2011) Health Survey for England 2010. The Information Centre: Leeds. Copyright © 2011, Re-used with the permission of The Health and Social Care Information Centre. All rights reserved.

British Heart Foundation and University of Oxford 185
Table 5.20 Prevalence of body mass index (BMI) status categories in children, by sex and school year, England 2010/11
Underweight Healthy Weight Overweight Obese Base
% % % %
Reception
Boys 1.2 75.0 13.8 10.1 276,750
Girls 0.8 77.9 12.6 8.8 264,505
Both 1.0 76.4 13.2 9.4 541,255
Year 6
Boys 1.1 64.0 14.3 20.6 254,006
Girls 1.5 66.6 14.4 17.4 241,347
Both 1.3 65.3 14.4 19.0 495,353
Notes: Definitions based on UK national BMI reference charts.
Source: Department of Health Cross-Government Obesity Unit (2011). Lifestyle Statistics / National Child Measurement Programme 2010/11. The Information Centre: Leeds.

186 Coronary heart disease statistics 2012
Table 5.21 Prevalence of obesity, by sex and age, England 1994 to 2010
All ages 16–24 25–34 35–44 45–54 55–64 65–74 75+
% % % % % % % %
Men
1994 14 6 10 16 18 18 18 16
1998 17 5 17 18 22 24 22 16
2003 22 9 19 26 29 28 30 21
2006 24 10 22 27 30 36 32 18
2008 24 8 19 28 32 36 35 23
2010 26 13 19 28 35 37 28 26
Women
1994 17 9 14 19 19 28 27 17
1998 21 12 18 24 26 31 31 22
2003 23 15 21 26 31 31 33 27
2006 24 13 20 27 30 33 39 29
2008 25 15 22 29 32 34 37 27
2010 26 11 21 26 30 32 37 27
Base (2010)
Men 3,144 334 431 553 533 552 446 295
Women 3,843 387 559 693 750 613 460 381
Notes: Data from 1994 to 1998 are unweighted data, from 2003 onwards weighted data are presented. ¶ Obesity defined as BMI ≥ 30kg/m2
Source:Joint Health Surveys Unit (2011) Health Survey for England 2010. The Information Centre: Leeds, and previous editions. Copyright © 2011, Re-used with the permission of The Health and Social Care Information Centre. All rights reserved.

British Heart Foundation and University of Oxford 187
Figure 5.21 Prevalence of obesity, by sex , England 1994 to 2010
Prev
alen
ce (%
)
WomenMen
1994
1998
2003
2006
2008
2010
0
5
10
15
20
25
30
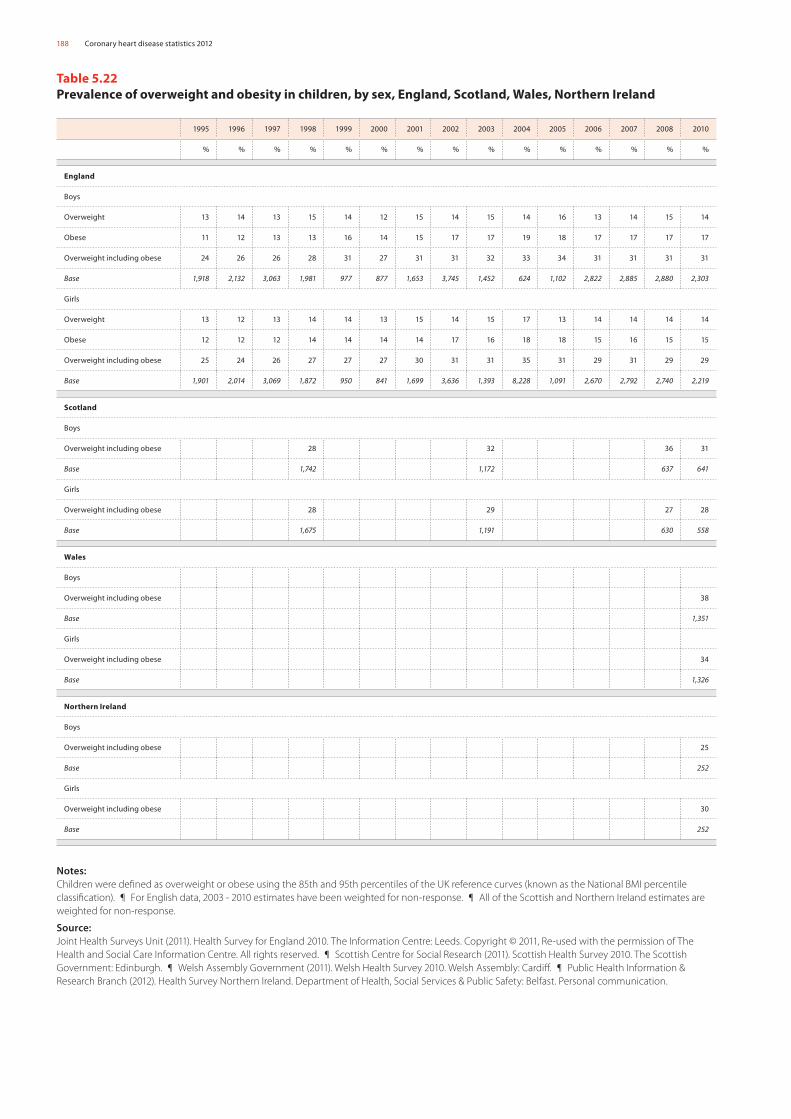
188 Coronary heart disease statistics 2012
Table 5.22 Prevalence of overweight and obesity in children, by sex, England, Scotland, Wales, Northern Ireland
1995 1996 1997 1998 1999 2000 2001 2002 2003 2004 2005 2006 2007 2008 2010
% % % % % % % % % % % % % % %
England
Boys
Overweight 13 14 13 15 14 12 15 14 15 14 16 13 14 15 14
Obese 11 12 13 13 16 14 15 17 17 19 18 17 17 17 17
Overweight including obese 24 26 26 28 31 27 31 31 32 33 34 31 31 31 31
Base 1,918 2,132 3,063 1,981 977 877 1,653 3,745 1,452 624 1,102 2,822 2,885 2,880 2,303
Girls
Overweight 13 12 13 14 14 13 15 14 15 17 13 14 14 14 14
Obese 12 12 12 14 14 14 14 17 16 18 18 15 16 15 15
Overweight including obese 25 24 26 27 27 27 30 31 31 35 31 29 31 29 29
Base 1,901 2,014 3,069 1,872 950 841 1,699 3,636 1,393 8,228 1,091 2,670 2,792 2,740 2,219
Scotland
Boys
Overweight including obese 28 32 36 31
Base 1,742 1,172 637 641
Girls
Overweight including obese 28 29 27 28
Base 1,675 1,191 630 558
Wales
Boys
Overweight including obese 38
Base 1,351
Girls
Overweight including obese 34
Base 1,326
Northern Ireland
Boys
Overweight including obese 25
Base 252
Girls
Overweight including obese 30
Base 252
Notes:Children were defined as overweight or obese using the 85th and 95th percentiles of the UK reference curves (known as the National BMI percentile classification). ¶ For English data, 2003 - 2010 estimates have been weighted for non-response. ¶ All of the Scottish and Northern Ireland estimates are weighted for non-response.
Source:Joint Health Surveys Unit (2011). Health Survey for England 2010. The Information Centre: Leeds. Copyright © 2011, Re-used with the permission of The Health and Social Care Information Centre. All rights reserved. ¶ Scottish Centre for Social Research (2011). Scottish Health Survey 2010. The Scottish Government: Edinburgh. ¶ Welsh Assembly Government (2011). Welsh Health Survey 2010. Welsh Assembly: Cardiff. ¶ Public Health Information & Research Branch (2012). Health Survey Northern Ireland. Department of Health, Social Services & Public Safety: Belfast. Personal communication.

British Heart Foundation and University of Oxford 189
Figure 5.22 Prevalence of obese children, by sex, England 1995 to 2010
Prev
alen
ce (%
)
GirlsBoys
1995
1996
1997
1998
1999
2000
2001
2002
2003
2004
2005
2006
2007
2008
2010
0
2
4
6
8
10
12
14
16
18
20

190 Coronary heart disease statistics 2012
Table 5.23 Prevalence of Body mass index (BMI) status categories, by sex and Strategic Health Authority, England 2010
BMI <25 BMI ≥25 < 30 BMI ≥30 BMI ≥25
Unweighted basesNormal Overweight Obese
Overweight including obese
% % % %
Strategic Health Authority (SHA)
Men
North East 28 43 27 69 249
North West 30 41 26 67 425
Yorkshire and the Humber 30 42 26 68 296
East Midlands 28 40 30 69 309
West Midlands 27 45 28 72 317
East of England 33 40 27 67 363
London 35 40 25 64 302
South East Coast 29 46 23 69 270
South Central 33 40 28 67 279
South West 34 41 29 66 334
Women
North East 40 31 30 60 341
North West 42 33 25 58 497
Yorkshire and the Humber 37 32 30 61 363
East Midlands 35 33 30 63 374
West Midlands 39 35 25 60 374
East of England 46 28 25 53 418
London 39 32 24 56 381
South East Coast 48 28 22 50 362
South Central 37 36 26 61 338
South West 42 31 26 56 395
Notes: Adults aged 16 and over. ¶ Data are weighted for non-response.
Source: Joint Health Surveys Unit (2011) Health Survey for England 2010. The Information Centre: Leeds. Copyright © 2011, Re-used with the permission of The Health and Social Care Information Centre. All rights reserved.

British Heart Foundation and University of Oxford 191
Table 5.24 Body mass index, by sex and equivalised household income quintile, England 2010
Equivalised household income quintile
Highest 2nd 3rd 4th Lowest
% % % % %
Body mass index (kg/m2)
Men
BMI < 25: Normal 28 26 31 34 34
BMI ≥ 25 < 30: Overweight 47 26 38 37 35
BMI ≥ 30: Obese 24 27 29 28 28
BMI ≥ 25: Overweight including obese 71 73 67 65 63
Unweighted bases 617 587 543 482 353
Women
BMI < 25: Normal 48 42 38 36 36
BMI ≥ 25 < 30: Overweight 32 34 34 29 28
BMI ≥ 30: Obese 17 23 26 33 34
BMI ≥ 25: Overweight including obese 49 57 60 63 62
Unweighted bases 643 674 651 644 548
Notes:Adults aged 16 and over. ¶ Data are weighted for non-response.
Source: Joint Health Surveys Unit (2011) Health Survey for England 2010. The Information Centre: Leeds. Copyright © 2011, Re-used with the permission of The Health and Social Care Information Centre. All rights reserved.
Table 5.25 Raised waist circumference, by sex and equivalised household income quintile, England 2010
Equivalised household income quintile
Highest 2nd 3rd 4th Lowest
% % % % %
Raised waist circumference
Men 33 34 32 41 36
Unweighted bases 474 459 427 372 283
Women 36 42 50 52 53
Unweighted bases 514 535 546 490 438
Notes:Adults aged 16 and over. ¶ Data are weighted for non-response.
Source: Joint Health Surveys Unit (2011) Health Survey for England 2010. The Information Centre: Leeds. Copyright © 2011, Re-used with the permission of The Health and Social Care Information Centre. All rights reserved.

192 Coronary heart disease statistics 2012
Table 5.26Body mass index (BMI), waist-hip ratio and waist circumference, by sex and ethnic group, England 2004
General
pop
ulation
Banglad
eshi
Black African
Black Carib
bean
Chinese
Ind
ian
Irish
Pakistani
Men
Mean Body Mass Index (BMI) 27.1 24.7 26.4 27.1 24.1 25.8 27.2 25.9
Percentage with BMI of 30 kg/m2 and over 23 6 17 25 6 14 25 15
Mean waist-hip ratio 0.92 0.91 0.87 0.90 0.87 0.92 0.93 0.92
Percentage with waist-hip ratio 0.95 and over 33 32 16 25 17 38 36 36
Mean waist circumference 96.5 88.7 90.6 92.5 86.8 93.0 97.3 95.0
Percentage with waist circumference 102cm and over 31 12 19 22 8 20 33 30
Women
Mean Body Mass Index (BMI) 26.8 25.7 28.8 28.0 23.2 26.2 26.7 27.1
Percentage with BMI of 30 kg/m2 and over 23 17 38 32 8 20 21 28
Mean waist-hip ratio 0.82 0.85 0.81 0.83 0.81 0.82 0.83 0.84
Percentage with waist-hip ratio 0.85 and over 30 50 32 37 22 30 37 39
Mean waist circumference 86.4 85.7 90.2 88.4 77.6 83.9 87.4 87.7
Percentage with waist circumference 88cm and over 41 43 53 47 16 38 43 48
Bases (unweighted)
Men 5,397 138 156 209 182 310 311 197
Women 5,554 171 200 314 185 345 405 224
Notes:Adults aged 16 and over. ¶ Data are weighted for non-response. ¶ ‘General population’ refers to the whole population of England, regardless of minority ethnic groups.
Source:Joint Health Surveys Unit (2005) Health Survey for England 2004. The Health of Minority Ethnic Groups. Department of Health: London. Copyright © 2005, Re-used with the permission of The Health and Social Care Information Centre. All rights reserved.

British Heart Foundation and University of Oxford 193
Figure 5.26a Body mass index, waist-hip ratio and waist circumference in men, by ethnic group, England 2004
Figure 5.26b Body mass index, waist-hip ratio and waist circumference in women, by ethnic group, England 2004
Prev
alen
ce (%
)
Waist-hip ratio 0.95 and over Waist circumference 102cm and overBMI of 30 kg/m2 and over
Black Caribbean Black African Indian Pakistani Bangladeshi Chinese Irish General population
0
5
10
15
20
25
30
35
40
Prev
alen
ce (%
)
Waist-hip ratio 0.95 and over Waist circumference 102cm and overBMI of 30 kg/m2 and over
Black Caribbean Black African Indian Pakistani Bangladeshi Chinese Irish General population
0
10
20
30
40
50
60

194 Coronary heart disease statistics 2012
Table 5.27 Prevalence of childhood overweight, by sex, Europe latest available year
Year Age group (years) Boys Girls
% %
Austria 2003 8 to 12 22.5 16.7
Belgium 1998-2009 5 to 15 27.3 26.7
Bulgaria 2004 5 to 17 22.0 17.9
Crete 2005-06 10 to 12 45.0 37.0
Cyprus 2003 11 30.2 28.8
Czech Republic 2005 6 to 17 24.6 16.8
Denmark 1996-2007 5 to 16 14.1 15.3
England 2009 5 to 17 21.8 26.1
Estonia* 2005-06 11, 13 & 15 12.7 7.0
Finland 2005-06 11, 13 & 15 18.7 13.0
France 2006-07 3 to 17 13.1 14.9
Germany 2008 4 to 16 22.6 17.7
Greece 2003 13 to 17 27.8 16.0
Hungary 2005 7 to 14 25.5 25.9
Iceland 1998 9 22.0 25.5
Italy 2008 8 to 9 35.9† 35.9†
Latvia* 2005-06 11, 13 & 15 10.0 5.7
Luxembourg* 2005-07 11, 13 & 15 15.0 10.0
Malta* 2005-06 11, 13 & 15 31.0 28.0
Netherlands 2003 5 to 16 14.7 17.9
Northern Ireland 2005 2 to 15 27.0 25.0
Norway 2003-06 5 to 15 12.9 14.7
Poland 2000 7 to 17 16.3 12.4
Portugal 2008 10 to 18 23.5 21.6
Poland 2000 7 to 17 16.3 12.4
Romania* 2005-06 11, 13 & 15 14.7 8.7
Russian Federation 2005 7 to 11 17.3 16.9
Slovakia 2001 7 to 17 17.5 16.2
Slovenia 2007 6 to 17 28.7 24.4
Spain 1999-2000 5 to 17 32.9 22.9
Sweden 2000 10 17.0 19.5
Switzerland 2007 6 to 13 16.7 13.1
Turkey 2001 12 to 17 11.3 10.3
Notes: All studies used IOTF definitions for childhood overweight and obesity, except Austria and Belgium, which used 90th and 85th percentiles of reference populations. ¶ *indicates self-reported data. ¶ † Italy: study did not provide results by gender, therefore results for all children combined are presented.
Source: International obesity taskforce (2012) Global Childhood Overweight. IOTF. http://www.iaso.org/iotf/obesity/. (Accessed June 2012)

British Heart Foundation and University of Oxford 195
Table 5.28 Prevalence of diagnosed diabetes, by sex and age, England 2010
All ages 16-24 25-34 35-44 45-54 55-64 65-74 75+
% % % % % % % %
Men 6.3 0.5 1.3 2.5 6.9 11.1 15.2 15.9
Base 4,179 646 701 755 721 607 429 318
Women 5.3 0.4 1.7 2.5 4.1 8 12.2 13.2
Base 4,329 610 686 760 730 631 470 442
Notes: Prevalence rates are weighted for non-response.
Source: Joint Health Surveys Unit (2011) Health Survey for England 2010. The Information Centre: Leeds. Copyright © 2011, Re-used with the permission of The Health and Social Care Information Centre. All rights reserved
Table 5.29 Prevalence of diagnosed diabetes, by sex and age, Scotland 2008/09
All ages 16-24 25-34 35-44 45-54 55-64 65-74 75+
% % % % % % % %
Men 5.8 0.3 1.1 1.3 5.7 11.9 13.2 14.2
Base 6,130 518 723 1,013 1,139 1,100 970 667
Women 4.3 0.9 1.5 2.2 3.2 6.4 9 9.9
Base 7,866 719 1,031 1,428 1,365 1,367 1,066 890
Notes: Prevalence rates are weighted for non-response. ¶ Respondents were prompted to recall whether they had ever been diagnosed with diabetes by a doctor.
Source: Scottish Centre for Social Research (2011) Scottish Health Survey 2009 revisions. The Scottish Government: Edinburgh.

196 Coronary heart disease statistics 2012
Table 5.30 Prevalence of diagnosed diabetes, by sex and age, Wales 2010
All ages 16-24 25-34 35-44 45-54 55-64 65-74 75+
% % % % % % % %
Men 7 0 1 4 7 12 15 16
Base 7,420 882 831 1,082 1,333 1,361 1,109 822
Women 6 1 1 2 5 7 12 14
Base 5,879 919 1,073 1,330 1,472 1,520 1,247 1,018
Notes: Prevalence rates are weighted for non-response. ¶ Respondents were prompted to recall whether they had ever been diagnosed with diabetes by a doctor.
Source: Welsh Assembly Government (2011) Welsh Health Survey 2010. Welsh Assembly: Cardiff.
Table 5.31 Prevalence of diagnosed diabetes, by sex and age, Northern Ireland 2005/06 and 2010/11
2005/06 2010/11
All ages 16-24 25-34 35-44 45-54 55-64 65-74 75+ All ages
% % % % % % % % %
Men 4 0 0 1 5 8 8 14 5
Base 1,743 153 278 344 305 275 236 152
Women 4 0 1 1 2 5 11 10 5
Base 2,497 254 428 501 417 334 312 251
Notes: Respondents were prompted to recall whether they had ever been diagnosed with diabetes by a doctor.
Source: Central Survey Unit (2007) Northern Ireland Health and Wellbeing Survey 2005/06. Northern Ireland Statistics and Research Agency: Belfast. ¶ Public Health Information & Research Branch (2012). Health Survey Northern Ireland. Department of Health, Social Services & Public Safety: Belfast

British Heart Foundation and University of Oxford 197
Table 5.32 Prevalence of diagnosed diabetes, by sex and country, United Kingdom 1991 to 2010
1991 1993 1994 1998 2001 2003 2004 2005 2006 2007 2008 2009 2010Unweighted
base (latest year)
% % % % % % % % % % % % %
Men
England 2 3 2.9 3.3 4.3 5.6 6.5 6.3 6,854
Scotland 3.8 5.8 2,841
Wales 5 6 7 6 7 7 7 7,412
Northern Ireland 4 4 1,743
Women
England 2 2 1.9 2.5 3.4 4.2 4.5 5.3 7,307
Scotland 3.7 4.3 3,622
Wales 5 4 5 6 6 6 6 8,606
Northern Ireland 2 4 2,497
Notes:Estimates are reported to the appropriate level of accuracy – one decimal place where possible, no decimal places when not. ¶ Estimates are based on self-report of being diagnosed for diabetes by a doctor. ¶ Methods are broadly comparable across studies, but small differences may affect comparability. ¶ For example, some, but not all, of the estimates are weighted for non-response. ¶ All estimates are for adults aged 16 and over. ¶ See source for details.
Source:Joint Health Surveys Unit (2011) Health Survey for England 2010. The Information Centre: Leeds, and previous editions. Copyright © 2011, Re-used with the permission of The Health and Social Care Information Centre. All rights reserved. ¶ Scottish Centre for Social Research (2011) Scottish Health Survey 2009 revisions. The Scottish Government: Edinburgh, and previous editions. ¶ Welsh Assembly Government (2011) Welsh Health Survey 2010. Welsh Assembly: Cardiff, and previous editions. ¶ Central Survey Unit (2007) Northern Ireland Health and Wellbeing Survey 2005/06. Northern Ireland Statistics and Research Agency: Belfast, and previous editions.

198 Coronary heart disease statistics 2012
Figure 5.32a Prevalence of diagnosed diabetes in men, by country, United Kingdom 1991 to 2010
Figure 5.32b Prevalence of diagnosed diabetes in women, by country, United Kingdom 1991 to 2010
Prev
alen
ce (%
)
D. Northern IrelandC. WalesB. ScotlandA. England
1991
1992
1993
1994
1995
1996
1997
1998
1999
2000
2001
2002
2003
2004
2005
2006
2007
2008
2009
2010
0
1
2
3
4
5
6
7
8
A.
D.
C.
B.
Prev
alen
ce (%
)
1991
1992
1993
1994
1995
1996
1997
1998
1999
2000
2001
2002
2003
2004
2005
2006
2007
2008
2009
2010
0
1
2
3
4
5
6
7
D. Northern IrelandC. WalesB. ScotlandA. England
A.
C.
B.
D.

British Heart Foundation and University of Oxford 199
Table 5.33 Prevalence of diagnosed diabetes, by sex and Government Office Region, England 2006
North EastNorth West
Yorkshire and the
Humber
East Midlands
West Midlands
East of England
London South EastSouth
West
% % % % % % % % %
Men 5.2 6.5 6.3 4.6 5.8 5.4 6.0 4.7 4.9
Unweighted base 298 847 570 548 576 651 678 929 528
Women 4.8 4.3 5.4 4.1 5.4 4.2 4.3 3.9 2.6
Unweighted base 389 1,030 732 692 748 740 763 1,135 696
Notes:Estimates are based on self-report of being diagnosed with diabetes by a doctor. ¶ Adults aged 16 and over. ¶ Estimates are age-standardised and have been weighted for non-response.
Source:Joint Health Surveys Unit (2008) Health Survey for England 2006. Cardiovascular disease and risk factors. The Information Centre: Leeds. Copyright © 2008, Re-used with the permission of The Health and Social Care Information Centre. All rights reserved
Table 5.34 Prevalence of diagnosed diabetes, by sex and household income, England 2009
Equivalised household income tertile
Highest Middle Lowest
% % %
Men 4.8 8.3 6.0
Base 681 557 483
Women 1.2 4.9 6.3
Base 703 699 642
Notes: Estimates are based on self-report of being diagnosed with diabetes by a doctor. ¶ Adults aged 16 and over. ¶ Estimates are age-standardised and have been weighted for non-response.
Source:Joint Health Surveys Unit (2010) Health Survey for England 2009. The Information Centre: Leeds. Copyright © 2010, Re-used with the permission of The Health and Social Care Information Centre. All rights reserved

200 Coronary heart disease statistics 2012
Table 5.35 Prevalence of diagnosed diabetes, by sex and ethnic group, England 2004
General population
BangladeshiBlack
AfricanBlack
CaribbeanChinese Indian Irish Pakistani
% % % % % % % %
Men
Type 1 0.6 0.2 0.7 0.5 0.3 0.9
Type 2 3.8 8.0 4.3 9.5 3.4 9.2 3.6 7.3
Types 1 and 2 combined 4.3 8.2 5.0 10.0 3.8 10.1 3.6 7.3
Unweighted base 6,602 411 390 414 348 550 497 433
Women
Type 1 0.3 0.6 0.1 0.8 0.3 0.2
Type 2 3.1 4.5 2.0 7.6 3.3 5.9 2.0 8.4
Types 1 and 2 combined 3.4 5.2 2.1 8.4 3.3 5.9 2.3 8.6
Unweighted base 8,234 478 469 653 375 634 656 508
Notes:Numbers may not add exactly due to rounding. ¶ Estimates are based on self-report of being diagnosed with diabetes by a doctor. ¶ Adults aged 16 and over. ¶ Estimates are age-standardised and have been weighted for non-response. ¶ General population refers to the whole population of England, regardless of ethnicity. ¶ Blank cells indicate non existence of data.
Source:Joint Health Surveys Unit (2005) Health Survey for England 2004. The Information Centre: Leeds. Copyright © 2005, Re-used with the permission of The Health and Social Care Information Centre. All rights reserved

British Heart Foundation and University of Oxford 201
Figure 5.35 Prevalence of diagnosed diabetes, by ethnic group, England 2004
Prev
alen
ce (%
)
WomenMen
General Black Caribbean Black African Indian Pakistani Bangladeshi Chinese Irish population
0
2
4
6
8
10
12

202 Coronary heart disease statistics 2012
Table 5.36 Prevalence of diabetes in adults, Europe 1980 to 2009
1980-84 1985-89 1990-94 1995-99 2000 2001 2002 2003 2004 2005 2006 2007 2008 2009
Albania 0.1 0.1 0.1
Armenia 0.6 0.8 1.1 1.1 1.1 1.1 1.1 1.0 1.1 1.1 1.2 1.3 1.4 1.5
Austria 4.7
Azerbaijan 0.6 0.5 0.5 0.6 0.6 0.6 0.6 0.6 0.8 0.9 1.1 1.2
Belarus 1.2 1.2 1.3 1.4 1.5 1.5 1.6 1.7 1.8 1.9 1.9 2.1
Belgium 2.9 3.2 2.8 3.5 3.6
Bosnia and Herzegovina 0.5 0.6 0.7 1.3 1.2 1.1 1.1 1.2 1.3 1.7 1.6 1.5 1.3
Bulgaria 1.0 1.2 1.2 1.6 1.7
Czech Republic 3.4 4.1 4.8 5.8 6.4 6.4 6.5 6.7 7.0 7.2 7.3 7.3 7.4 7.5
Denmark 2.4 2.4 2.8 3.0 3.2 3.5 3.8 4.0 4.2 4.4 4.7
Estonia 2.9
Finland 1.8 1.9 2.1 2.3 2.6 2.7 2.8 2.9 3.1 3.3 3.4 3.5 3.7 4.0
France 0.6 2.8 3.0
Georgia 1.0 1.1 1.0 1.1 1.1 1.1 1.2 1.3 1.3 1.4 1.5 1.6
Germany
Greece 0.2 0.2 0.2 0.2 0.2 0.2 0.2 0.1 0.2 0.2 0.2
Hungary 4.4
Iceland 0.1 0.1 0.2 0.2
Israel 2.6 3.0 3.2 3.7 3.9 4.1 4.7
Italy 3.7 4.2 4.5 4.6 4.8 4.8
Kazakhstan 0.7 0.6 0.7 0.6 0.8 0.9 0.8 0.9 0.9 1.0 1.2 1.1
Kyrgyzstan 0.2 0.4 0.4 0.4 0.4 0.4 0.5 0.5 0.5 0.5 0.5 0.5 0.6
Latvia 1.1 1.1 1.1 1.5 1.5 1.5 1.7 1.7 2.1 2.3 2.6 2.8 3.0
Lithuania 0.8 0.9 1.0 1.2 1.5 1.5 1.7 2.0 2.1 2.2 1.7 1.8 2.0 2.2
Malta 5.2 6.5 6.6 6.8 7.1 7.6 6.4
Netherlands 2.0 1.9 2.0 3.8
Norway 2.9 2.0
Portugal 6.1 4.8 6.5
Republic of Moldova 0.6 0.9 1.0 0.9 0.9 0.7 0.8 1.0 1.1 1.2 1.3 1.4 1.5 1.5
Romania 0.6 0.7 1.1 1.4 1.6 1.8 1.9 2.1 2.2 2.0 2.7 3.0 2.7
Russian Federation 1.0 1.3 1.3 1.4 1.5 1.5 1.6 1.7 1.8 1.9
Slovakia 2.8 3.3 3.8 4.2 4.7 4.9 5.1 5.2 5.3 5.3 5.5 5.7 5.6 6.2
Slovenia 2.5 2.8 3.4
Spain 5.0 5.1
Sweden 3.0 2.9
Tajikistan 0.3 0.2 0.3 0.2 0.1 0.1 0.2 0.2 0.2 0.2 0.2 0.3
TFYR Macedonia 1.1 0.8 1.0 1.0 1.1 1.1 1.3 1.3 1.4
Turkey 1.9
Turkmenistan 0.4 0.3 0.4 0.3 0.3 0.3 0.3 0.3 0.3 0.3 0.3 0.3
Ukraine 1.0 1.3 1.7 1.8 1.9 1.9 1.9 2.0 2.1 2.2 2.3 2.4 2.5 2.6
United Kingdom 3.5 3.7 3.9 4.1 4.3
Uzbekistan 0.4 0.4 0.5 0.4 0.3 0.3 0.4 0.4 0.4 0.4 0.4 0.6
Notes: Where years are given as 5-year ranges, values are the averages of available data for the 5 years. ¶ Empty cells indicate no data were available.
Source: WHO (2012) European Health for All Database. http://www.euro.who.int/en/what-we-do/data-and-evidence/databases/european-health-for-all-database-hfa-db2 (accessed July 2012).

British Heart Foundation and University of Oxford 203
6. Economic costs

204 Coronary heart disease statistics 2012
6. Economic costs
As well as human costs, both cardiovascular disease (CVD) and coronary heart disease (CHD) have major economic consequences for the United Kingdom. The economic costs provided here are the most up to date available, but are not comparable to previous estimates published in the Coronary Heart Disease Statistics series. While the methods used are similar between the 2006 and 2009 studies, the data which underlies the estimates for the two years differs. Consequently, data that may have previously been based on assumptions may now be based on actual data, and vice-versa.
Health care costsCVD cost the health care system in the UK around £8.6 billion in 2009 1,2. This represents a cost per capita of £141. The cost of hospital care for people who have CVD accounts for 50% of these costs, whereas 23% of the cost is due to drugs (Table 6.1 and Figure 6.1a).
CHD and stroke each cost the health care system in the UK around £1.8 billion in 2009 1,2. This represents a cost per capita of £29 each for the two conditions. The cost of hospital care for people who have CHD accounts for about 56% of these costs. The hospital costs for stroke account for 82% of the total health care costs (Table 6.1, Figures 6.1a to 6.1c).
Non-health care costsLooking only at the health care costs of CVD grossly underestimates the total cost of CVD in the UK. Production losses from death and illness in those of working age and from the informal care of people with the disease contribute greatly to the overall financial burden.
In 2009, production losses due to mortality and morbidity associated with CVD cost the UK over £6 billion, with around 21% of this cost due to death and 13% due to illness in those of working age. The cost of informal care for people with CVD in the UK was around £3.8 billion 3 in 2009 (Table 6.2).
In 2009, production losses due to mortality and morbidity associated with CHD cost the UK over £3 billion, with around 33% of this cost due to death and 14% due to illness in those of working age. The cost of informal care for people with CHD in the UK was around £1.7 billion 3 in 2009.
Production losses due to mortality and morbidity associated with stroke cost the UK almost £1 billion. The cost of informal care for people with stroke was £1 billion in 2009 (Table 6.2).
Total costsOverall CVD is estimated to cost the UK economy £19 billion a year. Of the total cost of CVD to the UK, around 46% is due to direct health care costs, 34% to productivity losses, and 20% to the informal care of people with CVD (Table 6.2).
Overall CHD is estimated to cost the UK economy over £6.7 billion a year. Of the total cost of CHD to the UK, around 27% is due to direct health care costs, 47% to productivity losses, and 26% to the informal care of people with CHD (Table 6.2).
International differencesTable 6.3 shows the relative costs of cardiovascular related diseases for the 27 member states of the European Union for 2009. The cost per capita of CVD is highest in Germany (€374) and lowest in Romania (€37). The cost in the UK (€156) is lower than the average for the European Union (€212) (Table 6.3).
1. The estimates for this chapter are from a cost of illness study by researchers at the Health Economics Research Centre, Department of Public Health, University of Oxford.
2. This estimate does not include the money spent on non-clinical activities concerned with the primary prevention of CVD and CHD, for example, public anti-smoking campaigns, nutrition education etc. However, the cost of drugs prescribed in primary care for both primary and secondary prevention is included.
3. The cost of informal care is equivalent to the opportunity costs of unpaid care. It is a measure of the amount of money that carers forgo to provide unpaid care for their spouse, friend or relative living with CVD.

British Heart Foundation and University of Oxford 205
Table 6.1 Health care costs of CVD, CHD and stroke (£ thousands), United Kingdom, 2009
CVD CHD Stroke
€ £ € £ € £
Primary care 1,247,279 1,123,675 120,364 108,436 44,438 40,034
Outpatient care 1,140,361 1,027,352 399,865 360,239 180,121 162,271
A&E 171,810 154,784 58,518 52,718 35,278 31,782
Inpatient care 4,843,730 4,363,721 1,122,043 1,010,850 1,623,543 1,462,651
Medications 2,232,610 2,011,360 296,609 267,216 95,651 86,172
Total health care costs 9,635,790 8,680,892 1,997,400 1,799,459 1,979,031 1,782,910
Cost per capita 156 141 32 29 32 29
Percentage of total health care expenditure 6% 6% 1% 1% 1% 1%
Notes: Estimates originally calculated in Euros. ¶ They have been converted using £1 = €1.11, the approximate exchange rate in 2009. ¶ For details of methods and sources used, see http://www.ehnheart.org/cvd-statistics.html
Source: Nichols M, Townsend N, Luengo-Fernandez R, Leal J, Grey A, Scarborough P, Rayner M (2012). European Cardiovascular Disease Statistics 2012. European Heart Network, Brussels, European Society of Cardiology, Sophia Antipolis.
Figure 6.1a Health care costs of cardiovascular disease (CVD), United Kingdom 2009
Figure 6.1bHealth care costs of coronary heart disease (CHD), United Kingdom 2009
Primary care (13%)
Outpatient care (12%)
A&E (2%)
Inpatient care (50%)
Medications (23%)
Primary care (6%)
Outpatient care (20%)
A&E (3%)
Inpatient care (56%)
Medications (15%)
Figure 6.1cHealth care costs of stroke, United Kingdom 2009
Primary care (2%)
Outpatient care (9%)
A&E (2%)
Inpatient care (82%)
Medications (5%)

206 Coronary heart disease statistics 2012
Table 6.2 Totals costs of CVD, CHD and stroke (£ thousands), United Kingdom 2009
CVD CHD Stroke
€ £% of total
€ £% of total
€ £% of total
Direct health care costs
9,635,790 8,680,892 46% 1,997,400 1,799,459 27% 1,979,031 1,782,910 48%
Productivity loss due to mortality
4,466,456 4,023,834 21% 2,473,550 2,228,423 33% 702,379 632,774 17%
Productivity loss due to morbidity
2,715,698 2,446,575 13% 1,021,775 920,518 14% 353,501 318,469 9%
Informal care costs
4,215,296 3,797,564 20% 1,915,000 1,725,225 26% 1,118,357 1,007,529 27%
Total 21,033,240 18,948,865 7,407,725 6,673,626 4,153,267 3,741,682
Notes: Estimates originally calculated in Euros. ¶ They have been converted using £1 = €1.11, the approximate exchange rate in 2009. ¶ For details of methods and sources used, see http://www.ehnheart.org/cvd-statistics.html
Source:
Nichols M, Townsend N, Luengo-Fernandez R, Leal J, Grey A, Scarborough P, Rayner M (2012). European Cardiovascular Disease Statistics 2012. European Heart Network, Brussels, European Society of Cardiology, Sophia Antipolis.

British Heart Foundation and University of Oxford 207
Table 6.3 Health care costs of CVD, CHD and stroke (€ thousands), European Union 2009
CVD CHD Stroke
Cost per capitaPercentage of
total health care expenditure
Cost per capitaPercentage of
total health care expenditure
Cost per capitaPercentage of
total health care expenditure
Austria € 280 8% € 59 2% € 53 1%
Belgium € 221 6% € 46 1% € 24 1%
Bulgaria € 46 13% € 7 2% € 6 2%
Cyprus € 84 7% € 17 1% € 9 1%
Czech Rep. € 150 14% € 26 2% € 34 3%
Denmark € 226 5% € 49 1% € 43 1%
Estonia € 124 17% € 30 4% € 28 4%
Finland € 368 12% € 76 3% € 139 5%
France € 198 6% € 26 1% € 24 1%
Germany € 374 11% € 66 2% € 73 2%
Greece € 249 11% € 52 2% € 50 2%
Hungary € 100 14% € 16 2% € 13 2%
Ireland € 208 6% € 44 1% € 14 0%
Italy € 241 10% € 43 2% € 45 2%
Latvia € 90 17% € 27 5% € 19 4%
Lithuania € 75 12% € 17 3% € 11 2%
Luxembourg € 270 4% € 51 1% € 26 0%
Malta € 117 11% € 22 2% € 9 1%
Netherlands € 352 8% € 96 2% € 83 2%
Poland € 109 17% € 24 4% € 14 2%
Portugal € 114 6% € 18 1% € 15 1%
Romania € 37 12% € 5 2% € 6 2%
Slovakia € 110 10% € 27 3% € 17 2%
Slovenia € 130 8% € 21 1% € 18 1%
Spain € 173 8% € 32 1% € 23 1%
Sweden € 263 8% € 65 2% € 61 2%
UK € 156 6% € 32 1% € 32 1%
Total EU € 212 9% € 40 2% € 38 2%
Notes:For details of methods and sources used, see http://www.ehnheart.org/cvd-statistics.html
Source:Nichols M, Townsend N, Luengo-Fernandez R, Leal J, Grey A, Scarborough P, Rayner M (2012). European Cardiovascular Disease Statistics 2012. European Heart Network, Brussels, European Society of Cardiology, Sophia Antipolis.

208 Coronary heart disease statistics 2012
We’re the nation’s heart charity. Our vision is a world where people don’t die prematurely from heart disease.We’ll achieve this through pioneering research, vital prevention activity and ensuring quality care and support for everyone living with heart disease.But we urgently need your help. We rely on your donations of time and money to continue our life-saving work. Because together we can beat heart disease.
Please get involved at www.bhf.org.uk
AcknowledgementsThe compilers would like to thank Brian Steenson, Ed Dicks, Katie Larkins, Catherine Kelly, Peter Weissberg, Lynn Girdwood, Michael Goldacre, Julie Ramsay, Rachel Stewart and Mary Scarlett for their help in producing this publication.

© B
riti
sh H
eart
Fou
nd
atio
n 20
12, r
egis
tere
d ch
arit
y in
En
gla
nd
and
Wal
es (2
2597
1) a
nd
in S
cotl
and
(SC
0394
26)
Pri
nt c
od
e: G
608
1012
/CH
A
Heart Helpline 0300 330 3311 bhf.org.uk
British Heart FoundationGreater London House 180 Hampstead Road London NW1 7AWT 020 7554 0000 F 020 7554 0100
bhf.org.uk/ statistics
Information & support on anything heart-related Phone lines open 9am to 5pm Monday to Friday Similar cost to 01 or 02 numbers
We are the nation’s heart charity, dedicated to
saving lives through pioneering research, patient care, campaigning for change and by providing vital information. But we urgently
need your help. We rely on your donations of time and money to
continue our life-saving work. Because together we can
beat heart disease.