2012 CAFR (5.7 MB PDF) - City of Winchester, VA
175
Comprehensive Annual FINANCIAL REPORT City of Winchester, Virginia Fiscal Year Ending June 30, 2012
Transcript of 2012 CAFR (5.7 MB PDF) - City of Winchester, VA
Comprehensive Annual
FINANCIAL REPORT
City of Winchester, VirginiaFiscal Year Ending
June 30, 2012

CITY OF WINCHESTER, VIRGINIA
COMPREHENSIVE ANNUAL FINANCIAL REPORT
JUNE 30, 2012
Prepared by:
City of Winchester, Virginia
Finance Department

THIS PAGE IS INTENTIONALLY LEFT BLANK.

CITY OF WINCHESTER, VIRGINIA
COMPREHENSIVE ANNUAL FINANCIAL REPORT
YEAR ENDED JUNE 30, 2012
TABLE OF CONTENTS
Page(s)
INTRODUCTORY SECTION
Officials .................................................................................................................................................... i
Organization Chart................................................................................................................................... ii
Letter of Transmittal ........................................................................................................................ iii-viii
Certificate of Achievement ..................................................................................................................... ix
FINANCIAL SECTION
Independent Auditor’s Report .............................................................................................................. 1-2
Management’s Discussion and Analysis .......................................................................................... 3a-3k
Basic Financial Statements:
Government-Wide Financial Statements:
Exhibit 1 – Statement of Net Assets.................................................................................................. 4
Exhibit 2 – Statement of Activities ................................................................................................... 5
Fund Financial Statements:
Exhibit 3 – Balance Sheet – Governmental Funds............................................................................ 6
Exhibit 4 – Statement of Revenues, Expenditures, and Changes in Fund Balances –
Governmental Funds ...................................................................................................................... 7
Exhibit 5 – Reconciliation of the Statement of Revenues, Expenditures, and Changes
in Fund Balances of Governmental Funds to the Statement of Activities ..................................... 8
Exhibit 6 – Statement of Revenues, Expenditures, and Changes in Fund Balances –
Budget to Actual – General Fund.............................................................................................. 9-10
Exhibit 7 – Statement of Net Assets – Proprietary Funds ............................................................... 11
Exhibit 8 – Statement of Revenues, Expenses, and Changes in Fund Net Assets –
Proprietary Funds......................................................................................................................... 12
Exhibit 9 – Statement of Cash Flows – Proprietary Funds ........................................................ 13-14
Exhibit 10 – Statement of Fiduciary Net Assets – Fiduciary Funds ............................................... 15
Notes to Financial Statements ....................................................................................................... 16-61
Required Supplementary Information:
Exhibit 11 – Schedules of Funding Progress...................................................................................... 62

FINANCIAL SECTION (Continued) Page(s)
Other Supplementary Information:
Combining and Individual Fund Statements and Schedules:
Governmental Funds ....................................................................................................................... 63
Exhibit 12 – Combining Balance Sheet – Nonmajor Governmental Funds.................................... 64
Exhibit 13 – Combining Statement of Revenues, Expenditures, and Changes in
Fund Balance – Nonmajor Governmental Funds......................................................................... 65
Exhibit 14 – Combining Balance Sheet – Nonmajor Special Revenue Funds................................ 66
Exhibit 15 – Combining Statement of Revenues, Expenditures, and Changes in
Fund Balance – Nonmajor Special Revenue Funds..................................................................... 67
Exhibit 16 – Schedule of Revenues, Expenditures, and Changes in Fund Balances –
Budget and Actual – Nonmajor Special Revenue Funds ............................................................. 68
Exhibit 17 – Schedule of Revenues, Expenditures, and Changes in Fund Balances –
Budget and Actual – Capital Projects Funds................................................................................ 69
Internal Service Funds..................................................................................................................... 70
Exhibit 18 – Combining Statement of Net Assets........................................................................... 71
Exhibit 19 – Combining Statement of Revenue, Expenses, and Changes in
Fund Net Assets ........................................................................................................................... 72
Exhibit 20 – Combining Statement of Cash Flows ......................................................................... 73
Fiduciary Funds............................................................................................................................... 74
Exhibit 21 – Combining Statement of Fiduciary Net Assets – Agency Funds ............................... 75
Exhibit 22 – Combining Statement of Changes in Fiduciary Assets and Liabilities –
Agency Funds .............................................................................................................................. 76
Discretely Presented Component Unit – School Board................................................................. 77-78
Exhibit 23 – Balance Sheet – Governmental Funds........................................................................ 79
Exhibit 24 – Statement of Revenues, Expenditures, and Changes in Fund Balances –
Governmental Funds .................................................................................................................... 80
Exhibit 25 – Schedule of Revenues, Expenditures, and Changes in Fund Balances –
Budget and Actual – School Operating Fund .............................................................................. 81
Exhibit 26 – Combining Balance Sheet – Nonmajor Governmental Funds.................................... 82
Exhibit 27 – Combining Statement of Revenues, Expenditures, and Changes in
Fund Balances – Nonmajor Funds ............................................................................................... 83
Exhibit 28 – Schedule of Revenues, Expenditures, and Changes in Fund Balances –
Budget and Actual – Nonmajor Special Revenue Funds ............................................................. 84

FINANCIAL SECTION (Continued) Page(s)
Other Supplementary Information: (Continued)
Discretely Presented Component Unit – School Board (Continued)
Exhibit 29 – Schedule of Revenues, Expenditures, and Changes in Fund Balances –
Budget and Actual – Capital Projects Funds................................................................................ 85
Exhibit 30 – Combining Statement of Net Assets – Internal Service Funds................................... 86
Exhibit 31 – Combining Statement of Revenues, Expenses, and Changes in Fund
Net Assets – Internal Service Funds ............................................................................................ 87
Exhibit 32 – Combining Statement of Cash Flows – Internal Service Funds ................................. 88
Exhibit 33 – Combining Statement of Fiduciary Net Assets – Private-Purpose
Trust Funds .................................................................................................................................. 89
Exhibit 34 – Combining Statement of Changes in Fiduciary Net Assets – Private-Purpose
Trust Funds .................................................................................................................................. 90
Exhibit 35 – Statement of Changes in Fiduciary Assets and Liabilities – Agency Funds .............. 91
Discretely Presented Component Unit – Parking Authority............................................................... 92
Exhibit 36 – Statement of Net Assets – Parking Authority Fund.................................................... 93
Exhibit 37 – Statement of Revenues, Expenses, and Changes in Fund Net Assets –
Parking Authority Fund ............................................................................................................... 94
Exhibit 38 – Statement of Cash Flows – Parking Authority Fund .................................................. 95
STATISTICAL SECTION
Narrative ................................................................................................................................................ 96
Table 1 – Net Assets by Component...................................................................................................... 97
Table 2 – Changes in Net Assets .................................................................................................... 98-100
Table 3 – Fund Balances of Governmental Funds............................................................................... 101
Table 4 – Changes in Fund Balances of Governmental Funds ..................................................... 102-103
Table 5 – Assessed Value and Actual Value of Taxable Property ...................................................... 104
Table 6 – Direct Property Tax Rates.................................................................................................... 105
Table 7 – Principal Property Taxpayers............................................................................................... 106
Table 8 – Property Tax Levies and Collections................................................................................... 107
Table 9 – Ratios of Outstanding Debt by Type ................................................................................... 108
Table 10 – Ratios of Net General Bonded Debt Outstanding.............................................................. 109
Table 11 – Direct and Overlapping Governmental Activities Debt..................................................... 110
Table 12 – Legal Debt Margin Information......................................................................................... 111
Table 13 – Pledged-Revenue Coverage............................................................................................... 112
Table 14 – Demographic and Economic Statistics .............................................................................. 113
Table 15 – Principal Employers........................................................................................................... 114
Table 16 – Full-time Equivalent City Government Employees by Function....................................... 115
Table 17 – Operating Indicators by Function ...................................................................................... 116
Table 18 – Capital Assets Statistics by Function................................................................................. 117
COMPLIANCE SECTION Page(s)
Report on Internal Control Over Financial Reporting and on Compliance and Other Matters
Based on an Audit of Financial Statements Performed in Accordance with
Governmental Auditing Standards ............................................................................................ 118-119
Independent Auditor’s Report on Compliance with Requirements That Could Have a
Direct and Material Effect on Each Major Program and on Internal Control Over
Compliance in Accordance with OMB Circular A-133 ............................................................ 120-121
Summary of State and Local Compliance Matters.................................................................................. 122
Schedule of Findings and Questioned Costs .................................................................................... 123-124
Schedule of Expenditures of Federal Awards.................................................................................. 125-126

THIS PAGE IS INTENTIONALLY LEFT BLANK.
i
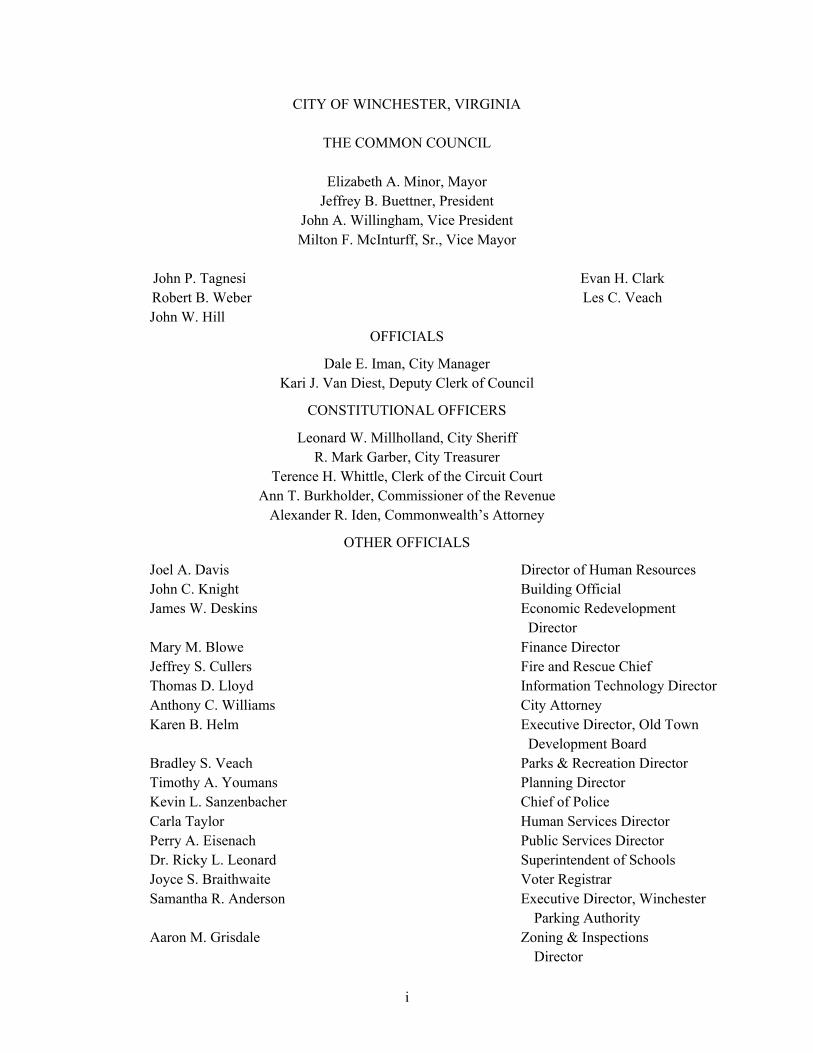
CITY OF WINCHESTER, VIRGINIA
THE COMMON COUNCIL
Elizabeth A. Minor, Mayor
Jeffrey B. Buettner, President
John A. Willingham, Vice President
Milton F. McInturff, Sr., Vice Mayor
John P. Tagnesi Evan H. Clark
Robert B. Weber Les C. Veach
John W. Hill
OFFICIALS
Dale E. Iman, City Manager
Kari J. Van Diest, Deputy Clerk of Council
CONSTITUTIONAL OFFICERS
Leonard W. Millholland, City Sheriff
R. Mark Garber, City Treasurer
Terence H. Whittle, Clerk of the Circuit Court
Ann T. Burkholder, Commissioner of the Revenue
Alexander R. Iden, Commonwealth’s Attorney
OTHER OFFICIALS
Joel A. Davis Director of Human Resources
John C. Knight Building Official
James W. Deskins Economic Redevelopment
Director
Mary M. Blowe Finance Director
Jeffrey S. Cullers Fire and Rescue Chief
Thomas D. Lloyd Information Technology Director
Anthony C. Williams City Attorney
Karen B. Helm Executive Director, Old Town
Development Board
Bradley S. Veach Parks & Recreation Director
Timothy A. Youmans Planning Director
Kevin L. Sanzenbacher Chief of Police
Carla Taylor Human Services Director
Perry A. Eisenach Public Services Director
Dr. Ricky L. Leonard Superintendent of Schools
Joyce S. Braithwaite Voter Registrar
Samantha R. Anderson Executive Director, Winchester
Parking Authority
Aaron M. Grisdale Zoning & Inspections
Director

ii
iii
Rouss City Hall Telephone: 540/667-1815 15 North Cameron Street FAX: 540/723-0238 Winchester, VA 22601
November 9, 2012 To the Honorable Mayor and Members of the City Council To the Citizens of the City of Winchester Winchester, Virginia Ladies and Gentlemen: The Comprehensive Annual Financial Report (CAFR) of the City of Winchester, Virginia for the fiscal year ended June 30, 2012 is submitted herewith pursuant to Section 15.1-166 & 167 of the Code of Virginia. Responsibility for both the accuracy of the data and the completeness and fairness of the presentation, including all disclosures, rests with the City. To the best of our knowledge and belief, the enclosed data are accurate in all material respects and are reported in a manner designed to present fairly the financial position and results of operations of all the funds of the City. All disclosures necessary to enable the reader to gain an understanding of the City's financial activities are included. The City’s management is responsible for establishing and maintaining an internal control structure designed to ensure that the assets of the City are protected from loss, theft, or misuse; to ensure that adequate accounting data are compiled; and to allow for the preparation of financial statements in conformity with generally accepted accounting principles. The internal control structure is designed to provide reasonable, but not absolute, assurance that these objectives are met. The concept of reasonable assurance recognizes that (1) the cost of a control should not exceed the benefits likely to be derived; and (2) the evaluation of costs and benefits requires estimates and judgments by management. State Statutes require an annual audit by independent certified public accountants. The accounting firm of Brown Edwards & Company, L.L.P. performed the City of Winchester’s audit for the fiscal year ended June 30, 2012. In addition to complying with the requirements set forth in the State Statutes, the audit was designed to comply with the requirements of the Single Audit Act of 1984 and related OMB Circular A-133. The auditor’s report on the basic financial statements is included in the Financial Section of this report. The auditor’s reports related specifically to the single audit are included in the Single Audit Section. Generally accepted accounting principals require that management provide a narrative introduction, overview, and analysis to accompany the basic financial statements in the form of Management’s Discussion and Analysis (MD&A). This letter of transmittal is designed to complement the MD&A and should be read in conjunction with it. The City of Winchester’s MD&A can be found immediately following the report of the independent auditors.
CITY OF WINCHESTER, VIRGINIA

iv
Profile of the City of Winchester The City of Winchester is located in the northern tip of Virginia in the Shenandoah Valley. Winchester, founded in 1744, is the oldest city in Virginia west of the Blue Ridge Mountains. The City currently occupies a land area of 9.3 square miles and serves a population of approximately 26,000. Two major interstate highways, I-81 and I-66, and four major state highways, Routes 50, 7, 11, and 522, provide direct access to eastern markets, including Washington, D.C., 72 miles away, and Baltimore, 97 miles away. The City of Winchester has a Council/Manager form of government. The nine member Council consists of a Mayor and eight Councilors elected from four wards in the city with each ward electing two members from the territory of the ward, and the mayor elected at-large and serve for a period of four years. In the governance of the City, the Council is charged with the responsibility of establishing policies and enacting ordinances and resolutions. The City Manager is appointed by the Council, and is charged with the responsibility of administering daily operations and implementing Council directives. The City provides a full range of services, including the following: police and fire protection; emergency response and rescue services; education; water and sewer services; refuse removal and disposal services; the construction and maintenance of highways, streets and infrastructure; parks and recreational activities; cultural events; parking facilities; transit services; social services; planning and zoning; and general administration. All moneys required to support these services are reflected in this report. The CAFR includes all funds, component unit agencies, and boards and commissions for which the City is financially accountable. Financial accountability is defined as appointment of a voting majority of such an entity’s Board, and either (a) the ability to impose its will, or (b) the possibility that the component unit will provide a financial benefit to, or impose a financial burden on, the City. Based on the foregoing criteria, the financial activities of the following organizations are included in the financial statements for the reasons indicated:
Winchester Parking Authority (WPA): The City of Winchester created the WPA to plan and foster the development of off-street parking facilities. The WPA is included in the accompanying financial statements as the City appoints all WPA members and is able to impose its will on the WPA.
Winchester School Board (Board): The Board was created as a separate legal entity by the City to
oversee the operation and management of its publicly funded primary and secondary schools. All members of the Board are appointed by the City’s Common Council, which has the ability to impose its will upon the Board.
Financial activities of the following joint ventures and other related organizations are not included in the CAFR, but are disclosed in the notes to the financial statements in accordance with pronouncements of the Governmental Accounting Standards Board:
Frederick-Winchester Service Authority Winchester Regional Airport Authority Handley Regional Library Board
The City maintains budgetary control as part of its fiscal management techniques. The objective of these budgetary controls is to ensure compliance with legal provisions embodied in the biennial appropriated budget approved by the City’s governing body. The level of budgetary control (the level at which
v
expenditures cannot legally exceed the appropriated amount) is established at the departmental level. Only the Common Council can revise the appropriation for each department. The City Manager is authorized to transfer appropriations within general government departments, and the School Board is authorized to transfer budgeted amounts within the school system’s categories. As demonstrated by the statements and schedules included in the financial section of this report, the City meets its responsibility for sound financial management. Local Economy The City is the region’s commercial, industrial, and medical center serving a 60-mile radius. Because of the City’s position as a regional economic center and its extensive highway system, the City’s work force is drawn from a substantially broader area. Employers in the area offer a wide variety of private sector jobs ranging from agriculture, forestry, and manufacturing, to retail, professional, educational, and medical services. The City’s largest employer is the Valley Health Systems, which owns and operates the Winchester Medical Center and five smaller primary care hospitals along with other related services such as urgent care clinics, home health services, a childcare facility, and transport services. A level II trauma center, the Winchester Medical Center is a non-profit, regional referral hospital, serving the tri-state region surrounding the City. The 445-bed facility offers a full range of inpatient and outpatient diagnostic, medical, surgical and rehabilitative services. The Winchester Medical Center recently completed a three-year $161 million construction project enhancing critical care and women’s services. Located within the City of Winchester is Shenandoah University, a United Methodist Church-affiliated institution, which was founded in 1875 in Dayton, Virginia, and moved to Winchester in 1960. Today, Shenandoah University has an enrollment of approximately 3,000 students. These students participate in more than 90 programs of study at the undergraduate, graduate, doctorate and professional levels in six schools: the College of Arts and Sciences, School of Business, School of Health Professions, Shenandoah Conservatory, School of Pharmacy, and School of Education and Human Development. The University has expressed an interest to work with the City to develop an upperclassmen and graduate housing center in downtown Winchester. The Winchester Regional Airport is an all-weather general aviation airport, with 5,500 feet of grooved asphalt runway, serving the region. The airport is staffed 24 hours a day/7 days a week and has U.S. Customs and Immigration Service available with 24 hour notice. It is the official airport of the Virginia Inland Port Authority, which is fifteen miles south of Winchester. The City participates with other user localities in a joint venture to operate the airport, and contributes a share of the local funding needed for the operations and capital requirements of the airport. The City’s commercial tax base accounts for 40.5% of the taxable real property value in the City. The City serves as the major retail center for the region. Apple Blossom Mall, an enclosed regional shopping center, contains Sears, Belk, and J.C. Penney as its anchors, along with an additional 85 specialty stores. Plazas such as Apple Blossom Corners, Winchester Crossing, and Winchester Station house Martin’s, Staples, Kohl’s, Office Max, Books-A-Million, Michael’s, Old Navy, and HH Gregg. Also, serving the area are a Wal-Mart Supercenter, Lowe’s, Home Depot, Big K-Mart, Target, T.J. Maxx, and Pier 1 Imports. The Old Town Mall, a pedestrian mall in the City’s downtown, offers a wide range of specialty shops and restaurants. There are also several anchorless strip centers and one life style center that house Ann Taylor, Jos A Banks Clothier, and other high end retail stores. The City also is home to several national chain restaurants. In addition, the City has several class A office buildings serving the professional services sector and business service entities.
vi
The City’s Department of Economic Development and the Economic Development Authority of the City of Winchester work closely together to facilitate economic development within the City of Winchester. During the last year, several major economic development activities have occurred. The EDA worked with the Virginia Economic Development Partnership to provide over $1,000,000 in incentives to Rubbermaid Commercial Products LLC resulting in their investment of $67,251,104 in new capital and facilities in the City and the creation of 71 new jobs. In addition, the EDA acquired over $1,000,000 worth of property in the historic downtown. These acquisitions involved four major downtown properties, three of which have been sold and are completely renovated or are currently under construction resulting in 23 new high-end apartments and 10,000 square feet of new retail space. The Authority has also made $875,000 in Revolving Loan Program loans to four different borrowers during this same period in addition to receiving a $1,000,000 HUD 108 Fund for the renovations of the downtown Taylor Hotel. In addition, the City’s Old Town Development Board continues to successfully market the City’s downtown. New businesses continue to locate downtown, while existing businesses thrive. The Old Town Development Board administers the Main Street Program, which concentrates on downtown revitalization - putting the traditional assets of downtown, such as unique architecture and locally-owned businesses, to work as a catalyst for economic growth and community pride. The efforts of the Winchester Old Town Development Board have earned it recognition for excellence in the field of downtown revitalization by meeting high standards of performance set by the Virginia Main Street Program and the National Trust for Historic Preservations National Main Street Center. The recent major focus in downtown has been the creation of new housing opportunities for young professionals, with the goal of stimulating 300 new housing units downtown over the next five years. Long-term Financial Planning Unassigned fund balance in the general fund (22.3% of General Fund expenditures) falls within the policy guidelines set by Council for planning purposes. Twenty percent is the target for the City’s General Fund balance. As part of our strategic plan, the City has implemented a 20 year financial planning model to help project revenue and expenditures through the year 2030. Factored into the financial planning model are the future major capital projects. Renovation and expansion of John Kerr and Frederick Douglas Elementary Schools will be a consideration for a future bond issue of approximately $18 to 20 million, respectively. Operational costs for the newly renovated facilities will increase as the renovations are completed at an approximate cost of $1,000,000. The John Kerr School is approximately 40 years old and has never been renovated. Enrollment projections show that elementary space is inadequate to handle the additional 350 students anticipated by the year 2013. These improvements should take us well into the future and provide a quality education for all students in the City. Relevant Financial Policies In December 2003, along with the fund balance policy, City Council adopted a debt obligation policy, which states that net debt as a percentage of assessed value will not exceed 4%. General obligation debt service and capital lease payments as a percentage of general governmental expenditures will not exceed 15%. The City’s investment policy is designed to allow the City to obtain the highest possible yield on available City financial assets, consistent with constraints imposed by its safety objectives, cash flow considerations, and Virginia State laws that restrict the placement of public funds. Accordingly, deposits
vii
were either insured by Federal Depository Insurance or collateralized in accordance with the Virginia Security for Public Deposits Act. Major Initiatives A. Water Treatment Plant
The City’s water treatment plant is located south of Middletown and provides the sole source of potable water for the City. The facility is over 50 years old and much of the plant’s equipment was original and had reached the end of its useful life. The City started on the construction of significant improvements to the water treatment plant in January 2010. These improvements were successfully completed in June 2012 at a cost of $25 million. The improvements consisted of:
New chemical feed system SCADA control system Replacement of high service pumps Replacement of raw water pumps Additional treated water storage New solids handling system
B. Water Distribution/Sewer Collection Systems The City’s water distribution system is one of the oldest in the United States and many existing water mains are over 150 years old. The system experiences numerous water main breaks and approximately 30% of the water pumped into the system is lost due to leaks. The sanitary sewer collection system is also very old and much of it is in poor condition. The City has started an aggressive program of replacing this very old water and sewer infrastructure. The Amherst Street Project and the North End Project both started construction in FY 2012 and will be completed in the fall of 2012. In addition, the utilities on Indian Alley and the Pedestrian Walking Mall will be replaced by the summer of 2013. C. Sidewalk Improvements Making improvements to sidewalks within the City continues to be high priority for the residents and City Council. The City has recently completed work on a $2 million project that replaced the sidewalks on Valley Avenue, Millwood Avenue, S. Loudoun Street, Purcell Avenue, and Woodstock Lane. Additional sidewalk improvements will be completed in 2013. Awards and Acknowledgment The Government Finance Officers Association of the United States and Canada (GFOA) awarded a Certificate of Achievement for Excellence in Financial Reporting to the City of Winchester for its Comprehensive Annual Financial Report for the fiscal year ended June 30, 2011. This was the twentieth year that the City of Winchester has achieved this prestigious award. In order to be awarded a Certificate of Achievement, a government must publish an easily readable and efficiently organized comprehensive annual financial report. This report must satisfy both generally accepted accounting principles and applicable legal requirements.

blegg
Typewritten Text
ix

THIS PAGE IS INTENTIONALLY LEFT BLANK.

1Your Success is Our Focus
124 Newman Avenue • Harrisonburg, VA 22801-4004 • 540-434-6736 • Fax: 540-434-3097 • www.BEcpas.com
INDEPENDENT AUDITOR’S REPORT
To the Honorable Members of City Council City of Winchester, Virginia
We have audited the accompanying financial statements of the governmental activities, the business-type activities, the aggregate discretely presented component units, each major fund, and the aggregate remaining fund information of the City of Winchester, Virginia, as of and for the year ended June 30, 2012, which collectively comprise the City’s basic financial statements as listed in the table of contents. These financial statements are the responsibility of the City’s management. Our responsibility is to express an opinion on these financial statements based on our audit.
We conducted our audit in accordance with auditing standards generally accepted in the United States of America; the standards applicable to financial audits contained in Government Auditing Standards, issued by the Comptroller General of the United States, and Specifications for Audits of Counties, Cities, and Towns and Specifications for Audits of Authorities, Boards, and Commissions issued by the Auditor of Public Accounts of the Commonwealth of Virginia. Those standards require that we plan and perform the audit to obtain reasonable assurance about whether the financial statements are free of material misstatement. An audit includes examining, on a test basis, evidence supporting the amounts and disclosures in the financial statements. An audit also includes assessing the accounting principles used and significant estimates made by management, as well as evaluating the overall financial statement presentation. We believe that our audit provides a reasonable basis for our opinions.
In our opinion, based on our audit, the financial statements referred to above present fairly, in all material respects, the respective financial position of the governmental activities, the business-type activities, the aggregate discretely presented component units, each major fund, and the aggregate remaining fund information of the City, as of June 30, 2012, and the respective changes in financial position, and, where applicable, cash flows thereof, and the respective budgetary comparison for the general fund for the year then ended in conformity with accounting principles generally accepted in the United States of America.
In accordance with Government Auditing Standards, we have also issued our report dated November 9, 2012, on our consideration of the City’s internal control over financial reporting and on our tests of its compliance with certain provisions of laws, regulations, contracts, and grant agreements and other matters. The purpose of that report is to describe the scope of our testing of internal control over financial reporting and compliance and the results of that testing, and not to provide an opinion on internal control over financial reporting or on compliance. That report is an integral part of an audit performed in accordance with Government Auditing Standards and should be considered in assessing the results of our audit.

2
Accounting principles generally accepted in the United States of America require that the management’s discussion and analysis, budgetary comparison information and schedules of funding progress as listed in the table of contents be presented to supplement the basic financial statements. Such information, although not a part of the basic financial statements, is required by the Governmental AccountingStandards Board, who considers it to be an essential part of financial reporting for placing the basic financial statements in an appropriate operational, economic, or historical context. We have applied certain limited procedures to the required supplementary information in accordance with auditing standards generally accepted in the United States of America, which consisted of inquiries of management about the methods of preparing the information and comparing the information for consistency with management’s responses to our inquiries, the basic financial statements, and other knowledge we obtained during our audit of the basic financial statements. We do not express an opinion or provide any assurance on the information because the limited procedures do not provide us with sufficient evidence to express an opinion or provide any assurance.
Our audit was conducted for the purpose of forming opinions on the financial statements that collectively comprise the City’s financial statements as a whole. The introductory section, combining and individual non-major fund statements, non-major funds budgetary comparison statements, and statistical section are presented for purposes of additional analysis and are not a required part of the financial statements. The accompanying schedule of expenditures of federal awards is presented for purposes of additional analysis as required by U.S. Office of Management and Budget Circular A-133, Audits of States, Local Governments, and Non-Profit Organizations, and is also not a required part of the financial statements. The combining and individual non-major fund financial statements, the non-major funds budgetary comparison statements, and the schedule of expenditures of federal awards are the responsibility of management and were derived from and relate directly to the underlying accounting and other records used to prepare the financial statements. The information has been subjected to the auditing procedures applied by us in the audit of the financial statements and certain additional procedures including comparing and reconciling such information directly to the underlying accounting and other records used to prepare the financial statements or to the financial statements themselves, and other additional procedures in accordance with auditing standards generally accepted in the United States of America. In our opinion, the information is fairly stated in all material respects in relation to the financial statements as a whole. The introductory and statistical sections have not been subjected to the auditing procedures applied in the audit of the basic financial statements, and accordingly, we do not express an opinion or provide any assurance on them.
CERTIFIED PUBLIC ACCOUNTANTS
Harrisonburg, VirginiaNovember 9, 2012
3a
City of Winchester, VirginiaManagement’s Discussion and AnalysisFiscal Year Ended June 30, 2012
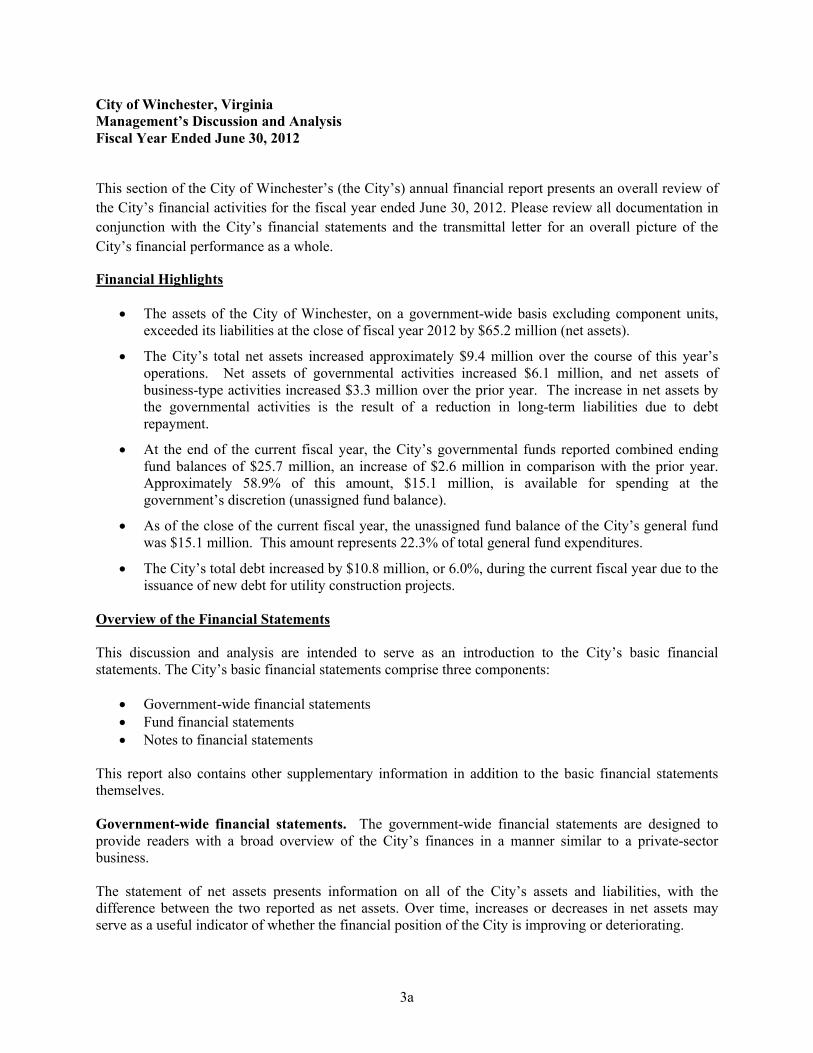
This section of the City of Winchester’s (the City’s) annual financial report presents an overall review of
the City’s financial activities for the fiscal year ended June 30, 2012. Please review all documentation in
conjunction with the City’s financial statements and the transmittal letter for an overall picture of the
City’s financial performance as a whole.
Financial Highlights
The assets of the City of Winchester, on a government-wide basis excluding component units, exceeded its liabilities at the close of fiscal year 2012 by $65.2 million (net assets).
The City’s total net assets increased approximately $9.4 million over the course of this year’s operations. Net assets of governmental activities increased $6.1 million, and net assets of business-type activities increased $3.3 million over the prior year. The increase in net assets by the governmental activities is the result of a reduction in long-term liabilities due to debt repayment.
At the end of the current fiscal year, the City’s governmental funds reported combined ending fund balances of $25.7 million, an increase of $2.6 million in comparison with the prior year. Approximately 58.9% of this amount, $15.1 million, is available for spending at the government’s discretion (unassigned fund balance).
As of the close of the current fiscal year, the unassigned fund balance of the City’s general fund was $15.1 million. This amount represents 22.3% of total general fund expenditures.
The City’s total debt increased by $10.8 million, or 6.0%, during the current fiscal year due to the issuance of new debt for utility construction projects.
Overview of the Financial Statements
This discussion and analysis are intended to serve as an introduction to the City’s basic financial statements. The City’s basic financial statements comprise three components:
Government-wide financial statements Fund financial statements Notes to financial statements
This report also contains other supplementary information in addition to the basic financial statements themselves.
Government-wide financial statements. The government-wide financial statements are designed to provide readers with a broad overview of the City’s finances in a manner similar to a private-sector business.
The statement of net assets presents information on all of the City’s assets and liabilities, with the difference between the two reported as net assets. Over time, increases or decreases in net assets may serve as a useful indicator of whether the financial position of the City is improving or deteriorating.

3b
Overview of the Financial Statements (Continued)
The statement of activities presents information showing how the City’s net assets changed during the most recent fiscal year. All changes in net assets are reported as soon as the underlying event giving rise to the change occurs, regardless of the timing of related cash flows. Thus, revenues and expenses are reported in the statement for some items that will only result in cash flows in future fiscal periods (e.g., uncollected taxes and earned but unused vacation leave).
Both of the government-wide financial statements distinguish functions of the City that are principally supported by taxes and intergovernmental revenue (governmental activities) from other functions that are intended to recover all or a significant portion of their costs through user fees and charges (business-type activities). The governmental activities of the City include: general government; judicial administration; public safety; public works; health and welfare; and recreation and cultural. The business-type activities of the City include water and sewer and bus operations.
The government-wide financial statements include not only the City itself (known as the primary government), but also a legally separate school district and a legally separate parking authority for which the City is financially accountable. Financial information for these component units is reported separately from the financial information presented for the primary government itself.
Fund financial statements. A fund is a grouping of related accounts that is used to maintain control over resources that have been segregated for specific activities or objectives. The City, like other state and local governments, uses fund accounting to ensure and demonstrate compliance with finance-related legal requirements. All of the funds of the City can be divided into three categories: governmental funds, proprietary funds, and fiduciary funds.
Governmental funds. Governmental funds are used to account for essentially the same functions reported as governmental activities in the government-wide statements. However, unlike the government-wide financial statements, governmental fund financial statements focus on near-term inflows and outflows of spendable resources, as well as on balances of spendable resources available at the end of the fiscal year. Such information may be useful in evaluating a government’s near-term financing requirements.
Because the focus of governmental funds is narrower than that of the government-wide financial statements, it is useful to compare the information presented for governmental funds with similar information presented for governmental activities in the government-wide financial statements. By doing so, readers may better understand the long-term impact of the City’s near-term financing decisions. Both the governmental fund balance sheet and the governmental statement of revenues, expenditures, and changes in fund balances provide a reconciliation to facilitate this comparison between governmental funds and governmental activities.
The City maintains seven governmental funds. Information is presented separately in the governmental fund balance sheet and in the governmental fund statement of revenues, expenditures, and changes in fund balance for the general fund, which is considered a major fund. Data from the other governmental funds are combined into a single, aggregated presentation. Individual fund data for each of these nonmajor governmental funds is provided in the form of combining statements elsewhere in this report.
The City adopts an annual appropriated budget for its governmental funds. A budgetary comparison statement has been provided for the governmental funds to demonstrate compliance with this budget.

3c
Overview of the Financial Statements (Continued)
Proprietary funds. The City maintains two different types of proprietary funds. Enterprise funds are used to report the same functions presented as business-type activities in the government-wide financial statements. The City uses an enterprise fund to account for its water and sewer operations. Internal service funds are an accounting device used to accumulate and allocate costs internally among the City’s various functions. The City uses internal service funds to account for its employee benefits program, equipment maintenance operation, and other post-employment benefits. Because these three functions predominantly benefit governmental rather than business-type functions, they have been included within governmental activities in the government-wide financial statements.
Proprietary funds provide the same type of information as the government-wide financial statements, only in more detail. The proprietary fund financial statements provide separate information for the Water and Sewer fund (a major fund). Conversely, the internal service funds are combined into a single, aggregated presentation in the proprietary fund financial statements. Individual fund data for the internal service funds is provided in the form of combining statements elsewhere in this report.
Fiduciary Funds. Fiduciary funds are used to account for resources held for the benefit of parties outside the government. Fiduciary funds are not reflected in the government-wide financial statements because the resources of those funds are not available to support the City’s own programs. The City has threefiduciary funds: the Special Welfare Fund, Northwestern Regional Jail Authority Construction Fund, and Northwestern Regional Juvenile Detention Center Fund. The accounting used for fiduciary funds is much like that used for proprietary funds.
Notes to the financial statements. The notes provide additional information that is essential to a full understanding of the data provided in the government-wide and fund financial statements. The notes to the financial statements can be found on pages 16-61 of this report.
Other information. In addition to the basic financial statements and accompanying notes, this report also presents certain required supplementary information concerning the City’s progress in funding its obligation to provide pension benefits to its employees. Required supplementary information can be found on page 62 of this report.
The combining statements referred to earlier in connection with nonmajor governmental funds and internal service funds are presented immediately following the required supplementary information on pensions.
Government-wide Financial Analysis
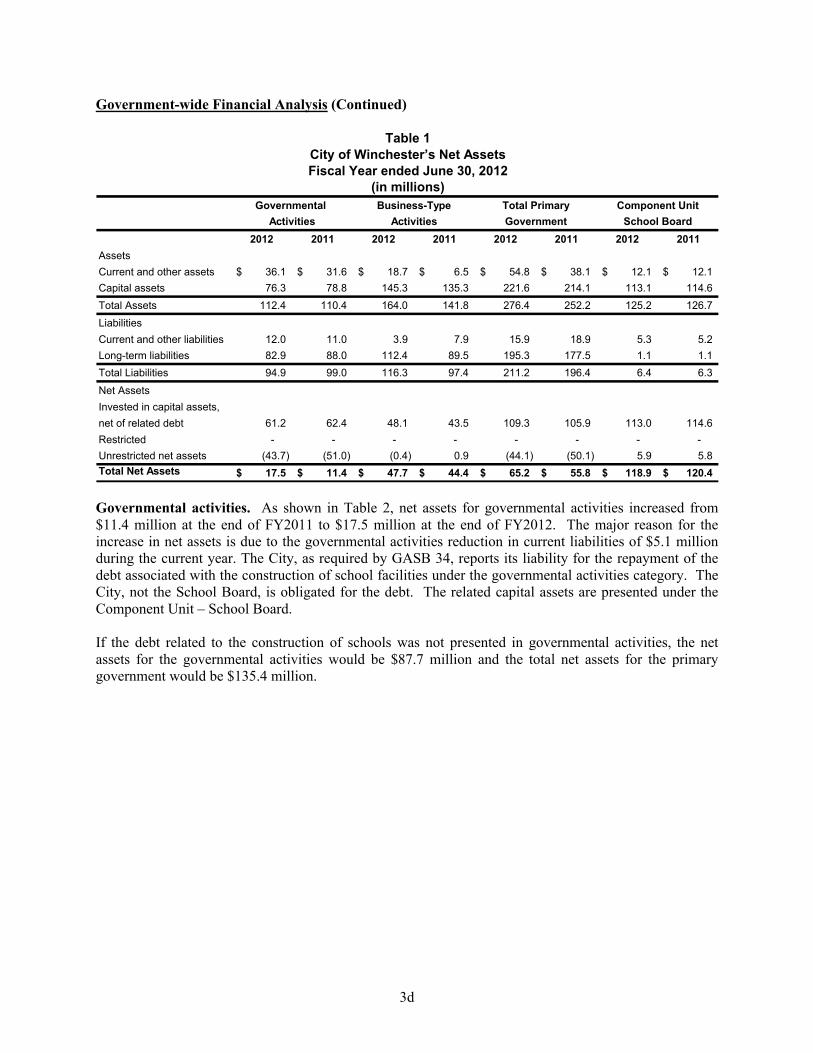
As noted earlier, net assets (assets in excess of liabilities) may serve over time as a useful indicator of a government’s financial position. Table 1 shows that the primary government’s assets exceeded liabilities by $65.2 million at the close of fiscal year 2012.
The City’s net assets reflects its investment in capital assets (e.g., land, buildings, machinery, and equipment), less any related debt used to acquire those assets that is still outstanding. The City uses these capital assets to provide services to citizens; consequently, these assets are not available for future spending. Although, the City’s investment in its capital assets is reported net of related debt, it should be noted that the resources needed to repay this debt must be provided from other sources, since the capital assets themselves cannot be used to liquidate these liabilities.
3d
Government-wide Financial Analysis (Continued)
2012 2011 2012 2011 2012 2011 2012 2011
Assets
Current and other assets 36.1$ 31.6$ 18.7$ 6.5$ 54.8$ 38.1$ 12.1$ 12.1$
Capital assets 76.3 78.8 145.3 135.3 221.6 214.1 113.1 114.6
Total Assets 112.4 110.4 164.0 141.8 276.4 252.2 125.2 126.7
Liabilities
Current and other liabilities 12.0 11.0 3.9 7.9 15.9 18.9 5.3 5.2
Long-term liabilities 82.9 88.0 112.4 89.5 195.3 177.5 1.1 1.1
Total Liabilities 94.9 99.0 116.3 97.4 211.2 196.4 6.4 6.3
Net Assets
Invested in capital assets,
net of related debt 61.2 62.4 48.1 43.5 109.3 105.9 113.0 114.6
Restricted - - - - - - - -
Unrestricted net assets (43.7) (51.0) (0.4) 0.9 (44.1) (50.1) 5.9 5.8
Total Net Assets 17.5$ 11.4$ 47.7$ 44.4$ 65.2$ 55.8$ 118.9$ 120.4$
Activities
Business-Type
Table 1City of Winchester’s Net AssetsFiscal Year ended June 30, 2012
(in millions)
Component Unit
School Board
Total Primary
Government
Governmental
Activities
Governmental activities. As shown in Table 2, net assets for governmental activities increased from$11.4 million at the end of FY2011 to $17.5 million at the end of FY2012. The major reason for the increase in net assets is due to the governmental activities reduction in current liabilities of $5.1 million during the current year. The City, as required by GASB 34, reports its liability for the repayment of the debt associated with the construction of school facilities under the governmental activities category. The City, not the School Board, is obligated for the debt. The related capital assets are presented under the Component Unit – School Board.
If the debt related to the construction of schools was not presented in governmental activities, the net assets for the governmental activities would be $87.7 million and the total net assets for the primary government would be $135.4 million.
3e
Government-wide Financial Analysis (Continued)
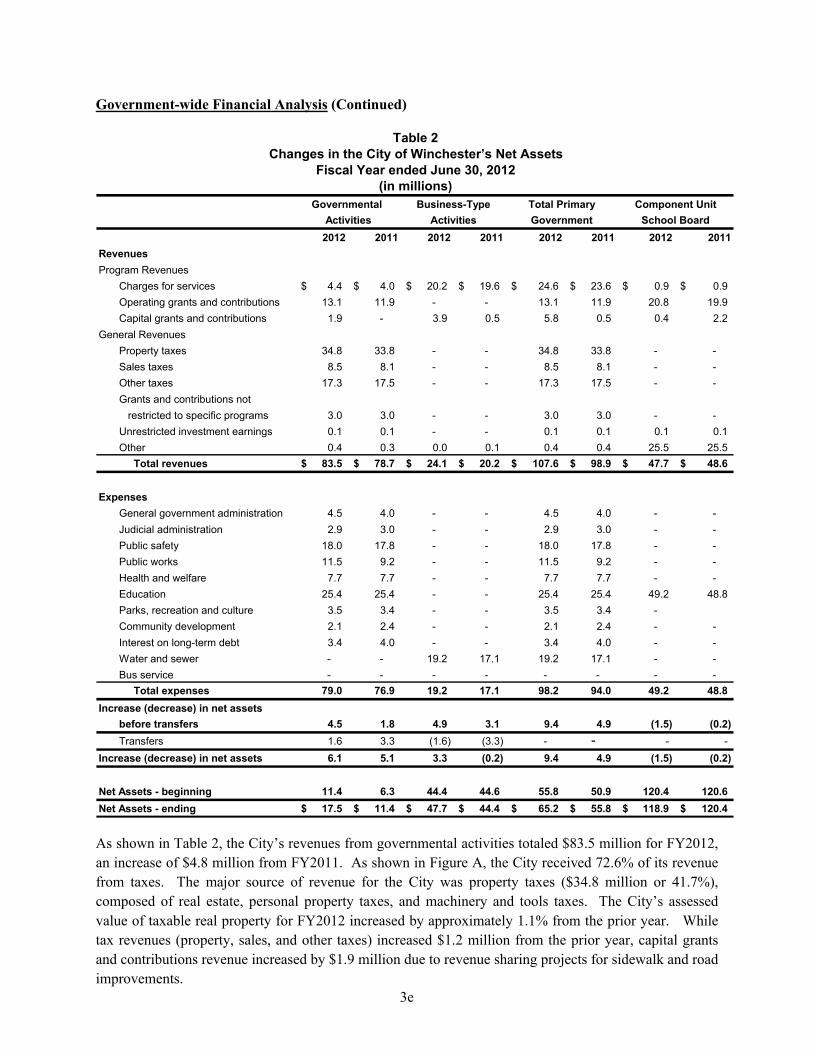
2012 2011 2012 2011 2012 2011 2012 2011
Revenues
Program Revenues
Charges for services 4.4$ 4.0$ 20.2$ 19.6$ 24.6$ 23.6$ 0.9$ 0.9$
Operating grants and contributions 13.1 11.9 - - 13.1 11.9 20.8 19.9
Capital grants and contributions 1.9 - 3.9 0.5 5.8 0.5 0.4 2.2
General Revenues
Property taxes 34.8 33.8 - - 34.8 33.8 - -
Sales taxes 8.5 8.1 - - 8.5 8.1 - -
Other taxes 17.3 17.5 - - 17.3 17.5 - -
Grants and contributions not
restricted to specific programs 3.0 3.0 - - 3.0 3.0 - -
Unrestricted investment earnings 0.1 0.1 - - 0.1 0.1 0.1 0.1
Other 0.4 0.3 0.0 0.1 0.4 0.4 25.5 25.5
Total revenues 83.5$ 78.7$ 24.1$ 20.2$ 107.6$ 98.9$ 47.7$ 48.6$
Expenses
General government administration 4.5 4.0 - - 4.5 4.0 - -
Judicial administration 2.9 3.0 - - 2.9 3.0 - -
Public safety 18.0 17.8 - - 18.0 17.8 - -
Public works 11.5 9.2 - - 11.5 9.2 - -
Health and welfare 7.7 7.7 - - 7.7 7.7 - -
Education 25.4 25.4 - - 25.4 25.4 49.2 48.8
Parks, recreation and culture 3.5 3.4 - - 3.5 3.4 -
Community development 2.1 2.4 - - 2.1 2.4 - -
Interest on long-term debt 3.4 4.0 - - 3.4 4.0 - -
Water and sewer - - 19.2 17.1 19.2 17.1 - -
Bus service - - - - - - - -
Total expenses 79.0 76.9 19.2 17.1 98.2 94.0 49.2 48.8
Increase (decrease) in net assets
before transfers 4.5 1.8 4.9 3.1 9.4 4.9 (1.5) (0.2)
Transfers 1.6 3.3 (1.6) (3.3) - - - -
Increase (decrease) in net assets 6.1 5.1 3.3 (0.2) 9.4 4.9 (1.5) (0.2)
Net Assets - beginning 11.4 6.3 44.4 44.6 55.8 50.9 120.4 120.6
Net Assets - ending 17.5$ 11.4$ 47.7$ 44.4$ 65.2$ 55.8$ 118.9$ 120.4$
Activities Activities Government School Board
(in millions)
Changes in the City of Winchester’s Net AssetsTable 2
Component UnitGovernmental Business-Type Total Primary
Fiscal Year ended June 30, 2012
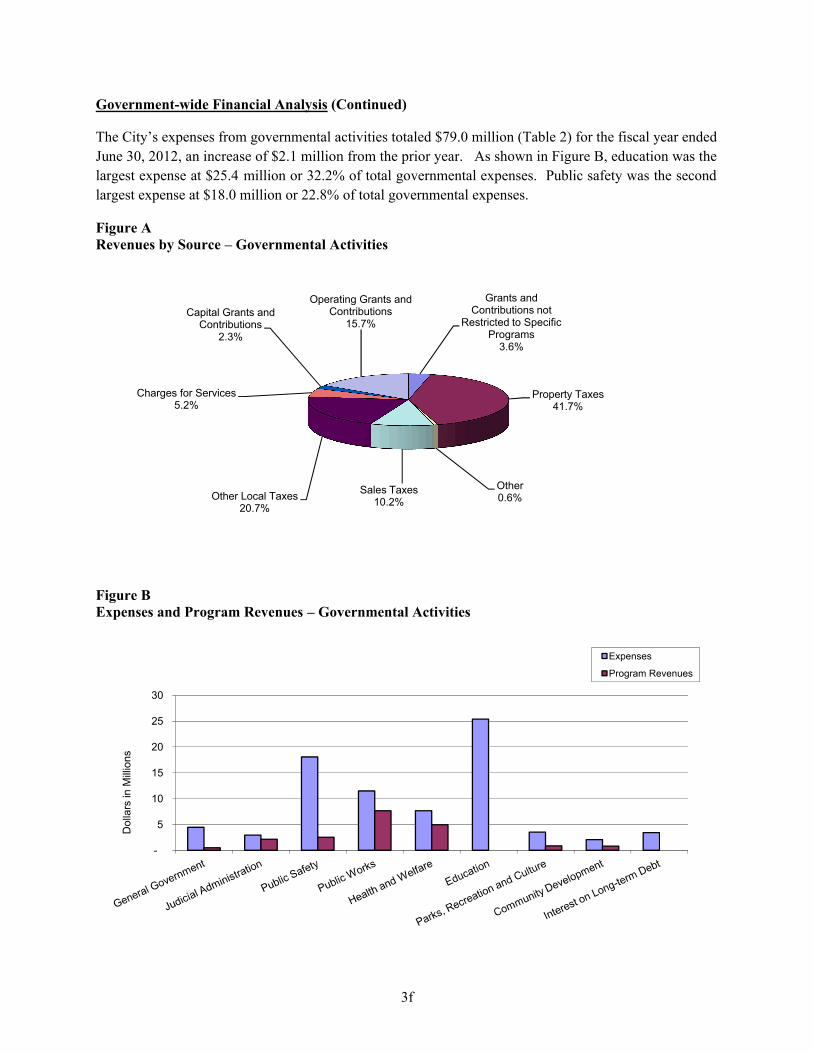
As shown in Table 2, the City’s revenues from governmental activities totaled $83.5 million for FY2012,
an increase of $4.8 million from FY2011. As shown in Figure A, the City received 72.6% of its revenue
from taxes. The major source of revenue for the City was property taxes ($34.8 million or 41.7%),
composed of real estate, personal property taxes, and machinery and tools taxes. The City’s assessed
value of taxable real property for FY2012 increased by approximately 1.1% from the prior year. While
tax revenues (property, sales, and other taxes) increased $1.2 million from the prior year, capital grants
and contributions revenue increased by $1.9 million due to revenue sharing projects for sidewalk and road
improvements.
Government-wide Financial Analysis (Continued)
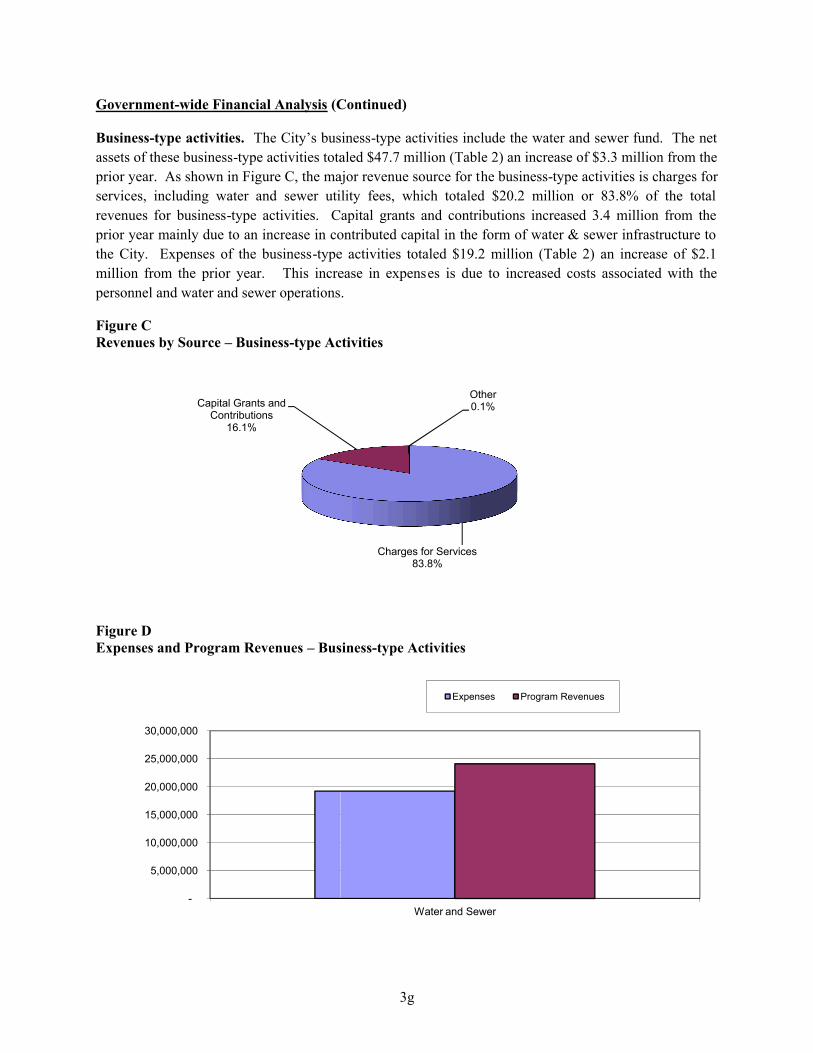
The City’s expenses from governmental activities totaled $79.0 million (Table 2) for the fiscal year ended
June 30, 2012, an increase of $2.1 million from the prior year. As shown in Figure B, education was the
largest expense at $25.4 million or 32.2% of total governmental expenses. Public safety was the second
largest expense at $18.0 million or 22.8% of total governmental expenses.
Figure ARevenues by Source – Governmental Activities
Figure BExpenses and Program Revenues – Governmental Activities
Other Local Taxes20.7%
Charges for Services5.2%
Capital Grants and Contributions
2.3%
Operating Grants and Contributions
-
5
10
15
20
25
30
Do
llars
in M
illio
ns
3f
(Continued)
The City’s expenses from governmental activities totaled $79.0 million (Table 2) for the fiscal year ended
June 30, 2012, an increase of $2.1 million from the prior year. As shown in Figure B, education was the
million or 32.2% of total governmental expenses. Public safety was the second
largest expense at $18.0 million or 22.8% of total governmental expenses.
Governmental Activities
Governmental Activities
Grants and Contributions not
Restricted to Specific Programs
3.6%
Property Taxes41.7%
Other0.6%
Sales Taxes10.2%
Operating Grants and Contributions
15.7%
Expenses
Program Revenues
The City’s expenses from governmental activities totaled $79.0 million (Table 2) for the fiscal year ended
June 30, 2012, an increase of $2.1 million from the prior year. As shown in Figure B, education was the
million or 32.2% of total governmental expenses. Public safety was the second
Program Revenues
Government-wide Financial Analysis (Continued)
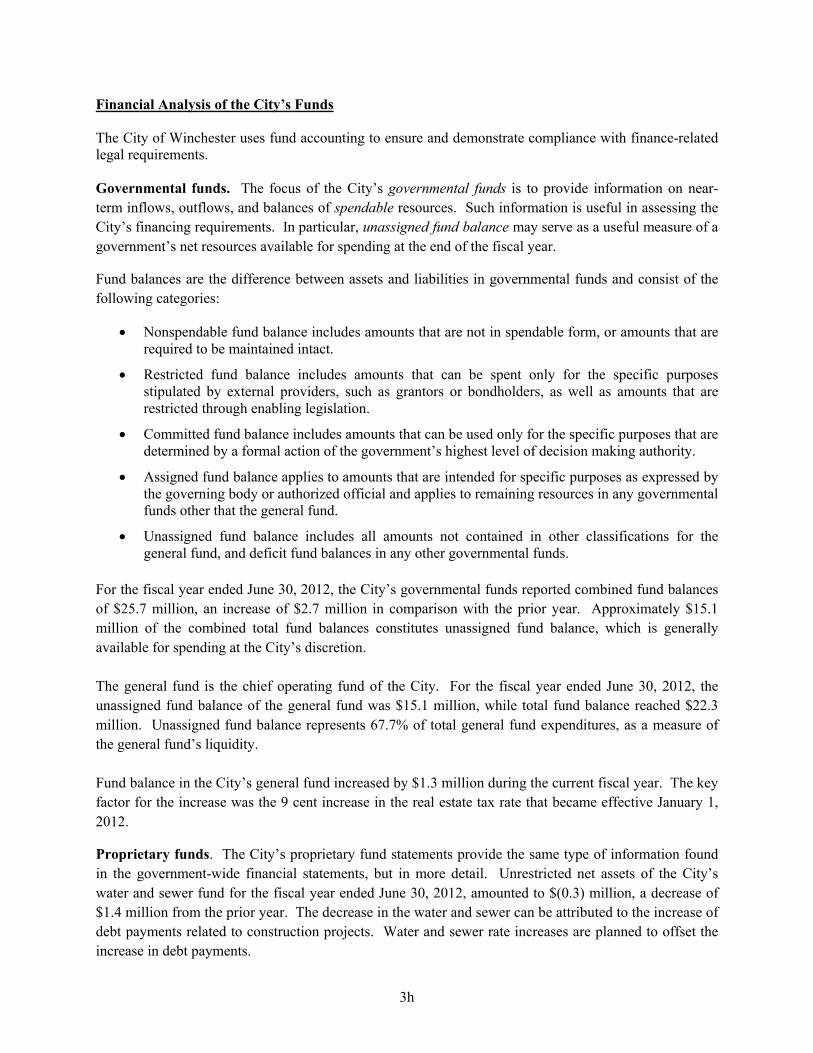
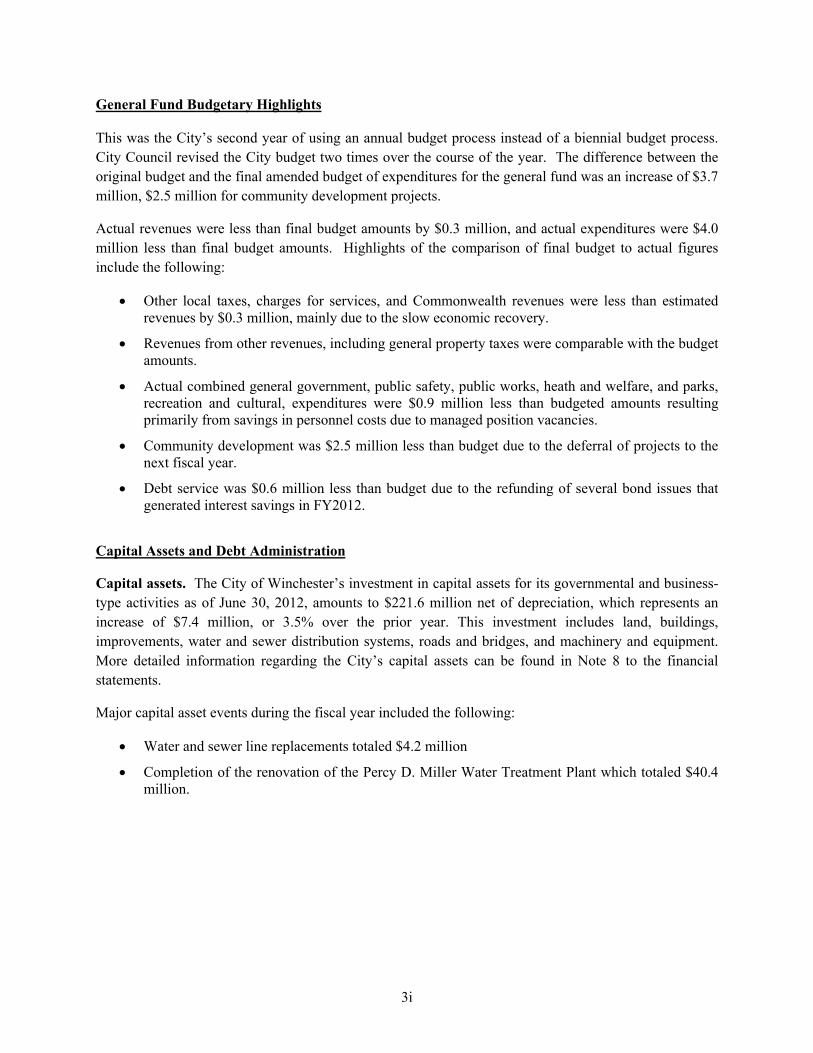
Business-type activities. The City’s business
assets of these business-type activities totaled $47.7 million (Table 2) an increase of $3.3 million from the
prior year. As shown in Figure C, the major revenue source for t
services, including water and sewer utility fees, which totaled $20.2 million or 83.8% of the total
revenues for business-type activities. Capital grants and contributions increased 3.4 million from the
prior year mainly due to an increase in contributed capital in the form of water & sewer infrastructure to
the City. Expenses of the business-type activities totaled $19.2 million (Table 2) an increase of $2.1
million from the prior year. This increase in expens
personnel and water and sewer operations.
Figure CRevenues by Source – Business-type Activities
Figure DExpenses and Program Revenues – Business
Capital Grants and Contributions
16.1%
-
5,000,000
10,000,000
15,000,000
20,000,000
25,000,000
30,000,000
3g
(Continued)
The City’s business-type activities include the water and sewer fund. The net
type activities totaled $47.7 million (Table 2) an increase of $3.3 million from the
prior year. As shown in Figure C, the major revenue source for the business-type activities is charges for
services, including water and sewer utility fees, which totaled $20.2 million or 83.8% of the total
type activities. Capital grants and contributions increased 3.4 million from the
r mainly due to an increase in contributed capital in the form of water & sewer infrastructure to
type activities totaled $19.2 million (Table 2) an increase of $2.1
million from the prior year. This increase in expenses is due to increased costs associated with the
personnel and water and sewer operations.
type Activities
Business-type Activities
Charges for Services83.8%
Other0.1%
Water and Sewer
Expenses Program Revenues
type activities include the water and sewer fund. The net
type activities totaled $47.7 million (Table 2) an increase of $3.3 million from the
type activities is charges for
services, including water and sewer utility fees, which totaled $20.2 million or 83.8% of the total
type activities. Capital grants and contributions increased 3.4 million from the
r mainly due to an increase in contributed capital in the form of water & sewer infrastructure to
type activities totaled $19.2 million (Table 2) an increase of $2.1
es is due to increased costs associated with the
3h
Financial Analysis of the City’s Funds
The City of Winchester uses fund accounting to ensure and demonstrate compliance with finance-related legal requirements.
Governmental funds. The focus of the City’s governmental funds is to provide information on near-
term inflows, outflows, and balances of spendable resources. Such information is useful in assessing the
City’s financing requirements. In particular, unassigned fund balance may serve as a useful measure of a
government’s net resources available for spending at the end of the fiscal year.
Fund balances are the difference between assets and liabilities in governmental funds and consist of the
following categories:
Nonspendable fund balance includes amounts that are not in spendable form, or amounts that are required to be maintained intact.
Restricted fund balance includes amounts that can be spent only for the specific purposes stipulated by external providers, such as grantors or bondholders, as well as amounts that are restricted through enabling legislation.
Committed fund balance includes amounts that can be used only for the specific purposes that are determined by a formal action of the government’s highest level of decision making authority.
Assigned fund balance applies to amounts that are intended for specific purposes as expressed by the governing body or authorized official and applies to remaining resources in any governmental funds other that the general fund.
Unassigned fund balance includes all amounts not contained in other classifications for the general fund, and deficit fund balances in any other governmental funds.
For the fiscal year ended June 30, 2012, the City’s governmental funds reported combined fund balances
of $25.7 million, an increase of $2.7 million in comparison with the prior year. Approximately $15.1
million of the combined total fund balances constitutes unassigned fund balance, which is generally
available for spending at the City’s discretion.
The general fund is the chief operating fund of the City. For the fiscal year ended June 30, 2012, the
unassigned fund balance of the general fund was $15.1 million, while total fund balance reached $22.3
million. Unassigned fund balance represents 67.7% of total general fund expenditures, as a measure of
the general fund’s liquidity.
Fund balance in the City’s general fund increased by $1.3 million during the current fiscal year. The key
factor for the increase was the 9 cent increase in the real estate tax rate that became effective January 1,
2012.
Proprietary funds. The City’s proprietary fund statements provide the same type of information found
in the government-wide financial statements, but in more detail. Unrestricted net assets of the City’s
water and sewer fund for the fiscal year ended June 30, 2012, amounted to $(0.3) million, a decrease of
$1.4 million from the prior year. The decrease in the water and sewer can be attributed to the increase of
debt payments related to construction projects. Water and sewer rate increases are planned to offset the
increase in debt payments.
3i
General Fund Budgetary Highlights
This was the City’s second year of using an annual budget process instead of a biennial budget process.
City Council revised the City budget two times over the course of the year. The difference between the
original budget and the final amended budget of expenditures for the general fund was an increase of $3.7
million, $2.5 million for community development projects.
Actual revenues were less than final budget amounts by $0.3 million, and actual expenditures were $4.0
million less than final budget amounts. Highlights of the comparison of final budget to actual figures
include the following:
Other local taxes, charges for services, and Commonwealth revenues were less than estimated revenues by $0.3 million, mainly due to the slow economic recovery.
Revenues from other revenues, including general property taxes were comparable with the budget amounts.
Actual combined general government, public safety, public works, heath and welfare, and parks, recreation and cultural, expenditures were $0.9 million less than budgeted amounts resulting primarily from savings in personnel costs due to managed position vacancies.
Community development was $2.5 million less than budget due to the deferral of projects to the next fiscal year.
Debt service was $0.6 million less than budget due to the refunding of several bond issues that generated interest savings in FY2012.
Capital Assets and Debt Administration
Capital assets. The City of Winchester’s investment in capital assets for its governmental and business-
type activities as of June 30, 2012, amounts to $221.6 million net of depreciation, which represents an
increase of $7.4 million, or 3.5% over the prior year. This investment includes land, buildings,
improvements, water and sewer distribution systems, roads and bridges, and machinery and equipment.
More detailed information regarding the City’s capital assets can be found in Note 8 to the financial
statements.
Major capital asset events during the fiscal year included the following:
Water and sewer line replacements totaled $4.2 million
Completion of the renovation of the Percy D. Miller Water Treatment Plant which totaled $40.4 million.
3j
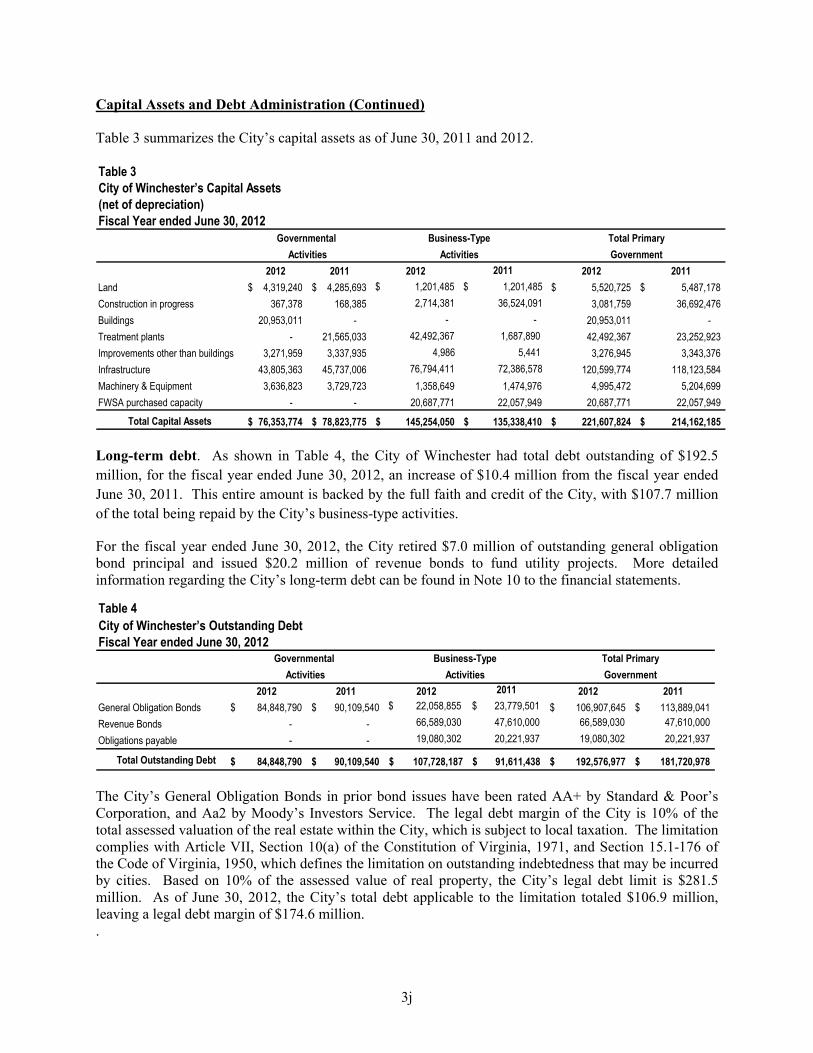
Capital Assets and Debt Administration (Continued)
Table 3 summarizes the City’s capital assets as of June 30, 2011 and 2012.
Table 3
(net of depreciation)
2012 2011 2012 2011 2012 2011
Land 4,319,240$ 4,285,693$ $ 1,201,485 $ 1,201,485 5,520,725$ 5,487,178$
Construction in progress 367,378 168,385 2,714,381 36,524,091 3,081,759 36,692,476
Buildings 20,953,011 - - - 20,953,011 -
Treatment plants - 21,565,033 42,492,367 1,687,890 42,492,367 23,252,923
Improvements other than buildings 3,271,959 3,337,935 4,986 5,441 3,276,945 3,343,376
Infrastructure 43,805,363 45,737,006 76,794,411 72,386,578 120,599,774 118,123,584
Machinery & Equipment 3,636,823 3,729,723 1,358,649 1,474,976 4,995,472 5,204,699
FWSA purchased capacity - - 20,687,771 22,057,949 20,687,771 22,057,949
Total Capital Assets 76,353,774$ 78,823,775$ 145,254,050$ 135,338,410$ 221,607,824$ 214,162,185$
Activities Activities Government
City of Winchester’s Capital Assets
Fiscal Year ended June 30, 2012Governmental Business-Type Total Primary
Long-term debt. As shown in Table 4, the City of Winchester had total debt outstanding of $192.5
million, for the fiscal year ended June 30, 2012, an increase of $10.4 million from the fiscal year ended
June 30, 2011. This entire amount is backed by the full faith and credit of the City, with $107.7 million
of the total being repaid by the City’s business-type activities.
For the fiscal year ended June 30, 2012, the City retired $7.0 million of outstanding general obligation bond principal and issued $20.2 million of revenue bonds to fund utility projects. More detailed information regarding the City’s long-term debt can be found in Note 10 to the financial statements.
Table 4
2012 2011 2012 2011 2012 2011
General Obligation Bonds 84,848,790$ 90,109,540$ $ 22,058,855 $ 23,779,501 106,907,645$ 113,889,041$
Revenue Bonds - - 66,589,030 47,610,000 66,589,030 47,610,000
Obligations payable - - 19,080,302 20,221,937 19,080,302 20,221,937
Total Outstanding Debt 84,848,790$ 90,109,540$ 107,728,187$ 91,611,438$ 192,576,977$ 181,720,978$
Activities Activities Government
City of Winchester’s Outstanding DebtFiscal Year ended June 30, 2012
Governmental Business-Type Total Primary
The City’s General Obligation Bonds in prior bond issues have been rated AA+ by Standard & Poor’s Corporation, and Aa2 by Moody’s Investors Service. The legal debt margin of the City is 10% of the total assessed valuation of the real estate within the City, which is subject to local taxation. The limitation complies with Article VII, Section 10(a) of the Constitution of Virginia, 1971, and Section 15.1-176 of the Code of Virginia, 1950, which defines the limitation on outstanding indebtedness that may be incurred by cities. Based on 10% of the assessed value of real property, the City’s legal debt limit is $281.5 million. As of June 30, 2012, the City’s total debt applicable to the limitation totaled $106.9 million, leaving a legal debt margin of $174.6 million. .
3k
Economic Factors and Next Year’s Budgets and Rates
The City of Winchester completed an Economic Development Master Plan and adopted the updated Comprehensive Plan. The goal described in both of these new plans is to attract young professionals, and families headed by individuals over the age of 55. These are the two largest growing population segments in the country, with the largest amounts of disposable income and the minimal impact on municipal services. Our plans call for major changes in land use to allow for more mixed use development and increases in housing density with the hope that these changes will allow for the development of appropriate housing and work environments required to attract these population segments. These two populations groups will help provide a skilled workforce for future employment, particularly in our growing health services industries, along with providing market support for our retail and service sectors.
In order to replace the aging utility infrastructure, the City has continued with major water and sewer main replacement projects, including the North End Utility Replacement Project and the Amherst Street Infrastructure Improvements Project. Construction on both of these projects was initiated in FY 2012 and will be completed in FY 2013. In addition, the City will also complete water and sewer main replacements on Indian Alley and the Pedestrian Walking Mall in FY 2013. In order to finance the additional debt service for these major improvements, a 14-percent water and sewer rate increase went into effect on June 1, 2012, and an additional 14-percent increase will go into effect on June 1, 2013.
For the month of June 2012, the City’s unemployment rate was 6.6%, compared to the State’s 6.0% and Federal rate of 8.4%.
Contacting the City’s Financial Management
This financial report is designed to provide citizens, taxpayers, customers, investors, and creditors with a
general overview of the City’s finances and to demonstrate the City’s accountability for the funds it
receives. If you have questions about this report or need additional financial information, contact the
Director of Finance, City of Winchester, 15 N. Cameron Street, Winchester, VA 22601.

BASIC FINANCIAL STATEMENTS.

THIS PAGE IS INTENTIONALLY LEFT BLANK.

GOVERNMENT WIDE FINANCIAL STATEMENTS

THIS PAGE IS INTENTIONALLY LEFT BLANK.
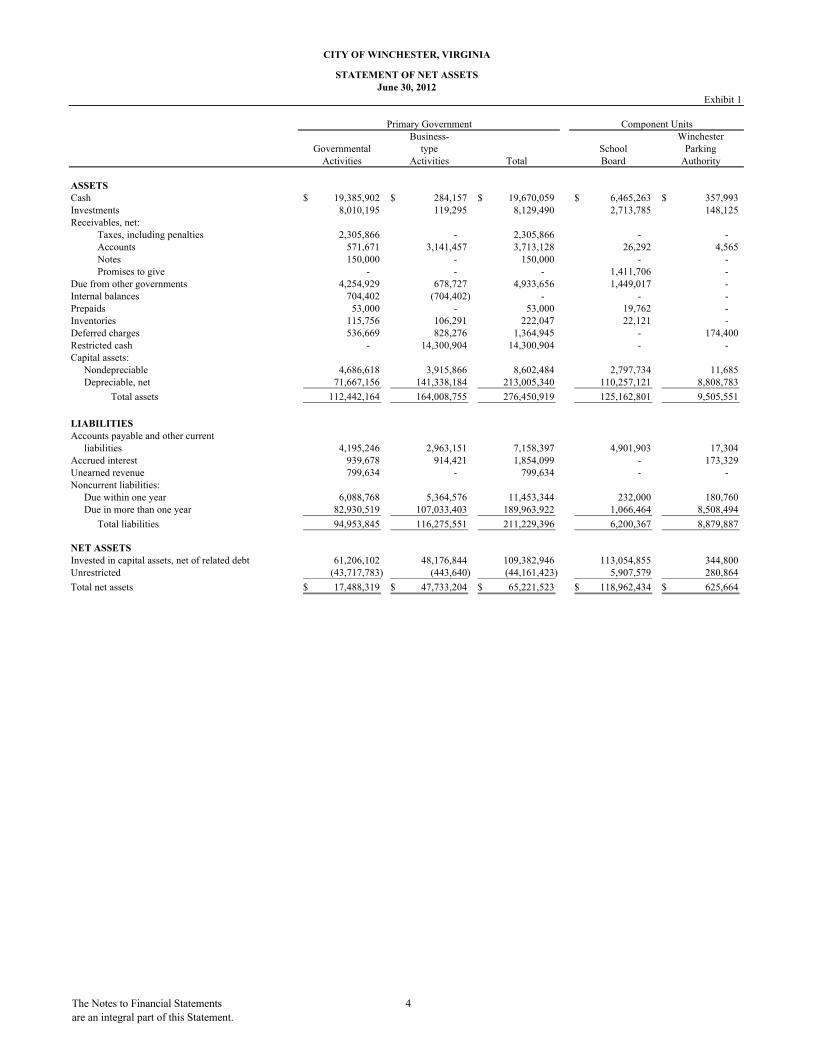
Exhibit 1
Business- WinchesterGovernmental type School Parking
Activities Activities Total Board Authority
ASSETSCash 19,385,902$ 284,157$ 19,670,059$ 6,465,263$ 357,993$ Investments 8,010,195 119,295 8,129,490 2,713,785 148,125 Receivables, net:
Taxes, including penalties 2,305,866 - 2,305,866 - - Accounts 571,671 3,141,457 3,713,128 26,292 4,565 Notes 150,000 - 150,000 - - Promises to give - - - 1,411,706 -
Due from other governments 4,254,929 678,727 4,933,656 1,449,017 - Internal balances 704,402 (704,402) - - - Prepaids 53,000 - 53,000 19,762 - Inventories 115,756 106,291 222,047 22,121 - Deferred charges 536,669 828,276 1,364,945 - 174,400 Restricted cash - 14,300,904 14,300,904 - - Capital assets:
Nondepreciable 4,686,618 3,915,866 8,602,484 2,797,734 11,685 Depreciable, net 71,667,156 141,338,184 213,005,340 110,257,121 8,808,783
Total assets 112,442,164 164,008,755 276,450,919 125,162,801 9,505,551
Accounts payable and other currentliabilities 4,195,246 2,963,151 7,158,397 4,901,903 17,304
Accrued interest 939,678 914,421 1,854,099 - 173,329 Unearned revenue 799,634 - 799,634 - - Noncurrent liabilities:
Due within one year 6,088,768 5,364,576 11,453,344 232,000 180,760 Due in more than one year 82,930,519 107,033,403 189,963,922 1,066,464 8,508,494
Total liabilities 94,953,845 116,275,551 211,229,396 6,200,367 8,879,887
Invested in capital assets, net of related debt 61,206,102 48,176,844 109,382,946 113,054,855 344,800 Unrestricted (43,717,783) (443,640) (44,161,423) 5,907,579 280,864
Total net assets 17,488,319$ 47,733,204$ 65,221,523$ 118,962,434$ 625,664$
LIABILITIES
NET ASSETS
Primary Government Component Units
CITY OF WINCHESTER, VIRGINIA
STATEMENT OF NET ASSETSJune 30, 2012
The Notes to Financial Statements
are an integral part of this Statement.
4

Exhibit 2
Operating Capital WinchesterCharges for Grants and Grants and Governmental Business-type School Parking
Functions/Programs Expenses Services Contributions Contributions Activities Activities Total Board AuthorityPrimary government:
Governmental activities:General government 4,450,987$ 269,955$ 227,259$ -$ (3,953,773)$ (3,953,773)$ Judicial administration 2,937,196 837,066 1,197,693 - (902,437) (902,437) Public safety 18,061,684 961,651 1,576,089 - (15,523,944) (15,523,944) Public works 11,502,592 1,193,772 4,570,451 1,904,428 (3,833,941) (3,833,941) Health and welfare 7,659,067 61,555 4,876,840 - (2,720,672) (2,720,672) Education 25,383,157 - - - (25,383,157) (25,383,157) Parks, recreation, and culture 3,525,459 777,314 103,355 - (2,644,790) (2,644,790) Community development 2,077,685 279,155 541,412 - (1,257,118) (1,257,118) Interest on long-term debt 3,436,706 - - - (3,436,706) (3,436,706)
Total governmental activities 79,034,533 4,380,468 13,093,099 1,904,428 (59,656,538) (59,656,538)
Business-type activities:Water and sewer 19,207,251 20,219,861 - 3,882,896 - 4,895,506$ 4,895,506
Total business-type activities 19,207,251 20,219,861 - 3,882,896 - 4,895,506 4,895,506
Total primary government 98,241,784$ 24,600,329$ 13,093,099$ 5,787,324$ (59,656,538) 4,895,506 (54,761,032)
Component units:School board 49,246,256$ 869,102$ 20,824,041$ 390,328$ (27,162,785)$ -$ Parking authority 1,199,913 912,755 - - - (287,158)
Total component unit 50,446,169$ 1,781,857$ 20,824,041$ 390,328$ (27,162,785) (287,158)
General revenues: Taxes: Property taxes 34,768,213 - 34,768,213 - - Sales taxes 8,485,685 - 8,485,685 - - Utility taxes 1,616,764 - 1,616,764 - - Business license taxes 5,678,324 - 5,678,324 - - Franchise taxes 302,554 - 302,554 - - Hotel and meals taxes 5,999,862 - 5,999,862 - - Communication taxes 2,142,639 - 2,142,639 - - Other local taxes 1,529,900 - 1,529,900 - - Gain on sale of property 386,296 - 386,296 Miscellaneous 31,860 6,516 38,376 215,316 4,099 Payments from City - - - 25,351,902 - Grants and contributions not restricted to specific programs 3,007,083 - 3,007,083 - - Unrestricted investment earnings 138,851 32,925 171,776 73,813 3,244 Transfers 1,600,000 (1,600,000) - - -
Total revenues and transfers 65,688,031 (1,560,559) 64,127,472 25,641,031 7,343
Change in net assets 6,031,493 3,334,947 9,366,440 (1,521,754) (279,815) Net assets - beginning 11,456,826 44,398,257 55,855,083 120,484,188 905,479
Net assets - ending 17,488,319$ 47,733,204$ 65,221,523$ 118,962,434$ 625,664$
Component UnitsChanges in Net Assets
Net (Expenses) Revenues and
Primary GovernmentProgram Revenues
CITY OF WINCHESTER, VIRGINIASTATEMENT OF ACTIVITIES
For the Year Ended June 30, 2012
The Notes to Financial Statements
are an integral part of this Statement.
5
FUND FINANCIAL STATEMENTS

THIS PAGE IS INTENTIONALLY LEFT BLANK.

Exhibit 3Other Total
Governmental Governmental General Funds Funds
ASSETSCash 14,513,786$ 2,616,734$ 17,130,520$ Investments 6,092,175 1,098,568 7,190,743 Receivables, net:
Taxes, including penalties 2,305,866 - 2,305,866 Accounts 297,749 169,984 467,733 Notes - 150,000 150,000
Prepaids - 40,000 40,000 Inventories 7,081 - 7,081 Due from other funds 918,000 - 918,000 Due from other governments 2,777,072 1,477,857 4,254,929
Total assets 26,911,729$ 5,553,143$ 32,464,872$
LIABILITIES AND FUND BALANCESLiabilities:
Accounts payable 692,350$ 1,459,288$ 2,151,638$ Deposits payable 80,712 - 80,712 Accrued payroll 845,637 215,960 1,061,597 Due to other funds - 364,000 364,000 Deferred revenues 2,953,132 151,250 3,104,382
Total liabilities 4,571,831 2,190,498 6,762,329
Fund balances:Nonspendable 7,081 190,000 197,081 Restricted 476,780 - 476,780 Committed 1,300,000 - 1,300,000 Assigned 5,410,412 3,172,645 8,583,057 Unassigned 15,145,625 - 15,145,625
Total fund balances 22,339,898 3,362,645 25,702,543
CITY OF WINCHESTER, VIRGINIABALANCE SHEET
GOVERNMENTAL FUNDSJune 30, 2012
Total liabilities and fund balances 26,911,729$ 5,553,143$
Amounts reported for governmental activities in the Statement of NetAssets (Exhibit 1) are different because:
Capital assets used in governmental activities are not financialresources and, therefore, are not reported in the funds. 76,334,272
Other long-term assets are not available to pay for current-periodexpenditures and, therefore, are deferred in the funds. 2,304,748
Internal service funds are used by management to charge the costs ofsupplies, employee benefits, and risk management to individualfunds. The assets and liabilities of the internal service funds areincluded in governmental activities in the statement of net assets. 1,691,285
Long-term liabilities, including bonds payable, are not due and payablein the current period and therefore are not reported in the funds. (88,544,529)
Net assets of governmental activities 17,488,319$
The Notes to Financial Statements
are an integral part of this Statement.
6
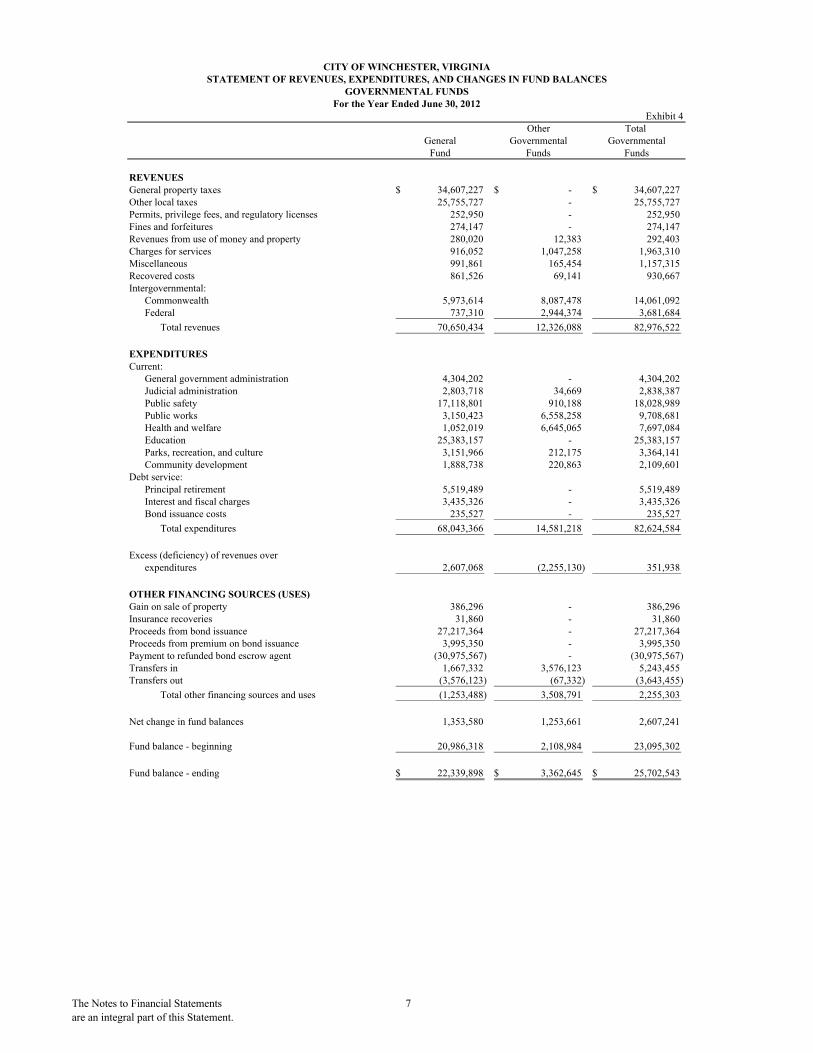
Exhibit 4 Other Total
General Governmental GovernmentalFund Funds Funds
REVENUESGeneral property taxes 34,607,227$ -$ 34,607,227$ Other local taxes 25,755,727 - 25,755,727
252,950 - 252,950 Fines and forfeitures 274,147 - 274,147 Revenues from use of money and property 280,020 12,383 292,403 Charges for services 916,052 1,047,258 1,963,310 Miscellaneous 991,861 165,454 1,157,315 Recovered costs 861,526 69,141 930,667 Intergovernmental:
Commonwealth 5,973,614 8,087,478 14,061,092 Federal 737,310 2,944,374 3,681,684
Total revenues 70,650,434 12,326,088 82,976,522
EXPENDITURESCurrent:
General government administration 4,304,202 - 4,304,202 Judicial administration 2,803,718 34,669 2,838,387 Public safety 17,118,801 910,188 18,028,989 Public works 3,150,423 6,558,258 9,708,681 Health and welfare 1,052,019 6,645,065 7,697,084 Education 25,383,157 - 25,383,157 Parks, recreation, and culture 3,151,966 212,175 3,364,141 Community development 1,888,738 220,863 2,109,601
Debt service:Principal retirement 5,519,489 - 5,519,489 Interest and fiscal charges 3,435,326 - 3,435,326 Bond issuance costs 235,527 - 235,527
Total expenditures 68,043,366 14,581,218 82,624,584
Excess (deficiency) of revenues over expenditures 2,607,068 (2,255,130) 351,938
OTHER FINANCING SOURCES (USES)Gain on sale of property 386,296 - 386,296 Insurance recoveries 31,860 - 31,860 Proceeds from bond issuance 27,217,364 - 27,217,364 Proceeds from premium on bond issuance 3,995,350 - 3,995,350 Payment to refunded bond escrow agent (30,975,567) - (30,975,567) Transfers in 1,667,332 3,576,123 5,243,455 Transfers out (3,576,123) (67,332) (3,643,455)
Total other financing sources and uses (1,253,488) 3,508,791 2,255,303
Net change in fund balances 1,353,580 1,253,661 2,607,241
Fund balance - beginning 20,986,318 2,108,984 23,095,302
Fund balance - ending 22,339,898$ 3,362,645$ 25,702,543$
Permits, privilege fees, and regulatory licenses
CITY OF WINCHESTER, VIRGINIASTATEMENT OF REVENUES, EXPENDITURES, AND CHANGES IN FUND BALANCES
GOVERNMENTAL FUNDSFor the Year Ended June 30, 2012
The Notes to Financial Statements
are an integral part of this Statement.
7
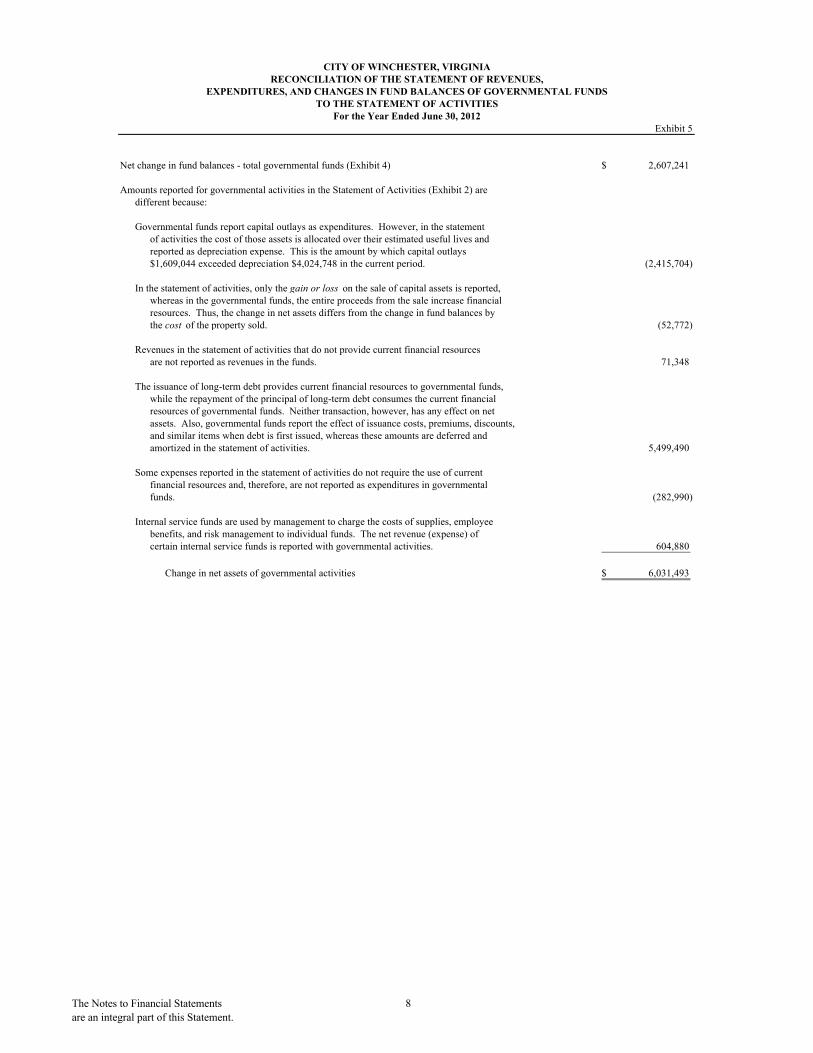
Exhibit 5
Net change in fund balances - total governmental funds (Exhibit 4) 2,607,241$
Amounts reported for governmental activities in the Statement of Activities (Exhibit 2) aredifferent because:
Governmental funds report capital outlays as expenditures. However, in the statementof activities the cost of those assets is allocated over their estimated useful lives andreported as depreciation expense. This is the amount by which capital outlays$1,609,044 exceeded depreciation $4,024,748 in the current period. (2,415,704)
In the statement of activities, only the gain or loss on the sale of capital assets is reported,whereas in the governmental funds, the entire proceeds from the sale increase financialresources. Thus, the change in net assets differs from the change in fund balances bythe cost of the property sold. (52,772)
Revenues in the statement of activities that do not provide current financial resourcesare not reported as revenues in the funds. 71,348
The issuance of long-term debt provides current financial resources to governmental funds, while the repayment of the principal of long-term debt consumes the current financialresources of governmental funds. Neither transaction, however, has any effect on netassets. Also, governmental funds report the effect of issuance costs, premiums, discounts,and similar items when debt is first issued, whereas these amounts are deferred andamortized in the statement of activities. 5,499,490
Some expenses reported in the statement of activities do not require the use of currentfinancial resources and, therefore, are not reported as expenditures in governmentalfunds. (282,990)
Internal service funds are used by management to charge the costs of supplies, employeebenefits, and risk management to individual funds. The net revenue (expense) ofcertain internal service funds is reported with governmental activities. 604,880
Change in net assets of governmental activities 6,031,493$
For the Year Ended June 30, 2012
CITY OF WINCHESTER, VIRGINIARECONCILIATION OF THE STATEMENT OF REVENUES,
EXPENDITURES, AND CHANGES IN FUND BALANCES OF GOVERNMENTAL FUNDSTO THE STATEMENT OF ACTIVITIES
The Notes to Financial Statements
are an integral part of this Statement.
8
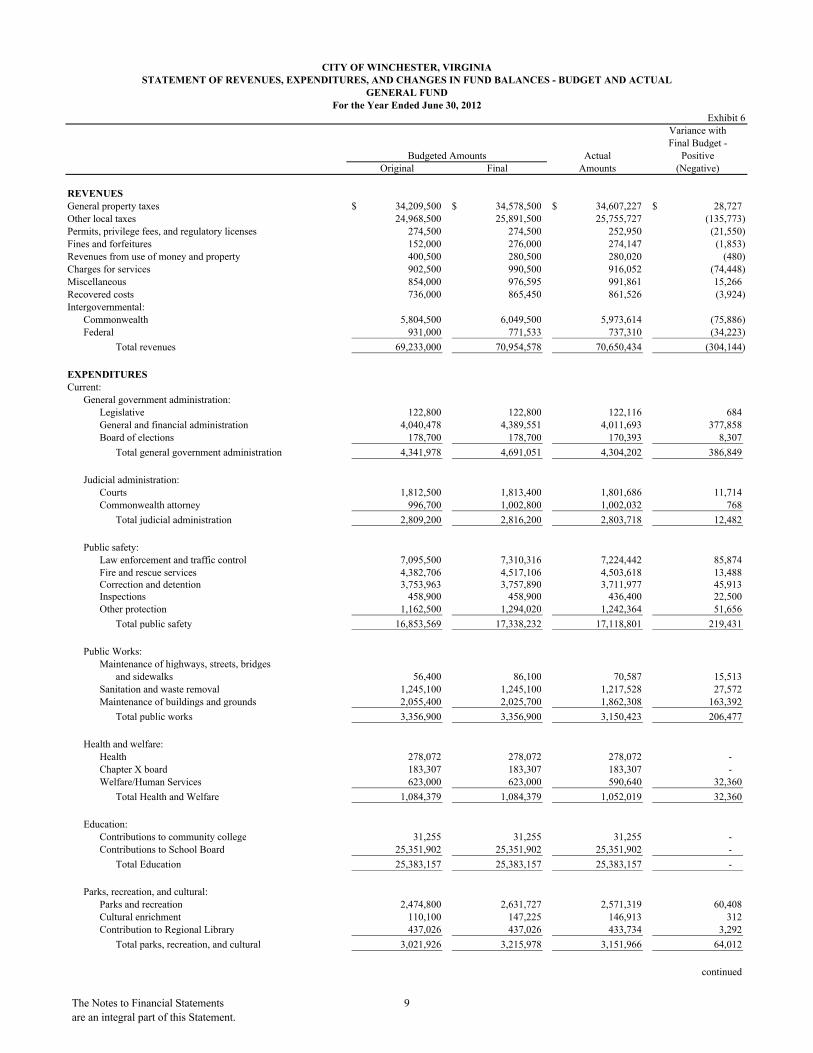
Exhibit 6Variance withFinal Budget -
Actual PositiveOriginal Final Amounts (Negative)
REVENUES34,209,500$ 34,578,500$ 34,607,227$ 28,727$
Other local taxes 24,968,500 25,891,500 25,755,727 (135,773) 274,500 274,500 252,950 (21,550)
Fines and forfeitures 152,000 276,000 274,147 (1,853) 400,500 280,500 280,020 (480)
Charges for services 902,500 990,500 916,052 (74,448) Miscellaneous 854,000 976,595 991,861 15,266 Recovered costs 736,000 865,450 861,526 (3,924) Intergovernmental:
Commonwealth 5,804,500 6,049,500 5,973,614 (75,886) Federal 931,000 771,533 737,310 (34,223)
Total revenues 69,233,000 70,954,578 70,650,434 (304,144)
EXPENDITURESCurrent:
General government administration:Legislative 122,800 122,800 122,116 684 General and financial administration 4,040,478 4,389,551 4,011,693 377,858 Board of elections 178,700 178,700 170,393 8,307
Total general government administration 4,341,978 4,691,051 4,304,202 386,849
Judicial administration:Courts 1,812,500 1,813,400 1,801,686 11,714 Commonwealth attorney 996,700 1,002,800 1,002,032 768
Total judicial administration 2,809,200 2,816,200 2,803,718 12,482
Public safety:Law enforcement and traffic control 7,095,500 7,310,316 7,224,442 85,874 Fire and rescue services 4,382,706 4,517,106 4,503,618 13,488 Correction and detention 3,753,963 3,757,890 3,711,977 45,913 Inspections 458,900 458,900 436,400 22,500 Other protection 1,162,500 1,294,020 1,242,364 51,656
Total public safety 16,853,569 17,338,232 17,118,801 219,431
Public Works:Maintenance of highways, streets, bridges
and sidewalks 56,400 86,100 70,587 15,513 Sanitation and waste removal 1,245,100 1,245,100 1,217,528 27,572 Maintenance of buildings and grounds 2,055,400 2,025,700 1,862,308 163,392
Total public works 3,356,900 3,356,900 3,150,423 206,477
Health and welfare:Health 278,072 278,072 278,072 - Chapter X board 183,307 183,307 183,307 - Welfare/Human Services 623,000 623,000 590,640 32,360
Total Health and Welfare 1,084,379 1,084,379 1,052,019 32,360
Education:Contributions to community college 31,255 31,255 31,255 - Contributions to School Board 25,351,902 25,351,902 25,351,902 -
Total Education 25,383,157 25,383,157 25,383,157 -
Parks, recreation, and cultural:Parks and recreation 2,474,800 2,631,727 2,571,319 60,408 Cultural enrichment 110,100 147,225 146,913 312 Contribution to Regional Library 437,026 437,026 433,734 3,292
Total parks, recreation, and cultural 3,021,926 3,215,978 3,151,966 64,012
continued
Permits, privilege fees, and regulatory licenses
Revenues from use of money and property
CITY OF WINCHESTER, VIRGINIASTATEMENT OF REVENUES, EXPENDITURES, AND CHANGES IN FUND BALANCES - BUDGET AND ACTUAL
GENERAL FUNDFor the Year Ended June 30, 2012
Budgeted Amounts
General property taxes
The Notes to Financial Statements
are an integral part of this Statement.
9
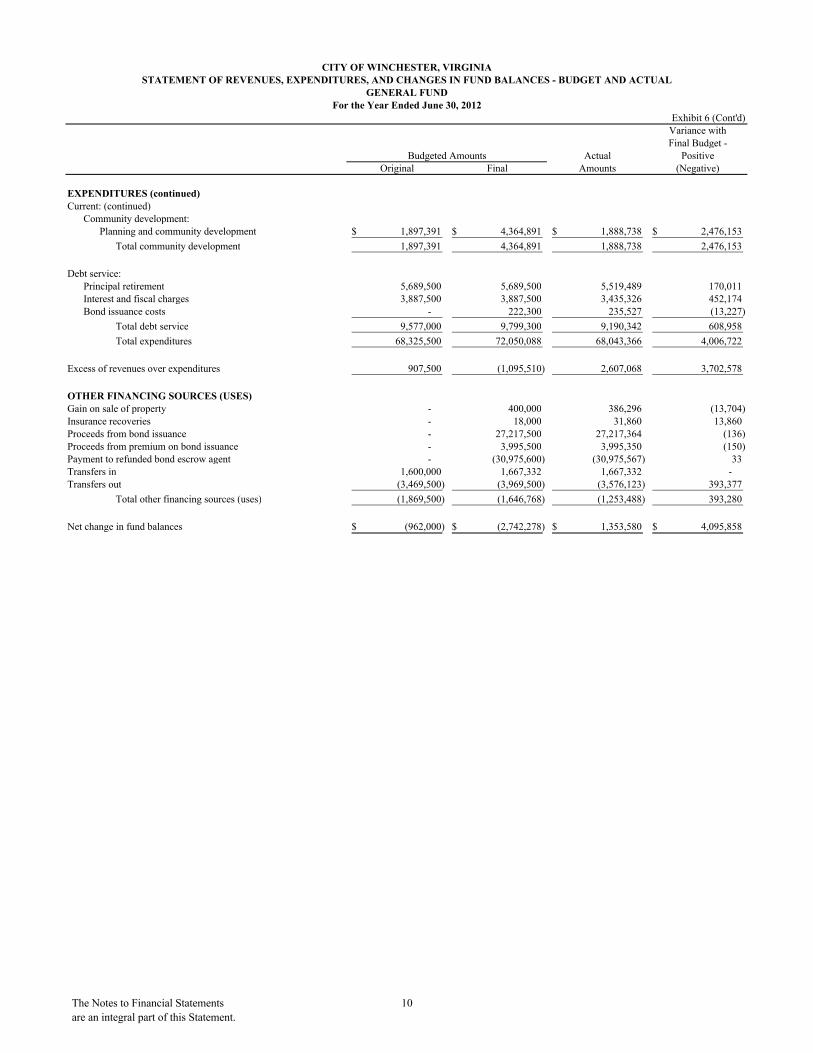
Exhibit 6 (Cont'd)Variance withFinal Budget -
Actual PositiveOriginal Final Amounts (Negative)
EXPENDITURES (continued)Current: (continued)
Community development:Planning and community development 1,897,391$ 4,364,891$ 1,888,738$ 2,476,153$
Total community development 1,897,391 4,364,891 1,888,738 2,476,153
Debt service:Principal retirement 5,689,500 5,689,500 5,519,489 170,011 Interest and fiscal charges 3,887,500 3,887,500 3,435,326 452,174 Bond issuance costs - 222,300 235,527 (13,227)
Total debt service 9,577,000 9,799,300 9,190,342 608,958
Total expenditures 68,325,500 72,050,088 68,043,366 4,006,722
Excess of revenues over expenditures 907,500 (1,095,510) 2,607,068 3,702,578
OTHER FINANCING SOURCES (USES)Gain on sale of property - 400,000 386,296 (13,704) Insurance recoveries - 18,000 31,860 13,860 Proceeds from bond issuance - 27,217,500 27,217,364 (136) Proceeds from premium on bond issuance - 3,995,500 3,995,350 (150) Payment to refunded bond escrow agent - (30,975,600) (30,975,567) 33 Transfers in 1,600,000 1,667,332 1,667,332 - Transfers out (3,469,500) (3,969,500) (3,576,123) 393,377
Total other financing sources (uses) (1,869,500) (1,646,768) (1,253,488) 393,280
Net change in fund balances (962,000)$ (2,742,278)$ 1,353,580$ 4,095,858$
CITY OF WINCHESTER, VIRGINIASTATEMENT OF REVENUES, EXPENDITURES, AND CHANGES IN FUND BALANCES - BUDGET AND ACTUAL
Budgeted Amounts
GENERAL FUNDFor the Year Ended June 30, 2012
The Notes to Financial Statements
are an integral part of this Statement.
10
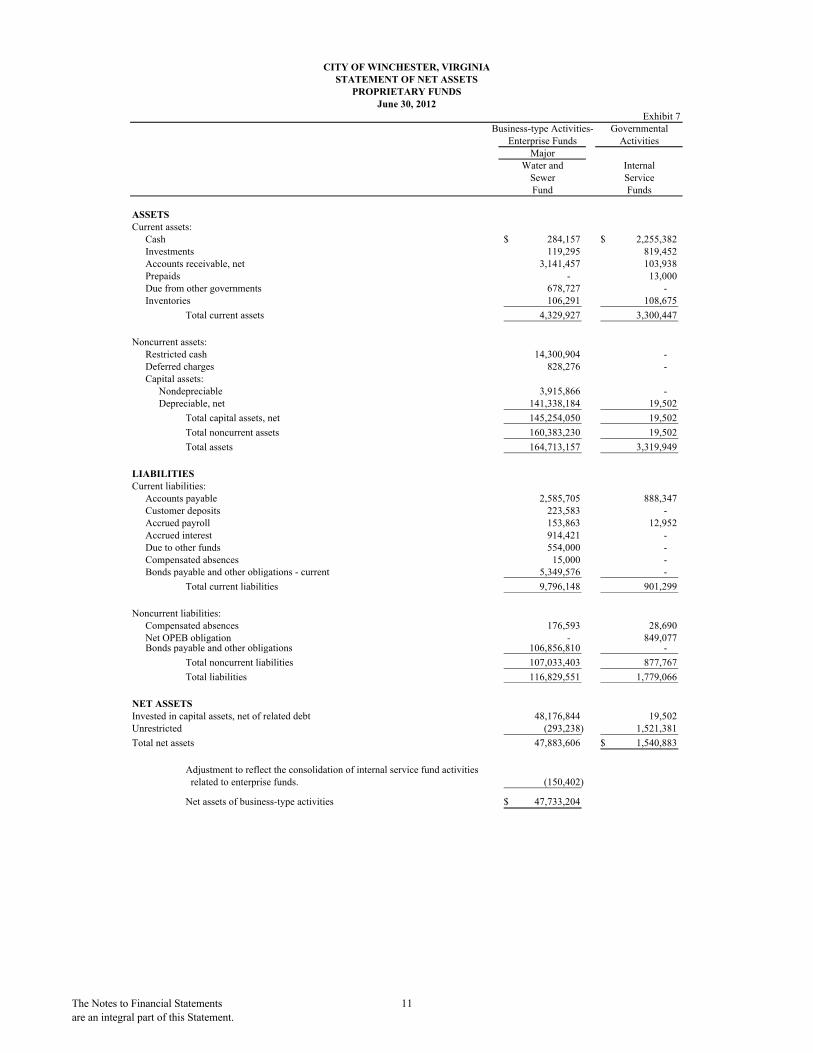
Exhibit 7Business-type Activities- Governmental
Enterprise Funds ActivitiesMajor
Water and InternalSewer ServiceFund Funds
ASSETS
Cash 284,157$ 2,255,382$ Investments 119,295 819,452 Accounts receivable, net 3,141,457 103,938 Prepaids - 13,000 Due from other governments 678,727 - Inventories 106,291 108,675
Total current assets 4,329,927 3,300,447
Noncurrent assets:Restricted cash 14,300,904 - Deferred charges 828,276 - Capital assets:
Nondepreciable 3,915,866 - Depreciable, net 141,338,184 19,502
Total capital assets, net 145,254,050 19,502
Total noncurrent assets 160,383,230 19,502
Total assets 164,713,157 3,319,949
Current liabilities:Accounts payable 2,585,705 888,347 Customer deposits 223,583 - Accrued payroll 153,863 12,952 Accrued interest 914,421 - Due to other funds 554,000 - Compensated absences 15,000 - Bonds payable and other obligations - current 5,349,576 -
CITY OF WINCHESTER, VIRGINIA
PROPRIETARY FUNDSJune 30, 2012
STATEMENT OF NET ASSETS
LIABILITIES
Current assets:
Bonds payable and other obligations - current 5,349,576 -
Total current liabilities 9,796,148 901,299
Noncurrent liabilities:Compensated absences 176,593 28,690 Net OPEB obligation - 849,077 Bonds payable and other obligations 106,856,810 -
Total noncurrent liabilities 107,033,403 877,767
Total liabilities 116,829,551 1,779,066
Invested in capital assets, net of related debt 48,176,844 19,502 Unrestricted (293,238) 1,521,381
Total net assets 47,883,606 1,540,883$
Adjustment to reflect the consolidation of internal service fund activities related to enterprise funds. (150,402)
Net assets of business-type activities 47,733,204$
NET ASSETS
The Notes to Financial Statements
are an integral part of this Statement.
11
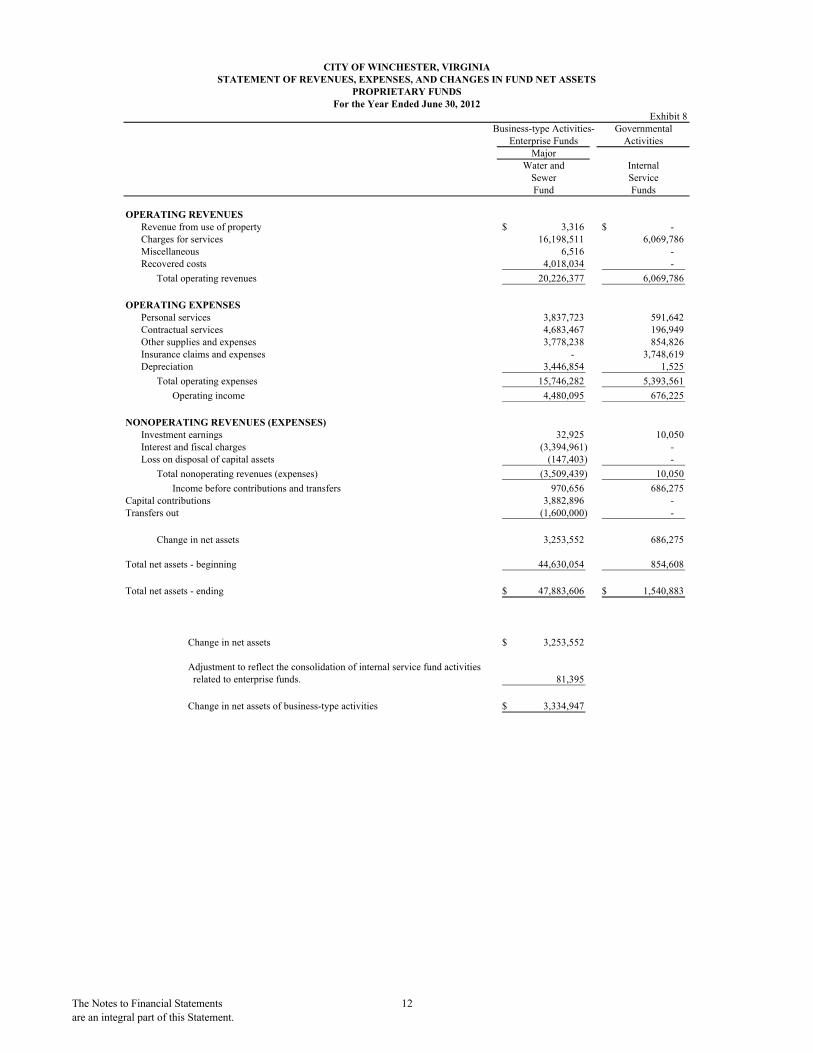
CITY OF WINCHESTER, VIRGINIASTATEMENT OF REVENUES, EXPENSES, AND CHANGES IN FUND NET ASSETS
PROPRIETARY FUNDSFor the Year Ended June 30, 2012
Exhibit 8 Business-type Activities- Governmental Enterprise Funds Activities
MajorWater and Internal
Sewer Service Fund Funds
OPERATING REVENUESRevenue from use of property 3,316$ -$ Charges for services 16,198,511 6,069,786 Miscellaneous 6,516 - Recovered costs 4,018,034 -
Total operating revenues 20,226,377 6,069,786
OPERATING EXPENSESPersonal services 3,837,723 591,642 Contractual services 4,683,467 196,949 Other supplies and expenses 3,778,238 854,826 Insurance claims and expenses - 3,748,619 Depreciation 3,446,854 1,525
Total operating expenses 15,746,282 5,393,561
Operating income 4,480,095 676,225
NONOPERATING REVENUES (EXPENSES)Investment earnings 32,925 10,050 Interest and fiscal charges (3,394,961) - Loss on disposal of capital assets (147,403) -
Total nonoperating revenues (expenses) (3,509,439) 10,050
Income before contributions and transfers 970,656 686,275 Capital contributions 3,882,896 - Transfers out (1,600,000) -
Change in net assets 3,253,552 686,275
Total net assets - beginning 44,630,054 854,608 Total net assets - beginning 44,630,054 854,608
Total net assets - ending 47,883,606$ 1,540,883$
Change in net assets 3,253,552$
Adjustment to reflect the consolidation of internal service fund activities related to enterprise funds. 81,395
Change in net assets of business-type activities 3,334,947$
The Notes to Financial Statements
are an integral part of this Statement.
12
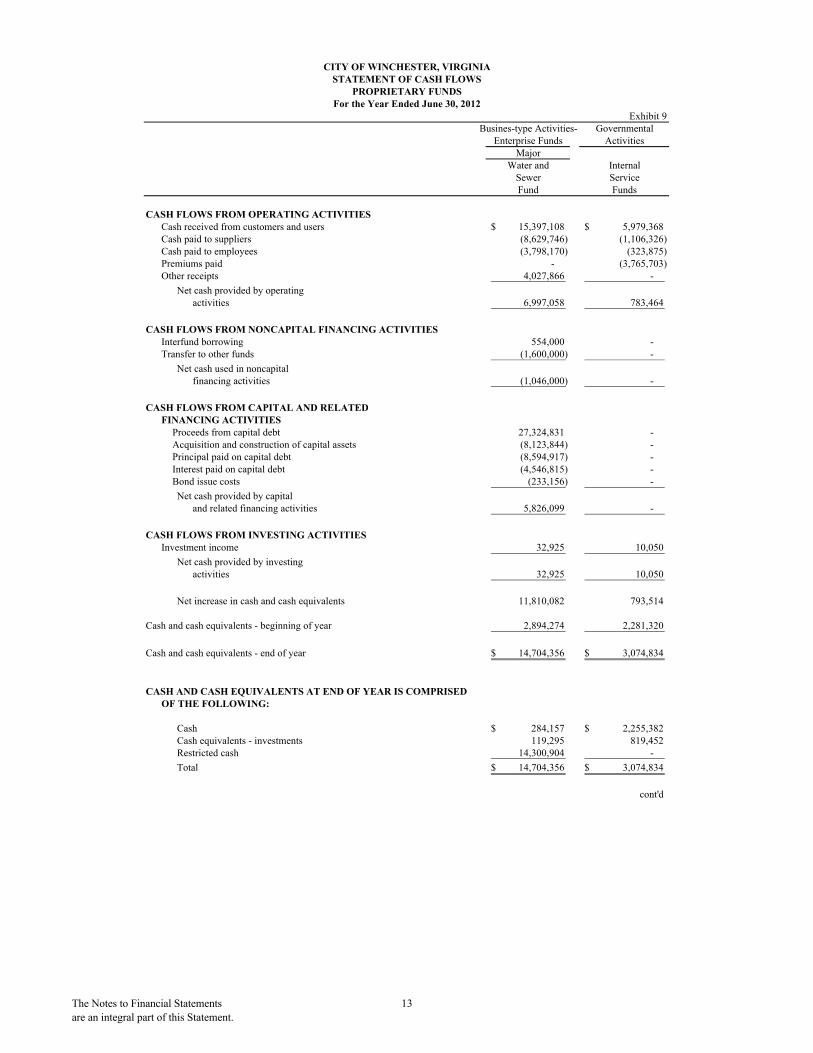
CITY OF WINCHESTER, VIRGINIASTATEMENT OF CASH FLOWS
PROPRIETARY FUNDSFor the Year Ended June 30, 2012
Exhibit 9Busines-type Activities- Governmental
Enterprise Funds ActivitiesMajor
Water and InternalSewer ServiceFund Funds
CASH FLOWS FROM OPERATING ACTIVITIESCash received from customers and users 15,397,108$ 5,979,368$ Cash paid to suppliers (8,629,746) (1,106,326) Cash paid to employees (3,798,170) (323,875) Premiums paid - (3,765,703) Other receipts 4,027,866 -
Net cash provided by operatingactivities 6,997,058 783,464
CASH FLOWS FROM NONCAPITAL FINANCING ACTIVITIESInterfund borrowing 554,000 - Transfer to other funds (1,600,000) -
Net cash used in noncapitalfinancing activities (1,046,000) -
CASH FLOWS FROM CAPITAL AND RELATEDFINANCING ACTIVITIES
Proceeds from capital debt 27,324,831 - Acquisition and construction of capital assets (8,123,844) - Principal paid on capital debt (8,594,917) - Interest paid on capital debt (4,546,815) - Bond issue costs (233,156) -
Net cash provided by capitaland related financing activities 5,826,099 -
CASH FLOWS FROM INVESTING ACTIVITIESInvestment income 32,925 10,050
Net cash provided by investingactivities 32,925 10,050
Net increase in cash and cash equivalents 11,810,082 793,514
Cash and cash equivalents - beginning of year 2,894,274 2,281,320
Cash and cash equivalents - end of year 14,704,356$ 3,074,834$
CASH AND CASH EQUIVALENTS AT END OF YEAR IS COMPRISEDOF THE FOLLOWING:
Cash 284,157$ 2,255,382$ Cash equivalents - investments 119,295 819,452 Restricted cash 14,300,904 -
Total 14,704,356$ 3,074,834$
cont'd
The Notes to Financial Statements
are an integral part of this Statement.
13
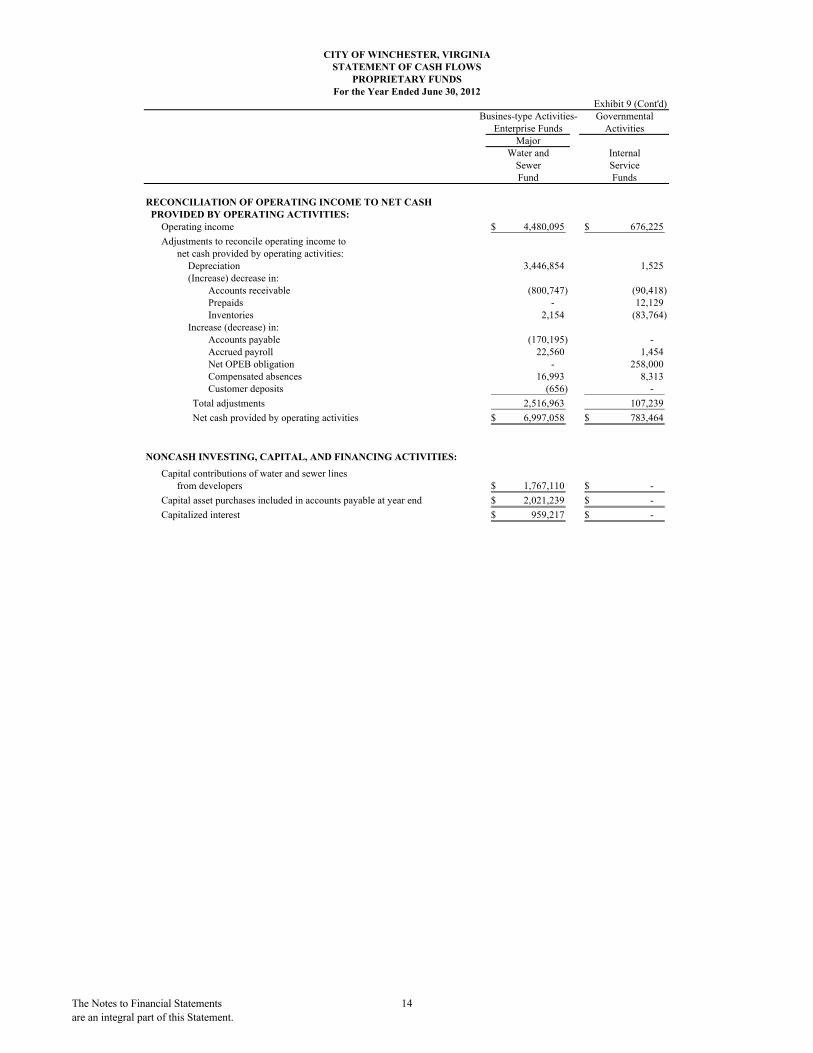
CITY OF WINCHESTER, VIRGINIASTATEMENT OF CASH FLOWS
PROPRIETARY FUNDSFor the Year Ended June 30, 2012
Exhibit 9 (Cont'd)Busines-type Activities- Governmental
Enterprise Funds ActivitiesMajor
Water and InternalSewer ServiceFund Funds
RECONCILIATION OF OPERATING INCOME TO NET CASH PROVIDED BY OPERATING ACTIVITIES:
Operating income 4,480,095$ 676,225$
Adjustments to reconcile operating income tonet cash provided by operating activities:
Depreciation 3,446,854 1,525 (Increase) decrease in:
Accounts receivable (800,747) (90,418) Prepaids - 12,129 Inventories 2,154 (83,764)
Increase (decrease) in:Accounts payable (170,195) - Accrued payroll 22,560 1,454 Net OPEB obligation - 258,000 Compensated absences 16,993 8,313 Customer deposits (656) -
Total adjustments 2,516,963 107,239
Net cash provided by operating activities 6,997,058$ 783,464$
NONCASH INVESTING, CAPITAL, AND FINANCING ACTIVITIES:
Capital contributions of water and sewer linesfrom developers 1,767,110$ -$
Capital asset purchases included in accounts payable at year end 2,021,239$ -$
Capitalized interest 959,217$ -$
The Notes to Financial Statements
are an integral part of this Statement.
14
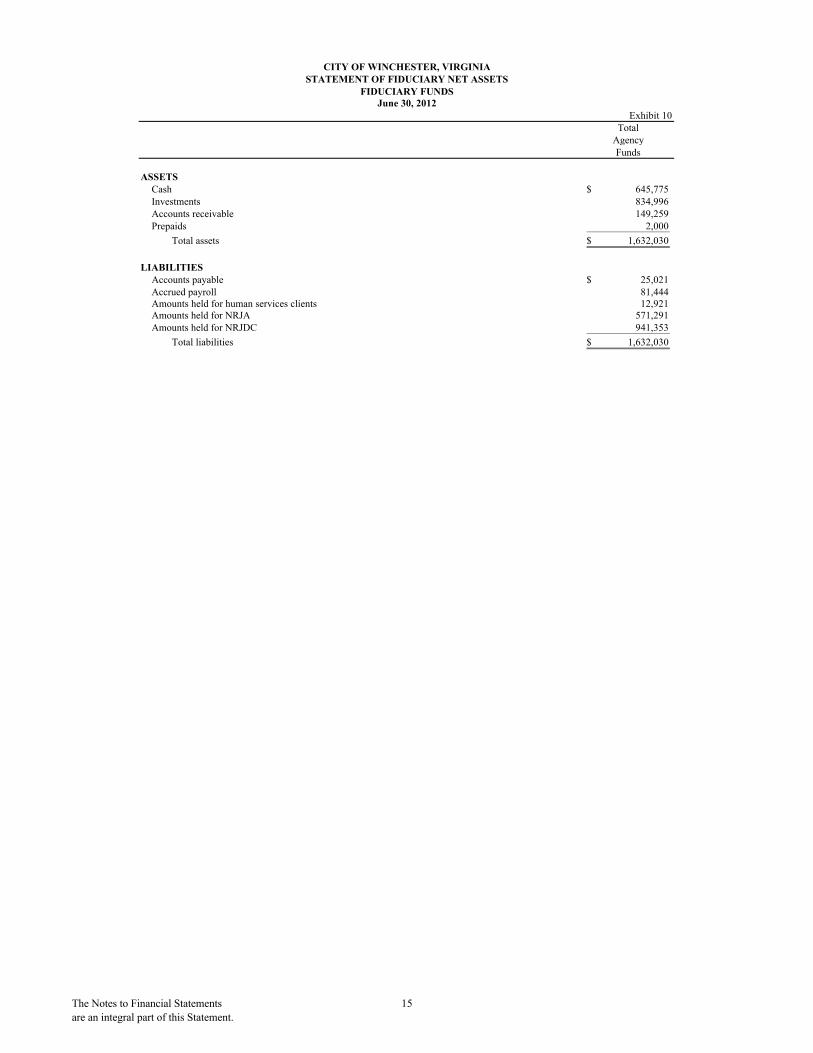
Exhibit 10Total
AgencyFunds
ASSETSCash 645,775$ Investments 834,996 Accounts receivable 149,259 Prepaids 2,000
Total assets 1,632,030$
LIABILITIESAccounts payable 25,021$ Accrued payroll 81,444 Amounts held for human services clients 12,921 Amounts held for NRJA 571,291 Amounts held for NRJDC 941,353
Total liabilities 1,632,030$
CITY OF WINCHESTER, VIRGINIASTATEMENT OF FIDUCIARY NET ASSETS
FIDUCIARY FUNDSJune 30, 2012
The Notes to Financial Statements
are an integral part of this Statement.
15

CITY OF WINCHESTER, VIRGINIA
NOTES TO FINANCIAL STATEMENTS
JUNE 30, 2012
(Continued) 16
Note 1. Summary of Significant Accounting Policies
The financial statements of the City conform to generally accepted accounting principles (GAAP) applicable to government units promulgated by the Governmental Accounting Standards Board (GASB). The following is a summary of the significant accounting policies:
Reporting Entity
The City of Winchester, Virginia (the “City”) was incorporated in 1752 and organized under the Council-Manager form of government. The City is governed by an elected mayor and an eight-member council. The accompanying financial statements present the government and its component units, entities for which the government is considered to be financially accountable. Each discretely presented component unit is reported in a separate column in the government-wide financial statements to emphasize that it is legally separate from the government.
Discretely Presented Component Units:
The City of Winchester School Board was created as a separate legal entity by the City to oversee the operations and management of its publicly funded primary and secondary schools. All members of the School Board are appointed by City Council, and the City has the ability to impose its will upon the Board. In addition, because the School Board does not have taxing powers, the School Board is fiscally dependent upon the City to provide significant funding to operate the public schools. The School Board must also obtain the City’s approval for debt issuances.
The Winchester Parking Authority was created by the City for the purpose of planning and fostering the development of off-street parking facilities. The City appoints all members of the Authority and is able to impose its will on the Authority. The City is financially accountable for the Authority because the City approves the Authority’s budget, levies taxes (if necessary) and must approve any debt issuances.
Separate financial statements of these component units are not available.
Jointly Governed Organizations:
The Frederick-Winchester Service Authority was created by the City and County of Frederick to provide for administration, planning, and design of regional wastewater facilities for the participating jurisdictions. The City appoints a majority of the voting members of the Authority but has no equity interest in the venture. The Authority is able to meet its operating and other costs from charges for services. The City has certain long-term obligations with the Authority that are described further in Note 10.
CITY OF WINCHESTER, VIRGINIA
NOTES TO FINANCIAL STATEMENTS
JUNE 30, 2012
(Continued) 17
Note 1. Summary of Significant Accounting Policies (Continued)
Reporting Entity (Continued)
Jointly Governed Organizations (Continued):
The Winchester Regional Airport Authority was created by the City and the Counties of Frederick, Clarke, Warren, and Shenandoah to operate a regional airport facility. The City appoints less than a majority of Authority members and participating jurisdictions have no equity interest in the venture. The participants normally must subsidize operations and capital needs. During 2012, the City provided total support of $55,179.
The Northwestern Juvenile Detention Center Commission was created by the City of Winchester and the Counties of Clarke, Frederick, Page, Shenandoah, and Warren to provide for the operation of a regional juvenile detention center for the use of the participating jurisdictions. The City serves as fiscal agent for the Commission and appoints a majority of the voting members of the Commission, but has no equity interest in the venture. The participants must subsidize operations and capital needs. During 2012, the City provided total support of $215,127.
Separate financial statements for these joint ventures may be obtained at the entity’s Administrative offices as follows:
Frederick-Winchester Service Authority Winchester Regional Airport AuthorityP. O. Box 43 491 Airport RoadWinchester, VA 22604 Winchester, VA 22602
Northwestern Juvenile Detention Center Commission145 Fort Collier RoadWinchester, VA 22603
Other Related Organizations:
The Economic Development Authority of the City of Winchester was created by Council resolution to promote industry and trade within the City. A board of seven directors appointed by the City Council governs the Authority; however, the City’s accountability does not extend beyond making the appointments.
The Handley Regional Library Board was created by the City and the Counties of Frederick and Clarke to operate a regional library. Although the City appoints a majority of the Board members, its accountability does not extend beyond making the appointments. The participating localities have no equity interest in the library; however, the City provided $433,734 to the Board for operating support for 2012.
CITY OF WINCHESTER, VIRGINIA
NOTES TO FINANCIAL STATEMENTS
JUNE 30, 2012
(Continued) 18
Note 1. Summary of Significant Accounting Policies (Continued)
Government-Wide and Fund Financial Statements
The government-wide financial statements (i.e., the statement of net assets and the statement of activities) report information on all of the non-fiduciary activities of the primary government and its component units. Governmental activities, which normally are supported by taxes and intergovernmental revenues, are reported separately from business-type activities, which rely to a significant extent on fees and charges for support. Likewise, the primary government is reported separately from certain legally separate component units for which the primary government is financially accountable.
The statement of activities demonstrates the degree to which the direct expenses of a given function or segment is offset by program revenues. Direct expenses are those that are clearly identifiable with a specific function or segment. Program revenues include 1) charges to customers or applicants who purchase, use, or directly benefit from goods, services, or privileges provided by a given function or segment and 2) grants and contributions that are restricted to meeting the operational or capital requirements of a particular function or segment. Taxes and other items not properly included among program revenues are reported instead as general revenues.
Separate financial statements are provided for governmental funds, proprietary funds, and fiduciary funds, even though the latter are excluded from the government-wide financial statements. Major individual governmental funds and major individual enterprise funds are reported as separate columns in the fund financial statements.
Measurement Focus, Basis of Accounting, and Financial Statement Presentation
The government-wide financial statements are reported using the economic resources measurement focusand the accrual basis of accounting, as are the proprietary fund and fiduciary fund financial statements, with the exception of agency fund financial statements, which have no measurement focus. Revenues are recorded when earned and expenses are recorded when a liability is incurred, regardless of the timing of related cash flows. Property taxes are recognized as revenues in the year for which they are levied. Grants and similar items are recognized as revenue as soon as all eligibility requirements imposed by the provider have been met.
Governmental fund financial statements are reported using the current financial resources measurement focus and the modified accrual basis of accounting. Revenues are recognized as soon as they are both measurable and available. Revenues are considered to be available when they are collectible within the current period or soon enough thereafter to pay liabilities of the current period. For this purpose, the government considers revenues to be available if they are collected within 45 days of the end of the current period. Expenditures generally are recorded when a liability is incurred, as under accrual accounting. However, debt service expenditures, as well as expenditures related to compensated absences and claims and judgments, are recorded only when payment is due.
CITY OF WINCHESTER, VIRGINIA
NOTES TO FINANCIAL STATEMENTS
JUNE 30, 2012
(Continued) 19
Note 1. Summary of Significant Accounting Policies (Continued)
Measurement Focus, Basis of Accounting, and Financial Statement Presentation (Continued)
Property taxes, franchise taxes, licenses, and interest associated with the current fiscal period are all considered to be susceptible to accrual and so have been recognized as revenues of the current fiscal period. Accordingly, real and personal property taxes are recorded as revenues and receivables when billed, net of allowances for uncollectible amounts. Property taxes not collected within 45 days after year-end are reflected as deferred revenues. Sales and utility taxes, which are collected by the state or utilities and subsequently remitted to the City, are recognized as revenues and receivables upon collection by the state or utility, which is generally in the month preceding receipt by the City.
Licenses, permits, fines, and rents are recorded as revenues when received. Intergovernmental revenues, consisting primarily of federal, state and other grants for the purpose of funding specific expenditures, are recognized when earned or at the time of the specific expenditure. Revenues from general-purpose grants are recognized in the period to which the grant applies. All other revenue items are considered to be measurable and available only when the government receives cash.
Governmental funds account for the expendable financial resources, other than those accounted for in Proprietary and Fiduciary Funds. The governmental funds use the modified accrual basis of accounting where the measurement focus is upon determination of financial position and changes in financial position, rather than on net income determination as would apply to a commercial enterprise. The City reports the following governmental funds:
The General fund is the government’s primary operating fund. It accounts for all financial resources of the general government, except those required to be accounted for in another fund. The General Fund is considered a major fund for financial reporting purposes.
Special revenue funds account for the proceeds of specific revenue sources (other than major capital projects) that are legally restricted to expenditures for specified purposes. Special revenue funds consist of the Human Services Fund, Highway Maintenance Fund, Emergency Medical Services Fund, Winchester-Frederick County Convention and Visitors Bureau Fund, Law Library Fund, and Bus Fund.
Capital projects fund accounts for financial resources to be used for the acquisition or construction of major capital facilities, other than those financed by proprietary funds. Capital projects funds consist of the Capital Improvements Fund.
CITY OF WINCHESTER, VIRGINIA
NOTES TO FINANCIAL STATEMENTS
JUNE 30, 2012
(Continued) 20
Note 1. Summary of Significant Accounting Policies (Continued)
Measurement Focus, Basis of Accounting, and Financial Statement Presentation (Continued)
Proprietary funds account for operations that are financed in a manner similar to private business enterprises. The proprietary funds utilize the accrual basis of accounting where the measurement focus is upon determination of net income. Proprietary funds consist of enterprise and internal service funds. The government reports the following proprietary funds:
Enterprise funds account for operations where the intent of the City is that the cost of provided services to the general public be financed and recovered through user charges. Enterprise funds consist of the water and sewer fund. The Water and Sewer Fund, which accounts for the operation of the City’s water distribution system and sewage collection system, is considered a major fund for financial reporting purposes.
Internal service funds account for employee fringes, equipment inventory, and other post-employment benefits provided to other departments or agencies of the government, or to other governments, on a cost reimbursement basis. Internal service funds consist of the employee benefits fund, equipment operating fund and other post-employment benefits fund.
Fiduciary funds account for assets held by the government in a trustee capacity or as agent or custodian for individuals, private organizations, other governmental units, or other funds. These funds include agency funds. Fiduciary funds utilize the accrual basis of accounting as described in the proprietary funds presentation. Agency funds reported by the City include the special welfare fund, Northwestern Regional Jail Authority Construction fund, and the Northwestern Regional Juvenile Detention Center fund. These funds account for assets held by the City for human services clients, regional jail construction, and a regional juvenile detention center.
Private-sector standards of accounting and financial reporting issued prior to December 1, 1989, generally are followed in both the government-wide and proprietary fund financial statements to the extent that those standards do not conflict with or contradict guidance of the Government Accounting Standards Board. Governments also have the option of following subsequent private-sector guidance for their business-type activities and enterprise funds, subject to this same limitation. The government has elected not to follow subsequent private-sector guidance.
As a general rule the effect of inter-fund activity has been eliminated from the government-wide financial statements. Exceptions to this general rule are payments-in-lieu of taxes and other charges between the government’s water and sewer function and various other functions of the government. Elimination of these charges would distort the direct costs and program revenues reported for the various functions concerned.
Amounts reported as program revenues include 1) charges to customers or applicants for goods, services, or privileges provided, 2) operating grants and contributions, and 3) capital grants and contributions, including special assessments. Internally dedicated resources are reported as general revenues rather than as program revenues. Likewise, general revenues include all taxes.
CITY OF WINCHESTER, VIRGINIA
NOTES TO FINANCIAL STATEMENTS
JUNE 30, 2012
(Continued) 21
Note 1. Summary of Significant Accounting Policies (Continued)
Measurement Focus, Basis of Accounting, and Financial Statement Presentation (Continued)
Proprietary funds distinguish operating revenues and expenses from non-operating items. Operating revenues and expenses generally result from providing services and producing and delivering goods in connection with a proprietary fund’s principal ongoing operations. The principal operating revenues of the water and sewer fund, bus service fund, and internal service funds are charges to customers for sales and services. The water and sewer fund also recognizes as operating revenue the portion of tap fees intended to recover the cost of connecting new customers to the system. Operating expenses for enterprise funds and internal service funds include the cost of sales and services, administrative expenses, and depreciation on capital assets. All revenues and expenses not meeting the operating definition are reported as non-operating revenues and expenses.
Assets, Liabilities, and Net Assets or Equity
Deposits and Investments
The government’s cash and cash equivalents are considered to be cash on hand, demand deposits, and short-term investments with original maturities of three months or less from the date of acquisition.
State statues authorize the government to invest in obligations of the U.S. Treasury, commercial paper, corporate bonds, repurchase agreements, and the State Treasurer’s Investment Pool.
Investments for the government, as well as for its component units, are reported at fair value. The State Treasurer’s Investment Pool operates in accordance with appropriate state laws and regulations. The reported value of the pool is the same as the fair value of the pool shares.

CITY OF WINCHESTER, VIRGINIA
NOTES TO FINANCIAL STATEMENTS
JUNE 30, 2012
(Continued) 22
Note 1. Summary of Significant Accounting Policies (Continued)
Assets, Liabilities, and Net Assets or Equity (Continued)
Receivables and Payables
Activity between funds that is representative of lending/borrowing arrangements outstanding at the end of the fiscal year are referred to as either “due to/from other funds” (i.e., the current portion of inter-fund loans) or “advances to/from other funds” (i.e., the non-current portion of inter-fund loans). All other outstanding balances between funds are reported as “due to/from other funds.” Any residual balances outstanding between the governmental activities and business-type activities are reported in the government-wide financial statements as “internal balances.”
Notes Receivable
The City participates in a “Private Property Rehabilitation Program” funded under a Community Development Block Grant by the Department of Housing and Urban Development. The majority of the funding represents deferred loans payable at maturity date or on change of home ownership, whichever occurs first. The City maintains a security interest in the property. Interest rates on the loans range from non-interest bearing to eight percent.
During the year, the City loaned $150,000 to the South End Fire Company through the Emergency Medical Services Fund to assist with volunteer firefighting and emergency response needs. The loan is to be repaid in equal monthly installments of $1,250 beginning January 1, 2013 until maturity on December 1, 2022. The note does not bear any interest.
Inventories and Prepaid Items
Inventories are valued at cost using the first-in/first-out (FIFO) method. Inventories in the enterprise and internal service funds consist of expendable supplies held for consumption and are accounted for under the consumption method. The cost is recorded as an expense at the time the individual inventory items are used.
Certain payments to vendors reflect costs applicable to future accounting periods and are recorded as prepaid items in both government-wide and fund financial statements.
Property Taxes
Property is assessed at its value on January 1. Property taxes attach as an enforceable lien on property as of January 1. Taxes are payable in two installments on June 5 and December 5. The City bills and collects itsown taxes. The City’s real estate and business-related personal property taxes are levied each calendar year on all taxable property located in the City, and are accounted for in the General fund. Therefore, real estate and business-related personal property taxes that are due within the current fiscal year and collected within 45 days subsequent to year-end are recorded as revenue.
Levy Date January 1Due Date June 5/December 5
CITY OF WINCHESTER, VIRGINIA
NOTES TO FINANCIAL STATEMENTS
JUNE 30, 2012
(Continued) 23
Note 1. Summary of Significant Accounting Policies (Continued)
Assets, Liabilities, and Net Assets or Equity (Continued)
Motor Vehicles
The City employs an innovative system providing for both proration and monthly billing/assessment for personal property taxes on motor vehicles. Property is assessed on the date which a vehicle gains situs in the City, using its value as of the immediately preceding January 1. Taxes attach as a lien on the property as of the date assessed, and are due thirty days after assessment. The City bills and collects its own taxes. These taxes are levied on each vehicle each year in the month in which the property first became taxable in the City. Vehicles already in the City at the adoption of this system were grandfathered in using the same system as for real estate, except that taxes were due in one installment on December 5. Replacement vehicles are taxed using the new system. These taxes are accounted for in the General fund. Accordingly, such taxes due within the current fiscal year and collected within 45 days subsequent to year-end are recorded as revenue.
Levy Date Date on which legal situs is attainedDue Date Thirty days after assessment
Allowance for Uncollectible Accounts
The City calculates its allowance for uncollectible accounts using historical collection data and, in certain cases, specific account analysis. The allowance at June 30, consisted of the following:
General fund (property taxes, penalties, and interest) $ 1,618,107Emergency medical service fund 120,819Water and sewer fund 52,384
$ 1,791,310
Use of Estimates
The preparation of financial statements in conformity with generally accepted accounting principles requires management to make estimates and assumptions that affect certain reported amounts and disclosures. Accordingly, actual results could differ from those estimates.
Capital Assets
Capital assets, which include property, plant, equipment, and infrastructure assets (e.g., roads, bridges, and similar items), are reported in the applicable governmental or business-type activities columns in the government-wide financial statements. The City defines capital assets as assets with an initial, individual cost of more than $10,000 and an estimated useful life in excess of two years. Such assets are recorded at historical cost or estimated historical cost if purchased or constructed. Donated capital assets are recorded at estimated fair market value at the date of donation.

CITY OF WINCHESTER, VIRGINIA
NOTES TO FINANCIAL STATEMENTS
JUNE 30, 2012
(Continued) 24
Note 1. Summary of Significant Accounting Policies (Continued)
Assets, Liabilities, and Net Assets or Equity (Continued)
Capital Assets (Continued)
The cost of normal maintenance and repairs that do not add to the value of the asset or materially extend assets lives are not capitalized.
Major outlays for capital assets and improvements are capitalized as projects are constructed. Interest incurred during the construction phase of capital assets of business-type activities is included as part of the capitalized value of the assets constructed. $959,217 of interest was capitalized during the current year.
Property, plant, and equipment of the primary government, as well as the component units, is depreciated using the straight line method over the following estimated useful lives:
Years Buildings 25-50
Improvements other than buildings 10-65Infrastructure 10-65Machinery and equipment 5-30
Compensated Absences
In accordance with GASB Statement No. 16, Accounting for Compensated Absences, the City has accrued the liability arising from compensated absences.
City employees earn vacation at a rate of 8 to 14 hours per month, depending on years of service. Sick leave is earned at the rate of one day per month. Benefits or pay is received for unused sick leave upon termination at 25% of its carrying value to a maximum of $5,000 per employee after five years of credited service. Accumulated vacation up to forty-two days is paid upon termination.
Employees of the School Board, who retire under the Virginia Retirement System, and have been employed by the School Board for the immediately preceding ten consecutive years prior to retirement in a full-time position receive $50 a day for any unused sick leave up to a maximum of 90 days. All employees who are classified as full-time twelve-month employees are entitled to annual leave and shall be paid per diem upon retirement or termination (based on their final annual salary) for their unused annual leave.
All vacation and sick pay currently payable is accrued when incurred in the government-wide, proprietary, and fiduciary fund financial statements. A liability for these amounts is reported in governmental funds only if they have matured, for example, as a result of employee resignations and retirements.
CITY OF WINCHESTER, VIRGINIA
NOTES TO FINANCIAL STATEMENTS
JUNE 30, 2012
(Continued) 25
Note 1. Summary of Significant Accounting Policies (Continued)
Assets, Liabilities, and Net Assets or Equity (Continued)
Long-term Obligations
In the government-wide financial statements, and proprietary fund types in the fund financial statements, long-term debt and other long-term obligations are reported as liabilities in the applicable governmental activities, business-type activities, or proprietary fund type statement of net assets. Bond premiums and discounts, as well as issuance costs, are deferred and amortized over the life of the bonds using the effective interest method. Bonds payable are reported net of the applicable bond premium or discount. Bond issuance costs are reported as deferred charges and amortized over the term of the related debt.
In the fund financial statements, governmental fund types recognize bond premiums and discounts, as well as bond issuance costs, during the current period. The face value of the debt issued plus premium is reported as other financing sources. Discounts on debt issuances are reported as other financing uses. Issuance costs, whether or not withheld from the actual debt proceeds received, are reported as debt service expenditures.
Fund Balances
Fund balance is divided into five classifications based primarily on the extent to which the City is bound to observe constraints imposed upon the use of the resources in the governmental funds.
The classifications are as follows:
Nonspendable - Amounts that cannot be spent because they are not in spendable form, or legally or contractually required to be maintained intact. The “not in spendable form” criterion includes items that are not expected to be converted to cash. It also includes the long-term amount of interfund loans.
Restricted – Amounts constrained to specific purposes by their providers (such as grantors, bondholders, and higher levels of government), through constitutional provisions, or by enabling legislation.
Committed – Amounts can only be used for specific purposes pursuant to constraints imposed by formal action of the City Council through adoption of a resolution. Only City Council may modify or rescind the commitment.
Assigned - Amounts the City intends to use for a specified purpose; intent can be expressed by City Council or by the City Manager or Finance Director, who has been designated this Authority.
Unassigned –Amounts that are available for any purpose; positive amounts are reported only in the general fund.

CITY OF WINCHESTER, VIRGINIA
NOTES TO FINANCIAL STATEMENTS
JUNE 30, 2012
(Continued) 26
Note 1. Summary of Significant Accounting Policies (Continued)
Assets, Liabilities, and Net Assets or Equity (Continued)
Restricted Amounts
The City applies restricted resources first when expenditures are incurred for purposes for which either restricted or unrestricted (committed, assigned, and unassigned) amounts are available. Similarly, within unrestricted fund balance, committed amounts are reduced first followed by assigned, and then unassigned amounts when expenditures are incurred for purposes for which amounts in any of the unrestricted fund balance classifications could be used.
Minimum Fund Balance Policy
The General Fund reserve target is 20% of the Fund’s current year budgeted appropriations. For the purpose of determining if the target has been met, the unassigned fund balance of the general fund is compared with the annual appropriations budget.
Other governmental funds of the City do not have specified fund balance targets. Recommended levels of committed and/or assigned fund balance will be determined on a case by case basis, based on the needs of each fund and as recommended by officials and approved by Council.
Encumbrances
Encumbrance accounting, under which purchase orders, contracts, and other commitments for the expenditure of monies are recorded in order to reserve that portion of the appropriation, is employed as an extension of formal budgetary integration in the governmental funds. Significant encumbrances as of June 30, 2012 total $45,952 in the general fund, $49,361 in the capital improvements fund, $78,000 in the bus fund, $245,127 in the school capital improvements fund, $246,223 in the school textbook fund, $18,296 in the school federal grants fund, and $38,375 in the school operating fund.
Net Assets
Net assets are the difference between assets and liabilities. Net assets invested in capital assets represent capital assets, less accumulated depreciation less any outstanding debt related to the acquisition, construction or improvement of those assets.
School Board Debt/Capital Asset Reporting
The City issues debt to finance the construction of school facilities because the School Board does not have borrowing or taxing authority. The City reports this debt, whereas the School Board reports the related capital assets. As a result, in the Statement of Net Assets (Exhibit 1), the school related debt reduces unrestricted net assets for the primary government, while the capital assets are reported in net assets invested in capital assets, net of related debt for the School Board.
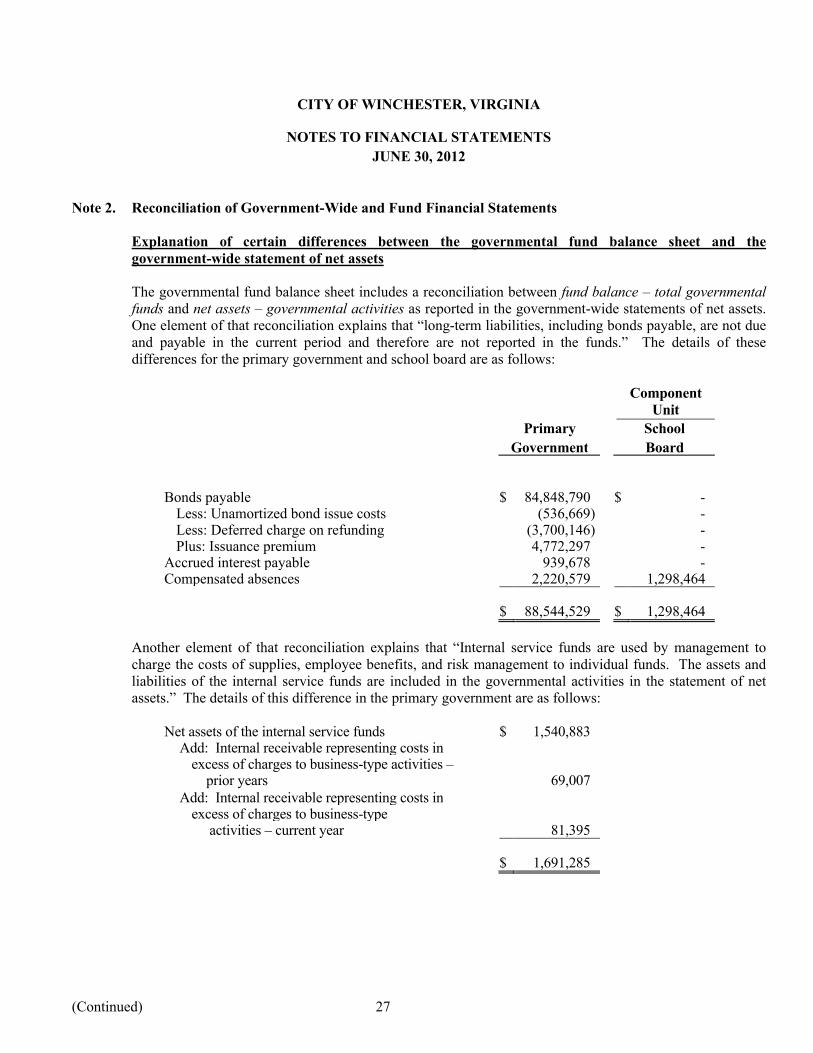
CITY OF WINCHESTER, VIRGINIA
NOTES TO FINANCIAL STATEMENTS
JUNE 30, 2012
(Continued) 27
Note 2. Reconciliation of Government-Wide and Fund Financial Statements
Explanation of certain differences between the governmental fund balance sheet and the government-wide statement of net assets
The governmental fund balance sheet includes a reconciliation between fund balance – total governmental funds and net assets – governmental activities as reported in the government-wide statements of net assets. One element of that reconciliation explains that “long-term liabilities, including bonds payable, are not due and payable in the current period and therefore are not reported in the funds.” The details of these differences for the primary government and school board are as follows:
Component Unit
Primary School
Government Board
Bonds payable $ 84,848,790 $ -Less: Unamortized bond issue costs (536,669) -Less: Deferred charge on refunding (3,700,146) -Plus: Issuance premium 4,772,297 -
Accrued interest payable 939,678 -Compensated absences 2,220,579 1,298,464
$ 88,544,529 $ 1,298,464
Another element of that reconciliation explains that “Internal service funds are used by management to charge the costs of supplies, employee benefits, and risk management to individual funds. The assets and liabilities of the internal service funds are included in the governmental activities in the statement of net assets.” The details of this difference in the primary government are as follows:
Net assets of the internal service funds $ 1,540,883Add: Internal receivable representing costs in
excess of charges to business-type activities –prior years 69,007
Add: Internal receivable representing costs inexcess of charges to business-type
activities – current year 81,395
$ 1,691,285
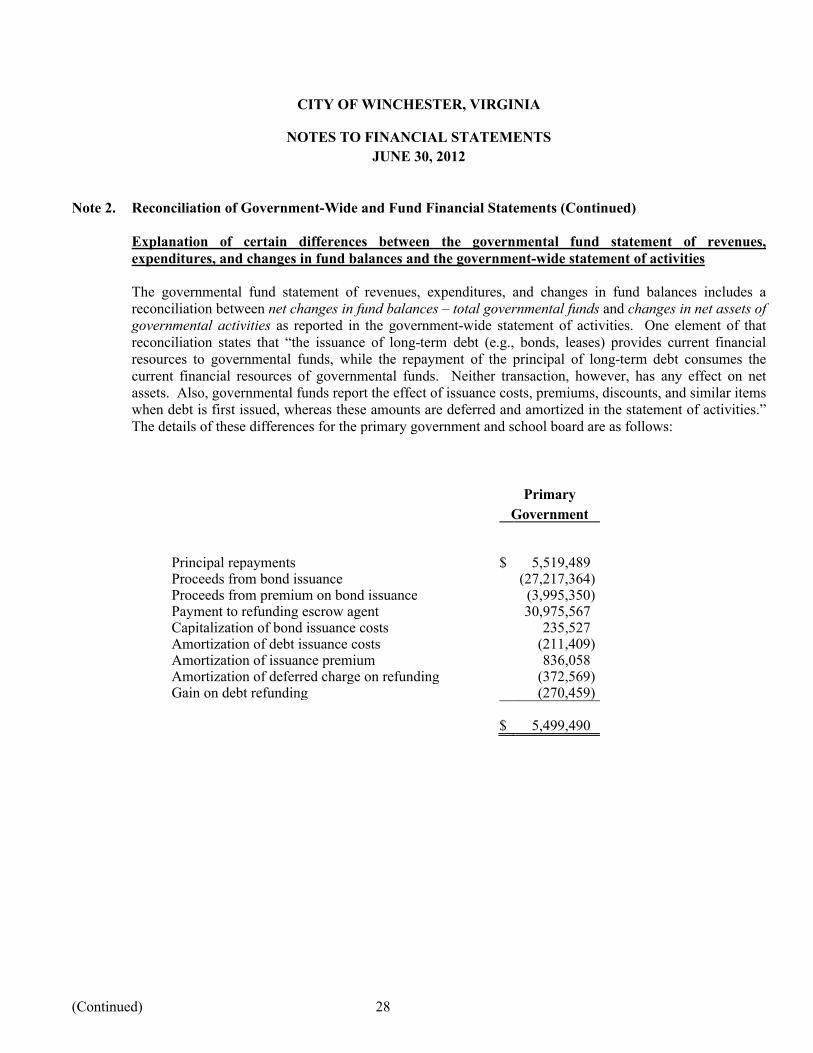
CITY OF WINCHESTER, VIRGINIA
NOTES TO FINANCIAL STATEMENTS
JUNE 30, 2012
(Continued) 28
Note 2. Reconciliation of Government-Wide and Fund Financial Statements (Continued)
Explanation of certain differences between the governmental fund statement of revenues, expenditures, and changes in fund balances and the government-wide statement of activities
The governmental fund statement of revenues, expenditures, and changes in fund balances includes a reconciliation between net changes in fund balances – total governmental funds and changes in net assets of governmental activities as reported in the government-wide statement of activities. One element of that reconciliation states that “the issuance of long-term debt (e.g., bonds, leases) provides current financial resources to governmental funds, while the repayment of the principal of long-term debt consumes the current financial resources of governmental funds. Neither transaction, however, has any effect on net assets. Also, governmental funds report the effect of issuance costs, premiums, discounts, and similar items when debt is first issued, whereas these amounts are deferred and amortized in the statement of activities.” The details of these differences for the primary government and school board are as follows:
Primary
Government
Principal repayments $ 5,519,489 Proceeds from bond issuance (27,217,364) Proceeds from premium on bond issuance (3,995,350) Payment to refunding escrow agent 30,975,567 Capitalization of bond issuance costs 235,527 Amortization of debt issuance costs (211,409) Amortization of issuance premium 836,058 Amortization of deferred charge on refunding (372,569) Gain on debt refunding (270,459)
$ 5,499,490
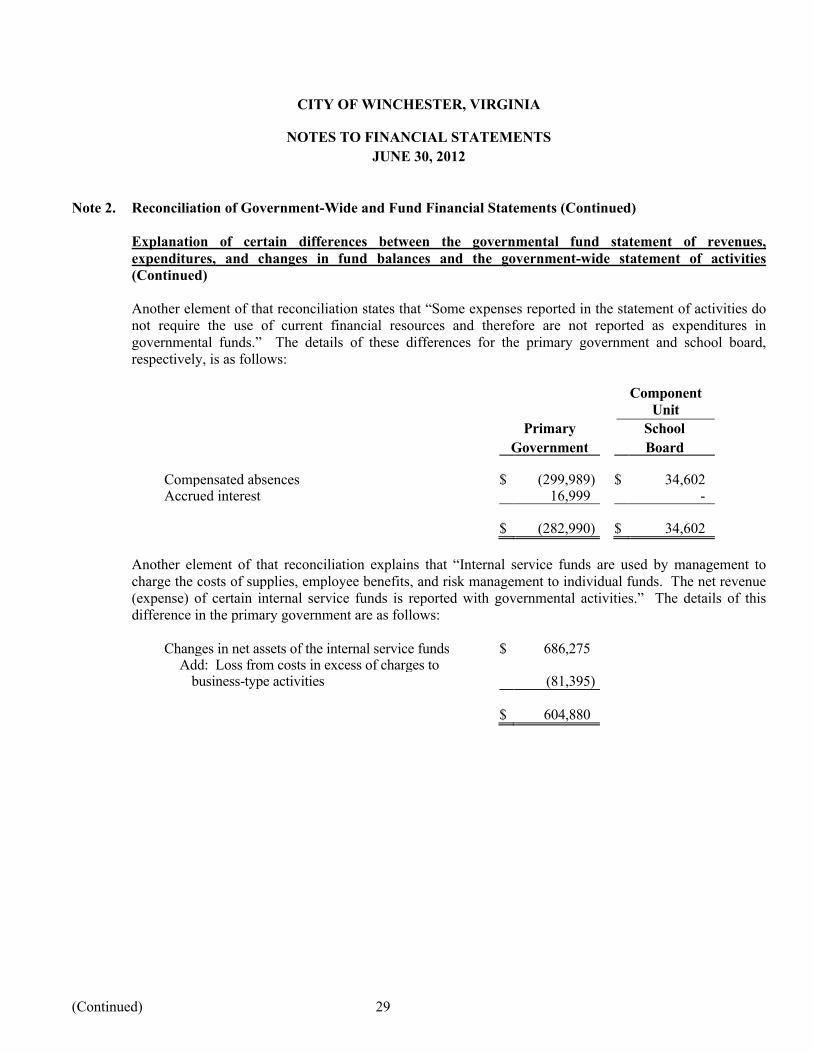
CITY OF WINCHESTER, VIRGINIA
NOTES TO FINANCIAL STATEMENTS
JUNE 30, 2012
(Continued) 29
Note 2. Reconciliation of Government-Wide and Fund Financial Statements (Continued)
Explanation of certain differences between the governmental fund statement of revenues, expenditures, and changes in fund balances and the government-wide statement of activities(Continued)
Another element of that reconciliation states that “Some expenses reported in the statement of activities do not require the use of current financial resources and therefore are not reported as expenditures in governmental funds.” The details of these differences for the primary government and school board, respectively, is as follows:
Component Unit
Primary School
Government Board
Compensated absences $ (299,989) $ 34,602Accrued interest 16,999 -
$ (282,990) $ 34,602
Another element of that reconciliation explains that “Internal service funds are used by management to charge the costs of supplies, employee benefits, and risk management to individual funds. The net revenue (expense) of certain internal service funds is reported with governmental activities.” The details of this difference in the primary government are as follows:
Changes in net assets of the internal service funds $ 686,275Add: Loss from costs in excess of charges to
business-type activities (81,395)
$ 604,880
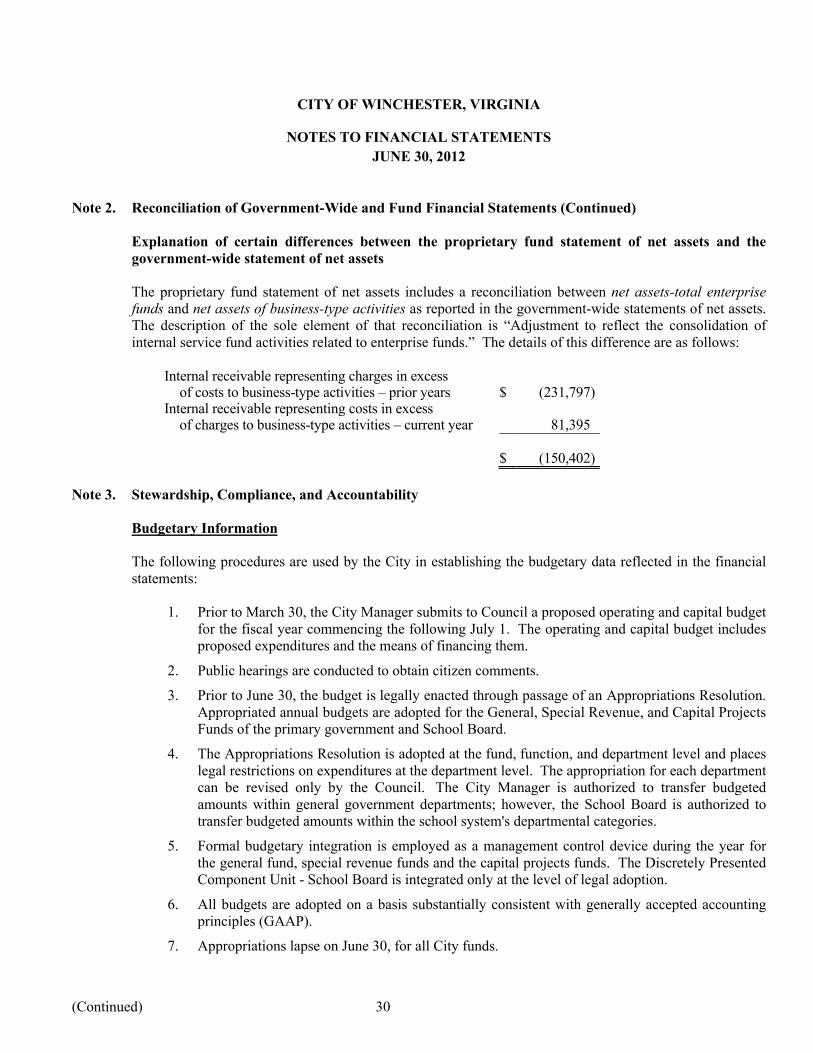
CITY OF WINCHESTER, VIRGINIA
NOTES TO FINANCIAL STATEMENTS
JUNE 30, 2012
(Continued) 30
Note 2. Reconciliation of Government-Wide and Fund Financial Statements (Continued)
Explanation of certain differences between the proprietary fund statement of net assets and the government-wide statement of net assets
The proprietary fund statement of net assets includes a reconciliation between net assets-total enterprise funds and net assets of business-type activities as reported in the government-wide statements of net assets. The description of the sole element of that reconciliation is “Adjustment to reflect the consolidation of internal service fund activities related to enterprise funds.” The details of this difference are as follows:
Internal receivable representing charges in excessof costs to business-type activities – prior years $ (231,797)
Internal receivable representing costs in excessof charges to business-type activities – current year 81,395
$ (150,402)
Note 3. Stewardship, Compliance, and Accountability
Budgetary Information
The following procedures are used by the City in establishing the budgetary data reflected in the financial statements:
1. Prior to March 30, the City Manager submits to Council a proposed operating and capital budget for the fiscal year commencing the following July 1. The operating and capital budget includes proposed expenditures and the means of financing them.
2. Public hearings are conducted to obtain citizen comments.
3. Prior to June 30, the budget is legally enacted through passage of an Appropriations Resolution. Appropriated annual budgets are adopted for the General, Special Revenue, and Capital Projects Funds of the primary government and School Board.
4. The Appropriations Resolution is adopted at the fund, function, and department level and places legal restrictions on expenditures at the department level. The appropriation for each department can be revised only by the Council. The City Manager is authorized to transfer budgeted amounts within general government departments; however, the School Board is authorized to transfer budgeted amounts within the school system's departmental categories.
5. Formal budgetary integration is employed as a management control device during the year for the general fund, special revenue funds and the capital projects funds. The Discretely Presented Component Unit - School Board is integrated only at the level of legal adoption.
6. All budgets are adopted on a basis substantially consistent with generally accepted accounting principles (GAAP).
7. Appropriations lapse on June 30, for all City funds.
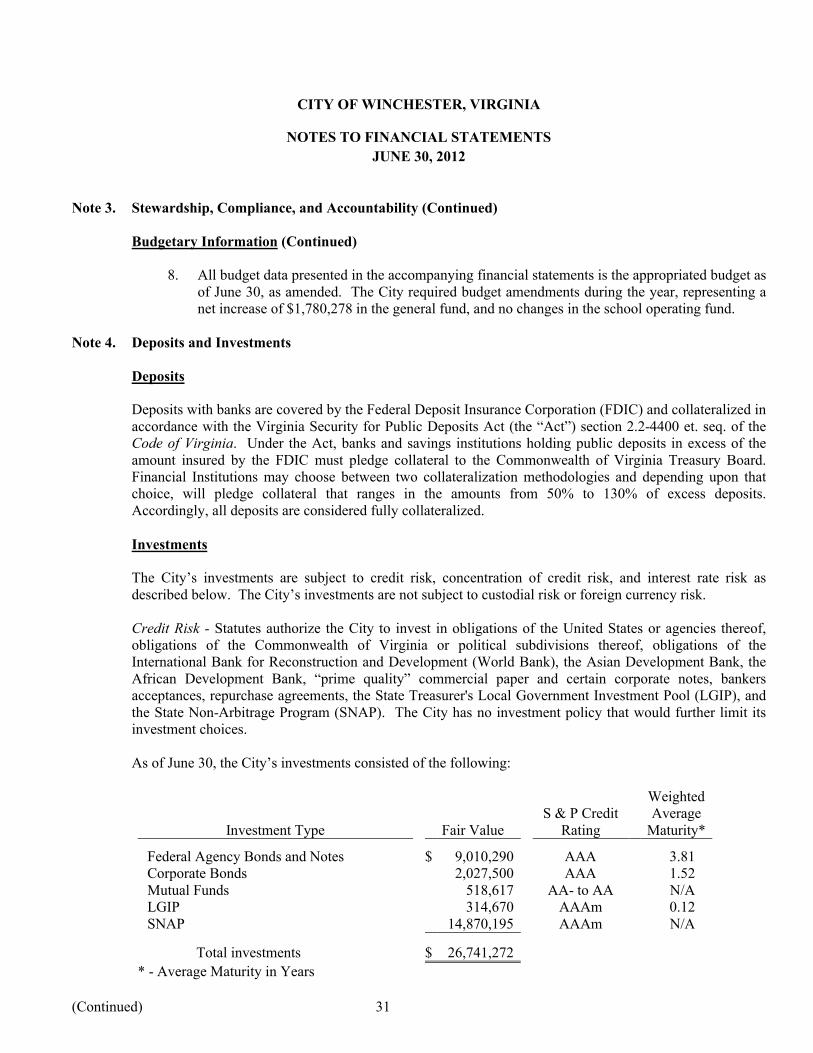
CITY OF WINCHESTER, VIRGINIA
NOTES TO FINANCIAL STATEMENTS
JUNE 30, 2012
(Continued) 31
Note 3. Stewardship, Compliance, and Accountability (Continued)
Budgetary Information (Continued)
8. All budget data presented in the accompanying financial statements is the appropriated budget as of June 30, as amended. The City required budget amendments during the year, representing a net increase of $1,780,278 in the general fund, and no changes in the school operating fund.
Note 4. Deposits and Investments
Deposits
Deposits with banks are covered by the Federal Deposit Insurance Corporation (FDIC) and collateralized in accordance with the Virginia Security for Public Deposits Act (the “Act”) section 2.2-4400 et. seq. of the Code of Virginia. Under the Act, banks and savings institutions holding public deposits in excess of the amount insured by the FDIC must pledge collateral to the Commonwealth of Virginia Treasury Board. Financial Institutions may choose between two collateralization methodologies and depending upon that choice, will pledge collateral that ranges in the amounts from 50% to 130% of excess deposits. Accordingly, all deposits are considered fully collateralized. Investments
The City’s investments are subject to credit risk, concentration of credit risk, and interest rate risk as described below. The City’s investments are not subject to custodial risk or foreign currency risk.
Credit Risk - Statutes authorize the City to invest in obligations of the United States or agencies thereof, obligations of the Commonwealth of Virginia or political subdivisions thereof, obligations of the International Bank for Reconstruction and Development (World Bank), the Asian Development Bank, the African Development Bank, “prime quality” commercial paper and certain corporate notes, bankers acceptances, repurchase agreements, the State Treasurer's Local Government Investment Pool (LGIP), and the State Non-Arbitrage Program (SNAP). The City has no investment policy that would further limit its investment choices.
As of June 30, the City’s investments consisted of the following:
Investment Type Fair ValueS & P Credit
Rating
Weighted Average
Maturity*
Federal Agency Bonds and Notes $ 9,010,290 AAA 3.81Corporate Bonds 2,027,500 AAA 1.52Mutual Funds 518,617 AA- to AA N/ALGIP 314,670 AAAm 0.12SNAP 14,870,195 AAAm N/A
Total investments $ 26,741,272
* - Average Maturity in Years

CITY OF WINCHESTER, VIRGINIA
NOTES TO FINANCIAL STATEMENTS
JUNE 30, 2012
(Continued) 32
Note 4. Deposits and Investments
Investments (Continued)
Concentration of Credit Risk:
The City had the following investments at June 30, that exceeded 5 percent of the total investment balance. These investments were not considered by management to represent a risk to the City.
IssuerPercent of Total
Portfolio
SNAP 55.61%Federal National Mortgage Association 22.46%General Electric Capital Corporation 7.58%
Interest Rate Risk:
The above items are reflected in the financial statements as follows:
Component Units
Primary Government School Board
Winchester Parking
Authority
Deposits and investments:Cash on hand $ 3,475 $ - $ -Deposits 20,312,359 6,790,198 357,993Investments 23,265,390 3,327,757 148,125
$ 43,581,224 10,117,955 $ 506,118
Statement of net assets:Cash $ 19,670,059 $ 6,465,263 $ 357,993Investments 8,129,490 2,713,785 148,125
Restricted cash 14,300,904 - -Fiduciary: Cash and cash equivalents 645,775 324,935 - Investments 834,996 613,972 -
$ 43,581,224 $ 10,117,955 $ 506,118
Restricted Cash:
Restricted cash consists of unspent bond proceeds related to the Series 2011B bond issuance.

CITY OF WINCHESTER, VIRGINIA
NOTES TO FINANCIAL STATEMENTS
JUNE 30, 2012
(Continued) 33
Note 5. Due from Other Governments
The following amounts represent receivables from other governments at June 30:
ComponentPrimary Unit –
Government School Board
Commonwealth of Virginia: State sales tax $ - $ 597,529 Title VI-B - 110,063 Title I - 181,552 Other state school funds - 559,873 Local sales tax 1,381,091 - Transit grants 458,339 - Welfare grants 466,323 - Communication tax 181,256 -
State Revenue Sharing - VDOT 268,275 - Community development block grant 202,817 - Other state funds 1,652,906 -
Total due from the Commonwealth 4,611,007 1,449,017
Frederick County: Joint Judicial Center – debt service 158,315 - Joint Judicial Center – operating expenses 164,334 -
Total due from other governments $ 4,933,656 $ 1,449,017
Note 6. Promise to Give
Unconditional promises to give reported by the School Board for the Handley Capital Project at June 30, are as follows:
Receivable in less than one year $ 192,120Receivable in one to five years 849,807Receivable in five to ten years 485,000Receivable in ten to fifteen years 293,435Receivable in fifteen to twenty years 10,500
Total unconditional promises to give 1,830,862Less discounts to present value (419,156)
Net unconditional promises to give $ 1,411,706
The discount rate used on long-term promises to give is 5%.
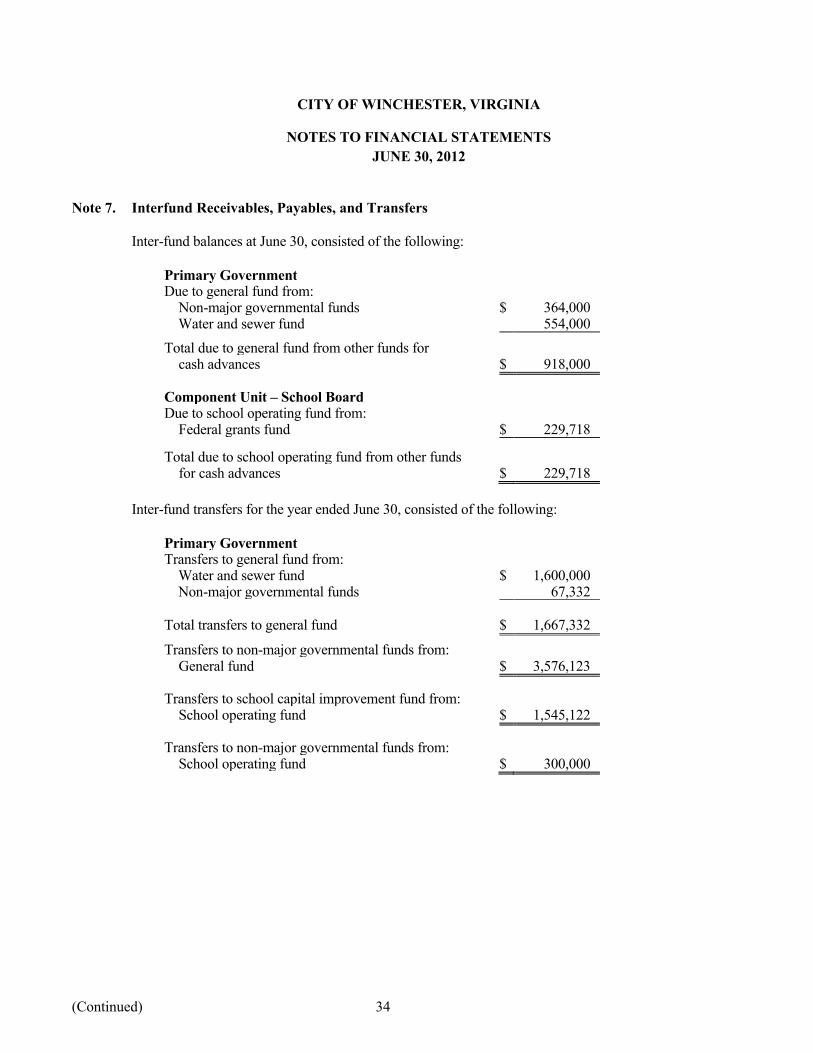
CITY OF WINCHESTER, VIRGINIA
NOTES TO FINANCIAL STATEMENTS
JUNE 30, 2012
(Continued) 34
Note 7. Interfund Receivables, Payables, and Transfers
Inter-fund balances at June 30, consisted of the following:
Primary GovernmentDue to general fund from:
Non-major governmental funds $ 364,000 Water and sewer fund 554,000
Total due to general fund from other funds for cash advances $ 918,000
Component Unit – School BoardDue to school operating fund from:
Federal grants fund $ 229,718
Total due to school operating fund from other fundsfor cash advances $ 229,718
Inter-fund transfers for the year ended June 30, consisted of the following:
Primary GovernmentTransfers to general fund from: Water and sewer fund $ 1,600,000 Non-major governmental funds 67,332
Total transfers to general fund $ 1,667,332
Transfers to non-major governmental funds from:General fund $ 3,576,123
Transfers to school capital improvement fund from:School operating fund $ 1,545,122
Transfers to non-major governmental funds from:School operating fund $ 300,000
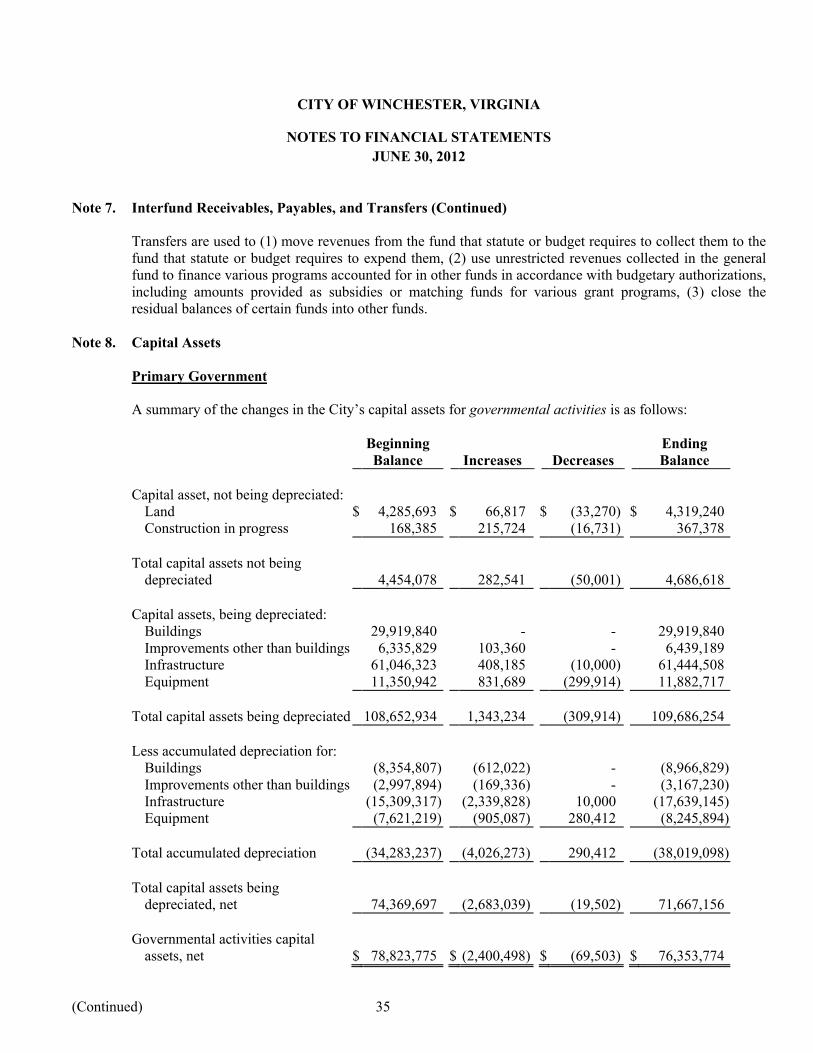
CITY OF WINCHESTER, VIRGINIA
NOTES TO FINANCIAL STATEMENTS
JUNE 30, 2012
(Continued) 35
Note 7. Interfund Receivables, Payables, and Transfers (Continued)
Transfers are used to (1) move revenues from the fund that statute or budget requires to collect them to the fund that statute or budget requires to expend them, (2) use unrestricted revenues collected in the general fund to finance various programs accounted for in other funds in accordance with budgetary authorizations, including amounts provided as subsidies or matching funds for various grant programs, (3) close the residual balances of certain funds into other funds.
Note 8. Capital Assets
Primary Government
A summary of the changes in the City’s capital assets for governmental activities is as follows:
Beginning EndingBalance Increases Decreases Balance
Capital asset, not being depreciated:Land $ 4,285,693 $ 66,817 $ (33,270) $ 4,319,240Construction in progress 168,385 215,724 (16,731) 367,378
Total capital assets not being depreciated 4,454,078 282,541 (50,001) 4,686,618
Capital assets, being depreciated:Buildings 29,919,840 - - 29,919,840Improvements other than buildings 6,335,829 103,360 - 6,439,189Infrastructure 61,046,323 408,185 (10,000) 61,444,508Equipment 11,350,942 831,689 (299,914) 11,882,717
Total capital assets being depreciated 108,652,934 1,343,234 (309,914) 109,686,254
Less accumulated depreciation for:Buildings (8,354,807) (612,022) - (8,966,829)Improvements other than buildings (2,997,894) (169,336) - (3,167,230)Infrastructure (15,309,317) (2,339,828) 10,000 (17,639,145)Equipment (7,621,219) (905,087) 280,412 (8,245,894)
Total accumulated depreciation (34,283,237) (4,026,273) 290,412 (38,019,098)
Total capital assets being depreciated, net 74,369,697 (2,683,039) (19,502) 71,667,156
Governmental activities capitalassets, net $ 78,823,775 $ (2,400,498) $ (69,503) $ 76,353,774

CITY OF WINCHESTER, VIRGINIA
NOTES TO FINANCIAL STATEMENTS
JUNE 30, 2012
(Continued) 36
Note 8. Capital Assets (Continued)
Primary Government (Continued)
Depreciation expense was charged to functions/programs of the City’s governmental activities as follows:
Governmental activities:General government $ 134,243Judicial administration 174,108Public safety 505,628Public works 2,789,687Health and welfare 18,567Parks, recreation, and cultural 395,745Community development 8,295
Total depreciation expense – governmental activities $ 4,026,273

CITY OF WINCHESTER, VIRGINIA
NOTES TO FINANCIAL STATEMENTS
JUNE 30, 2012
(Continued) 37
Note 8. Capital Assets (Continued)
Primary Government (Continued)
A summary of the changes in the City’s capital assets for business-type activities is as follows:
Beginning EndingBalance Increases Decreases Balance
Capital asset, not being depreciated:Land $ 1,201,485 $ - $ - $ 1,201,485Construction in progress 36,524,091 2,431,272 (36,240,982) 2,714,381
Total capital assets not being depreciated 37,725,576 2,431,272 (36,240,982) 3,915,866
Capital assets, being depreciated:Treatment plants 3,718,119 41,256,920 - 44,975,039Improvements other than buildings 118,837 - - 118,837Infrastructure 93,018,345 5,989,007 (249,966) 98,757,386Equipment 2,627,098 73,681 (16,744) 2,684,035
FWSA purchased capacity 27,403,547 - - 27,403,547
Total capital assets being depreciated 126,885,946 47,319,608 (266,710) 173,938,844
Less accumulated depreciation for:Treatment plants (2,030,229) (452,443) - (2,482,672)Improvements other than buildings (113,396) (455) - (113,851)Infrastructure (20,631,768) (1,433,770) 102,563 (21,962,975)Equipment (1,152,122) (190,008) 16,744 (1,325,386)
FWSA purchased capacity (5,345,598) (1,370,178) - (6,715,776)
Total accumulated depreciation (29,273,113) (3,446,854) 119,307 (32,600,660)
Total capital assets being depreciated, net 97,612,834 43,872,754 (147,403) 141,338,184
Business-type activities capitalassets, net $ 135,338,410 $ 46,304,026 $(36,388,385) $ 145,254,050
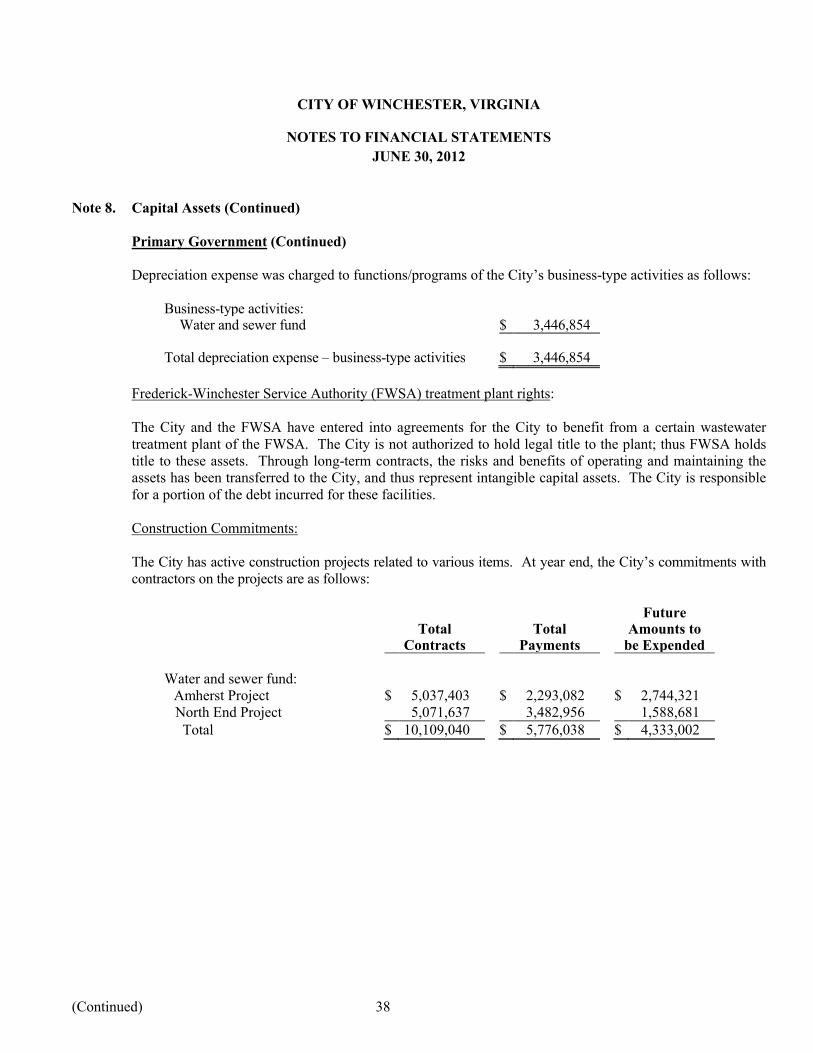
CITY OF WINCHESTER, VIRGINIA
NOTES TO FINANCIAL STATEMENTS
JUNE 30, 2012
(Continued) 38
Note 8. Capital Assets (Continued)
Primary Government (Continued)
Depreciation expense was charged to functions/programs of the City’s business-type activities as follows:
Business-type activities:Water and sewer fund $ 3,446,854
Total depreciation expense – business-type activities $ 3,446,854
Frederick-Winchester Service Authority (FWSA) treatment plant rights:
The City and the FWSA have entered into agreements for the City to benefit from a certain wastewater treatment plant of the FWSA. The City is not authorized to hold legal title to the plant; thus FWSA holds title to these assets. Through long-term contracts, the risks and benefits of operating and maintaining the assets has been transferred to the City, and thus represent intangible capital assets. The City is responsible for a portion of the debt incurred for these facilities.
Construction Commitments:
The City has active construction projects related to various items. At year end, the City’s commitments with contractors on the projects are as follows:
FutureTotal Total Amounts to
Contracts Payments be Expended
Water and sewer fund:Amherst Project $ 5,037,403 $ 2,293,082 $ 2,744,321
North End Project 5,071,637 3,482,956 1,588,681 Total $ 10,109,040 $ 5,776,038 $ 4,333,002

CITY OF WINCHESTER, VIRGINIA
NOTES TO FINANCIAL STATEMENTS
JUNE 30, 2012
(Continued) 39
Note 8. Capital Assets (Continued)
Summaries of the changes in the Discretely Presented Component Unit School Board and Parking Authority’s capital assets are as follows:
Component Unit – School Board
Beginning EndingBalance Increases Decreases Balance
Capital asset, not being depreciated:Land $ 2,307,970 $ - $ - $ 2,307,970Construction in progress - 489,764 - 489,764
Total capital assets not being depreciated 2,307,970 489,764 - 2,797,734
Capital assets, being depreciated:Buildings 129,421,433 184,188 (5,272) 129,600,349Improvements other than buildings 2,204,523 284,353 - 2,488,876Equipment 5,944,117 371,774 (144,253) 6,171,638
Total capital assets being depreciated 137,570,073 840,315 (149,525) 138,260,863
Less accumulated depreciation for:Buildings (19,234,035) (2,521,861) 5,272 (21,750,624)Improvements other than buildings (1,753,765) (38,939) - (1,792,704)Equipment (4,197,534) (392,330) 129,450 (4,460,414)
Total accumulated depreciation (25,185,334) (2,953,130) 134,722 (28,003,742)
Total capital assets being depreciated, net 112,384,739 (2,112,815) (14,803) 110,257,121
School board capitalassets, net $ 114,692,709 $ (1,623,051) $ (14,803) $ 113,054,855
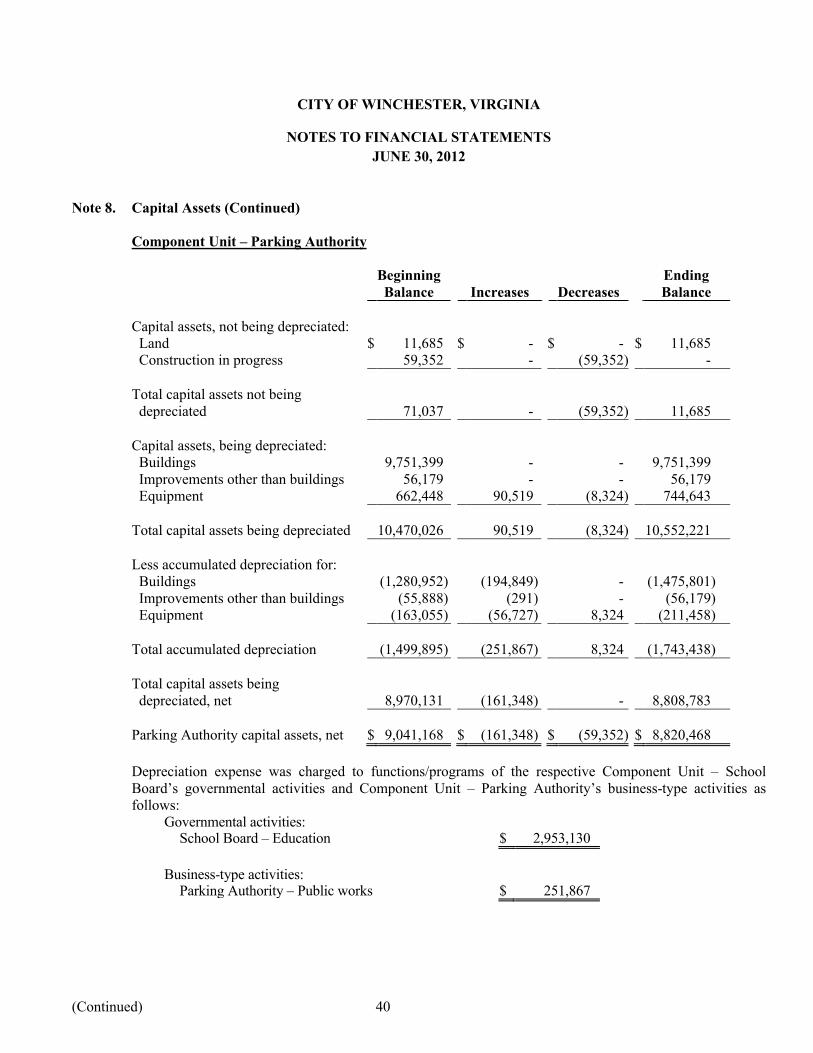
CITY OF WINCHESTER, VIRGINIA
NOTES TO FINANCIAL STATEMENTS
JUNE 30, 2012
(Continued) 40
Note 8. Capital Assets (Continued)
Component Unit – Parking Authority
Beginning EndingBalance Increases Decreases Balance
Capital assets, not being depreciated: Land $ 11,685 $ - $ - $ 11,685 Construction in progress 59,352 - (59,352) -
Total capital assets not being depreciated 71,037 - (59,352) 11,685
Capital assets, being depreciated: Buildings 9,751,399 - - 9,751,399 Improvements other than buildings 56,179 - - 56,179 Equipment 662,448 90,519 (8,324) 744,643
Total capital assets being depreciated 10,470,026 90,519 (8,324) 10,552,221
Less accumulated depreciation for: Buildings (1,280,952) (194,849) - (1,475,801) Improvements other than buildings (55,888) (291) - (56,179) Equipment (163,055) (56,727) 8,324 (211,458)
Total accumulated depreciation (1,499,895) (251,867) 8,324 (1,743,438)
Total capital assets being depreciated, net 8,970,131 (161,348) - 8,808,783
Parking Authority capital assets, net $ 9,041,168 $ (161,348) $ (59,352) $ 8,820,468
Depreciation expense was charged to functions/programs of the respective Component Unit – School Board’s governmental activities and Component Unit – Parking Authority’s business-type activities as follows:
Governmental activities:School Board – Education $ 2,953,130
Business-type activities:Parking Authority – Public works $ 251,867

CITY OF WINCHESTER, VIRGINIA
NOTES TO FINANCIAL STATEMENTS
JUNE 30, 2012
(Continued) 41
Note 9. Deferred Revenue
Governmental funds report deferred revenue in connection with receivables for revenues that are not considered to be available to liquidate liabilities in the current period. Governmental funds also defer revenue recognition in connection with resources that have been received, but not yet earned. At year end, the various components of deferred revenue and unearned revenue reported in the governmental funds were as follows:
Unavailable Unearned Total
Deferred property tax revenue, representing uncollected tax billings
(General Fund) $ 1,995,183 $ - $ 1,995,183
Deferred joint judicial commission, representing uncollected debt service
billings (General Fund) 158,315 - 158,315
Deferred EMS transportation charges, representing uncollected EMS billings
(Special Revenue Fund) 151,250 - 151,250
Property taxes paid in advance, representing property taxes not yet due
(General Fund) - 799,634 799,634
Total deferred revenue for governmental funds $ 2,304,748 $ 799,634 $ 3,104,382
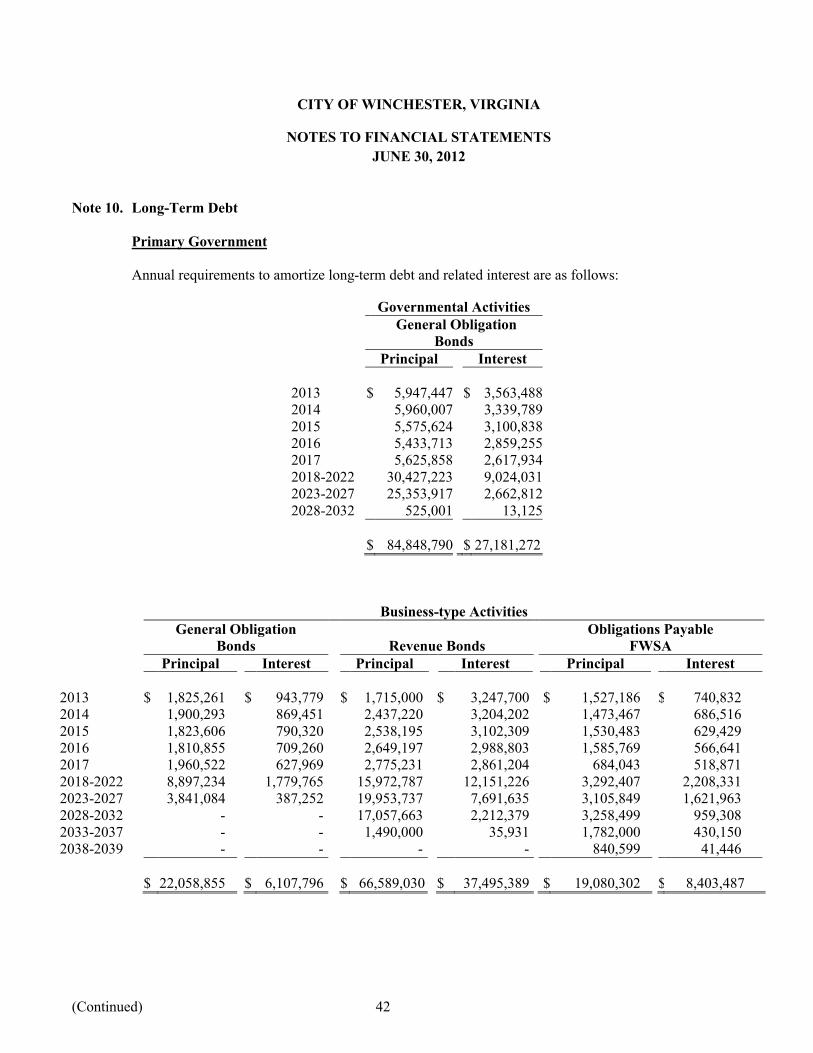
CITY OF WINCHESTER, VIRGINIA
NOTES TO FINANCIAL STATEMENTS
JUNE 30, 2012
(Continued) 42
Note 10. Long-Term Debt
Primary Government
Annual requirements to amortize long-term debt and related interest are as follows:
Business-type ActivitiesGeneral Obligation Obligations Payable
Bonds Revenue Bonds FWSAPrincipal Interest Principal Interest Principal Interest
2013 $ 1,825,261 $ 943,779 $ 1,715,000 $ 3,247,700 $ 1,527,186 $ 740,8322014 1,900,293 869,451 2,437,220 3,204,202 1,473,467 686,5162015 1,823,606 790,320 2,538,195 3,102,309 1,530,483 629,4292016 1,810,855 709,260 2,649,197 2,988,803 1,585,769 566,6412017 1,960,522 627,969 2,775,231 2,861,204 684,043 518,8712018-2022 8,897,234 1,779,765 15,972,787 12,151,226 3,292,407 2,208,3312023-2027 3,841,084 387,252 19,953,737 7,691,635 3,105,849 1,621,9632028-2032 - - 17,057,663 2,212,379 3,258,499 959,3082033-2037 - - 1,490,000 35,931 1,782,000 430,1502038-2039 - - - - 840,599 41,446
$ 22,058,855 $ 6,107,796 $ 66,589,030 $ 37,495,389 $ 19,080,302 $ 8,403,487
Governmental ActivitiesGeneral Obligation
BondsPrincipal Interest
2013 $ 5,947,447 $ 3,563,4882014 5,960,007 3,339,7892015 5,575,624 3,100,8382016 5,433,713 2,859,2552017 5,625,858 2,617,9342018-2022 30,427,223 9,024,0312023-2027 25,353,917 2,662,8122028-2032 525,001 13,125
$ 84,848,790 $ 27,181,272

CITY OF WINCHESTER, VIRGINIA
NOTES TO FINANCIAL STATEMENTS
JUNE 30, 2012
(Continued) 43
Note 10. Long-Term Debt (Continued)
Primary Government (Continued)
Changes in Long-Term Debt
The following is a summary of the long-term debt transactions of the City for the year ended June 30:
Beginning Ending Due withinBalance Increases Decreases Balance One Year
Governmental Activities:
General obligation bonds $ 90,109,540 $27,217,364 $ 32,478,114 $ 84,848,790 $ 5,947,447 Unamortized bond premium 1,613,005 3,995,350 836,058 4,772,297 422,670Unamortized deferred
amounts on refunding (326,231) (3,746,484) (372,569) (3,700,146) (358,349)Compensated absences 1,940,967 385,302 77,000 2,249,269 77,000Net OPEB obligation 591,077 258,000 - 849,077 -
Governmental activitieslong-term liabilities $ 93,928,358 $28,109,532 $ 33,018,603 $ 89,019,287 $ 6,088,768
Beginning Ending Due withinBalance Increases Decreases Balance One Year
Business-type Activities:General obligation bonds $ 23,779,501 $ 4,487,636 $ 6,208,282 $ 22,058,855 $ 1,825,261Revenue bonds 47,610,000 20,224,030 1,245,000 66,589,030 1,715,000Obligations payable 20,221,937 - 1,141,635 19,080,302 1,527,186Unamortized bond
premium 2,446,386 3,225,279 448,119 5,223,546 376,099Unamortized deferred amounts on refunding (234,076) (612,114) (100,843) (745,347) (93,970)Compensated absences 174,600 31,993 15,000 191,593 15,000
Business-type activitieslong-term liabilities $ 93,998,348 $ 27,356,824 $ 8,957,193 $ 112,397,979 $ 5,364,576
Internal service funds predominantly serve the governmental funds. Accordingly, long-term liabilities for them are included as part of the above totals for governmental activities. At June 30, $28,690 of internal service funds compensated absences is included in the above amounts. Also, for the governmental activities, compensated absences are generally liquidated by the general fund and special revenue funds.

CITY OF WINCHESTER, VIRGINIA
NOTES TO FINANCIAL STATEMENTS
JUNE 30, 2012
(Continued) 44
Note 10. Long-Term Debt (Continued)
Primary Government (Continued)Governmental
ActivitiesBusiness-type
Activities
Details of Long-Term Indebtedness
General Obligation Bonds:
$10,000,000 General Obligation Public Improvement Bonds, Series of 1999A, issued June 16, 1999, maturing annually beginning June 1, 2000 through June 3, 2019, interest payable semi-annually at 4.86% Purpose: General and Utilities capital projects $ 2,301,322 $ 2,301,322
$10,000,000 General Obligation Public Improvement Bonds, Series of 2001, issued October 5, 2001, maturing annually beginning September 1, 2002 through September 1, 2021, interest payable semi-annually at 4.50%. Purpose: General and Utilities capital projects 2,503,050 3,601,950
$6,320,000 General Obligation Public Improvement Refunding Bonds, Series of 2002B, issued December 19, 2002, maturing annually beginning January 15, 2004 through January 15, 2014, interest payable semi-annually at 3.30%. Purpose: Utilities and School capital projects 1,228,000 307,000
$9,595,000 General Obligation Public Improvement Bonds, Series of 2003, issued December 18, 2003, maturing annually beginning September 1, 2004 through September 1, 2015, interest payable semi-annually at 3.79% Purpose: General, Utilities and School capital projects 832,167 357,833
$35,020,000 General Obligation Public Improvement and Refunding Bonds, Series of 2004, issued October 21, 2004, maturing annually beginning January 15, 2005 through January 15, 2020, interest payable semi-annually at 3.77%. Purpose: General, Utilities, and School capital projects 10,776,887 4,558,114
$45,000,000 General Obligation Public Improvement, Series of 2005, issued November 1, 2005, maturing annually beginning November 1, 2006 through November 1, 2025, interest payable semi-annually at 4.1861% Purpose: General, Utilities, and School capital projects 18,050,000 2,865,000
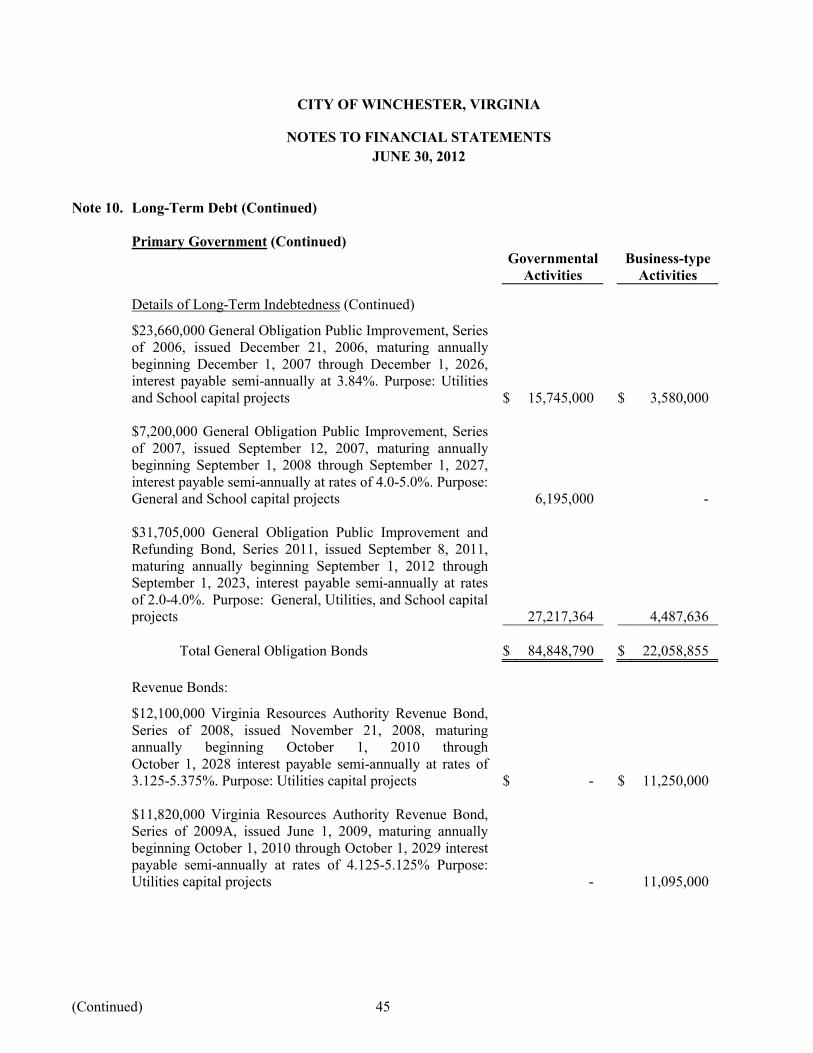
CITY OF WINCHESTER, VIRGINIA
NOTES TO FINANCIAL STATEMENTS
JUNE 30, 2012
(Continued) 45
Note 10. Long-Term Debt (Continued)
Primary Government (Continued)Governmental
ActivitiesBusiness-type
Activities
Details of Long-Term Indebtedness (Continued)
$23,660,000 General Obligation Public Improvement, Series of 2006, issued December 21, 2006, maturing annually beginning December 1, 2007 through December 1, 2026, interest payable semi-annually at 3.84%. Purpose: Utilities and School capital projects $ 15,745,000 $ 3,580,000
$7,200,000 General Obligation Public Improvement, Series of 2007, issued September 12, 2007, maturing annually beginning September 1, 2008 through September 1, 2027, interest payable semi-annually at rates of 4.0-5.0%. Purpose: General and School capital projects 6,195,000 -
$31,705,000 General Obligation Public Improvement and Refunding Bond, Series 2011, issued September 8, 2011, maturing annually beginning September 1, 2012 through September 1, 2023, interest payable semi-annually at rates of 2.0-4.0%. Purpose: General, Utilities, and School capital projects 27,217,364 4,487,636
Total General Obligation Bonds $ 84,848,790 $ 22,058,855
Revenue Bonds:
$12,100,000 Virginia Resources Authority Revenue Bond, Series of 2008, issued November 21, 2008, maturing annually beginning October 1, 2010 through October 1, 2028 interest payable semi-annually at rates of 3.125-5.375%. Purpose: Utilities capital projects $ - $ 11,250,000
$11,820,000 Virginia Resources Authority Revenue Bond, Series of 2009A, issued June 1, 2009, maturing annually beginning October 1, 2010 through October 1, 2029 interest payable semi-annually at rates of 4.125-5.125% Purpose: Utilities capital projects - 11,095,000
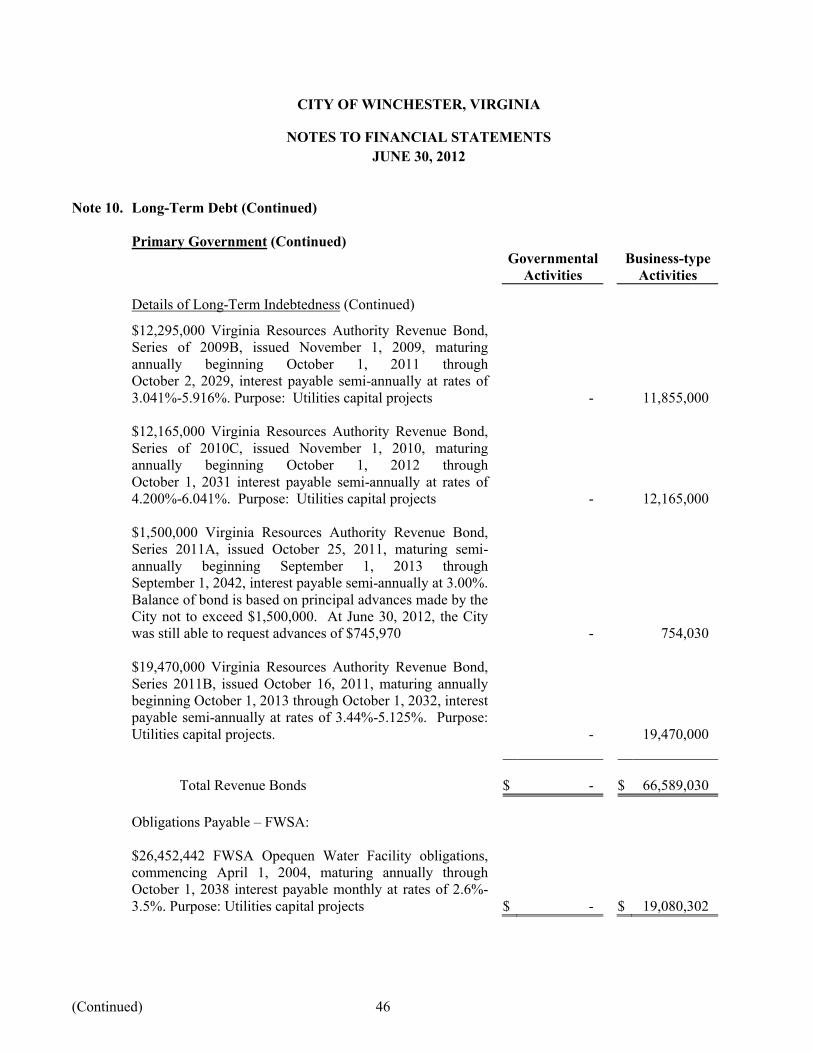
CITY OF WINCHESTER, VIRGINIA
NOTES TO FINANCIAL STATEMENTS
JUNE 30, 2012
(Continued) 46
Note 10. Long-Term Debt (Continued)
Primary Government (Continued)Governmental
ActivitiesBusiness-type
Activities
Details of Long-Term Indebtedness (Continued)
$12,295,000 Virginia Resources Authority Revenue Bond, Series of 2009B, issued November 1, 2009, maturing annually beginning October 1, 2011 through October 2, 2029, interest payable semi-annually at rates of 3.041%-5.916%. Purpose: Utilities capital projects - 11,855,000
$12,165,000 Virginia Resources Authority Revenue Bond, Series of 2010C, issued November 1, 2010, maturing annually beginning October 1, 2012 through October 1, 2031 interest payable semi-annually at rates of 4.200%-6.041%. Purpose: Utilities capital projects - 12,165,000
$1,500,000 Virginia Resources Authority Revenue Bond, Series 2011A, issued October 25, 2011, maturing semi-annually beginning September 1, 2013 through September 1, 2042, interest payable semi-annually at 3.00%. Balance of bond is based on principal advances made by the City not to exceed $1,500,000. At June 30, 2012, the City was still able to request advances of $745,970 - 754,030
$19,470,000 Virginia Resources Authority Revenue Bond, Series 2011B, issued October 16, 2011, maturing annually beginning October 1, 2013 through October 1, 2032, interest payable semi-annually at rates of 3.44%-5.125%. Purpose: Utilities capital projects. - 19,470,000
Total Revenue Bonds $ - $ 66,589,030
Obligations Payable – FWSA:
$26,452,442 FWSA Opequen Water Facility obligations, commencing April 1, 2004, maturing annually through October 1, 2038 interest payable monthly at rates of 2.6%-3.5%. Purpose: Utilities capital projects $ - $ 19,080,302

CITY OF WINCHESTER, VIRGINIA
NOTES TO FINANCIAL STATEMENTS
JUNE 30, 2012
(Continued) 47
Note 10. Long-Term Debt (Continued)
Frederick-Winchester Service Authority (FWSA) treatment plant rights
During 2008 and 2009, the FWSA in conjunction with the participating entities decided to expand the Opequon Water Reclamation Facility. The FWSA has issued debt to finance this project. During 2011, this project was completed and the City assumed responsibility for partial debt service of this plant.
Current Year Refunding of Debt
In September 2011, the City issued $31,705,000 in general obligation bonds with an average interest rate of 4.00%. These bonds were issued to refund approximately $31,410,000 in outstanding bonds including bond issuances in 2002, and partial refunding of bonds issued in 2003, 2004, and 2005. The net proceeds of the refunding were $36,350,037 (including $4,645,037 in bond premium and payment of $277,060 in underwriting fees and other issuance costs). The liability for the refunded bonds has been replaced with the liability from the new debt with the difference between the reacquisition price and the net carrying amount of the old debt being deferred and amortized over the life of the new debt in proportion to the stated interest due on the new debt. Approximately $28,910,000 remains outstanding at June 30, 2012 related to the partially defeased bonds described above.
The City refunded these bonds to reduce its total debt service over the next 12 years by $1,397,126 and to obtain an economic gain (the difference between the present values of the debt service payments on the old and new debt) of $1,221,025.
School Board
The following is a summary of long-term debt transactions for the School Board for the year ended June 30:
Beginning Ending Due withinBalance Increases Decreases Balance One Year
Governmental Activities - School BoardCompensated absences $ 1,333,066 $ 197,398 $ 232,000 $ 1,298,464 $ 232,000
School boardlong-term liabilities $ 1,333,066 $ 197,398 $ 232,000 $ 1,298,464 $ 232,000
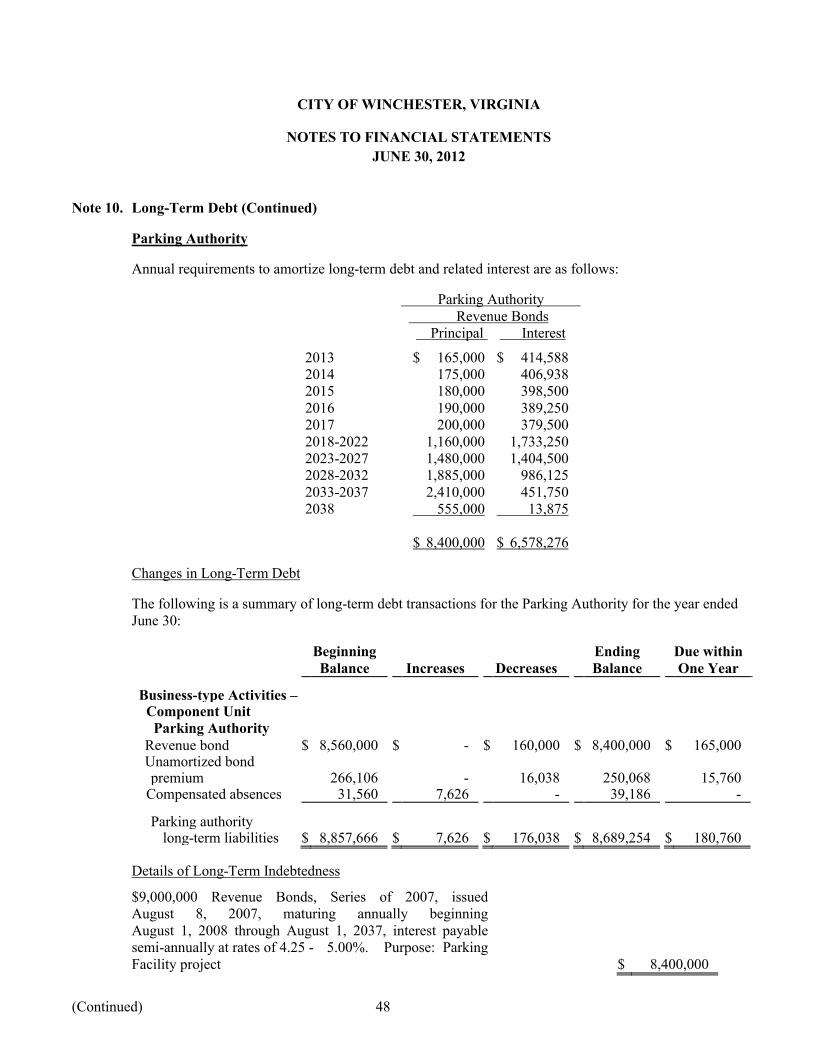
CITY OF WINCHESTER, VIRGINIA
NOTES TO FINANCIAL STATEMENTS
JUNE 30, 2012
(Continued) 48
Note 10. Long-Term Debt (Continued)
Parking Authority
Annual requirements to amortize long-term debt and related interest are as follows:
Parking Authority Revenue Bonds
Principal Interest
2013 $ 165,000 $ 414,5882014 175,000 406,9382015 180,000 398,5002016 190,000 389,2502017 200,000 379,5002018-2022 1,160,000 1,733,2502023-2027 1,480,000 1,404,5002028-2032 1,885,000 986,1252033-2037 2,410,000 451,7502038 555,000 13,875
$ 8,400,000 $ 6,578,276
Changes in Long-Term Debt
The following is a summary of long-term debt transactions for the Parking Authority for the year ended June 30:
Beginning Ending Due withinBalance Increases Decreases Balance One Year
Business-type Activities – Component Unit Parking AuthorityRevenue bond $ 8,560,000 $ - $ 160,000 $ 8,400,000 $ 165,000Unamortized bond premium 266,106 - 16,038 250,068 15,760
Compensated absences 31,560 7,626 - 39,186 -
Parking authoritylong-term liabilities $ 8,857,666 $ 7,626 $ 176,038 $ 8,689,254 $ 180,760
Details of Long-Term Indebtedness
$9,000,000 Revenue Bonds, Series of 2007, issued August 8, 2007, maturing annually beginning August 1, 2008 through August 1, 2037, interest payable semi-annually at rates of 4.25 - 5.00%. Purpose: Parking Facility project $ 8,400,000
CITY OF WINCHESTER, VIRGINIA
NOTES TO FINANCIAL STATEMENTS
JUNE 30, 2012
(Continued) 49
Note 11. Contingent Liabilities
Federal programs in which the City participates were audited in accordance with provisions of U.S. Office of Management and Budget Circular A-133, Audits of States, Local Governments, and Non-Profit Organizations. Pursuant to the provisions of this document, all major programs were tested for compliance with applicable grant requirements. While no matters of material noncompliance were disclosed by audit, the Federal government may subject grant programs to additional compliance tests, which may result in disallowed expenditures. In the opinion of management, any future disallowances of current grant program expenditures, if any, would be immaterial.
The City is a defendant in various lawsuits. Although the outcome of these lawsuits is not presently determinable, in the opinion of the City’s counsel, the resolution of these matters will not have a material adverse affect on the financial condition of the government.
Note 12. Virginia Retirement System
Plan Description
Name of Plan: Virginia Retirement System (VRS)Identification of Plan: Agent and Cost-Sharing Multiple-Employer Defined Benefit Pension
PlanAdministering Entity: Virginia Retirement System (System)
All full-time, salaried permanent (professional) employees of public school divisions and employees of participating employers are automatically covered by VRS upon employment. Benefits vest afterfive years of service credit. Members earn one month of service credit for each month they are employed and their employer is paying into the VRS. Members are eligible to purchase prior public service, active duty military service, certain periods of leave and previously refunded VRS service as credit in their plan.
VRS administers two defined benefit plans for local government employees – Plan 1 and Plan 2:
Members hired before July 1, 2010 and who have service credits before July 1, 2010 are covered under Plan 1. Non-hazardous duty members are eligible for an unreduced retirement benefit beginning at age 65 with at least five years of service credit or age 50 with at least 30 years of service credit. They may retire with a reduced benefit early at age 55 with at least 10 years of service credit or age 50 with at least five years of service credit.
Members hired or rehired on or after July 1, 2010 and who have no service credits before July 1, 2010 are covered under Plan 2. Non-hazardous duty members are eligible for an unreduced benefit beginning at their normal Social Security retirement age with at least five years of service credit or when the sum of their age and service equals 90. They may retire with a reduced benefit as early as age 60 with at least five years of service credit.
Eligible hazardous duty members in Plan 1 and Plan 2 are eligible for an unreduced benefit beginning at age 60 with at least 5 years of service credit or age 50 with at least 25 years of service credit. These members include sheriffs, deputy sheriffs and hazardous duty employees of political subdivisions that have elected to provide enhanced coverage for hazardous duty service. They may retire with a reduced benefit as early as age 50 with at least five years of service credit. All other provisions of the member’s plan apply.

CITY OF WINCHESTER, VIRGINIA
NOTES TO FINANCIAL STATEMENTS
JUNE 30, 2012
(Continued) 50
Note 12. Virginia Retirement System (Continued)
Plan Description (continued)
The VRS Basic Benefit is a lifetime monthly benefit based on a retirement multiplier as a percentage of the member’s average final compensation multiplied by the member’s total service credit. Under Plan 1, average final compensation is the average of the member’s 36 consecutive months of highest compensation. Under Plan 2, average final compensation is the average of the member’s 60 consecutive months of highest compensation. The retirement multiplier for non-hazardous duty members is 1.70%. The retirement multiplier for sheriffs and regional jail superintendents is 1.85%. The retirement multiplier for eligible political subdivision hazardous duty employees other than sheriffs and jail superintendents is 1.70% or 1.85% as elected by the employer. At retirement, members can elect the Basic Benefit, the Survivor Option, a Partial Lump-Sum Option Payment (PLOP) or the Advance Pension Option. A retirement reduction factor is applied to the Basic Benefit amount for members electing the Survivor Option, PLOP or Advance Pension Option or those retiring with a reduced benefit.
Retirees are eligible for an annual cost-of-living adjustment (COLA) effective July 1 of the second calendar year of retirement. Under Plan 1, the COLA cannot exceed 5.00%; under Plan 2, the COLA cannot exceed 6.00%. During years of no inflation or deflation, the COLA is 0.00%. The VRS also provides death and disability benefits. Title 51.1 of the Code of Virginia (1950), as amended, assigns the authority to establish and amend benefit provisions to the General Assembly of Virginia.
The system issues a publicly available comprehensive annual financial report that includes financial statements and required supplementary information for VRS. A copy of the report may be obtained from the VRS Web site at http://www.varetire.org/Pdf/Publications/2011-annual-report.pdf or by writing to the System’s Chief Financial Officer at P.O. Box 2500, Richmond, VA, 23218-2500.
Funding Policy
Plan members are required by Title 51.1 of the Code of Virginia (1950), as amended, to contribute 5% of their compensation toward their retirement. All or part of the 5% member contribution may be assumed by the employer. In addition, the City is required to contribute the remaining amounts necessary to fund its participation in the VRS using the actuarial basis specified by the Code of Virginia and approved by the VRS Board of Trustees. The City's contribution rate for 2012 was 9.34% of annual covered payroll. The School Board contribution rate for 2012 was 8.16% of annual covered payroll of non-professional employees, and 6.33% to the teacher cost-sharing pool.
The School Board’s required contributions to the teacher cost-sharing pool were $1,528,934 for 2012, $2,129,064 for 2011, and $1,478,296 for 2010. In each year, the School Board contributed 100% of the required contributions.

CITY OF WINCHESTER, VIRGINIA
NOTES TO FINANCIAL STATEMENTS
JUNE 30, 2012
(Continued) 51
Note 12. Virginia Retirement System (Continued)
Annual Pension Cost
For 2012, the City and School Board’s annual pension cost was equal to the required and actual contributions.
Three-Year Trend InformationCity
Fiscal Year Annual Pension Percentage of Net PensionEnding Cost (APC) APC Contributed Obligation
June 30, 2012 $ 1,924,048 100% $ - June 30, 2011 $ 1,854,902 100% $ - June 30, 2010 $ 1,878,179 100% $ -
Three-Year Trend InformationSchool Board (non-professional employees)
Fiscal Year Annual Pension Percentage of Net PensionEnding Cost (APC) APC Contributed Obligation
June 30, 2012 $ 149,625 100% $ - June 30, 2011 $ 239,975 100% $ - June 30, 2010 $ 145,131 100% $ -
The 2012 required contribution was determined as part of the June 30, 2009 actuarial valuation using the entry age actuarial cost method. The actuarial assumptions at June 30, 2009 included (a) an investment rate of return (net of administrative expenses) of 7.50%, (b) projected salary increases ranging from 3.75% to 5.60% per year for general government employees and 3.50% to 4.75% for employees eligible for enhanced benefits available to law enforcement officers, firefighters, and sheriffs, and (c) a cost-of-living adjustment of 2.50% per year for Plan 1 members and $2.25% per year for Plan members. Both the investment rate of return and the projected salary increases include an inflation component of 2.50%. The actuarial value of the assets is equal to the modified market value of assets. This method uses techniques that smooth the effects of short-term volatility in the market value of assets over a five-year period. The unfunded actuarial accrued liability is being amortized as a level percentage of projected payroll on an open basis. The remaining amortization period at June 30, 2009 for the Unfunded Actuarial Accrued Liability (UAAL) was 20 years.

CITY OF WINCHESTER, VIRGINIA
NOTES TO FINANCIAL STATEMENTS
JUNE 30, 2012
(Continued) 52
Note 12. Virginia Retirement System (Continued)
Funded Status and Funding Progress
As of June 30, 2011, the most recent actuarial valuation date, the plan was 76.2% and 81.9% funded for the City and the School Board (non-professional employees), respectively. The actuarial accrued liability for benefits was $80,339,762 and $5,978,413, and the actuarial value of assets was $61,204,572 and $4,898,052, resulting in an unfunded actuarial accrued liability (UAAL) of $19,135,190 and $1,080,361 for the City and the School Board (non-professional employees), respectively. The covered payroll (annual payroll of active employees covered by the plan) was $20,700,320 and $1,840,586, and ratio of the UAAL to the covered payroll was 92.4% and 58.7% for the City and the School Board (non-professional employees).
The schedule of funding progress, presented as Required Supplementary Information following the notes to the financial statements, presents multiyear trend information about whether the actuarial value of plan assets is increasing or decreasing over time relative to the actuarial accrued liability for benefits.
VRS Health Insurance Credit
Plan Description
Retirees who have 15 or more years of creditable VRS service are granted the option to participate in the VRS Health Insurance Credit Program by paying 100% of their monthly health insurance premium less a $1.50 per month per year of service for a maximum health insurance credit of $45.00 from VRS. Title 51.1 of the Code of Virginia (1950), as amended, assigns the authority to establish and amend the benefit provisions to the General Assembly of Virginia. The health insurance credit program is financed bypayments from the City and the School Board (non-professional employees) for all active employees to VRS and is an agent and cost-sharing multiple-employer defined benefit pension plan. The surplus funds are not considered advance funded because the City, the School Board, its employees, and retirees have no vested rights to access the excess funds. GAAP do not require governments to report a liability in the financial statements in connection with an employer’s obligation to provide these benefits.
The VRS issues a publicly available comprehensive annual financial report that includes financial statements and required supplementary information for the VRS. A copy of that report may be obtained by writing the VRS at P.O. Box 2500, Richmond, Virginia 23218-2500 or by download from their website at http://www.varetire.org.
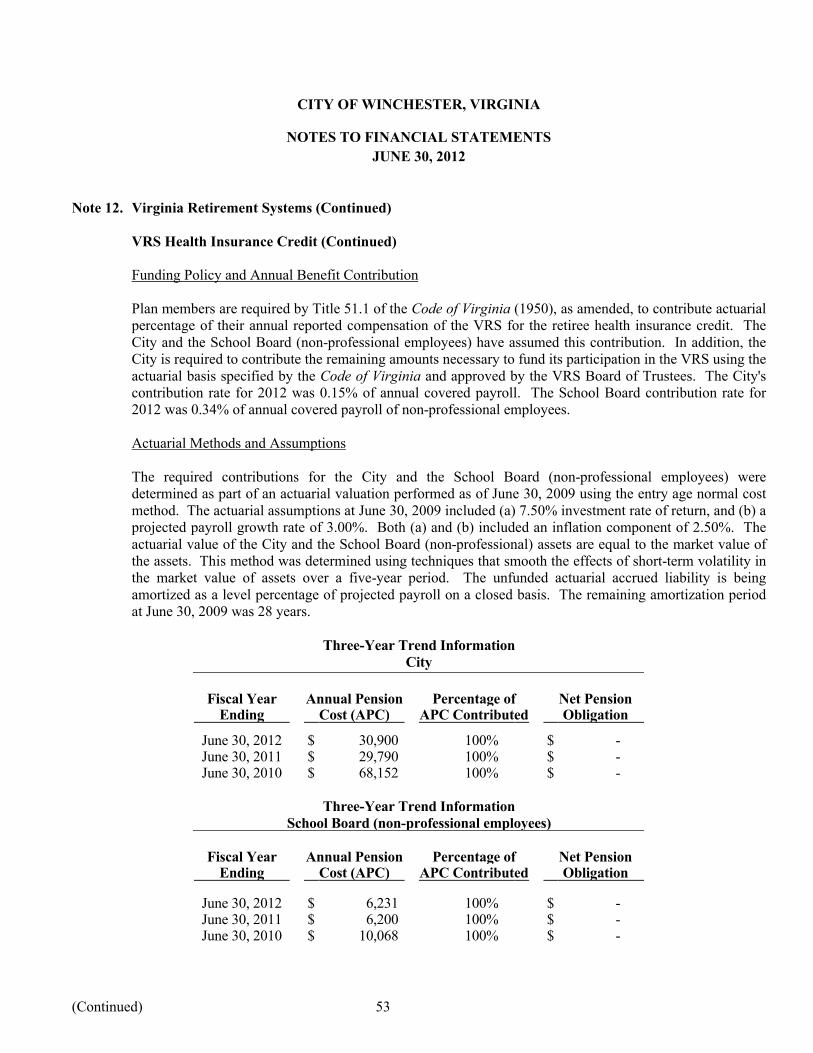
CITY OF WINCHESTER, VIRGINIA
NOTES TO FINANCIAL STATEMENTS
JUNE 30, 2012
(Continued) 53
Note 12. Virginia Retirement Systems (Continued)
VRS Health Insurance Credit (Continued)
Funding Policy and Annual Benefit Contribution
Plan members are required by Title 51.1 of the Code of Virginia (1950), as amended, to contribute actuarial percentage of their annual reported compensation of the VRS for the retiree health insurance credit. The City and the School Board (non-professional employees) have assumed this contribution. In addition, the City is required to contribute the remaining amounts necessary to fund its participation in the VRS using the actuarial basis specified by the Code of Virginia and approved by the VRS Board of Trustees. The City's contribution rate for 2012 was 0.15% of annual covered payroll. The School Board contribution rate for 2012 was 0.34% of annual covered payroll of non-professional employees.
Actuarial Methods and Assumptions
The required contributions for the City and the School Board (non-professional employees) were determined as part of an actuarial valuation performed as of June 30, 2009 using the entry age normal cost method. The actuarial assumptions at June 30, 2009 included (a) 7.50% investment rate of return, and (b) a projected payroll growth rate of 3.00%. Both (a) and (b) included an inflation component of 2.50%. The actuarial value of the City and the School Board (non-professional) assets are equal to the market value of the assets. This method was determined using techniques that smooth the effects of short-term volatility in the market value of assets over a five-year period. The unfunded actuarial accrued liability is being amortized as a level percentage of projected payroll on a closed basis. The remaining amortization period at June 30, 2009 was 28 years.
Three-Year Trend InformationCity
Fiscal Year Annual Pension Percentage of Net PensionEnding Cost (APC) APC Contributed Obligation
June 30, 2012 $ 30,900 100% $ - June 30, 2011 $ 29,790 100% $ - June 30, 2010 $ 68,152 100% $ -
Three-Year Trend InformationSchool Board (non-professional employees)
Fiscal Year Annual Pension Percentage of Net PensionEnding Cost (APC) APC Contributed Obligation
June 30, 2012 $ 6,231 100% $ - June 30, 2011 $ 6,200 100% $ - June 30, 2010 $ 10,068 100% $ -
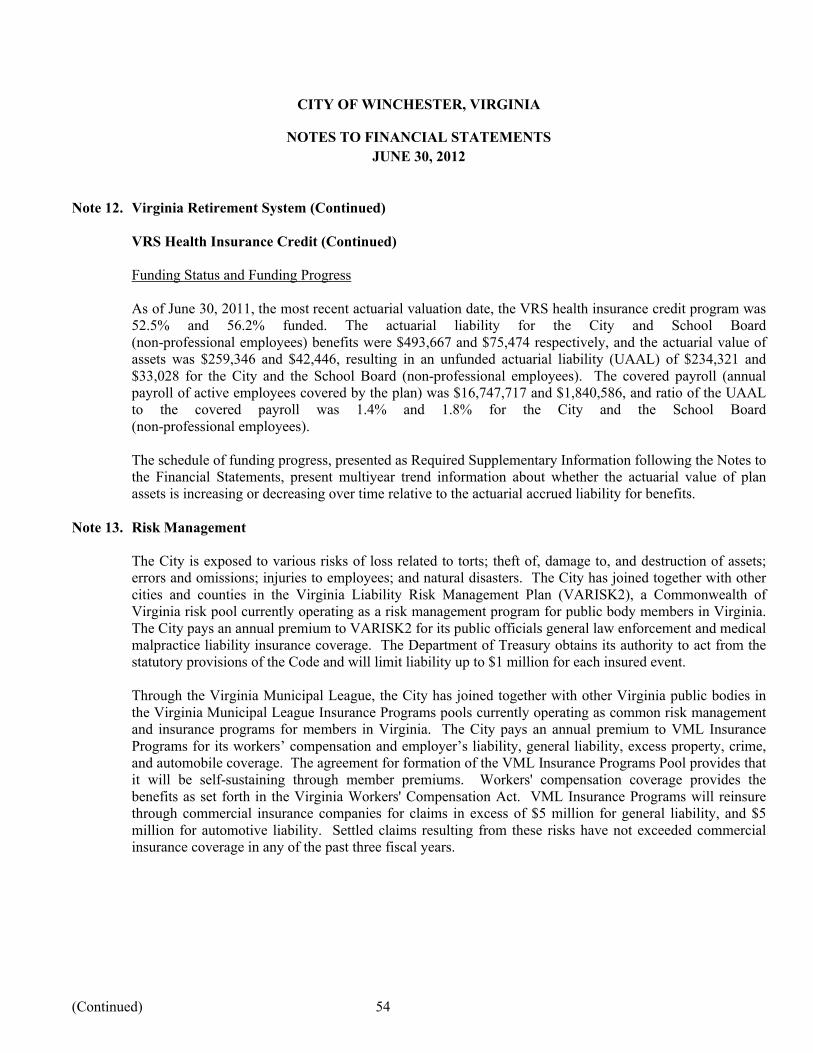
CITY OF WINCHESTER, VIRGINIA
NOTES TO FINANCIAL STATEMENTS
JUNE 30, 2012
(Continued) 54
Note 12. Virginia Retirement System (Continued)
VRS Health Insurance Credit (Continued)
Funding Status and Funding Progress
As of June 30, 2011, the most recent actuarial valuation date, the VRS health insurance credit program was 52.5% and 56.2% funded. The actuarial liability for the City and School Board (non-professional employees) benefits were $493,667 and $75,474 respectively, and the actuarial value of assets was $259,346 and $42,446, resulting in an unfunded actuarial liability (UAAL) of $234,321 and $33,028 for the City and the School Board (non-professional employees). The covered payroll (annual payroll of active employees covered by the plan) was $16,747,717 and $1,840,586, and ratio of the UAAL to the covered payroll was 1.4% and 1.8% for the City and the School Board (non-professional employees).
The schedule of funding progress, presented as Required Supplementary Information following the Notes to the Financial Statements, present multiyear trend information about whether the actuarial value of plan assets is increasing or decreasing over time relative to the actuarial accrued liability for benefits.
Note 13. Risk Management
The City is exposed to various risks of loss related to torts; theft of, damage to, and destruction of assets; errors and omissions; injuries to employees; and natural disasters. The City has joined together with other cities and counties in the Virginia Liability Risk Management Plan (VARISK2), a Commonwealth of Virginia risk pool currently operating as a risk management program for public body members in Virginia. The City pays an annual premium to VARISK2 for its public officials general law enforcement and medical malpractice liability insurance coverage. The Department of Treasury obtains its authority to act from the statutory provisions of the Code and will limit liability up to $1 million for each insured event.
Through the Virginia Municipal League, the City has joined together with other Virginia public bodies in the Virginia Municipal League Insurance Programs pools currently operating as common risk management and insurance programs for members in Virginia. The City pays an annual premium to VML Insurance Programs for its workers’ compensation and employer’s liability, general liability, excess property, crime, and automobile coverage. The agreement for formation of the VML Insurance Programs Pool provides that it will be self-sustaining through member premiums. Workers' compensation coverage provides the benefits as set forth in the Virginia Workers' Compensation Act. VML Insurance Programs will reinsure through commercial insurance companies for claims in excess of $5 million for general liability, and $5 million for automotive liability. Settled claims resulting from these risks have not exceeded commercial insurance coverage in any of the past three fiscal years.
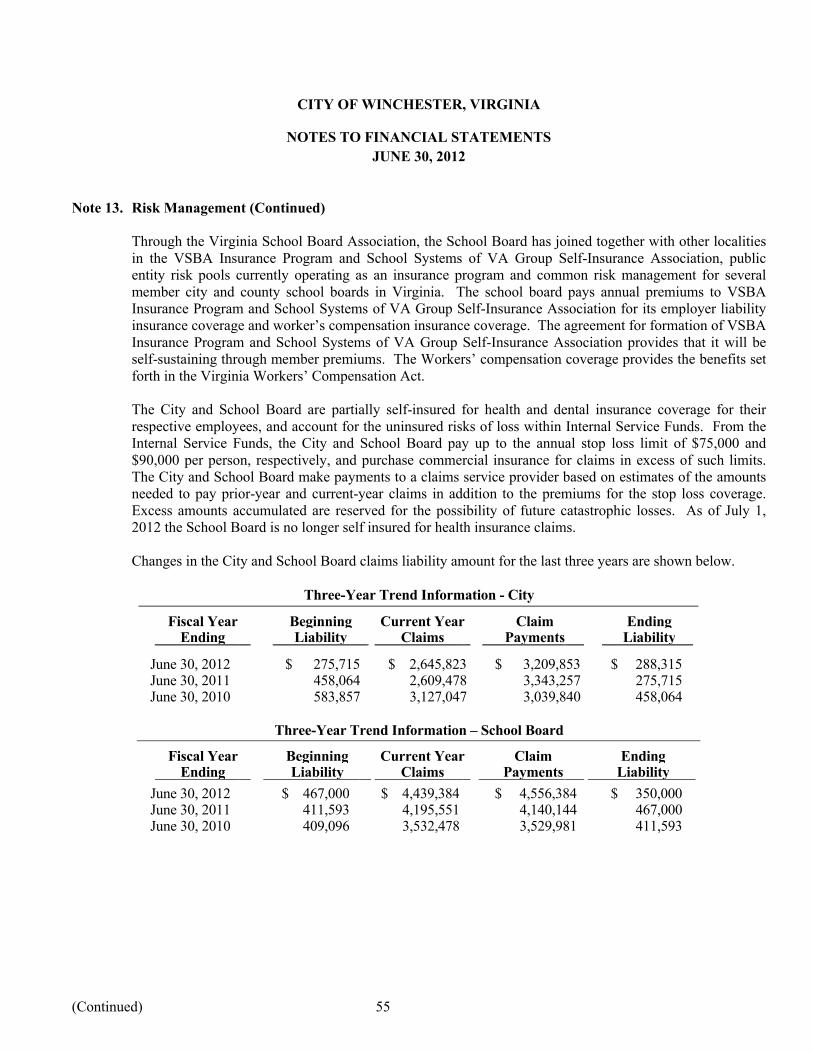
CITY OF WINCHESTER, VIRGINIA
NOTES TO FINANCIAL STATEMENTS
JUNE 30, 2012
(Continued) 55
Note 13. Risk Management (Continued)
Through the Virginia School Board Association, the School Board has joined together with other localitiesin the VSBA Insurance Program and School Systems of VA Group Self-Insurance Association, public entity risk pools currently operating as an insurance program and common risk management for several member city and county school boards in Virginia. The school board pays annual premiums to VSBA Insurance Program and School Systems of VA Group Self-Insurance Association for its employer liability insurance coverage and worker’s compensation insurance coverage. The agreement for formation of VSBA Insurance Program and School Systems of VA Group Self-Insurance Association provides that it will be self-sustaining through member premiums. The Workers’ compensation coverage provides the benefits set forth in the Virginia Workers’ Compensation Act.
The City and School Board are partially self-insured for health and dental insurance coverage for their respective employees, and account for the uninsured risks of loss within Internal Service Funds. From the Internal Service Funds, the City and School Board pay up to the annual stop loss limit of $75,000 and $90,000 per person, respectively, and purchase commercial insurance for claims in excess of such limits. The City and School Board make payments to a claims service provider based on estimates of the amounts needed to pay prior-year and current-year claims in addition to the premiums for the stop loss coverage. Excess amounts accumulated are reserved for the possibility of future catastrophic losses. As of July 1, 2012 the School Board is no longer self insured for health insurance claims.
Changes in the City and School Board claims liability amount for the last three years are shown below.
Three-Year Trend Information - City
Fiscal Year Beginning Current Year Claim EndingEnding Liability Claims Payments Liability
June 30, 2012 $ 275,715 $ 2,645,823 $ 3,209,853 $ 288,315June 30, 2011 458,064 2,609,478 3,343,257 275,715June 30, 2010 583,857 3,127,047 3,039,840 458,064
Three-Year Trend Information – School Board
Fiscal Year Beginning Current Year Claim EndingEnding Liability Claims Payments Liability
June 30, 2012 $ 467,000 $ 4,439,384 $ 4,556,384 $ 350,000June 30, 2011 411,593 4,195,551 4,140,144 467,000June 30, 2010 409,096 3,532,478 3,529,981 411,593

CITY OF WINCHESTER, VIRGINIA
NOTES TO FINANCIAL STATEMENTS
JUNE 30, 2012
(Continued) 56
Note 14. Related Party Transactions
During 2012, the City paid $31,625 and $3,133 to Buettner Tire Distributors, Inc. and Gearclean, Inc., respectively, for automobile repair services and fire and rescue equipment testing. The City also paid $23,757 to Master Media Group, Inc. for marketing, advertising, and printing services. Three members of the City’s Common Council had economic interests in these businesses.
Additionally, the Human Services department has a 15 year lease for property that commenced during 2011with a company in which a Council member is a partial owner. The City paid $484,250 during 2012. The lease calls for monthly lease payments of $40,000 per month and an initial deposit of $40,000 is being held by the company.
Note 15. Other Post-employment Benefits
Plan Description
The City of Winchester administers a single-employer defined benefit healthcare plan (the “Retiree Health Plan”). The plan provides healthcare insurance for eligible retirees and coverage ceases at age 65. Retirees under age 65 have the option of choosing three medical plans including a prescription program for retail and a mail order program. Retirees can continue the same medical coverage they had (including dependent coverage) as active employees. There are five grandfathered retirees over age 65 where their entire individual premium is subsidized for life. The plan was established under the authority of the City of Winchester’s Council.
Funding Policy
The City pays a certain dollar amount for the retiree, which covers the entire cost of the cheapest plan. The retiree pays 100% for the dependent coverage. Employees must meet the unreduced retirement eligibility as described in the pension plan to be eligible for post-retirement health coverage.
Annual OPEB Cost and Net OPEB Obligation
The annual cost of other post-employment benefits (OPEB) under GASB 45 is called the annual required contribution or ARC. The estimated pay as you go cost for OPEB benefits is $210,000 for 2012.
The City has elected not to pre-fund OPEB liabilities. The City is required to recognize the annual required contribution of the employer (ARC) an amount actuarially determined in accordance with the parameters of GASB Statement 45. The ARC represents a level of funding that, if paid on an ongoing basis, is projected to cover normal cost each year and amortize any unfunded actuarial liabilities (or funding excess) over a period not to exceed thirty years.
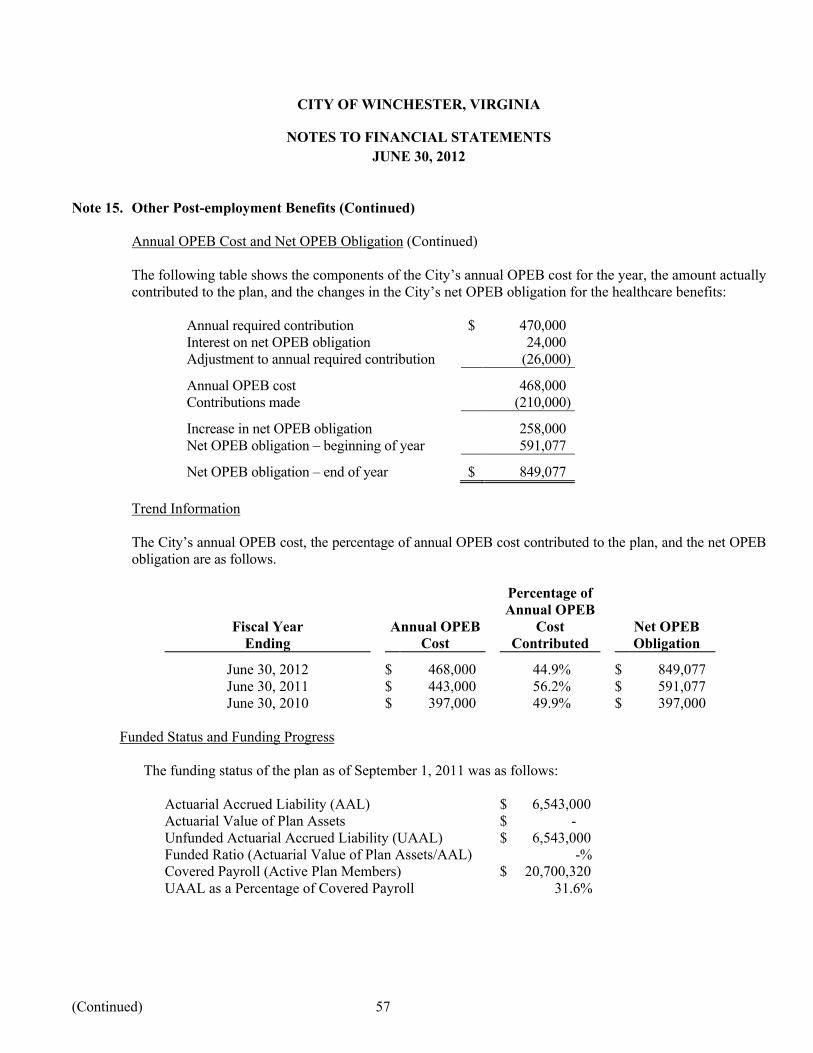
CITY OF WINCHESTER, VIRGINIA
NOTES TO FINANCIAL STATEMENTS
JUNE 30, 2012
(Continued) 57
Note 15. Other Post-employment Benefits (Continued)
Annual OPEB Cost and Net OPEB Obligation (Continued)
The following table shows the components of the City’s annual OPEB cost for the year, the amount actually contributed to the plan, and the changes in the City’s net OPEB obligation for the healthcare benefits:
Annual required contribution $ 470,000Interest on net OPEB obligation 24,000Adjustment to annual required contribution (26,000)
Annual OPEB cost 468,000Contributions made (210,000)
Increase in net OPEB obligation 258,000Net OPEB obligation – beginning of year 591,077
Net OPEB obligation – end of year $ 849,077
Trend Information
The City’s annual OPEB cost, the percentage of annual OPEB cost contributed to the plan, and the net OPEB obligation are as follows.
Percentage ofAnnual OPEB
Fiscal Year Annual OPEB Cost Net OPEBEnding Cost Contributed Obligation
June 30, 2012 $ 468,000 44.9% $ 849,077June 30, 2011 $ 443,000 56.2% $ 591,077June 30, 2010 $ 397,000 49.9% $ 397,000
Funded Status and Funding Progress
The funding status of the plan as of September 1, 2011 was as follows:
Actuarial Accrued Liability (AAL) $ 6,543,000Actuarial Value of Plan Assets $ - Unfunded Actuarial Accrued Liability (UAAL) $ 6,543,000Funded Ratio (Actuarial Value of Plan Assets/AAL) -%Covered Payroll (Active Plan Members) $ 20,700,320 UAAL as a Percentage of Covered Payroll 31.6%

CITY OF WINCHESTER, VIRGINIA
NOTES TO FINANCIAL STATEMENTS
JUNE 30, 2012
(Continued) 58
Note 15. Other Post-employment Benefits (Continued)
Funding Status and Funding Progress (Continued)
Actuarial valuations of an ongoing plan involve estimates of the value of reported amounts and assumptions about the probability of occurrence of events far into the future. Examples include assumptions about future employment, mortality, and the healthcare cost trend. Amounts determined regarding the funded status of the plan and the annual required contributions of the employer are subject to continual revisions as actual results are compared with past expectations and new estimates are made about the future. The schedule of funding progress, presented as Required Supplementary Information following the Notes to the Financial Statements, presents trend information that shows whether the actuarial value of plan assets and liabilities are increasing or decreasing over time relative to the actuarial accrued liabilities for benefits.
Actuarial Methods and Assumptions
Projections of benefits for financial reporting purposes are based on the substantive plan (the plan as understood by the employer and the plan members) and include the types of benefits provided at the time of each valuation and the historical pattern of sharing of benefits costs between the employer and the plan members to that point. The actuarial methods and assumptions used include techniques that are designed to reduce the efforts of short-term volatility in actuarial accrued liabilities and the actuarial value assets, consistent with the long-term perspective of the calculations.
In the September 1, 2011 actuarial valuation, the projected unit credit cost method was used. The actuarial assumptions include a 4% investment rate of return (net of administrative expenses), which is the expected long-term investment returns on the employer’s own investments calculated based on the funded level of the plan at the valuation date. The closed amortization method and a 30-year amortization period are being used. The remaining amortization period at September 1, 2011 was 27 years.
The following additional simplifying assumptions were made:
Coverage Status and Age of Spouse – Actual coverage status is used; females assumed 3 years younger than male spouse. Employees with individual coverage are assumed to elect individual coverage in retirement, those with spouse/family coverage assumed to continue this coverage at retirement.
90% of actives currently enrolled in the City’s health care plan, or will continue in the plan upon retiring or becoming disabled.
Demographic Assumptions – Demographic assumptions mirror those used for the pension plan, with adjustments made for actual experience of City employees. All employees are assumed to participate in the Virginia Retirement System.
Economic Assumptions – Medical claims are assumed to decrease from 7.5% to 4.6% per year. While medical costs have increased by a rate well in excess of 7.5% in recent years, prevailing practice is to assume that these increases will slow in the future. This is based on the macroeconomic assumption that if they do not moderate, medical expenses will consume an unacceptable percentage of the gross national product. The long-term assumption selected is consistent with the Centers for Medicare and Medicaid Services office of the actuary’s assumption for per-capita increases in medical costs.
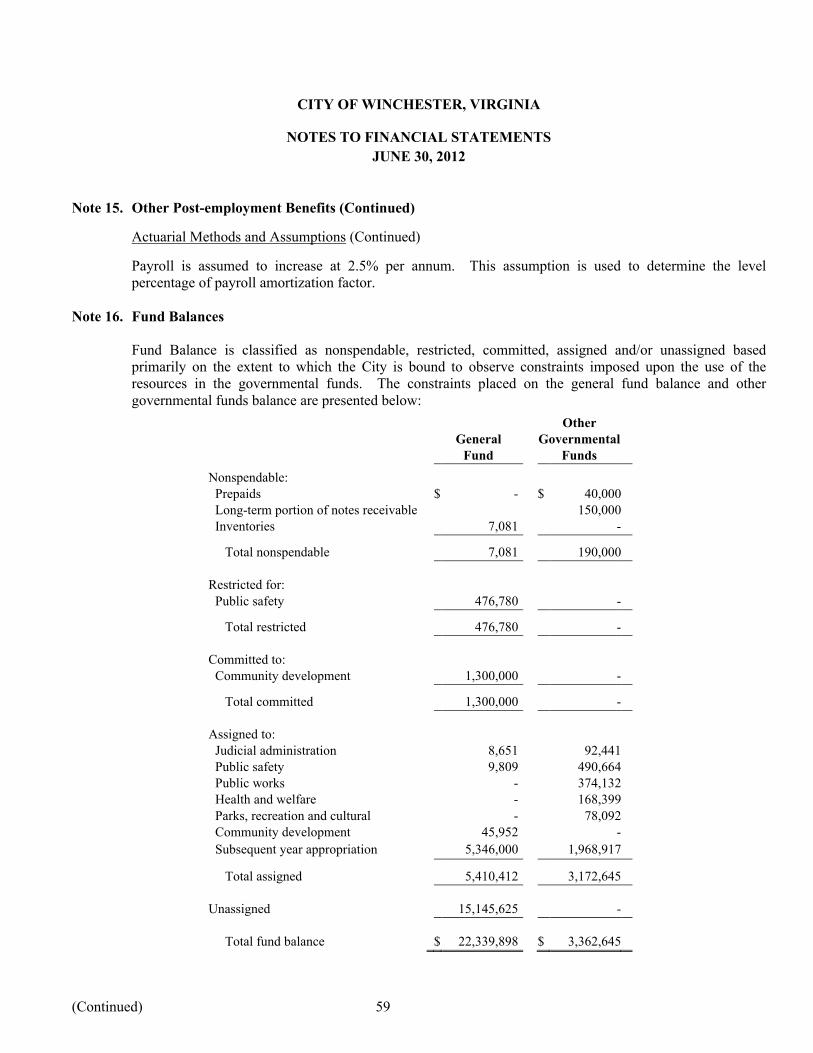
CITY OF WINCHESTER, VIRGINIA
NOTES TO FINANCIAL STATEMENTS
JUNE 30, 2012
(Continued) 59
Note 15. Other Post-employment Benefits (Continued)
Actuarial Methods and Assumptions (Continued)
Payroll is assumed to increase at 2.5% per annum. This assumption is used to determine the level percentage of payroll amortization factor.
Note 16. Fund Balances
Fund Balance is classified as nonspendable, restricted, committed, assigned and/or unassigned based primarily on the extent to which the City is bound to observe constraints imposed upon the use of the resources in the governmental funds. The constraints placed on the general fund balance and other governmental funds balance are presented below:
OtherGeneral Governmental
Fund Funds
Nonspendable: Prepaids $ - $ 40,000 Long-term portion of notes receivable 150,000 Inventories 7,081 -
Total nonspendable 7,081 190,000
Restricted for: Public safety 476,780 -
Total restricted 476,780 -
Committed to: Community development 1,300,000 -
Total committed 1,300,000 -
Assigned to: Judicial administration 8,651 92,441 Public safety 9,809 490,664 Public works - 374,132 Health and welfare - 168,399 Parks, recreation and cultural - 78,092 Community development 45,952 -
Subsequent year appropriation 5,346,000 1,968,917
Total assigned 5,410,412 3,172,645
Unassigned 15,145,625 -
Total fund balance $ 22,339,898 $ 3,362,645

CITY OF WINCHESTER, VIRGINIA
NOTES TO FINANCIAL STATEMENTS
JUNE 30, 2012
(Continued) 60
Note 17. Subsequent Events
In August 2012, the City issued $28,635,000 in General Obligation Public Improvement Refunding Bonds, Series 2012. The issuance resulted in a net premium of approximately $6,035,000. The bonds are being issued to refund on a current basis certain maturities of the City’s General Obligation Public Improvement Bonds, Series 2001 and advance refund certain maturities of the City’s General Obligation Public Improvement and Refunding Bonds, Series 2004, 2005, and 2006. The amount to be refunded approximates $30,465,000. Interest will be due semi-annually beginning September 1, 2012 at ratesranging from 3.00%-5.00%.
In August 2012, the City awarded a contract to Consolidated Electric Service in the amount of $310,397 for the City Hall Generator Project. This project consists of the installation of a gas powered generator and all switches, including the installation of a concrete pad, connections to the gas and electrical systems, and a fenced enclosure for the generator. All work related to this project is expected to be completed in 2013.
In August 2012, the City awarded a contract to Lantz Construction Company in the amount of $806,324 for the New Winchester Transit Office Building Construction Project. Construction of this new office building is to begin in September 2012 with anticipated completion by February 2013.
In October 2012, the City entered into a contract with Lantz Construction Company in the amount of $1,118,000 for the demolition and structural stabilization of the historic Taylor Hotel. This is the first phase of this project which is expected to be completed by January 2013 when Phase two of the project will begin.
Note 18. New Accounting Standards
The Governmental Accounting Standards Board (GASB) has issued the following statements which are not yet effective.
GASB Statement No. 60, Accounting and Financial Reporting for Service Concession Arrangements, was issued to address service concession arrangements, which are a type of public-private or public-public partnership. The statement defines a service concession arrangement in which (1) the transferor conveys to an operator the right and related obligation to provide services through the use of infrastructure or another public asset in exchange for significant consideration and (2) the operator collects and is compensated by fees from third parties. The requirements of this statement establish recognition, measurement, and disclosure requirements for these types of arrangements. This statement will be effective for the year ending June 30, 2013.
GASB Statement No. 61, The Financial Reporting Entity: Omnibus – an amendment of GASB Statements No. 14 and No. 34, modifies certain requirements for the inclusion of component units in the financial reporting entity. For organizations that previously were required to be included as component units by meeting the fiscal dependency criterion, a financial benefit or burden relationship also would need to be present to be included as a component unit. The statement also amends the criteria for reporting of blended component units. For component units that are blended based on the “substantively the same governing body” criterion, it additionally requires that a financial benefit or financial burden relationship exist or that management of the primary government have operational responsibility for the activities of the component unit. The statement also clarifies the reporting of equity interests in legally separate organizations. It requires a primary government to report its equity interest in a component unit as an asset. This statement will be effective for the year ending June 30, 2013.
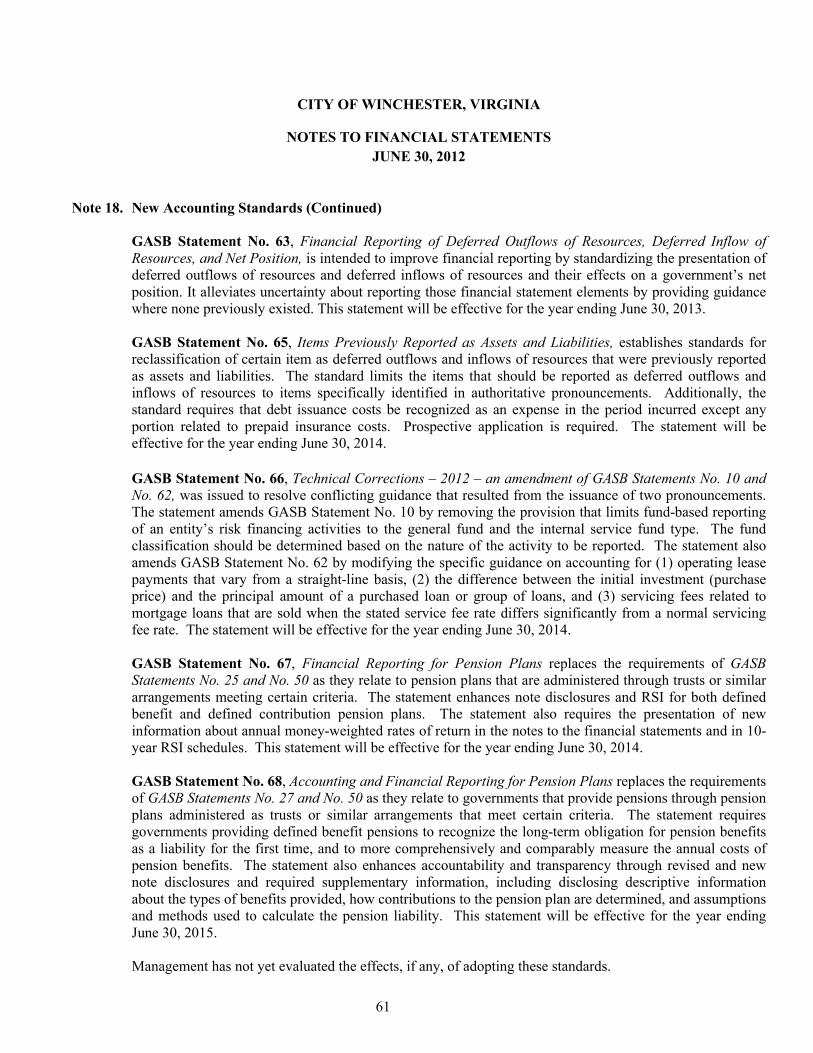
CITY OF WINCHESTER, VIRGINIA
NOTES TO FINANCIAL STATEMENTS
JUNE 30, 2012
61
Note 18. New Accounting Standards (Continued)
GASB Statement No. 63, Financial Reporting of Deferred Outflows of Resources, Deferred Inflow of Resources, and Net Position, is intended to improve financial reporting by standardizing the presentation of deferred outflows of resources and deferred inflows of resources and their effects on a government’s net position. It alleviates uncertainty about reporting those financial statement elements by providing guidance where none previously existed. This statement will be effective for the year ending June 30, 2013.
GASB Statement No. 65, Items Previously Reported as Assets and Liabilities, establishes standards for reclassification of certain item as deferred outflows and inflows of resources that were previously reported as assets and liabilities. The standard limits the items that should be reported as deferred outflows and inflows of resources to items specifically identified in authoritative pronouncements. Additionally, the standard requires that debt issuance costs be recognized as an expense in the period incurred except any portion related to prepaid insurance costs. Prospective application is required. The statement will be effective for the year ending June 30, 2014.
GASB Statement No. 66, Technical Corrections – 2012 – an amendment of GASB Statements No. 10 and No. 62, was issued to resolve conflicting guidance that resulted from the issuance of two pronouncements. The statement amends GASB Statement No. 10 by removing the provision that limits fund-based reporting of an entity’s risk financing activities to the general fund and the internal service fund type. The fund classification should be determined based on the nature of the activity to be reported. The statement also amends GASB Statement No. 62 by modifying the specific guidance on accounting for (1) operating lease payments that vary from a straight-line basis, (2) the difference between the initial investment (purchase price) and the principal amount of a purchased loan or group of loans, and (3) servicing fees related to mortgage loans that are sold when the stated service fee rate differs significantly from a normal servicing fee rate. The statement will be effective for the year ending June 30, 2014.
GASB Statement No. 67, Financial Reporting for Pension Plans replaces the requirements of GASB Statements No. 25 and No. 50 as they relate to pension plans that are administered through trusts or similar arrangements meeting certain criteria. The statement enhances note disclosures and RSI for both defined benefit and defined contribution pension plans. The statement also requires the presentation of new information about annual money-weighted rates of return in the notes to the financial statements and in 10-year RSI schedules. This statement will be effective for the year ending June 30, 2014.
GASB Statement No. 68, Accounting and Financial Reporting for Pension Plans replaces the requirements of GASB Statements No. 27 and No. 50 as they relate to governments that provide pensions through pension plans administered as trusts or similar arrangements that meet certain criteria. The statement requires governments providing defined benefit pensions to recognize the long-term obligation for pension benefits as a liability for the first time, and to more comprehensively and comparably measure the annual costs of pension benefits. The statement also enhances accountability and transparency through revised and new note disclosures and required supplementary information, including disclosing descriptive information about the types of benefits provided, how contributions to the pension plan are determined, and assumptions and methods used to calculate the pension liability. This statement will be effective for the year ending June 30, 2015.
Management has not yet evaluated the effects, if any, of adopting these standards.

REQUIRED SUPPLEMENTARY INFORMATION

CITY OF WINCHESTER, VIRGINIAREQUIRED SUPPLEMENTARY INFORMATION
SCHEDULE OF FUNDING PROGRESS
CITY - DEFINED BENEFIT PENSION PLAN Exhibit 11(a) (b) (b-a) (a/b) (c) ((b-a)/c)
UAAL as aActuarial Actuarial Actuarial Unfunded Percentage ofValuation Value of Accrued Actuarial Accrued Funded Covered Covered
Date Assets Liability (AAL) Liability (UAAL) Ratio Payroll Payroll
June 30, 2009 58,987,278$ 68,332,284$ 9,345,006$ 86.3% 20,470,820$ 45.7%
June 30, 2010 59,652,664 76,183,079 16,530,415 78.3% 20,053,084 82.4%
June 30, 2011 61,204,572 80,339,762 19,135,190 76.2% 20,700,320 92.4%
SCHOOL BOARD COMPONENT UNIT (NON-PROFESSIONAL) - DEFINED BENEFIT PENSION PLAN(a) (b) (b-a) (a/b) (c) ((b-a)/c)
UAAL as aActuarial Actuarial Actuarial Unfunded Percentage ofValuation Value of Accrued Actuarial Accrued Funded Covered Covered
Date Assets Liability (AAL) Liability (UAAL) Ratio Payroll Payroll
June 30, 2009 4,488,789$ 4,994,502$ 505,713$ 89.9% 1,982,067$ 25.5%
June 30, 2010 4,664,275 5,582,402 918,127 83.6% 1,803,499 50.9%
June 30, 2011 4,898,052 5,978,413 1,080,361 81.9% 1,840,586 58.7%
CITY - VRS HEALTH INSURANCE CREDIT PROGRAM(a) (b) (b-a) (a/b) (c) ((b-a)/c)
UAAL as aActuarial Actuarial Actuarial Unfunded Percentage ofValuation Value of Accrued Actuarial Accrued Funded Covered Covered
Date Assets Liability (AAL) Liability (UAAL) Ratio Payroll Payroll
June 30, 2009 144,542$ 409,938$ 265,396$ 35.3% 20,470,820$ 1.3%
June 30, 2010 211,970 463,797 251,827 45.7% 20,053,084 1.3%
June 30, 2011 259,346 493,667 234,321 52.5% 16,747,717 1.4%
SCHOOL BOARD COMPONENT UNIT (NON-PROFESSIONAL) - VRS HEALTH INSURANCE CREDIT PROGRAM(a) (b) (b-a) (a/b) (c) ((b-a)/c)
UAAL as aActuarial Actuarial Actuarial Unfunded Percentage ofValuation Value of Accrued Actuarial Accrued Funded Covered Covered
Date Assets Liability (AAL) Liability (UAAL) Ratio Payroll Payroll
June 30, 2009 20,709$ 67,285$ 46,576$ 30.8% 1,982,067$ 2.3%
June 30, 2010 31,864 72,176 40,312 44.1% 1,803,499 2.2%
June 30, 2011 42,446 75,474 33,028 56.2% 1,840,586 1.8%
CITY - RETIREE HEALTH PLAN(a) (b) (b-a) (a/b) (c) ((b-a)/c)
UAAL as aActuarial Actuarial Actuarial Unfunded Percentage ofValuation Value of Accrued Actuarial Accrued Funded Covered Covered
Date Assets Liability (AAL) Liability (UAAL) Ratio Payroll Payroll
June 1, 2009 -$ 4,417,000$ 4,417,000$ 0.0% 16,282,810$ 27.1%
September 1, 2011 - 6,543,000$ 6,543,000$ 0.0% 20,700,320$ 31.6%
62

COMBINING AND INDIVIDUAL FUND
STATEMENTS AND SCHEDULES

THIS PAGE IS INTENTIONALLY LEFT BLANK.
63
NONMAJOR GOVERNMENTAL FUNDS
SPECIAL REVENUE FUNDS
Human Services Fund – to account for the provision of health and welfare services. Financing is provided by state and federal funds, which may be used only for this purpose.
Highway Maintenance Fund – to account for the proceeds of state street and highway maintenance grants, and the related expenditure which is to be used for this purpose. This fund is only used for maintenance related expenditures, capital expenditures are recorded in other applicable funds.
Emergency Medical Services Fund – to account for the provision of emergency medical transportation services. Financing is provided by fees charged to customers and insurance providers.
Winchester-Frederick County Convention and Visitors Bureau Fund – to account for the costs of a shared visitors bureau. Financing is provided in equal amounts by the City of Winchester and Frederick County.
Law Library Fund – to account for the purchase of reference material for the law library. Financing is provided by a portion of court fines levied. Such funds are limited to expenditures for this purpose.
Bus Fund – to account for grants and monies received and used for operations of the City’s public transit system.
CAPITAL PROJECTS FUND
Capital Improvements Fund – to account for the financing and construction of capital projects of the general government. Financing is provided by general government revenue and bond issues.
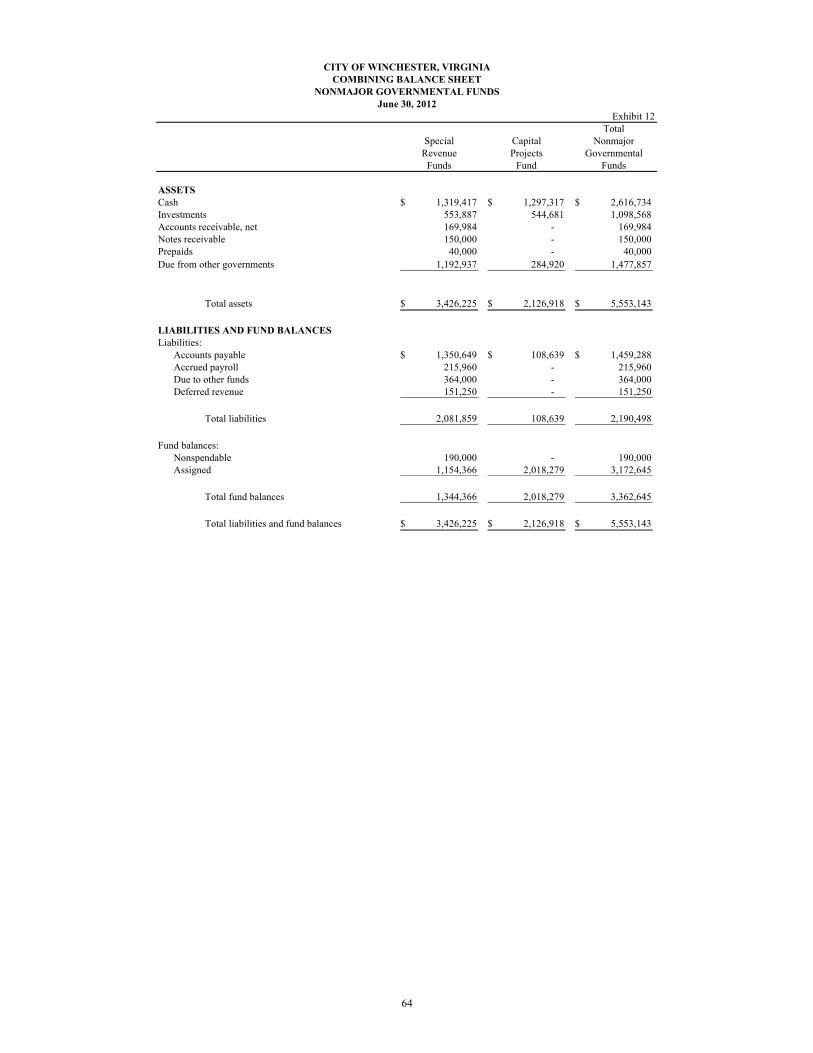
CITY OF WINCHESTER, VIRGINIACOMBINING BALANCE SHEET
NONMAJOR GOVERNMENTAL FUNDSJune 30, 2012
Exhibit 12Total
Special Capital NonmajorRevenue Projects Governmental
Funds Fund Funds
ASSETSCash 1,319,417$ 1,297,317$ 2,616,734$ Investments 553,887 544,681 1,098,568 Accounts receivable, net 169,984 - 169,984 Notes receivable 150,000 - 150,000 Prepaids 40,000 - 40,000
Due from other governments 1,192,937 284,920 1,477,857
Total assets 3,426,225$ 2,126,918$ 5,553,143$
LIABILITIES AND FUND BALANCESLiabilities:
Accounts payable 1,350,649$ 108,639$ 1,459,288$ Accrued payroll 215,960 - 215,960 Due to other funds 364,000 - 364,000 Deferred revenue 151,250 - 151,250
Total liabilities 2,081,859 108,639 2,190,498
Fund balances:Nonspendable 190,000 - 190,000 Assigned 1,154,366 2,018,279 3,172,645
Total fund balances 1,344,366 2,018,279 3,362,645
Total liabilities and fund balances 3,426,225$ 2,126,918$ 5,553,143$
64

Exhibit 13Total
Special Capital NonmajorRevenue Projects Governmental
Funds Fund Funds
REVENUESRevenues from use of money and property 12,383$ -$ 12,383$ Charges for services 1,047,258 - 1,047,258 Miscellaneous 165,454 - 165,454 Recovered costs 37,836 31,305 69,141 Intergovernmental:
Commonwealth 6,244,437 1,843,041 8,087,478 Federal 2,916,424 27,950 2,944,374
Total revenues 10,423,792 1,902,296 12,326,088
EXPENDITURESCurrent:
Judicial administration 34,669 - 34,669 Public safety 864,430 45,758 910,188 Public works 6,173,372 384,886 6,558,258 Health and welfare 6,645,065 - 6,645,065 Parks, recreation, and culture - 212,175 212,175 Community development 220,863 - 220,863
Total expenditures 13,938,399 642,819 14,581,218
Excess of expenditures over revenues (3,514,607) 1,259,477 (2,255,130)
OTHER FINANCING SOURCES (USES)Transfers in 3,501,123 75,000 3,576,123 Transfers out - (67,332) (67,332)
Total other financing sources 3,501,123 7,668 3,508,791
Net change in fund balances (13,484) 1,267,145 1,253,661
Fund balance - beginning 1,357,850 751,134 2,108,984
Fund balance - ending 1,344,366$ 2,018,279$ 3,362,645$
CITY OF WINCHESTER, VIRGINIACOMBINING STATEMENT OF REVENUES, EXPENDITURES, AND CHANGES IN FUND BALANCES
NONMAJOR GOVERNMENTAL FUNDSFor the Year Ended June 30, 2012
65

Exhibit 14Win-Fred
Emergency Convention Human Highway Medical and Visitors Law Services Maintenance Services Bureau Library Bus
Fund Fund Fund Fund Fund Fund Total
ASSETSCash 188,201$ 625,439$ 388,903$ 62,933$ 53,534$ 407$ 1,319,417$ Investments 79,016 262,592 163,282 26,422 22,476 99 553,887 Accounts receivable, net - - 152,526 - 17,073 385 169,984 Notes receivable - - 150,000 - - - 150,000 Prepaids 40,000 - - - - - 40,000 Due from other governments 466,323 268,275 - - - 458,339 1,192,937
Total assets 773,540$ 1,156,306$ 854,711$ 89,355$ 93,083$ 459,230$ 3,426,225$
LIABILITIES AND FUND BALANCESLiabilities:
Accounts payable 461,924$ 835,770$ 39,956$ 6,225$ 142 6,632$ 1,350,649$ Accrued payroll 103,217 57,646 22,841 5,038 500 26,718 215,960Due to other funds - - - - - 364,000 364,000Deferred revenue - - 151,250 - - - 151,250
Total liabilities 565,141 893,416 214,047 11,263 642 397,350 2,081,859
Fund balances: Nonspendable 40,000 - 150,000 - - - 190,000 Assigned 168,399 262,890 490,664 78,092 92,441 61,880 1,154,366
Total fund balances 208,399 262,890 640,664 78,092 92,441 61,880 1,344,366
Total liabilities and fund balances 773,540$ 1,156,306$ 854,711$ 89,355$ 93,083$ 459,230$ 3,426,225$
CITY OF WINCHESTER, VIRGINIACOMBINING BALANCE SHEET
NONMAJOR SPECIAL REVENUE FUNDSJune 30, 2012
6666

Exhibit 15Win-Fred
Emergency Convention Human Highway Medical and Visitors Law Services Maintenance Services Bureau Library Bus Fund Fund Fund Fund Fund Fund Total
REVENUESRevenues from use of money and property -$ 7,111$ 4,205$ 477$ 590$ -$ 12,383$ Charges for services - - 893,135 - 53,762 100,361 1,047,258 Miscellaneous 1,880 7,180 - 146,068 - 10,326 165,454 Recovered costs - 37,836 - - - - 37,836 Intergovernmental:
Commonwealth 2,407,630 3,707,428 - - - 129,379 6,244,437 Federal 2,200,004 145,465 - - - 570,955 2,916,424
Total revenues 4,609,514 3,905,020 897,340 146,545 54,352 811,021 10,423,792
EXPENDITURESCurrent:
Judicial administration - - - - 34,669 - 34,669 Public safety - - 864,430 - - - 864,430 Public works - 5,177,523 - - - 995,849 6,173,372 Health and welfare 6,645,065 - - - - - 6,645,065 Community development - - - 220,863 - - 220,863
Total expenditures 6,645,065 5,177,523 864,430 220,863 34,669 995,849 13,938,399
Excess (deficiency) of revenues over (under)expenditures (2,035,551) (1,272,503) 32,910 (74,318) 19,683 (184,828) (3,514,607)
OTHER FINANCING SOURCES (USES)Transfers in 1,979,396 1,225,000 - 100,500 - 196,227 3,501,123
Total other financing sources (uses) 1,979,396 1,225,000 - 100,500 - 196,227 3,501,123
Net change in fund balances (56,155) (47,503) 32,910 26,182 19,683 11,399 (13,484)
Fund balance - beginning 264,554 310,393 607,754 51,910 72,758 50,481 1,357,850
Fund balance - ending 208,399$ 262,890$ 640,664$ 78,092$ 92,441$ 61,880$ 1,344,366$
CITY OF WINCHESTER, VIRGINIACOMBINING STATEMENT OF REVENUES, EXPENDITURES, AND CHANGES IN FUND BALANCES
NONMAJOR SPECIAL REVENUE FUNDSFor the Year Ended June 30, 2012
67

Variance w/ Final Budget Original Final Positive
Budget Budget Actual (Negative)REVENUESRevenues from use of money and property -$ -$ -$ -$ Charges for services - - - - Miscellaneous - - 1,880 1,880 Recovered costs - - - - Intergovernmental:
Commonwealth 3,241,033 3,322,361 2,407,630 (914,731) Federal 2,079,967 2,200,412 2,200,004 (408)
Total revenues 5,321,000 5,522,773 4,609,514 (913,259)
EXPENDITURESCurrent:
Judicial administration - - - - Public safety - - - - Public works - - - - Health and welfare 7,668,000 7,904,099 6,645,065 1,259,034 Community development - - - -
Total expenditures 7,668,000 7,904,099 6,645,065 1,259,034
Excess (deficiency) of revenues over (under) expenditures (2,347,000) (2,381,326) (2,035,551) 345,775
OTHER FINANCING SOURCES (USES)Transfers in 2,347,000 2,381,326 1,979,396 (401,930) Transfers out - - - -
Total other financing sources and uses 2,347,000 2,381,326 1,979,396 (401,930)
Net change in fund balances -$ -$ (56,155)$ (56,155)$
Variance withFinal Budget
Original Final PositiveBudget Budget Actual (Negative)
REVENUESRevenues from use of money and property -$ -$ 477$ 477$ Charges for services - - - - Miscellaneous 130,500 130,500 146,068 15,568 Recovered costs - - - - Intergovernmental:
Commonwealth - - - - Federal - - - -
Total revenues 130,500 130,500 146,545 16,045
EXPENDITURESCurrent:
Judicial administration - - - - Public safety - - - - Public works - - - - Health and welfare - - - - Community development 231,000 231,000 220,863 10,137
Total expenditures 231,000 231,000 220,863 10,137
Excess (deficiency) of revenues over (under) expenditures (100,500) (100,500) (74,318) 26,182
OTHER FINANCING SOURCES (USES)Transfers in 100,500 100,500 100,500 - Transfers out - - - -
Total other financing sources and uses 100,500 100,500 100,500 -
Net change in fund balances -$ -$ 26,182$ 26,182$
Human Services Fund
CITY OF WINCHESTER, VIRGINIASCHEDULE OF REVENUES, EXPENDITURES, AND CHANGES IN FUND BALANCES - BUDGET AND ACTUAL
NONMAJOR SPECIAL REVENUE FUNDSFor the Year Ended June 30, 2012
Win-Fred Convention and Visitors Bureau Fund

Exhibit 16
Variance with Variance withFinal Budget Final Budget
Original Final Positive Original Final PositiveBudget Budget Actual (Negative) Budget Budget Actual (Negative)
-$ -$ 7,111$ 7,111$ 5,000$ 5,000$ 4,205$ (795)$ - - - - 840,000 840,000 893,135 53,135 - - 7,180 7,180 - - - - - - 37,836 37,836 - - - -
3,076,000 3,706,326 3,707,428 1,102 - - - - - 139,446 145,465 6,019 - - - -
3,076,000 3,845,772 3,905,020 59,248 845,000 845,000 897,340 52,340
- - - - - - - - - - - - 884,000 1,034,000 864,430 169,570
3,801,000 5,070,772 5,177,523 (106,751) - - - - - - - - - - - - - - - - - - - -
3,801,000 5,070,772 5,177,523 (106,751) 884,000 1,034,000 864,430 169,570
(725,000) (1,225,000) (1,272,503) (47,503) (39,000) (189,000) 32,910 221,910
725,000 1,225,000 1,225,000 - 39,000 189,000 - (189,000) - - - - - - - -
725,000 1,225,000 1,225,000 - 39,000 189,000 - (189,000)
-$ -$ (47,503)$ (47,503)$ -$ -$ 32,910$ 32,910$
Variance with Variance withFinal Budget Final Budget
Original Final Positive Original Final PositiveBudget Budget Actual (Negative) Budget Budget Actual (Negative)
-$ -$ 590$ 590$ -$ -$ -$ -$ 30,000 30,000 53,762 23,762 90,500 90,500 100,361 9,861
- - - - - - 10,326 10,326 - - - - -
- - - - 127,900 127,900 129,379 1,479 - - - - 533,600 533,600 570,955 37,355
30,000 30,000 54,352 24,352 752,000 752,000 811,021 59,021
30,000 42,000 34,669 7,331 - - - - - - - - - - - - - 1,005,000 1,005,000 995,849 (9,151) - - - - - - - - - - - - - - - -
30,000 42,000 34,669 7,331 1,005,000 1,005,000 995,849 (9,151)
- (12,000) 19,683 31,683 (253,000) (253,000) (184,828) 68,172
- 12,000 - (12,000) 253,000 253,000 196,227 (56,773) - - - - - - - -
- 12,000 - (12,000) 253,000 253,000 196,227 (56,773)
-$ -$ 19,683$ 19,683$ -$ -$ 11,399$ 11,399$
68
Highway Maintenance Fund Emergency Medical Services Fund
Law Library Fund Bus Fund
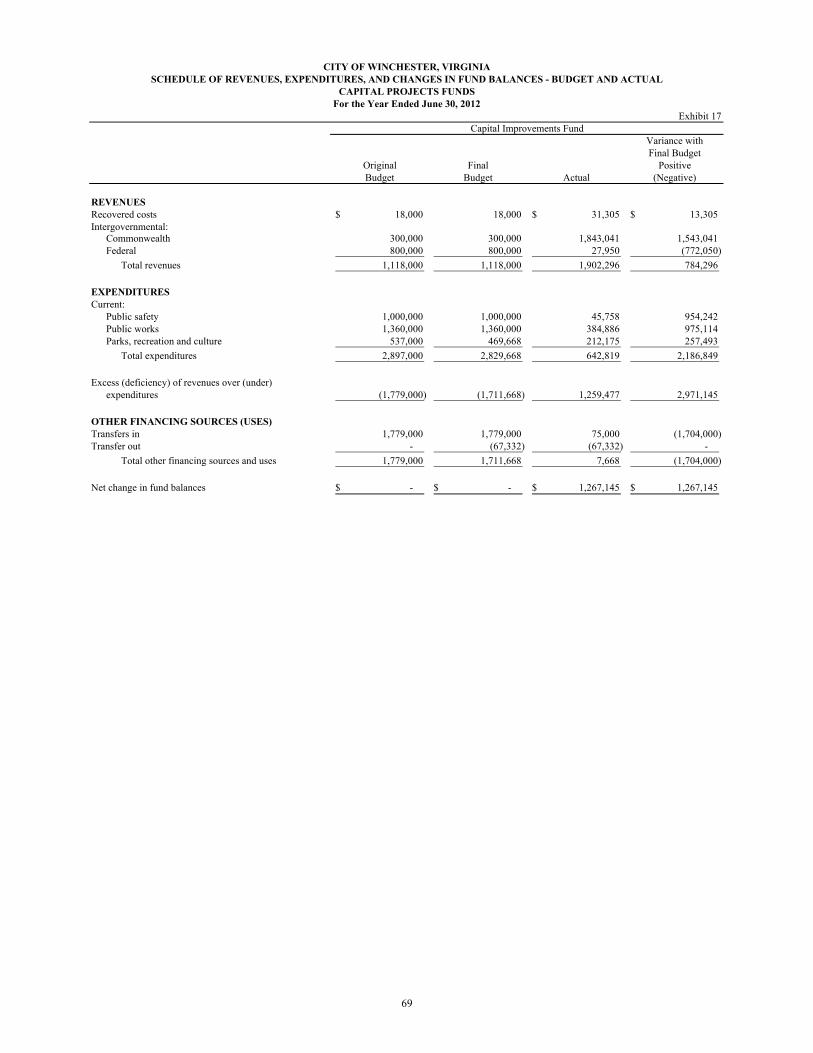
Exhibit 17
Variance withFinal Budget
Original Final PositiveBudget Budget Actual (Negative)
REVENUESRecovered costs 18,000$ 18,000 31,305$ 13,305$ Intergovernmental:
Commonwealth 300,000 300,000 1,843,041 1,543,041 Federal 800,000 800,000 27,950 (772,050)
Total revenues 1,118,000 1,118,000 1,902,296 784,296
EXPENDITURESCurrent:
Public safety 1,000,000 1,000,000 45,758 954,242 Public works 1,360,000 1,360,000 384,886 975,114 Parks, recreation and culture 537,000 469,668 212,175 257,493
Total expenditures 2,897,000 2,829,668 642,819 2,186,849
Excess (deficiency) of revenues over (under)expenditures (1,779,000) (1,711,668) 1,259,477 2,971,145
OTHER FINANCING SOURCES (USES)Transfers in 1,779,000 1,779,000 75,000 (1,704,000) Transfer out - (67,332) (67,332) -
Total other financing sources and uses 1,779,000 1,711,668 7,668 (1,704,000)
Net change in fund balances -$ -$ 1,267,145$ 1,267,145$
Capital Improvements Fund
CITY OF WINCHESTER, VIRGINIASCHEDULE OF REVENUES, EXPENDITURES, AND CHANGES IN FUND BALANCES - BUDGET AND ACTUAL
CAPITAL PROJECTS FUNDSFor the Year Ended June 30, 2012
69

THIS PAGE IS INTENTIONALLY LEFT BLANK.
70
INTERNAL SERVICE FUNDS
Employee Benefits Fund – to account for the receipt and payment of funds for City employee fringe
benefits, including health insurance and workers’ compensation. Cost reimbursement revenues paid
by departments and agencies of the City, as well as participating employees, are used to provide the
employee fringe benefits.
Equipment Operating Fund – to account for the purchase and use of equipment inventory, which is
provided to departments and agencies of the City on a cost reimbursement basis.
Other Post-Employment Benefits Fund – to account for the costs associated with providing healthcare
benefits to current and future eligible retirees of the City.
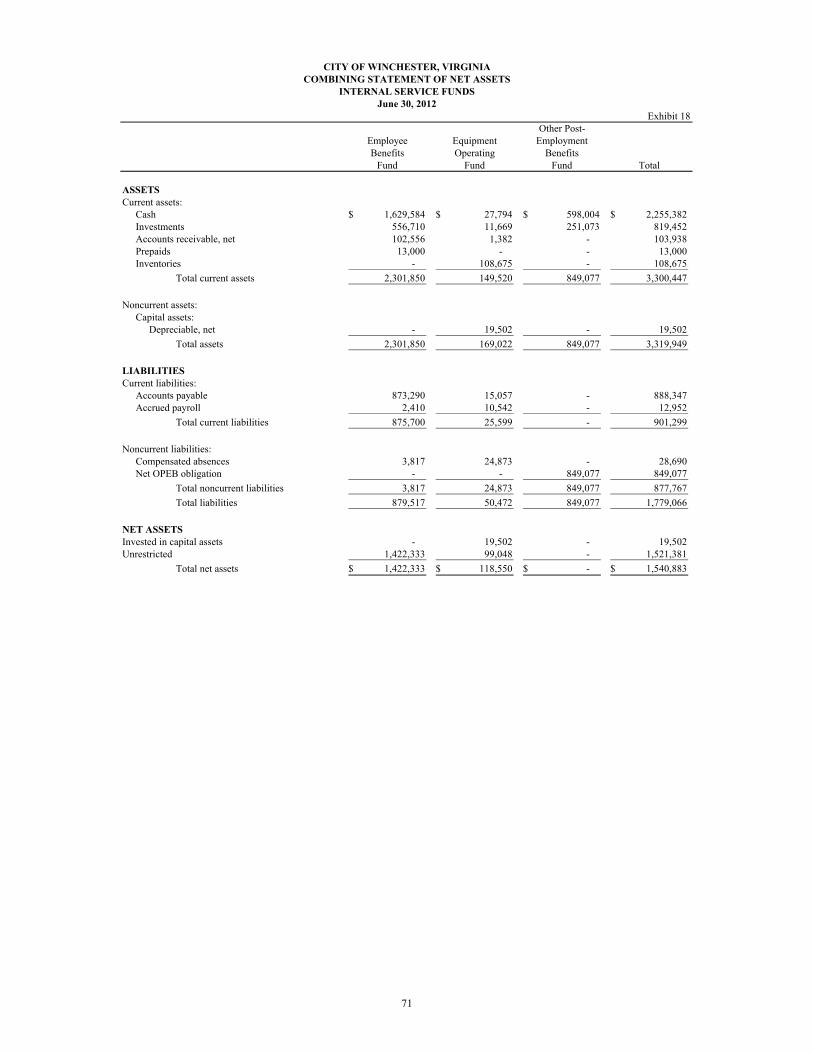
CITY OF WINCHESTER, VIRGINIACOMBINING STATEMENT OF NET ASSETS
INTERNAL SERVICE FUNDSJune 30, 2012
Exhibit 18Other Post-
Employee Equipment EmploymentBenefits Operating Benefits
Fund Fund Fund Total
ASSETSCurrent assets:
Cash 1,629,584$ 27,794$ 598,004$ 2,255,382$ Investments 556,710 11,669 251,073 819,452 Accounts receivable, net 102,556 1,382 - 103,938 Prepaids 13,000 - - 13,000 Inventories - 108,675 - 108,675
Total current assets 2,301,850 149,520 849,077 3,300,447
Noncurrent assets:Capital assets:
Depreciable, net - 19,502 - 19,502
Total assets 2,301,850 169,022 849,077 3,319,949
LIABILITIESCurrent liabilities:
Accounts payable 873,290 15,057 - 888,347 Accrued payroll 2,410 10,542 - 12,952
Total current liabilities 875,700 25,599 - 901,299
Noncurrent liabilities:Compensated absences 3,817 24,873 - 28,690 Net OPEB obligation - - 849,077 849,077
Total noncurrent liabilities 3,817 24,873 849,077 877,767
Total liabilities 879,517 50,472 849,077 1,779,066
NET ASSETSInvested in capital assets - 19,502 - 19,502 Unrestricted 1,422,333 99,048 - 1,521,381
Total net assets 1,422,333$ 118,550$ -$ 1,540,883$
71

CITY OF WINCHESTER, VIRGINIACOMBINING STATEMENT OF REVENUES, EXPENSES, AND CHANGES IN FUND NET ASSETS
INTERNAL SERVICE FUNDSFor the Year Ended June 30, 2012
Exhibit 19Other Post-
Employee Equipment EmploymentBenefits Operating Benefits
Fund Fund Fund Total
OPERATING REVENUESCharges for services 4,454,310$ 1,357,476$ 258,000$ 6,069,786$
Total operating revenues 4,454,310 1,357,476 258,000 6,069,786
OPERATING EXPENSESPersonal services 64,016 269,626 258,000 591,642 Contractual services - 196,949 - 196,949 Other supplies and expenses - 854,826 - 854,826 Insurance claims and expenses 3,748,619 - - 3,748,619 Depreciation - 1,525 - 1,525
Total operating expenses 3,812,635 1,322,926 258,000 5,393,561
Operating income 641,675 34,550 - 676,225
NONOPERATING REVENUES (EXPENSES)Investment earnings 10,037 13 - 10,050
Change in net assets 651,712 34,563 - 686,275
Total net assets - beginning 770,621 83,987 - 854,608
Total net assets - ending 1,422,333$ 118,550$ -$ 1,540,883$
72

CITY OF WINCHESTER, VIRGINIACOMBINING STATEMENT OF CASH FLOWS
INTERNAL SERVICE FUNDSFor the Year Ended June 30, 2012
Exhibit 20Other Post-
Employee Equipment EmploymentBenefits Operating Benefits
Fund Fund Fund Total
CASH FLOWS FROM OPERATING ACTIVITIESCash received from internal services provided 4,352,774$ 1,368,594$ 258,000$ 5,979,368$ Cash paid to suppliers - (1,106,326) - (1,106,326) Cash paid to employees (62,129) (261,746) - (323,875) Premiums paid (3,765,703) - - (3,765,703)
Net cash provided by operatingactivities 524,942 522 258,000 783,464
CASH FLOWS FROM INVESTING ACTIVITIESInvestment income 10,037 13 - 10,050
Net cash provided by investing activities 10,037 13 - 10,050
Net increase in cash and cash equivalents 534,979 535 258,000 793,514
Cash and cash equivalents - beginning of year 1,651,315 38,928 591,077 2,281,320
Cash and cash equivalents - end of year 2,186,294$ 39,463$ 849,077$ 3,074,834$
Cash and cash equivalents at end of year is comprisedof the following:
Cash 1,629,584$ 27,794$ 598,004$ 2,255,382$ Cash equivalents - Investments 556,710 11,669 251,073 819,452
Total 2,186,294$ 39,463$ 849,077$ 3,074,834$
Reconciliation of operating income to net cash provided by operating activities:
Operating income 641,675$ 34,550$ -$ 676,225$ Adjustments to reconcile operating income to
net cash provided by operating activities:Depreciation - 1,525 - 1,525 (Increase) decrease in accounts receivable (101,536) 11,118 - (90,418) (Increase) decrease in inventory - 12,129 - 12,129 Increase (decrease) in accounts payable (17,084) (66,680) - (83,764) Increase (decrease) in accrued payroll 223 1,231 - 1,454 Increase (decrease) in net OPEB obligation - - 258,000 258,000 Increase (decrease) in compensated absences 1,664 6,649 - 8,313
Total adjustments (116,733) (34,028) 258,000 107,239
Net cash provided by operating activities 524,942$ 522$ 258,000$ 783,464$
73

THIS PAGE IS INTENTIONALLY LEFT BLANK.

74
FIDUCIARY FUNDS
AGENCY FUNDS
Special Welfare Fund – to account for the receipt and payment of funds collected by the City on the behalf of certain human services clients.
Northwestern Regional Jail Authority Construction Fund – to account for bond proceeds for purposes of constructing a new regional jail.
Northwestern Regional Juvenile Detention Center Fund – to account for state grants, member locality contributions and reimbursements, and other revenues for the purpose of operating a joint juvenile detention center.
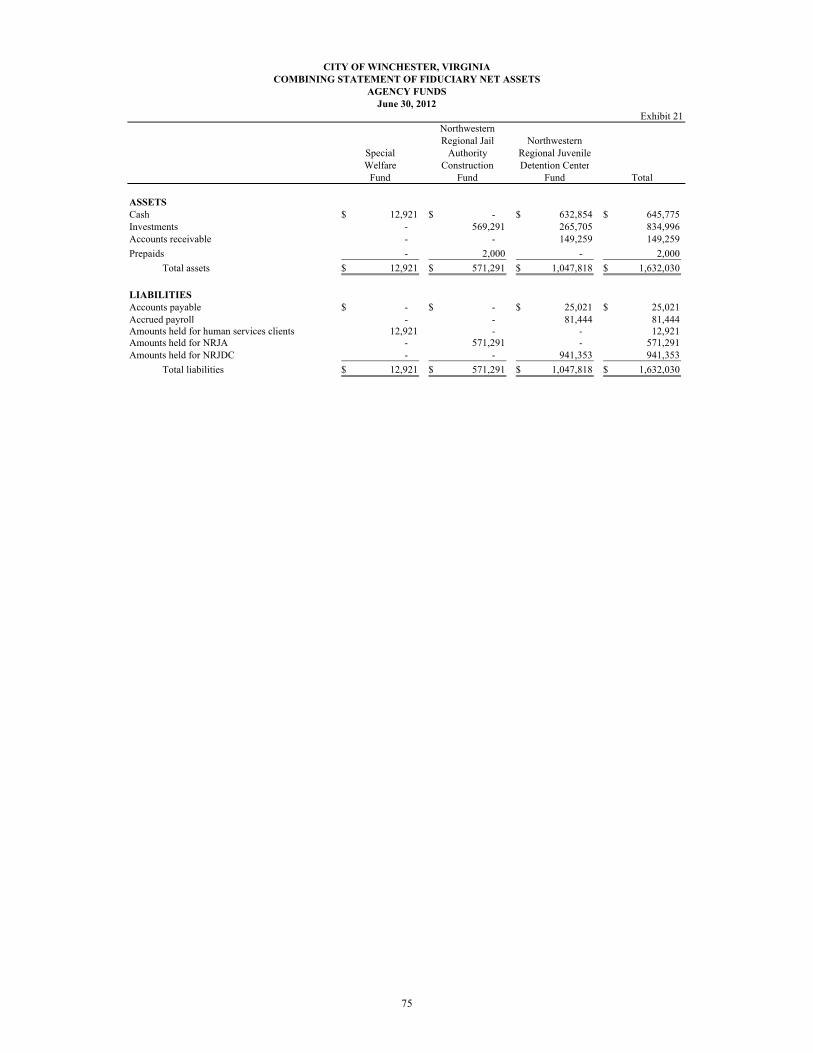
Exhibit 21Northwestern
Regional Jail NorthwesternSpecial Authority Regional Juvenile
Welfare Construction Detention CenterFund Fund Fund Total
ASSETSCash 12,921$ -$ 632,854$ 645,775$ Investments - 569,291 265,705 834,996 Accounts receivable - - 149,259 149,259
Prepaids - 2,000 - 2,000
Total assets 12,921$ 571,291$ 1,047,818$ 1,632,030$
LIABILITIESAccounts payable -$ -$ 25,021$ 25,021$ Accrued payroll - - 81,444 81,444 Amounts held for human services clients 12,921 - - 12,921 Amounts held for NRJA - 571,291 - 571,291 Amounts held for NRJDC - - 941,353 941,353
Total liabilities 12,921$ 571,291$ 1,047,818$ 1,632,030$
CITY OF WINCHESTER, VIRGINIACOMBINING STATEMENT OF FIDUCIARY NET ASSETS
June 30, 2012AGENCY FUNDS
75

CITY OF WINCHESTER, VIRGINIACOMBINING STATEMENT OF CHANGES IN FIDUCIARY ASSETS AND LIABILITIES
AGENCY FUNDSFor the Year Ended June 30, 2012
Exhibit 22Balance Balance
July 1, 2011 Additions Deletions June 30, 2012
Special Welfare FundAssets: Cash 11,868$ 1,053$ -$ 12,921$ Accounts receivable 449 - 449 -
Total Assets 12,317$ 1,053$ 449$ 12,921$
Liabilities: Amounts held for human services clients 12,317$ 604$ -$ 12,921$
Total Liabilities 12,317$ 604$ -$ 12,921$
Northwestern Regional Jail AuthorityConstruction FundAssets: Investments 569,835$ 1,138,562$ 1,139,106$ 569,291$ Prepaids - 2,000 - 2,000
Total Assets 569,835$ 1,140,562$ 1,139,106$ 571,291$
Liabilities: Amounts held for NRJA 569,835$ 1,140,562$ 1,139,106$ 571,291$
Total Liabilities 569,835$ 1,140,562$ 1,139,106$ 571,291$
Northwestern Regional Juvenile DetentionCenter FundAssets: Cash 837,138$ 2,209,410$ 2,413,694$ 632,854$ Investments 382,192 - 116,487 265,705 Accounts receivable 8,303 1,415,897 1,274,941 149,259
Total Assets 1,227,633$ 3,625,307$ 3,805,122$ 1,047,818$
Liabilities: Accounts payable 18,925$ 2,403,046$ 2,396,950$ 25,021$ Accrued payroll 73,720 7,724 - 81,444 Amounts held for NRJDC 1,134,988 1,214,537 1,408,172 941,353
Total Liabilities 1,227,633$ 3,625,307$ 3,805,122$ 1,047,818$
Total All Agency FundsAssets: Cash 849,006$ 2,210,463$ 2,413,694$ 645,775$ Investments 952,027 1,138,562 1,255,593 834,996 Accounts receivable 8,752 1,415,897 1,275,390 149,259 Prepaids - 2,000 - 2,000
Total Assets 1,809,785$ 4,766,922$ 4,944,677$ 1,632,030$
Liabilities: Accounts payable 18,925$ 2,403,046$ 2,396,950$ 25,021$ Accrued payroll 73,720 7,724 - 81,444 Amounts held for human services clients 12,317 604 - 12,921 Amounts held for NRJA 569,835 1,140,562 1,139,106 571,291 Amounts held for NRJDC 1,134,988 1,214,537 1,408,172 941,353
Total Liabilities 1,809,785$ 4,766,473$ 4,944,228$ 1,632,030$
76
77
DISCRETELY PRESENTED COMPONENT UNIT – SCHOOL BOARD
MAJOR GOVERNMENTAL FUNDS
SPECIAL REVENUE FUNDS
School Operating Fund – to account for the operations and maintenance of the schools. Financing is provided by state and federal funds, and by appropriations from the City’s general revenues. State and federal education funds received may be used only for this purpose. Annual appropriations from general revenues were restricted by the Appropriations Resolution to education expenditures.
CAPITAL PROJECTS FUNDS
School Fundraising Fund – created to account fundraising revenue and expenditures for the construction of school facilities.
School Capital Improvement Fund – created to account for unexpended school funds allowed by the Common Council to be carried over to future periods for school related capital projects.
NONMAJOR GOVERNMENTAL FUNDS
SPECIAL REVENUE FUNDS
School Cafeteria Fund – to account for the operation and maintenance of cafeterias of the schools. Financing is provided primarily from charges for services and federal and state lunch subsidiaries. Such funds are limited by federal and state law to expenditures for cafeteria operations and maintenance.
School Federal Grants Fund – to account for the proceeds from federal grants. Such funds are limited to specified educational expenditures that are governed by the terms of the grant.
School Textbook Fund – to account for the purchase and sale of school textbooks. Financing is provided primarily by the transfer of funds from the School Operating Fund and funds so received are limited by the School Board to expenditures only for school textbooks.
78
DISCRETELY PRESENTED COMPONENT UNIT – SCHOOL BOARD(Continued)
INTERNAL SERVICE FUNDS
School Insurance Fund – to account for the operation of a partially self-insured employee health insurance program. Receipts from the School Board and participating employees are used to pay claims and purchase insurance for excess claims.
School Consolidated Maintenance Fund – to account for the repairs and maintenance services provided by the School Maintenance Department. Costs are accumulated and reimbursed by the School Board.
FIDUCIARY FUNDS
PRIVATE-PURPOSE TRUST FUNDS
Newton B. Shingleton, M. Louise Cooper, and School Scholarship Funds – to account for donations received for the purpose of funding scholarships.
AGENCY FUNDS
School Employee Benefits Fund – to account for funds withheld and payment of funds for payroll withholding taxes for all school employees.

Exhibit 23
School School School Capital Other Total Operating Fundraising Improvement Governmental Governmental Fund Fund Fund Funds Funds
ASSETS
Cash 1,775,128$ 533,384$ 1,943,743$ 883,442$ 5,135,697$
Investments 745,080 223,522 816,083 370,880 2,155,565
Receivables, net:
Accounts - - - 24,559 24,559
Promises to give - 1,411,706 - - 1,411,706 Due from other funds 229,718 - - - 229,718 Due from other governments 895,965 - 64,468 488,584 1,449,017
Inventories - - - 22,121 22,121
Total assets 3,645,891$ 2,168,612$ 2,824,294$ 1,789,586$ 10,428,383$
LIABILITIES AND FUND BALANCESLiabilities:
Accounts payable 222,210$ 51,319$ 212,020$ 268,820$ 754,369$ Accrued payroll 3,412,384 - - 359,904 3,772,288 Due to other funds - - - 229,718 229,718 Deferred revenue 10,121 1,411,706 - - 1,421,827
Total liabilities 3,644,715 1,463,025 212,020 858,442 6,178,202
Fund balances:Nonspendable - - - 22,121 22,121
Assigned 1,176 705,587 2,612,274 909,023 4,228,060
Total fund balances 1,176 705,587 2,612,274 931,144 4,250,181
Total liabilities and fund balances 3,645,891$ 2,168,612$ 2,824,294$ 1,789,586$
CITY OF WINCHESTER, VIRGINIABALANCE SHEET
DISCRETELY PRESENTED COMPONENT UNIT - SCHOOL BOARD
June 30, 2012GOVERNMENTAL FUNDS
Amounts reported for governmental activities in the statement of netassets (Exhibit 1) are different because:
Capital assets used in governmental activities are not financialresources and, therefore, are not reported in the funds. 113,023,354
Other long-term assets are not available to pay for current-periodexpenditures and, therefore, are deferred in the funds. 1,421,827
Internal service funds are used by management to charge the costs ofmaintenance and risk management, to individual funds. The assetsand liabilities of the internal service funds are included in governmentalactivities in the statement of net assets. 1,565,536
Long-term liabilities, including debt payable, are not due and payablein the current period and therefore are not reported in the funds. (1,298,464)
Net assets of governmental activities 118,962,434$
79

Exhibit 24
School School School Capital Other TotalOperating Fundraising Improvement Governmental Governmental
Fund Fund Fund Funds Funds
REVENUESRevenues from use of money and property 49,191$ 6,101$ 12,072$ 6,449$ 73,813$ Charges for services 200,462 - - 668,640 869,102 Miscellaneous 200,638 244,882 7,301 4,807 457,628 Recovered costs 127,521 - 87,795 - 215,316 Intergovernmental revenues:
Local 25,351,902 - - - 25,351,902 Commonwealth 16,670,696 - - 34,097 16,704,793 Federal - - - 4,119,248 4,119,248
Total revenues 42,600,410 250,983 107,168 4,833,241 47,791,802
EXPENDITURESCurrent:
Education 40,755,407 - - 5,105,021 45,860,428 Capital projects - 306,050 1,448,246 - 1,754,296
Total expenditures 40,755,407 306,050 1,448,246 5,105,021 47,614,724
Excess (deficiency) of revenues over (under)expenditures 1,845,003 (55,067) (1,341,078) (271,780) 177,078
OTHER FINANCING SOURCES (USES)Transfers in - - 1,545,122 300,000 1,845,122 Transfers out (1,845,122) - - - (1,845,122)
Total other financing sources (uses) (1,845,122) - 1,545,122 300,000 -
Net change in fund balances (119) (55,067) 204,044 28,220 177,078
Fund balances - beginning 1,295 760,654 2,408,230 902,924
Fund balances - ending 1,176$ 705,587$ 2,612,274$ 931,144$
Amounts reported for governmental activities in the statement of activities are different because:
Governmental funds reported capital outlays as expenditures. However, in the statement ofof activities the cost of those assets is allocated over their estimated useful lives andreported as depreciation expense. This is the amount by which capital outlay ($1,316,883)exceeded depreciation ($2,943,488) in the current period. (1,626,605)
Revenues in the statement of activities that do not provide current financial resourcesare not reported as revenues in the funds. (67,300)
Internal service funds are used by management to charge the costs of maintenanceand risk management, to individual funds. The net revenue (expense) of theseinternal service funds is reported with governmental activities. (39,529)
Some expenses reported in the statement of activities do not require the use of currentfinancial resources and, therefore are not reported as expenditures in governmental funds. 34,602
Change in net assets of governmental activities (1,521,754)$
CITY OF WINCHESTER, VIRGINIASTATEMENT OF REVENUES, EXPENDITURES, AND CHANGES IN FUND BALANCES
DISCRETELY PRESENTED COMPONENT UNIT - SCHOOL BOARD
For the Year Ended June 30, 2012GOVERNMENTAL FUNDS
80
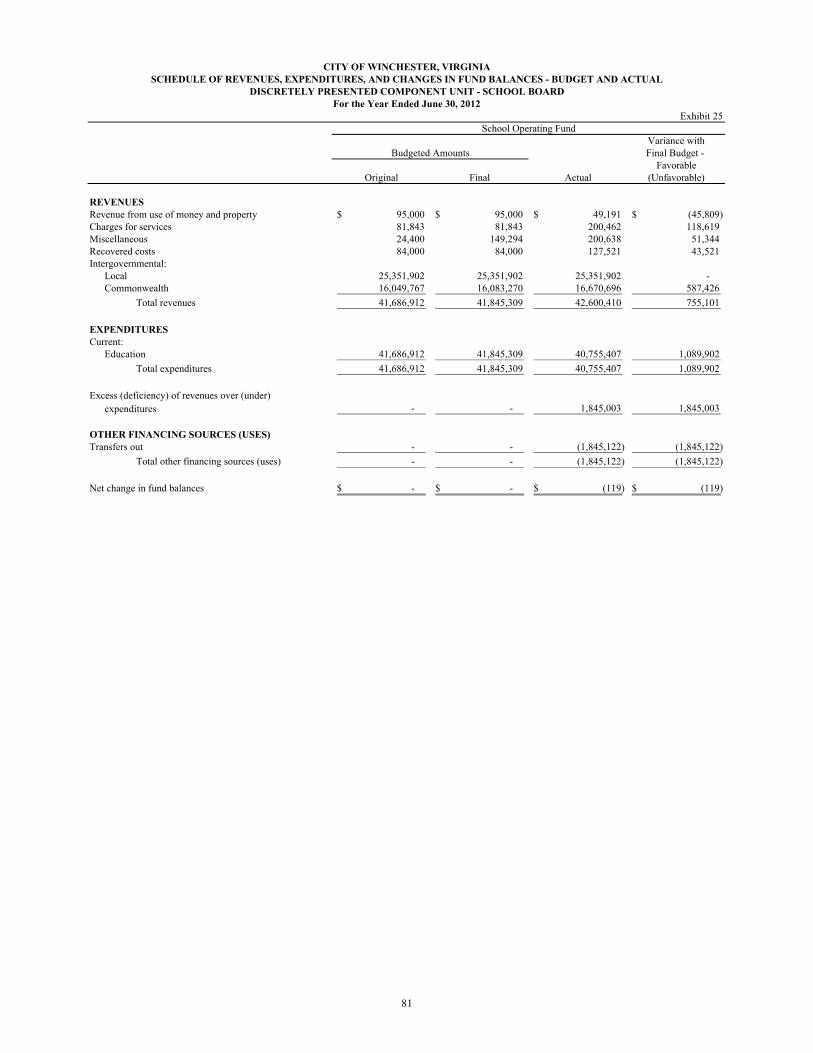
Exhibit 25School Operating Fund
Variance withFinal Budget -
FavorableOriginal Final Actual (Unfavorable)
REVENUESRevenue from use of money and property 95,000$ 95,000$ 49,191$ (45,809)$ Charges for services 81,843 81,843 200,462 118,619Miscellaneous 24,400 149,294 200,638 51,344Recovered costs 84,000 84,000 127,521 43,521Intergovernmental:
Local 25,351,902 25,351,902 25,351,902 - Commonwealth 16,049,767 16,083,270 16,670,696 587,426
Total revenues 41,686,912 41,845,309 42,600,410 755,101
EXPENDITURESCurrent:
Education 41,686,912 41,845,309 40,755,407 1,089,902
Total expenditures 41,686,912 41,845,309 40,755,407 1,089,902
Excess (deficiency) of revenues over (under)
expenditures - - 1,845,003 1,845,003
OTHER FINANCING SOURCES (USES)Transfers out - - (1,845,122) (1,845,122)
Total other financing sources (uses) - - (1,845,122) (1,845,122)
Net change in fund balances -$ -$ (119)$ (119)$
For the Year Ended June 30, 2012
Budgeted Amounts
CITY OF WINCHESTER, VIRGINIASCHEDULE OF REVENUES, EXPENDITURES, AND CHANGES IN FUND BALANCES - BUDGET AND ACTUAL
DISCRETELY PRESENTED COMPONENT UNIT - SCHOOL BOARD
81

Exhibit 26
School TotalSchool Federal School Nonmajor
Cafeteria Grants Textbook Governmental Fund Fund Fund Funds
ASSETS
Cash 393,220$ -$ 490,222$ 883,442$
Investments 165,060 - 205,820 370,880 Accounts receivable 24,559 - - 24,559 Due from other governments - 488,584 - 488,584 Inventories 22,121 - - 22,121
Total assets 604,960$ 488,584$ 696,042$ 1,789,586$
LIABILITIES AND FUND BALANCESLiabilities:Accounts payable 1,797$ 7,908$ 259,115$ 268,820$ Accrued payroll 108,946 250,958 - 359,904 Due to other funds - 229,718 - 229,718
Total liabilities 110,743 488,584 259,115 858,442
Fund balances:Nonspendable 22,121 - - 22,121 Assigned 472,096 - 436,927 909,023
Total fund balances 494,217 - 436,927 931,144
Total liabilities and fund balances 604,960$ 488,584$ 696,042$ 1,789,586$
CITY OF WINCHESTER, VIRGINIACOMBINING BALANCE SHEET
DISCRETELY PRESENTED COMPONENT UNIT - SCHOOL BOARD
June 30, 2012NONMAJOR GOVERNMENTAL FUNDS
Special Revenue
82

Exhibit 27
School TotalSchool Federal School Nonmajor
Cafeteria Grants Textbook GovernmentalFund Fund Fund Funds
REVENUESRevenues from use of money and property 2,873$ -$ 3,576$ 6,449$ Charges for services 668,640 - - 668,640 Miscellaneous 4,807 - - 4,807 Intergovernmental revenues:
Commonwealth 34,097 - - 34,097 Federal 1,307,867 2,811,381 - 4,119,248
Total revenues 2,018,284 2,811,381 3,576 4,833,241
EXPENDITURESCurrent:
Education 1,847,921 2,811,381 445,719 5,105,021
Total expenditures 1,847,921 2,811,381 445,719 5,105,021
Excess (deficiency) of revenues over (under)expenditures 170,363 - (442,143) (271,780)
OTHER FINANCING SOURCES (USES)Transfers in - - 300,000 300,000
Total other financing sources (uses) - - 300,000 300,000
Net change in fund balances 170,363 - (142,143) 28,220
Fund balance - beginning 323,854 - 579,070 902,924
Fund balance - ending 494,217$ -$ 436,927$ 931,144$
Special Revenue
CITY OF WINCHESTER, VIRGINIACOMBINING STATEMENT OF REVENUES, EXPENDITURES, AND CHANGES IN FUND BALANCES
DISCRETELY PRESENTED COMPONENT UNIT - SCHOOL BOARD
For the Year Ended June 30, 2012NONMAJOR FUNDS
83

THIS PAGE IS INTENTIONALLY LEFT BLANK.

School Cafeteria FundVariance withFinal Budget -
PositiveOriginal Final Actual (Negative)
REVENUESRevenues from use of money and property 1,500$ 1,500$ 2,873$ 1,373$ Charges for services 727,616 727,616 668,640 (58,976)Miscellaneous 5,000 5,000 4,807 (193)Intergovernmental:
Commonwealth 34,089 34,089 34,097 8 Federal 1,009,900 1,136,987 1,307,867 170,880
Total revenues 1,778,105 1,905,192 2,018,284 113,092
EXPENDITURESCurrent:
Education 1,778,105 1,905,192 1,847,921 57,271
Total expenditures 1,778,105 1,905,192 1,847,921 57,271
Excess (deficiency) of revenues over (under)
expenditures - - 170,363 170,363
OTHER FINANCING SOURCES (USES)Transfers in - - - -
Total other financing sources (uses) - - - -
Net change in fund balances -$ -$ 170,363$ 170,363$
NONMAJOR SPECIAL REVENUE FUNDS
Budgeted Amounts
For the Year Ended June 30, 2012
CITY OF WINCHESTER, VIRGINIASCHEDULE OF REVENUES, EXPENDITURES, AND CHANGES IN FUND BALANCES - BUDGET AND ACTUAL
DISCRETELY PRESENTED COMPONENT UNIT - SCHOOL BOARD
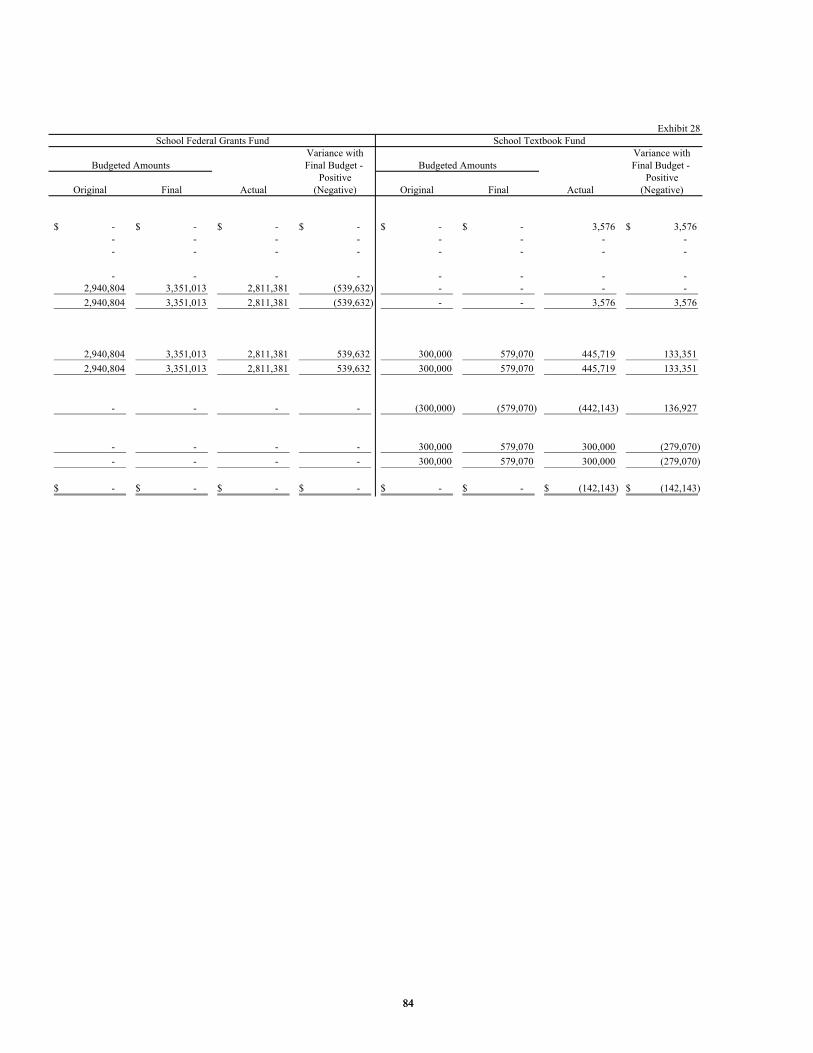
Exhibit 28School Federal Grants Fund School Textbook Fund
Variance with Variance withFinal Budget - Final Budget -
Positive PositiveOriginal Final Actual (Negative) Original Final Actual (Negative)
-$ -$ -$ -$ -$ -$ 3,576 3,576$ - - - - - - - - - - - - - - - -
- - - - - - - - 2,940,804 3,351,013 2,811,381 (539,632) - - - -
2,940,804 3,351,013 2,811,381 (539,632) - - 3,576 3,576
2,940,804 3,351,013 2,811,381 539,632 300,000 579,070 445,719 133,351
2,940,804 3,351,013 2,811,381 539,632 300,000 579,070 445,719 133,351
- - - - (300,000) (579,070) (442,143) 136,927
- - - - 300,000 579,070 300,000 (279,070)
- - - - 300,000 579,070 300,000 (279,070)
-$ -$ -$ -$ -$ -$ (142,143)$ (142,143)$
Budgeted Amounts Budgeted Amounts
84 84

Variance withFinal Budget -
PositiveOriginal Final Actual (Negative)
REVENUESRevenues from use of money and property 2,500$ 2,500$ 6,101$ 3,601$ Miscellaneous 197,500 938,154 244,882 (693,272) Recovered costs - - - -
Total revenues 200,000 940,654 250,983 (689,671)
EXPENDITURESCapital projects 200,000 940,654 306,050 634,604
Total expenditures 200,000 940,654 306,050 634,604
Excess (deficiency) of revenues over (under)
expenditures - - (55,067) (55,067)
OTHER FINANCING SOURCES (USES)Transfers in - - - -
Total other financing sources (uses) - - - -
Net change in fund balances -$ -$ (55,067)$ (55,067)$
CITY OF WINCHESTER, VIRGINIA
Budgeted Amounts
School Fundraising Fund
SCHEDULE OF REVENUES, EXPENDITURES, AND CHANGES IN FUND BALANCES - BUDGET AND ACTUALDISCRETELY PRESENTED COMPONENT UNIT - SCHOOL BOARD
CAPITAL PROJECTS FUNDSFor the Year Ended June 30, 2012
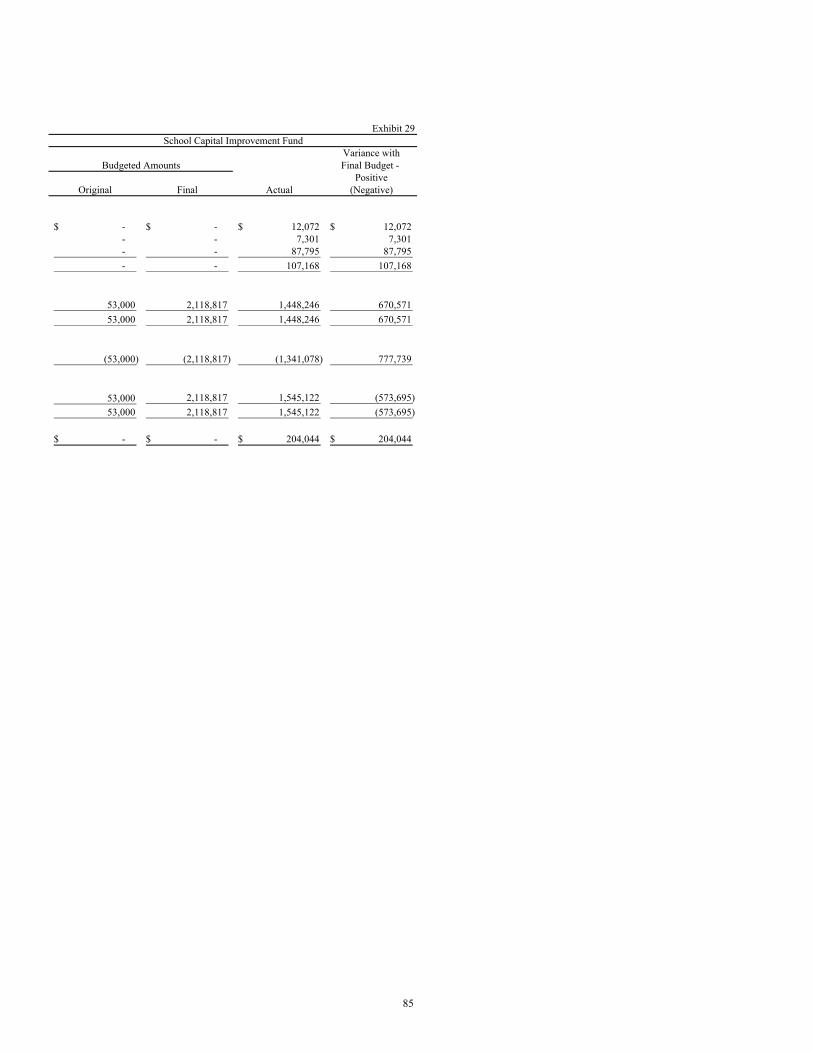
Exhibit 29School Capital Improvement Fund
Variance withFinal Budget -
PositiveOriginal Final Actual (Negative)
-$ -$ 12,072$ 12,072$ - - 7,301 7,301 - - 87,795 87,795
- - 107,168 107,168
53,000 2,118,817 1,448,246 670,571
53,000 2,118,817 1,448,246 670,571
(53,000) (2,118,817) (1,341,078) 777,739
53,000 2,118,817 1,545,122 (573,695)
53,000 2,118,817 1,545,122 (573,695)
-$ -$ 204,044$ 204,044$
Budgeted Amounts
85
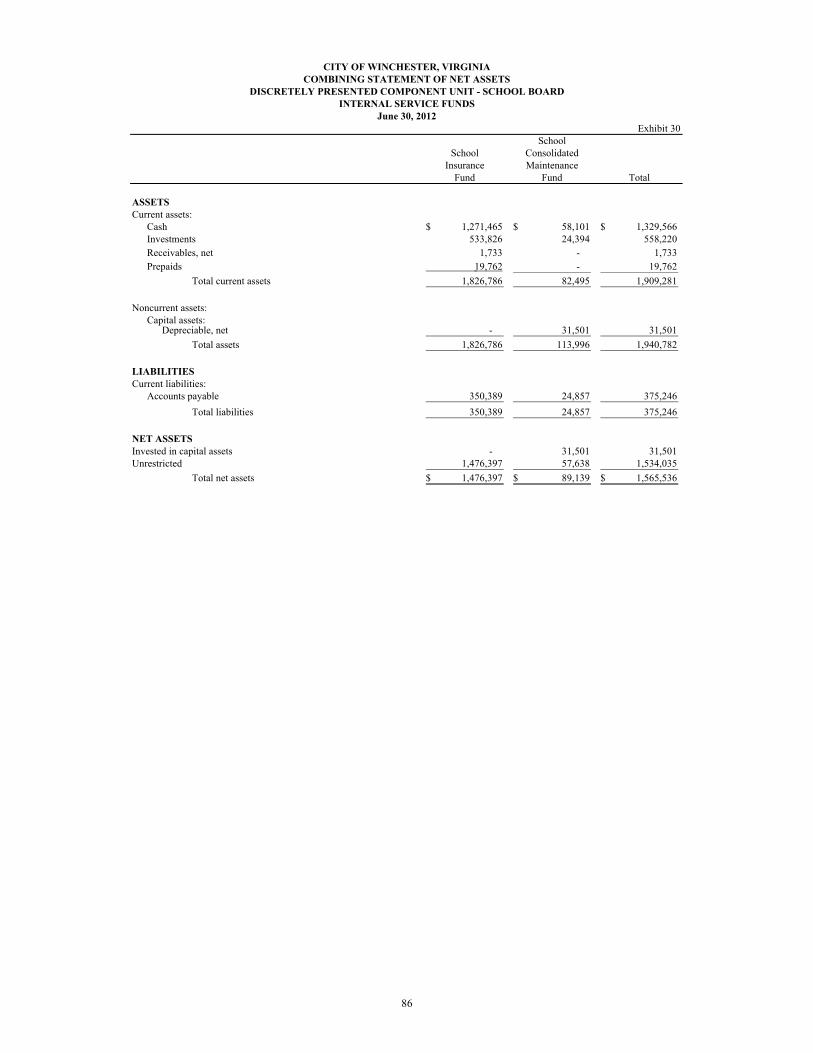
CITY OF WINCHESTER, VIRGINIACOMBINING STATEMENT OF NET ASSETS
DISCRETELY PRESENTED COMPONENT UNIT - SCHOOL BOARDINTERNAL SERVICE FUNDS
June 30, 2012Exhibit 30
SchoolSchool Consolidated
Insurance Maintenance Fund Fund Total
ASSETSCurrent assets:
Cash 1,271,465$ 58,101$ 1,329,566$ Investments 533,826 24,394 558,220
Receivables, net 1,733 - 1,733
Prepaids 19,762 - 19,762
Total current assets 1,826,786 82,495 1,909,281
Noncurrent assets:Capital assets:
Depreciable, net - 31,501 31,501
Total assets 1,826,786 113,996 1,940,782
LIABILITIESCurrent liabilities:
Accounts payable 350,389 24,857 375,246
Total liabilities 350,389 24,857 375,246
NET ASSETSInvested in capital assets - 31,501 31,501 Unrestricted 1,476,397 57,638 1,534,035
Total net assets 1,476,397$ 89,139$ 1,565,536$
86

Exhibit 31School
School ConsolidatedInsurance Maintenance
Fund Fund Total
OPERATING REVENUESCharges for services 4,350,697$ 1,149,381$ 5,500,078$ Miscellaneous 47,925 - 47,925
Total operating revenues 4,398,622 1,149,381 5,548,003
OPERATING EXPENSESPersonal services - 673,976 673,976 Contractual services - 254,427 254,427 Other supplies and expenses - 222,584 222,584 Insurance claims and expenses 4,439,384 - 4,439,384 Depreciation - 9,642 9,642
Total operating expenses 4,439,384 1,160,629 5,600,013
Operating loss (40,762) (11,248) (52,010)
NONOPERATING REVENUES Investment earnings 12,337 144 12,481
Total nonoperating revenues 12,337 144 12,481
Change in net assets (28,425) (11,104) (39,529)
Total net assets - beginning 1,504,822 100,243 1,605,065
Total net assets - ending 1,476,397$ 89,139$ 1,565,536$
CITY OF WINCHESTER, VIRGINIACOMBINING STATEMENT OF REVENUES, EXPENSES, AND CHANGES IN FUND NET ASSETS
DISCRETELY PRESENTED COMPONENT UNIT - SCHOOL BOARDINTERNAL SERVICE FUNDS
For the Year Ended June 30, 2012
87
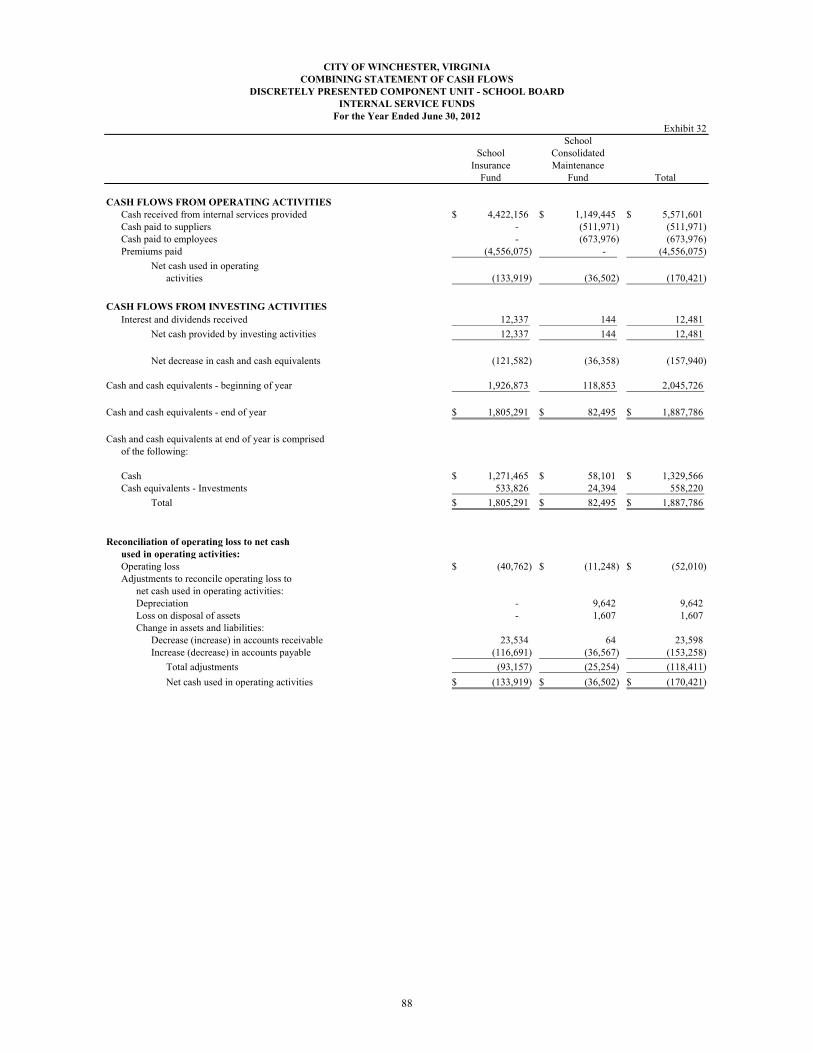
Exhibit 32School
School ConsolidatedInsurance Maintenance
Fund Fund Total
CASH FLOWS FROM OPERATING ACTIVITIESCash received from internal services provided 4,422,156$ 1,149,445$ 5,571,601$ Cash paid to suppliers - (511,971) (511,971) Cash paid to employees - (673,976) (673,976) Premiums paid (4,556,075) - (4,556,075)
Net cash used in operating activities (133,919) (36,502) (170,421)
CASH FLOWS FROM INVESTING ACTIVITIES
Interest and dividends received 12,337 144 12,481
Net cash provided by investing activities 12,337 144 12,481
Net decrease in cash and cash equivalents (121,582) (36,358) (157,940)
Cash and cash equivalents - beginning of year 1,926,873 118,853 2,045,726
Cash and cash equivalents - end of year 1,805,291$ 82,495$ 1,887,786$
Cash and cash equivalents at end of year is comprisedof the following:
Cash 1,271,465$ 58,101$ 1,329,566$ Cash equivalents - Investments 533,826 24,394 558,220
Total 1,805,291$ 82,495$ 1,887,786$
Reconciliation of operating loss to net cashused in operating activities:Operating loss (40,762)$ (11,248)$ (52,010)$ Adjustments to reconcile operating loss to
net cash used in operating activities:Depreciation - 9,642 9,642 Loss on disposal of assets - 1,607 1,607 Change in assets and liabilities:
Decrease (increase) in accounts receivable 23,534 64 23,598 Increase (decrease) in accounts payable (116,691) (36,567) (153,258)
Total adjustments (93,157) (25,254) (118,411)
Net cash used in operating activities (133,919)$ (36,502)$ (170,421)$
For the Year Ended June 30, 2012
CITY OF WINCHESTER, VIRGINIACOMBINING STATEMENT OF CASH FLOWS
DISCRETELY PRESENTED COMPONENT UNIT - SCHOOL BOARDINTERNAL SERVICE FUNDS
88
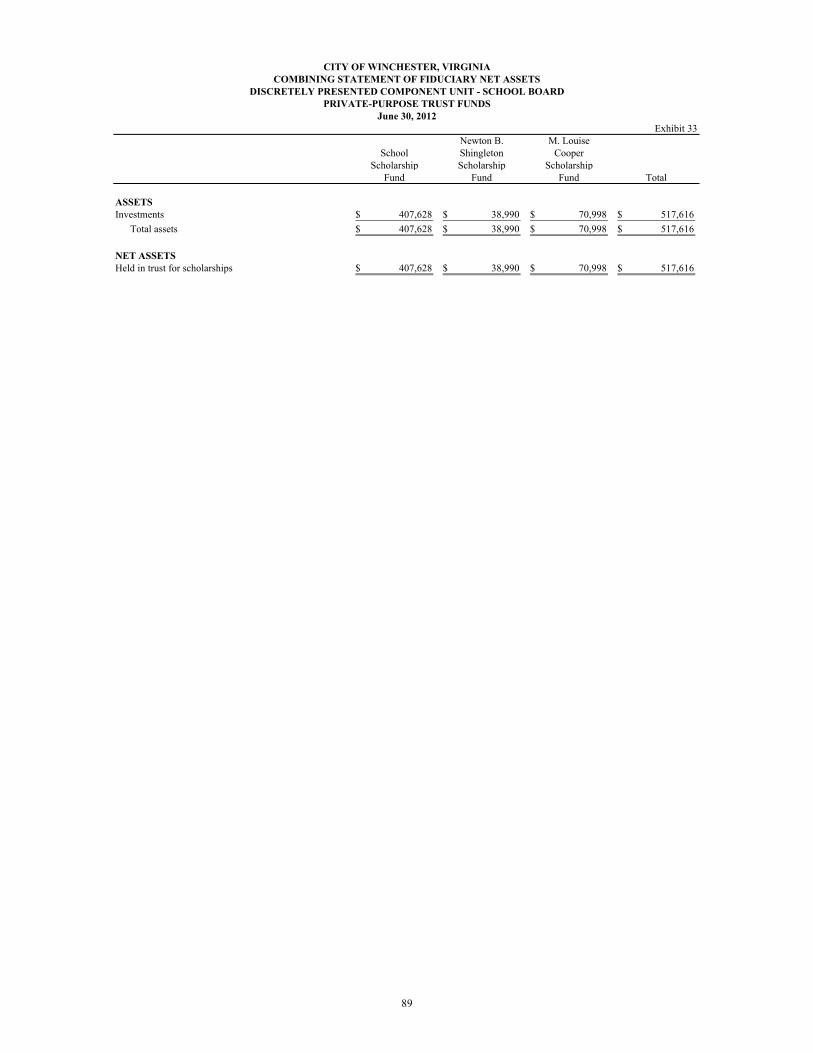
CITY OF WINCHESTER, VIRGINIACOMBINING STATEMENT OF FIDUCIARY NET ASSETS
DISCRETELY PRESENTED COMPONENT UNIT - SCHOOL BOARDPRIVATE-PURPOSE TRUST FUNDS
June 30, 2012Exhibit 33
Newton B. M. LouiseSchool Shingleton Cooper
Scholarship Scholarship Scholarship Fund Fund Fund Total
ASSETSInvestments 407,628$ 38,990$ 70,998$ 517,616$
Total assets 407,628$ 38,990$ 70,998$ 517,616$
NET ASSETSHeld in trust for scholarships 407,628$ 38,990$ 70,998$ 517,616$
89

CITY OF WINCHESTER, VIRGINIACOMBINING STATEMENT OF CHANGES IN FIDUCIARY NET ASSETS
DISCRETELY PRESENTED COMPONENT UNIT - SCHOOL BOARDPRIVATE-PURPOSE TRUST FUNDS
For the Year Ended June 30, 2012 Exhibit 34
Newton B. M. LouiseSchool Shingleton Cooper
Scholarship Scholarship Scholarship Fund Fund Fund Total
ADDITIONSGifts and contributions 37,425$ 3,800$ 35,077$ 76,302$ Investment earnings:
Interest 39 - 109 148 Dividends 14,679 537 - 15,216 Net change in fair value of investments (2,551) 1,239 - (1,312)
Total additions 49,592 5,576 35,186 90,354
DEDUCTIONSAdministrative expenses 5,092 718 - 5,810 Scholarships awarded 44,258 9,800 36,000 90,058
Total deductions 49,350 10,518 36,000 95,868
Change in net assets 242 (4,942) (814) (5,514)
Net assets - beginning 407,386 43,932 71,812 523,130
Net assets - ending 407,628$ 38,990$ 70,998$ 517,616$
90
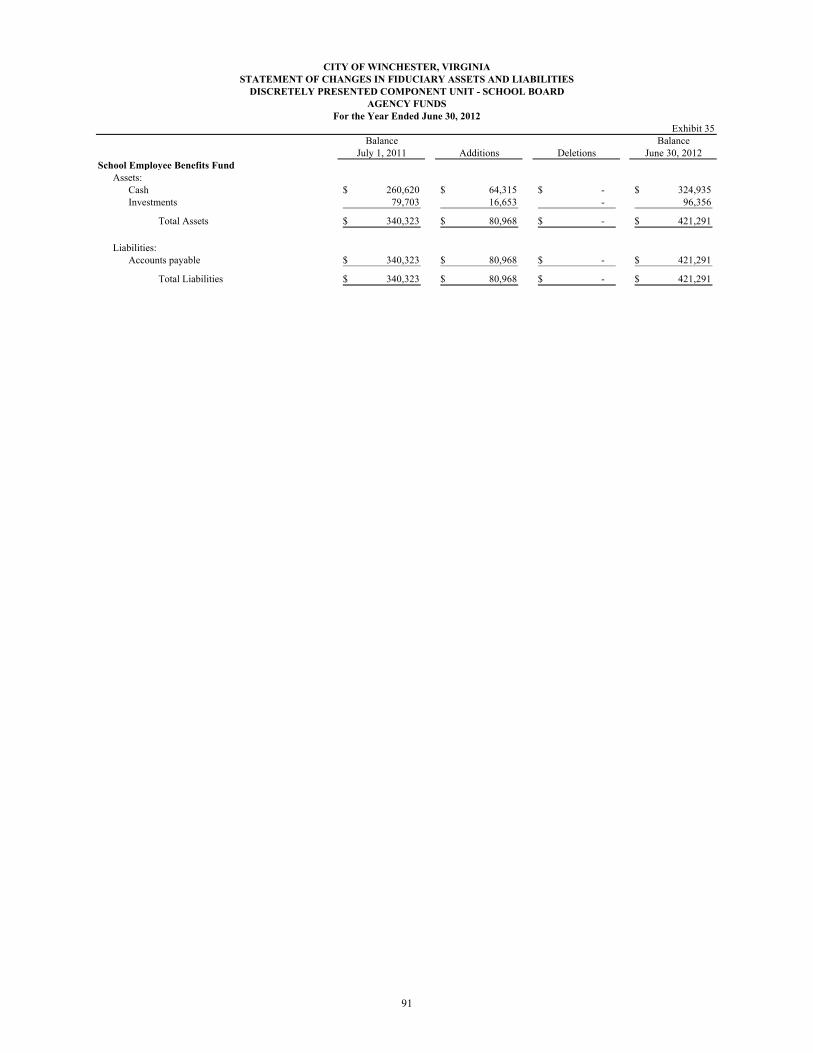
CITY OF WINCHESTER, VIRGINIASTATEMENT OF CHANGES IN FIDUCIARY ASSETS AND LIABILITIES
DISCRETELY PRESENTED COMPONENT UNIT - SCHOOL BOARDAGENCY FUNDS
For the Year Ended June 30, 2012Exhibit 35
Balance BalanceJuly 1, 2011 Additions Deletions June 30, 2012
School Employee Benefits FundAssets:
Cash 260,620$ 64,315$ -$ 324,935$ Investments 79,703 16,653 - 96,356
Total Assets 340,323$ 80,968$ -$ 421,291$
Liabilities:Accounts payable 340,323$ 80,968$ -$ 421,291$
Total Liabilities 340,323$ 80,968$ -$ 421,291$
91

THIS PAGE IS INTENTIONALLY LEFT BLANK.
92
DISCRETELY PRESENTED COMPONENT UNIT – PARKING AUTHORITY
ENTERPRISE FUND
Parking Authority Fund – to account for the provision of parking facilities to City residents and visitors through City-owned parking lots and garages and metered on-street parking. All activities necessary to provide such services are included in the fund, including, but not limited to, administration, operations, maintenance, financing and related debt service, and billing and collection.

CITY OF WINCHESTER, VIRGINIASTATEMENT OF NET ASSETS
DISCRETELY PRESENTED COMPONENT UNIT - WINCHESTER PARKING AUTHORITYENTERPRISE FUND
June 30, 2012Exhibit 36
Parking Authority Fund
ASSETSCurrent assets:
Cash 357,993$ Investments 148,125Accounts receivable, net 4,565
Total current assets 510,683
Noncurrent assets:Deferred charges 174,400
Capital assets:Nondepreciable 11,685 Depreciable, net 8,808,783
Total capital assets, net 8,820,468
Total noncurrent assets 8,994,868
Total assets 9,505,551
Current liabilities:Accounts payable 4,684Accrued payroll 12,620Accrued interest payable 173,329Revenue bonds payable 180,760
Total current liabilities 371,393
Noncurrent liabilities:Compensated absences 39,186Revenue bonds payable 8,469,308
Total noncurrent liabilities 8,508,494
Total liabilities 8,879,887
LIABILITIES
Invested in capital assets, net of related debt 344,800 Unrestricted 280,864
Total net assets 625,664$
NET ASSETS
93

Exhibit 37Parking
AuthorityFund
OPERATING REVENUESCharges for services 912,755$ Miscellaneous 4,099
Total operating revenues 916,854
OPERATING EXPENSESPersonal services 352,086Contractual services 48,636Other supplies and expenses 133,260Depreciation 251,867
Total operating expenses 785,849
Operating income 131,005
NONOPERATING REVENUES (EXPENSES)Investment earnings 3,244Interest and fiscal charges (414,064)
Total nonoperating revenues (expenses) (410,820)
Change in net assets (279,815)
Total net assets - beginning 905,479
Total net assets - ending 625,664$
CITY OF WINCHESTER, VIRGINIASTATEMENT OF REVENUES, EXPENSES, AND CHANGES IN FUND NET ASSETS
DISCRETELY PRESENTED COMPONENT UNIT - WINCHESTER PARKING AUTHORITYENTERPRISE FUND
For the Year Ended June 30, 2012
94

Exhibit 38Parking
AuthorityFund
CASH FLOWS FROM OPERATING ACTIVITIESCash received from customers and users 915,986$ Cash paid to suppliers (216,748) Cash paid to employees (344,592)
Net cash provided by operatingactivities 354,646
CASH FLOWS FROM CAPITAL AND RELATEDFINANCING ACTIVITIESAcquisition and construction of capital assets (406,064) Principal paid on capital debt (160,000) Interest paid on capital debt (421,898)
Net cash used by capitaland related financing activities (987,962)
CASH FLOWS FROM INVESTING ACTIVITIESInvestment income 3,244
Net cash provided by investingactivities 3,244
Net decrease in cash and cash equivalents (630,072)
Cash and cash equivalents - beginning of year 1,136,190
Cash and cash equivalents - end of year 506,118$
Cash and cash equivalents at end of year is comprisedof the following:
Cash 357,993$ Cash equivalents - Investments 148,125
Total 506,118$
Reconciliation of operating income to net cashprovided by operating activities:Operating income 131,005$ Adjustments to reconcile operating income to
net cash provided by operating activities:Depreciation 251,867 Change in assets and liabilities:
Decrease (increase) in accounts receivable (869) Increase (decrease) in accounts payable (34,851) Increase (decrease) in accrued payroll (132) Increase (decrease) in compensated absences 7,626
Total adjustments 223,641
Net cash provided by operating activities 354,646$
For the Year Ended June 30, 2012
CITY OF WINCHESTER, VIRGINIASTATEMENT OF CASH FLOWS
DISCRETELY PRESENTED COMPONENT UNIT - WINCHESTER PARKING AUTHORITYENTERPRISE FUND
95

SUPPLEMENTAL DATA.

THIS PAGE IS INTENTIONALLY LEFT BLANK.
96
STATISTICAL SECTION
This part of the City of Winchester’s comprehensive annual financial report presents detailed information as a context
for understanding what the information in the financial statements, note disclosures, and required supplementary
information says about the government’s overall financial health.
Contents Pages
Financial Trends – Tables 1 – 4 These schedules contain trend information to help the reader understand how the government’s financial performance and well-being have changed over time. ....................................... 97-103
Revenue Capacity – Tables 5 – 8 These schedules contain information to help the reader assess the government’s most significant local revenue source, the property tax. ........................................................................ 104-107
Debt Capacity – Tables 9 – 13 These schedules contain trend information to help the reader assess the affordabilityof the government’s current levels of outstanding debt and the government’s ability to issue additional debt in the future....................................................................................................... 108-112
Demographic and Economic Information – Tables 14 – 15These schedules offer demographic and economic indicators to help the reader understand the environment within which the government’s financial activities take place ................. 113-114
Operating Information – Tables 16 – 18 These schedules contain service and infrastructure data to help the reader understandhow the information in the government’s financial report relates to the servicesthe government provides and activities it performs................................................................................ 115-117
Sources: Unless otherwise noted, the information in these schedules is derived from the Comprehensive Annual Financial Reports for the relevant year.

THIS PAGE IS INTENTIONALLY LEFT BLANK.

Table 1
2003 2004 2005 2006 2007 2008 2009(1) 2010 (1) 2011 2012
Governmental activitiesInvested in capital assets, net of related debt 7,748,390$ 23,709,296$ 27,530,372$ 31,894,578$ 35,925,618$ 42,291,055$ 44,602,441$ 62,512,145$ 62,402,348$ 61,206,102$ Restricted - - - 217,166 102,003 49,876 - - - Unrestricted 15,373,006 (2,745,524) (16,610,067) (41,078,838) (53,683,445) (58,705,920) (59,010,599) (58,030,587) (50,945,522) (43,717,783)
Total governmental activities net assets 23,121,396$ 20,963,772$ 10,920,305$ (9,184,260)$ (17,540,661)$ (16,312,862)$ (14,358,282)$ 4,481,558$ 11,456,826$ 17,488,319$
Business-type activitiesInvested in capital assets, net of related debt 27,093,874$ 28,384,032$ 30,128,483$ 32,310,319$ 32,018,014$ 35,012,184$ 36,807,871$ 44,278,901$ 43,480,262$ 48,176,844$ Restricted - - 2,000 2,000 2,000 2,000 - - - Unrestricted 4,411,056 4,182,606 7,464,431 3,904,997 6,531,712 3,555,389 5,579,913 380,107 917,995 (443,640)
Total business-type activities net assets 31,504,930$ 32,566,638$ 37,592,914$ 36,217,316$ 38,551,726$ 38,569,573$ 42,389,784$ 44,659,008$ 44,398,257$ 47,733,204$
Primary governmentInvested in capital assets, net of related debt 34,842,264$ 52,093,328$ 57,658,855$ 64,204,897$ 67,943,632$ 77,303,239$ 81,410,312$ 106,791,046$ 105,882,610$ 109,382,946$ Restricted - - 2,000 219,166 104,003 51,876 - - - Unrestricted 19,784,062 1,437,082 (9,145,636) (37,173,841) (47,151,733) (55,150,531) (53,430,686) (57,650,480) (50,027,527) (44,161,423)
Total primary government net assets 54,626,326$ 53,530,410$ 48,513,219$ 27,033,056$ 21,011,065$ 22,256,711$ 28,031,502$ 49,140,566$ 55,855,083$ 65,221,523$
School Board Component UnitInvested in capital assets, net of related debt 18,574,602$ 22,990,095$ 42,682,558$ 70,713,467$ 88,843,037$ 104,213,868$ 112,430,425$ 116,460,222$ 114,692,709$ 113,054,855$ Restricted 1,517,504 2,626,304 - - 2,096,290 3,731,987 1,767,727 - - - Unrestricted 3,292,060 2,802,246 4,965,488 10,815,973 16,779,217 8,553,970 2,173,262 3,881,107 5,791,479 5,907,579
Total governmental activities net assets 23,384,166$ 28,418,645$ 47,648,046$ 81,529,440$ 107,718,544$ 116,499,825$ 116,371,414$ 120,341,329$ 120,484,188$ 118,962,434$
Notes:(1) These totals are as previously reported. A prior period adjustment was required in 2010 and 2011 which modified these amounts.
CITY OF WINCHESTER, VIRGINIANET ASSETS BY COMPONENT
Last Ten Fiscal Years (accrual basis of accounting)
97

THIS PAGE IS INTENTIONALLY LEFT BLANK.
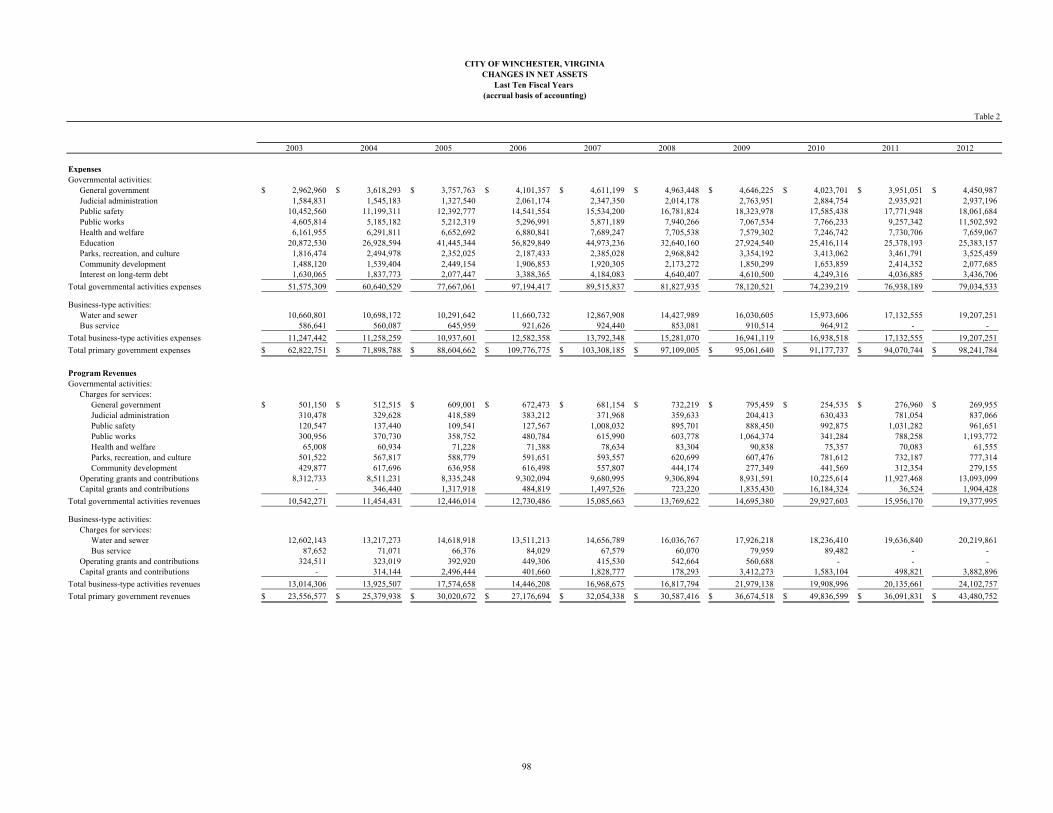
Table 2
2003 2004 2005 2006 2007 2008 2009 2010 2011 2012
ExpensesGovernmental activities:
General government 2,962,960$ 3,618,293$ 3,757,763$ 4,101,357$ 4,611,199$ 4,963,448$ 4,646,225$ 4,023,701$ 3,951,051$ 4,450,987$ Judicial administration 1,584,831 1,545,183 1,327,540 2,061,174 2,347,350 2,014,178 2,763,951 2,884,754 2,935,921 2,937,196 Public safety 10,452,560 11,199,311 12,392,777 14,541,554 15,534,200 16,781,824 18,323,978 17,585,438 17,771,948 18,061,684 Public works 4,605,814 5,185,182 5,212,319 5,296,991 5,871,189 7,940,266 7,067,534 7,766,233 9,257,342 11,502,592 Health and welfare 6,161,955 6,291,811 6,652,692 6,880,841 7,689,247 7,705,538 7,579,302 7,246,742 7,730,706 7,659,067 Education 20,872,530 26,928,594 41,445,344 56,829,849 44,973,236 32,640,160 27,924,540 25,416,114 25,378,193 25,383,157 Parks, recreation, and culture 1,816,474 2,494,978 2,352,025 2,187,433 2,385,028 2,968,842 3,354,192 3,413,062 3,461,791 3,525,459 Community development 1,488,120 1,539,404 2,449,154 1,906,853 1,920,305 2,173,272 1,850,299 1,653,859 2,414,352 2,077,685 Interest on long-term debt 1,630,065 1,837,773 2,077,447 3,388,365 4,184,083 4,640,407 4,610,500 4,249,316 4,036,885 3,436,706
Total governmental activities expenses 51,575,309 60,640,529 77,667,061 97,194,417 89,515,837 81,827,935 78,120,521 74,239,219 76,938,189 79,034,533
Business-type activities:Water and sewer 10,660,801 10,698,172 10,291,642 11,660,732 12,867,908 14,427,989 16,030,605 15,973,606 17,132,555 19,207,251 Bus service 586,641 560,087 645,959 921,626 924,440 853,081 910,514 964,912 - -
Total business-type activities expenses 11,247,442 11,258,259 10,937,601 12,582,358 13,792,348 15,281,070 16,941,119 16,938,518 17,132,555 19,207,251
Total primary government expenses 62,822,751$ 71,898,788$ 88,604,662$ 109,776,775$ 103,308,185$ 97,109,005$ 95,061,640$ 91,177,737$ 94,070,744$ 98,241,784$
Program RevenuesGovernmental activities:
Charges for services:General government 501,150$ 512,515$ 609,001$ 672,473$ 681,154$ 732,219$ 795,459$ 254,535$ 276,960$ 269,955$ Judicial administration 310,478 329,628 418,589 383,212 371,968 359,633 204,413 630,433 781,054 837,066 Public safety 120,547 137,440 109,541 127,567 1,008,032 895,701 888,450 992,875 1,031,282 961,651 Public works 300,956 370,730 358,752 480,784 615,990 603,778 1,064,374 341,284 788,258 1,193,772 Health and welfare 65,008 60,934 71,228 71,388 78,634 83,304 90,838 75,357 70,083 61,555 Parks, recreation, and culture 501,522 567,817 588,779 591,651 593,557 620,699 607,476 781,612 732,187 777,314 Community development 429,877 617,696 636,958 616,498 557,807 444,174 277,349 441,569 312,354 279,155
Operating grants and contributions 8,312,733 8,511,231 8,335,248 9,302,094 9,680,995 9,306,894 8,931,591 10,225,614 11,927,468 13,093,099 Capital grants and contributions - 346,440 1,317,918 484,819 1,497,526 723,220 1,835,430 16,184,324 36,524 1,904,428
Total governmental activities revenues 10,542,271 11,454,431 12,446,014 12,730,486 15,085,663 13,769,622 14,695,380 29,927,603 15,956,170 19,377,995
Business-type activities:Charges for services:
Water and sewer 12,602,143 13,217,273 14,618,918 13,511,213 14,656,789 16,036,767 17,926,218 18,236,410 19,636,840 20,219,861 Bus service 87,652 71,071 66,376 84,029 67,579 60,070 79,959 89,482 - -
Operating grants and contributions 324,511 323,019 392,920 449,306 415,530 542,664 560,688 - - - Capital grants and contributions - 314,144 2,496,444 401,660 1,828,777 178,293 3,412,273 1,583,104 498,821 3,882,896
Total business-type activities revenues 13,014,306 13,925,507 17,574,658 14,446,208 16,968,675 16,817,794 21,979,138 19,908,996 20,135,661 24,102,757
Total primary government revenues 23,556,577$ 25,379,938$ 30,020,672$ 27,176,694$ 32,054,338$ 30,587,416$ 36,674,518$ 49,836,599$ 36,091,831$ 43,480,752$
CITY OF WINCHESTER, VIRGINIACHANGES IN NET ASSETS
Last Ten Fiscal Years (accrual basis of accounting)
98
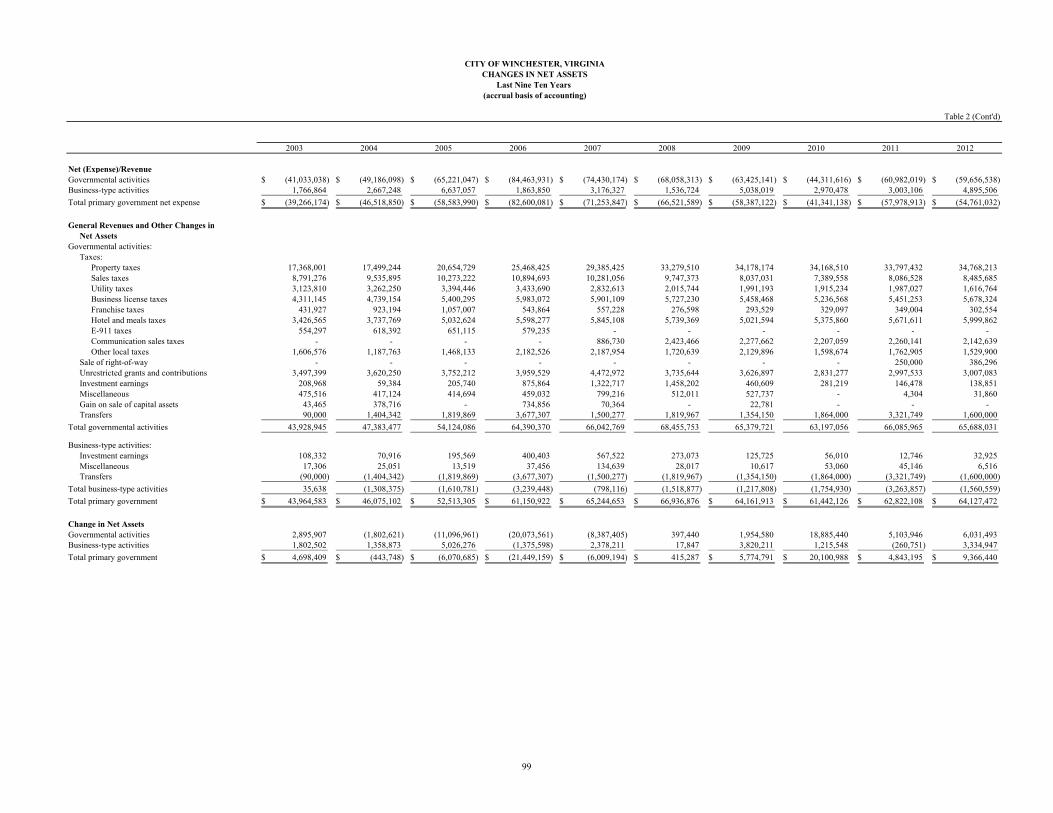
Table 2 (Cont'd)
2003 2004 2005 2006 2007 2008 2009 2010 2011 2012
Net (Expense)/RevenueGovernmental activities (41,033,038)$ (49,186,098)$ (65,221,047)$ (84,463,931)$ (74,430,174)$ (68,058,313)$ (63,425,141)$ (44,311,616)$ (60,982,019)$ (59,656,538)$ Business-type activities 1,766,864 2,667,248 6,637,057 1,863,850 3,176,327 1,536,724 5,038,019 2,970,478 3,003,106 4,895,506
Total primary government net expense (39,266,174)$ (46,518,850)$ (58,583,990)$ (82,600,081)$ (71,253,847)$ (66,521,589)$ (58,387,122)$ (41,341,138)$ (57,978,913)$ (54,761,032)$
General Revenues and Other Changes inNet Assets
Governmental activities:Taxes:
Property taxes 17,368,001 17,499,244 20,654,729 25,468,425 29,385,425 33,279,510 34,178,174 34,168,510 33,797,432 34,768,213 Sales taxes 8,791,276 9,535,895 10,273,222 10,894,693 10,281,056 9,747,373 8,037,031 7,389,558 8,086,528 8,485,685 Utility taxes 3,123,810 3,262,250 3,394,446 3,433,690 2,832,613 2,015,744 1,991,193 1,915,234 1,987,027 1,616,764 Business license taxes 4,311,145 4,739,154 5,400,295 5,983,072 5,901,109 5,727,230 5,458,468 5,236,568 5,451,253 5,678,324 Franchise taxes 431,927 923,194 1,057,007 543,864 557,228 276,598 293,529 329,097 349,004 302,554 Hotel and meals taxes 3,426,565 3,737,769 5,032,624 5,598,277 5,845,108 5,739,369 5,021,594 5,375,860 5,671,611 5,999,862 E-911 taxes 554,297 618,392 651,115 579,235 - - - - - - Communication sales taxes - - - - 886,730 2,423,466 2,277,662 2,207,059 2,260,141 2,142,639 Other local taxes 1,606,576 1,187,763 1,468,133 2,182,526 2,187,954 1,720,639 2,129,896 1,598,674 1,762,905 1,529,900
Sale of right-of-way - - - - - - - - 250,000 386,296 Unrestricted grants and contributions 3,497,399 3,620,250 3,752,212 3,959,529 4,472,972 3,735,644 3,626,897 2,831,277 2,997,533 3,007,083 Investment earnings 208,968 59,384 205,740 875,864 1,322,717 1,458,202 460,609 281,219 146,478 138,851 Miscellaneous 475,516 417,124 414,694 459,032 799,216 512,011 527,737 - 4,304 31,860 Gain on sale of capital assets 43,465 378,716 - 734,856 70,364 - 22,781 - - - Transfers 90,000 1,404,342 1,819,869 3,677,307 1,500,277 1,819,967 1,354,150 1,864,000 3,321,749 1,600,000
Total governmental activities 43,928,945 47,383,477 54,124,086 64,390,370 66,042,769 68,455,753 65,379,721 63,197,056 66,085,965 65,688,031
Business-type activities:Investment earnings 108,332 70,916 195,569 400,403 567,522 273,073 125,725 56,010 12,746 32,925 Miscellaneous 17,306 25,051 13,519 37,456 134,639 28,017 10,617 53,060 45,146 6,516 Transfers (90,000) (1,404,342) (1,819,869) (3,677,307) (1,500,277) (1,819,967) (1,354,150) (1,864,000) (3,321,749) (1,600,000)
Total business-type activities 35,638 (1,308,375) (1,610,781) (3,239,448) (798,116) (1,518,877) (1,217,808) (1,754,930) (3,263,857) (1,560,559)
Total primary government 43,964,583$ 46,075,102$ 52,513,305$ 61,150,922$ 65,244,653$ 66,936,876$ 64,161,913$ 61,442,126$ 62,822,108$ 64,127,472$
Change in Net AssetsGovernmental activities 2,895,907 (1,802,621) (11,096,961) (20,073,561) (8,387,405) 397,440 1,954,580 18,885,440 5,103,946 6,031,493 Business-type activities 1,802,502 1,358,873 5,026,276 (1,375,598) 2,378,211 17,847 3,820,211 1,215,548 (260,751) 3,334,947
Total primary government 4,698,409$ (443,748)$ (6,070,685)$ (21,449,159)$ (6,009,194)$ 415,287$ 5,774,791$ 20,100,988$ 4,843,195$ 9,366,440$
CITY OF WINCHESTER, VIRGINIACHANGES IN NET ASSETS
Last Nine Ten Years (accrual basis of accounting)
99
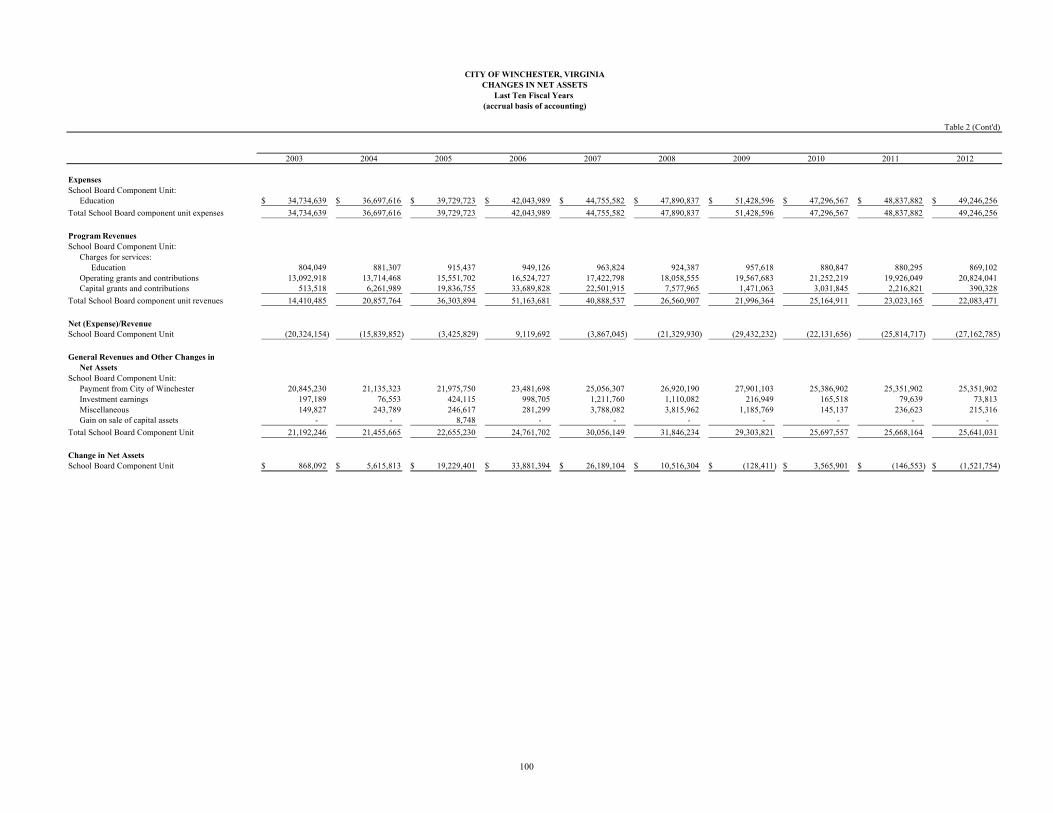
Table 2 (Cont'd)
2003 2004 2005 2006 2007 2008 2009 2010 2011 2012
ExpensesSchool Board Component Unit:
Education 34,734,639$ 36,697,616$ 39,729,723$ 42,043,989$ 44,755,582$ 47,890,837$ 51,428,596$ 47,296,567$ 48,837,882$ 49,246,256$
Total School Board component unit expenses 34,734,639 36,697,616 39,729,723 42,043,989 44,755,582 47,890,837 51,428,596 47,296,567 48,837,882 49,246,256
Program RevenuesSchool Board Component Unit:
Charges for services:Education 804,049 881,307 915,437 949,126 963,824 924,387 957,618 880,847 880,295 869,102
Operating grants and contributions 13,092,918 13,714,468 15,551,702 16,524,727 17,422,798 18,058,555 19,567,683 21,252,219 19,926,049 20,824,041 Capital grants and contributions 513,518 6,261,989 19,836,755 33,689,828 22,501,915 7,577,965 1,471,063 3,031,845 2,216,821 390,328
Total School Board component unit revenues 14,410,485 20,857,764 36,303,894 51,163,681 40,888,537 26,560,907 21,996,364 25,164,911 23,023,165 22,083,471
Net (Expense)/RevenueSchool Board Component Unit (20,324,154) (15,839,852) (3,425,829) 9,119,692 (3,867,045) (21,329,930) (29,432,232) (22,131,656) (25,814,717) (27,162,785)
General Revenues and Other Changes inNet Assets
School Board Component Unit:Payment from City of Winchester 20,845,230 21,135,323 21,975,750 23,481,698 25,056,307 26,920,190 27,901,103 25,386,902 25,351,902 25,351,902 Investment earnings 197,189 76,553 424,115 998,705 1,211,760 1,110,082 216,949 165,518 79,639 73,813 Miscellaneous 149,827 243,789 246,617 281,299 3,788,082 3,815,962 1,185,769 145,137 236,623 215,316 Gain on sale of capital assets - - 8,748 - - - - - - -
Total School Board Component Unit 21,192,246 21,455,665 22,655,230 24,761,702 30,056,149 31,846,234 29,303,821 25,697,557 25,668,164 25,641,031
Change in Net AssetsSchool Board Component Unit 868,092$ 5,615,813$ 19,229,401$ 33,881,394$ 26,189,104$ 10,516,304$ (128,411)$ 3,565,901$ (146,553)$ (1,521,754)$
CHANGES IN NET ASSETSLast Ten Fiscal Years
(accrual basis of accounting)
CITY OF WINCHESTER, VIRGINIA
100
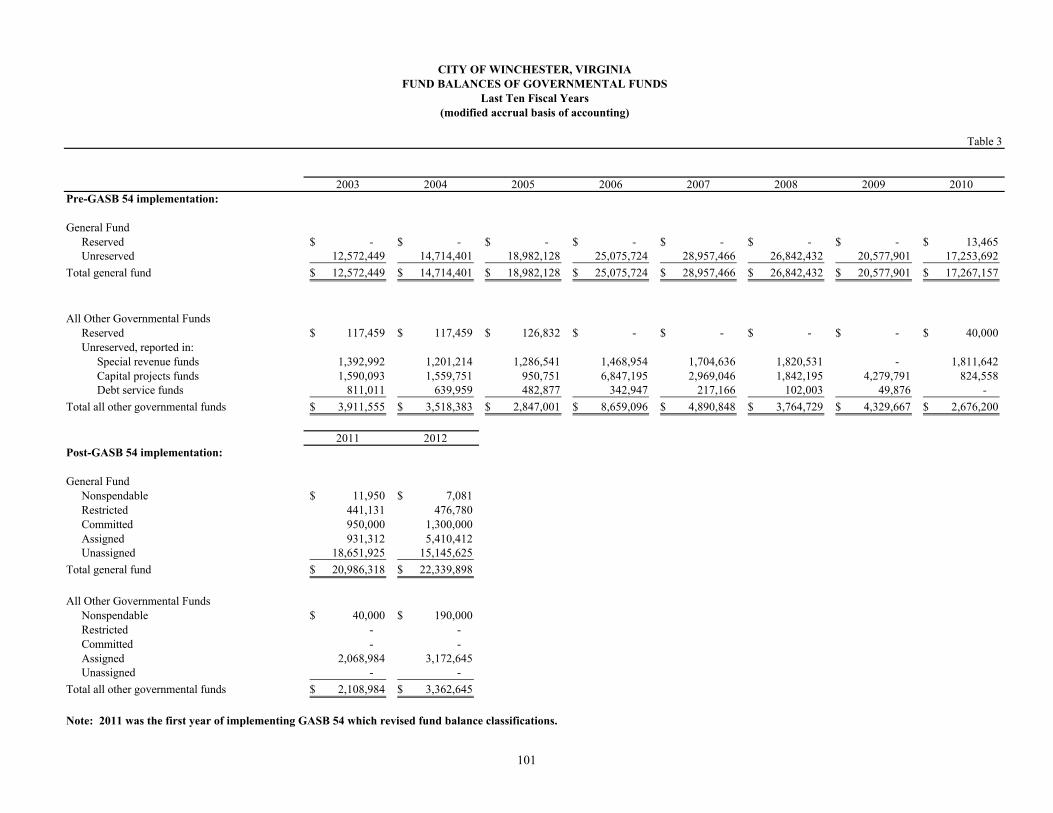
Table 3
2003 2004 2005 2006 2007 2008 2009 2010Pre-GASB 54 implementation:
General FundReserved -$ -$ -$ -$ -$ -$ -$ 13,465$ Unreserved 12,572,449 14,714,401 18,982,128 25,075,724 28,957,466 26,842,432 20,577,901 17,253,692
Total general fund 12,572,449$ 14,714,401$ 18,982,128$ 25,075,724$ 28,957,466$ 26,842,432$ 20,577,901$ 17,267,157$
All Other Governmental FundsReserved 117,459$ 117,459$ 126,832$ -$ -$ -$ -$ 40,000$ Unreserved, reported in:
Special revenue funds 1,392,992 1,201,214 1,286,541 1,468,954 1,704,636 1,820,531 - 1,811,642 Capital projects funds 1,590,093 1,559,751 950,751 6,847,195 2,969,046 1,842,195 4,279,791 824,558 Debt service funds 811,011 639,959 482,877 342,947 217,166 102,003 49,876 -
Total all other governmental funds 3,911,555$ 3,518,383$ 2,847,001$ 8,659,096$ 4,890,848$ 3,764,729$ 4,329,667$ 2,676,200$
2011 2012Post-GASB 54 implementation:
General FundNonspendable 11,950$ 7,081$ Restricted 441,131 476,780 Committed 950,000 1,300,000 Assigned 931,312 5,410,412 Unassigned 18,651,925 15,145,625
Total general fund 20,986,318$ 22,339,898$
All Other Governmental FundsNonspendable 40,000$ 190,000$ Restricted - - Committed - - Assigned 2,068,984 3,172,645 Unassigned - -
Total all other governmental funds 2,108,984$ 3,362,645$
Note: 2011 was the first year of implementing GASB 54 which revised fund balance classifications.
CITY OF WINCHESTER, VIRGINIAFUND BALANCES OF GOVERNMENTAL FUNDS
Last Ten Fiscal Years(modified accrual basis of accounting)
101

Table 4
2003 2004 2005 2006 2007 2008 2009 2010 2011 2012
Revenues
General property taxes 17,174,708$ 17,904,992$ 20,502,718$ 25,041,195$ 29,701,648$ 33,045,144$ 33,704,350$ 33,821,252$ 33,942,158$ 34,607,227$ Sales taxes 8,791,276 9,535,895 10,273,222 10,894,693 10,281,056 9,747,373 8,037,031 7,389,558 8,086,528 8,485,685 Other local taxes 13,454,320 14,468,522 17,003,620 18,320,664 18,210,742 17,903,046 17,172,342 16,662,492 17,481,942 17,270,042
433,236 621,027 639,874 619,646 560,761 450,188 285,131 392,290 292,644 252,950 Fines and forfeitures 171,173 185,477 274,987 221,123 203,206 171,521 159,077 147,721 221,715 274,147 Revenues from use of money and property 208,570 86,646 226,866 897,306 1,357,831 1,504,587 529,863 439,521 315,006 292,403 Charges for services 732,614 827,070 834,354 843,209 1,420,091 1,698,424 1,760,787 1,706,059 1,846,033 1,963,310 Miscellaneous 387,757 382,337 391,358 436,721 763,945 465,622 444,901 453,621 764,927 1,157,315 Recovered costs 670,731 647,694 650,470 776,667 903,114 887,583 1,454,804 979,769 1,045,223 930,667 Intergovernmental 11,810,132 12,477,171 12,575,431 13,646,660 13,697,391 13,849,118 14,393,918 14,754,690 14,737,288 17,742,776
Total revenues 53,834,517 57,136,831 63,372,900 71,697,884 77,099,785 79,722,606 77,942,204 76,746,973 78,733,464 82,976,522
Expenditures
General government administration 2,566,622 3,201,756 3,140,752 3,445,735 3,907,048 4,420,565 3,999,143 3,803,786 3,690,586 4,304,202 Judicial administration 1,511,492 1,609,089 1,661,817 1,929,431 2,266,027 2,537,903 2,574,148 2,690,827 2,768,905 2,838,387 Public safety 10,387,188 11,041,207 12,505,214 14,851,908 15,745,426 16,592,044 17,907,345 16,963,980 17,471,623 18,028,989 Public works 5,139,949 5,878,314 5,645,313 6,994,174 7,592,466 9,579,042 8,611,361 10,526,541 6,958,722 9,708,681 Health and welfare 6,168,712 6,270,468 6,678,900 6,852,789 7,675,658 7,728,686 7,542,126 7,205,135 7,727,186 7,697,084 Education (1) 20,872,530 26,928,594 41,445,344 56,829,849 44,973,236 32,640,160 27,924,540 25,416,114 25,378,193 25,383,157 Parks, recreation, and culture 1,974,719 2,239,955 2,125,648 2,702,534 2,941,953 3,898,630 3,716,933 3,877,809 3,117,656 3,364,141 Community development 1,490,323 1,560,657 2,456,570 1,922,337 1,897,862 2,247,515 1,757,737 1,574,376 2,332,049 2,109,601
Permits, privilege fees, and regulatory licenses
CITY OF WINCHESTER, VIRGINIACHANGES IN FUND BALANCES OF GOVERNMENTAL FUNDS
Last Ten Fiscal Years(modified accrual basis of accounting)
Community development 1,490,323 1,560,657 2,456,570 1,922,337 1,897,862 2,247,515 1,757,737 1,574,376 2,332,049 2,109,601 Capital projects 1,826,167 583,013 744,593 1,004,599 2,866,617 2,466,646 2,027,584 - - - Debt service:
Principal retirement 2,837,627 3,101,293 3,511,299 4,290,832 4,860,328 5,702,316 5,544,227 5,829,665 5,760,991 5,519,489 Interest and fiscal charges 1,620,693 1,669,686 1,763,091 3,048,509 4,136,444 4,592,251 4,690,387 4,343,895 4,132,168 3,435,326 Bond issuance costs 27,542 105,029 297,686 260,168 142,965 98,552 - - - 235,527 Advance refunding escrow 88,892 - 129,378 - - - - - - -
Total expenditures 56,512,456 64,189,061 82,105,605 104,132,865 99,006,030 92,504,310 86,295,531 82,232,128 79,338,079 82,624,584
Excess of revenues over (under)expenditures (2,677,939) (7,052,230) (18,732,705) (32,434,981) (21,906,245) (12,781,704) (8,353,327) (5,485,155) (604,615) 351,938
102
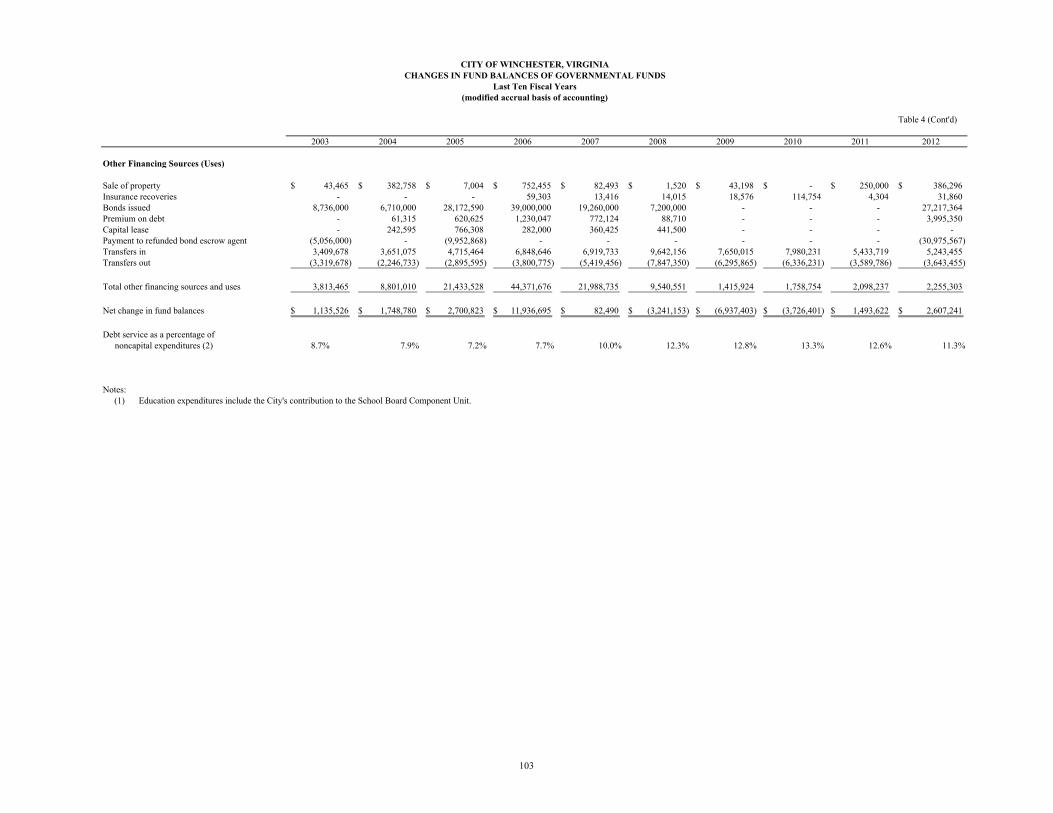
Table 4 (Cont'd)
2003 2004 2005 2006 2007 2008 2009 2010 2011 2012
Other Financing Sources (Uses)
Sale of property 43,465$ 382,758$ 7,004$ 752,455$ 82,493$ 1,520$ 43,198$ -$ 250,000$ 386,296$ Insurance recoveries - - - 59,303 13,416 14,015 18,576 114,754 4,304 31,860 Bonds issued 8,736,000 6,710,000 28,172,590 39,000,000 19,260,000 7,200,000 - - - 27,217,364 Premium on debt - 61,315 620,625 1,230,047 772,124 88,710 - - - 3,995,350 Capital lease - 242,595 766,308 282,000 360,425 441,500 - - - - Payment to refunded bond escrow agent (5,056,000) - (9,952,868) - - - - - - (30,975,567) Transfers in 3,409,678 3,651,075 4,715,464 6,848,646 6,919,733 9,642,156 7,650,015 7,980,231 5,433,719 5,243,455 Transfers out (3,319,678) (2,246,733) (2,895,595) (3,800,775) (5,419,456) (7,847,350) (6,295,865) (6,336,231) (3,589,786) (3,643,455)
Total other financing sources and uses 3,813,465 8,801,010 21,433,528 44,371,676 21,988,735 9,540,551 1,415,924 1,758,754 2,098,237 2,255,303
Net change in fund balances 1,135,526$ 1,748,780$ 2,700,823$ 11,936,695$ 82,490$ (3,241,153)$ (6,937,403)$ (3,726,401)$ 1,493,622$ 2,607,241$
Debt service as a percentage ofnoncapital expenditures (2) 8.7% 7.9% 7.2% 7.7% 10.0% 12.3% 12.8% 13.3% 12.6% 11.3%
Notes:(1) Education expenditures include the City's contribution to the School Board Component Unit.
CHANGES IN FUND BALANCES OF GOVERNMENTAL FUNDSLast Ten Fiscal Years
(modified accrual basis of accounting)
CITY OF WINCHESTER, VIRGINIA
103

CITY OF WINCHESTER, VIRGINIAASSESSED VALUE AND ACTUAL VALUE OF TAXABLE PROPERTY
Last Ten Fiscal Years
Table 5
Real Property (1)(3) Personal Property (1)Motor Total Taxable Total
Fiscal Tax Rate Public Tax Rate Vehicles Tax Rate Public Tax Rate Machinery Tax Rate Mobile Tax Rate Assessed DirectYear Residential Commercial per $100 Service per $100 and Tangibles per $100 Service per $100 & Tools per $100 Homes per $100 Value Tax Rate
2002 856,043,311 600,065,600 0.72 54,035,828 0.72 153,944,372 3.5 34,190 3.5 131,402,338 1.2 174,602 0.65 1,795,700,241 0.992003 (2) 1,118,428,884 732,552,900 0.58 52,338,544 0.72 153,763,064 3.5 19,014 3.5 135,636,858 1.2 225,300 0.72 2,192,964,564 0.832004 1,168,629,389 744,643,100 0.63 59,448,513 0.58 157,769,037 3.5 10,558 3.5 116,302,067 1.2 242,600 0.63 2,247,045,264 0.862005 (2) 1,547,000,230 846,685,200 0.63 52,812,984 0.63 163,876,921 3.5 33,411 3.5 114,813,086 1.3 236,400 0.63 2,725,458,232 0.832006 1,611,591,819 873,266,900 0.69 64,545,448 0.63 174,036,126 4.5 - 4.5 121,396,014 1.3 251,900 0.69 2,845,088,207 0.952007 (2) 2,222,262,840 1,145,978,600 0.65 52,548,980 0.69 184,039,831 4.5 7,656 4.5 116,912,479 1.3 175,000 0.65 3,721,925,386 0.862008 2,209,123,962 1,151,495,700 0.68 62,548,699 0.65 184,820,863 4.5 8,814 4.5 116,719,433 1.3 197,956 0.68 3,724,915,427 0.892009 (2) 1,930,786,600 1,145,085,600 0.77 62,322,900 0.68 183,336,720 4.5 10,493 4.5 109,391,904 1.3 192,756 0.77 3,431,126,973 0.982010 1,937,277,200 1,138,605,300 0.77 67,087,131 0.77 178,115,588 4.5 16,957 4.5 124,891,288 1.3 202,056 0.77 3,446,195,520 0.982011 (2) 1,590,890,500 1,129,950,300 0.86 64,741,641 0.86 186,501,554 4.5 11,236 4.5 124,891,288 1.3 202,056 0.86 3,097,188,575 1.102012 1,603,736,800 1,139,679,400 0.95 72,272,617 0.95 102,458,341 4.5 5,494 4.5 120,805,964 1.3 158,888 0.95 3,039,117,504 1.08
Notes:(1) Property assessed at 100% of actual value. Tax rates are assessed per $100 of assessed value.(2) General reassessment of real property completed for the 2003, 2005, 2007, 2009 and 2011 tax year.(3) Real Property tax rate for residential and commercial property is rate in effect for 1st half billing coming due in the current fiscal year.
Source: City of Winchester, Commissioner of the Revenue
104
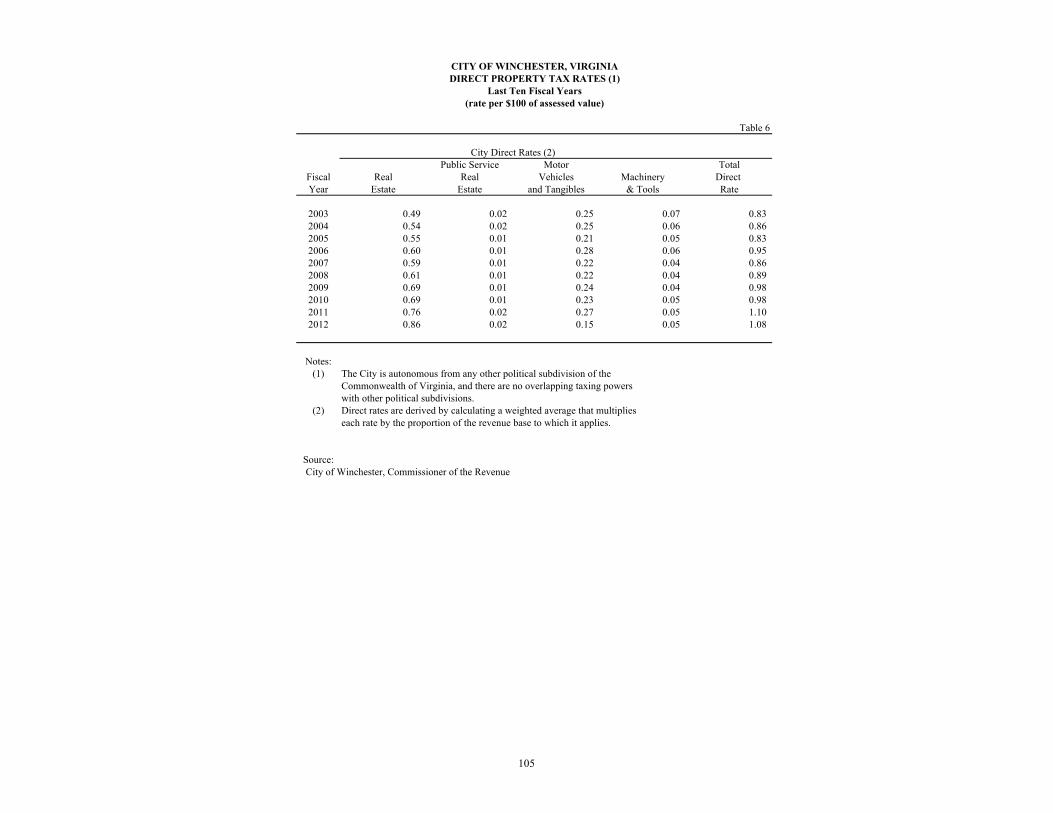
Table 6
Public Service Motor TotalFiscal Real Real Vehicles Machinery Direct Year Estate Estate and Tangibles & Tools Rate
2003 0.49 0.02 0.25 0.07 0.83 2004 0.54 0.02 0.25 0.06 0.86 2005 0.55 0.01 0.21 0.05 0.83 2006 0.60 0.01 0.28 0.06 0.95 2007 0.59 0.01 0.22 0.04 0.86 2008 0.61 0.01 0.22 0.04 0.89 2009 0.69 0.01 0.24 0.04 0.98 2010 0.69 0.01 0.23 0.05 0.98 2011 0.76 0.02 0.27 0.05 1.10 2012 0.86 0.02 0.15 0.05 1.08
Notes:(1) The City is autonomous from any other political subdivision of the
Commonwealth of Virginia, and there are no overlapping taxing powerswith other political subdivisions.
(2) Direct rates are derived by calculating a weighted average that multiplieseach rate by the proportion of the revenue base to which it applies.
Source: City of Winchester, Commissioner of the Revenue
City Direct Rates (2)
CITY OF WINCHESTER, VIRGINIADIRECT PROPERTY TAX RATES (1)
Last Ten Fiscal Years(rate per $100 of assessed value)
105
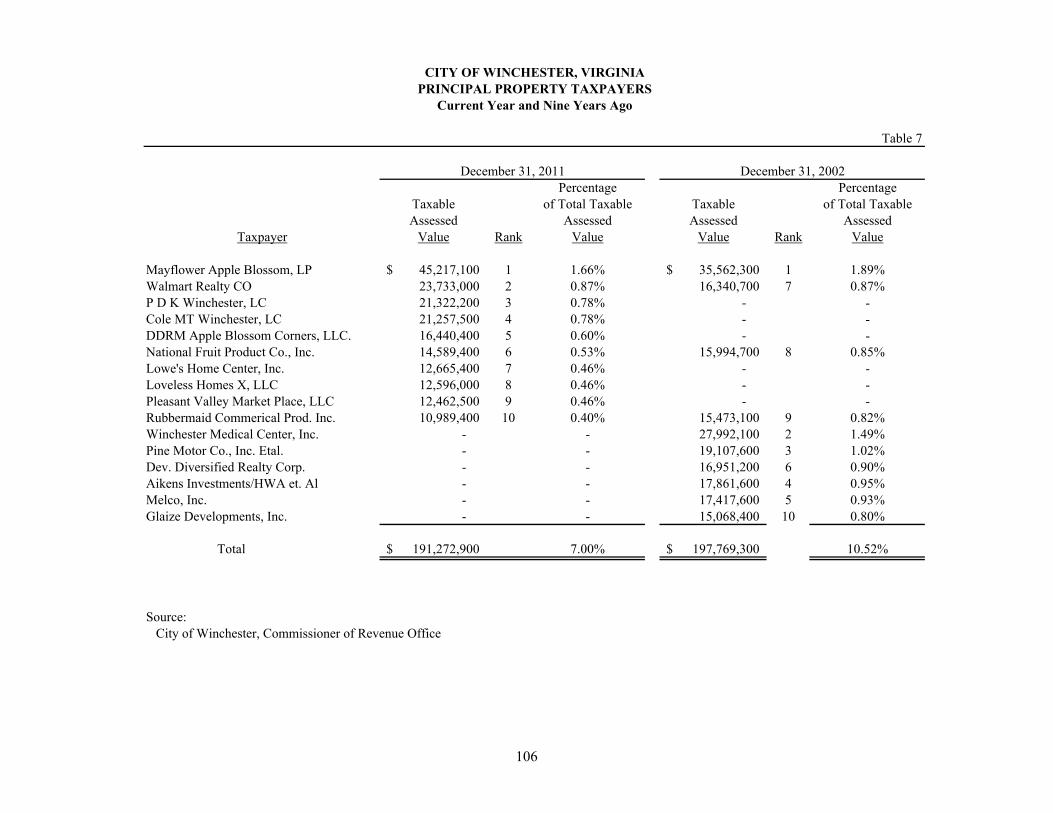
CITY OF WINCHESTER, VIRGINIAPRINCIPAL PROPERTY TAXPAYERS
Current Year and Nine Years Ago
Table 7
Percentage PercentageTaxable of Total Taxable Taxable of Total TaxableAssessed Assessed Assessed Assessed
Taxpayer Value Rank Value Value Rank Value
Mayflower Apple Blossom, LP 45,217,100$ 1 1.66% 35,562,300$ 1 1.89%Walmart Realty CO 23,733,000 2 0.87% 16,340,700 7 0.87%P D K Winchester, LC 21,322,200 3 0.78% - -Cole MT Winchester, LC 21,257,500 4 0.78% - -DDRM Apple Blossom Corners, LLC. 16,440,400 5 0.60% - -National Fruit Product Co., Inc. 14,589,400 6 0.53% 15,994,700 8 0.85%Lowe's Home Center, Inc. 12,665,400 7 0.46% - -Loveless Homes X, LLC 12,596,000 8 0.46% - -Pleasant Valley Market Place, LLC 12,462,500 9 0.46% - -Rubbermaid Commerical Prod. Inc. 10,989,400 10 0.40% 15,473,100 9 0.82%Winchester Medical Center, Inc. - - 27,992,100 2 1.49%Pine Motor Co., Inc. Etal. - - 19,107,600 3 1.02%Dev. Diversified Realty Corp. - - 16,951,200 6 0.90%Aikens Investments/HWA et. Al - - 17,861,600 4 0.95%Melco, Inc. - - 17,417,600 5 0.93%Glaize Developments, Inc. - - 15,068,400 10 0.80%
Total 191,272,900$ 7.00% 197,769,300$ 10.52%
Source: City of Winchester, Commissioner of Revenue Office
December 31, 2011 December 31, 2002
106
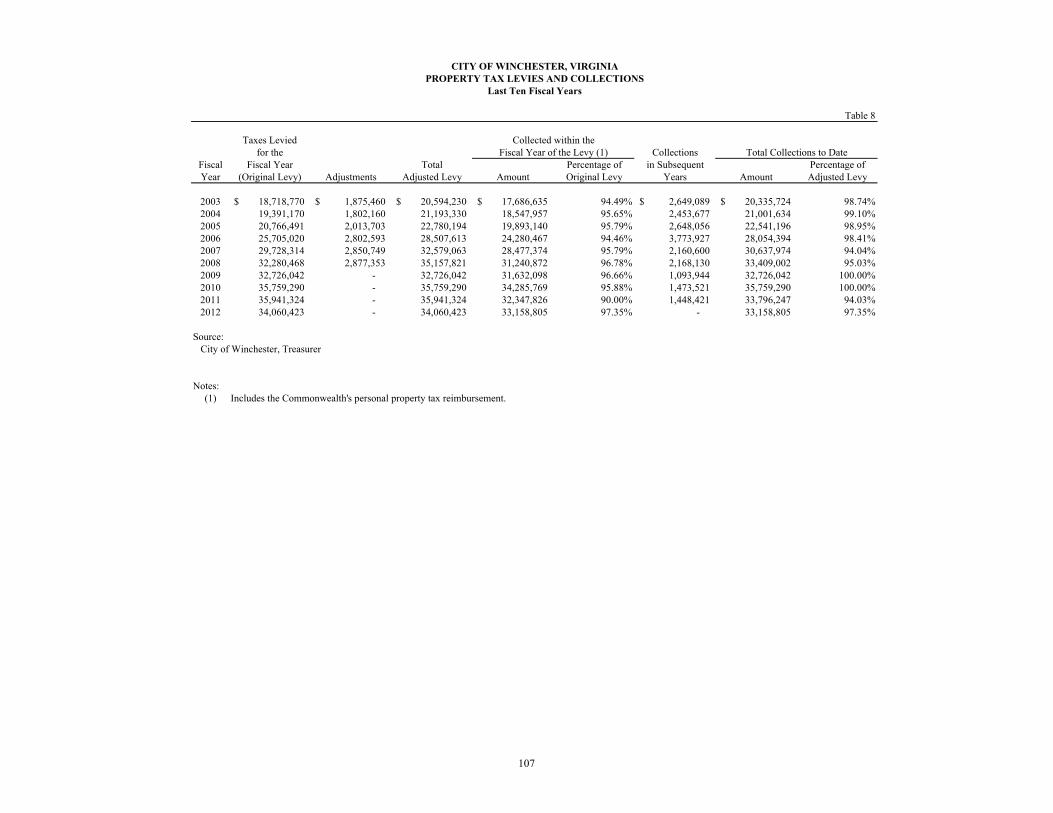
CITY OF WINCHESTER, VIRGINIAPROPERTY TAX LEVIES AND COLLECTIONS
Last Ten Fiscal Years
Table 8
Taxes Leviedfor the Collections
Fiscal Fiscal Year Total Percentage of in Subsequent Percentage ofYear (Original Levy) Adjustments Adjusted Levy Amount Original Levy Years Amount Adjusted Levy
2003 18,718,770$ 1,875,460$ 20,594,230$ 17,686,635$ 94.49% 2,649,089$ 20,335,724$ 98.74%2004 19,391,170 1,802,160 21,193,330 18,547,957 95.65% 2,453,677 21,001,634 99.10%2005 20,766,491 2,013,703 22,780,194 19,893,140 95.79% 2,648,056 22,541,196 98.95%2006 25,705,020 2,802,593 28,507,613 24,280,467 94.46% 3,773,927 28,054,394 98.41%2007 29,728,314 2,850,749 32,579,063 28,477,374 95.79% 2,160,600 30,637,974 94.04%2008 32,280,468 2,877,353 35,157,821 31,240,872 96.78% 2,168,130 33,409,002 95.03%2009 32,726,042 - 32,726,042 31,632,098 96.66% 1,093,944 32,726,042 100.00%2010 35,759,290 - 35,759,290 34,285,769 95.88% 1,473,521 35,759,290 100.00%2011 35,941,324 - 35,941,324 32,347,826 90.00% 1,448,421 33,796,247 94.03%2012 34,060,423 - 34,060,423 33,158,805 97.35% - 33,158,805 97.35%
Source: City of Winchester, Treasurer
Notes:(1) Includes the Commonwealth's personal property tax reimbursement.
Total Collections to DateFiscal Year of the Levy (1)Collected within the
107
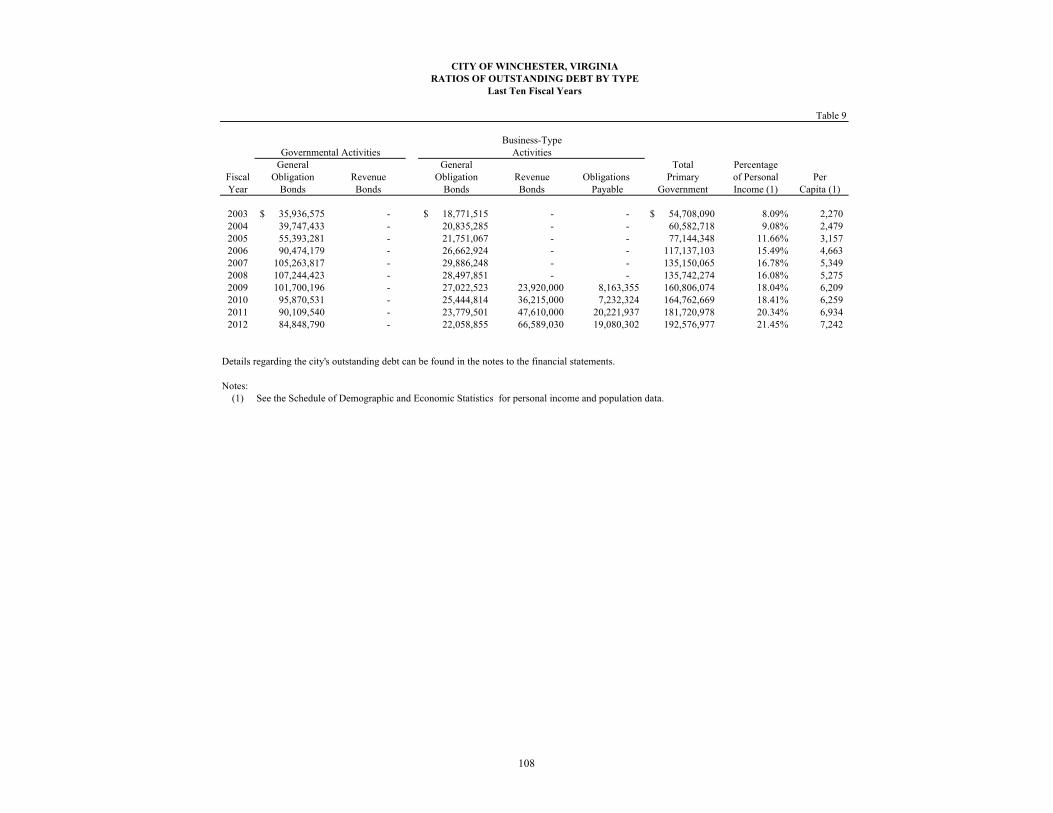
CITY OF WINCHESTER, VIRGINIARATIOS OF OUTSTANDING DEBT BY TYPE
Last Ten Fiscal Years
Table 9
General General Total PercentageFiscal Obligation Revenue Obligation Revenue Obligations Primary of Personal PerYear Bonds Bonds Bonds Bonds Payable Government Income (1) Capita (1)
2003 35,936,575$ - 18,771,515$ - - 54,708,090$ 8.09% 2,270 2004 39,747,433 - 20,835,285 - - 60,582,718 9.08% 2,479 2005 55,393,281 - 21,751,067 - - 77,144,348 11.66% 3,157 2006 90,474,179 - 26,662,924 - - 117,137,103 15.49% 4,663 2007 105,263,817 - 29,886,248 - - 135,150,065 16.78% 5,349 2008 107,244,423 - 28,497,851 - - 135,742,274 16.08% 5,275 2009 101,700,196 - 27,022,523 23,920,000 8,163,355 160,806,074 18.04% 6,209 2010 95,870,531 - 25,444,814 36,215,000 7,232,324 164,762,669 18.41% 6,259 2011 90,109,540 - 23,779,501 47,610,000 20,221,937 181,720,978 20.34% 6,934 2012 84,848,790 - 22,058,855 66,589,030 19,080,302 192,576,977 21.45% 7,242
Details regarding the city's outstanding debt can be found in the notes to the financial statements.
Notes:(1) See the Schedule of Demographic and Economic Statistics for personal income and population data.
Governmental Activities ActivitiesBusiness-Type
108

CITY OF WINCHESTER, VIRGINIARATIOS OF NET GENERAL BONDED DEBT OUTSTANDING
Last Ten Fiscal Years
Table 10
Percentage of General Less: Amounts Actual Taxable
Fiscal Obligation Available in Debt Value of PerYear Bonds Service Fund Total Property (1) Capita (2)
2003 35,936,575 811,011 35,125,564 1.96% 1,457 2004 39,747,433 639,959 39,107,474 1.78% 1,601 2005 55,393,281 482,877 54,910,404 2.44% 2,247 2006 90,474,179 342,947 90,131,232 3.31% 3,588 2007 105,263,817 217,166 105,046,651 3.69% 4,158 2008 107,244,423 102,003 107,142,420 2.88% 4,164 2009 101,700,196 49,876 101,650,320 2.73% 3,925 2010 95,870,531 - 95,870,531 2.79% 3,642 2011 90,109,540 - 90,109,540 2.61% 3,439 2012 84,848,790 - 84,848,790 2.79% 3,191
Details regarding the city's outstanding debt can be found in the notes to the financial statements.
Notes:(1) See the Schedule of Assessed Value and Actual Value of Taxable Property for property value data.(2) Population data can be found in the Schedule of Demographic and Economic Statistics.
109
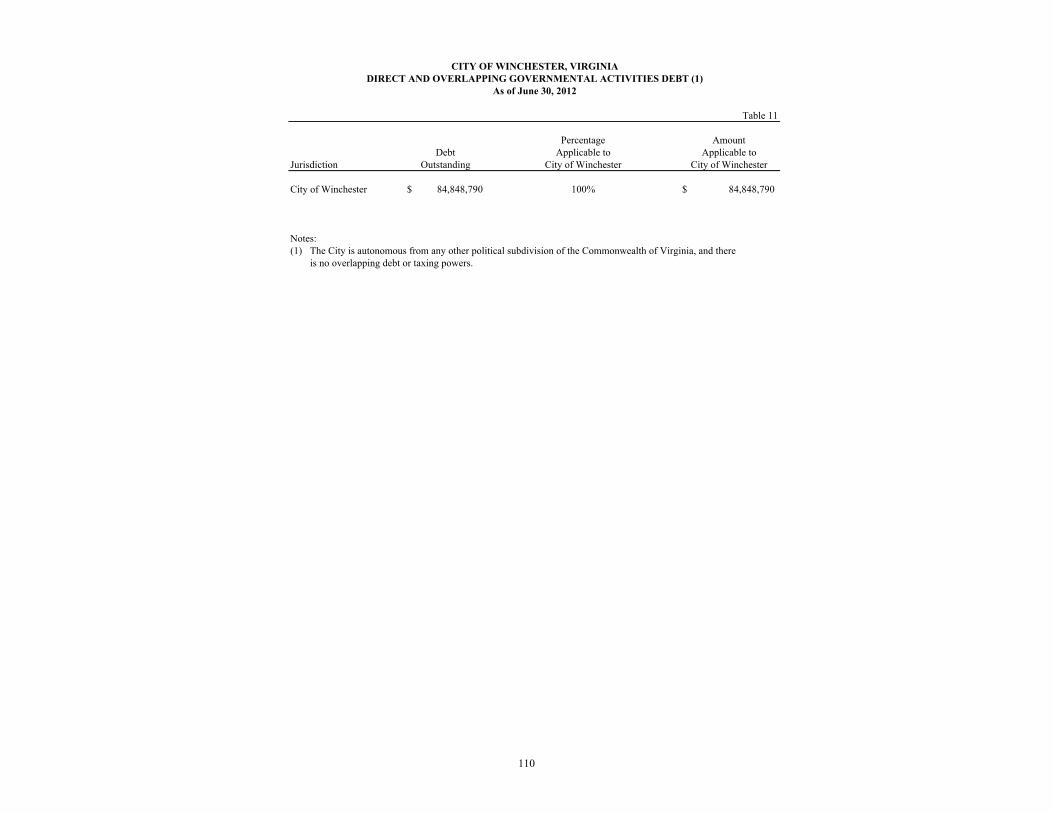
CITY OF WINCHESTER, VIRGINIADIRECT AND OVERLAPPING GOVERNMENTAL ACTIVITIES DEBT (1)
As of June 30, 2012
Table 11
Percentage AmountDebt Applicable to Applicable to
Jurisdiction Outstanding City of Winchester City of Winchester
City of Winchester 84,848,790$ 100% 84,848,790$
Notes:(1) The City is autonomous from any other political subdivision of the Commonwealth of Virginia, and there
is no overlapping debt or taxing powers.
110
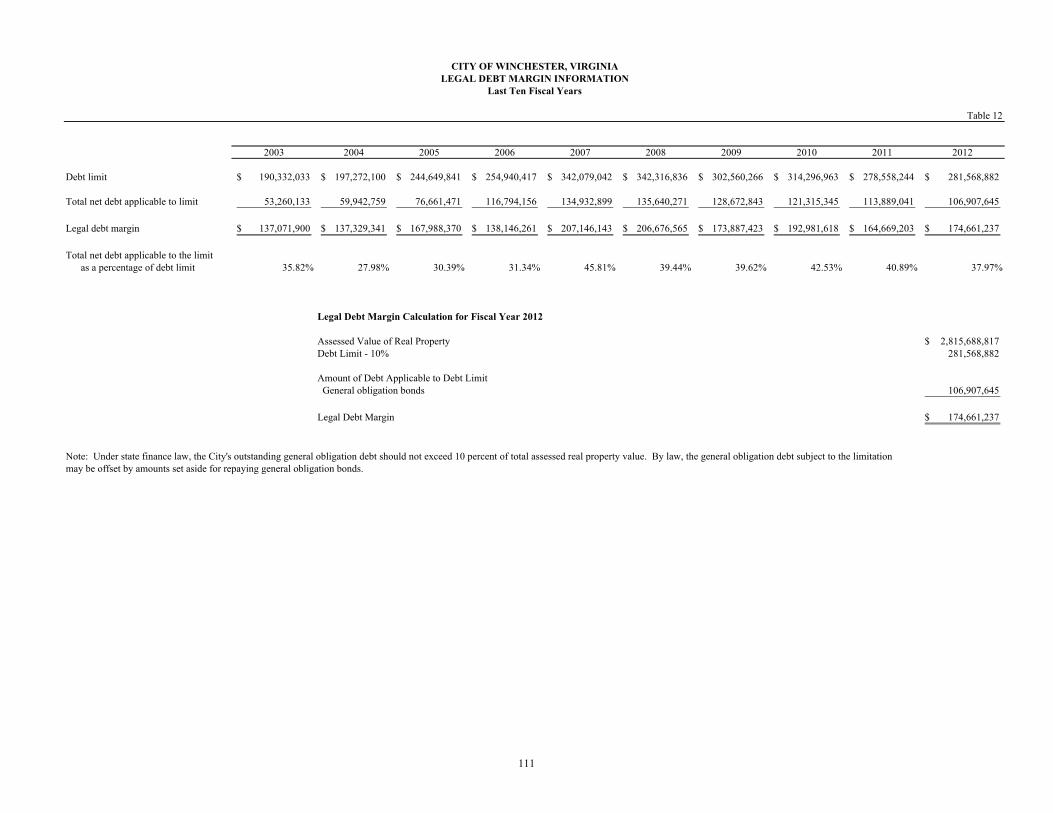
CITY OF WINCHESTER, VIRGINIALEGAL DEBT MARGIN INFORMATION
Last Ten Fiscal Years
Table 12
2003 2004 2005 2006 2007 2008 2009 2010 2011 2012
Debt limit 190,332,033$ 197,272,100$ 244,649,841$ 254,940,417$ 342,079,042$ 342,316,836$ 302,560,266$ 314,296,963$ 278,558,244$ 281,568,882$
Total net debt applicable to limit 53,260,133 59,942,759 76,661,471 116,794,156 134,932,899 135,640,271 128,672,843 121,315,345 113,889,041 106,907,645
Legal debt margin 137,071,900$ 137,329,341$ 167,988,370$ 138,146,261$ 207,146,143$ 206,676,565$ 173,887,423$ 192,981,618$ 164,669,203$ 174,661,237$
Total net debt applicable to the limitas a percentage of debt limit 35.82% 27.98% 30.39% 31.34% 45.81% 39.44% 39.62% 42.53% 40.89% 37.97%
Legal Debt Margin Calculation for Fiscal Year 2012
Assessed Value of Real Property 2,815,688,817$ Debt Limit - 10% 281,568,882
Amount of Debt Applicable to Debt Limit General obligation bonds 106,907,645
Legal Debt Margin 174,661,237$
Note: Under state finance law, the City's outstanding general obligation debt should not exceed 10 percent of total assessed real property value. By law, the general obligation debt subject to the limitationmay be offset by amounts set aside for repaying general obligation bonds.
111
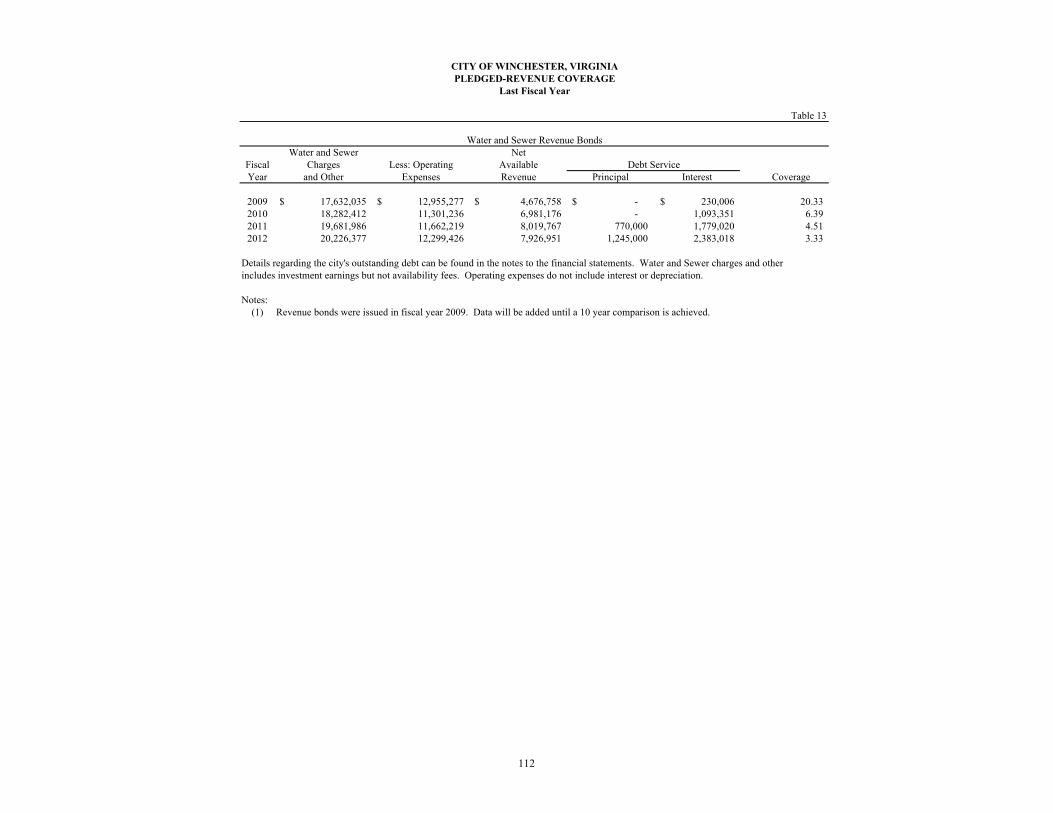
CITY OF WINCHESTER, VIRGINIAPLEDGED-REVENUE COVERAGE
Last Fiscal Year
Table 13
Water and Sewer NetFiscal Charges Less: Operating AvailableYear and Other Expenses Revenue Principal Interest Coverage
2009 17,632,035$ 12,955,277$ 4,676,758$ -$ 230,006$ 20.33 2010 18,282,412 11,301,236 6,981,176 - 1,093,351 6.39 2011 19,681,986 11,662,219 8,019,767 770,000 1,779,020 4.51 2012 20,226,377 12,299,426 7,926,951 1,245,000 2,383,018 3.33
Details regarding the city's outstanding debt can be found in the notes to the financial statements. Water and Sewer charges and otherincludes investment earnings but not availability fees. Operating expenses do not include interest or depreciation.
Notes:(1) Revenue bonds were issued in fiscal year 2009. Data will be added until a 10 year comparison is achieved.
Water and Sewer Revenue Bonds
Debt Service
112
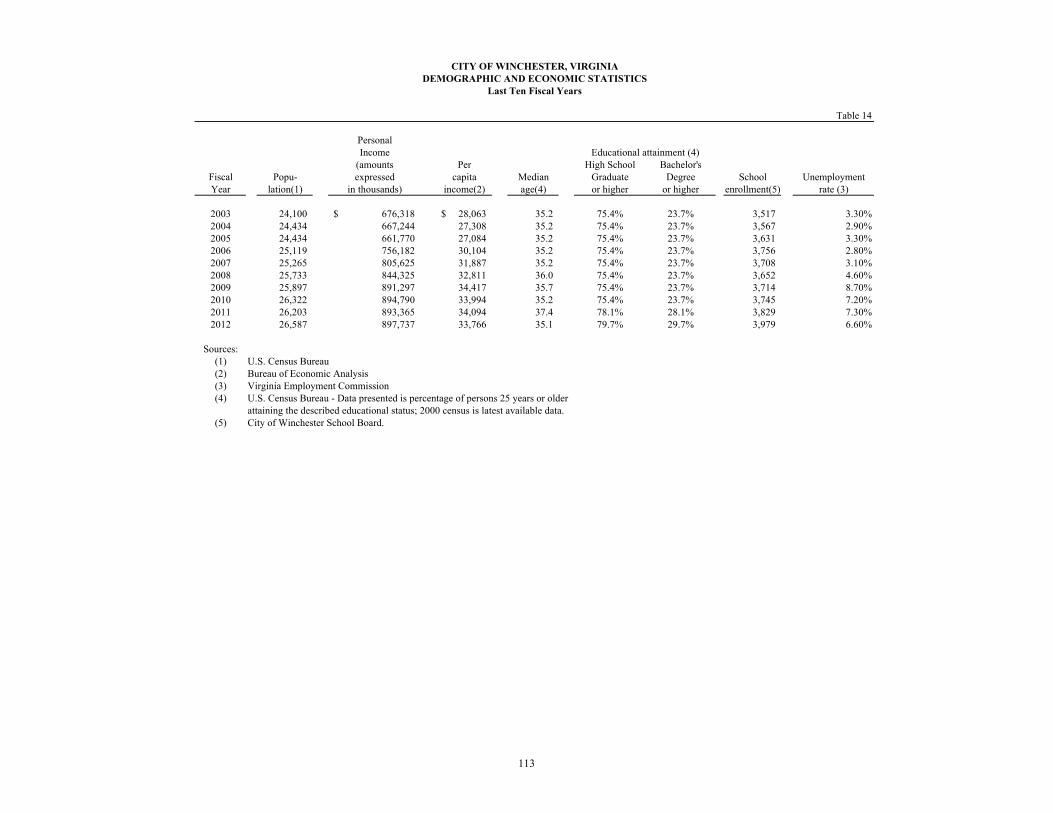
CITY OF WINCHESTER, VIRGINIADEMOGRAPHIC AND ECONOMIC STATISTICS
Last Ten Fiscal Years
Table 14
PersonalIncome Educational attainment (4)
(amounts Per High School Bachelor'sFiscal Popu- expressed capita Median Graduate Degree School UnemploymentYear lation(1) in thousands) income(2) age(4) or higher or higher enrollment(5) rate (3)
2003 24,100 676,318$ 28,063$ 35.2 75.4% 23.7% 3,517 3.30%2004 24,434 667,244 27,308 35.2 75.4% 23.7% 3,567 2.90%2005 24,434 661,770 27,084 35.2 75.4% 23.7% 3,631 3.30%2006 25,119 756,182 30,104 35.2 75.4% 23.7% 3,756 2.80%2007 25,265 805,625 31,887 35.2 75.4% 23.7% 3,708 3.10%2008 25,733 844,325 32,811 36.0 75.4% 23.7% 3,652 4.60%2009 25,897 891,297 34,417 35.7 75.4% 23.7% 3,714 8.70%2010 26,322 894,790 33,994 35.2 75.4% 23.7% 3,745 7.20%2011 26,203 893,365 34,094 37.4 78.1% 28.1% 3,829 7.30%2012 26,587 897,737 33,766 35.1 79.7% 29.7% 3,979 6.60%
Sources:(1) U.S. Census Bureau(2) Bureau of Economic Analysis(3) Virginia Employment Commission(4) U.S. Census Bureau - Data presented is percentage of persons 25 years or older
attaining the described educational status; 2000 census is latest available data.(5) City of Winchester School Board.
113
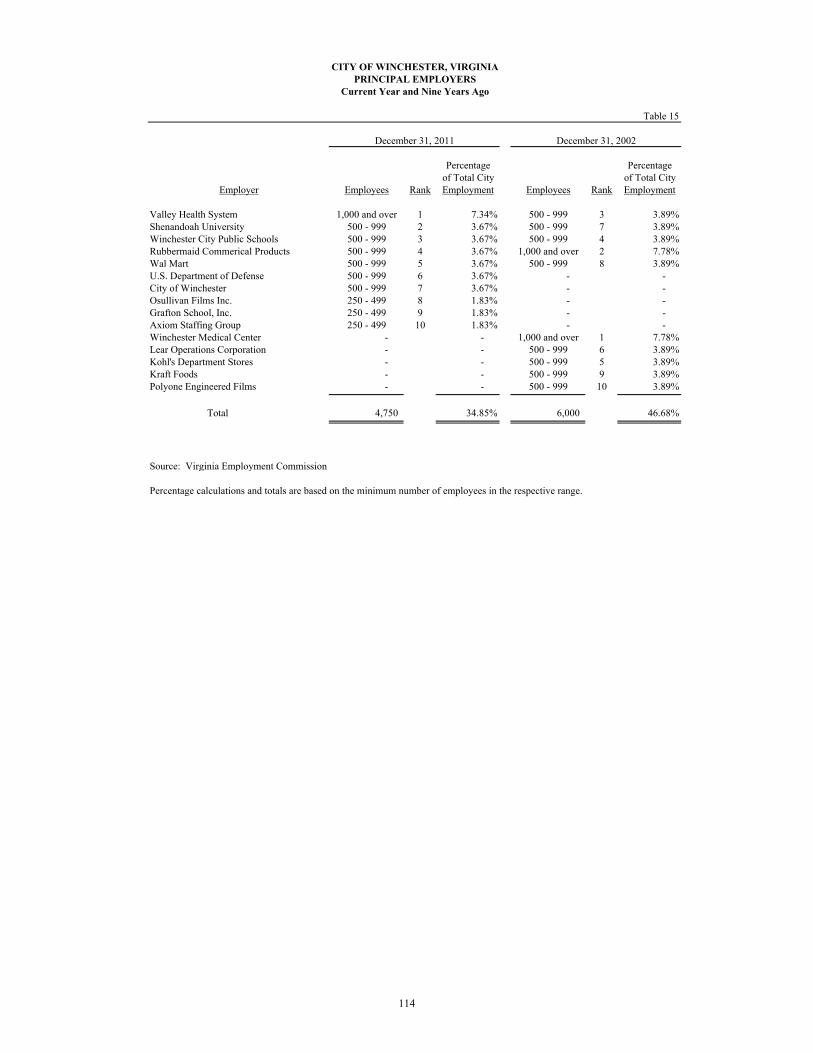
CITY OF WINCHESTER, VIRGINIAPRINCIPAL EMPLOYERS
Current Year and Nine Years Ago
Table 15
Percentage Percentageof Total City of Total City
Employer Employees Rank Employment Employees Rank Employment
Valley Health System 1,000 and over 1 7.34% 500 - 999 3 3.89%Shenandoah University 500 - 999 2 3.67% 500 - 999 7 3.89%Winchester City Public Schools 500 - 999 3 3.67% 500 - 999 4 3.89%Rubbermaid Commerical Products 500 - 999 4 3.67% 1,000 and over 2 7.78%Wal Mart 500 - 999 5 3.67% 500 - 999 8 3.89%U.S. Department of Defense 500 - 999 6 3.67% - - City of Winchester 500 - 999 7 3.67% - - Osullivan Films Inc. 250 - 499 8 1.83% - - Grafton School, Inc. 250 - 499 9 1.83% - - Axiom Staffing Group 250 - 499 10 1.83% - - Winchester Medical Center - - 1,000 and over 1 7.78%Lear Operations Corporation - - 500 - 999 6 3.89%Kohl's Department Stores - - 500 - 999 5 3.89%Kraft Foods - - 500 - 999 9 3.89%Polyone Engineered Films - - 500 - 999 10 3.89%
Total 4,750 34.85% 6,000 46.68%
Source: Virginia Employment Commission
Percentage calculations and totals are based on the minimum number of employees in the respective range.
December 31, 2011 December 31, 2002
114
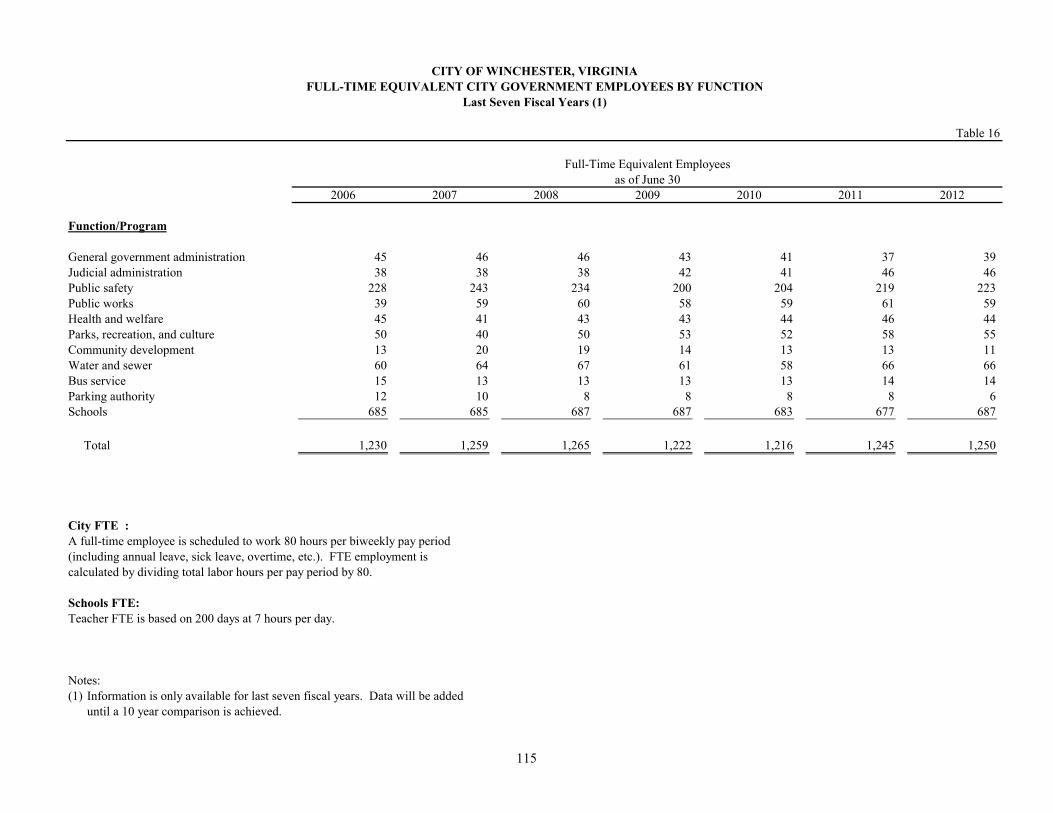
2006 2007 2008 2009 2010 2011 2012
Function/Program
General government administration 45 46 46 43 41 37 39 Judicial administration 38 38 38 42 41 46 46 Public safety 228 243 234 200 204 219 223 Public works 39 59 60 58 59 61 59 Health and welfare 45 41 43 43 44 46 44 Parks, recreation, and culture 50 40 50 53 52 58 55 Community development 13 20 19 14 13 13 11 Water and sewer 60 64 67 61 58 66 66 Bus service 15 13 13 13 13 14 14 Parking authority 12 10 8 8 8 8 6 Schools 685 685 687 687 683 677 687
Total 1,230 1,259 1,265 1,222 1,216 1,245 1,250
City FTE :A full-time employee is scheduled to work 80 hours per biweekly pay period(including annual leave, sick leave, overtime, etc.). FTE employment iscalculated by dividing total labor hours per pay period by 80.
Schools FTE:Teacher FTE is based on 200 days at 7 hours per day.
Notes:(1) Information is only available for last seven fiscal years. Data will be added
until a 10 year comparison is achieved.
Table 16
Full-Time Equivalent Employeesas of June 30
CITY OF WINCHESTER, VIRGINIAFULL-TIME EQUIVALENT CITY GOVERNMENT EMPLOYEES BY FUNCTION
Last Seven Fiscal Years (1)
115
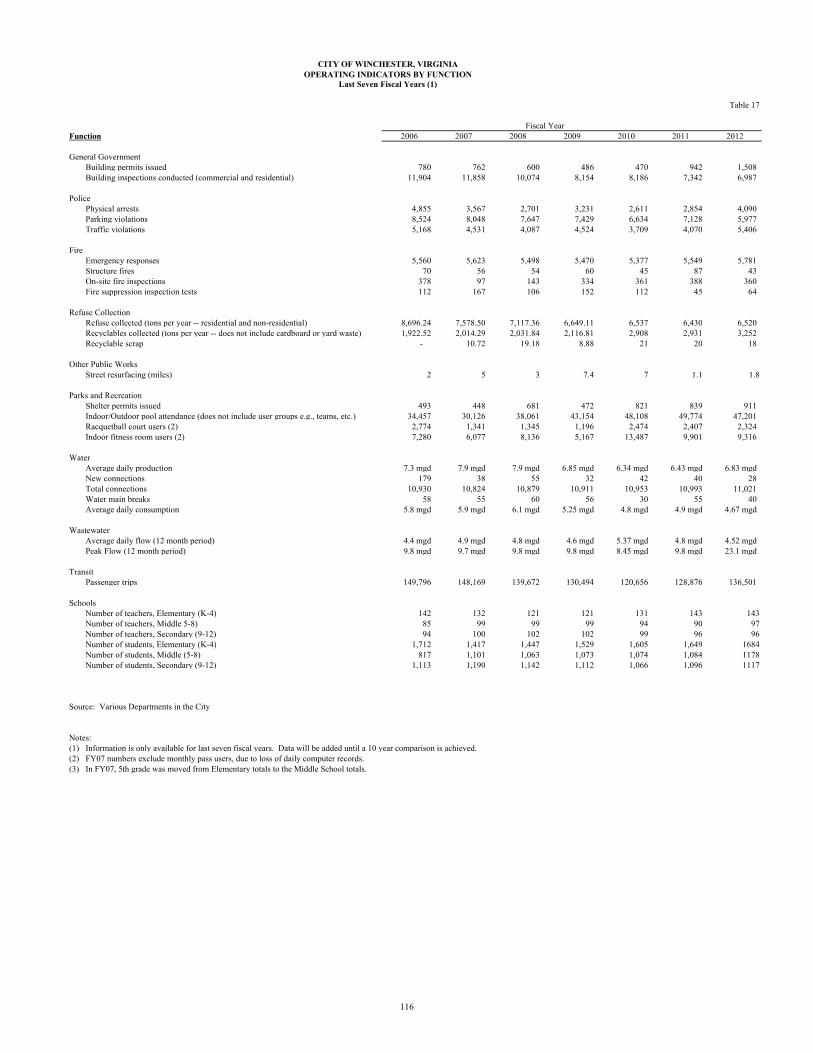
CITY OF WINCHESTER, VIRGINIAOPERATING INDICATORS BY FUNCTION
Last Seven Fiscal Years (1)
Function 2006 2007 2008 2009 2010 2011 2012
General GovernmentBuilding permits issued 780 762 600 486 470 942 1,508 Building inspections conducted (commercial and residential) 11,904 11,858 10,074 8,154 8,186 7,342 6,987
PolicePhysical arrests 4,855 3,567 2,701 3,231 2,611 2,854 4,090 Parking violations 8,524 8,048 7,647 7,429 6,634 7,128 5,977 Traffic violations 5,168 4,531 4,087 4,524 3,709 4,070 5,406
FireEmergency responses 5,560 5,623 5,498 5,470 5,377 5,549 5,781 Structure fires 70 56 54 60 45 87 43 On-site fire inspections 378 97 143 334 361 388 360 Fire suppression inspection tests 112 167 106 152 112 45 64
Refuse CollectionRefuse collected (tons per year -- residential and non-residential) 8,696.24 7,578.50 7,117.36 6,649.11 6,537 6,430 6,520 Recyclables collected (tons per year -- does not include cardboard or yard waste) 1,922.52 2,014.29 2,031.84 2,116.81 2,908 2,931 3,252 Recyclable scrap - 10.72 19.18 8.88 21 20 18
Other Public Works Street resurfacing (miles) 2 5 3 7.4 7 1.1 1.8
Parks and RecreationShelter permits issued 493 448 681 472 821 839 911 Indoor/Outdoor pool attendance (does not include user groups e.g., teams, etc.) 34,457 30,126 38,061 43,154 48,108 49,774 47,201 Racquetball court users (2) 2,774 1,341 1,345 1,196 2,474 2,407 2,324 Indoor fitness room users (2) 7,280 6,077 8,136 5,167 13,487 9,901 9,316
WaterAverage daily production 7.3 mgd 7.9 mgd 7.9 mgd 6.85 mgd 6.34 mgd 6.43 mgd 6.83 mgdNew connections 179 38 55 32 42 40 28 Total connections 10,930 10,824 10,879 10,911 10,953 10,993 11,021 Water main breaks 58 55 60 56 30 55 40 Average daily consumption 5.8 mgd 5.9 mgd 6.1 mgd 5.25 mgd 4.8 mgd 4.9 mgd 4.67 mgd
WastewaterAverage daily flow (12 month period) 4.4 mgd 4.9 mgd 4.8 mgd 4.6 mgd 5.37 mgd 4.8 mgd 4.52 mgdPeak Flow (12 month period) 9.8 mgd 9.7 mgd 9.8 mgd 9.8 mgd 8.45 mgd 9.8 mgd 23.1 mgd
TransitPassenger trips 149,796 148,169 139,672 130,494 120,656 128,876 136,501
SchoolsNumber of teachers, Elementary (K-4) 142 132 121 121 131 143 143Number of teachers, Middle 5-8) 85 99 99 99 94 90 97Number of teachers, Secondary (9-12) 94 100 102 102 99 96 96Number of students, Elementary (K-4) 1,712 1,417 1,447 1,529 1,605 1,649 1684Number of students, Middle (5-8) 817 1,101 1,063 1,073 1,074 1,084 1178Number of students, Secondary (9-12) 1,113 1,190 1,142 1,112 1,066 1,096 1117
Source: Various Departments in the City
Notes:(1) Information is only available for last seven fiscal years. Data will be added until a 10 year comparison is achieved.(2) FY07 numbers exclude monthly pass users, due to loss of daily computer records.(3) In FY07, 5th grade was moved from Elementary totals to the Middle School totals.
Fiscal Year
Table 17
116
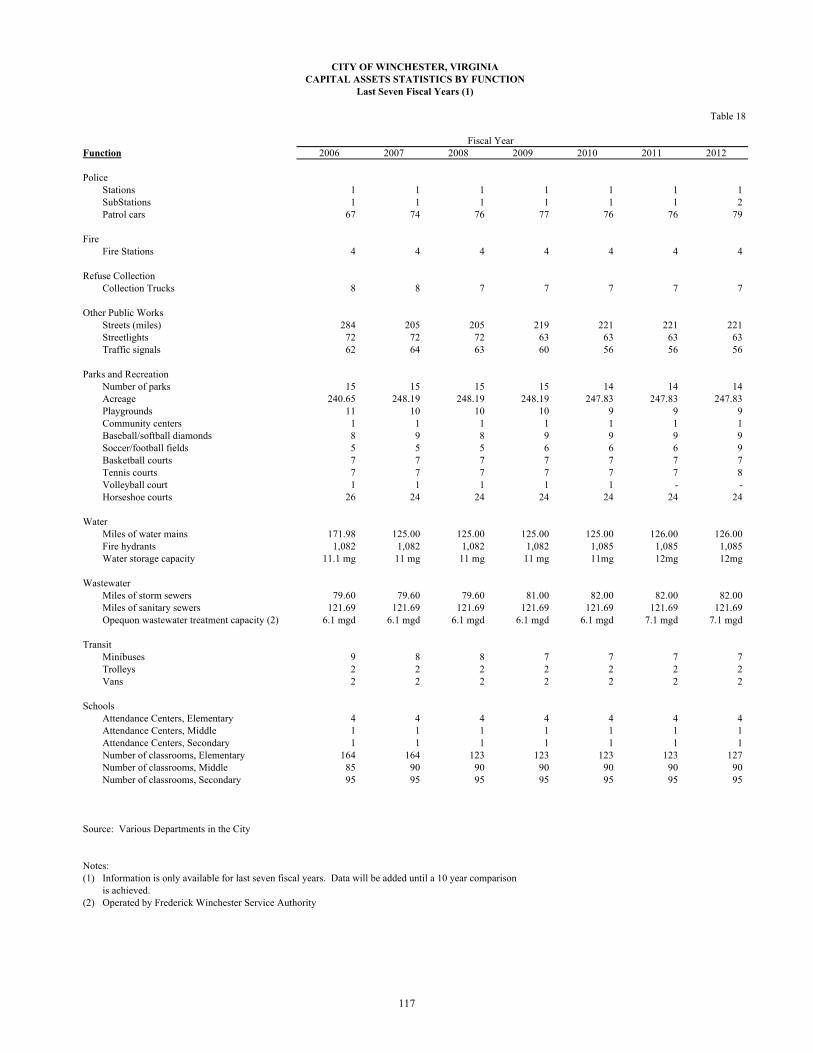
Function 2006 2007 2008 2009 2010 2011 2012
PoliceStations 1 1 1 1 1 1 1 SubStations 1 1 1 1 1 1 2 Patrol cars 67 74 76 77 76 76 79
FireFire Stations 4 4 4 4 4 4 4
Refuse CollectionCollection Trucks 8 8 7 7 7 7 7
Other Public Works Streets (miles) 284 205 205 219 221 221 221 Streetlights 72 72 72 63 63 63 63 Traffic signals 62 64 63 60 56 56 56
Parks and RecreationNumber of parks 15 15 15 15 14 14 14 Acreage 240.65 248.19 248.19 248.19 247.83 247.83 247.83 Playgrounds 11 10 10 10 9 9 9 Community centers 1 1 1 1 1 1 1 Baseball/softball diamonds 8 9 8 9 9 9 9 Soccer/football fields 5 5 5 6 6 6 9 Basketball courts 7 7 7 7 7 7 7 Tennis courts 7 7 7 7 7 7 8 Volleyball court 1 1 1 1 1 - - Horseshoe courts 26 24 24 24 24 24 24
Water Miles of water mains 171.98 125.00 125.00 125.00 125.00 126.00 126.00 Fire hydrants 1,082 1,082 1,082 1,082 1,085 1,085 1,085 Water storage capacity 11.1 mg 11 mg 11 mg 11 mg 11mg 12mg 12mg
WastewaterMiles of storm sewers 79.60 79.60 79.60 81.00 82.00 82.00 82.00 Miles of sanitary sewers 121.69 121.69 121.69 121.69 121.69 121.69 121.69 Opequon wastewater treatment capacity (2) 6.1 mgd 6.1 mgd 6.1 mgd 6.1 mgd 6.1 mgd 7.1 mgd 7.1 mgd
TransitMinibuses 9 8 8 7 7 7 7 Trolleys 2 2 2 2 2 2 2 Vans 2 2 2 2 2 2 2
SchoolsAttendance Centers, Elementary 4 4 4 4 4 4 4 Attendance Centers, Middle 1 1 1 1 1 1 1 Attendance Centers, Secondary 1 1 1 1 1 1 1 Number of classrooms, Elementary 164 164 123 123 123 123 127 Number of classrooms, Middle 85 90 90 90 90 90 90 Number of classrooms, Secondary 95 95 95 95 95 95 95
Source: Various Departments in the City
Notes:(1) Information is only available for last seven fiscal years. Data will be added until a 10 year comparison
is achieved.(2) Operated by Frederick Winchester Service Authority
Fiscal Year
Table 18
CITY OF WINCHESTER, VIRGINIACAPITAL ASSETS STATISTICS BY FUNCTION
Last Seven Fiscal Years (1)
117

THIS PAGE IS INTENTIONALLY LEFT BLANK.
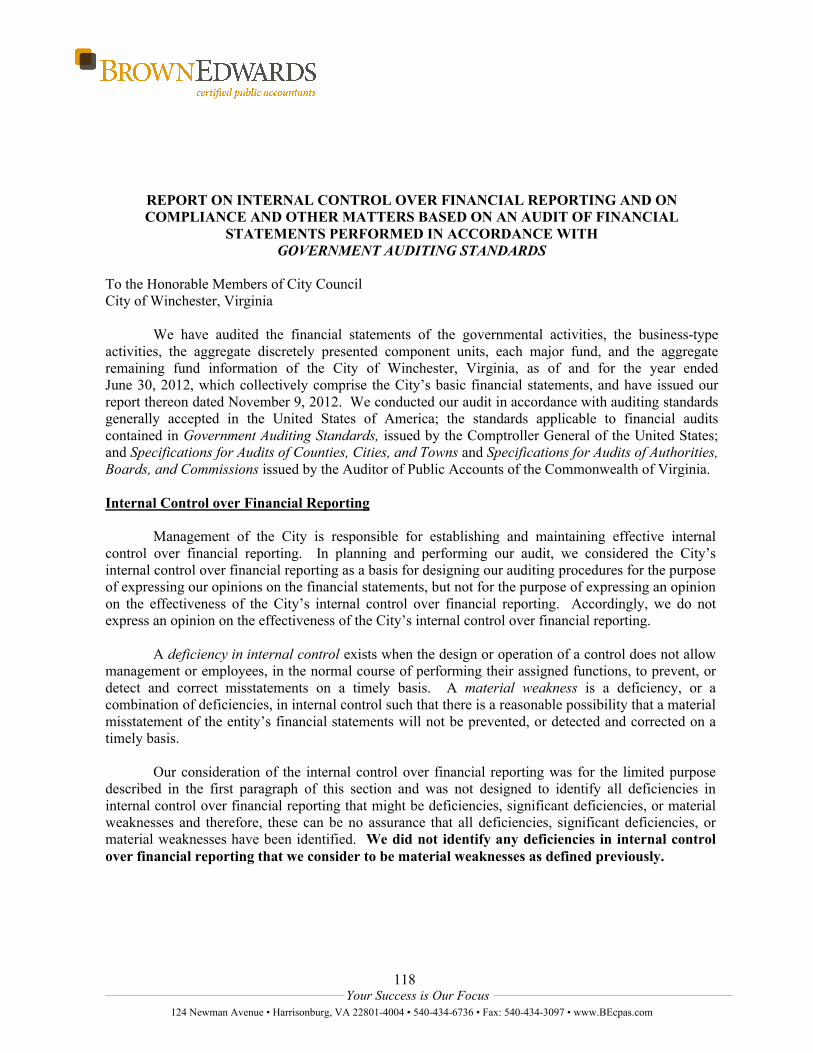
118Your Success is Our Focus
124 Newman Avenue • Harrisonburg, VA 22801-4004 • 540-434-6736 • Fax: 540-434-3097 • www.BEcpas.com
REPORT ON INTERNAL CONTROL OVER FINANCIAL REPORTING AND ON COMPLIANCE AND OTHER MATTERS BASED ON AN AUDIT OF FINANCIAL
STATEMENTS PERFORMED IN ACCORDANCE WITH GOVERNMENT AUDITING STANDARDS
To the Honorable Members of City CouncilCity of Winchester, Virginia
We have audited the financial statements of the governmental activities, the business-type activities, the aggregate discretely presented component units, each major fund, and the aggregate remaining fund information of the City of Winchester, Virginia, as of and for the year ended June 30, 2012, which collectively comprise the City’s basic financial statements, and have issued our report thereon dated November 9, 2012. We conducted our audit in accordance with auditing standards generally accepted in the United States of America; the standards applicable to financial audits contained in Government Auditing Standards, issued by the Comptroller General of the United States; and Specifications for Audits of Counties, Cities, and Towns and Specifications for Audits of Authorities, Boards, and Commissions issued by the Auditor of Public Accounts of the Commonwealth of Virginia.
Internal Control over Financial Reporting
Management of the City is responsible for establishing and maintaining effective internal control over financial reporting. In planning and performing our audit, we considered the City’s internal control over financial reporting as a basis for designing our auditing procedures for the purpose of expressing our opinions on the financial statements, but not for the purpose of expressing an opinion on the effectiveness of the City’s internal control over financial reporting. Accordingly, we do not express an opinion on the effectiveness of the City’s internal control over financial reporting.
A deficiency in internal control exists when the design or operation of a control does not allow management or employees, in the normal course of performing their assigned functions, to prevent, or detect and correct misstatements on a timely basis. A material weakness is a deficiency, or a combination of deficiencies, in internal control such that there is a reasonable possibility that a material misstatement of the entity’s financial statements will not be prevented, or detected and corrected on a timely basis.
Our consideration of the internal control over financial reporting was for the limited purpose described in the first paragraph of this section and was not designed to identify all deficiencies in internal control over financial reporting that might be deficiencies, significant deficiencies, or material weaknesses and therefore, these can be no assurance that all deficiencies, significant deficiencies, or material weaknesses have been identified. We did not identify any deficiencies in internal control over financial reporting that we consider to be material weaknesses as defined previously.
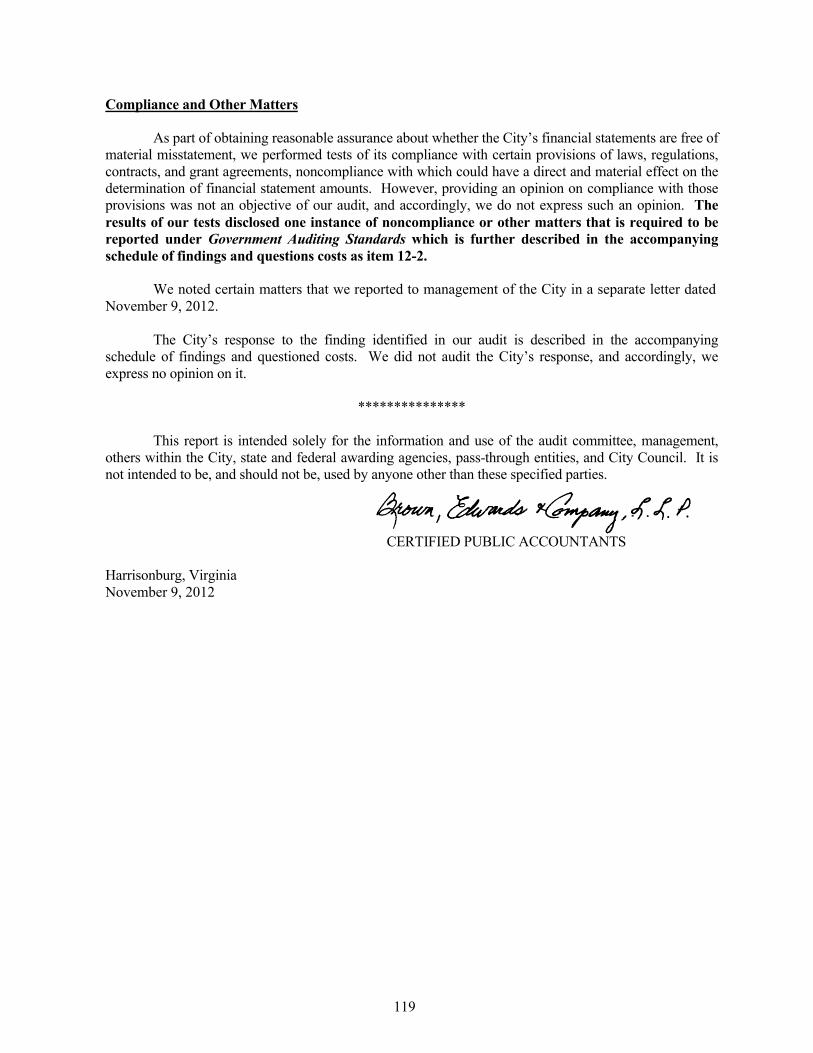
119
Compliance and Other Matters
As part of obtaining reasonable assurance about whether the City’s financial statements are free of material misstatement, we performed tests of its compliance with certain provisions of laws, regulations, contracts, and grant agreements, noncompliance with which could have a direct and material effect on the determination of financial statement amounts. However, providing an opinion on compliance with those provisions was not an objective of our audit, and accordingly, we do not express such an opinion. The results of our tests disclosed one instance of noncompliance or other matters that is required to be reported under Government Auditing Standards which is further described in the accompanying schedule of findings and questions costs as item 12-2.
We noted certain matters that we reported to management of the City in a separate letter datedNovember 9, 2012.
The City’s response to the finding identified in our audit is described in the accompanying schedule of findings and questioned costs. We did not audit the City’s response, and accordingly, we express no opinion on it.
***************
This report is intended solely for the information and use of the audit committee, management, others within the City, state and federal awarding agencies, pass-through entities, and City Council. It is not intended to be, and should not be, used by anyone other than these specified parties.
CERTIFIED PUBLIC ACCOUNTANTS
Harrisonburg, VirginiaNovember 9, 2012
120Your Success is Our Focus
124 Newman Avenue • Harrisonburg, VA 22801-4004 • 540-434-6736 • Fax: 540-434-3097 • www.BEcpas.com
INDEPENDENT AUDITOR’S REPORT ON COMPLIANCE WITH REQUIREMENTS THAT COULD HAVE A DIRECT AND MATERIAL EFFECT ON EACH MAJOR PROGRAM AND
ON INTERNAL CONTROL OVER COMPLIANCE IN ACCORDANCE WITHOMB CIRCULAR A-133
To the Honorable Members of City CouncilCity of Winchester, Virginia
Compliance
We have audited the City of Winchester, Virginia’s compliance with the types of compliance requirements described in the OMB Circular A-133 Compliance Supplement that could have a direct and material effect on each of its major federal programs for the year ended June 30, 2012. The City’s major federal programs are identified in the summary of auditor’s results section of the accompanying schedule of findings and questioned costs. Compliance with the requirements of laws, regulations, contracts and grants applicable to each of its major federal programs is the responsibility of the City’s management. Our responsibility is to express an opinion on the City’s compliance based on our audit.
We conducted our audit of compliance in accordance with auditing standards generally accepted in the United States of America; the standards applicable to financial audits contained in Government Auditing Standards, issued by the Comptroller General of the United States; and OMB Circular A-133, Audits of States, Local Governments, and Non-Profit Organizations. Those standards and OMB Circular A-133 require that we plan and perform the audit to obtain reasonable assurance about whether noncompliance with the types of compliance requirements referred to above that could have a direct and material effect on a major federal program occurred. An audit includes examining, on a test basis, evidence about the City’s compliance with those requirements and performing such other procedures as we considered necessary in the circumstances. We believe that our audit provides a reasonable basis for our opinion. Our audit does not provide a legal determination on the City’s compliance with those requirements.
In our opinion, the City complied, in all material respects, with the compliance requirements referred to above that could have a direct and material effect on each of its major federal programs for the year ended June 30, 2012. However, the results of our auditing procedures disclosed an instance of noncompliance with those requirements, which is required to be reported in accordance with OMB Circular A-133 and which is described in the accompanying schedule of findings and questioned costs as item 12-1.
121
Internal Control over Compliance
Management of the City is responsible for establishing and maintaining effective internal control over compliance with the requirements of laws, regulations, contracts, and grants applicable to federal programs. In planning and performing our audit, we considered the City’s internal control over compliance with the requirements that could have a direct and material effect on a major federal program to determine the auditing procedures for the purpose of expressing our opinion on compliance and to test and report on internal control over compliance in accordance with OMB Circular A-133, but not for the purpose of expressing an opinion on the effectiveness of internal control over compliance. Accordingly, we do not express an opinion on the effectiveness of the City’s internal control over compliance.
A deficiency in internal control over compliance exists when the design or operation of a control over compliance does not allow management or employees, in the normal course of performing their assigned functions, to prevent, or detect and correct, noncompliance with a type of compliance requirement of a federal program on a timely basis. A material weakness in internal control over compliance is a deficiency, or combination of deficiencies, in internal control over compliance, such that there is a reasonable possibility that material noncompliance with a type of compliance requirement of a federal program will not be prevented, or detected and corrected, on a timely basis.
Our consideration of the internal control over compliance was for the limited purpose described in the first paragraph of this section and was not designed to identify all deficiencies in internal control over compliance that might be deficiencies, significant deficiencies, or material weaknesses. We did not identify any deficiencies in internal control over compliance that we consider to be material weaknesses, as defined above. The City’s response to the finding identified in our audit is described in the accompanying schedule of findings and questioned costs. We did not audit the City’s response and, accordingly, we express no opinion on the response.
This report is intended solely for the information and use of the audit committee, management, others within the City, federal awarding agencies and pass-through entities, and City Council and is not intended to be, and should not be, used by anyone other than these specified parties.
CERTIFIED PUBLIC ACCOUNTANTS
Harrisonburg, VirginiaNovember 9, 2012

122
CITY OF WINCHESTER, VIRGINIA
SUMMARY OF COMPLIANCE MATTERSJune 30, 2012
As more fully described in the Report on Internal Control over Financial Reporting and on Compliance and Other Matters Based on an Audit of Financial Statements Performed in Accordance with Government Auditing Standards, we performed tests of the City’s compliance with certain provisions of the laws, regulations, contracts, and grants shown below.
STATE COMPLIANCE MATTERS
Code of Virginia State Agency RequirementsBudget and Appropriation Laws EducationCash and Investment Laws Social ServicesConflicts of Interest Act Urban Highway MaintenanceLocal Retirement SystemsDebt ProvisionsProcurement LawsComprehensive Services ActUniform Disposition of Unclaimed Property ActSheriff Internal Controls
FEDERAL COMPLIANCE MATTERS
Compliance Supplement for Single Audits of State and Local Governments
Provisions and conditions of agreements related to federal programs selected for testing.

(Continued) 123
CITY OF WINCHESTER, VIRGINIA
SCHEDULE OF FINDINGS AND QUESTIONED COSTSYear Ended June 30, 2012
A. SUMMARY OF AUDITOR’S RESULTS
1. The auditor’s report expresses an unqualified opinion on the financial statements.
2. No significant deficiencies relating to the audit of the financial statements was reported in the Report on Internal Control over Financial Reporting and on Compliance and Other Matters Based on an Audit of Financial Statements Performed in Accordance with Government Auditing Standards.
3. No instances of noncompliance material to the financial statements, which would be required to be reported in accordance with Government Auditing Standards, were disclosed during the audit.
4. No significant deficiencies relating to the audit of the major federal award programs were reported in the Independent Auditor’s Report on Compliance with Requirements That Could Have a Direct and Material Effect on Each Major Program and on Internal Control over Compliance in Accordance with OMB Circular A-133.
5. The auditor’s report on compliance for the major federal award programs expresses an unqualified opinionon all major federal programs.
6. The audit disclosed one audit finding relating to major programs.
7. The major programs of the City are:
Name of Program CFDA #
State Administrative Matching Grants for the Supplemental Nutrition Assistance Program 10.561Temporary Assistance for Needy FamiliesCapitalization Grants for Drinking Water State Revolving FundsSpecial Education – Grants to StatesARRA - Special Education – Grants to States
93.55866.46884.02784.391
Special Education – Preschool Grants 84.173Title I Grants to Local Educational Agencies 84.010ARRA - Title I Grants to Local Educational Agencies 84.389Community Development Block Grants/Entitlement Grants 14.218Child Care and Development Block Grant 93.575Child Care Mandatory and Matching Funds of the Child Care and Development Fund 93.596
8. The threshold for distinguishing Type A and B programs was $300,000.
9. The City of Winchester was not determined to be a low-risk auditee.
124
CITY OF WINCHESTER, VIRGINIA
SCHEDULE OF FINDINGS AND QUESTIONED COSTSYear Ended June 30, 2012
B. FINDINGS – FINANCIAL STATEMENT AUDIT
None
C. FINDINGS AND QUESTIONED COSTS – MAJOR FEDERAL AWARD PROGRAMS AUDIT
12-1: Capitalization Grants for Drinking Water State Revolving Funds – CFDA 66.468
Condition:
We noted that the first quarter utilization report was not filed by the October 15, 2011 due date and was instead filed on October 27, 2011.
Recommendation:
We recommend that the City implement a process to ensure that reports are filed on or before their stated due dates.
Management’s Response:
The auditee concurs with this recommendation and added that they notified the State ahead of time to make them aware that the City would be filing this report late.
D. FINDINGS AND QUESTIONED COSTS – COMMONWEALTH OF VIRGINIA
12-2: Commonwealth of Virginia Disclosure Statements
Condition:
Four out of thirty-six members of City appointed governing bodies did not file statements of economic interest by the deadline as set forth by the Code of Virginia.
Recommendation:
Steps should be taken to ensure that these statements are filed and in a timely manner.
Management’s Response:
The auditee concurs with this recommendation.

Federal Granting Agency/Recipient State Agency/
Grant Program
Federal CFDA
Number Federal Expenditures
U.S. Department of AgriculturePass-through payments: Department of Social Services: State Administration Matching Grants for Supplemental Nutrition Assistance Program 10.561 379,792$
Department of Forestry:Cooperative Forestry Assistance 10.664 4,500
Department of Corrections:National School Lunch Program 10.555 26,691
Commonwealth of Virginia Department of Agriculture and Consumer ServicesNational School Lunch Program 10.555 955,680 National School Lunch Program - Commodities 10.555 97,831 School Breakfast Program 10.553 281,317 Total School Lunch Cluster 1,334,828
ARRA - Child Nutrition Discretionary Grant 10.579 12,950 Fresh Fruits and Vegetables Program 10.582 57,920
Total U.S. Department of Agriculture 1,816,681 U.S. Department of Homeland Security
Pass-through payments:Department of Emergency Management:
FEMA Disaster Assistance 97.036 161,032 State Homeland Security Grant Program 97.073 127,702
Total U.S. Department of Homeland Security 288,734
U.S. Department of Housing and Urban DevelopmentDirect payments:
Community Development Block Grants/Entitlement Grants 14.218 488,500
Total U.S. Department of Housing and Urban Development 488,500
Environmental Protection AgencyDirect payments:
Capitalization Grants for Drinking Water State Revolving Funds 66.468 1,516,582
Total Environmental Protection Agency 1,516,582
U.S. Department of JusticeDirect payments:
NVRDTF Gang Grant 16.580 74,068 COPS Hiring Recovery Program (CHRP) Grant 16.710 225,090
Pass-through payments:Department of Criminal Justice Services
Crime Victim Assistance 16.575 75,032 Violence Against Women Formula Grant 16.588 17,176 Sexual Assault Services Grant 16.017 4,659
Edward Byrne Memorial Justice Assistance Grant Program:Safe Streets Initiative 16.738 2,186 Byrne JAG Program 16.738 8,993 Law Enforcement Fitness Program 16.738 19,876 VEST Reimbursement Program 16.607 8,415
Total U.S. Department of Justice 435,495
National Endowment for the ArtsPass-through payments:
Virginia Commission for the ArtsPromotion of the Arts Partnership Agreements 45.025 5,000
Total National Endowment for the Arts 5,000
U.S. Department of TransportationDirect payments:
Federal Transit - Capital Investment Grants 20.500 33,437 ARRA - Federal Transit - Capital Investments Grants 20.500 103,481 Federal Transit - Formula Grants 20.507 434,037 Total Federal Transit Cluster 570,955
Pass-through payments:Virginia Department of Motor Vehicles
Alcohol Traffic Safety and Drunk Driving Prevention 20.601 30,466 Virginia Department of Transportation
Highway Planning and Construction 20.600 13,497 State and Community Highway Safety 20.607 15,936 Total Highway Safety Cluster 59,899
Total U.S. Department of Transportation 630,854
CITY OF WINCHESTER, VIRGINIASCHEDULE OF EXPENDITURES OF FEDERAL AWARDS
For the Year Ended June 30, 2012
125

Federal Granting Agency/Recipient State Agency/
Grant Program
Federal CFDA
Number Federal Expenditures
U.S. Department of EducationDirect payments:
McKinney-Vento Education for Homeless Children & Youth 84.387 827$ Pass-through payments:
Commonwealth of Virginia Department of Education:Title I - Grants to Local Educational Agencies 84.010 971,995 ARRA - Title I - Grant to States 84.389 8,237 Total Title I Cluster 980,232
Special Education - Grants to States 84.027 1,026,486 Special Education - Preschool Grants 84.173 30,446 ARRA - Special Education Grants to States 84.391 8,845 Total Special Education Cluster 1,065,777
Safe and Drug-free Schools and Communities - State Grants 84.186 2,376 21st Century Community Learning Centers 84.287 228,713 English Language Acquisition Grants 84.365 82,878 Improving Teacher Quality State Grants 84.367 164,589 Education Technology State Grants 84.318 420 Vocational Education - Basic Grants to States 84.048 78,404 Education Jobs Fund Grant 84.410 208,048
Department of Behavioral Health and Developmental ServicesEarly Intervention 84.181 218,501 ARRA - Early Intervention 84.393 35,929
Total U.S. Department of Education 3,066,694
Department of Health and Human Services:
Pass-through Payments:
Department of Human Services:
Promoting Safe and Stable Families 93.556 15,949
Temporary Assistance to Needy Families 93.558 366,366
Refugee and Entrant Assistance 93.566 1,690
Low Income Home Energy Assistance 93.568 21,516
Child Care and Development Block Grant 93.575 121,428
Child Care Mandatory and Matching Funds of the Child Care and Development Fund 93.596 161,120
Total Child Care Assistance Cluster 282,548
Chafee Education and Training Vouchers Program 93.599 5,906
Child Welfare Services 93.645 950
Foster Care - Title IV-E 93.658 231,205
Adoption Assistance 93.659 196,254
Social Service Block Grant 93.667 205,686
Chafee Foster Care Independence Program 93.674 9,123
Medical Assistance Program 93.778 10,930
State Children's Insurance Program 93.767 231,533
Total U.S. Department of Health and Human Services 1,579,656
Total Expenditures of Federal Awards 9,828,196$
Notes to the Schedule of Expenditures of Federal Awards
Note 1: Basis of Presentation
Note 2: Non-Cash Assistance
The Schedule of Expenditures of Federal Awards is presented on the modified accrual basis of accounting as contemplated by generally accepted accounting
principles.
The City of Winchester participated in the National School Lunch Program, CFDA Number 10.555, which provides non-cash benefits. The Schedule of
Expenditures of Federal Awards includes commodity distributions of $97,831 from the National School Lunch Program.
CITY OF WINCHESTER, VIRGINIASCHEDULE OF EXPENDITURES OF FEDERAL AWARDS (Continued)
For the Year Ended June 30, 2012
126