2012 Annual Report€¦ · that differentiate Brand McDonald’s in the marketplace and building a...
54
2012 Annual Report
Transcript of 2012 Annual Report€¦ · that differentiate Brand McDonald’s in the marketplace and building a...

2012 Annual Report
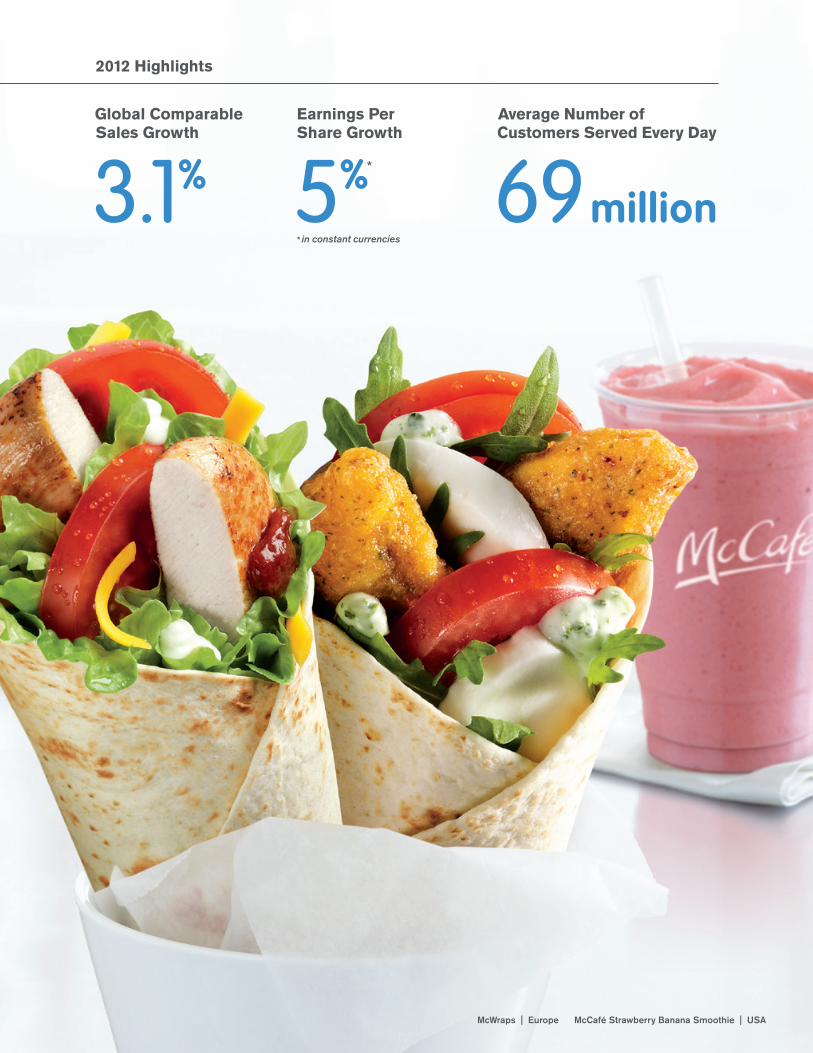
Global Comparable Sales Growth
3.1%
Average Number of Customers Served Every Day
69million
McWraps | Europe McCafé Strawberry Banana Smoothie | USA
Earnings Per Share Growth
5%*
* in constant currencies
2012 Highlights

Le M Burger | France Green Salad | Argentina
Sydney | Australia
Now more than ever, customers truly care about good food. The Golden Arches have always stood for quality, consistency and value. But today they also promise unique tastes, modern choices and real ingredients. Our World Famous Fries and our iconic Big Mac sandwich share the menu with tempting specialty coffees and creative new selections that put the fun in real fruits and vegetables. Wholesome ingredients like 100% beef, whole grains and freshly cracked eggs make it easy to enjoy quality food, every time, all at the speed of McDonald’s.
McDonald’s Corporation 2012 Annual Report | 1

24-Hour Accessibility | USA | Canada
Don Thompson, President and CEO & Tim Fenton, COO
2 | McDonald’s Corporation 2012 Annual Report * in constant currencies
To Our Valued Shareholders:
Our founder, Ray Kroc, made a statement about how we operate our business that is as relevant today as it was 60 years ago: “Take calculated risks. Act boldly and thoughtfully. Be an agile company.”
2012 was a testament to our resilient business model, the talented and aligned System of McDonald’s franchisees, supplier partners and company employees, and our broad experience in every type of operating environment. We grew global comparable sales 3.1%
and Systemwide sales 5%*. We increased operating income 4%* and diluted earnings per share 5%*. And, we returned $5.5 billion to shareholders through dividends and share repurchases.
We grew market share despite the flat to declining trend in the informal eating-out industry. The key: our ability to remain focused on our Plan to Win and our three global growth priorities to optimize our menu, modernize the customer experience and broaden accessibility to Brand McDonald’s. Most importantly, we’re doing it with franchisees, suppliers, company employees, managers and crew who are proud to be affiliated with us, and with a talented and diverse Board of Directors who provide sage guidance and strong corporate governance as we work together to deliver shareholder value.
Every day, 69 million customers visit our restaurants because we offer great-tasting food, exceptional service, and a clean, modern and engaging restaurant experience – all at a reasonable price.
We continued to build our business through our menu focus by encouraging markets to learn from each other and scale proven solutions. New products like McWraps from Poland or our McCafé specialty beverages that originated in Australia complement classic favorites – like the Big Mac, our Quarter Pounder with Cheese, our Egg McMuffin and our World Famous Fries – to give our customers compelling reasons to visit.
We also made significant progress toward becoming more modern and relevant. Nearly 60% of our restaurant interiors around the world have been re-imaged, and we expect to reach 50% with our exteriors by 2015. And, we continued evolving how we talk with our customers through our creative, digital and social media efforts.
In our journey to be accessible whenever and wherever our customers want McDonald’s, we added 1,439 new restaurants in established markets including the U.S., France, Germany and Australia … as well as in emerging markets like China, Brazil, India and Russia. We also grew delivery in APMEA and evolved our value offers to always have something for our customers with Value Lunch in China, P’tit Prix in France, our Loose Change Menu in Australia and our Dollar Menu in the U.S., to name a few.
$7.5’10
$8.5’11
$8.6’12
10.9%
10.3%
15.7%
S&P 500
DJIA
MCD
31.0%
31.6%
31.2%
’10
’11
’12
$4.58
$5.27
$5.36
’10
’11
’12
$2.4’10
$2.6’11
$2.9’12
Operating Income (in billions)
$7.5’10
$8.5’11
$8.6’12
10.9%
10.3%
15.7%
S&P 500
DJIA
MCD
31.0%
31.6%
31.2%
’10
’11
’12
$4.58
$5.27
$5.36
’10
’11
’12
$2.4’10
$2.6’11
$2.9’12
3-Year Compound Annual Total Return (2010-2012)

New Restaurant | Korea
When I proudly took on the role of CEO, I became even more motivated by the fact that within our success lies even greater opportunity. There is much more potential we can capture and we have a clear, straightforward vision for growth. We must continue driving enduring, profitable growth. We must strengthen consumers’ trust in our brand. And, we must always champion talent and leadership development.
I have no doubt we will serve more customers more often … that our customers will be more loyal … and that our restaurants will be more profitable. We’ve continued to invest in our operating platforms, our restaurants, our global food pipeline, our people and the customer experience. Moving forward, our challenge is two-fold: 1) be even more nimble in synthesizing the lessons we learn, sharing insights across borders and scaling proven solutions, and 2) increase our appeal by anticipating, innovating and seizing opportunities through the Plan to Win and our three global growth priorities.
Growing our business is about appealing to and serving more customers. It’s also about leveraging our incredible iconic brand to build consumers’ trust in us and drive long-term sustainable growth. We need to make sure our customers feel good about eating at McDonald’s and want to visit us again and again … that they feel good about the way we treat our people … and that they feel good about the deep connections we make in the communities where we operate.
It’s clear that outstanding people are the reason for the success of a dynamic global business like ours. We are a leading developer of today’s workforce and tomorrow’s leaders, whether franchisees, leading citizens who started as crew, or those who aspire to grow with and through McDonald’s. In this increasingly demanding marketplace, our collective charge is to do everything we can to strengthen our people and help them achieve their best.
On behalf of the entire McDonald’s System, please accept our sincere gratitude for your investment and confidence in our direction.
The late Fred Turner – our first grill man and the visionary who helped Ray transform his dream into reality – once said, “Satisfied customers will assure a vigorous and growing McDonald’s System.” I’m energized by our opportunity to continue being a bright spot in our customers’ day and confident in our ability to grow our business as we become even more relevant and more trusted all over the world.
Sincerely,
Don Thompson President and CEO
$7.5’10
$8.5’11
$8.6’12
10.9%
10.3%
15.7%
S&P 500
DJIA
MCD
31.0%
31.6%
31.2%
’10
’11
’12
$4.58
$5.27
$5.36
’10
’11
’12
$2.4’10
$2.6’11
$2.9’12
Earnings Per Share
$7.5’10
$8.5’11
$8.6’12
10.9%
10.3%
15.7%
S&P 500
DJIA
MCD
31.0%
31.6%
31.2%
’10
’11
’12
$4.58
$5.27
$5.36
’10
’11
’12
$2.4’10
$2.6’11
$2.9’12
Dividends Paid (in billions)
$7.5’10
$8.5’11
$8.6’12
10.9%
10.3%
15.7%
S&P 500
DJIA
MCD
31.0%
31.6%
31.2%
’10
’11
’12
$4.58
$5.27
$5.36
’10
’11
’12
$2.4’10
$2.6’11
$2.9’12
Combined Operating Margin
McDonald’s Corporation 2012 Annual Report | 3

Egg McMuffin & Hash Browns | USA
Andy McKenna, Chairman
4 | McDonald’s Corporation 2012 Annual Report
Dear Fellow Shareholders:
McDonald’s Corporation continued moving forward in 2012 despite a challenging environment, as we remained committed to meeting the ever-evolving needs of our customers around the world.
Guided by the Plan to Win, the McDonald’s System of franchisees, suppliers and employees continued working to make our brand more modern and in step with consumers everywhere. Your Board of Directors is pleased with the company’s continued focus on driving customer relevance and enhancing all aspects of the McDonald’s experience.
We continue to manage our business for the long-term, while staying committed to driving near-term growth. Our focus remains on leveraging the hard-earned competitive advantages that differentiate Brand McDonald’s in the marketplace and building a stronger, more profitable company.
McDonald’s strong, consistent leadership positions the company well to continue achieving these goals. We recognize Fred Turner, one of McDonald’s pioneers, who passed away recently and left a legacy of excellence for all to follow, and recently retired CEO Jim Skinner for his remarkable tenure – and now President and CEO Don Thompson and his global leadership team. Don is a tremendous leader with a deep knowledge and passion for our brand, and his team is skilled, seasoned and committed to raising the bar on all those things that drive our success – from our food and service to our convenience and value.
We believe that McDonald’s will continue to skillfully navigate through the current business environment to drive growth and deliver shareholder value. We remain confident in the company’s overall strategies, its strong leadership and the many talented employees around the world who deliver for our millions of guests every day.
McDonald’s Board of diverse and experienced business leaders remains committed to overseeing the company’s direction and advancing strong corporate governance. We eagerly embrace our responsibilities to help ensure the strength of this great brand moving forward.
On behalf of the entire Board of Directors, it is an honor and privilege to serve you, our shareholders.
Very truly yours,
Andy McKenna Chairman
Guided by the Plan to Win, the McDonald’s System of franchisees, suppliers and employees continued working to make our brand more modern and in step with consumers everywhere.

Bangkok | Thailand Madrid | Spain
Columbus, Ohio | USA
McDonald’s Corporation 2012 Annual Report | 5
When good people are engaged and valued, they’re empowered to make a difference for their guests, themselves and the world. Joining the McFamily opens doors to innovative training and genuinely unlimited opportunity. A McDonald’s career brings people together for good. Talent is rewarded. Ambition is stoked. Pride is earned. A culture of inclusion and respect creates lifelong brand ambassadors who feel connected to each other, their restaurants and especially their customers. The ways we stand up for our people help us stand out from the competition.

Green Restaurant | GermanyDirk Giannini, Lettuce Supplier | USA
Ronald McDonald House, Chicago, Illinois | USA
6 | McDonald’s Corporation 2012 Annual Report
Being a good neighbor means honestly caring about our local communities and the planet we all share. Our restaurants are committed to enriching neigh-borhoods by being a responsible employer and a welcoming, friendly place. Many local sports teams and schools find a champion under the Golden Arches. Across the globe we’re exploring bold ways to use less energy and reduce our carbon footprint. As we address the challenges of sustainability, we will leverage our size and scope as tools for good. Our charity of choice, Ronald McDonald House Charities helps families in crisis.

201
2F
inan
cial
Rep
ort

2012 Financial Report9 6-year Summary10 Stock Performance Graph11 Management’s Discussion and Analysis of Financial
Condition and Results of Operations28 Consolidated Statement of Income29 Consolidated Statement of Comprehensive Income30 Consolidated Balance Sheet31 Consolidated Statement of Cash Flows32 Consolidated Statement of Shareholders’ Equity33 Notes to Consolidated Financial Statements45 Quarterly Results (Unaudited)46 Management’s Assessment of Internal Control over
Financial Reporting47 Report of Independent Registered Public Accounting Firm48 Report of Independent Registered Public Accounting Firm
on Internal Control over Financial Reporting49 Executive Management & Business Unit Officers49 Board of Directors50 Investor Information
8 McDonald’s Corporation 2012 Annual Report

6-Year Summary
Dollars in millions, except per share data 2012 2011 2010 2009 2008 2007Company-operated sales $18,603 18,293 16,233 15,459 16,561 16,611Franchised revenues $ 8,964 8,713 7,842 7,286 6,961 6,176Total revenues $27,567 27,006 24,075 22,745 23,522 22,787Operating income $ 8,605 8,530 7,473 6,841(1) 6,443 3,879(4)
Income from continuing operations $ 5,465 5,503 4,946 4,551(1,2) 4,313(3) 2,335(4,5)
Net income $ 5,465 5,503 4,946 4,551(1,2) 4,313(3) 2,395(4,5,6)
Cash provided by operations $ 6,966 7,150 6,342 5,751 5,917 4,876Cash used for investing activities $ 3,167 2,571 2,056 1,655 1,625 1,150Capital expenditures $ 3,049 2,730 2,135 1,952 2,136 1,947Cash used for financing activities $ 3,850 4,533 3,729 4,421 4,115 3,996Treasury stock purchases(7) $ 2,605 3,373 2,648 2,854 3,981 3,949Common stock cash dividends $ 2,897 2,610 2,408 2,235 1,823 1,766Financial position at year end:Total assets $35,386 32,990 31,975 30,225 28,462 29,392Total debt $13,633 12,500 11,505 10,578 10,218 9,301Total shareholders’ equity $15,294 14,390 14,634 14,034 13,383 15,280Shares outstanding in millions 1,003 1,021 1,054 1,077 1,115 1,165Per common share:Income from continuing operations-diluted $ 5.36 5.27 4.58 4.11(1,2) 3.76(3) 1.93(4,5)
Earnings-diluted $ 5.36 5.27 4.58 4.11(1,2) 3.76(3) 1.98(4,5,6)
Dividends declared $ 2.87 2.53 2.26 2.05 1.63 1.50Market price at year end $ 88.21 100.33 76.76 62.44 62.19 58.91Company-operated restaurants 6,598 6,435 6,399 6,262 6,502 6,906Franchised restaurants 27,882 27,075 26,338 26,216 25,465 24,471Total Systemwide restaurants 34,480 33,510 32,737 32,478 31,967 31,377Franchised sales(8) $69,687 67,648 61,147 56,928 54,132 46,943(1) Includes pretax income due to Impairment and other charges (credits), net of $61.1 million ($91.4 million after tax or $0.08 per share) primarily related to the resolution of certain
liabilities retained in connection with the 2007 Latin America developmental license transaction.
(2) Includes income of $58.8 million ($0.05 per share) for gain on sale of investment related to the sale of the Company’s minority ownership interest in Redbox Automated Retail, LLC.
(3) Includes income of $109.0 million ($0.09 per share) for gain on sale of investment from the sale of the Company’s minority ownership interest in U.K.- based Pret A Manger.
(4) Includes pretax operating charges of $1.7 billion ($1.32 per share) due to Impairment and other charges (credits), net primarily as a result of the Company’s sale of its businesses in 18Latin American and Caribbean markets to a developmental licensee.
(5) Includes a tax benefit of $316.4 million ($0.26 per share) resulting from the completion of an Internal Revenue Service examination of the Company’s 2003-2004 U.S. federaltax returns.
(6) Includes income of $60.1 million ($0.05 per share) related to discontinued operations primarily from the sale of the Company’s investment in Boston Market.
(7) Represents treasury stock purchases as reflected in Shareholders’ equity.
(8) While franchised sales are not recorded as revenues by the Company, management believes they are important in understanding the Company’s financial performance because thesesales are the basis on which the Company calculates and records franchised revenues and are indicative of the financial health of the franchisee base. Franchised restaurants representmore than 80% of McDonald’s restaurants worldwide.
McDonald’s Corporation 2012 Annual Report 9

Stock Performance Graph
At least annually, we consider which companies comprise a read-ily identifiable investment peer group. McDonald’s is included inpublished restaurant indices; however, unlike most other compa-nies included in these indices, which have no or limitedinternational operations, McDonald’s does business in 119 coun-tries and a substantial portion of our revenues and income isgenerated outside the U.S. In addition, because of our size,McDonald’s inclusion in those indices tends to skew the results.Therefore, we believe that such a comparison is not meaningful.
Our market capitalization, trading volume and importance in anindustry that is vital to the U.S. economy have resulted in McDo-nald’s inclusion in the Dow Jones Industrial Average (DJIA) since1985. Like McDonald’s, many DJIA companies generate
meaningful revenues and income outside the U.S. and somemanage global brands. Thus, we believe that the use of the DJIAcompanies as the group for comparison purposes is appropriate.
The following performance graph shows McDonald’s cumulativetotal shareholder returns (i.e., price appreciation and reinvestmentof dividends) relative to the Standard & Poor’s 500 Stock Index(S&P 500 Index) and to the DJIA companies for the five-yearperiod ended December 31, 2012. The graph assumes that thevalue of an investment in McDonald’s common stock, the S&P500 Index and the DJIA companies (including McDonald’s) was$100 at December 31, 2007. For the DJIA companies, returnsare weighted for market capitalization as of the beginning ofeach period indicated. These returns may vary from those of theDow Jones Industrial Average Index, which is not weighted bymarket capitalization, and may be composed of different compa-nies during the period under consideration.
COMPARISON OF CUMULATIVE FIVE YEAR TOTAL RETURN
Dec '07 '08 '09 '10 '12'11
McDonald’s CorporationS&P 500 IndexDow Jones Industrials
$0
$50
$100
$150
$200
$250
100 109 113 143 193 175100 63 80 92 94 109100 68 84 95 103 114
Source: Capital IQ, a Standard & Poor’s business
10 McDonald’s Corporation 2012 Annual Report

Management’s Discussion and Analysis ofFinancial Condition and Results of Operations
OverviewDESCRIPTION OF THE BUSINESS
The Company franchises and operates McDonald’s restaurants.Of the 34,480 restaurants in 119 countries at year-end 2012,27,882 were franchised or licensed (including 19,869 franchisedto conventional franchisees, 4,350 licensed to developmentallicensees and 3,663 licensed to foreign affiliates (“affiliates”)—primarily Japan) and 6,598 were operated by the Company.Under our conventional franchise arrangement, franchisees pro-vide a portion of the capital required by initially investing in theequipment, signs, seating and décor of their restaurant business,and by reinvesting in the business over time. The Company ownsthe land and building or secures long-term leases for bothCompany-operated and conventional franchised restaurant sites.This maintains long-term occupancy rights, helps control relatedcosts and assists in alignment with franchisees. In certaincircumstances, the Company participates in reinvestment forconventional franchised restaurants. Under our developmentallicense arrangement, licensees provide capital for the entirebusiness, including the real estate interest, and the Company hasno capital invested. In addition, the Company has an equityinvestment in a limited number of affiliates that invest in realestate and operate or franchise restaurants within a market.
We view ourselves primarily as a franchisor and believe fran-chising is important to delivering great, locally-relevant customerexperiences and driving profitability. However, directly operatingrestaurants is paramount to being a credible franchisor and isessential to providing Company personnel with restaurant oper-ations experience. In our Company-operated restaurants, and incollaboration with franchisees, we further develop and refineoperating standards, marketing concepts and product and pricingstrategies, so that only those that we believe are most beneficialare introduced in the restaurants. We continually review, and asappropriate adjust, our mix of Company-operated and franchisedor licensed (conventional franchised, developmental licensed andforeign affiliated) restaurants to help optimize overallperformance.
The Company’s revenues consist of sales by Company-operated restaurants and fees from restaurants operated byfranchisees. Revenues from conventional franchised restaurantsinclude rent and royalties based on a percent of sales along withminimum rent payments, and initial fees. Revenues from restau-rants licensed to affiliates and developmental licensees include aroyalty based on a percent of sales, and generally include initialfees. Fees vary by type of site, amount of Company investment, ifany, and local business conditions. These fees, along with occu-pancy and operating rights, are stipulated in franchise/licenseagreements that generally have 20-year terms.
The business is managed as distinct geographic segments.Significant reportable segments include the United States(“U.S.”), Europe, and Asia/Pacific, Middle East and Africa(“APMEA”). In addition, throughout this report we present “OtherCountries & Corporate” that includes operations in Canada andLatin America, as well as Corporate activities. The U.S., Europeand APMEA segments account for 32%, 39% and 23% of totalrevenues, respectively. The United Kingdom (“U.K.”), France and
Germany, collectively, account for 51% of Europe’s revenues;and China, Australia and Japan (a 50%-owned affiliateaccounted for under the equity method), collectively, account for56% of APMEA’s revenues. These six markets along with theU.S. and Canada are referred to as “major markets” throughoutthis report and comprise 70% of total revenues.
In analyzing business trends, management considers a varietyof performance and financial measures, including comparablesales and comparable guest count growth, Systemwide salesgrowth and returns.
• Constant currency results exclude the effects of foreign cur-rency translation and are calculated by translating current yearresults at prior year average exchange rates. Managementreviews and analyzes business results in constant currenciesand bases certain incentive compensation plans on theseresults because we believe this better represents the Compa-ny’s underlying business trends.
• Comparable sales and comparable guest counts are key per-formance indicators used within the retail industry and areindicative of acceptance of the Company’s initiatives as well aslocal economic and consumer trends. Increases or decreasesin comparable sales and comparable guest counts representthe percent change in sales and transactions, respectively,from the same period in the prior year for all restaurants,whether operated by the Company or franchisees, in operationat least thirteen months, including those temporarily closed.Some of the reasons restaurants may be temporarily closedinclude reimaging or remodeling, rebuilding, road constructionand natural disasters. Comparable sales exclude the impact ofcurrency translation. Comparable sales are driven by changesin guest counts and average check, which is affected bychanges in pricing and product mix. Generally, the goal is toachieve a balanced contribution from both guest counts andaverage check.
McDonald’s reports on a calendar basis and therefore thecomparability of the same month, quarter and year with thecorresponding period of the prior year will be impacted by themix of days. The number of weekdays and weekend days in agiven timeframe can have a positive or negative impact oncomparable sales and guest counts. The Company refers tothese impacts as calendar shift/trading day adjustments. Inaddition, the timing of holidays can impact comparable salesand guest counts. These impacts vary geographically due toconsumer spending patterns and have the greatest effect onmonthly comparable sales and guest counts while the annualimpacts are typically minimal.
• Systemwide sales include sales at all restaurants. While fran-chised sales are not recorded as revenues by the Company,management believes the information is important in under-standing the Company’s financial performance because thesesales are the basis on which the Company calculates andrecords franchised revenues and are indicative of the financialhealth of the franchisee base.
• Return on incremental invested capital (“ROIIC”) is a measurereviewed by management over one-year and three-year timeperiods to evaluate the overall profitability of the businessunits, the effectiveness of capital deployed and the future allo-cation of capital. The return is calculated by dividing thechange in operating income plus depreciation and amortization
McDonald’s Corporation 2012 Annual Report 11
(numerator) by the cash used for investing activities(denominator), primarily capital expenditures. The calculationuses a constant average foreign exchange rate over the peri-ods included in the calculation.
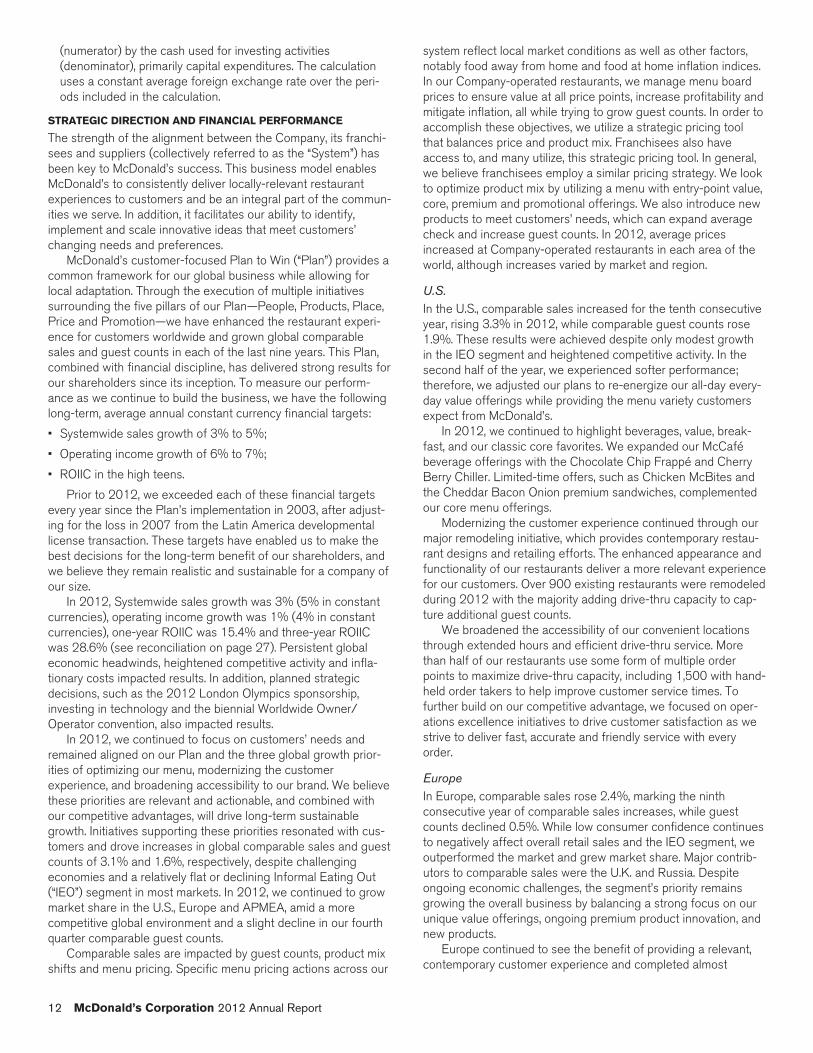
STRATEGIC DIRECTION AND FINANCIAL PERFORMANCE
The strength of the alignment between the Company, its franchi-sees and suppliers (collectively referred to as the “System”) hasbeen key to McDonald’s success. This business model enablesMcDonald’s to consistently deliver locally-relevant restaurantexperiences to customers and be an integral part of the commun-ities we serve. In addition, it facilitates our ability to identify,implement and scale innovative ideas that meet customers’changing needs and preferences.
McDonald’s customer-focused Plan to Win (“Plan”) provides acommon framework for our global business while allowing forlocal adaptation. Through the execution of multiple initiativessurrounding the five pillars of our Plan—People, Products, Place,Price and Promotion—we have enhanced the restaurant experi-ence for customers worldwide and grown global comparablesales and guest counts in each of the last nine years. This Plan,combined with financial discipline, has delivered strong results forour shareholders since its inception. To measure our perform-ance as we continue to build the business, we have the followinglong-term, average annual constant currency financial targets:
• Systemwide sales growth of 3% to 5%;
• Operating income growth of 6% to 7%;
• ROIIC in the high teens.
Prior to 2012, we exceeded each of these financial targetsevery year since the Plan’s implementation in 2003, after adjust-ing for the loss in 2007 from the Latin America developmentallicense transaction. These targets have enabled us to make thebest decisions for the long-term benefit of our shareholders, andwe believe they remain realistic and sustainable for a company ofour size.
In 2012, Systemwide sales growth was 3% (5% in constantcurrencies), operating income growth was 1% (4% in constantcurrencies), one-year ROIIC was 15.4% and three-year ROIICwas 28.6% (see reconciliation on page 27). Persistent globaleconomic headwinds, heightened competitive activity and infla-tionary costs impacted results. In addition, planned strategicdecisions, such as the 2012 London Olympics sponsorship,investing in technology and the biennial Worldwide Owner/Operator convention, also impacted results.
In 2012, we continued to focus on customers’ needs andremained aligned on our Plan and the three global growth prior-ities of optimizing our menu, modernizing the customerexperience, and broadening accessibility to our brand. We believethese priorities are relevant and actionable, and combined withour competitive advantages, will drive long-term sustainablegrowth. Initiatives supporting these priorities resonated with cus-tomers and drove increases in global comparable sales and guestcounts of 3.1% and 1.6%, respectively, despite challengingeconomies and a relatively flat or declining Informal Eating Out(“IEO”) segment in most markets. In 2012, we continued to growmarket share in the U.S., Europe and APMEA, amid a morecompetitive global environment and a slight decline in our fourthquarter comparable guest counts.
Comparable sales are impacted by guest counts, product mixshifts and menu pricing. Specific menu pricing actions across our
system reflect local market conditions as well as other factors,notably food away from home and food at home inflation indices.In our Company-operated restaurants, we manage menu boardprices to ensure value at all price points, increase profitability andmitigate inflation, all while trying to grow guest counts. In order toaccomplish these objectives, we utilize a strategic pricing toolthat balances price and product mix. Franchisees also haveaccess to, and many utilize, this strategic pricing tool. In general,we believe franchisees employ a similar pricing strategy. We lookto optimize product mix by utilizing a menu with entry-point value,core, premium and promotional offerings. We also introduce newproducts to meet customers’ needs, which can expand averagecheck and increase guest counts. In 2012, average pricesincreased at Company-operated restaurants in each area of theworld, although increases varied by market and region.
U.S.In the U.S., comparable sales increased for the tenth consecutiveyear, rising 3.3% in 2012, while comparable guest counts rose1.9%. These results were achieved despite only modest growthin the IEO segment and heightened competitive activity. In thesecond half of the year, we experienced softer performance;therefore, we adjusted our plans to re-energize our all-day every-day value offerings while providing the menu variety customersexpect from McDonald’s.
In 2012, we continued to highlight beverages, value, break-fast, and our classic core favorites. We expanded our McCafébeverage offerings with the Chocolate Chip Frappé and CherryBerry Chiller. Limited-time offers, such as Chicken McBites andthe Cheddar Bacon Onion premium sandwiches, complementedour core menu offerings.
Modernizing the customer experience continued through ourmajor remodeling initiative, which provides contemporary restau-rant designs and retailing efforts. The enhanced appearance andfunctionality of our restaurants deliver a more relevant experiencefor our customers. Over 900 existing restaurants were remodeledduring 2012 with the majority adding drive-thru capacity to cap-ture additional guest counts.
We broadened the accessibility of our convenient locationsthrough extended hours and efficient drive-thru service. Morethan half of our restaurants use some form of multiple orderpoints to maximize drive-thru capacity, including 1,500 with hand-held order takers to help improve customer service times. Tofurther build on our competitive advantage, we focused on oper-ations excellence initiatives to drive customer satisfaction as westrive to deliver fast, accurate and friendly service with everyorder.
EuropeIn Europe, comparable sales rose 2.4%, marking the ninthconsecutive year of comparable sales increases, while guestcounts declined 0.5%. While low consumer confidence continuesto negatively affect overall retail sales and the IEO segment, weoutperformed the market and grew market share. Major contrib-utors to comparable sales were the U.K. and Russia. Despiteongoing economic challenges, the segment’s priority remainsgrowing the overall business by balancing a strong focus on ourunique value offerings, ongoing premium product innovation, andnew products.
Europe continued to see the benefit of providing a relevant,contemporary customer experience and completed almost
12 McDonald’s Corporation 2012 Annual Report

750 restaurant reimages. By the end of 2012, over 90% of res-taurant interiors and approximately 50% of exteriors had beenreimaged. Europe also invested in a roll-out of a new point-of-sale system, which allows us to continue to expand our menuofferings and improve order accuracy. By the end of 2012, over2,200 restaurants had deployed this system.
We expanded our coffee business and have over 1,600McCafé locations, which in Europe are generally separate areasinside the restaurants that serve specialty coffees, desserts andsnacks. In addition, we increased our accessibility and con-venience with extended operating hours, self-order kiosks,optimized drive-thrus, and opened over 250 new restaurants.
APMEAIn APMEA, comparable sales rose 1.4% and comparable guestcounts rose 2.2%, despite a challenging year of economic pres-sures, partly due to Japan’s uneven recovery and China’s slowereconomic growth. Positive performance was driven by China,Australia and many other markets. Unique value platforms, greattasting premium menu selections, locally-relevant menu variety,and convenience and service enhancements differentiated theMcDonald’s experience. Australia launched the “Loose ChangeMenu,” which is a branded affordability menu, while Chinafocused on breakfast, lunch, and dinner value platforms. Valueinitiatives were balanced with mid-tier offers, such as Bubble Teain China, and premium limited-time offers, such as the SeriousLamb Burger and Wrap in Australia.
Our breakfast business has expanded and is offered inapproximately 75% of APMEA restaurants. Desserts continuedto play a meaningful role, particularly in China, where we remainone of the largest ice cream retailers.
We opened over 750 new restaurants in APMEA, of whichover 250 were in China, where we have made significant prog-ress toward our goal of 2,000 restaurants by the end of 2013.Nearly two-thirds of APMEA restaurants are offering some formof extended operating hours and over 5,400 restaurants areopen 24 hours. Delivery is offered in many APMEA markets andis now available in over 1,700 restaurants, including nearly 550 inChina.
Since Japan’s natural disaster in March of 2011, theeconomy remains a challenge. Despite a declining IEO segment,McDonald’s is gaining market share through a value platform of100, 250, and 500 YEN offerings, and family sharing boxes,such as 15-piece Chicken McNuggets. Japan augmented itsvalue platform with strategic couponing to encourage add-on andExtra Value Meal purchases.
ConsolidatedGlobally, our approach to offering affordable value to our custom-ers is complemented by a focus on driving operating efficienciesand leveraging our scale, supply chain infrastructure and oursuppliers’ risk management practices to manage costs. We wereable to execute our strategies in every area of the world, growcomparable sales and control selling, general and administrativeexpenses. However, in 2012 we faced top—and bottom-linepressures, some a result of planned strategic decisions, andothers driven by the external environment. As a result, combinedoperating margin (operating income as a percent of total rev-enues) was 31.2% in 2012, down 0.4 percentage points ascompared to 2011.
In 2012, cash from operations was nearly $7.0 billion. Oursubstantial cash flow, strong credit rating and continued access
to credit provide us flexibility to fund capital expenditures as wellas return cash to shareholders. Capital expenditures of approx-imately $3.0 billion were invested in our business primarily toreimage existing restaurants and open new restaurants. Acrossthe System, over 1,400 restaurants were opened and about2,400 existing locations were reimaged. In addition, we returned$5.5 billion to shareholders consisting of $2.9 billion in dividendsand $2.6 billion in share repurchases.
Cash from operations continues to benefit from our heavilyfranchised business model as the rent and royalty incomereceived from owner/operators is a stable revenue stream thathas relatively low costs. In addition, the franchise business modelis less capital intensive than the Company-owned model. Webelieve locally-owned and operated restaurants maximize brandperformance and are at the core of our competitive advantages,making McDonald’s not just a global brand but also a locally–relevant one.
HIGHLIGHTS FROM THE YEAR INCLUDED:
• Comparable sales grew 3.1% and guest counts rose 1.6%,building on 2011 increases of 5.6% and 3.7%, respectively.
• Revenues increased 2% (5% in constant currencies).
• Operating income increased 1% (4% in constant currencies).
• Diluted earnings per share was $5.36, an increase of 2% (5%in constant currencies).
• Cash provided by operations was nearly $7.0 billion.
• One-year ROIIC was 15.4% and three-year ROIIC was 28.6%for the period ended December 31, 2012.
• The Company increased the quarterly cash dividend per share10% to $0.77 for the fourth quarter—bringing our currentannual dividend to $3.08 per share.
• The Company returned $5.5 billion to shareholders throughdividends and share repurchases.
OUTLOOK FOR 2013
We will continue to build the business in 2013 and beyond byenhancing the customer experience across all pillars of our Planand our three global growth priorities to optimize our menu,modernize the customer experience and broaden accessibility toour brand. We remain focused on seizing the long-term oppor-tunities in the $1 trillion IEO segment by leveraging ourcompetitive advantages. We have a brand advantage in con-venience, menu variety and value, a resilient business model, andthe experience and alignment throughout the McDonald’s Sys-tem to navigate the current environment.
Our number one priority continues to be satisfying our custom-ers’ needs by serving great-tasting, high-quality food incontemporary restaurants. This focus on our customers is partic-ularly critical in this uncertain environment, where ongoingvolatility continues to negatively impact consumer sentiment andspending. We anticipate a continued flat to declining IEO seg-ment in many of the markets where we operate. Growing marketshare will remain our focus to attain sustainable and profitablelong-term growth.
We will highlight promotions of our core menu favorites, whilestrategically expanding our menu with relevant new offeringsacross all dayparts, including premium products that can deliver ahigher average check. We will place an even greater emphasis onscaling success quickly around the globe. For example, in many
McDonald’s Corporation 2012 Annual Report 13
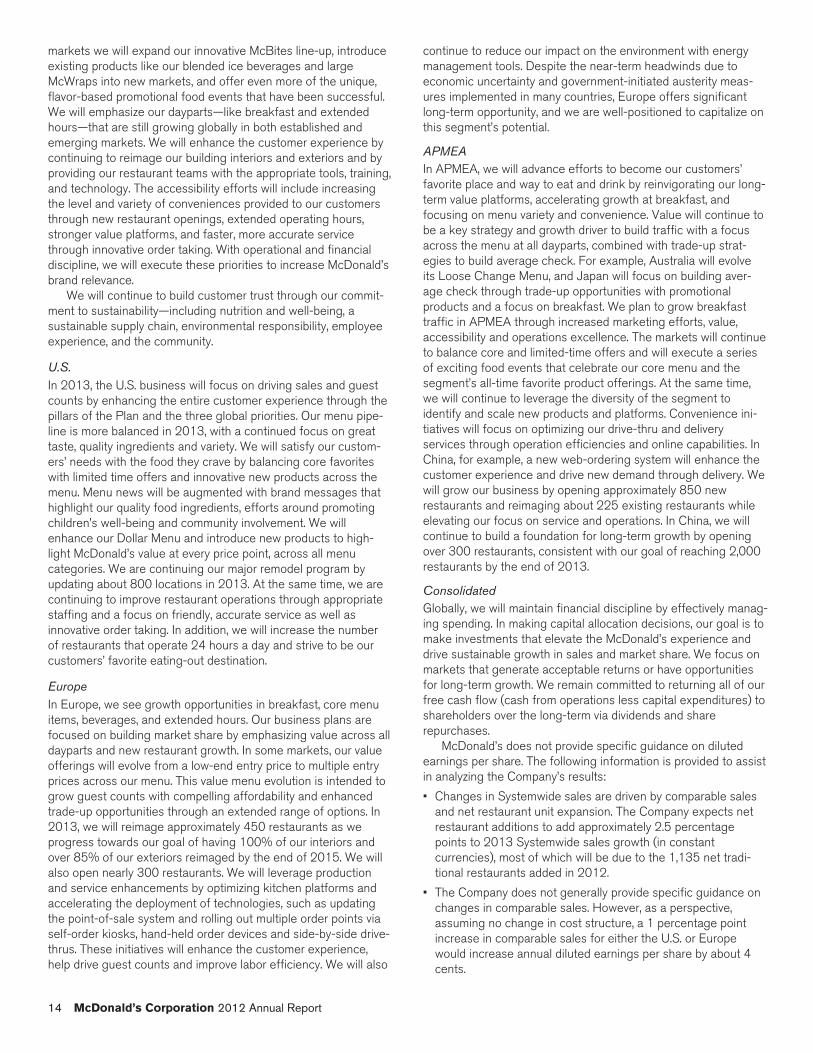
markets we will expand our innovative McBites line-up, introduceexisting products like our blended ice beverages and largeMcWraps into new markets, and offer even more of the unique,flavor-based promotional food events that have been successful.We will emphasize our dayparts—like breakfast and extendedhours—that are still growing globally in both established andemerging markets. We will enhance the customer experience bycontinuing to reimage our building interiors and exteriors and byproviding our restaurant teams with the appropriate tools, training,and technology. The accessibility efforts will include increasingthe level and variety of conveniences provided to our customersthrough new restaurant openings, extended operating hours,stronger value platforms, and faster, more accurate servicethrough innovative order taking. With operational and financialdiscipline, we will execute these priorities to increase McDonald’sbrand relevance.
We will continue to build customer trust through our commit-ment to sustainability—including nutrition and well-being, asustainable supply chain, environmental responsibility, employeeexperience, and the community.
U.S.In 2013, the U.S. business will focus on driving sales and guestcounts by enhancing the entire customer experience through thepillars of the Plan and the three global priorities. Our menu pipe-line is more balanced in 2013, with a continued focus on greattaste, quality ingredients and variety. We will satisfy our custom-ers’ needs with the food they crave by balancing core favoriteswith limited time offers and innovative new products across themenu. Menu news will be augmented with brand messages thathighlight our quality food ingredients, efforts around promotingchildren’s well-being and community involvement. We willenhance our Dollar Menu and introduce new products to high-light McDonald’s value at every price point, across all menucategories. We are continuing our major remodel program byupdating about 800 locations in 2013. At the same time, we arecontinuing to improve restaurant operations through appropriatestaffing and a focus on friendly, accurate service as well asinnovative order taking. In addition, we will increase the numberof restaurants that operate 24 hours a day and strive to be ourcustomers’ favorite eating-out destination.
EuropeIn Europe, we see growth opportunities in breakfast, core menuitems, beverages, and extended hours. Our business plans arefocused on building market share by emphasizing value across alldayparts and new restaurant growth. In some markets, our valueofferings will evolve from a low-end entry price to multiple entryprices across our menu. This value menu evolution is intended togrow guest counts with compelling affordability and enhancedtrade-up opportunities through an extended range of options. In2013, we will reimage approximately 450 restaurants as weprogress towards our goal of having 100% of our interiors andover 85% of our exteriors reimaged by the end of 2015. We willalso open nearly 300 restaurants. We will leverage productionand service enhancements by optimizing kitchen platforms andaccelerating the deployment of technologies, such as updatingthe point-of-sale system and rolling out multiple order points viaself-order kiosks, hand-held order devices and side-by-side drive-thrus. These initiatives will enhance the customer experience,help drive guest counts and improve labor efficiency. We will also
continue to reduce our impact on the environment with energymanagement tools. Despite the near-term headwinds due toeconomic uncertainty and government-initiated austerity meas-ures implemented in many countries, Europe offers significantlong-term opportunity, and we are well-positioned to capitalize onthis segment’s potential.
APMEAIn APMEA, we will advance efforts to become our customers’favorite place and way to eat and drink by reinvigorating our long-term value platforms, accelerating growth at breakfast, andfocusing on menu variety and convenience. Value will continue tobe a key strategy and growth driver to build traffic with a focusacross the menu at all dayparts, combined with trade-up strat-egies to build average check. For example, Australia will evolveits Loose Change Menu, and Japan will focus on building aver-age check through trade-up opportunities with promotionalproducts and a focus on breakfast. We plan to grow breakfasttraffic in APMEA through increased marketing efforts, value,accessibility and operations excellence. The markets will continueto balance core and limited-time offers and will execute a seriesof exciting food events that celebrate our core menu and thesegment’s all-time favorite product offerings. At the same time,we will continue to leverage the diversity of the segment toidentify and scale new products and platforms. Convenience ini-tiatives will focus on optimizing our drive-thru and deliveryservices through operation efficiencies and online capabilities. InChina, for example, a new web-ordering system will enhance thecustomer experience and drive new demand through delivery. Wewill grow our business by opening approximately 850 newrestaurants and reimaging about 225 existing restaurants whileelevating our focus on service and operations. In China, we willcontinue to build a foundation for long-term growth by openingover 300 restaurants, consistent with our goal of reaching 2,000restaurants by the end of 2013.
ConsolidatedGlobally, we will maintain financial discipline by effectively manag-ing spending. In making capital allocation decisions, our goal is tomake investments that elevate the McDonald’s experience anddrive sustainable growth in sales and market share. We focus onmarkets that generate acceptable returns or have opportunitiesfor long-term growth. We remain committed to returning all of ourfree cash flow (cash from operations less capital expenditures) toshareholders over the long-term via dividends and sharerepurchases.
McDonald’s does not provide specific guidance on dilutedearnings per share. The following information is provided to assistin analyzing the Company’s results:
• Changes in Systemwide sales are driven by comparable salesand net restaurant unit expansion. The Company expects netrestaurant additions to add approximately 2.5 percentagepoints to 2013 Systemwide sales growth (in constantcurrencies), most of which will be due to the 1,135 net tradi-tional restaurants added in 2012.
• The Company does not generally provide specific guidance onchanges in comparable sales. However, as a perspective,assuming no change in cost structure, a 1 percentage pointincrease in comparable sales for either the U.S. or Europewould increase annual diluted earnings per share by about 4cents.
14 McDonald’s Corporation 2012 Annual Report

• With about 75% of McDonald’s grocery bill comprised of 10different commodities, a basket of goods approach is the mostcomprehensive way to look at the Company’s commodity costs.For the full year 2013, the total basket of goods cost isexpected to increase 1.5-2.5% in the U.S. and 3-4% in Europe.
• The Company expects full-year 2013 selling, general andadministrative expenses to increase approximately 2-3% inconstant currencies, with fluctuations expected between thequarters.
• Based on current interest and foreign currency exchange rates,the Company expects interest expense for the full year 2013to increase approximately 4-6% compared with 2012.
• A significant part of the Company’s operating income is gen-erated outside the U.S., and about 35% of its total debt isdenominated in foreign currencies. Accordingly, earnings areaffected by changes in foreign currency exchange rates,particularly the Euro, British Pound, Australian Dollar andCanadian Dollar. Collectively, these currencies representapproximately 65% of the Company’s operating income out-side the U.S. If all four of these currencies moved by 10% inthe same direction, the Company’s annual diluted earnings pershare would change by about 25 cents.
• The Company expects the effective income tax rate for the full-year 2013 to be 31% to 33%. Some volatility may beexperienced between the quarters resulting in a quarterly taxrate that is outside the annual range. As a result of the Ameri-can Taxpayer Relief Act of 2012, our income tax provision forthe first quarter of 2013 will include a tax benefit of about $50million reflecting the retroactive impact of certain tax benefits,which may result in a first quarter effective tax rate below thefull year range.
• The Company expects capital expenditures for 2013 to beapproximately $3.2 billion. Over half of this amount will be usedto open new restaurants. The Company expects to openbetween 1,500–1,600 restaurants including about 500restaurants in affiliated and developmental licensee markets,such as Japan and Latin America, where the Company doesnot fund any capital expenditures. The Company expects netadditions of between 1,200–1,300 traditional restaurants. Theremaining capital will be used to reinvest in existing locations,in part through reimaging. More than 1,600 restaurants world-wide are expected to be reimaged, including locations inaffiliated and developmental licensee markets that require nocapital investment from the Company.
McDonald’s Corporation 2012 Annual Report 15

Consolidated Operating Results
Operating results
2012 2011 2010
Dollars in millions, except per share data AmountIncrease/
(decrease) AmountIncrease/
(decrease) Amount
RevenuesSales by Company-operated restaurants $ 18,603 2% $ 18,293 13% $ 16,233Revenues from franchised restaurants 8,964 3 8,713 11 7,842
Total revenues 27,567 2 27,006 12 24,075Operating costs and expensesCompany-operated restaurant expenses 15,224 3 14,838 14 13,060Franchised restaurants-occupancy expenses 1,527 3 1,481 8 1,378Selling, general & administrative expenses 2,455 3 2,394 3 2,333Impairment and other charges (credits), net 8 nm (4) nm 29Other operating (income) expense, net (252) (8) (233) (18) (198)
Total operating costs and expenses 18,962 3 18,476 11 16,602Operating income 8,605 1 8,530 14 7,473Interest expense 517 5 493 9 451Nonoperating (income) expense, net 9 (64) 25 13 22Income before provision for income taxes 8,079 1 8,012 14 7,000Provision for income taxes 2,614 4 2,509 22 2,054Net income $ 5,465 (1%) $ 5,503 11% $ 4,946Earnings per common share—diluted $ 5.36 2% $ 5.27 15% $ 4.58Weighted-average common shares outstanding—
diluted 1,020.2 (2%) 1,044.9 (3%) 1,080.3nm Not meaningful
IMPACT OF FOREIGN CURRENCY TRANSLATION ON REPORTED RESULTS
While changes in foreign currency exchange rates affect reported results, McDonald’s mitigates exposures, where practical, by financingin local currencies, hedging certain foreign-denominated cash flows, and purchasing goods and services in local currencies.
In 2012, foreign currency translation had a negative impact on consolidated operating results primarily due to the weaker Euro, alongwith most other currencies. In 2011, foreign currency translation had a positive impact on consolidated operating results driven by thestronger Euro and Australian Dollar, as well as most other currencies. In 2010, foreign currency translation had a positive impact onconsolidated operating results driven by stronger global currencies, primarily the Australian Dollar and Canadian Dollar, partly offset bythe weaker Euro.
Impact of foreign currency translation on reported results
Reported amountCurrency translation
benefit/(cost)In millions, except per share data 2012 2011 2010 2012 2011 2010
Revenues $27,567 $27,006 $24,075 $ (726) $ 944 $ 188Company-operated margins 3,379 3,455 3,173 (97) 134 35Franchised margins 7,437 7,232 6,464 (204) 213 (14)Selling, general & administrative expenses 2,455 2,394 2,333 40 (55) (12)Operating income 8,605 8,530 7,473 (261) 301 13Net income 5,465 5,503 4,946 (178) 195 13Earnings per common share—diluted 5.36 5.27 4.58 (0.17) 0.19 0.01
16 McDonald’s Corporation 2012 Annual Report

NET INCOME AND DILUTED EARNINGS PER COMMON SHARE
In 2012, net income decreased 1% (increased 3% in constantcurrencies) to $5.5 billion and diluted earnings per commonshare increased 2% (5% in constant currencies) to $5.36. For-eign currency translation had a negative impact of $0.17 pershare on diluted earnings per share. Net income and dilutedearnings per share growth in constant currencies were positivelyimpacted by growth in franchised margin dollars, partly offset bya higher effective income tax rate and higher selling, general andadministrative expenses. A decrease of 2% in diluted weightedaverage shares outstanding also contributed to the diluted earn-ings per share growth in 2012.
In 2011, net income increased 11% (7% in constant curren-cies) to $5.5 billion and diluted earnings per common share
increased 15% (11% in constant currencies) to $5.27. Foreigncurrency translation had a positive impact of $0.19 per share ondiluted earnings per share. Net income and diluted earnings pershare growth in 2011 in constant currencies were positivelyimpacted by growth in franchised margin dollars, and to a lesserextent, Company-operated margin dollars, partly offset by ahigher effective income tax rate. A decrease of 3% in dilutedweighted average shares outstanding also contributed to thediluted earnings per share growth in 2011.
The Company repurchased 28.1 million shares of its stock for$2.6 billion in 2012 and 41.9 million shares of its stock for $3.4billion in 2011, driving reductions in weighted average sharesoutstanding on a diluted basis in both periods.
REVENUES
The Company’s revenues consist of sales by Company-operated restaurants and fees from restaurants operated by franchisees. Rev-enues from conventional franchised restaurants include rent and royalties based on a percent of sales along with minimum rentpayments, and initial fees. Revenues from franchised restaurants that are licensed to foreign affiliates and developmental licenseesinclude a royalty based on a percent of sales, and generally include initial fees.
In 2012 and 2011, constant currency revenue growth was driven primarily by positive comparable sales as well as expansion.
Revenues
Amount Increase/(decrease)
Increase/(decrease)excluding currency
translationDollars in millions 2012 2011 2010 2012 2011 2012 2011
Company-operated sales:U.S. $ 4,530 $ 4,433 $ 4,229 2% 5% 2% 5%Europe 7,850 7,852 6,932 0 13 6 8APMEA 5,350 5,061 4,297 6 18 5 11Other Countries & Corporate 873 947 775 (8) 22 (7) 17
Total $18,603 $18,293 $16,233 2% 13% 4% 8%Franchised revenues:U.S. $ 4,284 $ 4,096 $ 3,883 5% 5% 5% 5%Europe 2,977 3,034 2,637 (2) 15 5 9APMEA 1,041 958 769 9 25 9 14Other Countries & Corporate 662 625 553 6 13 11 8
Total $ 8,964 $ 8,713 $ 7,842 3% 11% 6% 8%Total revenues:U.S. $ 8,814 $ 8,529 $ 8,112 3% 5% 3% 5%Europe 10,827 10,886 9,569 (1) 14 6 8APMEA 6,391 6,019 5,066 6 19 6 11Other Countries & Corporate 1,535 1,572 1,328 (2) 18 0 14
Total $27,567 $27,006 $24,075 2% 12% 5% 8%
In the U.S., the increase in revenues in 2012 was primarilydue to positive comparable sales. Everyday value offerings, menuvariety and the enhanced customer experience due to reimagingcontributed positively to results, despite broad competitive activ-ity. Revenues in 2011 were positively impacted by the ongoingappeal of our iconic core products and the success of new prod-ucts, including additions to the McCafé beverage line, as well ascontinued focus on everyday value, convenience and modernizingthe customer experience.
Europe’s constant currency increases in revenues in 2012and 2011 were primarily driven by positive comparable sales in
the U.K. and Russia, the segment’s two largest Company-operated restaurant markets, as well as expansion in Russia.Revenues in 2011 also benefited from comparable salesincreases in France and Germany.
In APMEA, the constant currency increase in revenues in2012 was driven by positive comparable sales in China, Australiaand many other markets. The constant currency increase in rev-enues in 2011 was primarily driven by comparable salesincreases in China and most other markets. Expansion, primarilyin China, also contributed to revenue growth in both periods.
McDonald’s Corporation 2012 Annual Report 17

The following tables present comparable sales, comparable guest counts and Systemwide sales increases/(decreases):
Comparable sales and guest count increases/(decreases)
2012 2011 2010
SalesGuest
Counts SalesGuest
Counts SalesGuest
Counts
U.S. 3.3% 1.9% 4.8% 3.3% 3.8% 5.3%Europe 2.4 (0.5) 5.9 3.4 4.4 2.7APMEA 1.4 2.2 4.7 4.3 6.0 4.9Other Countries & Corporate 7.7 3.0 10.1 4.5 11.3 8.3
Total 3.1% 1.6% 5.6% 3.7% 5.0% 4.9%
Systemwide sales increases/(decreases)
Excluding currencytranslation
2012 2011 2012 2011
U.S. 4% 5% 4% 5%Europe (2) 14 5 9APMEA 5 16 6 7Other Countries & Corporate 4 17 10 12
Total 3% 11% 5% 7%
Franchised sales are not recorded as revenues by the Company, but are the basis on which the Company calculates and recordsfranchised revenues and are indicative of the financial health of the franchisee base. The following table presents franchised sales andthe related increases/(decreases):
Franchised sales
Amount Increase/(decrease)Increase excluding
currency translationDollars in millions 2012 2011 2010 2012 2011 2012 2011
U.S. $31,063 $29,739 $28,166 4% 6% 4% 6%Europe 16,857 17,243 15,049 (2) 15 5 9APMEA 13,723 13,041 11,373 5 15 6 6Other Countries & Corporate 8,044 7,625 6,559 5 16 12 12
Total $69,687 $67,648 $61,147 3% 11% 6% 7%
RESTAURANT MARGINS
• Franchised marginsFranchised margin dollars represent revenues from franchisedrestaurants less the Company’s occupancy costs (rent anddepreciation) associated with those sites. Franchised margindollars represented about two-thirds of the combined restaurantmargins in 2012, 2011 and 2010. Franchised margin dollarsincreased $205 million or 3% (6% in constant currencies) in2012 and $768 million or 12% (9% in constant currencies) in2011. Positive comparable sales were the primary driver of theconstant currency growth in franchised margin dollars inboth years.
Franchised margins
In millions 2012 2011 2010
U.S. $3,594 $3,436 $3,239Europe 2,352 2,400 2,063APMEA 924 858 686Other Countries & Corporate 567 538 476
Total $7,437 $7,232 $6,464
Percent of revenues
U.S. 83.9% 83.9% 83.4%Europe 79.0 79.1 78.2APMEA 88.8 89.5 89.3Other Countries & Corporate 85.6 86.1 86.0
Total 83.0% 83.0% 82.4%
In the U.S., the franchised margin percent was flat in 2012 ascomparable sales performance was offset by higher depreciationrelated to reimaging. The increase in 2011 was primarily due topositive comparable sales, partly offset by higher occupancyexpenses.
18 McDonald’s Corporation 2012 Annual Report

In Europe, the franchised margin percent decrease in 2012reflected positive comparable sales and higher occupancy costs.The increase in 2011 was primarily due to positive comparablesales, partly offset by higher occupancy expenses.
In APMEA, the franchised margin percent decrease in 2012was primarily due to Australia, which was partly impacted by the2012 change in classification of certain amounts from revenuesto restaurant occupancy expenses. Although the change inclassification resulted in a decrease to the franchised marginpercentage, there was no impact on the reported franchisedmargin dollars. The increase in 2011 was primarily due to a con-tractual escalation in the royalty rate for Japan in addition topositive comparable sales in most markets, partly offset by anegative impact from the strengthening of the Australian dollar.
The franchised margin percent in APMEA and Other Coun-tries & Corporate is higher relative to the U.S. and Europe due toa larger proportion of developmental licensed and/or affiliatedrestaurants where the Company receives royalty income with nocorresponding occupancy costs.
• Company-operated marginsCompany-operated margin dollars represent sales by Company-operated restaurants less the operating costs of theserestaurants. Company-operated margin dollars decreased $76million or 2% (increased 1% in constant currencies) in 2012, andincreased $282 million or 9% (5% in constant currencies) in2011. In 2012, Company-operated margin dollars were neg-atively impacted by foreign currency translation of $97 million,primarily in Europe. On a constant currency basis, the increase inCompany-operated margin dollars was due to positive perform-ance in Europe, offset by lower results in APMEA and the U.S. aspositive comparable sales were more than offset by higher costs.The growth in Company-operated margin dollars in 2011 wasdriven by positive comparable sales partly offset by higher costs,primarily commodity costs, in all segments. Foreign currencytranslation also had a positive impact on results.
Company-operated margins
In millions 2012 2011 2010
U.S. $ 883 $ 914 $ 902Europe 1,501 1,514 1,373APMEA 849 876 764Other Countries & Corporate 146 151 134
Total $3,379 $3,455 $3,173
Percent of sales
U.S. 19.5% 20.6% 21.3%Europe 19.1 19.3 19.8APMEA 15.9 17.3 17.8Other Countries & Corporate 16.8 16.0 17.2
Total 18.2% 18.9% 19.6%
In the U.S., the Company-operated margin percent decreasedin 2012 primarily due to higher commodity and labor costs, partlyoffset by positive comparable sales. The margin percentdecreased in 2011 due to higher commodity and occupancycosts, partly offset by positive comparable sales.
Europe’s Company-operated margin percent decreased in2012 primarily due to higher labor and commodity costs acrossseveral markets, despite positive comparable sales in Russia and
the U.K. The margin percent decreased in 2011 as highercommodity, labor, and occupancy costs were partly offset by pos-itive comparable sales.
In APMEA, the Company-operated margin percent in 2012decreased primarily due to higher labor and occupancy costs,partly offset by positive comparable sales. The margin percentdecreased in 2011 as higher commodity, labor and occupancycosts were partly offset by positive comparable sales. Accel-eration of new restaurant openings in China negatively impactedthe margin percent in both periods. Similar to other markets, newrestaurants in China initially open with lower margins that growsignificantly over time.
Supplemental information regarding Company-operated restaurantsWe continually review our restaurant ownership mix with a goal ofimproving local relevance, profits and returns. In most cases,franchising is the best way to achieve these goals, but as pre-viously stated, Company-operated restaurants are also importantto our success.
We report results for Company-operated restaurants basedon their sales, less costs directly incurred by that business includ-ing occupancy costs. We report the results for franchisedrestaurants based on franchised revenues, less associated occu-pancy costs. For this reason and because we manage ourbusiness based on geographic segments and not on the basis ofour ownership structure, we do not specifically allocate selling,general and administrative expenses and other operating(income) expenses to Company-operated or franchised restau-rants. Other operating items that relate to the Company-operatedrestaurants generally include gains/losses on sales of restaurantbusinesses and write-offs of equipment and leasehold improve-ments.
We believe the following information about Company-operated restaurants in our most significant segments providesan additional perspective on this business. Management of theCompany considers this information when evaluating restaurantownership mix, subject to other relevant considerations.
The following table seeks to illustrate the two components ofour Company-operated margins. The first of these relatesexclusively to restaurant operations, which we refer to as “Storeoperating margin.” The second relates to the value of our brandand the real estate interest we retain for which we charge rentand royalties. We refer to this component as “Brand/real estatemargin.” Both Company-operated and conventional franchisedrestaurants are charged rent and royalties, although rent androyalties for Company-operated restaurants are eliminated inconsolidation. Rent and royalties for both restaurant ownershiptypes are based on a percentage of sales, and the actual rentpercentage varies depending on the level of McDonald’s invest-ment in the restaurant. Royalty rates may also vary by market.
As shown in the following table, in disaggregating the compo-nents of our Company-operated margins, certain costswith respect to Company-operated restaurants are reflected inBrand/real estate margin. Those costs consist of rent payable byMcDonald’s to third parties on leased sites and depreciation forbuildings and leasehold improvements and constitute a portion ofoccupancy & other operating expenses recorded in the Con-solidated statement of income. Store operating margins reflectrent and royalty expenses, and those amounts are accounted foras income in calculating Brand/real estate margin.
McDonald’s Corporation 2012 Annual Report 19

While we believe that the following information provides aperspective in evaluating our Company-operated business, it isnot intended as a measure of our operating performance or as analternative to operating income or restaurant margins as reportedby the Company in accordance with accounting principles gen-erally accepted in the U.S. In particular, as noted previously, wedo not allocate selling, general and administrative expenses to
our Company-operated business. However, we believe that about$50,000 per restaurant, on average, is the typical cost to supportthis business in the U.S. The actual costs in markets outside theU.S. will vary depending on local circumstances and the organiza-tional structure of the market. These costs reflect the indirectservices we believe are necessary to provide the appropriatesupport of the restaurant.
U.S. EuropeDollars in millions 2012 2011 2010 2012 2011 2010As reportedNumber of Company-operated restaurants at
year end 1,552 1,552 1,550 2,017 1,985 2,005Sales by Company-operated restaurants $4,530 $4,433 $4,229 $ 7,850 $ 7,852 $ 6,932Company-operated margin $ 883 $ 914 $ 902 $ 1,501 $ 1,514 $ 1,373Store operating marginCompany-operated margin $ 883 $ 914 $ 902 $ 1,501 $ 1,514 $ 1,373Plus:
Outside rent expense(1) 59 56 60 245 242 223Depreciation—buildings & leasehold
improvements(1) 77 69 65 123 118 105Less:
Rent & royalties(2) (668) (651) (619) (1,603) (1,598) (1,409)Store operating margin $ 351 $ 388 $ 408 $ 266 $ 276 $ 292Brand/real estate marginRent & royalties(2) $ 668 $ 651 $ 619 $ 1,603 $ 1,598 $ 1,409Less:
Outside rent expense(1) (59) (56) (60) (245) (242) (223)Depreciation—buildings & leasehold
improvements(1) (77) (69) (65) (123) (118) (105)Brand/real estate margin $ 532 $ 526 $ 494 $ 1,235 $ 1,238 $ 1,081(1) Represents certain costs recorded as occupancy & other operating expenses in the Consolidated statement of income – rent payable by McDonald’s to third parties on leased sites and
depreciation for buildings and leasehold improvements. This adjustment is made to reflect these occupancy costs in Brand/real estate margin. The relative percentage of sites that areowned versus leased varies by country.
(2) Reflects average Company-operated rent and royalties (as a percent of sales: U.S.: 2012 – 14.7%; 2011 – 14.7%; 2010 – 14.6%; Europe: 2012 – 20.4%; 2011 – 20.4%; 2010 –20.3%). This adjustment is made to reflect expense in Store operating margin and income in Brand/real estate margin. Countries within Europe have varying economic profiles and awide range of rent and royalty rates as a percentage of sales.
SELLING, GENERAL & ADMINISTRATIVE EXPENSES
Consolidated selling, general and administrative expenses increased 3% (4% in constant currencies) in 2012 and increased 3% (flat inconstant currencies) in 2011. The growth rate for 2012 was primarily due to higher employee costs, the 2012 London Olympicssponsorship, higher technology related costs and the 2012 Worldwide Owner/Operator Convention, partly offset by lower incentive-based compensation. The growth rate for 2011 was flat as higher employee and other costs were offset by lower incentive-basedcompensation and costs in 2010 related to the Vancouver Olympics and the Company’s 2010 Worldwide Owner/Operator Convention.
Selling, general & administrative expenses
Amount Increase/(decrease)
Increase/(decrease)excluding currency
translationDollars in millions 2012 2011 2010 2012 2011 2012 2011U.S. $ 782 $ 779 $ 781 0% 0% 0% 0%Europe 695 699 653 (1) 7 5 2APMEA 353 341 306 4 12 3 5Other Countries & Corporate(1) 625 575 593 9 (3) 9 (4)
Total $2,455 $2,394 $2,333 3% 3% 4% 0%(1) Included in Other Countries & Corporate are home office support costs in areas such as facilities, finance, human resources, information technology, legal, marketing, restaurant oper-
ations, supply chain and training.
20 McDonald’s Corporation 2012 Annual Report

Selling, general and administrative expenses as a percent ofrevenues were 8.9% in 2012 and 2011, and 9.7% in 2010. Sell-ing, general and administrative expenses as a percent ofSystemwide sales were 2.8% in 2012 and 2011, and 3.0% in2010. Management believes that analyzing selling, general andadministrative expenses as a percent of Systemwide sales, aswell as revenues, is meaningful because these costs are incurredto support the overall McDonald’s business.
IMPAIRMENT AND OTHER CHARGES (CREDITS), NET
Impairment and other charges (credits), net
In millions 2012 2011 2010Europe $7 $ 1APMEA $(4) 49Other Countries & Corporate 1 (21)
Total $8 $(4) $ 29
In 2010, the Company recorded expense of $29 million pri-marily related to its share of restaurant closing costs inMcDonald’s Japan in conjunction with the strategic review of themarket’s restaurant portfolio, partly offset by income related tothe resolution of certain liabilities retained in connection with the2007 Latin America developmental license transaction.
OTHER OPERATING (INCOME) EXPENSE, NET
Other operating (income) expense, net
In millions 2012 2011 2010Gains on sales of restaurant
businesses $(152) $ (82) $ (79)Equity in earnings of unconsolidated
affiliates (144) (178) (164)Asset dispositions and other expense 44 27 45
Total $(252) $(233) $(198)
• Gains on sales of restaurant businesses
Gains on sales of restaurant businesses include gains from salesof Company-operated restaurants. The Company’s purchasesand sales of businesses with its franchisees are aimed at achiev-ing an optimal ownership mix in each market. Resulting gains orlosses are recorded in operating income because the trans-actions are a recurring part of our business. Gains on sales ofrestaurant businesses increased in 2012 due primarily to sales ofrestaurants in China to developmental licensees, as well as salesof restaurants in Europe and Canada.
• Equity in earnings of unconsolidated affiliatesUnconsolidated affiliates and partnerships are businesses inwhich the Company actively participates, but does not control.The Company records equity in earnings from these entitiesrepresenting McDonald’s share of results. For foreign affiliatedmarkets—primarily Japan—results are reported after interestexpense and income taxes. McDonald’s share of results for part-nerships in certain consolidated markets such as the U.S. isreported before income taxes. These partnership restaurants areoperated under conventional franchise arrangements and, there-fore, are classified as conventional franchised restaurants. Equityin earnings of unconsolidated affiliates decreased in 2012 due tolower operating results, primarily in Japan. Results in 2011reflected a benefit from stronger foreign currencies, partly offsetby the decline in the number of unconsolidated partnerships inthe U.S.
• Asset dispositions and other expenseAsset dispositions and other expense consists of gains or losseson excess property and other asset dispositions, provisions forrestaurant closings and uncollectible receivables, asset write-offsdue to restaurant reinvestment, and other miscellaneous incomeand expenses. Asset dispositions and other expense increased in2012 primarily due to lower gains on unconsolidated partnershipdissolutions in the U.S. Results in 2011 reflected higher gains onunconsolidated partnership dissolutions in the U.S.
OPERATING INCOME
Operating income
Amount Increase/(decrease)Increase excluding
currency translationDollars in millions 2012 2011 2010 2012 2011 2012 2011U.S. $3,751 $3,666 $3,446 2% 6% 2% 6%Europe 3,196 3,227 2,797 (1) 15 6 10APMEA 1,566 1,526 1,200 3 27 3 17Other Countries & Corporate 92 111 30 (17) nm 9 nm
Total $8,605 $8,530 $7,473 1% 14% 4% 10%nm Not meaningful
In the U.S., results for 2012 increased due to higher fran-chised margin dollars, partly offset by lower other operatingincome and Company-operated margin dollars. Results for 2011increased primarily due to higher combined restaurant margindollars, mostly from franchised margin dollars.
In Europe, results for 2012 were driven by strong operatingperformance in Russia and the U.K. The segment’s constant
currency operating results benefited from higher franchisedmargin dollars, and to a lesser extent, Company-operated margindollars. These results also benefited from higher gains on salesof restaurants, primarily in France and Germany, partly offset byincremental selling, general and administrative expenses relatedto the 2012 London Olympics. Results for 2011 were driven by
McDonald’s Corporation 2012 Annual Report 21
stronger operating performance in France, the U.K., Russia andGermany, and higher combined restaurant margin dollars, primar-ily franchised margin dollars.
In APMEA, results for 2012 increased primarily due to higherfranchised margin dollars and gains on sales of restaurants inChina to developmental licensees, partly offset by lowerCompany-operated margin dollars and lower operating results inJapan. Results for 2011 increased due to stronger operatingresults in many markets. Impairment charges in 2010 also pos-itively impacted the constant currency growth rate for 2011 by 4percentage points.
• Combined operating marginCombined operating margin is defined as operating income as apercent of total revenues. Combined operating margin for 2012,2011 and 2010 was 31.2%, 31.6% and 31.0%, respectively.
INTEREST EXPENSE
Interest expense increased 5% and 9% in 2012 and 2011,respectively, primarily due to higher average debt balances, partlyoffset by lower average interest rates. Stronger foreign curren-cies also contributed to the increase in 2011.
NONOPERATING (INCOME) EXPENSE, NET
Nonoperating (income) expense, net
In millions 2012 2011 2010Interest income $(28) $(39) $(20)Foreign currency and hedging activity 9 9 (2)Other expense 28 55 44
Total $ 9 $ 25 $ 22
Interest income consists primarily of interest earned on short-term cash investments. Foreign currency and hedging activityincludes net gains or losses on certain hedges that reduce theexposure to variability on certain intercompany foreign currencycash flow streams.
PROVISION FOR INCOME TAXES
In 2012, 2011 and 2010, the reported effective income tax rateswere 32.4%, 31.3% and 29.3%, respectively.
In 2012, the effective income tax rate reflected the negativeimpact of certain tax benefits in the U.S. that had expired atDecember 31, 2011. In January 2013, the United States enactedthe American Taxpayer Relief Act of 2012 (“Act”). The Actreinstated, retroactive to January 1, 2012, certain tax benefitsthat had previously expired. However, in accordance with thefinancial accounting standards for income taxes, the Company isrequired to account for the effects of changes in tax laws in theperiod the legislation is enacted.
In 2011, the effective income tax rate reflected lower taxbenefits related to certain foreign tax credits, partially offset bynonrecurring deferred tax benefits related to certain foreignoperations.
Consolidated net deferred tax liabilities included tax assets,net of valuation allowance, of $1.5 billion in 2012 and 2011.Substantially all of the net tax assets are expected to be realizedin the U.S. and other profitable markets.
ACCOUNTING CHANGES
• Fair value measurementsIn May 2011, the Financial Accounting Standards Board(“FASB”) issued an update to Topic 820 – Fair Value Measure-ment of the Accounting Standards Codification (“ASC”). Thisupdate provides guidance on how fair value accounting should beapplied where its use is already required or permitted by otherstandards and does not extend the use of fair value accounting.The Company adopted this guidance effective January 1, 2012,as required, and it did not have a significant impact on its con-solidated financial statements.
• Comprehensive IncomeIn June 2011, the FASB issued an update to Topic 220 – Com-prehensive Income of the ASC. The update is intended toincrease the prominence of other comprehensive income in thefinancial statements. The guidance requires that the Companypresents components of comprehensive income in either onecontinuous statement or two separate consecutive statements.The Company adopted this new guidance in 2012, as required,and included a separate Consolidated statement of compre-hensive income in the consolidated financial statementsappearing elsewhere herein.
Cash Flows
The Company generates significant cash from its operations andhas substantial credit availability and capacity to fund operatingand discretionary spending such as capital expenditures, debtrepayments, dividends and share repurchases.
Cash provided by operations totaled $7.0 billion andexceeded capital expenditures by $3.9 billion in 2012, while cashprovided by operations totaled $7.2 billion and exceeded capitalexpenditures by $4.4 billion in 2011. In 2012, cash provided byoperations decreased $184 million or 3% compared with 2011despite increased operating results, primarily due to higherincome tax payments and the negative impact of foreign currencytranslation on operating results. In 2011, cash provided by oper-ations increased $808 million or 13% compared with 2010primarily due to higher operating results.
Cash used for investing activities totaled $3.2 billion in 2012,an increase of $596 million compared with 2011. The increaseprimarily reflected higher capital expenditures, an increase inother investing activities related to short-term time deposits, andlower proceeds from sales of restaurant businesses. Cash usedfor investing activities totaled $2.6 billion in 2011, an increase of$515 million compared with 2010. This reflected higher capitalexpenditures, partly offset by higher proceeds from sales of res-taurant businesses.
Cash used for financing activities totaled $3.8 billion in 2012,a decrease of $683 million compared with 2011, primarily due tolower treasury stock purchases and higher net debt issuances,partly offset by higher dividend payments. Cash used for financ-ing activities totaled $4.5 billion in 2011, an increase of $804million compared with 2010, primarily due to higher treasurystock purchases, higher dividend payments and lower proceedsfrom stock option exercises, partly offset by higher net debt issu-ances.
The Company’s cash and equivalents balance was $2.3 billionat year end 2012 and 2011. In addition to cash and equivalents
22 McDonald’s Corporation 2012 Annual Report

on hand and cash provided by operations, the Company can meetshort-term funding needs through its continued access to com-mercial paper borrowings and line of credit agreements.
RESTAURANT DEVELOPMENT AND CAPITAL EXPENDITURES
In 2012, the Company opened 1,404 traditional restaurants and35 satellite restaurants (small, limited-menu restaurants for whichthe land and building are generally leased), and closed 269 tradi-tional restaurants and 200 satellite restaurants. In 2011, theCompany opened 1,118 traditional restaurants and 32 satelliterestaurants, and closed 246 traditional restaurants and 131satellite restaurants. The majority of restaurant openings andclosings occurred in the major markets in both years. The Com-pany closes restaurants for a variety of reasons, such as existingsales and profit performance or loss of real estate tenure.
Systemwide restaurants at year end(1)
2012 2011 2010U.S. 14,157 14,098 14,027Europe 7,368 7,156 6,969APMEA 9,454 8,865 8,424Other Countries & Corporate 3,501 3,391 3,317
Total 34,480 33,510 32,737(1) Includes satellite units at December 31, 2012, 2011 and 2010 as follows: U.S.—
997, 1,084, 1,112; Europe—246, 240, 239; APMEA (primarily Japan)—871, 949,1,010; Other Countries & Corporate—453, 459, 470.
Approximately 65% of Company-operated restaurants andover 75% of franchised restaurants were located in the majormarkets at the end of 2012. Over 80% of the restaurants atyear-end 2012 were franchised.
Capital expenditures increased $319 million or 12% in 2012,and increased $595 million or 28% in 2011, primarily due tohigher reinvestment in existing restaurants and higher investmentin new restaurants. The higher reinvestment reflects the Compa-ny’s commitment to grow sales through initiatives such asreimaging in many markets around the world. The increaserelated to new restaurants reflects our commitment to broadenaccessibility to our brand.
Capital expenditures invested in major markets, excludingJapan, represented about 70% of the total in 2012, 2011 and2010. Japan is accounted for under the equity method, andaccordingly its capital expenditures are not included in con-solidated amounts.
Capital expenditures
In millions 2012 2011 2010New restaurants $ 1,340 $ 1,193 $ 968Existing restaurants 1,615 1,432 1,089Other(1) 94 105 78
Total capital expenditures $ 3,049 $ 2,730 $ 2,135Total assets $35,386 $32,990 $31,975
(1) Primarily corporate equipment and other office-related expenditures.
New restaurant investments in all years were concentrated inmarkets with acceptable returns or opportunities for long-termgrowth. Average development costs vary widely by marketdepending on the types of restaurants built and the real estateand construction costs within each market. These costs, which
include land, buildings and equipment, are managed through theuse of optimally-sized restaurants, construction and design effi-ciencies, and leveraging best practices. Although the Company isnot responsible for all costs for every restaurant opened, totaldevelopment costs (consisting of land, buildings and equipment)for new traditional McDonald’s restaurants in the U.S. averagedapproximately $2.9 million in 2012.
The Company owned approximately 45% of the land andabout 70% of the buildings for restaurants in its consolidatedmarkets at year-end 2012 and 2011.
SHARE REPURCHASES AND DIVIDENDS
For the last three years, the Company returned a total of $16.5billion to shareholders through a combination of sharerepurchases and dividends.
Shares repurchased and dividends
In millions, except per share data 2012 2011 2010Number of shares repurchased 28.1 41.9 37.8Shares outstanding at year end 1,003 1,021 1,054Dividends declared per share $ 2.87 $ 2.53 $ 2.26
Treasury stock purchases (inShareholders’ equity) $2,605 $3,373 $2,648
Dividends paid 2,897 2,610 2,408Total returned to shareholders $5,502 $5,983 $5,056
In September 2009, the Company’s Board of Directorsapproved a $10 billion share repurchase program with no speci-fied expiration date (“2009 Program”). As most of the amountauthorized under the 2009 Program was utilized, the Company’sBoard of Directors terminated the 2009 Program and replaced itwith a new share repurchase program, effective August 1, 2012,that authorizes the purchase of up to $10 billion of the Compa-ny’s outstanding common stock with no specified expiration date.In 2012, approximately 8.4 million shares were repurchased for$748 million under the new program.
The Company has paid dividends on its common stock for 37consecutive years and has increased the dividend amount everyyear. The 2012 full year dividend of $2.87 per share reflects thequarterly dividend paid for each of the first three quarters of$0.70 per share, with an increase to $0.77 per share paid in thefourth quarter. This 10% increase in the quarterly dividend equa-tes to a $3.08 per share annual dividend and reflects theCompany’s confidence in the ongoing strength and reliability ofits cash flow. As in the past, future dividend amounts will be con-sidered after reviewing profitability expectations and financingneeds, and will be declared at the discretion of the Company’sBoard of Directors.
Financial Position and Capital Resources
TOTAL ASSETS AND RETURNS
Total assets increased $2.4 billion or 7% in 2012. Excluding theeffect of changes in foreign currency exchange rates, totalassets increased $2.0 billion in 2012. Over 75% of total assetswere in major markets at year-end 2012. Net property andequipment increased $1.8 billion in 2012 and represented about70% of total assets at year end. Excluding the effect of changes
McDonald’s Corporation 2012 Annual Report 23

in foreign currency exchange rates, net property and equipmentincreased $1.4 billion primarily due to capital expenditures, partlyoffset by depreciation.
Operating income is used to compute return on averageassets, while net income is used to calculate return on averagecommon equity. Month-end balances are used to compute bothaverage assets and average common equity.
2012 2011 2010
Return on average assets 25.4% 26.0% 24.7%Return on average common
equity 37.5 37.7 35.3
In 2012, return on average assets and return on averagecommon equity decreased due to the negative impact of foreigncurrency translation primarily on operating income and netincome. In 2011, return on average assets and return on averagecommon equity benefited from strong global operating resultsand the positive impact of foreign currency translation. Operatingincome, as reported, does not include interest income; however,cash balances are included in average assets. The inclusion ofcash balances in average assets reduced return on averageassets by about two percentage points for all years presented.
FINANCING AND MARKET RISK
The Company generally borrows on a long-term basis and isexposed to the impact of interest rate changes and foreign cur-rency fluctuations. Debt obligations at December 31, 2012totaled $13.6 billion, compared with $12.5 billion atDecember 31, 2011. The net increase in 2012 was primarily dueto net issuances of $1.2 billion.
Debt highlights(1)
2012 2011 2010
Fixed-rate debt as a percent of totaldebt(2,3) 74% 69% 66%
Weighted-average annual interest rate oftotal debt(3) 4.0 4.2 4.3
Foreign currency-denominated debt as apercent of total debt(2) 36 40 41
Total debt as a percent of totalCapitalization (total debt and totalShareholders’ equity)(2) 47 46 44
Cash provided by operations as a percentof total debt(2) 51 57 55
(1) All percentages are as of December 31, except for the weighted-average annualinterest rate, which is for the year.
(2) Based on debt obligations before the effect of fair value hedging adjustments. Thiseffect is excluded as these adjustments have no impact on the obligation at maturity.See Debt financing note to the consolidated financial statements.
(3) Includes the effect of interest rate swaps.
Fitch, Standard & Poor’s and Moody’s currently rate, with astable outlook, the Company’s commercial paper F1, A-1 andP-1, respectively; and its long-term debt A, A and A2,respectively.
Certain of the Company’s debt obligations contain cross-acceleration provisions and restrictions on Company andsubsidiary mortgages and the long-term debt of certain sub-sidiaries. There are no provisions in the Company’s debtobligations that would accelerate repayment of debt as a result of
a change in credit ratings or a material adverse change in theCompany’s business. Under existing authorization from theCompany’s Board of Directors, at December 31, 2012, theCompany had $5.4 billion of authority remaining to borrow funds,including through (i) public or private offering of debt securities;(ii) direct borrowing from banks or other financial institutions; and(iii) other forms of indebtedness. In addition to debt securitiesavailable through a medium-term notes program registered withthe U.S. Securities and Exchange Commission (“SEC”) and aGlobal Medium-Term Notes program, the Company has $1.5 bil-lion available under committed line of credit agreements as wellas authority to issue commercial paper in the U.S. and globalmarkets (see Debt Financing note to the consolidated financialstatements appearing elsewhere herein). Debt maturing in 2013is approximately $690 million of long-term corporate debt. In2013, the Company expects to issue commercial paper and long-term debt to refinance this maturing debt. As of December 31,2012, the Company also had $581 million of foreign currencyborrowings outstanding primarily under uncommitted line ofcredit agreements.
The Company uses major capital markets, bank financingsand derivatives to meet its financing requirements and reduceinterest expense. The Company manages its debt portfolio inresponse to changes in interest rates and foreign currency ratesby periodically retiring, redeeming and repurchasing debt, termi-nating swaps and using derivatives. The Company does not usederivatives with a level of complexity or with a risk higher than theexposures to be hedged and does not hold or issue derivativesfor trading purposes. All swaps are over-the-counter instruments.
In managing the impact of interest rate changes and foreigncurrency fluctuations, the Company uses interest rate swaps andfinances in the currencies in which assets are denominated. TheCompany uses foreign currency debt and derivatives to hedgethe foreign currency risk associated with certain royalties, inter-company financings and long-term investments in foreignsubsidiaries and affiliates. This reduces the impact of fluctuatingforeign currencies on cash flows and shareholders’ equity. Totalforeign currency-denominated debt was $4.9 billion and$5.0 billion for the years ended December 31, 2012 and 2011,respectively. In addition, where practical, the Company’s restau-rants purchase goods and services in local currencies resulting innatural hedges. See Summary of significant accounting policiesnote to the consolidated financial statements related to financialinstruments and hedging activities for additional informationregarding the accounting impact and use of derivatives.
The Company does not have significant exposure to anyindividual counterparty and has master agreements that containnetting arrangements. Certain of these agreements also requireeach party to post collateral if credit ratings fall below, oraggregate exposures exceed, certain contractual limits. AtDecember 31, 2012, neither the Company nor its counterpartieswere required to post collateral on any derivative position, otherthan on hedges of certain of the Company’s supplemental benefitplan liabilities where our counterparty was required to postcollateral on its liability position.
24 McDonald’s Corporation 2012 Annual Report

The Company’s net asset exposure is diversified among abroad basket of currencies. The Company’s largest net assetexposures (defined as foreign currency assets less foreign cur-rency liabilities) at year end were as follows:
Foreign currency net asset exposures
In millions of U.S. Dollars 2012 2011Euro $6,692 $5,905Australian Dollars 2,450 2,409Canadian Dollars 1,319 1,224British Pounds Sterling 1,117 726Russian Ruble 651 594
The Company prepared sensitivity analyses of its financialinstruments to determine the impact of hypothetical changes ininterest rates and foreign currency exchange rates on theCompany’s results of operations, cash flows and the fair value ofits financial instruments. The interest rate analysis assumed a onepercentage point adverse change in interest rates on all financialinstruments, but did not consider the effects of the reduced levelof economic activity that could exist in such an environment. Theforeign currency rate analysis assumed that each foreign currencyrate would change by 10% in the same direction relative to theU.S. Dollar on all financial instruments; however, the analysis didnot include the potential impact on revenues, local currency pricesor the effect of fluctuating currencies on the Company’s antici-pated foreign currency royalties and other payments received inthe U.S. Based on the results of these analyses of the Company’sfinancial instruments, neither a one percentage point adversechange in interest rates from 2012 levels nor a 10% adversechange in foreign currency rates from 2012 levels would materi-ally affect the Company’s results of operations, cash flows or thefair value of its financial instruments.
LIQUIDITY
The Company has significant operations outside the UnitedStates where we earn over 60% of our operating income. A sig-nificant portion of these historical earnings are considered to beindefinitely reinvested in foreign jurisdictions where the Companyhas made, and will continue to make, substantial investments tosupport the ongoing development and growth of our internationaloperations. Accordingly, no U.S. federal or state income taxeshave been provided on the undistributed foreign earnings. TheCompany’s cash and equivalents held by our foreign subsidiariestotaled approximately $2.1 billion as of December 31, 2012. Wedo not intend, nor do we foresee a need, to repatriate these funds.
Consistent with prior years, we expect existing domestic cashand equivalents, domestic cash flows from operations, annualrepatriation of a portion of the current period’s foreign earnings,and the issuance of domestic debt to continue to be sufficient tofund our domestic operating, investing, and financing activities.We also continue to expect existing foreign cash and equivalentsand foreign cash flows from operations to be sufficient to fundour foreign operating, investing, and financing activities.
In the future, should we require more capital to fund activitiesin the United States than is generated by our domestic oper-ations and is available through the issuance of domestic debt, wecould elect to repatriate a greater portion of future periods’ earn-ings from foreign jurisdictions. This could also result in a highereffective tax rate in the future.
While the likelihood is remote, to the extent foreign cash isavailable, the Company could also elect to repatriate earningsfrom foreign jurisdictions that have previously been considered tobe indefinitely reinvested. Upon distribution of those earnings inthe form of dividends or otherwise, the Company may be subjectto additional U.S. income taxes (net of an adjustment for foreigntax credits) which could result in a use of cash. This could alsoresult in a higher effective tax rate in the period in which such adetermination is made to repatriate prior period foreign earnings.Refer to the Income Taxes note to the consolidated financialstatements appearing elsewhere herein for further informationrelated to our income taxes and the undistributed earnings of theCompany’s foreign subsidiaries.
CONTRACTUAL OBLIGATIONS AND COMMITMENTS
The Company has long-term contractual obligations primarily inthe form of lease obligations (related to both Company-operatedand franchised restaurants) and debt obligations. In addition, theCompany has long-term revenue and cash flow streams thatrelate to its franchise arrangements. Cash provided by operations(including cash provided by these franchise arrangements) alongwith the Company’s borrowing capacity and other sources ofcash will be used to satisfy the obligations. The following tablesummarizes the Company’s contractual obligations and theiraggregate maturities as well as future minimum rent paymentsdue to the Company under existing franchise arrangements as ofDecember 31, 2012. See discussions of cash flows and financialposition and capital resources as well as the Notes to the con-solidated financial statements appearing elsewhere herein forfurther details.
Contractual cash outflows Contractual cash inflows
In millionsOperating
leasesDebt
obligations(1)Minimum rent under
franchise arrangements
2013 $ 1,352 $ 2,5622014 1,259 $ 659 2,4842015 1,130 1,168 2,3822016 1,020 2,437 2,2612017 918 1,053 2,130Thereafter 6,844 8,273 17,047
Total $12,523 $13,590 $28,866(1) The maturities reflect reclassifications of short-term obligations to long-term obliga-
tions of $1.5 billion, as they are supported by a long-term line of credit agreementexpiring in November 2016. Debt obligations do not include $42 million of noncashfair value hedging adjustments or $217 million of accrued interest.
The Company maintains certain supplemental benefit plansthat allow participants to (i) make tax-deferred contributions and(ii) receive Company-provided allocations that cannot be madeunder the qualified benefit plans because of IRS limitations. AtDecember 31, 2012, total liabilities for the supplemental planswere $493 million, and total liabilities for gross unrecognized taxbenefits were $482 million.
There are certain purchase commitments that are not recog-nized in the consolidated financial statements and are primarilyrelated to construction, inventory, energy, marketing and otherservice related arrangements that occur in the normal course ofbusiness. The amounts related to these commitments are notsignificant to the Company’s financial position. Such commit-ments are generally shorter term in nature and will be fundedfrom operating cash flows.
McDonald’s Corporation 2012 Annual Report 25

Other MattersCRITICAL ACCOUNTING POLICIES AND ESTIMATES
Management’s discussion and analysis of financial condition andresults of operations is based upon the Company’s consolidatedfinancial statements, which have been prepared in accordancewith accounting principles generally accepted in the U.S. Thepreparation of these financial statements requires the Companyto make estimates and judgments that affect the reportedamounts of assets, liabilities, revenues and expenses as well asrelated disclosures. On an ongoing basis, the Company evaluatesits estimates and judgments based on historical experience andvarious other factors that are believed to be reasonable under thecircumstances. Actual results may differ from these estimatesunder various assumptions or conditions.
The Company reviews its financial reporting and disclosurepractices and accounting policies quarterly to ensure that theyprovide accurate and transparent information relative to the cur-rent economic and business environment. The Company believesthat of its significant accounting policies, the following involve ahigher degree of judgment and/or complexity:
• Property and equipmentProperty and equipment are depreciated or amortized on astraight-line basis over their useful lives based on management’sestimates of the period over which the assets will generate rev-enue (not to exceed lease term plus options for leased property).The useful lives are estimated based on historical experience withsimilar assets, taking into account anticipated technological orother changes. The Company periodically reviews these lives rela-tive to physical factors, economic factors and industry trends. Ifthere are changes in the planned use of property and equipment,or if technological changes occur more rapidly than anticipated,the useful lives assigned to these assets may need to be short-ened, resulting in the accelerated recognition of depreciation andamortization expense or write-offs in future periods.
• Share-based compensationThe Company has a share-based compensation plan whichauthorizes the granting of various equity-based incentives includ-ing stock options and restricted stock units (“RSUs”) toemployees and nonemployee directors. The expense for theseequity-based incentives is based on their fair value at date ofgrant and generally amortized over their vesting period.
The fair value of each stock option granted is estimated onthe date of grant using a closed-form pricing model. The pricingmodel requires assumptions, which impact the assumed fair val-ue, including the expected life of the stock option, the risk-freeinterest rate, expected volatility of the Company’s stock over theexpected life and the expected dividend yield. The Company useshistorical data to determine these assumptions and if theseassumptions change significantly for future grants, share-basedcompensation expense will fluctuate in future years. The fairvalue of each RSU granted is equal to the market price of theCompany’s stock at date of grant less the present value ofexpected dividends over the vesting period.
• Long-lived assets impairment reviewLong-lived assets (including goodwill) are reviewed for impair-ment annually in the fourth quarter and whenever events orchanges in circumstances indicate that the carrying amount of anasset may not be recoverable. In assessing the recoverability ofthe Company’s long-lived assets, the Company considers
changes in economic conditions and makes assumptions regard-ing estimated future cash flows and other factors. Estimates offuture cash flows are highly subjective judgments based on theCompany’s experience and knowledge of its operations. Theseestimates can be significantly impacted by many factors includingchanges in global and local business and economic conditions,operating costs, inflation, competition, and consumer and demo-graphic trends. A key assumption impacting estimated futurecash flows is the estimated change in comparable sales. If theCompany’s estimates or underlying assumptions change in thefuture, the Company may be required to record impairmentcharges. Based on the annual goodwill impairment test, con-ducted in the fourth quarter, the Company does not have anyreporting units (defined as each individual country) with goodwillcurrently at risk of impairment.
• Litigation accrualsIn the ordinary course of business, the Company is subject toproceedings, lawsuits and other claims primarily related to com-petitors, customers, employees, franchisees, governmentagencies, intellectual property, shareholders and suppliers. TheCompany is required to assess the likelihood of any adversejudgments or outcomes to these matters as well as potentialranges of probable losses. A determination of the amount ofaccrual required, if any, for these contingencies is made aftercareful analysis of each matter. The required accrual may changein the future due to new developments in each matter or changesin approach such as a change in settlement strategy in dealingwith these matters. The Company does not believe that any suchmatter currently being reviewed will have a material adverseeffect on its financial condition or results of operations.
• Income taxesThe Company records a valuation allowance to reduce itsdeferred tax assets if it is more likely than not that some portionor all of the deferred assets will not be realized. While the Com-pany has considered future taxable income and ongoing prudentand feasible tax strategies, including the sale of appreciatedassets, in assessing the need for the valuation allowance, if theseestimates and assumptions change in the future, the Companymay be required to adjust its valuation allowance. This couldresult in a charge to, or an increase in, income in the period suchdetermination is made.
The Company operates within multiple taxing jurisdictions andis subject to audit in these jurisdictions. The Company recordsaccruals for the estimated outcomes of these audits, and theaccruals may change in the future due to new developments ineach matter. In 2012, the Internal Revenue Service (“IRS”) com-pleted its examination of the Company’s U.S. federal income taxreturns for 2007 and 2008. The Company and the IRS reachedan agreement on adjustments that had been previously proposedby the IRS. The agreement did not have a material impact on theCompany’s cash flows, results of operations or financial position.The Company’s 2009 and 2010 U.S. federal income tax returnsare currently under examination and the completion of the fieldexamination is expected in 2013.
Deferred U.S. income taxes have not been recorded fortemporary differences totaling $14.8 billion related to invest-ments in certain foreign subsidiaries and corporate affiliates. Thetemporary differences consist primarily of undistributed earningsthat are considered permanently invested in operations outsidethe U.S. If management’s intentions change in the future,deferred taxes may need to be provided.
26 McDonald’s Corporation 2012 Annual Report

EFFECTS OF CHANGING PRICES—INFLATION
The Company has demonstrated an ability to manage inflationarycost increases effectively. This ability is because of rapid inventoryturnover, the ability to adjust menu prices, cost controls and sub-stantial property holdings, many of which are at fixed costs andpartly financed by debt made less expensive by inflation.
RISK FACTORS AND CAUTIONARY STATEMENT ABOUTFORWARD-LOOKING INFORMATION
This report includes forward-looking statements about our plansand future performance, including those under Outlook for 2013.
These statements use such words as “may,” “will,” “expect,”“believe” and “plan.” They reflect our expectations and speak onlyas of the date of this report. We do not undertake to update them.Our expectations (or the underlying assumptions) may change ornot be realized, and you should not rely unduly on forward-lookingstatements. We have identified the principal risks anduncertainties that affect our performance in the Company’s filingswith the Securities and Exchange Commission, and investors areurged to consider these risks and uncertainties when evaluatingour historical and expected performance.
RECONCILIATION OF RETURNS ON INCREMENTAL INVESTED CAPITAL
ROIIC is a measure reviewed by management over one-year and three-year time periods to evaluate the overall profitability of the busi-ness units, the effectiveness of capital deployed and the future allocation of capital. This measure is calculated using operating incomeand constant foreign exchange rates to exclude the impact of foreign currency translation. The numerator is the Company’s incrementaloperating income plus depreciation and amortization from the base period.
The denominator is the weighted-average cash used for investing activities during the applicable one-or three-year period. Theweighted-average cash used for investing activities is based on a weighting applied on a quarterly basis. These weightings are used toreflect the estimated contribution of each quarter’s investing activities to incremental operating income. For example, fourth quarter 2012investing activities are weighted less because the assets purchased have only recently been deployed and would have generated littleincremental operating income (12.5% of fourth quarter 2012 investing activities are included in the one-year and three-year calculations).In contrast, fourth quarter 2011 is heavily weighted because the assets purchased were deployed more than 12 months ago, and thereforehave a full-year impact on 2012 operating income, with little or no impact to the base period (87.5% and 100.0% of fourth quarter 2011investing activities are included in the one-year and three-year calculations, respectively). Management believes that weighting cash usedfor investing activities provides a more accurate reflection of the relationship between its investments and returns than a simple average.
The reconciliations to the most comparable measurements, in accordance with accounting principles generally accepted in the U.S.,for the numerator and denominator of the one-year and three-year ROIIC are as follows:
One-year ROIIC calculation (dollars in millions):
Years ended December 31, 2012 2011Incremental
changeNUMERATOR:Operating income $8,604.6 $8,529.7 $ 74.9Depreciation and amortization 1,488.5 1,415.0 73.5Currency translation(1) 286.1Incremental operating income plus depreciation and
amortization (at constant foreign exchange rates) $ 434.5DENOMINATOR:Weighted-average cash used for
investing activities(2) $2,826.3Currency translation(1) 3.0Weighted-average cash used for investing activities
(at constant foreign exchange rates) $2,829.3One-year ROIIC 15.4%
(1) Represents the effect of foreign currency translation by translating results at an aver-age exchange rate for the periods measured.
(2) Represents one-year weighted-average cash used for investing activities, determinedby applying the weightings below to the cash used for investing activities for eachquarter in the two-year period ended December 31, 2012.
Years ended December 31,2012 2011
Cash used for investing activities $3,167.3 $2,570.9AS A PERCENT
Quarters ended:
March 31 87.5% 12.5%June 30 62.5 37.5September 30 37.5 62.5December 31 12.5 87.5
Three-year ROIIC calculation (dollars in millions):
Years ended December 31, 2012 2009Incremental
changeNUMERATOR:Operating income $8,604.6 $6,841.0 $1,763.6Depreciation and amortization 1,488.5 1,216.2 272.3Currency translation(3) (65.3)Incremental operating income plus depreciation and
amortization (at constant foreign exchange rates) $1,970.6DENOMINATOR:Weighted-average adjusted cash
used for investing activities(4) $6,959.1Currency translation(3) (70.0)Weighted-average cash used for investing activities
(at constant foreign exchange rates) $6,889.1Three-year ROIIC 28.6%
(3) Represents the effect of foreign currency translation by translating results at an aver-age exchange rate for the periods measured.
(4) Represents three-year weighted-average adjusted cash used for investing activities,determined by applying the weightings below to the adjusted cash used for investingactivities for each quarter in the four-year period ended December 31, 2012.
Years ended December 31,2012 2011 2010 2009
Cash used forinvesting activities $3,167.3 $2,570.9 $2,056.0 $1,655.3
Less: Cash generated frominvesting activities related toRedbox transaction (144.9)
Adjusted cash usedfor investingactivities $3,167.3 $2,570.9 $2,056.0 $1,800.2
AS A PERCENTQuarters ended:March 31 87.5% 100.0% 100.0% 12.5%June 30 62.5 100.0 100.0 37.5September 30 37.5 100.0 100.0 62.5December 31 12.5 100.0 100.0 87.5
McDonald’s Corporation 2012 Annual Report 27

Consolidated Statement of Income
In millions, except per share data Years ended December 31, 2012 2011 2010REVENUESSales by Company-operated restaurants $18,602.5 $18,292.8 $16,233.3Revenues from franchised restaurants 8,964.5 8,713.2 7,841.3
Total revenues 27,567.0 27,006.0 24,074.6OPERATING COSTS AND EXPENSESCompany-operated restaurant expenses
Food & paper 6,318.2 6,167.2 5,300.1Payroll & employee benefits 4,710.3 4,606.3 4,121.4Occupancy & other operating expenses 4,195.2 4,064.4 3,638.0
Franchised restaurants-occupancy expenses 1,527.0 1,481.5 1,377.8Selling, general & administrative expenses 2,455.2 2,393.7 2,333.3Impairment and other charges (credits), net 8.0 (3.9) 29.1Other operating (income) expense, net (251.5) (232.9) (198.2)
Total operating costs and expenses 18,962.4 18,476.3 16,601.5Operating income 8,604.6 8,529.7 7,473.1Interest expense-net of capitalized interest of $15.9, $14.0 and $12.0 516.6 492.8 450.9Nonoperating (income) expense, net 9.0 24.7 21.9Income before provision for income taxes 8,079.0 8,012.2 7,000.3Provision for income taxes 2,614.2 2,509.1 2,054.0Net income $ 5,464.8 $ 5,503.1 $ 4,946.3Earnings per common share–basic $ 5.41 $ 5.33 $ 4.64Earnings per common share–diluted $ 5.36 $ 5.27 $ 4.58Dividends declared per common share $ 2.87 $ 2.53 $ 2.26Weighted-average shares outstanding–basic 1,010.1 1,032.1 1,066.0Weighted-average shares outstanding–diluted 1,020.2 1,044.9 1,080.3
See Notes to consolidated financial statements.
28 McDonald’s Corporation 2012 Annual Report

Consolidated Statement of Comprehensive Income
In millions Years ended December 31, 2012 2011 2010Net income $5,464.8 $5,503.1 $4,946.3Other comprehensive income (loss), net of tax
Foreign currency translation adjustments:Gain (loss) recognized in accumulated other comprehensive
income (AOCI), including net investment hedges 274.7 (310.5) (3.0)Reclassification of (gain) loss to net income (0.1) 25.4
Foreign currency translation adjustments-net oftax benefit (expense) of $(47.9), $61.0 and $52.2 274.6 (285.1) (3.0)
Cash flow hedges:Gain (loss) recognized in AOCI 19.8 (12.2) 6.5Reclassification of (gain) loss to net income 10.8 1.8 (8.0)
Cash flow hedges-net of tax benefit (expense) of$(8.8), $5.8 and $1.1 30.6 (10.4) (1.5)
Defined benefit pension plans:Gain (loss) recognized in AOCI 33.1 (8.1) 9.3Reclassification of (gain) loss to net income 8.4 0.4 0.7
Defined benefit pension plans-net of tax benefit(expense) of $(16.6), $2.9 and $(3.5) 41.5 (7.7) 10.0
Total other comprehensive income (loss), net of tax 346.7 (303.2) 5.5Comprehensive income $5,811.5 $5,199.9 $4,951.8
See Notes to consolidated financial statements.
McDonald’s Corporation 2012 Annual Report 29
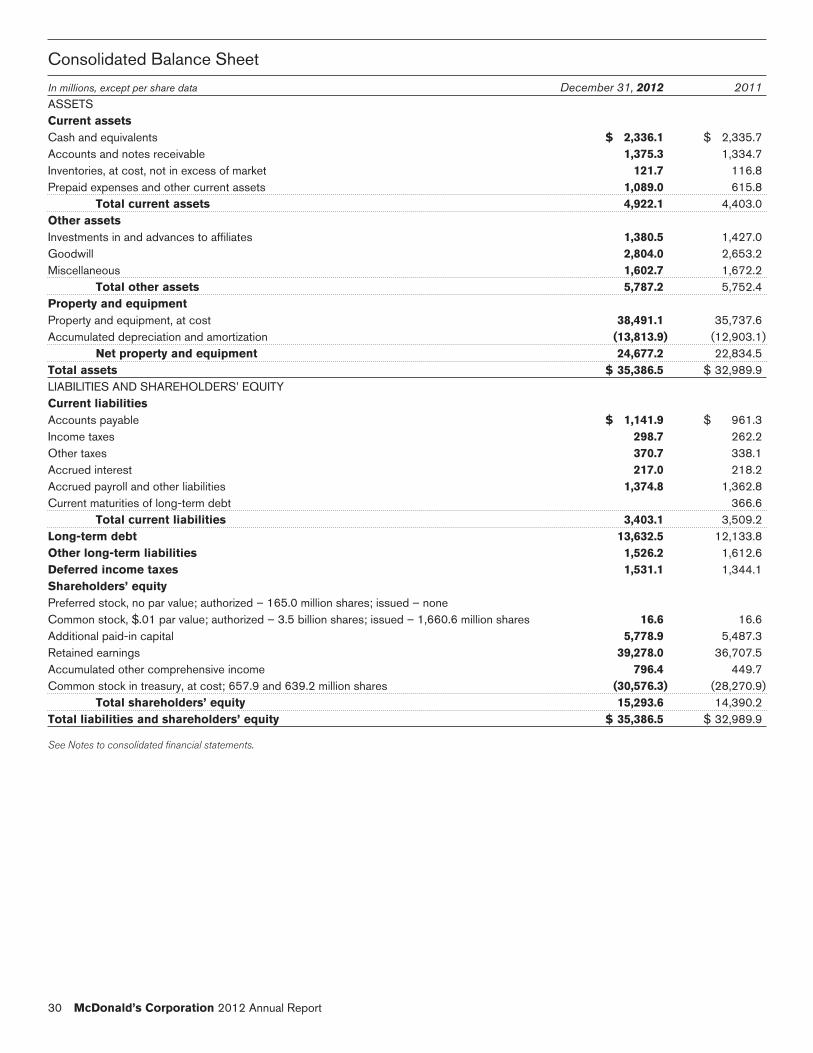
Consolidated Balance Sheet
In millions, except per share data December 31, 2012 2011ASSETSCurrent assetsCash and equivalents $ 2,336.1 $ 2,335.7Accounts and notes receivable 1,375.3 1,334.7Inventories, at cost, not in excess of market 121.7 116.8Prepaid expenses and other current assets 1,089.0 615.8
Total current assets 4,922.1 4,403.0Other assetsInvestments in and advances to affiliates 1,380.5 1,427.0Goodwill 2,804.0 2,653.2Miscellaneous 1,602.7 1,672.2
Total other assets 5,787.2 5,752.4Property and equipmentProperty and equipment, at cost 38,491.1 35,737.6Accumulated depreciation and amortization (13,813.9) (12,903.1)
Net property and equipment 24,677.2 22,834.5Total assets $ 35,386.5 $ 32,989.9LIABILITIES AND SHAREHOLDERS’ EQUITYCurrent liabilitiesAccounts payable $ 1,141.9 $ 961.3Income taxes 298.7 262.2Other taxes 370.7 338.1Accrued interest 217.0 218.2Accrued payroll and other liabilities 1,374.8 1,362.8Current maturities of long-term debt 366.6
Total current liabilities 3,403.1 3,509.2Long-term debt 13,632.5 12,133.8Other long-term liabilities 1,526.2 1,612.6Deferred income taxes 1,531.1 1,344.1Shareholders’ equityPreferred stock, no par value; authorized – 165.0 million shares; issued – noneCommon stock, $.01 par value; authorized – 3.5 billion shares; issued – 1,660.6 million shares 16.6 16.6Additional paid-in capital 5,778.9 5,487.3Retained earnings 39,278.0 36,707.5Accumulated other comprehensive income 796.4 449.7Common stock in treasury, at cost; 657.9 and 639.2 million shares (30,576.3) (28,270.9)
Total shareholders’ equity 15,293.6 14,390.2Total liabilities and shareholders’ equity $ 35,386.5 $ 32,989.9
See Notes to consolidated financial statements.
30 McDonald’s Corporation 2012 Annual Report
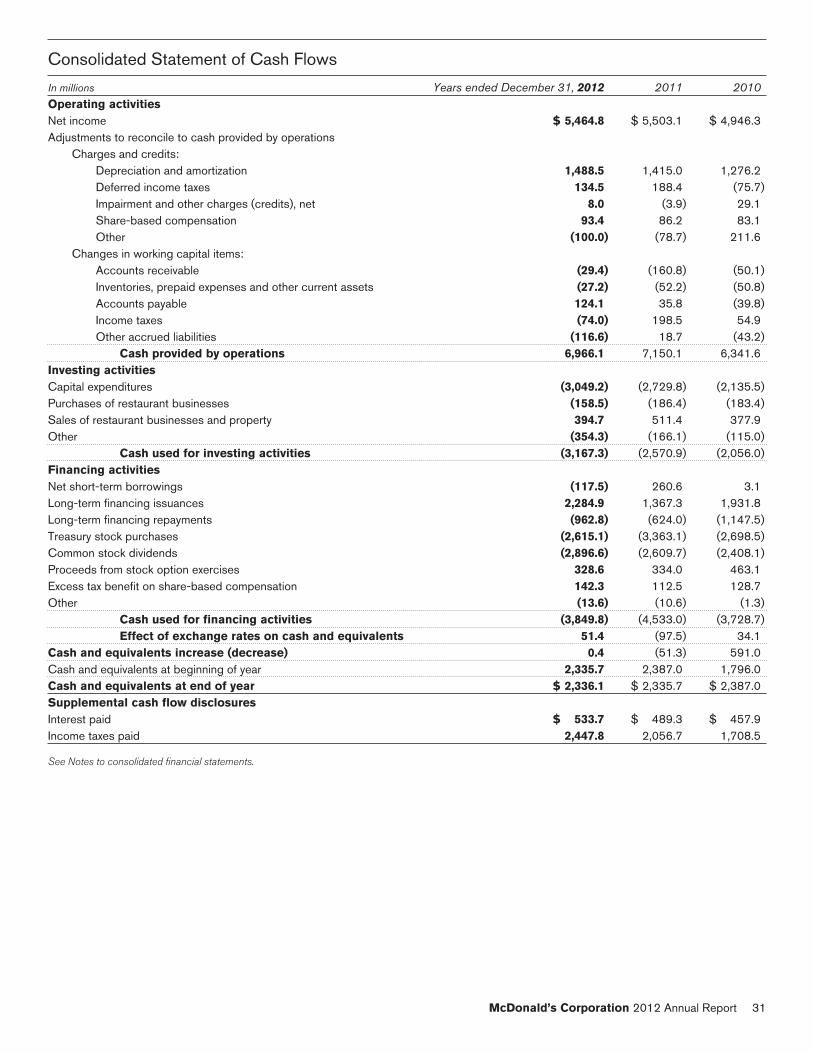
Consolidated Statement of Cash Flows
In millions Years ended December 31, 2012 2011 2010Operating activitiesNet income $ 5,464.8 $ 5,503.1 $ 4,946.3Adjustments to reconcile to cash provided by operations
Charges and credits:Depreciation and amortization 1,488.5 1,415.0 1,276.2Deferred income taxes 134.5 188.4 (75.7)Impairment and other charges (credits), net 8.0 (3.9) 29.1Share-based compensation 93.4 86.2 83.1Other (100.0) (78.7) 211.6
Changes in working capital items:Accounts receivable (29.4) (160.8) (50.1)Inventories, prepaid expenses and other current assets (27.2) (52.2) (50.8)Accounts payable 124.1 35.8 (39.8)Income taxes (74.0) 198.5 54.9Other accrued liabilities (116.6) 18.7 (43.2)
Cash provided by operations 6,966.1 7,150.1 6,341.6Investing activitiesCapital expenditures (3,049.2) (2,729.8) (2,135.5)Purchases of restaurant businesses (158.5) (186.4) (183.4)Sales of restaurant businesses and property 394.7 511.4 377.9Other (354.3) (166.1) (115.0)
Cash used for investing activities (3,167.3) (2,570.9) (2,056.0)Financing activitiesNet short-term borrowings (117.5) 260.6 3.1Long-term financing issuances 2,284.9 1,367.3 1,931.8Long-term financing repayments (962.8) (624.0) (1,147.5)Treasury stock purchases (2,615.1) (3,363.1) (2,698.5)Common stock dividends (2,896.6) (2,609.7) (2,408.1)Proceeds from stock option exercises 328.6 334.0 463.1Excess tax benefit on share-based compensation 142.3 112.5 128.7Other (13.6) (10.6) (1.3)
Cash used for financing activities (3,849.8) (4,533.0) (3,728.7)Effect of exchange rates on cash and equivalents 51.4 (97.5) 34.1
Cash and equivalents increase (decrease) 0.4 (51.3) 591.0Cash and equivalents at beginning of year 2,335.7 2,387.0 1,796.0Cash and equivalents at end of year $ 2,336.1 $ 2,335.7 $ 2,387.0Supplemental cash flow disclosuresInterest paid $ 533.7 $ 489.3 $ 457.9Income taxes paid 2,447.8 2,056.7 1,708.5
See Notes to consolidated financial statements.
McDonald’s Corporation 2012 Annual Report 31

Consolidated Statement of Shareholders’ Equity
Common stockissued
Accumulated othercomprehensive income (loss)
Common stock intreasury
Additionalpaid-incapital
Retainedearnings Pensions
Cash flowhedges
Foreigncurrency
translation
Totalshareholders’
equityIn millions, except per share data Shares Amount Shares AmountBalance at December 31, 2009 1,660.6 $16.6 $4,853.9 $31,270.8 $(134.6) $ 16.5 $ 865.5 (583.9) $(22,854.8) $14,033.9Net income 4,946.3 4,946.3Other comprehensive income (loss),
net of tax 10.0 (1.5) (3.0) 5.5Comprehensive income 4,951.8
Common stock cash dividends($2.26 per share) (2,408.1) (2,408.1)
Treasury stock purchases (37.8) (2,648.5) (2,648.5)Share-based compensation 83.1 83.1Stock option exercises and other
(including tax benefits of $146.1) 259.4 2.7 14.7 359.9 622.0Balance at December 31, 2010 1,660.6 16.6 5,196.4 33,811.7 (124.6) 15.0 862.5 (607.0) (25,143.4) 14,634.2Net income 5,503.1 5,503.1Other comprehensive income (loss),
net of tax (7.7) (10.4) (285.1) (303.2)Comprehensive income 5,199.9
Common stock cash dividends($2.53 per share) (2,609.7) (2,609.7)
Treasury stock purchases (41.9) (3,372.9) (3,372.9)Share-based compensation 86.2 86.2Stock option exercises and other
(including tax benefits of $116.7) 204.7 2.4 9.7 245.4 452.5Balance at December 31, 2011 1,660.6 16.6 5,487.3 36,707.5 (132.3) 4.6 577.4 (639.2) (28,270.9) 14,390.2Net income 5,464.8 5,464.8Other comprehensive income (loss),
net of tax 41.5 30.6 274.6 346.7Comprehensive income 5,811.5
Common stock cash dividends($2.87 per share) (2,896.6) (2,896.6)
Treasury stock purchases (28.1) (2,605.4) (2,605.4)Share-based compensation 93.4 93.4Stock option exercises and other
(including tax benefits of $150.8) 198.2 2.3 9.4 300.0 500.5Balance at December 31, 2012 1,660.6 $16.6 $5,778.9 $39,278.0 $ (90.8) $ 35.2 $ 852.0 (657.9) $(30,576.3) $15,293.6
See Notes to consolidated financial statements.
32 McDonald’s Corporation 2012 Annual Report

Notes to Consolidated Financial Statements
Summary of Significant Accounting Policies
NATURE OF BUSINESS
The Company franchises and operates McDonald’s restaurants inthe global restaurant industry. All restaurants are operated eitherby the Company or by franchisees, including conventionalfranchisees under franchise arrangements, and foreign affiliatesand developmental licensees under license agreements.
The following table presents restaurant information byownership type:
Restaurants at December 31, 2012 2011 2010Conventional franchised 19,869 19,527 19,279Developmental licensed 4,350 3,929 3,485Foreign affiliated 3,663 3,619 3,574Franchised 27,882 27,075 26,338Company-operated 6,598 6,435 6,399Systemwide restaurants 34,480 33,510 32,737
The results of operations of restaurant businesses purchasedand sold in transactions with franchisees were not material eitherindividually or in the aggregate to the consolidated financialstatements for periods prior to purchase and sale.
CONSOLIDATION
The consolidated financial statements include the accounts ofthe Company and its subsidiaries. Investments in affiliates owned50% or less (primarily McDonald’s Japan) are accounted for bythe equity method.
On an ongoing basis, the Company evaluates its businessrelationships such as those with franchisees, joint venture part-ners, developmental licensees, suppliers, and advertisingcooperatives to identify potential variable interest entities. Gen-erally, these businesses qualify for a scope exception under thevariable interest entity consolidation guidance. The Company hasconcluded that consolidation of any such entity is not appropriatefor the periods presented.
ESTIMATES IN FINANCIAL STATEMENTS
The preparation of financial statements in conformity withaccounting principles generally accepted in the U.S. requiresmanagement to make estimates and assumptions that affect theamounts reported in the financial statements and accompanyingnotes. Actual results could differ from those estimates.
REVENUE RECOGNITION
The Company’s revenues consist of sales by Company-operatedrestaurants and fees from franchised restaurants operated byconventional franchisees, developmental licensees and foreignaffiliates.
Sales by Company-operated restaurants are recognized on acash basis. The Company presents sales net of sales tax andother sales-related taxes. Revenues from conventional franchisedrestaurants include rent and royalties based on a percent of saleswith minimum rent payments, and initial fees. Revenues fromrestaurants licensed to foreign affiliates and developmentallicensees include a royalty based on a percent of sales, and may
include initial fees. Continuing rent and royalties are recognizedin the period earned. Initial fees are recognized upon opening ofa restaurant or granting of a new franchise term, which is whenthe Company has performed substantially all initial servicesrequired by the franchise arrangement.
FOREIGN CURRENCY TRANSLATION
Generally, the functional currency of operations outside the U.S.is the respective local currency.
ADVERTISING COSTS
Advertising costs included in operating expenses of Company-operated restaurants primarily consist of contributions toadvertising cooperatives and were (in millions): 2012–$787.5;2011–$768.6; 2010–$687.0. Production costs for radio andtelevision advertising are expensed when the commercials areinitially aired. These production costs, primarily in the U.S., as wellas other marketing-related expenses included in Selling, gen-eral & administrative expenses were (in millions): 2012–$113.5;2011–$74.4; 2010–$94.5. Costs related to the Olympics spon-sorship are included in these expenses for 2012 and 2010. Inaddition, significant advertising costs are incurred by franchiseesthrough contributions to advertising cooperatives in individualmarkets.
SHARE-BASED COMPENSATION
Share-based compensation includes the portion vesting of allshare-based awards granted based on the grant date fair value.
Share-based compensation expense and the effect on dilutedearnings per common share were as follows:
In millions, except per share data 2012 2011 2010Share-based compensation expense $93.4 $86.2 $83.1After tax $63.2 $59.2 $56.2Earnings per common share-diluted $0.06 $0.05 $0.05
Compensation expense related to share-based awards isgenerally amortized on a straight-line basis over the vestingperiod in Selling, general & administrative expenses. As ofDecember 31, 2012, there was $94.6 million of total unrecog-nized compensation cost related to nonvested share-basedcompensation that is expected to be recognized over a weighted-average period of 2.1 years.
The fair value of each stock option granted is estimated onthe date of grant using a closed-form pricing model. The follow-ing table presents the weighted-average assumptions used in theoption pricing model for the 2012, 2011 and 2010 stock optiongrants. The expected life of the options represents the period oftime the options are expected to be outstanding and is based onhistorical trends. Expected stock price volatility is generally basedon the historical volatility of the Company’s stock for a periodapproximating the expected life. The expected dividend yield isbased on the Company’s most recent annual dividend rate. Therisk-free interest rate is based on the U.S. Treasury yield curve ineffect at the time of grant with a term equal to the expected life.
McDonald’s Corporation 2012 Annual Report 33

Weighted-average assumptions
2012 2011 2010Expected dividend yield 2.8% 3.2% 3.5%Expected stock price volatility 20.8% 21.5% 22.1%Risk-free interest rate 1.1% 2.8% 2.8%Expected life of options In years 6.1 6.3 6.2Fair value per option granted $13.65 $12.18 $9.90
PROPERTY AND EQUIPMENT
Property and equipment are stated at cost, with depreciation andamortization provided using the straight-line method over thefollowing estimated useful lives: buildings–up to 40 years; lease-hold improvements–the lesser of useful lives of assets or leaseterms, which generally include option periods; and equipment–three to 12 years.
GOODWILL
Goodwill represents the excess of cost over the net tangibleassets and identifiable intangible assets of acquired restaurantbusinesses. The Company’s goodwill primarily results from pur-chases of McDonald’s restaurants from franchisees andownership increases in subsidiaries or affiliates, and it is gen-erally assigned to the reporting unit expected to benefit from thesynergies of the combination. If a Company-operated restaurantis sold within 24 months of acquisition, the goodwill associatedwith the acquisition is written off in its entirety. If a restaurant issold beyond 24 months from the acquisition, the amount ofgoodwill written off is based on the relative fair value of the busi-ness sold compared to the reporting unit (defined as eachindividual country).
The Company conducts goodwill impairment testing in thefourth quarter of each year or whenever an indicator of impair-ment exists. If an indicator of impairment exists (e.g., estimatedearnings multiple value of a reporting unit is less than its carryingvalue), the goodwill impairment test compares the fair value of areporting unit, generally based on discounted future cash flows,with its carrying amount including goodwill. If the carrying amountof a reporting unit exceeds its fair value, an impairment loss ismeasured as the difference between the implied fair value of thereporting unit’s goodwill and the carrying amount of goodwill.Historically, goodwill impairment has not significantly impactedthe consolidated financial statements.
The following table presents the 2012 activity in goodwill bysegment:
In millions U.S. Europe APMEA(1)Other Countries
& Corporate(2) Consolidated
Balance at December 31, 2011 $1,254.4 $801.6 $405.4 $191.8 $2,653.2Net restaurant purchases (sales) 39.8 54.2 21.3 (2.7) 112.6Ownership changes and other (3.5) (3.5)Currency translation 25.6 12.0 4.1 41.7Balance at December 31, 2012 $1,294.2 $881.4 $438.7 $189.7 $2,804.0(1) APMEA represents Asia/Pacific, Middle East and Africa.
(2) Other Countries & Corporate represents Canada, Latin America and Corporate.
LONG-LIVED ASSETS
Long-lived assets are reviewed for impairment annually in thefourth quarter and whenever events or changes in circumstancesindicate that the carrying amount of an asset may not berecoverable. For purposes of annually reviewing McDonald’s res-taurant assets for potential impairment, assets are initiallygrouped together at a television market level in the U.S. and at acountry level for each of the international markets. The Companymanages its restaurants as a group or portfolio with significantcommon costs and promotional activities; as such, an individualrestaurant’s cash flows are not generally independent of the cashflows of others in a market. If an indicator of impairment (e.g.,negative operating cash flows for the most recent trailing 24-month period) exists for any grouping of assets, an estimate ofundiscounted future cash flows produced by each individual res-taurant within the asset grouping is compared to its carryingvalue. If an individual restaurant is determined to be impaired, theloss is measured by the excess of the carrying amount of therestaurant over its fair value as determined by an estimate ofdiscounted future cash flows.
Losses on assets held for disposal are recognized whenmanagement and the Board of Directors, as required, haveapproved and committed to a plan to dispose of the assets, theassets are available for disposal, the disposal is probable of
occurring within 12 months, and the net sales proceeds areexpected to be less than its net book value, among other factors.Generally, such losses relate to restaurants that have closed andceased operations as well as other assets that meet the criteriato be considered “available for sale”.
FAIR VALUE MEASUREMENTS
The Company measures certain financial assets and liabilities atfair value on a recurring basis, and certain non-financial assetsand liabilities on a nonrecurring basis. Fair value is defined as theprice that would be received to sell an asset or paid to transfer aliability in the principal or most advantageous market in an orderlytransaction between market participants on the measurementdate. Fair value disclosures are reflected in a three-level hier-archy, maximizing the use of observable inputs and minimizingthe use of unobservable inputs.
The valuation hierarchy is based upon the transparency ofinputs to the valuation of an asset or liability on the measurementdate. The three levels are defined as follows:
• Level 1 – inputs to the valuation methodology are quotedprices (unadjusted) for an identical asset or liability in anactive market.
• Level 2 – inputs to the valuation methodology include quotedprices for a similar asset or liability in an active market or
34 McDonald’s Corporation 2012 Annual Report
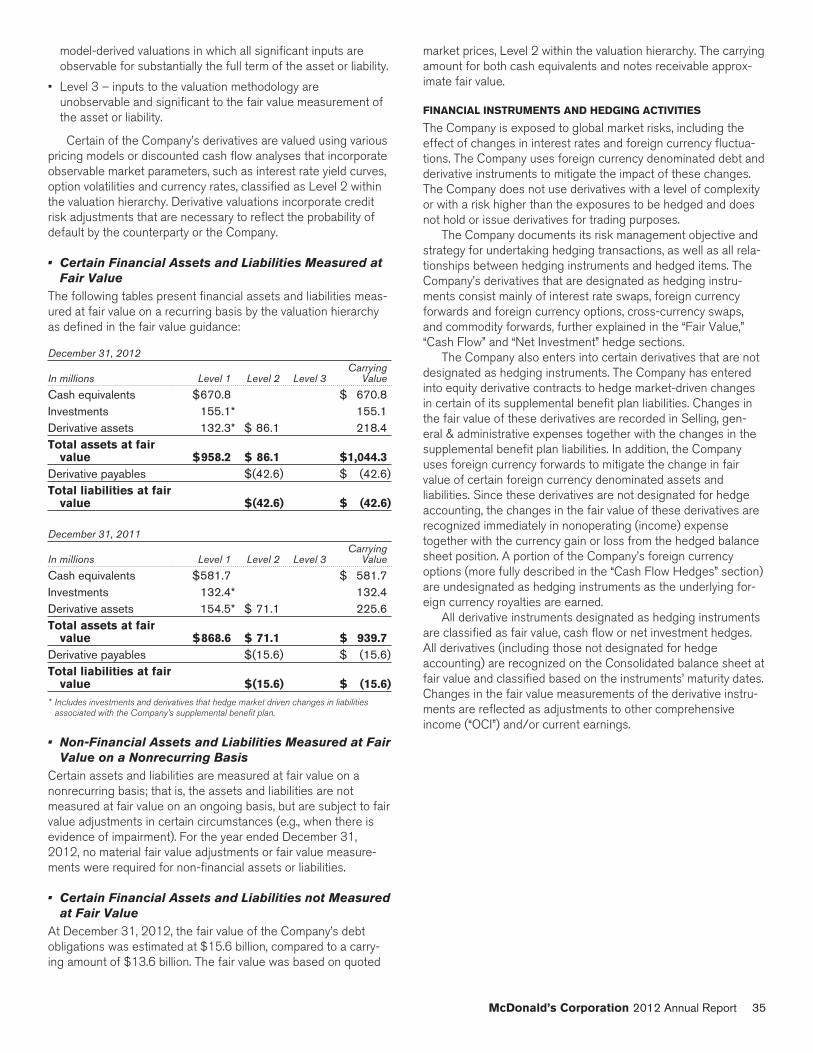
model-derived valuations in which all significant inputs areobservable for substantially the full term of the asset or liability.
• Level 3 – inputs to the valuation methodology areunobservable and significant to the fair value measurement ofthe asset or liability.
Certain of the Company’s derivatives are valued using variouspricing models or discounted cash flow analyses that incorporateobservable market parameters, such as interest rate yield curves,option volatilities and currency rates, classified as Level 2 withinthe valuation hierarchy. Derivative valuations incorporate creditrisk adjustments that are necessary to reflect the probability ofdefault by the counterparty or the Company.
• Certain Financial Assets and Liabilities Measured atFair Value
The following tables present financial assets and liabilities meas-ured at fair value on a recurring basis by the valuation hierarchyas defined in the fair value guidance:
December 31, 2012
In millions Level 1 Level 2 Level 3Carrying
Value
Cash equivalents $670.8 $ 670.8Investments 155.1* 155.1Derivative assets 132.3* $ 86.1 218.4Total assets at fair
value $958.2 $ 86.1 $1,044.3Derivative payables $(42.6) $ (42.6)Total liabilities at fair
value $(42.6) $ (42.6)
December 31, 2011
In millions Level 1 Level 2 Level 3Carrying
Value
Cash equivalents $581.7 $ 581.7Investments 132.4* 132.4Derivative assets 154.5* $ 71.1 225.6Total assets at fair
value $868.6 $ 71.1 $ 939.7Derivative payables $(15.6) $ (15.6)Total liabilities at fair
value $(15.6) $ (15.6)* Includes investments and derivatives that hedge market driven changes in liabilities
associated with the Company’s supplemental benefit plan.
• Non-Financial Assets and Liabilities Measured at FairValue on a Nonrecurring Basis
Certain assets and liabilities are measured at fair value on anonrecurring basis; that is, the assets and liabilities are notmeasured at fair value on an ongoing basis, but are subject to fairvalue adjustments in certain circumstances (e.g., when there isevidence of impairment). For the year ended December 31,2012, no material fair value adjustments or fair value measure-ments were required for non-financial assets or liabilities.
• Certain Financial Assets and Liabilities not Measuredat Fair Value
At December 31, 2012, the fair value of the Company’s debtobligations was estimated at $15.6 billion, compared to a carry-ing amount of $13.6 billion. The fair value was based on quoted
market prices, Level 2 within the valuation hierarchy. The carryingamount for both cash equivalents and notes receivable approx-imate fair value.
FINANCIAL INSTRUMENTS AND HEDGING ACTIVITIES
The Company is exposed to global market risks, including theeffect of changes in interest rates and foreign currency fluctua-tions. The Company uses foreign currency denominated debt andderivative instruments to mitigate the impact of these changes.The Company does not use derivatives with a level of complexityor with a risk higher than the exposures to be hedged and doesnot hold or issue derivatives for trading purposes.
The Company documents its risk management objective andstrategy for undertaking hedging transactions, as well as all rela-tionships between hedging instruments and hedged items. TheCompany’s derivatives that are designated as hedging instru-ments consist mainly of interest rate swaps, foreign currencyforwards and foreign currency options, cross-currency swaps,and commodity forwards, further explained in the “Fair Value,”“Cash Flow” and “Net Investment” hedge sections.
The Company also enters into certain derivatives that are notdesignated as hedging instruments. The Company has enteredinto equity derivative contracts to hedge market-driven changesin certain of its supplemental benefit plan liabilities. Changes inthe fair value of these derivatives are recorded in Selling, gen-eral & administrative expenses together with the changes in thesupplemental benefit plan liabilities. In addition, the Companyuses foreign currency forwards to mitigate the change in fairvalue of certain foreign currency denominated assets andliabilities. Since these derivatives are not designated for hedgeaccounting, the changes in the fair value of these derivatives arerecognized immediately in nonoperating (income) expensetogether with the currency gain or loss from the hedged balancesheet position. A portion of the Company’s foreign currencyoptions (more fully described in the “Cash Flow Hedges” section)are undesignated as hedging instruments as the underlying for-eign currency royalties are earned.
All derivative instruments designated as hedging instrumentsare classified as fair value, cash flow or net investment hedges.All derivatives (including those not designated for hedgeaccounting) are recognized on the Consolidated balance sheet atfair value and classified based on the instruments’ maturity dates.Changes in the fair value measurements of the derivative instru-ments are reflected as adjustments to other comprehensiveincome (“OCI”) and/or current earnings.
McDonald’s Corporation 2012 Annual Report 35
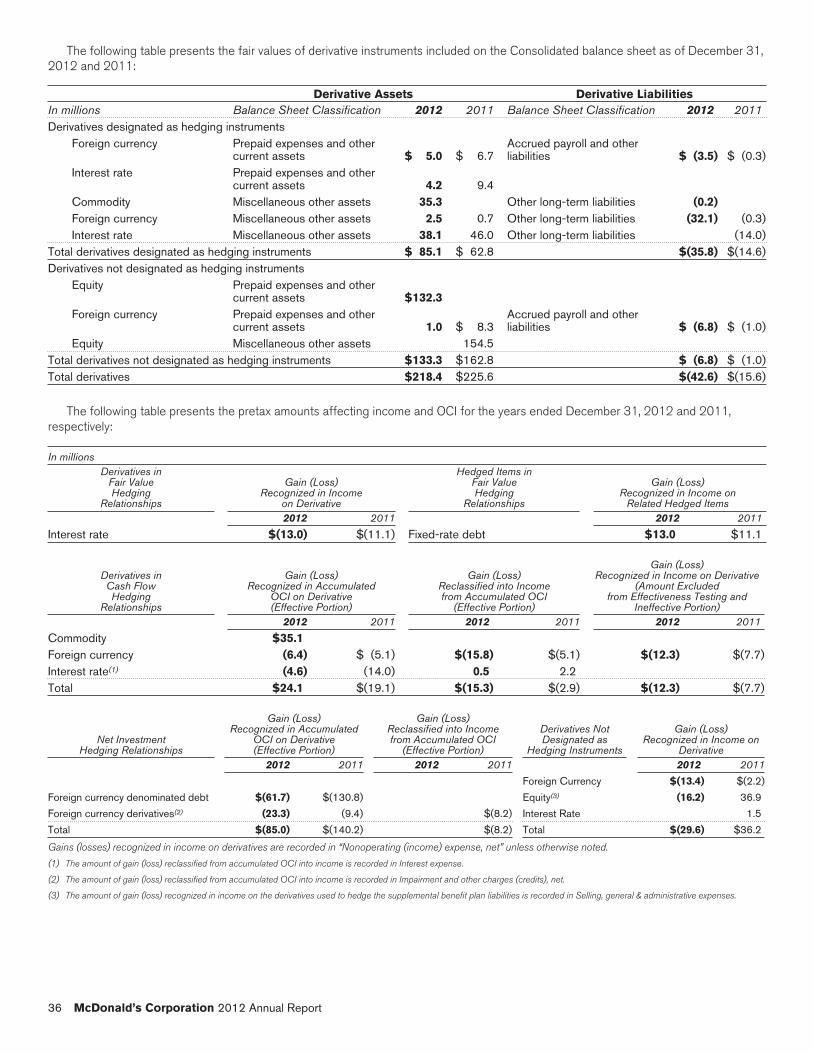
The following table presents the fair values of derivative instruments included on the Consolidated balance sheet as of December 31,2012 and 2011:
Derivative Assets Derivative LiabilitiesIn millions Balance Sheet Classification 2012 2011 Balance Sheet Classification 2012 2011Derivatives designated as hedging instruments
Foreign currency Prepaid expenses and othercurrent assets $ 5.0 $ 6.7
Accrued payroll and otherliabilities $ (3.5) $ (0.3)
Interest rate Prepaid expenses and othercurrent assets 4.2 9.4
Commodity Miscellaneous other assets 35.3 Other long-term liabilities (0.2)Foreign currency Miscellaneous other assets 2.5 0.7 Other long-term liabilities (32.1) (0.3)Interest rate Miscellaneous other assets 38.1 46.0 Other long-term liabilities (14.0)
Total derivatives designated as hedging instruments $ 85.1 $ 62.8 $(35.8) $(14.6)Derivatives not designated as hedging instruments
Equity Prepaid expenses and othercurrent assets $132.3
Foreign currency Prepaid expenses and othercurrent assets 1.0 $ 8.3
Accrued payroll and otherliabilities $ (6.8) $ (1.0)
Equity Miscellaneous other assets 154.5Total derivatives not designated as hedging instruments $133.3 $162.8 $ (6.8) $ (1.0)Total derivatives $218.4 $225.6 $(42.6) $(15.6)
The following table presents the pretax amounts affecting income and OCI for the years ended December 31, 2012 and 2011,respectively:
In millionsDerivatives in
Fair ValueHedging
Relationships
Gain (Loss)Recognized in Income
on Derivative
Hedged Items inFair ValueHedging
Relationships
Gain (Loss)Recognized in Income on
Related Hedged Items2012 2011 2012 2011
Interest rate $(13.0) $(11.1) Fixed-rate debt $13.0 $11.1
Derivatives inCash FlowHedging
Relationships
Gain (Loss)Recognized in Accumulated
OCI on Derivative(Effective Portion)
Gain (Loss)Reclassified into Incomefrom Accumulated OCI
(Effective Portion)
Gain (Loss)Recognized in Income on Derivative
(Amount Excludedfrom Effectiveness Testing and
Ineffective Portion)2012 2011 2012 2011 2012 2011
Commodity $35.1Foreign currency (6.4) $ (5.1) $(15.8) $(5.1) $(12.3) $(7.7)Interest rate(1) (4.6) (14.0) 0.5 2.2Total $24.1 $(19.1) $(15.3) $(2.9) $(12.3) $(7.7)
Net InvestmentHedging Relationships
Gain (Loss)Recognized in Accumulated
OCI on Derivative(Effective Portion)
Gain (Loss)Reclassified into Incomefrom Accumulated OCI
(Effective Portion)
Derivatives NotDesignated as
Hedging Instruments
Gain (Loss)Recognized in Income on
Derivative2012 2011 2012 2011 2012 2011
Foreign Currency $(13.4) $(2.2)
Foreign currency denominated debt $(61.7) $(130.8) Equity(3) (16.2) 36.9
Foreign currency derivatives(2) (23.3) (9.4) $(8.2) Interest Rate 1.5
Total $(85.0) $(140.2) $(8.2) Total $(29.6) $36.2
Gains (losses) recognized in income on derivatives are recorded in “Nonoperating (income) expense, net” unless otherwise noted.
(1) The amount of gain (loss) reclassified from accumulated OCI into income is recorded in Interest expense.
(2) The amount of gain (loss) reclassified from accumulated OCI into income is recorded in Impairment and other charges (credits), net.
(3) The amount of gain (loss) recognized in income on the derivatives used to hedge the supplemental benefit plan liabilities is recorded in Selling, general & administrative expenses.
36 McDonald’s Corporation 2012 Annual Report

• Fair Value HedgesThe Company enters into fair value hedges to reduce theexposure to changes in the fair values of certain liabilities. Thefair value hedges the Company enters into consist of interest rateswaps which convert a portion of its fixed-rate debt into floating-rate debt. All of the Company’s interest rate swaps meet theshortcut method requirements. Accordingly, changes in the fairvalues of the interest rate swaps are exactly offset by changes inthe fair value of the underlying debt. No ineffectiveness has beenrecorded to net income related to interest rate swaps designatedas fair value hedges for the year ended December 31, 2012. Atotal of $1.8 billion of the Company’s outstanding fixed-rate debtwas effectively converted to floating-rate debt resulting from theuse of interest rate swaps.
• Cash Flow HedgesThe Company enters into cash flow hedges to reduce theexposure to variability in certain expected future cash flows. Thetypes of cash flow hedges the Company enters into includeinterest rate swaps, foreign currency forwards, foreign currencyoptions, cross currency swaps, and commodity forwards.
The Company periodically uses interest rate swaps to effec-tively convert a portion of floating-rate debt, including forecasteddebt issuances, into fixed-rate debt and the agreements areintended to reduce the impact of interest rate changes on futureinterest expense.
To protect against the reduction in value of forecasted foreigncurrency cash flows (such as royalties denominated in foreigncurrencies), the Company uses foreign currency forwards andforeign currency options to hedge a portion of anticipatedexposures.
When the U.S. dollar strengthens against foreign currencies,the decline in value of future foreign denominated royalties isoffset by gains in the fair value of the foreign currency forwardsand/or foreign currency options. Conversely, when the U.S. dollarweakens, the increase in the value of future foreign denominatedroyalties is offset by losses in the fair value of the foreign cur-rency forwards and/or foreign currency options.
Although the fair value changes in the foreign currencyoptions may fluctuate over the period of the contract, theCompany’s total loss on a foreign currency option is limited to theupfront premium paid for the contract; however, the potentialgains on a foreign currency option are unlimited. In some sit-uations, the Company uses foreign currency collars, which limitthe potential gains and lower the upfront premium paid, to protectagainst currency movements.
The hedges cover the next 19 months for certain exposuresand are denominated in various currencies. As of December 31,2012, the Company had derivatives outstanding with an equiv-alent notional amount of $626.9 million that were used to hedgea portion of forecasted foreign currency denominated royalties.
The Company excludes the time value of foreign currencyoptions from its effectiveness assessment on its cash flow hedg-es. As a result, changes in the fair value of the derivatives due tothis component, as well as the ineffectiveness of the hedges, arerecognized in earnings currently. The effective portion of thegains or losses on the derivatives is reported in the cash flowhedging component of OCI in shareholders’ equity andreclassified into earnings in the same period or periods in whichthe hedged transaction affects earnings.
The Company uses cross-currency swaps to hedge the risk ofcash flows associated with certain foreign-currency denominateddebt, including forecasted interest payments, and has electedcash flow hedge accounting. The hedges cover periods up to59 months and have an equivalent notional amount of$245.8 million.
The Company manages its exposure to the variability of cashflows for energy-related transactions in certain markets by enter-ing into commodity forwards and has elected cash flow hedgeaccounting as appropriate. The hedges cover periods up to 22years and have an equivalent notional amount of $493.8 million.
The Company recorded after tax adjustments to the cash flowhedging component of accumulated OCI in shareholders’ equity.The Company recorded a net increase of $30.6 million for theyear ended December 31, 2012 and a net decrease of$10.4 million for the year ended December 31, 2011. Based oninterest rates and foreign exchange rates at December 31, 2012,the $35.2 million in cumulative cash flow hedging gains, after tax,at December 31, 2012, is not expected to have a significanteffect on earnings over the next 12 months.
• Net Investment HedgesThe Company primarily uses foreign currency denominated debt(third party and intercompany) to hedge its investments in certainforeign subsidiaries and affiliates. Realized and unrealized trans-lation adjustments from these hedges are included inshareholders’ equity in the foreign currency translation compo-nent of OCI and offset translation adjustments on the underlyingnet assets of foreign subsidiaries and affiliates, which also arerecorded in OCI. As of December 31, 2012, $7.7 billion of inter-company foreign currency denominated debt, $4.0 billion of theCompany’s third party foreign currency denominated debt and$528.6 million of derivatives were designated to hedge invest-ments in certain foreign subsidiaries and affiliates.
• Credit RiskThe Company is exposed to credit-related losses in the event ofnon-performance by the counterparties to its hedging instru-ments. The counterparties to these agreements consist of adiverse group of financial institutions and market participants.The Company continually monitors its positions and the creditratings of its counterparties and adjusts positions as appropriate.The Company did not have significant exposure to any individualcounterparty at December 31, 2012 and has master agreementsthat contain netting arrangements. For financial reporting pur-poses, the Company presents gross derivative balances in thefinancial statements and supplementary data, even for counter-parties subject to netting arrangements. Some of theseagreements also require each party to post collateral if creditratings fall below, or aggregate exposures exceed, certain con-tractual limits. At December 31, 2012, neither the Company norits counterparties were required to post collateral on anyderivative position, other than on hedges of certain of theCompany’s supplemental benefit plan liabilities where itscounterparties were required to post collateral on their liabilitypositions.
INCOME TAX UNCERTAINTIES
The Company, like other multi-national companies, is regularlyaudited by federal, state and foreign tax authorities, and taxassessments may arise several years after tax returns have been
McDonald’s Corporation 2012 Annual Report 37

filed. Accordingly, tax liabilities are recorded when, in manage-ment’s judgment, a tax position does not meet the more likelythan not threshold for recognition. For tax positions that meet themore likely than not threshold, a tax liability may still be recordeddepending on management’s assessment of how the tax positionwill ultimately be settled.
The Company records interest and penalties on unrecognizedtax benefits in the provision for income taxes.
PER COMMON SHARE INFORMATION
Diluted earnings per common share is calculated using netincome divided by diluted weighted-average shares. Dilutedweighted-average shares include weighted-average shares out-standing plus the dilutive effect of share-based compensationcalculated using the treasury stock method, of (in millions ofshares): 2012–10.1; 2011–12.8; 2010–14.3. Stock options thatwere not included in diluted weighted-average shares becausethey would have been antidilutive were (in millions of shares):2012–4.7; 2011–0.0; 2010–0.0.
The Company has elected to exclude the pro forma deferredtax asset associated with share-based compensation in earningsper share.
STATEMENT OF CASH FLOWS
The Company considers short-term, highly liquid investments withan original maturity of 90 days or less to be cash equivalents.
SUBSEQUENT EVENTS
The Company evaluated subsequent events through the date thefinancial statements were issued and filed with the U.S. Secu-rities and Exchange Commission (“SEC”). There were nosubsequent events that required recognition or disclosure.
Comprehensive Income
In June 2011, the Financial Accounting Standards Board(“FASB”) issued an update to Topic 220 – ComprehensiveIncome of the Accounting Standards Codification (“ASC”). Theupdate is intended to increase the prominence of other compre-hensive income in the financial statements. The guidancerequires that the Company presents components of compre-hensive income in either one continuous statement or twoseparate consecutive statements. The Company adopted thisnew guidance in 2012, as required, and included a separateConsolidated statement of comprehensive income for the yearsended December 31, 2012, 2011 and 2010.
Property and Equipment
Net property and equipment consisted of:
In millions December 31, 2012 2011Land $ 5,612.6 $ 5,328.3Buildings and improvements
on owned land 14,089.0 13,079.9Buildings and improvements
on leased land 12,970.8 12,021.8Equipment, signs and
seating 5,241.0 4,757.2Other 577.7 550.4
38,491.1 35,737.6Accumulated depreciation
and amortization (13,813.9) (12,903.1)Net property and equipment $ 24,677.2 $ 22,834.5
Depreciation and amortization expense was (in millions): 2012–$1,402.2; 2011–$1,329.6; 2010–$1,200.4.
Impairment and Other Charges (Credits), Net
In millions 2012 2011 2010Europe $6.6 $ 0.3 $ 1.6APMEA (4.2) 48.5Other Countries & Corporate 1.4 (21.0)
Total $8.0 $(3.9) $ 29.1
In 2010, the Company recorded expense of $29 million primarilyrelated to its share of restaurant closing costs in McDonald’sJapan in conjunction with the strategic review of the market’srestaurant portfolio, partly offset by income related to the reso-lution of certain liabilities retained in connection with the 2007Latin America developmental license transaction.
Other Operating (Income) Expense, Net
In millions 2012 2011 2010Gains on sales of restaurant
businesses $(151.5) $ (81.8) $ (79.4)Equity in earnings of
unconsolidated affiliates (143.5) (178.0) (164.3)Asset dispositions and other
expense 43.5 26.9 45.5Total $(251.5) $(232.9) $(198.2)
• Gains on sales of restaurant businessesGains on sales of restaurant businesses include gains from salesof Company-operated restaurants. The Company’s purchasesand sales of businesses with its franchisees are aimed at achiev-ing an optimal ownership mix in each market. Resulting gains orlosses are recorded in operating income because the trans-actions are a recurring part of our business.
38 McDonald’s Corporation 2012 Annual Report

• Equity in earnings of unconsolidated affiliatesUnconsolidated affiliates and partnerships are businesses inwhich the Company actively participates but does not control.The Company records equity in earnings from these entitiesrepresenting McDonald’s share of results. For foreign affiliatedmarkets—primarily Japan—results are reported after interestexpense and income taxes. McDonald’s share of results for part-nerships in certain consolidated markets such as the U.S. arereported before income taxes. These partnership restaurants areoperated under conventional franchise arrangements and, there-fore, are classified as conventional franchised restaurants.
• Asset dispositions and other expenseAsset dispositions and other expense consists of gains or losseson excess property and other asset dispositions, provisions forrestaurant closings and uncollectible receivables, asset write-offsdue to restaurant reinvestment, and other miscellaneous incomeand expenses.
Contingencies
In the ordinary course of business, the Company is subject toproceedings, lawsuits and other claims primarily related to com-petitors, customers, employees, franchisees, governmentagencies, intellectual property, shareholders and suppliers. TheCompany is required to assess the likelihood of any adversejudgments or outcomes to these matters as well as potentialranges of probable losses. A determination of the amount ofaccrual required, if any, for these contingencies is made aftercareful analysis of each matter. The required accrual may changein the future due to new developments in each matter or changesin approach such as a change in settlement strategy in dealingwith these matters.
In connection with the sale in 2007 of its businesses in18 countries in Latin America and the Caribbean to a devel-opmental licensee organization, the Company agreed toindemnify the buyers for certain tax and other claims, certain ofwhich are reflected on McDonald’s Consolidated balance sheet(2012 and 2011: other long-term liabilities–$42.0 million and$49.4 million, respectively; 2012 and 2011: accrued payroll andother liabilities–$0.0 million and $21.2 million, respectively).
The Company believes any other matters currently beingreviewed will not have a material adverse effect on its financialcondition or results of operations.
Franchise Arrangements
Conventional franchise arrangements generally include a leaseand a license and provide for payment of initial fees, as well ascontinuing rent and royalties to the Company based upon a per-cent of sales with minimum rent payments that parallel theCompany’s underlying leases and escalations (on properties thatare leased). Under this arrangement, franchisees are granted theright to operate a restaurant using the McDonald’s System and, inmost cases, the use of a restaurant facility, generally for a periodof 20 years. These franchisees pay related occupancy costsincluding property taxes, insurance and maintenance. Affiliatesand developmental licensees operating under license agree-ments pay a royalty to the Company based upon a percent ofsales, and may pay initial fees.
Revenues from franchised restaurants consisted of:
In millions 2012 2011 2010Rents $5,863.5 $5,718.5 $5,198.4Royalties 3,032.6 2,929.8 2,579.2Initial fees 68.4 64.9 63.7Revenues from franchised
restaurants $8,964.5 $8,713.2 $7,841.3
Future minimum rent payments due to the Company underexisting franchise arrangements are:
In millions Owned sites Leased sites Total
2013 $ 1,266.0 $ 1,295.7 $ 2,561.72014 1,233.6 1,250.3 2,483.92015 1,184.3 1,198.2 2,382.52016 1,124.2 1,137.0 2,261.22017 1,061.7 1,067.9 2,129.6Thereafter 9,125.9 7,921.0 17,046.9Total minimum payments $14,995.7 $13,870.1 $28,865.8
At December 31, 2012, net property and equipment underfranchise arrangements totaled $14.6 billion (including land of$4.2 billion) after deducting accumulated depreciation and amor-tization of $7.6 billion.
Leasing Arrangements
At December 31, 2012, the Company was the lessee at 14,429restaurant locations through ground leases (the Company leasesthe land and the Company or franchisee owns the building) andthrough improved leases (the Company leases land andbuildings). Lease terms for most restaurants, where market con-ditions allow, are generally for 20 years and, in many cases,provide for rent escalations and renewal options, with certainleases providing purchase options. Escalation terms vary bygeographic segment with examples including fixed-rent escala-tions, escalations based on an inflation index, and fair-valuemarket adjustments. The timing of these escalations generallyranges from annually to every five years. For most locations, theCompany is obligated for the related occupancy costs includingproperty taxes, insurance and maintenance; however, for fran-chised sites, the Company requires the franchisees to pay thesecosts. In addition, the Company is the lessee under non-cancelable leases covering certain offices and vehicles.
The following table provides detail of rent expense:
In millions 2012 2011 2010Company-operated
restaurants:U.S. $ 59.1 $ 55.9 $ 60.4Outside the U.S. 661.0 620.4 545.0
Total 720.1 676.3 605.4Franchised restaurants:U.S. 433.0 420.0 409.7Outside the U.S. 519.7 514.7 463.5
Total 952.7 934.7 873.2Other 104.2 101.7 98.1Total rent expense $1,777.0 $1,712.7 $1,576.7
McDonald’s Corporation 2012 Annual Report 39

Rent expense included percent rents in excess of minimumrents (in millions) as follows–Company-operated restaurants:2012–$169.6; 2011–$165.2; 2010–$142.5. Franchisedrestaurants: 2012–$178.7; 2011–$173.4; 2010–$167.3.
Future minimum payments required under existing operatingleases with initial terms of one year or more are:
In millions Restaurant Other Total
2013 $ 1,276.5 $ 75.2 $ 1,351.72014 1,193.6 65.4 1,259.02015 1,076.6 53.8 1,130.42016 972.4 47.0 1,019.42017 877.7 40.2 917.9Thereafter 6,620.2 224.0 6,844.2Total minimum payments $12,017.0 $505.6 $12,522.6
Income Taxes
Income before provision for income taxes, classified by source ofincome, was as follows:
In millions 2012 2011 2010U.S. $2,879.7 $3,202.8 $2,763.0Outside the U.S. 5,199.3 4,809.4 4,237.3Income before provision for
income taxes $8,079.0 $8,012.2 $7,000.3
The provision for income taxes, classified by the timing andlocation of payment, was as follows:
In millions 2012 2011 2010U.S. federal $1,129.9 $1,173.4 $1,127.1U.S. state 189.8 165.2 161.1Outside the U.S. 1,160.0 982.1 841.5
Current tax provision 2,479.7 2,320.7 2,129.7U.S. federal 144.9 189.0 (66.8)U.S. state 5.5 8.6 13.8Outside the U.S. (15.9) (9.2) (22.7)
Deferred tax provision(benefit) 134.5 188.4 (75.7)
Provision for income taxes $2,614.2 $2,509.1 $2,054.0
Net deferred tax liabilities consisted of:
In millions December 31, 2012 2011Property and equipment $ 1,713.9 $ 1,651.3Other 636.4 541.7
Total deferred tax liabilities 2,350.3 2,193.0Property and equipment (403.6) (355.4)Employee benefit plans (362.9) (406.3)Intangible assets (258.0) (256.2)Deferred foreign tax credits (179.5) (173.9)Capital loss carryforwards (2.8) (26.0)Operating loss carryforwards (92.4) (71.1)Indemnification liabilities (18.3) (33.4)Other (298.3) (312.6)
Total deferred tax assetsbefore valuation allowance (1,615.8) (1,634.9)
Valuation Allowance 127.0 102.0Net deferred tax liabilities 861.5 660.1Balance sheet presentation:Deferred income taxes 1,531.1 1,344.1Other assets-miscellaneous (603.6) (606.3)Current assets-prepaid expenses
and other current assets (66.0) (77.7)Net deferred tax liabilities $ 861.5 $ 660.1
The statutory U.S. federal income tax rate reconciles to theeffective income tax rates as follows:
2012 2011 2010Statutory U.S. federal income tax rate 35.0% 35.0% 35.0%State income taxes, net of related
federal income tax benefit 1.6 1.4 1.6Benefits and taxes related to foreign
operations (4.1) (4.7) (6.9)Other, net (0.1) (0.4) (0.4)Effective income tax rates 32.4% 31.3% 29.3%
As of December 31, 2012 and 2011, the Company’s grossunrecognized tax benefits totaled $482.4 million and $565.0 mil-lion, respectively. After considering the deferred tax accountingimpact, it is expected that about $360 million of the total as ofDecember 31, 2012 would favorably affect the effective tax rateif resolved in the Company’s favor.
40 McDonald’s Corporation 2012 Annual Report

The following table presents a reconciliation of the beginningand ending amounts of unrecognized tax benefits:
In millions 2012 2011Balance at January 1 $565.0 $572.6Decreases for positions taken in prior years (65.7) (50.6)Increases for positions taken in prior years 36.9 24.3Increases for positions related to the current
year 47.3 54.8Settlements with taxing authorities (95.8) (14.4)Lapsing of statutes of limitations (5.3) (21.7)Balance at December 31(1) $482.4 $565.0(1) Of this amount, $481.7 million and $564.3 million are included in long-term liabilities
on the Consolidated balance sheet for 2012 and 2011, respectively. The remainderis included in deferred income taxes on the Consolidated balance sheet.
In December 2012, the Company reached a final settlementwith the Internal Revenue Service (“IRS”) Appeals Divisionregarding its U.S. federal income tax returns for 2007 and 2008.The Company agreed to a settlement of about $80 million,primarily related to proposed foreign tax credit adjustments ofabout $400 million. The liabilities previously recorded anddetermined in accordance with ASC 740—Income Taxes relatedto this matter were adequate. Additionally, no cash payment wasmade related to this settlement as the Company had previouslymade a tax deposit with the IRS. The agreement did not have amaterial impact on the Company’s cash flows, results of oper-ations or financial position.
The Company’s 2009 and 2010 U.S. federal income taxreturns are currently under examination. Additionally, the Com-pany is currently under audit in multiple state and foreign taxjurisdictions where it is reasonably possible that the audits couldbe completed within 12 months. Due to the possible completionof these audits and the expiration of the statute of limitations in
multiple tax jurisdictions, it is reasonably possible that the totalamount of unrecognized tax benefits could decrease within thenext 12 months by $150 million to $160 million, of which $10million to $30 million could favorably affect the effective tax rate.
In addition, the Company is currently under audit in multipletax jurisdictions where completion of the tax audits is notexpected within 12 months. However, it is reasonably possiblethat, as a result of audit progression within the next 12 months,there may be new information that causes the Company toreassess the total amount of unrecognized tax benefits recorded.While the Company cannot estimate the impact that newinformation may have on our unrecognized tax benefit balance,we believe that the liabilities recorded are appropriate andadequate as determined under ASC 740.
The Company is generally no longer subject to U.S. federal,state and local, or non-U.S. income tax examinations by taxauthorities for years prior to 2006.
The Company had $37.7 million and $39.6 million accruedfor interest and penalties at December 31, 2012 and 2011,respectively. The Company recognized interest and penaltiesrelated to tax matters of $11.2 million in 2012, $4.8 million in2011, and $29.0 million in 2010, which are included in the provi-sion for income taxes.
Deferred U.S. income taxes have not been recorded fortemporary differences related to investments in certain foreignsubsidiaries and corporate joint ventures. These temporarydifferences were approximately $14.8 billion at December 31,2012 and consisted primarily of undistributed earnings consid-ered permanently invested in operations outside the U.S.Determination of the deferred income tax liability on theseunremitted earnings is not practicable because such liability, ifany, is dependent on circumstances existing if and whenremittance occurs.
McDonald’s Corporation 2012 Annual Report 41

Segment and Geographic Information
The Company operates in the global restaurant industry andmanages its business as distinct geographic segments. All inter-company revenues and expenses are eliminated in computingrevenues and operating income. Corporate general and admin-istrative expenses are included in Other Countries & Corporateand consist of home office support costs in areas such as facili-ties, finance, human resources, information technology, legal,marketing, restaurant operations, supply chain and training.Corporate assets include corporate cash and equivalents, assetportions of financial instruments and home office facilities.
In millions 2012 2011 2010U.S. $ 8,813.7 $ 8,528.2 $ 8,111.6Europe 10,827.4 10,886.4 9,569.2APMEA 6,391.1 6,019.5 5,065.5Other Countries &
Corporate 1,534.8 1,571.9 1,328.3Total revenues $27,567.0 $27,006.0 $24,074.6
U.S. $ 3,750.4 $ 3,666.2 $ 3,446.5Europe 3,195.8 3,226.7 2,796.8APMEA 1,566.1 1,525.8 1,199.9(1)
Other Countries &Corporate 92.3 111.0 29.9(2)
Total operating income $ 8,604.6 $ 8,529.7 $ 7,473.1U.S. $11,431.6 $10,865.5 $10,467.7Europe 14,223.3 12,015.1 11,360.7APMEA 6,419.3 5,824.2 5,374.0Other Countries &
Corporate 3,312.3 4,285.1 4,772.8Total assets $35,386.5 $32,989.9 $31,975.2
U.S. $ 1,065.0 $ 786.5 $ 530.5Europe 1,114.7 1,130.1 978.5APMEA 716.6 614.1 493.1Other Countries &
Corporate 152.9 199.1 133.4Total capital
expenditures $ 3,049.2 $ 2,729.8 $ 2,135.5U.S. $ 477.1 $ 446.0 $ 433.0Europe 573.5 570.3 500.5APMEA 296.2 267.5 232.4Other Countries &
Corporate 141.7 131.2 110.3Total depreciation and
amortization $ 1,488.5 $ 1,415.0 $ 1,276.2(1) Includes expense due to Impairment and other charges (credits), net of $39.3 million
related to the Company’s share of restaurant closings in McDonald’s Japan (a 50%-owned affiliate).
(2) Includes income due to Impairment and other charges (credits), net of $21.0 millionrelated to the resolution of certain liabilities retained in connection with the 2007Latin America developmental license transaction.
Total long-lived assets, primarily property and equipment,were (in millions)–Consolidated: 2012–$29,644.5; 2011–$27,587.6; 2010–$26,700.9; U.S. based: 2012–$11,308.7;2011–$10,724.9; 2010–$10,430.2.
Debt Financing
LINE OF CREDIT AGREEMENTS
At December 31, 2012, the Company had a $1.5 billion line ofcredit agreement expiring in November 2016 with fees of0.065% per annum on the total commitment, which remainedunused. Fees and interest rates on this line are based on theCompany’s long-term credit rating assigned by Moody’s andStandard & Poor’s. In addition, the Company, including certainsubsidiaries outside the U.S., had unused lines of credit totaling$988.9 million at December 31, 2012; these lines of credit wereprimarily uncommitted, short-term and denominated in variouscurrencies at local market rates of interest.
The weighted-average interest rate of short-term borrowingswas 4.1% at December 31, 2012 (based on $581.3 million offoreign currency bank line borrowings and $200.0 million ofcommercial paper) and 4.6% at December 31, 2011 (based on$640.3 million of foreign currency bank line borrowings and$250.0 million of commercial paper).
DEBT OBLIGATIONS
The Company has incurred debt obligations principally throughpublic and private offerings and bank loans. There are no provi-sions in the Company’s debt obligations that would acceleraterepayment of debt as a result of a change in credit ratings or amaterial adverse change in the Company’s business. Certain ofthe Company’s debt obligations contain cross-acceleration provi-sions, and restrictions on Company and subsidiary mortgagesand the long-term debt of certain subsidiaries. Under certainagreements, the Company has the option to retire debt prior tomaturity, either at par or at a premium over par. The Company hasno current plans to retire a significant amount of its debt prior tomaturity.
ESOP LOANS
Borrowings related to the leveraged Employee Stock OwnershipPlan (“ESOP”) at December 31, 2012, which include $31.5 mil-lion of loans from the Company to the ESOP, are reflected asdebt with a corresponding reduction of shareholders’ equity(additional paid-in capital included a balance of $27.2 million and$34.4 million at December 31, 2012 and 2011, respectively).The ESOP is repaying the loans and interest through 2018 usingCompany contributions and dividends from its McDonald’scommon stock holdings. As the principal amount of the borrow-ings is repaid, the debt and the unearned ESOP compensation(additional paid-in capital) are reduced.
42 McDonald’s Corporation 2012 Annual Report

The following table summarizes the Company’s debt obligations. (Interest rates and debt amounts reflected in the table include theeffects of interest rate swaps.)
Interest rates(1)
December 31Amounts outstanding
December 31In millions of U.S. Dollars Maturity dates 2012 2011 2012 2011Fixed 4.8% 5.1% $ 7,075.7 $ 6,039.3Floating 1.2 2.0 1,650.0 1,399.9
Total U.S. Dollars 2013-2042 8,725.7 7,439.2Fixed 3.7 4.5 1,847.2 1,167.0Floating 2.9 2.8 348.0 719.0
Total Euro 2013-2024 2,195.2 1,886.0Fixed 2.9 2.9 144.2 162.4Floating 0.4 0.6 923.3 1,039.4
Total Japanese Yen 2013-2030 1,067.5 1,201.8Total British Pounds Sterling-Fixed 2020-2032 6.0 6.0 730.1 697.8
Fixed 2.0 2.8 305.4 495.8Floating 5.4 5.6 566.3 723.9
Total other currencies(2) 2013-2021 871.7 1,219.7Debt obligations before fair value adjustments(3) 13,590.2 12,444.5Fair value adjustments(4) 42.3 55.9Total debt obligations(5) $13,632.5 $12,500.4(1) Weighted-average effective rate, computed on a semi-annual basis.
(2) Primarily consists of Chinese Renminbi, Swiss Francs, and Korean Won.
(3) Aggregate maturities for 2012 debt balances, before fair value adjustments, were as follows (in millions): 2013–$0.0; 2014–$659.5; 2015–$1,167.6; 2016–$2,437.5; 2017–$1,052.9; Thereafter–$8,272.7. These amounts include a reclassification of short-term obligations totaling $1.5 billion to long-term obligations as they are supported by a long-term lineof credit agreement expiring in November 2016.
(4) The carrying value of underlying items in fair value hedges, in this case debt obligations, are adjusted for fair value changes to the extent they are attributable to the risk designated asbeing hedged. The related hedging instrument is also recorded at fair value in prepaid expenses and other current assets, miscellaneous other assets or other long-term liabilities.
(5) Includes notes payable, current maturities of long-term debt and long-term debt included on the Consolidated balance sheet. The increase in debt obligations from December 31, 2011to December 31, 2012 was primarily due to net issuances of $1.2 billion.
Employee Benefit Plans
The Company’s Profit Sharing and Savings Plan for U.S.-basedemployees includes a 401(k) feature, a regular employee matchfeature, and a discretionary employer profit sharing match. The401(k) feature allows participants to make pretax contributionsthat are matched each pay period from shares released under theESOP. The Profit Sharing and Savings Plan also provides for adiscretionary employer profit sharing match after the end of theyear for those participants eligible to share in the match.
All current account balances and future contributions andrelated earnings can be invested in several investment alter-natives as well as McDonald’s common stock in accordance witheach participant’s elections. Participants’ contributions to the401(k) feature and the discretionary employer matching con-tribution feature are limited to 20% investment in McDonald’scommon stock. Participants may choose to make separateinvestment choices for current account balances and for futurecontributions.
The Company also maintains certain supplemental benefitplans that allow participants to (i) make tax-deferred con-tributions and (ii) receive Company-provided allocations thatcannot be made under the Profit Sharing and Savings Planbecause of Internal Revenue Service limitations. The investmentalternatives and returns are based on certain market-rate invest-ment alternatives under the Profit Sharing and Savings Plan.Total liabilities were $493.5 million at December 31, 2012, and$482.5 million at December 31, 2011, and were primarilyincluded in other long-term liabilities on the Consolidated balancesheet.
The Company has entered into derivative contracts tohedge market-driven changes in certain of the liabilities. AtDecember 31, 2012, derivatives with a fair value of $132.3 mil-lion indexed to the Company’s stock and an investment totaling$123.8 million indexed to certain market indices were included inprepaid expenses and other current assets on the Consolidatedbalance sheet. All changes in liabilities for these nonqualifiedplans and in the fair value of the derivatives are recorded in Sell-ing, general & administrative expenses. Changes in fair value ofthe derivatives indexed to the Company’s stock are recorded inthe income statement because the contracts provide thecounterparty with a choice to settle in cash or shares.
Total U.S. costs for the Profit Sharing and Savings Plan,including nonqualified benefits and related hedging activities,were (in millions): 2012–$27.9; 2011–$41.3; 2010–$51.4.Certain subsidiaries outside the U.S. also offer profit sharing,stock purchase or other similar benefit plans. Total plan costsoutside the U.S. were (in millions): 2012–$62.5; 2011–$58.3;2010–$57.6.
The total combined liabilities for international retirement planswere $77.7 million and $125.4 million at December 31, 2012and 2011, respectively.
Other postretirement benefits and post-employment benefitswere immaterial.
McDonald’s Corporation 2012 Annual Report 43

Share-based Compensation
The Company maintains a share-based compensation plan which authorizes the granting of various equity-based incentives includingstock options and restricted stock units (RSUs) to employees and nonemployee directors. The number of shares of common stockreserved for issuance under the plans was 79.3 million at December 31, 2012, including 50.1 million available for future grants.
STOCK OPTIONS
Stock options to purchase common stock are granted with an exercise price equal to the closing market price of the Company’s stock onthe date of grant. Substantially all of the options become exercisable in four equal installments, beginning a year from the date of thegrant, and generally expire 10 years from the grant date. Options granted between March 21, 2000 and December 31, 2000(approximately 1.0 million options outstanding at December 31, 2012) expire 13 years from the date of grant.
Intrinsic value for stock options is defined as the difference between the current market value of the Company’s stock and theexercise price. During 2012, 2011 and 2010, the total intrinsic value of stock options exercised was $469.8 million, $416.5 million and$500.8 million, respectively. Cash received from stock options exercised during 2012 was $328.6 million and the actual tax benefit real-ized for tax deductions from stock options exercised totaled $140.2 million. The Company uses treasury shares purchased under theCompany’s share repurchase program to satisfy share-based exercises.
A summary of the status of the Company’s stock option grants as of December 31, 2012, 2011 and 2010, and changes during theyears then ended, is presented in the following table:
2012 2011 2010
OptionsShares in
millions
Weighted-averageexercise
price
Weighted-average
remainingcontractuallife in years
Aggregateintrinsicvalue inmillions
Shares inmillions
Weighted-averageexercise
priceShares in
millions
Weighted-averageexercise
price
Outstanding at beginning of year 31.7 $47.77 37.4 $42.47 47.8 $38.16Granted 4.9 99.63 3.9 75.97 4.5 63.26Exercised (8.6) 38.51 (9.0) 37.46 (13.6) 33.84Forfeited/expired (0.6) 55.28 (0.6) 55.00 (1.3) 46.03Outstanding at end of year 27.4 $59.86 5.6 $833.0 31.7 $47.77 37.4 $42.47Exercisable at end of year 17.1 $45.97 4.1 $722.1 21.9 26.4
RSUs
RSUs generally vest 100% on the third anniversary of the grant and are payable in either shares of McDonald’s common stock or cash,at the Company’s discretion. Certain executives have been awarded RSUs that vest based on Company performance. The fair value ofeach RSU granted is equal to the market price of the Company’s stock at date of grant less the present value of expected dividends overthe vesting period.
A summary of the Company’s RSU activity during the years ended December 31, 2012, 2011 and 2010 is presented in the followingtable:
2012 2011 2010
RSUsShares in
millions
Weighted-average
grant datefair value
Shares inmillions
Weighted-average
grant datefair value
Shares inmillions
Weighted-average
grant datefair value
Nonvested at beginning of year 2.1 $56.78 2.3 $51.17 2.8 $46.33Granted 0.5 90.34 0.6 67.96 0.7 56.09Vested (0.8) 50.69 (0.7) 49.88 (1.1) 42.08Forfeited 0.0 68.72 (0.1) 50.16 (0.1) 49.61Nonvested at end of year 1.8 $68.23 2.1 $56.78 2.3 $51.17
The Company realized tax deductions of $10.6 million from RSUs vested during 2012. The total fair value of RSUs vested during2012, 2011 and 2010 was $76.4 million, $55.5 million and $66.8 million, respectively.
44 McDonald’s Corporation 2012 Annual Report

Quarterly Results (Unaudited)Quarters ended
December 31Quarters ended
September 30Quarters ended
June 30Quarters ended
March 31In millions, except per share data 2012 2011 2012 2011 2012 2011 2012 2011
RevenuesSales by Company-operated
restaurants $4,658.4 $4,587.2 $4,838.4 $4,855.5 $4,673.5 $4,697.4 $4,432.2 $4,152.7Revenues from franchised
restaurants 2,293.7 2,235.5 2,314.0 2,310.8 2,242.4 2,208.0 2,114.4 1,958.9Total revenues 6,952.1 6,822.7 7,152.4 7,166.3 6,915.9 6,905.4 6,546.6 6,111.6
Company-operated margin 827.3 856.1 924.0 972.2 849.7 890.6 777.8 736.0Franchised margin 1,901.0 1,857.5 1,930.6 1,934.6 1,866.2 1,835.0 1,739.7 1,604.6Operating income 2,197.8 2,120.0 2,287.2 2,394.7 2,155.0 2,189.1 1,964.6 1,825.9Net income $1,396.1 $1,376.6 $1,455.0 $1,507.3 $1,347.0 $1,410.2 $1,266.7 $1,209.0Earnings per common
share—basic $ 1.39 $ 1.35 $ 1.45 $ 1.47 $ 1.33 $ 1.36 $ 1.24 $ 1.16Earnings per common
share—diluted $ 1.38 $ 1.33 $ 1.43 $ 1.45 $ 1.32 $ 1.35 $ 1.23 $ 1.15Dividends declared per
common share $ 1.47(1) $ 1.31(2) $ 0.70 $ 0.61 $ 0.70 $ 0.61Weighted-averaged
common shares—basic 1,002.4 1,022.0 1,006.1 1,028.8 1,013.8 1,035.6 1,018.2 1,042.4Weighted-averaged
common shares—diluted 1,010.7 1,034.7 1,015.4 1,041.3 1,023.9 1,047.7 1,030.0 1,054.6Market price per common
share:High $ 94.16 $ 101.00 $ 94.00 $ 91.22 $ 99.50 $ 84.91 $ 102.22 $ 77.59Low 83.31 83.74 86.15 82.01 85.92 75.66 95.13 72.14Close 88.21 100.33 91.75 87.82 88.53 84.32 98.10 76.09(1) Includes a $0.70 per share dividend declared and paid in third quarter and a $0.77 per share dividend declared in third quarter and paid in fourth quarter.
(2) Includes a $0.61 per share dividend declared and paid in third quarter and a $0.70 per share dividend declared in third quarter and paid in fourth quarter.
McDonald’s Corporation 2012 Annual Report 45

Management’s Assessment of Internal Control Over Financial Reporting
The financial statements were prepared by management, which is responsible for their integrity and objectivity and for establishing andmaintaining adequate internal controls over financial reporting.
The Company’s internal control over financial reporting is designed to provide reasonable assurance regarding the reliability of financialreporting and the preparation of financial statements for external purposes in accordance with generally accepted accounting principles.The Company’s internal control over financial reporting includes those policies and procedures that:
I. pertain to the maintenance of records that, in reasonable detail, accurately and fairly reflect the transactions and dispositions ofthe assets of the Company;
II. provide reasonable assurance that transactions are recorded as necessary to permit preparation of financial statements inaccordance with generally accepted accounting principles, and that receipts and expenditures of the Company are being madeonly in accordance with authorizations of management and directors of the Company; and
III. provide reasonable assurance regarding prevention or timely detection of unauthorized acquisition, use or disposition of theCompany’s assets that could have a material effect on the financial statements.
There are inherent limitations in the effectiveness of any internal control, including the possibility of human error and the circumvention oroverriding of controls. Accordingly, even effective internal controls can provide only reasonable assurances with respect to financialstatement preparation. Further, because of changes in conditions, the effectiveness of internal controls may vary over time.
Management assessed the design and effectiveness of the Company’s internal control over financial reporting as of December 31, 2012.In making this assessment, management used the criteria set forth by the Committee of Sponsoring Organizations of the TreadwayCommission (“COSO”) in Internal Control – Integrated Framework.
Based on management’s assessment using those criteria, as of December 31, 2012, management believes that the Company’s internalcontrol over financial reporting is effective.
Ernst & Young, LLP, independent registered public accounting firm, has audited the financial statements of the Company for the fiscalyears ended December 31, 2012, 2011 and 2010 and the Company’s internal control over financial reporting as of December 31, 2012.Their reports are presented on the following pages. The independent registered public accountants and internal auditors advisemanagement of the results of their audits, and make recommendations to improve the system of internal controls. Management evaluatesthe audit recommendations and takes appropriate action.
McDONALD’S CORPORATION
February 25, 2013
46 McDonald’s Corporation 2012 Annual Report

Report of Independent Registered Public Accounting Firm
The Board of Directors and Shareholders of McDonald’s Corporation
We have audited the accompanying consolidated balance sheets of McDonald’s Corporation as of December 31, 2012 and 2011, andthe related consolidated statements of income, comprehensive income, shareholders’ equity, and cash flows for each of the three years inthe period ended December 31, 2012. These financial statements are the responsibility of the Company’s management. Our responsi-bility is to express an opinion on these financial statements based on our audits.
We conducted our audits in accordance with the standards of the Public Company Accounting Oversight Board (United States). Thosestandards require that we plan and perform the audit to obtain reasonable assurance about whether the financial statements are free ofmaterial misstatement. An audit includes examining, on a test basis, evidence supporting the amounts and disclosures in the financialstatements. An audit also includes assessing the accounting principles used and significant estimates made by management, as well asevaluating the overall financial statement presentation. We believe that our audits provide a reasonable basis for our opinion.
In our opinion, the financial statements referred to above present fairly, in all material respects, the consolidated financial position ofMcDonald’s Corporation at December 31, 2012 and 2011, and the consolidated results of its operations and its cash flows for each ofthe three years in the period ended December 31, 2012, in conformity with U.S. generally accepted accounting principles.
We also have audited, in accordance with the standards of the Public Company Accounting Oversight Board (United States), McDonald’sCorporation’s internal control over financial reporting as of December 31, 2012, based on criteria established in Internal Control-Integrated Framework issued by the Committee of Sponsoring Organizations of the Treadway Commission, and our report datedFebruary 25, 2013, expressed an unqualified opinion thereon.
ERNST & YOUNG LLP
Chicago, IllinoisFebruary 25, 2013
McDonald’s Corporation 2012 Annual Report 47

Report of Independent Registered Public Accounting Firm on Internal Control Over FinancialReporting
The Board of Directors and Shareholders of McDonald’s Corporation
We have audited McDonald’s Corporation’s internal control over financial reporting as of December 31, 2012, based on criteria estab-lished in Internal Control – Integrated Framework issued by the Committee of Sponsoring Organizations of the Treadway Commission(the COSO criteria). McDonald’s Corporation’s management is responsible for maintaining effective internal control over financial report-ing, and for its assessment of the effectiveness of internal control over financial reporting included in the accompanying report onManagement’s Assessment of Internal Control over Financial Reporting. Our responsibility is to express an opinion on the Company’sinternal control over financial reporting based on our audit.
We conducted our audit in accordance with the standards of the Public Company Accounting Oversight Board (United States). Thosestandards require that we plan and perform the audit to obtain reasonable assurance about whether effective internal control over finan-cial reporting was maintained in all material respects. Our audit included obtaining an understanding of internal control over financialreporting, assessing the risk that a material weakness exists, testing and evaluating the design and operating effectiveness of internalcontrol based on the assessed risk, and performing such other procedures as we considered necessary in the circumstances. We believethat our audit provides a reasonable basis for our opinion.
A company’s internal control over financial reporting is a process designed to provide reasonable assurance regarding the reliability offinancial reporting and the preparation of financial statements for external purposes in accordance with generally accepted accountingprinciples. A company’s internal control over financial reporting includes those policies and procedures that (1) pertain to the main-tenance of records that, in reasonable detail, accurately and fairly reflect the transactions and dispositions of the assets of the company;(2) provide reasonable assurance that transactions are recorded as necessary to permit preparation of financial statements in accord-ance with generally accepted accounting principles, and that receipts and expenditures of the company are being made only inaccordance with authorizations of management and directors of the company; and (3) provide reasonable assurance regarding pre-vention or timely detection of unauthorized acquisition, use, or disposition of the company’s assets that could have a material effect onthe financial statements.
Because of its inherent limitations, internal control over financial reporting may not prevent or detect misstatements. Also, projections ofany evaluation of effectiveness to future periods are subject to the risk that controls may become inadequate because of changes inconditions, or that the degree of compliance with the policies or procedures may deteriorate.
In our opinion, McDonald’s Corporation maintained, in all material respects, effective internal control over financial reporting as ofDecember 31, 2012, based on the COSO criteria.
We also have audited, in accordance with the standards of the Public Company Accounting Oversight Board (United States), the con-solidated financial statements of McDonald’s Corporation as of December 31, 2012 and 2011 and for each of the three years in theperiod ended December 31, 2012, and our report dated February 25, 2013, expressed an unqualified opinion thereon.
ERNST & YOUNG LLP
Chicago, IllinoisFebruary 25, 2013
48 McDonald’s Corporation 2012 Annual Report

Executive Management & BusinessUnit Officers
Jose Armario*Corporate EVP – Global Supply Chain, Development and
Franchising
Peter Bensen*Corporate EVP and Chief Financial Officer
John BettsPresident – McDonald’s Canada
Bridget CoffingCorporate SVP – Corporate Relations
Timothy Fenton*Chief Operating Officer
Richard Floersch*Corporate EVP and Chief Human Resources Officer
Douglas Goare*President – McDonald’s Europe
J.C. Gonzalez-MendezCorporate SVP – Global Corporate Social Responsibility and
Sustainability
David Hoffmann*President – McDonald’s APMEA
Kenneth Koziol*Corporate Executive Vice President – Chief Restaurant Officer
Edgardo NavarroLatin America SVP - President – McDonald’s Latin America
Kevin Ozan*Corporate SVP - Controller
Gloria Santona*Corporate EVP – General Counsel & Secretary
James SappingtonCorporate SVP – Chief Information Officer
Jeffrey Stratton*President – McDonald’s USA
Donald Thompson*President and Chief Executive Officer
*Executive Officer
Board of Directors
Director
Susan E. Arnold2, 3
Former President – Global Business Units
The Procter & Gamble Company
Robert A. Eckert2, 4, 6
Chairman Emeritus of the Board
Mattel, Inc.
Enrique Hernandez, Jr.1, 4, 6
President and Chief Executive Officer
Inter-Con Security Systems, Inc.
Jeanne P. Jackson5, 6
President of Direct to Consumer
NIKE, Inc.
Richard H. Lenny2, 3, 5
Operating Partner
Friedman, Fleischer & Lowe, LLC
Walter E. Massey1, 3
President
School of the Art Institute of Chicago
Andrew J. McKenna4, 6
Chairman of the Board
McDonald’s Corporation
Chairman of the Board
Schwarz Supply Source
Cary D. McMillan1, 5
Chief Executive Officer
True Partners Consulting LLC
Sheila A. Penrose1, 3
Chairman of the Board
Jones Lang LaSalle Incorporated
John W. Rogers, Jr.2, 3, 5
Chairman and Chief Executive Officer
Ariel Investments, LLC
Roger W. Stone1, 5, 6
Chairman and Chief Executive Officer
KapStone Paper and Packaging Corporation
Donald Thompson4
President and Chief Executive Officer
McDonald’s Corporation
Miles D. White2, 6
Chairman and Chief Executive Officer
Abbott Laboratories
1. Audit Committee
2. Compensation Committee
3. Sustainability and Corporate Responsibility Committee
4. Executive Committee
5. Finance Committee
6. Governance Committee
McDonald’s Corporation 2012 Annual Report 49

Investor Information
Common stockTicker symbol: MCD
Stock exchange listing: New York
The number of shareholders of record and beneficial owners ofthe Company’s common stock as of January 31, 2013, wasestimated to be 1,811,000.
McDonald’s home officeMcDonald’s CorporationOne McDonald’s PlazaOak Brook IL 605231.630.623.3000
Annual meetingMay 23, 20139:00 a.m. Central TimeMcDonald’s Office CampusOak Brook IL 60523
McDonald’s onlineInvestor informationwww.investor.mcdonalds.com
Corporate governancewww.governance.mcdonalds.com
Corporate social responsibilitywww.crmcdonalds.com
General informationwww.aboutmcdonalds.com
Key phone numbersShareholder Services1.630.623.7428
MCDirect Shares (direct stock purchase plan)1.800.228.9623
U.S. customer comments/inquiries1.800.244.6227
Financial media1.630.623.3678
Franchising1.630.623.6196
Shareholder account informationStock transfer agent, registrar and MCDirect SharesadministratorComputersharec/o McDonald’s Shareholder ServicesP.O. Box 43078Providence, RI 02940-3078
www.computershare.com/mcdonaldsU.S. and Canada: 1.800.621.7825International: 1.312.360.5129TDD (hearing impaired): 1.312.588.4110
TrademarksAll trademarks used herein are the property of their respectiveowners and are used with permission.
Available informationCopies of Certifications dated February 25, 2013 of the Compa-ny’s Chief Executive Officer, Donald Thompson, and ChiefFinancial Officer, Peter J. Bensen, pursuant to Rule 13a-14(a) ofthe Securities Exchange Act of 1934, are attached as Exhibits31.1 and 31.2, respectively, to the Company’s Annual Report onForm 10-K for the fiscal year ended December 31, 2012.Shareholders may obtain a copy of these certifications and/or acomplete copy of the Company’s Annual Report on Form 10-Kby following the instructions below.
McDonald’s Annual Report on Form 10-KThe financial information included in this report was excerptedfrom the Company’s Annual Report on Form 10-K for the periodended December 31, 2012, filed with the SEC on February 25,2013, and speaks as of February 25, 2013. Shareholders mayaccess a complete copy of the 10-K online atwww.investor.mcdonalds.com or www.sec.gov. Shareholders mayalso request a paper copy at no charge by calling 1-800-228-9623 or writing to McDonald’s Corporation, ShareholderServices, Department 720, One McDonald’s Plaza, Oak Brook,Illinois 60523.
The information in this report is as of March 13, 2013 unlessotherwise indicated.
Reproduction of photography and/or text in whole or in partwithout permission is prohibited.
©2013 McDonald’sPrinted in the U.S.A.MCD13-4765
Printing: R.R. Donnelley
The Annual Report is printed on paper certified to the standardsof the Forest Stewardship Council™and includes post-consumerfiber. The FSC® trademark identifies products which contain fiberfrom well-managed forests certified in accordance with FSCstandards.
50 McDonald’s Corporation 2012 Annual Report

Fred Turner | 1933 – 2013
Fred Turner was a visionary who could spot a trend before anyone even noticed. His gut instinct shaped and redefined how America, and ultimately the world, would dine. From the time our founder Ray Kroc hired Fred as a grill man at our first restaurant in 1956 through his rise to become our Chairman and CEO, Fred’s simple genius was on display. From training our people to leading our global expansion to championing food people love to giving back to the communities we serve, we at McDonald’s are who we are because of Fred.
Fred Turner, our good friend and one-of-a-kind honorary chairman, passed away in January. But his influence is present throughout McDonald’s and contemporary culture. And always will be.
The grill man who changed the world.

McDonald’s Corporation
One McDonald’s Plaza
Oak Brook, IL 60523
aboutmcdonalds.com