2012 ANNuAl RepORt Marked set by...
182
2012 ANNUAL REPORT
Transcript of 2012 ANNuAl RepORt Marked set by...

2012 Annual Report I CN
O Financial G
roup, Inc.
2012 ANNuAl RepORt
cdamiano
Sticky Note
Marked set by cdamiano


CNO Financial Group 2012 Annual Report
Letter to Our Shareholders 2
Bankers Life and Casualty Company 6
Colonial Penn Life Insurance Company 8
Washington National Insurance Company 10
CNO in the Community 12
Annual Report on Form 10-K 15
Market for Registrant’s Common Equity Related Stockholder 49Matters and Issuer Purchases of Equity Securities
Selected Consolidated Financial Data 51
Management’s Discussion and Analysis of Consolidated 52Financial Condition and Results of Operations
Consolidated Financial Statements and Supplementary Data 105
Exhibits and Financial Statement Schedules 169
Directors of CNO Financial Group, Inc. 175
Investor Information 177
249224_Labrador_Narr_R3.indd 1 3/19/13 5:21 PM
cdamiano
Sticky Note
Unmarked set by cdamiano

2
CNO’s accomplishments were aligned with our strategic priorities as we delivered long-term value for our shareholders and other stakeholders. We further improved our financial strength and our earnings profile, and, with the completion of our recapitalization, enhanced our financial flexibility. We also proactively addressed several legacy litigation issues during the year, which should lead to less earnings volatility and improved financial flexibility as we move forward.
Additionally, we returned significant value to shareholders during the year through our share buyback program and our initiation of a common stock dividend. Including the convertible debenture repurchase in the third quarter, CNO returned nearly $550 million in capital to shareholders in 2012.
The breadth of these achievements was recognized on two important fronts. We earned positive ratings actions by all of the major ratings agencies, including three upgrades. In addition, our stock price reflected our achievements, as CNO’s total return during the year was 49 percent, outperforming the S&P Life and Health Insurance Index and our peer group average by a wide margin.
While we successfully deployed excess capital into stock buybacks and dividends, we also continued to invest in our business. Our focus has been on initiatives that increase the reach, productivity and size of our agent force, while keeping a keen eye on profitable growth. We are increasing direct marketing efforts, adding new locations to expand our presence in under-penetrated markets, along with developing and launching new products that will meet the needs of our fast-growing target market. These investments are paying off, as consolidated core sales, excluding annuities, have grown at an eight percent compound rate since 2010, and were up 12 percent in 2012.
Letter to our sharehoLders
I am pleased to report that 2012 was a year marked by significant achievements on many fronts for CNO Financial Group.
CNO
49%
Peer Group
17%
2012 Total Return
S&P Insurance
19%
249224_Labrador_Narr.indd 2 3/15/13 6:44 PM

3
CNO Financial Group 2012 Annual Report
Financial PerformanceWe achieved our fourth consecutive year of earnings and growth in 2012. Importantly, this growth extended across all of our actively marketed businesses, as sales, defined by new annualized premium, increased by 5 percent over the prior year to $393 million. The low interest rate environment continued to be a headwind that depressed fixed annuity sales, but the strength of our middle-income market focus, distribution and product breadth more than offset the decline in annuity sales.
CNO reported net operating income of $180 million, or 69 cents per diluted share, in 2012, compared to $172 million, or 61 cents per diluted share, in the prior year. Our financial strength continued to improve as a result of significant management actions during the year, including recapitalizing our company, which increased financial flexibility, while continuing to generate strong earnings and cash flow. Our consolidated statutory risk-based capital rose to 367 percent from 358 percent in the prior year, and we closed the year with $294 million of liquidity and investments at the holding company level.
CNO Senior Leadership Team Left to right: Eric Johnson, President, 40|86 Advisors; Scott Perry, Chief Business Officer and President, Bankers Life and Casualty; Susan Menzel, Executive Vice President, Human Resources; Tony Zehnder, Senior Vice President, Corporate Communications; Matt Zimpfer, Executive Vice President and General Counsel; Ed Bonach, Chief Executive Officer; Chris Nickele, Executive Vice President, Product Management and President, Other CNO Business; Fred Crawford, Executive Vice President and Chief Financial Officer; and Bruce Baude, Executive Vice President and Chief Operations and Technology Officer.
New Annualized Premium(in millions)
2011
$375.1
2012
$393.4
Operating Income (in millions)
2011
$171.5
2012
$180.4
249224_Labrador_Narr_R1.indd 3 3/18/13 3:45 PM

4
Business PerformanceSo what drove our year of significant accomplishments, and is it sustainable? We strongly believe it starts with our market focus on pre- and at-retirement middle-income Americans. We reach that market with our primarily exclusive distribution, aligned with a breadth of products and service to meet our customers’ needs. This market focus and alignment are key differentiators. We have invested in the expansion of our distribution platforms, and plan to continue that investment strategy as we strive to serve the middle-income market, improve our operating efficiencies and deliver on the customer experience.
At Bankers Life, our career distribution channel, we added 25 new locations in 2012, for a total of 276 branches and satellite offices across the country. We are pleased to report that our agent force grew by 6 percent due to increased productivity and retention efforts. New annualized premium, excluding annuities, rose by 9 percent for the year, and we successfully introduced a new critical illness product that is now available in 46 states.
The annual election period for Medicare Advantage sales again produced strong results, and our relationships with partner companies for Medicare Advantage and Prescription Drug Program sales also were successful. Of note, we are continuing our partnership selling of Humana Preferred prescription plans in Walmart locations across the country.
Washington National also had a strong year. Core product sales grew by 13 percent in 2012. Life product sales showed healthy gains, while supplemental health sales also were strong during the year.
Agent recruiting and retention were also Washington National strengths. At Performance Matters Associates (PMA), our wholly owned agency, the number of new agents increased by 35 percent, and in our partner channel, new partners grew by 19 percent. Agent and partner growth are key factors supporting our future performance.
Colonial Penn, our direct distribution channel, also performed well, with sales rising by 20 percent over
the prior year. The results were due primarily to our direct marketing investments. Colonial Penn’s year was marked by the introduction of a new term life product, improved direct marketing initiatives and sales productivity improvements.
Overall, our plans for expanded distribution and straightforward product offerings are on track with our strategic business plans, as we work to more effectively serve our growing target market. We have identified capital deployment initiatives to accelerate organic growth for all three of our core businesses.
Specifically, we expect to continue to increase the number of Bankers Life branch locations, expand our field management, sales productivity tools and cross-selling capability, and stay focused on the customer. At Washington National, we expect increased focus and continued momentum in the voluntary worksite market, as well as expansion of the number of states served by PMA. With Colonial Penn, we will continue investing in lead generation and new product development, along with our emerging focus on the Hispanic market.
Investment results were also very strong in 2012. Investment yields were substantially maintained from the prior year, despite continued low interest rates, as a result of strategic and tactical moves throughout the year. Investing wisely for the long run represents one of our core competencies.
Our PeopleOur associates are our most valuable asset. We win or lose with our people, and our ability to attract and retain great people remains one of our key strengths, as we strive to ensure that CNO is an employer of choice. We saw proof of that as we enhanced the talent of our management team during the year, bringing seasoned executives on board, while also promoting a number of internal executives as well.
Training and development are high priorities across our businesses. We have successfully implemented several new programs, including a company-wide development program for high-potential employees and a Manager Trainee Program at Bankers Life.
249224_Labrador_Narr.indd 4 3/15/13 6:44 PM

5
CNO Financial Group 2012 Annual Report
There also were noteworthy changes on our board of directors during the year. We were pleased to welcome two new members, Ellyn Brown, retired Principal of Brown & Associates, and Nina Henderson, Managing Partner of Henderson Advisory, both of whom bring considerable experience and background to the board. At the close of the year, Charles Murphy resigned his position on our board after serving for three years, during which time he made significant contributions to the progress of our company.
Our Industry’s ValueOur industry has served a valuable social purpose for more than 250 years by providing financial security to policyholders in their time of need. At CNO, we are mindful of that purpose and proud of the efforts we make in providing millions of Americans, their families and loved ones with financial security and peace of mind.
While our target market is rapidly growing, with an estimated 10,000 Baby Boomers turning 65 every day, it remains underserved, with more than half of middle-income Boomers indicating they have never been contacted by an agent/retirement professional, and more than half saying they are not confident they are financially prepared for the future. The products and service we provide are designed to fill those gaps and meet their most pressing financial needs, and we accomplish that by earning their trust through delivering on our commitment to helping them achieve their goals.
Looking ForwardAgain, the past year was marked by significant achievements for our company, and we are confident in the strategic initiatives we have in place for delivering
long-term value for CNO. We have a compelling value proposition that is delivering results and gaining wider recognition, as reflected in our growing financial strength, market performance and rating agency upgrades.
We believe our businesses, with their distinct, largely exclusive distribution models, are well positioned to continue delivering profitable growth. To further improve our value proposition, we expect to invest $80 to $85 million in strategic business initiatives over the next three years. In addition, we are researching strategies to accelerate our growth while exploring options to reduce the impact of our closed blocks of business. All of our initiatives as well as our efforts to improve operational efficiencies are designed to enhance shareholder value.
We pride ourselves on our marketplace knowledge and our ability to meet our customers’ needs in achieving their financial security goals — the cornerstone of our company mission. We intend to keep delivering on our promises, and to enhance the customer experience at CNO.
Our confidence in the future and the accomplishments of 2012 are direct results of the dedication that all of our associates bring to CNO, which, along with the dedication of our leadership and our board of directors, forms the backbone of our success.
Thank you for your ownership, support and confidence in CNO!
Edward J. Bonach Chief Executive Officer
“ The past year was marked by significant achievements for our company, and we are confident in the strategic initiatives we have in place for delivering long-term value for CNO.”
249224_Labrador_Narr_R2.indd 5 3/18/13 6:47 PM

6
Bankers Life and Casualty Company — based in Chicago — was
established in 1879 and is a leading provider of health and life
insurance products and annuities to retirees. In 2012, the company
paid $1.3 billion in policy benefits.
“ Knowing that Bankers is behind my family is a great relief.”
— Donna Setzer, Daughter of Bankers Life Policyholder
Pictured with Jeanne Corey, Bankers Life Policyholder (left), and Francis Beiter, Bankers Life Agent (right).
249224_Labrador_Narr.indd 6 3/15/13 6:44 PM

7
CNO Financial Group 2012 Annual Report
When Donna Setzer of Herndon, VA, became the primary caregiver for her parents, Jeanne and John Corey, she readily accepted the role, glad to have the opportunity to give back to her parents, but concerned about the unknowns that accompany aging. When they were invited to attend a seminar given by Bankers Life agent Francis Beiter back in 2005 about long-term care, they didn’t hesitate.
“My father was an insurance agent for 36 years, and he understood the value of having the right coverage,” Donna said. “I had a good feeling about Francis and his help was very welcome.”
After the meeting, the Coreys evaluated their needs and wishes for future care, and purchased a home health care policy for both Jeanne and John. Home health care insurance allows the patient the ability to remain in his or her home for care, instead of receiving it in a hospital or nursing home.
“It can be a tremendous advantage for a patient to be cared for at home,” said Francis, a 15-year Bankers veteran and now a Unit Supervisor in their Chantilly, VA branch office. “They can maintain a greater sense of privacy and dignity, and they have more control about their personal choices regarding meals, schedules and other activities of daily living.”
“When we purchased the policy, my parents were both vibrant and active, so the policy brought us a great deal of peace of mind should we ever need to use it,” Donna said.
As it turns out, the Coreys needed the policy sooner than they thought, when John was diagnosed with brain cancer in 2007. The
Bankers policy allowed him to remain in his own home to receive the care he needed until he passed away in June of 2008.
“We were able to keep my dad at home in familiar surroundings, in hospice care with a 24/7 caregiver, until he left us peacefully,” she said.
“Not having to be in a hospital or nursing home at that time meant the world to all of us.”
Soon after they lost John, Jeanne was diagnosed with Progressive Supranuclear Palsy (PSP), a movement disorder that occurs from damage to certain nerve cells in the brain. The policy has allowed Jeanne to have a round-the-clock live-in caregiver to assist her with the activities of daily living she can no longer manage on her own due to PSP.
“It gives me great peace of mind to know all my mom’s needs are being met — that her medications are administered correctly, she’s eating food that she enjoys, and she’s able to be in a familiar, caring environment,” said Donna. “And Francis has helped us a lot, I can call him any time I have a question and he’s very responsive and approachable. That really helps to make it easier for all of us.”
Francis’ approach to his job of serving his customers can be summed up in one word.
“Trust,” he said. “My customers are dealing with life issues that are stressful, and if I can build their trust and help them with the right solutions, then I’m doing my job. Bankers has a great portfolio of products that not only meets the needs of our customers, but provides what’s most important — peace of mind.”
Secure
249224_Labrador_Narr.indd 7 3/15/13 6:44 PM

8
Colonial Penn Life Insurance Company — based in Philadelphia —
specializes in offering insurance directly to consumers at affordable
prices. Colonial Penn’s commitment to policyholders is evidenced
in the more than $112 million in life insurance claim benefits paid
in 2012.
“ It was very hard on my family when my mother passed, but Colonial Penn made handling the claim very easy, and it was truly a relief at a very tough time.”— Vanessa Garvin,
Colonial Penn Beneficiary
249224_Labrador_Narr_R2.indd 8 3/18/13 6:47 PM

9
CNO Financial Group 2012 Annual Report
STrONG
Vanessa Garvin spent 15 years in the Army
Reserve before she came back to Philadelphia
to be near her family. It was during that time
that a close friend of hers had a family member
pass away.
“They didn’t have any life insurance coverage,
and I remember they had to ask their friends
and family for donations to have a proper
funeral and burial,” Vanessa recalled. “I thought
to myself, I need to think of my mom, when she
goes, and I don’t ever want to be in the position
of having to ask people for help. Then I saw a
Colonial Penn commercial on television.”
Thinking that the commercial made the coverage
look easy to apply for and affordable, she
called the toll-free number and talked with a
representative about an appropriate policy to
meet her mother’s needs. The representative
took all the relevant information on the phone
and answered Vanessa’s questions.
“The rep I talked to was very informative,
and she made the process very easy for
me, including setting up convenient billing
options,” she said. “I was surprised. Honestly,
I didn’t think it would be that easy to get life
insurance for my mom, but it was.”
After Vanessa applied for her mother’s coverage
on the phone, she received the policy in the mail,
along with the application to sign and return.
She put the policy away in a drawer and was
relieved to have one less worry. Several years
later, Vanessa’s mother became ill, and she
passed away in December of 2011.
“That was such an emotional time,” Vanessa said.
“You can’t even think straight, with all the details.
But knowing we had the Colonial Penn policy
for my mom made it a whole lot easier. They
handled everything directly with the funeral
home, and everything went very smoothly. It
gave my family great peace of mind.”
249224_Labrador_Narr.indd 9 3/15/13 6:44 PM

10
Washington National Insurance Company — based in Carmel,
Indiana — is focused on serving the supplemental health and life
insurance needs of middle-income Americans at the worksite and
at home. Washington National’s commitment to policyholders is
evidenced in the $391 million in policy benefits paid out in 2012,
and the more than $1.6 billion in returned premium since 1995.
“ I have the most confidence in Washington National because I know that y’all will be there when I need you, no matter what.”
— Gail Smith, Washington National Policyholder, Hudson, North Carolina
Pictured with Art McPeak, Washington National Agent.
249224_Labrador_Narr.indd 10 3/15/13 6:44 PM

11
CNO Financial Group 2012 Annual Report
OpTimiSTic
As small business owners, Gail Smith and her husband Donald know that sometimes things can change overnight. Should something happen to either one of them — a serious accident or illness — their business would be in jeopardy.
“We met our agent, Art, about 25 years ago,” said Gail. “My husband wasn’t interested in insurance, but I talked him into it, because you never know what’s going to happen. I think I took out just about every policy I could.”
Gail and Donald first purchased an accident disability policy, then took out cancer coverage, and followed that with a critical illness policy.
“My granddaddy and grandma had insurance, and I know from experience that it pays, in more ways than one,” she said. “As it turns out, I was right.”
After her policies were in force several years, Gail suffered a stroke in May 2008 and went through a lengthy recovery period.
“That was a very tough time,” Gail recalled. “There were so many procedures being done, time in the hospital, and additional help I needed, it was very confusing to sort through. But Art helped me through all of it. He answered my
questions, helped me submit the claim forms, and showed that Washington National really cared. That kind of service is rare these days.”
In May of 2010, just when it seemed that Gail had recovered from her stroke, came some unbelievable news — she was diagnosed with colon cancer.
“My doctor suggested surgery, which I had,” Gail said. “I was worried, but in a way, relieved, because if I didn’t have my agent and this insurance, there’s no way we would have been able to keep our business and our home. The medication alone is the cost of my Social Security check. The insurance allowed me to pay all my bills and continue to live a half-normal life, and knowing those payments were being made took a lot of worry and stress away from me.”
Art McPeak, Washington National agent, gives a lot of credit to Gail. “One thing hit her after another, but Gail’s a very strong person, she’s a fighter. There’s no way to describe the feeling when you have a policyholder that needs help and you’re able to help them. It was good to know that we always came through for her during the most critical times in her life. Gail needed to worry about getting better, not getting by. That’s what we’re here for.”
249224_Labrador_Narr.indd 11 3/15/13 6:44 PM

12
Team CNO’s employee volunteers live the
company’s core values of Integrity, Customer-
Focus, Excellence and Teamwork every day.
As a company, we provide financial support
for a number of causes that contribute to the
well-being of our communities. As individuals,
we invest our time and talents in the same
causes. Employees from our major offices in
Carmel (IN), Chicago and Philadelphia, and in
the nationwide sales offices of our Bankers Life
and Casualty Company subsidiary, came out in
droves to donate nearly 7,000 hours of volunteer
service to their communities in 2012, helping
nearly 100 different nonprofit agencies.
Since 2003, CNO Carmel volunteers have contributed in almost every area of the American Red Cross, from providing first aid and disaster relief, to public education and disaster planning, to staffing the community food pantry and accounting offices, to providing children with books from the Red Cross bookmobile. In all, CNO employees have donated more than 20,000 hours of volunteer service to the Red Cross, with nearly 1,000 hours in 2012 alone. CNO is also the presenting sponsor for the Red Cross Hall of Fame, an event that pays tribute to individuals from the central Indiana community who exemplify the spirit and values of the worldwide Red Cross movement. The 2012 event was held in March in downtown Indianapolis and attended by the honorees, their families and friends, emergency responders, community leaders and Red Cross representatives.
CNo IN the CommuNIty
249224_Labrador_Narr.indd 12 3/15/13 6:44 PM

13
CNO Financial Group 2012 Annual Report
CNO Financial Group sponsored the Arthritis Foundation’s Bone Bash event, a costume party in October. This event has a silent auction and other fundraising events to help the Arthritis Foundation raise money for research efforts. In addition, nearly 90 Team CNO associates, friends and family members bundled up in December for the 24th annual Jingle Bell Run/Walk to help fund the search for a cure for over 46 million Americans suffering from arthritis. CNO sponsored the event, entered a team and raised $5,000 in support of the Arthritis Foundation’s mission to prevent, control and cure arthritis and related diseases. For the second consecutive year, a CNO associate served as the chair of the entire Indianapolis event.
More than 1,000 agents and associates in 150 cities throughout the country came out to support Bankers Life and Casualty Company’s 10th annual Forget Me Not Days fundraiser. In this event, agents and associates go into their local communities to collect donations for their local chapters of the Alzheimer’s Association and raise awareness for the cause. In addition, Bankers Life and Casualty Company hosted a Forget Me Not Days Night in April at Bankers Life Fieldhouse in Indianapolis. The first 15,000 fans who entered the Fieldhouse for the Indiana Pacers vs. Philadelphia 76ers game received a packet of Forget-Me-Not seeds and information on the annual fundraising event. In 2012, total donations and a Bankers Life and Casualty Company corporate contribution brought in more than $420,000 for the Alzheimer’s Association.
CNO has supported central Indiana’s Adopt-a-Family program for 13 consecutive years. In 2012, hundreds of Carmel CNO employees pitched in to provide holiday cheer to 40 families, bringing the total number of families this CNO program has assisted over the years to over 400. Partnering with the United Christmas Service (a United Way agency) to identify local families in need, CNO provides up to $1,000 of funding per family. Teams of employee volunteers shop for holiday gifts, wrap and deliver them to their adopted families —along with boxes of groceries and household items. In 2012, the Indiana Pacers donated additional toys for CNO’s teams to give their adopted families. Philadelphia associates participated in three separate holiday charity drives in 2012. Associates donated toys to the Eliza Shirley House, a recovery home for women with children. They also supported Turning Points for Children and the Harrington Elementary School with clothes and toys. And finally, these associates donated toys to the Marine Corps Toys for Tots program. CNO associates in Chicago hosted an Adopt-a-Senior drive for the Temple Corps Salvation Army of Chicago. About 130 associates participated, and over $1,000 was spent to provide 100 sets of hats, gloves and scarves for the seniors and their family members living in the facility.
In June, Team CNO held its first Meal Marathon event with Kids Against Hunger (KAH). KAH feeds the world’s hungry in a unique and efficient way, using volunteers to assemble meals designed by nutritionists. At the event, about 300 Team CNO volunteers worked on assembly lines and added food to bags, while other volunteers helped lift the heavy bags of supplies to refill bins. An astonishing 52,711 meals were packed in one morning, surpassing the goal of 52,000. The meals went to Gleaners Food Bank in Indianapolis, and excess went to feed the hungry of Africa.
249224_Labrador_Narr.indd 13 3/15/13 6:44 PM

14
Every weekday, Meals on Wheels Chicago, in partnership with the Chicago Department of Family and Support Service’s Area Agency on Aging, delivers meals to 11,000 homebound seniors in Chicago. In some cases, it’s their only opportunity for healthy, nutritious meals on a regular basis. Each December, a team of Bankers Life and Casualty Company associates volunteers at a local senior living community by serving a holiday meal, playing games and visiting with the residents. In addition, since 2004, Bankers has contributed more than $250,000 to Meals on Wheels Chicago to help support programs such as Home Delivered Meals, Holiday Meals and Home Modification, which involves adapting a recipient’s home to his or her unique needs.
Once again in 2012, CNO’s United Way pledge campaign exceeded its goal, with more than $400,000 pledged by employees. Including the company match, the pledge campaign generated nearly $570,000 for the United Way. In conjunction with the pledge campaign, associates raised an additional $4,400 for United Way through a special silent auction.
As part of the 2012 United Way Day of Caring, a group of more than two dozen associates and family members donated a Saturday to help the Julian Center in downtown Indianapolis. The Julian Center is a facility that helps women and children who are trying to make a new life after leaving a situation involving domestic violence. Volunteers painted two rooms, pulled weeds and cleaned up an outdoor courtyard, and cleaned windows and the kitchen in the facility.
CNO Community Spirit AwardsIn March 2012, CNO made its annual CNO Community Spirit Award grants to seven community nonprofit organizations. The awards honored associates who made an extraordinary social impact in their communities, demonstrated strategic involvement and dedication to getting results, and maintained a compelling and enduring commitment to the agencies where they volunteered. The winners were selected by a panel of nine associates representing all of the company’s major locations and departments. Through CNO’s partnership with the nationally acclaimed Jefferson Awards for Public Service, each Community Spirit winner also received a Jefferson Award.
Award of Excellence ($10,000 grant from CNO to the nonprofit organization, plus a trip for the winner to Washington, D.C., to represent CNO at the national Jefferson Awards Ceremony):
Adam Rhoades Tatum’s Bags of Fun
Award of High Achievement ($5,000 grant):
Lester Trotter Susan G. Komen for the Cure– Central Indiana Affiliate
Awards of Merit ($1,000 grant):
John Reid American Red Cross of Greater Indianapolis
Julia Skaggs Tire Rack Street Survival
Terri Scott Southside Animal Shelter
David Sadler Friends of Indianapolis Animal Care & Control
Christy Wilson Cicero Friends of the Park
Team CNO celebrated the service of these associates at an awards luncheon. The winning associates, their supervisors and their non-profit partners were present.
249224_Labrador_Narr.indd 14 3/15/13 6:44 PM

UNITED STATES
SECURITIES AND EXCHANGE COMMISSION
WASHINGTON, D.C. 20549
FORM 10-K ANNUAL REPORT PURSUANT TO SECTION 13 OR 15(D) OF THE SECURITIES EXCHANGE ACT OF 1934
For the fi scal year ended December 31, 2012 TRANSITION REPORT PURSUANT TO SECTION 13 OR 15(D) OF THE SECURITIES EXCHANGE ACT OF 1934
For the transition period from ______ to ______
CNO FINANCIAL GROUP, INC.Commission File Number 001-31792
DELAWARE 75-3108137State of Incorporation IRS Employer Identifi cation No.
11825 N. Pennsylvania Street, Carmel, Indiana 46032 (317) 817-6100Address of principal executive offi ces Telephone
SECURITIES REGISTERED PURSUANT TO SECTION 12(B) OF THE ACT:Title of each class Name of Each Exchange on which Registered
Common Stock, par value $0.01 per share
Rights to purchase Series B Junior Participating Preferred Stock
New York Stock Exchange
New York Stock Exchange
SECURITIES REGISTERED PURSUANT TO SECTION 12(G) OF THE ACT:NONE
Indicate by check mark YES NO
• if the registrant is a well-known seasoned issuer, as defi ned in Rule 405 of the Securities Act.
• if the registrant is not required to fi le reports pursuant to Section 13 or 15(d) of the Act. • whether the Registrant (1) has fi led all reports required to be fi led by Section 13 or 15(d) of the Securities Exchange Act of 1934 during the preceding 12 months (or for such shorter period that the registrant was required to fi le such reports) and (2) has been subject to such fi ling requirements for the past 90 days: • whether the registrant has submitted electronically and posted on its corporate Website, if any, every Interactive Data File required to be submitted and posted pursuant to Rule 405 of Regulation S-T (§232.405 of this chapter) during the preceding 12 months (or for such shorter period that the registrant was required to submit and post such fi les). • if disclosure of delinquent fi lers pursuant to Item 405 of Regulation S-K is not contained herein, and will not be contained, to the best of Registrant’s knowledge, in defi nitive proxy or information statements incorporated by reference in Part III of this Form 10-K or any amendment to this Form 10-K. • whether the Registrant is a large accelerated fi ler, an accelerated fi ler, a non-accelerated fi ler or a smaller reporting company. See the defi nitions of “large accelerated fi ler,” “accelerated fi ler” and “smaller reporting company” in Rule 12b-2 of the Exchange Act.
Large accelerated fi ler Accelerated fi ler Non-accelerated fi ler Smaller reporting company
• whether the registrant is a shell company (as defi ned in Rule 12b-2 of the Exchange Act):
At June 30, 2012, the last business day of the R egistrant’ s most recently completed second fi scal quarter, the aggregate market value of the Registrant’ s common equity held by nonaffi liates was approximately $1.8 billion .
Shares of common stock outstanding as of February 7, 2013: 221,517,871
DOCUMENTS INCORPORATED BY REFERENCE:
Portions of the Registrant’ s defi nitive proxy statement for the 2013 annual meeting of shareholders are incorporated by reference into Part III of this report .

Table of Contents
PART I 17
ITEM 1 Business of CNO ................................................................................................................................................................................................................................................................................................17ITEM 1A Risk Factors ....................................................................................................................................................................................................................................................................................................................32ITEM 1B Unresolved Staff Comments .........................................................................................................................................................................................................................................................47ITEM 2 Properties ............................................................................................................................................................................................................................................................................................................................47ITEM 3 Legal Proceedings ...............................................................................................................................................................................................................................................................................................47ITEM 4 Mine Safety Disclosures ........................................................................................................................................................................................................................................................................48
Executive Offi cers of the Registrant .........................................................................................................................................................................................................................................48
PART II 49
ITEM 5 Market for Registrant’s Common Equity, Related Stockholder Matters and Issuer Purchases of Equity Securities .........................................................................................................................................................................................................................................................................................49
ITEM 6 Selected Consolidated Financial Data .......................................................................................................................................................................................................................51ITEM 7 Management’s Discussion and Analysis of Consolidated Financial Condition and
Results of Operations .................................................................................................................................................................................................................................................................................52ITEM 7A Quantitative and Qualitative Disclosures About Market Risk ............................................................................................................................104ITEM 8 Consolidated Financial Statements .............................................................................................................................................................................................................................105ITEM 9 Changes in and Disagreements with Accountants on Accounting and Financial Disclosure ................166ITEM 9A Controls and Procedures ..................................................................................................................................................................................................................................................................166ITEM 9B Other Information .......................................................................................................................................................................................................................................................................................167
PART III 168
ITEM 10 Directors, Executive Offi cers and Corporate Governance ............................................................................................................................................168ITEM 11 Executive Compensation .................................................................................................................................................................................................................................................................168ITEM 12 Security Ownership of Certain Benefi cial Owners and Management and
Related Stockholder Matters ....................................................................................................................................................................................................................................................168ITEM 13 Certain Relationships and Related Transactions, and Director Independence ....................................................................168ITEM 14 Principal Accountant Fees and Services .............................................................................................................................................................................................................168
PART IV 169
ITEM 15 Exhibits and Financial Statement Schedules ............................................................................................................................................................................................169SIGNATURE .........................................................................................................................................................................................................................................................................................................................................................170

CNO FINANCIAL GROUP, INC. - Form 10-K 17
PART I ITEM 1 Business of CNO
PART I
ITEM 1 Business of CNOCNO Financial Group, Inc., a Delaware corporation (“CNO”), (formerly known as Conseco, Inc. prior to its name change in May 2010) is a holding company for a group of insurance companies operating throughout the United States that develop, market and administer health insurance, annuity, individual life insurance and other insurance products. CNO became the successor to Conseco, Inc., an Indiana corporation (our “Predecessor”), in connection with our bankruptcy reorganization which became eff ective on September 10, 2003 (the “Eff ective Date”). Th e terms “CNO Financial Group, Inc.”, “CNO”, the “Company”, “we”, “us”, and “our” as used in this report refer to CNO and its subsidiaries or, when the context requires otherwise, our Predecessor and its subsidiaries. Such terms, when used to describe insurance business and products, refer to the insurance business and products of CNO’s insurance subsidiaries.
We focus on serving the senior and middle-income markets, which we believe are attractive, underserved, high growth markets. We sell our products through three distribution channels: career agents, independent producers (some of whom sell one or more of our product lines exclusively) and direct marketing. As of December 31, 2012, we had shareholders’ equity of $5.0 billion and assets of $34.1 billion. For the year ended December 31, 2012, we had revenues of $4.3 billion and net income of $221.0 million. See our consolidated fi nancial statements and accompanying footnotes for additional fi nancial information about the Company and its segments.
Th e Company manages its business through the following operating segments: Bankers Life, Washington National and Colonial Penn, which are defi ned on the basis of product distribution; Other CNO Business, comprised primarily of products we no longer sell actively; and corporate operations, comprised of holding company activities and certain noninsurance company businesses. Our segments are described below.
• Bankers Life, which markets and distributes Medicare supplement insurance, interest-sensitive life insurance, traditional life insurance, fi xed annuities and long-term care insurance products to the middle-income senior market through a dedicated fi eld force of career agents and sales managers supported by a network of community-based sales offi ces. Th e Bankers Life segment includes primarily the business of Bankers Life and Casualty Company (“Bankers Life”). Bankers Life also markets and distributes Medicare Advantage plans primarily through distribution arrangements with Humana, Inc. (“Humana”) and United HealthCare and Medicare Part D prescription drug plans (“PDP”) through a distribution and reinsurance arrangement with Coventry Health Care (“Coventry”). • Washington National, which markets and distributes supplemental health (including specifi ed disease, accident and hospital indemnity insurance products) and life insurance to middle-income consumers at home and at the worksite. Th ese products are marketed through Performance Matters Associates of Texas, Inc. (“PMA”), a wholly owned subsidiary, and through independent marketing organizations and insurance agencies, including worksite marketing. Th e products being marketed are underwritten by Washington National Insurance Company (“Washington National”). • Colonial Penn, which markets primarily graded benefi t and simplifi ed issue life insurance directly to customers in the senior middle-income market through television advertising, direct mail, the internet and telemarketing. Th e Colonial Penn segment includes primarily the business of Colonial Penn Life Insurance Company (“Colonial Penn”). • Other CNO Business, which consists of blocks of interest-sensitive life insurance, traditional life insurance, annuities, long-term care insurance and other supplemental health products. Th ese blocks of business are not actively marketed and were primarily issued or acquired by Conseco Life Insurance Company (“Conseco Life”) and Washington National.
Our Strategic Direction
Our mission is to enrich lives by providing fi nancial security to middle-income American working families and retirees. We strive to be a recognized market leader in providing for our customers’ protection and retirement needs through life insurance, supplemental health products and annuities, while providing value to our shareholders and other stakeholders. We believe that our focus on middle-income families and retirees positions us favorably to capitalize on the future growth in these markets. We believe we can accomplish this mission through the eff ective execution of the following strategies:
Remain Focused on the Needs of Our Target Market with the Alignment of Distribution to Reach the Market, Products to Serve it, and Home Offi ce in Support
We defi ne our business by our target market, which is underserved and fast growing. We reach our customers through our career agents and exclusive independent agent relationships, and directly through our Colonial Penn direct distribution platform. We provide a broad range of middle-market products to meet the protection needs of our customers and to provide them with solutions for their fi nancial needs.

CNO FINANCIAL GROUP, INC. - Form 10-K 18
PART I ITEM 1 Business of CNO
Expand and Improve the Reach and Effi ciency of our Distribution Channels
Th e continued development and productivity of our distribution channels is critical to our continued sales growth. We dedicate substantial resources to new sales locations, the recruitment, development and retention of our Bankers Life career agents and seek to maximize their productivity by providing them with high quality leads technology and other sales support for new business opportunities. In addition, investments in both our direct distribution platform, Colonial Penn, and in our wholly owned distributor, PMA, have enabled us to achieve signifi cant sales growth.
Seek Profi table Growth
We continue to pursue profi table growth opportunities in the middle income market. We focus on marketing and selling products that meet the needs of our customers, while providing long-term value for our shareholders.
Pursue Operational Effi ciencies and Cost Reduction Opportunities
We seek to strengthen our competitive position and improve customer service with a focus on enhanced operational effi ciency and elimination of unnecessary costs and expenses. Our eff orts include:
• improvements to our policy administration processes and procedures; • continued consolidation of policy processing systems, including conversions and elimination of systems;
• streamlining administrative procedures and consolidating processes across the enterprise; and • improving the profi tability of existing lines of business or disposing of underperforming blocks of business.
Continue to Manage and Where Possible reduce the Risk Profi le of Our Business
We actively manage the risks associated with our business. We emphasize products that are straightforward, meet our target market needs and have a lower risk profi le. We will continue to manage the investment risks associated with our insurance business by maintaining a largely investment-grade, diversifi ed fi xed-income portfolio, maximizing the spread between the investment income we earn and the yields we pay on products within acceptable levels of risk, regularly tailoring our investment portfolio to consider liability durations, cash fl ows and other requirements.
Eff ectively deploy excess capital
Managing excess capital at the holding company, while maintaining appropriate capital at the insurance subsidiaries, are priorities for us. Our earnings power and cash generation, provide us with several opportunities to eff ectively deploy excess capital. Deploying excess capital to increase growth is one of our top priorities. In addition, eff ectively deploying excess capital in areas such as securities repurchases, shareholder dividends and debt prepayment are other signifi cant opportunities to drive shareholder value, increase returns and improve ratings.
Other Information
Our Predecessor was organized in 1979 and commenced operations in 1982. Our executive offi ces are located at 11825 N. Pennsylvania Street, Carmel, Indiana 46032, and our telephone number is (317) 817-6100. Our annual reports on Form 10-K, quarterly reports on Form 10-Q, current reports on Form 8-K and amendments to those reports fi led or furnished pursuant to Section 13(a) or 15(d) of the Securities Exchange Act are available free of charge on our website at www.CNOinc.com as soon as reasonably practicable after they are electronically fi led with, or furnished to, the Securities and Exchange Commission (the “SEC”). Th ese fi lings are also available on the SEC’s website at www.sec.gov. In addition, the public may read and copy any document we fi le at the SEC’s Public Reference Room located at 100 F Street, NE, Room 1580, Washington, D.C. 20549. Th e public may obtain information on the operation of the Public Reference Room by calling the SEC at 1-800-SEC-0330. Copies of these fi lings are also available, without charge, from CNO Investor Relations, 11825 N. Pennsylvania Street, Carmel, IN 46032.
Our website also includes the charters of our Audit and Enterprise Risk Committee, Executive Committee, Governance and Nominating Committee, Human Resources and Compensation Committee and
Investment Committee, as well as our Corporate Governance Operating Principles and our Code of Business Conduct and Ethics that applies to all offi cers, directors and employees. Copies of these documents are available free of charge on our website at www.CNOinc.com or from CNO Investor Relations at the address shown above. Within the time period specifi ed by the SEC and the New York Stock Exchange, we will post on our website any amendment to our Code of Business Conduct and Ethics and any waiver applicable to our principal executive offi cer, principal fi nancial offi cer or principal accounting offi cer.
In May 2012, we fi led with the New York Stock Exchange the Annual CEO Certifi cation regarding the Company’s compliance with their Corporate Governance listing standards as required by Section 303A.12(a) of the New York Stock Exchange Listed Company Manual. In addition, we have fi led as exhibits to this 2012 Form 10-K the applicable certifi cations of the Company’s Chief Executive Offi cer and Chief Financial Offi cer required under Section 302 of the Sarbanes-Oxley Act of 2002 regarding the Company’s public disclosures.
Data in Item 1 are provided as of or for the year ended December 31, 2012 (as the context implies), unless otherwise indicated.

CNO FINANCIAL GROUP, INC. - Form 10-K 19
PART I ITEM 1 Business of CNO
Marketing and Distribution
Insurance
Our insurance subsidiaries develop, market and administer health insurance, annuity, individual life insurance and other insurance products. We sell these products through three primary distribution channels: career agents, independent producers (some of whom sell one or more of our product lines exclusively) and direct marketing. We had premium collections of $3.3 billion, $3.6 billion and $3.6 billion in 2012, 2011 and 2010, respectively.
Our insurance subsidiaries collectively hold licenses to market our insurance products in all fi fty states, the District of Columbia, and certain protectorates of the United States. Sales to residents of the following states accounted for at least fi ve percent of our 2012 collected premiums: Florida (7.7 percent), California (6.5 percent), Texas (6.4 percent) and Pennsylvania (6.2 percent).
We believe that most purchases of life insurance, accident and health insurance and annuity products occur only after individuals are contacted and solicited by an insurance agent. Accordingly, the success of our distribution system is largely dependent on our ability to attract and retain experienced and highly motivated agents. A description of our primary distribution channels is as follows:
Career Agents
Th e products of the Bankers Life segment are sold through a career agency force of over 5,750 agents and sales managers working from 275 Bankers Life branch offi ces and satellites. Th ese agents establish one-on-one contact with potential policyholders and promote strong personal relationships with existing policyholders. Th e career agents sell primarily Medicare supplement and long-term care insurance policies, life insurance and annuities. In 2012, this distribution channel accounted for $2.3 billion, or 70 percent, of our total collected premiums. Th ese agents sell Bankers Life policies, as well as Medicare Advantage plans primarily through distribution arrangements with Humana and United HealthCare and Medicare Part D prescription drug plans through a distribution and reinsurance arrangement with Coventry, and typically visit the prospective policyholder’s home to conduct personalized “kitchen-table” sales presentations. After the sale of an insurance policy, the agent serves as a contact person for policyholder questions, claims assistance and additional insurance needs.
Independent Producers
Th e products of the Washington National segment are sold through a diverse network of independent agents, insurance brokers and marketing organizations. Th e general agency and insurance brokerage distribution system is comprised of independent licensed agents doing business in all fi fty states, the District of Columbia, and certain protectorates of the United States. In 2012, this distribution channel collected $785.1 million, or 23 percent, of our total premiums.
Marketing organizations typically recruit agents by advertising our products and commission structure through direct mail advertising or through seminars for agents and brokers. Th ese organizations bear most of the costs incurred in marketing our products. We compensate the marketing organizations by paying them a percentage of the commissions earned on new sales generated by agents recruited by such organizations. Certain of these marketing organizations are specialty organizations that have a marketing expertise or a distribution system related to a particular product or market, such as worksite and individual health products. During 1999 and 2000, we purchased three organizations that specialize in marketing and distributing health products and combined them under the name PMA.
Direct Marketing
Th is distribution channel is engaged primarily in the sale of graded benefi t life insurance policies through Colonial Penn. In 2012, this channel accounted for $216.8 million, or 7 percent, of our total collected premiums.

CNO FINANCIAL GROUP, INC. - Form 10-K 20
PART I ITEM 1 Business of CNO
Products
Th e following table summarizes premium collections by major category and segment for the years ended December 31, 2012, 2011 and 2010 (dollars in millions):
TOTAL PREMIUM COLLECTIONS
2012 2011 2010Health:
Bankers Life $ 1,323.9 $ 1,330.6 $ 1,360.1Washington National 576.3 569.8 564.9Colonial Penn 4.9 5.7 6.4Other CNO Business 25.8 27.8 31.7
Total health 1,930.9 1,933.9 1,963.1Annuities:
Bankers Life 709.0 985.5 1,005.5Other CNO Business 3.8 16.4 16.4
Total annuities 712.8 1,001.9 1,021.9Life:
Bankers Life 314.6 250.0 209.6Washington National 14.2 16.0 16.2Colonial Penn 211.9 196.4 187.7Other CNO Business 165.0 179.4 191.6
Total life 705.7 641.8 605.1TOTAL PREMIUM COLLECTIONS $ 3,349.4 $ 3,577.6 $ 3,590.1
Our insurance subsidiaries collected premiums from the following products:
Health
HEALTH PREMIUM COLLECTIONS DOLLARS IN MILLIONS
2012 2011 2010Medicare supplement:
Bankers Life $ 717.2 $ 701.2 $ 697.8Washington National 113.9 132.1 154.8Colonial Penn 4.5 5.2 6.0
Total 835.6 838.5 858.6Long-term care:
Bankers Life 546.5 561.9 584.6Other CNO Business 25.1 27.0 29.2
Total 571.6 588.9 613.8Prescription Drug Plan and Medicare Advantage products included in Bankers Life 47.8 56.5 66.4Health products included in Washington National 459.7 434.2 405.5Other:
Bankers Life 12.4 11.0 11.3Washington National 2.7 3.5 4.6Colonial Penn .4 .5 .4Other CNO Business .7 .8 2.5
Total 16.2 15.8 18.8TOTAL HEALTH PREMIUM COLLECTIONS $ 1,930.9 $ 1,933.9 $ 1,963.1
Th e following describes our major health products:
Medicare Supplement
Medicare supplement collected premiums were $835.6 million during 2012 or 25 percent of our total collected premiums. Medicare is a federal health insurance program for disabled persons and seniors (age 65 and older). Part A of the program provides protection against the costs of
hospitalization and related hospital and skilled nursing facility care, subject to an initial deductible, related coinsurance amounts and specifi ed maximum benefi t levels. Th e deductible and coinsurance amounts are subject to change each year by the federal government. Part B of Medicare covers doctor’s bills and a number of other medical costs not covered by Part A, subject to deductible and coinsurance amounts for charges approved by Medicare. Th e deductible amount is subject to change each year by the federal government.

CNO FINANCIAL GROUP, INC. - Form 10-K 21
PART I ITEM 1 Business of CNO
Medicare supplement policies provide coverage for many of the hospital and medical expenses which the Medicare program does not cover, such as deductibles, coinsurance costs (in which the insured and Medicare share the costs of medical expenses) and specifi ed losses which exceed the federal program’s maximum benefi ts. Our Medicare supplement plans automatically adjust coverage to refl ect changes in Medicare benefi ts. In marketing these products, we currently concentrate on individuals who have recently become eligible for Medicare by reaching the age of 65. Approximately 51 percent of new sales of Medicare supplement policies in 2012 were to individuals who had recently reached the age of 65.
Bankers Life sells Medicare supplement insurance. Washington National discontinued new sales of Medicare supplement policies in the fourth quarter of 2012.
Long-Term Care
Long-term care collected premiums were $571.6 million during 2012, or 17 percent of our total collected premiums. Long-term care products provide coverage, within prescribed limits, for nursing homes, home healthcare, or a combination of both. We sell the long-term care plans primarily to retirees and, to a lesser degree, to older self-employed individuals in the middle-income market.
Current nursing home care policies cover incurred charges up to a daily fi xed-dollar limit with an elimination period (which, similar to a deductible, requires the insured to pay for a certain number of days of nursing home care before the insurance coverage begins), subject to a maximum benefi t. Home healthcare policies cover incurred charges after a deductible or elimination period and are subject to a weekly or monthly maximum dollar amount, and an overall benefi t maximum. Comprehensive policies cover both nursing home care and home healthcare. We monitor the loss experience on our long-term care products and, when necessary, apply for rate increases in the jurisdictions in which we sell such products. Regulatory fi lings are made before we increase our premiums on these products.
A small portion of our long-term care business resides in the Other CNO Business segment. Th is business was sold through independent producers and was largely underwritten by certain of our subsidiaries prior to their acquisitions by our Predecessor in 1996 and 1997. Th e performance of these blocks of business did not meet the expectations we had when the blocks were acquired. As a result, we ceased selling new long-term care policies through independent distribution in 2003.
We continue to sell long-term care insurance through the Bankers Life career agent distribution channel. Th is business is underwritten using stricter underwriting and pricing standards than had previously been used on our acquired blocks of long-term care business included in the Other CNO Business segment.
Prescription Drug Plan and Medicare Advantage
Th e Medicare Prescription Drug, Improvement and Modernization Act of 2003 provided for the introduction of a prescription drug program under Medicare Part D. Persons eligible for Medicare can receive their Part D coverage through a stand-alone PDP. In order to off er a PDP product to our current and potential future policyholders without investment in management and infrastructure, we entered into a national distribution agreement with Coventry to use our career and independent agents to distribute Coventry’s PDP product, Advantra Rx.
We receive a fee based on the number of PDP plans sold through our distribution channels. In addition, CNO has a quota-share reinsurance agreement with Coventry for CNO enrollees that provides CNO with a specifi ed percentage of net premiums and related profi ts subject to a risk corridor. Th e Part D program was eff ective January 1, 2006. PDP collected premiums were $47.8 million during 2012 or 1 percent of our total collected premiums.
Bankers Life primarily partners with Humana and United HealthCare to off er Medicare Advantage plans to its policyholders and consumers nationwide through its career agency force and receives marketing fees based on sales.
Supplemental Health Products
Supplemental health collected premiums were $459.7 million during 2012, or 14 percent of our total collected premiums. Th ese policies generally provide fi xed or limited benefi ts. Cancer insurance and heart/stroke products are guaranteed renewable individual accident and health insurance policies. Payments under cancer insurance policies are generally made directly to, or at the direction of, the policyholder following diagnosis of, or treatment for, a covered type of cancer. Heart/stroke policies provide for payments directly to the policyholder for treatment of a covered heart disease, heart attack or stroke. Accident products combine insurance for accidental death with limited benefi t disability income insurance. Hospital indemnity products provide a fi xed dollar amount per day of confi nement in a hospital. Th e benefi ts provided under the supplemental health policies do not necessarily refl ect the actual cost incurred by the insured as a result of the illness, or accident, and benefi ts are not reduced by any other medical insurance payments made to or on behalf of the insured.
Approximately 74 percent of the total number of our supplemental health policies inforce was sold with return of premium or cash value riders. Th e return of premium rider generally provides that, after a policy has been inforce for a specifi ed number of years or upon the policyholder reaching a specifi ed age, we will pay to the policyholder, or in some cases, a benefi ciary under the policy, the aggregate amount of all premiums paid under the policy, without interest, less the aggregate amount of all claims incurred under the policy. For some policies, the return of premium rider does not have any claim off set. Th e cash value rider is similar to the return of premium rider, but also provides for payment of a graded portion of the return of premium benefi t if the policy terminates before the return of premium benefi t is earned.
Other Health Products
Collected premiums on other health products were $16.2 million during 2012. Th is category includes various other health products such as major medical health insurance, senior hospital indemnity and disability income products which are sold in small amounts and other products which are no longer actively marketed. During 2012, Bankers Life introduced a new critical illness insurance product that pays a lump sum cash benefi t of between $10,000 and $70,000 directly to the insured when the insured is diagnosed with a specifi ed critical illness. Th e product is designed to provide additional fi nancial protection associated with treatment and recovery as well as cover non-medical expenses such as: (i) loss of income; (ii) at home recovery or treatment; (iii) experimental and/or alternative medicine; (iv) co-pays, deductibles and out-of-network expenses; and (v) child care and transportation costs.

CNO FINANCIAL GROUP, INC. - Form 10-K 22
PART I ITEM 1 Business of CNO
Annuities
ANNUITY PREMIUM COLLECTIONS DOLLARS IN MILLIONS
2012 2011 2010Fixed index annuity:
Bankers Life $ 505.0 $ 708.4 $ 577.7Other CNO Business 2.9 13.4 14.9
Total fi xed index annuity premium collections 507.9 721.8 592.6Other fi xed rate annuity:
Bankers Life 204.0 277.1 427.8Other CNO Business .9 3.0 1.5
Total fi xed rate annuity premium collections 204.9 280.1 429.3TOTAL ANNUITY PREMIUM COLLECTIONS $ 712.8 $ 1,001.9 $ 1,021.9
During 2012, we collected annuity premiums of $712.8 million or 21 percent of our total premiums collected. Annuity products include fi xed index annuity, traditional fi xed rate annuity and single premium immediate annuity products sold through Bankers Life. Annuities off er a tax-deferred means of accumulating savings for retirement needs, and provide a tax-effi cient source of income in the payout period. Our major source of income from fi xed rate annuities is the spread between the investment income earned on the underlying general account assets and the interest credited to contractholders’ accounts. For fi xed index annuities, our major source of income is the spread between the investment income earned on the underlying general account assets and the cost of the index options purchased to provide index-based credits to the contractholders’ accounts.
Th e change in mix of premium collections between Bankers Life’s fi xed index products and fi xed annuity products has fl uctuated due to volatility in the fi nancial markets in recent periods. In addition, premium collections from Bankers Life’s fi xed annuity products decreased in 2012 as low market interest rates negatively impacted the attractiveness to the consumer of these products.
Th e following describes the major annuity products:
Fixed Index Annuities
Th ese products accounted for $507.9 million, or 15 percent, of our total premium collections during 2012. Th e account value (or “accumulation value”) of these annuities is credited in an amount that is based on changes in a particular index during a specifi ed period of time. Within each contract issued, each fi xed index annuity specifi es:
• Th e index to be used. • Th e time period during which the change in the index is measured. At the end of the time period, the change in the index is applied to the account value. Th e time period of the contract ranges from 1 to 4 years. • Th e method used to measure the change in the index. • Th e measured change in the index is multiplied by a “participation rate” (percentage of change in the index) before the credit is applied. Some policies guarantee the initial participation rate for the life of the contract, and some vary the rate for each period. • Th e measured change in the index may also be limited by a “cap” before the credit is applied. Some policies guarantee the initial cap for the life of the contract, and some vary the cap for each period.
• Th e measured change in the index may also be limited to the excess in the measured change over a “margin” before the credit is applied. Some policies guarantee the initial margin for the life of the contract, and some vary the margin for each period.
Th ese products have guaranteed minimum cash surrender values, regardless of actual index performance and the resulting indexed-based interest credits applied.
We have generally been successful at hedging increases to policyholder benefi ts resulting from increases in the indices to which the product’s return is linked.
Other Fixed Rate Annuities
Th ese products include fi xed rate single-premium deferred annuities (“SPDAs”), fl exible premium deferred annuities (“FPDAs”) and single-premium immediate annuities (“SPIAs”). Th ese products accounted for $204.9 million, or 6 percent, of our total premium collections during 2012, of which SPDAs and FPDAs comprised $189.0 million. Our fi xed rate SPDAs and FPDAs typically have an interest rate (the “crediting rate”) that is guaranteed by the Company for the fi rst policy year, after which we have the discretionary ability to change the crediting rate to any rate not below a guaranteed minimum rate. Th e guaranteed rates on annuities written recently range from 1.0 percent to 1.7 percent, and the rates on all policies inforce range from 1.0 percent to 5.5 percent. Th e initial crediting rate is largely a function of:
• the interest rate we can earn on invested assets acquired with the new annuity fund deposits; • the costs related to marketing and maintaining the annuity products; and • the rates off ered on similar products by our competitors.
For subsequent adjustments to crediting rates, we take into account current and prospective yields on investments, annuity surrender assumptions, competitive industry pricing and the crediting rate history for particular groups of annuity policies with similar characteristics.
In 2012, a signifi cant portion of our new annuity sales were “bonus interest” products. Th e initial crediting rate on these products generally specifi es a bonus crediting rate of up to .5 percent of the annuity deposit for the fi rst policy year only. After the fi rst year, the bonus interest portion of the initial crediting rate is automatically discontinued, and the renewal crediting rate is established. As of December 31, 2012, the average crediting rate, excluding bonuses, on our outstanding traditional annuities was 3.2 percent.
CNO FINANCIAL GROUP, INC. - Form 10-K 23
PART I ITEM 1 Business of CNO
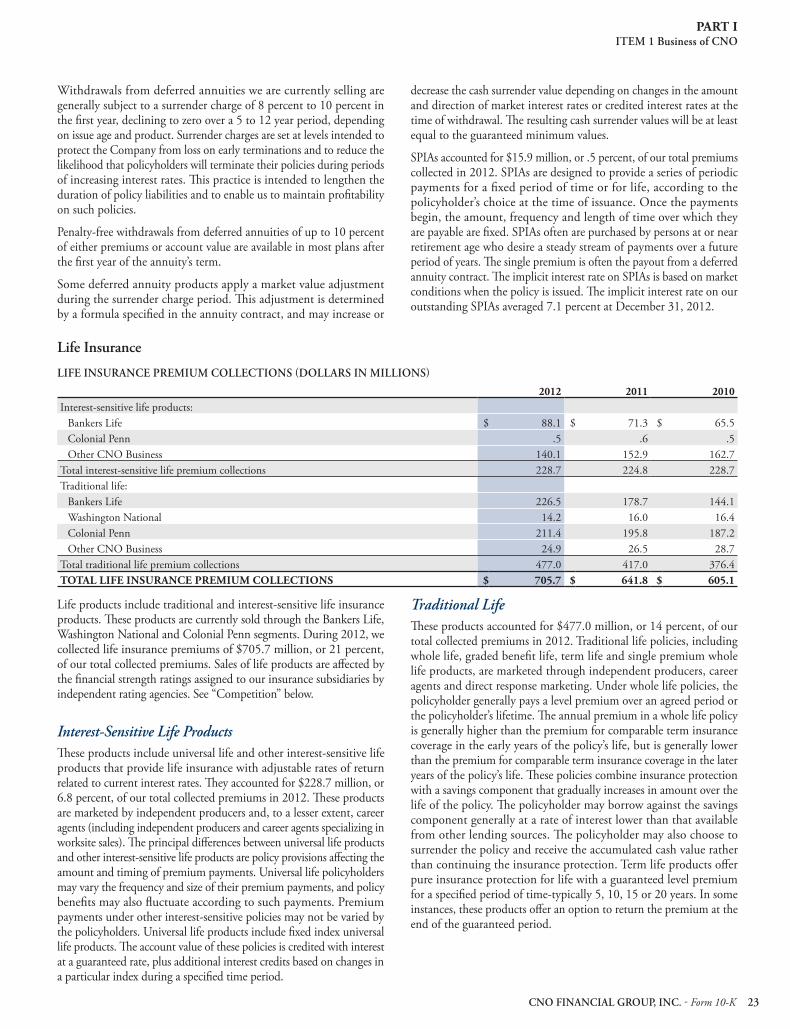
Withdrawals from deferred annuities we are currently selling are generally subject to a surrender charge of 8 percent to 10 percent in the fi rst year, declining to zero over a 5 to 12 year period, depending on issue age and product. Surrender charges are set at levels intended to protect the Company from loss on early terminations and to reduce the likelihood that policyholders will terminate their policies during periods of increasing interest rates. Th is practice is intended to lengthen the duration of policy liabilities and to enable us to maintain profi tability on such policies.
Penalty-free withdrawals from deferred annuities of up to 10 percent of either premiums or account value are available in most plans after the fi rst year of the annuity’s term.
Some deferred annuity products apply a market value adjustment during the surrender charge period. Th is adjustment is determined by a formula specifi ed in the annuity contract, and may increase or
decrease the cash surrender value depending on changes in the amount and direction of market interest rates or credited interest rates at the time of withdrawal. Th e resulting cash surrender values will be at least equal to the guaranteed minimum values.
SPIAs accounted for $15.9 million, or .5 percent, of our total premiums collected in 2012. SPIAs are designed to provide a series of periodic payments for a fi xed period of time or for life, according to the policyholder’s choice at the time of issuance. Once the payments begin, the amount, frequency and length of time over which they are payable are fi xed. SPIAs often are purchased by persons at or near retirement age who desire a steady stream of payments over a future period of years. Th e single premium is often the payout from a deferred annuity contract. Th e implicit interest rate on SPIAs is based on market conditions when the policy is issued. Th e implicit interest rate on our outstanding SPIAs averaged 7.1 percent at December 31, 2012.
Life Insurance
LIFE INSURANCE PREMIUM COLLECTIONS DOLLARS IN MILLIONS
2012 2011 2010Interest-sensitive life products:
Bankers Life $ 88.1 $ 71.3 $ 65.5Colonial Penn .5 .6 .5Other CNO Business 140.1 152.9 162.7
Total interest-sensitive life premium collections 228.7 224.8 228.7Traditional life:
Bankers Life 226.5 178.7 144.1Washington National 14.2 16.0 16.4Colonial Penn 211.4 195.8 187.2Other CNO Business 24.9 26.5 28.7
Total traditional life premium collections 477.0 417.0 376.4TOTAL LIFE INSURANCE PREMIUM COLLECTIONS $ 705.7 $ 641.8 $ 605.1
Life products include traditional and interest-sensitive life insurance products. Th ese products are currently sold through the Bankers Life, Washington National and Colonial Penn segments. During 2012, we collected life insurance premiums of $705.7 million, or 21 percent, of our total collected premiums. Sales of life products are aff ected by the fi nancial strength ratings assigned to our insurance subsidiaries by independent rating agencies. See “Competition” below.
Interest-Sensitive Life Products
Th ese products include universal life and other interest-sensitive life products that provide life insurance with adjustable rates of return related to current interest rates. Th ey accounted for $228.7 million, or 6.8 percent, of our total collected premiums in 2012. Th ese products are marketed by independent producers and, to a lesser extent, career agents (including independent producers and career agents specializing in worksite sales). Th e principal diff erences between universal life products and other interest-sensitive life products are policy provisions aff ecting the amount and timing of premium payments. Universal life policyholders may vary the frequency and size of their premium payments, and policy benefi ts may also fl uctuate according to such payments. Premium payments under other interest-sensitive policies may not be varied by the policyholders. Universal life products include fi xed index universal life products. Th e account value of these policies is credited with interest at a guaranteed rate, plus additional interest credits based on changes in a particular index during a specifi ed time period.
Traditional Life
Th ese products accounted for $477.0 million, or 14 percent, of our total collected premiums in 2012. Traditional life policies, including whole life, graded benefi t life, term life and single premium whole life products, are marketed through independent producers, career agents and direct response marketing. Under whole life policies, the policyholder generally pays a level premium over an agreed period or the policyholder’s lifetime. Th e annual premium in a whole life policy is generally higher than the premium for comparable term insurance coverage in the early years of the policy’s life, but is generally lower than the premium for comparable term insurance coverage in the later years of the policy’s life. Th ese policies combine insurance protection with a savings component that gradually increases in amount over the life of the policy. Th e policyholder may borrow against the savings component generally at a rate of interest lower than that available from other lending sources. Th e policyholder may also choose to surrender the policy and receive the accumulated cash value rather than continuing the insurance protection. Term life products off er pure insurance protection for life with a guaranteed level premium for a specifi ed period of time-typically 5, 10, 15 or 20 years. In some instances, these products off er an option to return the premium at the end of the guaranteed period.
CNO FINANCIAL GROUP, INC. - Form 10-K 24
PART I ITEM 1 Business of CNO
Traditional life products also include graded benefi t life insurance products. Graded benefi t life products accounted for $209.2 million, or 6.2 percent, of our total collected premiums in 2012. Graded benefi t life insurance products are off ered on an individual basis primarily to persons age 50 to 85, principally in face amounts of $400 to $25,000, without medical examination or evidence of insurability. Premiums are paid as frequently as monthly. Benefi ts paid are less than the face amount of the policy during the fi rst two years, except in cases of accidental death. Our Colonial Penn segment markets graded benefi t life policies
under its own brand name using direct response marketing techniques. New policyholder leads are generated primarily from television, print advertisements and direct response mailings.
Traditional life products also include single premium whole life insurance. Th is product requires one initial lump sum payment in return for providing life insurance protection for the insured’s entire lifetime. Single premium whole life products accounted for $79.2 million, or 2.4 percent, of our total collected premiums in 2012.
Investments
40|86 Advisors, Inc. (“40|86 Advisors”, a registered investment advisor and wholly owned subsidiary of CNO) manages the investment portfolios of our insurance subsidiaries. 40|86 Advisors had approximately $27.7 billion of assets (at fair value) under management at December 31, 2012, of which $27.5 billion were our assets and $.2 billion were assets managed for third parties. Our general account investment strategies are to:
• maintain a largely investment-grade, diversifi ed fi xed-income portfolio; • maximize and maintain a stable spread between our investment income and the yields we pay on insurance products; • sustain adequate liquidity levels to meet operating cash requirements; • continually monitor and manage the relationship between our investment portfolio and the fi nancial characteristics of our insurance reserves such as durations and cash fl ows; and • maximize total return through active investment management.
During 2012, 2011 and 2010, we recognized net realized investment gains of $81.1 million, $61.8 million and $30.2 million, respectively. During 2012, net realized investment gains were comprised of: (i) $98.8 million of net gains from the sales of investments (primarily fi xed maturities); (ii) $20.1 million representing the increase in fair value of certain fi xed maturity investments with embedded derivatives; and (iii) $37.8 million of writedowns of investments for other-than-temporary declines in fair value recognized through net income. During 2011, net realized investment gains were comprised of: (i) $96.4 million of net gains from the sales of investments (primarily fi xed maturities); and (ii) $34.6 million of writedowns of investments for other-than-temporary declines in fair value recognized through net income ($39.9 million, prior to the $5.3 million of impairment losses recognized through accumulated other comprehensive income). During 2010, net realized investment gains were comprised of: (i) $180.0 million of net gains from the sales of investments (primarily fi xed maturities); and (ii) $149.8 million of writedowns of investments for other than temporary declines in fair value recognized through net income ($146.8 million, prior to the $(3.0) million of impairment losses recognized through accumulated other comprehensive income).
Investment activities are an important and integral part of our business because investment income is a signifi cant component of our revenues. Th e profi tability of many of our insurance products is signifi cantly aff ected by spreads between interest yields on investments and rates credited on insurance liabilities. Also, certain insurance products are priced based on long term assumptions including investment returns. Although substantially all credited rates on SPDAs, FPDAs and interest sensitive life products may be changed annually (subject to minimum guaranteed rates), changes in crediting rates may not be suffi cient to maintain targeted investment spreads in all economic and market environments. In addition,
competition, minimum guaranteed rates and other factors, including the impact of surrenders and withdrawals, may limit our ability to adjust or to maintain crediting rates at levels necessary to avoid narrowing of spreads under certain market conditions. As of December 31, 2012, the average yield, computed on the cost basis of our fi xed maturity portfolio, was 5.7 percent, and the average interest rate credited or accruing to our total insurance liabilities was 4.5 percent.
We manage the equity-based risk component of our fi xed index annuity products by:
• purchasing equity-based options with similar payoff characteristics; and • adjusting the participation rate to refl ect the change in the cost of such options (such cost varies based on market conditions).
Th e price of the options we purchase to manage the equity-based risk component of our fi xed index annuities varies based on market conditions. All other factors held constant, the price of the options generally increases with increases in the volatility of the applicable indices, which may either reduce the profi tability of the fi xed index products or cause us to lower participation rates. Accordingly, volatility of the indices is one factor in the uncertainty regarding the profi tability of our fi xed index products. We attempt to mitigate this risk by adjusting participation rates to refl ect the change in the cost of such options.
Our invested assets are predominately fi xed rate in nature and their value fl uctuates with changes in market rates. We seek to manage the interest rate risk inherent in our business by managing the durations and cash fl ows of our fi xed maturity investments along with those of the related insurance liabilities. For example, one management measure we use is asset and liability duration. Duration measures expected change in fair value for a given change in interest rates. If interest rates increase by 1 percent, the fair value of a fi xed maturity security with a duration of 5 years is typically expected to decrease in value by approximately 5 percent. When the estimated durations of assets and liabilities are similar, a change in the value of assets should be largely off set by a change in the value of liabilities.
We calculate asset and liability durations using our estimates of future asset and liability cash fl ows. At December 31, 2012, the duration of our fi xed income securities (as modifi ed to refl ect prepayments and potential calls) was approximately 8.7 years and the duration of our insurance liabilities was approximately 8.6 years. While our investment portfolio had a longer duration and, consequently, was more sensitive to interest rate fl uctuations than our liabilities at that date, this sensitivity was within our guidelines. We generally seek to minimize the gap between asset and liability durations.
For information regarding the composition and diversifi cation of the investment portfolio of our subsidiaries, see “Investments”.

CNO FINANCIAL GROUP, INC. - Form 10-K 25
PART I ITEM 1 Business of CNO
Competition
Th e markets in which we operate are competitive. Compared to CNO, many companies in the fi nancial services industry are larger, have greater capital, technological and marketing resources, have greater access to capital and other sources of liquidity at a lower cost, off er broader and more diversifi ed product lines, have greater brand recognition, have larger staff s and higher ratings. An expanding number of banks, securities brokerage fi rms and other fi nancial intermediaries also market insurance products or off er competing products, such as mutual fund products, traditional bank investments and other investment and retirement funding alternatives. We also compete with many of these companies and others in providing services for fees. In most areas, competition is based on a number of factors including pricing, service provided to distributors and policyholders and ratings. CNO’s subsidiaries must also compete to attract and retain the allegiance of agents, insurance brokers and marketing companies.
In the individual health insurance business, companies compete primarily on the bases of marketing, service and price. Pursuant to federal regulations, the Medicare supplement products off ered by all companies have standardized policy features. Th is increases the comparability of such policies and intensifi es competition based on other factors. See “-Insurance Underwriting” and “Governmental Regulation” for additional information. In addition to competing with the products of other insurance companies, commercial banks, thrifts, mutual funds and broker dealers, our insurance products compete with health maintenance organizations, preferred provider organizations and other health care-related institutions which provide medical benefi ts based on contractual agreements.
An important competitive factor for life insurance companies is the ratings they receive from nationally recognized rating organizations. Agents, insurance brokers and marketing companies who market our products and prospective purchasers of our products use the ratings of our insurance subsidiaries as one factor in determining which insurer’s products to market or purchase. Ratings have the most impact on our sales in the worksite market and sales of our annuity, interest-sensitive life insurance and long-term care products. Insurance fi nancial strength ratings are opinions regarding an insurance company’s fi nancial capacity to meet the obligations of its insurance policies in accordance with their terms. Th ey are not directed toward the protection of investors, and such ratings are not recommendations to buy, sell or hold securities.
On September 4, 2012, A.M. Best Company (“A.M. Best”) upgraded the fi nancial strength ratings of our primary insurance subsidiaries, except Conseco Life, to “B++” from “B+”. A.M. Best also affi rmed the fi nancial strength rating of “B-” of Conseco Life. Th e outlook for all ratings is stable. A “stable” designation means that there is a low likelihood of a rating change due to stable fi nancial market trends. Th e “B++” rating is assigned to companies that have a good ability, in A.M. Best’s opinion, to meet their ongoing obligations to policyholders. A “B-” rating is assigned to companies that have a fair ability, in A.M. Best’s opinion, to meet their current obligations to policyholders, but are fi nancially vulnerable to adverse changes in underwriting and economic conditions. A.M. Best ratings for the industry currently range from “A++ (Superior)” to “F (In Liquidation)” and some companies are not rated. An “A++” rating indicates a superior ability to meet ongoing obligations to policyholders. A.M. Best has sixteen possible ratings. Th ere are four ratings above the “B++” rating of our primary insurance subsidiaries, other than Conseco Life, and eleven ratings that are below that rating. Th ere are seven ratings above the “B-” rating of Conseco Life and eight ratings that are below that rating.
On August 3, 2012, Standard & Poor’s Corporation (“S&P”) affi rmed the fi nancial strength ratings of “BB+” of our primary insurance subsidiaries, except Conseco Life, and revised the outlook for such ratings to positive from stable. S&P also downgraded the fi nancial strength rating of Conseco Life to “B+” from “BB+” and the outlook for such rating is stable. On August 4, 2011, S&P upgraded the fi nancial strength ratings of our primary insurance subsidiaries to “BB+” from “BB”. A “positive” outlook means that a rating may be raised. A “stable” outlook means that a rating is not likely to change. S&P fi nancial strength ratings range from “AAA” to “R” and some companies are not rated. An insurer rated “BB” or lower is regarded as having vulnerable characteristics that may outweigh its strengths. A “BB” rating indicates the least degree of vulnerability within the range; a “CC” rating indicates the highest degree of vulnerability. Pluses and minuses show the relative standing within a category. In S&P’s view, an insurer rated “BB” has marginal fi nancial security characteristics and although positive attributes exist, adverse business conditions could lead to an insuffi cient ability to meet fi nancial commitments. In S&P’s view, an insurer rated “B” has weak fi nancial security characteristics and adverse business conditions will likely impair its ability to meet fi nancial commitments. S&P has twenty-one possible ratings. Th ere are ten ratings above the “BB+” rating of our primary insurance subsidiaries, other than Conseco Life, and ten ratings that are below that rating. Th ere are thirteen ratings above the “B+” rating of Conseco Life and seven ratings that are below that rating.
On August 29, 2012, Moody’s Investor Services, Inc. (“Moody’s”) upgraded the fi nancial strength ratings of our primary insurance subsidiaries, except Conseco Life, to “Baa3” from “Ba1”. Moody’s also affi rmed the fi nancial strength rating of “Ba1” of Conseco Life. Th e outlook for all ratings is stable. A “stable” designation means that a rating is not likely to change. Moody’s fi nancial strength ratings range from “Aaa” to “C”. Th ese ratings may be supplemented with numbers “1”, “2”, or “3” to show relative standing within a category. In Moody’s view, an insurer rated “Baa” off ers adequate fi nancial security, however, certain protective elements may be lacking or may be characteristically unreliable over any great length of time. In Moody’s view, an insurer rated “Ba” off ers questionable fi nancial security and, often, the ability of these companies to meet policyholders’ obligations may be very moderate and thereby not well safeguarded in the future. Moody’s has twenty-one possible ratings. Th ere are nine ratings above the “Baa3” rating of our primary insurance subsidiaries, other than Conseco Life, and eleven ratings that are below the rating. Th ere are ten ratings above the “Ba1” rating of Conseco Life and ten ratings that are below that rating.
On September 5, 2012, Fitch Ratings (“Fitch”) affi rmed the fi nancial strength ratings of “BBB” of our primary insurance subsidiaries as well as the “BB+” rating of Conseco Life and the outlook for all of these ratings is stable. On February 3, 2012, Fitch upgraded the fi nancial strength ratings of our primary insurance subsidiaries, except Conseco Life, to “BBB” (from “BBB-” or “BB+” depending on the company). Fitch also affi rmed the fi nancial strength rating of “BB+” of Conseco Life. A “BBB” rating, in Fitch’s opinion, indicates that there is currently a low expectation of ceased or interrupted payments. Th e capacity to meet policyholder and contract obligations on a timely basis is considered adequate, but adverse changes in circumstances and economic conditions are more likely to impact this capacity. A “BB” rating, in Fitch’s opinion, indicates that there is an elevated vulnerability to ceased or interrupted payments, particularly as the result of adverse economic or market changes over time. However, business or fi nancial alternatives may be available

CNO FINANCIAL GROUP, INC. - Form 10-K 26
PART I ITEM 1 Business of CNO
to allow for policyholder and contract obligations to be met in a timely manner. Fitch ratings for the industry range from “AAA Exceptionally Strong” to “C Distressed” and some companies are not rated. Pluses and minuses show the relative standing within a category. Fitch has nineteen possible ratings. Th ere are eight ratings above the “BBB” rating of our primary insurance subsidiaries, other than Conseco Life, and ten ratings that are below that rating. Th ere are ten ratings above the “BB+” rating of Conseco Life and eight ratings that are below that rating.
In light of the diffi culties experienced recently by many fi nancial institutions, including insurance companies, rating agencies have increased the frequency and scope of their credit reviews and requested
additional information from the companies that they rate, including us. Th ey may also adjust upward the capital and other requirements employed in the rating agency models for maintenance of certain ratings levels. We cannot predict what actions rating agencies may take, or what actions we may take in response. Accordingly, downgrades and outlook revisions related to us or the life insurance industry may occur in the future at any time and without notice by any rating agency. Th ese could increase policy surrenders and withdrawals, adversely aff ect relationships with our distribution channels, reduce new sales, reduce our ability to borrow and increase our future borrowing costs.
Insurance Underwriting
Under regulations developed by the National Association of Insurance Commissioners (the “NAIC”) (an association of state regulators and their staff s) and adopted by the states, we are prohibited from underwriting our Medicare supplement policies for certain fi rst-time purchasers. If a person applies for insurance within six months after becoming eligible by reason of age, or disability in certain limited circumstances, the application may not be rejected due to medical conditions. Some states prohibit underwriting of all Medicare supplement policies. For other prospective Medicare supplement policyholders, such as senior citizens who are transferring to our products, the underwriting procedures are relatively limited, except for policies providing prescription drug coverage.
Before issuing long-term care products, we generally apply detailed underwriting procedures to assess and quantify the insurance risks. We require medical examinations of applicants (including blood and urine tests, where permitted) for certain health insurance products and for life insurance products which exceed prescribed policy amounts. Th ese requirements vary according to the applicant’s age and may vary by type of policy or product. We also rely on medical records and the potential policyholder’s written application. In recent years, there have been signifi cant regulatory changes with respect to underwriting certain types of health insurance. An increasing number of states prohibit underwriting and/or charging higher premiums for substandard risks.
We monitor changes in state regulation that aff ect our products, and consider these regulatory developments in determining the products we market and where we market them.
Our supplemental health policies are individually underwritten using a simplifi ed issue application. Based on an applicant’s responses on the application, the underwriter either: (i) approves the policy as applied for; (ii) approves the policy with reduced benefi ts; or (iii) rejects the application.
Most of our life insurance policies are underwritten individually, although standardized underwriting procedures have been adopted for certain low face-amount life insurance coverages. After initial processing, insurance underwriters obtain the information needed to make an underwriting decision (such as medical examinations, doctors’ statements and special medical tests). After collecting and reviewing the information, the underwriter either: (i) approves the policy as applied for; (ii) approves the policy with an extra premium charge because of unfavorable factors; or (iii) rejects the application.
We underwrite group insurance policies based on the characteristics of the group and its past claim experience. Graded benefi t life insurance policies are issued without medical examination or evidence of insurability. Th ere is minimal underwriting on annuities.
Liabilities For Insurance Products
At December 31, 2012, the total balance of our liabilities for insurance products was $25.1 billion. Th ese liabilities are generally payable over an extended period of time. Th e profi tability of our insurance products depends on pricing and other factors. Diff erences between our expectations when we sold these products and our actual experience could result in future losses.
Liabilities for insurance products are calculated using management’s best judgments, based on our past experience and standard actuarial tables, of mortality, morbidity, lapse rates, investment experience and expense levels. For all of our insurance products, we establish an active life reserve, a liability for due and unpaid claims, claims in the course of settlement and incurred but not reported claims. In addition, for our health insurance business, we establish a reserve for the present value of amounts not yet due on incurred claims. Many factors can aff ect these reserves and liabilities, such as economic and social conditions, infl ation, hospital and pharmaceutical costs, changes in doctrines of
legal liability and extra-contractual damage awards. Th erefore, our reserves and liabilities are necessarily based on extensive estimates, assumptions and historical experience. Establishing reserves is an uncertain process, and it is possible that actual claims will materially exceed our reserves and have a material adverse eff ect on our results of operations and fi nancial condition. Our fi nancial results depend signifi cantly upon the extent to which our actual claims experience is consistent with the assumptions we used in determining our reserves and pricing our products. If our assumptions are incorrect with respect to future claims, future policyholder premiums and policy charges or the investment income on assets supporting liabilities, or our reserves are insuffi cient to cover our actual losses and expenses, we would be required to increase our liabilities, which would negatively aff ect our operating results.

CNO FINANCIAL GROUP, INC. - Form 10-K 27
PART I ITEM 1 Business of CNO
Reinsurance
Consistent with the general practice of the life insurance industry, our subsidiaries enter into both facultative and treaty agreements of indemnity reinsurance with other insurance companies in order to reinsure portions of the coverage provided by our insurance products. Indemnity reinsurance agreements are intended to limit a life insurer’s maximum loss on a large or unusually hazardous risk or to diversify its risk. Indemnity reinsurance does not discharge the original insurer’s primary liability to the insured. Our reinsured business is ceded to numerous reinsurers. Based on our periodic review of their fi nancial
statements, insurance industry reports and reports fi led with state insurance departments, we believe the assuming companies are able to honor all contractual commitments.
As of December 31, 2012, the policy risk retention limit of our insurance subsidiaries was generally $.8 million or less. Reinsurance ceded by CNO represented 23 percent of gross combined life insurance inforce and reinsurance assumed represented .8 percent of net combined life insurance inforce.
Our principal reinsurers at December 31, 2012 were as follows (dollars in millions):
Name of Reinsurer Ceded life insurance inforce A.M. Best ratingWilton Reassurance Company $ 3,063.4 ASwiss Re Life and Health America Inc. 2,586.2 A +Security Life of Denver Insurance Company 2,040.3 AJackson National Life Insurance Company (“Jackson”) (a) 1,047.5 A +Munich American Reassurance Company 703.2 A +RGA Reinsurance Company 628.6 A +Lincoln National Life Insurance Company 428.1 A +Scor Global Life Re Insurance Co of Texas 392.4 AHannover Life Reassurance Company 288.3 A +General Re Life Corporation 254.0 A ++All others (b) 960.4
$ 12,392.4(a) In addition to the life insur ance business summarized above, Jackson has assumed cer tain annuity business fr om our insurance subsidiaries through a coinsurance
agreement. Such business had total insurance policy liabilities of $1.6 billion at December 31, 2012.(b) No other single reinsurer assumed greater than 2 percent of the total ceded business inforce.
Employees
At December 31, 2012, we had approximately 4,200 full time employees, including 1,700 employees supporting our Bankers Life segment, 400 employees supporting our Colonial Penn segment and 2,100 employees supporting our shared services and our Washington National, Other
CNO Business and corporate segments. None of our employees are covered by a collective bargaining agreement. We believe that we have good relations with our employees.
Governmental Regulation
Our insurance businesses are subject to extensive regulation and supervision by the insurance regulatory agencies of the jurisdictions in which they operate. Th is regulation and supervision is primarily for the benefi t and protection of customers, and not for the benefi t of investors or creditors. State laws generally establish supervisory agencies that have broad regulatory authority, including the power to:
• grant and revoke business licenses; • regulate and supervise sales practices and market conduct; • establish guaranty associations; • license agents; • approve policy forms; • approve premium rates and premium rate increases for some lines of business such as long-term care and Medicare supplement; • establish reserve requirements;
• prescribe the form and content of required fi nancial statements and reports; • determine the reasonableness and adequacy of statutory capital and surplus; • perform fi nancial, market conduct and other examinations; • defi ne acceptable accounting principles; and • regulate the types and amounts of permitted investments.
In addition, the NAIC develops model laws and regulations, many of which have been adopted by state legislators and/or insurance regulators, relating to:
• reserve requirements; • risk-based capital (“RBC”) standards; • codifi cation of insurance accounting principles; • investment restrictions;

CNO FINANCIAL GROUP, INC. - Form 10-K 28
PART I ITEM 1 Business of CNO
• restrictions on an insurance company’s ability to pay dividends; • credit for reinsurance; and • product illustrations.
In addition to the regulations described above, most states have also enacted laws or regulations regarding the activities of insurance holding company systems, including acquisitions, the terms of surplus debentures, the terms of transactions between or involving insurance companies and their affi liates and other related matters. Various reporting and approval requirements apply to transactions between or involving insurance companies and their affi liates within an insurance holding company system, depending on the size and nature of the transactions. Currently, the Company and its insurance subsidiaries are registered as a holding company system pursuant to such laws and regulations in the domiciliary states of the insurance subsidiaries. In addition, the Company’s insurance subsidiaries routinely report to other jurisdictions.
Insurance regulators may prohibit the payment of dividends or other payments by our insurance subsidiaries to parent companies if they determine that such payment could be adverse to our policyholders or contract holders. Otherwise, the ability of our insurance subsidiaries to pay dividends is subject to state insurance department regulations and is based on the fi nancial statements of our insurance subsidiaries prepared in accordance with statutory accounting practices prescribed or permitted by regulatory authorities, which diff er from fi nancial statements prepared in accordance with accounting principles generally accepted in the United States of America (“GAAP”). Th ese regulations generally permit dividends to be paid by the insurance company if such dividends are not in excess of unassigned surplus and, for any 12-month period, are in amounts less than the greater of, or in a few states, the lesser of:
• statutory net gain from operations or statutory net income for the prior year; or • 10 percent of statutory capital and surplus at the end of the preceding year.
Any dividends in excess of these levels require the approval of the director or commissioner of the applicable state insurance department.
In accordance with an order from the Florida Offi ce of Insurance Regulation, Washington National may not distribute funds to any affi liate or shareholder without prior notice to the Florida Offi ce of Insurance Regulation. In addition, the RBC and other capital requirements described below can also limit, in certain circumstances, the ability of our insurance subsidiaries to pay dividends.
Our insurance subsidiaries that have long-term care business have made insurance regulatory fi lings seeking actuarially justifi ed rate increases on our long-term care policies. Most of our long-term care business is guaranteed renewable, and, if necessary rate increases are not approved, we may be required to write off all or a portion of the deferred acquisition costs and the present value of future profi ts (collectively referred to as “insurance acquisition costs”) and establish a premium defi ciency reserve. If we are unable to raise our premium rates because we fail to obtain approval for actuarially justifi ed rate increases in one or more states, our fi nancial condition and results of operations could be adversely aff ected.
During 2006, the Florida legislature enacted a statute, known as House Bill 947, intended to provide new protections to long-term care insurance policyholders. Among other requirements, this statute requires:
(i) claim experience of affi liated long-term care insurers to be pooled in determining justifi cation for rate increases for Florida policyholders; and (ii) insurers with closed blocks of long-term care insurance to not raise rates above the comparable new business premium rates off ered by affi liated insurers. Th e manner in which the requirements of this statute are applied to our long-term care policies in Florida (including policies subject to the order from the Florida Offi ce of Insurance Regulation as described in “Management’s Discussion and Analysis of Consolidated Financial Condition and Results of Operations”) may aff ect our ability to achieve our anticipated rate increases on this business.
Most states have also enacted legislation or adopted administrative regulations that aff ect the acquisition (or sale) of control of insurance companies. Th e nature and extent of such legislation and regulations vary from state to state. Generally, these regulations require an acquirer of control to fi le detailed information and the plan of acquisition, and to obtain administrative approval prior to the acquisition of control. “Control” is generally defi ned as the direct or indirect power to direct or cause the direction of the management and policies of a person and is rebuttably presumed to exist if a person or group of affi liated persons directly or indirectly owns or controls 10 percent or more of the voting securities of another person.
Using statutory statements fi led with state regulators annually, the NAIC calculates certain fi nancial ratios to assist state regulators in monitoring the fi nancial condition of insurance companies. A “usual range” of results for each ratio is used as a benchmark. An insurance company may fall out of the usual range for one or more ratios because of specifi c transactions that are in themselves immaterial or eliminated at the consolidated level. Generally, an insurance company will become subject to regulatory scrutiny if it falls outside the usual ranges of four or more of the ratios, and regulators may then act, if the company has insuffi cient capital, to constrain the company’s underwriting capacity. In the past, variances in certain ratios of our insurance subsidiaries have resulted in inquiries from insurance departments, to which we have responded. Th ese inquiries have not led to any restrictions aff ecting our operations.
Th e NAIC’s RBC requirements provide a tool for insurance regulators to determine the levels of statutory capital and surplus an insurer must maintain in relation to its insurance and investment risks and the need for possible regulatory attention. Th e RBC requirements provide four levels of regulatory attention, varying with the ratio of the insurance company’s total adjusted capital (“TAC”, defi ned as the total of its statutory capital and surplus, asset valuation reserve and certain other adjustments) to its RBC (as measured on December 31 of each year), as follows:
• if a company’s total adjusted capital is less than 100 percent but greater than or equal to 75 percent of its RBC (the “Company Action Level”), the company must submit a comprehensive plan to the regulatory authority proposing corrective actions aimed at improving its capital position; • if a company’s total adjusted capital is less than 75 percent but greater than or equal to 50 percent of its RBC, the regulatory authority will perform a special examination of the company and issue an order specifying the corrective actions that must be taken; • if a company’s total adjusted capital is less than 50 percent but greater than or equal to 35 percent of its RBC (the “Authorized Control Level”), the regulatory authority may take any action it deems necessary, including placing the company under regulatory control; and

CNO FINANCIAL GROUP, INC. - Form 10-K 29
PART I ITEM 1 Business of CNO
• if a company’s total adjusted capital is less than 35 percent of its RBC (the “Mandatory Control Level”), the regulatory authority must place the company under its control.
In addition, the RBC requirements currently provide for a trend test if a company’s total adjusted capital is between 100 percent and 125 percent of its RBC at the end of the year. Th e trend test calculates the greater of the decrease in the margin of total adjusted capital over RBC:
• between the current year and the prior year; and • for the average of the last 3 years.
It assumes that such decrease could occur again in the coming year. Any company whose trended total adjusted capital is less than 95 percent of its RBC would trigger a requirement to submit a comprehensive plan as described above for the Company Action Level. In 2011, the NAIC approved an increase in the RBC requirements that would subject a company to the trend test if a company’s total adjusted capital is between 100 percent and 150 percent of its RBC at the end of the year (previously between 100 percent and 125 percent). However, this change will require the states to modify their RBC law before it becomes eff ective for their domiciled insurance companies.
Th e 2012 statutory annual statements to be fi led with the state insurance regulators of each of our insurance subsidiaries are expected to refl ect total adjusted capital in excess of the levels subjecting the subsidiaries to any regulatory action. However, the RBC ratio of Conseco Life, which has experienced signifi cant losses primarily related to pending legal settlements, was near the level at which it would have been required to submit a comprehensive plan to insurance regulators proposing corrective actions aimed at improving its capital position. Conseco Life’s domestic state is expected to adopt the increased RBC requirements described in the preceding paragraph, in which event, they would be eff ective for the calculation of Conseco Life’s RBC ratio as of December 31, 2013. If those increased requirements had been in eff ect at December 31, 2012, the RBC ratio of Conseco Life at that date would have been subject to the trend test described above and Conseco Life would have been required to submit a comprehensive plan to the state regulatory authority proposing corrective actions aimed at improving its capital position. No assurances can be given that capital will be contributed or otherwise made available to Conseco Life or the other insurance subsidiaries.
In addition to the RBC requirements, certain states have established minimum capital requirements for insurance companies licensed to do business in their state. Th ese regulators have the discretionary authority, in connection with the continual licensing of the Company’s insurance subsidiaries, to limit or prohibit writing new business within its jurisdiction when, in the state’s judgment, the insurance subsidiary is not maintaining adequate statutory surplus or capital or that the insurance subsidiary’s further transaction of business would be hazardous to policyholders. Th e state insurance department rules provide several standards for the regulators to use in identifying companies which may be deemed to be in hazardous fi nancial condition. One of the standards defi nes hazardous conditions as existing if an insurer’s operating loss in the last twelve months or any shorter period of time, (including, but not limited to: (A) net capital gain or loss; (B) change in nonadmitted assets; and (C) cash dividends paid to shareholders), is greater than fi fty percent of the insurer’s remaining surplus. One of the Company’s subsidiaries, Conseco Life, has reported statutory fi nancial results that indicate a surplus defi ciency under this calculation. We have been in contact with regulators in Conseco Life’s domestic state insurance
department regarding this matter following the signifi cant loss Conseco Life recognized in the third quarter of 2012, primarily related to a pending legal settlement. Based on our current discussions with the state insurance regulator, we do not expect any actions to be taken against Conseco Life that would have a material adverse eff ect on the fi nancial position or results of operations of CNO. See “Management’s Discussion and Analysis of Consolidated Financial Condition and Results of Operations - Liquidity of the Holding Companies” for more information on our RBC ratios.
In addition, although we are under no obligation to do so, we may elect to contribute additional capital or retain greater amounts of capital to strengthen the surplus of certain insurance subsidiaries. Any election to contribute or retain additional capital could impact the amounts our insurance subsidiaries pay as dividends to the holding company. Th e ability of our insurance subsidiaries to pay dividends is also impacted by various criteria established by rating agencies to maintain or receive higher ratings and by the capital levels that we target for our insurance subsidiaries.
Th e NAIC has adopted model long-term care policy language providing nonforfeiture benefi ts and has proposed a rate stabilization standard for long-term care policies. Various bills are introduced from time to time in the U.S. Congress which propose the implementation of certain minimum consumer protection standards in all long-term care policies, including guaranteed renewability, protection against infl ation and limitations on waiting periods for pre-existing conditions. Federal legislation permits premiums paid for qualifi ed long-term care insurance to be tax-deductible medical expenses and for benefi ts received on such policies to be excluded from taxable income.
Our insurance subsidiaries are required, under guaranty fund laws of most states, to pay assessments up to prescribed limits to fund policyholder losses or liabilities of insolvent insurance companies. Typically, assessments are levied on member insurers on a basis which is related to the member insurer’s proportionate share of the business written by all member insurers. Assessments can be partially recovered through a reduction in future premium taxes in some states.
Th e Company’s insurance subsidiaries are required to fi le detailed annual reports, in accordance with prescribed statutory accounting rules, with regulatory authorities in each of the jurisdictions in which they do business. As part of their routine oversight process, state insurance departments conduct periodic detailed examinations, generally once every three to fi ve years, of the books, records and accounts of insurers domiciled in their states. Th ese examinations are generally conducted in cooperation with the departments of two or three other states under guidelines promulgated by the NAIC.
State regulatory authorities and industry groups have developed several initiatives regarding market conduct, including the form and content of disclosures to consumers, advertising, sales practices and complaint handling. Various state insurance departments periodically examine the market conduct activities of domestic and non-domestic insurance companies doing business in their states, including our insurance subsidiaries. Th e purpose of these market conduct examinations is to determine if operations are consistent with the laws and regulations of the state conducting the examination. State regulators have imposed signifi cant fi nes and restrictions on our insurance company subsidiaries for improper market conduct. See “Management’s Discussion and Analysis of Financial Condition and Results of Operations”. In addition, market conduct has become one of the criteria used by rating agencies

CNO FINANCIAL GROUP, INC. - Form 10-K 30
PART I ITEM 1 Business of CNO
to establish the ratings of an insurance company. For example, A.M. Best’s ratings analysis now includes a review of the insurer’s compliance program.
Most states mandate minimum benefi t standards and benefi t ratios for accident and health insurance policies. We are generally required to maintain, with respect to our individual long-term care policies, minimum anticipated benefi t ratios over the entire period of coverage of not less than 60 percent. With respect to our Medicare supplement policies, we are generally required to attain and maintain an actual benefi t ratio, after three years, of not less than 65 percent. We provide to the insurance departments of all states in which we conduct business annual calculations that demonstrate compliance with required minimum benefi t ratios for both long-term care and Medicare supplement insurance. Th ese calculations are prepared utilizing statutory lapse and interest rate assumptions. In the event that we fail to maintain minimum mandated benefi t ratios, our insurance subsidiaries could be required to provide retrospective refunds and/or prospective rate reductions. We believe that our insurance subsidiaries currently comply with all applicable mandated minimum benefi t ratios.
Our insurance subsidiaries are subject to state laws and regulations that require diversifi cation of their investment portfolios and limit the amount of investments in certain investment categories, such as below-investment grade bonds, equity real estate and common stocks. Failure to comply with these laws and regulations would cause investments exceeding regulatory limitations to be treated as non-admitted assets for purposes of measuring statutory surplus, and, in some instances, would require divestiture of such non-qualifying investments. Th e investments made by our insurance subsidiaries comply in all material respects with such investment regulations as of December 31, 2012.
Federal and state law and regulation require fi nancial institutions to protect the security and confi dentiality of personal information, including health-related and customer information, and to notify customers and other individuals about their policies and practices relating to their collection and disclosure of health-related and customer information and their practices relating to protecting the security and confi dentiality of that information. State laws regulate use and disclosure of social security numbers and federal and state laws require notice to aff ected individuals, law enforcement, regulators and others if there is a breach of the security of certain personal information, including social security numbers. Federal and state laws and regulations regulate the ability of fi nancial institutions to make telemarketing calls and to send unsolicited e-mail or fax messages to consumers and customers. Federal and state lawmakers and regulatory bodies may be expected to consider additional or more detailed regulation regarding these subjects and the privacy and security of personal information. Th e United States Department of Health and Human Services has issued regulations under the Health Insurance Portability and Accountability Act relating to standardized electronic transaction formats, code sets and the privacy of member health information. Th ese regulations, and any corresponding state legislation, aff ect our administration of health insurance.
Title III of the USA PATRIOT Act of 2001 (the “Patriot Act”), amends the Money Laundering Control Act of 1986 and the Bank Secrecy Act of 1970 to expand anti-money laundering (“AML”) and fi nancial transparency laws applicable to fi nancial services companies, including insurance companies. Th e Patriot Act, among other things, seeks to promote cooperation among fi nancial institutions, regulators and law enforcement entities in identifying parties that may be involved in
terrorism, money laundering or other illegal activities. To the extent required by applicable laws and regulations, CNO and its insurance subsidiaries have adopted AML programs that include policies, procedures and controls to detect and prevent money laundering, have designated compliance offi cers to oversee the programs, provide for on-going employee training and ensure periodic independent testing of the programs. CNO’s and the insurance subsidiaries’ AML programs, to the extent required, also establish and enforce customer identifi cation programs and provide for the monitoring and the reporting to the Department of the Treasury of certain suspicious transactions.
Traditionally, the federal government has not directly regulated the business of insurance. However, federal legislation and administrative policies in several areas can signifi cantly and adversely aff ect insurance companies. Most prominently, the Patient Protection and Aff ordable Care Act and the Health Care and Education Reconciliation Act of 2010 give the U.S. federal government direct regulatory authority over certain aspects of the business of health insurance. In addition, the reform includes major changes to the U.S. health care insurance marketplace. Among other changes, the reform legislation includes an individual medical insurance coverage mandate, provides for penalties on certain employers for failing to provide adequate coverage, creates health insurance exchanges to attempt to facilitate the purchase of insurance by individuals and small businesses, and addresses policy coverages and exclusions as well as the medical loss ratios of insurers. Th e legislation also includes changes in government reimbursements and tax credits for individuals and employers and alters federal and state regulation of health insurers. Th ese changes are being phased in through 2018. Th ese changes are directed toward major medical health insurance coverage, which our insurance subsidiaries do not off er. Rather, our core products (e.g., medicare supplement insurance, long term care insurance, and other limited benefi t supplemental insurance products) are not subject to or covered under the major provisions of this new federal legislation.
In addition, the Dodd-Frank Wall Street Reform and Consumer Protection Act of 2010 (the “Dodd-Frank Act”) generally provides for enhanced federal supervision of fi nancial institutions, including insurance companies in certain circumstances, and fi nancial activities that represent a systemic risk to fi nancial stability or the U.S. economy. Under the Dodd-Frank Act, a Federal Insurance Offi ce has been established within the U.S. Treasury Department to monitor all aspects of the insurance industry and its authority will likely extend to most lines of insurance that are written by the Company, although the Federal Insurance Offi ce is not empowered with any general regulatory authority over insurers. Th e director of the Federal Insurance Offi ce serves in an advisory capacity to the newly established Financial Stability Oversight Council and will have the ability to recommend that an insurance company or an insurance holding company be subject to heightened prudential standards by the Federal Reserve, if it is determined that fi nancial distress at the company could pose a threat to fi nancial stability in the U.S. Th e Dodd-Frank Act also provides for the preemption of state laws when inconsistent with certain international agreements, and would streamline the state-level regulation of reinsurance and surplus lines insurance. Under certain circumstances, the FDIC can assume the role of a state insurance regulator and initiate liquidation proceedings under state law.
In 2009, the U.S. House of Representatives passed the “Helping Families Save Th eir Homes Act of 2009”, which would grant federal bankruptcy judges the ability to modify the terms of certain mortgage

CNO FINANCIAL GROUP, INC. - Form 10-K 31
PART I ITEM 1 Business of CNO
loans by, among other things, reducing interest rates and principal and extending repayments. Because it would permit judges to reduce, or “cram down” principal, this type of legislation is referred to as “cram down” legislation. Although the U.S. Senate defeated the “cram down” aspects of this legislation, similar legislation may be introduced in the future. Mortgage loan modifi cations can aff ect the allocation of losses on certain residential mortgage-backed securities (“RMBS”) transactions including senior tranches of RMBS transactions that include bankruptcy carve-outs, which provide that bankruptcy losses above a specifi ed threshold are allocated to all tranches pro rata regardless of seniority. If similar mortgage-related legislation is signed into law, it could cause loss of principal on or ratings downgrades of certain of the Company’s RMBS holdings, including senior tranches of RMBS transactions that include bankruptcy carve-outs.
In late 2011, the NAIC adopted Statement of Statutory Accounting Principles No. 101, “Income Taxes a replacement of SSAP 10R and SSAP 10” (“SSAP 101”) , with an eff ective date of January 1, 2012. Under SSAP 101, the criteria for determining the value of deferred tax assets will be based on certain admissibility tests. In addition, tax contingencies will be based on a GAAP-like standard using a “more likely than not” approach. Th ese changes did not have a material eff ect on our statutory capital and surplus.
Th e asset management activities of 40|86 Advisors are subject to various federal and state securities laws and regulations. Th e SEC and the Commodity Futures Trading Commission are the principal regulators of our asset management operations.
Federal Income Taxation
Our annuity and life insurance products generally provide policyholders with an income tax advantage, as compared to other savings investments such as certifi cates of deposit and bonds, because taxes on the increase in value of the products are deferred until received by policyholders. With other savings investments, the increase in value is generally taxed as earned. Annuity benefi ts and life insurance benefi ts, which accrue prior to the death of the policyholder, are generally not taxable until paid. Life insurance death benefi ts are generally exempt from income tax. Also, benefi ts received on immediate annuities (other than structured settlements) are recognized as taxable income ratably, as opposed to the methods used for some other investments which tend to accelerate taxable income into earlier years. Th e tax advantage for annuities and life insurance is provided in the Internal Revenue Code (the “Code”), and is generally followed in all states and other United States taxing jurisdictions.
Congress has considered, from time to time, possible changes to the U.S. tax laws, including elimination of the tax deferral on the accretion of value of certain annuities and life insurance products. It is possible that further tax legislation will be enacted which would contain provisions with possible adverse eff ects on our annuity and life insurance products.
Our insurance company subsidiaries are taxed under the life insurance company provisions of the Code. Provisions in the Code require a portion of the expenses incurred in selling insurance products to be deducted over a period of years, as opposed to immediate deduction in the year incurred. Th is provision increases the tax for statutory accounting purposes, which reduces statutory earnings and surplus and, accordingly, decreases the amount of cash dividends that may be paid by the life insurance subsidiaries.
Our income tax expense includes deferred income taxes arising from temporary diff erences between the fi nancial reporting and tax bases of assets and liabilities, capital loss carryforwards and NOLs. In evaluating our deferred tax assets, we consider whether it is more likely than not that the deferred tax assets will be realized. Th e ultimate realization of our deferred tax assets depends upon generating future taxable income during the periods in which our temporary diff erences become deductible and before our NOLs expire. In addition, the use of our NOLs is dependent, in part, on whether the Internal Revenue Service (“IRS”) ultimately agrees with the tax position we plan to take in our current and future tax returns. Accordingly, with respect to our deferred tax assets, we assess the need for a valuation allowance on an ongoing basis.
Based upon information existing at the time of our emergence from bankruptcy, we established a valuation allowance equal to our entire balance of net deferred tax assets because, at that time, the realization of such deferred tax assets in future periods was uncertain. As of December 31, 2012, 2011 and 2010, we determined that a full valuation allowance was no longer necessary. However, as further discussed in the note to the consolidated fi nancial statements entitled “Income Taxes”, we continue to believe that it is necessary to have a valuation allowance on a portion of our deferred tax assets. Th is determination was made by evaluating each component of the deferred tax assets and assessing the eff ects of limitations or issues on the value of such component to be fully recognized in the future.

CNO FINANCIAL GROUP, INC. - Form 10-K 32
PART I ITEM 1A Risk Factors
ITEM 1A Risk FactorsCNO and its businesses are subject to a number of risks including general business and fi nancial risk. Any or all of such risks could have a material adverse eff ect on the business, fi nancial condition or results of operations of CNO. In addition, please refer to the “Cautionary Statement Regarding Forward-Looking Statements” included in “Item 7 - Management’s Discussion and Analysis of Consolidated Financial Condition and Results of Operations”.
Potential continuation of a low interest rate environment for an extended period of time may negatively impact our results of operations, fi nancial position and cash fl ows.
In recent periods, interest rates have been at or near historically low levels. Some of our products, principally traditional whole life, universal life, fi xed rate and fi xed index annuity contracts, expose us to the risk that changes in interest rates will reduce our spread (the diff erence between the amounts that we are required to pay under the contracts and the investment income we are able to earn on the investments supporting our obligations under the contracts). Our spread is a key component of our net income. In addition, investment income is an important component of the profi tability of our health products, especially long-term care and supplemental health policies.
If interest rates were to decrease further or remain at low levels for an extended period of time, we may have to invest new cash fl ows or reinvest proceeds from investments that have matured or have been prepaid or sold at yields that have the eff ect of reducing our net investment income as well as the spread between interest earned on investments and interest credited to some of our products below present or planned levels. To the extent borrowers may prepay or redeem fi xed maturity investments or mortgage loans in our investment portfolio, this could increase the impact of this risk. We can lower crediting rates on certain products to off set the decrease in investment yield. However, our ability to lower these rates may be limited by: (i) contractually guaranteed minimum rates; or (ii) competition. In addition, a decrease in crediting rates may not match the timing or magnitude of changes in investment yields. Currently, the vast majority of our products with contractually guaranteed minimum rates, have crediting rates set at the minimum rate. As a result, further decreases in investment yields would decrease the spread we earn and such spread could potentially become a loss.
Th e following table summarizes the distribution of annuity and universal life account values by guaranteed interest crediting rates as of December 31, 2012 (dollars in millions):
Guaranteed rateFixed rate and fi xed
index annuities Universal life Total> 6.0% to 8.0% $ .1 $ — $ .1 > 5.0% to 6.0% .2 36.4 36.6 > 4.0% to 5.0% 88.5 899.2 987.7 > 3.0% to 4.0% 1,682.2 1,181.4 2,863.6 > 2.0% to 3.0% 3,661.6 371.4 4,033.0 > 1.0% to 2.0% 1,283.1 5.1 1,288.2 1.0% and under 1,214.6 45.6 1,260.2
$ 7,930.3 $ 2,539.1 $ 10,469.4 Weighted average 2.45% 3.97% 2.82%
In addition, during periods of declining or low interest rates, life and annuity products may be relatively more attractive to consumers, resulting in increased premium payments on products with fl exible premium features, repayment of policy loans and increased persistency (a higher percentage of insurance policies remaining in force from year-to-year).
Our expectation of future investment income is an important consideration in determining the amortization of insurance acquisition costs and analyzing the recovery of these assets as well as determining the adequacy of our liabilities for insurance products. Expectations of lower future investment earnings may cause us to accelerate amortization, write down the balance of insurance acquisition costs or establish additional liabilities for insurance products, thereby reducing net income in the future periods.
Th e blocks of business in our Other CNO Business segment are particularly sensitive to changes in our expectations of future interest rates. Since the interest sensitive blocks in this segment are not expected to generate future profi ts, the entire impact of adverse changes to
our earlier estimate of future gross profi ts is recognized in earnings in the period such changes occur. For example, in 2012, 2011, and 2010, we recognized a pre-tax reduction in earnings of approximately $43 million, $13 million and $13 million, respectively, in the Other CNO Business segment primarily due to increases in future loss reserves resulting from decreased projected future investment yields related to investments backing our interest-sensitive insurance products. Th e earnings reduction in 2012 resulted from our review of interest rate assumptions on all of our products. As a result of this review, we lowered our new money rate assumptions used in determining our projections of future investment income. Th e new money rate is the rate of return we receive on cash fl ows invested at a current date. If new money rates are lower than the overall weighted average return we earn from our investment portfolio, and the lower rates persist, our overall earned rates will decrease. Specifi cally, our revised projections assumed new money rates of 4.75 percent for one year and then grade over 5 years from this level to an ultimate new money rate ranging from 6.35 percent to 7.00 percent, depending on the specifi c product.
CNO FINANCIAL GROUP, INC. - Form 10-K 33
PART I ITEM 1A Risk Factors
While we expect the long-term care business in the Bankers Life segment to generate future profi ts, the margins are relatively small and are vulnerable to lower interest rates.
Th e following summarizes hypothetical scenarios which assume immediate and permanent reductions to current interest rates. We estimate that a pre-tax charge of $60 million would occur if assumed spreads related to our universal life and investment-type products immediately and permanently decreased by 10 basis points. In addition, we estimate that a pre-tax charge of $200 million would occur if assumed investment earnings rates related to products other than universal life and investment-type products immediately and permanently decreased by 50 basis points.
Th e following summarizes a hypothetical stress scenario related to the eff ect of continued low new money rates on our portfolio yields. Th e scenario assumed new money rates of 4.75 percent that remain level for fi ve years, and then grade over 5 years from this level to an ultimate new money rate ranging from 6.35 percent to 7.00 percent, depending on the specifi c product. We estimate that this scenario would result in an after-tax charge of $20 million to $50 million primarily related to an increase in future loss reserves resulting from decreased projected future investment yields on investments backing our interest-sensitive and long-term care insurance products. In addition, we estimate that this scenario would result in an approximate unfavorable after-tax investment income eff ect of $10 million to $15 million during 2013 and $25 million to $30 million during 2014. Under this hypothetical scenario, insurance liabilities reported under statutory accounting principles would also increase by up to $50 million, which would result in a reduction to our consolidated RBC ratio of approximately 10 percentage points.
Although the hypothetical revisions described in the scenarios summarized in the previous two paragraphs are not currently required or anticipated, we believe similar changes could occur based on past variances in experience and our expectations of the ranges of future experience that could reasonably occur. We have assumed that revisions to assumptions resulting in such adjustments would occur equally among policy types, ages and durations within each product classifi cation. Any actual adjustment would be dependent on the specifi c policies aff ected and, therefore, may diff er from such estimates. In addition, the impact of actual adjustments would refl ect the net eff ect of all changes in assumptions during the period.
Sustained periods of low or declining interest rates may adversely aff ect our results of operations, fi nancial position and cash fl ows.
Litigation and regulatory investigations are inherent in our business, may harm our fi nancial condition and reputation, and may negatively impact our fi nancial results.
Insurance companies historically have been subject to substantial litigation. In addition to the traditional policy claims associated with their businesses, insurance companies like ours face class action suits and derivative suits from shareholders and/or policyholders. We also face signifi cant risks related to regulatory investigations and proceedings. Th e litigation and regulatory matters we are, have been, or may become, subject to include matters related to sales, marketing and underwriting practices, payment of contingent or other sales commissions, claim payments and procedures, product design, product disclosure, administration, additional premium charges for premiums paid on a periodic basis, calculation of cost of insurance charges, changes to certain non-guaranteed policy features, denial or delay of benefi ts, charging excessive or impermissible fees on
products and recommending unsuitable products to customers. Certain of our insurance policies allow or require us to make changes based on experience to certain non-guaranteed elements (“NGEs”) such as cost of insurance charges, expense loads, credited interest rates and policyholder bonuses. We intend to make changes to certain NGEs in the future. In some instances in the past, such action has resulted in litigation and similar litigation may arise in the future. Our exposure (including the potential adverse fi nancial consequences of delays or decisions not to pursue changes to certain NGEs), if any, arising from any such action cannot presently be determined. Our pending legal and regulatory proceedings include matters that are specifi c to us, as well as matters faced by other insurance companies. State insurance departments have focused and continue to focus on sales, marketing and claims payment practices and product issues in their market conduct examinations. Negotiated settlements of class action and other lawsuits have had a material adverse eff ect on the business, fi nancial condition and results of operations of our insurance subsidiaries. We are, in the ordinary course of our business, a plaintiff or defendant in actions arising out of our insurance business, including class actions and reinsurance disputes, and, from time to time, we are also involved in various governmental and administrative proceedings and investigations and inquiries such as information requests, subpoenas and books and record examinations, from state, federal and other authorities. Recently, we and other insurance companies have been the subject of regulatory examinations regarding compliance with state unclaimed property laws. Such examinations have included inquiries related to the use of data available on the U.S. Social Security Administration’s Death Master File to identify instances where benefi ts under life insurance policies, annuities and retained asset accounts are payable. It is possible that such examination or other regulatory inquiries may result in payments to benefi ciaries, escheatment of funds deemed abandoned under state laws and changes to procedures for the identifi cation and escheatment of abandoned property. See the note to the consolidated fi nancial statements entitled “Litigation and Other Legal Proceedings.” Th e ultimate outcome of these lawsuits, regulatory proceedings and investigations cannot be predicted with certainty. In the event of an unfavorable outcome in one or more of these matters, the ultimate liability may be in excess of liabilities we have established and could have a material adverse eff ect on our business, fi nancial condition, results of operations or cash fl ows. We could also suff er signifi cant reputational harm as a result of such litigation, regulatory proceedings or investigations, including harm fl owing from actual or threatened revocation of licenses to do business, regulator actions to assert supervision or control over our business, and other sanctions which could have a material adverse eff ect on our business, fi nancial condition, results of operations or cash fl ows.
If our subsidiary, Conseco Life, is unable to implement anticipated changes to certain NGEs, the reserves on our interest-sensitive life insurance blocks may prove to be inadequate, requiring us to increase liabilities which may have a material adverse eff ect on our results of operations and our fi nancial condition and on the results of operations and fi nancial condition of Conseco Life.
In establishing the net liabilities for our interest-sensitive life insurance products, we make estimates and assumptions using management’s best judgments. Th ese estimates and assumptions include mortality, lapse rates, investment experience and expense levels including charges to policyholders which, under some of our policies, we are allowed or required to make based on experience to certain NGEs such as

CNO FINANCIAL GROUP, INC. - Form 10-K 34
PART I ITEM 1A Risk Factors
cost of insurance charges, expense loads, credited interest rates and policyholder bonuses. If our estimates and assumptions are incorrect and our reserves prove to be insuffi cient to cover amounts payable under these policies, we would be required to increase our liabilities, and our fi nancial results would be adversely aff ected.
A substantial block of our interest-sensitive life insurance policies was issued by Conseco Life and its predecessors. Th ese policies are included in our Other CNO Business segment. After Conseco Life notifi ed holders in late 2008 of changes to cer tain NGEs of their Lifetrend and CIUL3+ interest-sensitive life insurance policies, several state insurance departments began a market conduct examination. After working with state insurance regulators to review the terms of the Lifetrend and CIUL3+ policies, Conseco Life entered into a regulatory settlement agreement with the regulators regarding issues involving these policies, which was eff ective in June 2010. In addition to the market conduct examination which resulted in the regulatory settlement agreement, Conseco Life has been the defendant in litigation involving NGE changes. See the note to the consolidated fi nancial statements entitled “Litigation and Other Legal Proceedings - Cost of Insurance Litigation”. Conseco Life intends to make additional changes to certain NGEs in the future, and such changes may result in similar litigation. Adverse decisions in, or a negotiated resolution of, any such litigation, delays in the implementation of changes to certain NGEs, or any other events which limit Conseco Life’s ability to implement changes to certain NGEs could have a material adverse eff ect on our results of operations and our fi nancial condition and on the results of operations and fi nancial condition of Conseco Life.
We have substantial indebtedness that will require a signifi cant portion of the cash available to CNO, which may restrict our ability to take advantage of business, strategic or fi nancing opportunities.
As of December 31, 2012, we had an aggregate principal amount of indebtedness of $1,012.6 million. CNO’s indebtedness will require $110 million in cash to service in 2013. Th e payment of principal and interest on our outstanding indebtedness will require a substantial portion of CNO’s available cash each year, which, as a holding company, is limited, as further described in the risk factor entitled “CNO is a holding company and its liquidity and ability to meet its obligations may be constrained by the ability of CNO’s insurance subsidiaries to distribute cash to it” below. Our debt obligations may restrict our ability to take advantage of business, strategic or fi nancing opportunities. See “Management’s Discussion and Analysis of Financial Condition and Results of Operations-Liquidity of the Holding Companies” for more information.
On September 28, 2012, the Company entered into a new senior secured credit agreement, providing for: (i) a $425.0 million six-year term loan facility; (ii) a $250.0 million four-year term loan facility; and (iii) a $50.0 million three-year revolving credit facility, with JPMorgan Chase Bank, N.A., as administrative agent (the “Agent”), and the lenders from time to time party thereto (the “New Senior Secured Credit Agreement”). On September 28, 2012, we also issued $275.0 million in aggregate principal amount of 6.375% Senior Secured Notes due October 2020 (the “6.375% Notes”) pursuant to an indenture, dated as of September 28, 2012 (the “6.375% Indenture”), among the Company, the subsidiary guarantors party thereto (the “Subsidiary Guarantors”) and Wilmington Trust, National Association, as trustee
(the “Trustee”) and as collateral agent (the “Collateral Agent”). Th e New Senior Secured Credit Agreement contains various restrictive covenants and required fi nancial ratios that we will be required to meet or maintain and that will limit our operating fl exibility. If we default under any of these covenants, the lenders could declare the outstanding principal amount of the term loan, accrued and unpaid interest and all other amounts owing or payable thereunder to be immediately due and payable, which would have material adverse consequences to us. In such event, the holders of the 7.0% Convertible Senior Debentures due 2016 (the “7.0% Debentures”) and the 6.375% Notes could elect to take similar action with respect to those debts. If that were to occur, we would not have suffi cient liquidity to repay our indebtedness.
If we fail to pay interest or principal on our other indebtedness, including the 7.0% Debentures or the 6.375% Notes, we will be in default under the indentures governing such indebtedness, which could also lead to a default under agreements governing our existing and future indebtedness, including under the New Senior Secured Credit Agreement. If the repayment of the related indebtedness were to be accelerated after any applicable notice or grace periods, we likely would not have suffi cient funds to repay our indebtedness.
Absent suffi cient liquidity to repay our indebtedness, our management or our independent registered public accounting fi rm may conclude that there is substantial doubt regarding our ability to continue as a going concern.
Th e New Senior Secured Credit Agreement and the 6.375% Notes contain various restrictive covenants and required fi nancial ratios that limit our operating fl exibility. Th e violation of one or more loan covenant requirements will entitle our lenders to declare all outstanding amounts under the New Senior Secured Credit Agreement and the 6.375% Notes to be due and payable.
Pursuant to the New Senior Secured Credit Agreement, CNO agreed to a number of covenants and other provisions that restrict the Company’s ability to borrow money and pursue some operating activities without the prior consent of the lenders. We also agreed to meet or maintain various fi nancial ratios and balances. Our ability to meet these fi nancial tests or maintain ratings may be aff ected by events beyond our control. Th ere are several conditions or circumstances that could lead to an event of default under the New Senior Secured Credit Agreement, as described below.
Th e New Senior Secured Credit Agreement prohibits or restricts, among other things, CNO’s ability to:
• incur or guarantee additional indebtedness (including, for this purpose, reimbursement obligations under letters of credit, except to the extent such reimbursement obligations relate to letters of credit issued in connection with reinsurance transactions entered into in the ordinary course of business) or issue preferred stock; • pay dividends or make other distributions to shareholders; • purchase or redeem capital stock or subordinated indebtedness; • make certain investments; • create liens; • incur restrictions on CNO’s ability and the ability of CNO’s subsidiaries to pay dividends or make other payments to CNO;

CNO FINANCIAL GROUP, INC. - Form 10-K 35
PART I ITEM 1A Risk Factors
• sell assets, including capital stock of CNO’s subsidiaries; • enter into sale and leaseback transactions; • consolidate or merge with or into other companies or transfer all or substantially all of our assets; and • engage in transactions with affi liates;
in each case subject to important exceptions and qualifi cations as set forth in the New Senior Secured Credit Agreement.
Mandatory prepayments of the New Senior Secured Credit Agreement will be required, subject to certain exceptions, in an amount equal to: (i) 100% of the net cash proceeds from certain asset sales or casualty events; (ii) 100% of the net cash proceeds received by the Company or any of its restricted subsidiaries from certain debt issuances; and (iii) 100% of the amount of certain restricted payments made (including any common stock dividends and share repurchases) as defi ned in the New Senior Secured Credit Agreement provided that if, as of the end of the fi scal quarter immediately preceding such restricted payment, the debt to total capitalization ratio is: (x) equal to or less than 22.5%, but greater than 17.5%, the prepayment requirement shall be reduced to 33.33%; or (y) equal to or less than 17.5%, the prepayment requirement shall not apply.
Notwithstanding the foregoing, no mandatory prepayments pursuant to item (i) in the preceding paragraph shall be required if: (x) the debt to total capitalization ratio is equal or less than 20% and (y) either (A) the fi nancial strength rating of certain of the Company’s insurance subsidiaries is equal or better than A- (stable) from A.M. Best or (B) the New Senior Secured Credit Agreement is rated equal or better than BBB- (stable) from S&P and Baa3 (stable) by Moody’s.
In addition, the New Senior Secured Credit Agreement requires the Company to maintain (each as calculated in accordance with the New Senior Secured Credit Agreement): (i) a debt to total capitalization ratio of not more than 27.5 percent (such ratio was 20.9 percent at December 31, 2012); (ii) an interest coverage ratio of not less than 2.50 to 1.00 for each rolling four quarters (or, if less, the number of full fi scal quarters commencing after the eff ective date of the New Senior Secured Credit Agreement) (such ratio was 8.08 for the period ended December 31, 2012); (iii) an aggregate ratio of total adjusted capital to company action level risk-based capital for the Company’s insurance subsidiaries of not less than 250 percent (such ratio was 367 percent at December 31, 2012); and (iv) a combined statutory capital and surplus for the Company’s insurance subsidiaries of at least $1,300.0 million (combined statutory capital and surplus at December 31, 2012, was $1,782.6 million).
Th ese covenants place signifi cant restrictions on the manner in which we may operate our business and our ability to meet these fi nancial covenants may be aff ected by events beyond our control. If we default under any of these covenants, the lenders could declare the outstanding principal amount of the term loan, accrued and unpaid interest and all other amounts owing and payable thereunder to be immediately due and payable, which would have material adverse consequences to us. If the lenders under the New Senior Secured Credit Agreement elect to accelerate the amounts due, the holders of CNO’s 7.0% Debentures and 6.375% Notes could elect to take similar action with respect to those debts. If that were to occur, we would not have suffi cient liquidity to repay our indebtedness.
We are required to assess our ability to continue as a going concern as part of our preparation of fi nancial statements at each quarter-end. Th e assessment includes, among other things, consideration of our plans to address our liquidity and capital needs during the following twelve months and our ability to comply with the future loan covenant and fi nancial ratio requirements under the New Senior Secured Credit Agreement. If we default under any covenants or fi nancial ratio requirement, the lenders could declare the outstanding principal amount of the term loan, accrued and unpaid interest and all other amounts owing and payable thereunder to be immediately due and payable. In such event, the holders of CNO’s 7.0% Debentures and 6.375% Notes could elect to take similar action with respect to those debts. If that were to occur, we would not have suffi cient liquidity to repay our indebtedness. Absent suffi cient liquidity to repay our indebtedness, we or our auditors may conclude that there is substantial doubt regarding our ability to continue as a going concern. If we were to conclude there was substantial doubt regarding our ability to continue as a going concern in our fi nancial statements for subsequent periods, we may be required to increase the valuation allowance for deferred tax assets, which could result in the violation of one or more loan covenant requirements under the New Senior Secured Credit Agreement.
If in future periods we are not able to demonstrate that we will be in compliance with the fi nancial covenant requirements in the New Senior Secured Credit Agreement for at least 12 months following the date of the fi nancial statements, management would conclude there is substantial doubt about our ability to continue as a going concern and the audit opinion that we would receive from our independent registered public accounting fi rm would include an explanatory paragraph regarding our ability to continue as a going concern. Such an opinion would cause us to be in breach of the covenants in the New Senior Secured Credit Agreement. If the circumstances leading to the substantial doubt were not cured prior to the issuance of the audit opinion, or we were unable to obtain a waiver on the going concern opinion requirement within 30 days after notice from the lenders, the issuance of such an opinion would be an ev ent of default entitling the lenders to declare the outstanding principal amount of term loans, accrued and unpaid interest and all other amounts due and payable thereunder to be due and payable. If an event of default were to occur, it is highly probable that we would not have suffi cient liquidity to repay our bank indebtedness in full or any of our other indebtedness which could also be accelerated as a result of the default.
Th e 6.375% Indenture contains covenants that, among other things, limit (subject to certain exceptions) the Company’s ability and the ability of the Company’s Restricted Subsidiaries (as defi ned in the 6.375% Indenture) to:
• incur or guarantee additional indebtedness or issue preferred stock; • pay dividends or make other distributions to shareholders; • purchase or redeem capital stock or subordinated indebtedness; • make investments; • create liens; • incur restrictions on the Company’s ability and the ability of its Restricted Subsidiaries to pay dividends or make other payments to the Company; • sell assets, including capital stock of the Company’s subsidiaries; • consolidate or merge with or into other companies or transfer all or substantially all of the Company’s assets; and • engage in transactions with affi liates.

CNO FINANCIAL GROUP, INC. - Form 10-K 36
PART I ITEM 1A Risk Factors
Th e 6.375% Indenture provides for customary events of default (subject in certain cases to customary grace and cure periods), which include nonpayment, breach of covenants in the 6.375% Indenture, failure to pay at maturity or acceleration of other indebtedness, a failure to pay certain judgments and certain events of bankruptcy and insolvency. Generally, if an event of default occurs, the Trustee or holders of at least 25% in principal amount of the then outstanding 6.375% Notes may declare the principal of and accrued but unpaid interest, including any additional interest, on all of the 6.375% Notes to be due and payable.
Under the 6.375% Indenture, the Company can make Restricted Payments (as such term is defi ned in the 6.375% Indenture) up to a calculated limit, provided that the Company’s pro forma risk-based capital ratio exceeds 225% after giving eff ect to the Restricted Payment and certain other conditions are met. Restricted Payments include, among other items, repurchases of common stock and cash dividends on common stock (to the extent such dividends exceed $30 million in the aggregate in any calendar year). Th e limit of Restricted Payments permitted under the 6.375% Indenture is the sum of (x) 50% of the Company’s “Net Excess Cash Flow” (as defi ned in the 6.375% Indenture) for the period (taken as one accounting period) from July 1, 2012 to the end of the Company’s most recently ended fi scal quarter for which fi nancial statements are available at the time of such Restricted Payment, (y) $175.0 million and (z) certain other amounts specifi ed in the 6.375% Indenture. Based on the provisions set forth in the 6.375% Indenture and the Company’s Net Excess Cash Flow for the period from July 1, 2012 through December 31, 2012, the Company could have made additional Restricted Payments under this 6.375% Indenture covenant of approximately $212 million as of December 31, 2012. Th is limitation on Restricted Payments does not apply if the Debt to Total Capitalization Ratio (as defi ned in the 6.375% Indenture) as of the last day of the Company’s most recently ended fi scal quarter for which fi nancial statements are available that immediately precedes the date of any Restricted Payment, calculated immediately after giving eff ect to such Restricted Payment and any related transactions on a pro forma basis, is equal to or less than 17.5%.
Th e obligations under the New Senior Secured Credit Agreement and the 6.375% Notes are guaranteed by our current and future restricted domestic subsidiaries, other than our insurance subsidiaries and certain immaterial subsidiaries. Th e guarantee of CDOC, Inc. (“CDOC”) (our wholly owned subsidiary and a guarantor under the 6.375% Notes and the New Senior Secured Credit Agreement) is secured by a lien on substantially all of the assets of the Subsidiary Guarantors, including the stock of Conseco Life Insurance Company of Texas (“Conseco Life of Texas”) (which is the parent of Bankers Life, Bankers Conseco Life Insurance Company (“Bankers Conseco Life”) and Colonial Penn), Washington National and Conseco Life. If we fail to make the required payments, do not meet the fi nancial covenants or otherwise default on the terms of the New Senior Secured Credit Agreement or the 6.375% Notes, the stock of Conseco Life of Texas, Washington National and Conseco Life could be transferred to the lenders (subject to regulatory approval) under the New Senior Secured Credit Agreement and the holders of the 6.375% Notes. Any such transfer would have a material adverse eff ect on our business, fi nancial condition and results of operations.
Our current credit ratings may adversely aff ect our ability to access capital and the cost of such capital, which could have a material adverse eff ect on our fi nancial condition and results of operations.
On September 5, 2012, S&P assigned a “B+” rating to our New Senior Secured Credit Agreement and 6.375% Notes. In S&P’s view, an obligation rated “B” is more vulnerable to nonpayment than obligations rated “BB”, but the obligor currently has the capacity to meet its fi nancial commitment on the obligation. Adverse business, fi nancial, or economic conditions will likely impair the obligor’s capacity or willingness to meet its fi nancial commitment on the obligation. S&P has a total of 22 separate categories rating senior debt, ranging from “AAA (Extremely Strong)” to “D (Payment Default).” Th ere are thirteen ratings above CNO’s “B+” rating and eight ratings that are below its rating. On September 5, 2012, Moody’s assigned a “Ba3” rating to our New Senior Secured Credit Agreement and 6.375% Notes. In Moody’s view, obligations rated “Ba” are judged to have speculative elements and are subject to substantial credit risk. Moody’s has a total of 21 separate categories in which to rate senior debt, ranging from “Aaa” to “C.” Th ere are 12 ratings above CNO’s “Ba3” rating and eight ratings that are below its rating. If we were to require additional capital, either to refi nance our existing indebtedness or for any other reason, our current senior debt ratings, as well as conditions in the credit markets generally, could restrict our access to such capital and adversely aff ect its cost. See “Management’s Discussion and Analysis of Financial Condition and Results of Operations-Liquidity of the Holding Companies” for more information.
CNO is a holding company and its liquidity and ability to meet its obligations may be constrained by the ability of CNO’s insurance subsidiaries to distribute cash to it.
CNO and CDOC are holding companies with no business operations of their own. CNO and CDOC depend on their operating subsidiaries for cash to make principal and interest payments on debt and to pay administrative expenses and income taxes. CNO and CDOC receive cash from our insurance subsidiaries, consisting of dividends and distributions, principal and interest payments on surplus debentures and tax-sharing payments, as well as cash from their non-insurance subsidiaries consisting of dividends, distributions, loans and advances. Deterioration in the fi nancial condition, earnings or cash fl ow of these signifi cant subsidiaries for any reason could hinder the ability of such subsidiaries to pay cash dividends or other disbursements to CNO and/or CDOC, which would limit our ability to meet our debt service requirements and satisfy other fi nancial obligations. In addition, CNO may elect to contribute additional capital to certain insurance subsidiaries to strengthen their surplus for covenant compliance or regulatory purposes (including, for example, maintaining adequate RBC level) or to provide the capital necessary for growth, in which case it is less likely that its insurance subsidiaries would pay dividends to the holding company. Accordingly, this could limit CNO’s ability to meet debt service requirements and satisfy other holding company fi nancial obligations. See “Management’s Discussion and Analysis of Financial Condition and Results of Operations-Liquidity of the Holding Companies” for more information.

CNO FINANCIAL GROUP, INC. - Form 10-K 37
PART I ITEM 1A Risk Factors
CNO receives dividends and other payments from CDOC and from certain non-insurance subsidiaries. CDOC receives dividends and surplus debenture interest payments from our insurance subsidiaries and payments from certain of our non-insurance subsidiaries. Payments from our non-insurance subsidiaries to CNO or CDOC, and payments from CDOC to CNO, do not require approval by any regulatory authority or other third party. However, the payment of dividends or surplus debenture interest by our insurance subsidiaries to CDOC is subject to state insurance department regulations and may be prohibited by insurance regulators if they determine that such dividends or other payments could be adverse to our policyholders or contract holders. Insurance regulations generally permit dividends to be paid from statutory earned surplus of the insurance company without regulatory approval for any 12-month period in amounts equal to the greater of (or in a few states, the lesser of ):
• statutory net gain from operations or statutory net income for the prior year, or • 10 percent of statutory capital and surplus as of the end of the preceding year.
Th is type of dividend is referred to as an “ordinary dividend”. Any dividend in excess of these levels requires the approval of the director or commissioner of the applicable state insurance department and is referred to as an “extraordinary dividend”. In 2012, our insurance subsidiaries paid extraordinary dividends of $265.0 million to CDOC. Each of the immediate insurance subsidiaries of CDOC had negative earned surplus at December 31, 2012. As a result, any dividend payments from the insurance subsidiaries to CNO will be considered extraordinary dividends and will require the prior approval of the director or commissioner of the applicable state insurance department. CNO expects to receive regulatory approval for future dividends from our insurance subsidiaries, but there can be no assurance that such payments will be approved or that the fi nancial condition of our insurance subsidiaries will not deteriorate, making future approvals less likely.
We generally strive to maintain capital and surplus levels in our insurance subsidiaries in an amount that is suffi cient to maintain a minimum consolidated RBC ratio of approximately 350 percent and will typically seek to have our insurance subsidiaries pay ordinary dividends or request regulatory approval for extraordinary dividends when the consolidated RBC ratio exceeds such level and we have concluded the capital level in each of our insurance subsidiaries is adequate to suppor t their business and projected growth. As required by applicable insurance regulations, we calculate the RBC ratio of our insurance company subsidiaries as of December 31 of each year. In addition, for purposes of a covenant in our New Senior Secured Credit Agreement, we calculate the consolidated RBC ratio of our insurance company subsidiaries quarterly by dividing our consolidated TAC (the sum of the TAC of Washington National, Conseco Life, Conseco Life of Texas, Bankers Life, Colonial Penn and Bankers Conseco Life minus the equity in the TAC of Bankers Life, Colonial Penn and Bankers Conseco Life (the subsidiaries of Conseco Life of Texas) included in the TAC of Conseco Life of Texas) by our consolidated RBC (the RBC calculated for all of our insurance company subsidiaries based on an aggregation of our insurance company subsidiaries’ data on a pro forma basis, as if they were one entity). Th e consolidated RBC ratio of our insurance
company subsidiaries was 367 percent at December 31, 2012. See the risk factor above entitled “Th e New Senior Secured Credit Agreement and the 6.375% Notes contain various restrictive covenants and required fi nancial ratios that limit our operating fl exibility. Th e violation of one or more loan covenant requirements will entitle our lenders to declare all outstanding amounts under the New Senior Secured Credit Agreement and the 6.375% Notes to be due and payable”.
CDOC holds surplus debentures issued by Conseco Life of Texas in the aggregate principal amount of $749.6 million. Interest payments on those surplus debentures do not require additional approval provided the RBC ratio of Conseco Life of Texas exceeds 100 percent (but do require prior written notice to the Texas state insurance department). Th e RBC ratio of Conseco Life of Texas was 305 percent at December 31, 2012. CDOC also holds a surplus debenture from Colonial Penn with an outstanding principal balance of $160.0 million. Interest payments on the Colonial Penn surplus debenture require prior approval by the Pennsylvania state insurance department. Dividends and other payments from our non-insurance subsidiaries, including 40|86 Advisors and CNO Services, LLC, to CNO or CDOC do not require approval by any regulatory authority or other third party. However, insurance regulators may prohibit payments by our insurance subsidiaries to parent companies if they determine that such payments could be adverse to our policyholders or contractholders.
In addition, although we are under no obligation to do so, we may elect to contribute additional capital to strengthen the surplus of certain insurance subsidiaries for covenant compliance or regulatory purposes or to provide the capital necessary for growth. Any election regarding the contribution of additional capital to our insurance subsidiaries could aff ect the ability of our top tier insurance subsidiaries to pay dividends. Th e ability of our insurance subsidiaries to pay dividends is also impacted by various criteria established by rating agencies to maintain or receive higher fi nancial strength ratings and by the capital levels that we target for our insurance subsidiaries, as well as RBC and statutory capital and surplus compliance requirements under the New Senior Secured Credit Agreement.
In addition, Washington National may not distribute funds to any affi liate or shareholder, without prior notice to the Florida Offi ce of Insurance Regulation, in accordance with an order from the Florida Offi ce of Insurance Regulation.
Th ere are risks to our business associated with the current economic environment.
From 2008 to 2010, the U.S. economy experienced unusually severe credit and liquidity issues and underwent a recession. Following several years of rapid credit expansion, a contraction in mortgage lending coupled with substantial declines in home prices and rising mortgage defaults, resulted in signifi cant write-downs of asset values by fi nancial institutions, including government-sponsored entities and major commercial and investment banks. Th ese write-downs, initially of mortgage-backed securities but spreading to many sectors of the related credit markets, and to related credit default swaps and other derivative securities, caused many fi nancial institutions to seek additional capital, to merge with larger and stronger institutions, to

CNO FINANCIAL GROUP, INC. - Form 10-K 38
PART I ITEM 1A Risk Factors
be subsidized by the U.S. government or, in some cases, to fail. Th ese factors, combined with declining business and consumer confi dence and increased unemployment, precipitated an economic slowdown. Although the recession may have ended, elevated unemployment remains.
Even under more favorable market conditions, general factors such as the availability of credit, consumer spending, business investment, capital market conditions and infl ation aff ect our business. For example, in an economic downturn, higher unemployment, lower family income, lower corporate earnings, lower business investment and lower consumer spending may depress the demand for life insurance, annuities and other insurance products. In addition, this type of economic environment may result in higher lapses or surrenders of policies. Accordingly, the risks we face related to general economic and business conditions are more pronounced given the severity and magnitude of the recent adverse economic and market conditions.
More specifi cally, our business is exposed to the performance of the debt and equity markets. Adverse market conditions can aff ect the liquidity and value of our investments. Th e manner in which debt and equity market performance and changes in interest rates have aff ected, and will continue to aff ect, our business, fi nancial condition, growth and profi tability include, but are not limited to, the following:
• Th e value of our investment portfolio has been materially aff ected in recent periods by changes in market conditions which resulted in, and may continue to result in, substantial realized and/or unrealized losses. For example, in 2008, the value of our investments decreased by $2.5 billion due to net unrealized losses on investments. Certain types of securities in our investment portfolio, such as structured securities supported by residential and commercial mortgages, were disproportionately aff ected. Although the value of our investments increased on an aggregate basis in the past three years, future adverse capital market conditions could result in additional realized and/or unrealized losses. • Changes in interest rates also aff ect our investment portfolio. In periods of increasing interest rates, life insurance policy loans, surrenders and withdrawals could increase as policyholders seek higher returns. Th is could require us to sell invested assets at a time when their prices may be depressed by the increase in interest rates, which could cause us to realize investment losses. Conversely, during periods of declining interest rates, we could experience increased premium payments on products with fl exible premium features, repayment of policy loans and increased percentages of policies remaining inforce. We could obtain lower returns on investments made with these cash fl ows. In addition, prepayment rates on investments may increase so that we might have to reinvest those proceeds in lower-yielding investments. As a consequence of these factors, we could experience a decrease in the spread between the returns on our investment portfolio and amounts to be credited to policyholders and contractholders, which could adversely aff ect our profi tability. • Th e attractiveness of certain of our insurance products may decrease because they are linked to the equity markets and assessments of our fi nancial strength, resulting in lower profi ts. Increasing consumer concerns about the returns and features of our insurance products or our fi nancial strength may cause existing customers to surrender policies or withdraw assets, and diminish our ability to sell policies and attract assets from new and existing customers, which would result in lower sales and fee revenues.
Our investment portfolio is subject to several risks that may diminish the value of our invested assets and negatively impact our profi tability, our fi nancial condition, our liquidity and our ability to continue to comply with the fi nancial covenants under the New Senior Secured Credit Agreement.
Th e value of our investment portfolio is subject to numerous factors, which may be diffi cult to predict, and are often beyond our control. Th ese factors include, but are not limited to, the following:
• changes in interest rates and credit spreads, which can reduce the value of our investments as further discussed in the risk factor below entitled “Changing interest rates may adversely aff ect our results of operations”; • changes in patterns of relative liquidity in the capital markets for various asset classes; • changes in the ability of issuers to make timely repayments, which can reduce the value of our investments. Th is risk is signifi cantly greater with respect to below-investment grade securities, which comprised 11 percent of the cost basis of our available for sale fi xed maturity investments as of December 31, 2012; and • changes in the estimated timing of receipt of cash fl ows. For example, our structured security investments, which comprised 23 percent of our available for sale fi xed maturity investments at December 31, 2012, are subject to risks relating to variable prepayment on the assets underlying such securities, such as mortgage loans. When structured securities prepay faster than expected, investment income may be adversely aff ected due to the acceleration of the amortization of purchase premiums or the inability to reinvest at comparable yields in lower interest rate environments.
We have recorded writedowns of fi xed maturity investments, equity securities and other invested assets as a result of conditions which caused us to conclude a decline in the fair value of the investment was other than temporary as follows: $37.8 million in 2012; $34.6 million in 2011 ($39.9 million, prior to the $5.3 million of impairment losses recognized through accumulated other comprehensive income (loss)); and $149.8 million in 2010 ($146.8 million, prior to the $(3.0) million of impairment losses recognized through accumulated other comprehensive income (loss)). Our investment portfolio is subject to the risks of further declines in realizable value. However, we attempt to mitigate this risk through the diversifi cation and active management of our portfolio.
In the event of substantial product surrenders or policy claims, we may be required to sell assets at a loss, thereby eroding the performance of our portfolio.
Because a substantial portion of our operating results are derived from returns on our investment portfolio, signifi cant losses in the portfolio may have a direct and materially adverse impact on our results of operations. In addition, losses on our investment portfolio could reduce the investment returns that we are able to credit to our customers of certain products, thereby impacting our sales and eroding our fi nancial performance. Investment losses may also reduce the capital of our insurance subsidiaries, which may cause us to make additional capital contributions to those subsidiaries or may limit the ability of the insurance subsidiaries to make dividend payments to CNO. In addition, future investment losses could cause us to be in violation of the fi nancial covenants under the New Senior Secured Credit Agreement.

CNO FINANCIAL GROUP, INC. - Form 10-K 39
PART I ITEM 1A Risk Factors
Deteriorating fi nancial performance of securities collateralized by mortgage loans and commercial mortgage loans may lead to writedowns, which could have a material adverse eff ect on our results of operations and fi nancial condition.
Changes in mortgage delinquency or recovery rates, declining real estate prices, challenges to the validity of foreclosures and the quality of service provided by service providers on securities in our portfolios could lead us to determine that writedowns are appropriate in the future.
Th e determination of the amount of realized investment losses recorded as impairments of our investments is highly subjective and could have a material adverse eff ect on our operating results and fi nancial condition.
Th e determination of realized investment losses recorded as impairments is based upon our ongoing evaluation and assessment of known risks. We consider a wide range of factors about the issuer and use our best judgment in evaluating the cause of a decline in estimated fair value and in assessing prospects for recovery. Inherent in our evaluation are assumptions and estimates about the operations of the issuer and its future earnings potential. Such evaluations and assessments are revised as conditions change and new information becomes available. We update our evaluations regularly and refl ect losses from impairments in operating results as such evaluations are revised. Our assessment of whether unrealized losses are other-than-temporary impairments requires signifi cant judgment and future events may occur, or additional information may become available, which may necessitate future impairments of securities in our portfolio. Historical trends may not be indicative of future other-than- temporary impairments. For example, the cost of our fi xed maturity and equity securities is adjusted for impairments in value deemed to be other than temporary in the period in which the determination is made. Th e assessment of whether impairments have occurred is based on our case-by-case evaluation of the underlying reasons for the decline in fair value.
Th e determination of fair value of our fi xed maturity securities results in unrealized investment gains and losses and is highly subjective and could materially impact our operating results and fi nancial condition.
In determining fair value, we generally utilize market transaction data for the same or similar instruments. Th e degree of management judgment involved in determining fair values is inversely related to the availability of market observable information. Since signifi cant observable market inputs are not available for certain securities, it may be diffi cult to value them. Th e fair value of fi nancial assets and fi nancial liabilities may diff er from the amount actually received to sell an asset or the amount paid to transfer a liability in an orderly transaction between market participants at the measurement date. Moreover, the use of diff erent valuation assumptions may have a material eff ect on the fair values of the fi nancial assets and fi nancial liabilities. As of December 31, 2012 and 2011, our total unrealized net investment gains before adjustments for insurance intangibles and deferred income taxes were $3.0 billion and $1.7 billion, respectively.
Th e limited historical claims experience on our long-term care products could negatively impact our operations if our estimates prove wrong and we have not adequately set premium rates.
In setting premium rates, we consider historical claims information and other factors, but we cannot predict future claims with certainty. Th is is particularly applicable to our long-term care insurance products, for which we (as well as other companies selling these products) have relatively limited historical claims experience. Long-term care products tend to have fewer claims than other health products such as Medicare supplement products, but when claims are incurred, they tend to be much higher in dollar amount and longer in duration. Also, long-term care claims are incurred much later in the life of the policy than most other supplemental health products. As a result of these traits, it is diffi cult to appropriately price this product. For our long-term care insurance, actual persistency in later policy durations that is higher than our persistency assumptions could have a negative impact on profi tability. If these policies remain inforce longer than we assumed, then we could be required to make greater benefi t payments than anticipated when the products were priced. Mortality is a critical factor infl uencing the length of time a claimant receives long-term care benefi ts. Mortality continues to improve for the general population, and life expectancy has increased. Improvements in actual mortality trends relative to assumptions may adversely aff ect our profi tability.
Our Bankers Life segment has off ered long-term care insurance since 1985. In recent years, the claims experience on some of Bankers Life long-term care blocks has generally been higher than our pricing expectations and the persistency of these policies has been higher than our pricing expectations, which may result in higher benefi t ratios in the future and adversely aff ect our profi tability.
On November 12, 2008, CNO and CDOC completed the transfer of the stock of Senior Health Insurance Company of Pennsylvania (“Senior Health”) to Senior Health Care Oversight Trust, an independent trust (the “Independent Trust”). After the transfer, we continue to hold long-term care business acquired through previous acquisitions in our Other CNO Business segment. Th e premiums collected from this block totaled $25.1 million in 2012. Th e experience on this acquired block has generally been worse than the acquired companies’ original pricing expectations. We have received regulatory approvals for numerous premium rate increases in recent years pertaining to these blocks. Even with these rate increases, this block experienced benefi t ratios of 247.0 percent in 2012, 226.4 percent in 2011 and 210.8 percent in 2010. If future claims experience continues to be worse than anticipated as our long-term care blocks continue to age, our fi nancial results will be adversely aff ected.
Th e occurrence of natural or man-made disasters or a pandemic could adversely aff ect our fi nancial condition and results of operations.
We are exposed to various risks arising out of natural disasters, including earthquakes, hurricanes, fl oods and tornadoes, and man-made disasters, including acts of terrorism and military actions and pandemics. For example, a natural or man-made disaster or a pandemic could lead to unexpected changes in persistency rates as policyholders and contractholders who are aff ected by the disaster may be unable to meet their contractual obligations, such as payment of premiums on our insurance policies and deposits into our investment products. In

CNO FINANCIAL GROUP, INC. - Form 10-K 40
PART I ITEM 1A Risk Factors
addition, such a disaster or pandemic could also signifi cantly increase our mortality and morbidity experience above the assumptions we used in pricing our products. Th e continued threat of terrorism and ongoing military actions may cause signifi cant volatility in global fi nancial markets, and a natural or man-made disaster or a pandemic could trigger an economic downturn in the areas directly or indirectly aff ected by the disaster or pandemic. Th ese consequences could, among other things, result in a decline in business and increased claims from those areas. Disasters or a pandemic also could disrupt public and private infrastructure, including communications and fi nancial services, which could disrupt our normal business operations.
A natural or man-made disaster or a pandemic could also disrupt the operations of our counterparties or result in increased prices for the products and services they provide to us. For example, a natural or man-made disaster or a pandemic could lead to increased reinsurance prices and potentially cause us to retain more risk than we otherwise would retain if we were able to obtain reinsurance at lower prices. In addition, a disaster or a pandemic could adversely aff ect the value of the assets in our investment portfolio if it aff ects companies’ ability to pay principal or interest on their securities.
Interruption in telecommunication, information technology and other operational systems, or a failure to maintain the security, confi dentiality or privacy of sensitive data residing on such systems, could harm our business.
We depend heavily on our telecommunication, information technology and other operational systems and on the integrity and timeliness of data we use to run our businesses and service our customers. Th ese systems may fail to operate properly or become disabled as a result of events or circumstances which may be wholly or partly beyond our control. Further, we face the risk of operational and technology failures by others, including fi nancial intermediaries, vendors and parties that provide services to us. If these parties do not perform as anticipated, we may experience operational diffi culties, increased costs and other adverse eff ects on our business. Despite our implementation of a variety of security measures, our information technology and other systems could be subject to physical or electronic break-ins, unauthorized tampering or other security breaches, resulting in a failure to maintain the security, confi dentiality or privacy of sensitive data, including personal information relating to customers. Interruption in telecommunication, information technology and other operational systems, or a failure to maintain the security, confi dentiality or privacy of sensitive data residing on such systems, whether due to actions by us or others, could delay or disrupt our ability to do business and service our customers, harm our reputation, subject us to litigation, regulatory sanctions and other claims, require us to incur signifi cant expenses, lead to a loss of customers and revenues and otherwise adversely aff ect our business.
Th e results of operations of our insurance business will decline if our premium rates are not adequate or if we are unable to increase rates.
We set the premium rates on our health insurance policies, including long-term care policies and certain life insurance policies, based on facts and circumstances known at the time we issue the policies and on assumptions about numerous variables, including the actuarial
probability of a policyholder incurring a claim, the probable size of the claim, maintenance costs to administer the policies and the interest rate earned on our investment of premiums. In setting premium rates, we consider historical claims information, industry statistics, the rates of our competitors and other factors, but we cannot predict with certainty the future actual claims on our products. If our actual claims experience proves to be less favorable than we assumed and we are unable to raise our premium rates to the extent necessary to off set the unfavorable claims experience, our fi nancial results will be adversely aff ected.
We review the adequacy of our premium rates regularly and fi le proposed rate increases on our health insurance products when we believe existing premium rates are too low. It is possible that we will not be able to obtain approval for premium rate increases from currently pending requests or from future requests. If we are unable to raise our premium rates because we fail to obtain approval in one or more states, our fi nancial results will be adversely aff ected. Moreover, in some instances, our ability to exit unprofi table lines of business is limited by the guaranteed renewal feature of the policy. Due to this feature, we cannot exit such lines of business without regulatory approval, and accordingly, we may be required to continue to service those products at a loss for an extended period of time. Most of our long-term care business is guaranteed renewable, and, if necessary rate increases are not approved, we would be required to recognize a loss and establish a premium defi ciency reserve.
During 2012, the fi nancial statements of three of our insurance subsidiaries prepared in accordance with statutory accounting practices prescribed or permitted by regulatory authorities refl ected asset adequacy or premium defi ciency reserves. Total asset adequacy or premium defi ciency reserves for Conseco Life, Washington National and Bankers Conseco Life were $318.0 million, $87.0 million and $19.0 million, respectively, at December 31, 2012. Due to diff erences between statutory and GAAP insurance liabilities, we were not required to recognize a similar asset adequacy or premium defi ciency reserve in our consolidated fi nancial statements prepared in accordance with GAAP. Th e determination of the need for and amount of asset adequacy or premium defi ciency reserves is subject to numerous actuarial assumptions, including our ability to change NGEs related to certain products consistent with contract provisions.
If, however, we are successful in obtaining regulatory approval to raise premium rates, the increased premium rates may reduce the volume of our new sales and cause existing policyholders to allow their policies to lapse. Th is could result in a signifi cantly higher ratio of claim costs to premiums if healthier policyholders who get coverage elsewhere allow their policies to lapse, while policies of less healthy policyholders continue inforce. Th is would reduce our premium income and profi tability in future periods.
Most of our supplemental health policies allow us to increase premium rates when warranted by our actual claims experience. Th ese rate increases must be approved by the applicable state insurance departments, and we are required to submit actuarial claims data to support the need for such rate increases. Th e re-rate application and approval process on supplemental health products is a normal recurring part of our business operations and reasonable rate increases are typically approved by the state departments as long as they are supported by actual claims experience and are not unusually large in either dollar amount or percentage increase. For policy types on which rate increases are a normal recurring event, our estimates of insurance liabilities assume we will be able to raise rates if experience on the blocks warrants such increases in the future.

CNO FINANCIAL GROUP, INC. - Form 10-K 41
PART I ITEM 1A Risk Factors
As a result of higher persistency and resultant higher claims in our long-term care block in the Bankers Life segment than assumed in the original pricing, our premium rates were too low. Accordingly, we have been seeking approval from regulatory authorities for rate increases on portions of this business. Many of the rate increases have been approved by regulators and implemented, but it has become increasingly diffi cult to receive regulatory approval for the premium rate increases we have sought. If we are unable to obtain pending or future rate increases, the profi tability of these policies and the performance of this block of business will be adversely aff ected. In addition, such rate increases may reduce the volume of our new sales and cause existing policyholders to allow their policies to lapse, resulting in reduced profi tability.
We have implemented and will continue to implement from time to time and when actuarially justifi ed, premium rate increases in our long-term care business. In some cases, we off er policyholders the opportunity to reduce their coverage amounts or accept non-forfeiture benefi ts as alternatives to increasing their premium rates. Th e fi nancial impact of our rate increase actions could be adversely aff ected by policyholder anti-selection, meaning that policyholders who are less likely to incur claims may lapse their policies or reduce their benefi ts, while policyholders who are more likely to incur claims may maintain full coverage and accept their rate increase.
We identifi ed a material weakness in our internal control over fi nancial reporting which has been remediated, and our business may be adversely aff ected if we fail to maintain eff ective controls over fi nancial reporting.
We have previously identifi ed material weaknesses in internal controls, including one identifi ed at September 30, 2012 related to the accurate calculation of certain adjustments impacting other comprehensive income. Specifi cally, controls in place to ensure the accurate calculation of these adjustments did not operate eff ectively. We have emphasized the importance of performing and reviewing calculations consistent with the design of our internal control structure in an eff ort to ensure controls operate eff ectively. Th e Company has completed its testing of controls over the calculation of these adjustments and concluded that the material weakness identifi ed at September 30, 2012 has been remediated as of December 31, 2012.
We face the risk that, notwithstanding our eff orts to date to identify and remedy the material weakness in our internal control over fi nancial reporting, we may discover other material weaknesses in the future and the cost of remediating the material weakness could be high and could have a material adverse eff ect on our fi nancial condition and results of operations.
Our ability to use our existing NOLs may be limited by certain transactions, and an impairment of existing NOLs could result in a signifi cant writedown in the value of our deferred tax assets, which could cause us to breach the debt to total capitalization covenant of the New Senior Secured Credit Agreement.
As of December 31, 2012, we had approximately $3.8 billion of federal tax NOLs and $.8 billion of capital loss carry-forwards, resulting in deferred tax assets of approximately $1.6 billion, expiring in years 2013 through 2032. Section 382 of the Code imposes limitations on a corporation’s ability to use its NOLs when it undergoes a 50 percent
“ownership change” over a three year period. Although we underwent an ownership change in 2003 as the result of our reorganization, the timing and manner in which we will be able to utilize our NOLs is not currently limited by Section 382.
We regularly monitor ownership changes (as calculated for purposes of Section 382) based on available information and, as of December 31, 2012, our analysis indicated that we were below the 50 percent ownership change threshold that would limit our ability to utilize our NOLs. However, after the common stock issuance to Paulson & Co. Inc. (“Paulson”) and CNO’s public off ering of common stock in 2009, we were close to the 50 percent ownership change level. A future transaction or transactions and the timing of such transaction or transactions could trigger an ownership change under Section 382. Such transactions may include, but are not limited to, additional repurchases or issuances of common stock, including upon conversion of the 7.0% Debentures (including conversion pursuant to a make whole adjustment event) or exercise of the warrants sold to Paulson, or acquisitions or sales of shares of CNO’s stock by certain holders of its shares, including persons who have held, currently hold or may accumulate in the future 5 percent or more of CNO’s outstanding common stock for their own account. In January 2009, CNO’s Board of Directors adopted a Section 382 Rights Agreement designed to protect shareholder value by preserving the value of our NOLs. Th e Section 382 Rights Agreement was amended and extended by the CNO Board of Directors on December 6, 2011 and was approved by CNO’s shareholders at the 2012 annual meeting of shareholders. Th e Amended Section 382 Rights Agreement provides a strong economic disincentive for any one shareholder knowingly, and without the approval of the Board of Directors, to become an owner of more than 4.99% of the Company’s outstanding common stock (or any other interest in CNO that would be treated as “stock” under applicable Section 382 regulations) and for any owner of more than 4.99% of CNO’s outstanding common stock as of the date of the Amended Section 382 Rights Agreement to increase their ownership stake by more than 1 percent of the shares of CNO’s common stock then outstanding, and thus limits the uncertainty with regard to the potential for future ownership changes. However, despite the strong economic disincentives of the Amended Section 382 Rights Agreement, shareholders may elect to increase their ownership, including beyond the limits set by the Amended Section 382 Rights Agreement, and thus adversely aff ect CNO’s ownership shift calculations. To further protect against the possibility of triggering an ownership change under Section 382, CNO’s shareholders approved an amendment to CNO’s certifi cate of incorporation (the “Section 382 Charter Amendment”) designed to prevent certain transfers of common stock which could otherwise adversely aff ect our ability to use our NOLs. See the note to the consolidated fi nancial statements entitled “Income Taxes” for further information regarding the Amended Section 382 Rights Agreement, the Section 382 Charter Amendment and CNO’s NOLs.
Additionally, based on the advice of our tax advisor, we have taken the position that the 7.0% Debentures are not treated as stock for purposes of Section 382 and do not trigger an ownership change. However, the IRS may not agree with our position. If the IRS were to succeed in challenging this position, the issuance of the 7.0% Debentures would have pushed us above the 50 percent ownership change level described above and triggered an ownership change under Section 382 when the 7.0% Debentures were issued in November 2009.
If an ownership change were to occur for purposes of Section 382, we would be required to calculate an annual limitation on the amount of our taxable income that may be off set by NOLs arising prior to such

CNO FINANCIAL GROUP, INC. - Form 10-K 42
PART I ITEM 1A Risk Factors
ownership change. Th at limitation would apply to all of our current NOLs. Th e annual limitation would be calculated based upon the fair market value of our equity at the time of such ownership change, multiplied by a federal long-term tax exempt rate (2.87 percent at December 31, 2012), and would eliminate our ability to use a substantial portion of our NOLs to off set future taxable income. Additionally, the writedown of our deferred tax assets that would occur in the event of an ownership change for purposes of Section 382 could cause us to breach the debt to total capitalization covenant in the New Senior Secured Credit Agreement.
Th e value of our deferred tax assets may be reduced to the extent our future profi ts are less than we have projected or the current corporate income tax rate is reduced, and such reductions in value may have a material adverse eff ect on our results of operations and our fi nancial condition.
As of December 31, 2012, we had net deferred tax assets of $742.6 million. Our income tax expense includes deferred income taxes arising from temporary diff erences between the fi nancial reporting and tax bases of assets and liabilities, capital loss carry-forwards and NOLs. We evaluate the realizability of our deferred tax assets and assess the need for a valuation allowance on an ongoing basis. In evaluating our deferred tax assets, we consider whether it is more likely than not that the deferred tax assets will be realized. Th e ultimate realization of our deferred tax assets depends upon generating suffi cient future taxable income during the periods in which our temporary diff erences become deductible and before our capital loss carry-forwards and NOLs expire. Our assessment of the realizability of our deferred tax assets requires signifi cant judgment. Failure to achieve our projections may result in an increase in the valuation allowance in a future period. Any future increase in the valuation allowance would result in additional income tax expense which could have a material adverse eff ect upon our earnings in the future, and reduce shareholders’ equity.
Th e value of our net deferred tax assets as of December 31, 2012 refl ects the current corporate income tax rate of approximately 35 percent. A reduction in the corporate income tax rate would cause a writedown of our deferred tax assets, which may have a material adverse eff ect on our results of operations and fi nancial condition.
From time to time we may become subject to tax audits, tax litigation or similar proceedings, and as a result we may owe additional taxes, interest and penalties, or our NOLs may be reduced, in amounts that may be material.
In determining our provisions for income taxes and our accounting for tax-related matters in general, we are required to exercise judgment. We regularly make estimates where the ultimate tax determination is uncertain. Th e fi nal determination of any tax audit, appeal of the decision of a taxing authority, tax litigation or similar proceedings may be materially diff erent from that refl ected in our fi nancial statements. Th e assessment of additional taxes, interest and penalties could be materially adverse to our current and future results of operations and fi nancial condition. See the note to the consolidated fi nancial statements entitled “Income Taxes” for further information.
Concentration of our investment portfolio in any particular sector of the economy or type of asset may have an adverse eff ect on our fi nancial position or results of operations.
Th e concentration of our investment portfolio in any particular industry, group of related industries, asset classes (such as RMBS and other asset-backed securities), or geographic area could have an adverse eff ect on our results of operations and fi nancial position. While we seek to mitigate this risk by having a broadly diversifi ed portfolio, events or developments that have a negative impact on any particular industry, group of related industries or geographic area may have an adverse eff ect on the investment portfolio to the extent that the portfolio is concentrated.
Our business is subject to extensive regulation, which limits our operating fl exibility and could result in our insurance subsidiaries being placed under regulatory control or otherwise negatively impact our fi nancial results.
Our insurance business is subject to extensive regulation and supervision in the jurisdictions in which we operate. See “Business of CNO - Governmental Regulation.” Our insurance subsidiaries are subject to state insurance laws that establish supervisory agencies. Th e regulations issued by state insurance agencies can be complex and subject to diff ering interpretations. If a state insurance regulatory agency determines that one of our insurance company subsidiaries is not in compliance with applicable regulations, the subsidiary is subject to various potential administrative remedies including, without limitation, monetary penalties, restrictions on the subsidiary’s ability to do business in that state and a return of a portion of policyholder premiums. In addition, regulatory action or investigations could cause us to suff er signifi cant reputational harm, which could have an adverse eff ect on our business, fi nancial condition and results of operations.
Our insurance subsidiaries are also subject to RBC requirements. Th ese requirements were designed to evaluate the adequacy of statutory capital and surplus in relation to investment and insurance risks associated with asset quality, mortality and morbidity, asset and liability matching and other business factors. Th e requirements are used by states as an early warning tool to discover companies that may be weakly-capitalized for the purpose of initiating regulatory action. Generally, if an insurer’s RBC ratio falls below specifi ed levels, the insurer is subject to diff erent degrees of regulatory action depending upon the magnitude of the defi ciency.
Th e 2012 statutory annual statements to be fi led with the state insurance regulators of each of our insurance subsidiaries are expected to refl ect total adjusted capital ratios in excess of the current levels which would subject any of the subsidiaries to regulatory action. However, the RBC ratio of Conseco Life, which has experienced signifi cant losses primarily related to pending legal settlements, was near the level at which it would have been required to submit a comprehensive plan to insurance regulators proposing corrective actions aimed at improving its capital position. Conseco Life’s domestic state is expected to adopt new RBC requirements which would increase the RBC level required to avoid regulatory action, eff ective December 31, 2013. If those increased requirements had been in eff ect at December 31, 2012, the RBC ratio of Conseco Life at that date would have been at a level that would require Conseco Life to submit a comprehensive plan to

CNO FINANCIAL GROUP, INC. - Form 10-K 43
PART I ITEM 1A Risk Factors
the state regulatory authority proposing corrective actions aimed at improving its capital position. No assurances can be given that capital will be contributed or otherwise made available to Conseco Life or the other insurance subsidiaries.
In addition to the RBC requirements, certain states have established minimum capital requirements for insurance companies licensed to do business in their state. Th ese regulators have the discretionary authority, in connection with the continual licensing of the Company’s insurance subsidiaries, to limit or prohibit writing new business within its jurisdiction when, in the state’s judgment, the insurance subsidiary is not maintaining adequate statutory surplus or capital or that the insurance subsidiary’s further transaction of business would be hazardous to policyholders. Th e state insurance department rules provide several standards for the regulators to use in identifying companies which may be deemed to be in hazardous fi nancial condition. One of the standards defi nes hazardous conditions as existing if an insurer’s operating loss in the last twelve months or any shorter period of time, (including, but not limited to: (A) net capital gain or loss; (B) change in nonadmitted assets; and (C) cash dividends paid to shareholders), is greater than fi fty percent of the insurer’s remaining surplus. One of the Company’s subsidiaries, Conseco Life, has reported statutory fi nancial results that indicate a surplus defi ciency under this calculation. We have been in contact with regulators in Conseco Life’s domestic state insurance department regarding this matter following the signifi cant loss Conseco Life recognized in the third quarter of 2012, primarily related to a pending legal settlement. Based on our current discussions with the state insurance regulator, we do not expect any actions to be taken against Conseco Life that would have a material adverse eff ect on the fi nancial position or results of operations of CNO. See “Management’s Discussion and Analysis of Consolidated Financial Condition and Results of Operations - Liquidity of the Holding Companies” for more information on our RBC ratios.
Our reserves for future insurance policy benefi ts and claims may prove to be inadequate, requiring us to increase liabilities which results in reduced net income and shareholders’ equity.
Liabilities for insurance products are calculated using management’s best judgments, based on our past experience and standard actuarial tables of mortality, morbidity, lapse rates, investment experience and expense levels. For our health insurance business, we establish an active life reserve, a liability for due and unpaid claims, claims in the course of settlement, incurred but not reported claims, and a reserve for the present value of amounts on incurred claims not yet due. We establish reserves based on assumptions and estimates of factors either established at the Eff ective Date for business inforce or considered when we set premium rates for business written after that date.
Many factors can aff ect these reserves and liabilities, such as economic and social conditions, infl ation, hospital and pharmaceutical costs, changes in life expectancy, regulatory actions, changes in doctrines of legal liability and extra-contractual damage awards. Th erefore, the reserves and liabilities we establish are necessarily based on estimates, assumptions, industry data and prior years’ statistics. It is possible that actual claims will materially exceed our reserves and have a material adverse eff ect on our results of operations and fi nancial condition. We have incurred signifi cant losses beyond our estimates as a result of actual claim costs and persistency of our long-term care business included in
our Bankers Life and Other CNO Business segments. Th e insurance policy benefi ts incurred for our long-term care products in our Bankers Life segment were $653.1 million, $642.6 million and $666.3 million in 2012, 2011 and 2010, respectively. Th e benefi t ratios for our long-term care products in our Bankers Life segment were 117.6 percent, 112.6 percent and 113.7 percent in 2012, 2011 and 2010, respectively. Th e benefi t ratios for our long-term care products in our Other CNO Business segment were 247.0 percent, 226.4 percent and 210.8 percent in 2012, 2011 and 2010, respectively. Th e insurance policy benefi ts incurred for our long-term care products in our Other CNO Business segment were $63.4 million, $62.7 million and $63.0 million in 2012, 2011 and 2010, respectively. Our fi nancial performance depends signifi cantly upon the extent to which our actual claims experience and future expenses are consistent with the assumptions we used in setting our reserves. If our assumptions with respect to future claims are incorrect, and our reserves prove to be insuffi cient to cover our actual losses and expenses, we would be required to increase our liabilities, and our fi nancial results could be adversely aff ected.
We may be required to accelerate the amortization of deferred acquisition costs or the present value of future profi ts or establish premium defi ciency reserves.
Deferred acquisition costs represent incremental direct costs related to the successful acquisition of new or renewal insurance contracts. Th e present value of future profi ts represents the value assigned to the right to receive future cash fl ows from contracts existing at the Eff ective Date. Th e balances of these accounts are amortized over the expected lives of the underlying insurance contracts. On an ongoing basis, we test these accounts recorded on our balance sheet to determine if these amounts are recoverable under current assumptions. In addition, we regularly review the estimates and assumptions underlying these accounts for those products for which we amortize deferred acquisition costs or the present value of future profi ts in proportion to gross profi ts or gross margins. If facts and circumstances change, these tests and reviews could lead to reduction in the balance of those accounts, and the establishment of a premium defi ciency reserve. Such results could have an adverse eff ect on the results of our operations and our fi nancial condition. See “Item 7 Management’s Discussion and Analysis of Consolidated Finance Condition and Results of Operations, Critical Accounting Policies, Present Value of Future Profi ts and Deferred Acquisition Costs.”
Our operating results will suff er if policyholder surrender levels diff er signifi cantly from our assumptions.
Surrenders of our annuities and life insurance products can result in losses and decreased revenues if surrender levels diff er signifi cantly from assumed levels. At December 31, 2012, approximately 26 percent of our total insurance liabilities, or approximately $6.5 billion, could be surrendered by the policyholder without penalty. Th e surrender charges that are imposed on our fi xed rate annuities typically decline during a penalty period, which ranges from fi ve to twelve years after the date the policy is issued. Surrender charges are eliminated after the penalty period. Surrenders and redemptions could require us to dispose of assets earlier than we had planned, possibly at a loss. Moreover, surrenders and redemptions require faster amortization of either the acquisition costs or the commissions associated with the original sale

CNO FINANCIAL GROUP, INC. - Form 10-K 44
PART I ITEM 1A Risk Factors
of a product, thus reducing our net income. We believe policyholders are generally more likely to surrender their policies if they believe the issuer is having fi nancial diffi culties, or if they are able to reinvest the policy’s value at a higher rate of return in an alternative insurance or investment product.
Changing interest rates may adversely aff ect our results of operations.
Our profi tability is aff ected by fl uctuating interest rates. While we monitor the interest rate environment and employ asset/liability and hedging strategies to mitigate such impact, our fi nancial results could be adversely aff ected by changes in interest rates. Our spread-based insurance and annuity business is subject to several inherent risks arising from movements in interest rates. First, interest rate changes can cause compression of our net spread between interest earned on investments and interest credited to customer deposits. Our ability to adjust for such a compression is limited by the guaranteed minimum rates that we must credit to policyholders on certain products, as well as the terms on most of our other products that limit reductions in the crediting rates to pre-established intervals. As of December 31, 2012, the vast majority of our products with contractual guaranteed minimum rates, had crediting rates set at the minimum. In addition, approximately 37 percent of our insurance liabilities were subject to interest rates that may be reset annually; 44 percent had a fi xed explicit interest rate for the duration of the contract; 16 percent had credited rates that approximate the income we earn; and the remainder had no explicit interest rates. Second, if interest rate changes produce an unanticipated increase in surrenders of our spread-based products, we may be forced to sell invested assets at a loss in order to fund such surrenders. Th ird, the profi ts from many non-spread-based insurance products, such as long-term care policies, can be adversely aff ected when interest rates decline because we may be unable to reinvest the cash from premiums received at the interest rates anticipated when we sold the policies. Finally, changes in interest rates can have signifi cant eff ects on the fair value and performance of our investments in general such as the timing of cash fl ows on many structured securities due to changes in the prepayment rate of the loans underlying such securities.
We employ asset/liability strategies that are designed to mitigate the eff ects of interest rate changes on our profi tability but do not currently extensively employ derivative instruments for this purpose. We may not be successful in implementing these strategies and achieving adequate investment spreads.
We simulate our cash fl ows expected from existing business under various interest rate scenarios. With such estimates, we seek to manage the relationship between the duration of our assets and the expected duration of our liabilities. When the estimated durations of assets and liabilities are similar, exposure to interest rate risk is minimized because a change in the value of assets should be largely off set by a change in the value of liabilities. At December 31, 2012, the duration of our fi xed income securities (as modifi ed to refl ect prepayments and potential calls) was approximately 8.7 years, and the duration of our insurance liabilities was approximately 8.6 years. We estimate that our fi xed maturity securities and short-term investments, net of corresponding changes in insurance acquisition costs, would decline in fair value by approximately $230 million if interest rates were to
increase by 10 percent from rates as of December 31, 2012. Th is compares to a decline in fair value of approximately $225 million based on amounts and rates at December 31, 2011. Our simulations incorporate numerous assumptions, require signifi cant estimates and assume an immediate change in interest rates without any management reaction to such change. Consequently, potential changes in the values of our fi nancial instruments indicated by the simulations will likely be diff erent from the actual changes experienced under given interest rate scenarios, and the diff erences may be material. Because we actively manage our investments and liabilities, our net exposure to interest rates can vary over time.
General market conditions aff ect investments and investment income.
Th e performance of our investment portfolio depends in part upon the level of and changes in interest rates, risk spreads, real estate values, market volatility, the performance of the economy in general, the performance of the specifi c obligors included in our portfolio and other factors that are beyond our control. Changes in these factors can aff ect our net investment income in any period, and such changes can be substantial.
Financial market conditions can also aff ect our realized and unrealized investment gains (losses). During periods of rising interest rates, the fair values of our investments will typically decline. Conversely, during periods of falling interest rates, the fair values of our investments will typically rise.
Our results of operations may be negatively impacted if our initiatives to restructure our insurance operations are unsuccessful or if our planned conversions result in valuation diff erences.
We have implemented or are in the process of implementing several initiatives to improve operating results, including: (i) focusing sales eff orts on higher margin products; (ii) reducing operating expenses by eliminating or reducing marketing costs of certain products; (iii) streamlining administrative procedures and reducing personnel; and (iv) increasing retention rates on our more profi table blocks of inforce business. Many of our initiatives address issues resulting from the substantial number of acquisitions of our Predecessor. Between 1982 and 1997, our Predecessor completed 19 transactions involving the acquisitions of 44 separate insurance companies. Our eff orts involve improvements to our policy administration procedures and signifi cant systems conversions, such as the elimination of duplicate processing systems for similar business. Th ese initiatives may result in unforeseen expenses, complications or delays, may be inadequate to address all issues, and may not ultimately be successfully completed. While our future operating performance depends greatly on the success of these eff orts, even if we successfully implement these measures, they alone may not suffi ciently improve our results of operations.
Conversions to new systems can result in valuation diff erences between the prior system and the new system. We have recognized such diff erences in the past. Our planned conversions could result in future valuation adjustments, and these adjustments may have a material adverse eff ect on future earnings.

CNO FINANCIAL GROUP, INC. - Form 10-K 45
PART I ITEM 1A Risk Factors
A decline in the current fi nancial strength rating of our insurance subsidiaries could cause us to experience decreased sales, increased agent attrition and increased policyholder lapses and redemptions.
An important competitive factor for our insurance subsidiaries is the ratings they receive from nationally recognized rating organizations. Agents, insurance brokers and marketing companies who market our products, and prospective policyholders view ratings as an important factor in evaluating an insurer’s products. Th is is especially true for annuity, interest-sensitive life insurance and long-term care products. Th e current fi nancial strength ratings of our primary insurance subsidiaries (except Conseco Life) from A.M. Best, S&P, Moody’s and Fitch are “B++”, “BB+”, “Baa3” and “BBB”, respectively. A.M. Best has 16 possible ratings. Th ere are four ratings above our “B++” rating and 11 ratings that are below our rating. S&P has 21 possible ratings. Th ere are ten ratings above our “BB+” rating and ten ratings that are below our rating. Moody’s has 21 possible ratings. Th ere are nine ratings above our “Baa3” rating and 11 ratings that are below our rating. Fitch has 19 possible ratings. Th ere are eight ratings above our “BBB” rating and ten ratings that are below our rating. Th e current fi nancial strength ratings of Conseco Life from A.M. Best, S&P, Moody’s and Fitch are “B-”, “B+”, “Ba1” and “BB+”, respectively.
If our ratings are downgraded, we may experience declining sales of certain of our insurance products, defections of our independent and career sales force, and increased policies being redeemed or allowed to lapse. Th ese events would adversely aff ect our fi nancial results, which could then lead to ratings downgrades.
Competition from companies that have greater market share, higher ratings, greater fi nancial resources and stronger brand recognition, may impair our ability to retain existing customers and sales representatives, attract new customers and sales representatives and maintain or improve our fi nancial results.
Th e supplemental health insurance, annuity and individual life insurance markets are highly competitive. Competitors include other life and accident and health insurers, commercial banks, thrifts, mutual funds and broker-dealers.
Our principal competitors vary by product line. Our main competitors for agent-sold long-term care insurance products include Genworth Financial, Inc., John Hancock Financial Services, Northwestern Mutual and Mutual of Omaha. Our main competitors for agent-sold Medicare supplement insurance products include United HealthCare, Blue Cross and Blue Shield Plans and Mutual of Omaha.
In some of our product lines, such as life insurance and fi xed annuities, we have a relatively small market share. Even in some of the lines in which we are one of the top fi ve writers, our market share is relatively small. For example, while, based on an Individual Long-Term Care Insurance Survey, our Bankers Life segment ranked ninth in annualized premiums of individual long-term care insurance in 2011 with a market share of approximately 3.1 percent, the top eight writers of individual long-term care insurance had annualized premiums with a combined market share of approximately 88 percent during the period. In addition, while, based on the NAIC’s 2011 Medicare Supplement Loss Ratios report, we ranked fi fth in direct premiums earned for Medicare
supplement insurance in 2011 with a market share of 3.9 percent, the top writer of Medicare supplement insurance had direct premiums with a market share of 32 percent during the period.
Most of our major competitors have higher fi nancial strength ratings than we do. Many of our competitors are larger companies that have greater capital, technological and marketing resources and have access to capital at a lower cost. Recent industry consolidation, including business combinations among insurance and other fi nancial services companies, has resulted in larger competitors with even greater fi nancial resources. Furthermore, changes in federal law have narrowed the historical separation between banks and insurance companies, enabling traditional banking institutions to enter the insurance and annuity markets and further increase competition. Th is increased competition may harm our ability to maintain or improve our profi tability.
In addition, because the actual cost of products is unknown when they are sold, we are subject to competitors who may sell a product at a price that does not cover its actual cost. Accordingly, if we do not also lower our prices for similar products, we may lose market share to these competitors. If we lower our prices to maintain market share, our profi tability will decline.
We must attract and retain sales representatives to sell our insurance and annuity products. Strong competition exists among insurance and fi nancial services companies for sales representatives. We compete for sales representatives primarily on the basis of our fi nancial position, fi nancial strength ratings, support services, compensation, products and product features. Our competitiveness for such agents also depends upon the relationships we develop with these agents. Our Predecessor’s bankruptcy continues to be an adverse factor in developing relationships with certain agents. If we are unable to attract and retain suffi cient numbers of sales representatives to sell our products, our ability to compete and our revenues and profi tability would suff er.
If we are unable to attract and retain agents and marketing organizations, sales of our products may be reduced.
Our products are marketed and distributed primarily through a dedicated fi eld force of career agents and sales managers (in our Bankers Life segment) and through PMA and independent marketing organizations (in our Washington National segment). We must attract and retain agents, sales managers and independent marketing organizations to sell our products through those distribution channels. We compete with other insurance companies and fi nancial services companies for agents and sales managers and for business through marketing organizations. If we are unable to attract and retain these agents, sales managers and marketing organizations, our ability to grow our business and generate revenues from new sales would suff er.
Volatility in the securities markets, and other economic factors, may adversely aff ect our business, particularly our sales of certain life insurance products and annuities.
Fluctuations in the securities markets and other economic factors may adversely aff ect sales and/or policy surrenders of our annuities and life insurance policies. For example, volatility in the equity markets may deter potential purchasers from investing in fi xed index annuities and may cause current policyholders to surrender their policies for the

CNO FINANCIAL GROUP, INC. - Form 10-K 46
PART I ITEM 1A Risk Factors
cash value or to reduce their investments. In addition, signifi cant or unusual volatility in the general level of interest rates could negatively impact sales and/or lapse rates on certain types of insurance products.
Federal and state legislation could adversely aff ect the fi nancial performance of our insurance operations.
During recent years, the health insurance industry has experienced substantial changes, including those caused by healthcare legislation. Recent federal and state legislation and pending legislative proposals concerning healthcare reform contain features that could severely limit, or eliminate, our ability to vary pricing terms or apply medical underwriting standards to individuals, thereby potentially increasing our benefi t ratios and adversely impacting our fi nancial results. In particular, Medicare reform could aff ect our ability to price or sell our products or profi tably maintain our blocks inforce. For example, the Medicare Advantage program provides incentives for health plans to off er managed care plans to seniors. Th e growth of managed care plans under this program could decrease sales of the traditional Medicare supplement products we sell. Some current proposals contain government provided long-term care insurance which could aff ect the sales of our long-term care products.
Proposals currently pending in Congress and some state legislatures may also aff ect our fi nancial results. Th ese proposals include the implementation of minimum consumer protection standards in all long-term care policies, including: guaranteed premium rates; protection against infl ation; limitations on waiting periods for pre-existing conditions; setting standards for sales practices for long-term care insurance; and guaranteed consumer access to information about insurers, including information regarding lapse and replacement rates for policies and the percentage of claims denied. Enactment of any proposal that would limit the amount we can charge for our products, such as guaranteed premium rates, or that would increase the benefi ts we must pay, such as limitations on waiting periods, or that would otherwise increase the costs of our business, could adversely aff ect our fi nancial results.
On July 21, 2010, the Dodd-Frank Act was enacted and signed into law. Th e Dodd-Frank Act made extensive changes to the laws regulating fi nancial services fi rms and requires various federal agencies to adopt a broad range of new rules and regulations. Among other provisions, the Dodd-Frank Act provides for a new framework of regulation of over-the-counter derivatives markets. Th is will require us to clear certain types of transactions currently traded in the over-the-counter derivative markets and may limit our ability to customize derivative transactions for our needs. In addition, we will likely experience additional collateral requirements and costs associated with derivative transactions.
Th e Dodd-Frank Act also establishes a Financial Stability Oversight Council, which is authorized to subject nonbank fi nancial companies deemed systemically signifi cant to stricter prudential standards and other requirements and to subject such a company to a special orderly liquidation process outside the federal bankruptcy code, administered by the Federal Deposit Insurance Corporation (although insurance company subsidiaries would remain subject to liquidation and rehabilitation proceedings under state law). In addition, the Dodd-Frank Act establishes a Federal Insurance Offi ce within the Department of the Treasury. While not having a general supervisory or regulatory authority over the business
of insurance, the director of this offi ce will perform various functions with respect to insurance, including serving as a non-voting member of the Financial Stability Oversight Council and making recommendations to the Council regarding insurers to be designated for more stringent regulation. Th e director is also required to conduct a study on how to modernize and improve the system of insurance regulation in the United States, including by increased national uniformity through either a federal charter or eff ective action by the states.
Federal agencies have been given signifi cant discretion in drafting the rules and regulations that will implement the Dodd-Frank Act. Consequently, many of the details and much of the impact of the Dodd-Frank Act may not be known for some time. In addition, this legislation mandated multiple studies and reports for Congress, which could result in additional legislative or regulatory action.
We cannot predict the requirements of the regulations ultimately adopted under the Dodd-Frank Act, the eff ect such regulations will have on fi nancial markets generally, or on our businesses specifi cally, the additional costs associated with compliance with such regulations, or any changes to our operations that may be necessary to comply with the Dodd-Frank Act, any of which could have a material adverse aff ect on our business, results of operations, cash fl ows or fi nancial condition.
Reinsurance may not be available, aff ordable or adequate to protect us against losses.
As part of our overall risk and capital management strategy, we have historically purchased reinsurance from external reinsurers as well as provided internal reinsurance support for certain risks underwritten by our business segments. Th e availability and cost of reinsurance protection are impacted by our operating and fi nancial performance as well as conditions beyond our control. For example, volatility in the equity markets and the related impacts on asset values required to fund liabilities may reduce the availability of certain types of reinsurance and make it more costly when it is available, as reinsurers are less willing to take on credit risk in a volatile market. Accordingly, we may be forced to incur additional expenses for reinsurance or may not be able to obtain suffi cient new reinsurance on acceptable terms, which could adversely aff ect our ability to write future business or obtain statutory capital credit for new reinsurance.
We face risk with respect to our reinsurance agreements.
We transfer exposure to certain risks to others through reinsurance arrangements. Under these arrangements, other insurers assume a portion of our losses and expenses associated with reported and unreported claims in exchange for a portion of policy premiums. Th e availability, amount and cost of reinsurance depend on general market conditions and may vary signifi cantly. As of December 31, 2012, our reinsurance receivables totaled $2.9 billion. Our ceded life insurance in-force totaled $12.4 billion. Our ten largest reinsurers accounted for 92 percent of our ceded life insurance in-force. We face credit risk with respect to reinsurance. When we obtain reinsurance, we are still liable for those transferred risks if the reinsurer cannot meet its obligations. Th erefore, the inability of our reinsurers to meet their fi nancial obligations may require us to increase liabilities, thereby reducing our net income and shareholders’ equity.

CNO FINANCIAL GROUP, INC. - Form 10-K 47
PART I ITEM 3 Legal Proceedings
Our insurance subsidiaries may be required to pay assessments to fund other companies’ policyholder losses or liabilities and this may negatively impact our fi nancial results.
Th e solvency or guaranty laws of most states in which an insurance company does business may require that company to pay assessments up to certain prescribed limits to fund policyholder losses or liabilities of other insurance companies that become insolvent. Insolvencies of
insurance companies increase the possibility that these assessments may be required. Th ese assessments may be deferred or forgiven under most guaranty laws if they would threaten an insurer’s fi nancial strength and, in certain instances, may be off set against future premium taxes. We cannot estimate the likelihood and amount of future assessments. Although past assessments have not been material, if there were a number of large insolvencies, future assessments could be material and could have a material adverse eff ect on our operating results and fi nancial position.
ITEM 1B Unresolved Staff CommentsNone.
ITEM 2 PropertiesOur headquarters and the administrative operations of our Washington National and Other CNO Business segments and certain administrative operations of our subsidiaries are located on a Company-owned corporate campus in Carmel, Indiana, immediately north of Indianapolis. We currently occupy four buildings on the campus with approximately 422,000 square feet of space.
Our Bankers Life segment is primarily administered from downtown Chicago, Illinois. In 2012, Bankers Life relocated from one downtown location to another. Th e new location has approximately 135,000 square feet leased under an agreement which expires in 2023. Bankers Life
has subleased its prior location of 222,000 square feet through the remaining term of the lease which expires in 2018. We also lease 276 sales offi ces in various states totaling approximately 825,000 square feet. Th ese leases generally are short-term in length, with remaining lease terms expiring between 2013 and 2019.
Our Colonial Penn segment is administered from a Company-owned offi ce building in Philadelphia, Pennsylvania, with approximately 127,000 square feet. We occupy approximately 60 percent of this space, with unused space leased to tenants.
Management believes that this offi ce space is adequate for our needs.
ITEM 3 Legal ProceedingsInformation required for Item 3 is incorporated by reference to the discussion under the heading “Legal Proceedings” in note 7 “Litigation and Other Legal Proceedings” to our consolidated fi nancial statements included in Item 8 of this Form 10-K.

CNO FINANCIAL GROUP, INC. - Form 10-K 48
PART I ITEM 4 Mine Safety Disclosures
ITEM 4 Mine Safety DisclosuresNot applicable.
Executive Offi cers of the Registrant
Offi cer Name and Age (a) Since Positions with CNO, Principal Occupation and Business Experience (b)
Bruce Baude, 48 2012 Since July 2012, executive vice president, chief operations and technology offi cer. From 2008 to 2012, Mr. Baude was chief operating offi cer at Univita Health. He joined Long Term Care Group in 2005 and served as chief executive offi cer through 2008, when it was acquired by Univita Health.
Edward J. Bonach, 58 2007 Since October 2011, chief executive offi cer. From May 2007 to January 2012, chief fi nancial offi cer of CNO.
Frederick J. Crawford, 49 2012 Since January 2012, executive vice president and chief fi nancial offi cer. From 2001 to January 2012, Mr. Crawford was with Lincoln Financial Group, serving as vice president and treasurer (2001-2004), chief fi nancial offi cer (2005-2010), and executive vice president and head of corporate development and investments (2011-January 2012).
Eric R. Johnson, 52 1997 Since September 2003, chief investment offi cer of CNO and president and chief executive offi cer of 40|86 Advisors, CNO’s wholly-owned registered investment advisor. Mr. Johnson has held various investment management positions since joining CNO in 1997.
John R. Kline, 55 1990 Since July 2002, senior vice president and chief accounting offi cer. Mr. Kline has served in various accounting and fi nance capacities with CNO since 1990.
Susan L. Menzel, 47 2005 Since May 2005, executive vice president, human resources.Christopher J. Nickele, 56 2005 Since October 2005, executive vice president, product management and since
May 2010, president, Other CNO Business.Scott R. Perry, 50 2001 Since July 2011, chief business offi cer of CNO and since 2006, president of Bankers
Life. Employed in various capacities for Bankers Life since 2001.Steven M. Stecher, 52 2004 Since August 2008, president of Washington National. From January 2007 until
August 2008, executive vice president, operations. From August 2004 until January 2007, executive vice president of Washington National.
Matthew J. Zimpfer, 45 1998 Since June 2008, executive vice president and general counsel. Mr. Zimpfer has held various legal positions since joining CNO in 1998.
(a) The executive officers serve as such at the discretion of the Board of Directors and are elected annually.(b) Business experience is given for at least the last five years.

CNO FINANCIAL GROUP, INC. - Form 10-K 49
PART II
ITEM 5 Market for Registrant’s Common Equity, Related Stockholder Matters and Issuer Purchases of Equity Securities
Market Information and Dividends
Th e following table sets forth the dividends declared and paid per share and the ranges of high and low sales prices per share for our common stock on the New York Stock Exchange for the quarterly periods beginning January 1, 2011.
PeriodMarket price Dividends declared
and paidHigh Low2011:
First Quarter $ 7.59 $ 6.23 $ —Second Quarter 8.34 6.98 —Th ird Quarter 8.15 5.28 —Fourth Quarter 6.79 4.73 —
2012: First Quarter $ 8.20 $ 6.04 $ —Second Quarter 7.99 6.30 .02 Th ird Quarter 10.18 7.55 .02 Fourth Quarter 10.06 8.26 .02
As of February 7, 2013, there were approximately 27,400 holders of the outstanding shares of common stock, including individual participants in securities position listings.
We commenced the payment of a dividend on our common stock in the second quarter of 2012. Th e dividend on our common stock is declared each quarter by our Board of Directors. In determining dividends, our Board of Directors takes into consideration our fi nancial condition,
including current and expected earnings and projected cash fl ows. Th e Company’s debt agreements contain covenants which could limit our ability to pay cash dividends on our common stock, but we do not believe such covenants are likely to impact the future payment of dividends on our common stock. Refer to the note to the consolidated fi nancial statements entitled “Notes Payable - Direct Corporate Obligations” for further information regarding these limitations.
Performance Graph
Th e performance graph below compares CNO’s cumulative total shareholder return on its common stock for the period from December 31, 2007 through December 31, 2012 with the cumulative total return of the Standard & Poor’s 500 Composite Stock Price Index (the “S&P 500 Index”) and the Standard & Poor’s Life and Health Insurance Index (the “S&P Life and Health Insurance Index”). Th e comparison for each
of the periods assumes that $100 was invested on December 31, 2007 in each of CNO common stock, the stocks included in the S&P 500 Index and the stocks included in the S&P Life and Health Index and that all dividends were reinvested. Th e stock performance shown in this graph represents past performance and should not be considered an indication of future performance of CNO’s common stock.

CNO FINANCIAL GROUP, INC. - Form 10-K 50
PART II ITEM 5 Market for Registrant’s Common Equity, Related Stockholder Matters and Issuer Purchases of Equity Securities
* $100 invested on 12/31/07 in stock or index, including reinvestment of dividends.
12/07 12/08 12/09 12/10 12/11 12/12CNO Financial Group, Inc. $ 100.00 $ 41.24 $ 39.81 $ 53.98 $ 50.24 $ 74.82S&P 500 Index 100.00 63.00 79.68 91.68 93.61 108.59S&P Life & Health Insurance Index 100.00 51.68 59.73 74.82 59.32 67.98
Issuer Purchases Of Equity Securities
Period
Total number of shares
(or units)
Average price paid per share
(or unit)
Total number of shares (or units) purchased as
part of publicly announced plans or programs
Maximum number (or approximate dollar value) of shares (or units) that may yet be purchased under the plans or programs(a)
(dollars in millions)
October 1 through October 31 3,252,642 $ 9.68 3,245,609 $ 99.2November 1 through November 30 2,636,498 8.94 2,628,502 75.7December 1 through December 31 2,843,708 9.30 2,765,104 350.0TOTAL 8,732,848 9.33 8,639,215 350.0(a) In May 2011, the Company announced a common share repurchase program of up to $100.0 million. In February 2012, June 2012 and December 2012, the Company’s
Board of Directors approved, in aggregate, an additional $500.0 million to repurchase the Company’s outstanding securities.

CNO FINANCIAL GROUP, INC. - Form 10-K 51
PART II ITEM 6 Selected Consolidated Financial Data
Equity Compensation Plan Information
Th e following table summarizes information, as of December 31, 2012, relating to our common stock that may be issued under the CNO Financial Group, Inc. Amended and Restated Long-Term Incentive Plan.
Number of securities to be issued upon exercise of outstanding options,
warrants and rights
Weighted-average exercise price of
outstanding options, warrants and rights
Number of securities remaining available for future issuance under
equity compensation plans (excluding securities refl ected in fi rst column)
Equity compensation plans approved by security holders 6,655,010 $ 9.72 9,712,561Equity compensation plans not approved by security holders — — —TOTAL 6,655,010 $ 9.72 9,712,561
ITEM 6 Selected Consolidated Financial Data
(Amounts in millions, except per share data)
Years ended December 31,2012 2011 2010 2009 2008
STATEMENT OF OPERATIONS DATA a Insurance policy income $ 2,755.4 $ 2,690.5 $ 2,670.0 $ 3,093.6 $ 3,253.6 Net investment income 1,486.4 1,354.1 1,366.9 1,292.7 1,178.8 Net realized investment gains (losses) 81.1 61.8 30.2 (60.5) (262.4)Total revenues 4,342.7 4,124.6 4,083.9 4,341.4 4,189.7 Interest expense 114.6 114.1 113.2 117.9 106.5 Total benefi ts and expenses 4,187.0 3,818.4 3,859.0 4,269.6 4,299.8 Income (loss) before income taxes and discontinued operations 155.7 306.2 224.9 71.8 (110.1)Income tax expense (benefi t) (65.3) (29.5) (15.7) 51.4 372.5 Income (loss) before discontinued operations 221.0 335.7 240.6 20.4 (482.6)Discontinued operations, net of income taxes — — — — (722.7)Net income (loss) 221.0 335.7 240.6 20.4 (1,205.3)PER SHARE DATA (a) Income (loss) before discontinued operations, basic $ .95 $ 1.35 $ .96 $ .11 $ (2.62)Income (loss) before discontinued operations, diluted .83 1.15 .84 .11 (2.62)Net income, basic .95 1.35 .96 .11 (6.53)Net income, diluted .83 1.15 .84 .11 (6.53)Dividends declared per common share .06 — — — — Book value per common share outstanding 22.80 19.12 15.18 12.12 6.43 Weighted average shares outstanding for basic earnings 233.7 248.0 251.0 188.4 184.7 Weighted average shares outstanding for diluted earnings 281.4 304.1 301.9 193.3 184.7 Shares outstanding at period-end 221.5 241.3 251.1 250.8 184.8 BALANCE SHEET DATA AT PERIOD END (a) Total investments $ 27,959.3 $ 26,364.3 $ 23,782.0 $ 21,530.2 $ 18,647.5 Total assets 34,131.4 32,921.9 31,394.9 29,860.4 28,321.3 Corporate notes payable 1,004.2 857.9 998.5 1,037.4 1,311.5 Total liabilities 29,082.1 28,308.1 27,583.3 26,821.8 27,133.3 Shareholders’ equity 5,049.3 4,613.8 3,811.6 3,038.6 1,188.0 STATUTORY DATA AT PERIOD END (b) Statutory capital and surplus $ 1,560.4 $ 1,578.1 $ 1,525.1 $ 1,410.7 $ 1,311.5 Asset valuation reserve (“AVR”) 222.2 168.4 71.3 28.2 55.0 Total statutory capital and surplus and AVR 1,782.6 1,746.5 1,596.4 1,438.9 1,366.5 (a) As a result of the transfer of Senior Health to the Independent Trust in 2008, a substantial portion of our long-term care business is presented as discontinued operations in
periods prior to 2009.(b) We have derived the statutory data from statements filed by our insurance subsidiaries with regulatory authorities which are prepared in accordance with statutory
accounting principles, which vary in certain respects from GAAP.

CNO FINANCIAL GROUP, INC. - Form 10-K 52
PART II ITEM 7 Management’s Discussion and Analysis of Consolidated Financial Condition and Results of Operations
ITEM 7 Management’s Discussion and Analysis of Consolidated Financial Condition and Results of Operations
In this section, we review the consolidated fi nancial condition of CNO and its consolidated results of operations for the years ended December 31, 2012, 2011 and 2010 and, where appropriate, factors that may aff ect future fi nancial performance. Please read this discussion in conjunction with the consolidated fi nancial statements and notes included in this Form 10-K.
Cautionary Statement Regarding Forward-Looking Statements
Our statements, trend analyses and other information contained in this report and elsewhere (such as in fi lings by CNO with the SEC, press releases, presentations by CNO or its management or oral statements) relative to markets for CNO’s products and trends in CNO’s operations or fi nancial results, as well as other statements, contain forward-looking statements within the meaning of the federal securities laws and the Private Securities Litigation Reform Act of 1995. Forward-looking statements typically are identifi ed by the use of terms such as “anticipate,” “believe,” “plan,” “estimate,” “expect,” “project,” “intend,” “may,” “will,” “would,” “contemplate,” “possible,” “attempt,” “seek,” “should,” “could,” “goal,” “target,” “on track,” “comfortable with,” “optimistic” and similar words, although some forward-looking statements are expressed diff erently. You should consider statements that contain these words carefully because they describe our expectations, plans, strategies and goals and our beliefs concerning future business conditions, our results of operations, fi nancial position, and our business outlook or they state other “forward-looking” information based on currently available information. Th e “Risk Factors” in Item 1A provide examples of risks, uncertainties and events that could cause our actual results to diff er materially from the expectations expressed in our forward-looking statements. Assumptions and other important factors that could cause our actual results to diff er materially from those anticipated in our forward-looking statements include, among other things:
• changes in or sustained low interest rates causing reductions in investment income, the margins of our fi xed annuity and life insurance businesses, and sales of, and demand for, our products; • expectations of lower future investment earnings may cause us to accelerate amortization, write down the balance of insurance acquisition costs or establish additional liabilities for insurance products; • general economic, market and political conditions, including the performance and fl uctuations of the fi nancial markets which may aff ect the value of our investments as well as our ability to raise capital or refi nance existing indebtedness and the cost of doing so; • the ultimate outcome of lawsuits fi led against us and other legal and regulatory proceedings to which we are subject; • our ability to make anticipated changes to certain NGEs of our life insurance products;
• our ability to obtain adequate and timely rate increases on our health products, including our long-term care business; • the receipt of any required regulatory approvals for dividend and surplus debenture interest payments from our insurance subsidiaries; • mortality, morbidity, the increased cost and usage of health care services, persistency, the adequacy of our previous reserve estimates and other factors which may aff ect the profi tability of our insurance products; • changes in our assumptions related to deferred acquisition costs or the present value of future profi ts; • the recoverability of our deferred tax assets and the eff ect of potential ownership changes and tax rate changes on their value; • our assumption that the positions we take on our tax return fi lings, including our position that our 7.0% Debentures will not be treated as stock for purposes of Section 382 of the Code and will not trigger an ownership change, will not be successfully challenged by the IRS; • changes in accounting principles and the interpretation thereof (including changes in principles related to accounting for deferred acquisition costs); • our ability to continue to satisfy the fi nancial ratio and balance requirements and other covenants of our debt agreements; • our ability to achieve anticipated expense reductions and levels of operational effi ciencies including improvements in claims adjudication and continued automation and rationalization of operating systems; • performance and valuation of our investments, including the impact of realized losses (including other-than-temporary impairment charges); • our ability to identify products and markets in which we can compete eff ectively against competitors with greater market share, higher ratings, greater fi nancial resources and stronger brand recognition; • our ability to generate suffi cient liquidity to meet our debt service obligations and other cash needs; • our ability to maintain eff ective controls over fi nancial reporting; • our ability to continue to recruit and retain productive agents and distribution partners and customer response to new products, distribution channels and marketing initiatives;

CNO FINANCIAL GROUP, INC. - Form 10-K 53
PART II ITEM 7 Management’s Discussion and Analysis of Consolidated Financial Condition and Results of Operations
• our ability to achieve eventual upgrades of the fi nancial strength ratings of CNO and our insurance company subsidiaries as well as the impact of our ratings on our business, our ability to access capital, and the cost of capital; • the risk factors or uncertainties listed from time to time in our fi lings with the SEC; • regulatory changes or actions, including those relating to regulation of the fi nancial aff airs of our insurance companies, such as the payment of dividends and surplus debenture interest to us, regulation of the sale, underwriting and pricing of products, and health care regulation aff ecting health insurance products; and • changes in the Federal income tax laws and regulations which may aff ect or eliminate the relative tax advantages of some of our products or aff ect the value of our deferred tax assets.
Other factors and assumptions not identifi ed above are also relevant to the forward-looking statements, and if they prove incorrect, could also cause actual results to diff er materially from those projected.
All written or oral forward-looking statements attributable to us are expressly qualifi ed in their entirety by the foregoing cautionary statement. Our forward-looking statements speak only as of the date made. We assume no obligation to update or to publicly announce the r esults of any revisions to any of the forward-looking statements to refl ect actual results, future events or developments, changes in assumptions or changes in other factors aff ecting the forward-looking statements.
Th e reporting of RBC measures is not intended for the purpose of ranking any insurance company or for use in connection with any marketing, advertising or promotional activities.
Overview
We are a holding company for a group of insurance companies operating throughout the United States that develop, market and administer health insurance, annuity, individual life insurance and other insurance products. We focus on serving the senior and middle-income markets, which we believe are attractive, underserved, high growth markets. We sell our products through three distribution channels: career agents, independent producers (some of whom sell one or more of our product lines exclusively) and direct marketing.
Th e Company manages its business through the following operating segments: Bankers Life, Washington National and Colonial Penn, which are defi ned on the basis of product distribution; Other CNO Business, comprised primarily of products we no longer sell actively; and corporate operations, comprised of holding company activities and certain noninsurance company businesses. Th e Company’s segments are described below:
• Bankers Life, which markets and distributes Medicare supplement insurance, interest-sensitive life insurance, traditional life insurance, fi xed annuities and long-term care insurance products to the middle-income senior market through a dedicated fi eld force of career agents and sales managers supported by a network of community-based sales offi ces. Th e Bankers Life segment includes primarily the business of Bankers Life and Casualty Company. Bankers Life also markets and
distributes Medicare Advantage plans primarily through distribution arrangements with Humana and United HealthCare and Medicare Part D prescription drug plans through a distribution and reinsurance arrangement with Coventry. • Washington National, which markets and distributes supplemental health (including specifi ed disease, accident and hospital indemnity insurance products) and life insurance to middle-income consumers at home and at the worksite. Th ese products are marketed through PMA and through independent marketing organizations and insurance agencies including worksite marketing. Th e products being marketed are underwritten by Washington National. • Colonial Penn, which markets primarily graded benefi t and simplifi ed issue life insurance directly to customers in the senior middle-income market through television advertising, direct mail, the internet and telemarketing. Th e Colonial Penn segment includes primarily the business of Colonial Penn Life Insurance Company. • Other CNO Business, which consists of blocks of interest-sensitive life insurance, traditional life insurance, annuities, long-term care insurance and other supplemental health products. Th ese blocks of business are not actively marketed and were primarily issued or acquired by Conseco Life and Washington National.

CNO FINANCIAL GROUP, INC. - Form 10-K 54
PART II ITEM 7 Management’s Discussion and Analysis of Consolidated Financial Condition and Results of Operations
Th e following summarizes our earnings for the three years ending December 31, 2012 (dollars in millions, except per share data):
2012 2011 2010Earnings before net realized investment gains (losses), fair value changes in embedded derivative liabilities, corporate interest expense, loss on extinguishment of debt and income taxes (“EBIT”, a non-GAAP fi nancial measure) (a):
Bankers Life $ 300.9 $ 290.9 $ 237.5 Washington National 127.1 96.1 100.4 Colonial Penn (8.6) (4.7) 4.2 Other CNO Business (48.8) 15.3 (9.2)
EBIT from business segments 370.6 397.6 332.9 Corporate operations, excluding corporate interest expense (20.3) (47.7) (42.8)
EBIT 350.3 349.9 290.1 Corporate interest expense (66.2) (76.3) (79.3)
Income before loss on extinguishment of debt, net realized investment gains (losses), fair value changes in embedded derivative liabilities and taxes 284.1 273.6 210.8
Tax expense on operating income 103.7 102.1 74.4 Net operating income 180.4 171.5 136.4
Net realized investment gains (net of related amortization and taxes) 48.4 36.7 13.6 Fair value changes in embedded derivative liabilities (net of related amortization and taxes) (1.8) (13.3) — Loss on extinguishment of debt, net of income taxes (177.5) (2.2) (4.4)
Net income before valuation allowance for deferred tax assets 49.5 192.7 145.6 Decrease in valuation allowance for deferred tax assets 171.5 143.0 95.0 NET INCOME $ 221.0 $ 335.7 $ 240.6Per diluted share:
Net operating income $ .69 $ .61 $ .50 Net realized investment gains (net of related amortization and taxes) .17 .12 .04 Fair value changes in embedded derivative liabilities (net of related amortization and taxes) (.01) (.04) — Loss on extinguishment of debt (net of income taxes) (.63) (.01) (.01)Decrease in valuation allowance for deferred tax assets .61 .47 .31
NET INCOME $ .83 $ 1.15 $ .84(a) Management believes that an analysis of EBIT provides a clearer comparison of the operating results of the Company from period to period because it excludes: (i) corporate
interest expense; (ii) loss on extinguishment of debt; (iii) net realized investment gains; and (iv) fair value changes in embedded derivative liabilities that are unrelated to the Company’s underlying fundamentals. The table above reconciles the non-GAAP measure to the corresponding GAAP measure.
Our major goals for 2013 include:
• Increasing operating earnings per share. • Profi tably increasing sales at Bankers Life, Washington National and Colonial Penn. • Maximizing our investment income in a low interest rate environment while remaining within acceptable risk tolerance levels. • Enhancing the customer experience. • Continuing to execute on initiatives to achieve operational effi ciencies and cost savings.
•Continuing to actively manage the profi tability of our long-term care business.
• Improving profi tability of existing lines of business or disposing of underperforming blocks of business. • Continuing to invest in and develop our talent. • Continuing to work to improve the fi nancial strength and senior debt ratings from the major rating agencies. • Eff ectively deploying excess capital.
Critical Accounting Policies
Th e preparation of fi nancial statements in accordance with GAAP requires management to make estimates and assumptions that aff ect the reported amounts of assets and liabilities and disclosure of contingent assets and liabilities at the date of the fi nancial statements and the reported amounts of revenues and expenses during the reporting period. Management has made estimates in the past that we believed to be appropriate but were subsequently revised to refl ect actual experience. If our future experience diff ers materially from these estimates and assumptions, our results of operations and fi nancial condition could be materially aff ected.
We base our estimates on historical experience and other assumptions that we believe are reasonable under the circumstances. We continually evaluate the information used to make these estimates as our business and the economic environment change. Th e use of estimates is pervasive throughout our fi nancial statements. Th e accounting policies and estimates we consider most critical are summarized below. Additional information on our accounting policies is included in the note to our consolidated fi nancial statements entitled “Summary of Signifi cant Accounting Policies”.

CNO FINANCIAL GROUP, INC. - Form 10-K 55
PART II ITEM 7 Management’s Discussion and Analysis of Consolidated Financial Condition and Results of Operations
Investments
At December 31, 2012, the carrying value of our investment portfolio was $28.0 billion.
We defer any fees received or costs incurred when we originate investments. We amortize fees, costs, discounts and premiums as yield adjustments over the contractual lives of the investments. We consider anticipated prepayments on structured securities when we estimate yields on such securities. When actual prepayments diff er from our estimates, the adjustment to yield is recognized as investment income (loss).
Our evaluation of investments for impairment requires signifi cant judgments, including: (i) the identifi cation of potentially impaired securities; (ii) the determination of their estimated fair value; and (iii) the assessment of whether any decline in estimated fair value is other than temporary.
We regularly evaluate all of our investments with unrealized losses for possible impairment. Our assessment of whether unrealized losses are “other than temporary” requires signifi cant judgment. Factors considered include: (i) the extent to which fair value is less than the cost basis; (ii) the length of time that the fair value has been less than cost; (iii) whether the unrealized loss is event driven, credit-driven or a result of changes in market interest rates or risk premium; (iv) the near-term prospects for specifi c events, developments or circumstances likely to aff ect the value of the investment; (v) the investment’s rating and whether the investment is investment-grade and/or has been downgraded since its purchase; (vi) whether the issuer is current on all payments in accordance with the contractual terms of the investment and is expected to meet all of its obligations under the terms of the investment; (vii) whether we intend to sell the investment or it is more likely than not that circumstances will require us to sell the investment before recovery occurs; (viii) the underlying current and prospective asset and enterprise values of the issuer and the extent to which the recoverability of the carrying value of our investment may be aff ected by changes in such values; (ix) projections of, and unfavorable changes in, cash fl ows on structured securities including mortgage-backed and asset-backed securities; (x) our best estimate of the value of any collateral; and (xi) other objective and subjective factors.
Future events may occur, or additional information may become available, which may necessitate future realized losses in our portfolio. Signifi cant losses could have a material adverse eff ect on our consolidated fi nancial statements in future periods.
Impairment losses on equity securities are recognized in net income. Th e manner in which impairment losses on fi xed maturity securities, available for sale, are recognized in the fi nancial statements is dependent on the facts and circumstances related to the specifi c security. If we intend to sell a security or it is more likely than not that we would be required to sell a security before the recovery of its amortized cost, the security is other-than-temporarily impaired and the full amount of the impairment is recognized as a loss through earnings. If we do not expect to recover the amortized cost basis, we do not plan to sell the security, and if it is not more likely than not that we would be required to sell a security before the recovery of its amortized cost, less any current period credit loss, the recognition of the other-than-temporary impairment is bifurcated. We recognize the credit loss portion in net income and the noncredit loss portion in accumulated other comprehensive income.
We estimate the amount of the credit loss component of a fi xed maturity security impairment as the diff erence between amortized cost and the present value of the expected cash fl ows of the security. Th e present value is determined using the best estimate of future cash fl ows discounted at the eff ective interest rate implicit to the security at the date of purchase or the current yield to accrete an asset-backed or fl oating rate security. Th e methodology and assumptions for establishing the best estimate of future cash fl ows vary depending on the type of security.
For most structured securities, cash fl ow estimates are based on bond specifi c facts and circumstances that may include collateral characteristics, expectations of delinquency and default rates, loss severity, prepayment speeds and structural support, including excess spread, subordination and guarantees. For corporate bonds, cash fl ow estimates are derived from scenario-based outcomes of expected corporate restructurings or the disposition of assets using bond specifi c facts and circumstances including timing, secured interest and loss severity. Th e previous amortized cost basis less the impairment recognized in net income becomes the security’s new cost basis. We accrete the new cost basis to the estimated future cash fl ows over the expected remaining life of the security.
Th e remaining non-credit impairment, which is recorded in accumulated other comprehensive income (loss), is the diff erence between the security’s estimated fair value and our best estimate of future cash fl ows discounted at the eff ective interest rate prior to impairment. Th e remaining non-credit impairment typically represents changes in the market interest rates, current market liquidity and risk premiums. As of December 31, 2012, other-than-temporary impairments included in accumulated other comprehensive income of $6.0 million (before taxes and related amortization) related to structured securities.
Fair value is the price that would be received to sell an asset or paid to transfer a liability in an orderly transaction between market participants at the measurement date and, therefore, represents an exit price, not an entry price. We carry certain assets and liabilities at fair value on a recurring basis, including fi xed maturities, equity securities, trading securities, investments held by VIEs, derivatives, cash and cash equivalents, separate account assets and embedded derivatives. We carry our company-owned life insurance policy, which is backed by a series of mutual funds, at its cash surrender value and our hedge fund investments at their net asset values; in both cases, we believe these values approximate their fair values. In addition, we disclose fair value for certain fi nancial instruments, including mortgage loans and policy loans, insurance liabilities for interest-sensitive products, investment borrowings, notes payable and borrowings related to VIEs.
Th e degree of judgment utilized in measuring the fair value of fi nancial instruments is largely dependent on the level to which pricing is based on observable inputs. Observable inputs refl ect market data obtained from independent sources, while unobservable inputs refl ect our view of market assumptions in the absence of observable market information. Financial instruments with readily available active quoted prices would be considered to have fair values based on the highest level of observable inputs, and little judgment would be utilized in measuring fair value. Financial instruments that rarely trade would often have fair value based on a lower level of observable inputs, and more judgment would be utilized in measuring fair value.

CNO FINANCIAL GROUP, INC. - Form 10-K 56
PART II ITEM 7 Management’s Discussion and Analysis of Consolidated Financial Condition and Results of Operations
Th ere is a three-level hierarchy for valuing assets or liabilities at fair value based on whether inputs are observable or unobservable.
• Level 1 – includes assets and liabilities valued using inputs that are unadjusted quoted prices in active markets for identical assets or liabilities. Our Level 1 assets primarily include cash and exchange traded securities. • Level 2 – includes assets and liabilities valued using inputs that are quoted prices for similar assets in an active market, quoted prices for identical or similar assets in a market that is not active, observable inputs, or observable inputs that can be corroborated by market data. Level 2 assets and liabilities include those fi nancial instruments that are valued by independent pricing services using models or other valuation methodologies. Th ese models are primarily industry-standard models that consider various inputs such as interest rate, credit spread, reported trades, issuer spreads and other inputs that are observable or derived from observable information in the marketplace or are supported by observable levels at which transactions are executed in the marketplace. Financial assets in this category primarily include: certain public and privately placed corporate fi xed maturity securities; certain government or agency securities; certain mortgage and asset-backed securities; certain equity securities; most investments held by our consolidated VIEs; certain mutual fund and hedge fund investments; and most short-term investments; and non-exchange-traded derivatives such as call options to hedge liabilities related to our fi xed index annuity products. Financial liabilities in this category include investment borrowings, notes payable and borrowings related to VIEs. • Level 3 – includes assets and liabilities valued using unobservable inputs that are used in model-based valuations that contain management assumptions. Level 3 assets and liabilities include those fi nancial instruments whose fair value is estimated based on broker/dealer quotes, pricing services or internally developed models or methodologies utilizing signifi cant inputs not based on, or corroborated by, readily available market information. Financial assets in this category include certain corporate securities (primarily certain below-investment grade privately placed securities), certain structured securities, mortgage loans, and other less liquid securities. Financial liabilities in this category include our insurance liabilities for interest-sensitive products, which includes embedded derivatives (including embedded derivatives related to our fi xed index annuity products and to a modifi ed coinsurance arrangement) since their values include signifi cant unobservable inputs including actuarial assumptions.
At each reporting date, we classify assets and liabilities into the three input levels based on the lowest level of input that is signifi cant to the measurement of fair value for each asset and liability reported at fair value. Th is classifi cation is impacted by a number of factors, including the type of fi nancial instrument, whether the fi nancial instrument is new to the market and not yet established, the characteristics specifi c to the transaction and overall market conditions. Our assessment of the signifi cance of a particular input to the fair value measurement and the ultimate classifi cation of each asset and liability requires judgment and is subject to change from period to period based on the observability of the valuation inputs.
Below-investment grade corporate debt securities have diff erent characteristics than investment grade corporate debt securities. Based on historical performance, probability of default by the borrower is signifi cantly greater for below-investment grade corporate debt securities and in many cases severity of loss is relatively greater as such securities are generally unsecured and often subordinated to other indebtedness of the issuer. Also, issuers of below-investment grade corporate debt securities frequently have higher levels of debt relative to investment-grade issuers, hence, all other things being equal, are generally more sensitive to adverse economic conditions. Th e Company attempts to reduce the overall risk related to its investment in below-investment grade securities, as in all investments, through careful credit analysis, strict investment policy guidelines, and diversifi cation by issuer and/or guarantor and by industry.
Our fi xed maturity investments are generally purchased in the context of a long-term strategy to fund insurance liabilities, so we do not generally seek to generate short-term realized gains through the purchase and sale of such securities. In certain circumstances, we may sell securities. Th ese circumstances include: (i) when securities are selling at prices which exceed our view of their underlying economic value; (ii) when it is possible to reinvest the proceeds to better meet our long-term asset-liability management objectives; (iii) changes in the investment environment; (iv) expectation that the fair value could deteriorate further; (v) desire to reduce our exposure to an asset class, an issuer or an industry; (vi) prospective or actual changes in credit quality; or (vii) related to structured securities, changes in expected cash fl ows. During 2012, we sold $402.5 million of fi xed maturity investments which resulted in gross investment losses (before income taxes) of $15.4 million.
We generally seek to balance the duration and cash fl ows of our invested assets with the estimated duration and cash fl ows of benefi t payments arising from contract liabilities. Th ese eff orts may cause us to sell investments before their maturity date and could result in the realization of net realized investment gains (losses). When the estimated durations of assets and liabilities are similar, exposure to interest rate risk is minimized because a change in the value of assets should be largely off set by a change in the value of liabilities. In certain circumstances, a mismatch of the durations or related cash fl ows of invested assets and insurance liabilities could have a signifi cant impact on our results of operations and fi nancial position. See “- Quantitative and Qualitative Disclosures About Market Risks” for additional discussion of the duration of our invested assets and insurance liabilities.
For more information on our investment portfolio and our critical accounting policies related to investments, see the note to our consolidated fi nancial statements entitled “Investments”.

CNO FINANCIAL GROUP, INC. - Form 10-K 57
PART II ITEM 7 Management’s Discussion and Analysis of Consolidated Financial Condition and Results of Operations
Present Value of Future Profi ts and Deferred Acquisition Costs
In conjunction with the implementation of fresh start accounting, we eliminated the historical balances of our Predecessor’s deferred acquisition costs and the present value of future profi ts and replaced them with the present value of future profi ts as calculated on the Eff ective Date.
Th e value assigned to the right to receive future cash fl ows from contracts existing at the Eff ective Date is referred to as the present value of future profi ts. Th e balance of this account is amortized, evaluated for recovery, and adjusted for the impact of unrealized gains (losses) in the same manner as the deferred acquisition costs described below. We expect to amortize the balance of the present value of future profi ts as of December 31, 2012 as follows: 9 percent in 2013, 8 percent in 2014, 7 percent in 2015, 7 percent in 2016 and 6 percent in 2017.
Deferred acquisition costs represent incremental direct costs related to the successful acquisition of new or renewal insurance contracts. For universal life or investment products, we amortize these costs in relation to the estimated gross profi ts using the interest rate credited to the underlying policies. For other products, we amortize these costs in relation to future anticipated premium revenue using the projected investment earnings rate.
Insurance acquisition costs are amortized to expense over the lives of the underlying policies in relation to future anticipated premiums or gross profi ts. Th e insurance acquisition costs for policies other than universal life and investment-type products are amortized with interest (using the projected investment earnings rate) over the estimated premium-paying period of the policies, in a manner which recognizes amortization expense in proportion to each year’s premium income. Th e insurance acquisition costs for universal life and investment-type products are amortized with interest (using the interest rate credited to the underlying policy) in proportion to estimated gross profi ts. Th e interest, mortality, morbidity and persistency assumptions used to amortize insurance acquisition costs are consistent with those assumptions used to estimate liabilities for insurance products. For universal life and investment-type products, these assumptions are reviewed on a regular basis. When actual profi ts or our current best estimates of future profi ts are diff erent from previous estimates, we adjust cumulative amortization of insurance acquisition costs to maintain amortization expense as a constant percentage of gross profi ts over the entire life of the policies.
When we realize a gain or loss on investments backing our universal life or investment-type products, we adjust the amortization of insurance acquisition costs to refl ect the change in estimated gross profi ts from the products due to the gain or loss realized and the eff ect on future investment yields. We increased amortization expense for such changes by $6.5 million, $5.4 million and $9.3 million during the years ended December 31, 2012, 2011 and 2010, respectively. We also adjust insurance acquisition costs for the change in amortization that would have been recorded if fi xed maturity securities, available for sale, had been sold at their stated aggregate fair value and the proceeds reinvested at current yields. Such adjustments are commonly referred to as “shadow adjustments” and may include adjustments to: (i) deferred acquisition costs; (ii) the present value of future profi ts; (iii) loss recognition reserves;
and (iv) income taxes. We include the impact of this adjustment in accumulated other comprehensive income (loss) within shareholders’ equity. We limit the total adjustment related to unrealized losses to the total of the costs capitalized plus interest (or the total value of policies inforce recognized at the Eff ective Date plus interest with respect to the present value of future profi ts) related to insurance policies issued in a particular year (or policies inforce at the Eff ective Date with respect to the present value of future profi ts). Th e total pre-tax impact of such adjustments on accumulated other comprehensive income (loss) was a decrease of $645.9 million at December 31, 2012 (including $312.2 million for premium defi ciencies that would exist on certain long-term care products if unrealized gains on the assets backing such products had been realized and the proceeds from our sales of such assets were invested at then current yields.)
At December 31, 2012, the balance of insurance acquisition costs was $1.9 billion prior to shadow adjustments. Th e recoverability of this amount is dependent on the future profi tability of the related business. Each year, we evaluate the recoverability of the unamortized balance of insurance acquisition costs. Th ese evaluations are performed to determine whether estimates of the present value of future cash fl ows, in combination with the related liability for insurance products, will support the unamortized balance. Th ese future cash fl ows are based on our best estimate of future premium income, less benefi ts and expenses. Th e present value of these cash fl ows, plus the related balance of liabilities for insurance products, is then compared with the unamortized balance of insurance acquisition costs. In the event of a defi ciency, such amount would be charged to amortization expense. If the defi ciency exceeds the balance of insurance acquisition costs, a premium defi ciency reserve is established for the excess. Th e determination of future cash fl ows involves signifi cant judgment. Revisions to the assumptions which determine such cash fl ows could have a signifi cant adverse eff ect on our results of operations and fi nancial position.
Th e blocks of business in our Other CNO Business segment are particularly sensitive to changes in assumptions. Since many of these blocks are not expected to generate future profi ts, the entire impact of adverse changes to our earlier estimate of future gross profi ts is recognized in earnings in the period such changes occur. While we expect the long-term care business in the Bankers Life segment to generate future profi ts, the margins are relatively thin and are vulnerable to changes in assumptions.
Th e table presented below summarizes our estimates of cumulative adjustments to insurance acquisition costs or premium defi ciency reserves (when the defi ciency exceeds the balance of insurance acquisition costs) resulting from hypothetical revisions to certain assumptions. Although such hypothetical revisions are not currently required or anticipated, we believe they could occur based on past variances in experience and our expectations of the ranges of future experience that could reasonably occur. We have assumed that revisions to assumptions resulting in the adjustments summarized below would occur equally among policy types, ages and durations within each product classifi cation. Any actual adjustment would be dependent on the specifi c policies aff ected and, therefore, may diff er from the estimates summarized below. In addition, the impact of actual adjustments would refl ect the net eff ect of all changes in assumptions during the period.

CNO FINANCIAL GROUP, INC. - Form 10-K 58
PART II ITEM 7 Management’s Discussion and Analysis of Consolidated Financial Condition and Results of Operations
Change in assumptions
Estimated adjustment to income before income taxes based on revisions to certain assumptions
(dollars in millions) Universal life-type products (a):
5% increase to assumed mortality $ (90)5% decrease to assumed mortality 75 15% increase to assumed expenses (20)15% decrease to assumed expenses 20 10 basis point decrease to assumed spread (25)10 basis point increase to assumed spread 25 10% increase to assumed lapses 5 10% decrease to assumed lapses (5)
Investment-type products: 20% increase to assumed surrenders (70)20% decrease to assumed surrenders 85 15% increase to assumed expenses (10)15% decrease to assumed expenses 10 10 basis point decrease to assumed spread (35)10 basis point increase to assumed spread 35
Other than universal life and investment-type products (b): 5% increase to assumed morbidity (225)50 basis point decrease to investment earnings rate (200)
(a) A significant portion of our universal life-type products inforce are valued in a loss recognition status. A favorable change in experience on such blocks may slow down future amortization; however, the current period adjustment to insurance acquisition costs would be small. This may cause the downside sensitivities to be different in magnitude than the upside sensitivities.
(b) We have excluded the effect of reasonably likely changes in lapse, surrender and expense assumptions for policies other than universal life and investment-type products.
Th e following summarizes the persistency of our major blocks of insurance business summarized by segment and line of business:
Years ended December 31,2012 2011 2010
Bankers Life: Medicare supplement (1) 80.7% 81.7% 82.3%Long-term care (1) 90.4% 90.1% 89.0%Fixed index annuities (2) (3) 90.8% 90.1% 88.7%Other annuities (2) (4) 87.3% 87.4% 86.8%Life (1) (4) 86.2% 87.2% 87.2%
Washington National: Medicare supplement (1) (4) 81.2% 80.9% 78.8%Supplemental health (1) (4) 88.3% 88.4% 88.7%Life (1) (4) 92.4% 93.3% 93.3%
Colonial Penn: Life (1) (4) 84.7% 85.6% 86.1%
Other CNO Business: Long-term care (1) (4) 92.2% 91.7% 91.5%Fixed index annuities (2) 87.9% 86.4% 88.6%Other annuities (1) (4) 91.0% 91.2% 91.2%Life (1) (4) 91.3% 92.3% 94.3%
(1) Based on number of inforce policies.(2) Based on the percentage of the inforce block persisting.(3) We believe this recent increase is related to the lack of competing investment products which would offer higher returns for consumers.(4) These persistency rates are generally in line with our expectations.

CNO FINANCIAL GROUP, INC. - Form 10-K 59
PART II ITEM 7 Management’s Discussion and Analysis of Consolidated Financial Condition and Results of Operations
Liabilities for Insurance Products - reserves for the future payment of long-term care policy claims
We calculate and maintain reserves for the future payment of claims to our policyholders based on actuarial assumptions. For all our insurance products, we establish an active life reserve, a liability for due and unpaid claims, claims in the course of settlement and incurred but not reported claims. In addition, for our health insurance business, we establish a reserve for the present value of amounts not yet due on claims. Many factors can aff ect these reserves and liabilities, such as economic and social conditions, infl ation, hospital and pharmaceutical costs, changes in doctrines of legal liability and extra-contractual damage awards. Th erefore, our reserves and liabilities are necessarily based on numerous estimates and assumptions as well as historical experience. Establishing reserves is an uncertain process, and it is possible that actual claims will materially exceed our reserves and have a material adverse eff ect on our results of operations and fi nancial condition. For example, our long-term care policy claims may be paid over a long period of time and, therefore, loss estimates have a higher degree of uncertainty. We have incurred signifi cant losses beyond our estimates as a result of actual claim costs and persistency of our long-term care business in our Other CNO Business segment. Estimates of unpaid losses related to long-term care business have a higher degree of uncertainty than estimates for our other products due to the range of ultimate duration of these claims and the resulting variability in their cost (in addition to the variations in the lag time in reporting claims). We would not consider a variance of 5-10 percentage points from the initial expected loss ratio to be unusual. As an example, an increase in the initial loss ratio of 5-10 percentage points for claims incurred in 2012 related to our long-term care business (in both our Bankers Life and Other CNO Business segments) would result in a decrease in our earnings of approximately $35 to $72 million. Our fi nancial results depend signifi cantly upon the extent to which our actual claims experience is consistent with the assumptions we used in determining our reserves and pricing our products. If our assumptions with respect to future claims are incorrect, and our reserves are insuffi cient to cover our actual losses and expenses, we would be required to increase our liabilities, which would negatively aff ect our operating results.
Accounting for marketing and reinsurance agreements with Coventry
Th e Medicare Prescription Drug, Improvement and Modernization Act of 2003 provided for the introduction of a PDP product. In order to off er this product to our current and potential future policyholders without investing in management and infrastructure, we entered into a national distribution agreement with Coventry to use our career and independent agents to distribute Coventry’s prescription drug plan, Advantra Rx. We receive a fee based on the premiums collected on plans sold through our distribution channels. In addition, CNO has a quota-share reinsurance agreement with Coventry for CNO enrollees that provides CNO with 50 percent of net premiums and related policy benefi ts subject to a risk corridor.
Th e following describes how we account for and report our PDP business:
Our accounting for the national distribution agreement
• We recognize distribution income based on a fi xed fee per PDP contract. Th is fee income is recognized over the calendar year term as premiums are collected. • We also pay commissions to our agents who sell the plans on behalf of Coventry. Th ese payments are deferred and amortized over the remaining term of the initial enrollment period (the one-year life of the initial policy).
Our accounting for the quota-share agreement
• We recognize premium revenue evenly over the period of the underlying Medicare Part D contracts. • We recognize policyholder benefi ts and ceding commission expense as incurred. • We recognize risk-share premium adjustments consistent with Coventry’s risk-share agreement with the Centers for Medicare and Medicaid Services.
Th e following summarizes the pre-tax income of the PDP business (dollars in millions):2012 2011 2010
Insurance policy income $ 49.9 $ 54.5 $ 67.8Fee revenue and other 3.0 2.4 3.8Total revenues 52.9 56.9 71.6Insurance policy benefi ts 35.6 45.1 52.6Commission expense 3.9 4.9 6.4Other operating expenses .4 .3 .4Total expense 39.9 50.3 59.4PRE-TAX INCOME $ 13.0 $ 6.6 $ 12.2

CNO FINANCIAL GROUP, INC. - Form 10-K 60
PART II ITEM 7 Management’s Discussion and Analysis of Consolidated Financial Condition and Results of Operations
Income Taxes
Our income tax expense includes deferred income taxes arising from temporary diff erences between the fi nancial reporting and tax bases of assets and liabilities, capital loss carryforwards and NOLs. Deferred tax assets and liabilities are measured using enacted tax rates expected to apply in the years in which temporary diff erences are expected to be recovered or paid. Th e eff ect of a change in tax rates on deferred tax assets and liabilities is recognized in earnings in the period when the changes are enacted.
A reduction of the net carrying amount of deferred tax assets by establishing a valuation allowance is required if, based on the available evidence, it is more likely than not that such assets will not be realized. In assessing the need for a valuation allowance, all available evidence, both positive and negative, shall be considered to determine whether, based on the weight of that evidence, a valuation allowance for deferred tax assets is needed. Th is assessment requires signifi cant judgment and considers, among other matters, the nature, frequency and severity of current and cumulative losses, forecasts of future profi tability, the duration of carryforward periods, our experience with operating loss and tax credit carryforwards expiring unused, and tax planning strategies. We evaluate the need to establish a valuation allowance for our deferred tax assets on an ongoing basis. Th e realization of our deferred tax assets depends upon generating suffi cient future taxable income during the periods in which our temporary diff erences become deductible and before our capital loss carryforwards and NOLs expire.
Based on our assessment, it appears more likely than not that $876 million of our NOLs and capital loss carryforwards will be realized through future taxable earnings. Accordingly, we reduced our deferred tax valuation
allowance by $171.5 million in 2012. We will continue to assess the need for a valuation allowance in the future. If future results are less than projected, a valuation allowance may be required to reduce the deferred tax assets, which could have a material impact on our results of operations in the period in which it is recorded.
Th ere are three principal components of the reduction to our valuation allowance for deferred tax assets in 2012. First, our 2012 taxable operating income, exceeded the amount previously refl ected in our deferred tax valuation model, resulting in a reduction to the valuation allowance of $13.7 million in 2012. Second, we reduced the valuation allowance by $46.6 milion for taxable investment gains realized in 2012. Last, our recent higher levels of operating income resulted in the projection of higher levels of future years taxable income based on evidence we consider to be objective and verifi able. Th is change is further described in the following paragraph and resulted in a reduction to the valuation allowance for deferred tax assets of $111.2 million in 2012.
Our analysis at December 31, 2012, is consistent with the deferred tax valuation model used in the prior year. Our deferred tax valuation model refl ects projections of future taxable income based on a normalized average annual taxable income for the last three years, plus 5 percent growth for the next fi ve years and no growth thereafter. In our new projections, our three year average increased to $292 million, compared to $260 million in our prior projection. Th e projections used to support the recovery of our NOLs do not anticipate the use of tax planning strategies that we could consider in the future to avoid a tax benefi t from expiring. We have evaluated each component of the deferred tax assets and assessed the eff ect of limitations and/or interpretations on the value of each component to be fully recognized in the future.
Changes in our valuation allowance are summarized as follows (dollars in millions):
Balance, December 31, 2009 $ 1,176.4Decrease in 2010 (95.0)(a)
Balance, December 31, 2010 1,081.4 Decrease in 2011 (143.0)(b)
Balance, December 31, 2011 938.4 Decrease in 2012 (171.5)(c)
BALANCE, DECEMBER 31, 2012 $ 766.9(a) The $95.0 million reduction to the deferr ed tax valuation allowance during 2010 r esulted from the utilization of NOLs and c apital loss carr yforwards and higher
projections of future taxable income based on evidence we consider to be objective and verifiable.(b) The $143.0 million reduction to the deferred tax valuation allowance during 2011 resulted primarily from our recent higher levels of operating income when projecting
future taxable income.(c) The $171.5 million reduction to the deferred tax valuation allowance during 2012 resulted primarily from: (i) higher taxable income in 2012 (including inv estment
gains); and (ii) our recent higher levels of operating income when projecting future taxable income as further discussed above.
Recovery of our deferred tax assets is dependent on achieving the future taxable income used in our deferred tax valuation model and failure to do so would result in an increase in the valuation allowance in a future period. Any future increase in the valuation allowance may result in additional income tax expense and reduce shareholders’ equity, and such an increase could have a signifi cant impact upon our earnings in the future. In addition, the use of the Company’s NOLs is dependent, in part, on whether the IRS ultimately agrees with the tax positions we have taken in our tax returns with respect to the allocation of cancellation of indebtedness income (“CODI”) resulting from the bankruptcy of our Predecessor and the classifi cation of the loss we recognized as a result of the transfer of Senior Health to the Independent Trust (as further described below).
Th e Code limits the extent to which losses realized by a non-life entity (or entities) may off set income from a life insurance company (or companies) to the lesser of: (i) 35 percent of the income of the life insurance company; or (ii) 35 percent of the total loss of the non-life entities (including NOLs of the non-life entities). Th ere is no similar limitation on the extent to which losses realized by a life insurance entity (or entities) may off set income from a non-life entity (or entities).
Section 382 of the Code imposes limitations on a corporation’s ability to use its NOLs when the company undergoes an ownership change. Future transactions and the timing of such transactions could cause an ownership change for Section 382 income tax purposes. Such transactions may include, but are not limited to, additional repurchases

CNO FINANCIAL GROUP, INC. - Form 10-K 61
PART II ITEM 7 Management’s Discussion and Analysis of Consolidated Financial Condition and Results of Operations
under our securities repurchase program, issuances of common stock (including upon conversion of our outstanding 7.0% Debentures) and acquisitions or sales of shares of CNO stock by certain holders of our shares, including persons who have held, currently hold or may accumulate in the future fi ve percent or more of our outstanding common stock for their own account. Many of these transactions are beyond our control. If an additional ownership change were to occur for purposes of Section 382, we would be required to calculate an annual restriction on the use of our NOLs to off set future taxable income. Th e
annual restriction would be calculated based upon the value of CNO’s equity at the time of such ownership change, multiplied by a federal long-term tax exempt rate (2.87 percent at December 31, 2012), and the annual restriction could eff ectively eliminate our ability to use a substantial portion of our NOLs to off set future taxable income. We regularly monitor ownership change (as calculated for purposes of Section 382) and, as of December 31, 2012, we were below the 50 percent ownership change level that would trigger further impairment of our ability to utilize our NOLs.
As of December 31, 2012, we had $3.8 billion of federal NOLs and $.8 billion of capital loss carryforwards, which expire as follows (dollars in millions):
Year of expirationNet operating loss carryforwards (a) Capital loss
carryforwardsTotal loss
carryforwardsLife Non-life2013 $ — $ — $ 808.6(b) $ 808.62014 — — 28.6 28.62015 — — 9.1 9.12018 475.0(a) — — 475.02021 29.5 — — 29.52022 204.1 — — 204.12023 —(b) 2,603.1(a) — 2,603.12024 — 3.2 — 3.22025 — 118.8 — 118.82027 — 216.8 — 216.82028 — .5 — .52029 — 148.9 — 148.92032 — .8 — .8Total $ 708.6 $ 3,092.1 $ 846.3 $ 4,647.0(a) The life/non-life allocation summarized above assumes the IRS does not ultimately agree with the tax position we have taken in our tax returns with respect to the allocation
of CODI. If the IRS ultimately agrees with our tax position, appr oximately $631 million of the non-life NOLs expiring in 2023 w ould be characterized as life NOLs expiring in 2018.
(b) The allocation of the capital loss carr yforwards summarized above assumes the IRS does not ultimately agr ee with the tax position we have taken with r espect to our investment in Senior Health, which was worthless when it was transferred to the Independent Trust in 2008. If the IRS ultimately agrees with our tax position of classifying this loss as ordinary, capital loss carryforwards expiring in 2013 would decrease and life NOLs expiring in 2023 would increase by $742.0 million.
As more fully discussed below, the following interpretations of the tax law may have an impact on our ability to utilize our NOLs and are uncertain tax positions of the Company: (i) whether the CODI recognized in conjunction with our bankruptcy should be classifi ed as a reduction to life or non-life NOLs; and (ii) whether the loss on our investment in Senior Health should be classifi ed as an NOL or a capital loss carryforward. Th e recorded NOLs and capital loss carryforwards related to these items are fully off set by tax valuation allowances, as it is uncertain whether such assets will be realized.
In July 2006, the Joint Committee of Taxation accepted the audit and the settlement which characterized $2.1 billion of the tax losses on our Predecessor’s investment in Conseco Finance Corp. as life company losses and the remaining $3.8 billion as non-life losses prior to the application of the CODI attribute reductions described below.
Th e Code provides that any income realized as a result of the CODI in bankruptcy must reduce NOLs. We realized $2.5 billion of CODI when we emerged from bankruptcy. Pursuant to the Company’s interpretation of the tax law, the CODI reductions were all used to reduce non-life NOLs and this position has been taken in our tax returns. However, the IRS has issued a proposed adjustment which is not in agreement with our position. We have requested an appeal of the IRS proposed
adjustment through their early appeals process. Due to uncertainties with respect to the position the IRS may take and limitations on our ability to utilize NOLs based on projected life and non-life income, we have consistently considered the $631 million of CODI to be a reduction to life NOLs when determining our valuation allowance, pending resolution. If the IRS ultimately agrees with our position that the $631 million of CODI is a reduction to non-life NOLs, our valuation allowance would be reduced by approximately $140 million based on the income projection used in determining our valuation allowance. Th e outcome of this uncertainty cannot be predicted.
We recognized a $742 million loss on our investment in Senior Health which was worthless when it was transferred to the Independent Trust in 2008. We have treated the loss as a capital loss when determining the deferred tax benefi t we may receive. We also established a full valuation allowance as we believe we will not generate capital gains to utilize the benefi t. However, due to uncertainties in the Code, we have refl ected this loss as an ordinary loss in our tax return, contrary to certain IRS rulings. If classifying this loss as ordinary is ultimately determined to be correct, our valuation allowance would be reduced by approximately $145 million based on income projections used in determining our valuation allowance.

CNO FINANCIAL GROUP, INC. - Form 10-K 62
PART II ITEM 7 Management’s Discussion and Analysis of Consolidated Financial Condition and Results of Operations
A reconciliation of the beginning and ending amount of unrecognized tax benefi ts for the years ended December 31, 2012 and 2011 is as follows (dollars in millions):
Years ended December 31,2012 2011
Balance at beginning of year $ 318.2 $ 311.1Increase based on tax positions taken in prior years 7.3 7.1Decrease based on tax positions taken in prior years (15.0) —
BALANCE AT END OF YEAR $ 310.5 $ 318.2
As of December 31, 2012 and 2011, $285.0 million and $300.0 million, respectively, of our unrecognized tax benefi ts, if recognized, would have resulted in a decrease in our valuation allowance for deferred tax assets. Th e remaining balances relate to timing diff erences which, if recognized, would have no eff ect on the Company’s tax expense or our evaluation of the valuation allowance for deferred tax assets. Th e Company recognizes interest and penalties related to unrecognized tax benefi ts as income tax expense in the consolidated statement of operations. Included in tax expense in 2012 and 2011 is $.7 million and $1.1 million, respectively, of interest. No such amounts were recognized in 2010. Th e liability for accrued interest was $1.8 million and $1.1 million at December 31, 2012 and 2011, respectively.
Tax years 2004 and 2008 through 2010 are open to examination by the IRS through September 2014, while tax year 2011 is open through September 2015. Th e Company’s various state income tax returns are generally open for tax years 2009 through 2011 based on the individual state statutes of limitation. Generally, for tax years which generate NOLs, capital losses or tax credit carryforwards, the statute of limitations does not close until the expiration of the statute of limitations for the tax year in which such carryforwards are utilized.
Liabilities for Insurance Products
At December 31, 2012, the total balance of our liabilities for insurance products was $25.1 billion. Th ese liabilities are generally payable over an extended period of time and the profi tability of the related products is dependent on the pricing of the products and other factors. Diff erences between our expectations when we sold these products and our actual experience could result in future losses.
We calculate and maintain reserves for the future payment of claims to our policyholders based on actuarial assumptions. For our insurance products, we establish an active life reserve, a liability for due and unpaid claims, claims in the course of settlement and incurred but not reported claims. In addition, for our health insurance business, we establish a reserve for the present value of amounts not yet due on claims. Many factors can aff ect these reserves and liabilities, such as economic and social conditions, infl ation, hospital and pharmaceutical costs, changes in doctrines of legal liability and extra-contractual damage awards. Th erefore, our reserves and liabilities are necessarily based on numerous estimates and assumptions as well as historical experience.
Establishing reserves is an uncertain process, and it is possible that actual claims will materially exceed our reserves and have a material adverse eff ect on our results of operations and fi nancial condition. We have incurred signifi cant losses beyond our estimates as a result of actual claim costs and persistency of our long-term care business in the Other CNO Business segment. Our fi nancial results depend signifi cantly upon the extent to which our actual claims experience is consistent with the assumptions we used in determining our reserves and pricing our products. If our assumptions with respect to future claims are incorrect, and our reserves are insuffi cient to cover our actual losses and expenses, we would be required to increase our liabilities, which would negatively aff ect our operating results.
Liabilities for insurance products are calculated using management’s best judgments, based on our past experience and standard actuarial tables, of mortality, morbidity, lapse rates, investment experience and expense levels.
Accounting for Long-term Care Premium Rate Increases
Many of our long-term care policies have been subject to premium rate increases. In some cases, these premium rate increases were materially consistent with the assumptions we used to value the particular block of business at the Eff ective Date. With respect to certain premium rate increases, some of our policyholders were provided an option to cease paying their premiums and receive a non-forfeiture option in the form of a paid-up policy with limited benefi ts. In addition, our policyholders could choose to reduce their coverage amounts and premiums in the same proportion, when permitted by our contracts
or as required by regulators. Th e following describes how we account for these policyholder options:
• Premium rate increases - If premium rate increases refl ect a change in our previous rate increase assumptions, the new assumptions are not refl ected prospectively in our reserves. Instead, the additional premium revenue resulting from the rate increase is recognized as earned and original assumptions continue to be used to determine changes to liabilities for insurance products unless a premium defi ciency exists.

CNO FINANCIAL GROUP, INC. - Form 10-K 63
PART II ITEM 7 Management’s Discussion and Analysis of Consolidated Financial Condition and Results of Operations
• Benefi t reductions - If there is a premium rate increase on one of our long-term care policies, a policyholder may choose reduced coverage with a proportionate reduction in premium, when permitted by our contracts. Th is option does not require additional underwriting. Benefi t reductions are treated as a partial lapse of coverage, and the balance of our reserves and deferred insurance acquisition costs is reduced in proportion to the reduced coverage. • Non-forfeiture benefi ts off ered in conjunction with a rate increase - In some cases, non-forfeiture benefi ts are off ered to policyholders who wish to lapse their policies at the time of a signifi cant rate increase. In these cases, exercise of this option is treated as an extinguishment of the original contract and issuance of a new contract. Th e balance of our reserves and deferred insurance acquisition costs are released, and a reserve for the new contract is established. • Florida Order - In 2004, the Florida Offi ce of Insurance Regulation issued an order regarding home health care business in Florida in our Other CNO Business segment. Th e order required a choice of three alternatives to be off ered to holders of home health care policies in Florida subject to premium rate increases as follows: – retention of their current policy with a rate increase of 50 percent in the fi rst year and actuarially justifi ed increases in subsequent years;
– receipt of a replacement policy with reduced benefi ts and a rate increase in the fi rst year of 25 percent and no more than 15 percent in subsequent years; or
– receipt of a paid-up policy, allowing the holder to fi le future claims up to 100 percent of the amount of premiums paid since the inception of the policy.
Reserves for all three groups of policies under the order were prospectively adjusted using the prospective revision methodology described above, as these alternatives were required by the Florida Offi ce of Insurance Regulation. Th ese policies had no insurance acquisition costs established at the Eff ective Date.
Some of our policyholders may receive a non-forfeiture benefi t if they cease paying their premiums pursuant to their original contract (or pursuant to changes made to their original contract as a result of a litigation settlement made prior to the Eff ective Date or an order issued by the Florida Offi ce of Insurance Regulation). In these cases, exercise of this option is treated as the exercise of a policy benefi t, and the reserve for premium paying benefi ts is reduced, and the reserve for the non-forfeiture benefi t is adjusted to refl ect the election of this benefi t.
Liabilities for Loss Contingencies Related to Lawsuits
Th e Company and its subsidiaries are involved in various legal actions in the normal course of business, in which claims for compensator y and punitive damages are asserted, some for substantial amounts. We recognize an estimated loss from these loss contingencies when we believe it is probable that a loss has been incurred and the amount of the loss can be reasonably estimated. Some of the pending matters have been fi led as purported class actions and some actions have been fi led in certain jurisdictions that permit punitive damage awards that are disproportionate to the actual damages incurred. Th e amounts sought in certain of these actions are often large or indeterminate and the ultimate outcome of certain actions is diffi cult to predict. In the event of an adverse outcome in one or more of these matters, there is a possibility that the ultimate liability may be in excess of the liabilities we have established and could have a material adverse eff ect on our business, fi nancial condition, results of operations and cash fl ows. In addition, the resolution of pending or future litigation may involve modifi cations to the terms of outstanding insurance policies or could impact the timing and amount of rate increases, which could adversely aff ect the future profi tability of the related insurance policies. Based upon information presently available, and in light of legal, factual and other defenses available to the Company and its subsidiaries, the Company does not believe that it is probable that the ultimate liability from either pending or threatened legal actions, after consideration of existing loss provisions, will have a material adverse eff ect on the Company’s consolidated fi nancial condition, operating results or cash
fl ows. However, given the inherent diffi culty in predicting the outcome of legal proceedings, there exists the possibility such legal actions could have a material adverse eff ect on the Company’s consolidated fi nancial condition, operating results or cash fl ows.
In addition to the inherent diffi culty of predicting litigation outcomes, particularly those that will be decided by a jury, many of these matters purport to seek substantial or an unspecifi ed amount of damages for unsubstantiated conduct spanning several years based on complex legal theories and damages models. Th e alleged damages typically are indeterminate or not factually supported in the complaint, and, in any event, the Company’s experience indicates that monetary demands for damages often bear little relation to the ultimate loss. In some cases, plaintiff s are seeking to certify classes in the litigation and class certifi cation either has been denied or is pending and we have fi led oppositions to class certifi cation or sought to decertify a prior class certifi cation. In addition, for many of these cases: (i) there is uncertainty as to the outcome of pending appeals or motions; (ii) there are signifi cant factual issues to be resolved; and/or (iii) there are novel legal issues presented. Accordingly, the Company can not reasonably estimate the possible loss or range of loss in excess of amounts accrued, if any, or predict the timing of the eventual resolution of these matters. Th e Company reviews these matters on an ongoing basis. When assessing reasonably possible and probable outcomes, the Company bases its assessment on the expected ultimate outcome following all appeals.

CNO FINANCIAL GROUP, INC. - Form 10-K 64
PART II ITEM 7 Management’s Discussion and Analysis of Consolidated Financial Condition and Results of Operations
Results of Operations
We manage our business through the following operating segments: Bankers Life, Washington National and Colonial Penn, which are defi ned on the basis of product distribution; Other CNO Business, comprised primarily of products we no longer sell actively; and corporate
operations, comprised of holding company activities and certain noninsurance company businesses.
Please read this discussion in conjunction with the consolidated fi nancial statements and notes included in this Form 10-K.
Th e following tables and narratives summarize the operating results of our segments (dollars in millions):
2012 2011 2010Income (loss) before net realized investment gains (losses) and fair value changes in embedded derivative liabilities, net of related amortization and income taxes (a non-GAAP measure) (a):
Bankers Life $ 300.9 $ 290.9 $ 237.5 Washington National 127.1 96.1 100.4 Colonial Penn (8.6) (4.7) 4.2 Other CNO Business (48.8) 15.3 (9.2)Corporate operations (86.5) (124.0) (122.1)
284.1 273.6 210.8 Net realized investment gains (losses), net of related amortization:
Bankers Life 48.7 42.7 54.1 Washington National 6.7 2.0 (7.4)Colonial Penn 7.2 5.8 6.6 Other CNO Business 10.2 5.9 (28.9)Corporate operations 1.8 — (3.5)
74.6 56.4 20.9 Fair value changes in embedded derivative liabilities, net of related amortization:
Bankers Life (2.8) (19.8) — Other CNO Business — (.6) —
(2.8) (20.4) — Loss on extinguishment of debt:
Corporate operations (200.2) (3.4) (6.8) Income (loss) before income taxes:
Bankers Life 346.8 313.8 291.6 Washington National 133.8 98.1 93.0 Colonial Penn (1.4) 1.1 10.8 Other CNO Business (38.6) 20.6 (38.1)Corporate operations (284.9) (127.4) (132.4)
INCOME BEFORE INCOME TAXES $ 155.7 $ 306.2 $ 224.9(a) These non-GAAP measures as presented in the above table and in the following segment financial data and discussions of segment results exclude net realized investment
gains (losses) and fair value of embedded derivative liabilities, net of related amortization and before income taxes. These are considered non-GAAP financial measures. A non-GAAP measure is a numerical measure of a company’s performance, financial position, or cash flows that excludes or includes amounts that are normally excluded or included in the most directly comparable measure calculated and presented in accordance with GAAP. These non-GAAP financial measures of “income (loss) before net realized investment gains (losses) and fair value of embedded derivative liabilities, net of related amortization, and before income taxes” differ from “income (loss) before income taxes” as presented in our consolidated statement of operations prepared in accordance with GAAP due to the exclusion of before tax realized investment gains (losses) and fair value of embedded derivative liabilities, net of related amortization. We measure segment performance excluding realized investment gains (losses) and fair value of embedded derivative liabilities because we believe that this performance measure is a better indicator of the ongoing businesses and trends in our business. Our primary investment focus is on investment income to support our liabilities for insurance products as opposed to the generation of realized investment gains (losses), and a long-term focus is necessary to maintain profitability over the life of the business. Realized investment gains (losses) and fair value of embedded derivative liabilities depend on market conditions and do not necessarily relate to decisions regarding the underlying business of our segments. However, “income (loss) before net realized investment gains (losses) and fair value of embedded derivative liabilities, net of related amortization, and before income taxes” does not replace “income (loss) before income taxes” as a measure of overall profitability. We may experience realized investment gains (losses), which will affect future earnings levels since our underlying business is long-term in nature and we need to earn the assumed interest rates on the investments backing our liabilities for insurance products to maintain the profitability of our business. In addition, management uses this non-GAAP financial measure in its budgeting process, financial analysis of segment performance and in assessing the allocation of resources. We believe these non-GAAP financial measures enhance an investor’s understanding of our financial performance and allows them to make more informed judgments about the Company as a whole. These measures also highlight operating trends that might not otherwise be transparent. The table above reconciles the non-GAAP measure to the corresponding GAAP measure.

CNO FINANCIAL GROUP, INC. - Form 10-K 65
PART II ITEM 7 Management’s Discussion and Analysis of Consolidated Financial Condition and Results of Operations
General: CNO is the top tier holding company for a group of insurance companies operating throughout the United States that develop, market and administer health insurance, annuity, individual life insurance and other insurance products. We distribute these products through our
Bankers Life segment, which utilizes a career agency force, through our Colonial Penn segment, which utilizes direct response marketing, and through our Washington National segment, which utilizes independent producers.
Bankers Life (dollars in millions)
Premium collections: 2012 2011 2010Annuities $ 709.0 $ 985.5 $ 1,005.5 Medicare supplement and other supplemental health 1,323.9 1,330.6 1,360.1 Life 314.6 250.0 209.6
Total collections $ 2,347.5 $ 2,566.1 $ 2,575.2 Average liabilities for insurance products:
Annuities: Mortality based $ 231.7 $ 241.4 $ 250.1 Fixed index 2,831.5 2,350.5 1,833.6 Deposit based 4,548.1 4,768.9 4,899.7
Medicare supplement and other supplemental health 4,748.1 4,547.6 4,355.3 Life:
Interest sensitive 448.9 428.6 412.9 Non-interest sensitive 520.9 428.2 355.3
Total average liabilities for insurance products, net of reinsurance ceded $ 13,329.2 $ 12,765.2 $ 12,106.9 Revenues:
Insurance policy income $ 1,657.4 $ 1,612.4 $ 1,596.2 Net investment income:
General account invested assets 817.6 780.3 719.3 Fixed index products 21.3 (14.0) 32.6 Other special-purpose portfolios — — 7.0
Fee revenue and other income 15.2 13.8 12.8 Total revenues 2,511.5 2,392.5 2,367.9 Expenses:
Insurance policy benefi ts 1,417.9 1,361.7 1,376.5 Amounts added to policyholder account balances:
Annuity products and interest-sensitive life products other than fi xed index products 147.9 161.2 175.3 Fixed index products 77.1 47.2 55.5
Amortization related to operations 187.6 206.3 207.9 Interest expense on investment borrowings 5.3 4.8 1.0 Other operating costs and expenses 374.8 320.4 314.2
Total benefi ts and expenses 2,210.6 2,101.6 2,130.4 Income before net realized investment gains (losses) and fair value changes in embedded derivative liabilities, net of related amortization, and income taxes 300.9 290.9 237.5
Net realized investment gains (losses) 53.0 47.9 62.1 Amortization related to net realized investment gains (losses) (4.3) (5.2) (8.0)
Net realized investment gains (losses), net of related amortization 48.7 42.7 54.1 Insurance policy benefi ts - fair value changes in embedded derivative liabilities (4.5) (31.2) — Amortization related to fair value changes in embedded derivative liabilities 1.7 11.4 —
Fair value changes in embedded derivative liabilities, net of related amortization (2.8) (19.8) — INCOME BEFORE INCOME TAXES $ 346.8 $ 313.8 $ 291.6

CNO FINANCIAL GROUP, INC. - Form 10-K 66
PART II ITEM 7 Management’s Discussion and Analysis of Consolidated Financial Condition and Results of Operations
2012 2011 2010Health benefi t ratios:
All health lines: Insurance policy benefi ts $ 1,196.7 $ 1,181.5 $ 1,206.5 Benefi t ratio (a) 89.1% 87.7% 88.3%
Medicare supplement: Insurance policy benefi ts $ 508.5 $ 495.4 $ 505.6 Benefi t ratio (a) 69.0% 69.0% 70.9%
PDP: Insurance policy benefi ts $ 35.6 $ 45.1 $ 52.7 Benefi t ratio (a) 71.4% 82.8% 77.7%
PFFS: Insurance policy benefi ts $ (.5) $ (1.6) $ (18.1)Benefi t ratio (a) N/A N/A N/A
Long-term care: Insurance policy benefi ts $ 653.1 $ 642.6 $ 666.3 Benefi t ratio (a) 117.6% 112.6% 113.7%Interest-adjusted benefi t ratio (b) 71.2% 68.8% 73.0%
(a) We calculate benefit ratios by dividing the related product’s insurance policy benefits by insurance policy income.(b) We calculate the interest-adjusted benefit ratio (a non-GAAP measure) for Bankers Life’s long-term care products by dividing such product’s insurance policy benefits less the
imputed interest income on the accumulated assets backing the insurance liabilities by policy income. These are considered non-GAAP financial measures. A non-GAAP measure is a numerical measure of a company’s performance, financial position, or cash flows that excludes or includes amounts that are normally excluded or included in the most directly comparable measure calculated and presented in accordance with GAAP. These non-GAAP financial measures of “interest-adjusted benefit ratios” differ from “benefit ratios” due to the deduction of imputed interest income on the accumulated assets backing the insurance liabilities from the product’s insurance policy benefits used to determine the ratio. Interest income is an important factor in measuring the performance of health products that are expected to be inforce for a longer duration of time, are not subject to unilateral changes in provisions (such as non-cancelable or guaranteed renewable contracts) and require the performance of various functions and services (including insurance protection) for an extended period of time. The net cash flows from long-term care products generally cause an accumulation of amounts in the early years of a policy (accounted for as reserve increases) that will be paid out as benefits in later policy years (accounted for as reserve decreases). Accordingly, as the policies age, the benefit ratio will typically increase, but the increase in benefits will be partially offset by the imputed interest income earned on the accumulated assets. The interest-adjusted benefit ratio reflects the effects of such interest income offset. Since interest income is an important factor in measuring the performance of this product, management believes a benefit ratio that includes the effect of interest income is useful in analyzing product performance. We utilize the interest-adjusted benefit ratio in measuring segment performance because we believe that this performance measure is a better indicator of the ongoing businesses and trends in the business. However, the “interest-adjusted benefit ratio” does not replace the “benefit ratio” as a measure of current period benefits to current period insurance policy income. Accordingly, management reviews both “benefit ratios” and “interest-adjusted benefit ratios” when analyzing the financial results attributable to these products. The imputed investment income earned on the accumulated assets backing Bankers Life’s long-term care reserves was $257.8 million, $249.8 million and $238.8 million in 2012, 2011 and 2010, respectively.
Total premium collections were $2,347.5 million in 2012, down 8.5 percent from 2011, and $2,566.1 million in 2011, down .4 percent from 2010. See “Premium Collections” for further analysis of Bankers Life’s premium collections.
Average liabilities for insurance products, net of reinsurance ceded were $13.3 billion in 2012, up 4.4 percent from 2011 and $12.8 billion in 2011, up 5.4 percent from 2010. Th e increase in such liabilities was primarily due to increases in new sales of these products.
Insurance policy income is comprised of premiums earned on policies which provide mortality or morbidity coverage and fees and other charges assessed on other policies.
Net investment income on general account invested assets (which excludes income on policyholder accounts) increased 4.8 percent, to $817.6 million, in 2012 and 8.5 percent, to $780.3 million, in 2011. Th e average balance of general account invested assets was $14.2 billion, $13.6 billion and $12.3 billion in 2012, 2011 and 2010, respectively. Th e average yield on these assets was 5.74 percent in 2012, 5.75 percent in 2011 and 5.84 percent in 2010. Th e increase in general account invested assets is primarily due to: (i) sales and increased persistency of our annuity and health products in recent periods; and (ii) the proceeds from collateralized borrowings from the Federal Home Loan Bank (“FHLB”) pursuant to an investment borrowing program that commenced in September 2010. Th e increase in net investment income in 2012 and 2011 refl ects the growth in general account
invested assets and prepayment income. Prepayment income was $11.6 million, $15.4 million and $11.0 million in 2012, 2011 and 2010, respectively. Investing in higher yielding investments and reduction to turnover rates to preserve higher yielding investments has resulted in maintaining overall yields in this segment when compared to the prior year. However, current market conditions are more challenging and we expect to see the overall yield decline in future periods. Th e decline in average yield in 2011 is primarily due to the increase in variable rate investments purchased with the proceeds from the collateralized borrowings from the FHLB.
Net investment income related to fi xed index products represents the change in the estimated fair value of options which are purchased in an eff ort to off set or hedge certain potential benefi ts accruing to the policyholders of our fi xed index products. Our fi xed index products are designed so that investment income spread is expected to be more than adequate to cover the cost of the options and other costs related to these policies. Net investment income (loss) related to fi xed index products was $21.3 million, $(18.0) million and $21.1 million in 2012, 2011 and 2010, respectively. Such amounts were mostly off set by the corresponding charge (credit) to amounts added to policyholder account balances for fi xed index products. Such income and related charges fl uctuate based on the value of options embedded in the segment’s fi xed index annuity policyholder account balances subject to this benefi t and to the performance of the index to which the returns on such products are linked. For periods prior to June 30, 2011,

CNO FINANCIAL GROUP, INC. - Form 10-K 67
PART II ITEM 7 Management’s Discussion and Analysis of Consolidated Financial Condition and Results of Operations
net investment income related to fi xed index products also included income on trading securities which were held to off set the change in estimated fair values of the embedded derivatives related to our fi xed index products caused by interest rate fl uctuations. During the second quarter of 2011, we discontinued and liquidated this trading portfolio. Trading account income was $4.0 million and $11.5 million in 2011 and 2010, respectively.
Net investment income on other special-purpose portfolios in 2010 primarily includes the income related to Company-owned life insurance (“COLI”) which was purchased as an investment vehicle to fund the deferred compensation plan for certain agents. Th e COLI assets are not assets of the deferred compensation plan, and as a result, are accounted for outside the plan and are recorded in the consolidated balance sheet as other invested assets. Changes in the cash surrender value (which approximates net realizable value) of the COLI assets were recorded as net investment income and totaled $5.0 million in 2010. Beginning in the fi rst quarter of 2011, the Bankers Life segment is allocated a return on COLI investments equivalent to the yield on the Company’s overall portfolio (classifi ed as net investment income on general account assets); and the Corporate Operations segment is allocated any diff erence between the actual COLI return and the amount allocated to the Bankers Life segment.
Fee revenue and other income was $15.2 million in 2012, compared to $13.8 million in 2011, and $12.8 million in 2010. We recognized fee income of $14.9 million, $11.8 million and $11.4 million in 2012, 2011 and 2010, respectively, pursuant to marketing agreements to sell PFFS, PDP and Medicare Advantage products of other insurance companies.
Insurance policy benefi ts fl uctuated as a result of the factors summarized below for benefi t ratios. Benefi t ratios are calculated by dividing the related insurance product’s insurance policy benefi ts by insurance policy income.
Th e Medicare supplement business consists of both individual and group policies. Government regulations generally require us to attain and maintain a ratio of total benefi ts incurred to total premiums earned (excluding changes in policy benefi t reserves), after three years from the original issuance of the policy and over the lifetime of the policy, of not less than 65 percent on individual products and not less than 75 percent on group products, as determined in accordance with statutory accounting principles. Since the insurance product liabilities we establish for Medicare supplement business are subject to signifi cant estimates, the ultimate claim liability we incur for a particular period is likely to be diff erent than our initial estimate. Our insurance policy benefi ts refl ected reserve redundancies from prior years of $13.7 million, $12.4 million and $8.1 million in 2012, 2011 and 2010, respectively. Excluding the eff ects of prior period claim reserve redundancies, our benefi t ratios would have been 70.8 percent, 70.7 percent and 72.1 percent in 2012, 2011 and 2010, respectively. In 2013, we currently expect the benefi t ratio on this Medicare supplement business will be approximately 71 percent.
Th e insurance policy benefi ts on our PDP and PFFS business result from our quota-share reinsurance agreements with Coventry. Coventry ceased selling PFFS plans eff ective January 1, 2010. Eff ective January 1, 2010, the Company no longer assumes the underwriting risk related to PFFS business. Insurance margins (insurance policy income less insurance policy benefi ts) on the PDP business were $14.3 million, $9.4 million and $15.2 million in 2012, 2011 and 2010, respectively. In 2012, 2011 and 2010, reserves related to the terminated PFFS business were
released due to favorable claim developments resulting in insurance policy benefi ts of $(.5) million, $(1.6) million and $(18.1) million, respectively.
Th e net cash fl ows from our long-term care products generally cause an accumulation of amounts in the early years of a policy (accounted for as reserve increases) which will be paid out as benefi ts in later policy years (accounted for as reserve decreases). Accordingly, as the policies age, the benefi t ratio typically increases, but the increase in reserves is partially off set by investment income earned on the accumulated assets. Th e benefi t ratio on our long-term care business in the Bankers Life segment was 117.6 percent, 112.6 percent and 113.7 percent in 2012, 2011 and 2010, respectively. Th e interest-adjusted benefi t ratio on this business was 71.2 percent, 68.8 percent and 73.0 percent in 2012, 2011 and 2010, respectively. In 2013, we currently expect the interest adjusted benefi t ratio on this long-term care business will be approximately 75 percent. Since the insurance product liabilities we establish for long-term care business are subject to signifi cant estimates, the ultimate claim liability we incur for a particular period is likely to be diff erent than our initial estimate. Our insurance policy benefi ts refl ected reserve redundancies from prior years of $26.6 million, $25.3 million and $26.3 million in 2012, 2011 and 2010, respectively. Excluding the eff ects of prior year claim reserve redundancies, our benefi t ratios would have been 122.4 percent, 117.0 percent and 118.2 percent in 2012, 2011 and 2010, respectively. When policies lapse, active life reserves for such lapsed policies are released, resulting in decreased insurance policy benefi ts (although such decrease is somewhat off set by additional amortization expense). Th e benefi t ratio in 2012 increased as the business continues to age and as new business becomes less of a component of the overall inforce business; partially off set by higher investment income.
Over the past several years, we have implemented rate increases in the long-term care block in the Bankers Life segment. In October 2010, we commenced additional rate increase fi lings on certain long-term care blocks. Approximately $36 million of approvals were received from this round of rate increases. In 2012 and 2011, the income before income taxes in the Bankers Life segment refl ected a reduction in insurance policy benefi ts partially off set by additional amortization of insurance acquisition costs due to the impacts of recent rate increases. Th ese impacts netted to approximately $18 million in 2012 and $23 million in 2011 and included: (i) the reduction in liabilities for policyholders choosing to lapse their policies rather than paying higher rates; (ii) the reduction in liabilities for policyholders choosing to reduce their coverages to achieve a lower cost; off set by (iii) the increase in the liabilities related to waiver of premium benefi ts to refl ect higher premiums after the rate increases; and (iv) increased amortization of insurance acquisition costs resulting from the increase in lapses. Th e net impacts described above are expected to be lower in future periods as re-rating activity slows given we have completed several rounds of rate actions on underperforming blocks of long-term care business in recent years.
Amounts added to policyholder account balances for annuity products and interest-sensitive life products were $147.9 million, $161.2 million and $175.3 million in 2012, 2011 and 2010, respectively. Th e weighted average crediting rates for these products was 3.0 percent, 3.1 percent and 3.3 percent in 2012, 2011 and 2010, respectively. Th e average liabilities of the deposit-based annuity block was $4.5 billion, $4.8 billion and $4.9 billion in 2012, 2011 and 2010, respectively.
Amounts added to fi xed index products based on change in value of the indices will generally fl uctuate with the corresponding related investment income accounts described above.

CNO FINANCIAL GROUP, INC. - Form 10-K 68
PART II ITEM 7 Management’s Discussion and Analysis of Consolidated Financial Condition and Results of Operations
Amortization related to operations includes amortization of insurance acquisition costs. Insurance acquisition costs are generally amortized either: (i) in relation to the estimated gross profi ts for universal life and investment-type products; or (ii) in relation to actual and expected premium revenue for other products. In addition, for universal life and investment-type products, we are required to adjust the total amortization recorded to date through the statement of operations if actual experience or other evidence suggests that earlier estimates of future gross profi ts should be revised. Accordingly, amortization for universal life and investment-type products is dependent on the profi ts realized during the period and on our expectation of future profi ts. For other products, we amortize insurance acquisition costs in relation to actual and expected premium revenue, and amortization is only adjusted if expected premium revenue changes or if we determine the balance of these costs is not recoverable from future profi ts. Bankers Life’s amortization expense was $187.6 million, $206.3 million and $207.9 million in 2012, 2011 and 2010, respectively. During the fi rst quarter of 2011, we experienced higher policy lapses than we
anticipated on our Medicare supplement products, including lapses where policyholders terminated their current policy and purchased a lower cost policy off ered through this segment. Th ese lapses reduced our estimates of future expected premium income and, accordingly, we recognized additional amortization expense of $6 million. Amortization expense related to our annuity block decreased in 2012 due to higher persistency on this business.
Interest expense on investment borrowings represents interest expense on collateralized borrowings as further described in the note to the consolidated fi nancial statements entitled “Summary of Signifi cant Accounting Policies - Investment Borrowings”.
Other operating costs and expenses in our Bankers Life segment were $374.8 million in 2012, up 17 percent from 2011, and were $320.4 million in 2011, up 2.0 percent from 2010. Other operating expenses in 2012 refl ect higher legal and regulatory expenses of approximately $24 million. Other operating costs and expenses include the following (dollars in millions):
2012 2011 2010Expenses related to the marketing and quota-share agreements with Coventry $ 9.8 $ 9.6 $ 13.6Commission expense and agent manager benefi ts 61.1 53.3 48.9Other operating expenses 303.9 257.5 251.7TOTAL $ 374.8 $ 320.4 $ 314.2
Net realized investment gains (losses) fl uctuated each period. During 2012, net realized investment gains in this segment included $61.7 million of net gains from the sales of investments (primarily fi xed maturities) and $8.7 million of writedowns of investments for other than temporary declines in fair value recognized through net income. During 2011, net realized investment gains in this segment included $55.8 million of net gains from the sales of investments (primarily fi xed maturities) and $7.9 million of writedowns of investments for other than temporary declines in fair value recognized through net income ($11.4 million, prior to the $3.5 million of impairment losses recognized through accumulated other comprehensive income (loss)). During 2010, net realized investment gains in this segment included $116.8 million of net gains from the sales of investments (primarily fi xed maturities) and $54.7 million of writedowns of investments for other than temporary declines in fair value recognized through net income ($50.7 million, prior to the $(4.0) million of impairment losses recognized through accumulated other comprehensive income (loss)).
Amortization related to net realized investment losses is the increase or decrease in the amortization of insurance acquisition costs which results from realized investment gains or losses. When we sell securities
which back our universal life and investment-type products at a gain (loss) and reinvest the proceeds at a diff erent yield, we increase (reduce) the amortization of insurance acquisition costs in order to refl ect the change in estimated gross profi ts due to the gains (losses) realized and the resulting eff ect on estimated future yields. Sales of fi xed maturity investments resulted in an increase in the amortization of insurance acquisition costs of $4.3 million, $5.2 million and $8.0 million in 2012, 2011 and 2010, respectively.
Insurance policy benefi ts - fair value changes in embedded derivative liabilities represents fair value changes due to fl uctuations in the interest rates used to discount embedded derivative liabilities related to our fi xed index annuities. Prior to June 30, 2011, we held certain trading securities to off set the income statement volatility caused by the interest rate fl uctuations. In the second quarter of 2011, we sold this trading portfolio.
Amortization related to fair value changes in embedded derivative liabilities is the increase or decrease in the amortization of insurance acquisition costs which results from changes in interest rates used to discount embedded derivative liabilities related to our fi xed index annuities.

CNO FINANCIAL GROUP, INC. - Form 10-K 69
PART II ITEM 7 Management’s Discussion and Analysis of Consolidated Financial Condition and Results of Operations
Washington National (dollars in millions)
2012 2011 2010Premium collections:
Medicare supplement and other supplemental health $ 576.3 $ 569.8 $ 564.9 Life 14.2 16.0 16.2
Total collections $ 590.5 $ 585.8 $ 581.1 Average liabilities for insurance products:
Medicare supplement and other supplemental health $ 2,419.4 $ 2,436.2 $ 2,470.1 Non-interest sensitive life 199.4 201.4 206.7
Total average liabilities for insurance products, net of reinsurance ceded $ 2,618.8 $ 2,637.6 $ 2,676.8 Revenues:
Insurance policy income $ 590.4 $ 585.1 $ 581.0 Net investment income:
General account invested assets 204.0 189.4 184.2 Trading account income related to reinsurer accounts .6 3.8 2.5 Change in value of embedded derivatives related to modifi ed coinsurance agreements (.5) (3.7) (1.3)
Fee revenue and other income 1.1 1.0 1.1 Total revenues 795.6 775.6 767.5 Expenses:
Insurance policy benefi ts 447.1 464.5 450.6 Amortization related to operations 47.7 44.9 46.6 Interest expense on investment borrowings 2.8 .7 — Other operating costs and expenses 170.9 169.4 169.9
Total benefi ts and expenses 668.5 679.5 667.1 Income before net realized investment gains (losses) and income taxes 127.1 96.1 100.4
Net realized investment gains (losses) 6.7 2.0 (7.4)INCOME BEFORE INCOME TAXES $ 133.8 $ 98.1 $ 93.0 Health benefi t ratios:
Medicare supplement: Insurance policy benefi ts $ 77.6 $ 93.5 $ 106.6 Benefi t ratio (a) 65.4% 68.5% 67.3%
Supplemental health: Insurance policy benefi ts $ 347.6 $ 343.4 $ 322.2 Benefi t ratio (a) 76.6% 80.0% 80.4%Interest-adjusted benefi t ratio (b) 49.8% 51.3% 49.2%
(a) We calculate benefit ratios by dividing the related product’s insurance policy benefits by insurance policy income.(b) We calculate the interest-adjusted benefit ratio (a non-GAAP measure) for Washington National’s supplemental health products by dividing such product’s insurance policy
benefits less the imputed interest income on the accumulated assets backing the insurance liabilities by policy income. These are considered non-GAAP financial measures. A non-GAAP measure is a numerical measure of a company’s performance, financial position, or cash flows that excludes or includes amounts that are normally excluded or included in the most directly comparable measure calculated and presented in accordance with GAAP. These non-GAAP financial measures of “interest-adjusted benefit ratios” differ from “benefit ratios” due to the deduction of imputed interest income on the accumulated assets backing the insurance liabilities from the product’s insurance policy benefits used to determine the ratio. Interest income is an important factor in measuring the performance of health products that are expected to be inforce for a longer duration of time, are not subject to unilateral changes in provisions (such as non-cancelable or guaranteed renewable contracts) and require the performance of various functions and services (including insurance protection) for an extended period of time. The net cash flows from supplemental health products generally cause an accumulation of amounts in the early years of a policy (accounted for as reserve increases) that will be paid out as benefits in later policy years (accounted for as reserve decreases). Accordingly, as the policies age, the benefit ratio will typically increase, but the increase in benefits will be partially offset by the imputed interest income earned on the accumulated assets. The interest-adjusted benefit ratio reflects the effects of such interest income offset. Since interest income is an important factor in measuring the performance of these products, management believes a benefit ratio that includes the effect of interest income is useful in analyzing product performance. We utilize the interest-adjusted benefit ratio in measuring segment performance because we believe that this performance measure is a better indicator of the ongoing businesses and trends in the business. However, the “interest-adjusted benefit ratio” does not replace the “benefit ratio” as a measure of current period benefits to current period insurance policy income. Accordingly, management reviews both “benefit ratios” and “interest-adjusted benefit ratios” when analyzing the financial results attributable to these products. The imputed investment income earned on the accumulated assets backing the supplemental health reserves was $121.6 million, $122.8 million and $125.1 million in 2012, 2011 and 2010, respectively.

CNO FINANCIAL GROUP, INC. - Form 10-K 70
PART II ITEM 7 Management’s Discussion and Analysis of Consolidated Financial Condition and Results of Operations
Total premium collections were $590.5 million in 2012, up .8 percent from 2011, and $585.8 million in 2011, up .8 percent from 2010. See “Premium Collections” for further analysis of fl uctuations in premiums collected by product.
Average liabilities for insurance products, net of reinsurance ceded were $2.6 billion in 2012, down .7 percent from 2011, and $2.6 billion in 2011, down 1.5 percent from 2010.
Insurance policy income is comprised of premiums earned on traditional insurance policies which provide mortality or morbidity coverage and fees and other charges assessed on other policies. Such income increased slightly in 2012 and 2011 as supplemental health premiums have increased and Medicare supplement premiums have decreased consistent with sales.
Net investment income on general account invested assets (which excludes income on policyholder and reinsurer accounts) increased 7.7 percent, to $204.0 million in 2012 and 2.8 percent, to $189.4 million in 2011. Th e average balance of general account invested assets was $3.7 billion, $3.2 billion and $3.1 billion in 2012, 2011 and 2010, respectively. Th e average yield on these assets was 5.56 percent in 2012, 5.86 percent in 2011 and 5.90 percent in 2010. Increases in general account invested assets and net investment income in 2012 and 2011 are primarily due to invested assets purchased with the proceeds from collateralized borrowings from the FHLB pursuant to an investment borrowing program that commenced in this segment in June 2011. Th e decline in average yield in 2012 and 2011 is primarily due to lower yields related to the variable rate investments purchased with the proceeds from the collateralized borrowings from the FHLB as well as the lower interest rate environment.
Trading account income related to reinsurer accounts and other portfolios primarily represents the income on trading securities which are held to act as hedges for embedded derivatives related to certain modifi ed coinsurance agreements. Th e income on our trading account securities is designed to substantially off set the change in value of embedded derivatives related to modifi ed coinsurance agreements described below.
Change in value of embedded derivatives related to modifi ed coinsurance agreements is described in the note to our consolidated fi nancial statements entitled “Summary of Signifi cant Accounting Policies - Accounting for Derivatives.” We have transferred the specifi c block of investments related to these agreements to our trading securities account, which we carry at estimated fair value with changes in such value recognized as trading account income. Th e change in the value of the embedded derivatives has largely been off set by the change in value of the trading securities.
Insurance policy benefi ts fl uctuated as a result of the factors summarized below for benefi t ratios. Benefi t ratios are calculated by dividing the related insurance product’s insurance policy benefi ts by insurance policy income.
Th e benefi t ratios on Washington National’s Medicare supplement products have been impacted by increases in policyholder lapses following our premium rate increase actions. We establish active life reserves for these policies, which are in addition to amounts required for incurred claims. When policies lapse, active life reserves for such lapsed
policies are released, resulting in decreased insurance policy benefi ts (although such decrease is substantially off set by additional amortization expense). In addition, the insurance product liabilities we establish for our Medicare supplement business are subject to signifi cant estimates and the ultimate claim liability we incur for a particular period is likely to be diff erent than our initial estimate. Our insurance policy benefi ts refl ected claim reserve redundancies from prior years of $1.2 million, nil and $4.2 million in 2012, 2011 and 2010, respectively. Excluding the eff ects of prior year claim reserve redundancies, our benefi t ratios for the Medicare supplement block would have been 66.4 percent, 68.5 percent and 69.9 percent in 2012, 2011 and 2010, respectively. Governmental regulations generally require us to attain and maintain a ratio of total benefi ts incurred to total premiums earned (excluding changes in policy benefi t reserves), after three years from the original issuance of the policy and over the lifetime of the policy, of not less than 65 percent on these products, as determined in accordance with statutory accounting principles. Insurance margins (insurance policy income less insurance policy benefi ts) on these products were $41.0 million, $43.0 million and $51.8 million in 2012, 2011 and 2010, respectively. Such decreases are primarily due to lower sales and to policyholder lapses; partially off set by favorable claim experience.
Washington National’s supplemental health products (including specifi ed disease, accident and hospital indemnity products) generally provide fi xed or limited benefi ts. For example, payments under cancer insurance policies are generally made directly to, or at the direction of, the policyholder following diagnosis of, or treatment for, a covered type of cancer. Approximately three-fourths of our supplemental health policies inforce (based on policy count) are sold with return of premium or cash value riders. Th e return of premium rider generally provides that after a policy has been inforce for a specifi ed number of years or upon the policyholder reaching a specifi ed age, we will pay to the policyholder, or a benefi ciary under the policy, the aggregate amount of all premiums paid under the policy, without interest, less the aggregate amount of all claims incurred under the policy. Th e cash value rider is similar to the return of premium rider, but also provides for payment of a graded portion of the return of premium benefi t if the policy terminates before the return of premium benefi t is earned. Accordingly, the net cash fl ows from these products generally result in the accumulation of amounts in the early years of a policy (refl ected in our earnings as reserve increases) which will be paid out as benefi ts in later policy years (refl ected in our earnings as reserve decreases which off set the recording of benefi t payments). As the policies age, the benefi t ratio will typically increase, but the increase in benefi ts will be partially off set by investment income earned on the accumulated assets. Th e benefi t ratio will fl uctuate depending on the claim experience during the year. Insurance margins (insurance policy income less insurance policy benefi ts) on these products were $106.2 million, $85.8 million and $78.6 million in 2012, 2011 and 2010, respectively. Th e margin in 2012 refl ects higher insurance policy income due to the growth in this block of business and favorable claim experience. In addition, we recognized $7.6 million of out-of-period adjustments in 2011, which decreased the insurance margin on these products. Th e interest adjusted benefi t ratio on this supplemental health business was 49.8 percent, 51.3 percent and 49.2 percent in 2012, 2011 and 2010, respectively. In 2013, we currently expect this interest-adjusted benefi t ratio will be approximately 50 percent.

CNO FINANCIAL GROUP, INC. - Form 10-K 71
PART II ITEM 7 Management’s Discussion and Analysis of Consolidated Financial Condition and Results of Operations
Amortization related to operations includes amortization of insurance acquisition costs. Insurance acquisition costs are generally amortized in relation to actual and expected premium revenue, and amortization is only adjusted if expected premium revenue changes or if we determine the balance of these costs is not recoverable from future profi ts. Such amounts were generally consistent with the related premium revenue. A revision to our current assumptions could result in increases or decreases to amortization expense in future periods.
Interest expense on investment borrowings represents $2.8 million and $.7 million of interest expense on collateralized borrowings in 2012 and 2011, respectively, as further described in the note to the consolidated fi nancial statements entitled “Summary of Signifi cant Accounting Policies - Investment Borrowings”.
Other operating costs and expenses were $170.9 million, $169.4 million and $169.9 million in 2012, 2011 and 2010, respectively. Other operating costs and expenses include commission expense of $70.0 million, $67.2 million and $64.8 million in 2012, 2011 and 2010, respectively.
Net realized investment gains (losses) fluctuate each period. During 2012, net realized investment gains in this segment included $17.2 million of net gains from the sales of investments (primarily fi xed maturities) and $10.5 million of writedowns of investments for other than temporary declines in fair value recognized through net income. During 2011, net realized investment gains in this segment included $9.6 million of net gains from the sales of investments (primarily fi xed maturities) and $7.6 million of writedowns of investments for other than temporary declines in fair value recognized through net income ($8.1 million, prior to the $.5 million of impairment losses recognized through accumulated other comprehensive income (loss)). During 2010, net realized investment losses in this segment included $23.5 million of net gains from the sales of investments (primarily fi xed maturities) and $30.9 million of writedowns of investments for other than temporary declines in fair value recognized through net income ($31.1 million, prior to the $.2 million of impairment losses recognized through accumulated other comprehensive income (loss)).
Colonial Penn (dollars in millions)
2012 2011 2010Premium collections:
Life $ 211.9 $ 196.4 $ 187.7Supplemental health 4.9 5.7 6.4
Total collections $ 216.8 $ 202.1 $ 194.1Average liabilities for insurance products:
Annuities-mortality based $ 76.5 $ 77.7 $ 79.4Supplemental health 15.1 16.2 17.6Life:
Interest sensitive 18.7 20.3 21.3Non-interest sensitive 604.5 589.8 579.7
Total average liabilities for insurance products, net of reinsurance ceded $ 714.8 $ 704.0 $ 698.0Revenues:
Insurance policy income $ 217.8 $ 203.0 $ 194.9Net investment income:
General account invested assets 40.4 41.1 39.3Fee revenue and other income .7 .9 .7
Total revenues 258.9 245.0 234.9Expenses:
Insurance policy benefi ts 160.3 149.2 143.8Amounts added to annuity and interest-sensitive life product account balances .8 .9 1.0Amortization related to operations 15.0 15.0 12.5Other operating costs and expenses 91.4 84.6 73.4
Total benefi ts and expenses 267.5 249.7 230.7Income (loss) before net realized investment gains and income taxes (8.6) (4.7) 4.2
Net realized investment gains 7.2 5.8 6.6INCOME BEFORE INCOME TAXES $ (1.4) $ 1.1 $ 10.8

CNO FINANCIAL GROUP, INC. - Form 10-K 72
PART II ITEM 7 Management’s Discussion and Analysis of Consolidated Financial Condition and Results of Operations
Th is segment’s results are signifi cantly impacted by the adoption of the new accounting standard related to deferred acquisition costs. We are no longer able to defer most of Colonial Penn’s direct response advertising costs although such costs generate predictable sales and future inforce profi ts. In 2013, we plan to continue to invest in this segment’s business, including the development of new products and markets. Th e amount of our investment in new business during a particular period will have a signifi cant impact on this segment’s results. Based on our current advertising plan, we expect this segment to report a loss (before net realized investment gains (losses) and income taxes) in 2013 of between $5 million and $10 million.
Total premium collections increased 7.3 percent, to $216.8 million, in 2012 and 4.1 percent, to $202.1 million, in 2011. See “Premium Collections” for further analysis of Colonial Penn’s premium collections.
Average liabilities for insurance products, net of reinsurance ceded have increased as a result of growth in this segment.
Insurance policy income is comprised of premiums earned on policies which provide mortality or morbidity coverage and fees and other charges assessed on other policies. Th e increase in such income refl ects the growth in the block of business.
Net investment income on general account invested assets (which excludes income on policyholder and reinsurer accounts) did not fl uctuate signifi cantly during the three years ended December 31, 2012. Th e average balance of general account invested assets was $679.4 million in 2012, $680.1 million in 2011 and $662.8 million in 2010. Th e average yield on these assets was 5.95 percent in 2012, 6.04 percent in 2011 and 5.93 percent in 2010.
Insurance policy benefi ts fl uctuated as a result of the growth in this segment.
Amortization related to operations includes amortization of insurance acquisition costs. Insurance acquisition costs in the Colonial Penn segment are amortized in relation to actual and expected premium revenue, and amortization is only adjusted if expected premium revenue changes or if we determine the balance of these costs is not recoverable from future profi ts. Such amounts were generally consistent with the related premium revenue and gross profi ts for such periods and the assumptions we made when we established the present value of future profi ts. A revision to our current assumptions could result in increases or decreases to amortization expense in future periods.
Other operating costs and expenses in our Colonial Penn segment fl uctuate primarily due to changes in the marketing expenses incurred to generate new business. Such marketing expenses have increased in each of the last three years.
Net realized investment gains fl uctuated each period. During 2012, net realized investment gains in this segment included $7.8 million of net gains from the sales of investments (primarily fi xed maturities) and $.6 million of writedowns of investments for other than temporary declines in fair value recognized through net income. During 2011, net realized investment gains in this segment included $6.2 million of net gains from the sales of investments (primarily fi xed maturities) and $.4 million of writedowns of investments for other than temporary declines in fair value recognized through net income ($.7 million, prior to the $.3 million of impairment losses recognized through accumulated other comprehensive income (loss)). During 2010, net realized investment gains in this segment included $9.0 million of net gains from the sales of investments (primarily fi xed maturities) and $2.4 million of writedowns of investments for other than temporary declines in fair value recognized through net income ($2.7 million, prior to the $.3 million of impairment losses recognized through accumulated other comprehensive income (loss)).

CNO FINANCIAL GROUP, INC. - Form 10-K 73
PART II ITEM 7 Management’s Discussion and Analysis of Consolidated Financial Condition and Results of Operations
Other CNO Business (dollars in millions)
2012 2011 2010Premium collections:
Annuities $ 3.8 $ 16.4 $ 16.4 Other health 25.8 27.8 31.7 Life 165.0 179.4 191.6
Total collections $ 194.6 $ 223.6 $ 239.7 Average liabilities for insurance products:
Annuities: Mortality based $ 223.7 $ 216.1 $ 210.5 Fixed index 521.7 617.4 713.8 Deposit based 635.1 672.7 670.9 Separate accounts 15.6 16.8 16.7
Other health 479.5 481.6 480.0 Life:
Interest sensitive 2,349.3 2,493.7 2,585.5 Non-interest sensitive 780.2 787.8 834.1
Total average liabilities for insurance products, net of reinsurance ceded $ 5,005.1 $ 5,286.1 $ 5,511.5 Revenues:
Insurance policy income $ 289.8 $ 290.0 $ 297.9 Net investment income:
General account invested assets 332.9 346.9 352.1 Fixed index products 4.2 (3.4) 9.8 Trading account income related to policyholder accounts 3.5 .6 2.7
Total revenues 630.4 634.1 662.5 Expenses:
Insurance policy benefi ts 380.8 350.1 367.6 Amounts added to policyholder account balances:
Annuity products and interest-sensitive life products other than fi xed index products 111.8 120.4 127.6 Fixed index products 15.8 9.4 25.8
Amortization related to operations 33.8 39.8 48.7 Interest expense on investment borrowings 19.9 20.3 20.0 Other operating costs and expenses 117.1 78.8 82.0
Total benefi ts and expenses 679.2 618.8 671.7 Income (loss) before net realized investment gains (losses) and fair value changes in embedded derivative liabilities, net of related amortization, and income taxes (48.8) 15.3 (9.2)
Net realized investment gains (losses) 12.4 6.1 (27.6)Amortization related to net realized investment gains (losses) (2.2) (.2) (1.3)
Net realized investment gains (losses), net of related amortization 10.2 5.9 (28.9)Insurance policy benefi ts - fair value changes in embedded derivative liabilities .1 (3.2) — Amortization related to fair value changes in embedded derivative liabilities (.1) 2.6 —
Fair value changes in embedded derivative liabilities, net of related amortization — (.6) — INCOME (LOSS) BEFORE INCOME TAXES $ (38.6) $ 20.6 $ (38.1)
Health benefi t ratios: Long-term care:
Insurance policy benefi ts $ 63.4 $ 62.7 $ 63.0 Benefi t ratio (a) 247.0% 226.4% 210.8%Interest-adjusted benefi t ratio (b) 137.6% 127.3% 123.8%

CNO FINANCIAL GROUP, INC. - Form 10-K 74
PART II ITEM 7 Management’s Discussion and Analysis of Consolidated Financial Condition and Results of Operations
(a) We calculate benefit ratios by dividing the related product’s insurance policy benefits by insurance policy income.(b) We calculate the inter est-adjusted benefit ratio (a non-GAAP measur e) for long-term care products in our O ther CNO Business segment by dividing such pr oduct’s
insurance policy benefits less the imputed inter est income on the accumulated assets backing the insur ance liabilities by policy income. These are considered non-GAAP financial measures. A non-GAAP measure is a numerical measure of a company’s performance, financial position, or cash flows that excludes or includes amounts that are normally excluded or included in the most directly comparable measure calculated and presented in accordance with GAAP. These non-GAAP financial measures of “interest-adjusted benefit ratios” differ from “benefit ratios” due to the deduction of imputed interest income on the accumulated assets backing the insurance liabilities from the product’s insurance policy benefits used to deter mine the ratio. Interest income is an impor tant factor in measuring the performance of health products that are expected to be inforce for a longer duration of time, are not subject to unilateral changes in provisions (such as non-cancelable or guaranteed renewable contracts) and require the performance of various functions and services (including insurance protection) for an extended period of time. The net cash flows from long-term care products generally cause an accumulation of amounts in the early years of a policy (accounted for as reserve increases) that will be paid out as benefits in later policy years (accounted for as reserve decreases). Accordingly, as the policies age, the benefit ratio will typically increase, but the increase in benefits will be partially offset by the imputed interest income earned on the accumulated assets. The interest-adjusted benefit ratio reflects the effects of such interest income offset. Since interest income is an important factor in measuring the performance of these products, management believes a benefit ratio that includes the effect of interest income is useful in analyzing product performance. We utilize the interest-adjusted benefit ratio in measuring segment performance because we believe that this performance measure is a better indicator of the ongoing businesses and trends in the business. However, the “interest-adjusted benefit ratio” does not replace the “benefit ratio” as a measure of current period benefits to current period insurance policy income. Accordingly, management reviews both “benefit ratios” and “interest-adjusted benefit ratios” when analyzing the financial results attributable to these products. The imputed investment income earned on the accumulated assets backing the long-term care reserves was $28.1 million, $27.4 million and $26.0 million in 2012, 2011 and 2010, respectively.
Th is segment’s results are signifi cantly impacted by the interest-sensitive life insurance block which is sensitive to interest rates and changes to NGEs. Th is segment also includes: (i) declining blocks of traditional life and annuity products which generally generate stable earnings; and (ii) a smaller block of long-term care business generating a modest stream of losses with limited rate increase potential. In 2013, we expect this segment to report normalized earnings before net realized investment gains (losses) and fair value changes in embedded derivative liabilities, net of related amortization and taxes of between $5 million and $20 million, recognizing this segment’s results can be volatile given relatively thin margins and continued litigation activity.
Total premium collections were $194.6 million in 2012, down 13 percent from 2011, and $223.6 million in 2011, down 6.7 percent from 2010. Th e decrease in collected premiums was primarily due to policyholder redemptions and lapses. See “Premium Collections” for further analysis of fl uctuations in premiums collected by product.
Average liabilities for insurance products, net of reinsurance ceded were $5.0 billion in 2012, down 5.3 percent from 2011, and $5.3 billion in 2011, down 4.1 percent from 2010. Th e decreases in such liabilities were primarily due to policyholder redemptions and lapses.
Insurance policy income is comprised of policyholder charges on our interest-sensitive products and premiums earned on traditional insurance policies which provide mortality or morbidity coverage. Insurance policy income in 2012 was comparable to 2011 primarily due to increased policyholder charges from the implementation of changes to certain NGEs related to certain interest-sensitive life products; partially off set by lower premium revenue due to policyholder redemptions and lapses.
Net investment income on general account invested assets (which excludes income on policyholder and reinsurer accounts) decreased 4.0 percent, to $332.9 million, in 2011 and 1.5 percent, to $346.9 million, in 2011. Th e average balance of general account invested assets was $5.6 billion in 2012, $5.9 billion in 2011 and $6.0 billion in 2010. Th e average yield on these assets was 5.93 percent in 2012, 5.89 percent in 2011 and 5.84 percent in 2010. Investing in higher yielding investments, slightly higher prepayment income and reduction to turnover rates to preserve higher yielding investments has resulted in maintaining (or slightly improving) overall yield in this segment in 2012. However, current market conditions are challenging and we expect to see the overall yield decline in future periods.
Net investment income related to fi xed index products represents the change in the estimated fair value of options which are purchased in
an eff ort to off set or hedge certain potential benefi ts accruing to the policyholders of our fi xed index products. Our fi xed index products are designed so that investment income spread is expected to be more than adequate to cover the cost of the options and other costs related to these policies. Net investment income (loss) related to fi xed index products was $4.2 million, $(3.2) million and $7.1 million in 2012, 2011 and 2010, respectively. Such amounts were mostly off set by the corresponding charge (credit) to amounts added to policyholder account balances for fi xed index products. Such income and related charges fl uctuate based on the value of options embedded in the segment’s fi xed index annuity policyholder account balances subject to this benefi t and to the performance of the index to which the returns on such products are linked. For periods prior to June 30, 2011, net investment income related to fi xed index products also included income on trading securities which were held to off set the change in estimated fair values of the embedded derivatives related to our fi xed index products caused by interest rate fl uctuations. During the second quarter of 2011, we discontinued and liquidated this trading portfolio. Such trading account income (loss) was $(.2) million and $2.7 million in 2011 and 2010, respectively.
Trading account income related to policyholder accounts represents the income on investments backing the market strategies of certain annuity products which provide for diff erent rates of cash value growth based on the experience of a particular market strategy. Th e income on our trading account securities is designed to substantially off set certain amounts included in insurance policy benefi ts related to the aforementioned annuity products.
Insurance policy benefi ts were aff ected by a number of items as summarized below.
During 2012, 2011 and 2010, we recognized approximately $43 million, $13 million and $13 million, respectively, of additional increases to future loss reserves primarily resulting from decreased projected future investment yields related to interest-sensitive insurance products.
Th e long-term care policies in this segment generally provide for indemnity and non-indemnity benefi ts on a guaranteed renewable or non-cancellable basis. Th e benefi t ratio on our long-term care policies was 247.0 percent, 226.4 percent and 210.8 percent in 2012, 2011 and 2010, respectively. Benefi t ratios are calculated by dividing the related insurance product’s insurance policy benefi ts by insurance policy income. Since the insurance product liabilities we establish for

CNO FINANCIAL GROUP, INC. - Form 10-K 75
PART II ITEM 7 Management’s Discussion and Analysis of Consolidated Financial Condition and Results of Operations
long-term care business are subject to signifi cant estimates, the ultimate claim liability we incur for a particular period is likely to be diff erent than our initial estimate. Our insurance policy benefi ts refl ected reserve defi ciencies from prior years of $9.2 million, $6.1 million and $3.8 million in 2012, 2011 and 2010, respectively. Excluding the eff ects of prior year claim reserve defi ciencies, our benefi t ratios would have been 211.1 percent, 204.3 percent and 198.1 percent in 2012, 2011 and 2010, respectively. Th ese ratios refl ect the level of incurred claims experienced in recent periods, adverse development on claims incurred in prior periods and lower policy income. Th e prior period defi ciencies have primarily resulted from the impact of paid claim experience being diff erent than prior estimates.
Th e net cash fl ows from long-term care products generally cause an accumulation of amounts in the early years of a policy (refl ected in our earnings as reserve increases) which will be paid out as benefi ts in later policy years (refl ected in our earnings as reserve decreases which off set the recording of benefi t payments). Accordingly, as the policies age, the benefi t ratio will typically increase, but the increase in benefi ts will be partially off set by investment income earned on the assets which have accumulated. Th e interest-adjusted benefi t ratio for long-term care products is calculated by dividing the insurance product’s insurance policy benefi ts less the imputed interest income on the accumulated assets backing the insurance liabilities by insurance policy income. Th e interest-adjusted benefi t ratio on this business was 137.6 percent, 127.3 percent and 123.8 percent in 2012, 2011 and 2010, respectively. Excluding the eff ects of prior year claim reserve defi ciencies, our interest-adjusted benefi t ratios would have been 101.8 percent, 105.2 percent and 111.1 percent in 2012, 2011 and 2010, respectively.
In each quarterly period, we calculate our best estimate of claim reserves based on all of the information available to us at that time, which necessarily takes into account new experience emerging during the period. Our actuaries estimate these claim reserves using various generally recognized actuarial methodologies which are based on informed estimates and judgments that are believed to be appropriate. As additional experience emerges and other data become available, these estimates and judgments are reviewed and may be revised. Signifi cant assumptions made in estimating claim reserves for long-term care policies include expectations about the: (i) future duration of existing claims; (ii) cost of care and benefi t utilization; (iii) interest rate utilized to discount claim reserves; (iv) claims that have been incurred but not yet reported; (v) claim status on the reporting date; (vi) claims that have been closed but are expected to reopen; and (vii) correspondence that has been received that will ultimately become claims that have payments associated with them.
Earnings in the fi rst quarter of 2010 were unfavorably impacted by changes in assumptions related to when certain NGEs would be implemented. Th ese changes resulted in increases to insurance policy benefi ts and amortization of insurance acquisition costs of approximately $8 million.
Amounts added to policyholder account balances for annuity products and interest-sensitive life products were $111.8 million, $120.4 million and $127.6 million in 2012, 2011 and 2010, respectively. Th e decrease was primarily due to a smaller block of interest-sensitive life business inforce due to lapses in recent periods. Th e weighted average crediting rates for these products were 3.8 percent, 3.9 percent and 4.0 percent in 2012, 2011 and 2010, respectively.
Amounts added to fi xed index products generally fl uctuate with the corresponding related investment income accounts described above.
Amortization related to operations includes amortization of insurance acquisition costs. Insurance acquisition costs are generally amortized either: (i) in relation to the estimated gross profi ts for universal life and investment-type products; or (ii) in relation to actual and expected premium revenue for other products. In addition, for universal life and investment-type products, we are required to adjust the total amortization recorded to date through the statement of operations if actual experience or other evidence suggests that earlier estimates of future gross profi ts should be revised. Accordingly, amortization for universal life and investment-type products is dependent on the profi ts realized during the period and on our expectation of future profi ts. For other products, we amortize insurance acquisition costs in relation to actual and expected premium revenue, and amortization is only adjusted if expected premium revenue changes. Th e assumptions we use to estimate our future gross profi ts and premiums involve signifi cant judgment. A revision to our current assumptions could result in increases or decreases to amortization expense in future periods. Earnings on our universal life products, which comprise a signifi cant part of this block, are subject to volatility since our insurance acquisition costs are equal to the value of future estimated gross profi ts. Accordingly, the impact of adverse changes in our earlier estimates of future gross profi ts is generally refl ected in earnings in the period such diff erences occur.
Interest expense on investment borrowings includes $19.9 million, $20.2 million and $19.8 million of interest expense on collateralized borrowings in 2012, 2011 and 2010, respectively, as further described in the note to the consolidated fi nancial statements entitled “Summary of Signifi cant Accounting Policies - Investment Borrowings”.
Other operating costs and expenses were $117.1 million, $78.8 million and $82.0 million in 2012, 2011 and 2010, respectively. Other operating costs and expenses include commission expense of $3.7 million, $3.7 million and $6.2 million in 2012, 2011 and 2010, respectively. In 2012, we recognized charges of $41.5 million related to pending litigation as more fully described in the note to the consolidated fi nancial statements entitled “Litigation and Other Legal Proceedings - Cost of Insurance Litigation”.
Net realized investment gains (losses) fluctuate each period. During 2012, net realized investment gains in this segment included $29.6 million of net gains from the sales of investments (primarily fi xed maturities) and $17.2 million of writedowns of investments for other than temporary declines in fair value recognized through net income. During 2011, net realized investment gains in this segment included $20.5 million of net gains from the sales of investments (primarily fi xed maturities) and $14.4 million of writedowns of investments for other than temporary declines in fair value recognized through net income ($15.4 million, prior to the $1.0 million of impairment losses recognized through accumulated other comprehensive income (loss)). During 2010, net realized investment losses in this segment included $30.9 million of net gains from the sales of investments (primarily fi xed maturities) and $58.5 million of writedowns of investments for other than temporary declines in fair value recognized through net income ($59.0 million, prior to the $.5 million of impairment losses recognized through accumulated other comprehensive income (loss)).

CNO FINANCIAL GROUP, INC. - Form 10-K 76
PART II ITEM 7 Management’s Discussion and Analysis of Consolidated Financial Condition and Results of Operations
Amortization related to net realized investment gains (losses) is the increase or decrease in the amortization of insurance acquisition costs which results from realized investment gains or losses. When we sell securities which back our universal life and investment-type products at a gain (loss) and reinvest the proceeds at a diff erent yield (or when we have the intent to sell the impaired investments before an anticipated recovery in value occurs, we increase (reduce) the amortization of insurance acquisition costs in order to refl ect the change in estimated gross profi ts due to the gains (losses) realized and the resulting eff ect on estimated future yields. Sales of fi xed maturity investments resulted in an increase in the amortization of insurance acquisition costs of $2.2 million, $.2 million and $1.3 million in 2012, 2011 and 2010, respectively.
Insurance policy benefi ts - fair value changes in embedded derivative liabilities represents fair value changes due to fl uctuations in the interest rates used to discount embedded derivative liabilities related to our fi xed index annuities. Prior to June 30, 2011, we held certain trading securities to off set the income statement volatility caused by the interest rate fl uctuations. In the second quarter of 2011, we sold this trading portfolio.
Amortization related to fair value changes in embedded derivative liabilities is the increase or decrease in the amortization of insurance acquisition costs which results from changes in interest rates used to discount embedded derivative liabilities related to our fi xed index annuities.
Corporate Operations (dollars in millions)
2012 2011 2010Corporate operations: Interest expense on corporate debt $ (66.2) $ (76.3) $ (79.3)Net investment income (loss):
General investment portfolio 3.6 3.0 .1 Other special-purpose portfolios:
COLI 5.0 (7.8) — Investments held in a rabbi trust 4.3 (1.4) (1.5)Investments in certain hedge funds (2.1) (6.8) — Other trading account activities 20.3 7.3 —
Fee revenue and other income 1.2 1.3 1.6 Net operating results of variable interest entities 12.3 7.5 7.2 Interest expense on investment borrowings (.4) (.2) — Other operating costs and expenses (64.5) (50.6) (50.2)Loss before net realized investment gains, loss on extinguishment of debt and income taxes (86.5) (124.0) (122.1)Net realized investment gains (losses) 1.8 — (3.5)Loss on extinguishment of debt (200.2) (3.4) (6.8)LOSS BEFORE INCOME TAXES $ (284.9) $ (127.4) $ (132.4)
Interest expense on corporate debt has been impacted by: (i) the recapitalization transactions completed in September 2012 as further described in “Management’s Discussion and Analysis of Consolidated Financial Condition and Results of Operations - Liquidity of the Holding Companies”; (ii) prepayments of our $375 million senior secured term loan facility maturing on September 30, 2016 (the “Previous Senior Secured Credit Agreement”) in 2011 and 2012 and the amendment in May 2011 which reduced the interest rate payable on the Previous Senior Secured Credit Agreement; (iii) repurchases of 3.5% Convertible Debentures due September 30, 2035 (the “3.5% Debentures”) and the corresponding issuances of 7.0% Debentures in 2010; (iv) the issuance of 9.0% Senior Secured Notes due January 2018 (the “9.0% Notes”) in December 2010; and (v) repayments of the Senior Health Note due November 12, 2013 (the “Senior Health Note”). Such transactions are further discussed in the note to the consolidated fi nancial statements entitled “Notes Payable - Direct Corporate Obligations”. Our average corporate debt outstanding was $882.7 million, $951.7 million and $1,036.5 million in 2012, 2011 and 2010, respectively. Th e average interest rate on our debt was 6.8 percent, 7.4 percent and 7.3 percent in 2012, 2011 and 2010, respectively.
Net investment income on general investment portfolio fl uctuates based on the amount and type of invested assets in the corporate operations segment.
Net investment income on other special-purpose portfolios includes the income (loss) from: (i) investments related to deferred compensation plans held in a rabbi trust (which is off set by amounts included in other operating costs and expenses as the investment results are allocated to participants’ account balances); (ii) trading account activities which commenced in the fi rst quarter of 2011; (iii) income (loss) from COLI equal to the diff erence between the return on these investments and our overall portfolio yield; and (iv) investments in certain hedge funds which commenced in the third quarter of 2011. COLI is utilized as an investment vehicle to fund Bankers Life’s agent deferred compensation plan. For segment reporting, the Bankers Life segment is allocated a return on these investments equivalent to the yield on the Company’s overall portfolio, with any diff erence in the actual COLI return allocated to the Corporate operations segment.
Fee revenue and other income primarily includes revenues we receive for managing investments for other companies.

CNO FINANCIAL GROUP, INC. - Form 10-K 77
PART II ITEM 7 Management’s Discussion and Analysis of Consolidated Financial Condition and Results of Operations
Net operating results of variable interest entities represent the operating results of variable interest entities (“VIEs”). Th e VIEs are consolidated in accordance with GAAP. Th ese entities were established to issue securities and use the proceeds to invest in loans and other permitted assets. Refer to the note to the consolidated fi nancial statements entitled “Investments in Variable Interest Entities” for more information on the VIEs.
Interest expense on investment borrowings represents interest expense on repurchase agreements as further discussed in the note to the consolidated fi nancial statements entitled “Summary of Signifi cant Accounting Policies - Investment Borrowings”.
Other operating costs and expenses include general corporate expenses, net of amounts charged to subsidiaries for services provided by the corporate operations. Th ese amounts fl uctuate as a result of expenses such as consulting, legal and severance costs which often vary from period to period. In 2012, 2011 and 2010, we recognized charges of $9.7 million, $18.9 million and $4.3 million, respectively, related to changes in the underlying actuarial assumptions used to value our agent deferred compensation plan and certain retirement benefi ts. In 2012, we also recognized a $6.8 million charge related to the relocation of Bankers Life’s primary offi ce. In 2011, we recognized a reduction in expenses of $7.4 million related to a true-up of forfeiture estimates related to certain stock-based compensation awards.
Net realized investment gains (losses) often fl uctuate each period. During 2012, net realized investment gains in this segment included $2.6 million of net gains from the sales of investments (of which $.4 million were gains recognized by VIEs) and $.8 million of writedowns of investments (all of which were recognized by VIEs) due to other-than-temporary declines in value. During 2011, net realized investment
gains in this segment included $4.3 million of net gains from the sales of investments (of which $3.0 million were gains recognized by VIEs) and $4.3 million of writedowns of investments (all of which were recognized by VIEs) due to other-than-temporary declines in value. During 2010, net realized investment losses in this segment included $.2 million of net losses from the sales of investments (of which $.4 million were losses recognized by VIEs) and $3.3 million of writedowns of investments (all of which were recognized by VIEs) due to other-than-temporary declines in value.
Loss on extinguishment of debt of $200.2 million in 2012 represents: (i) $136.5 million due to our repurchase of $200.0 million principal amount of 7.0% Debentures and the write-off of unamortized discount and issuance costs associated with the 7.0% Debentures; (ii) $58.2 million related to the tender off er and consent solicitation for the 9.0% Notes, the write-off of unamortized issuance costs related to the 9.0% Notes and other transactions; (iii) $5.1 million representing the write-off of unamortized discount and issuance costs associated with repayments of our Previous Senior Secured Credit Agreement; and (iv) $.4 million representing the write-off of unamortized discount and issuance costs associated with payments on our New Senior Secured Credit Agreement. Th e loss on extinguishment of debt of $3.4 million in 2011 represents the write-off of unamortized discount and issuance costs associated with repayments of the Previous Senior Secured Credit Agreement. Th e loss on extinguishment of debt of $6.8 million in 2010 resulted from the write-off of unamortized discount and issuance costs related to: (i) the repurchases of 3.5% Debentures; and (ii) the repayment of a prior senior credit agreement. Th ese transactions are further discussed in the note to the consolidated fi nancial statements entitled “Notes Payable - Direct Corporate Obligations”.
EBIT From Business Segments Summarized by In-Force and New Business
Management believes that an analysis of EBIT, separated between in-force and new business provides increased clarity around the value drivers of our business, particularly since the new business results are signifi cantly impacted by the rate of sales, mix of business and the distribution channel through which new sales are made. EBIT from new business includes pre-tax revenues and expenses associated with
new sales of our insurance products during the fi rst year after the sale is completed. EBIT from in-force business includes all pre-tax revenues and expenses associated with sales of insurance products that were completed more than one year before the end of the reporting period. Th e allocation of certain revenues and expenses between new and in-force business is based on estimates, which we believe are reasonable.

CNO FINANCIAL GROUP, INC. - Form 10-K 78
PART II ITEM 7 Management’s Discussion and Analysis of Consolidated Financial Condition and Results of Operations
Th e following summarizes our earnings, separated between in-force and new business on a consolidated basis and for each of our operating segments for the three years ended December 31, 2012:
Business segments - total (dollars in millions)
2012 2011 2010EBIT FROM INFORCE BUSINESS
Revenues: Insurance policy income $ 2,377.1 $ 2,347.2 $ 2,327.7 Net investment income and other 1,402.3 1,314.1 1,300.6
Total revenues 3,779.4 3,661.3 3,628.3 Benefi ts and expenses:
Insurance policy benefi ts 2,498.8 2,429.6 2,468.5 Amortization 254.5 266.1 291.6 Other expenses 482.5 404.6 411.4
Total benefi ts and expenses 3,235.8 3,100.3 3,171.5 EBIT from In-Force Business $ 543.6 $ 561.0 $ 456.8 EBIT FROM NEW BUSINESS
Revenues: Insurance policy income $ 378.3 $ 343.3 $ 342.3 Net investment income and other 38.7 42.6 62.2
Total revenues 417.0 385.9 404.5 Benefi ts and expenses:
Insurance policy benefi ts 260.7 235.0 255.2 Amortization 29.6 39.9 24.1 Other expenses 299.7 274.4 249.1
Total benefi ts and expenses 590.0 549.3 528.4 EBIT from New Business $ (173.0) $ (163.4) $ (123.9)EBIT FROM INFORCE AND NEW BUSINESS
Revenues: Insurance policy income $ 2,755.4 $ 2,690.5 $ 2,670.0 Net investment income and other 1,441.0 1,356.7 1,362.8
Total revenues 4,196.4 4,047.2 4,032.8 Benefi ts and expenses:
Insurance policy benefi ts 2,759.5 2,664.6 2,723.7 Amortization 284.1 306.0 315.7 Other expenses 782.2 679.0 660.5
Total benefi ts and expenses 3,825.8 3,649.6 3,699.9 EBIT from In-Force and New Business $ 370.6 $ 397.6 $ 332.9

CNO FINANCIAL GROUP, INC. - Form 10-K 79
PART II ITEM 7 Management’s Discussion and Analysis of Consolidated Financial Condition and Results of Operations
Bankers Life (dollars in millions)
2012 2011 2010EBIT FROM INFORCE BUSINESS
Revenues: Insurance policy income $ 1,381.3 $ 1,358.9 $ 1,341.2 Net investment income and other 815.4 737.5 709.5
Total revenues 2,196.7 2,096.4 2,050.7 Benefi ts and expenses:
Insurance policy benefi ts 1,431.2 1,378.0 1,393.8 Amortization 161.8 169.9 187.2 Other expenses 186.4 148.9 147.5
Total benefi ts and expenses 1,779.4 1,696.8 1,728.5 EBIT from In-Force Business $ 417.3 $ 399.6 $ 322.2 EBIT FROM NEW BUSINESS
Revenues: Insurance policy income $ 276.1 $ 253.5 $ 255.0 Net investment income and other 38.7 42.6 62.2
Total revenues 314.8 296.1 317.2 Benefi ts and expenses:
Insurance policy benefi ts 211.7 192.1 213.5 Amortization 25.8 36.4 20.7 Other expenses 193.7 176.3 167.7
Total benefi ts and expenses 431.2 404.8 401.9 EBIT from New Business $ (116.4) $ (108.7) $ (84.7)EBIT FROM INFORCE AND NEW BUSINESS
Revenues: Insurance policy income $ 1,657.4 $ 1,612.4 $ 1,596.2 Net investment income and other 854.1 780.1 771.7
Total revenues 2,511.5 2,392.5 2,367.9 Benefi ts and expenses:
Insurance policy benefi ts 1,642.9 1,570.1 1,607.3 Amortization 187.6 206.3 207.9 Other expenses 380.1 325.2 315.2
Total benefi ts and expenses 2,210.6 2,101.6 2,130.4 EBIT from In-Force and New Business $ 300.9 $ 290.9 $ 237.5

CNO FINANCIAL GROUP, INC. - Form 10-K 80
PART II ITEM 7 Management’s Discussion and Analysis of Consolidated Financial Condition and Results of Operations
Washington National (dollars in millions)
2012 2011 2010 EBIT FROM INFORCE BUSINESS Revenues:
Insurance policy income $ 531.5 $ 530.7 $ 526.0 Net investment income and other 205.2 190.5 186.5
Total revenues 736.7 721.2 712.5 Benefi ts and expenses:
Insurance policy benefi ts 422.9 442.0 427.5 Amortization 44.8 42.1 44.0 Other expenses 134.5 130.5 135.7
Total benefi ts and expenses 602.2 614.6 607.2 EBIT from In-Force Business $ 134.5 $ 106.6 $ 105.3 EBIT FROM NEW BUSINESS Revenues:
Insurance policy income $ 58.9 $ 54.4 $ 55.0 Net investment income and other — — —
Total revenues 58.9 54.4 55.0 Benefi ts and expenses:
Insurance policy benefi ts 24.2 22.5 23.1 Amortization 2.9 2.8 2.6 Other expenses 39.2 39.6 34.2
Total benefi ts and expenses 66.3 64.9 59.9 EBIT from New Business $ (7.4) $ (10.5) $ (4.9)EBIT FROM INFORCE AND NEW BUSINESS Revenues:
Insurance policy income $ 590.4 $ 585.1 $ 581.0 Net investment income and other 205.2 190.5 186.5
Total revenues 795.6 775.6 767.5 Benefi ts and expenses:
Insurance policy benefi ts 447.1 464.5 450.6 Amortization 47.7 44.9 46.6 Other expenses 173.7 170.1 169.9
Total benefi ts and expenses 668.5 679.5 667.1 EBIT from In-Force and New Business $ 127.1 $ 96.1 $ 100.4

CNO FINANCIAL GROUP, INC. - Form 10-K 81
PART II ITEM 7 Management’s Discussion and Analysis of Consolidated Financial Condition and Results of Operations
Colonial Penn (dollars in millions)
2012 2011 2010EBIT FROM INFORCE BUSINESS Revenues:
Insurance policy income $ 174.5 $ 167.6 $ 162.6 Net investment income and other 41.1 42.0 40.0
Total revenues 215.6 209.6 202.6 Benefi ts and expenses:
Insurance policy benefi ts 136.3 129.7 126.2 Amortization 14.1 14.3 11.7 Other expenses 24.6 26.1 26.2
Total benefi ts and expenses 175.0 170.1 164.1 EBIT from In-Force Business $ 40.6 $ 39.5 $ 38.5 EBIT FROM NEW BUSINESS
Revenues: Insurance policy income $ 43.3 $ 35.4 $ 32.3 Net investment income and other — — —
Total revenues 43.3 35.4 32.3 Benefi ts and expenses:
Insurance policy benefi ts 24.8 20.4 18.6 Amortization .9 .7 .8 Other expenses 66.8 58.5 47.2
Total benefi ts and expenses 92.5 79.6 66.6 EBIT from New Business $ (49.2) $ (44.2) $ (34.3)EBIT FROM INFORCE AND NEW BUSINESS Revenues:
Insurance policy income $ 217.8 $ 203.0 $ 194.9 Net investment income and other 41.1 42.0 40.0
Total revenues 258.9 245.0 234.9 Benefi ts and expenses:
Insurance policy benefi ts 161.1 150.1 144.8 Amortization 15.0 15.0 12.5 Other expenses 91.4 84.6 73.4
Total benefi ts and expenses 267.5 249.7 230.7 EBIT from In-Force and New Business $ (8.6) $ (4.7) $ 4.2
Other CNO Business (dollars in millions)
2012 2011 2012EBIT from In-Force Business (a) Revenues:
Insurance policy income $ 289.8 $ 290.0 $ 297.9 Net investment income and other 340.6 344.1 364.6
Total revenues 630.4 634.1 662.5 Benefi ts and expenses:
Insurance policy benefi ts 508.4 479.9 521.0 Amortization 33.8 39.8 48.7 Other expenses 137.0 99.1 102.0
Total benefi ts and expenses 679.2 618.8 671.7 EBIT from In-Force Business $ (48.8) $ 15.3 $ (9.2)(a) All activity in the Other CNO Business segment relates to in-force business.

CNO FINANCIAL GROUP, INC. - Form 10-K 82
PART II ITEM 7 Management’s Discussion and Analysis of Consolidated Financial Condition and Results of Operations
Th e above analysis of EBIT, separated between in-force and new business, illustrates how our segments are impacted by the rate of sales, mix of business and distribution channel through which new sales are made. In addition, when the impacts from new business are separated, the value drivers of our in-force business are more apparent.
Th e EBIT from in-force business in the Bankers Life segment grew in 2012 and 2011 primarily due to the growth in this segment’s in-force block refl ecting prior period sales and improved persistency. Other expenses in 2012 include $24 million of legal and regulatory expenses.
Th e EBIT from in-force business in the Washington National segment grew in 2012 primarily due to higher investment income on higher average balance of general account assets from the FHLB investment borrowing program that commenced in June 2011 and higher insurance margins on our supplemental health block of business.
Th e EBIT from in-force business in the Colonial Penn segment in 2012 refl ects growth in the block and higher insurance policy benefi ts.
Th e EBIT from in-force business in the Other CNO Business segment refl ects the natural run-off of this block. Other expenses in 2012 included $41.5 million of legal expenses related to pending litigation.
Th e EBIT from new business in the Colonial Penn segment in 2012 and 2011 refl ects additional marketing costs. Th e vast majority of the costs to generate new business in this segment are not deferrable and EBIT will fl uctuate based on management’s decisions on how much marketing costs to incur in each period.
We are not investing in new business in the Other CNO Business segment.
Premium Collections
In accordance with GAAP, insurance policy income in our consolidated statement of operations consists of premiums earned for traditional insurance policies that have life contingencies or morbidity features. For annuity and universal life contracts, premiums collected are not reported as revenues, but as deposits to insurance liabilities. We recognize revenues for these products over time in the form of investment income and surrender or other charges.
Our insurance segments sell products through three primary distribution channels - career agents (our Bankers Life segment), direct marketing (our Colonial Penn segment) and independent producers (our Washington National segment). Our career agency force in the Bankers Life segment sells primarily Medicare supplement and long-term care insurance policies, PDP contracts, life insurance and annuities. Th ese agents visit the customer’s home, which permits one-on-one contact with potential policyholders and promotes strong personal relationships with existing policyholders. Our direct marketing distribution channel in the Colonial Penn segment is engaged primarily in the sale of graded benefi t life and simplifi ed issue life insurance policies which are sold directly to the policyholder. Our Washington National segment sells primarily supplemental health and life insurance. Th ese products are marketed through PMA, a subsidiary that specializes in marketing and distributing health products, and through independent marketing organizations and insurance agencies, including worksite marketing.
Agents, insurance brokers and marketing companies who market our products and prospective purchasers of our products use the fi nancial strength ratings of our insurance subsidiaries as an important factor in determining whether to market or purchase. Ratings have the most
impact on our annuity, interest-sensitive life insurance and long-term care products. Th e current fi nancial strength ratings of our primary insurance subsidiaries (except Conseco Life) from A.M. Best, S&P, Moody’s and Fitch are “B++”, “BB+”, “Baa3” and “BBB”, respectively. Th e current fi nancial strength rating of Conseco Life from A.M. Best, S&P, Moody’s and Fitch are “B-”, “B+”, “Ba1” and “BB+”, respectively. For a description of these ratings and additional information on our ratings, see “Financial Strength Ratings of our Insurance Subsidiaries.”
We set premium rates on our health insurance policies based on facts and circumstances known at the time we issue the policies using assumptions about numerous variables, including the actuarial probability of a policyholder incurring a claim, the probable size of the claim, and the interest rate earned on our investment of premiums. We also consider historical claims information, industry statistics, the rates of our competitors and other factors. If our actual claims experience is less favorable than we anticipated and we are unable to raise our premium rates, our fi nancial results may be adversely aff ected. We generally cannot raise our health insurance premiums in any state until we obtain the approval of the state insurance regulator. We review the adequacy of our premium rates regularly and fi le for rate increases on our products when we believe such rates are too low. It is likely that we will not be able to obtain approval for all requested premium rate increases. If such requests are denied in one or more states, our net income may decrease. If such requests are approved, increased premium rates may reduce the volume of our new sales and may cause existing policyholders to lapse their policies. If the healthier policyholders allow their policies to lapse, this would reduce our premium income and profi tability in the future.
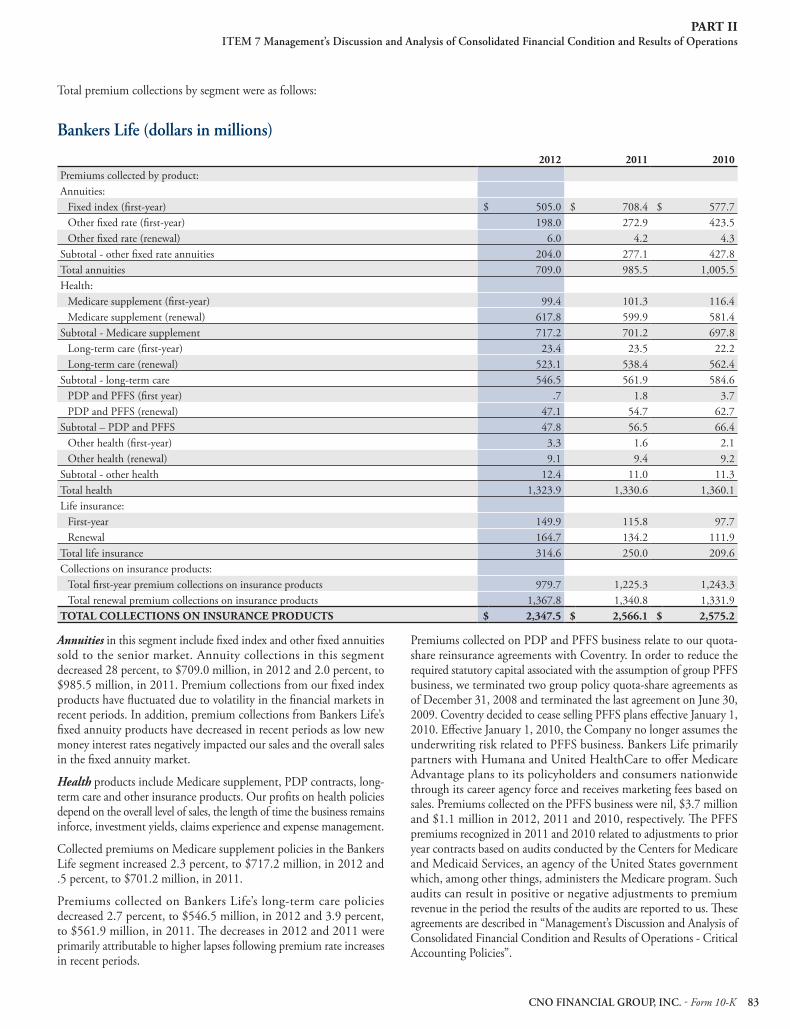
CNO FINANCIAL GROUP, INC. - Form 10-K 83
PART II ITEM 7 Management’s Discussion and Analysis of Consolidated Financial Condition and Results of Operations
Total premium collections by segment were as follows:
Bankers Life (dollars in millions)
2012 2011 2010Premiums collected by product: Annuities:
Fixed index (fi rst-year) $ 505.0 $ 708.4 $ 577.7Other fi xed rate (fi rst-year) 198.0 272.9 423.5Other fi xed rate (renewal) 6.0 4.2 4.3
Subtotal - other fi xed rate annuities 204.0 277.1 427.8Total annuities 709.0 985.5 1,005.5Health:
Medicare supplement (fi rst-year) 99.4 101.3 116.4Medicare supplement (renewal) 617.8 599.9 581.4
Subtotal - Medicare supplement 717.2 701.2 697.8Long-term care (fi rst-year) 23.4 23.5 22.2Long-term care (renewal) 523.1 538.4 562.4
Subtotal - long-term care 546.5 561.9 584.6PDP and PFFS (fi rst year) .7 1.8 3.7PDP and PFFS (renewal) 47.1 54.7 62.7
Subtotal – PDP and PFFS 47.8 56.5 66.4Other health (fi rst-year) 3.3 1.6 2.1Other health (renewal) 9.1 9.4 9.2
Subtotal - other health 12.4 11.0 11.3Total health 1,323.9 1,330.6 1,360.1Life insurance:
First-year 149.9 115.8 97.7Renewal 164.7 134.2 111.9
Total life insurance 314.6 250.0 209.6Collections on insurance products:
Total fi rst-year premium collections on insurance products 979.7 1,225.3 1,243.3Total renewal premium collections on insurance products 1,367.8 1,340.8 1,331.9
TOTAL COLLECTIONS ON INSURANCE PRODUCTS $ 2,347.5 $ 2,566.1 $ 2,575.2
Annuities in this segment include fi xed index and other fi xed annuities sold to the senior market. Annuity collections in this segment decreased 28 percent, to $709.0 million, in 2012 and 2.0 percent, to $985.5 million, in 2011. Premium collections from our fi xed index products have fl uctuated due to volatility in the fi nancial markets in recent periods. In addition, premium collections from Bankers Life’s fi xed annuity products have decreased in recent periods as low new money interest rates negatively impacted our sales and the overall sales in the fi xed annuity market.
Health products include Medicare supplement, PDP contracts, long-term care and other insurance products. Our profi ts on health policies depend on the overall level of sales, the length of time the business remains inforce, investment yields, claims experience and expense management.
Collected premiums on Medicare supplement policies in the Bankers Life segment increased 2.3 percent, to $717.2 million, in 2012 and .5 percent, to $701.2 million, in 2011.
Premiums collected on Bankers Life’s long-term care policies decreased 2.7 percent, to $546.5 million, in 2012 and 3.9 percent, to $561.9 million, in 2011. Th e decreases in 2012 and 2011 were primarily attributable to higher lapses following premium rate increases in recent periods.
Premiums collected on PDP and PFFS business relate to our quota-share reinsurance agreements with Coventry. In order to reduce the required statutory capital associated with the assumption of group PFFS business, we terminated two group policy quota-share agreements as of December 31, 2008 and terminated the last agreement on June 30, 2009. Coventry decided to cease selling PFFS plans eff ective January 1, 2010. Eff ective January 1, 2010, the Company no longer assumes the underwriting risk related to PFFS business. Bankers Life primarily partners with Humana and United HealthCare to off er Medicare Advantage plans to its policyholders and consumers nationwide through its career agency force and receives marketing fees based on sales. Premiums collected on the PFFS business were nil, $3.7 million and $1.1 million in 2012, 2011 and 2010, respectively. Th e PFFS premiums recognized in 2011 and 2010 related to adjustments to prior year contracts based on audits conducted by the Centers for Medicare and Medicaid Services, an agency of the United States government which, among other things, administers the Medicare program. Such audits can result in positive or negative adjustments to premium revenue in the period the results of the audits are reported to us. Th ese agreements are described in “Management’s Discussion and Analysis of Consolidated Financial Condition and Results of Operations - Critical Accounting Policies”.

CNO FINANCIAL GROUP, INC. - Form 10-K 84
PART II ITEM 7 Management’s Discussion and Analysis of Consolidated Financial Condition and Results of Operations
Life products in this segment include traditional and interest-sensitive life products. Life premiums collected in this segment increased 26 percent, to $314.6 million, in 2012 and 19 percent, to $250.0 million, in 2011.
Collected premiums in 2012 and 2011 refl ect higher sales in this segment (including increased sales of single premium whole life products).
Washington National (dollars in millions)
2012 2011 2010Premiums collected by product: Health:
Medicare supplement (fi rst-year) $ 1.0 $ 1.9 $ 3.8Medicare supplement (renewal) 112.9 130.2 151.0
Subtotal - Medicare supplement 113.9 132.1 154.8Supplemental health (fi rst-year) 59.2 54.1 52.0Supplemental health (renewal) 400.5 380.1 353.5
Subtotal – supplemental health 459.7 434.2 405.5Other health (all renewal) 2.7 3.5 4.6
Total health 576.3 569.8 564.9Life insurance:
First-year 1.0 1.2 .8Renewal 13.2 14.8 15.4
Total life insurance 14.2 16.0 16.2Collections on insurance products:
Total fi rst-year premium collections on insurance products 61.2 57.2 56.6Total renewal premium collections on insurance products 529.3 528.6 524.5
TOTAL COLLECTIONS ON INSURANCE PRODUCTS $ 590.5 $ 585.8 $ 581.1
Health products in the Washington National segment include Medicare supplement, supplemental health and other insurance products. Our profi ts on health policies depend on the overall level of sales, the length of time the business remains inforce, investment yields, claim experience and expense management.
Collected premiums on Medicare supplement policies in the Washington National segment decreased 14 percent, to $113.9 million, in 2012 and 15 percent, to $132.1 million, in 2011. We have experienced lower sales and higher lapses of these products due to premium rate increases implemented in recent periods and an increased focus on our
supplemental health products. We discontinued new sales of Medicare supplement policies in this segment in the fourth quarter of 2012.
Premiums collected on supplemental health products (including specifi ed disease, accident and hospital indemnity insurance products) increased 5.9 percent, to $459.7 million, in 2012 and 7.1 percent, to $434.2 million, in 2011. Such increases are due to higher new sales in each year.
Life products in the Washington National segment are primarily traditional life products. Life premiums collected in this segment have declined in recent periods.
Colonial Penn (dollars in millions)
2012 2011 2010Premiums collected by product: Life insurance:
First-year $ 43.1 $ 35.4 $ 32.3Renewal 168.8 161.0 155.4
Total life insurance 211.9 196.4 187.7Health (all renewal):
Medicare supplement 4.5 5.2 6.0Other health .4 .5 .4
Total health 4.9 5.7 6.4Collections on insurance products:
Total fi rst-year premium collections on insurance products 43.1 35.4 32.3Total renewal premium collections on insurance products 173.7 166.7 161.8
TOTAL COLLECTIONS ON INSURANCE PRODUCTS $ 216.8 $ 202.1 $ 194.1

CNO FINANCIAL GROUP, INC. - Form 10-K 85
PART II ITEM 7 Management’s Discussion and Analysis of Consolidated Financial Condition and Results of Operations
Life products in this segment are sold primarily to the senior market. Life premiums collected in this segment increased 7.9 percent, to $211.9 million, in 2012 and 4.6 percent, to $196.4 million, in 2011. Graded benefi t life products sold through our direct response marketing channel accounted for $209.2 million, $193.2 million and $184.1 million of collected premiums in 2012, 2011 and 2010, respectively.
Health products include Medicare supplement and other insurance products. Our profi ts on health policies depend on the overall level of sales, the length of time the business remains inforce, investment yields, claims experience and expense management. Premiums collected on these products have decreased as we do not currently market these products through this segment.
Other CNO Business (dollars in millions)
2012 2011 2010Premiums collected by product: Annuities:
Fixed index (fi rst-year) $ .6 $ 9.5 $ 10.3Fixed index (renewal) 2.3 3.9 4.6
Subtotal - fi xed index annuities 2.9 13.4 14.9Other fi xed rate (fi rst-year) — 2.1 .9Other fi xed rate (renewal) .9 .9 .6
Subtotal - other fi xed rate annuities .9 3.0 1.5Total annuities 3.8 16.4 16.4Health:
Long-term care (all renewal) 25.1 27.0 29.2Other health (all renewal) .7 .8 2.5
Total health 25.8 27.8 31.7Life insurance:
First-year 3.4 2.1 2.3Renewal 161.6 177.3 189.3
Total life insurance 165.0 179.4 191.6Collections on insurance products:
Total fi rst-year premium collections on insurance products 4.0 13.7 13.5Total renewal premium collections on insurance products 190.6 209.9 226.2
TOTAL COLLECTIONS ON INSURANCE PRODUCTS $ 194.6 $ 223.6 $ 239.7
Annuities in this segment include fi xed index and other fi xed annuities. We are no longer actively pursuing sales of annuity products in this segment.
Health products in the Other CNO Business segment include long-term care and other health insurance products. Our profi ts on health policies depend on the length of time the business remains inforce, investment yields, claim experience and expense management.
Th e long-term care premiums in this segment relate to blocks of business that we no longer market or underwrite. As a result, we expect this segment’s long-term care premiums to continue to decline, refl ecting additional policy lapses in the future.
Life products in the Other CNO Business segment include primarily universal life products. Life premiums collected decreased 8.0 percent, to $165.0 million, in 2012 and 6.4 percent, to $179.4 million, in 2011. We are not actively marketing life products in this segment and expect premiums to continue to decline.
Investments
Our investment strategy is to: (i) maintain a predominately investment-grade fi xed income portfolio; (ii) mitigate the eff ect of changing interest rates through active asset/liability management; (iii) provide liquidity to meet our cash obligations to policyholders and others; and (iv) generate stable and predictable investment income through active investment
management. Consistent with this strategy, investments in fi xed maturity securities, mortgage loans and policy loans made up 95 percent of our $28.0 billion investment portfolio at December 31, 2012. Th e remainder of the invested assets was trading securities, investments held by variable interest entities, equity securities and other invested assets.

CNO FINANCIAL GROUP, INC. - Form 10-K 86
PART II ITEM 7 Management’s Discussion and Analysis of Consolidated Financial Condition and Results of Operations
Th e following table summarizes the composition of our investment portfolio as of December 31, 2012 (dollars in millions):
Carrying valuePercent of total
investmentsFixed maturities, available for sale $ 24,614.1 88%Equity securities 171.4 1 Mortgage loans 1,573.2 6 Policy loans 272.0 1 Trading securities 266.2 1 Investments held by variable interest entities 814.3 3 Company-owned life insurance 123.0 — Other invested assets 125.1 — TOTAL INVESTMENTS $ 27,959.3 100%
Insurance statutes regulate the types of investments that our insurance subsidiaries are permitted to make and limit the amount of funds that may be used for any one type of investment. In light of these statutes and regulations and our business and investment strategy, we generally
seek to invest in United States government and government-agency securities and corporate securities rated investment grade by established nationally recognized rating organizations or in securities of comparable investment quality, if not rated.
Th e following table summarizes the carrying value of our fi xed maturity securities, available for sale, by category as of December 31, 2012 (dollars in millions):
Carrying valuePercent of fi xed
maturitiesGross unrealized
lossesPercent of gross
unrealized lossesEnergy/pipelines $ 2,646.0 10.7% $ .3 .9%Collateralized mortgage obligations 2,247.5 9.1 .7 2.1 States and political subdivisions 2,128.1 8.6 5.2 15.9 Utilities 1,963.6 8.0 .2 .4 Insurance 1,560.8 6.3 .6 1.9 Commercial mortgage-backed securities 1,477.4 6.0 .6 2.0 Asset-backed securities 1,460.9 5.9 5.2 15.7 Healthcare/pharmaceuticals 1,219.1 5.0 2.7 8.1 Food/beverage 1,201.3 4.9 1.6 4.9 Cable/media 918.9 3.7 2.7 8.1 Real estate/REITs 906.9 3.7 — — Banks 833.2 3.4 1.9 5.7 Capital goods 713.8 2.9 — — Transportation 562.8 2.3 .1 .3 Telecom 531.6 2.2 1.7 5.2 Aerospace/defense 482.8 2.0 — — Chemicals 397.7 1.6 1.2 3.7 Metals and mining 379.9 1.5 .4 1.2 Building materials 368.0 1.5 2.9 8.9 Paper 333.7 1.4 — — Collateralized debt obligations 324.0 1.3 1.0 3.1 Technology 265.4 1.1 .1 .4 Brokerage 259.6 1.1 — — Consumer products 248.8 1.0 — — Retail 238.4 1.0 .2 .6 Other 943.9 3.8 3.6 10.9 TOTAL FIXED MATURITIES, AVAILABLE FOR SALE $ 24,614.1 100.0% $ 32.9 100.0%

CNO FINANCIAL GROUP, INC. - Form 10-K 87
PART II ITEM 7 Management’s Discussion and Analysis of Consolidated Financial Condition and Results of Operations
Th e following table summarizes the gross unrealized losses of our fi xed maturity securities, available for sale, by category and ratings category as of December 31, 2012 (dollars in millions):
Investment grade Below-investment grade Total gross
unrealized lossesAAA/AA/A BBB BB B+ and belowStates and political subdivisions $ 1.9 $ 2.4 $ .9 $ — $ 5.2Asset-backed securities .6 2.2 2.1 .3 5.2Building materials — — 2.9 — 2.9Cable/media — .3 .5 1.9 2.7Healthcare/pharmaceuticals — 2.5 — .2 2.7Banks — .3 1.6 — 1.9Telecom — 1.7 — — 1.7Food/beverage .1 1.5 — — 1.6Chemicals — .2 — 1.0 1.2Collateralized debt obligations 1.0 — — — 1.0Collateralized mortgage obligations .6 .1 — — .7Commercial mortgage-backed securities .5 .1 — — .6Insurance .1 .5 — — .6Metals and mining — .4 — — .4Energy/pipelines — .3 — — .3Retail — .2 — — .2Utilities — .2 — — .2Technology — .1 — — .1Transportation — .1 — — .1Other — 3.6 — — 3.6TOTAL FIXED MATURITIES, AVAILABLE FOR SALE $ 4.8 $ 16.7 $ 8.0 $ 3.4 $ 32.9
Our investment strategy is to maximize, over a sustained period and within acceptable parameters of quality and risk, investment income and total investment return through active investment management. Accordingly, we may sell securities at a gain or a loss to enhance the projected total return of the portfolio as market opportunities change, to refl ect changing perceptions of risk, or to better match certain characteristics of our investment portfolio with the corresponding characteristics of our insurance liabilities.
Our fi xed maturity securities consist predominantly of publicly traded securities. We classify securities issued in the Rule 144A market as publicly traded. Securities not publicly traded comprise approximately 11 percent of our total fi xed maturity securities portfolio.
Fair Value of Investments
Fair value is the price that would be received to sell an asset or paid to transfer a liability in an orderly transaction between market participants at the measurement date and, therefore, represents an exit price, not an entry price. We carry certain assets and liabilities at fair value on a recurring basis, including fi xed maturities, equity securities, trading securities, investments held by VIEs, derivatives, cash and cash equivalents, separate account assets and embedded derivatives. We carry our company-owned life insurance policy, which is backed by a series of mutual funds, at its cash surrender value and our hedge fund investments at their net asset values; in both cases, we believe these values approximate their fair values. In addition, we disclose fair value for certain fi nancial instruments, including mortgage loans and policy loans, insurance liabilities for interest-sensitive products, investment borrowings, notes payable and borrowings related to VIEs.
Th e degree of judgment utilized in measuring the fair value of fi nancial instruments is largely dependent on the level to which pricing is based on observable inputs. Observable inputs refl ect market data obtained from independent sources, while unobservable inputs refl ect our view of market assumptions in the absence of observable market information. Financial instruments with readily available active quoted prices would be considered to have fair values based on the highest level of observable inputs, and little judgment would be utilized in measuring fair value. Financial instruments that rarely trade would often have fair value based on a lower level of observable inputs, and more judgment would be utilized in measuring fair value.
Valuation Hierarchy
Th ere is a three-level hierarchy for valuing assets or liabilities at fair value based on whether inputs are observable or unobservable.
• Level 1 – includes assets and liabilities valued using inputs that are unadjusted quoted prices in active markets for identical assets or liabilities. Our Level 1 assets primarily include cash and exchange traded securities. • Level 2 – includes assets and liabilities valued using inputs that are quoted prices for similar assets in an active market, quoted prices for identical or similar assets in a market that is not active, observable inputs, or observable inputs that can be corroborated by market data. Level 2 assets and liabilities include those fi nancial instruments that are valued by independent pricing services using models or other valuation methodologies. Th ese models are primarily industry-standard models that consider various inputs such as interest rate, credit or issuer spreads, reported trades, broker/dealer quotes and other inputs that are observable or derived from observable information in the marketplace

CNO FINANCIAL GROUP, INC. - Form 10-K 88
PART II ITEM 7 Management’s Discussion and Analysis of Consolidated Financial Condition and Results of Operations
or are supported by observable levels at which transactions are executed in the marketplace. Financial assets in this category primarily include: certain public and privately placed corporate fi xed maturity securities; certain government or agency securities; certain mortgage and asset-backed securities; certain equity securities; most investments held by our consolidated VIEs; certain mutual fund and hedge fund investments; and most short-term investments; and non-exchange-traded derivatives such as call options to hedge liabilities related to our fi xed index annuity products. Financial liabilities in this category include investment borrowings, notes payable and borrowings related to VIEs. • Level 3 – includes assets and liabilities valued using unobservable inputs that are used in model-based valuations that contain management assumptions. Level 3 assets and liabilities include those fi nancial instruments whose fair value is estimated based on non-binding broker prices or internally developed models or methodologies utilizing signifi cant inputs not based on, or corroborated by, readily available market information. Financial assets in this category include certain corporate securities (primarily certain below-investment grade privately placed securities), certain structured securities, mortgage loans, and other less liquid securities. Financial liabilities in this category include our insurance liabilities for interest-sensitive products, which includes embedded derivatives (including embedded derivatives related to our fi xed index annuity products and to a modifi ed coinsurance arrangement) since their values include signifi cant unobservable inputs including actuarial assumptions.
At each reporting date, we classify assets and liabilities into the three input levels based on the lowest level of input that is signifi cant to the measurement of fair value for each asset and liability reported at fair value. Th is classifi cation is impacted by a number of factors, including the type of fi nancial instrument, whether the fi nancial instrument is new to the market and not yet established, the characteristics specifi c to the transaction and overall market conditions. Our assessment of the signifi cance of a particular input to the fair value measurement and the ultimate classifi cation of each asset and liability requires judgment and is subject to change from period to period based on the observability of the valuation inputs. Any transfers between levels are reported as having occurred at the beginning of the period. Th ere were no transfers between Level 1 and Level 2 in 2012.
Th e vast majority of our fi xed maturity and equity securities, including those held in trading portfolios and those held by consolidated VIEs, short-term and separate account assets use Level 2 inputs for the determination of fair value. Th ese fair values are obtained primarily from independent pricing services, which use Level 2 inputs for the determination of fair value. Substantially all of our Level 2 fi xed maturity securities and separate account assets were valued from independent pricing services. Th ird party pricing services normally derive the security prices through recently reported trades for identical or similar securities making adjustments through the reporting date based upon available market observable information. If there are no recently reported trades, the third party pricing services may use matrix or model processes to develop a security price where future cash fl ow expectations are developed and discounted at an estimated risk-adjusted market rate. Th e number of prices obtained for a given security is dependent on the Company’s analysis of such prices as further described below.
For securities that are not priced by pricing services and may not be reliably priced using pricing models, we obtain broker quotes. Th ese broker quotes are non-binding and represent an exit price, but
assumptions used to establish the fair value may not be observable and therefore represent Level 3 inputs. Approximately 20 percent of our Level 3 fi xed maturity securities were valued using unadjusted broker quotes or broker-provided valuation inputs. Th e remaining Level 3 fi xed maturity investments do not have readily determinable market prices and/or observable inputs. For these securities, we use internally developed valuations. Key assumptions used to determine fair value for these securities may include risk-free rates, risk premiums, performance of underlying collateral and other factors involving signifi cant assumptions which may not be refl ective of an active market. For certain investments, we use a matrix or model process to develop a security price where future cash fl ow expectations are developed and discounted at an estimated market rate. Th e pricing matrix utilizes a spread level to determine the market price for a security. Th e credit spread generally incorporates the issuer’s credit rating and other factors relating to the issuer’s industry and the security’s maturity. In some instances issuer-specifi c spread adjustments, which can be positive or negative, are made based upon internal analysis of security specifi cs such as liquidity, deal size, and time to maturity.
As the Company is responsible for the determination of fair value, we have control processes designed to ensure that the fair values received from third-party pricing sources are reasonable and the valuation techniques and assumptions used appear reasonable and consistent with prevailing market conditions. Additionally, when inputs are provided by third-party pricing sources, we have controls in place to review those inputs for reasonableness. As part of these controls, we perform monthly quantitative and qualitative analysis on the prices received from third parties to determine whether the prices are reasonable estimates of fair value. Th e Company’s analysis includes: (i) a review of the methodology used by third party pricing services; (ii) where available, a comparison of multiple pricing services’ valuations for the same security; (iii) a review of month to month price fl uctuations; (iv) a review to ensure valuations are not unreasonably stale; and (v) back testing to compare actual purchase and sale transactions with valuations previously received from third parties. As a result of such procedures, the Company may conclude the prices received from third parties are not refl ective of current market conditions. In those instances, we may request additional pricing quotes or apply internally developed valuations. However, the number of instances is insignifi cant and the aggregate change in value of such investments is not materially diff erent from the original prices received.
Th e categorization of the fair value measurements of our investments priced by independent pricing services was based upon the Company’s judgment of the inputs or methodologies used by the independent pricing services to value diff erent asset classes. Such inputs include: benchmark yields, reported trades, broker dealer quotes, issuer spreads, benchmark securities, bids, off ers and reference data. Th e Company categorizes such fair value measurements based upon asset classes and the underlying observable or unobservable inputs used to value such investments.
Th e fair value measurements for derivative instruments, including embedded derivatives requiring bifurcation, are determined based on the consideration of several inputs including closing exchange or over-the-counter market price quotations; time value and volatility factors underlying options; market interest rates; and non-performance risk. For certain embedded derivatives, we may use actuarial assumptions in the determination of fair value.

CNO FINANCIAL GROUP, INC. - Form 10-K 89
PART II ITEM 7 Management’s Discussion and Analysis of Consolidated Financial Condition and Results of Operations
Th e categorization of fair value measurements, by input level, for our fi nancial instruments carried at fair value on a recurring basis at December 31, 2012 is as follows (dollars in millions):
Quoted prices in active markets for identical assets or liabilities
(Level 1)
Signifi cant other observable inputs
(Level 2)
Signifi cant unobservable inputs
(Level 3) TotalASSETS:
Fixed maturities, available for sale: Corporate securities $ — $ 16,498.6 $ 355.5 $ 16,854.1United States Treasury securities and obligations of United States government corporations and agencies — 99.5 — 99.5States and political subdivisions — 2,115.0 13.1 2,128.1Debt securities issued by foreign governments — .8 — .8Asset-backed securities — 1,416.9 44.0 1,460.9Collateralized debt obligations — — 324.0 324.0Commercial mortgage-backed securities — 1,471.2 6.2 1,477.4Mortgage pass-through securities — 19.9 1.9 21.8Collateralized mortgage obligations — 2,230.6 16.9 2,247.5
Total fi xed maturities, available for sale — 23,852.5 761.6 24,614.1Equity securities:
Corporate securities 49.7 118.8 .1 168.6Venture capital investments — — 2.8 2.8
Total equity securities 49.7 118.8 2.9 171.4Trading securities:
Corporate securities — 46.6 — 46.6United States Treasury securities and obligations of United States government corporations and agencies — 4.8 — 4.8States and political subdivisions — 14.0 .6 14.6Asset-backed securities — 50.1 — 50.1Collateralized debt obligations — — 7.3 7.3Commercial mortgage-backed securities — 93.3 — 93.3Mortgage pass-through securities — .1 — .1Collateralized mortgage obligations — 41.2 5.8 47.0Equity securities .9 1.5 — 2.4
Total trading securities .9 251.6 13.7 266.2Investments held by variable interest entities - corporate securities — 814.3 — 814.3Other invested assets - derivatives — 54.4 — 54.4Assets held in separate accounts — 14.9 — 14.9TOTAL ASSETS CARRIED AT FAIR VALUE BY CATEGORY $ 50.6 $ 25,106.5 $ 778.2 $ 25,935.3LIABILITIES:
Liabilities for insurance products: Interest-sensitive products - embedded derivatives associated with fi xed index annuity products — — 734.0 734.0Interest-sensitive products - embedded derivatives associated with modifi ed coinsurance agreement — — 5.5 5.5
TOTAL LIABILITIES FOR INSURANCE PRODUCTS — — 739.5 739.5TOTAL LIABILITIES CARRIED AT FAIR VALUE BY CATEGORY $ — $ — $ 739.5 $ 739.5

CNO FINANCIAL GROUP, INC. - Form 10-K 90
PART II ITEM 7 Management’s Discussion and Analysis of Consolidated Financial Condition and Results of Operations
Th e following table presents additional information about assets and liabilities measured at fair value on a recurring basis and for which we have utilized signifi cant unobservable (Level 3) inputs to determine fair value for the year ended December 31, 2012 (dollars in millions):
December 31, 2012
Beginning balance as of
December 31, 2011 (a)
Purchases, sales,
issuances and settlements,
net (c)
Total realized and
unrealized gains (losses)
included in net income
Total realized and unrealized
gains (losses) included in
accumulated other
comprehensive income (loss)
Transfers into
Level 3
Transfers out of
Level 3 (b)
Ending balance as of
December 31, 2012
Amount of total gains (losses) for
the year ended December 31,
2012 included in our net income
relating to assets and liabilities
still held as of the reporting date
ASSETS:
Fixed maturities, available for sale:
Corporate securities $ 278.1 $ 88.1 $ (.2) $ 9.9 $ 68.6 $ (89.0) $ 355.5 $ — United States Treasury securities and obligations of United States government corporations and agencies 1.6 (1.6) — — — — — — States and political subdivisions 2.1 (1.8) — .9 11.9 — 13.1 — Asset-backed securities 79.7 15.2 (.3) 6.3 .5 (57.4) 44.0 — Collateralized debt obligations 327.3 (24.8) — 21.5 — — 324.0 — Commercial mortgage-backed securities 17.3 (2.5) — .8 5.7 (15.1) 6.2 — Mortgage pass-through securities 2.2 (.3) — — — — 1.9 — Collateralized mortgage obligations 124.8 .2 — (.1) 5.0 (113.0) 16.9 —
Total fi xed maturities, available for sale 833.1 72.5 (.5) 39.3 91.7 (274.5) 761.6 — Equity securities:
Corporate securities 6.4 (3.2) (3.8) .7 — — .1 (3.8)Venture capital investments 63.5 (34.3) (26.0) (.4) — — 2.8 —
Total equity securities 69.9 (37.5) (29.8) .3 — — 2.9 (3.8)Trading securities:
States and political subdivisions — — .1 — .5 — .6 .1 Collateralized debt obligations — 6.9 .4 — — 7.3 .4 Commercial mortgage-backed securities .4 — — — — (.4) — — Collateralized mortgage obligations — 4.5 1.3 — — — 5.8 1.3
Total trading securities .4 11.4 1.8 — .5 (.4) 13.7 1.8 LIABILITIES:
Liabilities for insurance products:
Interest-sensitive products (669.8) (54.5) (15.2) — — — (739.5) (15.2)
(a) We revised the hierarchy classification of certain fixed maturities, equity securities, trading securities and other invested assets as we believe the observability of the inputs more closely represent Level 2 valuations.
(b) For our fixed maturity securities, the majority of our transfers out of Level 3 are the result of obtaining a valuation from an independent pricing service at the end of the period, whereas a broker quote was used as of the beginning of the period.

CNO FINANCIAL GROUP, INC. - Form 10-K 91
PART II ITEM 7 Management’s Discussion and Analysis of Consolidated Financial Condition and Results of Operations
(c) Purchases, sales, issuances and settlements, net, represent the activity that occurred during the period that results in a change of the asset or liability but does not represent changes in fair value for the instruments held at the beginning of the period. Such activity primarily consists of purchases and sales of fixed maturity and equity securities and changes to embedded derivative instruments related to insurance products resulting from the issuance of new contracts, or changes to existing contracts. The following summarizes such activity for the year ended December 31, 2012 (dollars in millions):
Purchases Sales Issuances Settlements
Purchases, sales, issuances and
settlements, netASSETS:
Fixed maturities, available for sale: Corporate securities $ 110.3 $ (22.2) $ — $ — $ 88.1 United States Treasury securities and obligations of United States government corporations and agencies — (1.6) — — (1.6)States and political subdivisions — (1.8) — — (1.8)Asset-backed securities 19.0 (3.8) — — 15.2 Collateralized debt obligations 35.4 (60.2) — — (24.8)Commercial mortgage-backed securities — (2.5) — — (2.5)Mortgage pass-through securities — (.3) — — (.3)Collateralized mortgage obligations 11.2 (11.0) — — .2
Total fi xed maturities, available for sale 175.9 (103.4) — — 72.5 Equity securities:
Corporate securities — (3.2) — — (3.2)Venture capital investments — (34.3) — — (34.3)
Total equity securities — (37.5) — — (37.5)Trading securities:
Collateralized debt obligations 6.9 — — — 6.9 Collateralized mortgage obligations 4.5 — — — 4.5
Total trading securities 11.4 — — — 11.4 LIABILITIES:
Liabilities for insurance products: Interest-sensitive products (103.3) 60.4 (50.9) 39.3 (54.5)
At December 31, 2012, 91 percent of our Level 3 fi xed maturities, available for sale, were investment grade and 43 percent and 47 percent of our Level 3 fi xed maturities, available for sale, consisted of collateralized debt securities and corporate securities, respectively.
Realized and unrealized investment gains and losses presented in the preceding tables represent gains and losses during the time the applicable fi nancial instruments were classifi ed as Level 3.
Realized and unrealized gains (losses) on Level 3 assets are primarily reported in either net investment income for policyholder and reinsurer accounts and other special-purpose portfolios, net realized investment gains (losses) or insurance policy benefi ts within the consolidated statement of operations or accumulated other comprehensive income within shareholders’ equity based on the appropriate accounting treatment for the instrument.
Th e amount presented for gains (losses) included in our net loss for assets and liabilities still held as of the reporting date primarily represents impairments for fi xed maturities, available for sale, changes in fair value of trading securities and certain derivatives and changes in fair value of embedded derivative instruments included in liabilities for insurance products that exist as of the reporting date.
Investment ratings are assigned the second lowest rating by a nationally recognized statistical rating organization (primarily Moody’s, S&P or Fitch), or if not rated by such fi rms, the rating assigned by the NAIC. NAIC designations of “1” or “2” include fi xed maturities generally rated investment grade (rated “Baa3” or higher by Moody’s or rated “BBB-” or higher by S&P and Fitch. NAIC designations of “3” through “6” are referred to as below-investment grade (which generally are rated “Ba1” or lower by Moody’s or rated “BB+” or lower by S&P and Fitch). References to investment grade or below-investment grade throughout our consolidated fi nancial statements are based on such nationally recognized statistical ratings.

CNO FINANCIAL GROUP, INC. - Form 10-K 92
PART II ITEM 7 Management’s Discussion and Analysis of Consolidated Financial Condition and Results of Operations
Th e following table sets forth fi xed maturity investments at December 31, 2012, classifi ed by ratings (dollars in millions):
Investment rating Amortized cost
Estimated fair value
AmountPercent of fi xed
maturitiesAAA $ 2,044.6 $ 2,271.8 9%AA 1,965.7 2,234.7 9 A 4,806.2 5,673.9 23 BBB+ 3,019.2 3,516.0 14 BBB 4,255.0 4,848.8 20 BBB- 3,194.9 3,562.3 15
Investment grade 19,285.6 22,107.5 90 BB+ 338.0 355.0 2 BB 334.0 352.2 1 BB- 334.9 354.8 1 B+ and below 1,334.3 1,444.6 6
Below-investment grade 2,341.2 2,506.6 10 TOTAL FIXED MATURITY SECURITIES $ 21,626.8 $ 24,614.1 100%
Th e following table summarizes investment yields earned over the past three years on the general account invested assets of our insurance subsidiaries. General account investments exclude the value of options (dollars in millions):
2012 2011 2010Weighted average general account invested assets as defi ned:
As reported $ 26,757.8 $ 24,758.2 $ 22,965.8 Excluding unrealized appreciation (depreciation) (a) 24,215.5 23,370.6 22,117.9
Net investment income on general account invested assets 1,394.9 1,357.7 1,294.9 Yields earned:
As reported 5.21% 5.48% 5.64%Excluding unrealized appreciation (depreciation) (a) 5.76% 5.81% 5.85%
(a) Excludes the effect of reporting fixed maturities at fair value as described in the note to our consolidated financial statements entitled “Investments”
Although investment income is a signifi cant component of total revenues, the profi tability of certain of our insurance products is determined primarily by the spreads between the interest rates we earn and the rates we credit or accrue to our insurance liabilities. At December 31, 2012 and 2011, the average yield, computed on the cost basis of our fi xed maturity portfolio, was 5.7 percent and 5.9 percent, respectively, and the average interest rate credited or accruing to our total insurance liabilities (excluding interest rate bonuses for the fi rst policy year only and excluding the eff ect of credited rates attributable to variable or fi xed index products) was 4.5 percent and 4.4 percent, respectively.
Fixed Maturities, Available for Sale
Our fi xed maturity portfolio at December 31, 2012, included primarily debt securities of the United States government, various corporations, and structured securities. Asset-backed securities, collateralized debt obligations, commercial mortgage-backed securities, mortgage pass-through securities and collateralized mortgage obligations are collectively referred to as “structured securities”.
At December 31, 2012, our fi xed maturity portfolio had $3,020.2 million of unrealized gains and $32.9 million of unrealized losses, for a net unrealized gain of $2,987.3 million. Estimated fair values of fi xed maturity investments were determined based on estimates from: (i) nationally recognized pricing services (88 percent of the portfolio); (ii) broker-dealer market makers (9 percent of the portfolio); and (iii) internally developed methods (3 percent of the portfolio).
At December 31, 2012, approximately 9.0 percent of our invested assets (10 percent of fi xed maturity investments) were fi xed maturities rated below-investment grade. Our level of investments in below-investment grade fi xed maturities could change based on market conditions or changes in our management policies. Below-investment grade corporate debt securities have diff erent characteristics than investment grade corporate debt securities. Based on historical performance, probability of default by the borrower is signifi cantly greater for below-investment grade securities and in many cases severity of loss is relatively greater as such securities are often subordinated to other indebtedness of the issuer. Also, issuers of below-investment grade securities frequently have higher levels of debt relative to investment-grade issuers, hence, all other things being equal, are more sensitive to adverse economic conditions, such as recession or increasing interest rates. Th e Company attempts to reduce the overall risk related to its investment in below-investment grade securities, as in all investments, through careful credit analysis, strict investment policy guidelines, and diversifi cation by issuer and/or guarantor and by industry. At December 31, 2012, our below-investment grade fi xed maturity investments had an amortized cost of $2,341.2 million and an estimated fair value of $2,506.6 million.
We continually evaluate the creditworthiness of each issuer whose securities we hold. We pay special attention to large investments and to those securities whose fair values have declined materially for reasons other than changes in interest rates or other general market conditions. We evaluate the realizable value of the investment, the specifi c condition of the issuer and the issuer’s ability to comply with
CNO FINANCIAL GROUP, INC. - Form 10-K 93
PART II ITEM 7 Management’s Discussion and Analysis of Consolidated Financial Condition and Results of Operations
the material terms of the security. We review the recent operational results and fi nancial position of the issuer, information about its industry, information about factors aff ecting the issuer’s performance and other information. 40|86 Advisors employs experienced securities analysts in a variety of specialty areas who compile and review such data. If evidence does not exist to support a realizable value equal to or greater than the amortized cost of the investment, and such decline in fair value is determined to be other than temporary, we reduce the amortized cost to its fair value, which becomes the new cost basis. We report the amount of the reduction as a realized loss. We recognize any recovery of such reductions as investment income over the remaining life of the investment (but only to the extent our current valuations indicate such amounts will ultimately be collected), or upon the repayment of the investment. During 2012, we recognized net realized investment gains of $81.1 million, which were comprised of $98.8 million of net gains from the sales of investments (primarily fi xed maturities) with proceeds of $2.1 billion, the increase in fair value of certain fi xed maturity investments with embedded derivatives of $20.1 million and $37.8 million of writedowns of investments for other than temporary declines in fair value recognized through net income. Our investment portfolio is subject to the risk of declines in realizable value. However, we attempt to mitigate this risk through the diversifi cation and active management of our portfolio.
Our investment strategy is to maximize, over a sustained period and within acceptable parameters of quality and risk, investment income and total investment return through active investment management. Accordingly, we may sell securities at a gain or a loss to enhance the projected total return of the portfolio as market opportunities change, to refl ect changing perceptions of risk, or to better match certain characteristics of our investment portfolio with the corresponding characteristics of our insurance liabilities.
As of December 31, 2012, we had investments in substantive default (i.e., in default due to nonpayment of interest or principal) that had a carrying value of $.5 million. Th ere were no other fi xed maturity investments about which we had serious doubts as to the recoverability of the carrying value of the investment.
When a security defaults or securities (other than structured securities) are other-than-temporarily impaired, our policy is to discontinue the accrual of interest and eliminate all previous interest accruals, if we determine that such amounts will not be ultimately realized in full. Investment income forgone on nonperforming investments was $.6 million, $1.0 million and $2.7 million for the years ended December 31, 2012, 2011 and 2010, respectively.
At December 31, 2012 fi xed maturity investments included structured securities with an estimated fair value of $5.5 billion (or 23 percent of all fi xed maturity securities). Th e yield characteristics of structured securities generally diff er in some respects from those of traditional corporate fi xed-income securities or government securities. For example, interest and principal payments on structured securities may occur
more frequently, often monthly. In many instances, we are subject to the risk that the amount and timing of principal and interest payments may vary from expectations. For example, in many cases, partial prepayments may occur at the option of the issuer and prepayment rates are infl uenced by a number of factors that cannot be predicted with certainty, including: the relative sensitivity of prepayments on the underlying assets backing the security to changes in interest rates; a variety of economic, geographic and other factors; the timing, pace and proceeds of liquidations of defaulted collateral; and various security-specifi c structural considerations (for example, the repayment priority of a given security in a securitization structure). In addition, the total amount of payments for non-government structured securities could be aff ected by changes to cumulative default rates or loss severities of the related collateral.
Historically, the rate of prepayments on structured securities has tended to increase when prevailing interest rates have declined signifi cantly in absolute terms and also relative to the interest rates on the underlying collateral. Th e yields recognized on structured securities purchased at a discount to par will increase (relative to the stated rate) when the underlying collateral prepays faster than expected. Th e yields recognized on structured securities purchased at a premium will decrease (relative to the stated rate) when the underlying collateral prepays faster than expected. When interest rates decline, the proceeds from prepayments may be reinvested at lower rates than we were earning on the prepaid securities. When interest rates increase, prepayments may decrease below expected levels. When this occurs, the average maturity and duration of structured securities increases, decreasing the yield on structured securities purchased at discounts and increasing the yield on those purchased at a premium because of a decrease in the annual amortization of premium. However, current prepayment rates are less sensitive to changes in interest rates for a variety of reasons.
For structured securities that were purchased at a discount or premium, we recognize investment income using an eff ective yield based on anticipated future prepayments and the estimated fi nal maturity of the securities. Actual prepayment experience is periodically reviewed and eff ective yields are recalculated when diff erences arise between the prepayments originally anticipated and the actual prepayments received and currently anticipated. For credit sensitive mortgage-backed and asset-backed securities, and for securities that can be prepaid or settled in a way that we would not recover substantially all of our investment, the eff ective yield is recalculated on a prospective basis. Under this method, the amortized cost basis in the security is not immediately adjusted and a new yield is applied prospectively. For all other structured and asset-backed securities, the eff ective yield is recalculated when changes in assumptions are made, and refl ected in our income on a retrospective basis. Under this method, the amortized cost basis of the investment in the securities is adjusted to the amount that would have existed had the new eff ective yield been applied since the acquisition of the securities. Such adjustments were not signifi cant in 2012.

CNO FINANCIAL GROUP, INC. - Form 10-K 94
PART II ITEM 7 Management’s Discussion and Analysis of Consolidated Financial Condition and Results of Operations
Th e following table sets forth the par value, amortized cost and estimated fair value of structured securities, summarized by interest rates on the underlying collateral at December 31, 2012 (dollars in millions):
Par value Amortized costEstimated fair
valueBelow 4 percent $ 609.4 $ 564.1 $ 581.84 percent – 5 percent 793.1 773.7 850.35 percent – 6 percent 2,718.1 2,575.9 2,825.06 percent – 7 percent 941.4 881.4 967.27 percent – 8 percent 159.5 164.8 176.38 percent and above 127.7 128.7 131.0TOTAL STRUCTURED SECURITIES $ 5,349.2 $ 5,088.6 $ 5,531.6
Th e amortized cost and estimated fair value of structured securities at December 31, 2012, summarized by type of security, were as follows (dollars in millions):
Type Amortized cost
Estimated fair value
AmountPercent of fi xed
maturitiesPass-throughs, sequential and equivalent securities $ 1,376.6 $ 1,492.7 6.1%Planned amortization classes, target amortization classes and accretion-directed bonds 678.9 746.8 3.0 Commercial mortgage-backed securities 1,325.7 1,477.4 6.0 Asset-backed securities 1,363.9 1,460.9 6.0 Collateralized debt obligations 317.0 324.1 1.3 Other 26.5 29.7 .1 TOTAL STRUCTURED SECURITIES $ 5,088.6 $ 5,531.6 22.5%
Pass-throughs, sequentials and equivalent securities have unique prepayment variability characteristics. Pass-through securities typically return principal to the holders based on cash payments from the underlying mortgage obligations. Sequential securities return principal to tranche holders in a detailed hierarchy. Planned amortization classes, targeted amortization classes and accretion-directed bonds adhere to fi xed schedules of principal payments as long as the underlying mortgage loans experience prepayments within certain estimated ranges. In most circumstances, changes in prepayment rates are fi rst absorbed by support or companion classes insulating the timing of receipt of cash fl ows from the consequences of both faster prepayments (average life shortening) and slower prepayments (average life extension).
Commercial mortgage-backed securities are secured by commercial real estate mortgages, generally income producing properties that are managed for profi t. Property types include multi-family dwellings including apartments, retail centers, hotels, restaurants, hospitals, nursing homes, warehouses, and offi ce buildings. Most commercial mortgage-backed securities have call protection features whereby underlying borrowers may not prepay their mortgages for stated periods of time without incurring prepayment penalties.
During 2012, we sold $402.5 million of fi xed maturity investments which resulted in gross investment losses (before income taxes) of $15.4 million. We sell securities at a loss for a number of reasons including, but not limited to: (i) changes in the investment environment; (ii) expectation that the fair value could deteriorate further; (iii) desire to reduce our exposure to an asset class, an issuer or an industry; (iv) changes in credit
quality; or (v) changes in expected liability cash fl ows. As discussed in the notes to our consolidated fi nancial statements, the realization of gains and losses aff ects the timing of the amortization of insurance acquisition costs related to universal life and investment products.
Other Investments
At December 31, 2012, we held commercial mortgage loan investments with a carrying value of $1,573.2 million (or 5.6 percent of total invested assets) and a fair value of $1,682.1 million. We had no mortgage loans that were in the process of foreclosure at December 31, 2012. During 2012 and 2011, we recognized $5.4 million and $11.8 million, respectively, of writedowns of commercial mortgage loans resulting from declines in fair value that we concluded were other than temporary. During 2010, we recognized $40.8 million of writedowns of commercial mortgage loans resulting from declines in fair value that we concluded were other than temporary. Our commercial mortgage loan portfolio is comprised of large commercial mortgage loans. We do not hold groups of smaller-balance homogeneous loans. Our loans have risk characteristics that are unique to an individual borrower. Accordingly, we measure potential losses on a loan-by-loan basis rather than establishing an allowance for losses on mortgage loans. Approximately 8 percent, 7 percent, 6 percent, 6 percent, 5 percent, 5 percent and 5 percent of the mortgage loan balance were on properties located in California, Minnesota, Arizona, Indiana, Florida, Maryland and Texas, respectively. No other state comprised greater than fi ve percent of the mortgage loan balance.

CNO FINANCIAL GROUP, INC. - Form 10-K 95
PART II ITEM 7 Management’s Discussion and Analysis of Consolidated Financial Condition and Results of Operations
Th e following table shows the distribution of our commercial mortgage loan portfolio by property type as of December 31, 2012 (dollars in millions):
Number of loans Carrying valueRetail 196 $ 574.8Offi ce building 60 503.4Industrial 34 281.1Multi-family 15 113.7Other 6 100.2TOTAL COMMERCIAL MORTGAGE LOANS 311 $ 1,573.2
Th e following table shows our commercial mortgage loan portfolio by loan size as of December 31, 2012 (dollars in millions):
Number of loans Carrying valueUnder $5 million 211 $ 338.6$5 million but less than $10 million 55 396.1$10 million but less than $20 million 25 333.8Over $20 million 20 504.7TOTAL COMMERCIAL MORTGAGE LOANS 311 $ 1,573.2
Th e following table summarizes the distribution of maturities of our commercial mortgage loans as of December 31, 2012 (dollars in millions):
Number of loans Carrying value2013 11 $ 116.62014 15 62.82015 22 84.62016 30 95.22017 43 207.1A fter 2017 190 1,006.9TOTAL COMMERCIAL MORTGAGE LOANS 311 $ 1,573.2
Th e following table provides the carrying value and estimated fair value of our outstanding mortgage loans and the underlying collateral as of December 31, 2012 (dollars in millions):
Loan-to-value ratio (a) Carrying valueEstimated fair value
Mortgage loans CollateralLess than 60% $ 758.9 $ 838.7 $ 2,172.660% to 70% 323.1 342.7 498.2Greater than 70% to 80% 266.9 281.5 358.7Greater than 80% to 90% 114.1 118.5 135.0Greater than 90% 110.2 100.7 117.3TOTAL $ 1,573.2 $ 1,682.1 $ 3,281.8(a) Loan-to-value ratios are calculated as the ratio of: (i) the carrying value of the commercial mortgage loans; to (ii) the estimated fair value of the underlying collateral.
At December 31, 2012, we held $266.2 million of trading securities. We carry trading securities at estimated fair value; changes in fair value are refl ected in the statement of operations. Our trading securities include: (i) investments purchased with the intent of selling in the near term to generate income on price changes; (ii) investments supporting certain insurance liabilities (including investments backing the market strategies of our multibucket annuity products) and certain reinsurance agreements; and (iii) certain fi xed maturity securities containing embedded derivatives for which we have elected the fair value option. Prior to June 30, 2011, certain of our trading securities were held to off set the income statement volatility caused by the eff ect of interest rate fl uctuations on the value of embedded derivatives related to our fi xed index annuity products. During the second quarter of 2011, we sold this trading portfolio. See the note to the consolidated fi nancial statements entitled “Summary of Signifi cant Accounting Policies - Accounting for Derivatives” for further discussion regarding
the embedded derivatives and the trading accounts. In addition, the trading account includes investments backing the market strategies of our multibucket annuity products.
Other invested assets also include options backing our fi xed index products, credit default swaps and certain nontraditional investments, including investments in limited partnerships, promissory notes, hedge funds and real estate investments held for sale.
At December 31, 2012, we held investments with an amortized cost of $809.3 million and an estimated fair value of $814.3 million related to variable interest entities that we are required to consolidate. Th e investment portfolio held by the variable interest entities is primarily comprised of commercial bank loans, the borrowers for which are almost entirely rated below-investment grade. Refer to the note to the consolidated fi nancial statements entitled “Investments in Variable Interest Entities” for additional information on these investments.

CNO FINANCIAL GROUP, INC. - Form 10-K 96
PART II ITEM 7 Management’s Discussion and Analysis of Consolidated Financial Condition and Results of Operations
Consolidated Financial Condition
Changes in the Consolidated Balance Sheet
Changes in our consolidated balance sheet between December 31, 2012 and December 31, 2011, primarily refl ect: (i) our net income for 2012; (ii) changes in the fair value of our fi xed maturity securities, available for sale; (iii) the recapitalization transactions completed in September 2012, as further discussed below under the caption “Liquidity of the Holding Companies”; and (iv) common stock repurchases of $180.2 million.
In accordance with GAAP, we record our fi xed maturity securities, available for sale, equity securities and certain other invested assets at estimated fair value with any unrealized gain or loss (excluding impairment losses, which are recognized through earnings), net of tax and related adjustments, recorded as a component of shareholders’ equity. At December 31, 2012, we increased the carrying value of such investments by $3.0 billion as a result of this fair value adjustment.
Our capital structure as of December 31, 2012 and 2011 was as follows (dollars in millions):
December 31, 2012 December 31, 2011Total capital: Corporate notes payable $ 1,004.2 $ 857.9 Shareholders’ equity:
Common stock 2.2 2.4 Additional paid-in capital 4,174.7 4,361.9 Accumulated other comprehensive income 1,197.4 781.6 Accumulated defi cit (325.0) (532.1)
Total shareholders’ equity 5,049.3 4,613.8 TOTAL CAPITAL $ 6,053.5 $ 5,471.7
Th e following table summarizes certain fi nancial ratios as of and for the years ended December 31, 2012 and 2011:
December 31, 2012 December 31, 2011Book value per common share $ 22.80 $ 19.12 Book value per common share, excluding accumulated other comprehensive income (a) 17.39 15.88 Ratio of earnings to fi xed charges 1.40X 1.75X Debt to total capital ratios:
Corporate debt to total capital 16.6% 15.7%Corporate debt to total capital, excluding accumulated other comprehensive income (a) 20.7% 18.3%
(a) This non-GAAP measure differs from the corresponding GAAP measure presented immediately above, because accumulated other comprehensive income has been excluded from the value of capital used to determine this measure. Management believes this non-GAAP measure is useful because it removes the volatility that arises from changes in accumulated other comprehensive income. Such volatility is often caused by changes in the estimated fair value of our investment portfolio resulting from changes in general market interest rates rather than the business decisions made by management. However, this measure does not replace the corresponding GAAP measure.

CNO FINANCIAL GROUP, INC. - Form 10-K 97
PART II ITEM 7 Management’s Discussion and Analysis of Consolidated Financial Condition and Results of Operations
Contractual Obligations
Th e Company’s signifi cant contractual obligations as of December 31, 2012, were as follows (dollars in millions):
TotalPayment due in
2013 2014-2015 2016-2017 Th ereafterInsurance liabilities (a) $ 56,177.1 $ 3,823.6 $ 7,860.3 $ 7,286.1 $ 37,207.1Notes payable (b) 1,319.2 110.2 241.1 240.7 727.2Investment borrowings (c) 1,782.9 29.4 830.9 871.6 51.0Borrowings related to variable interest entities (d) 927.7 19.6 39.3 39.4 829.4Postretirement plans (e) 233.3 5.5 12.2 13.1 202.5Operating leases and certain other contractual commitments (f ) 155.1 44.3 52.5 33.0 25.3TOTAL $ 60,595.3 $ 4,032.6 $ 9,036.3 $ 8,483.9 $ 39,042.5(a) These cash flows represent our estimates of the payments we expect to make to our policyholders, without consideration of future premiums or reinsurance recoveries. These
estimates are based on numerous assumptions (depending on the product type) related to mortality, morbidity, lapses, withdrawals, future premiums, future deposits, interest rates on investments, credited rates, expenses and other factors which affect our futur e payments. The cash flows presented are undiscounted for interest. As a result, total outflows for all years exceed the corresponding liabilities of $25.1 billion included in our consolidated balance sheet as of December 31, 2012. As such payments are based on numerous assumptions, the actual payments may vary significantly from the amounts shown.In estimating the payments we expect to make to our policyholders, we considered the following:• For products such as immediate annuities and str uctured settlement annuities without life contingencies, the payment obligati on is fixed and determinable based on
the terms of the policy.• For products such as universal life, ordinary life, long-term care, supplemental health and fixed rate annuities, the future payments are not due until the occurrence of
an insurable event (such as death or disability) or a triggering event (such as a surrender or partial withdrawal). We estimated these payments using actuarial models based on historical experience and our expectation of the future payment patterns.
• For short-term insurance products such as M edicare supplement insurance, the future payments relate only to amounts necessar y to settle all outstanding claims, including those that have been incurred but not reported as of the balance sheet date. We estimated these payments based on our historical experience and our expectation of future payment patterns.
• The average interest rate we assumed would be credited to our total insurance liabilities (excluding interest rate bonuses for the first policy year only and excluding the effect of credited rates attributable to variable or fixed index products) over the term of the contracts was 4.5 percent.
(b) Includes projected interest payments based on market rates, as applicable, as of December 31, 2012. Refer to the note to the consolidated financial statements entitled “Notes Payable - Direct Corporate Obligations” for additional information on notes payable.
(c) These borrowings primarily represent collateralized borrowings from the FHLB.(d) These borrowings represent the securities issued by VIEs and include projected interest payments based on market rates, as applicable, as of December 31, 2012.(e) Includes benefits expected to be paid pursuant to our deferred compensation plan and postretirement plans based on numerous actuarial assumptions and interest credited
at 4.00 percent.(f ) Refer to the notes to the consolidated financial statements entitled “Commitments and Contingencies ” for additional information on operating leases and cer tain other
contractual commitments.It is possible that the ultimate outcomes of various uncertainties could affect our liquidity in future periods. For example, the following events could have a material adverse effect on our cash flows:• An adverse decision in pending or future litigation.• An inability to obtain rate increases on certain of our insurance products.• Worse than anticipated claims experience.• Lower than expected dividends and/or surplus debenture interest payments from our insurance subsidiaries (resulting from inadequate earnings or capital or regulatory
requirements).• An inability to meet and/or maintain the covenants in our New Senior Secured Credit Agreement.• A significant increase in policy surrender levels.• A significant increase in investment defaults.• An inability of our reinsurers to meet their financial obligations.
While we seek to balance the duration and cash fl ows of our invested assets with the estimated duration and cash fl ows of benefi t payments arising from contract liabilities, there could be signifi cant variations in the timing of such cash fl ows. Although we believe our current estimates properly project future claim experience, if these estimates prove to be wrong, and our experience worsens (as it did in some prior periods), our future liquidity could be adversely aff ected.
Liquidity for Insurance Operations
Our insurance companies generally receive adequate cash fl ows from premium collections and investment income to meet their obligations. Life insurance, long-term care insurance and annuity liabilities are
generally long-term in nature. Life and annuity policyholders may, however, withdraw funds or surrender their policies, subject to any applicable penalty provisions; there are generally no withdrawal or surrender benefi ts for long-term care insurance. We seek to balance the duration of our invested assets with the estimated duration of benefi t payments arising from contract liabilities.
Th ree of the Company’s insurance subsidiaries (Conseco Life, Washington National and Bankers Life) are members of the FHLB. As members of the FHLB, Conseco Life, Washington National and Bankers Life have the ability to borrow on a collateralized basis from the FHLB. Conseco Life, Washington National and Bankers Life are required to hold certain minimum amounts of FHLB common stock as a condition

CNO FINANCIAL GROUP, INC. - Form 10-K 98
PART II ITEM 7 Management’s Discussion and Analysis of Consolidated Financial Condition and Results of Operations
of membership in the FHLB, and additional amounts based on the amount of the borrowings. At December 31, 2012, the carrying value of the FHLB common stock was $82.5 million. As of December 31, 2012, collateralized borrowings from the FHLB totaled $1.7 billion and the proceeds were used to purchase fi xed maturity securities. Th e borrowings
are classifi ed as investment borrowings in the accompanying consolidated balance sheet. Th e borrowings are collateralized by investments with an estimated fair value of $2.0 billion at December 31, 2012, which are maintained in custodial accounts for the benefi t of the FHLB.
Th e following summarizes the terms of the borrowings (dollars in millions):
Amount borrowed Maturity date Interest rate at December 31, 2012$ 67.0 February 2014 Fixed rate – 1.830% 50.0 August 2014 Variable rate – 0.440% 100.0 August 2014 Variable rate – 0.470% 50.0 September 2015 Variable rate – 0.613% 150.0 October 2015 Variable rate – 0.559% 100.0 November 2015 Variable rate – 0.390% 146.0 November 2015 Fixed rate – 5.300% 100.0 December 2015 Fixed rate – 4.710% 100.0 June 2016 Variable rate – 0.650% 75.0 June 2016 Variable rate – 0.471% 100.0 October 2016 Variable rate – 0.535% 50.0 November 2016 Variable rate – 0.581% 50.0 November 2016 Variable rate – 0.680% 100.0 June 2017 Variable rate – 0.735% 100.0 July 2017 Fixed rate – 3.900% 50.0 August 2017 Variable rate – 0.510% 75.0 August 2017 Variable rate – 0.462% 100.0 October 2017 Variable rate – 0.770% 37.0 November 2017 Fixed rate – 3.750% 50.0 July 2018 Variable rate – 0.783%$ 1,650.0
State laws generally give state insurance regulatory agencies broad authority to protect policyholders in their jurisdictions. Regulators have used this authority in the past to restrict the ability of our insurance subsidiaries to pay any dividends or other amounts without prior approval. We cannot be assured that the regulators will not seek to assert greater supervision and control over our insurance subsidiaries’ businesses and fi nancial aff airs.
Th e 2012 statutory annual statements to be fi led with the state insurance regulators of each of our insurance subsidiaries are expected to refl ect total adjusted capital in excess of the levels subjecting the subsidiaries to any regulatory action. However, the RBC ratio of Conseco Life, which has experienced signifi cant losses primarily related to pending legal settlements, was near the level at which it would have been required to submit a comprehensive plan to insurance regulators proposing corrective actions aimed at improving its capital position. Conseco Life’s domestic state is expected to adopt new RBC requirements which would increase the RBC level required to avoid regulatory action, eff ective December 31, 2013. If those increased requirements had been in eff ect at December 31, 2012, the RBC ratio of Conseco Life at that date would have been at a level that would require Conseco Life to submit a comprehensive plan to the state regulatory authority proposing corrective actions aimed at improving its capital position. No assurances can be given that Capital will be contributed or otherwise made available to Conseco Life or the other insurance subsidiaries.
In addition to the RBC requirements, certain states have established minimum capital requirements for insurance companies licensed to do business in their state. Th ese regulators have the discretionary
authority, in connection with the continual licensing of the Company’s insurance subsidiaries, to limit or prohibit writing new business within its jurisdiction when, in the state’s judgment, the insurance subsidiary is not maintaining adequate statutory surplus or capital or that the insurance subsidiary’s further transaction of business would be hazardous to policyholders. Th e state insurance department rules provide several standards for the regulators to use in identifying companies which may be deemed to be in hazardous fi nancial condition. One of the standards defi nes hazardous conditions as existing if an insurer’s operating loss in the last twelve months or any shorter period of time, (including, but not limited to: (A) net capital gain or loss; (B) change in nonadmitted assets; and (C) cash dividends paid to shareholders), is greater than fi fty percent of the insurer’s remaining surplus. One of the Company’s subsidiaries, Conseco Life, has reported statutory fi nancial results that indicate a surplus defi ciency under this calculation. We have been in contact with regulators in Conseco Life’s domestic state insurance department regarding this matter following the signifi cant loss Conseco Life recognized in the third quarter of 2012, primarily related to a pending legal settlement. Based on our current discussions with the state insurance regulator, we do not expect any actions to be taken against Conseco Life that would have a material adverse eff ect on the fi nancial position or results of operations of CNO.
During 2012, the fi nancial statements of three of our insurance subsidiaries prepared in accordance with statutory accounting practices prescribed or permitted by regulatory authorities refl ected asset adequacy or premium defi ciency reserves. Total asset adequacy and premium defi ciency reserves for Conseco Life, Washington National and Bankers

CNO FINANCIAL GROUP, INC. - Form 10-K 99
PART II ITEM 7 Management’s Discussion and Analysis of Consolidated Financial Condition and Results of Operations
Conseco Life were $318.0 million, $87.0 million and $19.0 million, respectively, at December 31, 2012. Due to diff erences between statutory and GAAP insurance liabilities, we were not required to recognize a similar asset adequacy or premium defi ciency reserve in our consolidated fi nancial statements prepared in accordance with GAAP. Th e determination of the need for and amount of asset adequacy or premium defi ciency reserves is subject to numerous actuarial assumptions, including the Company’s ability to change NGEs related to certain products consistent with contract provisions.
Financial Strength Ratings of our Insurance Subsidiaries
Financial strength ratings provided by A.M. Best, S&P and Moody’s are the rating agency’s opinions of the ability of our insurance subsidiaries to pay policyholder claims and obligations when due.
On September 4, 2012, A.M. Best upgraded the fi nancial strength ratings of our primary insurance subsidiaries, except Conseco Life, to “B++” from “B+”. A.M. Best also affi rmed the fi nancial strength rating of “B-” of Conseco Life. Th e outlook for all ratings is stable. A “stable” designation means that there is a low likelihood of a rating change due to stable fi nancial market trends. Th e “B++” rating is assigned to companies that have a good ability, in A.M. Best’s opinion, to meet their ongoing obligations to policyholders. A “B-” rating is assigned to companies that have a fair ability, in A.M. Best’s opinion, to meet their current obligations to policyholders, but are fi nancially vulnerable to adverse changes in underwriting and economic conditions. A.M. Best ratings for the industry currently range from “A++ (Superior)” to “F (In Liquidation)” and some companies are not rated. An “A++” rating indicates a superior ability to meet ongoing obligations to policyholders. A.M. Best has sixteen possible ratings. Th ere are four ratings above the “B++” rating of our primary insurance subsidiaries, other than Conseco Life, and eleven ratings that are below that rating. Th ere are seven ratings above the “B-” rating of Conseco Life and eight ratings that are below that rating.
On August 3, 2012, S&P affi rmed the fi nancial strength ratings of “BB+” of our primary insurance subsidiaries, except Conseco Life, and revised the outlook for such ratings to positive from stable. S&P also downgraded the fi nancial strength rating of Conseco Life to “B+” from “BB+” and the outlook for such rating is stable. On August 4, 2011, S&P upgraded the fi nancial strength ratings of our primary insurance subsidiaries to “BB+” from “BB”. A “positive” outlook means that a rating may be raised. A “stable” outlook means that a rating is not likely to change. S&P fi nancial strength ratings range from “AAA” to “R” and some companies are not rated. An insurer rated “BB” or lower is regarded as having vulnerable characteristics that may outweigh its strengths. A “BB” rating indicates the least degree of vulnerability within the range; a “CC” rating indicates the highest degree of vulnerability. Pluses and minuses show the relative standing within a category. In S&P’s view, an insurer rated “BB” has marginal fi nancial security characteristics and although positive attributes exist, adverse business conditions could lead to an insuffi cient ability to meet fi nancial commitments. In S&P’s view, an insurer rated “B” has weak fi nancial security characteristics and adverse business conditions will likely impair its ability to meet fi nancial commitments. S&P has twenty-one possible ratings. Th ere are ten ratings above the “BB+” rating of our primary insurance subsidiaries, other than Conseco Life, and ten ratings that are below that rating. Th ere are thirteen ratings above the “B+” rating of Conseco Life and seven ratings that are below that rating.
On August 29, 2012, Moody’s upgraded the fi nancial strength ratings of our primary insurance subsidiaries, except Conseco Life, to “Baa3” from “Ba1”. Moody’s also affi rmed the fi nancial strength rating of “Ba1” of Conseco Life. Th e outlook for all ratings is stable. A “stable” designation means that a rating is not likely to change. Moody’s fi nancial strength ratings range from “Aaa” to “C”. Th ese ratings may be supplemented with numbers “1”, “2”, or “3” to show relative standing within a category. In Moody’s view, an insurer rated “Baa” off ers adequate fi nancial security, however, certain protective elements may be lacking or may be characteristically unreliable over any great length of time. In Moody’s view, an insurer rated “Ba” off ers questionable fi nancial security and, often, the ability of these companies to meet policyholders’ obligations may be very moderate and thereby not well safeguarded in the future. Moody’s has twenty-one possible ratings. Th ere are nine ratings above the “Baa3” rating of our primary insurance subsidiaries, other than Conseco Life, and eleven ratings that are below the rating. Th ere are ten ratings above the “Ba1” rating of Conseco Life and ten ratings that are below that rating.
On September 5, 2012, Fitch affi rmed the fi nancial strength ratings of “BBB” of our primary insurance subsidiaries as well as the “BB+” rating of Conseco Life and the outlook for all of these ratings is stable. O n February 3, 2012, Fitch upgraded the fi nancial strength ratings of our primary insurance subsidiaries, except Conseco Life, to “BBB” (from “BBB-” or “BB+” depending on the company). Fitch also affi rmed the fi nancial strength rating of “BB+” of Conseco Life. A “BBB” rating, in Fitch’s opinion, indicates that there is currently a low expectation of ceased or interrupted payments. Th e capacity to meet policyholder and contract obligations on a timely basis is considered adequate, but adverse changes in circumstances and economic conditions are more likely to impact this capacity. A “BB” rating, in Fitch’s opinion, indicates that there is an elevated vulnerability to ceased or interrupted payments, particularly as the result of adverse economic or market changes over time. However, business or fi nancial alternatives may be available to allow for policyholder and contract obligations to be met in a timely manner. Fitch ratings for the industry range from “AAA Exceptionally Strong” to “C Distressed” and some companies are not rated. Pluses and minuses show the relative standing within a category. Fitch has nineteen possible ratings. Th ere are eight ratings above the “BBB” rating of our primary insurance subsidiaries, other than Conseco Life, and ten ratings that are below that rating. Th ere are ten ratings above the “BB+” rating of Conseco Life and eight ratings that are below that rating.
Rating agencies have increased the frequency and scope of their credit reviews and requested additional information from the companies that they rate, including us. Th ey may also adjust upward the capital and other requirements employed in the rating agency models for maintenance of certain ratings levels. We cannot predict what actions rating agencies may take, or what actions we may take in response. Accordingly, downgrades and outlook revisions related to us or the life insurance industry may occur in the future at any time and without notice by any rating agency. Th ese could increase policy surrenders and withdrawals, adversely aff ect relationships with our distribution channels, reduce new sales, reduce our ability to borrow and increase our future borrowing costs.

CNO FINANCIAL GROUP, INC. - Form 10-K 100
PART II ITEM 7 Management’s Discussion and Analysis of Consolidated Financial Condition and Results of Operations
Liquidity of the Holding Companies
Availability and Sources and Uses of Holding Company Liquidity; Limitations on Ability of Insurance Subsidiaries to Make Dividend and Surplus Debenture Interest Payments to the Holding Companies; Limitations on Holding Company Activities
At December 31, 2012, CNO, CDOC and our other non-insurance subsidiaries held: (i) unrestricted cash and cash equivalents of $167.3 million; (ii) fi xed income investments of $70.8 million; and (iii) equity securities and other invested assets totaling $55.5 million. CNO and CDOC are holding companies with no business operations of their own; they depend on their operating subsidiaries for cash to
make principal and interest payments on debt, and to pay administrative expenses and income taxes. CNO and CDOC receive cash from insurance subsidiaries, consisting of dividends and distributions, interest payments on surplus debentures and tax-sharing payments, as well as cash from non-insurance subsidiaries consisting of dividends, distributions, loans and advances. Th e principal non-insurance subsidiaries that provide cash to CNO and CDOC are 40|86 Advisors, which receives fees from the insurance subsidiaries for investment services, and CNO Services, LLC which receives fees from the insurance subsidiaries for providing administrative services. Th e agreements between our insurance subsidiaries and CNO Services, LLC and 40|86 Advisors, respectively, were previously approved by the domestic insurance regulator for each insurance company, and any payments thereunder do not require further regulatory approval.
Th e following table sets forth the aggregate amount of dividends (net of capital contributions) and other distributions that our insurance subsidiaries paid to us in each of the last three fi scal years (dollars in millions):
Years ended December 31,2012 2011 2010
Dividends from insurance subsidiaries, net of contributions $ 265.0 $ 209.0 $ 51.6Surplus debenture interest 58.9 59.1 48.7Fees for services provided pursuant to service agreements 99.4 78.6 79.5TOTAL DIVIDENDS AND OTHER DISTRIBUTIONS PAID BY INSURANCE SUBSIDIARIES $ 423.3 $ 346.7 $ 179.8
Th e following summarizes the current legal ownership structure of CNO’s primary subsidiaries:
Th e ability of our insurance subsidiaries to pay dividends is subject to state insurance department regulations and is based on the fi nancial statements of our insurance subsidiaries prepared in accordance with statutory accounting practices prescribed or permitted by regulatory authorities, which diff er from GAAP. Th ese regulations generally permit dividends to be paid from statutory earned surplus of the insurance company for any 12-month period in amounts equal to the greater of (or in a few states, the lesser of ): (i) statutory net gain from operations or net income for the prior year; or (ii) 10 percent of statutory capital and surplus as of the end of the preceding year. Th is type of dividend is referred to as an “ordinary dividend”. Any dividend in excess of these levels or from an insurance company that has negative earned surplus requires the approval of the director or commissioner of the applicable state insurance department and is referred to as an “extraordinary
dividend”. Each of the direct insurance subsidiaries of CDOC has signifi cant negative earned surplus and any dividend payments from the subsidiaries of CDOC would be considered extraordinary dividends and, therefore, require the approval of the director or commissioner of the applicable state insurance department. In 2012, our insurance subsidiaries paid extraordinary dividends to CDOC totaling $265.0 million. Based on our continued expectation to generate strong statutory earnings and excess capital, we expect to make total dividend payments to the holding company of $250 million to $300 million during 2013. We expect to receive regulatory approval for future dividends from our subsidiaries, but there can be no assurance that such payments will be approved or that the fi nancial condition of our insurance subsidiaries will not change, making future approvals less likely.

CNO FINANCIAL GROUP, INC. - Form 10-K 101
PART II ITEM 7 Management’s Discussion and Analysis of Consolidated Financial Condition and Results of Operations
We generally maintain capital and surplus levels in our insurance subsidiaries in an amount that is suffi cient to maintain a minimum consolidated RBC ratio of 350 percent and will typically seek to have our insurance subsidiaries pay ordinary dividends or request regulatory approval for extraordinary dividends when the consolidated RBC ratio exceeds such level and we have concluded the capital level in each of our insurance subsidiaries is adequate to support their business and projected growth. Th e consolidated RBC ratio of our insurance subsidiaries was 367 percent at December 31, 2012.
CDOC holds surplus debentures from Conseco Life of Texas with an aggregate principal amount of $749.6 million. Interest payments on those surplus debentures do not require additional approval provided the RBC ratio of Conseco Life of Texas exceeds 100 percent (but do require prior written notice to the Texas state insurance department). Th e RBC ratio of Conseco Life of Texas was 305 percent at December 31, 2012. CDOC also holds a surplus debenture from Colonial Penn with
an outstanding principal balance of $160.0 million. Interest payments on that surplus debenture require prior approval by the Pennsylvania state insurance department. Dividends and other payments from our non-insurance subsidiaries, including 40|86 Advisors and CNO Services, LLC, to CNO or CDOC do not require approval by any regulatory authority or other third party. However, insurance regulators may prohibit payments by our insurance subsidiaries to parent companies if they determine that such payments could be adverse to our policyholders or contractholders.
Th e insurance subsidiaries of CDOC receive funds to pay dividends primarily from: (i) the earnings of their direct businesses; (ii) tax sharing payments received from subsidiaries (if applicable); and (iii) with respect to Conseco Life of Texas, dividends received from subsidiaries. At December 31, 2012, the subsidiaries of Conseco Life of Texas had earned surplus (defi cit) as summarized below (dollars in millions):
Subsidiary of CDOCEarned surplus
(defi cit)Additional
informationSubsidiaries of Conseco Life of Texas:
Bankers Life $ 293.3 (a) Colonial Penn (243.7) (b)
(a) Bankers Life paid ordinary dividends of $95.0 million to Conseco Life of Texas in 2012.(b) The deficit is primarily due to transactions which occurred several years ago, including a tax planning transaction and the fee paid to recapture a block of business previously
ceded to an unaffiliated insurer.
A signifi cant deterioration in the fi nancial condition, earnings or cash fl ow of the material subsidiaries of CNO or CDOC for any r eason could hinder such subsidiaries’ ability to pay cash dividends or other disbursements to CNO and/or CDOC, which, in turn, could limit CNO’s ability to meet debt service requirements and satisfy other fi nancial obligations. In addition, we may choose to retain capital in our insurance subsidiaries or to contribute additional capital to our insurance subsidiaries to strengthen their surplus, and these decisions could limit the amount available at our top tier insurance subsidiaries to pay dividends to the holding companies. In the past, we have
made capital contributions to our insurance subsidiaries to meet debt covenants and minimum capital levels required by certain regulators and it is possible we will be required to do so in the future. We paid a capital contribution to our insurance subsidiaries of $26.0 million in 2012, which had been accrued at December 31, 2011.
In the third quarter of 2012, as further discussed in the note to the consolidated fi nancial statements entitled “Notes Payable - Direct Corporate Obligations”, we completed a comprehensive recapitalization plan.
Th e following table sets forth the sources and uses of cash from the recapitalization transactions (dollars in millions):
Sources:New Senior Secured Credit Agreement $ 669.5Issuance of 6.375% Notes 275.0
TOTAL SOURCES $ 944.5Uses:
Cash on hand for general corporate purposes $ 13.7Repurchase of $200 million principal amount of 7.0% Debentures pursuant to Debenture Repurchase Agreement 355.1Repayment of Previous Senior Secured Credit Agreement 223.8Repayment of $275.0 million principal amount of 9.0% Notes, including redemption premium 322.7Debt issuance costs 23.1Accrued interest 6.1
TOTAL USES $ 944.5

CNO FINANCIAL GROUP, INC. - Form 10-K 102
PART II ITEM 7 Management’s Discussion and Analysis of Consolidated Financial Condition and Results of Operations
Th e scheduled principal and interest payments on our direct corporate obligations are as follows (dollars in millions):
Principal Interest (a) 2013 $ 51.1 $ 59.12014 60.5 52.22015 79.2 49.22016 153.5 45.52017 4.2 37.52018 389.1 32.42019 — 17.52020 275.0 13.2
$ 1,012.6 $ 306.6(a) Based on interest rates as of December 31, 2012.
On February 11, 2013, we commenced a tender off er to purchase for cash any and all of our outstanding 7.0% Debentures. Th e tender off er (the “Off er”) is being made pursuant to the terms set forth in our Off er to Purchase, dated February 11, 2013 (the “Off er to Purchase”), and the related Letter of Transmittal. Th e Off er will expire on March 27, 2013 (the “Expiration Date”), unless it is extended or earlier terminated by us.
Th e Off er is being conducted as part of our previously announced securities repurchase program. As of February 8, 2013, we had repurchase capacity of approximately $350.0 million under our securities repurchase program. As of February 8, 2013, there was $93.0 million aggregate principal amount of 7.0% Debentures outstanding.
Pursuant to the terms of the Off er, holders of the 7.0% Debentures who tender and do not withdraw their 7.0% Debentures prior to the Expiration Date, will receive, for each $1,000 principal amount of such 7.0% Debentures, a cash purchase price (the “Purchase Price”) equal to the sum of: (i) the average volume weighted average price of our common stock (as defi ned in the Off er to Purchase) multiplied by 183.5145; plus (ii) a fi xed cash amount of $61.25, provided that in no event will the Purchase Price be less than $1,454.13 per $1,000 principal amount of such 7.0% Debentures. Th e Purchase Price will not be adjusted at any time during the Off er for any dividends declared and/or paid on our common stock during the Off er. In addition to the Purchase Price, holders will receive accrued and unpaid interest on any 7.0% Debentures that are tendered to, but excluding, the settlement date of the Off er.
In May 2011, the Company announced a common share repurchase program of up to $100.0 million. In February 2012, June 2012 and December 2012, the Company’s Board of Directors approved, in aggregate, an additional $500.0 million to repurchase the Company’s outstanding securities. During 2012, we repurchased 21.5 million shares of common stock for $180.2 million pursuant to the program. Th e Company had remaining repurchase authority of $350.0 million as of December 31, 2012. We currently anticipate repurchasing a total of approximately $250 million to $300 million of securities (including common stock, warrants and convertible debentures) during 2013. Th e amount and timing of the securities repurchases (if any) will be based on business and market conditions and other factors.
In May 2012, we initiated a common stock dividend program. In the second, third and fourth quarters of 2012, dividends declared and paid on common stock were $0.02 per common share totaling $13.9 million.
Also, in 2012, as required under the terms of the New Senior Secured Credit Agreement and the Previous Senior Secured Credit Agreement, we made mandatory prepayments of $28.4 million and $31.4 million,
respectively, due to repurchases of our common stock and payment of common stock dividends. We also made an additional payment of $2.0 million to cover the remaining portion of the scheduled term loan installment under our New Senior Secured Credit Agreement.
In March 2012, we paid in full the remaining $50.0 million principal balance on the Senior Health Note, which had been scheduled to mature in November 2013. Th e repayment in full of the Senior Health Note removed the previous restriction on our ability to pay cash dividends on our common stock.
Th e New Senior Secured Credit Agreement requires the Company to maintain (each as calculated in accordance with the New Senior Secured Credit Agreement): (i) a debt to total capitalization ratio of not more than 27.5 percent (such ratio was 20.9 percent at December 31, 2012); (ii) an interest coverage ratio of not less than 2.50 to 1.00 for each rolling four quarters (or, if less, the number of full fi scal quarters commencing after the eff ective date of the New Senior Secured Credit Agreement) (such ratio was 8.08 to 1.00 for the period ended December 31, 2012); (iii) an aggregate ratio of total adjusted capital to company action level risk-based capital for the Company’s insurance subsidiaries of not less than 250 percent (such ratio was 367 percent at December 31, 2012); and (iv) a combined statutory capital and surplus for the Company’s insurance subsidiaries of at least $1,300.0 million (combined statutory capital and surplus at December 31, 2012, was $1,782.6 million).
Mandatory prepayments of the New Senior Secured Credit Agreement will be required, subject to certain exceptions, in an amount equal to: (i) 100% of the net cash proceeds from certain asset sales or casualty events; (ii) 100% of the net cash proceeds received by the Company or any of its restricted subsidiaries from certain debt issuances; and (iii) 100% of the amount of certain restricted payments made (including any common stock dividends and share repurchases) as defi ned in the New Senior Secured Credit Agreement provided that if, as of the end of the fi scal quarter immediately preceding such restricted payment, the debt to total capitalization ratio is: (x) equal to or less than 22.5%, but greater than 17.5%, the prepayment requirement shall be reduced to 33.33%; or (y) equal to or less than 17.5%, the prepayment requirement shall not apply.
Notwithstanding the foregoing, no mandatory prepayments pursuant to item (i) in the preceding paragraph shall be required if: (x) the debt to total capitalization ratio is equal or less than 20% and (y) either (A) the fi nancial strength rating of certain of the Company’s insurance subsidiaries is equal or better than A- (stable) from A.M. Best or (B) the New Senior Secured Credit Agreement is rated equal or better than BBB- (stable) from S&P and Baa3 (stable) by Moody’s.

CNO FINANCIAL GROUP, INC. - Form 10-K 103
PART II ITEM 7 Management’s Discussion and Analysis of Consolidated Financial Condition and Results of Operations
Th e 6.375% Indenture contains covenants that, among other things, limit (subject to certain exceptions) the Company’s ability and the ability of the Company’s Restricted Subsidiaries (as defi ned in the 6.375% Indenture) to take certain actions and make certain payments. Under the 6.375% Indenture, the Company can make Restricted Payments (as such term is defi ned in the 6.375% Indenture) up to a calculated limit, provided that the Company’s pro forma risk-based capital ratio exceeds 225% after giving eff ect to the Restricted Payment and certain other conditions are met. Restricted Payments include, among other items, repurchases of common stock and cash dividends on common stock (to the extent such dividends exceed $30 million in the aggregate in any calendar year). Restricted payments do not include cash paid to purchase our outstanding 7% Debentures pursuant to the Off er we announced on February 11, 2013.
Th e limit of Restricted Payments permitted under the 6.375% Indenture is the sum of (x) 50% of the Company’s “Net Excess Cash Flow” (as defi ned in the 6.375% Indenture) for the period (taken as one accounting period) from July 1, 2012 to the end of the Company’s most recently ended fi scal quarter for which fi nancial statements are available at the time of such Restricted Payment, (y) $175 million and (z) certain other amounts specifi ed in the 6.375% Indenture. Based on the provisions set forth in the 6.375% Indenture and the Company’s Net Excess Cash Flow for the period from July 1, 2012 through December 31, 2012, the Company could have made additional Restricted Payments under this 6.375% Indenture covenant of approximately $212 million as of December 31, 2012. Th is limitation on Restricted Payments does not apply if the Debt to Total Capitalization Ratio (as defi ned in the 6.375% Indenture) as of the last day of the Company’s most recently ended fi scal quarter for which fi nancial statements are available that
immediately precedes the date of any Restricted Payment, calculated immediately after giving eff ect to such Restricted Payment and any related transactions on a pro forma basis, is equal to or less than 17.5%.
As part of our investment strategy for the holding company, we may enter into investment borrowing arrangements, including repurchase agreements, to increase our investment return. With respect to repurchase agreements, we account for these transactions as collateralized borrowings, where the amount borrowed is equal to the sales price of the underlying securities. Repurchase agreements involve a sale of securities and an agreement to repurchase the same securities at a later date at an agreed-upon price. We had no such borrowings outstanding at December 31, 2012. Th e primary risks associated with short-term collateralized borrowings are: (i) a substantial decline in the market value of the margined security; and (ii) that a counterparty will be unable to perform under the terms of the contract or be unwilling to extend such related fi nancing in future periods especially if the liquidity or value of the margined security has declined. Exposure is limited to any depreciation in value of the related securities.
Outlook
We believe that the existing cash available to the holding company, the cash fl ows to be generated from operations and other transactions will be suffi cient to allow us to meet our debt service obligations, pay corporate expenses and satisfy other fi nancial obligations. However, our cash fl ow is aff ected by a variety of factors, many of which are outside of our control, including insurance regulatory issues, competition, fi nancial markets and other general business conditions. We cannot provide assurance that we will possess suffi cient income and liquidity to meet all of our debt service requirements and other holding company obligations. For additional discussion regarding the liquidity and other risks that we face, see “Risk Factors”.
Market-Sensitive Instruments and Risk Management
Our spread-based insurance business is subject to several inherent risks arising from movements in interest rates, especially if we fail to anticipate or respond to such movements. First, interest rate changes can cause compression of our net spread between interest earned on investments and interest credited on customer deposits, thereby adversely aff ecting our results. Second, if interest rate changes produce an unanticipated increase in surrenders of our spread-based products, we may be forced to sell investment assets at a loss in order to fund such surrenders. Many of our products include surrender charges, market interest rate adjustments or other features to encourage persistency; however at December 31, 2012, approximately 26 percent of our total insurance liabilities, or approximately $6.5 billion, could be surrendered by the policyholder without penalty. Finally, changes in interest rates can have signifi cant eff ects on the performance of our structured securities portfolio as a result of changes in the prepayment rate of the collateral underlying such securities. We use asset/liability strategies that are designed to mitigate the eff ect of interest rate changes on our profi tability. However, there can be no assurance that management will be successful in implementing such strategies and achieving adequate investment spreads.
We seek to invest our available funds in a manner that will fund future obligations to policyholders, subject to appropriate risk considerations. We seek to meet this objective through investments that: (i) have
similar cash fl ow characteristics with the liabilities they support; (ii) are diversifi ed among industries, issuers and geographic locations; and (iii) are predominantly investment-grade fi xed maturity securities.
Our investment strategy is to maximize, over a sustained period and within acceptable parameters of risk, investment income and total investment return through active investment management. Accordingly, our entire portfolio of fi xed maturity securities is available to be sold in response to: (i) changes in market interest rates; (ii) changes in relative values of individual securities and asset sectors; (iii) changes in prepayment risks; (iv) changes in credit quality outlook for certain securities; (v) liquidity needs; and (vi) other factors. From time to time, we invest in securities for trading purposes, although such investments are a relatively small portion of our total portfolio.
Th e profi tability of many of our products depends on the spread between the interest earned on investments and the rates credited on our insurance liabilities. In addition, changes in competition and other factors, including the level of surrenders and withdrawals, may limit our ability to adjust or to maintain crediting rates at levels necessary to avoid narrowing of spreads under certain market conditions. As of December 31, 2012, approximately 37 percent of our insurance liabilities had interest rates that may be reset annually; 44 percent

CNO FINANCIAL GROUP, INC. - Form 10-K 104
PART II ITEM 7A Quantitative and Qualitative Disclosures About Market Risk
had a fi xed explicit interest rate for the duration of the contract; 16 percent had credited rates which approximate the income earned by the Company; and the remainder had no explicit interest rates. At December 31, 2012, the average yield, computed on the cost basis of our fi xed maturity portfolio, was 5.7 percent, and the average interest rate credited or accruing to our total insurance liabilities (excluding interest rate bonuses for the fi rst policy year only and excluding the eff ect of credited rates attributable to variable or fi xed index products) was 4.5 percent.
We simulate the cash fl ows expected from our existing insurance business under various interest rate scenarios. Th ese simulations help us to measure the potential gain or loss in fair value of our interest rate-sensitive investments and to manage the relationship between the interest sensitivity of our assets and liabilities. When the estimated durations of assets and liabilities are similar, a change in the value of assets should be largely off set by a change in the value of liabilities. At December 31, 2012, the adjusted modifi ed duration of our fi xed income securities (as modifi ed to refl ect payments and potential calls) was approximately 8.7 years and the duration of our insurance liabilities was approximately 8.6 years. We estimate that our fi xed maturity securities and short-term investments (net of corresponding changes in insurance acquisition costs) would decline in fair value by approximately $230 million if interest rates were to increase by 10 percent from their levels at December 31, 2012. Th is compares to a decline in fair value of $225 million based on amounts and rates at December 31, 2011. Our simulations incorporate numerous assumptions, require signifi cant estimates and assume an immediate change in interest rates without any management of the investment portfolio in reaction to such change. Consequently, potential changes in value of our fi nancial instruments indicated by the simulations will likely be diff erent from the actual changes experienced under given interest rate scenarios, and the diff erences may be material. Because we actively manage our investments and liabilities, our net exposure to interest rates can vary over time.
We are subject to the risk that our investments will decline in value. Th is has occurred in the past and may occur again, particularly if interest rates rise from their current low levels. During 2012, we recognized net realized investment gains of $81.1 million, which were comprised of $98.8 million of net gains from the sales of investments (primarily fi xed
maturities); the increase in fair value of certain fi xed maturity investments with embedded derivatives of $20.1 million; and $37.8 million of writedowns of investments for other than temporary declines in fair value recognized through net income. During 2011, we recognized net realized investment gains of $61.8 million, which were comprised of $96.4 million of net gains from the sales of investments (primarily fi xed maturities) and $34.6 million of writedowns of investments for other than temporary declines in fair value recognized through net income ($39.9 million, prior to the $5.3 million of impairment losses recognized through accumulated other comprehensive income). During 2010, we recognized net realized investment gains of $30.2 million, which were comprised of $180.0 million of net gains from the sales of investments (primarily fi xed maturities) and $149.8 million of writedowns of investments for other than temporary declines in fair value recognized through net income ($146.8 million, prior to the $(3.0) million of impairment losses recognized through accumulated other comprehensive income (loss)).
Th e Company is subject to risk resulting from fl uctuations in market prices of our equity securities. In general, these investments have more year-to-year price variability than our fi xed maturity investments. However, returns over longer time frames have been consistently higher. We manage this risk by limiting our equity securities to a relatively small portion of our total investments.
Our investment in options backing our equity-linked products is closely matched with our obligation to fi xed index annuity holders. Fair value changes associated with that investment are substantially off set by an increase or decrease in the amounts added to policyholder account balances for fi xed index products.
Infl ation
Infl ation rates may impact the fi nancial statements and operating results in several areas. Infl ation infl uences interest rates, which in turn impact the fair value of the investment portfolio and yields on new investments. Infl ation also impacts a portion of our insurance policy benefi ts aff ected by increased medical coverage costs. Operating expenses, including payrolls, are impacted to a certain degree by the infl ation rate.
ITEM 7A Quantitative and Qualitative Disclosures About Market Risk
Th e information included under the caption “Market-Sensitive Instruments and Risk Management” in Item 7. “Management’s Discussion and Analysis of Consolidated Financial Condition and Results of Operations” is incorporated herein by reference.

CNO FINANCIAL GROUP, INC. - Form 10-K 105
PART II ITEM 8 Consolidated Financial Statements
ITEM 8 Consolidated F inancial S tatements
Index to Consolidated Financial Statements
Report of Independent Registered Public Accounting Firm ...............................................................................................................................................................................................................105Consolidated Balance Sheet at December 31, 2012 and 2011 ........................................................................................................................................................................................................106Consolidated Statement of Operations for the years ended December 31, 2012, 2011 and 2010 ..............................................................................................108Consolidated Statement of Comprehensive Income for the years ended December 31, 2012, 2011 and 2010 .......................................................109Consolidated Statement of Shareholders’ Equity for the years ended December 31, 2012, 2011 and 2010.................................................................110Consolidated Statement of Cash Flows for the years ended December 31, 2012, 2011 and 2010 .............................................................................................111Notes to Consolidated Financial Statements .............................................................................................................................................................................................................................................................112
Report of Independent Registered Public Accounting Firm
To the Shareholders and Board of Directors of CNO Financial Group, Inc.:
In our opinion, the consolidated balance sheets and the r elated consolidated statements of operations, comprehensive income, shareholders’ equity and cash fl ows present fairly, in all material respects, the fi nancial position of CNO Financial Group, Inc. and its subsidiaries at December 31, 2012 and 2011, and the results of their operations and their cash fl ows for each of the three years in the period ended December 31, 2012 in conformity with accounting principles generally accepted in the United States of America. Also in our opinion, the Company maintained, in all material respects, eff ective internal control over fi nancial reporting as of December 31, 2012, based on criteria established in Internal Control - Integrated Framework issued by the Committee of Sponsoring Organizations of the Treadway Commission (COSO). Th e Company’s management is responsible for these fi nancial statements, for maintaining eff ective internal control over fi nancial reporting, and for its assessment of the eff ectiveness of internal control over fi nancial reporting, included in Management’s Report on Internal Control Over Financial Reporting appearing under Item 9A. Our responsibility is to express opinions on these fi nancial statements and on the Company’s internal control over fi nancial reporting based on our integrated audits. We conducted our audits in accordance with the standards of the Public Company Accounting Oversight Board (United States). Th ose standards require that we plan and perform the audits to obtain reasonable assurance about whether the fi nancial statements are free of material misstatement and whether eff ective internal control over fi nancial reporting was maintained in all material respects. Our audits of the fi nancial statements included examining, on a test basis, evidence supporting the amounts and disclosures in the fi nancial statements, assessing the accounting principles used and signifi cant estimates made by management, and evaluating the overall fi nancial statement presentation. Our audit of internal control over fi nancial reporting included obtaining an understanding of internal control over fi nancial reporting, assessing the risk that a material weakness exists, and testing and evaluating the design and operating
eff ectiveness of internal control based on the assessed risk. Our audits also included performing such other procedures as we considered necessary in the circumstances. We believe that our audits provide a reasonable basis for our opinions.
As discussed in Note 2 to the consolidated fi nancial statements, the Company changed the manner in which it accounts for costs associated with acquiring or renewing insurance contracts eff ective January 1, 2012.
A company’s internal control over fi nancial reporting is a process designed to provide reasonable assurance regarding the reliability of fi nancial reporting and the preparation of fi nancial statements for external purposes in accordance with generally accepted accounting principles. A company’s internal control over fi nancial reporting includes those policies and procedures that (i) pertain to the maintenance of records that, in reasonable detail, accurately and fairly refl ect the transactions and dispositions of the assets of the company; (ii) provide reasonable assurance that transactions are recorded as necessary to permit preparation of fi nancial statements in accordance with generally accepted accounting principles, and that receipts and expenditures of the company are being made only in accordance with authorizations of management and directors of the company; and (iii) provide reasonable assurance regarding prevention or timely detection of unauthorized acquisition, use, or disposition of the company’s assets that could have a material eff ect on the fi nancial statements.
Because of its inherent limitations, internal control over fi nancial reporting may not prevent or detect misstatements. Also, projections of any evaluation of eff ectiveness to future periods are subject to the risk that controls may become inadequate because of changes in conditions, or that the degree of compliance with the policies or procedures may deteriorate.
/s/PricewaterhouseCoopers LLP
Indianapolis, Indiana
February 19, 2013

CNO FINANCIAL GROUP, INC. - Form 10-K 106
PART II ITEM 8 Consolidated Financial Statements
Consolidated Balance Sheet
December 31, 2012 and 2011
(Dollars in millions) 2012 2011ASSETSInvestments:
Fixed maturities, available for sale, at fair value (amortized cost: 2012 - $21,626.8; 2011 - $21,779.1) $ 24,614.1 $ 23,516.0Equity securities at fair value (cost: 2012 - $167.1; 2011 - $177.0) 171.4 175.1Mortgage loans 1,573.2 1,602.8Policy loans 272.0 279.7Trading securities 266.2 91.6Investments held by variable interest entities 814.3 496.3Other invested assets 248.1 202.8
Total investments 27,959.3 26,364.3Cash and cash equivalents - unrestricted 582.5 436.0Cash and cash equivalents held by variable interest entities 54.2 74.4Accrued investment income 286.2 288.7Present value of future profi ts 626.0 697.7Deferred acquisition costs 629.7 797.1Reinsurance receivables 2,927.7 3,091.1Income tax assets, net 716.9 865.4Assets held in separate accounts 14.9 15.0Other assets 334.0 292.2TOTAL ASSETS $ 34,131.4 $ 32,921.9
(CONTINUED ON NEXT PAGE)Th e accompanying notes are an integral part of the consolidated fi nancial statements.

CNO FINANCIAL GROUP, INC. - Form 10-K 107
PART II ITEM 8 Consolidated Financial Statements
Consolidated Balance Sheet, continued
December 31, 2012 and 2011
(Dollars in millions) 2012 2011LIABILITIES AND SHAREHOLDERS’ EQUITY Liabilities:
Liabilities for insurance products: Interest-sensitive products $ 12,893.2 $ 13,165.5 Traditional products 11,196.3 10,482.7 Claims payable and other policyholder funds 985.1 1,034.3 Liabilities related to separate accounts 14.9 15.0
Other liabilities 570.6 556.3 Investment borrowings 1,650.8 1,676.5 Borrowings related to variable interest entities 767.0 519.9 Notes payable – direct corporate obligations 1,004.2 857.9
Total liabilities 29,082.1 28,308.1 Commitments and Contingencies (Note 7) Shareholders’ equity:
Common stock ($0.01 par value, 8,000,000,000 shares authorized, shares issued and outstanding: 2012 – 221,502,371; 2011 – 241,304,503) 2.2 2.4 Additional paid-in capital 4,174.7 4,361.9 Accumulated other comprehensive income 1,197.4 781.6 Accumulated defi cit (325.0) (532.1)
Total shareholders’ equity 5,049.3 4,613.8 TOTAL LIABILITIES AND SHAREHOLDERS’ EQUITY $ 34,131.4 $ 32,921.9
Th e accompanying notes are an integral part of the consolidated fi nancial statements.
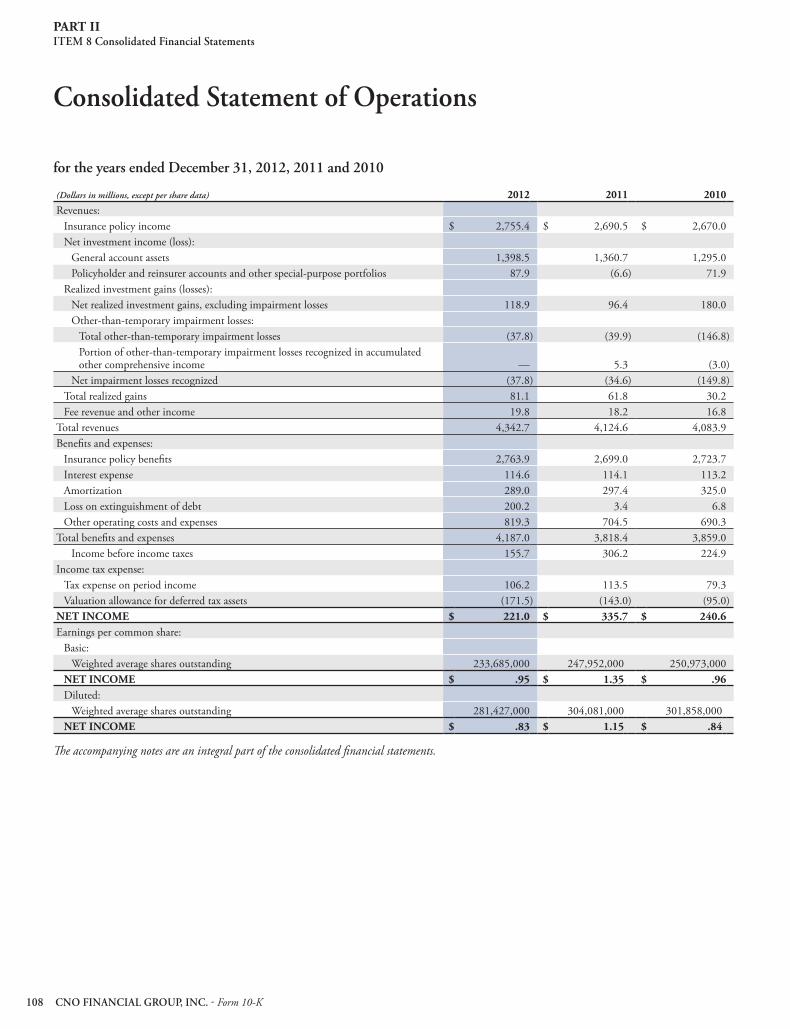
CNO FINANCIAL GROUP, INC. - Form 10-K 108
PART II ITEM 8 Consolidated Financial Statements
Consolidated Statement of Operations
for the years ended December 31, 2012, 2011 and 2010
(Dollars in millions, except per share data) 2012 2011 2010Revenues:
Insurance policy income $ 2,755.4 $ 2,690.5 $ 2,670.0 Net investment income (loss):
General account assets 1,398.5 1,360.7 1,295.0 Policyholder and reinsurer accounts and other special-purpose portfolios 87.9 (6.6) 71.9
Realized investment gains (losses): Net realized investment gains, excluding impairment losses 118.9 96.4 180.0 Other-than-temporary impairment losses:
Total other-than-temporary impairment losses (37.8) (39.9) (146.8)Portion of other-than-temporary impairment losses recognized in accumulated other comprehensive income — 5.3 (3.0)
Net impairment losses recognized (37.8) (34.6) (149.8)Total realized gains 81.1 61.8 30.2 Fee revenue and other income 19.8 18.2 16.8
Total revenues 4,342.7 4,124.6 4,083.9 Benefi ts and expenses:
Insurance policy benefi ts 2,763.9 2,699.0 2,723.7 Interest expense 114.6 114.1 113.2 Amortization 289.0 297.4 325.0 Loss on extinguishment of debt 200.2 3.4 6.8 Other operating costs and expenses 819.3 704.5 690.3
Total benefi ts and expenses 4,187.0 3,818.4 3,859.0 Income before income taxes 155.7 306.2 224.9
Income tax expense: Tax expense on period income 106.2 113.5 79.3 Valuation allowance for deferred tax assets (171.5) (143.0) (95.0)
NET INCOME $ 221.0 $ 335.7 $ 240.6 Earnings per common share:
Basic: Weighted average shares outstanding 233,685,000 247,952,000 250,973,000
NET INCOME $ .95 $ 1.35 $ .96 Diluted:
Weighted average shares outstanding 281,427,000 304,081,000 301,858,000 NET INCOME $ .83 $ 1.15 $ .84
Th e accompanying notes are an integral part of the consolidated fi nancial statements.

CNO FINANCIAL GROUP, INC. - Form 10-K 109
PART II ITEM 8 Consolidated Financial Statements
Consolidated Statement of Comprehensive Income
for the years ended December 31, 2012, 2011 and 2010
(Dollars in millions) 2012 2011 2010Net income $ 221.0 $ 335.7 $ 240.6 Other comprehensive income, before tax:
Unrealized gains for the period 1,336.2 1,357.7 1,052.2 Amortization of present value of future profi ts and deferred acquisition costs (107.1) (167.1) (136.1)Amount related to premium defi ciencies assuming the net unrealized gains had been realized (531.0) (271.0) — Reclassifi cation adjustments:
For net realized investment gains included in net income (68.7) (101.0) (97.2)For amortization of the present value of future profi ts and deferred acquisition costs related to net realized investment gains included in net income 6.5 5.4 9.3 Cumulative eff ect of accounting change — — (9.5)
Unrealized gains on investments 635.9 824.0 818.7 Change related to deferred compensation plan .4 (.6) .5
Other comprehensive income before tax 636.3 823.4 819.2 Income tax expense related to items of accumulated other comprehensive income (220.5) (294.5) (292.5)
Other comprehensive income, net of tax 415.8 528.9 526.7 COMPREHENSIVE INCOME $ 636.8 $ 864.6 $ 767.3
Th e accompanying notes are an integral part of the consolidated fi nancial statements.

CNO FINANCIAL GROUP, INC. - Form 10-K 110
PART II ITEM 8 Consolidated Financial Statements
Consolidated Statement of Shareholders’ Equity
(Dollars in millions)
Common stock and additional paid-in capital
Accumulated other comprehensive
income (loss)Accumulated
defi cit TotalBalance, December 31, 2009 $ 4,411.3 $ (274.0) $ (1,098.7) $ 3,038.6
Net income — — 240.6 240.6 Change in unrealized appreciation (depreciation) of investments (net of applicable income tax expense of $256.3) — 462.2 — 462.2 Change in noncredit component of impairment losses on fi xed maturities, available for sale (net of applicable income tax expense of $39.5) — 70.7 — 70.7 Cumulative eff ect of accounting change — (6.2) (9.7) (15.9)Benefi cial conversion feature related to the issuance of convertible debentures 4.0 — — 4.0 Stock options, restricted stock and performance units 11.4 — — 11.4
Balance, December 31, 2010 4,426.7 252.7 (867.8) 3,811.6 Net income — — 335.7 335.7 Change in unrealized appreciation (depreciation) of investments (net of applicable income tax expense of $294.4) — 528.7 — 528.7 Change in noncredit component of impairment losses on fi xed maturities, available for sale (net of applicable income tax expense of $.1) — .2 — .2 Cost of shares acquired (69.8) — — (69.8)Stock options, restricted stock and performance units 7.4 — — 7.4
Balance, December 31, 2011 4,364.3 781.6 (532.1) 4,613.8 Net income — — 221.0 221.0 Change in unrealized appreciation (depreciation) of investments (net of applicable income tax expense of $216.1) — 407.8 — 407.8 Change in noncredit component of impairment losses on fi xed maturities, available for sale (net of applicable income tax expense of $4.4) — 8.0 — 8.0 Extinguishment of benefi cial conversion feature related to the repurchase of convertible d ebentures (24.0) — — (24.0)Cost of shares acquired (180.2) — — (180.2)Dividends on common stock — — (13.9) (13.9)Stock options, restricted stock and performance units 16.8 — — 16.8
BALANCE, DECEMBER 31, 2012 $ 4,176.9 $ 1,197.4 $ (325.0) $ 5,049.3
Th e accompanying notes are an integral part of the consolidated fi nancial statements.

CNO FINANCIAL GROUP, INC. - Form 10-K 111
PART II ITEM 8 Consolidated Financial Statements
Consolidated Statement of Cash Flows
for the years ended December 31, 2012, 2011 and 2010
(Dollars in millions) 2012 2011 2010Cash fl ows from operating activities:
Insurance policy income $ 2,419.7 $ 2,382.8 $ 2,359.3 Net investment income 1,385.8 1,418.6 1,304.9 Fee revenue and other income 19.8 18.2 16.8 Insurance policy benefi ts (2,096.5) (2,044.9) (1,975.4)Interest expense (109.0) (95.5) (108.2)Deferrable policy acquisition costs (191.7) (216.7) (225.2)Other operating costs (786.7) (684.3) (637.8)Taxes (6.5) (3.4) (.4)
NET CASH PROVIDED BY OPERATING ACTIVITIES 634.9 774.8 734.0 Cash fl ows from investing activities:
Sales of investments 2,057.6 5,504.5 8,632.6 Maturities and redemptions of investments 1,967.4 1,093.5 894.0 Purchases of investments (4,271.1) (8,156.1) (10,739.2)Net sales (purchases) of trading securities 60.4 300.2 (51.7)Change in cash and cash equivalents held by variable interest entities 20.2 (47.6) (19.6)Other (31.6) (32.5) (14.7)
NET CASH USED BY INVESTING ACTIVITIES (197.1) (1,338.0) (1,298.6)Cash fl ows from fi nancing activities:
Issuance of notes payable, net 944.5 — 756.1 Payments on notes payable (810.6) (144.8) (793.6)Expenses related to extinguishment of debt (183.0) — — Amount paid to extinguish the benefi cial conversion feature associated with repurchase of convertible debentures (24.0) — — Issuance of common stock 3.1 2.2 — Payments to repurchase common stock (180.2) (69.8) — Common stock dividends paid (13.9) — — Amounts received for deposit products 1,296.7 1,693.5 1,730.1 Withdrawals from deposit products (1,544.9) (1,664.3) (1,704.4)Issuance of investment borrowings:
Federal Home Loan Bank 375.0 717.0 787.0 Related to variable interest entities 246.7 236.4 —
Payments on investment borrowings: Federal Home Loan Bank (375.0) (267.0) (37.0)Related to variable interest entities and other (.9) (100.7) (125.1)
Investment borrowings - repurchase agreements, net (24.8) 24.8 — NET CASH PROVIDED (USED) BY FINANCING ACTIVITIES (291.3) 427.3 613.1Net increase (decrease) in cash and cash equivalents 146.5 (135.9) 48.5 Cash and cash equivalents, beginning of year 436.0 571.9 523.4 CASH AND CASH EQUIVALENTS, END OF YEAR $ 582.5 $ 436.0 $ 571.9
Th e accompanying notes are an integral part of the consolidated fi nancial statements.

CNO FINANCIAL GROUP, INC. - Form 10-K 112
PART II ITEM 8 Consolidated Financial Statements
Notes to Consolidated Financial Statements
NOTE 1 BUSINESS AND BASIS OF PRESENTATION
CNO Financial Group, Inc., a Delaware corporation (“CNO”), is a holding company for a group of insurance companies operating throughout the United States that develop, market and administer health insurance, annuity, individual life insurance and other insurance products. CNO became the successor to Conseco, Inc., an Indiana corporation (our “Predecessor”), in connection with our bankruptcy reorganization which became eff ective on September 10, 2003 (the “Eff ective Date”). Th e terms “CNO Financial Group, Inc.”, “CNO”, the “Company”, “we”, “us”, and “our” as used in these fi nancial statements refer to CNO and its subsidiaries or, when the context requires otherwise, our Predecessor and its subsidiaries. Such terms, when used to describe insurance business and products, refer to the insurance business and products of CNO’s insurance subsidiaries.
We focus on serving the senior and middle-income markets, which we believe are attractive, underserved, high growth markets. We sell our products through three distribution channels: career agents, independent producers (some of whom sell one or more of our product lines exclusively) and direct marketing.
Th e Company manages its business through the following operating segments: Bankers Life, Washington National and Colonial Penn, which are defi ned on the basis of product distribution; Other CNO Business, comprised primarily of products we no longer sell actively; and corporate operations, comprised of holding company activities and certain noninsurance company businesses. Th e Company’s segments are described below:
• Bankers Life, which markets and distributes Medicare supplement insurance, interest-sensitive life insurance, traditional life insurance, fi xed annuities and long-term care insurance products to the middle-income senior market through a dedicated fi eld force of career agents and sales managers supported by a network of community-based sales offi ces. Th e Bankers Life segment includes primarily the business of Bankers Life and Casualty Company (“Bankers Life”). Bankers Life also markets and distributes Medicare Advantage plans primarily through distribution arrangements with Humana, Inc. and United HealthCare and Medicare Part D prescription drug plans (“PDP”) through a distribution and reinsurance arrangement with Coventry Health Care (“Coventry”).
• Washington National, which markets and distributes supplemental health (including specifi ed disease, accident and hospital indemnity insurance products) and life insurance to middle-income consumers at home and at the worksite. Th ese products are marketed through Performance Matters Associates of Texas, Inc., a wholly owned subsidiary, and through independent marketing organizations and insurance agencies, including worksite marketing. Th e products being marketed are underwritten by Washington National Insurance Company (“Washington National”). • Colonial Penn, which markets primarily graded benefi t and simplifi ed issue life insurance directly to customers in the senior middle-income market through television advertising, direct mail, the internet and telemarketing. Th e Colonial Penn segment includes primarily the business of Colonial Penn Life Insurance Company (“Colonial Penn”). • Other CNO Business, which consists of blocks of interest-sensitive life insurance, traditional life insurance, annuities, long-term care insurance and other supplemental health products. Th ese blocks of business are not actively marketed and were primarily issued or acquired by Conseco Life Insurance Company (“Conseco Life”) and Washington National.
We prepare our fi nancial statements in accordance with accounting principles generally accepted in the United States of America (“GAAP”).
Th e accompanying fi nancial statements include the accounts of the Company and its subsidiaries. Our consolidated fi nancial statements exclude the results of material transactions between us and our consolidated affi liates, or among our consolidated affi liates.
When we prepare fi nancial statements in conformity with GAAP, we are required to make estimates and assumptions that signifi cantly aff ect reported amounts of various assets and liabilities and the disclosure of contingent assets and liabilities at the date of the fi nancial statements and revenues and expenses during the reporting periods. For example, we use signifi cant estimates and assumptions to calculate values for deferred acquisition costs, the present value of future profi ts, fair value measurements of certain investments (including derivatives), other-than-temporary impairments of investments, assets and liabilities related to income taxes, liabilities for insurance products, liabilities related to litigation and guaranty fund assessment accruals. If our future experience diff ers from these estimates and assumptions, our fi nancial statements could be materially aff ected.
NOTE 2 SUMMARY OF SIGNIFICANT ACCOUNTING POLICIES
Investments
We classify our fi xed maturity securities into one of two categories: (i) “available for sale” (which we carry at estimated fair value with any unrealized gain or loss, net of tax and related adjustments, recorded as a component of shareholders’ equity); or (ii) “trading” (which we carry
at estimated fair value with changes in such value recognized as net investment income (classifi ed as investment income from policyholder and reinsurer accounts and other special-purpose portfolios)).
Equity securities include investments in common stock and non-redeemable preferred stock. We carry these investments at estimated

CNO FINANCIAL GROUP, INC. - Form 10-K 113
PART II ITEM 8 Consolidated Financial Statements
fair value. We record any unrealized gain or loss, net of tax and related adjustments, as a component of shareholders’ equity.
Mortgage loans held in our investment portfolio are carried at amortized unpaid balances, net of provisions for estimated losses. Interest income is accrued on the principal amount of the loan based on the loan’s contractual interest rate. Payment terms specifi ed for mortgage loans may include a prepayment penalty for unscheduled payoff of the investment. Prepayment penalties are recognized as investment income when received.
Policy loans are stated at current unpaid principal balances.
Our trading securities include: (i) investments purchased with the intent of selling in the near term to generate income on price changes; (ii) investments supporting certain insurance liabilities (including investments backing the market strategies of our multibucket annuity products) and certain reinsurance agreements; and (iii) certain fi xed maturity securities containing embedded derivatives for which we have elected the fair value option. Th e change in fair value of these securities is recognized in income from policyholder and reinsurer accounts and other special-purpose portfolios (a component of net investment income). Investment income from trading securities backing certain insurance liabilities and certain reinsurance agreements is substantially off set by the change in insurance policy benefi ts related to certain products and agreements. Prior to June 30, 2011, certain of our trading securities were held to off set the income statement volatility caused by the eff ect of interest rate fl uctuations on the value of embedded derivatives related to our fi xed index annuity products. During the second quarter of 2011, we sold this trading portfolio. See the section of this note entitled “Accounting for Derivatives” for further discussion regarding these embedded derivatives. Th e change in value of these securities is recognized in realized investment gains (losses). Our trading securities totaled $266.2 million and $91.6 million at December 31, 2012 and 2011, respectively.
Other invested assets include: (i) call options purchased in an eff ort to off set or hedge the eff ects of certain policyholder benefi ts related to our fi xed index annuity and life insurance products; (ii) Company-owned life insurance (“COLI”); and (iii) certain non-traditional investments. We carry the call options at estimated fair value as further described in the section of this note entitled “Accounting for Derivatives”. We carry COLI at its cash surrender value which approximates its net realizable value. Non-traditional investments include investments in certain limited partnerships, which are accounted for using the equity method; promissory notes, which are accounted for using the cost method; and investments in certain hedge funds that are carried at estimated fair value.
We defer any fees received or costs incurred when we originate investments. We amortize fees, costs, discounts and premiums as yield adjustments over the contractual lives of the investments without anticipation of prepayments. We consider anticipated prepayments on mortgage-backed securities in determining estimated future yields on such securities.
When we sell a security (other than trading securities), we report the diff erence between the sale proceeds and amortized cost (determined based on specifi c identifi cation) as a realized investment gain or loss.
We regularly evaluate our investments for possible impairment as further described in the note to the consolidated fi nancial statements entitled “Investments”.
When a security defaults (including mortgage loans) or securities (other than structured securities) are other-than-temporarily impaired, our policy is to discontinue the accrual of interest and eliminate all previous interest accruals, if we determine that such amounts will not be ultimately realized in full.
Cash and Cash Equivalents
Cash and cash equivalents include commercial paper, invested cash and other investments purchased with original maturities of less than three months. We carry them at amortized cost, which approximates estimated fair value.
Deferred Acquisition Costs
Deferred acquisition costs represent incremental direct costs related to the successful acquisition of new or renewal insurance contracts. For universal life or investment products, we amortize these costs in relation to the estimated gross profi ts using the interest rate credited to the underlying policies. For other products, we amortize these costs in relation to future anticipated premium revenue using the projected investment earnings rate.
When we realize a gain or loss on investments backing our universal life or investment-type products, we adjust the amortization to refl ect the change in estimated gross profi ts from the products due to the gain or loss realized and the eff ect on future investment yields. We also adjust deferred acquisition costs for the change in amortization that would have been recorded if our fi xed maturity securities, available for sale, had been sold at their stated aggregate fair value and the proceeds reinvested at current yields. We limit the total adjustment related to the impact of unrealized losses to the total of costs capitalized plus interest related to insurance policies issued in a particular year. We include the impact of this adjustment in accumulated other comprehensive income (loss) within shareholders’ equity.
We regularly evaluate the recoverability of the unamortized balance of the deferred acquisition costs. We consider estimated future gross profi ts or future premiums, expected mortality or morbidity, interest earned and credited rates, persistency and expenses in determining whether the balance is recoverable. If we determine a portion of the unamortized balance is not recoverable, it is charged to amortization expense. In certain cases, the unamortized balance of the deferred acquisition costs may not be defi cient in the aggregate, but our estimates of future earnings indicate that profi ts would be recognized in early periods and losses in later periods. In this case, we increase the amortization of the deferred acquisition costs over the period of profi ts, by an amount necessary to off set losses that are expected to be recognized in the later years.
Refer to the caption “Recently Issued Accounting Standards - Accounting Standard Adopted on a Retrospective Basis” for further information regarding the impact of adoption.
Present Value of Future Profi ts
Th e value assigned to the right to receive future cash fl ows from policyholder insurance contracts existing at the Eff ective Date is referred to as the present value of future profi ts. Th e discount rate we used to determine the present value of future profi ts was 12 percent.

CNO FINANCIAL GROUP, INC. - Form 10-K 114
PART II ITEM 8 Consolidated Financial Statements
Th e balance of this account is amortized and evaluated for recovery in the same manner as described above for deferred acquisition costs. We also adjust the present value of future profi ts for the change in amortization that would have been recorded if the fi xed maturity securities, available for sale, had been sold at their stated aggregate fair value and the proceeds reinvested at current yields, similar to the manner described above for deferred acquisition costs. We limit the total adjustment related to the impact of unrealized losses to the total present value of future profi ts plus interest.
Assets Held in Separate Accounts
Separate accounts are funds on which investment income and gains or losses accrue directly to certain policyholders. Th e assets of these accounts are legally segregated. Th ey are not subject to the claims that may arise out of any other business of CNO. We report separate account assets at fair value; the underlying investment risks are assumed by the contractholders. We record the related liabilities at amounts equal to the separate account assets. We record the fees earned for administrative and contractholder services performed for the separate accounts in insurance policy income.
Recognition of Insurance Policy Income and Related Benefi ts and Expenses on Insurance Contracts
For universal life and investment contracts that do not involve signifi cant mortality or morbidity risk, the amounts collected from policyholders are considered deposits and are not included in revenue. Revenues for these contracts consist of charges for policy administration, cost of insurance charges and surrender charges assessed against policyholders’ account balances. Such revenues are recognized when the service or coverage is provided, or when the policy is surrendered.
We establish liabilities for investment and universal life products equal to the accumulated policy account values, which include an accumulation of deposit payments plus credited interest, less withdrawals and the amounts assessed against the policyholder through the end of the period. Sales inducements provided to the policyholders of these products are recognized as liabilities over the period that the contract must remain in force to qualify for the inducement. Th e options attributed to the policyholder related to our fi xed index annuity products are accounted for as embedded derivatives as described in the section of this note entitled “Accounting for Derivatives”.
Premiums from individual life products (other than interest-sensitive life contracts), and health products are recognized when due. When premiums are due over a signifi cantly shorter period than the period over which benefi ts are provided, any gross premium in excess of the net premium (i.e., the portion of the gross premium required to provide for all expected future benefi ts and expenses) is deferred and recognized into revenue in a constant relationship to insurance in force. Benefi ts are recorded as an expense when they are incurred.
We establish liabilities for traditional life, accident and health insurance, and life contingent payment annuity products using mortality tables in general use in the United States, which are modifi ed to refl ect the Company’s actual experience when appropriate. We establish liabilities for accident and health insurance products using morbidity tables based on the Company’s actual or expected experience. Th ese reserves are computed
at amounts that, with additions from estimated future premiums received and with interest on such reserves at estimated future rates, are expected to be suffi cient to meet our obligations under the terms of the policy. Liabilities for future policy benefi ts are computed on a net-level premium method based upon assumptions as to future claim costs, investment yields, mortality, morbidity, withdrawals, policy dividends and maintenance expenses determined when the policies were issued (or with respect to policies inforce at August 31, 2003, the Company’s best estimate of such assumptions on the Eff ective Date). We make an additional provision to allow for potential adverse deviation for some of our assumptions. Once established, assumptions on these products are generally not changed unless a premium defi ciency exists. In that case, a premium defi ciency reserve is recognized and the future pattern of reserve changes is modifi ed to refl ect the relationship of premiums to benefi ts based on the current best estimate of future claim costs, investment yields, mortality, morbidity, withdrawals, policy dividends and maintenance expenses, determined without an additional provision for potential adverse deviation.
We establish claim reserves based on our estimate of the loss to be incurred on reported claims plus estimates of incurred but unreported claims based on our past experience.
Accounting for Long-term Care Premium Rate Increases
Many of our long-term care policies have been subject to premium rate increases. In some cases, these premium rate increases were materially consistent with the assumptions we used to value the particular block of business at the Eff ective Date. With respect to certain premium rate increases, some of our policyholders were provided an option to cease paying their premiums and receive a non-forfeiture option in the form of a paid-up policy with limited benefi ts. In addition, our policyholders could choose to reduce their coverage amounts and premiums in the same proportion, when permitted by our contracts or as required by regulators. Th e following describes how we account for these policyholder options:
• Premium rate increases - If premium rate increases refl ect a change in our previous rate increase assumptions, the new assumptions are not refl ected prospectively in our reserves. Instead, the additional premium revenue resulting from the rate increase is recognized as earned and original assumptions continue to be used to determine changes to liabilities for insurance products unless a premium defi ciency exists. • Benefi t reductions - A policyholder may choose reduced coverage with a proportionate reduction in premium, when permitted by our contracts. Th is option does not require additional underwriting. Benefi t reductions are treated as a partial lapse of coverage, and the balance of our reserves and deferred insurance acquisition costs is reduced in proportion to the reduced coverage. • Non-forfeiture benefi ts off ered in conjunction with a rate increase - In some cases, non-forfeiture benefi ts are off ered to policyholders who wish to lapse their policies at the time of a signifi cant rate increase. In these cases, exercise of this option is treated as an extinguishment of the original contract and issuance of a new contract. Th e balance of our reserves and deferred insurance acquisition costs are released, and a reserve for the new contract is established. • Florida Order - In 2004, the Florida Offi ce of Insurance Regulation issued an order regarding home health care business in Florida in our

CNO FINANCIAL GROUP, INC. - Form 10-K 115
PART II ITEM 8 Consolidated Financial Statements
Other CNO Business segment. Th e order required a choice of three alternatives to be off ered to holders of home health care policies in Florida subject to premium rate increases as follows: – retention of their current policy with a rate increase of 50 percent in the fi rst year and actuarially justifi ed increases in subsequent years;
– receipt of a replacement policy with reduced benefi ts and a rate increase in the fi rst year of 25 percent and no more than 15 percent in subsequent years; or
– receipt of a paid-up policy, allowing the holder to fi le future claims up to 100 percent of the amount of premiums paid since the inception of the policy.
Reserves for all three groups of policies under the order were prospectively adjusted using a prospective revision methodology, as these alternatives were required by the Florida Offi ce of Insurance Regulation. Th ese policies had no insurance acquisition costs established at the Eff ective Date.
Some of our policyholders may receive a non-forfeiture benefi t if they cease paying their premiums pursuant to their original contract (or pursuant to changes made to their original contract as a result of a litigation settlement made prior to the Eff ective Date or an order issued by the Florida Offi ce of Insurance Regulation). In these cases, exercise of this option is treated as the exercise of a policy benefi t, and the reserve for premium paying benefi ts is reduced, and the reserve for the non-forfeiture benefi t is adjusted to refl ect the election of this benefi t.
Accounting for Marketing and Reinsurance Agreements with Coventry
Th e Medicare Prescription Drug, Improvement and Modernization Act of 2003 provided for the introduction of a prescription drug benefi t. In order to off er this product to our current and potential future policyholders without investing in management and infrastructure, we entered into a national distribution agreement with Coventry to use our career and independent agents to distribute Coventry’s prescription drug plan, Advantra Rx. We receive a fee based on the premiums collected on plans sold through our distribution channels. In addition, CNO has a quota-share reinsurance agreement with Coventry for CNO enrollees that provides CNO with 50 percent of net premiums and related policy benefi ts subject to a risk corridor.
Th e following describes how we account for and report our PDP business:
Our accounting for the national distribution agreement
• We recognize distribution income based on a fi xed fee per PDP contract. Th is fee income is recognized over the calendar year term as premiums are collected. • We also pay commissions to our agents who sell the plans on behalf of Coventry. Th ese payments are deferred and amortized over the remaining term of the initial enrollment period (the one-year life of the initial policy).
Our accounting for the quota-share agreement
• We recognize premium revenue evenly over the period of the underlying Medicare Part D contracts. • We recognize policyholder benefi ts and ceding commission expense as incurred.
• We recognize risk-share premium adjustments consistent with Coventry’s risk-share agreement with the Centers for Medicare and Medicaid Services.
Reinsurance
In the normal course of business, we seek to limit our loss exposure on any single insured or to certain groups of policies by ceding reinsurance to other insurance enterprises. We currently retain no more than $.8 million of mortality risk on any one policy. We diversify the risk of reinsurance loss by using a number of reinsurers that have strong claims-paying ratings. In each case, the ceding CNO subsidiary is directly liable for claims reinsured in the event the assuming company is unable to pay.
Th e cost of reinsurance on life and health coverages is recognized over the life of the reinsured policies using assumptions consistent with those used to account for the underlying policy. Th e cost of reinsurance ceded totaled $220.0 million, $238.1 million and $258.6 million in 2012, 2011 and 2010, respectively. We deduct this cost from insurance policy income. Reinsurance recoveries netted against insurance policy benefi ts totaled $210.2 million, $204.9 million and $471.6 million in 2012, 2011 and 2010, respectively.
From time-to-time, we assume insurance from other companies. Any costs associated with the assumption of insurance are amortized consistent with the method used to amortize deferred acquisition costs described above. Reinsurance premiums assumed totaled $69.4 million, $80.4 million and $92.6 million in 2012, 2011 and 2010, respectively. Reinsurance premiums included amounts assumed pursuant to marketing and quota-share agreements with Coventry of $49.9 million, $58.1 million and $67.2 million in 2012, 2011 and 2010, respectively.
See the section of this note entitled “Accounting for Derivatives” for a discussion of the derivative embedded in the payable related to certain modifi ed coinsurance agreements.
Income Taxes
Our income tax expense includes deferred income taxes arising from temporary diff erences between the fi nancial reporting and tax bases of assets and liabilities, capital loss carryforwards and net operating loss carryforwards (“NOLs”). Deferred tax assets and liabilities are measured using enacted tax rates expected to apply in the years in which temporary diff erences are expected to be recovered or paid. Th e eff ect of a change in tax rates on deferred tax assets and liabilities is recognized in earnings in the period when the changes are enacted.
A reduction of the net carrying amount of deferred tax assets by establishing a valuation allowance is required if, based on the available evidence, it is more likely than not that such assets will not be realized. In assessing the need for a valuation allowance, all available evidence, both positive and negative, shall be considered to determine whether, based on the weight of that evidence, a valuation allowance for deferred tax assets is needed. Th is assessment requires signifi cant judgment and considers, among other matters, the nature, frequency and severity of current and cumulative losses, forecasts of future profi tability, the duration of carryforward periods, our experience with operating loss and tax credit carryforwards expiring unused, and tax planning strategies.

CNO FINANCIAL GROUP, INC. - Form 10-K 116
PART II ITEM 8 Consolidated Financial Statements
We evaluate the need to establish a valuation allowance for our deferred tax assets on an ongoing basis. Th e realization of our deferred tax assets depends upon generating suffi cient future taxable income during the periods in which our temporary diff erences become deductible and before our capital loss carryforwards and NOLs expire.
At December 31, 2012, our valuation allowance for our net deferred tax assets was $766.9 million, as we have determined that it is more likely than not that a portion of our deferred tax assets will not be realized. Th is determination was made by evaluating each component of the deferred tax assets and assessing the eff ects of limitations and/or interpretations on the value of such component to be fully recognized in the future.
Investments in Variable Interest Entities
We have concluded that we are the primary benefi ciary with respect to certain variable interest entities (“VIEs”), which are consolidated in our fi nancial statements. Th e following is a description of our signifi cant investments in VIEs:
All of the VIEs are collateralized loan trusts that were established to issue securities and use the proceeds to principally invest in corporate loans and other permitted investments (including a new VIE which was consolidated in the fi rst quarter of 2012). Th e assets held by the trusts are legally isolated and not available to the Company. Th e liabilities of the VIEs are expected to be satisfi ed from the cash fl ows generated by the underlying investments held by the trusts, not from the assets of the Company. Th e Company has no further commitments to the VIEs.
Th e investment portfolios held by the VIEs are primarily comprised of corporate fi xed maturity securities which are almost entirely rated as below-investment grade securities. Refer to the note to the consolidated fi nancial statements entitled “Investments in Variable Interest Entities” for additional information about VIEs.
Investment Borrowings
Th ree of the Company’s insurance subsidiaries (Conseco Life, Washington National and Bankers Life) are members of the Federal Home Loan Bank (“FHLB”). As members of the FHLB, Conseco Life, Washington National and Bankers Life have the ability to borrow on a collateralized basis from the FHLB. Conseco Life, Washington National and Bankers Life are required to hold certain minimum amounts of FHLB common stock as a condition of membership in the FHLB, and additional amounts based on the amount of the borrowings. At December 31, 2012, the carrying value of the FHLB common stock was $82.5 million. As of December 31, 2012, collateralized borrowings from the FHLB totaled $1.7 billion and the proceeds were used to purchase fi xed maturity securities. Th e borrowings are classifi ed as investment borrowings in the accompanying consolidated balance sheet. Th e borrowings are collateralized by investments with an estimated fair value of $2.0 billion at December 31, 2012, which are maintained in custodial accounts for the benefi t of the FHLB. Such investments are classifi ed as fi xed maturities, available for sale, in our consolidated balance sheet. Interest expense of $28.0 million, $25.7 million and $20.8 million in 2012, 2011 and 2010, respectively, was recognized related to the borrowings.
Th e following summarizes the terms of the borrowings (dollars in millions):
Amount borrowed Maturity date
Interest rate at December 31, 2012
$ 67.0 February 2014 Fixed rate – 1.830% 50.0 August 2014 Variable rate – 0.440% 100.0 August 2014 Variable rate – 0.470% 50.0 September 2015 Variable rate – 0.613% 150.0 October 2015 Variable rate – 0.559% 100.0 November 2015 Variable rate – 0.390% 146.0 November 2015 Fixed rate – 5.300% 100.0 December 2015 Fixed rate – 4.710% 100.0 June 2016 Variable rate – 0.650% 75.0 June 2016 Variable rate – 0.471% 100.0 October 2016 Variable rate – 0.535% 50.0 November 2016 Variable rate – 0.581% 50.0 November 2016 Variable rate – 0.680% 100.0 June 2017 Variable rate – 0.735% 100.0 July 2017 Fixed rate – 3.900% 50.0 August 2017 Variable rate – 0.510% 75.0 August 2017 Variable rate – 0.462% 100.0 October 2017 Variable rate – 0.770% 37.0 November 2017 Fixed rate – 3.750% 50.0 July 2018 Variable rate – 0.783%$ 1,650.0
Th e variable rate borrowings are pre-payable on each interest reset date without penalty. Th e fi xed rate borrowings are pre-payable subject to payment of a yield maintenance fee based on current market interest rates. At December 31, 2012, the aggregate fee to prepay all fi xed rate borrowings was $51.2 million.
As part of our investment strategy, we may enter into investment borrowings, including repurchase agreements, to increase our investment return. With respect to repurchase agreements, we account for these transactions as collateralized borrowings, where the amount borrowed is equal to the sales price of the underlying securities. Repurchase agreements involve a sale of securities and an agreement to repurchase the same securities at a later date at an agreed-upon price. We had no such borrowings outstanding at December 31, 2012. Th e primary risks associated with short-term collateralized borrowings are: (i) a substantial decline in the market value of the margined security; and (ii) that a counterparty may be unable to perform under the terms of the contract or be unwilling to extend such fi nancing in future periods especially if the liquidity or value of the margined security has declined. Exposure is limited to any depreciation in value of the related securities.
At December 31, 2012, investment borrowings consisted of: (i) collateralized borrowings from the FHLB of $1.7 billion; and (ii) other borrowings of $.8 million.
At December 31, 2011, investment borrowings consisted of: (i) collateralized borrowings from the FHLB of $1.7 billion; (ii) repurchase agreements of $24.8 million; and (ii) other borrowings of $1.7 million.

CNO FINANCIAL GROUP, INC. - Form 10-K 117
PART II ITEM 8 Consolidated Financial Statements
Accounting for Derivatives
Our fi xed index annuity products provide a guaranteed minimum rate of return and a higher potential return that is based on a percentage (the “participation rate”) of the amount of increase in the value of a particular index, such as the Standard & Poor’s 500 Index, over a specifi ed period. Typically, on each policy anniversary date, a new index period begins. We are generally able to change the participation rate at the beginning of each index period during a policy year, subject to contractual minimums. We typically buy call options (including call spreads) referenced to the applicable indices in an eff ort to off set or hedge potential increases to policyholder benefi ts resulting from increases in the particular index to which the policy’s return is linked. We refl ect changes in the estimated fair value of these options in net investment income (classifi ed as investment income from policyholder and reinsurer accounts and other special-purpose portfolios). Net investment gains (losses) related to fi xed index products were $25.5 million, $(21.2) million and $28.2 million in 2012, 2011 and 2010, respectively. Th ese amounts were substantially off set by a corresponding change to insurance policy benefi ts. Th e estimated fair value of these options was $54.4 million and $37.9 million at December 31, 2012 and 2011, respectively. We classify these instruments as other invested assets.
Th e Company accounts for the options attributed to the policyholder for the estimated life of the annuity contract as embedded derivatives. Th e Company purchases options to hedge liabilities for the next policy year on each policy anniversary date and must estimate the fair value of the forward embedded options related to the policies. Th ese accounting requirements often create volatility in the earnings from these products. We record the changes in the fair values of the embedded derivatives in earnings as a component of insurance policy benefi ts. Th e fair value of these derivatives, which are classifi ed as “liabilities for interest-sensitive products”, was $734.0 million and $666.3 million at December 31, 2012 and 2011, respectively. Prior to June 30, 2011, we maintained a specifi c block of investments in our trading securities account (which we carried at estimated fair value with changes in such value recognized as investment income from policyholder and reinsurer accounts and other special-purpose portfolios) to off set the income statement volatility caused by the eff ect of interest rate fl uctuations on the value of embedded derivatives related to our fi xed index annuity products. During the second quarter of 2011, we sold this trading portfolio. Because we no longer seek to off set changes from the eff ect of interest rates on derivative embedded in our fi xed index annuity products, we recognized $2.8 million and $20.4 million of decreased earnings in 2012 and 2011, respectively, since the volatility caused by the accounting requirements to record embedded options at fair value was no longer being off set.
If the counterparties for the call options we hold fail to meet their obligations, we may have to recognize a loss. We limit our exposure to such a loss by diversifying among several counterparties believed to be strong and creditworthy. At December 31, 2012, substantially all of our counterparties were rated “BBB+” or higher by Standard & Poor’s Corporation (“S&P”).
Certain of our reinsurance payable balances contain embedded derivatives. Such derivatives had an estimated fair value of $5.5 million and $3.5 million at December 31, 2012 and 2011, respectively. We record the change in the fair value of these derivatives as a component of investment income (classifi ed as investment income from policyholder and reinsurer accounts and other special-purpose portfolios). We maintain
the investments related to these agreements in our trading securities account, which we carry at estimated fair value with changes in such value recognized as investment income (also classifi ed as investment income from policyholder and reinsurer accounts and other special-purpose portfolios). Th e change in value of these trading securities off sets the change in value of the embedded derivatives.
We purchase certain fi xed maturity securities that contain embedded derivatives that are required to be bifurcated from the instrument and held at fair value on the consolidated balance sheet. For certain of these securities, we have elected the fair value option to carry the entire security at fair value with changes in fair value reported in net income for operational ease.
Multibucket Annuity Product
Th e Company’s multibucket annuity is an annuity product that credits interest based on the experience of a particular market strategy. Policyholders allocate their annuity premium payments to several diff erent market strategies based on diff erent asset classes within the Company’s investment portfolio. Interest is credited to this product based on the market return of the given strategy, less management fees, and funds may be moved between diff erent strategies. Th e Company guarantees a minimum return of premium plus approximately 3 percent per annum over the life of the contract. Th e investments backing the market strategies of these products are designated by the Company as trading securities. Th e change in the fair value of these securities is recognized as investment income (classifi ed as income from policyholder and reinsurer accounts and other special-purpose portfolios), which is substantially off set by the change in insurance policy benefi ts for these products. We hold insurance liabilities of $47.8 million and $52.6 million related to multibucket annuity products as of December 31, 2012 and 2011, respectively.
Fair Value Measurements
Defi nition of Fair Value
Fair value is the price that would be received to sell an asset or paid to transfer a liability in an orderly transaction between market participants at the measurement date and, therefore, represents an exit price, not an entry price. We carry certain assets and liabilities at fair value on a recurring basis, including fi xed maturities, equity securities, trading securities, investments held by VIEs, derivatives, cash and cash equivalents, separate account assets and embedded derivatives. We carry our company-owned life insurance policy, which is backed by a series of mutual funds, at its cash surrender value and our hedge fund investments at their net asset values; in both cases, we believe these values approximate their fair values. In addition, we disclose fair value for certain fi nancial instruments, including mortgage loans and policy loans, insurance liabilities for interest-sensitive products, investment borrowings, notes payable and borrowings related to VIEs.
Th e degree of judgment utilized in measuring the fair value of fi nancial instruments is largely dependent on the level to which pricing is based on observable inputs. Observable inputs refl ect market data obtained from independent sources, while unobservable inputs refl ect our view of market assumptions in the absence of observable market information. Financial instruments with readily available active quoted prices would

CNO FINANCIAL GROUP, INC. - Form 10-K 118
PART II ITEM 8 Consolidated Financial Statements
be considered to have fair values based on the highest level of observable inputs, and little judgment would be utilized in measuring fair value. Financial instruments that rarely trade would often have fair value based on a lower level of observable inputs, and more judgment would be utilized in measuring fair value.
Valuation Hierarchy
Th ere is a three-level hierarchy for valuing assets or liabilities at fair value based on whether inputs are observable or unobservable.
• Level 1 – includes assets and liabilities valued using inputs that are unadjusted quoted prices in active markets for identical assets or liabilities. Our Level 1 assets primarily include cash and exchange traded securities. • Level 2 – includes assets and liabilities valued using inputs that are quoted prices for similar assets in an active market, quoted prices for identical or similar assets in a market that is not active, observable inputs, or observable inputs that can be corroborated by market data. Level 2 assets and liabilities include those fi nancial instruments that are valued by independent pricing services using models or other valuation methodologies. Th ese models are primarily industry-standard models that consider various inputs such as interest rate, credit or issuer spreads, reported trades and other inputs that are observable or derived from observable information in the marketplace or are supported by observable levels at which transactions are executed in the marketplace. Financial assets in this category primarily include: certain public and privately placed corporate fi xed maturity securities; certain government or agency securities; certain mortgage and asset-backed securities; certain equity securities; most investments held by our consolidated VIEs; certain mutual fund and hedge fund investments; and most short-term investments; and non-exchange-traded derivatives such as call options to hedge liabilities related to our fi xed index annuity products. Financial liabilities in this category include investment borrowings, notes payable and borrowings related to VIEs. • Level 3 – includes assets and liabilities valued using unobservable inputs that are used in model-based valuations that contain management assumptions. Level 3 assets and liabilities include those fi nancial instruments whose fair value is estimated based on broker/dealer quotes, pricing services or internally developed models or methodologies utilizing signifi cant inputs not based on, or corroborated by, readily available market information. Financial assets in this category include certain corporate securities (primarily certain below-investment grade privately placed securities), certain structured securities, mortgage loans, and other less liquid securities. Financial liabilities in this category include our insurance liabilities for interest-sensitive products, which includes embedded derivatives (including embedded derivatives related to our fi xed index annuity products and to a modifi ed coinsurance arrangement) since their values include signifi cant unobservable inputs including actuarial assumptions.
At each reporting date, we classify assets and liabilities into the three input levels based on the lowest level of input that is signifi cant to the measurement of fair value for each asset and liability reported at fair value. Th is classifi cation is impacted by a number of factors, including the type of fi nancial instrument, whether the fi nancial instrument is new to the market and not yet established, the characteristics specifi c to the transaction and overall market conditions. Our assessment of the signifi cance of a particular input to the fair value measurement and the ultimate classifi cation of each asset and liability requires judgment and
is subject to change from period to period based on the observability of the valuation inputs. Any transfers between levels are reported as having occurred at the beginning of the period. Th ere were no transfers between Level 1 and Level 2 in 2012.
Th e vast majority of our fi xed maturity and equity securities, including those held in trading portfolios and those held by consolidated VIEs, short-term and separate account assets use Level 2 inputs for the determination of fair value. Th ese fair values are obtained primarily from independent pricing services, which use Level 2 inputs for the determination of fair value. Substantially all of our Level 2 fi xed maturity securities and separate account assets were valued from independent pricing services. Th ird party pricing services normally derive the security prices through recently reported trades for identical or similar securities making adjustments through the reporting date based upon available market observable information. If there are no recently reported trades, the third party pricing services may use matrix or model processes to develop a security price where future cash fl ow expectations are developed and discounted at an estimated risk-adjusted market rate. Th e number of prices obtained for a given security is dependent on the Company’s analysis of such prices as further described below.
For securities that are not priced by pricing services and may not be reliably priced using pricing models, we obtain broker quotes. Th ese broker quotes are non-binding and represent an exit price, but assumptions used to establish the fair value may not be observable and therefore represent Level 3 inputs. Approximately 20 percent of our Level 3 fi xed maturity securities were valued using unadjusted broker quotes or broker-provided valuation inputs. Th e remaining Level 3 fi xed maturity investments do not have readily determinable market prices and/or observable inputs. For these securities, we use internally developed valuations. Key assumptions used to determine fair value for these securities may include risk-free rates, risk premiums, performance of underlying collateral and other factors involving signifi cant assumptions which may not be refl ective of an active market. For certain investments, we use a matrix or model process to develop a security price where future cash fl ow expectations are developed and discounted at an estimated market rate. Th e pricing matrix utilizes a spread level to determine the market price for a security. Th e credit spread generally incorporates the issuer’s credit rating and other factors relating to the issuer’s industry and the security’s maturity. In some instances issuer-specifi c spread adjustments, which can be positive or negative, are made based upon internal analysis of security specifi cs such as liquidity, deal size, and time to maturity.
As the Company is responsible for the determination of fair value, we have control processes designed to ensure that the fair values received from third-party pricing sources are reasonable and the valuation techniques and assumptions used appear reasonable and consistent with prevailing market conditions. Additionally, when inputs are provided by third-party pricing sources, we have controls in place to review those inputs for reasonableness. As part of these controls, we perform monthly quantitative and qualitative analysis on the prices received from third parties to determine whether the prices are reasonable estimates of fair value. Th e Company’s analysis includes: (i) a review of the methodology used by third party pricing services; (ii) where available, a comparison of multiple pricing services’ valuations for the same security; (iii) a review of month to month price fl uctuations; (iv) a review to ensure valuations are not unreasonably stale; and (v) back testing to compare actual purchase and sale transactions with valuations received from third parties. As a result of such procedures, the Company may conclude the prices received from third parties are

CNO FINANCIAL GROUP, INC. - Form 10-K 119
PART II ITEM 8 Consolidated Financial Statements
not refl ective of current market conditions. In those instances, we may request additional pricing quotes or apply internally developed valuations. However, the number of instances is insignifi cant and the aggregate change in value of such investments is not materially diff erent from the original prices received.
Th e categorization of the fair value measurements of our investments priced by independent pricing services was based upon the Company’s judgment of the inputs or methodologies used by the independent pricing services to value diff erent asset classes. Such inputs include: benchmark yields, reported trades, broker dealer quotes, issuer spreads, benchmark
securities, bids, off ers and reference data. Th e Company categorizes such fair value measurements based upon asset classes and the underlying observable or unobservable inputs used to value such investments.
Th e fair value measurements for derivative instruments, including embedded derivatives requiring bifurcation, are determined based on the consideration of several inputs including closing exchange or over-the-counter market price quotations; time value and volatility factors underlying options; market interest rates; and non-performance risk. For certain embedded derivatives, we may use actuarial assumptions in the determination of fair value.
Th e categorization of fair value measurements, by input level, for our fi nancial instruments carried at fair value on a recurring basis at December 31, 2012 is as follows (dollars in millions):
Quoted prices in active markets for identical
assets or liabilities (Level 1)
Signifi cant other observable
inputs (Level 2)
Signifi cant unobservable
inputs (Level 3) Total
ASSETS: Fixed maturities, available for sale:
Corporate securities $ — $ 16,498.6 $ 355.5 $ 16,854.1 United States Treasury securities and obligations of United States government corporations and agencies — 99.5 — 99.5 States and political subdivisions — 2,115.0 13.1 2,128.1 Debt securities issued by foreign governments — .8 — .8 Asset-backed securities — 1,416.9 44.0 1,460.9 Collateralized debt obligations — — 324.0 324.0 Commercial mortgage-backed securities — 1,471.2 6.2 1,477.4 Mortgage pass-through securities — 19.9 1.9 21.8 Collateralized mortgage obligations — 2,230.6 16.9 2,247.5
Total fi xed maturities, available for sale — 23,852.5 761.6 24,614.1 Equity securities:
Corporate securities 49.7 118.8 .1 168.6 Venture capital investments — — 2.8 2.8
Total equity securities 49.7 118.8 2.9 171.4 Trading securities:
Corporate securities — 46.6 — 46.6 United States Treasury securities and obligations of United States government corporations and agencies — 4.8 — 4.8 States and political subdivisions — 14.0 .6 14.6 Asset-backed securities — 50.1 — 50.1 Collateralized debt obligations — — 7.3 7.3 Commercial mortgage-backed securities — 93.3 — 93.3 Mortgage pass-through securities — .1 — .1 Collateralized mortgage obligations — 41.2 5.8 47.0 Equity securities .9 1.5 — 2.4
Total trading securities .9 251.6 13.7 266.2 Investments held by variable interest entities - corporate securities — 814.3 — 814.3 Other invested assets - derivatives — 54.4 — 54.4 Assets held in separate accounts — 14.9 — 14.9 TOTAL ASSETS CARRIED AT FAIR VALUE BY CATEGORY $ 50.6 $ 25,106.5 $ 778.2 $ 25,935.3LIABILITIES:
Liabilities for insurance products: Interest-sensitive products - embedded derivatives associated with fi xed index annuity products — — 734.0 734.0 Interest-sensitive products - embedded derivatives associated with modifi ed coinsurance agreement — — 5.5 5.5
Total liabilities for insurance products — — 739.5 739.5 TOTAL LIABILITIES CARRIED AT FAIR VALUE BY CATEGORY $ — $ — $ 739.5 $ 739.5

CNO FINANCIAL GROUP, INC. - Form 10-K 120
PART II ITEM 8 Consolidated Financial Statements
For those fi nancial instruments disclosed at fair value, we use the following methods and assumptions to determine the estimated fair values:
Mortgage loans and policy loans. We discount future expected cash fl ows for loans included in our investment portfolio based on interest rates currently being off ered for similar loans to borrowers with similar credit ratings. We aggregate loans with similar characteristics in our calculations. Th e fair value of policy loans approximates their carrying value.
Company-owned life insurance is backed by a series of mutual funds and is carried at cash surrender value which approximates estimated fair value.
Hedge fund investments are carried at their net asset values which approximates estimated fair value.
Cash and cash equivalents include commercial paper, invested cash and other investments purchased with original maturities of less than three months. We carry them at amortized cost, which approximates estimated fair value.
Insurance liabilities for interest-sensitive products. We discount future expected cash fl ows based on interest rates currently being off ered for similar contracts with similar maturities.
Investment borrowings, notes payable and borrowings related to variable interest entities. For publicly traded debt, we use current fair values. For other notes, we use discounted cash fl ow analyses based on our current incremental borrowing rates for similar types of borrowing arrangements.
Th e fair value measurements for our fi nancial instruments disclosed at fair value on a recurring basis are as follows (dollars in millions):
December 31, 2012 December 31, 2011Quoted prices
in active markets for
identical assets or liabilities
(Level 1)
Signifi cant other
observable inputs
(Level 2)
Signifi cant unobservable
inputs (Level 3)
Total estimated fair value
Total carrying amount
Total estimated fair
value
Total carrying amount
Assets: Mortgage loans $ — $ — $ 1,682.1 $ 1,682.1 $ 1,573.2 $ 1,735.4 $ 1,602.8Policy loans — — 272.0 272.0 272.0 279.7 279.7Other invested assets:
Company-owned life insurance — 123.0 — 123.0 123.0 103.9 103.9Hedge funds — 16.1 — 16.1 16.1 18.2 18.2
Cash and cash equivalents: Unrestricted 432.3 150.2 — 582.5 582.5 436.0 436.0Held by variable interest entities 54.2 — — 54.2 54.2 74.4 74.4
Liabilities: Insurance liabilities for interest-sensitive products excluding embedded derivatives (a) — — 12,153.7 12,153.7 12,153.7 13,165.5 13,165.5Investment borrowings — 1,702.0 — 1,702.0 1,650.8 1,735.7 1,676.5Borrowings related to variable interest entities — 752.2 — 752.2 767.0 485.1 519.9Notes payable – direct corporate obligations — 1,100.3 — 1,100.3 1,004.2 978.3 857.9
(a) The estimated fair value of insurance liabilities for interest-sensitive products was approximately equal to its carrying value at December 31, 2012. This was because interest rates credited on the vast majority of account balances approximate current rates paid on similar products and because these rates are not generally guaranteed beyond one year.

CNO FINANCIAL GROUP, INC. - Form 10-K 121
PART II ITEM 8 Consolidated Financial Statements
Th e categorization of fair value measurements, by input level, for our fi xed maturity securities, equity securities, trading securities, certain other invested assets, assets held in separate accounts and embedded derivative instruments included in liabilities for insurance products at December 31, 2011 is as follows (dollars in millions):
Quoted prices in active markets for identical
assets or liabilities (Level 1)
Signifi cant other observable inputs
(Level 2) (a)
Signifi cant unobservable
inputs (Level 3) (a) Total
ASSETS: Fixed maturities, available for sale:
Corporate securities $ — $ 15,594.4 $ 278.1 $ 15,872.5United States Treasury securities and obligations of United States government corporations and agencies — 303.8 1.6 305.4States and political subdivisions — 1,952.3 2.1 1,954.4Debt securities issued by foreign governments — 1.4 — 1.4Asset-backed securities — 1,334.3 79.7 1,414.0Collateralized debt obligations — — 327.3 327.3Commercial mortgage-backed securities — 1,415.7 17.3 1,433.0Mortgage pass-through securities — 29.8 2.2 32.0Collateralized mortgage obligations — 2,051.2 124.8 2,176.0
Total fi xed maturities, available for sale — 22,682.9 833.1 23,516.0Equity securities 17.9 87.3 69.9 175.1Trading securities:
Corporate securities — 67.6 — 67.6United States Treasury securities and obligations of United States government corporations and agencies — 4.9 — 4.9States and political subdivisions — 15.6 — 15.6Asset-backed securities — .1 — .1Commercial mortgage-backed securities — — .4 .4Mortgage pass-through securities — .2 — .2Collateralized mortgage obligations — .7 — .7Equity securities .7 1.4 — 2.1
Total trading securities .7 90.5 .4 91.6Investments held by variable interest entities — 496.3 — 496.3Other invested assets - derivatives — 37.8 — 37.8Assets held in separate accounts — 15.0 — 15.0LIABILITIES:
Liabilities for insurance products: Interest-sensitive products — — 669.8(b) 669.8
(a) We revised the hierarchy classification of certain fixed maturities, equity securities, trading securities and other invested assets as we believe the observability of the inputs more closely represent Level 2 valuations.
(b) Includes $666.3 million of embedded derivatives associated with our fixed index annuity products and $3.5 million of embedded derivatives associated with a modified coinsurance agreement.

CNO FINANCIAL GROUP, INC. - Form 10-K 122
PART II ITEM 8 Consolidated Financial Statements
Th e following table presents additional information about assets and liabilities measured at fair value on a recurring basis and for which we have utilized signifi cant unobservable (Level 3) inputs to determine fair value for the year ended December 31, 2012 (dollars in millions):
December 31, 2012Amount of total gains
(losses) for the year ended December 31, 2012 included in our
net income relating to assets and liabilities
still held as of the reporting date
Beginning balance as of
December 31, 2011 (a)
Purchases, sales,
issuances and settlements,
net (c)
Total realized and
unrealized gains
(losses) included in net income
Total realized and unrealized
gains (losses) included in
accumulated other
comprehensive income (loss)
Transfers into
Level 3
Transfers out of
Level 3 (b)
Ending balance as of
December 31, 2012
ASSETS: Fixed maturities, available for sale:
Corporate securities $ 278.1 $ 88.1 $ (.2) $ 9.9 $ 68.6 $ (89.0) $ 355.5 $ — United States Treasury securities and obligations of United States government corporations and agencies 1.6 (1.6) — — — — — — States and political subdivisions 2.1 (1.8) — .9 11.9 — 13.1 — Asset-backed securities 79.7 15.2 (.3) 6.3 .5 (57.4) 44.0 — Collateralized debt obligations 327.3 (24.8) — 21.5 — — 324.0 — Commercial mortgage-backed securities 17.3 (2.5) — .8 5.7 (15.1) 6.2 — Mortgage pass-through securities 2.2 (.3) — — — — 1.9 — Collateralized mortgage obligations 124.8 .2 — (.1) 5.0 (113.0) 16.9 —
Total fi xed maturities, available for sale 833.1 72.5 (.5) 39.3 91.7 (274.5) 761.6 — Equity securities:
Corporate securities 6.4 (3.2) (3.8) .7 — — .1 (3.8)Venture capital investments 63.5 (34.3) (26.0) (.4) — — 2.8 —
Total equity securities 69.9 (37.5) (29.8) .3 — — 2.9 (3.8)Trading securities:
States and political subdivisions — — .1 — .5 — .6 .1 Collateralized debt obligations — 6.9 .4 — — — 7.3 .4 Commercial mortgage-backed securities .4 — — — — (.4) — — Collateralized mortgage obligations — 4.5 1.3 — — — 5.8 1.3
Total trading securities .4 11.4 1.8 — .5 (.4) 13.7 1.8 LIABILITIES:
Liabilities for insurance products:
Interest-sensitive products (669.8) (54.5) (15.2) — — — (739.5) (15.2)
(a) We revised the hierarchy classification of certain fixed maturities, equity securities, trading securities and other invested assets as we believe the observability of the inputs more closely represent Level 2 valuations.
(b) For our fixed maturity securities, the majority of our transfers out of Level 3 are the result of obtaining a valuation from an independent pricing service at the end of the period, whereas a broker quote was used as of the beginning of the period.
(c) Purchases, sales, issuances and settlements, net, represent the activity that occurred during the period that results in a change of the asset or liability but does not represent changes in fair value for the instruments held at the beginning of the period. Such activity primarily consists of purchases and sales of fixed maturity and equity securities and changes to embedded derivative instruments related to insurance products resulting from the issuance of new contracts, or changes to existing contracts. The following summarizes such activity for the year ended December 31, 2012 (dollars in millions):

CNO FINANCIAL GROUP, INC. - Form 10-K 123
PART II ITEM 8 Consolidated Financial Statements
Purchases Sales Issuances SettlementsPurchases, sales, issuances
and settlements, netASSETS: Fixed maturities, available for sale:
Corporate securities $ 110.3 $ (22.2) $ — $ — $ 88.1 United States Treasury securities and obligations of United States government corporations and agencies — (1.6) — — (1.6)States and political subdivisions — (1.8) — — (1.8)Asset-backed securities 19.0 (3.8) — — 15.2 Collateralized debt obligations 35.4 (60.2) — — (24.8)Commercial mortgage-backed securities — (2.5) — — (2.5)Mortgage pass-through securities — (.3) — — (.3)Collateralized mortgage obligations 11.2 (11.0) — — .2
Total fi xed maturities, available for sale 175.9 (103.4) — — 72.5 Equity securities:
Corporate securities — (3.2) — — (3.2)Venture capital investments — (34.3) — — (34.3)
Total equity securities — (37.5) — — (37.5)Trading securities:
Collateralized debt obligations 6.9 — — — 6.9 Collateralized mortgage obligations 4.5 — — — 4.5
Total trading securities 11.4 — — — 11.4 LIABILITIES:
Liabilities for insurance products: Interest-sensitive p roducts (103.3 ) 60.4 (50.9) 39.3 (54.5)

CNO FINANCIAL GROUP, INC. - Form 10-K 124
PART II ITEM 8 Consolidated Financial Statements
Th e following table presents additional information about assets and liabilities measured at fair value on a recurring basis and for which we have utilized signifi cant unobservable (Level 3) inputs to determine fair value for the year ended December 31, 2011 (dollars in millions):
December 31, 2011 Amount of total gains (losses) for
the year ended December 31,
2011 included in our net income
relating to assets and liabilities
still held as of the reporting date
Beginning balance as of
December 31, 2010 (a)
Purchases, sales,
issuances and settlements,
net (c)
Total realized and unrealized
gains (losses) included in net income
Total realized and unrealized gains (losses) included
in accumulated other
comprehensive income (loss)
Transfers into
Level 3
Transfers out of Level
3 (b)
Ending balance as of
December 31, 2011
ASSETS: Fixed maturities, available for sale:
Corporate securities $ 1,907.8 $ (292.3) $ (17.0) $ 15.2 $ 43.3 $ (1,378.9) $ 278.1 $ (11.5)United States Treasury securities and obligations of United States government corporations and agencies 2.0 (.1) — (.3) — — 1.6 — States and political subdivisions 2.5 — — .1 2.0 (2.5) 2.1 — Asset-backed securities 182.3 (4.1) — 4.8 39.4 (142.7) 79.7 — Collateralized debt obligations 256.5 69.4 1.5 (.1) — — 327.3 — Commercial mortgage-backed securities — — — .2 17.1 — 17.3 — Mortgage pass-through securities 3.5 (1.3) — — — — 2.2 — Collateralized mortgage obligations 197.1 28.4 (2.1) 3.7 3.9 (106.2) 124.8 —
Total fi xed maturities, available for sale 2,551.7 (200.0) (17.6) 23.6 105.7 (1,630.3) 833.1 (11.5)Equity securities 6.9 67.0 (3.8) (.2) — — 69.9 — Trading securities:
Commercial mortgage-backed securities .4 — — — — — .4 — Collateralized mortgage obligations .4 (.4) — — — — — —
Total trading securities .8 (.4) — — — — .4 — LIABILITIES:
Liabilities for insurance products:
Interest-sensitive products (553.2) (62.5) (54.1) — — — (669.8) (54.1)
(a) We revised the hierarchy classification of certain fixed maturities, equity securities, trading securities and other invested assets as we believe the observability of the inputs more closely represent Level 2 valuations.
(b) For our fixed maturity securities, the majority of our transfers out of Level 3 are the result of obtaining a valuation from an independent pricing service at the end of the period, whereas a broker quote was used as of the beginning of the period.
(c) Purchases, sales, issuances and settlements, net, represent the activity that occurred during the period that results in a change of the asset or liability but does not represent changes in fair value for the instruments held at the beginning of the period. Such activity primarily consists of purchases and sales of fixed maturity and equity securities and changes to embedded derivative instruments related to insurance products resulting from the issuance of new contracts, or changes to existing contracts. The following summarizes such activity for the year ended December 31, 2011 (dollars in millions):

CNO FINANCIAL GROUP, INC. - Form 10-K 125
PART II ITEM 8 Consolidated Financial Statements
Purchases Sales Issuances SettlementsPurchases, sales, issuances
and settlements, netASSETS: Fixed maturities, available for sale:
Corporate securities $ 5.8 $ (298.1) $ — $ — $ (292.3)United States Treasury securities and obligations of United States government corporations and agencies — (.1) — — (.1)Asset-backed securities .2 (4.3) — — (4.1)Collateralized debt obligations 182.2 (112.8) — — 69.4 Mortgage pass-through securities — (1.3) — — (1.3)Collateralized mortgage obligations 63.6 (35.2) — — 28.4
Total fi xed maturities, available for sale 251.8 (451.8) — — (200.0)Equity securities - venture capital investments 67.0 — — — 67.0 Trading securities - collateralized mortgage obligations — (.4) — — (.4)LIABILITIES:
Liabilities for insurance products: Interest-sensitive products (119.8) 54.5 (34.6) 37.4 (62.5)
At December 31, 2012, 91 percent of our Level 3 fi xed maturities, available for sale, were investment grade and 43 percent and 47 percent of our Level 3 fi xed maturities, available for sale, consisted of collateralized debt securities and corporate securities, respectively.
Realized and unrealized investment gains and losses presented in the preceding tables represent gains and losses during the time the applicable fi nancial instruments were classifi ed as Level 3.
Realized and unrealized gains (losses) on Level 3 assets are primarily reported in either net investment income for policyholder and reinsurer accounts and other special-purpose portfolios, net realized investment
gains (losses) or insurance policy benefi ts within the consolidated statement of operations or accumulated other comprehensive income within shareholders’ equity based on the appropriate accounting treatment for the instrument.
Th e amount presented for gains (losses) included in our net loss for assets and liabilities still held as of the reporting date primarily represents impairments for fi xed maturities, available for sale, changes in fair value of trading securities and certain derivatives and changes in fair value of embedded derivative instruments included in liabilities for insurance products that exist as of the reporting date.

CNO FINANCIAL GROUP, INC. - Form 10-K 126
PART II ITEM 8 Consolidated Financial Statements
Th e following table provides additional information about the signifi cant unobservable (Level 3) inputs developed internally by the Company to determine fair value for certain assets and liabilities carried at fair value at December 31, 2012 (dollars in millions):
Fair value at December 31, 2012
Valuation technique(s)
Unobservable inputs Range (weighted average)
ASSETS: Corporate securities (a) $ 248.3 Discounted cash fl ow analysis Discount margins 1.90% - 3.25% (2.78%)Asset-backed securities (b) 33.3 Discounted cash fl ow analysis Discount margins 2.78% - 3.14% (2.99%)
Collateralized debt obligations (c) 331.4 Discounted cash fl ow analysis
Recoveries 65% - 66%Constant prepayment rate 20%
Discount margins .95% - 8.75% (2.02%)Annual default rate .95% - 5.54% (3.01%)
Portfolio CCC %1.18% - 21.56%
(11.99%)
Venture capital investments (d) 2.8 Market multiplesEBITDA multiple 6.8Revenue multiple 1.5
Other assets categorized as Level 3 (e) 162.4 Unadjusted third-party price source Not applicable Not applicableTotal 778.2 LIABILITIES:
Interest sensitive products (f ) 739.5Discounted projected embedded derivatives
Projected portfolio yields 5.35% - 5.61% (5.55%)Discount rates 0.0 - 3.6% (1.4%)Surrender rates 4% - 43% (19%)
(a) Corporate securities - The significant unobservable input used in the fair value measurement of our corporate securities is discount margin added to a riskless market yield. Significant increases (decreases) in discount margin in isolation would result in a significantly lower (higher) fair value measurement.
(b) Asset-backed securities - The significant unobservable input used in the fair value measurement of our asset-backed securities is discount margin added to a riskless market yield. Significant increases (decreases) in discount margin in isolation would result in a significantly lower (higher) fair value measurement.
(c) Collateralized debt obligations - The significant unobservable inputs used in the fair value measurement of our collateralized debt obligations relate to collateral performance, including default rate, recoveries and constant prepayment rate, as well as discount margins of the underlying collateral. Significant increases (decreases) in default rate in isolation would result in a significantly lower (higher) fair value measurement. Generally, a significant increase (decrease) in the constant prepayment rate and recoveries in isolation would result in a significantly higher (lower) fair value measurement. Generally a significant increase (decrease) in discount margin in isolation would result in a significantly lower (higher) fair value measurement. Generally, a change in the assumption used for the annual default rate is accompanied by a directionally similar change in the assumption used for discount margins and por tfolio CCC % and a directionally opposite change in the assumption us ed for constant prepayment rate and recoveries. A tranche’s payment priority and investment cost basis could alter generalized fair value outcomes.
(d) Venture capital investments - The significant unobservable inputs used in the fair v alue measurement of our venture capital investments are the EBITDA multiple and revenue multiple. Generally, a significant increase (decrease) in the EBITDA or r evenue multiples in isolation would r esult in a significantly higher (lower) fair value measurement.
(e) Other assets categorized as Level 3 - For these assets, there were no adjustments to quoted market prices obtained from third-party pricing sources.(f ) Interest sensitive products - The significant unobservable inputs used in the fair value measurement of our interest sensitive products are projected portfolio yields, discount
rates and surrender rates. Increases (decreases) in projected portfolio yields in isolation would lead to a higher (lower) fair value measurement. The discount rate is based on the Treasury rate adjusted by a margin. Increases (decreases) in the discount rates would lead to a lower (higher) fair value measurement. Assumed surrender rates are used to project how long the contracts remain in force. Generally, the longer the contracts are assumed to be in force the higher the fair value of the embedded derivative.
Sales Inducements
Certain of our annuity products off er sales inducements to contract holders in the form of enhanced crediting rates or bonus payments in the initial period of the contract. Certain of our life insurance products off er persistency bonuses credited to the contract holders balance after the policy has been outstanding for a specifi ed period of time. Th ese enhanced rates and persistency bonuses are considered sales inducements in accordance with GAAP. Such amounts are deferred and amortized in the same manner as deferred acquisition costs. Sales inducements deferred totaled $4.4 million, $11.5 million and $20.0 million in 2012, 2011 and 2010, respectively. Amounts amortized totaled $27.1 million, $28.7 million and $31.2 million in 2012, 2011 and 2010, respectively. Th e unamortized balance of deferred sales inducements was $126.5 million and $149.2 million at December 31, 2012 and 2011, respectively. Th e balance of insurance liabilities for persistency bonus benefi ts was $34.6 million and $50.0 million at December 31, 2012 and 2011, respectively.
Out-of-Period Adjustments
We recorded the net eff ect of out-of-period adjustments which had the impact of decreasing our net income by $6.6 million (or two cents per diluted share) in 2012. Specifi c accounts were impacted as follows: a $12.1 million increase to insurance policy benefi ts; a $4.3 million increase to net realized gains; a $1.8 million increase to other expenses; a $.6 million decrease to net investment income related to special purpose portfolios; and a $3.6 million decrease to tax expense. We evaluated these errors taking into account both qualitative and quantitative factors and considered the impact of the errors in relation to 2012, as well as the materiality to the periods in which they originated. Th e impact of correcting these errors in prior years was not signifi cant to any individual period. Management believes these errors are immaterial to the consolidated fi nancial statements.

CNO FINANCIAL GROUP, INC. - Form 10-K 127
PART II ITEM 8 Consolidated Financial Statements
Recently Issued Accounting Standards
Accounting Standard Adopted on a Retrospective Basis
In October 2010, the Financial Accounting Standards Board (“FASB”) issued authoritative guidance that modifi ed the defi nition of the types of costs incurred by insurance entities that could be capitalized in the acquisition of new and renewal contracts. Th e guidance impacts the timing of GAAP reported fi nancial results, but has no impact on cash fl ows, statutory fi nancial results or the ultimate profi tability of the business.
Th e guidance specifi es that an insurance entity shall only capitalize incremental direct costs related to the successful acquisition of new or
renewal insurance contracts. Th e guidance also states that advertising costs should be included in deferred acquisition costs only if the capitalization criteria in the direct-response advertising guidance is met. Th e guidance was eff ective for fi scal years, and interim periods within those fi scal years, beginning after December 15, 2011, and was adopted by the Company on January 1, 2012. As permitted by the guidance, we elected to apply the provisions on a retrospective basis. Th e guidance reduced the balance of deferred acquisition costs, its amortization and the amount of costs capitalized. We are able to defer most commission payments, plus other costs directly related to the production of new business. Th e change did not impact the balance of the present value of future profi ts. Th erefore, in contrast to the reduction in amortization of deferred acquisition costs, there was no change in the amortization of the present value of future profi ts.
Th e adoption of ASU 2010-26 has been refl ected in the accompanying updated fi nancial statements. Th e revision of the fi nancial statements aff ected prior period information as follows (dollars in millions, except per share amounts):
December 31, 2011Amounts prior to adoption
of ASU 2010-26Eff ect of adoption
of ASU 2010-26 As reportedDeferred acquisition costs $ 1,418.1 $ (621.0) $ 797.1 Income tax assets, net 630.5 234.9 865.4 Other assets 316.9 (24.7) 292.2 Total assets 33,332.7 (410.8) 32,921.9 Other liabilities 548.3 8.0 556.3 Total liabilities 28,300.1 8.0 28,308.1 Accumulated other comprehensive income 625.5 156.1 781.6 Retained earnings (accumulated defi cit) 42.8 (574.9) (532.1)Total shareholders’ equity 5,032.6 (418.8) 4,613.8 Total liabilities and shareholders’ equity 33,332.7 (410.8) 32,921.9
Year ended December 31, 2011Amounts prior to adoption
of ASU 2010-26Eff ect of adoption
of ASU 2010-26 As reportedAmortization $ 432.4 $ (135.0) $ 297.4Other operating costs and expenses 496.5 208.0 704.5Total benefi ts and expenses 3,745.4 73.0 3,818.4Income before income taxes 379.2 (73.0) 306.2Tax expense on period income 139.7 (26.2) 113.5Net income 382.5 (46.8) 335.7Earnings per common share:
Basic: Net income $ 1.54 $ (.19) $ 1.35
Diluted: Net income 1.31 (.16) 1.15

CNO FINANCIAL GROUP, INC. - Form 10-K 128
PART II ITEM 8 Consolidated Financial Statements
Year ended December 31, 2010Amounts prior to adoption
of ASU 2010-26Eff ect of adoption
of ASU 2010-26 As reportedAmortization $ 443.8 $ (118.8) $ 325.0Other operating costs and expenses 502.9 187.4 690.3Total benefi ts and expenses 3,790.4 68.6 3,859.0Income before income taxes 293.5 (68.6) 224.9Tax expense on period income 103.9 (24.6) 79.3Net income 284.6 (44.0) 240.6Earnings per common share:
Basic: Net income $ 1.13 $ (.17) $ .96
Diluted: Net income .99 (.15) .84
Year ended December 31, 2011As originally
reportedEff ect of adoption
of ASU 2010-26 As adjustedCash fl ows from operating activities:
Deferrable policy acquisition costs $ (428.7) $ 212.0 $ (216.7)Other operating costs (472.3) (212.0) (684.3)
Net cash used by operating activities 774.8 — 774.8
Year ended December 31, 2010As originally
reportedEff ect of adoption
of ASU 2010-26 As adjustedCash fl ows from operating activities:
Deferrable policy acquisition costs $ (418.2) $ 193.0 $ (225.2)Other operating costs (444.8) (193.0) (637.8)
Net cash used by operating activities 734.0 — 734.0
Adopted Accounting Standards
In June 2011, the FASB issued authoritative guidance to increase the prominence of items reported in other comprehensive income by eliminating the option to present components of other comprehensive income as part of the statement of changes in shareholders’ equity. Such guidance requires that all non-owner changes in shareholders’ equity be presented either in a single continuous statement of comprehensive income or in two separate but consecutive statements. In the two-statement approach, the fi rst statement should present total net income and its components followed consecutively by a second statement that should present total other comprehensive income, the components of other comprehensive income and the total of comprehensive income. Th e guidance was applied retrospectively and is eff ective for fi scal years, and interim periods within those years, beginning after December 15, 2011. Th e adoption of this guidance resulted in a change in the presentation of our fi nancial statements but did not have any impact on our fi nancial condition, operating results or cash fl ows.
In May 2011, the FASB issued authoritative guidance which clarifi es or updates requirements for measuring fair value and for disclosing information about fair value measurements. Th e guidance clarifi es: (i) the application of the highest and best use and valuation premise concepts; (ii) measuring the fair value of an instrument classifi ed in a reporting entity’s shareholders’ equity; and (iii) disclosure of quantitative information about the unobservable inputs used in a fair value measurement that is categorized within Level 3 of the fair value
hierarchy. Th e guidance changes certain requirements for measuring fair value or disclosing information about fair value measurements including: (i) measuring the fair value of fi nancial instruments that are managed within a portfolio; (ii) application of premiums and discounts in a fair value measurement; and (iii) additional disclosures about fair value measurements. Such additional disclosures include a description of the valuation process used for measuring Level 3 instruments and the sensitivity of the Level 3 fair value measurement to changes in unobservable inputs and the interrelationships between those unobservable inputs, if any. Th e guidance was eff ective prospectively for interim and annual periods beginning after December 15, 2011. Refer to the note to our consolidated fi nancial statements entitled “Fair Value Measurements” for additional disclosures required by this guidance. Th e adoption of this guidance expanded our disclosures, but did not have a material impact on our fi nancial condition, operating results or cash fl ows.
In March 2010, the FASB issued authoritative guidance clarifying the scope exception for embedded credit derivatives and when those features would be bifurcated from the host contract. Under the new guidance, only embedded credit derivative features that are in the form of subordination of one fi nancial instrument to another would not be subject to the bifurcation requirements. Accordingly, entities will be required to bifurcate any embedded credit derivative features that no longer qualify under the amended scope exception, or, for certain

CNO FINANCIAL GROUP, INC. - Form 10-K 129
PART II ITEM 8 Consolidated Financial Statements
investments, an entity can elect the fair value option and record the entire investment at fair value. Th is guidance was eff ective for fi scal quarters beginning after June 15, 2010. Th e adoption of this guidance did not have a material impact on our consolidated fi nancial statements.
In January 2010, the FASB issued authoritative guidance which requires additional disclosures related to purchases, sales, issuances and settlements in the rollforward of Level 3 fair value measurements. Th is guidance was eff ective for reporting periods beginning after December 15, 2010. Th e adoption of this guidance did not have a material impact on our consolidated fi nancial statements.
In January 2010, the FASB issued authoritative guidance which requires new disclosures and clarifi es existing disclosure requirements related to fair value. An entity is also required to disclose signifi cant transfers in and out of Levels 1 and 2 of the fair value hierarchy. In addition, the guidance amends the fair value disclosure requirement for pension and postretirement benefi t plan assets to require this disclosure at the investment class level. Th e guidance was eff ective for interim and annual reporting periods beginning after December 15, 2009. Such disclosures are included in the note to the consolidated fi nancial statements entitled “Fair Value Measurements”. Th e adoption of this guidance did not have a material impact on our consolidated fi nancial statements.
NOTE 3 INVESTMENTS
At December 31, 2012, the amortized cost, gross unrealized gains and losses, estimated fair value and other-than-temporary impairments in accumulated other comprehensive income of fi xed maturities, available for sale, and equity securities were as follows (dollars in millions):
Amortized cost
Gross unrealized
gains
Gross unrealized
lossesEstimated fair value
Other-than-temporary impairments included in accumulated other
comprehensive incomeInvestment grade (a):
Corporate securities $ 13,531.8 $ 2,221.4 $ (12.1) $ 15,741.1 $ — United States Treasury securities and obligations of United States government corporations and agencies 93.9 5.6 — 99.5 — States and political subdivisions 1,840.7 277.3 (4.3) 2,113.7 — Debt securities issued by foreign governments .8 — — .8 — Asset-backed securities 1,002.9 70.9 (2.8) 1,071.0 — Collateralized debt obligations 311.5 7.5 (1.0) 318.0 — Commercial mortgage-backed securities 1,325.7 152.3 (.6) 1,477.4 — Mortgage pass-through securities 20.6 1.2 — 21.8 — Collateralized mortgage obligations 1,157.7 107.2 (.7) 1,264.2 (.8)
Total investment grade fi xed maturities, available for sale 19,285.6 2,843.4 (21.5) 22,107.5 (.8)Below-investment grade (a):
Corporate securities 1,055.8 65.3 (8.1) 1,113.0 — States and political subdivisions 15.3 — (.9) 14.4 — Asset-backed securities 360.9 31.4 (2.4) 389.9 — Collateralized debt obligations 5.5 .5 — 6.0 — Collateralized mortgage obligations 903.7 79.6 — 983.3 (5.2)
Total below-investment grade fi xed maturities, available for sale 2,341.2 176.8 (11.4) 2,506.6 (5.2)TOTAL FIXED MATURITIES, AVAILABLE FOR SALE $ 21,626.8 $ 3,020.2 $ (32.9) $ 24,614.1 $ (6.0)EQUITY SECURITIES $ 167.1 $ 5.9 $ (1.6) $ 171.4(a) Investment ratings – Investment ratings are assigned the second lo west rating by Nationally Recognized Statistical Rating Organization (“NRSROs”) (Moody’s Investor
Services, Inc. (“Moody’s”), S&P or Fitch Ratings (“Fitch”)), or if not rated by such firms, the rating assigned by the National Association of Insurance Commissioners (the “NAIC”). NAIC designations of “1” or “2” include fix ed maturities generally rated investment grade (rated “Baa3” or higher by Moody’s or rated “BBB-” or higher b y S&P and Fitch). NAIC designations of “3” through “6” are referred to as below-investment grade (which generally are rated “Ba1” or lower by Moody’s or rated “BB+” or lower by S&P and Fitch). References to investment grade or below-investment grade throughout our consolidated financial statements are determined as described above.

CNO FINANCIAL GROUP, INC. - Form 10-K 130
PART II ITEM 8 Consolidated Financial Statements
Th e NAIC evaluates the fi xed maturity investments of insurers for regulatory and capital assessment purposes and assigns securities to one of six credit quality categories called NAIC designations, which are used by insurers when preparing their annual statements based on statutory accounting principles. Th e NAIC designations are generally similar to the credit quality designations of the NRSROs for marketable fi xed maturity securities, except for certain structured securities as described below. Th e following summarizes the NAIC designations and NRSRO equivalent ratings:
NAIC Designation NRSRO Equivalent Rating1 AAA/AA/A2 BBB3 BB4 B5 CCC and lower6 In or near default
Th e NAIC adopted revised rating methodologies for non-agency residential mortgage-backed securities that became eff ective December 31, 2009 and for commercial mortgage-backed securities and all other asset-backed securities that became eff ective December 31, 2010. Th e NAIC’s objective with the revised ratings was to increase the accuracy in assessing potential losses, and to use the improved assessment to determine a more appropriate capital requirement for such structured securities. Accordingly, certain structured securities rated below investment grade by the NRSROs could be assigned as NAIC 1 or NAIC 2 securities dependent on th e cost basis of the holder relative to estimated recoverable amounts as determined by the NAIC. In late December 2012, the NAIC released valuation information used to calculate capital requirements on non-agency residential mortgage-backed and commercial mortgage-backed securities for year-end 2012. Th e 2012 valuation process incorporated more conservative assumptions, whereby higher probability weights were assigned to more pessimistic macroeconomic scenarios. Th e impact of the more conservative assumptions resulted in less than 1 percentage point reduction to the Company’s consolidated risk-based capital (“RBC”) ratio.
A summary of our fi xed maturity securities, available for sale, by NAIC designations (or for fi xed maturity securities held by non-regulated entities, based on NRSRO ratings) as of December 31, 2012 is as follows (dollars in millions):
NAIC designation Amortized costEstimated fair
valuePercentage of total
estimated fair value1 $ 10,133.6 $ 11,586.8 47.1%2 10,309.4 11,779.5 47.8 3 849.3 902.6 3.7 4 300.4 314.9 1.3 5 33.7 29.8 .1 6 .4 .5 —
$ 21,626.8 $ 24,614.1 100.0%

CNO FINANCIAL GROUP, INC. - Form 10-K 131
PART II ITEM 8 Consolidated Financial Statements
At December 31, 2011, the amortized cost, gross unrealized gains and losses, estimated fair value and other-than-temporary impairments in accumulated other comprehensive income of fi xed maturities, available for sale, and equity securities were as follows (dollars in millions):
Amortized cost
Gross unrealized
gains
Gross unrealized
lossesEstimated fair value
Other-than-temporary impairments included in accumulated other
comprehensive incomeInvestment grade:
Corporate securities $ 13,414.9 $ 1,513.4 $ (86.4) $ 14,841.9 $ — United States Treasury securities and obligations of United States government corporations and agencies 298.0 7.4 — 305.4 — States and political subdivisions 1,778.7 189.3 (13.6) 1,954.4 — Debt securities issued by foreign governments 1.3 .1 — 1.4 — Asset-backed securities 1,227.2 43.3 (30.9) 1,239.6 — Collateralized debt obligations 323.1 1.1 (4.4) 319.8 — Commercial mortgage-backed securities 1,351.0 89.9 (7.9) 1,433.0 — Mortgage pass-through securities 30.5 1.6 (.1) 32.0 — Collateralized mortgage obligations 1,314.8 77.8 (4.0) 1,388.6 (.3)
Total investment grade fi xed maturities, available for sale 19,739.5 1,923.9 (147.3) 21,516.1 (.3)Below-investment grade:
Corporate securities 1,055.5 25.6 (50.5) 1,030.6 — Asset-backed securities 178.0 2.2 (5.8) 174.4 — Collateralized debt obligations 9.4 — (1.9) 7.5 — Collateralized mortgage obligations 796.7 8.1 (17.4) 787.4 (11.5)
Total below-investment grade fi xed maturities, available for sale 2,039.6 35.9 (75.6) 1,999.9 (11.5)TOTAL FIXED MATURITIES, AVAILABLE FOR SALE $ 21,779.1 $ 1,959.8 $ (222.9) $ 23,516.0 $ (11.8)EQUITY SECURITIES $ 177.0 $ 1.2 $ (3.1) $ 175.1
Accumulated other comprehensive income is primarily comprised of the net eff ect of unrealized appreciation (depreciation) on our investments. Th ese amounts, included in shareholders’ equity as of December 31, 2012 and 2011, were as follows (dollars in millions):
2012 2011Net unrealized appreciation (depreciation) on fi xed maturity securities, available for sale, on which an other-than-temporary impairment loss has been recognized $ 9.8 $ (4.4)Net unrealized gains on all other investments 2,986.5 1,733.2 Adjustment to present value of future profi ts (a) (193.0) (214.8)Adjustment to deferred acquisition costs (452.9) (289.3)Adjustment to insurance liabilities (489.8) — Unrecognized net loss related to deferred compensation plan (7.9) (8.3)Deferred income tax liabilities (655.3) (434.8)ACCUMULATED OTHER COMPREHENSIVE INCOME $ 1,197.4 $ 781.6 (a) The present value of future profits is the value assigned to the right to receive future cash flows from contracts existing at September 10, 2003 (the date our Predecessor
emerged from bankruptcy).
At December 31, 2012, adjustments to the present value of future profi ts, deferred acquisition costs, insurance liabilities and deferred tax assets included $(162.3) million, $(149.9) million, $(489.8) million and $288.7 million, respectively, for premium defi ciencies that would exist on certain long-term health products if unrealized gains on the assets backing such products had been realized and the proceeds from our sales of such assets were invested at then current yields.
Below-Investment Grade Securities
At December 31, 2012, the amortized cost of the Company’s below-investment grade fi xed maturity securities was $2,341.2 million, or 11 percent of the Company’s fi xed maturity portfolio. Th e estimated fair value of the below-investment grade portfolio was $2,506.6 million, or 107 percent of the amortized cost.
Below-investment grade corporate debt securities typically have diff erent characteristics than investment grade corporate debt securities. Based on historical performance, probability of default by the borrower is signifi cantly greater for below-investment grade corporate debt securities and in many cases severity of loss is relatively greater as such securities are generally unsecured and often subordinated to other indebtedness of the issuer. Also, issuers of below-investment grade corporate debt securities frequently have higher levels of debt relative to investment-grade issuers, hence, all other things being equal, are generally more sensitive to adverse economic conditions. Th e Company attempts to reduce the overall risk related to its investment in below-investment grade securities, as in all investments, through careful credit analysis, strict investment policy guidelines, and diversifi cation by issuer and/or guarantor and by industry.

CNO FINANCIAL GROUP, INC. - Form 10-K 132
PART II ITEM 8 Consolidated Financial Statements
Contractual Maturity
Th e following table sets forth the amortized cost and estimated fair value of fi xed maturities, available for sale, at December 31, 2012, by contractual maturity. Actual maturities will diff er from contractual maturities because certain borrowers may have the right to call or
prepay obligations with or without penalties. In addition, structured securities (such as asset-backed securities, collateralized debt obligations, commercial mortgage-backed securities, mortgage pass-through securities and collateralized mortgage obligations, collectively referred to as “structured securities”) frequently include provisions for periodic principal payments and permit periodic unscheduled payments.
(Dollars in millions) Amortized cost Estimated fair valueDue in one year or less $ 167.6 $ 170.2Due after one year through fi ve years 1,605.0 1,754.5Due after fi ve years through ten years 4,375.0 4,932.7Due after ten years 10,390.7 12,225.1Subtotal 16,538.3 19,082.5Structured securities 5,088.5 5,531.6TOTAL FIXED MATURITIES, AVAILABLE FOR SALE $ 21,626.8 $ 24,614.1
Net Investment Income
Net investment income consisted of the following (dollars in millions):
2012 2011 2010Fixed maturities $ 1,280.9 $ 1,233.8 $ 1,162.6 Trading income related to policyholder and reinsurer accounts and other special-purpose portfolios 62.4 14.6 43.7 Equity securities 4.4 1.7 .8 Mortgage loans 99.8 111.7 121.7 Policy loans 17.1 17.6 18.2 Options related to fi xed index products:
Option income .4 36.5 57.3 Change in value of options 25.1 (57.7) (29.1)
Other invested assets 14.4 14.5 9.1 Cash and cash equivalents .6 .4 .5
Gross investment income 1,505.1 1,373.1 1,384.8 Less investment expenses 18.7 19.0 17.9 NET INVESTMENT INCOME $ 1,486.4 $ 1,354.1 $ 1,366.9
Th e estimated fair value of fi xed maturity investments and mortgage loans not accruing investment income totaled $.5 million and $10.0 million at December 31, 2012 and 2011, respectively.
Net Realized Investment Gains (Losses)
Th e following table sets forth the net realized investment gains (losses) for the periods indicated (dollars in millions):
2012 2011 2010Fixed maturity securities, available for sale: Realized gains on sale $ 115.4 $ 183.1 $ 347.1 Realized losses on sale (15.4) (59.9) (147.7)Impairments:
Total other-than-temporary impairment losses (1.0) (19.2) (94.8)Other-than-temporary impairment losses recognized in accumulated other comprehensive income (loss) — 5.3 (4.7)
Net impairment losses recognized (1.0) (13.9) (99.5)Net realized investment gains from fi xed maturities 99.0 109.3 99.9
Equity securities .1 (.2) .1 Commercial mortgage loans (3.7) (29.3) (16.9)Impairments of mortgage loans and other investments (36.8) (20.7) (50.3)Other 22.5 2.7 (2.6)NET REALIZED INVESTMENT GAINS $ 81.1 $ 61.8 $ 30.2

CNO FINANCIAL GROUP, INC. - Form 10-K 133
PART II ITEM 8 Consolidated Financial Statements
During 2012, we recognized net realized investment gains of $81.1 million, which were comprised of $98.8 million of net gains from the sales of investments (primarily fi xed maturities) with proceeds of $2.1 billion, the increase in fair value of certain fi xed maturity investments with embedded derivatives of $20.1 million and $37.8 million of writedowns of investments for other than temporary declines in fair value recognized through net income.
During 2011, we recognized net realized investment gains of $61.8 million, which were comprised of $96.4 million of net gains from the sales of investments (primarily fi xed maturities) with proceeds of $5.5 billion and $34.6 million of writedowns of investments for other than temporary declines in fair value recognized through net income ($39.9 million, prior to the $5.3 million of impairment losses recognized through accumulated other comprehensive income).
During 2010, we recognized net realized investment gains of $30.2 million, which were comprised of $180.0 million of net gains from the sales of investments (primarily fi xed maturities) with proceeds of $8.6 billion and $149.8 million of writedowns of investments for other than temporary declines in fair value recognized through net income ($146.8 million, prior to the $(3.0) million of impairment losses recognized through other comprehensive income).
At December 31, 2012, fi xed maturity securities in default or considered nonperforming had an aggregate amortized cost and a carrying value of $.4 million and $.5 million, respectively.
During 2010, we recorded an impairment charge of $70.6 million on an investment made by our Predecessor in a guaranteed investment contract issued by a Bermuda insurance company. We decided to pursue the early commutation of this investment in exchange for interests in certain underlying invested assets held by the insurance company. Information related to these underlying invested assets obtained in late December 2010 and early 2011 resulted in the recognition of the impairment charge. Th e guaranteed investment contract was scheduled to mature in December 2029 and had a projected future yield of 1.33 percent (the guaranteed minimum rate) immediately prior to the impairment charge. Th e estimated fair value of our investment in the guaranteed investment contract was $213 million at December 31, 2010. Also during 2010, other-than-temporary impairments recorded in earnings included: (i) $23.6 million of losses related to mortgage-backed and asset-backed securities, primarily refl ecting changes related to the estimated future cash fl ows of the underlying assets and, for certain securities, changes in our intent to hold the securities; (ii) $40.8 million of losses related to commercial mortgage loans refl ecting our concerns regarding the issuers’ ability to continue to make contractual payments related to these loans and our estimate of the value of the underlying properties; (iii) $1.6 million related to a home offi ce building which is available for sale;and (iv) $13.2 million of additional losses primarily related to various corporate securities and other invested assets following unforeseen issue-specifi c events or conditions.
During 2011, we completed the commutation of the investment in the guaranteed investment contract as discussed above pursuant to which we received government agency securities as well as equity interests in certain corporate investments with an aggregate fair value of $197.5 million in exchange for our holdings with a book value of $201.5 million (resulting in a net realized loss of $4.0 million). During 2011, we recognized impairment charges of $11.5 million on the underlying invested assets.
During 2012, the $37.8 million of other-than-temporary impairments we recorded in earnings included: (i) $5.4 million of losses related to certain commercial mortgage loans; (ii) $29.9 million of losses on equity securities primarily related to investments obtained through the commutation of an investment made by our Predecessor (as further described above); and (iii) $2.5 million of additional losses following unforeseen issue-specifi c events or conditions.
During 2012, the $15.4 million of realized losses on sales of $402.5 million of fi xed maturity securities, available for sale, included: (i) $5.2 million of losses related to the sales of mortgage-backed securities and asset-backed securities; and (ii) $10.2 million of additional losses primarily related to various corporate securities. Securities are generally sold at a loss following unforeseen issue-specifi c events or shifts in perceived risks. Th ese reasons include but are not limited to: (i) changes in the investment environment; (ii) expectation that the fair value could deteriorate further; (iii) desire to reduce our exposure to an asset class, an issuer or an industry; (iv) prospective or actual changes in credit quality; or (v) changes in expected cash fl ows related to structured securities.
During 2011, the $34.6 million of other-than-temporary impairments we recorded in earnings included: (i) $11.5 million on an investment in a guaranteed investment contract as discussed above; (ii) $11.8 million of losses related to certain commercial mortgage loans; (iii) $4.3 million related to investments held by a VIE as a result of our intent to sell such investments; and (iv) $7.0 million of additional losses following unforeseen issue-specifi c events or conditions.
During 2011, the $59.9 million of realized losses on sales of $1.0 billion of fi xed maturity securities, available for sale, included: (i) $24.1 million of losses related to the sales of mortgage-backed securities and asset-backed securities; (ii) $13.4 million related to sales of securities issued by states and political subdivisions; (iii) $8.9 million related to the partial commutations of the guaranteed investment contract as discussed above; and (iv) $13.5 million of additional losses primarily related to various corporate securities.
During 2010, the $147.7 million of realized losses on sales of $1.4 billion of fi xed maturity securities, available for sale, included: (i) $125.4 million of losses related to the sales of mortgage-backed securities and asset-backed securities; and (ii) $22.3 million of additional losses primarily related to various corporate securities.
Our fi xed maturity investments are generally purchased in the context of a long-term strategy to fund insurance liabilities, so we do not generally seek to generate short-term realized gains through the purchase and sale of such securities. In certain circumstances, including those in which securities are selling at prices which exceed our view of their underlying economic value, or when it is possible to reinvest the proceeds to better meet our long-term asset-liability objectives, we may sell certain securities.
We regularly evaluate all of our investments with unrealized losses for possible impairment. Our assessment of whether unrealized losses are “other than temporary” requires signifi cant judgment. Factors considered include: (i) the extent to which fair value is less than the cost basis; (ii) the length of time that the fair value has been less than cost; (iii) whether the unrealized loss is event driven, credit-driven or a result of changes in market interest rates or risk premium; (iv) the near-term prospects for specifi c events, developments or circumstances

CNO FINANCIAL GROUP, INC. - Form 10-K 134
PART II ITEM 8 Consolidated Financial Statements
likely to aff ect the value of the investment; (v) the investment’s rating and whether the investment is investment-grade and/or has been downgraded since its purchase; (vi) whether the issuer is current on all payments in accordance with the contractual terms of the investment and is expected to meet all of its obligations under the terms of the investment; (vii) whether we intend to sell the investment or it is more likely than not that circumstances will require us to sell the investment before recovery occurs; (viii) the underlying current and prospective asset and enterprise values of the issuer and the extent to which the recoverability of the carrying value of our investment may be aff ected by changes in such values; (ix) projections of, and unfavorable changes in, cash fl ows on structured securities including mortgage-backed and asset-backed securities; (x) our best estimate of the value of any collateral; and (xi) other objective and subjective factors.
Future events may occur, or additional information may become available, which may necessitate future realized losses in our portfolio. Signifi cant losses could have a material adverse eff ect on our consolidated fi nancial statements in future periods.
Impairment losses on equity securities are recognized in net income. Th e manner in which impairment losses on fi xed maturity securities, available for sale, are recognized in the fi nancial statements is dependent on the facts and circumstances related to the specifi c security. If we intend to sell a security or it is more likely than not that we would be required to sell a security before the recovery of its amortized cost, the security is other-than-temporarily impaired and the full amount of the impairment is recognized as a loss through earnings. If we do not expect to recover the amortized cost basis, we do not plan to sell the security, and if it is not more likely than not that we would be required to sell a security before the recovery of its amortized cost, less any current period credit loss, the recognition of the other-than-temporary impairment is bifurcated. We recognize the credit loss portion in net income and the noncredit loss portion in accumulated other comprehensive income.
We estimate the amount of the credit loss component of a fi xed maturity security impairment as the diff erence between amortized cost and the present value of the expected cash fl ows of the security. Th e present value is determined using the best estimate of future cash fl ows discounted at the eff ective interest rate implicit to the security at the date of purchase or the current yield to accrete an asset-backed or fl oating rate security. Th e methodology and assumptions for establishing the best estimate of future cash fl ows vary depending on the type of security.
For most structured securities, cash fl ow estimates are based on bond specifi c facts and circumstances that may include collateral characteristics, expectations of delinquency and default rates, loss severity, prepayment speeds and structural support, including excess spread, subordination and guarantees. For corporate bonds, cash fl ow estimates are derived from scenario-based outcomes of expected corporate restructurings or the disposition of assets using bond specifi c facts and circumstances. Th e previous amortized cost basis less the impairment recognized in net income becomes the security’s new cost basis. We accrete the new cost basis to the estimated future cash fl ows over the expected remaining life of the security, except when the security is in default or considered nonperforming.
Th e remaining noncredit impairment, which is recorded in accumulated other comprehensive income, is the diff erence between the security’s estimated fair value and our best estimate of future cash fl ows discounted at the eff ective interest rate prior to impairment. Th e remaining noncredit impairment typically represents changes in the market interest rates, current market liquidity and risk premiums. As of December 31, 2012, other-than-temporary impairments included in accumulated other comprehensive income of $6.0 million (before taxes and related amortization) related to structured securities.
Mortgage loans are impaired when it is probable that we will not collect the contractual principal and interest on the loan. We measure impairment based upon the diff erence between the carrying value of the loan and the estimated fair value of the collateral securing the loan less cost to sell.
Th e following table summarizes the amount of credit losses recognized in earnings on fi xed maturity securities, available for sale, held at the beginning of the period, for which a portion of the other-than-temporary impairment was also recognized in accumulated other comprehensive income for the years ended December 31, 2012, 2011 and 2010 (dollars in millions):
Year ended December 31,2012 2011 2010
Credit losses on fi xed maturity securities, available for sale, beginning of period $ (2.0) $ (6.1) $ (27.2)Add: credit losses on other-than-temporary impairments not previously recognized — (1.1) (1.7)Less: credit losses on securities sold .4 5.2 33.3 Less: credit losses on securities impaired due to intent to sell (a) — — 1.9 Add: credit losses on previously impaired securities — — (12.4)Less: increases in cash fl ows expected on previously impaired securities — — —
CREDIT LOSSES ON FIXED MATURITY SECURITIES, AVAILABLE FOR SALE, END OF PERIOD $ (1.6) $ (2.0) $ (6.1)(a) Represents securities for which the amount previously recognized in accumulated other comprehensive income was recognized in earnings because we intend to sell the
security or we more likely than not will be required to sell the security before recovery of its amortized cost basis.

CNO FINANCIAL GROUP, INC. - Form 10-K 135
PART II ITEM 8 Consolidated Financial Statements
Investments with Unrealized LossesTh e following table sets forth the amortized cost and estimated fair value of those fi xed maturities, available for sale, with unrealized losses at December 31, 2012, by contractual maturity. Actual maturities will
diff er from contractual maturities because borrowers may have the right to call or prepay obligations with or without penalties. Structured securities frequently include provisions for periodic principal payments and permit periodic unscheduled payments.
(Dollars in millions) Amortized cost Estimated fair valueDue in one year or less $ — $ —Due after one year through fi ve years 35.5 35.2Due after fi ve years through ten years 106.5 103.1Due after ten years 513.0 491.3Subtotal 655.0 629.6Structured securities 286.5 279.0TOTAL $ 941.5 $ 908.6
Th ere were no investments in our portfolio rated below-investment grade which have been continuously in an unrealized loss position exceeding 20 percent of the cost basis at December 31, 2012.
Th e following table summarizes the gross unrealized losses and fair values of our investments with unrealized losses that are not deemed to be other-than-temporarily impaired, aggregated by investment category and length of time that such securities have been in a continuous unrealized loss position, at December 31, 2012 (dollars in millions):
Description of securities
Less than 12 months 12 months or greater Total
Fair value Unrealized losses Fair value Unrealized losses Fair valueUnrealized
lossesStates and political subdivisions $ 48.3 $ (1.8) $ 68.7 $ (3.4) $ 117.0 $ (5.2)Corporate securities 338.1 (11.2) 174.5 (9.0) 512.6 (20.2)Asset-backed securities 41.7 (.3) 111.6 (4.9) 153.3 (5.2)Collateralized debt obligations 19.4 (.4) 32.5 (.6) 51.9 (1.0)Commercial mortgage-backed securities 4.9 (.1) 6.2 (.5) 11.1 (.6)Mortgage pass-through securities — — 1.9 — 1.9 — Collateralized mortgage obligations 27.0 (.4) 33.8 (.3) 60.8 (.7)TOTAL FIXED MATURITIES, AVAILABLE FOR SALE $ 479.4 $ (14.2) $ 429.2 $ (18.7) $ 908.6 $ (32.9)EQUITY SECURITIES $ 17.8 $ (1.6) $ — $ — $ 17.8 $ (1.6)
Th e following table summarizes the gross unrealized losses and fair values of our investments with unrealized losses that are not deemed to be other-than-temporarily impaired, aggregated by investment category and length of time that such securities have been in a continuous unrealized loss position, at December 31, 2011 (dollars in millions):
Description of securitiesLess than 12 months 12 months or greater Total
Fair value Unrealized losses Fair value Unrealized losses Fair value Unrealized lossesUnited States Treasury securities and obligations of United States government corporations and agencies $ 9.1 $ — $ .2 $ — $ 9.3 $ — States and political subdivisions 6.9 (.2) 155.4 (13.4) 162.3 (13.6)Debt securities issued by foreign governments .5 — — — .5 — Corporate securities 1,394.7 (57.0) 466.2 (79.9) 1,860.9 (136.9)Asset-backed securities 437.6 (14.5) 147.5 (22.2) 585.1 (36.7)Collateralized debt obligations 268.8 (6.3) 1.7 — 270.5 (6.3)Commercial mortgage-backed securities 168.8 (5.2) 33.0 (2.7) 201.8 (7.9)Mortgage pass-through securities 1.2 — 2.2 (.1) 3.4 (.1)Collateralized mortgage obligations 645.0 (20.8) 29.7 (.6) 674.7 (21.4)TOTAL FIXED MATURITIES, AVAILABLE FOR SALE $ 2,932.6 $ (104.0) $ 835.9 $ (118.9) $ 3,768.5 $ (222.9)EQUITY SECURITIES $ 41.6 $ (3.0) $ .4 $ — $ 42.0 $ (3.0)
Based on management’s current assessment of investments with unrealized losses at December 31, 2012, the Company believes the issuers of the securities will continue to meet their obligations (or with respect to equity-type securities, the investment value will recover to its cost basis). While we do not have the intent to sell securities with unrealized losses and it is not more likely than not that we will be required to sell
securities with unrealized losses prior to their anticipated recovery, our intent on an individual security may change, based upon market or other unforeseen developments. In such instances, if a loss is recognized from a sale subsequent to a balance sheet date due to these unexpected developments, the loss is recognized in the period in which we had the intent to sell the security before its anticipated recovery.

CNO FINANCIAL GROUP, INC. - Form 10-K 136
PART II ITEM 8 Consolidated Financial Statements
Structured Securities
At December 31, 2012 fi xed maturity investments included structured securities with an estimated fair value of $5.5 billion (or 23 percent of all fi xed maturity securities). Th e yield characteristics of structured securities generally diff er in some respects from those of traditional corporate fi xed-income securities or government securities. For example, interest and principal payments on structured securities may occur more frequently, often monthly. In many instances, we are subject to the risk that the amount and timing of principal and interest payments may vary from expectations. For example, in many cases, partial prepayments may occur at the option of the issuer and prepayment rates are infl uenced by a number of factors that cannot be predicted with certainty, including: the relative sensitivity of prepayments on the underlying assets backing the security to changes in interest rates; a variety of economic, geographic and other factors; the timing, pace and proceeds of liquidations of defaulted collateral; and various security-specifi c structural considerations (for example, the repayment priority of a given security in a securitization structure). In addition, the total amount of payments for non-agency structured securities could be aff ected by changes to cumulative default rates or loss severities of the related collateral.
Historically, the rate of prepayments on structured securities has tended to increase when prevailing interest rates have declined signifi cantly in absolute terms and also relative to the interest rates on the underlying collateral. Th e yields recognized on structured securities purchased at a discount to par will increase (relative to the stated rate) when the underlying collateral prepays faster than expected. Th e yields recognized on structured securities purchased at a premium will decrease (relative
to the stated rate) when the underlying collateral prepays faster than expected. When interest rates decline, the proceeds from prepayments may be reinvested at lower rates than we were earning on the prepaid securities. When interest rates increase, prepayments may decrease below expected levels. When this occurs, the average maturity and duration of structured securities increases, decreasing the yield on structured securities purchased at discounts and increasing the yield on those purchased at a premium because of a decrease in the annual amortization of premium.
For structured securities included in fi xed maturities, available for sale, that were purchased at a discount or premium, we recognize investment income using an eff ective yield based on anticipated future prepayments and the estimated fi nal maturity of the securities. Actual prepayment experience is periodically reviewed and eff ective yields are recalculated when diff erences arise between the prepayments originally anticipated and the actual prepayments received and currently anticipated. For credit sensitive mortgage-backed and asset-backed securities, and for securities that can be prepaid or settled in a way that we would not recover substantially all of our investment, the eff ective yield is recalculated on a prospective basis. Under this method, the amortized cost basis in the security is not immediately adjusted and a new yield is applied prospectively. For all other structured and asset-backed securities, the eff ective yield is recalculated when changes in assumptions are made, and refl ected in our income on a retrospective basis. Under this method, the amortized cost basis of the investment in the securities is adjusted to the amount that would have existed had the new eff ective yield been applied since the acquisition of the securities. Such adjustments were not signifi cant in 2012.
Th e following table sets forth the par value, amortized cost and estimated fair value of structured securities, summarized by interest rates on the underlying collateral, at December 31, 2012 (dollars in millions):
Par value Amortized cost Estimated fair valueBelow 4 percent $ 609.4 $ 564.1 $ 581.84 percent – 5 percent 793.1 773.7 850.35 percent – 6 percent 2,718.1 2,575.9 2,825.06 percent – 7 percent 941.4 881.4 967.27 percent – 8 percent 159.5 164.8 176.38 percent and above 127.7 128.7 131.0TOTAL STRUCTURED SECURITIES $ 5,349.2 $ 5,088.6 $ 5,531.6
Th e amortized cost and estimated fair value of structured securities at December 31, 2012, summarized by type of security, were as follows (dollars in millions):
Type Amortized costEstimated fair value
Amount Percent of fi xed maturitiesPass-throughs, sequential and equivalent securities $ 1,376.6 $ 1,492.7 6.1%Planned amortization classes, target amortization classes and accretion-directed bonds 678.9 746.8 3.0 Commercial mortgage-backed securities 1,325.7 1,477.4 6.0 Asset-backed securities 1,363.9 1,460.9 6.0 Collateralized debt obligations 317.0 324.1 1.3 Other 26.5 29.7 .1 TOTAL STRUCTURED SECURITIES $ 5,088.6 $ 5,531.6 22.5%

CNO FINANCIAL GROUP, INC. - Form 10-K 137
PART II ITEM 8 Consolidated Financial Statements
Pass-throughs, sequentials and equivalent securities have unique prepayment variability characteristics. Pass-through securities typically return principal to the holders based on cash payments from the underlying mortgage obligations. Sequential securities return principal to tranche holders in a detailed hierarchy. Planned amortization classes, targeted amortization classes and accretion-directed bonds adhere to fi xed schedules of principal payments as long as the underlying mortgage loans experience prepayments within certain estimated ranges. In most circumstances, changes in prepayment rates are fi rst absorbed by support or companion classes insulating the timing of receipt of cash fl ows from the consequences of both faster prepayments (average life shortening) and slower prepayments (average life extension).
Commercial mortgage-backed securities are secured by commercial real estate mortgages, generally income producing properties that are managed for profi t. Property types include multi-family dwellings including apartments, retail centers, hotels, restaurants, hospitals, nursing homes, warehouses, and offi ce buildings. Most commercial
mortgage-backed securities have call protection features whereby underlying borrowers may not prepay their mortgages for stated periods of time without incurring prepayment penalties.
Commercial Mortgage Loans
At December 31, 2012, the mortgage loan balance was primarily comprised of commercial loans. Approximately 8 percent, 7 percent, 6 percent, 6 percent, 5 percent, 5 percent and 5 percent of the mortgage loan balance were on properties located in California, Minnesota, Arizona, Indiana, Florida, Maryland and Texas, respectively. No other state comprised greater than fi ve percent of the mortgage loan balance. None of the commercial mortgage loan balance was noncurrent at December 31, 2012. Our commercial mortgage loan portfolio is comprised of large commercial mortgage loans. We do not hold groups of smaller-balance homogeneous loans. Our loans have risk characteristics that are unique to an individual borrower. Accordingly, we measure potential losses on a loan-by-loan basis rather than establishing an allowance for losses on mortgage loans.
Th e following table provides the carrying value and estimated fair value of our outstanding mortgage loans and the underlying collateral as of December 31, 2012 (dollars in millions):
Loan-to-value ratio (a) Carrying valueEstimated fair value
Mortgage loans CollateralLess than 60% $ 758.9 $ 838.7 $ 2,172.660% to 70% 323.1 342.7 498.2Greater than 70% to 80% 266.9 281.5 358.7Greater than 80% to 90% 114.1 118.5 135.0Greater than 90% 110.2 100.7 117.3TOTAL $ 1,573.2 $ 1,682.1 $ 3,281.8(a) Loan-to-value ratios are calculated as the ratio of: (i) the carrying value of the commercial mortgage loans; to (ii) the estimated fair value of the underlying collateral.
Other Investment Disclosures
Life insurance companies are required to maintain certain investments on deposit with state regulatory authorities. Such assets had aggregate carrying values of $67.8 million and $74.5 million at December 31, 2012 and 2011, respectively.
Th e changes in unrealized appreciation (depreciation) included in accumulated other comprehensive income are net of reclassifi cation adjustments for after-tax net gains (losses) from the sale of investments included in net income of approximately $5 million, $38 million and $(114) million for the years ended December 31, 2012, 2011 and 2010, respectively.
CNO had no fi xed maturity investments that were in excess of 10 percent of shareholders’ equity at December 31, 2012 and 2011.

CNO FINANCIAL GROUP, INC. - Form 10-K 138
PART II ITEM 8 Consolidated Financial Statements
NOTE 4 LIABILITIES FOR INSURANCE PRODUCTS
Th ese liabilities consisted of the following (dollars in millions):
Withdrawal assumption Mortality assumption Interest rate assumption 2012 2011Future policy benefi ts:
Interest-sensitive products: Investment contracts N/A N/A (c) $ 9,648.9 $ 9,832.9Universal life contracts N/A N/A N/A 3,244.3 3,332.6
Total interest-sensitive products 12,893.2 13,165.5Traditional products:
Traditional life insurance contracts Company experience (a) 5% 2,389.6 2,396.2
Limited-payment annuitiesCompany experience,
if applicable (b) 4% 903.5 848.8Individual and group accident and health Company experience Company experience 6% 7,903.2 7,237.7
Total traditional products 11,196.3 10,482.7Claims payable and other policyholder funds N/A N/A N/A 985.1 1,034.3Liabilities related to separate accounts N/A N/A N/A 14.9 15.0TOTAL $ 25,089.5 $ 24,697.5(a) Principally, modifications of the 1965 - 70 and 1975 - 80 Basic, Select and Ultimate Tables.(b) Principally, the 1984 United States Population Table and the NAIC 1983 Individual Annuitant Mortality Table.(c) In 2012 and 2011, all of this liability represented account balances where future benefits are not guaranteed.
Th e Company establishes reserves for insurance policy benefi ts based on assumptions as to investment yields, mortality, morbidity, withdrawals, lapses and maintenance expenses. Th ese reserves include amounts for estimated future payment of claims based on actuarial assumptions. Th e balance is based on the Company’s best estimate of the future policyholder benefi ts to be incurred on this business, given recent and expected future changes in experience.
Changes in the unpaid claims reserve (included in claims payable) and disabled life reserves related to accident and health insurance (included in individual and group accident and health liabilities) were as follows (dollars in millions):
2012 2011 2010Balance, beginning of the year $ 1,637.3 $ 1,543.7 $ 1,444.0 Incurred claims (net of reinsurance) related to:
Current year 1,570.1 1,545.8 1,505.8 Prior years (a) (56.4) (41.7) (15.6)
Total incurred 1,513.7 1,504.1 1,490.2 Interest on claim reserves 77.8 78.4 73.4 Paid claims (net of reinsurance) related to:
Current year 891.3 866.5 827.0 Prior years 663.9 626.2 694.1
Total paid 1,555.2 1,492.7 1,521.1 Net change in balance for reinsurance assumed and ceded 5.7 3.8 57.2 BALANCE, END OF THE YEAR $ 1,679.3 $ 1,637.3 $ 1,543.7(a) The reserves and liabilities we establish are necessarily based on estimates, assumptions and prior years’ statistics. Such amounts will fluctuate based upon the estimation
procedures used to determine the amount of unpaid losses. It is possible that actual claims will exceed our reserves and have a material adverse effect on our results of operations and financial condition.

CNO FINANCIAL GROUP, INC. - Form 10-K 139
PART II ITEM 8 Consolidated Financial Statements
NOTE 5 INCOME TAXES
Th e components of income tax expense were as follows (dollars in millions):
2012 2011 2010Current tax expense $ 12.5 $ 11.9 $ 9.7 Deferred tax expense 117.4 101.6 69.6 Valuation allowance applicable to current year income (60.3) — — Income tax expense calculated based on annual eff ective tax rate 69.6 113.5 79.3 Valuation allowance reduction applicable to income in future years (111.2) (143.0) (95.0)Deferred tax benefi t related to loss on extinguishment of debt and other items (23.7) — — TOTAL INCOME TAX BENEFIT $ (65.3) $ (29.5) $ (15.7)
A reconciliation of the U.S. statutory corporate tax rate to the eff ective rate refl ected in the consolidated statement of operations is as follows:
2012 2011 2010U.S. statutory corporate rate 35.0% 35.0% 35.0%Valuation allowance (110.1) (46.7) (42.2)Other nondeductible benefi ts 32.3 .7 (.6)State taxes 1.4 .9 .9 Provision for tax issues, tax credits and other (.5) .5 (.1)EFFECTIVE TAX RATE (41.9)% (9.6)% (7.0)%
Th e components of the Company’s income tax assets and liabilities were as follows (dollars in millions):
2012 2011Deferred tax assets:
Net federal operating loss carryforwards $ 1,330.2 $ 1,445.2 Net state operating loss carryforwards 16.2 16.8 Tax credits 39.2 32.6 Capital loss carryforwards 296.2 342.3 Deductible temporary diff erences:
Insurance liabilities 746.3 744.4 Other 86.0 64.8
Gross deferred tax assets 2,514.1 2,646.1 Deferred tax liabilities:
Investments (24.1) (24.2)Present value of future profi ts and deferred acquisition costs (325.2) (363.7)Accumulated other comprehensive income (655.3) (434.8)
Gross deferred tax liabilities (1,004.6) (822.7)Net deferred tax assets before valuation allowance 1,509.5 1,823.4
Valuation allowance (766.9) (938.4)Net deferred tax assets 742.6 885.0
Current income taxes accrued (25.7) (19.6)INCOME TAX ASSETS, NET $ 716.9 $ 865.4
Our income tax expense includes deferred income taxes arising from temporary diff erences between the fi nancial reporting and tax bases of assets and liabilities, capital loss carryforwards and NOLs. Deferred tax assets and liabilities are measured using enacted tax rates expected to apply in the years in which temporary diff erences are expected to be recovered or paid. Th e eff ect of a change in tax rates on deferred tax assets and liabilities is recognized in earnings in the period when the changes are enacted.
A reduction of the net carrying amount of deferred tax assets by establishing a valuation allowance is required if, based on the available evidence, it is more likely than not that such assets will not be realized. In assessing the need for a valuation allowance, all available evidence,
both positive and negative, shall be considered to determine whether, based on the weight of that evidence, a valuation allowance for deferred tax assets is needed. Th is assessment requires signifi cant judgment and considers, among other matters, the nature, frequency and severity of current and cumulative losses, forecasts of future profi tability, the duration of carryforward periods, our experience with operating loss and tax credit carryforwards expiring unused, and tax planning strategies. We evaluate the need to establish a valuation allowance for our deferred tax assets on an ongoing basis. Th e realization of our deferred tax assets depends upon generating suffi cient future taxable income during the periods in which our temporary diff erences become deductible and before our capital loss carryforwards and NOLs expire.

CNO FINANCIAL GROUP, INC. - Form 10-K 140
PART II ITEM 8 Consolidated Financial Statements
Based on our assessment, it appears more likely than not that $876 million of our NOLs and capital loss carryforwards will be realized through future taxable earnings. Accordingly, we reduced our deferred tax valuation allowance by $171.5 million in 2012. We will continue to assess the need for a valuation allowance in the future. If future results are less than projected, a valuation allowance may be required to reduce the deferred tax assets, which could have a material impact on our results of operations in the period in which it is recorded.
Th ere are three principal components of the reduction to our valuation allowance for deferred tax assets in 2012. First, our 2012 taxable operating income, exceeded the amount previously refl ected in our deferred tax valuation model, resulting in a reduction to the valuation allowance of $13.7 million in 2012. Second, we reduced the valuation allowance by $46.6 million for taxable investment gains realized in 2012. Last, our recent higher levels of operating income resulted in the projection of higher levels of future years taxable income based on evidence we
consider to be objective and verifi able. Th is change is further described in the following paragraph and resulted in a reduction to the valuation allowance for deferred tax assets of $111.2 million in 2012.
Our analysis at December 31, 2012, is consistent with the deferred tax valuation model used in the prior year. Our deferred tax valuation model refl ects projections of future taxable income based on a normalized average annual taxable income for the last three years, plus 5 percent growth for the next fi ve years and no growth thereafter. In our new projections, our three year average increased to $292 million, compared to $260 million in our prior projection. Th e projections used to support the recovery of our NOLs do not anticipate the use of tax planning strategies that we could consider in the future to avoid a tax benefi t from expiring. We have evaluated each component of the deferred tax assets and assessed the eff ect of limitations and/or interpretations on the value of each component to be fully recognized in the future.
Changes in our valuation allowance are summarized as follows (dollars in millions):
Balance, December 31, 2009 $ 1,176.4Decrease in 2010 (95.0)(a)
Balance, December 31, 2010 1,081.4 Decrease in 2011 (143.0)(b)
Balance, December 31, 2011 938.4 Decrease in 2012 (171.5)(c)
BALANCE, DECEMBER 31, 2012 $ 766.9(a) The $95.0 million reduction to the deferr ed tax valuation allowance during 2010 r esulted from the utilization of NOLs and c apital loss carr yforwards and higher
projections of future taxable income based on evidence we consider to be objective and verifiable.(b) The $143.0 million reduction to the deferred tax valuation allowance during 2011 resulted primarily from our recent higher levels of operating income when projecting
future taxable income.(c) The $171.5 million reduction to the deferred tax valuation allowance during 2012 resulted primarily from: (i) higher taxable income in 2012 (including inv estment
gains); and (ii) our recent higher levels of operating income when projecting future taxable income as further discussed above.
Recovery of our deferred tax assets is dependent on achieving the future taxable income used in our deferred tax valuation model and failure to do so would result in an increase in the valuation allowance in a future period. Any future increase in the valuation allowance may result in additional income tax expense and reduce shareholders’ equity, and such an increase could have a signifi cant impact upon our earnings in the future. In addition, the use of the Company’s NOLs is dependent, in part, on whether the Internal Revenue Service (the “IRS”) ultimately agrees with the tax positions we have taken in our tax returns with respect to the allocation of cancellation of indebtedness income (“CODI”) resulting from the bankruptcy of our Predecessor and the classifi cation of the loss we recognized as a result of the transfer (the “Transfer”) of the stock of Senior Health Insurance Company of Pennsylvania (“Senior Health”) to Senior Health Care Oversight Trust, an independent trust (the “Independent Trust”) (as further described below).
Th e Internal Revenue Code (the “Code”) limits the extent to which losses realized by a non-life entity (or entities) may off set income from a life insurance company (or companies) to the lesser of: (i) 35 percent of the income of the life insurance company; or (ii) 35 percent of the total loss of the non-life entities (including NOLs of the non-life entities). Th ere is no similar limitation on the extent to which losses realized by a life insurance entity (or entities) may off set income from a non-life entity (or entities).
Section 382 of the Code imposes limitations on a corporation’s ability to use its NOLs when the company undergoes an ownership change. Future transactions and the timing of such transactions could cause an
ownership change for Section 382 income tax purposes. Such transactions may include, but are not limited to, additional repurchases under our securities repurchase program, issuances of common stock (including upon conversion of our outstanding 7.0% Convertible Senior Debentures due 2016 (the “7.0% Debentures”)), and acquisitions or sales of shares of CNO stock by certain holders of our shares, including persons who have held, currently hold or may accumulate in the future fi ve percent or more of our outstanding common stock for their own account. Many of these transactions are beyond our control. If an additional ownership change were to occur for purposes of Section 382, we would be required to calculate an annual restriction on the use of our NOLs to off set future taxable income. Th e annual restriction would be calculated based upon the value of CNO’s equity at the time of such ownership change, multiplied by a federal long-term tax exempt rate (2.87 percent at December 31, 2012), and the annual restriction could eff ectively eliminate our ability to use a substantial portion of our NOLs to off set future taxable income. We regularly monitor ownership change (as calculated for purposes of Section 382) and, as of December 31, 2012, we were below the 50 percent ownership change level that would trigger further impairment of our ability to utilize our NOLs.
On January 20, 2009, the Company’s Board of Directors adopted a Section 382 Rights Agreement designed to protect shareholder value by preserving the value of our tax assets primarily associated with tax NOLs under Section 382. Th e Section 382 Rights Agreement was adopted to reduce the likelihood of this occurring by deterring the acquisition of stock that would create “5 percent shareholders” as defi ned in Section 382. On December 6, 2011, the Company’s Board

CNO FINANCIAL GROUP, INC. - Form 10-K 141
PART II ITEM 8 Consolidated Financial Statements
of Directors amended the Section 382 Rights Agreement to, among other things, (i) extend the fi nal expiration date of the Amended Rights Agreement to December 6, 2014, (ii) update the purchase price of the rights described below, (iii) provide for a new series of preferred stock relating to the rights that is substantially identical to the prior series of preferred stock, (iv) provide for a 4.99% percent ownership threshold relating to any Company 382 Securities (as defi ned below), and amend other provisions to refl ect best practices for tax benefi t preservation plans, including updates to certain defi nitions.
Under the Section 382 Rights Agreement, one right was distributed for each share of our common stock outstanding as of the close of business on January 30, 2009 and for each share issued after that date. Pursuant to the Amended Section 382 Rights Agreement, if any person or group (subject to certain exemptions) becomes an owner of more than 4.99 percent of the Company’s outstanding common stock (or any other interest in the Company that would be treated as “stock” under applicable Section 382 regulations) without the approval of the Board of Directors, there would be a triggering event causing signifi cant dilution in the voting power and economic ownership of that person or group. Shareholders who held more than 4.99 percent of the Company’s outstanding common stock as of December 6, 2011 will trigger a dilutive event only if they acquire additional shares exceeding one percent of our outstanding shares without prior approval from the Board of Directors.
Th e Amended Section 382 Rights Agreement was approved by our shareholders at the Company’s 2012 annual meeting and will continue in eff ect until December 6, 2014, unless earlier terminated or redeemed by the Board of Directors. Th e Company’s Audit and Enterprise Risk Committee will review our NOLs on an annual basis and will recommend amending or terminating the Section 382 Rights Agreement based on its review.
On May 11, 2010, our shareholders approved an amendment to CNO’s certifi cate of incorporation designed to prevent certain transfers of common stock which could otherwise adversely aff ect our ability to use our NOLs (the “Section 382 Charter Amendment”). Subject to the provisions set forth in the Section 382 Charter Amendment, transfers of our common stock would be void and of no eff ect if the eff ect of the purported transfer would be to: (i) increase the direct or indirect ownership of our common stock by any person or public group (as such term is defi ned in the regulations under Section 382) from less than 5% to 5% or more of our common stock; (ii) increase the percentage of our common stock owned directly or indirectly by a person or public group owning or deemed to own 5% or more of our common stock; or (iii) create a new public group. Th e Section 382 Charter Amendment will continue in eff ect until December 31, 2013.
As of December 31, 2012, we had $3.8 billion of federal NOLs and $.8 billion of capital loss carryforwards. Th e following table summarizes the expiration dates of our loss carryforwards assuming the IRS does not ultimately agree with the positions we have taken with respect to the allocation of CODI and the loss on our investment in Senior Health, both as further described below (dollars in millions):
Year of expiration Net operating loss carryforwards (a)Capital loss
carryforwardsTotal loss
carryforwardsLife Non-life2013 $ — $ — $ 808.6(b) $ 808.62014 — — 28.6 28.62015 — — 9.1 9.12018 475.0(a) — — 475.02021 29.5 — — 29.52022 204.1 — — 204.12023 —(b) 2,603.1(a) — 2,603.12024 — 3.2 — 3.22025 — 118.8 — 118.82027 — 216.8 — 216.82028 — .5 — .52029 — 148.9 — 148.92032 — .8 — .8TOTAL $ 708.6 $ 3,092.1 $ 846.3 $ 4,647.0(a) The life/non-life allocation summarized above assumes the IRS does not ultimately agree with the tax position we have taken in our tax returns with respect to the allocation
of CODI. If the IRS ultimately agrees with our tax position, appr oximately $631 million of the non-life NOLs expiring in 2023 w ould be characterized as life NOLs expiring in 2018.
(b) The allocation of the capital loss carr yforwards summarized above assumes the IRS does not ultimately agr ee with the tax position we have taken with r espect to our investment in Senior Health, which was worthless when it was transferred to the Independent Trust in 2008. If the IRS ultimately agrees with our tax position of classifying this loss as ordinary, capital loss carryforwards expiring in 2013 would decrease and life NOLs expiring in 2023 would increase by $742.0 million.
We had deferred tax assets related to NOLs for state income taxes of $16.2 million and $16.8 million at December 31, 2012 and 2011, respectively. Th e related state NOLs are available to off set future state taxable income in certain states through 2019.
As more fully discussed below, the following interpretations of the tax law may have an impact on our ability to utilize our NOLs and are uncertain tax positions of the Company: (i) whether the CODI
recognized in conjunction with our bankruptcy should be classifi ed as a reduction to life or non-life NOLs; and (ii) whether the loss on our investment in Senior Health should be classifi ed as an NOL or a capital loss carryforward. Th e recorded NOLs and capital loss carryforwards related to these items are fully off set by tax valuation allowances, as it is uncertain whether such assets will be realized.

CNO FINANCIAL GROUP, INC. - Form 10-K 142
PART II ITEM 8 Consolidated Financial Statements
In July 2006, the Joint Committee of Taxation accepted the audit and the settlement which characterized $2.1 billion of the tax losses on our Predecessor’s investment in Conseco Finance Corp. as life company losses and the remaining $3.8 billion as non-life losses prior to the application of the CODI attribute reductions described below.
Th e Code provides that any income realized as a result of the CODI in bankruptcy must reduce NOLs. We realized $2.5 billion of CODI when we emerged from bankruptcy. Pursuant to the Company’s interpretation of the tax law, the CODI reductions were all used to reduce non-life NOLs and this position has been taken in our tax returns. However, the IRS has issued a proposed adjustment which is not in agreement with our position. We have requested an appeal of the IRS proposed adjustment through their early appeals process. Due to uncertainties with respect to the position the IRS may take and limitations on our ability to utilize NOLs based on projected life and non-life income, we have consistently considered the $631 million of CODI to be a reduction to life NOLs when determining our valuation allowance,
pending resolution. If the IRS ultimately agrees with our position that the $631 million of CODI is a reduction to non-life NOLs, our valuation allowance would be reduced by approximately $140 million based on the income projection used in determining our valuation allowance. Th e outcome of this uncertainty cannot be predicted.
We recognized a $742 million loss on our investment in Senior Health which was worthless when it was transferred to the Independent Trust in 2008. We have treated the loss as a capital loss when determining the deferred tax benefi t we may receive. We also established a full valuation allowance as we believe we will not generate capital gains to utilize the benefi t. However, due to uncertainties in the Code, we have refl ected this loss as an ordinary loss in our tax return, contrary to certain IRS rulings. If classifying this loss as ordinary is ultimately determined to be correct, our valuation allowance would be reduced by approximately $145 million based on the income projections used in determining our valuation allowance.
A reconciliation of the beginning and ending amount of unrecognized tax benefi ts for the years ended December 31, 2012 and 2011 is as follows (dollars in millions):
Years ended December 31,2012 2011
Balance at beginning of year $ 318.2 $ 311.1Increase based on tax positions taken in prior years 7.3 7.1Decrease based on tax positions taken in prior years (15.0) —
BALANCE AT END OF YEAR $ 310.5 $ 318.2
As of December 31, 2012 and 2011, $285.0 million and $300.0 million, respectively, of our unrecognized tax benefi ts, if recognized, would have resulted in a decrease in our valuation allowance for deferred tax assets. Th e remaining balances relate to timing diff erences which, if recognized, would have no eff ect on the Company’s tax expense or our evaluation of the valuation allowance for deferred tax assets. Th e Company recognizes interest and penalties related to unrecognized tax benefi ts as income tax expense in the consolidated statement of operations. Included in tax expense in 2012 and 2011 is $.7 million and $1.1 million, respectively, of interest. No such amounts were recognized in 2010. Th e liability for accrued interest was $1.8 million and $1.1 million at December 31, 2012 and 2011, respectively.
Tax years 2004 and 2008 through 2010 are open to examination by the IRS through September 2014, while tax year 2011 is open through
September 2015. Th e Company’s various state income tax returns are generally open for tax years 2009 through 2011 based on the individual state statutes of limitation. Generally, for tax years which generate NOLs, capital losses or tax credit carryforwards, the statute of limitations does not close until the expiration of the statute of limitations for the tax year in which such carryforwards are utilized.
In accordance with GAAP, we are precluded from recognizing the tax benefi ts of any tax windfall upon the exercise of a stock option or the vesting of restricted stock unless such deduction resulted in actual cash savings to the Company. Because of the Company’s NOLs, no cash savings have occurred. NOL carryforwards of $2.9 million related to deductions for stock options and restricted stock will be refl ected in additional paid-in capital if realized.
NOTE 6 NOTES PAYABLE - DIRECT CORPORATE OBLIGATIONS
Th e following notes payable were direct corporate obligations of the Company as of December 31, 2012 and 2011 (dollars in millions):
2012 2011New Senior Secured Credit Agreement (as defi ned below) $ 644.6 $ — 7.0% Debentures 93.0 293.0 Previous Senior Secured Credit Agreement (as defi ned below) — 255.2 6.375% Senior Secured Notes due October 2020 (the “6.375% Notes”) 275.0 — 9.0% Senior Secured Notes due January 2018 (the “9.0% Notes”) — 275.0 Senior Health Note due November 12, 2013 (the “Senior Health Note”) — 50.0 Unamortized discount on New Senior Secured Credit Agreement (5.0) — Unamortized discount on 7.0% Debentures (3.4) (12.9)Unamortized discount on Previous Senior Secured Credit Agreement — (2.4)DIRECT CORPORATE OBLIGATIONS $ 1,004.2 $ 857.9

CNO FINANCIAL GROUP, INC. - Form 10-K 143
PART II ITEM 8 Consolidated Financial Statements
In the third quarter of 2012, as further discussed below, we completed a comprehensive recapitalization plan. Th e following table sets forth the sources and uses of cash from the recapitalization transactions (dollars in millions):
Sources:New Senior Secured Credit Agreement $ 669.5Issuance of 6.375% Notes 275.0
TOTAL SOURCES $ 944.5Uses:
Cash on hand for general corporate purposes $ 13.7Repurchase of $200 million principal amount of 7.0% Debentures pursuant to Debenture Repurchase Agreement 355.1Repayment of Previous Senior Secured Credit Agreement 223.8Repayment of $275.0 million principal amount of 9.0% Notes, including redemption premium 322.7Debt issuance costs 23.1Accrued interest 6.1
TOTAL USES $ 944.5
6.375% Notes
On September 28, 2012, we issued $275.0 million in aggregate principal amount of 6.375% Notes pursuant to an indenture, dated as of September 28, 2012 (the “6.375% Indenture”), among the Company, the subsidiary guarantors party thereto (the “Subsidiary Guarantors”) and Wilmington Trust, National Association, as trustee (the “Trustee”) and as collateral agent (the “Collateral Agent”). Th e net proceeds from the issuance of the 6.375% Notes, together with the net proceeds from the New Senior Secured Credit Agreement (as defi ned below), were used to repay other outstanding indebtedness, as further described below, and for general corporate purposes.
Th e 6.375% Notes will mature on October 1, 2020. Interest on the 6.375% Notes accrues at a rate of 6.375% per annum and is payable semiannually in arrears on April 1 and October 1 of each year, commencing on April 1, 2013. Th e 6.375% Notes and the guarantees thereof (the “Guarantees”) are senior secured obligations of the Company and the Subsidiary Guarantors and rank equally in right of payment with all of the Company’s and the Subsidiary Guarantors’ existing and future senior obligations, and senior to all of the Company’s and the Subsidiary Guarantors’ future subordinated indebtedness. Th e 6.375% Notes are secured by a fi rst-priority lien on substantially all of the assets of the Company and the Subsidiary Guarantors, subject to certain exceptions. Th e 6.375% Notes and the Guarantees are pari passu with respect to security and in right of payment with all of the Company’s and the Subsidiary Guarantors’ existing and future secured indebtedness under the New Senior Secured Credit Agreement (as defi ned below). Th e 6.375% Notes are structurally subordinated to all of the liabilities and preferred stock of each of the Company’s insurance subsidiaries, which are not guarantors of the 6.375% Notes.
Th e Company may redeem all or part of the 6.375% Notes beginning on October 1, 2015, at the redemption prices set forth in the 6.375% Indenture. Th e Company may also redeem all or part of the 6.375% Notes at any time and from time to time prior to October 1, 2015, at a price equal to 100% of the aggregate principal amount of the 6.375% Notes to be redeemed, plus a “make-whole” premium and accrued and unpaid interest to, but not including, the redemption date. In addition, prior to October 1, 2015, the Company may redeem up to 35% of the aggregate principal amount of the 6.375% Notes with the net cash proceeds of certain equity off erings at a price equal to 106.375% of the aggregate principal amount of the 6.375% Notes to be redeemed, plus accrued and unpaid interest to, but not including, the redemption date.
Upon the occurrence of a Change of Control (as defi ned in the 6.375% Indenture), each holder of the 6.375% Notes may require the Company to repurchase all or a portion of the 6.375% Notes in cash at a price equal to 101% of the aggregate principal amount of the 6.375% Notes to be repurchased, plus accrued and unpaid interest, if any, to, but not including, the date of repurchase.
Th e 6.375% Indenture contains covenants that, among other things, limit (subject to certain exceptions) the Company’s ability and the ability of the Company’s Restricted Subsidiaries (as defi ned in the 6.375% Indenture) to:
• incur or guarantee additional indebtedness or issue preferred stock; • pay dividends or make other distributions to shareholders; • purchase or redeem capital stock or subordinated indebtedness; • make investments; • create liens; • incur restrictions on the Company’s ability and the ability of its Restricted Subsidiaries to pay dividends or make other payments to the Company; • sell assets, including capital stock of the Company’s subsidiaries; • consolidate or merge with or into other companies or transfer all or substantially all of the Company’s assets; and • engage in transactions with affi liates.
Th e 6.375% Indenture provides for customary events of default (subject in certain cases to customary grace and cure periods), which include nonpayment, breach of covenants in the 6.375% Indenture, failure to pay at maturity or acceleration of other indebtedness, a failure to pay certain judgments and certain events of bankruptcy and insolvency. Generally, if an event of default occurs, the Trustee or holders of at least 25% in principal amount of the then outstanding 6.375% Notes may declare the principal of and accrued but unpaid interest, including any additional interest, on all of the 6.375% Notes to be due and payable.
Under the 6.375% Indenture, the Company can make Restricted Payments (as such term is defi ned in the 6.375% Indenture) up to a calculated limit, provided that the Company’s pro forma risk-based capital ratio exceeds 225% after giving eff ect to the Restricted Payment and certain other conditions are met. Restricted Payments include, among other

CNO FINANCIAL GROUP, INC. - Form 10-K 144
PART II ITEM 8 Consolidated Financial Statements
items, repurchases of common stock and cash dividends on common stock (to the extent such dividends exceed $30 million in the aggregate in any calendar year). Restricted payments do not include cash paid to purchase our outstanding 7% Debentures pursuant to the tender off er we announced on February 11, 2013, as further described in the note to the consolidated fi nancial statements entitled “Subsequent Event”.
Th e limit of Restricted Payments permitted under the 6.375% Indenture is the sum of (x) 50% of the Company’s “Net Excess Cash Flow” (as defi ned in the 6.375% Indenture) for the period (taken as one accounting period) from July 1, 2012 to the end of the Company’s most recently ended fi scal quarter for which fi nancial statements are available at the time of such Restricted Payment, (y) $175.0 million and (z) certain other amounts specifi ed in the 6.375% Indenture. Based on the provisions set forth in the 6.375% Indenture and the Company’s Net Excess Cash Flow for the period from July 1, 2012 through December 31, 2012, the Company could have made additional Restricted Payments under this 6.375% Indenture covenant of approximately $212 million as of December 31, 2012. Th is limitation on Restricted Payments does not apply if the Debt to Total Capitalization Ratio (as defi ned in the 6.375% Indenture) as of the last day of the Company’s most recently ended fi scal quarter for which fi nancial statements are available that immediately precedes the date of any Restricted Payment, calculated immediately after giving eff ect to such Restricted Payment and any related transactions on a pro forma basis, is equal to or less than 17.5%.
In connection with the issuance of the 6.375% Notes and execution of the 6.375% Indenture, the Company and the Subsidiary Guarantors entered into a security agreement, dated as of September 28, 2012 (the “Security Agreement”), by and among the Company, the Subsidiary Guarantors and the Collateral Agent, pursuant to which the Company and the Subsidiary Guarantors pledged substantially all of their assets to secure their obligations under the 6.375% Notes and the 6.375% Indenture, subject to certain exceptions as set forth in the Security Agreement.
New Senior Secured Credit Agreement
On September 28, 2012, the Company entered into a new senior secured credit agreement, providing for: (i) a $425.0 million six-year term loan facility; (ii) a $250.0 million four-year term loan facility; and (iii) a $50.0 million three-year revolving credit facility, with JPMorgan Chase Bank, N.A., as administrative agent (the “Agent”), and the lenders from time to time party thereto (the “New Senior Secured Credit Agreement”). Th e New Senior Secured Credit Agreement is guaranteed by the Subsidiary Guarantors and secured by a fi rst-priority lien (which ranks pari passu with the liens securing the 6.375% Notes) on substantially all of the Company’s and the Subsidiary Guarantors’ assets. As of December 31, 2012, the Company had borrowed in full the amounts available under each of the term loan facilities and no amounts have been borrowed under the revolving credit facility. Th e net proceeds from the New Senior Secured Credit Agreement, together with the net proceeds from the 6.375% Notes, were used to repay other outstanding indebtedness, as further described below, and for general corporate purposes.
Th e revolving credit facility includes an uncommitted subfacility for swingline loans of up to $5.0 million, and up to $5.0 million of the revolving credit facility is available for the issuance of letters of credit. Th e six-year term loan facility will amortize in quarterly installments in amounts resulting in an annual amortization of 1% and the four-year
term loan facility will amortize in quarterly installments resulting in an annual amortization of 20% during the fi rst and second years and 30% during the third and fourth years. Subject to certain conditions, the Company may incur additional incremental loans under the New Senior Secured Credit Agreement in an amount of up to $250.0 million.
Mandatory prepayments of the New Senior Secured Credit Agreement will be required, subject to certain exceptions, in an amount equal to: (i) 100% of the net cash proceeds from certain asset sales or casualty events; (ii) 100% of the net cash proceeds received by the Company or any of its restricted subsidiaries from certain debt issuances; and (iii) 100% of the amount of certain restricted payments made (including any common stock dividends and share repurchases) as defi ned in the New Senior Secured Credit Agreement provided that if, as of the end of the fi scal quarter immediately preceding such restricted payment, the debt to total capitalization ratio is: (x) equal to or less than 22.5%, but greater than 17.5%, the prepayment requirement shall be reduced to 33.33%; or (y) equal to or less than 17.5%, the prepayment requirement shall not apply.
Notwithstanding the foregoing, no mandatory prepayments pursuant to item (i) in the preceding paragraph shall be required if: (x) the debt to total capitalization ratio is equal or less than 20% and (y) either (A) the fi nancial strength rating of certain of the Company’s insurance subsidiaries is equal or better than A- (stable) from A.M. Best Company (“A.M. Best”) or (B) the New Senior Secured Credit Agreement is rated equal or better than BBB- (stable) from S&P and Baa3 (stable) by Moody’s.
In 2012, as required under the terms of the New Senior Secured Credit Agreement, we made mandatory prepayments of $28.4 million due to repurchases of our common stock and payment of a common stock dividend. We also made an additional payment of $2.0 million to cover the remaining portion of the scheduled term loan installment.
Th e interest rates with respect to loans under: (i) the six-year term loan facility will be, at the Company’s option, equal to a eurodollar rate, plus 3.75% per annum, or a base rate, plus 2.75% per annum, subject to a eurodollar rate “fl oor” of 1.25% and a base rate “fl oor” of 2.25% (such rate was 5.0% at December 31, 2012); (ii) the four-year term loan facility will be, at the Company’s option, equal to a eurodollar rate, plus 3.25% per annum, or a base rate, plus 2.25% per annum, subject to a eurodollar rate “fl oor” of 1.00% and a base rate “fl oor” of 2.00% (such rate was 4.25% at December 31, 2012); and (iii) the revolving credit facility will be, at the Company’s option, equal to a eurodollar rate, plus 3.50% per annum, or a base rate, plus 2.50% per annum, in each case, with respect to revolving credit facility borrowings only, subject to certain step-downs based on the debt to total capitalization ratio of the Company.
Th e New Senior Secured Credit Agreement contains covenants that limit the Company’s ability to take certain actions and perform certain activities, including (each subject to exceptions as set forth in the New Senior Secured Credit Agreement):
• limitations on debt (including, without limitation, guarantees and other contingent obligations); • limitations on issuances of disqualifi ed capital stock; • limitations on liens and further negative pledges; • limitations on sales, transfers and other dispositions of assets; • limitations on transactions with affi liates;

CNO FINANCIAL GROUP, INC. - Form 10-K 145
PART II ITEM 8 Consolidated Financial Statements
• limitations on changes in the nature of the Company’s business; • limitations on mergers, consolidations and acquisitions; • limitations on dividends and other distributions, stock repurchases and redemptions and other restricted payments; • limitations on investments and acquisitions; • limitations on prepayment of certain debt; • limitations on modifi cations or waivers of certain debt documents and charter documents; • investment portfolio requirements for insurance subsidiaries; • limitations on restrictions aff ecting subsidiaries; • limitations on holding company activities; and • limitations on changes in accounting policies.
In addition, the New Senior Secured Credit Agreement requires the Company to maintain (each as calculated in accordance with the New Senior Secured Credit Agreement): (i) a debt to total capitalization ratio of not more than 27.5 percent (such ratio was 20.9 percent at December 31, 2012); (ii) an interest coverage ratio of not less than 2.50 to 1.00 for each rolling four quarters (or, if less, the number of full fi scal quarters commencing after the eff ective date of the New Senior Secured Credit Agreement) (such ratio was 8.08 to 1.00 for the period ended December 31, 2012); (iii) an aggregate ratio of total adjusted capital to company action level risk-based capital for the Company’s insurance subsidiaries of not less than 250 percent (such ratio was 367 percent at December 31, 2012); and (iv) a combined statutory capital and surplus for the Company’s insurance subsidiaries of at least $1,300.0 million (combined statutory capital and surplus at December 31, 2012, was $1,782.6 million).
Th e New Senior Secured Credit Agreement provides for customary events of default (subject in certain cases to customary grace and cure periods), which include nonpayment, incorrectness of any representation or warranty in any material respect, breach of covenants in the New Senior Secured Credit Agreement or other loan documents, cross default to certain other indebtedness, certain events of bankruptcy and insolvency, certain ERISA events, a failure to pay certain judgments, certain material regulatory events, the occurrence of a change of control, and the invalidity of any material provision of any loan document or material lien or guarantee granted under the loan documents. I f an event of default under the New Senior Secured Credit Agreement occurs and is continuing, the Agent may accelerate the amounts and terminate all commitments outstanding under the New Senior Secured Credit Agreement and may exercise remedies in respect of the collateral.
In connection with the execution of the New Senior Secured Credit Agreement, the Company and the Subsidiary Guarantors entered into a guarantee and security agreement, dated as of September 28, 2012 (the “Guarantee and Security Agreement”), by and among the Company, the Subsidiary Guarantors and the Agent, pursuant to which the Subsidiary Guarantors guaranteed all of the obligations of the Company under the New Senior Secured Credit Agreement and the Company and the Subsidiary Guarantors pledged substantially all of their assets to secure the New Senior Secured Credit Agreement, subject to certain exceptions as set forth in the Guarantee and Security Agreement.
Pari Passu Intercreditor Agreement
In connection with the issuance of the 6.375% Notes and entry into the New Senior Secured Credit Agreement, the Agent and the Collateral Agent, as authorized representative with respect to the 6.375% Notes, entered into a Pari Passu Intercreditor Agreement, dated as of September 28, 2012 (the “Intercreditor Agreement”), which sets forth agreements with respect to the fi rst-priority liens granted by the Company and the Subsidiary Guarantors pursuant to the 6.375% Indenture and the New Senior Secured Credit Agreement.
Under the Intercreditor Agreement, any actions that may be taken with respect to the collateral that secures the 6.375% Notes and the New Senior Secured Credit Agreement, including the ability to cause the commencement of enforcement proceedings against such collateral, to control such proceedings and to approve amendments to releases of such collateral from the lien of, and waive past defaults under, such documents relating to such collateral, will be at the direction of the authorized representative of the lenders under the New Senior Secured Credit Agreement until the earliest of: (i) the Company’s obligations under the New Senior Secured Credit Agreement (or refi nancings thereof ) are discharged; (ii) the earlier of (x) the date on which the outstanding principal amount of loans and commitments under the New Senior Secured Credit Agreement is less than $25.0 million and (y) the date on which the outstanding principal amount of another tranche of fi rst-priority indebtedness exceeds the principal amount of loans and commitments under the New Senior Secured Credit Agreement; and (iii) 180 days after the occurrence of both an event of default under the 6.375% Indenture and the authorized representative of the holders of the New Notes making certain representations as described in the Intercreditor Agreement, unless the authorized representative of the lenders under the New Senior Secured Credit Agreement has commenced and is diligently pursuing enforcement action with respect to the collateral or the grantor of the security interest in that collateral (whether the Company or the applicable Subsidiary Guarantor) is then a debtor under or with respect to (or otherwise subject to) any insolvency or liquidation proceeding.
9.0% Notes
On December 21, 2010, we issued $275.0 million aggregate principal amount of 9.0% Notes. Th e net proceeds of $267.0 million were used to repay certain indebtedness. Th e Company could redeem all or part of the 9.0% Notes at any time and from time to time prior to January 15, 2014, at a price equal to 100% of the aggregate principal amount of the 9.0% Notes to be redeemed plus a “make-whole” premium and accrued and unpaid interest.
On September 28, 2012, the Company completed the cash tender off er for $273.8 million aggregate principal amount of the 9.0% Notes and received consents from such holders to proposed amendments to the indenture governing the 9.0% Notes (the “9.0% Indenture”). In addition, on September 28, 2012 (the “Initial Payment Date”), the Company, the Subsidiary Guarantors and Wilmington Trust, National Association (as successor by merger to Wilmington Trust FSB), as trustee, executed a fi rst supplemental indenture to the 9.0% Indenture (the “Supplemental Indenture”) that eliminated substantially all of the restrictive covenants contained in the 9.0% Indenture and certain events of default and related provisions. Th e Supplemental Indenture became

CNO FINANCIAL GROUP, INC. - Form 10-K 146
PART II ITEM 8 Consolidated Financial Statements
eff ective upon execution, and the amendments to the 9.0% Indenture became operative on the Initial Payment Date upon acceptance of and payment for the tendered 9.0% Notes by the Company.
On the Initial Payment Date, the Company paid an aggregate of $326.3 million (using a portion of the net proceeds from its off ering of the 6.375% Notes, together with borrowings under the New Senior Secured Credit Agreements) in order to purchase the 9.0% Notes tendered prior to the Initial Payment Date (representing, in the aggregate, tender off er consideration of approximately $313.1 million, consent payments of approximately $8.2 million and accrued and unpaid interest to, but not including, the Initial Payment Date of approximately $5.0 million).
On September 28, 2012, the Company: (i) issued a notice of redemption to holders of the remaining $1.2 million aggregate principal amount of 9.0% Notes that were not tendered and remained outstanding following the Company’s initial acceptance of and payments for the 9.0% Notes tendered in the tender off er prior to the Initial Payment Date; and (ii) deposited with the trustee of the 9.0% Notes suffi cient funds to satisfy and discharge the 9.0% Indenture and to fund the make-whole redemption of the remaining outstanding 9.0% Notes and to pay accrued and unpaid interest on the redeemed notes to, but not including, the October 29, 2012 redemption date. Upon the satisfaction and discharge of the 9.0% Indenture, all of the collateral securing the 9.0% Notes was released and any remaining restrictive covenants and certain additional events of default contained in the 9.0% Indenture (as amended by the Supplemental Indenture) ceased to have eff ect. Th e remaining $1.2 million of 9.0% Notes were redeemed on October 29, 2012.
7.0% Debentures
On November 13, 2009, we issued $176.5 million aggregate principal amount of our 7.0% Debentures in the initial closing of our private off ering of 7.0% Debentures to Morgan Stanley & Co. Incorporated, as the initial purchaser of the 7.0% Debentures. Th e net proceeds from the initial closing of the off ering of our 7.0% Debentures, after deducting the initial purchaser’s discounts and commissions and before other off ering expenses, totaled $172.0 million. Th e Company used the net proceeds to fund a substantial portion of the consideration payable in connection with a cash tender off er for the 3.5% Convertible Debentures due September 30, 2035 (the “3.5% Debentures”).
In February 2010, we completed a second closing of $64.0 million aggregate principal amount of our 7.0% Debentures and in May 2010, we completed a third closing of $52.5 million aggregate principal amount of our 7.0% Debentures. Th ese issuances were made pursuant to the purchase agreement that we entered into in October 2009 relating to the private off ering of up to $293 million of 7.0% Debentures. We received aggregate net proceeds (after taking into account the discounted off ering price less the initial purchaser’s discounts and commissions, but before expenses) of: (i) $61.4 million in the second closing of the 7.0% Debentures; and (ii) $49.4 million in the third closing of the 7.0% Debentures. At December 31, 2012 and 2011, unamortized issuance costs (classifi ed as other assets) related to the 7.0% Debentures were $.4 million and $1.6 million, respectively, and are amortized as an increase to interest expense over the term of the 7.0% Debentures.
Th e 7.0% Debentures rank equally in right of payment with all of the Company’s unsecured and unsubordinated obligations. Th e 7.0% Debentures are governed by an Indenture dated as of October 16, 2009
(the “7.0% Indenture”) between the Company and Th e Bank of New York Mellon Trust Company, N.A., as trustee (“Mellon”). Th e 7.0% Debentures bear interest at a rate of 7.0% per annum, payable semi-annually on June 30 and December 30 of each year, commencing on the interest payment date immediately succeeding the issuance date of such series. Th e 7.0% Debentures will mature on December 30, 2016, unless earlier converted. Th e 7.0% Debentures may not be redeemed at the Company’s election prior to the stated maturity date and the holders may not require the Company to repurchase the 7.0% Debentures at any time. Th e 7.0% Debentures are not convertible prior to June 30, 2013, except under limited circumstances. Commencing on June 30, 2013, the 7.0% Debentures will be convertible into shares of our common stock at the option of the holder at any time, subject to certain exceptions and subject to our right to terminate such conversion rights under certain circumstances relating to the sale price of our common stock. If the holders elect to convert their 7.0% Debentures upon the occurrence of certain changes of control of CNO or certain other events, we will be required, under certain circumstances, to increase the conversion rate for such holders of the 7.0% Debentures who convert in connection with such events. Initially, the 7.0% Debentures will be convertible into 182.1494 shares of our common stock for each $1,000 principal amount of 7.0% Debentures, which is equivalent to an initial conversion price of approximately $5.49 per share. Th e conversion rate is subject to adjustment following the occurrence of certain events (including the payment of dividends on our common stock) in accordance with the terms of the 7.0% Indenture.
Th e 7.0% Indenture provides for customary events of default (subject in certain cases to customary grace and cure periods), which include nonpayment, breach of covenants in the 7.0% Indenture, failure to pay at maturity or acceleration of other indebtedness and certain events of bankruptcy and insolvency. Generally, if an event of default occurs, Mellon or holders of at least 50% in principal amount of the then outstanding 7.0% Debentures may declare the principal of, and accrued but unpaid interest on all of the 7.0% Debentures to be immediately due and payable.
Th e 7.0% Indenture provides that on and after the date of the 7.0% Indenture, the Company may not: (i) consolidate with or merge into any other person or sell, convey, lease or transfer the Company’s consolidated properties and assets substantially as an entirety to any other person in any one transaction or series of related transactions; or (ii) permit any person to consolidate with or merge into the Company, unless certain requirements set forth in the 7.0% Indenture are satisfi ed.
In accordance with GAAP, we were required to consider on each issuance date whether the 7.0% Debentures issued on such date were issued with a benefi cial conversion feature. A benefi cial conversion feature exists if the 7.0% Debentures may be convertible into common stock at an eff ective conversion price (calculated by dividing the proceeds from the issuance of 7.0% Debentures issued on that date (per $1,000 principal amount of debentures) by the then eff ective conversion rate) that is lower than the market price of a share of common stock on the date of issuance. When a benefi cial conversion feature exists, we are required to separately recognize the benefi cial conversion feature at issuance by allocating a portion of the proceeds to the intrinsic value of that feature. Th e value of the benefi cial conversion feature is recorded, net of taxes, as an increase to additional paid-in capital. If a benefi cial conversion feature exists on the actual date(s) of issuance, a discount equal to the intrinsic value of the benefi cial conversion feature will be recorded against the carrying value of the 7.0% Debentures.

CNO FINANCIAL GROUP, INC. - Form 10-K 147
PART II ITEM 8 Consolidated Financial Statements
Such discount will be amortized from the actual date(s) of issuance to the stated maturity date of the 7.0% Debentures using the eff ective interest method. Accordingly, the interest expense we recognize related to the 7.0% Debentures will be dependent upon whether a benefi cial conversion feature existed on the actual date(s) of issuance and the amount by which the market price(s) of our common stock exceeded the eff ective conversion price on such actual date(s) of issuance.
Th e closing market price of our common stock on May 4, 2010 (the last closing price prior to the issuance of $52.5 million of the 7.0% Debentures) was $5.81. Because this amount was higher than the eff ective conversion price of $5.17 on that date, a benefi cial conversion feature existed with respect to the 7.0% Debentures we issued. Th e benefi cial conversion feature related to the 7.0% Debentures issued on May 5, 2010 of $4.0 million, net of tax, was recorded as an increase to additional paid-in capital.
On September 4, 2012, the Company entered into a Debenture Repurchase Agreement (the “Debenture Repurchase Agreement”) with Paulson Credit Opportunities Master Ltd. and Paulson Recovery Master Fund Ltd. (collectively, the “Paulson Holders”), funds managed by Paulson & Co. Inc., that held $200.0 million in aggregate principal amount of the Company’s 7.0% Debentures. Pursuant to the Debenture Repurchase Agreement, the Company purchased from each of the Paulson Holders the 7.0% Debentures held by such Paulson Holders, for a cash purchase price of $355.1 million that provided for a 2.8% discount to the estimated fair market value of the 7.0% Debentures as defi ned in the Debenture Repurchase Agreement.
As further described in the note to the consolidated fi nancial statements entitled “Subsequent Event”, we commenced a cash tender off er in February 2013 for the remaining $93.0 million aggregate principal amount of 7.0% Debentures that were outstanding.
Previous Senior Secured Credit Agreement
On December 21, 2010, the Company entered into a $375 million senior secured term loan facility maturing on September 30, 2016, pursuant to an agreement among the Company, Morgan Stanley Senior Funding, Inc., as administrative agent, and the lenders from time to time party thereto (the “Previous Senior Secured Credit Agreement”). Th e net proceeds of $363.6 million were used to repay certain indebtedness. Th e pricing terms for the Previous Senior Secured Credit Agreement included upfront fees of 1.25 percent paid to the lenders. Th e Previous Senior Secured Credit Agreement was guaranteed by our primary non-insurance company subsidiaries and secured by substantially all of our and the subsidiary guarantors’ assets.
In May 2011, we amended our Previous Senior Secured Credit Agreement. Pursuant to the amended terms, the applicable interest rate on the Previous Senior Secured Credit Agreement was decreased. Th e new interest rate was, at our option (in most instances): (i) a Eurodollar rate of LIBOR plus 5.00 percent subject to a LIBOR “fl oor” of 1.25 percent (previously LIBOR plus 6.00 percent with a LIBOR fl oor of 1.50 percent); or (ii) a Base Rate plus 4.00 percent subject to a Base Rate “fl oor” of 2.25 percent (previously a Base Rate plus 5.00 percent with a Base Rate fl oor of 2.50 percent).
In 2011, as required under the terms of the Previous Senior Secured Credit Agreement, we made mandatory prepayments totaling $69.8 million
due to our repurchase of $69.8 million of our common stock. In March 2011, we also made a voluntary prepayment of $50.0 million on our outstanding principal balance under the Previous Senior Secured Credit Agreement using available cash.
In September 2012, the Company used a portion of the net proceeds from its off ering of the 6.375% Notes, together with borrowings under the New Senior Secured Credit Agreement to repay the remaining $223.8 million principal amount outstanding under its Previous Senior Secured Credit Agreement.
Also, in the fi rst nine months of 2012, as required under the terms of the Previous Senior Secured Credit Agreement, we made mandatory prepayments of $31.4 million due to repurchases of our common stock and payment of a common stock dividend.
In December 2010, we repaid the $652.1 million outstanding principal balance under a prior senior credit agreement using: (i) the proceeds from the Previous Senior Secured Credit Agreement and the issuance of the 9.0% Notes; and (ii) available cash.
Senior Health Note
In connection with the Transfer, the Company issued the Senior Health Note payable to Senior Health. Th e Senior Health Note was unsecured and had an interest rate of 6.0 percent payable quarterly, beginning on March 15, 2009. We were required to make annual principal payments of $25.0 million beginning on November 12, 2009. Th e Company made a $25.0 million scheduled payment on the Senior Health Note in 2011, 2010 and 2009. In March 2012, we paid in full the remaining $50.0 million principal balance on the Senior Health Note, which had been scheduled to mature in November 2013. Th e repayment in full of the Senior Health Note removed the previous restriction on our ability to pay cash dividends on our common stock.
Loss on Extinguishment of Debt
In 2012, we recognized a loss on extinguishment of debt totaling $200.2 million consisting of:
(i) $136.5 million due to our repurchase of $200.0 million principal amount of 7.0% Debentures pursuant to the Debenture Repurchase Agreement described above and the write-off of unamortized discount and issuance costs associated with the 7.0% Debentures. Additional paid-in capital was also reduced by $24.0 million to extinguish the benefi cial conversion feature associated with a portion of the 7.0% Debentures that were repurchased. As the Code limits the deduction to taxable income for losses on the redemption of convertible debt, a minimal tax benefi t was recognized related to the repurchase of the 7.0% Debentures;
(ii) $58.2 million related to the tender off er and consent solicitation for the 9.0% Notes; the write-off of unamortized issuance costs related to the 9.0% Notes; and other transaction costs;
(iii) $5.1 million representing the write-off of unamortized discount and issuance costs associated with repayments of our Previous Senior Secured Credit Agreement; and
(iv) $.4 million representing the write-off of unamortized discount and issuance costs associated with payments on our New Senior Secured Credit Agreement.

CNO FINANCIAL GROUP, INC. - Form 10-K 148
PART II ITEM 8 Consolidated Financial Statements
In 2011, we recognized an aggregate loss on the extinguishment of debt totaling $3.4 million representing the write-off of unamortized discount and issuance costs associated with repayments of the Previous Senior Secured Credit Agreement.
In 2010, we recognized an aggregate loss on the extinguishment of debt totaling $6.8 million representing the write-off of unamortized discount and issuance costs associated with: (i) the repurchases of 3.5% Debentures; and (ii) the repayment of a prior senior credit agreement, each as previously described above.
Scheduled Repayment of our Direct Corporate Obligations
Th e scheduled repayment of our direct corporate obligations was as follows at December 31, 2012 (dollars in millions):
Year ending December 31,2013 $ 51.12014 60.52015 79.22016 153.52017 4.2Th ereafter 664.1
$ 1,012.6
NOTE 7 LITIGATION AND OTHER LEGAL PROCEEDINGS
Legal Proceedings
Th e Company and its subsidiaries are involved in various legal actions in the normal course of business, in which claims for compensator y and punitive damages are asserted, some for substantial amounts. We recognize an estimated loss from these loss contingencies when we believe it is probable that a loss has been incurred and the amount of the loss can be reasonably estimated. Some of the pending matters have been fi led as purported class actions and some actions have been fi led in certain jurisdictions that permit punitive damage awards that are disproportionate to the actual damages incurred. Th e amounts sought in certain of these actions are often large or indeterminate and the ultimate outcome of certain actions is diffi cult to predict. In the event of an adverse outcome in one or more of these matters, there is a possibility that the ultimate liability may be in excess of the liabilities we have established and could have a material adverse eff ect on our business, fi nancial condition, results of operations and cash fl ows. In addition, the resolution of pending or future litigation may involve modifi cations to the terms of outstanding insurance policies or could impact the timing and amount of rate increases, which could adversely aff ect the future profi tability of the related insurance policies. Based upon information presently available, and in light of legal, factual and other defenses available to the Company and its subsidiaries, the Company does not believe that it is probable that the ultimate liability from either pending or threatened legal actions, after consideration of existing loss provisions, will have a material adverse eff ect on the Company’s consolidated fi nancial condition, operating results or cash fl ows. However, given the inherent diffi culty in predicting the outcome of legal proceedings, there exists the possibility such legal actions could have a material adverse eff ect on the Company’s consolidated fi nancial condition, operating results or cash fl ows.
In addition to the inherent diffi culty of predicting litigation outcomes, particularly those that will be decided by a jury, many of the matters specifi cally identifi ed below purport to seek substantial or an unspecifi ed amount of damages for unsubstantiated conduct spanning several years
based on complex legal theories and damages models. Th e alleged damages typically are indeterminate or not factually supported in the complaint, and, in any event, the Company’s experience indicates that monetary demands for damages often bear little relation to the ultimate loss. In some cases, plaintiff s are seeking to certify classes in the litigation and class certifi cation either has been denied or is pending and we have fi led oppositions to class certifi cation or sought to decertify a prior class certifi cation. In addition, for many of these cases: (i) there is uncertainty as to the outcome of pending appeals or motions; (ii) there are signifi cant factual issues to be resolved; and/or (iii) there are novel legal issues presented. Accordingly, the Company can not reasonably estimate the possible loss or range of loss in excess of amounts accrued, if any, or predict the timing of the eventual resolution of these matters. Th e Company reviews these matters on an ongoing basis. When assessing reasonably possible and probable outcomes, the Company bases its assessment on the expected ultimate outcome following all appeals.
Cost of Insurance Litigation
Valulife/Valuterm Litigation
On March 4, 2008, a complaint was fi led in the United States District Court for the Central District of California, Celedonia X. Yue, M. D. on behalf of the class of all others similarly situated, and on behalf of the General Public v. Conseco Life Insurance Company, successor to Philadelphia Life Insurance Company and formerly known as Massachusetts General Life Insurance Company, Cause No. CV08-01506 CAS. Plaintiff in this putative class action owns a Valulife universal life policy insuring the life of Ruth S. Yue originally issued by Massachusetts General Life Insurance Company in 1995. Plaintiff is claiming breach of contract on behalf of the proposed national class and seeks injunctive and restitutionary relief pursuant to California Business & Professions Code Section 17200 and declaratory relief. Th e putative class consists of all

CNO FINANCIAL GROUP, INC. - Form 10-K 149
PART II ITEM 8 Consolidated Financial Statements
owners of Valulife and Valuterm universal life insurance policies issued by either Massachusetts General or Philadelphia Life and that were later acquired and serviced by Conseco Life. Plaintiff alleges that members of the class will be damaged by increases in the cost of insurance (a non-guaranteed element (“NGE”)) that are set to take place in the twenty fi rst policy year of Valulife and Valuterm policies. At the time plaintiff fi led her complaint, no such increases had yet been applied to the subject policies. During 2010, Conseco Life voluntarily agreed not to implement the cost of insurance rate increase at issue in this litigation and is following a process with respect to any future cost of insurance rate increases as set forth in the regulatory settlement agreement described below under the caption entitled “Regulatory Examinations and Fines”. Plaintiff fi led a motion for certifi cation of a nationwide class and a California state class. On December 7, 2009, the court granted that motion. On October 8, 2010, the court dismissed the causes of actions alleged in the California state class. On January 19, 2011, the court granted the plaintiff ’s motion for summary judgment as to the declaratory relief claim and on February 2, 2011, the court issued an advisory opinion, in the form of a declaratory judgment, as to what, in its view, Conseco Life could consider in implementing future cost of insurance rate increases related to its Valulife and Valuterm block of policies. Conseco Life is appealing the court’s January 19, 2011 decision and the plaintiff is appealing the court’s decision to dismiss the California causes of action. Th ese appeals are pending. We believe this case is without merit and intend to defend it vigorously.
On November 15, 2011, a second complaint was fi led by Dr. Yue in the United States District Court for the Central District on California, Celedonia X. Yue, M. D. on behalf of the class of all others similarly situated, and on behalf of the General Public v. Conseco Life Insurance Company, Cause No. CV11-9506 AHM (SHx), involving the same Valulife universal life policy described in the preceding paragraph. Plaintiff , for herself and on behalf of proposed members of a national class and a California class is claiming breach of contract, injunctive and restitutionary relief pursuant to California Business & Professions Code Section 17200, breach of the covenant of good faith and fair dealing, declaratory relief, and temporary, preliminary, and permanent injunctive relief. Th e putative class consists of all owners and former owners of Valulife and Valuterm universal life insurance policies issued by either Massachusetts General or Philadelphia Life and that were later acquired and serviced by Conseco Life. Plaintiff alleges that members of the classes will be damaged by increases in the cost of insurance (a NGE) that took place on or about November 1, 2011. Plaintiff fi led a motion for a preliminary injunction and a motion for certifi cation of a California class. On April 2, 2012, the court granted the plaintiff ’s motions, which Conseco Life is appealing. Pending the outcome of that appeal, Conseco Life is preliminarily enjoined from imposing the 2011 increase in the cost of insurance on the members of the California class. Plaintiff also fi led a motion on March 20, 2012 for certifi cation of a nationwide class.
Conseco Life has agreed to a settlement with the plaintiff in the litigation described in the two preceding paragraphs, which would, upon court approval, resolve those cases as well as the Nicholas litigation described below. On January 25, 2013, the parties fi led a stipulation of settlement and joint motion for preliminary approval of proposed nationwide class settlement and certifi cation of settlement classes. Th e court set the hearing for preliminary approval of the settlement for February 25, 2013. Th e settlement includes a reduction in the cost of
insurance increase implemented by Conseco Life in November 2011 and certain policy benefi t enhancements. Final approval of the settlement is subject to a court fairness hearing after notice to the policyholders covered by the settlement, as well as other conditions.
On February 6, 2012, a complaint was fi led in the United States District Court for the Northern District of Illinois, Daniel B. Nicholas, on behalf of himself and all others similarly situated v. Conseco Life Insurance Company, Cause No. 12cv845. Plaintiff in this putative class action owns a Valulife universal life policy insuring Plaintiff ’s life originally issued by Massachusetts General Life Insurance Company (now Conseco Life Insurance Company) in 1991. Plaintiff is claiming breach of contract on behalf of the proposed national class and seeks declaratory, injunctive, and supplemental relief. Th e putative class consists of all persons who own or have owned one or more universal life policies issued by Conseco Life which provide that the cost of insurance rates will be determined based upon expectations as to future mortality experience and who have experienced an increase in the cost of insurance rates. On April 20, 2012, we announced that Conseco Life had reached a tentative settlement in the Nicholas case. Venue of this case was subsequently transferred to the United States District Court for the Central District of California. Th e settlement described in the preceding paragraph would, if approved, resolve the Nicholas case.
In connection with the tentative settlement in the Nicholas litigation, the Company recorded a pre-tax charge of approximately $20 million in its Other CNO Business segment for the quarter ended March 31, 2012. Th e Company recorded an additional pre-tax charge of $21 million in its Other CNO Business segment for the quarter ended September 30, 2012 relating to the settlement agreement described above in the Yue litigation. Th e liability the Company has established related to these cases includes its best estimates of the costs of implementing the settlement, if fi nalized and approved by the court. While the Company believes its estimates are adequate to cover these costs, the estimates are subject to signifi cant judgment and it is possible that the estimates will prove insuffi cient to cover the actual costs.
Lifetrend Litigation
On December 24, 2008, a purported class action was fi led in the U.S. District Court for the Northern District of California, Cedric Brady, et. al. individually and on behalf of all other similar ly situated v. Conseco, Inc. and Conseco Life Insurance Company Case No. 3:08-cv-05746. Th e plaintiff s allege that Conseco Life and Conseco, Inc. committed breach of contract and insurance bad faith and violated various consumer protection statutes in the administration of various interest sensitive whole life products sold primarily under the name “Lifetrend” by requiring the payment of additional cash amounts to maintain the policies in force and by making changes to certain NGEs in their policies. On April 23, 2009, the plaintiff s fi led an amended complaint adding the additional counts of breach of fi duciary duty, fraud, negligent misrepresentation, conversion and declaratory relief. On May 29, 2009, Conseco, Inc. and Conseco Life fi led a motion to dismiss the amended complaint. On July 29, 2009, the court granted in part and denied in part the motion to dismiss. Th e court dismissed the allegations that Conseco Life violated various consumer protection statutes, the breach of fi duciary duty count, and dismissed Conseco, Inc. for lack of personal jurisdiction.

CNO FINANCIAL GROUP, INC. - Form 10-K 150
PART II ITEM 8 Consolidated Financial Statements
On July 2, 2009, a purported class action was fi led in the U.S. District Court for the Middle District of Florida, Bill W. McFarland, and all those similarly situated v. Conseco Life Insurance Company, Case No. 3:09-cv-598-J-32MCR. Th e plaintiff alleges that Conseco Life committed breach of contract and has been unjustly enriched in the administration, including changes to certain NGEs, of various interest sensitive whole life products sold primarily under the name “Lifetrend.” Th e plaintiff seeks declaratory and injunctive relief, compensatory damages, punitive damages and attorney fees.
Conseco Life fi led a motion with the Judicial Panel on Multidistrict Litigation (“MDL”), seeking the establishment of an MDL proceeding consolidating the Brady case and the McFarland case into a single action. On February 3, 2010, the Judicial Panel on MDL ordered these cases be consolidated for pretrial proceedings in the Northern District of California Federal Court. On July 7, 2010, plaintiff s fi led an amended motion for class certifi cation of a nationwide class and a California state class. On October 6, 2010, the court granted the motion for certifi cation of a nationwide class and denied the motion for certifi cation of a California state class. Conseco Life fi led a motion to decertify the nationwide class on July 1, 2011. On December 20, 2011, the court issued an order denying Conseco Life’s motion to decertify the class as to current policyholders, but granted the motion to decertify as to former policyholders. On March 5, 2012, the plaintiff s fi led a motion for a preliminary injunction requesting that the court enjoin Conseco Life from imposing increased cost of insurance charges until trial with regard to 157 members of the class, and on July 17, 2012, the court granted a preliminary injunction as to 100 members of the class and denied the plaintiff ’s motion for a preliminary injunction as to the other 57 members. Subsequently, the plaintiff s fi led a motion for partial summary judgment on their breach of contract claim, Conseco Life fi led a motion to decertify the nationwide class, and Conseco Life fi led a motion for summary judgment. On January 29, 2013, the court granted in part and denied in part plaintiff s’ motion for partial summary judgment and denied Conseco Life’s motions. Trial in the MDL proceeding has been set for March 25, 2013. We believe these cases are without merit and intend to defend them vigorously.
On October 25, 2012, a purported nationwide class action was fi led in the United States District Court for the Central District of California, William Jeff rey Burnett and Joe H. Camp v. Conseco Life Insurance Company, CNO Financial Group, Inc., CDOC, Inc. and CNO Services, LLC, Case No. EDCV12-01715VAPSPX. Th e plaintiff s bring this action under Rule 23(B)(3) on behalf of various Lifetrend policyholders who since October 2008 have surrendered their policies or had them lapse. Such policyholders are no longer members of the class covered by the MDL litigation described in the previous paragraph after the court in the MDL litigation granted Conseco Life’s motion to decertify as to former policyholders. Additionally, plaintiff s seek certifi cation of a subclass of various Lifetrend policyholders who accepted optional benefi ts and signed a release pursuant to the regulatory settlement agreement described below under the caption entitled “Regulatory Examinations and Fines.” Th e plaintiff s allege breach of contract and seek declaratory relief, compensatory damages, attorney fees and costs. On November 30, 2012, Conseco Life and the other defendants fi led a motion to dismiss the complaint. We believe this case is without merit and intend to defend it vigorously.
Other Litigation
On December 8, 2008, a purported Florida state class action was fi led in the U.S. District Court for the Southern District of Florida, Sydelle Ruderman individually and on behalf of all other similarly situated v. Washington National Insurance Company, Case No. 08-23401-CIV-Cohn/Selzer. Th e plaintiff alleges that the infl ation escalation rider on her policy of long-term care insurance operates to increase the policy’s lifetime maximum benefi t, and that Washington National Insurance Company breached the contract by stopping her benefi ts when they reached the lifetime maximum. Th e Company takes the position that the infl ation escalator only aff ects the per day maximum benefi t. Additional parties have asked the court to allow them to intervene in the action, and on January 5, 2010, the court granted the motion to intervene and granted the plaintiff ’s motion for class certifi cation. Th e court certifi ed a (B) (3) Florida state class alleging damages and a (B) (2) Florida state class alleging injunctive relief. Th e parties reached a settlement of the (B) (3) class in 2010, which has been implemented. Th e amount recognized in 2010 related to the settlement was not signifi cant to the Company’s consolidated fi nancial condition, cash fl ows or results of operations. Th e plaintiff fi led a motion for summary judgment as to the (B) (2) class which was granted by the court on September 8, 2010. Th e Company has appealed the court’s decision and the appeal is pending. On February 17, 2012, the Eleventh Circuit Court of Appeals referred the case to the Florida Supreme Court, which accepted jurisdiction of the case. On December 5, 2012, the Florida Supreme Court held oral argument and took the matter under advisement. We believe this case is without merit and intend to defend it vigorously.
On January 26, 2009, a purported class action complaint was fi led in the United States District Court for the Northern District of Illinois, Samuel Rowe and Estella Rowe, individually and on behalf of themselves and all others similarly situated v. Bankers Life & Casualty Company and Bankers Life Insurance Company of Illinois, Case No. 09CV491. Th e plaintiff s are alleging violation of California Business and Professions Code Sections 17200 et seq. and 17500 et seq., breach of common law fi duciary duty, breach of implied covenant of good faith and fair dealing and violation of California Welfare and Institutions Code Section 15600 on behalf of the proposed national class and seek injunctive relief, compensatory damages, punitive damages and attorney fees. Th e plaintiff s allege that the defendants used an improper and misleading sales and marketing approach to seniors that fails to disclose all facts, misuses consumers’ confi dential fi nancial information, uses misleading sales and marketing materials, promotes deferred annuities that are fundamentally inferior and less valuable than readily available alternative investment products and fails to adequately disclose other principal risks including maturity dates, surrender penalties and other restrictions which limit access to annuity proceeds to a date beyond the applicant’s actuarial life expectancy. Plaintiff s have amended their complaint attempting to convert this from a California only class action to a national class action. In addition, the amended complaint adds causes of action under the Racketeer Infl uenced and Corrupt Organization Act (“RICO”); aiding and abetting breach of fi duciary duty and for unjust enrichment. On September 13, 2010, the court dismissed the plaintiff ’s RICO claims. On October 25, 2010, the plaintiff s fi led a second amended complaint re-alleging their RICO claims. On March 29, 2012, the court denied plaintiff ’s motion for certifi cation of a nationwide class and denied plaintiff ’s motion for certifi cation of a California class. Th e court allowed the plaintiff the opportunity to fi le a renewed motion for a California class, which the

CNO FINANCIAL GROUP, INC. - Form 10-K 151
PART II ITEM 8 Consolidated Financial Statements
plaintiff did on May 21, 2012. On July 24, 2012, Bankers Life fi led a motion for summary judgment. We believe this case is without merit and intend to defend it vigorously.
On August 23, 2012, a purported class action was filed in the United States District Court for the District of Massachusetts (Boston), Fay Glick, on behalf of herself and all others similarly situated, v. Bankers Life & Casualty Company, Case No. 1:12-cv-11579. Th e plaintiff is seeking injunctive and declaratory relief and damages arising from Bankers’ alleged systematic business practices of delaying and/or denying the payment of claims for benefi ts provided for under its healthcare insurance policies and recovery of undisclosed interest that Bankers has charged on any policyholders who paid premiums on a monthly or “modal” basis (as opposed to paying premiums on an annual basis). On January 30, 2013, the court dismissed the modal premium related claims. Trial of the purported class claims has been set for December 2, 2013. We believe this case is without merit and intend to defend it vigorously.
Regulatory Examinations and Fines
Insurance companies face signifi cant risks related to regulatory investigations and actions. Regulatory investigations generally result from matters related to sales or underwriting practices, payment of contingent or other sales commissions, claim payments and procedures, product design, product disclosure, additional premium charges for premiums paid on a periodic basis, denial or delay of benefi ts, charging excessive or impermissible fees on products, changing the way cost of insurance charges are calculated for certain life insurance products or recommending unsuitable products to customers. We are, in the ordinary course of our business, subject to various examinations, inquiries and information requests from state, federal and other authorities. Th e ultimate outcome of these regulatory actions cannot be predicted with certainty. In the event of an unfavorable outcome in one or more of these matters, the ultimate liability may be in excess of liabilities we have established and we could suff er signifi cant reputational harm as a result of these matters, which could also have a material adverse eff ect on our business, fi nancial condition, results of operations or cash fl ows.
Th e states of Pennsylvania, Illinois, Texas, Florida and Indiana led a multistate examination of the long-term care claims administration and complaint handling practices of Senior Health and Bankers Life, as well as the sales and marketing practices of Bankers Life. On May 7, 2008, we announced a settlement among the state insurance regulators and Senior Health and Bankers Life. Th is examination covered the years 2005, 2006 and 2007. More than 40 states are parties to the settlement, which included a Senior Health fi ne of up to $2.3 million, with up to an additional $10 million payable, on the part of either Senior Health and/or Bankers Life, in the event the process improvements and benchmarks are not met. Pursuant to the settlement agreement, the lead states conducted a re-examination of Bankers Life to confi rm compliance with the process improvements and benchmarks. On November 9, 2012, Bankers Life and the lead states executed a regulatory settlement agreement fi nalizing the re-examination, pursuant to which Bankers Life paid a fi ne of $3.2 million.
In October 2008, Conseco Life mailed notice to approximately 12,000 holders of its “Lifetrend” life insurance products to inform them of: (i) changes to certain NGEs of their policies; and (ii) the fact that certain policyholders who were not paying premiums may have
failed to receive a notice that their policy was underfunded and that additional premiums were required in order for the policyholders to maintain their guaranteed cash values. In December 2008, Conseco Life mailed notice to approximately 16,000 holders of its CIUL3+ universal life policies to inform them of an increase in certain NGEs with respect to their policies. Prior to or around the time that the notices were sent, Conseco Life had informed the insurance regulators in a number of states, including among others Indiana, Iowa and Florida, of these matters and the planned communication with the impacted policyholders. Several states initiated regulatory actions and inquiries after the notices were sent by Conseco Life, and Conseco Life agreed to take no further actions with respect to those policies during the pendency of a market conduct examination.
After working with various state insurance regulators to review the terms of the Lifetrend and CIUL3+ policies, Conseco Life reached a settlement in principle with the regulators regarding issues involving these policies. During this regulatory review process, Conseco Life had been allowed to move forward with implementing the NGE changes in its CIUL3+ policies while the regulators continued their review. Conseco Life had also resumed the administration of its Lifetrend policies with administrative changes in place but did not implement the NGE changes pending execution of the fi nal settlement agreement with the regulators. On June 30, 2010, we announced that Conseco Life had fi nalized a regulatory settlement agreement that requires the establishment of a $10 million fund for certain owners of its Lifetrend life insurance products and the payment of a $1 million assessment to participating jurisdictions. Forty-seven jurisdictions, representing almost 98% percent of the Lifetrend policyholders, have signed the settlement agreement. Conseco Life has notifi ed consumers of the settlement and the increase in their NGEs. As previously disclosed, we accrued for the fi nancial impact of the settlement in our consolidated fi nancial statements for year-end 2009.
In August 2011, we were notifi ed of an examination to be done on behalf of a number of states for the purpose of determining compliance with unclaimed property laws by the Company and its subsidiaries. Such examination has included inquiries related to the use of data available on the U.S. Social Security Administration’s Death Master File to identify instances where benefi ts under life insurance policies, annuities and retained asset accounts are payable. We are continuing to provide information to the examiners in response to their requests. A total of 38 states and the District of Columbia are currently participating in this examination.
Guaranty Fund Assessments
Th e balance sheet at December 31, 2012, included: (i) accruals of $30.5 million, representing our estimate of all known assessments that will be levied against the Company’s insurance subsidiaries by various state guaranty associations based on premiums written through December 31, 2012; and (ii) receivables of $24.0 million that we estimate will be recovered through a reduction in future premium taxes as a result of such assessments. At December 31, 2011, such guaranty fund assessment accruals were $25.2 million and such receivables were $19.6 million. Th ese estimates are subject to change when the associations determine more precisely the losses that have occurred and how such losses will be allocated among the insurance companies. We recognized expense for such assessments of $4.3 million, $2.3 million and $2.4 million in 2012, 2011 and 2010, respectively.

CNO FINANCIAL GROUP, INC. - Form 10-K 152
PART II ITEM 8 Consolidated Financial Statements
Guarantees
In accordance with the terms of the employment agreements of two of the Company’s former chief executive offi cers, certain wholly-owned subsidiaries of the Company are the guarantors of the former executives’ nonqualifi ed supplemental retirement benefi ts. Th e liability for such benefi ts was $26.0 million and $24.8 million at December 31, 2012 and 2011, respectively, and is included in the caption “Other liabilities” in the consolidated balance sheet.
Leases and Certain Other Long-Term Commitments
Th e Company rents offi ce space, equipment and computer software under noncancellable operating lease agreements. In addition, the Company has entered into certain sponsorship agreements which require future payments. Total expense pursuant to these lease and sponsorship agreements was $47.5 million, $43.5 million and $42.8 million in 2012, 2011 and 2010, respectively. Future required minimum payments as of December 31, 2012, were as follows (dollars in millions):
2013 $ 44.32014 31.42015 21.12016 17.82017 15.2Th ereafter 25.3TOTAL $ 155.1
NOTE 8 AGENT DEFERRED COMPENSATION PLAN
For our agent deferred compensation plan, it is our policy to immediately recognize changes in the actuarial benefi t obligation resulting from either actual experience being diff erent than expected or from changes in actuarial assumptions.
One of our insurance subsidiaries has a noncontributory, unfunded deferred compensation plan for qualifying members of its career agency force. Benefi ts are based on years of service and career earnings. Th e actuarial measurement date of this deferred compensation plan is December 31. Th e liability recognized in the consolidated balance sheet for the agents’ deferred compensation plan was $151.7 million and $136.4 million at December 31, 2012 and 2011, respectively. Costs incurred on this plan were $20.5 million, $26.3 million and $13.0 million during 2012, 2011 and 2010, respectively (including the recognition of losses of $7.5 million, $16.2 million and $3.6 million in 2012, 2011 and 2010, respectively, primarily resulting from changes in the discount rate assumption used to determine the deferred compensation plan liability to refl ect current investment yields). Th e estimated net loss for the agent deferred compensation plan that will be amortized from accumulated other comprehensive income (loss) into the net periodic benefi t cost during 2013 is $4.0 million. We purchased COLI as an investment vehicle to fund the agent deferred compensation plan. Th e COLI assets are not assets of the agent deferred compensation plan, and as a result, are accounted for outside the plan and are recorded in the consolidated balance sheet as other invested assets. Th e carrying value of the COLI assets was $123.0 million and $103.9 million at December 31, 2012 and 2011, respectively. Changes in the cash surrender value (which approximates net realizable value) of the COLI assets are recorded as net investment income and totaled $9.0 million, $(3.8) million and $5.0 million in 2012, 2011 and 2010, respectively.
We used the following assumptions for the deferred compensation plan to calculate:
2012 2011Benefi t obligations:
Discount rate 4.00% 4.50%Net periodic cost:
Discount rate 4.50% 5.50%
Th e discount rate is based on the yield of a hypothetical portfolio of high quality debt instruments which could eff ectively settle plan benefi ts on a present value basis as of the measurement date. At December 31, 2012, for our deferred compensation plan for qualifying members of our career agency force, we assumed a 4 percent annual increase in compensation until the participant’s normal retirement date (age 65 and completion of fi ve years of service).
Th e benefi ts expected to be paid pursuant to our agent deferred compensation plan as of December 31, 2012 were as follows (dollars in millions):
2013 $ 5.52014 6.02015 6.22016 6.42017 6.72018 - 2022 39.1
Th e Company has qualifi ed defi ned contribution plans for which substantially all employees are eligible. Company contributions, which match a portion of certain voluntary employee contributions to the plan, totaled $4.5 million, $4.5 million and $4.1 million in 2012, 2011 and 2010, respectively. Employer matching contributions are discretionary.

CNO FINANCIAL GROUP, INC. - Form 10-K 153
PART II ITEM 8 Consolidated Financial Statements
NOTE 9 SHAREHOLDERS’ EQUITY
In November 2009, we completed the private sale of 16.4 million shares of our common stock and warrants to purchase 5.0 million shares of our common stock to Paulson & Co. Inc. (“Paulson”) on behalf of several investment funds and accounts managed by Paulson. Concurrently with the completion of the private placement of our common stock and warrants, we entered into an investor rights agreement with Paulson, pursuant to which we granted to Paulson, among other things, certain registration rights with respect to certain securities and certain preemptive rights, and Paulson agreed to, among other things, certain restrictions on transfer of certain securities, certain voting limitations and certain standstill provisions. Th e warrants have an exercise price of $6.50 per share of common stock, subject to customary anti-dilution adjustments. Prior to June 30, 2013, the warrants are not exercisable, except under limited circumstances. Commencing on June 30, 2013, the warrants will be exercisable for shares of our common stock at the option of the holder at any time, subject to certain exceptions. Th e warrants expire on December 30, 2016.
Prior to completing the private placement with Paulson, our Board of Directors deemed Paulson an “Exempted Entity” and therefore not an “Acquiring Person” for purposes of our Section 382 Rights Agreement, with respect to the 16.4 million shares of common stock, any shares of common stock issued upon exercise of the warrants, any common stock issued upon conversion of the 7.0% Debentures owned by Paulson, as well as the shares of common stock Paulson owned prior to the private placement. In connection with their approval of the Amended Section 382 Rights Agreement on December 6, 2011, our Board of Directors reaffi rmed that Paulson would continue to be deemed an “Exempted Entity” with respect to the CNO securities it owned at that time. See the note to the consolidated fi nancial statements entitled “Income Taxes” for more information on the Section 382 Rights Agreement.
Changes in the number of shares of common stock outstanding were as follows (shares in thousands):
2012 2011 2010Balance, beginning of year 241,305 251,084 250,786
Treasury stock purchased and retired (21,533) (11,120) — Stock options exercised 1,191 862 33 Restricted stock vested 539(a) 479(a) 265(a)
BALANCE, END OF YEAR 221,502 241,305 251,084(a) In 2012, 2011 and 2010, such amount was reduced by 237 thousand shares, 200 thousand shares and 74 thousand shares, respectively, which were tendered for the
payment of federal and state taxes owed on the vesting of restricted stock.
In May 2011, the Company announced a common share repurchase program of up to $100.0 million. In February 2012, June 2012 and December 2012, the Company’s Board of Directors approved, in aggregate, an additional $500.0 million to repurchase the Company’s outstanding securities. During 2012, we repurchased 21.5 million shares of common stock for $180.2 million pursuant to the program. Th e Company had remaining repurchase authority of $350.0 million as of December 31, 2012.
In May 2012, we initiated a common stock dividend program. In the second, third and fourth quarters of 2012, dividends declared and paid on common stock were $0.02 per common share totaling $13.9 million.
Th e Company has a long-term incentive plan which permits the grant of CNO incentive or non-qualifi ed stock options, restricted stock awards, stock appreciation rights, performance shares or units and certain other
equity-based awards to certain directors, offi cers and employees of the Company and certain other individuals who perform services for the Company. As of December 31, 2012, 9.7 million shares remained available for issuance under the plan. Our stock option awards are generally granted with an exercise price equal to the market price of the Company’s stock on the date of grant. For options granted in 2006 and prior years, our stock option awards generally vest on a graded basis over a four year service term and expire ten years from the date of grant. Our stock option awards granted in 2007 through 2009 generally vest on a graded basis over a three year service term and expire fi ve years from the date of grant. Our stock options granted in 2010, 2011 and 2012 vest on a graded basis over a three year service term and expire seven years from the date of grant. Th e vesting periods for our restricted stock awards range from immediate vesting to a period of three years.
A summary of the Company’s stock option activity and related information for 2012 is presented below (shares in thousands; dollars in millions, except per share amounts):
SharesWeighted average
exercise price
Weighted average remaining life
(in years)Aggregate
intrinsic valueOutstanding at the beginning of the year 7,712 $ 10.13
Options granted 1,389 7.55 Exercised (1,191) 3.14 $ 2.7Forfeited or terminated (1,255) 16.13
Outstanding at the end of the year 6,655 9.72 3.4 $ 30.2Options exercisable at the end of the year 3,715 1.7 $ 15.5Available for future grant 9,713

CNO FINANCIAL GROUP, INC. - Form 10-K 154
PART II ITEM 8 Consolidated Financial Statements
A summary of the Company’s stock option activity and related information for 2011 is presented below (shares in thousands; dollars in millions, except per share amounts):
SharesWeighted average
exercise price
Weighted average remaining life
(in years)Aggregate intrinsic
valueOutstanding at the beginning of the year 9,754 $ 10.87
Options granted 1,262 7.38 Exercised (862) 2.52 $ 1.3 Forfeited or terminated (2,442) 14.35
Outstanding at the end of the year 7,712 10.13 3.1 $ 31.3Options exercisable at the end of the year 4,135 1.8 $ 18.0Available for future grant 11,044
A summary of the Company’s stock option activity and related information for 2010 is presented below (shares in thousands; dollars in millions, except per share amounts):
SharesWeighted average
exercise price
Weighted average remaining life
(in years)Aggregate intrinsic
valueOutstanding at the beginning of the year 8,560 $ 11.65
Options granted 1,849 6.43 Exercised (33) 2.83 $ —Forfeited or terminated (622) 8.81
Outstanding at the end of the year 9,754 10.87 3.6 $ 38.3Options exercisable at the end of the year 4,374 2.9 $ 24.1Available for future grant 9,326
We recognized compensation expense related to stock options totaling $6.7 million ($4.4 million after income taxes) in 2012, $.2 million ($.1 million after income taxes) in 2011 and $7.1 million ($4.6 million after income taxes) in 2010. Compensation expense in 2011 was reduced by $7.4 million to refl ect the true-up of forfeiture estimates for awards with service conditions. Compensation expense related to stock options reduced both basic and diluted earnings (loss) per share
by 2 cents, nil cents and 2 cents in 2012, 2011 and 2010, respectively. At December 31, 2012, the unrecognized compensation expense for non-vested stock options totaled $7.6 million which is expected to be recognized over a weighted average period of 1.9 years. Cash received from the exercise of stock options was $3.1 million, $2.2 million and $.1 million during 2012, 2011 and 2010, respectively.
Th e fair value of each stock option grant is estimated on the date of grant using the Black-Scholes option valuation model with the following weighted average assumptions:
2012 Grants 2011 Grants 2010 GrantsWeighted average risk-free interest rates .9% 2.2% 2.5%Weighted average dividend yields —% —% —%Volatility factors 108% 107% 105%Weighted average expected life (in years) 4.7 4.8 4.7 Weighted average fair value per share $ 5.76 $ 5.68 $ 4.90
Th e risk-free interest rate is based on the U.S. Treasury yield curve in eff ect at the time of grant. Th e dividend yield is based on the Company’s history and expectation of dividend payouts. Volatility factors are based on the weekly historical volatility of the Company’s common stock equal to the expected life of the option or since our emergence from
bankruptcy in September 2003. Th e expected life is based on the average of the graded vesting period and the contractual terms of the option.
Th e exercise price was equal to the market price of our stock on the date of grant for all options granted in 2012, 2011 and 2010.

CNO FINANCIAL GROUP, INC. - Form 10-K 155
PART II ITEM 8 Consolidated Financial Statements
Th e following table summarizes information about stock options outstanding at December 31, 2012 (shares in thousands):
Range of exercise pricesNumber
outstanding
Options outstanding Options exercisableRemaining life
(in years)Average exercise
priceNumber
exercisableAverage exercise
price$1.13 171 1.3 $ 1.13 171 $ 1.13$3.05 - $3.11 781 1.4 3.05 781 3.05$4.79 - $6.77 1,150 4.2 6.40 527 6.36$7.38 - $7.74 2,247 5.7 7.45 — —$8.29 - $11.20 1,054 0.7 10.38 984 10.53$17.87 - $21.67 849 1.7 20.82 849 20.82$22.42 - $25.45 403 3.1 23.20 403 23.20
6,655 3,715
During 2012, 2011 and 2010, the Company granted .7 million, .9 million and 1.0 million restricted shares, respectively, of CNO common stock to certain directors, offi cers and employees of the Company at a weighted average fair value of $7.35 per share, $6.97
per share and $6.28 per share, respectively. Th e fair value of such grants totaled $5.0 million, $6.0 million and $6.2 million in 2012, 2011 and 2010, respectively. Such amounts are recognized as compensation expense over the vesting period of the restricted stock.
A summary of the Company’s non-vested restricted stock activity for 2012 is presented below (shares in thousands):
SharesWeighted average grant
date fair valueNon-vested shares, beginning of year 1,318 $ 6.09
Granted 686 7.35Vested (777) 5.64Forfeited (65) 7.05
NON-VESTED SHARES, END OF YEAR 1,162 7.08
At December 31, 2012, the unrecognized compensation expense for non-vested restricted stock totaled $5.4 million which is expected to be recognized over a weighted average period of 1.7 years. At December 31, 2011, the unrecognized compensation expense for non-vested restricted stock totaled $5.4 million. We recognized compensation expense related to restricted stock awards totaling $4.5 million, $4.3 million and $2.5 million in 2012, 2011 and 2010, respectively. Th e fair value of restricted stock that vested during 2012, 2011 and 2010 was $4.4 million, $3.2 million and $1.3 million, respectively.
Authoritative guidance also requires us to estimate the amount of unvested stock-based awards that will be forfeited in future periods and reduce the amount of compensation expense recognized over the applicable service period to refl ect this estimate. We periodically evaluate our forfeiture assumptions to more accurately refl ect our actual forfeiture experience.
Th e Company does not currently recognize tax benefi ts resulting from tax deductions in excess of the compensation expense recognized because of NOLs which are available to off set future taxable income.
In 2012, 2011 and 2010, the Company granted performance units totaling 406,500, 416,700 and 686,900, respectively, pursuant to its long-term incentive plan to certain offi cers of the Company. Th e criteria for payment for such awards are based on certain company-wide performance levels that must be achieved within a specifi ed performance time, each as defi ned in the award. Unless antidilutive, the diluted weighted average shares outstanding would refl ect the number of performance units expected to be issued, using the treasury stock method.
A summary of the Company’s performance units is presented below (shares in thousands):
Total shareholder
return awards
Operating return on equity
awards
Pre-tax operating
income awardsAwards outstanding at December 31, 2009 331 825 —
Granted in 2010 — — 687 Forfeited (331) (270) (35)
Awards outstanding at December 31, 2010 — 555 652 Granted in 2011 — — 417 Forfeited — (555) (233)
Awards outstanding at December 31, 2011 — — 836 Granted in 2012 203 — 203 Forfeited (10) — (62)
AWARDS OUTSTANDING AT DECEMBER 31, 2012 193 — 977

CNO FINANCIAL GROUP, INC. - Form 10-K 156
PART II ITEM 8 Consolidated Financial Statements
Th e grant date fair value of the performance units awarded was $3.1 million and $3.1 million in 2012 and 2011, respectively. We recognized compensation expense of $3.8 million, $2.0 million and $2.2 million in 2012, 2011 and 2010, respectively, related to the performance units.
As further discussed in the footnote to the consolidated fi nancial statements entitled “Income Taxes”, the Company’s Board of Directors adopted the Section 382 Rights Agreement on January 20, 2009 and amended and extended the Section 382 Rights Agreement on December 6, 2011. Th e Amended Section 382 Rights Agreement is designed to protect shareholder value by preserving the value of our tax assets primarily associated with NOLs. At the time the Section 382 Rights Agreement was adopted, the Company declared a dividend of one preferred share purchase right (a “Right”) for each outstanding share of common stock. Th e dividend was payable on January 30, 2009, to
the shareholders of record as of the close of business on that date and a Right is also attached to each share of CNO common stock issued after that date. Pursuant to the Amended Section 382 Rights Agreement, each Right entitles the shareholder to purchase from the Company one one-thousandth of a share of Series B Junior Participating Preferred Stock, par value $.01 per share (the “Junior Preferred Stock”) of the Company at a price of $25.00 per one one-thousandth of a share of Junior Preferred Stock. Th e description and terms of the Rights are set forth in the Amended Section 382 Rights Agreement. Th e Rights would become exercisable in the event any person or group (subject to certain exemptions) becomes an owner of more than 4.99 percent of the outstanding stock of CNO (a “Th reshold Holder”) without the approval of the Board of Directors or an existing shareholder who is currently a Th reshold Holder acquires additional shares exceeding one percent of our outstanding shares without prior approval from the Board of Directors.
A reconciliation of net income and shares used to calculate basic and diluted earnings per share is as follows (dollars in millions and shares in thousands):
2012 2011 2010Net income for basic earnings per share $ 221.0 $ 335.7 $ 240.6Add: interest expense on 7.0% Debentures, net of income taxes 12.2 14.7 13.3NET INCOME FOR DILUTED EARNINGS PER SHARE $ 233.2 $ 350.4 $ 253.9Shares:
Weighted average shares outstanding for basic earnings per share 233,685 247,952 250,973Eff ect of dilutive securities on weighted average shares:
7% Debentures 44,037 53,367 49,014Stock options, restricted stock and performance units 2,762 2,513 1,871Warrants 943 249 —
Dilutive potential common shares 47,742 56,129 50,885WEIGHTED AVERAGE SHARES OUTSTANDING FOR DILUTED EARNINGS PER SHARE 281,427 304,081 301,858
In August 2005, we completed the private off ering of the 3.5% Debentures. For periods in which the 3.5% Debentures were outstanding, the conversion feature of the 3.5% Debentures did not have a dilutive eff ect because the weighted average market price of our common stock did not exceed the initial conversion price of $26.66. Th erefore, the 3.5% Debentures had no eff ect on our diluted shares outstanding or our diluted earnings per share in 2010.
Basic earnings per common share is computed by dividing net income by the weighted average number of common shares outstanding for the period. Restricted shares (including our performance units) are not included in basic earnings per share until vested. Diluted earnings per share refl ect the potential dilution that could occur if outstanding stock options and warrants were exercised and restricted stock was vested. Th e
dilution from options, warrants and restricted shares is calculated using the treasury stock method. Under this method, we assume the proceeds from the exercise of the options and warrants (or the unrecognized compensation expense with respect to restricted stock) will be used to purchase shares of our common stock at the average market price during the period, reducing the dilutive eff ect of the exercise of the options and warrants (or the vesting of the restricted stock). Initially, the 7.0% Debentures will be convertible into 182.1494 shares of our common stock for each $1,000 principal amount of 7.0% Debentures, which is equivalent to an initial conversion price of approximately $5.49 per share. Th e conversion rate is subject to adjustment following the occurrence of certain events in accordance with the terms of the 7.0% Debentures.

CNO FINANCIAL GROUP, INC. - Form 10-K 157
PART II ITEM 8 Consolidated Financial Statements
NOTE 10 OTHER OPERATING STATEMENT DATA
Insurance policy income consisted of the following (dollars in millions):
2012 2011 2010Direct premiums collected $ 3,883.1 $ 4,214.7 $ 4,252.0 Reinsurance assumed 70.4 87.7 99.4 Reinsurance ceded (237.1) (243.2) (264.7)
Premiums collected, net of reinsurance 3,716.4 4,059.2 4,086.7 Change in unearned premiums 20.8 17.2 2.9 Less premiums on universal life and products without mortality and morbidity risk which are recorded as additions to insurance liabilities (1,296.7) (1,693.5) (1,730.1)
Premiums on traditional products with mortality or morbidity risk 2,440.5 2,382.9 2,359.5 Fees and surrender charges on interest-sensitive products 314.9 307.6 310.5 INSURANCE POLICY INCOME $ 2,755.4 $ 2,690.5 $ 2,670.0
Th e four states with the largest shares of 2012 collected premiums were Florida (7.7 percent), California (6.5 percent), Texas (6.4 percent) and Pennsylvania (6.2 percent). No other state accounted for more than fi ve percent of total collected premiums.
Other operating costs and expenses were as follows (dollars in millions):
2012 2011 2010Commission expense $ 115.8 $ 131.7 $ 130.9Salaries and wages 226.6 212.2 216.1Other 476.9 360.6 343.3TOTAL OTHER OPERATING COSTS AND EXPENSES $ 819.3 $ 704.5 $ 690.3
Changes in the present value of future profi ts were as follows (dollars in millions):
2012 2011 2010Balance, beginning of year $ 697.7 $ 1,008.6 $ 1,175.9
Amortization (93.5) (113.7) (139.0)Amounts related to fair value adjustment of fi xed maturities, available for sale 21.8 (197.2) (28.3)
BALANCE, END OF YEAR $ 626.0 $ 697.7 $ 1,008.6
Based on current conditions and assumptions as to future events on all policies inforce, the Company expects to amortize approximately 9 percent of the December 31, 2012 balance of the present value of future profi ts in 2013, 8 percent in 2014, 7 percent in 2015, 7 percent in 2016 and 6 percent in 2017. Th e discount rate used to determine the amortization of the present value of future profi ts averaged approximately 5 percent in the years ended December 31, 2012, 2011 and 2010.
In accordance with authoritative guidance, we are required to amortize the present value of future profi ts in relation to estimated gross profi ts for universal life products and investment-type products. Such guidance also requires that estimates of expected gross profi ts used as a basis for amortization be evaluated regularly, and that the total amortization recorded to date be adjusted by a charge or credit to the statement of operations, if actual experience or other evidence suggests that earlier estimates should be revised.
Changes in deferred acquisition costs were as follows (dollars in millions):
2012 2011 2010Balance, beginning of year $ 797.1 $ 999.6 $ 1,063.0
Additions 191.7 216.7 231.8 Amortization (195.5) (183.7) (186.0)Amounts related to fair value adjustment of fi xed maturities, available for sale (163.6) (235.5) (98.5)Other adjustments — — (10.7)
BALANCE, END OF YEAR $ 629.7 $ 797.1 $ 999.6
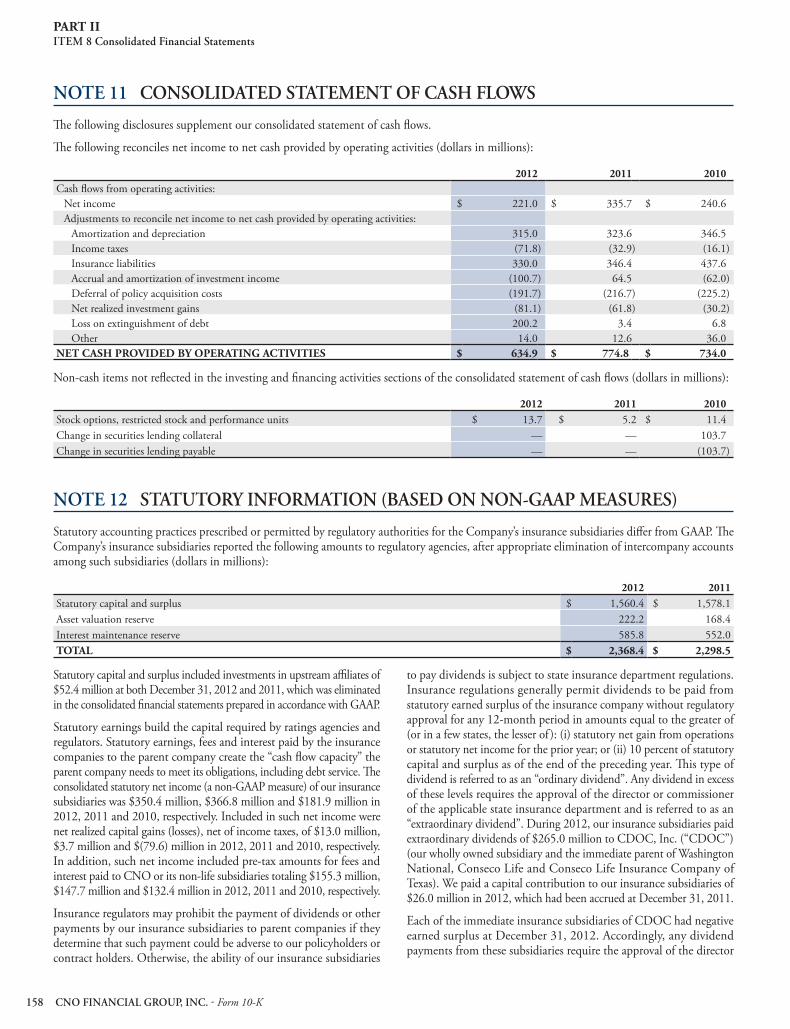
CNO FINANCIAL GROUP, INC. - Form 10-K 158
PART II ITEM 8 Consolidated Financial Statements
NOTE 11 CONSOLIDATED STATEMENT OF CASH FLOWS
Th e following disclosures supplement our consolidated statement of cash fl ows.
Th e following reconciles net income to net cash provided by operating activities (dollars in millions):
2012 2011 2010Cash fl ows from operating activities:
Net income $ 221.0 $ 335.7 $ 240.6Adjustments to reconcile net income to net cash provided by operating activities:
Amortization and depreciation 315.0 323.6 346.5Income taxes (71.8) (32.9) (16.1)Insurance liabilities 330.0 346.4 437.6Accrual and amortization of investment income (100.7) 64.5 (62.0)Deferral of policy acquisition costs (191.7) (216.7) (225.2)Net realized investment gains (81.1) (61.8) (30.2)Loss on extinguishment of debt 200.2 3.4 6.8Other 14.0 12.6 36.0
NET CASH PROVIDED BY OPERATING ACTIVITIES $ 634.9 $ 774.8 $ 734.0
Non-cash items not refl ected in the investing and fi nancing activities sections of the consolidated statement of cash fl ows (dollars in millions):
2012 2011 2010Stock options, restricted stock and performance units $ 13.7 $ 5.2 $ 11.4 Change in securities lending collateral — — 103.7 Change in securities lending payable — — (103.7)
NOTE 12 STATUTORY INFORMATION (BASED ON NON-GAAP MEASURES)
Statutory accounting practices prescribed or permitted by regulatory authorities for the Company’s insurance subsidiaries diff er from GAAP. Th e Company’s insurance subsidiaries reported the following amounts to regulatory agencies, after appropriate elimination of intercompany accounts among such subsidiaries (dollars in millions):
2012 2011Statutory capital and surplus $ 1,560.4 $ 1,578.1Asset valuation reserve 222.2 168.4Interest maintenance reserve 585.8 552.0TOTAL $ 2,368.4 $ 2,298.5
Statutory capital and surplus included investments in upstream affi liates of $52.4 million at both December 31, 2012 and 2011, which was eliminated in the consolidated fi nancial statements prepared in accordance with GAAP.
Statutory earnings build the capital required by ratings agencies and regulators. Statutory earnings, fees and interest paid by the insurance companies to the parent company create the “cash fl ow capacity” the parent company needs to meet its obligations, including debt service. Th e consolidated statutory net income (a non-GAAP measure) of our insurance subsidiaries was $350.4 million, $366.8 million and $181.9 million in 2012, 2011 and 2010, respectively. Included in such net income were net realized capital gains (losses), net of income taxes, of $13.0 million, $3.7 million and $(79.6) million in 2012, 2011 and 2010, respectively. In addition, such net income included pre-tax amounts for fees and interest paid to CNO or its non-life subsidiaries totaling $155.3 million, $147.7 million and $132.4 million in 2012, 2011 and 2010, respectively.
Insurance regulators may prohibit the payment of dividends or other payments by our insurance subsidiaries to parent companies if they determine that such payment could be adverse to our policyholders or contract holders. Otherwise, the ability of our insurance subsidiaries
to pay dividends is subject to state insurance department regulations. Insurance regulations generally permit dividends to be paid from statutory earned surplus of the insurance company without regulatory approval for any 12-month period in amounts equal to the greater of (or in a few states, the lesser of ): (i) statutory net gain from operations or statutory net income for the prior year; or (ii) 10 percent of statutory capital and surplus as of the end of the preceding year. Th is type of dividend is referred to as an “ordinary dividend”. Any dividend in excess of these levels requires the approval of the director or commissioner of the applicable state insurance department and is referred to as an “extraordinary dividend”. During 2012, our insurance subsidiaries paid extraordinary dividends of $265.0 million to CDOC, Inc. (“CDOC”) (our wholly owned subsidiary and the immediate parent of Washington National, Conseco Life and Conseco Life Insurance Company of Texas). We paid a capital contribution to our insurance subsidiaries of $26.0 million in 2012, which had been accrued at December 31, 2011.
Each of the immediate insurance subsidiaries of CDOC had negative earned surplus at December 31, 2012. Accordingly, any dividend payments from these subsidiaries require the approval of the director

CNO FINANCIAL GROUP, INC. - Form 10-K 159
PART II ITEM 8 Consolidated Financial Statements
or commissioner of the applicable state insurance department. Th e payment of interest on surplus debentures requires either prior written notice or approval of the director or commissioner of the applicable state insurance department. Dividends and other payments from our non-insurance subsidiaries to CNO or CDOC do not require approval by any regulatory authority or other third party.
In accordance with an order from the Florida Offi ce of Insurance Regulation, Washington National may not distribute funds to any affi liate or shareholder without prior notice to the Florida Offi ce of Insurance Regulation. In addition, the RBC and other capital requirements described below can also limit, in certain circumstances, the ability of our insurance subsidiaries to pay dividends.
RBC requirements provide a tool for insurance regulators to determine the levels of statutory capital and surplus an insurer must maintain in relation to its insurance and investment risks and the need for possible regulatory attention. Th e RBC requirements provide four levels of regulatory attention, varying with the ratio of the insurance company’s total adjusted capital (defi ned as the total of its statutory capital and surplus, asset valuation reserve and certain other adjustments) to its RBC (as measured on December 31 of each year) as follows: (i) if a company’s total adjusted capital is less than 100 percent but greater than or equal to 75 percent of its RBC, the company must submit a comprehensive plan to the regulatory authority proposing corrective actions aimed at improving its capital position (the “Company Action Level”); (ii) if a company’s total adjusted capital is less than 75 percent but greater than or equal to 50 percent of its RBC, the regulatory authority will perform a special examination of the company and issue an order specifying the corrective actions that must be taken; (iii) if a company’s total adjusted capital is less than 50 percent but greater than or equal to 35 percent of its RBC, the regulatory authority may take any action it deems necessary, including placing the company under regulatory control; and (iv) if a company’s total adjusted capital is less than 35 percent of its RBC, the regulatory authority must place the company under its control. In addition, the RBC requirements provide for a trend test if a company’s total adjusted capital is between 100 percent and 125 percent of its RBC at the end of the year. Th e trend test calculates the greater of the decrease in the margin of total adjusted capital over RBC: (i) between the current year and the prior year; and (ii) for the average of the last 3 years. It assumes that such decrease could occur again in the coming year. Any company whose trended total adjusted capital is less than 95 percent of its RBC would trigger a requirement to submit a comprehensive plan as described above for the Company Action Level. In 2011, the NAIC approved an increase in the RBC requirements that would subject a company to the trend test if a company’s total adjusted capital is between 100 percent and 150 percent of its RBC at the end of the year (previously between 100 percent and 125 percent). However, this change will require the states to modify their RBC law before it becomes eff ective for their domiciled insurance companies.
Th e 2012 statutory annual statements to be fi led with the state insurance regulators of each of our insurance subsidiaries are expected to refl ect total adjusted capital in excess of the levels subjecting the subsidiaries to any regulatory action. However, the RBC ratio of Conseco Life, which has experienced signifi cant losses primarily related to pending legal settlements, was near the level at which it would have been required to
submit a comprehensive plan to insurance regulators proposing corrective actions aimed at improving its capital position. Conseco Life’s domestic state is expected to adopt the increased RBC requirements described in the preceding paragraph, in which event, they would be eff ective for the calculation of Conseco Life’s RBC ratio as of December 31, 2013. If those increased requirements had been in eff ect at December 31, 2012, the RBC ratio of Conseco Life at that date would have been subject to the trend test described above and Conseco Life would have been required to submit a comprehensive plan to the state regulatory authority proposing corrective actions aimed at improving its capital position. No assurances can be given that capital will be contributed or otherwise made available to Conseco Life or the other insurance subsidiaries.
In addition to the RBC requirements, certain states have established minimum capital requirements for insurance companies licensed to do business in their state. Th ese regulators have the discretionary authority, in connection with the continual licensing of the Company’s insurance subsidiaries, to limit or prohibit writing new business within its jurisdiction when, in the state’s judgment, the insurance subsidiary is not maintaining adequate statutory surplus or capital or that the insurance subsidiary’s further transaction of business would be hazardous to policyholders. Th e state insurance department rules provide several standards for the regulators to use in identifying companies which may be deemed to be in hazardous fi nancial condition. One of the standards defi nes hazardous conditions as existing if an insurer’s operating loss in the last twelve months or any shorter period of time, (including, but not limited to: (A) net capital gain or loss; (B) change in nonadmitted assets; and (C) cash dividends paid to shareholders), is greater than fi fty percent of the insurer’s remaining surplus. One of the Company’s subsidiaries, Conseco Life, has reported statutory fi nancial results that indicate a surplus defi ciency under this calculation. We have been in contact with regulators in Conseco Life’s domestic state insurance department regarding this matter following the signifi cant loss Conseco Life recognized in the third quarter of 2012, primarily related to a pending legal settlement. Based on our current discussions with the state insurance regulator, we do not expect any actions to be taken against Conseco Life that would have a material adverse eff ect on the fi nancial position or results of operations of CNO.
In addition, although we are under no obligation to do so, we may elect to contribute additional capital or retain greater amounts of capital to strengthen the surplus of certain insurance subsidiaries. Any election to contribute or retain additional capital could impact the amounts our insurance subsidiaries pay as dividends to the holding company. Th e ability of our insurance subsidiaries to pay dividends is also impacted by various criteria established by rating agencies to maintain or receive higher ratings and by the capital levels that we target for our insurance subsidiaries.
At December 31, 2012, the consolidated RBC ratio of our insurance subsidiaries exceeded the minimum RBC requirement included in our New Senior Secured Credit Agreement. See the note to the consolidated fi nancial statements entitled “Notes Payable - Direct Corporate Obligations” for further discussion of various fi nancial ratios and balances we are required to maintain. We calculate the consolidated RBC ratio by assuming all of the assets, liabilities, capital and surplus and other aspects of the business of our insurance subsidiaries are combined together in one insurance subsidiary, with appropriate intercompany eliminations.

CNO FINANCIAL GROUP, INC. - Form 10-K 160
PART II ITEM 8 Consolidated Financial Statements
NOTE 13 BUSINESS SEGMENTS
Th e Company manages its business through the following operating segments: Bankers Life, Washington National and Colonial Penn, which are defi ned on the basis of product distribution; Other CNO Business, comprised primarily of products we no longer sell actively; and corporate operations, comprised of holding company activities and certain noninsurance company businesses.
We measure segment performance by excluding realized investment gains (losses) and fair value changes in embedded derivative liabilities because we believe that this performance measure is a better indicator of the ongoing business and trends in our business. Our primary investment focus is on investment income to support our liabilities for insurance
products as opposed to the generation of realized investment gains (losses), and a long-term focus is necessary to maintain profi tability over the life of the business.
Realized investment gains (losses) and fair value changes in embedded derivative liabilities depend on market conditions and do not necessarily relate to the underlying business of our segments. Realized investment gains (losses) and fair value changes in embedded derivative liabilities may aff ect future earnings levels since our underlying business is long-term in nature and changes in our investment portfolio may impact our ability to earn the assumed interest rates needed to maintain the profi tability of our business.
Operating information by segment was as follows (dollars in millions):
2012 2011 2010Revenues:
Bankers Life: Insurance policy income:
Annuities $ 28.4 $ 33.4 $ 39.5Health 1,342.7 1,347.3 1,366.0Life 286.3 231.7 190.7
Net investment income (a) 838.9 766.3 758.9Fee revenue and other income (a) 15.2 13.8 12.8
Total Bankers Life revenues 2,511.5 2,392.5 2,367.9Washington National:
Insurance policy income: Health 572.4 565.7 559.3Life 15.2 15.6 16.8Other 2.8 3.8 4.9
Net investment income (a) 204.1 189.5 185.4Fee revenue and other income (a) 1.1 1.0 1.1
Total Washington National revenues 795.6 775.6 767.5Colonial Penn:
Insurance policy income: Health 5.2 5.9 6.8Life 212.6 197.1 188.1
Net investment income (a) 40.4 41.1 39.3Fee revenue and other income (a) .7 .9 .7
Total Colonial Penn revenues 258.9 245.0 234.9Other CNO Business:
Insurance policy income: Annuities 10.6 12.2 12.9Health 25.7 27.7 29.9Life 252.9 248.4 252.5Other .6 1.7 2.6
Net investment income (a) 340.6 344.1 364.6Total Other CNO Business revenues 630.4 634.1 662.5
Corporate operations: Net investment income 62.4 13.1 18.7Fee and other income 2.8 2.5 2.2
Total corporate revenues 65.2 15.6 20.9TOTAL REVENUES 4,261.6 4,062.8 4,053.7
(continued on next page)
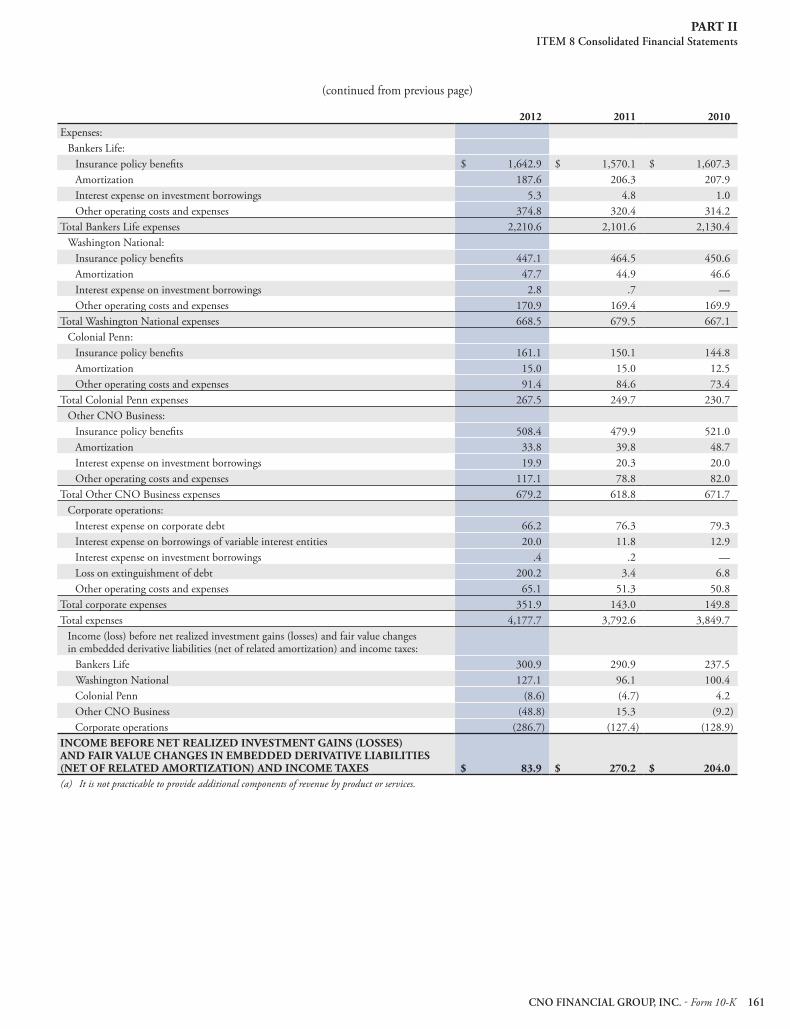
CNO FINANCIAL GROUP, INC. - Form 10-K 161
PART II ITEM 8 Consolidated Financial Statements
(continued from previous page)
2012 2011 2010Expenses:
Bankers Life: Insurance policy benefi ts $ 1,642.9 $ 1,570.1 $ 1,607.3 Amortization 187.6 206.3 207.9 Interest expense on investment borrowings 5.3 4.8 1.0 Other operating costs and expenses 374.8 320.4 314.2
Total Bankers Life expenses 2,210.6 2,101.6 2,130.4 Washington National:
Insurance policy benefi ts 447.1 464.5 450.6 Amortization 47.7 44.9 46.6 Interest expense on investment borrowings 2.8 .7 — Other operating costs and expenses 170.9 169.4 169.9
Total Washington National expenses 668.5 679.5 667.1 Colonial Penn:
Insurance policy benefi ts 161.1 150.1 144.8 Amortization 15.0 15.0 12.5 Other operating costs and expenses 91.4 84.6 73.4
Total Colonial Penn expenses 267.5 249.7 230.7 Other CNO Business:
Insurance policy benefi ts 508.4 479.9 521.0 Amortization 33.8 39.8 48.7 Interest expense on investment borrowings 19.9 20.3 20.0 Other operating costs and expenses 117.1 78.8 82.0
Total Other CNO Business expenses 679.2 618.8 671.7 Corporate operations:
Interest expense on corporate debt 66.2 76.3 79.3 Interest expense on borrowings of variable interest entities 20.0 11.8 12.9 Interest expense on investment borrowings .4 .2 — Loss on extinguishment of debt 200.2 3.4 6.8 Other operating costs and expenses 65.1 51.3 50.8
Total corporate expenses 351.9 143.0 149.8 Total expenses 4,177.7 3,792.6 3,849.7
Income (loss) before net realized investment gains (losses) and fair value changes in embedded derivative liabilities (net of related amortization) and income taxes:
Bankers Life 300.9 290.9 237.5 Washington National 127.1 96.1 100.4 Colonial Penn (8.6) (4.7) 4.2 Other CNO Business (48.8) 15.3 (9.2)Corporate operations (286.7) (127.4) (128.9)
INCOME BEFORE NET REALIZED INVESTMENT GAINS (LOSSES) AND FAIR VALUE CHANGES IN EMBEDDED DERIVATIVE LIABILITIES (NET OF RELATED AMORTIZATION) AND INCOME TAXES $ 83.9 $ 270.2 $ 204.0(a) It is not practicable to provide additional components of revenue by product or services.

CNO FINANCIAL GROUP, INC. - Form 10-K 162
PART II ITEM 8 Consolidated Financial Statements
A reconciliation of segment revenues and expenses to consolidated revenues and expenses is as follows (dollars in millions):
2012 2011 2010Total segment revenues $ 4,261.6 $ 4,062.8 $ 4,053.7Net realized investment gains (losses) 81.1 61.8 30.2CONSOLIDATED REVENUES $ 4,342.7 $ 4,124.6 $ 4,083.9Total segment expenses $ 4,177.7 $ 3,792.6 $ 3,849.7Insurance policy benefi ts - fair value changes in embedded derivative liabilities (a) 4.4 34.4 —Amortization related to fair value changes in embedded derivative liabilities (a) (1.6) (14.0) —Amortization related to net realized investment gains (losses) 6.5 5.4 9.3CONSOLIDATED EXPENSES $ 4,187.0 $ 3,818.4 $ 3,859.0(a) Prior to June 30, 2011, we maintained a specific block of investments in our trading securities account (which we carried at estimated fair value with changes in such
value recognized as investment income from policyholder and reinsurer accounts and other special-purpose portfolios) to offset the income statement volatility caused by the effect of interest rate fluctuations on the value of embedded derivatives related to our fixed index annuity products. During the second quarter of 2011, we sold this trading portfolio, which resulted in $2.8 million and $20.4 million of decreased earnings in 2012 and 2011, respectively, since the volatility caused by the accounting requirements to record embedded options at fair value was no longer being offset.
Segment balance sheet information was as follows (dollars in millions):
2012 2011ASSETS:
Bankers Life $ 17,637.7 $ 16,800.0Washington National 4,499.5 4,360.4Colonial Penn 917.8 879.2Other CNO Business 8,679.5 8,964.9Corporate operations 2,396.9 1,917.4
TOTAL ASSETS $ 34,131.4 $ 32,921.9LIABILITIES:
Bankers Life $ 15,590.1 $ 14,757.1Washington National 3,425.6 3,449.1Colonial Penn 749.6 742.4Other CNO Business 7,451.1 7,857.8Corporate operations 1,865.7 1,501.7
TOTAL LIABILITIES $ 29,082.1 $ 28,308.1
Th e following table presents selected fi nancial information of our segments (dollars in millions):
SegmentPresent value of
future profi tsDeferred
acquisition costsInsurance liabilities
2012Bankers Life $ 168.8 $ 332.8 $ 14,548.0Washington National 375.8 157.3 2,911.7Colonial Penn 63.6 57.5 763.1Other CNO Business 17.8 82.1 6,866.7TOTAL $ 626.0 $ 629.7 $ 25,089.52011Bankers Life $ 201.8 $ 491.0 $ 13,720.4Washington National 402.0 142.3 2,954.7Colonial Penn 72.6 51.5 725.5Other CNO Business 21.3 112.3 7,296.9TOTAL $ 697.7 $ 797.1 $ 24,697.5

CNO FINANCIAL GROUP, INC. - Form 10-K 163
PART II ITEM 8 Consolidated Financial Statements
NOTE 14 QUARTERLY FINANCIAL DATA (UNAUDITED)
We compute earnings per common share for each quarter independently of earnings per share for the year. Th e sum of the quarterly earnings per share may not equal the earnings per share for the year because of: (i) transactions aff ecting the weighted average number of shares
outstanding in each quarter; and (ii) the uneven distribution of earnings during the year. Quarterly fi nancial data (unaudited) were as follows (dollars in millions, except per share data):
2012 1st Qtr. 2nd Qtr. 3rd Qtr. 4th Qtr.Revenues $ 1,123.9 $ 1,065.0 $ 1,093.0 $ 1,060.8Income (loss) before income taxes $ 92.3 $ 104.5 $ (158.8) $ 117.7Income tax expense (benefi t) 33.2 38.8 (153.8) 16.5NET INCOME (LOSS) $ 59.1 $ 65.7 $ (5.0) $ 101.2Earnings per common share:
Basic: Net income (loss) $ .25 $ .28 $ (.02) $ .45
Diluted: Net income (loss) $ .21 $ .24 $ (.02) $ .41
2011 1st Qtr. 2nd Qtr. 3rd Qtr. 4th Qtr.Revenues $ 1,049.2 $ 1,032.0 $ 992.3 $ 1,051.1Income before income taxes $ 70.4 $ 71.8 $ 61.7 $ 102.3Income tax expense (benefi t) 25.0 25.4 (117.8) 37.9NET INCOME $ 45.4 $ 46.4 $ 179.5 $ 64.4Earnings per common share:
Basic: Net income $ .18 $ .18 $ .73 $ .27
Diluted: Net income $ .16 $ .16 $ .61 $ .23
NOTE 15 INVESTMENTS IN VARIABLE INTEREST ENTITIES
We have concluded that we are the primary benefi ciary with respect to certain VIEs, which are consolidated in our fi nancial statements. Th e following is a description of our signifi cant investments in VIEs.
All of the VIEs are collateralized loan trusts that were established to issue securities and use the proceeds to principally invest in corporate loans and other permitted investments (including a new VIE which was consolidated in the fi rst quarter of 2012). Th e assets held by the trusts are legally isolated and not available to the Company. Th e liabilities of the VIEs are expected to be satisfi ed from the cash fl ows generated by the underlying loans held by the trusts, not from the assets of the Company. Th e Company has no further commitments to the VIEs.
In the second quarter of 2011, one of the VIEs was liquidated and its obligations were repaid pursuant to the priority of payments as defi ned in the indenture of the VIE. Such liquidation did not have a material eff ect on our consolidated fi nancial statements. In addition, in the second quarter of 2011, certain of our insurance subsidiaries invested in the formation of a new VIE which has been consolidated in our fi nancial statements.
Certain of our insurance subsidiaries are noteholders of the VIEs. Another subsidiary of the Company is the investment manager for the VIEs. As such, it has the power to direct the most signifi cant activities of the VIEs which materially impacts the economic performance of the VIEs.

CNO FINANCIAL GROUP, INC. - Form 10-K 164
PART II ITEM 8 Consolidated Financial Statements
Th e following table provides supplemental information about the assets and liabilities of the VIEs which have been consolidated in accordance with authoritative guidance (dollars in millions):
December 31, 2012
VIEs Eliminations
Net eff ect on consolidated balance sheet
ASSETS: Investments held by variable interest entities $ 814.3 $ — $ 814.3 Notes receivable of VIEs held by insurance subsidiaries — (78.5) (78.5)Cash and cash equivalents held by variable interest entities 54.2 — 54.2 Accrued investment income 1.8 — 1.8 Income tax assets, net 3.3 (2.6) .7 Other assets 9.6 — 9.6
TOTAL ASSETS $ 883.2 $ (81.1) $ 802.1LIABILITIES:
Other liabilities $ 39.9 $ (3.3) $ 36.6 Borrowings related to variable interest entities 767.0 — 767.0 Notes payable of VIEs held by insurance subsidiaries 82.5 (82.5) —
TOTAL LIABILITIES $ 889.4 $ (85.8) $ 803.6
December 31, 2011
VIEs Eliminations
Net eff ect on consolidated balance sheet
ASSETS: Investments held by variable interest entities $ 496.3 $ — $ 496.3 Notes receivable of VIEs held by insurance subsidiaries — (45.3) (45.3)Cash and cash equivalents held by variable interest entities 74.4 — 74.4 Accrued investment income 1.7 — 1.7 Income tax assets, net 6.8 (1.4) 5.4 Other assets 7.7 — 7.7
TOTAL ASSETS $ 586.9 $ (46.7) $ 540.2LIABILITIES:
Other liabilities $ 30.3 $ (.1) $ 30.2 Borrowings related to variable interest entities 519.9 — 519.9 Notes payable of VIEs held by insurance subsidiaries 49.3 (49.3) —
TOTAL LIABILITIES $ 599.5 $ (49.4) $ 550.1
Th e following table provides supplemental information about the revenues and expenses of the VIEs which have been consolidated in accordance with authoritative guidance, after giving eff ect to the elimination of our investment in the VIEs and investment management fees earned by a subsidiary of the Company (dollars in millions):
2012 2011 2010REVENUES:
Net investment income – policyholder and reinsurer accounts and other special-purpose portfolios $ 31.3 $ 18.8 $ 20.1 Fee revenue and other income 1.6 1.2 .6
Total revenues 32.9 20.0 20.7 EXPENSES:
Interest expense 20.0 11.8 12.9 Other operating expenses .6 .7 .6
Total expenses 20.6 12.5 13.5 Income before net realized investment losses and income taxes 12.3 7.5 7.2 Net realized investment losses (.4) (1.3) (3.7)INCOME BEFORE INCOME TAXES $ 11.9 $ 6.2 $ 3.5
Th e investment portfolios held by the VIEs are primarily comprised of corporate fi xed maturity securities which are almost entirely rated as below-investment grade securities. At December 31, 2012, such securities had an amortized cost of $809.3 million; gross unrealized gains of $6.6 million; gross unrealized losses of $1.6 million; and an estimated fair value of $814.3 million.

CNO FINANCIAL GROUP, INC. - Form 10-K 165
PART II ITEM 8 Consolidated Financial Statements
Th e following table sets forth the amortized cost and estimated fair value of the investments held by the VIEs at December 31, 2012, by contractual maturity. Actual maturities will diff er from contractual maturities because borrowers may have the right to call or prepay obligations with or without penalties.
(Dollars in millions) Amortized cost Estimated fair valueDue in one year or less $ 3.8 $ 3.8Due after one year through fi ve years 400.7 402.3Due after fi ve years through ten years 404.8 408.2TOTAL $ 809.3 $ 814.3
Th e following table sets forth the amortized cost and estimated fair value of those investments held by the VIEs with unrealized losses at December 31, 2012, by contractual maturity. Actual maturities will diff er from contractual maturities because borrowers may have the right to call or prepay obligations with or without penalties.
(Dollars in millions) Amortized cost Estimated fair valueDue in one year or less $ 1.8 $ 1.8Due after one year through fi ve years 118.6 117.1Due after fi ve years through ten years 54.4 54.3TOTAL $ 174.8 $ 173.2
Th ere were no investments held by the VIEs rated below-investment grade which have been continuously in an unrealized loss position exceeding 20 percent of the cost basis as of December 31, 2012.
During 2012, we recognized net realized investment losses on the VIE investments of $.4 million, which were comprised of $.4 million of net gains from the sales of fi xed maturities, and $.8 million of writedowns of investments for other than temporary declines in fair value recognized through net income. During 2011, we recognized net realized investment losses on the VIE investments of $1.3 million, which were comprised of $3.0 million of net gains from the sales of fi xed maturities, and $4.3 million of writedowns of investments for other than temporary declines in fair value recognized through net income. During 2010, we recognized net realized investment losses on the VIE investments of $3.7 million, which were comprised of $.4 million of net losses from the sales of fi xed maturities, and $3.3 million of writedowns of investments for other than temporary declines in fair value recognized through net income.
At December 31, 2012, there were no investments held by the VIEs that were in default.
During 2012, $34.9 million of investments held by the VIEs were sold which resulted in gross investment losses (before income taxes) of $.3 million. During 2011, $27.5 million of investments held by the VIEs were sold which resulted in gross investment losses (before income taxes) of $2.7 million.
At December 31, 2012, the VIEs held: (i) investments with a fair value of $114.1 million and gross unrealized losses of $.7 million that had been in an unrealized loss position for less than twelve months; and (ii) investments with a fair value of $59.1 million and gross unrealized losses of $.9 million that had been in an unrealized loss position for greater than twelve months.
At December 31, 2011, the VIEs held: (i) investments with a fair value of $349.9 million and gross unrealized losses of $6.0 million that had been in an unrealized loss position for less than twelve months; and (ii) investments with a fair value of $33.0 million and gross unrealized losses of $1.7 million that had been in an unrealized loss position for greater than twelve months.
Th e investments held by the VIEs are evaluated for other-than-temporary declines in fair value in a manner that is consistent with the Company’s fi xed maturities, available for sale.
In addition, the Company, in the normal course of business, makes passive investments in structured securities issued by VIEs for which the Company is not the investment manager. Th ese structured securities include asset-backed securities, collateralized debt obligations, commercial mortgage-backed securities, residential mortgage-backed securities and collateralized mortgage obligations. Our maximum exposure to loss on these securities is limited to our cost basis in the investment. We have determined that we are not the primary benefi ciary of these structured securities due to the relative size of our investment in comparison to the total principal amount of the individual structured securities and the level of credit subordination which reduces our obligation to absorb gains or losses.
At December 31, 2012, we hold investments in various limited partnerships, in which we are not the primary benefi ciary, totaling $28.4 million (classifi ed as other invested assets). At December 31, 2012, we had unfunded commitments to these partnerships of $40.5 million. Our maximum exposure to loss on these investments is limited to the amount of our investment.

CNO FINANCIAL GROUP, INC. - Form 10-K 166
PART II ITEM 9A Controls and Procedures
NOTE 16 SUBSEQUENT EVENT
On February 11, 2013, we commenced a tender off er to purchase for cash any and all of our outstanding 7.0% Debentures. Th e tender off er (the “Off er”) is being made pursuant to the terms set forth in our Off er to Purchase, dated February 11, 2013 (the “Off er to Purchase”), and the related Letter of Transmittal. Th e Off er will expire on March 27, 2013, (the “Expiration Date”) unless it is extended or earlier terminated by us.
Th e Off er is being conducted as part of our previously announced securities repurchase program. As of February 8, 2013, we had repurchase capacity of approximately $350.0 million under our securities repurchase program. As of February 8, 2013, there was $93.0 million aggregate principal amount of 7.0% Debentures outstanding.
Pursuant to the terms of the Off er, holders of the 7.0% Debentures who tender and do not withdraw their 7.0% Debentures prior to the Expiration Date, will receive, for each $1,000 principal amount of such 7.0% Debentures, a cash purchase price (the “Purchase Price”) equal to the sum of: (i) the average volume weighted average price of our common stock (as defi ned in the Off er to Purchase) multiplied by 183.5145; plus (ii) a fi xed cash amount of $61.25, provided that in no event will the Purchase Price be less than $1,454.13 per $1,000 principal amount of such 7.0% Debentures. Th e Purchase Price will not be adjusted at any time during the Off er for any dividends declared and/or paid on our common stock during the Off er. In addition to the Purchase Price, holders will receive accrued and unpaid interest on any 7.0% Debentures that are tendered to, but excluding, the settlement date of the off er.
ITEM 9 Changes in and Disagreements with Accountants on Accounting and Financial Disclosure
None.
ITEM 9A Controls and Procedures
Evaluation of Disclosure Controls and Procedures
CNO’s management, under the supervision and with the participation of the Chief Executive Offi cer and the Chief Financial Offi cer, evaluated the eff ectiveness of CNO’s disclosure controls and procedures (as defi ned in Rules 13a-15(e) and 15d-15(e) under the Securities Exchange Act of 1934, as amended). Based on its evaluation, the Chief Executive Offi cer and Chief Financial Offi cer concluded that, as of December 31, 2012, CNO’s disclosure controls and procedures were eff ective to ensure that information required to be disclosed by CNO in reports that it fi les
or submits under the Securities Exchange Act of 1934 is recorded, processed, summarized and reported within the time periods specifi ed in the SEC’s rules and forms. Disclosure controls and procedures are also designed to reasonably assure that such information is accumulated and communicated to our management, including our Chief Executive Offi cer and Chief Financial Offi cer, as appropriate, to allow timely decisions regarding required disclosure.
Limitations on the Eff ectiveness of Controls
Our management, including our Chief Executive Offi cer and Chief Financial Offi cer, does not expect that our disclosure controls over fi nancial reporting will prevent all error and fraud. A control system, no matter how well designed and operated, can provide only reasonable, not absolute, assurance that the control system’s objectives will be met. Further, the design of a control system must refl ect the fact that there are resource constraints, and the benefi ts of controls must be
considered relative to their costs. Because of the inherent limitations in all control systems, no evaluation of controls can provide absolute assurance that all control issues and instances of fraud, if any, have been detected. Th ese inherent limitations include the realities that judgments in decision-making can be faulty and that breakdowns can occur because of error or mistake. Controls can also be circumvented by the individual acts of some persons, by collusion of two or more

CNO FINANCIAL GROUP, INC. - Form 10-K 167
PART II ITEM 9B Other Information
people, or by management override of the controls. Th e design of any system of controls is based in part on certain assumptions about the likelihood of future events, and there can be no assurance that any design will succeed in achieving its stated goals under all potential future conditions. Over time, controls may become inadequate because
of changes in conditions or deterioration in the degree of compliance with policies or procedures. Because of the inherent limitations in a cost-eff ective control system, misstatements due to error or fraud may occur and not be detected.
Conclusion Regarding the Eff ectiveness of Disclosure Controls and Procedures
Based on our controls evaluation, our Chief Executive Offi cer and Chief Financial Offi cer concluded that as of the end of the period covered by this annual report, our disclosure controls and procedures were eff ective to provide reasonable assurance that: (i) the information required to be disclosed by us in reports that we fi le or submit under the
Exchange Act is recorded, processed, summarized and reported within the time periods specifi ed in the SEC’s rules and forms; and (ii) material information is accumulated and communicated to our management, including our Chief Executive Offi cer and Chief Financial Offi cer, as appropriate to allow timely decisions regarding required disclosure.
Management’s Report on Internal Control Over Financial Reporting
Our management is responsible for establishing and maintaining adequate internal control over fi nancial reporting, as such term is defi ned in Rules 13a-15(f ) and 15d-15(f) under the Securities Exchange Act of 1934. Under the supervision and with the participation of our management, including our Chief Executive Offi cer and Chief Financial Offi cer, we conducted an evaluation of the eff ectiveness of our internal control over fi nancial reporting based on the framework in Internal Control - Integrated Framework issued by the Committee
of Sponsoring Organizations of the Treadway Commission. Based on our evaluation under the framework in Internal Control - Integrated Framework, our management concluded that our internal control over fi nancial reporting was eff ective as of December 31, 2012.
Th e eff ectiveness of our internal control over fi nancial reporting as of December 31, 2012 has been audited by PricewaterhouseCoopers LLP, an independent registered public accounting fi rm, as stated in their report which is included herein.
Changes to Internal Control Over Financial Reporting
As required by Rule 15d-15(d) under the Securities and Exchange Act of 1934, under the supervision and with the participation of our management, including our Chief Executive Offi cer and Chief Financial Offi cer, an evaluation of the Company’s internal control over fi nancial reporting was conducted to determine whether any changes occurred during the quarter ended December 31, 2012, that have materially aff ected, or are reasonably likely to materially aff ect, the Company’s internal control over fi nancial reporting. As reported in our Form 10-Q/A for the quarterly period ended September 30, 2012, we identifi ed an inadvertent error related to the calculation of shadow adjustments impacting accumulated other comprehensive income. Specifi cally,
controls in place to ensure the accurate calculation of these adjustments did not operate eff ectively. Th erefore, management concluded that the Company’s disclosure controls and procedures were not eff ective as of September 30, 2012. During the quarter ended December 31, 2012, we have emphasized the importance of performing and reviewing calculations consistent with the design of our internal control structure in an eff ort to ensure controls operate eff ectively. Th e Company has completed its testing of the controls over the calculation of shadow adjustments and concluded that the material weakness identifi ed as of September 30, 2012 has been remediated.
ITEM 9B Other InformationNone.

CNO FINANCIAL GROUP, INC. - Form 10-K 168
PART III ITEM 10 Directors, Executive Offi cers and Corporate Governance
PART III
ITEM 10 Directors, Executive Offi cers and Corporate Governance
We will provide information that is responsive to this Item 10 in our defi nitive proxy statement or in an amendment to this Annual Report not later than 120 days after the end of the fi scal year covered by this Annual Report. Th at information is incorporated by reference into this Item 10. Additional information called for by this item is contained in Part I of this Annual Report under the caption ” Executive Offi cers of the Registrant.”
ITEM 11 Executive CompensationWe will provide information that is responsive to this Item 11 in our defi nitive proxy statement or in an amendment to this Annual Report not later than 120 days after the end of the fi scal year covered by this Annual Report. Th at information is incorporated by reference into this Item 11.
ITEM 12 Security Ownership of Certain Benefi cial Owners and Management and Related Stockholder Matters
We will provide information that is responsive to this Item 12 in our defi nitive proxy statement or in an amendment to this Annual Report not later than 120 days after the end of the fi scal year covered by this Annual Report. Th at information is incorporated by reference into this Item 12.
ITEM 13 Certain Relationships and Related Transactions, and Director Independence
We will provide information that is responsive to this Item 13 in our defi nitive proxy statement or in an amendment to this Annual Report not later than 120 days after the end of the fi scal year covered by this Annual Report. Th at information is incorporated by reference into this Item 13.
ITEM 14 Principal Accountant Fees and ServicesWe will provide information that is responsive to this Item 14 in our defi nitive proxy statement or in an amendment to this Annual Report not later than 120 days after the end of the fi scal year covered by this Annual Report. Th at information is incorporated by reference into this Item 14.

CNO FINANCIAL GROUP, INC. - Form 10-K 169
PART IV ITEM 15 Exhibits and Financial Statement Schedules
PART IV
ITEM 15 Exhibits and Financial Statement Schedules(a) 1. Financial Statements. See Index to Consolidated Financial Statements on page 105 for a list of fi nancial statements included in this Report.
2. Financial Statement Schedules:Schedule II -- Condensed Financial Information of Registrant (Parent Company)Schedule IV -- Reinsurance
All other schedules are omitted, either because they are not applicable, not required, or because the information they contain is included elsewhere in the consolidated fi nancial statements or notes.
3. Exhibits. See Exhibit Index immediately preceding the Exhibits fi led with this report.

CNO FINANCIAL GROUP, INC. - Form 10-K 170
PART IV Signature
Signature
Pursuant to the requirements of the Securities Exchange Act of 1934, the Registrant has duly caused this report to be signed on its behalf by the undersigned thereunto duly authorized.
CNO FINANCIAL GROUP, INC. Dated: February 19, 2013 By: /s/ Edward J. Bonach Edward J. Bonach Chief Executive Offi cer
Pursuant to the requirements of the Securities Exchange Act of 1934, this Report has been signed below by the following persons on behalf of the Registrant and in the capacities and on the dates indicated:
Signature Title (Capacity) Date/s/ EDWARD J. BONACH Director and Chief Executive Offi cer February 19, 2013Edward J. Bonach (Principal Executive Offi cer) /s/ FREDERICK J. CRAWFORD Executive Vice President and Chief Financial Offi cer February 19, 2013Frederick J. Crawford (Principal Financial Offi cer) /s/ JOHN R. KLINE Senior Vice President and Chief Accounting Offi cer February 19, 2013John R. Kline (Principal Accounting Offi cer) /s/ ELLYN L. BROWN Director February 19, 2013Ellyn L. Brown /s/ ROBERT C. GREVING Director February 19, 2013Robert C. Greving /s/ MARY R. HENDERSON Director February 19, 2013Mary R. Henderson /s/ R. KEITH LONG Director February 19, 2013R. Keith Long /s/ NEAL C. SCHNEIDER Director February 19, 2013Neal C. Schneider /s/ FREDERICK J. SIEVERT Director February 19, 2013Frederick J. Sievert /s/ MICHAEL T. TOKARZ Director February 19, 2013Michael T. Tokarz /s/ JOHN G. TURNER Director February 19, 2013John G. Turner

CNO FINANCIAL GROUP, INC. - Form 10-K 171
PART IV Report of Independent Registered Public Accounting Firm on Financial Statement Schedules
Report of Independent Registered Public Accounting Firm on Financial Statement Schedules
To the Shareholders and Board of Directors of CNO Financial Group, Inc.:
Our audits of the consolidated fi nancial statements and of the eff ectiveness of internal control over fi nancial reporting of CNO Financial Group, Inc. and subsidiaries referred to in our report dated February 19, 2013 appearing under Item 8 of this Form 10-K also included an audit of the fi nancial statement schedules at December 31, 2012 and 2011 and for the years ended December 31, 2012, 2011 and 2010 listed in Item 15(a)(2) of this Form 10-K. In our opinion, these fi nancial statement schedules present fairly, in all material respects, the information set forth therein when read in conjunction with the related consolidated fi nancial statements.
As discussed in Note 2 to the consolidated fi nancial statements, the Company changed the manner in which it accounts for costs associated with acquiring or renewing insurance contracts eff ective January 1, 2012.
/s/PricewaterhouseCoopers LLP
Indianapolis, IndianaFebruary 19, 2013

CNO FINANCIAL GROUP, INC. - Form 10-K 172
PART IV SCHEDULE II Condensed Financial Information of Registrant (Parent Company)
SCHEDULE II Condensed Financial Information of Registrant (Parent Company)
Balance Sheet as of December 31, 2012 and 2011
(Dollars in millions) 2012 2011ASSETSFixed maturities, available for sale, at fair value (amortized cost: 2012 - $66.3; 2011 - $93.3) $ 68.5 $ 93.5 Cash and cash equivalents - unrestricted 165.7 70.2 Cash and cash equivalents - restricted — 26.0 Equity securities at fair value (cost: 2012 - $28.5; 2011 - $18.7) 30.0 17.9 Trading securities 2.3 16.5 Other invested assets 26.3 28.6 Investment in wholly-owned subsidiaries (eliminated in consolidation) 6,034.5 5,488.6 Receivable from subsidiaries (eliminated in consolidation) 1.4 4.1 Other assets 22.7 19.1 TOTAL ASSETS $ 6,351.4 $ 5,764.5LIABILITIES AND SHAREHOLDERS’ EQUITYLIABILITIES:
Notes payable $ 1,004.2 $ 857.9 Payable to subsidiaries (eliminated in consolidation) 110.9 84.6 Income tax liabilities, net 105.6 100.2 Investment borrowings — 24.8 Other liabilities 81.4 83.2
Total liabilities 1,302.1 1,150.7 Commitments and Contingencies Shareholders’ equity:
Common stock and additional paid-in capital ($0.01 par value, 8,000,000,000 shares authorized, shares issued and outstanding: 2012 – 221,502,371; 2011 – 241,304,503) 4,176.9 4,364.3 Accumulated other comprehensive income 1,197.4 781.6 Accumulated defi cit (325.0) (532.1)
TOTAL SHAREHOLDERS’ EQUITY 5,049.3 4,613.8TOTAL LIABILITIES AND SHAREHOLDERS’ EQUITY $ 6,351.4 $ 5,764.5
Th e accompanying notes are an integral part of the consolidated fi nancial statements.
SCHEDULE II Condensed Financial Information of Registrant (Parent Company)
Statement of Operations for the years ended December 31, 2012, 2011 and 2010
(Dollars in millions) 2012 2011 2010REVENUES:
Net investment income (loss) $ 22.3 $ (4.0) $ — Net realized investment gains 1.9 1.0 — Investment income from subsidiaries (eliminated in consolidation) — .2 —
Total revenues 24.2 (2.8) — EXPENSES:
Interest expense 66.6 76.3 79.3 Intercompany expenses (eliminated in consolidation) .4 .3 1.3 Operating costs and expenses 50.9 53.8 49.3 Loss on extinguishment of debt 200.2 3.4 6.8
Total expenses 318.1 133.8 136.7 Loss before income taxes and equity in undistributed earnings of subsidiaries (293.9) (136.6) (136.7)
Income tax benefi t on period income (59.8) (42.2) (50.8)Loss before equity in undistributed earnings of subsidiaries (234.1) (94.4) (85.9)
Equity in undistributed earnings of subsidiaries (eliminated in consolidation) 455.1 430.1 326.5 NET INCOME $ 221.0 $ 335.7 $ 240.6
Th e accompanying notes are an integral part of the consolidated fi nancial statements.

CNO FINANCIAL GROUP, INC. - Form 10-K 173
PART IV SCHEDULE II Condensed Financial Information of Registrant (Parent Company)
SCHEDULE II Condensed Financial Information of Registrant (Parent Company)
Statement of Cash Flows for the years ended December 31, 2012, 2011 and 2010
(Dollars in millions) 2012 2011 2010Cash fl ows used by operating activities $ (95.3) $ (85.5) $ (119.1)Cash fl ows from investing activities:
Sales of investments 159.7 1,422.9 — Sales of investments - affi liated* — 10.0 — Purchases of investments (145.0) (1,569.5) — Purchases of investments - affi liated* — (10.0) — Net sales (purchases) of trading securities 37.4 (16.5) — Dividends received from consolidated subsidiary, net of capital contributions* 245.0 236.0 26.6 Change in restricted cash 26.0 (26.0) —
Net cash provided by investing activities 323.1 46.9 26.6 Cash fl ows from fi nancing activities:
Issuance of notes payable, net 944.5 — 756.1 Payments on notes payable (810.6) (144.8) (793.6)Issuance of common stock 3.1 2.2 — Payments to repurchase common stock (180.2) (69.8) — Common stock dividends paid (13.9) — — Expenses related to extinguishment of debt (183.0) — — Amount paid to extinguish the benefi cial conversion feature associated with repurchase of convertible debentures (24.0) — — Investment borrowings - repurchase agreements, net (24.8) 24.8 — Issuance of notes payable to affi liates* 208.6 169.7 177.0 Payments on notes payable to affi liates* (52.0) (33.3) (32.3)
Net cash provided (used) by fi nancing activities (132.3) (51.2) 107.2 Net increase (decrease) in cash and cash equivalents 95.5 (89.8) 14.7
Cash and cash equivalents, beginning of the year 70.2 160.0 145.3 CASH AND CASH EQUIVALENTS, END OF THE YEAR $ 165.7 $ 70.2 $ 160.0* Eliminated in consolidation.
Th e accompanying notes are an integral part of the consolidated fi nancial statements.

CNO FINANCIAL GROUP, INC. - Form 10-K 174
PART IV SCHEDULE II Condensed Financial Information of Registrant (Parent Company)
SCHEDULE II Notes to Condensed Financial Information
1. Basis of Presentation
Th e condensed fi nancial information should be read in conjunction with the consolidated fi nancial statements of CNO Financial Group, Inc. Th e condensed fi nancial information includes the accounts and activity of the parent company.
Certain items related to our insurance subsidiaries have been restated to refl ect the adoption of authoritative guidance related to the accounting for incremental direct costs associated with the successful acquisition of new or renewal insurance contracts. Refer to the note to the consolidated fi nancial statements entitled “Summary of Signifi cant Accounting Policies - Recently Issued Accounting Standards” in Item 8 for additional information. Th e adoption of such guidance, referred to as ASU 2010-26, aff ected prior period information as follows (dollars in millions):
December 31, 2011Amounts prior to adoption of ASU 2010-26 Eff ect of adoption of ASU 2010-26 As reported
Investment in wholly-owned subsidiaries $ 5,907.4 $ (418.8) $ 5,488.6 Total assets 6,183.3 (418.8) 5,764.5 Accumulated other comprehensive income 625.5 156.1 781.6 Retained earnings (accumulated defi cit) 42.8 (574.9) (532.1)Total shareholders’ equity 5,032.6 (418.8) 4,613.8 Total liabilities and shareholders’ equity 6,183.3 (418.8) 5,764.5
Year ended December 31, 2011Amounts prior to adoption of ASU 2010-26 Eff ect of adoption of ASU 2010-26 As reported
Equity in undistributed earning of subsidiaries $ 476.9 $ (46.8) $ 430.1Net income 382.5 (46.8) 335.7
Year ended December 31, 2010Amounts prior to adoption of ASU 2010-26 Eff ect of adoption of ASU 2010-26 As reported
Equity in undistributed earning of subsidiaries $ 370.5 $ (44.0) $ 326.5Net income 284.6 (44.0) 240.6
SCHEDULE IV Reinsurance
for the years ended December 31, 2012, 2011 and 2010
(Dollars in millions) 2012 2011 2010Life insurance inforce:
Direct $ 53,750.8 $ 56,540.1 $ 59,388.5 Assumed 325.7 349.3 374.2 Ceded (12,392.4) (13,616.9) (14,800.9)
NET INSURANCE INFORCE $ 41,684.1 $ 43,272.5 $ 44,961.8PERCENTAGE OF ASSUMED TO NET .8% .8% .8%
2012 2011 2010Insurance policy income:
Direct $ 2,591.1 $ 2,540.6 $ 2,525.5 Assumed 69.4 80.4 92.6 Ceded (220.0) (238.1) (258.6)
NET PREMIUMS $ 2,440.5 $ 2,382.9 $ 2,359.5 PERCENTAGE OF ASSUMED TO NET 2.8% 3.4% 3.9%

CNO FINANCIAL GROUP, INC. - Form 10-K 175
PART IV Directors of CNO Financial Group, Inc

Th is page inten tionally left blank.

Th is page inten tionally left blank.

Th is page inten tionally left blank.

Meeting of ShareholdersOur annual meeting of shareholders will be held at 8:00 a.m. (EDT) on May 8, 2013, in the auditorium of CNO Financial Group’s headquarters at 11825 N. Pennsylvania Street, Carmel, IN. This information is also included in the meeting notice, proxy statement and form of proxy that were sent to each shareholder with this annual report. You may vote your proxy by executing and returning your form of proxy. If a brokerage firm holds your shares, you may also be able to vote over the inter-net or by telephone; consult your broker for information.
Shareholder ServicesIf you are a registered shareholder and have a questionabout your account, or if you would like to report a change in your name or address, please call CNO Financial Group’s transfer agent, American Stock Transfer & Trust Company, (800) 937-5449 or (718) 921-8124. Shareholders may also reach American Stock Transfer on the web at www.amstock.com, by email at [email protected], or by mail:American Stock Transfer & Trust Company6201 15th AvenueBrooklyn, NY 11219
Ways to Learn More About UsInvestor Hotline: Call (800) 426-6732 — in Indianapolis,(317) 817-2893 — to receive annual reports, Form 10-Ks, Form 10-Qs and other lengthy documents by mail, or to speak with an investor relations representative. Email: Contact us at [email protected] to ask questions or request materials.
Quarterly ReportingTo receive CNO Financial Group’s quarterly results as soon as they are announced, please contact the investor relations department or visit http://investor.cnoinc.com, to be placed on the mailing list.
Copies of This ReportTo obtain additional copies of this report or to receiveother free investor materials, contact the investor rela-tions department. To view these reports online, please visit http://investor.cnoinc.com.
Stock InformationCNO Financial Group’s common stock is traded primarily on the New York Stock Exchange (trading symbol: CNO).
Investor Information

CNO Financial Group, Inc.11825 N. Pennsylvania Street
Carmel, IN 46032
(317) 817-6100
(03/13) 130501© 2013 CNO Financial Group, Inc.
cnoinc.com