United States Department of Agriculture - Ohio Department of

Department of AgricultureDepartment of Agriculture
2012 Annual Report

2012 Ohio Department of Agriculture Annual Report and Sta s cs 1
2 2012 Ohio Department of Agriculture Annual Report and Sta s cs
Message from the Ohio Department of Agriculture Director ................................................................................................. 5
2012 Ohio Department of Agriculture Annual ReportOhio Department of Agriculture ............................................................................................................................................. 6Senior Administrators .............................................................................................................................................................. 82012-2013 Events .................................................................................................................................................................. 10
Protec ng Plant and Animal Life Animal Health and Animal Disease Diagnos c Laboratory ................................................................................. 12 Ohio Livestock Care Standards ............................................................................................................................ 13 Plant Health ........................................................................................................................................................ 14 Ohio Plant Diagnos c Network ........................................................................................................................... 16
Safeguarding the Food Supply Consumer Protec on Laboratory ........................................................................................................................ 17 Dairy .................................................................................................................................................................... 19 Food Safety ......................................................................................................................................................... 20 Meat Inspec on .................................................................................................................................................. 21
Protec ng the Public Amusement Ride Safety ...................................................................................................................................... 22 Enforcement........................................................................................................................................................ 23 Livestock Environmental Permi ng ................................................................................................................... 24 Weights and Measures ........................................................................................................................................ 25
Suppor ng Rural Ohio Farmland Preserva on ........................................................................................................................................ 26 Markets ............................................................................................................................................................... 27 Ohio Century Farm ............................................................................................................................................. 28
2012 Ohio Agricultural Sta s csAcknowledgements ............................................................................................................................................................... 30Ohio Historical Agricultural Sta s cs; Table 1 ....................................................................................................................... 31Profi le of Ohio Agriculture 2012; Table 2 .............................................................................................................................. 33Ohio County Ranking; Table 3 ............................................................................................................................................... 34Index Numbers of Crop and Livestock Produc on in Ohio 2009-2012; Table 4 .................................................................... 35
Crop DataAnnual Summary: Crop Produc on and Value; Ohio 2011-2012, United States 2012; Table 5 ............................................. 36Ohio Crops, Record Highs & Lows: Harvested Acres, Yield and Produc on; Table 6 ............................................................. 38 Ohio Agricultural Sta s cs Districts ...................................................................................................................................... 39Number of Farms, Average Size of Farm and Land in Farms, Ohio and United States, 2010-2012; Table 7 .............................................................................................................................................................. 39Ohio County Es mates, 2011-2012 Corn for Grain: Acres, Yield and Produc on; Table 8 ........................................................................................................ 40 Soybeans for Grain: Acres, Yield and Produc on; Table 9 ................................................................................................ 42 All Wheat: Acres, Yield and Produc on; Table 10 ............................................................................................................. 44 Alfalfa Hay: Acres, Yield and Produc on; Table 11 ............................................................................................................ 46 Other Hay: Acres, Yield and Produc on; Table 12 ............................................................................................................ 48 Cash Rents: Non-Irrigated Cropland and Pasture; Table 13 .............................................................................................. 50Processing Tomatoes: Acres, Yield, Produc on; Ohio 2008-2012; Table 14 .......................................................................... 52Burley Tobacco Acres, Yield and Produc on, Ohio 2008-2012; Table 15 .............................................................................. 52Fall Potato Acres, Yield and Produc on, Ohio, 2008-2012; Table 16 ..................................................................................... 52
2012 Ohio Department of Agriculture Annual Report and Sta s cs 3
Maple Syrup, Ohio 2008-2012; Table 17 ............................................................................................................................... 52Grain Stocks: By Posi on and Quarter, Ohio, 2011-2012; Table 18 ........................................................................................53Monthly Marke ngs of Wheat, Corn and Soybeans, Percent of Annual Sales by Months, Ohio, 2010-2011 and 2011-2013; Table 19 .................................................................53Grain Stocks: Total Stocks and Percent of Produc on, by Quarters, Ohio, 2011-2012; Table 20 ...........................................54Off -Farm Commercial Grain Storage Capacity, December 1, 2011-2012; Table 21 ................................................................54
Livestock DataOhio County Es mates, 2012-2013, All Ca le and Calves and Milk Cows: Inventory; 2011-2012 Milk Sold; Table 22 ............................................................................................................................55 Ca le and Calves: Ohio and United States, January 1, 2012-2013; Table 23 .........................................................................57Ca le and Calf Produc on, Ohio, 2008-2012; Table 24 ..........................................................................................................57Income from Ca le and Calf Produc on, Ohio, 2008-2012; Table 25 ....................................................................................57Milk Cows on Farms, Milk Per Cow, Total Milk Produc on, Milkfat, by Months, Ohio 2011-2012; Table 26.....................................................................................................................................................58Milk Produc on and Disposi on, Ohio, 2011-2012; Table 27 ................................................................................................58Milk Marketed, Price, Cash Receipts, and Value, Ohio, 2011-2012; Table 28 ........................................................................58 Milk Cow Opera ons and Inventory by Size Groups, Ohio, 2002, 2007; Table 29 ..................................................................58Manufactured Dairy Products Produc on by Months, Ohio, 2011-2012; Table 30................................................................59 Hog Inventory Numbers, Pig Crop and Disposi on, Ohio, 2008-2012; Table 31 ....................................................................59 Hogs and Pigs: Quarterly Inventory by Classes, Ohio, 2011-2012, United States 2012; Table 32 ..........................................60Hog Produc on and Income, Ohio, 2008-2012; Table 33 .......................................................................................................60Farrowings, Pigs per Li er, and Pig Crop, Ohio, 2009-2012; Table 34 ....................................................................................60 Hog and Pig Opera ons and Inventory by Size Groups, Ohio, 2002, 2007; Table 35 ..............................................................60 Sheep: Ohio and United States, January 1, 2012-2013; Table 36 ...........................................................................................61Sheep and Lamb Inventory and Disposi on, Ohio, 2008-2012; Table 37 ...............................................................................61Wool Produc on and Value, Ohio, 2008-2012; Table 38 ........................................................................................................61 Commercial Slaughter by Months, Ohio, 2011-2012; Table 39 ..............................................................................................62
Poultry Data and Honey Produc onChickens: Inventory by Classes, Ohio and United States, December 1, 2011-2013; Table 40 ................................................62Chicken Disposi on, Price and Value, Ohio and United States, 2011-2012; Table 41 ............................................................63Average Number of Layers on Hand and Eggs Produced by Months, Ohio, 2011-2012; Table 42 .........................................63 Egg Produc on, Price and Value, Ohio and United States, 2011-2012; Table 43 ...................................................................63 Broiler Produc on, Price and Value, Ohio and United States, 2011-2012; Table 44 ..............................................................64Turkey Produc on, Price and Value, Ohio and United States, 2011-2012; Table 45 ..............................................................64Bee Colonies and Honey Produc on, Ohio, 2008-2012; Table 46 ..........................................................................................64
Price and Economic DataPrices Received by Farmers for Selected Commodi es by Months, Ohio, 2011-2012; Table 47 ...........................................65Average Prices of Selected Commodi es, Ohio, 2011-2012; Table 48 ...................................................................................66 Average Prices Paid by Farmers for Feed and Fuels, Corn Belt, 2011-2013; Table 49 ............................................................66Ohio Farm Real Estate Value, 2008-2012; Table 50 ................................................................................................................67Indexes of Prices, United States, 2011-2012; Table 51 ...........................................................................................................67Ohio Historical Marke ng Year Average Prices by Selected Commodi es; Table 52 ..............................................................68Value of U.S. Foreign Trade and Trade Balance, Fiscal Years 2009-2012; Table 53 .................................................................69Farm Income Statement of Ohio, 2009-2011, and U.S., 2010-2011; Table 54 .......................................................................69Farm Assets, Debts and Ra os, U.S., 2008-2011; Table 55 .....................................................................................................70
2012 Weather DataOhio Climate Divisions ...........................................................................................................................................................71Monthly Temperature, Precipita on, Growing Degree Days (Base 50-Mod), and Devia on from Normal, Ohio, 2012; Table 56 ...............................................................................................................71
4 2012 Ohio Department of Agriculture Annual Report and Sta s cs
Last Occurrence of Cri cal Fahrenheit Temperatures, Spring 2012; Table 57 ........................................................................74First Occurrence of Cri cal Fahrenheit Temperatures, Fall 2012; Table 58 ............................................................................74
Crop DevelopmentCorn Development by Selected Dates, Ohio, 2011-2012, and 2008-2012 Average; Table 59 ................................................75 Soybean Development by Selected Dates, Ohio, 2011-2012, and 2008-2012 Average; Table 60 ..........................................76Winter Wheat Development by Selected Dates, Ohio, 2011-2012, and 2008-2012 Average; Table 61 .................................77 Oats Development by Selected Dates, Ohio, 2011-2012, and 2008-2012 Average; Table 62 ................................................77 Other Hay Harvested by Selected Dates, Ohio, 2011-2012, and 2008-2012 Average; Table 63 .............................................78Alfalfa Hay Harvested by Selected Dates, Ohio, 2011-2012, and 2008-2012 Average; Table 64 ...........................................78Days Suitable for Field Work in Ohio, 2011-2012, and 2008-2012 Average; Table 65 ............................................................79
Miscellaneous DataFloricultureNursery Crops: Producers, Quan ty Sold, and Sales, Ohio, 2009; Table 66 ...........................................................................80Nursery Crops: Percent of Sales by Category, 2009, and Inventory, January 1, 2007 and 2010, Ohio; Table 67 ......................................................................................................................................................80Nursery Crops: Opera ons by Gross Value of Sales, Ohio, 2009; Table 68 .............................................................................81Nursery Crops: Number of Hired Workers, Ohio, 2009; Table 69 ...........................................................................................81Commercial Floriculture Produc on and Value, Ohio, 2011-2012; Table 70 ..........................................................................82Po ed Flowering for Indoor or Pa o Use Number Sold by Size of Pot, Ohio, 2011-2012; Table 71 .......................................83
Fer lizer Consump on of Commercial Fer lizers in Ohio, 2008-2011; Table 72 ..................................................................................84Average Prices Paid by Farmers per Ton for Selected Commercial Fer lizers, 2011-2013; Table 73 ......................................84
2012 County Summaries; Table 74 .........................................................................................................................................85Ohio Agricultural Contacts ...................................................................................................................................................130

2012 Ohio Department of Agriculture Annual Report and Sta s cs 55
August 2013
At the Ohio Department of Agriculture, we spend a great deal of me formula ng and enforcing rules and rural policy that aff ect agriculture. Our policy decisions resonate through all levels of state government right down to the guy out in the fi eld thinking about how he is going to pay his taxes, keep his farm produc ve, and pass his business on to the next genera on.
I am from a farm family, so I can tell you with certainty that most farmers understand that change is inevitable. As a leader in state government, I can also tell you that as mes change, so must public policy.
The past several years have brought some incredible changes to this state.
Ohio is successfully emerging from one of the most pivotal periods in its history, during which me we closed a historic $7.7 billion budget imbalance without raising taxes. Governor Kasich has long believed that Ohio’s taxes are too high. The governor’s tax cuts will mean an income tax reduc on and small business tax cut. He also eliminated the estate tax, which means farmers will no longer be penalized for doing their jobs.
More good news for agriculture is that the governor’s Jobs and Transporta on Plan will inject $3 billion into infrastructure projects to help you move your grain and livestock across the state.
The result is that Ohio’s private sector has gone from losing hundreds of thousands of jobs to adding more than 160,000 jobs since 2011. Ohio’s strong agricultural produc on, along with a growing popula on and advances in technology, mean that the job poten al in food and agriculture-related fi elds in this state will only get stronger. The Bureau of Labor and Sta s cs projects jobs for agriculture and food science majors will grow 16 percent between 2008 and 2018. That is good news for our state.
Incredible changes have also been happening at the Ohio Department of Agriculture. Staff members spend a majority of their me and budget to uphold the department’s on-going du es of safeguarding the food supply and protec ng the state’s plant and animal interests. In addi on to those du es, there are several other topics on the forefront of our regulatory agenda, including nutrient management, interstate meat shipment, and implemen ng new du es to protect the public and non-na ve animals through the Dangerous Wild Animals Act.
Those are just a few of the issues that held our a en on in 2012. In the pages of this report, you will fi nd a comprehensive overview of these and other items.
The future of Ohio agriculture is bright and full of opportunity. Ohio agriculture and rural Ohio is about so much more than cows and combines. It is about technology, advances in science and a way to maintain the future of our state.
In the coming year, I look forward to working on your behalf.
Sincerely,
David T. DanielsDirector

6 2012 Ohio Department of Agriculture Annual Report and Sta s cs
The Ohio Department of Agriculture provides leadership for Ohio’s No. 1 industry – food and agriculture – to create greater economic
opportunity for Ohio’s farmers and processors; to preserve and enhance Ohio’s boun ful resources; and to partner with Ohio’s research ins tu ons to further the development of new agricultural products and services. The department administers numerous regulatory, food safety and consumer protec on programs for the benefi t of all Ohioans and helps build marke ng opportuni es for Ohio farmers and food processors.
The department’s workload is divided among the following divisions and programs: Administra on, Amusement Ride Safety, Animal Health, Consumer Protec on Laboratory, Dairy, Enforcement, Farmland Preserva on, Food Safety, Livestock Environmental Permi ng, Markets, Meat Inspec on, Ohio Grape Industries, Plant Health and Weights and Measures.
Ohio Department
David T. Daniels, Director
Howard F. Wise, Assistant Director
of

2012 Ohio Department of Agriculture Annual Report and Sta s cs 7
George McNab, Legisla ve Liaison
Michael Rodgers, Chief Legal Counsel
Erica Hawkins, Communica ons Director
Erin Honnold, Legisla ve Liaison
Cathy Dodson, Chief Financial Offi cer
Traci Orahood,Human Resources Administrator
Steve Swayne, Chief Informa on Offi cerSRob Kibler,
Facili es and Opera ons Chief
Janelle Mead, Deputy Director and Chief of Markets
John Schlichter, Deputy Director
Dr. Sereana Dresbach, Deputy Director
George McNab E
Agriculture

8 2012 Ohio Department of Agriculture Annual Report and Sta s cs
The mission of the Ohio Department of Agriculture is to protect Ohio ci zens by ensuring the safety of the state’s food supply and the health of Ohio’s food animals and plant life, and to create economic opportuni es for Ohio’s farmers, food processors and agribusinesses.

2012 Ohio Department of Agriculture Annual Report and Sta s cs 9
Senior Administrators at the Ohio Department of Agriculture: (pictured le to right) Traci Orahood, Rob Kibler, Erica Hawkins, Fran Elson Houston, Denise Franz King, Dr. Tony Forshey, Dr. Beverly Byrum, Dr. Sereana Dresbach, Dr. Michael Hockman, Howard Wise, Director David T. Daniels, John Schlichter, Janelle Mead, George McNab, Chuck Kirchner, Erin Honnold, Roger Tedrick, Ma Beal, Steve Swayne, Gary Hill, Kevin Elder, Michael Rodgers, and Cathy Dodson.

10 2012 Ohio Department of Agriculture Annual Report and Sta s cs
2012-2013eventsOhio Agriculture Week
Ohio Department of Agriculture Director David T. Daniels kicked off Ohio Agriculture Week in Ashville by induc ng the Der Decker Baurenhoff Farm into the Ohio Bicentennial Farm program. This farm is the fi rst to be inducted into the program, which was launched in 2013.
The Der Decker Baurenhoff Farm, owned by Bob Fagan, is one of 16 stops Daniels made during Ohio Agriculture Week, March 11-15, to honor local farmers, small businesses for the tremendous economic impact they have on the state.
Ohio Agriculture Week is celebrated each March to help educate Ohioans about the importance of the state’s $105 billion food and agriculture industry, on our dinner plates and beyond.
Ohio Department of Agriculture Director David T. Daniels (le ) presents a Bicentennial Farm cer fi cate to three genera ons of the Fagan family (second from le ): Bob Fagan, Kenneth Smith, Irene Fagan, Ann (Fagan) Smith, Terry Smith, and Eileen Smith.
Dangerous Wild Animals Facility
In 2012, legisla on was passed requiring all owners of dangerous wild animals to register with the Ohio Department of Agriculture’s Division of Animal Health. Registra ons were required to be completed by November 5, 2012.
Construc on of a state-of-the art holding facility began in late 2012. The purpose of the building is to hold dangerous wild animals in a secure environment un l appropriate re-loca on arrangements are made. The facility is key for the Ohio Department of Agriculture to uphold new regula ons governing the ownership of dangerous wild animals.
The facility is one-of-a kind, and was built with input from zoos and veterinarians to assure the security of the people caring for the animals and the general safety of people in the surrounding community, while at the same me maintaining the safety and comfort of the animals held in this building.
The new Dangerous Wild Animal facility on the Ohio Department of Agriculture’s Reynoldsburg campus helps keep people and non-na ve animals safe.
2012 Ohio Department of Agriculture Annual Report and Sta s cs 11
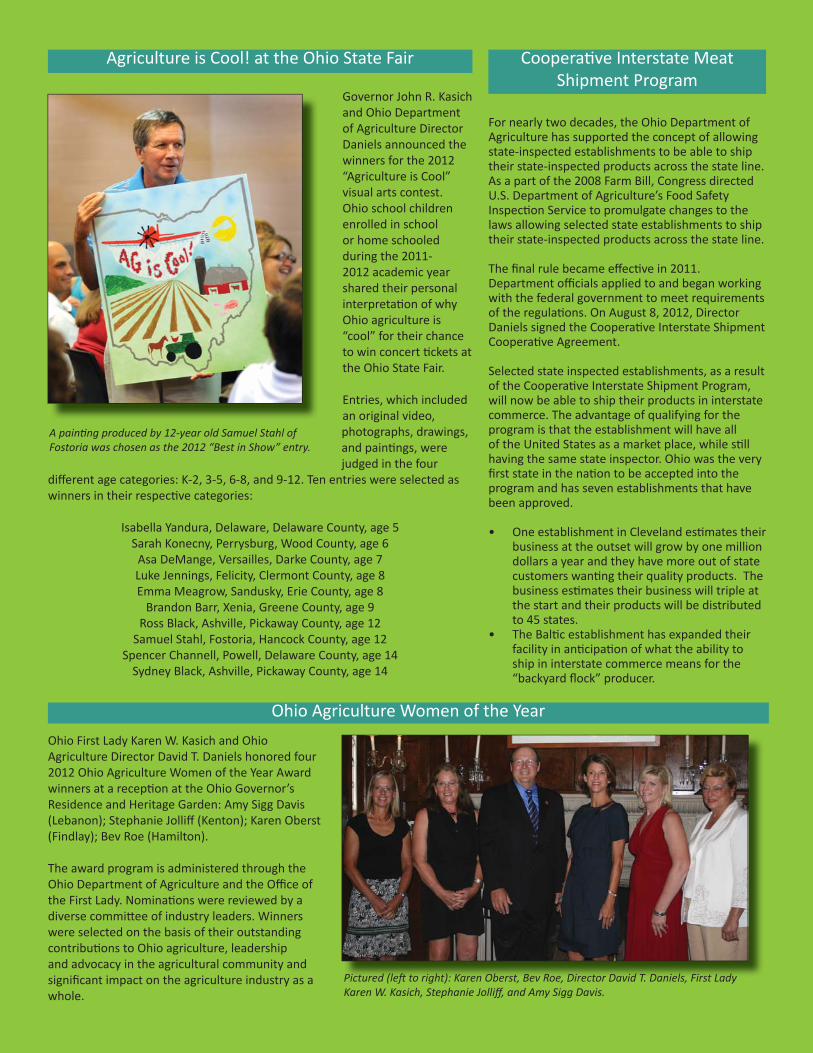
Governor John R. Kasich and Ohio Department of Agriculture Director Daniels announced the winners for the 2012 “Agriculture is Cool” visual arts contest. Ohio school children enrolled in school or home schooled during the 2011-2012 academic year shared their personal interpreta on of why Ohio agriculture is “cool” for their chance to win concert ckets at the Ohio State Fair.
Entries, which included an original video, photographs, drawings, and pain ngs, were judged in the four
diff erent age categories: K-2, 3-5, 6-8, and 9-12. Ten entries were selected as winners in their respec ve categories:
Isabella Yandura, Delaware, Delaware County, age 5Sarah Konecny, Perrysburg, Wood County, age 6
Asa DeMange, Versailles, Darke County, age 7Luke Jennings, Felicity, Clermont County, age 8Emma Meagrow, Sandusky, Erie County, age 8
Brandon Barr, Xenia, Greene County, age 9Ross Black, Ashville, Pickaway County, age 12
Samuel Stahl, Fostoria, Hancock County, age 12Spencer Channell, Powell, Delaware County, age 14
Sydney Black, Ashville, Pickaway County, age 14
Agriculture is Cool! at the Ohio State Fair Coopera ve Interstate Meat Shipment Program
For nearly two decades, the Ohio Department of Agriculture has supported the concept of allowing state-inspected establishments to be able to ship their state-inspected products across the state line. As a part of the 2008 Farm Bill, Congress directed U.S. Department of Agriculture’s Food Safety Inspec on Service to promulgate changes to the laws allowing selected state establishments to ship their state-inspected products across the state line.
The fi nal rule became eff ec ve in 2011. Department offi cials applied to and began working with the federal government to meet requirements of the regula ons. On August 8, 2012, Director Daniels signed the Coopera ve Interstate Shipment Coopera ve Agreement.
Selected state inspected establishments, as a result of the Coopera ve Interstate Shipment Program, will now be able to ship their products in interstate commerce. The advantage of qualifying for the program is that the establishment will have all of the United States as a market place, while s ll having the same state inspector. Ohio was the very fi rst state in the na on to be accepted into the program and has seven establishments that have been approved.
• One establishment in Cleveland es mates their business at the outset will grow by one million dollars a year and they have more out of state customers wan ng their quality products. The business es mates their business will triple at the start and their products will be distributed to 45 states.
• The Bal c establishment has expanded their facility in an cipa on of what the ability to ship in interstate commerce means for the “backyard fl ock” producer.
Ohio Agriculture Women of the YearOhio First Lady Karen W. Kasich and Ohio Agriculture Director David T. Daniels honored four 2012 Ohio Agriculture Women of the Year Award winners at a recep on at the Ohio Governor’s Residence and Heritage Garden: Amy Sigg Davis (Lebanon); Stephanie Jolliff (Kenton); Karen Oberst (Findlay); Bev Roe (Hamilton).
The award program is administered through the Ohio Department of Agriculture and the Offi ce of the First Lady. Nomina ons were reviewed by a diverse commi ee of industry leaders. Winners were selected on the basis of their outstanding contribu ons to Ohio agriculture, leadership and advocacy in the agricultural community and signifi cant impact on the agriculture industry as a whole.
A pain ng produced by 12-year old Samuel Stahl of Fostoria was chosen as the 2012 “Best in Show” entry.
Pictured (le to right): Karen Oberst, Bev Roe, Director David T. Daniels, First Lady Karen W. Kasich, Stephanie Jolliff , and Amy Sigg Davis.
12 2012 Ohio Department of Agriculture Annual Report and Sta s cs
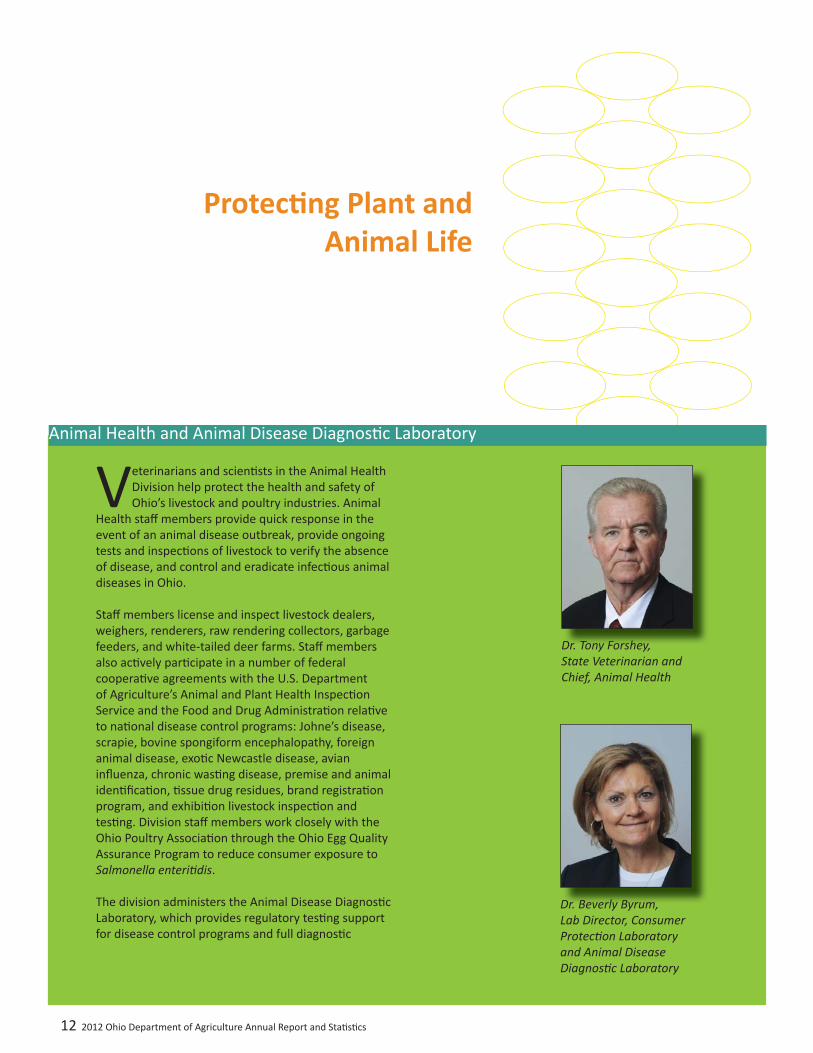
Veterinarians and scien sts in the Animal Health Division help protect the health and safety of Ohio’s livestock and poultry industries. Animal
Health staff members provide quick response in the event of an animal disease outbreak, provide ongoing tests and inspec ons of livestock to verify the absence of disease, and control and eradicate infec ous animal diseases in Ohio.
Staff members license and inspect livestock dealers, weighers, renderers, raw rendering collectors, garbage feeders, and white-tailed deer farms. Staff members also ac vely par cipate in a number of federal coopera ve agreements with the U.S. Department of Agriculture’s Animal and Plant Health Inspec on Service and the Food and Drug Administra on rela ve to na onal disease control programs: Johne’s disease, scrapie, bovine spongiform encephalopathy, foreign animal disease, exo c Newcastle disease, avian infl uenza, chronic was ng disease, premise and animal iden fi ca on, ssue drug residues, brand registra on program, and exhibi on livestock inspec on and tes ng. Division staff members work closely with the Ohio Poultry Associa on through the Ohio Egg Quality Assurance Program to reduce consumer exposure to Salmonella enteri dis.
The division administers the Animal Disease Diagnos c Laboratory, which provides regulatory tes ng support for disease control programs and full diagnos c
Protec ng Plant and Animal Life
Animal Health and Animal Disease Diagnos c Laboratory
Dr. Tony Forshey, State Veterinarian and Chief, Animal Health
Dr. Beverly Byrum, Lab Director, Consumer Protec on Laboratory and Animal Disease Diagnos c Laboratory

2012 Ohio Department of Agriculture Annual Report and Sta s cs 13
laboratory services for veterinarians, livestock producers and agribusinesses. It is one of 42 accredited laboratories in the United States. As the only American Associa on of Veterinary Laboratory Diagnos cians accredited laboratory in the state of Ohio, the lab operates under guidelines that ensure the quality of personnel, facili es and procedures.
This laboratory serves as a par cipa ng member of the Na onal Animal Health Laboratory Network, providing high-caliber diagnos c tes ng support in a number of animal disease situa ons and provides surge capacity for the na on in the event of a regional or na onal animal disease outbreak.
In 2012, division staff members con nued to enforce Ohio’s fi rst comprehensive set of livestock care standards, which went into eff ect in 2011. These standards are required by Ohio’s cons tu on following the passage of State Issue 2 in 2009. The statewide ballot ini a ve specifi ed crea on of the 13-member Ohio Livestock Care Standards Board with the responsibility of obtaining industry and public input to develop livestock care rules.
The standards apply to all species of livestock raised for food and fi ber, including: swine, poultry, dairy cows, beef ca le, veal, sheep, goats, llamas and alpacas. The care standards also apply to horses, ponies, mules and donkeys.
The standards are prac cal for livestock producers of all sizes and produc on systems. Proper care of livestock, guided by these regulatory standards, further assures the state’s goal of promo ng a safe, aff ordable food supply. The standards govern all aspects of animal care – water, food, handling,
LicensesLivestock Dealer ........................................................... 239Weigher ........................................................................ 643Renderer ........................................................................... 9Collector ....................................................................... 134Garbage Feeder .............................................................. 14
TestsAvian Serology ....................................................... 142,786Brucellosis ............................................................... 43,758Pseudorabies ............................................................. 2,387Equine Infec ous Anemia........................................ 29,788Johne’s .................................................................... 33,620Salmonella (SE) .......................................................... 7,754Pathology Cases ........................................................ 1,160Histological Slides and Tissues ................................ 16,489Chronic Was ng Disease ........................................... 3,735Scrapie ............................................................................ 52 Molecular Diagnos cs ............................................. 27,845Avian Infl uenza/Exo c Newcastle ........................... 21,298
Dangerous wild animal experts from across the na on met with State Veterinarian Dr. Tony Forshey (right) and other department staff to discuss care standards to be addressed in new legisla on.
housing, management, medicine, transporta on and humane euthanasia. The board meets three mes per year to discuss the standards.
Also in 2012, legisla on was passed requiring all owners of dangerous wild animals to register with the Ohio Department of Agriculture’s Division of Animal Health. Registra ons were required to be completed by November 5, 2012.
Following controlling board approval, construc on on a state-of-the-art holding facility began in late 2012. The purpose of the building is to hold dangerous, wild animals in a secure environment un l appropriate re-loca on arrangements are made. The facility is key to the Ohio Department of Agriculture being able to uphold new regula ons governing the ownership of dangerous wild animals.

14 2012 Ohio Department of Agriculture Annual Report and Sta s cs
The Plant Health Division is responsible for enforcing many consumer and public protec on regula ons. Staff du es include tes ng germina on of packaged seeds,
verifying label statements on feed and fer lizers, regula ng plant nursery stock, monitoring the fi nancial stability of grain elevators, registering pes cides, licensing pes cide applicators, inves ga ng pes cide use complaints, and working with the U.S. Department of Agriculture’s Animal Plant Health Inspec on Service and the U.S. Forest Service to control invasive pest species. The division’s goal is to assure businesses that produce, process and distribute agricultural products provide safe and properly labeled products to consumers.
Pes cide and Fer lizer Regula onThe division’s Pes cide and Fer lizer Regula on Program regulates the use and distribu on of pes cides as well as the manufacturing and distribu on of fer lizer, lime, and agricultural addi ves. This sec on issues licenses to pes cide applicators and serves as the registrar for pes cide and fer lizer companies. Through rou ne inspec ons, staff members enforce the state laws and rules that govern these ac vi es. In addi on to these responsibili es, staff members conduct inspec ons for the U.S. EPA in accordance with a coopera ve agreement to ensure compliance with the Federal Insec cide, Fungicide and Roden cide Act.
In 2012, there were 28,690 licensed pes cide applicators, 14,803 registered pes cide products and 4,498 registered specialty fer lizers in Ohio. Training and tes ng sessions for cer fi ca on and re-cer fi ca on of pes cide applicators were also held throughout the year, helping to assure the safe use of pes cides and preven ng misuse and mishandling.
This sec on also organizes the Clean Sweep Pes cide Disposal Program, holding three regional pes cide collec ons to assist farmers with a safe and environmentally responsible disposal of unusable, outdated pes cides.
Grain, Feed and Seed ProgramThe Grain, Feed and Seed Program licenses and regulates commodity handlers in Ohio; helps assure label claims are accurate on all agricultural, vegetable, fl ower and lawn seeds; and monitors animal feed, including pet food, to make sure claims of protein, fat, vitamins, minerals and an bio cs are accurate.
Licensed grain handlers are required to meet certain net worth requirements, verifi ed by fi nancial statements annually submi ed to the department. Licensed handlers are required to have insurance coverage equal to full-market value on all grain in their facili es to protect all or part of their losses in case of fi re or other disasters. This sec on also administers the state grain indemnity fund, which reimburses eligible farmers when a licensed elevator becomes insolvent.
Plant Health
Inspectors examine records and check produc on facili es for verifi ca on that feeds are manufactured properly. They help assure precau ons are taken to prevent possible cross-contamina on and that feeds are correctly labeled to prevent any prohibited material from being fed to ruminants.
Program staff works with the U.S. Food and Drug Administra on performing inspec ons to help prevent the occurrence of bovine spongiform encephalopathy. The sec on completed another successful year, fi nding no viola ons of these regula ons or any serious viola ons of the U.S. Food and Drug Administra on’s medicated feed regula ons.
Plant Pest ControlOhio’s green industry is one of the highest-value segments of the state’s agricultural sector. The Plant Pest Control Program helps protect the state’s plant nurseries and consumers by performing annual inspec ons to detect pests that pose a threat to plants. This sec on enforces federal and state quaran nes that restrict the movement of ar cles capable of harboring destruc ve pests. It provides inspec ons and phytosanitary cer fi cates for shipments of grain, seed, logs, lumber, greenhouse plants and other agricultural commodi es des ned for other states and foreign markets. The Plant Pest Control staff members also perform exo c pest surveys for destruc ve insects and disease. Early detec on of these pests can increase the likelihood of control and decrease the nega ve impact to growers or the environment. Over the past few years a small twig beetle, na ve to the Southwestern U.S., has been a acking eastern black walnut trees and infec ng the trees with a newly described fungal pathogen of unknown origin causing the disease known as Thousand Cankers Disease (TCD). TCD has been killing black walnut trees in high numbers in Colorado and other western states. In July 2010 this insect/disease complex was found aff ec ng eastern black walnut trees in the Knoxville, TN area and subsequently in Richmond, VA and Bucks County, PA.
Ma Beal, Chief,Plant Health

2012 Ohio Department of Agriculture Annual Report and Sta s cs 15
Working closely with the U.S. Department of Agriculture’s Animal and Plant Health Inspec on Service, the Plant Pest Control sec on con nues to support the eff orts to survey, contain and eventually eradicate the Asian Longhorned beetle from southeastern Ohio. Asian Longhorned beetle was discovered in Clermont County in June 2011. This invasive beetle poses a threat to Ohio’s hardwood forests (more than $2.5 billion in standing maple lumber) and the state’s $5 billion nursery industry which employs nearly 240,000 people. Currently there are 61 square miles under quaran ne in Clermont County for the Asian Longhorned beetle.
The European Gypsy Moth is a non-na ve insect threatening our hardwood forest and ornamental plants in Ohio. It will feed on more than 300 diff erent species of trees and shrubs, with oak being its preferred host. Since its accidental release in Massachuse s in 1869, this destruc ve pest has slowly moved westward, reaching Ohio in 1971 when the fi rst male moths were trapped in Ashtabula County. The Ohio Department of Agriculture’s Gypsy Moth Program is part of a na onal integrated pest management program that involves several state agriculture departments along the leading edge of the infesta on and the U.S. Department of Agriculture’s Forest Service.
Traps are placed across Ohio to detect, isolate, and monitor gypsy moth popula ons. Treatments are conducted to suppress, slow the spread of, or eradicate any developing popula ons. Currently 51 coun es in Ohio are under quaran ne for movement of regulated materials.
In the spring of 2012, Plant Pest Control staff worked to contain and trace the source of the fi rst detec on of boxwood blight in a nursery in northeast Ohio. Inspectors worked with the grower to quickly sample, test and isolate the infesta on. Boxwood blight is a disease caused by a fungus that threatens the health and sustainability of boxwood plants which are widely grown and sold as an ornamental in Ohio’s landscapes. This was the fi rst detec on of boxwood blight in Ohio. Since that me no new infesta ons have been discovered.
Because of this threat to Ohio’s Eastern Black Walnut resource, the Plant Pest Control sec on took measures to protect Ohio’s walnut trees by dra ing a quaran ne regula on which took eff ect on September 7, 2012. Walnut materials capable of spreading this pest are now restricted from entering Ohio. U.S. Forest Service es mates rank Ohio as high as second in the volume of standing walnut mber. Walnut is a high value mber species and an important Ohio export.
Over the past few years, the Plant Pest Control sec on collaborated with the Ohio Department of Natural Resources Division of Forestry, as well as other federal partners, to conduct surveys and develop plans to respond to the discovery of the harmful pest, hemlock woolly adelgid. This pest was fi rst discovered in Meigs County in January of 2012 and has since been detected in a total of three coun es. Hemlock is an ecologically important tree species and widely present in Ohio’s State Parks and Forests. The department has enacted quaran ne regula ons to a empt to reduce the spread of hemlock woolly adelgid within Ohio.
Pes cide and Fer lizer
Commercial Applicator Licenses .....................................14,023Private Applicator Licenses .............................................14,667Dealer Licenses Issued ......................................................... 562Business Licenses Issued .................................................. 3,001Business Registered Loca ons ............................................ 368Fer lizer Licenses ................................................................ 833Private Applicator Exams .................................................. 1,044Commercial Applicator Exams .......................................... 7,820Products Registered........................................................14,803Specialty Fer lizer Registra ons ....................................... 4,498Rou ne Inspec ons .......................................................... 1,838
GrainCapacity Examined (bushels) .................................421,958,000Licensed Facili es ................................................................ 399Grain Exams ......................................................................... 173Licensed Capacity ..................................................420,896,000Indemnity Fund Balance (12/31/12) ..................$8,184,069.95
SeedSamples Analyzed ............................................................. 1,039Permits to Label Seed .......................................................... 406Legume Innoculator Licenses ................................................ 30Legume Innoculant Manufact. Licensed .................................. 9
FeedCommercial Feed Registrants ........................................... 1,898Commercial Feed Distributed (tons) ....................5,224,913.33Feed Samples Tested ........................................................ 2,004FDA Medicated Feed Inspec ons ............................................ 9FDA BSE Inspec ons ............................................................ 150
Plant Pest Control
Dealer Licenses Issued ...................................................... 4,770Plant Cer fi ca on Inspec ons .......................................... 4,414Nursery Acres Cer fi ed ..................................................14,706Nursery Licenses Issued ...................................................... 955Federal Phytosanitary Cer fi cates .................................... 3,769State Phytosanitary Cer fi cates ............................................ 86
16 2012 Ohio Department of Agriculture Annual Report and Sta s cs
The Plant Health Diagnos c Lab was conceived, designed, and constructed to meet the U.S. Department of Agriculture Animal and Plant Health Inspec on Service-PPQ 526 permit containment specifi ca ons. The lab is versa le and handles viral, bacterial, fungal, oomycete, and nematode pathogens, as well as insect pests requiring containment condi ons. Department staff maintain the U.S. Department of Agriculture Animal and Plant Health Inspec on Service 526 permits to receive infected plant material from the con guous 48 states, as well as to receive restricted Phytophthora ramorum and plum pox virus samples. Laboratory staff also maintain cer fi ca on to perform the U.S. Department of Agriculture’s molecular diagnos c assays to detect P. ramorum.
In 2010, the department established the Ohio Plant Diagnos c Network, which is a coopera ve partnership between the
department’s Plant Health Diagnos c Laboratory and The Ohio State University’s C. Wayne Elle Plant and Pest Diagnos c Clinic. This newly established network brings research and regula on together to more effi ciently address Ohio’s plant pest, disease and diagnos c needs; eliminates duplica ve func ons; and increases response effi ciency to pest or disease outbreak. Following the Na onal Plant Diagnos c Network model, this lab off ers remote teaching and diagnos c nodes across Ohio that will facilitate a more rapid response to diseases and pests, as well as provides remote areas of the state access to educa onal opportuni es.
In 2011, the lab added a diagnos c node to the OSU South Centers Research Sta on in Piketon, Ohio, bringing the total number of opera onal nodes throughout the state to eight. The Pike County node will serve the vegetable and forestry industries in the south central and southeast part of the state. In 2012 the department secured funding to equip a node, which helps quickly iden y poten al harmful pests, to serve the state’s nursery industry in northeast Ohio.
In 2012, the lab in Reynoldsburg detected the fi rst incidence of the boxwood blight pathogen, Cylindrocladium pseudonaviculatum, in Ohio. The digital diagnos c node technology facilitated rapid iden fi ca on of the pathogen, confi rma on by USDA, and ini a on of response eff orts in less than twenty four hours.

2012 Ohio Department of Agriculture Annual Report and Sta s cs 17
Safeguarding the Food Supply
Consumer Protec on Laboratory
Dr. Beverly Byrum, Lab Director, Consumer Protec on Laboratory and Animal Disease Diagnos c Laboratory
The Consumer Protec on Laboratory is Ohio’s premier food and agriculture tes ng lab and carries out an important component of the
department’s mission to protect the public. Scien sts test food, feed, fer lizers, pes cides and animal exhibi on and race track samples. The lab houses the offi cial Equine Drug Tes ng Laboratory for the Ohio State Racing Commission. It also is the state’s primary emergency response lab for biological and chemical terrorism in food and environmental products as a member of the U. S. Department of Agriculture’s Food and Drug Administra on sponsored Food Emergency Response Network (FERN). Staff members help assure the safety and provides consumer protec on for Ohio’s food supply, agricultural products and animal compe ons and exhibi ons.
The lab analyzes samples origina ng in the food chain - from the farm, through processing and distribu on, to the retail level. Microbiologists test dairy products, raw and processed meat products, vegetables, fruits, drinking water and dairy process water for bacteria that cause foodborne illness. Chemists provide assurance that dangerous pes cides are not present in Ohio food products. They also confi rm the claims made on food and feed labels, evaluate apple juice and cider for Patulin, test maple syrup for lead, and test food samples for extraneous ma er in response to consumer complaints. Regulatory ac on is taken if bacteria or dangerous chemicals are found.

18 2012 Ohio Department of Agriculture Annual Report and Sta s cs
The Analy cal Toxicology Laboratory is the offi cial drug tes ng lab for the Ohio State Racing Commission. Lab staff test samples from horses compe ng at Ohio’s seven commercial race tracks and more than 70 county fairs for prohibited substances under the commission’s medica on and drug related regula ons. This interna onally renowned laboratory provides tes ng on nearly 9,000 horses each year.
The Consumer Protec on Laboratory was awarded three major compe ve federal grants from the Food and Drug Administra on and the U.S. Department of Agriculture for response to foodborne outbreaks, emergency management and to provide capacity for any Food Emergency Response Network-related projects.
The Food Emergency Response Network grant provides funding for method development and surveillance for highly pathogenic agents, such as anthrax, in food. The Consumer Protec on Laboratory also provides cri cal exper se to respond to natural foodborne illness outbreaks or emergencies that are inten onally introduced.
In 2012, Microbiology Laboratory staff detected pathogens in meat and food samples that were subsequequently linked to foodborne illness and mul -state outbreaks. The laboratory isolated Salmonella sp from hot pepper samples that were linked to salsa products which resulted in a mul -state recall in May 2012. The lab isolated Salmonella sp and L. monocytogenes from bagged spinich products in separate instances ini a ng two U.S. Food and Drug Administra on recalls. A U.S. Department of Agriculture recall was ini ated a er lab staff iden fi ed L. monocytogenes in pre-cooked meatballs. In this instance, the pathogen isolate matched the U.S. Department of Agriculture isolates previously on record from sampling conducted at the manufacturing plant. In addi on, staff detected L. monocytogenes from sprouts collected from a Cleveland plant, which resulted in a statewide recall. Lab staff helped inves gate a mul -state Salmonella infan s outbreak related to dog food samples. More than 50 samples were
collected and analyzed; of these,fi ve samples were linked to the outbreak strain. A report on this outbreak was released by the Centers for Disease Control.
Under a grant from the U.S. Department of Agriculture Agricultural Marke ng Service, lab staff par cipated in the Microbiological Data Program, a na onal program to monitor fruits and vegatables for the presence of pathogenic microorganisms. Under the program, fresh fruits and vegetables are tested for Salmonella, E. coli O157:H7, and pathogenic E. coli using the latest DNA technology.
In 2012, the pes cide residue laboratory staff started screening samples of ground water for newer classes of pes cides. Around 30 samples were analyzed and about one third showed pes cide residues. Upon further examina on, it was found that these residues were below the ac on threshold.
In 2012, chemists in the Consumer Protec on Laboratory provided analysis of exhibi on animals in Ohio’s 94 state, county and independent fairs. This program, administered by the Ohio Department of Agriculture’s Division of Animal Health, is one of the most comprehensive programs in the na on for evalua ng exhibi on animals for illegal drugs. These chemists also provided tes ng for exhibi ons in other states.
The Pes cide Data Program, Microbiological Data Program, Microbiology Lab, and the Analy cal Toxicology Lab are all accredited by the American Associa on for Laboratory Accredita on.
Lab Sec ons No. of Samples Reported No. of Tests Reported
Microbiology ..............................................................13,906 ...........27,079General Chemistry ........................................................3,460 ...........16,968Pes cides (Residue and Formula on) .............................269 .............1,979Analy cal Toxicology ..................................................14,491 ...........33,346FERN ................................................................................488 .............3,799
Support to Other Programs
USDA Microbiological Data Program ............................3,087 ............7,011USDA Pes cide Data Program ......................................1,469 .........167,962
Total 37,170 258,144
Under a grant from the U.S. Department of Agriculture Agricultural Marke ng Service, Consumer Protec on Lab staff members par cipate in the Microbiological Data Program, a na onal program to monitor fruits and vegetables for the presence of pathogenic microorganisms. Under the program, fresh fruits and vegetables are tested for Salmonella, E. coli O157:H7, and pathogenic E.coli using the latest DNA technology.

2012 Ohio Department of Agriculture Annual Report and Sta s cs 19
Ohio’s Dairy Division helps assure that dairy products produced, transported and processed in Ohio are wholesome and safe for consumers. The division’s
registered sanitarians work daily across the state to provide cri cal services through a series of inspec ons, evalua ons and sampling of raw and pasteurized milk products.
These ac vi es meet or exceed the standards set by the U.S. Department of Health and Human Services, Food and Drug Administra on and the U.S. Department of Agriculture. Ohio has adopted the Pasteurized Milk Ordinance as the state’s Grade A rules. This ordinance is a model document as it relates to all state regulatory dairy ac vity and allows for dairy products to move in interstate commerce.
Ohio’s Dairy Division staff members play an important role in providing protec on to consumers, producers and processors. For example, every supply of milk coming off a farm is tested for drug residues before being made into a variety of dairy products. Every fi nished product made at all of the processing facili es is tested for bacteria, coliforms, vitamins, standard of iden ty, chemicals, pes cides and water quality. Addi onally, processing plants are inspected quarterly and pasteuriza on equipment is tested quarterly.
Dairy producers also need to pass numerous monthly quality tests that include bacteria, soma c cell counts and water quality. Producers also undergo a rigorous inspec on that is conducted every six months, with addi onal state, U.S.
Laboratory TestsProducer Milk ................................................... 37,014Finished Product ................................................. 4,691Farm Water ......................................................... 1,358Plant Water............................................................ 326
LicensesProducer ............................................................. 3,009Processor ............................................................... 108Receiving, Transfer, Wash Sta ons ......................... 28Haulers ................................................................. 121Weigher, Sampler, Tester .................................... 1,001
Inspec ons
Producer ............................................................. 9,083Processor .............................................................. 449Tanker Trucks ......................................................... 493Weigher, Sampler, Tester ....................................... 430Grade A BTU Survey ................................................ 74Grade A Plant Survey ............................................... 17Single Service Lis ng ............................................... 29
Dairy
Roger Tedrick, Chief,Dairy
Department of Agriculture, and Food and Drug Administra on oversight.
Staff members also evaluate and regulate milk hauling. Proper permi ng and evalua ng tanks is cri cal to maintaining safety standards.
In 2012, milk produc on in the state was up 4.1 percent maintaining its rank of 11th in the na on. This level of milk produc on was achieved with 2,000 more milk cows and nearly 20,000 pounds of milk per cow. Ohio also maintained its rank of fi rst in the na on in Swiss cheese produc on.
Small on-farm or ar san dairy produc on con nues to fl ourish. Small processors are making products for farmers’ markets and other retail loca ons, including ice cream, cheese, fl uid milk and Greek yogurts.
Another area of growth in the state is robo c milking machines. By the end of 2012, Ohio had nearly 30 automated milking installa ons. Many more are in the works for 2013. As these facili es develop, division staff members con nue to work closely with manufacturers and the Food and Drug Administra on to ensure safety and compliance.
Ohio’s milk produc on helps support the state’s dairy processing industry.
20 2012 Ohio Department of Agriculture Annual Report and Sta s cs
The Division of Food Safety helps assure consumers are provided foods, over-the-counter drugs, dietary supplements and cosme cs that are safe, unadulterated
and honestly presented. Division staff members work toward this goal through regulatory oversight of the wholesale and retail industry and through contracts, partnerships and educa onal ac vi es with federal, state and local food regulatory agencies.
Division staff members work to increase awareness of food defense and assist operators in assessing their vulnerabili es. Representa ves also par cipated in several key emergency preparedness ac vi es, including U lity Radiological Safety Board, A er Ac on Working Group and Ohio Homeland Security Strategic Analysis and Informa on Center mee ngs.
Food Safety Division’s retail staff members con nue to off er training and educa on programs to the local health departments. In 2012, more than 100 trainings and programs were available. These programs addressed farmers’ markets, farm markets, co age food, reduced oxygen packaging, acidifi ed white rice, process reviews, home bakeries and labeling.
Division of Food Safety inspectors also inspect wholesale opera ons, such as bakeries, canneries, snack food and candy manufacturers, water and so drink bo lers, seafood processors and food warehouses. Staff members who inspect wholesale opera ons also perform contract inspec ons for the U.S Food and Drug Administra on and conduct weekly sampling for the U.S. Department of Agriculture’s Pes cide and Microbiological Data Programs.
Division staff members also conduct a food surveillance sampling program. This includes the rou ne sampling of ready-to-eat-foods and then tes ng for Listeria monocytogenes, E. coli O157:H7, Salmonella and generic E. coli. The samples collected included fresh produce, deli salads, sandwiches, bo led water, fresh juices, maple syrup and various imported canned food products.
In 2012, in conjunc on with the Ohio Department of Health, Division of Food Safety staff members disseminated 191 food recall no ces to local health offi cials and the public. The recalls, for a variety of food products, were issued based on bacteriological and allergen concerns.
Division of Food Safety staff and the Ohio Department of Health jointly conduct the Retail Food Safety Advisory Council mee ngs. These mee ngs are co-chaired by the directors of agriculture and health with council members represen ng local health departments, the retail food industry, academia and the consuming public. The council serves as a forum to discuss and resolve issues related to Ohio’s food safety program.
Licenses
Wholesale and Processing .................................. 1,199Home Bakery Registra ons ................................... 922Retail Licenses (issued by local Health Departments) .............. 17,123
Inspec ons, Cer fi ca ons and Collec ons
Wholesale/Processing Inspec ons. .................... 2,397ODA/FDA Contract Inspec ons ............................. 500Product Label Reviews ........................................ 1,467Farm Market and Farmers’ Market Inspec ons .... 312Samples Collected .............................................. 2,689Shellfi sh Cer fi ca on Inspec ons ........................... 18Variance Review Inspec on ................................... 156Country of Origin Labeling Audits (COOL) ............. 143
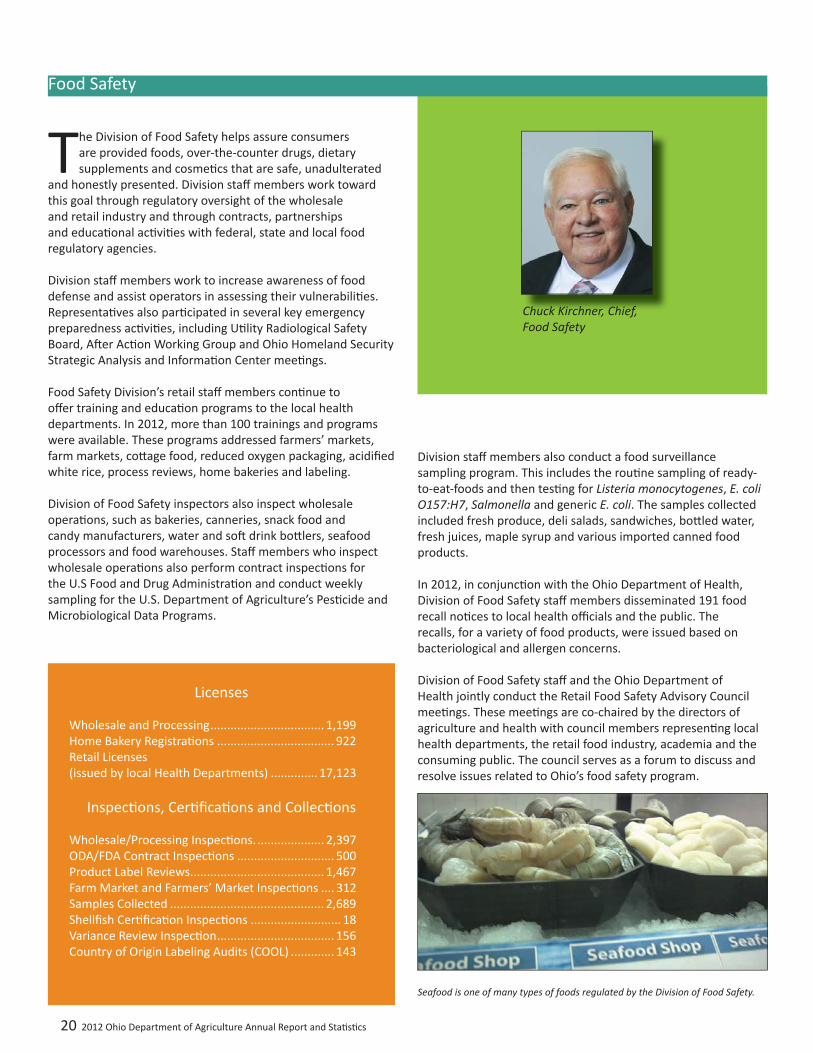
Food Safety
Chuck Kirchner, Chief,Food Safety
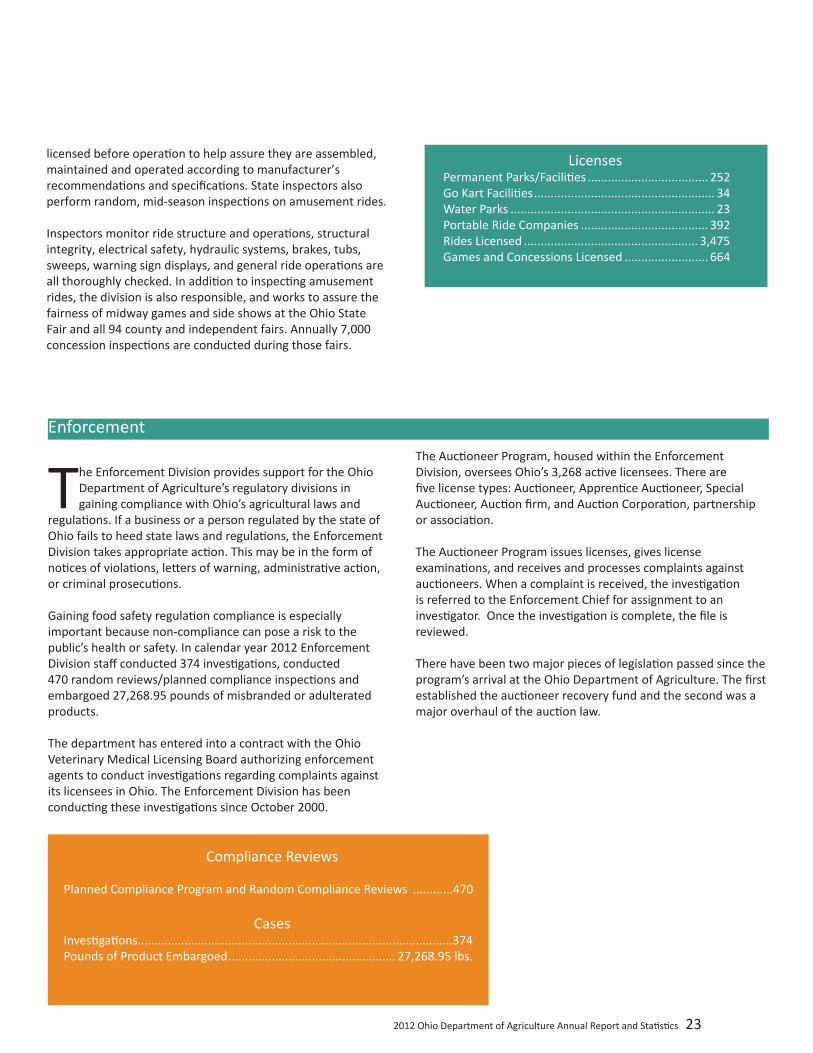
Seafood is one of many types of foods regulated by the Division of Food Safety.

2012 Ohio Department of Agriculture Annual Report and Sta s cs 21
The Division of Meat Inspec on helps assure that all meat and poultry establishments with a state license are producing safe, wholesome and truthfully labeled
products in a sanitary environment.
Division staff members oversee 281 slaughter and processing facili es. Of those, 207 are fully-inspected facili es, which provide products that are eligible for re-sale within Ohio. The remaining establishments operate under a “custom exempt” status and simply provide a “not-for-sale” service to individuals who wish to have their own animals processed to be consumed by their own families. Division staff members also oversee seven establishments that have been selected for the Coopera ve Interstate Shipment program.
The state’s inspec on approach is centered on an establishment’s performance, incorpora ng the concepts of Hazard Analysis and Cri cal Control Point (HACCP) and Sanita on Standard Opera ng Procedures. The required HACCP procedures make each fully inspected establishment responsible for safeguarding the meat and poultry products they produce. The opera ng procedures help assure the environment in which the establishment operates is maintained in a sanitary manner.
Addi onally, establishments are expected to develop programs for the control of Listeria monocytogenes, programs to control Specifi ed Risk Materials for preven ng Bovine Spongiform Encephalopathy in ca le over 30 months of age, E. coli O157:H7 in beef and a variety of other prerequisite programs to support their food safety system.
The explosive growth in the numbers of charter schools, daycare centers and senior meal feeding programs across the state con nues to provide opportuni es for caterers and food service operators to modify their businesses in order to
Inspec ons
State-Inspected Establishments (fully-inspected)..............................................207Custom Exempt Establishments .......................74
Red Meat at Slaughter ..................75,616,299 lbs.Poultry at Slaughter ...........................642,804 lbs.Red Meat at Processing .............172,157,216 lbs.Poultry at Processing ....................11,503,330 lbs.
Meat Inspec on
Dr. Michael Hockman, Chief, Meat Inspec on
provide meals to these growing numbers of consumers. The Division of Meat Inspec on is required to inspect such providers if they don’t meet the legal defi ni on of catering. Division staff members provide daily inspec on services to facili es that specialize in meal produc on and con nue to work with other prospec ve facili es to license and enter this market. On the average these facili es produce a total of more than 100,000 meals per day.
The division’s sampling program is a signifi cant tool used to verify that an establishment’s food safety system is working. The division conducts sampling on a wide range of products at a frequency that is comparable to that of the U. S. Department of Agriculture’s Food Safety and Inspec on Service (FSIS). FSIS provides 50 percent of the funding for the program. In 2012, meat samples were analyzed for E. coli O157:H7, Salmonella and Listeria monocytogenes, all of which are dangerous pathogenic microorganisms and linked to major foodborne illnesses.
For nearly two decades, the Ohio Department of Agriculture has supported the concept of allowing state-inspected establishments to be able to ship their state-inspected products across the state line. As a part of the 2008 Farm Bill, the Congress directed FSIS to promulgate changes to the laws allowing selected state establishments to ship their state-inspected products across the state line.
The Coopera ve Inspec on Programs: Interstate Shipment of Meat and Poultry Product fi nal rule became eff ec ve in 2011. Department offi cials applied to and began working with FSIS to meet the requirements of the regula ons. On August 8, 2012, Department Director David Daniels signed the Coopera ve Interstate Shipment Coopera ve Agreement.
Selected state inspected establishments, as a result of the Coopera ve Interstate Shipment Program (CISP), will now be able to ship their products in interstate commerce. The advantage of qualifying for the CISP is that the establishment will s ll be inspected by the same state inspector, while having all of the United States as a market place, not just Ohio.

22 2012 Ohio Department of Agriculture Annual Report and Sta s cs
Protec ng the Public
Amusement Ride Safety
Gary Hill, Chief, Amusement Ride Safety and Enforcement
Under Ohio law, all amusement rides must be inspected and licensed before opera ng to assure they are assembled, maintained, and
operated in a manner that will minimize the possibility of accidents or injuries to the riding public. The Ohio Department of Agriculture’s Amusement Ride Safety Division inspectors are responsible for the safety and regula on of all Ohio rides. The inspectors evaluate everything from the structural safety and warning signs to general ride opera ons. Inspectors also license go-kart tracks and water parks. Ohio was the fi rst state to enact a Rider Responsibility Act that stresses the consumer’s role in amusement ride safety. The division also assures that midway games of skill and side shows opera ng at all 94 county and independent agricultural fairs and the Ohio State Fair are fair and properly operated.
Ohio is known for the quality and quan ty of its amusement parks. The state is also known for having one of the best ride inspec on programs in the country. The department’s Division of Amusement Ride Safety regulates this industry and helps assure that all rides in Ohio are safe.
In 2012, division staff licensed 252 permanent facili es and amusement parks, 34 go-kart facili es, and 23 water park facili es. Department staff also inspected 392 portable ride companies. Department staff inspected licensed and maintained records on all 3,475 amusement rides and 664 games in the state. By law, all amusement rides must be inspected and
2012 Ohio Department of Agriculture Annual Report and Sta s cs 23
LicensesPermanent Parks/Facili es .................................... 252Go Kart Facili es ...................................................... 34Water Parks ............................................................. 23Portable Ride Companies ...................................... 392Rides Licensed .................................................... 3,475Games and Concessions Licensed ......................... 664
The Enforcement Division provides support for the Ohio Department of Agriculture’s regulatory divisions in gaining compliance with Ohio’s agricultural laws and
regula ons. If a business or a person regulated by the state of Ohio fails to heed state laws and regula ons, the Enforcement Division takes appropriate ac on. This may be in the form of no ces of viola ons, le ers of warning, administra ve ac on, or criminal prosecu ons.
Gaining food safety regula on compliance is especially important because non-compliance can pose a risk to the public’s health or safety. In calendar year 2012 Enforcement Division staff conducted 374 inves ga ons, conducted 470 random reviews/planned compliance inspec ons and embargoed 27,268.95 pounds of misbranded or adulterated products.
The department has entered into a contract with the Ohio Veterinary Medical Licensing Board authorizing enforcement agents to conduct inves ga ons regarding complaints against its licensees in Ohio. The Enforcement Division has been conduc ng these inves ga ons since October 2000.
The Auc oneer Program, housed within the Enforcement Division, oversees Ohio’s 3,268 ac ve licensees. There are fi ve license types: Auc oneer, Appren ce Auc oneer, Special Auc oneer, Auc on fi rm, and Auc on Corpora on, partnership or associa on.
The Auc oneer Program issues licenses, gives license examina ons, and receives and processes complaints against auc oneers. When a complaint is received, the inves ga on is referred to the Enforcement Chief for assignment to an inves gator. Once the inves ga on is complete, the fi le is reviewed.
There have been two major pieces of legisla on passed since the program’s arrival at the Ohio Department of Agriculture. The fi rst established the auc oneer recovery fund and the second was a major overhaul of the auc on law.
Compliance Reviews
Planned Compliance Program and Random Compliance Reviews ............470
CasesInves ga ons..............................................................................................374Pounds of Product Embargoed .................................................. 27,268.95 lbs.
Enforcement
licensed before opera on to help assure they are assembled, maintained and operated according to manufacturer’s recommenda ons and specifi ca ons. State inspectors also perform random, mid-season inspec ons on amusement rides.
Inspectors monitor ride structure and opera ons, structural integrity, electrical safety, hydraulic systems, brakes, tubs, sweeps, warning sign displays, and general ride opera ons are all thoroughly checked. In addi on to inspec ng amusement rides, the division is also responsible, and works to assure the fairness of midway games and side shows at the Ohio State Fair and all 94 county and independent fairs. Annually 7,000 concession inspec ons are conducted during those fairs.

24 2012 Ohio Department of Agriculture Annual Report and Sta s cs
Permits
Permits to Install............................................................. 22Permits to Operate ......................................................... 27Major Opera onal Changes............................................ 15
Inspec ons
Complete (rou ne) Inspec on ..................................... 296Par al Inspec on ............................................................ 10Cer fi ed Livestock Manager Inspec on ......................... 42Total Inspec ons ........................................................... 348
Ohio’s Division of Livestock Environmental Permi ng regulates Ohio’s largest livestock and poultry farms. Inspectors assure the farms follow science-based
guidelines that protect the environment and allow the facility to remain produc ve while managing manure, mortali es, fl ies, rodents and other pests.
As of December 31, 2012, there were 182 permi ed farms in Ohio. In 2012, staff members issued permits to 27 large livestock and poultry farms, including 22 Permits to Install and 27 Permits to Operate. Of those 27 Permits to Operate, 19 were renewal permits. Permits to Operate allow the farms to operate for a period of fi ve years, at which me they are required to apply for a renewal, which is also valid for fi ve years. In addi on, there were 15 Major Opera onal Changes issued to permi ed facili es which authorize construc on or expansion projects. At year-end 2012, there were 26 farms that had pending applica ons that were being processed.
Inspectors conducted 348 inspec ons during 2012. Of this total, 296 were rou ne inspec ons on permi ed facili es, 10 were par al inspec ons and 42 were inspec ons of Cer fi ed Livestock Managers.
Cer fi ed Livestock Manager training is required for those who manage or handle manure at a major concentrated animal feeding facility or anyone who buys, sells, or land applies more than 4,500 dry tons or 25 million gallons of liquid manure a year.
One two-day training session was conducted during 2012. Sixty individuals par cipated on the fi rst day of training and 62 on the second day. During 2012, 34 new Cer fi ed Livestock Manager cer fi ca ons were issued and 58 were recer fi ed. Since the program began in 2004, a total of 191 have received cer fi ca on.
Livestock Environmental Permi ng
Kevin Elder, Chief,Livestock Environmental Permi ng
Ohio Department of Agriculture offi cials are wai ng for a fi nal decision from U.S. EPA on the transfer of federal Na onal Pollutant Discharge Elimina on System (NPDES) permi ng authority. Ohio division staff members developed the fi nal rule revision necessary to transfer the NPDES permi ng authority over Ohio’s large livestock and poultry farms from Ohio Environmental Protec on Agency to the Ohio Department of Agriculture. In consulta on with the U. S. Environmental Protec on Agency, Division staff members iden fi ed the fi nal Ohio statutory revision that was required to meet the requirements of U.S. Environmental Protec on Agency. The statute has been dra ed and is pending passage by the Ohio Legislature.
In 2012, inspectors also responded to 18 complaints (14 oral and four wri en). Of the total, 10 involved manure applica ons, four were complaints about fl ies, two were odor issues, two were complaints about possible manure discharges. Of the 18 complaints inves gated, 14 were found to be unsubstan ated. Sixteen enforcement ac ons were issued in 2012, which included warning le ers, no ces of defi ciencies, and emergency orders. Through outreach and educa on, staff members achieved a 55 percent decrease in complaints from 2011 to 2012.
Permi ed facili es in the Grand Lakes St. Marys watershed are now expor ng over 96 percent of the manure they produce to replace commercial fer lizer on cropland areas outside the watershed.

2012 Ohio Department of Agriculture Annual Report and Sta s cs 25
The Division of Weights and Measures helps to assure consumer confi dence and equity in the marketplace by administering and enforcing all laws pertaining to true
and uniform weights and measures standards. The division works with county and city weights and measures programs to test devices ranging from fuel meters and retail store scanners to vehicle and livestock scales for consistent measuring standards.
Ohio law designates the Director of the Ohio Department of Agriculture as the “State Sealer” of weights and measures. The Ohio Department of Agriculture administers the Metrology Laboratory, which houses the state standards of mass, length and volume. Ohio’s Metrology lab was honored when it received accredita on cer fi cates to the Interna onal Standards Organiza on (ISO) 17025 laboratory standard and successfully underwent an onsite assessment by the Na onal Voluntary Laboratory Accredita on Program to con nue that level of accredita on. Ohio’s Metrology Laboratory is one of only 15 state measurement laboratories in the U.S. to achieve the ISO 17025 level of accredita on, which provides necessary traceability for Ohio manufacturers and other businesses using these metrology services. Ohio boasts one of only four Na onal Type Evalua on Program (NTEP) Laboratories in the na on that test and evaluate new scale designs and technology, keeping Ohio on the cu ng edge of today’s technology. The Ohio lab is also authorized by Canada to test for compliance to Canada’s standards and is one of only two state labs in the na on authorized to test scales for compliance to interna onal standards. The Ohio lab is the only lab in the U.S. authorized to test mul -dimensional devices. Na onal sta s cs released in 2012 show Ohio’s NTEP laboratory con nues to be one of the busiest and most produc ve in the U.S.
Training over 140 county and city weights and measures inspectors and keeping them up to date on new technology used in today’s gas pumps and supermarket scales is a huge task. The Na onal Conference on Weights and Measures made signifi cant changes to the tes ng procedure for scales. In 2012, the Ohio Department of Agriculture provided training regarding these signifi cant issues and other Ohio laws to the state’s 90 local weights and measures offi ces and all inspectors. Training was also conducted for 256 of Ohio’s 495 registered service people, represen ng 65 diff erent scale and meter service agencies. This is done as a means to promote uniform inspec ng and tes ng procedures throughout the state.
Inspec ons/Tests
Vehicle & Livestock Scales ..................... 1,628Law Enforcement Scales ........................... 846LP Gas Meters ............................................... 0Bulk & Vehicle Tank Meters ...................... 663
Packages
No. Audited ................................................ 79No. Lots Tested ......................................... 151No. Packages Represented in Lots ....... 20,875No. Packages Ordered Off Sale ................. 435
Physical StandardsTested ................................................. 14,931Adjusted ............................................... 1,229Companies/Agencies Served ................... 436Condemned ................................................ 47
NTEPTotal Evalua ons ........................................ 54Evalua ons Completed .............................. 44
Weights and Measures
Fran Elson Houston, Chief, Weights and Measures
Store scanners are one of the many things regulated by state weights and measures standards to assure a fair markeplace.

26 2012 Ohio Department of Agriculture Annual Report and Sta s cs
Suppor ng Rural Ohio
Farmland Preserva on
Denise Franz King Execu ve Director, Offi ce of Farmland Preserva on
TThe Offi ce of Farmland Preserva on strengthens the base of the state’s top industry, food and agriculture. Staff members assist farmers and
local offi cials with farmland protec on eff orts and educate the public about the importance of saving Ohio’s valuable farmland. The quality and quan ty of agricultural commodi es produced in our state is dependent upon the land available for farming. Recognizing this fundamental rela onship, the department works to maintain the state’s agricultural heritage while providing food and jobs. During 2012, the Offi ce of Farmland Preserva on reached a milestone by permanently preserving 50,000 acres of farmland through agricultural easements. An agricultural easement is a voluntary, permanent, legally binding restric on placed on a farm. The easement limits the use of the land to predominantly agricultural ac vity. The land remains under private ownership and management and stays on the tax rolls under current agricultural use valua on. The farmland can be sold or passed along as a gi to others at any me, but the restric on prohibi ng non-farm development stays with the land. Agricultural easements may be acquired through purchase or dona on.
Acres Preserved (2012):
Clean Ohio Ag. Easement Purchase Program ........ 28 farms, 3,571 acres
Acres Preserved to Date (2001-2012):
Clean Ohio Ag. Easement Purchase Program ............................................................... 40,777 acresAg. Easement Dona on Program ........................................ 6,390 acresTobacco Ag. Easement Purchase Program (2002) ................ 2,940 acresTotal (2001-2011) ............................................................... 50,107 acresAgricultural Security Areas ................................................. 32,022 acres

2012 Ohio Department of Agriculture Annual Report and Sta s cs 27
When consumers buy Ohio-grown, raised or processed products, they help support local farmers and economies and the state’s mul -billion dollar food
and agriculture industry.
The Markets Division provides marke ng services to Ohio’s food and agricultural sectors to help retain and create jobs and enhance their compe ve advantage in Ohio and the United States. The division has two major program areas: Ohio Proud and Ohio Grape Industries.
Ohio Proud is the state’s domes c marke ng program that promotes Ohio food and agricultural products within Ohio’s borders and beyond. The logo helps consumers iden fy foods that are made in Ohio and grown in Ohio. Ohio Proud supports the state’s goal to provide safe, local foods to consumers and to create new opportuni es for Ohio growers, producers and processors.
In 2012, Ohio Proud had 463 partners. The Ohio Proud mobile kitchen featured local products through cooking demonstra ons over the lunch hour in downtown Columbus. Area chefs prepared recipes with local produce and other products and provided samples to the public.
A 2012 Holiday Adver sing Campaign consisted of web ads which targeted consumers who are interested in local foods and entertainment. Beginning November 20, a four week campaign produced 3,051,663 impressions on the web. During
the campaign, the website had 84.66 percent new visitors in November and 79.03 percent in December.
Holiday videos off ering sugges ons for Ohio Proud themed gi baskets were also created and posted on social media. These gi baskets were then delivered to local radio and television sta ons encouraging them to promote during the holidays. This eff ort started a rela onship with a Columbus television personality who fi lmed stories about Ohio Proud companies and aired them on the local segment of the noon news.
Ohio Proud also increased their presence with social media this holiday season by crea ng a Pinterest page: h p://pinterest.com/ohioproud/. The Ohio Proud Pinterest page off ers recipes, gardening, entertaining and gi ideas using Ohio products. This has been a great opportunity for the program to feature its specialty food and nursery partners.
Division of Markets staff helped implement the Agriculture is Cool! program at the Ohio State Fair. In 2012, fourth grade students and a parent received free admi ance to the state fair and had the opportunity to learn about Ohio agriculture. Students were encouraged to visit various educa onal sta ons on the fairgrounds and then write an essay about why agriculture is cool. Four winning students were presented with $500 scholarships.
those farms, totaling 40,777 acres. Note that in 2012, the Offi ce of Farmland Preserva on did not receive funding to purchase addi onal easements; therefore no landowner applica on period was held.
The Ohio Agricultural Easement Dona on Program allows land owners to donate development rights of their land to the State of Ohio or local governments for the purpose of protec ng produc ve farmland from conversion to non-agricultural use. A total of 53 farms have donated easements to the state, which equal nearly 6,390 acres.
The offi ce expanded the reach of its dona on programs by introducing the Agricultural Easement Dona on Partnership Program in 2012. Under this program, the department encourages local capacity-building by providing local partners (coun es, townships, soil and water conserva on districts and land trusts) up to $3,000 in administra ve costs for the dona on of farms up to 200 acres, with an incen ve of $5 an acre for larger farms.
The Ohio Agricultural Security Area (ASA) Program authorizes one or more landowners of at least 500 acres of con guous farmland to request enrollment into an ASA for a 10-year period. The Offi ce provides technical assistance to farmers and local offi cials. Since 2005, more than 32,022 acres have been enrolled.
The offi ce also provides technical assistance to local boards of county commissioners and boards of township trustees on the Agricultural Security Area Program, and par cipates in the largest statewide gathering addressing farmland protec on, the annual Ohio Farmland Preserva on Summit.
In 2012, the Offi ce renamed its purchase program the Clean Ohio Local Agricultural Easement Purchase Program. Localizing the program has three purposes: 1) to build local capacity by cer fying local sponsors to hold and administer their own local agricultural easement purchase programs; 2) to reduce the administra ve role of the state staff ; and 3) to a ract addi onal federal farmland preserva on funds to Ohio. It went into eff ect for easements purchased in 2013.
Just like its predecessor, the Clean Ohio Agricultural Easement Purchase Program, the new program purchases agricultural easements from interested Ohio farmland owners. Awards are issued for up to 75 percent of the points-based appraised value of a farm’s development rights. A payment cap is $2,000 per acre, with a maximum of $500,000 per farm. All easement transac ons are recorded on the property deed and transfer with the land.
Since the beginning of the purchase program, the Offi ce of Farmland Preserva on has received approximately 2,400 applica ons, and with available funding, preserved 220 of
Markets
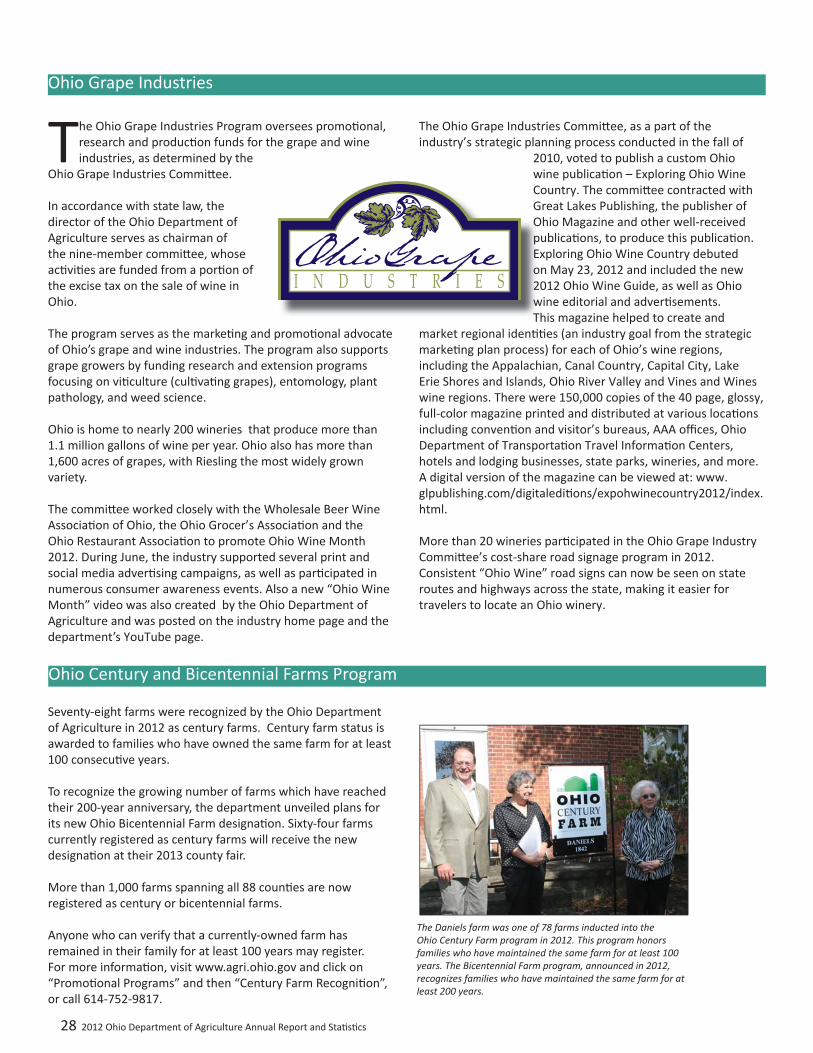
28 2012 Ohio Department of Agriculture Annual Report and Sta s cs
Seventy-eight farms were recognized by the Ohio Department of Agriculture in 2012 as century farms. Century farm status is awarded to families who have owned the same farm for at least 100 consecu ve years.
To recognize the growing number of farms which have reached their 200-year anniversary, the department unveiled plans for its new Ohio Bicentennial Farm designa on. Sixty-four farms currently registered as century farms will receive the new designa on at their 2013 county fair.
More than 1,000 farms spanning all 88 coun es are now registered as century or bicentennial farms.
Anyone who can verify that a currently-owned farm has remained in their family for at least 100 years may register. For more informa on, visit www.agri.ohio.gov and click on “Promo onal Programs” and then “Century Farm Recogni on”, or call 614-752-9817.
Ohio Century and Bicentennial Farms Program
Ohio Grape Industries
The Ohio Grape Industries Program oversees promo onal, research and produc on funds for the grape and wine industries, as determined by the
Ohio Grape Industries Commi ee.
In accordance with state law, the director of the Ohio Department of Agriculture serves as chairman of the nine-member commi ee, whose ac vi es are funded from a por on of the excise tax on the sale of wine in Ohio.
The program serves as the marke ng and promo onal advocate of Ohio’s grape and wine industries. The program also supports grape growers by funding research and extension programs focusing on vi culture (cul va ng grapes), entomology, plant pathology, and weed science.
Ohio is home to nearly 200 wineries that produce more than 1.1 million gallons of wine per year. Ohio also has more than 1,600 acres of grapes, with Riesling the most widely grown variety.
The commi ee worked closely with the Wholesale Beer Wine Associa on of Ohio, the Ohio Grocer’s Associa on and the Ohio Restaurant Associa on to promote Ohio Wine Month 2012. During June, the industry supported several print and social media adver sing campaigns, as well as par cipated in numerous consumer awareness events. Also a new “Ohio Wine Month” video was also created by the Ohio Department of Agriculture and was posted on the industry home page and the department’s YouTube page.
The Ohio Grape Industries Commi ee, as a part of the industry’s strategic planning process conducted in the fall of
2010, voted to publish a custom Ohio wine publica on – Exploring Ohio Wine Country. The commi ee contracted with Great Lakes Publishing, the publisher of Ohio Magazine and other well-received publica ons, to produce this publica on. Exploring Ohio Wine Country debuted on May 23, 2012 and included the new 2012 Ohio Wine Guide, as well as Ohio wine editorial and adver sements. This magazine helped to create and
market regional iden es (an industry goal from the strategic marke ng plan process) for each of Ohio’s wine regions, including the Appalachian, Canal Country, Capital City, Lake Erie Shores and Islands, Ohio River Valley and Vines and Wines wine regions. There were 150,000 copies of the 40 page, glossy, full-color magazine printed and distributed at various loca ons including conven on and visitor’s bureaus, AAA offi ces, Ohio Department of Transporta on Travel Informa on Centers, hotels and lodging businesses, state parks, wineries, and more. A digital version of the magazine can be viewed at: www.glpublishing.com/digitaledi ons/expohwinecountry2012/index.html.
More than 20 wineries par cipated in the Ohio Grape Industry Commi ee’s cost-share road signage program in 2012. Consistent “Ohio Wine” road signs can now be seen on state routes and highways across the state, making it easier for travelers to locate an Ohio winery.
The Daniels farm was one of 78 farms inducted into the Ohio Century Farm program in 2012. This program honors families who have maintained the same farm for at least 100 years. The Bicentennial Farm program, announced in 2012, recognizes families who have maintained the same farm for at least 200 years.

2012 Ohio Department of Agriculture Annual Report and Sta s cs 29
Na onal Agricultural Sta s cs Service Ohio Field Offi ce
Cheryl Turner, State Sta s cian, USDA Na onal Agricultural Sta s cs Service Ohio FIeld Offi ce
OHIO DEPARTMENT OF AGRICULTURE
David T. Daniels, DirectorHoward Wise, Assistant Director
Dr. Sereana Dresbach, Deputy DirectorJohn Schlichter, Deputy DirectorJanelle Mead, Deputy Director
Erica Hawkins, Communications DirectorSusan Showalter, Publications Editor
cooperating with:
UNITED STATES DEPARTMENT OF AGRICULTURENATIONAL AGRICULTURE STATISTICS SERVICE
Dr. Cynthia Clark, Administrator
OHIO FIELD OFFICE
P.O. BOX 686Reynoldsburg, Ohio 43068-0686
614/728-2100

30 2012 Ohio Department of Agriculture Annual Report and Sta s cs
Acknowledgements
Estimates made by the Ohio Field Offi ce are based on information supplied by farmers and agri-businesses. These estimates are the result of the data collected on probability designed surveys. Considerable information is collected from farmers randomly selected for telephone or personal interviews. Data for county estimates are collected from a large mail survey, and where available, check data are used to the extent possible.
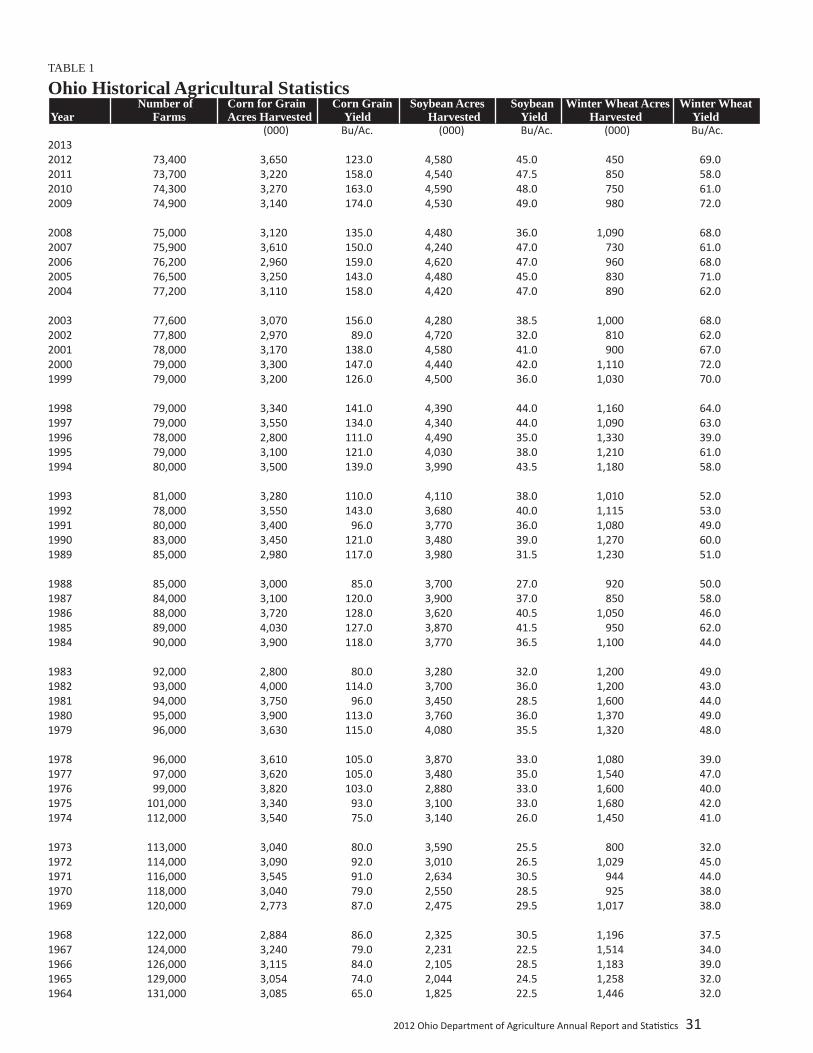
2012 Ohio Department of Agriculture Annual Report and Sta s cs 31
TABLE 1
Ohio Historical Agricultural Statistics Number of Corn for Grain Corn Grain Soybean Acres Soybean Winter Wheat Acres Winter Wheat Year Farms Acres Harvested Yield Harvested Yield Harvested Yield (000) Bu/Ac. (000) Bu/Ac. (000) Bu/Ac.2013 2012 73,400 3,650 123.0 4,580 45.0 450 69.02011 73,700 3,220 158.0 4,540 47.5 850 58.02010 74,300 3,270 163.0 4,590 48.0 750 61.02009 74,900 3,140 174.0 4,530 49.0 980 72.0 2008 75,000 3,120 135.0 4,480 36.0 1,090 68.02007 75,900 3,610 150.0 4,240 47.0 730 61.02006 76,200 2,960 159.0 4,620 47.0 960 68.02005 76,500 3,250 143.0 4,480 45.0 830 71.02004 77,200 3,110 158.0 4,420 47.0 890 62.0 2003 77,600 3,070 156.0 4,280 38.5 1,000 68.02002 77,800 2,970 89.0 4,720 32.0 810 62.02001 78,000 3,170 138.0 4,580 41.0 900 67.02000 79,000 3,300 147.0 4,440 42.0 1,110 72.01999 79,000 3,200 126.0 4,500 36.0 1,030 70.0 1998 79,000 3,340 141.0 4,390 44.0 1,160 64.01997 79,000 3,550 134.0 4,340 44.0 1,090 63.01996 78,000 2,800 111.0 4,490 35.0 1,330 39.01995 79,000 3,100 121.0 4,030 38.0 1,210 61.01994 80,000 3,500 139.0 3,990 43.5 1,180 58.0 1993 81,000 3,280 110.0 4,110 38.0 1,010 52.01992 78,000 3,550 143.0 3,680 40.0 1,115 53.01991 80,000 3,400 96.0 3,770 36.0 1,080 49.01990 83,000 3,450 121.0 3,480 39.0 1,270 60.01989 85,000 2,980 117.0 3,980 31.5 1,230 51.0 1988 85,000 3,000 85.0 3,700 27.0 920 50.01987 84,000 3,100 120.0 3,900 37.0 850 58.01986 88,000 3,720 128.0 3,620 40.5 1,050 46.01985 89,000 4,030 127.0 3,870 41.5 950 62.01984 90,000 3,900 118.0 3,770 36.5 1,100 44.0 1983 92,000 2,800 80.0 3,280 32.0 1,200 49.01982 93,000 4,000 114.0 3,700 36.0 1,200 43.01981 94,000 3,750 96.0 3,450 28.5 1,600 44.01980 95,000 3,900 113.0 3,760 36.0 1,370 49.01979 96,000 3,630 115.0 4,080 35.5 1,320 48.0 1978 96,000 3,610 105.0 3,870 33.0 1,080 39.01977 97,000 3,620 105.0 3,480 35.0 1,540 47.01976 99,000 3,820 103.0 2,880 33.0 1,600 40.01975 101,000 3,340 93.0 3,100 33.0 1,680 42.01974 112,000 3,540 75.0 3,140 26.0 1,450 41.0 1973 113,000 3,040 80.0 3,590 25.5 800 32.01972 114,000 3,090 92.0 3,010 26.5 1,029 45.01971 116,000 3,545 91.0 2,634 30.5 944 44.01970 118,000 3,040 79.0 2,550 28.5 925 38.01969 120,000 2,773 87.0 2,475 29.5 1,017 38.0 1968 122,000 2,884 86.0 2,325 30.5 1,196 37.51967 124,000 3,240 79.0 2,231 22.5 1,514 34.01966 126,000 3,115 84.0 2,105 28.5 1,183 39.01965 129,000 3,054 74.0 2,044 24.5 1,258 32.01964 131,000 3,085 65.0 1,825 22.5 1,446 32.0
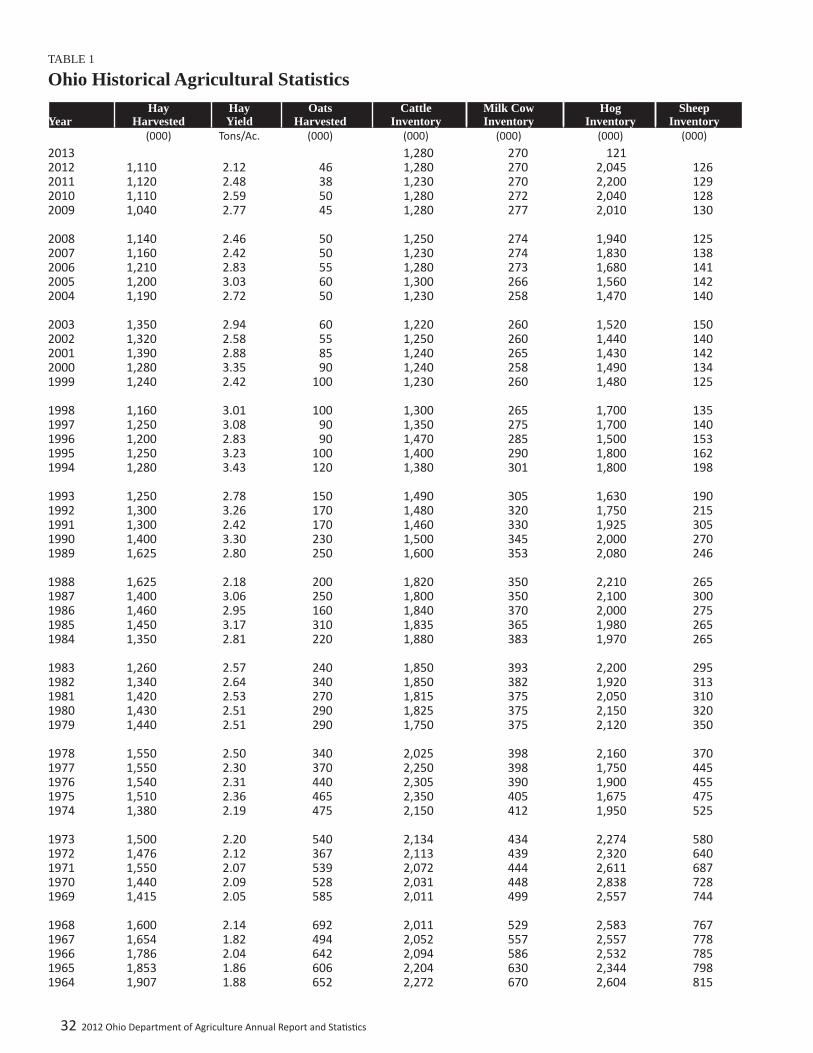
32 2012 Ohio Department of Agriculture Annual Report and Sta s cs
TABLE 1
Ohio Historical Agricultural Statistics Hay Acres Hay Oat Acres Cattle Milk Cow Hog Sheep Hay Hay Oats Cattle Milk Cow Hog SheepYear Harvested Yield Harvested Inventory Inventory Inventory Inventory (000) Tons/Ac. (000) (000) (000) (000) (000)2013 2012 2011 2010 2009
2008 2007 2006 2005 2004
2003 2002 2001 2000 1999
1998 1997 1996 1995 1994
1993 1992 1991 1990 1989
1988 1987 1986 1985 1984
1983 1982 1981 1980 1979
1978 1977 1976 1975 1974
1973 1972 1971 1970 1969
1968 1967 1966 1965 1964
1,280 270 1211,110 2.12 46 1,280 270 2,045 1261,120 2.48 38 1,230 270 2,200 1291,110 2.59 50 1,280 272 2,040 1281,040 2.77 45 1,280 277 2,010 130 1,140 2.46 50 1,250 274 1,940 1251,160 2.42 50 1,230 274 1,830 1381,210 2.83 55 1,280 273 1,680 1411,200 3.03 60 1,300 266 1,560 1421,190 2.72 50 1,230 258 1,470 140 1,350 2.94 60 1,220 260 1,520 1501,320 2.58 55 1,250 260 1,440 1401,390 2.88 85 1,240 265 1,430 1421,280 3.35 90 1,240 258 1,490 1341,240 2.42 100 1,230 260 1,480 125 1,160 3.01 100 1,300 265 1,700 1351,250 3.08 90 1,350 275 1,700 1401,200 2.83 90 1,470 285 1,500 1531,250 3.23 100 1,400 290 1,800 1621,280 3.43 120 1,380 301 1,800 198 1,250 2.78 150 1,490 305 1,630 1901,300 3.26 170 1,480 320 1,750 2151,300 2.42 170 1,460 330 1,925 3051,400 3.30 230 1,500 345 2,000 2701,625 2.80 250 1,600 353 2,080 246 1,625 2.18 200 1,820 350 2,210 2651,400 3.06 250 1,800 350 2,100 3001,460 2.95 160 1,840 370 2,000 2751,450 3.17 310 1,835 365 1,980 2651,350 2.81 220 1,880 383 1,970 265 1,260 2.57 240 1,850 393 2,200 2951,340 2.64 340 1,850 382 1,920 3131,420 2.53 270 1,815 375 2,050 3101,430 2.51 290 1,825 375 2,150 3201,440 2.51 290 1,750 375 2,120 350 1,550 2.50 340 2,025 398 2,160 3701,550 2.30 370 2,250 398 1,750 4451,540 2.31 440 2,305 390 1,900 4551,510 2.36 465 2,350 405 1,675 4751,380 2.19 475 2,150 412 1,950 525 1,500 2.20 540 2,134 434 2,274 5801,476 2.12 367 2,113 439 2,320 6401,550 2.07 539 2,072 444 2,611 6871,440 2.09 528 2,031 448 2,838 7281,415 2.05 585 2,011 499 2,557 744 1,600 2.14 692 2,011 529 2,583 7671,654 1.82 494 2,052 557 2,557 7781,786 2.04 642 2,094 586 2,532 7851,853 1.86 606 2,204 630 2,344 7981,907 1.88 652 2,272 670 2,604 815

2012 Ohio Department of Agriculture Annual Report and Sta s cs 33
TABLE 2
Profi le of Ohio Agriculture 20121
Ohio State Ranked First Prod. or Prod. or Commodity Unit Rank2 Inventory3 State2 Inventory3
Thousand ThousandField Crops Corn for grain Bu. 7 448,950 Iowa 1,876,900Corn for silage Ton 13 3,200 Wisconsin 14,210Oats Bu. 9 2,576 Minnesota 8,370Winter Wheat Bu. 16 31,050 Kansas 382,200Soybeans Bu. 6 206,100 Iowa 413,850All Hay (baled) Ton 23 2,330 Texas 9,490All Potatoes Cwt 4 4 Idaho 143,240Tobacco Lb. 8 3,990 North Carolina 381,190 Fresh Vegetables Sweet Corn Cwt 6 1,586 California 6,930Tomatoes Cwt 6 697 California 9,765Cabbage Cwt 12 480 New York 4,536Total Fresh Vegetables Cwt 14 5,476 California 212,213 Processing Vegetables Tomatoes Ton 3 156.6 California 12,640.0Cucumbers Ton 5 31.3 Miichigan 155.0Total Processing Vegetables Ton 7 187.9 California 12,830.0 Fruit Apples Lb. 12 33.0 Washington 6,500,000.0All Grapes Ton 9 5.3 California 6,682.0Processed Grapes Ton 10 5.2 California 5,684.0Peaches Ton 14 5.0 California 713.0Strawberries Cwt 10 28.0 California 27,637.0 Poultry and Poultry Products Chicken Layers inventory 12/1/11 Head 2 28,481 Iowa 52,773Chickens sold Lb. 9 36,386 Georgia 96,560Broiler produc on Lb. 16 379,200 Georgia 7,625,500Turkey produc on Lb. 9 219,450 North Carolina 1,177,200Egg produc on 12/10 - 11/11 (million) No. 2 7,685 Iowa 14,499 Livestock and Livestock Products Hog and Pig inventory 12/1/12 Head 9 2,055 Iowa 20,600Hog and Pig produc on Lb. 9 1,088,705 Iowa 10,371,793Ca le and Calf inventory 1/1/13 Head 25 1,230 Texas 11,300Ca le and Calf produc on Lb. 25 462,521 Texas 6,336,902Beef Cow inventory 1/1/13 Head 29 290 Texas 4,015Milk Cow inventory 1/1/13 Head 10 270 California 1,780Sheep and Lamb inventory 1/1/13 Head 13 121 Texas 700Wool Lb. 14 560 California 2,800Ca le slaughtered Head 15 107.8 Nebraska 6,731.8Hogs slaughtered Head 13 1,001.6 Iowa 30,158.5Calves slaughtered Head 2 125.7 California 174.9Sheep and Lambs slaughtered Head 14 13.3 Colorado 960.4Red Meat produc on Lb. 21 278,700 Nebraska 7,285,100Livestock slaughter plants 1/1/13 No. 4 154 Texas 215(Not in thousands) Milk and Milk Products Milk produc on (Million) Lb. 10 5,355 California 41,801All Cheese excluding Co age Cheese Lb. 10 198,904 Wisconsin 2,789,824Swiss Cheese Lb. 1 137,678 Ohio 137,678
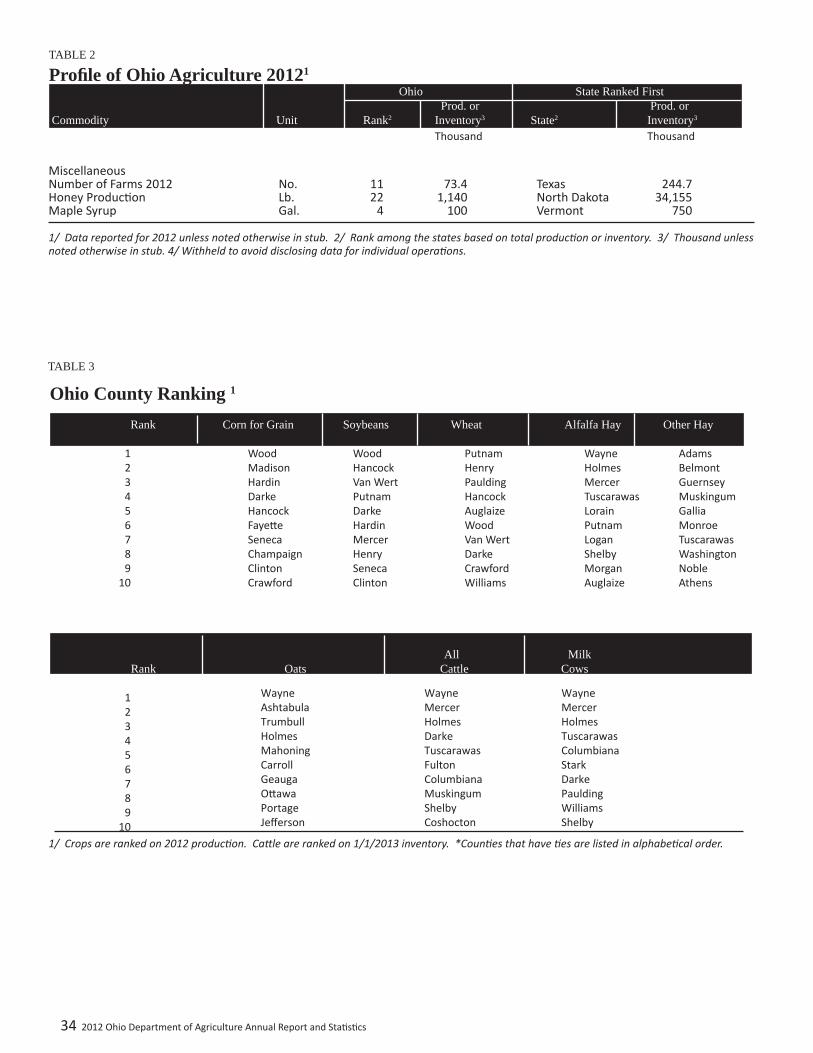
34 2012 Ohio Department of Agriculture Annual Report and Sta s cs
Ohio County Ranking 1
Rank Corn for Grain Soybeans Wheat Alfalfa Hay Other Hay
1 Wood Wood Putnam Wayne Adams 2 Madison Hancock Henry Holmes Belmont 3 Hardin Van Wert Paulding Mercer Guernsey 4 Darke Putnam Hancock Tuscarawas Muskingum 5 Hancock Darke Auglaize Lorain Gallia 6 Faye e Hardin Wood Putnam Monroe 7 Seneca Mercer Van Wert Logan Tuscarawas 8 Champaign Henry Darke Shelby Washington 9 Clinton Seneca Crawford Morgan Noble 10 Crawford Clinton Williams Auglaize Athens
All Milk Rank Oats Cattle Cows 1 2 3 4 5 6 7 8 9 10
TABLE 3
Miscellaneous Number of Farms 2012 No. 11 73.4 Texas 244.7Honey Produc on Lb. 22 1,140 North Dakota 34,155Maple Syrup Gal. 4 100 Vermont 750
1/ Data reported for 2012 unless noted otherwise in stub. 2/ Rank among the states based on total produc on or inventory. 3/ Thousand unless noted otherwise in stub. 4/ Withheld to avoid disclosing data for individual opera ons.
1/ Crops are ranked on 2012 produc on. Ca le are ranked on 1/1/2013 inventory. *Coun es that have es are listed in alphabe cal order.
Wayne Wayne WayneAshtabula Mercer MercerTrumbull Holmes HolmesHolmes Darke TuscarawasMahoning Tuscarawas ColumbianaCarroll Fulton StarkGeauga Columbiana DarkeO awa Muskingum PauldingPortage Shelby WilliamsJeff erson Coshocton Shelby
TABLE 2
Profi le of Ohio Agriculture 20121
Ohio State Ranked First Prod. or Prod. or Commodity Unit Rank2 Inventory3 State2 Inventory3
Thousand Thousand
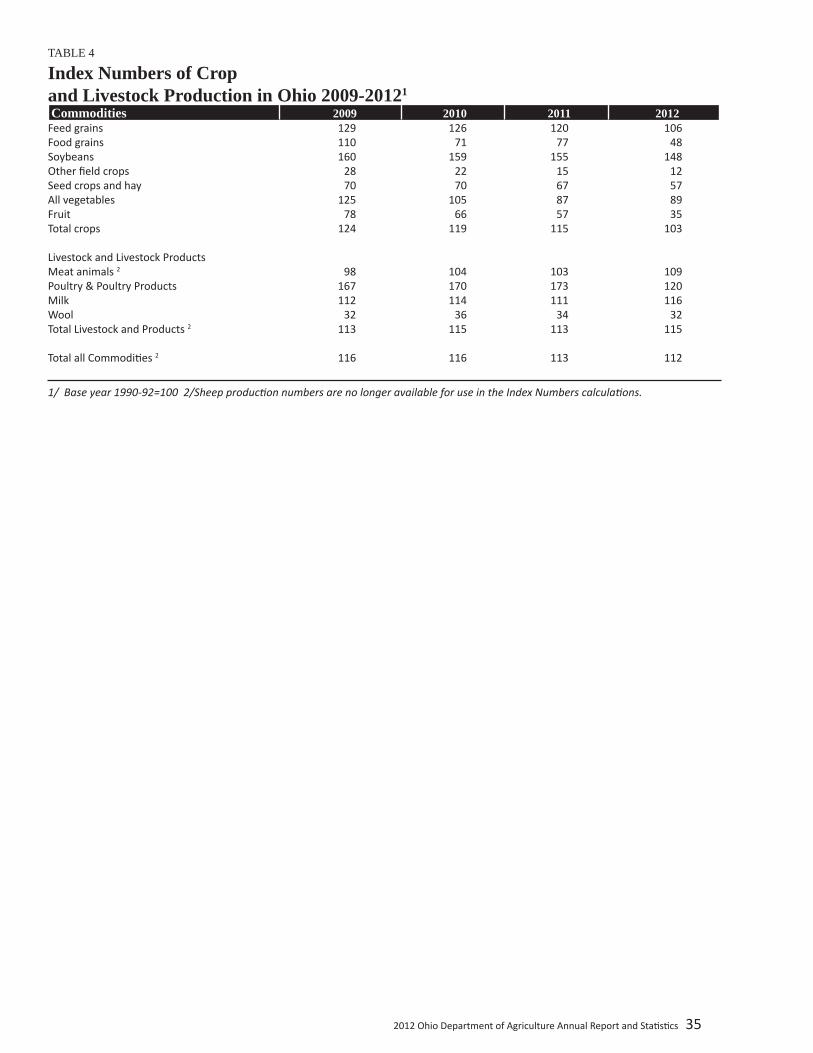
2012 Ohio Department of Agriculture Annual Report and Sta s cs 35
TABLE 4
Index Numbers of Cropand Livestock Production in Ohio 2009-20121
Commodities 2009 2010 2011 2012Feed grains 129 126 120 106Food grains 110 71 77 48Soybeans 160 159 155 148Other fi eld crops 28 22 15 12Seed crops and hay 70 70 67 57All vegetables 125 105 87 89Fruit 78 66 57 35Total crops 124 119 115 103 Livestock and Livestock Products Meat animals 2 98 104 103 109Poultry & Poultry Products 167 170 173 120Milk 112 114 111 116Wool 32 36 34 32Total Livestock and Products 2 113 115 113 115 Total all Commodi es 2 116 116 113 112
1/ Base year 1990-92=100 2/Sheep produc on numbers are no longer available for use in the Index Numbers calcula ons.
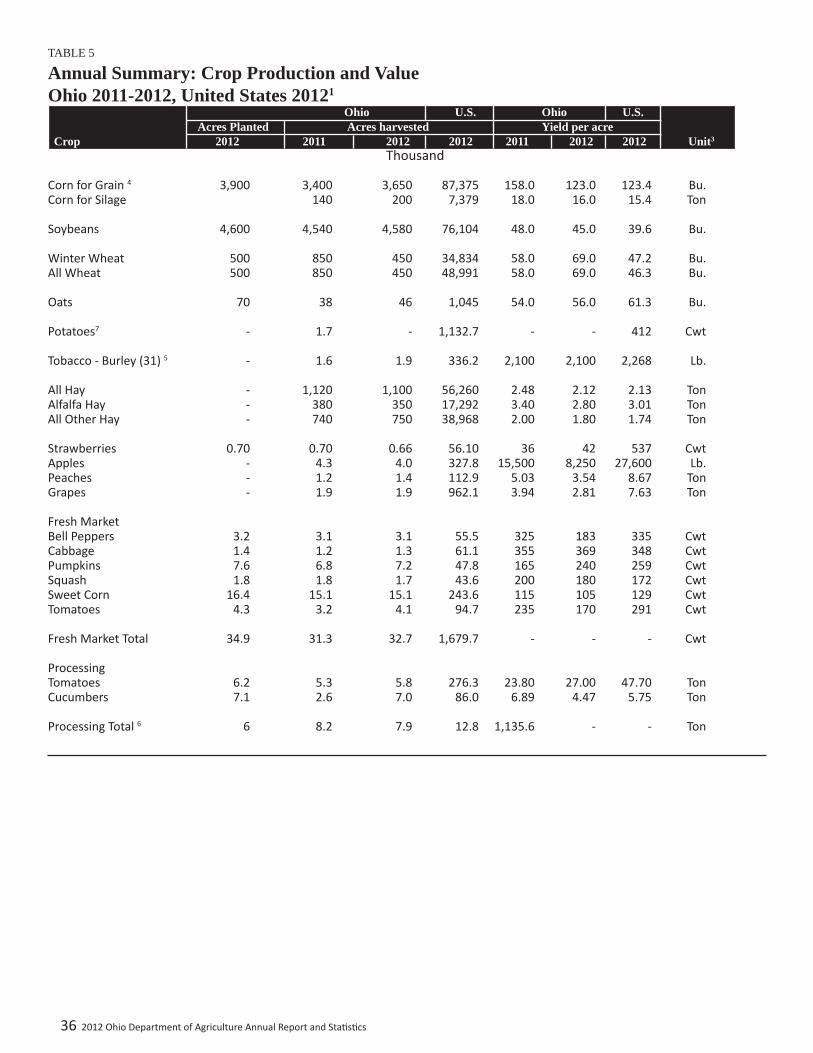
36 2012 Ohio Department of Agriculture Annual Report and Sta s cs
TABLE 5
Annual Summary: Crop Production and Value Ohio 2011-2012, United States 20121 Ohio U.S. Ohio U.S. Acres Planted Acres harvested Yield per acre Crop 2012 2011 2012 2012 2011 2012 2012 Unit3 Thousand
Corn for Grain 4 3,900 3,400 3,650 87,375 158.0 123.0 123.4 Bu.Corn for Silage 140 200 7,379 18.0 16.0 15.4 Ton Soybeans 4,600 4,540 4,580 76,104 48.0 45.0 39.6 Bu. Winter Wheat 500 850 450 34,834 58.0 69.0 47.2 Bu.All Wheat 500 850 450 48,991 58.0 69.0 46.3 Bu. Oats 70 38 46 1,045 54.0 56.0 61.3 Bu. Potatoes7 - 1.7 - 1,132.7 - - 412 Cwt Tobacco - Burley (31) 5 - 1.6 1.9 336.2 2,100 2,100 2,268 Lb. All Hay - 1,120 1,100 56,260 2.48 2.12 2.13 TonAlfalfa Hay - 380 350 17,292 3.40 2.80 3.01 TonAll Other Hay - 740 750 38,968 2.00 1.80 1.74 Ton Strawberries 0.70 0.70 0.66 56.10 36 42 537 CwtApples - 4.3 4.0 327.8 15,500 8,250 27,600 Lb.Peaches - 1.2 1.4 112.9 5.03 3.54 8.67 TonGrapes - 1.9 1.9 962.1 3.94 2.81 7.63 Ton Fresh Market Bell Peppers 3.2 3.1 3.1 55.5 325 183 335 CwtCabbage 1.4 1.2 1.3 61.1 355 369 348 CwtPumpkins 7.6 6.8 7.2 47.8 165 240 259 CwtSquash 1.8 1.8 1.7 43.6 200 180 172 CwtSweet Corn 16.4 15.1 15.1 243.6 115 105 129 CwtTomatoes 4.3 3.2 4.1 94.7 235 170 291 Cwt Fresh Market Total 34.9 31.3 32.7 1,679.7 - - - Cwt Processing Tomatoes 6.2 5.3 5.8 276.3 23.80 27.00 47.70 TonCucumbers 7.1 2.6 7.0 86.0 6.89 4.47 5.75 Ton Processing Total 6 6 8.2 7.9 12.8 1,135.6 - - Ton
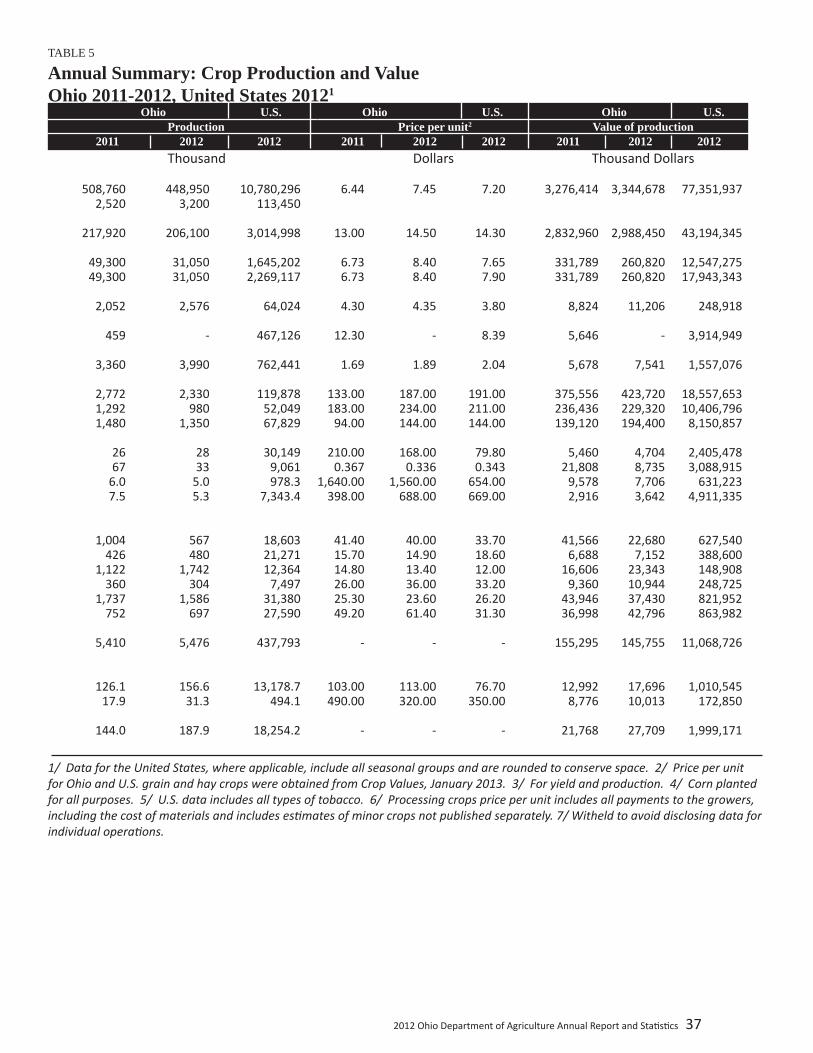
2012 Ohio Department of Agriculture Annual Report and Sta s cs 37
TABLE 5
Annual Summary: Crop Production and Value Ohio 2011-2012, United States 20121 Ohio U.S. Ohio U.S. Ohio U.S. Production Price per unit2 Value of production 2011 2012 2012 2011 2012 2012 2011 2012 2012 Thousand Dollars Thousand Dollars 508,760 448,950 10,780,296 6.44 7.45 7.20 3,276,414 3,344,678 77,351,937 2,520 3,200 113,450 217,920 206,100 3,014,998 13.00 14.50 14.30 2,832,960 2,988,450 43,194,345 49,300 31,050 1,645,202 6.73 8.40 7.65 331,789 260,820 12,547,275 49,300 31,050 2,269,117 6.73 8.40 7.90 331,789 260,820 17,943,343 2,052 2,576 64,024 4.30 4.35 3.80 8,824 11,206 248,918 459 - 467,126 12.30 - 8.39 5,646 - 3,914,949 3,360 3,990 762,441 1.69 1.89 2.04 5,678 7,541 1,557,076 2,772 2,330 119,878 133.00 187.00 191.00 375,556 423,720 18,557,653 1,292 980 52,049 183.00 234.00 211.00 236,436 229,320 10,406,796 1,480 1,350 67,829 94.00 144.00 144.00 139,120 194,400 8,150,857 26 28 30,149 210.00 168.00 79.80 5,460 4,704 2,405,478 67 33 9,061 0.367 0.336 0.343 21,808 8,735 3,088,915 6.0 5.0 978.3 1,640.00 1,560.00 654.00 9,578 7,706 631,223 7.5 5.3 7,343.4 398.00 688.00 669.00 2,916 3,642 4,911,335 1,004 567 18,603 41.40 40.00 33.70 41,566 22,680 627,540 426 480 21,271 15.70 14.90 18.60 6,688 7,152 388,600 1,122 1,742 12,364 14.80 13.40 12.00 16,606 23,343 148,908 360 304 7,497 26.00 36.00 33.20 9,360 10,944 248,725 1,737 1,586 31,380 25.30 23.60 26.20 43,946 37,430 821,952 752 697 27,590 49.20 61.40 31.30 36,998 42,796 863,982 5,410 5,476 437,793 - - - 155,295 145,755 11,068,726 126.1 156.6 13,178.7 103.00 113.00 76.70 12,992 17,696 1,010,545 17.9 31.3 494.1 490.00 320.00 350.00 8,776 10,013 172,850 144.0 187.9 18,254.2 - - - 21,768 27,709 1,999,171
1/ Data for the United States, where applicable, include all seasonal groups and are rounded to conserve space. 2/ Price per unit for Ohio and U.S. grain and hay crops were obtained from Crop Values, January 2013. 3/ For yield and produc on. 4/ Corn planted for all purposes. 5/ U.S. data includes all types of tobacco. 6/ Processing crops price per unit includes all payments to the growers, including the cost of materials and includes es mates of minor crops not published separately. 7/ Witheld to avoid disclosing data for individual opera ons.
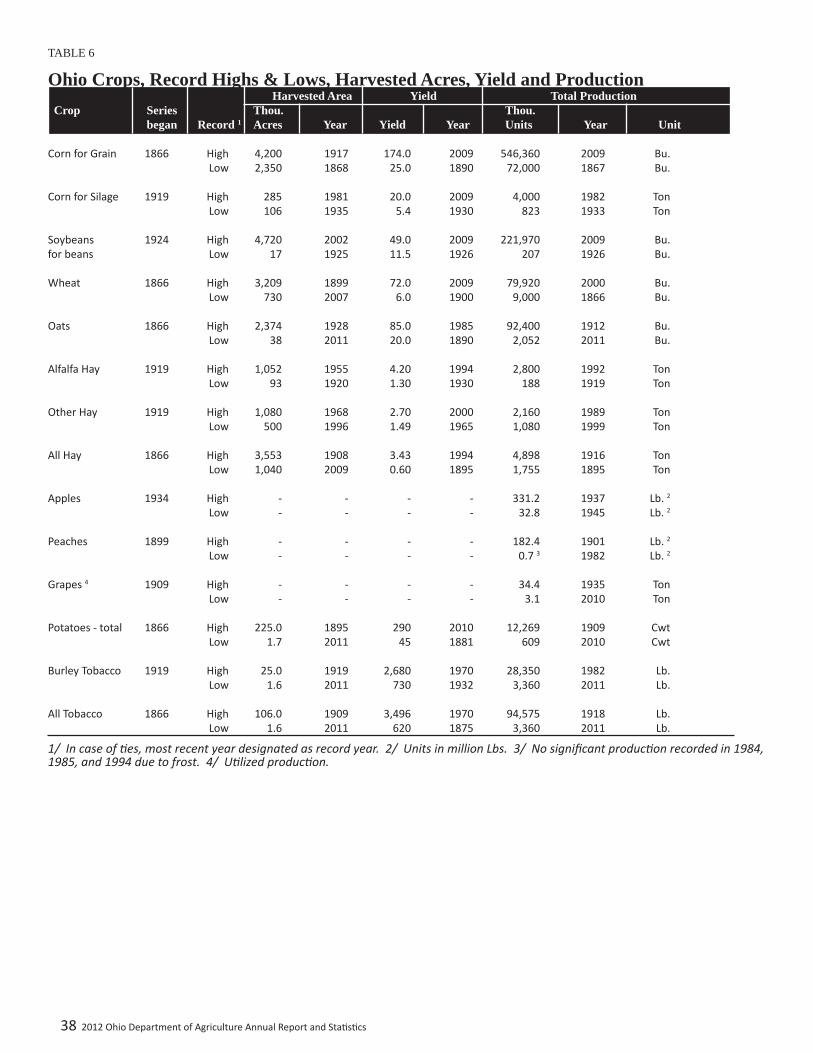
38 2012 Ohio Department of Agriculture Annual Report and Sta s cs
TABLE 6
Ohio Crops, Record Highs & Lows, Harvested Acres, Yield and Production Harvested Area Yield Total Production Crop Series Thou. Thou. began Record 1 Acres Year Yield Year Units Year Unit Corn for Grain 1866 High 4,200 1917 174.0 2009 546,360 2009 Bu. Low 2,350 1868 25.0 1890 72,000 1867 Bu. Corn for Silage 1919 High 285 1981 20.0 2009 4,000 1982 Ton Low 106 1935 5.4 1930 823 1933 Ton Soybeans 1924 High 4,720 2002 49.0 2009 221,970 2009 Bu.for beans Low 17 1925 11.5 1926 207 1926 Bu. Wheat 1866 High 3,209 1899 72.0 2009 79,920 2000 Bu. Low 730 2007 6.0 1900 9,000 1866 Bu. Oats 1866 High 2,374 1928 85.0 1985 92,400 1912 Bu. Low 38 2011 20.0 1890 2,052 2011 Bu. Alfalfa Hay 1919 High 1,052 1955 4.20 1994 2,800 1992 Ton Low 93 1920 1.30 1930 188 1919 Ton Other Hay 1919 High 1,080 1968 2.70 2000 2,160 1989 Ton Low 500 1996 1.49 1965 1,080 1999 Ton All Hay 1866 High 3,553 1908 3.43 1994 4,898 1916 Ton Low 1,040 2009 0.60 1895 1,755 1895 Ton Apples 1934 High - - - - 331.2 1937 Lb. 2
Low - - - - 32.8 1945 Lb. 2
Peaches 1899 High - - - - 182.4 1901 Lb. 2
Low - - - - 0.7 3 1982 Lb. 2
Grapes 4 1909 High - - - - 34.4 1935 Ton Low - - - - 3.1 2010 Ton Potatoes - total 1866 High 225.0 1895 290 2010 12,269 1909 Cwt Low 1.7 2011 45 1881 609 2010 Cwt Burley Tobacco 1919 High 25.0 1919 2,680 1970 28,350 1982 Lb. Low 1.6 2011 730 1932 3,360 2011 Lb. All Tobacco 1866 High 106.0 1909 3,496 1970 94,575 1918 Lb. Low 1.6 2011 620 1875 3,360 2011 Lb.
1/ In case of es, most recent year designated as record year. 2/ Units in million Lbs. 3/ No signifi cant produc on recorded in 1984, 1985, and 1994 due to frost. 4/ U lized produc on.

2012 Ohio Department of Agriculture Annual Report and Sta s cs 39
TABLE 7
Number of Farms, Average Size of Farm and Land in Farms Ohio and United States, 2010-2012 Number of Farms 1 Average Size of Farm Land in Farms Year Ohio U.S. Ohio U.S. Ohio U.S. Number Acres Thousand Acres2010 74,300 2,192,000 184 419 13,700 918,8402011 73,700 2,181,630 185 420 13,600 917,0002012 73,400 2,170,000 185 421 13,550 914,0001/ A farm is defi ned as a place with annual sales of agricultural commodi es of $1,000 or more.
Ohio Agricultural Statistics Districts

40 2012 Ohio Department of Agriculture Annual Report and Sta s cs
Adams 63 14,100 17,300 13,200 16,000 148.6 82.5 1,961,000 1,320,000Allen 28 59,700 71,800 58,200 70,000 158.2 113.9 9,205,000 7,975,000Ashland 41 43,900 42,400 34,500 36,200 145.3 121.4 5,014,000 4,393,000Ashtabula 50 21,800 23,300 20,000 21,800 155.0 136.0 3,099,000 2,965,000Athens 74 2,300 2,900 2,180 2,420 161.5 117.8 352,000 285,000Auglaize 29 64,800 78,800 60,400 74,100 171.1 107.2 10,332,000 7,941,000Belmont 80 * 500 * 180 * 98.9 * 17,800Brown 46 18,200 28,500 18,000 27,500 154.8 126.9 2,787,000 3,491,000Butler 61 30,000 30,800 29,200 28,800 131.6 66.1 3,843,000 1,904,000Carroll 65 11,600 12,600 10,300 10,300 125.6 84.1 1,294,000 866,000Champaign 8 88,900 91,900 85,200 89,800 144.8 125.0 12,337,000 11,226,000Clark 21 64,500 67,100 61,700 63,800 169.1 141.8 10,435,000 9,050,000Clermont 57 15,400 18,700 15,200 18,200 168.4 118.1 2,559,000 2,150,000Clinton 9 71,400 76,900 70,500 74,500 172.3 148.9 12,148,000 11,090,000Columbiana 53 25,300 26,200 21,700 20,300 144.0 132.6 3,124,000 2,692,000Coshocton 49 27,000 29,200 25,700 26,200 149.6 117.3 3,846,000 3,072,000Crawford 10 74,500 83,600 72,200 81,000 187.7 135.1 13,550,000 10,941,000Cuyahoga * * * * * * * * *Darke 4 130,500 136,000 125,800 128,600 131.0 102.7 16,484,000 13,210,000Defi ance 39 48,000 57,300 44,700 54,300 137.7 82.3 6,157,000 4,467,000Delaware 33 47,300 50,100 47,200 48,500 157.1 136.2 7,415,000 6,604,000Erie 40 27,500 32,100 26,400 30,700 145.3 145.0 3,837,000 4,452,000Fairfi eld 31 61,300 65,700 61,100 62,900 164.0 108.5 10,019,000 6,822,000Faye e 6 * 96,300 * 93,100 * 129.0 * 12,011,000Franklin * * * * * * * * *Fulton 15 84,900 85,900 79,600 83,000 159.2 121.4 12,675,000 10,080,000Gallia 69 3,000 3,200 2,540 3,060 145.3 139.5 369,000 427,000Geauga 71 3,300 3,700 3,070 3,100 150.2 130.3 461,000 404,000Greene 22 58,000 63,800 57,800 61,900 176.0 145.6 10,173,000 9,014,000Guernsey 70 3,400 4,200 2,990 3,310 134.1 125.1 401,000 414,000Hamilton 72 4,200 3,900 4,000 3,800 135.3 100.8 541,000 383,000Hancock 5 80,400 94,500 76,900 90,800 171.1 144.0 13,154,000 13,075,000Hardin 3 77,100 100,000 72,300 97,500 174.1 137.8 12,584,000 13,440,000Harrison 67 * 4,600 * 4,050 * 108.9 * 441,000Henry 27 79,600 84,900 77,000 80,300 148.5 101.1 11,438,000 8,118,000Highland 37 38,800 47,600 37,600 45,500 161.4 121.4 6,069,000 5,524,000Hocking 73 2,700 3,200 2,450 3,110 149.4 112.9 366,000 351,000Holmes 54 23,600 24,800 20,900 20,200 157.3 130.4 3,287,000 2,635,000Huron 14 58,500 75,300 56,000 72,000 161.0 143.5 9,016,000 10,330,000Jackson * 2,600 * 2,420 * 153.7 * 372,000 *Jeff erson 76 1,800 2,100 1,490 1,670 133.6 101.3 199,000 169,200Knox 30 51,400 57,100 49,700 51,700 149.5 143.7 7,429,000 7,430,000Lake * * * * * * * * *Lawrence 78 1,000 1,200 760 950 131.6 110.5 100,000 105,000Licking 25 57,400 64,700 55,700 62,100 158.0 132.9 8,800,000 8,250,000Logan 12 61,500 78,700 59,000 73,900 168.5 144.1 9,944,000 10,652,000Lorain 43 19,000 29,900 16,900 28,400 155.4 152.3 2,627,000 4,325,000Lucas 47 21,500 23,500 21,000 23,000 165.3 145.3 3,472,000 3,341,000Madison 2 93,900 106,500 89,600 102,500 172.2 144.5 15,427,000 14,811,000Mahoning 59 15,200 15,300 13,300 13,800 142.7 142.0 1,898,000 1,960,000Marion 23 57,000 71,000 52,000 65,000 175.9 133.1 9,145,000 8,650,000Medina 62 16,100 19,800 15,000 15,900 138.8 118.2 2,082,000 1,879,000Meigs 67 3,300 3,900 3,100 3,390 130.0 130.1 403,000 441,000Mercer 13 92,000 107,500 83,600 94,800 161.4 110.5 13,496,000 10,476,000Miami 24 74,000 80,600 71,900 78,300 134.2 110.2 9,649,000 8,627,000Monroe * 500 * 370 * 106.2 * 39,300 *Montgomery 52 38,200 40,500 38,100 39,400 132.1 69.1 5,032,000 2,723,000Morgan 75 3,400 4,200 3,020 2,550 119.9 106.7 362,000 272,000Morrow 32 44,600 47,100 44,100 45,300 165.9 148.4 7,318,000 6,722,000Muskingum 55 18,500 20,000 18,300 18,800 153.8 132.4 2,814,000 2,489,000
TABLE 8Ohio County Estimates, 2011-2012Corn for Grain: Acres, Yield and Production Ranking by Acreage Planted Acreage Harvested Yield Production County Production 2011 2012 2010 2011 2010 2011 2010 2011 Acres Acres Bu per acre Bushels
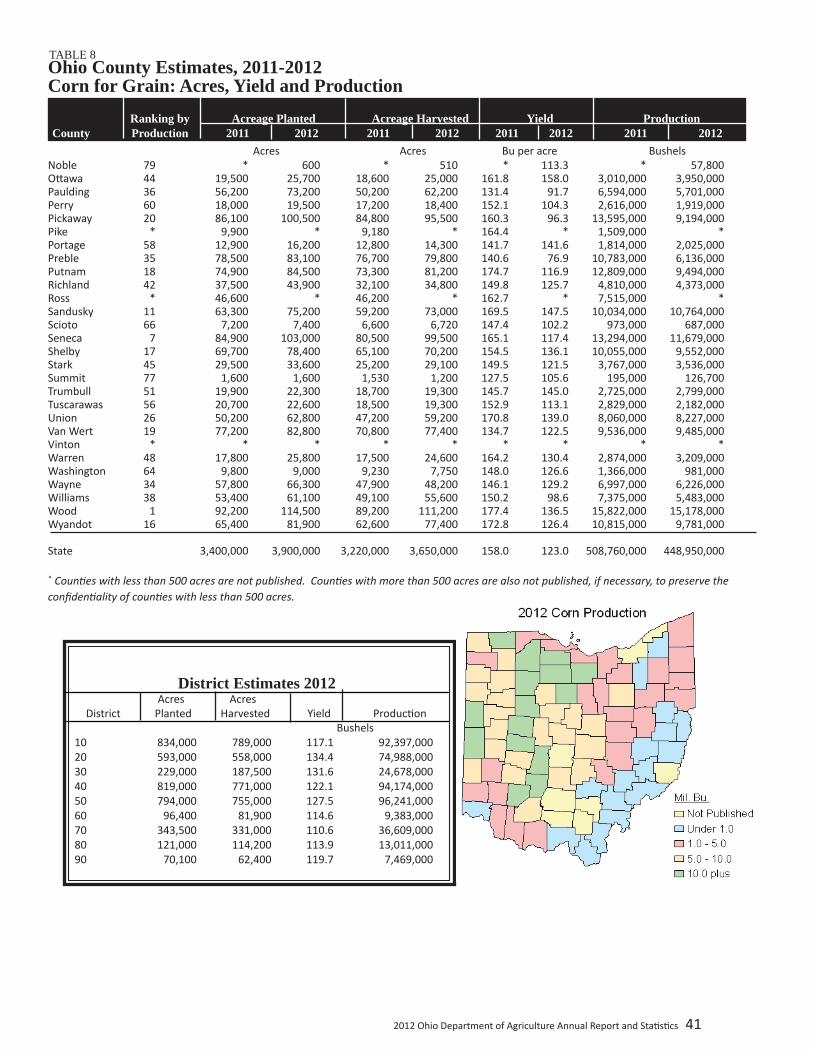
2012 Ohio Department of Agriculture Annual Report and Sta s cs 41
TABLE 8Ohio County Estimates, 2011-2012Corn for Grain: Acres, Yield and Production Ranking by Acreage Planted Acreage Harvested Yield Production County Production 2011 2012 2011 2012 2011 2012 2011 2012
Acres Acres Bu per acre Bushels
District Estimates 2012 Acres Acres District Planted Harvested Yield Produc on Bushels
10 834,000 789,000 117.1 92,397,00020 593,000 558,000 134.4 74,988,00030 229,000 187,500 131.6 24,678,00040 819,000 771,000 122.1 94,174,00050 794,000 755,000 127.5 96,241,00060 96,400 81,900 114.6 9,383,00070 343,500 331,000 110.6 36,609,00080 121,000 114,200 113.9 13,011,00090 70,100 62,400 119.7 7,469,000
Noble 79 * 600 * 510 * 113.3 * 57,800O awa 44 19,500 25,700 18,600 25,000 161.8 158.0 3,010,000 3,950,000Paulding 36 56,200 73,200 50,200 62,200 131.4 91.7 6,594,000 5,701,000Perry 60 18,000 19,500 17,200 18,400 152.1 104.3 2,616,000 1,919,000Pickaway 20 86,100 100,500 84,800 95,500 160.3 96.3 13,595,000 9,194,000Pike * 9,900 * 9,180 * 164.4 * 1,509,000 *Portage 58 12,900 16,200 12,800 14,300 141.7 141.6 1,814,000 2,025,000Preble 35 78,500 83,100 76,700 79,800 140.6 76.9 10,783,000 6,136,000Putnam 18 74,900 84,500 73,300 81,200 174.7 116.9 12,809,000 9,494,000Richland 42 37,500 43,900 32,100 34,800 149.8 125.7 4,810,000 4,373,000Ross * 46,600 * 46,200 * 162.7 * 7,515,000 *Sandusky 11 63,300 75,200 59,200 73,000 169.5 147.5 10,034,000 10,764,000Scioto 66 7,200 7,400 6,600 6,720 147.4 102.2 973,000 687,000Seneca 7 84,900 103,000 80,500 99,500 165.1 117.4 13,294,000 11,679,000Shelby 17 69,700 78,400 65,100 70,200 154.5 136.1 10,055,000 9,552,000Stark 45 29,500 33,600 25,200 29,100 149.5 121.5 3,767,000 3,536,000Summit 77 1,600 1,600 1,530 1,200 127.5 105.6 195,000 126,700Trumbull 51 19,900 22,300 18,700 19,300 145.7 145.0 2,725,000 2,799,000Tuscarawas 56 20,700 22,600 18,500 19,300 152.9 113.1 2,829,000 2,182,000Union 26 50,200 62,800 47,200 59,200 170.8 139.0 8,060,000 8,227,000Van Wert 19 77,200 82,800 70,800 77,400 134.7 122.5 9,536,000 9,485,000Vinton * * * * * * * * *Warren 48 17,800 25,800 17,500 24,600 164.2 130.4 2,874,000 3,209,000Washington 64 9,800 9,000 9,230 7,750 148.0 126.6 1,366,000 981,000Wayne 34 57,800 66,300 47,900 48,200 146.1 129.2 6,997,000 6,226,000Williams 38 53,400 61,100 49,100 55,600 150.2 98.6 7,375,000 5,483,000Wood 1 92,200 114,500 89,200 111,200 177.4 136.5 15,822,000 15,178,000Wyandot 16 65,400 81,900 62,600 77,400 172.8 126.4 10,815,000 9,781,000 State 3,400,000 3,900,000 3,220,000 3,650,000 158.0 123.0 508,760,000 448,950,000
* Coun es with less than 500 acres are not published. Coun es with more than 500 acres are also not published, if necessary, to preserve the confi den ality of coun es with less than 500 acres.

42 2012 Ohio Department of Agriculture Annual Report and Sta s cs
TABLE 9Ohio County Estimates, 2011-2012Soybeans for Grain: Acres, Yield and Production Ranking by Acreage Planted Acreage Harvested Yield Production County Production 2011 2012 2011 2012 2011 2012 2011 2012 Acres Acres Bu per acre BushelsAdams 56 21,700 22,600 21,600 22,500 45.0 41.1 972,000 925,000Allen 16 83,400 83,400 83,100 83,300 50.8 53.3 4,220,000 4,444,000Ashland 44 40,600 42,100 40,500 41,900 45.2 41.2 1,832,000 1,727,000Ashtabula 47 26,100 32,600 26,000 32,500 46.2 47.4 1,200,000 1,540,000Athens 72 2,300 2,500 2,230 2,400 42.5 45.0 94,700 108,000Auglaize 15 92,500 89,000 91,500 88,900 50.3 50.4 4,598,000 4,478,000Belmont * * * * * * * * *Brown 24 87,300 81,400 87,200 81,300 43.9 48.6 3,831,000 3,951,000Butler 55 33,700 34,200 33,600 33,800 37.6 28.1 1,265,000 950,000Carroll 66 8,000 9,000 8,000 8,800 40.0 25.7 320,000 226,000Champaign 28 82,900 81,800 82,800 81,700 44.4 41.2 3,674,000 3,365,000Clark 37 64,300 64,000 64,200 63,900 52.4 40.8 3,364,000 2,604,000Clermont 48 37,600 34,400 37,400 33,800 49.2 45.0 1,841,000 1,522,000Clinton 10 97,500 100,500 97,400 100,300 51.2 47.6 4,989,000 4,770,000Columbiana 54 19,700 21,200 19,600 21,100 50.4 46.4 988,000 980,000Coshocton 59 16,800 17,300 16,600 17,000 47.5 39.6 788,000 673,000Crawford 26 94,900 92,600 94,700 91,400 54.9 42.8 5,195,000 3,915,000Cuyahoga * * * * * * * * *Darke 5 138,000 137,000 137,900 136,400 43.2 42.7 5,951,000 5,826,000Defi ance 27 91,800 103,000 91,500 102,100 39.2 34.6 3,583,000 3,536,000Delaware 29 71,400 72,200 71,200 72,100 42.5 44.1 3,029,000 3,181,000Erie 45 35,200 34,500 35,100 34,400 43.9 47.4 1,540,000 1,630,000Fairfi eld 39 66,200 64,700 66,100 64,200 54.1 39.5 3,579,000 2,539,000Faye e * 113,500 * 113,500 * 51.1 * 5,795,000 *Franklin * * * * * * * * *Fulton 23 78,200 87,500 78,100 87,100 48.5 47.5 3,791,000 4,138,000Gallia 69 2,700 3,600 2,670 3,240 45.3 43.5 121,000 141,000Geauga 67 2,300 3,600 2,270 3,440 47.6 50.3 108,000 173,000Greene 38 65,700 62,400 65,600 62,300 52.6 41.5 3,451,000 2,587,000Guernsey 74 * 3,000 * 2,600 * 39.2 * 102,000Hamilton 68 3,500 3,800 3,400 3,700 43.5 44.9 148,000 166,000Hancock 2 127,000 137,500 126,900 137,400 50.9 49.8 6,458,000 6,839,000Hardin 6 112,500 108,500 112,200 108,400 51.2 48.3 5,744,000 5,241,000Harrison 72 * 2,900 * 2,800 * 38.6 * 108,000Henry 8 94,200 100,500 94,100 100,400 50.4 49.9 4,740,000 5,011,000Highland 19 95,900 95,700 95,800 95,600 46.7 45.5 4,470,000 4,351,000Hocking 70 2,800 3,100 2,760 2,900 47.8 39.3 132,000 114,000Holmes 64 12,600 12,300 12,500 12,200 50.7 41.1 634,000 502,000Huron 22 91,900 93,900 91,700 92,500 46.3 44.9 4,244,000 4,153,000Jackson * 3,500 * 3,450 * 47.8 * 165,000 *Jeff erson * * * * * * * * *Knox 40 * 52,900 * 52,800 * 45.2 * 2,385,000Lake * * * * * * * * *Lawrence 76 1,400 1,400 1,380 1,330 39.9 33.1 55,000 44,000Licking 35 64,500 63,700 64,400 63,500 47.3 42.8 3,044,000 2,718,000Logan 21 90,800 85,100 90,700 85,000 49.1 49.3 4,454,000 4,192,000Lorain 36 46,200 54,900 46,000 54,400 42.3 48.4 1,948,000 2,632,000Lucas 46 28,800 30,400 28,600 30,300 46.4 52.4 1,327,000 1,589,000Madison 17 123,000 114,000 122,900 113,900 52.1 39.0 6,397,000 4,443,000Mahoning 58 14,100 15,400 14,100 15,200 44.8 49.2 631,000 748,000Marion 12 104,000 99,700 104,000 99,600 50.5 46.0 5,249,000 4,585,000Medina 52 23,900 30,900 23,900 30,800 45.7 39.3 1,092,000 1,210,000Meigs * * * * * * * * *Mercer 7 103,000 96,100 102,900 96,000 49.5 53.4 5,095,000 5,123,000Miami 31 83,900 78,300 83,800 77,600 43.7 40.9 3,659,000 3,170,000Monroe * * * * * * * * *Montgomery 53 42,000 39,300 41,800 39,200 42.1 29.9 1,760,000 1,171,000Morgan 71 * 2,700 * 2,590 * 42.5 * 110,000Morrow 33 64,900 64,700 64,800 64,600 45.5 48.5 2,950,000 3,130,000Muskingum 61 11,600 14,000 11,500 13,500 48.4 49.2 557,000 664,000

2012 Ohio Department of Agriculture Annual Report and Sta s cs 43
TABLE 9 Ohio County Estimates, 2011-2012Soybeans for Grain: Acres, Yield and Production Ranking by Acreage Planted Acreage Harvested Yield Production County Production 2011 2012 2011 2012 2011 2012 2011 2012 Acres Acres Bu per acre Bushels
Acres Acres District Planted Harvested Yield Produc on Bushels 10 1,137,000 1,133,000 47.9 54,315,000 20 738,000 734,000 44.9 32,941,000 30 224,500 223,000 46.2 10,305,000 40 829,000 827,000 46.4 38,413,000 50 931,000 929,000 42.5 39,450,000 60 56,600 55,700 38.6 2,149,000 70 393,000 391,000 40.2 15,731,000 80 237,000 236,000 44.6 10,521,000 90 53,900 51,300 44.3 2,275,000
Noble * * * * * * * * *O awa 30 53,300 60,100 52,800 59,900 46.4 53.0 2,448,000 3,172,000Paulding 14 110,000 112,500 109,800 111,700 42.5 40.7 4,662,000 4,543,000Perry 60 13,900 16,400 13,800 16,000 50.7 42.0 700,000 672,000Pickaway 25 109,500 106,000 109,400 105,800 49.9 37.1 5,463,000 3,924,000Pike * 12,400 * 12,400 * 47.3 * 586,000 *Portage 57 15,900 19,500 15,800 19,300 47.5 46.9 750,000 906,000Preble 34 84,000 81,700 83,900 81,400 41.8 37.7 3,507,000 3,071,000Putnam 4 131,500 134,000 131,300 133,100 50.8 48.6 6,676,000 6,465,000Richland 43 43,500 39,600 43,400 39,500 45.4 43.9 1,971,000 1,735,000Ross 41 57,000 55,800 56,900 55,500 51.3 39.6 2,917,000 2,196,000Sandusky 11 84,700 89,600 84,500 89,500 48.9 51.9 4,130,000 4,642,000Scioto 63 14,100 15,000 14,000 14,900 40.9 34.3 572,000 511,000Seneca 9 123,000 131,000 122,800 130,900 49.6 38.3 6,085,000 5,007,000Shelby 18 91,100 89,200 91,000 89,100 46.7 49.5 4,247,000 4,414,000Stark 51 27,800 28,500 27,700 28,100 47.7 44.6 1,321,000 1,253,000Summit 75 1,300 1,800 1,270 1,780 43.2 43.1 54,900 76,800Trumbull 50 25,800 27,300 25,800 27,100 44.8 51.8 1,157,000 1,405,000Tuscarawas 62 12,100 14,000 12,000 13,900 49.1 43.0 589,000 598,000Union 13 105,000 103,000 104,900 102,900 48.1 44.4 5,049,000 4,570,000Van Wert 3 120,000 118,500 119,800 118,300 47.3 55.3 5,669,000 6,538,000Vinton * * * * * * * * *Warren 49 38,000 36,700 37,900 36,500 43.3 40.9 1,642,000 1,494,000Washington 65 5,900 8,000 5,890 7,520 50.3 46.8 296,000 352,000Wayne 42 42,400 43,000 42,300 43,000 49.3 46.1 2,087,000 1,982,000Williams 32 73,600 79,200 73,500 79,000 45.9 39.9 3,371,000 3,149,000Wood 1 136,500 150,500 136,300 150,300 52.6 53.6 7,173,000 8,063,000Wyandot 20 99,700 99,700 99,500 99,600 50.5 43.5 5,020,000 4,328,000 State 4,550,000 4,600,000 4,540,000 4,580,000 48.0 45.0 217,920,000 206,100,000
District Estimates 2012
* Coun es with less than 500 acres are not published. Coun es with more than 500 acres are also not published, if necessary, to preserve the confi den ality of coun es with less than 500 acres.
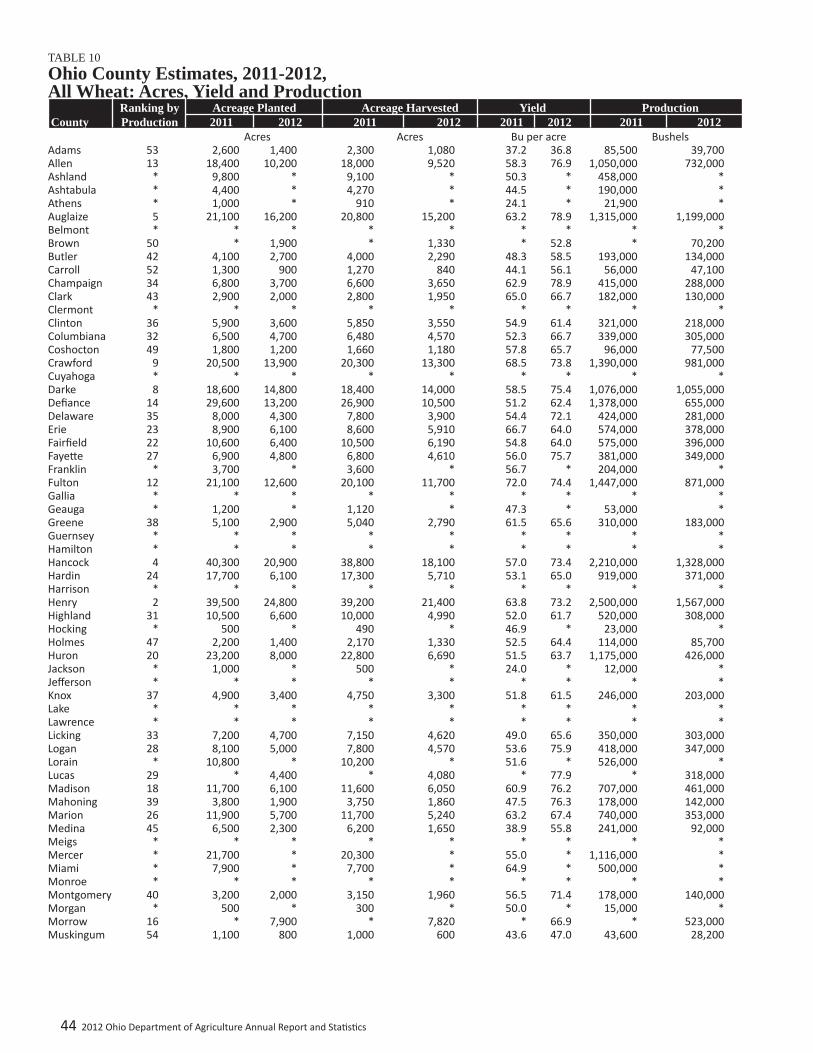
44 2012 Ohio Department of Agriculture Annual Report and Sta s cs
TABLE 10Ohio County Estimates, 2011-2012,All Wheat: Acres, Yield and Production Ranking by Acreage Planted Acreage Harvested Yield Production County Production 2011 2012 2011 2012 2011 2012 2011 2012 Acres Acres Bu per acre BushelsAdams 53 2,600 1,400 2,300 1,080 37.2 36.8 85,500 39,700Allen 13 18,400 10,200 18,000 9,520 58.3 76.9 1,050,000 732,000Ashland * 9,800 * 9,100 * 50.3 * 458,000 *Ashtabula * 4,400 * 4,270 * 44.5 * 190,000 *Athens * 1,000 * 910 * 24.1 * 21,900 *Auglaize 5 21,100 16,200 20,800 15,200 63.2 78.9 1,315,000 1,199,000Belmont * * * * * * * * *Brown 50 * 1,900 * 1,330 * 52.8 * 70,200Butler 42 4,100 2,700 4,000 2,290 48.3 58.5 193,000 134,000Carroll 52 1,300 900 1,270 840 44.1 56.1 56,000 47,100Champaign 34 6,800 3,700 6,600 3,650 62.9 78.9 415,000 288,000Clark 43 2,900 2,000 2,800 1,950 65.0 66.7 182,000 130,000Clermont * * * * * * * * *Clinton 36 5,900 3,600 5,850 3,550 54.9 61.4 321,000 218,000Columbiana 32 6,500 4,700 6,480 4,570 52.3 66.7 339,000 305,000Coshocton 49 1,800 1,200 1,660 1,180 57.8 65.7 96,000 77,500Crawford 9 20,500 13,900 20,300 13,300 68.5 73.8 1,390,000 981,000Cuyahoga * * * * * * * * *Darke 8 18,600 14,800 18,400 14,000 58.5 75.4 1,076,000 1,055,000Defi ance 14 29,600 13,200 26,900 10,500 51.2 62.4 1,378,000 655,000Delaware 35 8,000 4,300 7,800 3,900 54.4 72.1 424,000 281,000Erie 23 8,900 6,100 8,600 5,910 66.7 64.0 574,000 378,000Fairfi eld 22 10,600 6,400 10,500 6,190 54.8 64.0 575,000 396,000Faye e 27 6,900 4,800 6,800 4,610 56.0 75.7 381,000 349,000Franklin * 3,700 * 3,600 * 56.7 * 204,000 *Fulton 12 21,100 12,600 20,100 11,700 72.0 74.4 1,447,000 871,000Gallia * * * * * * * * *Geauga * 1,200 * 1,120 * 47.3 * 53,000 *Greene 38 5,100 2,900 5,040 2,790 61.5 65.6 310,000 183,000Guernsey * * * * * * * * *Hamilton * * * * * * * * *Hancock 4 40,300 20,900 38,800 18,100 57.0 73.4 2,210,000 1,328,000Hardin 24 17,700 6,100 17,300 5,710 53.1 65.0 919,000 371,000Harrison * * * * * * * * *Henry 2 39,500 24,800 39,200 21,400 63.8 73.2 2,500,000 1,567,000Highland 31 10,500 6,600 10,000 4,990 52.0 61.7 520,000 308,000Hocking * 500 * 490 * 46.9 * 23,000 *Holmes 47 2,200 1,400 2,170 1,330 52.5 64.4 114,000 85,700Huron 20 23,200 8,000 22,800 6,690 51.5 63.7 1,175,000 426,000Jackson * 1,000 * 500 * 24.0 * 12,000 *Jeff erson * * * * * * * * *Knox 37 4,900 3,400 4,750 3,300 51.8 61.5 246,000 203,000Lake * * * * * * * * *Lawrence * * * * * * * * *Licking 33 7,200 4,700 7,150 4,620 49.0 65.6 350,000 303,000Logan 28 8,100 5,000 7,800 4,570 53.6 75.9 418,000 347,000Lorain * 10,800 * 10,200 * 51.6 * 526,000 *Lucas 29 * 4,400 * 4,080 * 77.9 * 318,000Madison 18 11,700 6,100 11,600 6,050 60.9 76.2 707,000 461,000Mahoning 39 3,800 1,900 3,750 1,860 47.5 76.3 178,000 142,000Marion 26 11,900 5,700 11,700 5,240 63.2 67.4 740,000 353,000Medina 45 6,500 2,300 6,200 1,650 38.9 55.8 241,000 92,000Meigs * * * * * * * * *Mercer * 21,700 * 20,300 * 55.0 * 1,116,000 *Miami * 7,900 * 7,700 * 64.9 * 500,000 *Monroe * * * * * * * * *Montgomery 40 3,200 2,000 3,150 1,960 56.5 71.4 178,000 140,000Morgan * 500 * 300 * 50.0 * 15,000 *Morrow 16 * 7,900 * 7,820 * 66.9 * 523,000Muskingum 54 1,100 800 1,000 600 43.6 47.0 43,600 28,200
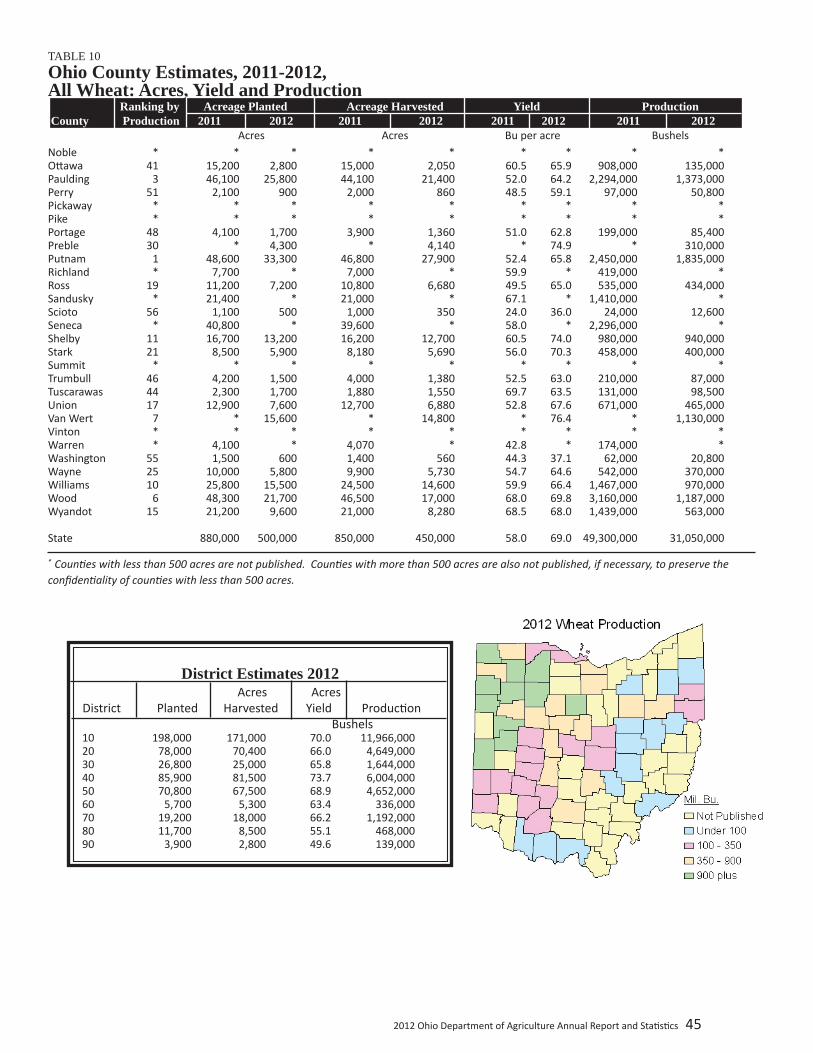
2012 Ohio Department of Agriculture Annual Report and Sta s cs 45
Noble * * * * * * * * *O awa 41 15,200 2,800 15,000 2,050 60.5 65.9 908,000 135,000Paulding 3 46,100 25,800 44,100 21,400 52.0 64.2 2,294,000 1,373,000Perry 51 2,100 900 2,000 860 48.5 59.1 97,000 50,800Pickaway * * * * * * * * *Pike * * * * * * * * *Portage 48 4,100 1,700 3,900 1,360 51.0 62.8 199,000 85,400Preble 30 * 4,300 * 4,140 * 74.9 * 310,000Putnam 1 48,600 33,300 46,800 27,900 52.4 65.8 2,450,000 1,835,000Richland * 7,700 * 7,000 * 59.9 * 419,000 *Ross 19 11,200 7,200 10,800 6,680 49.5 65.0 535,000 434,000Sandusky * 21,400 * 21,000 * 67.1 * 1,410,000 *Scioto 56 1,100 500 1,000 350 24.0 36.0 24,000 12,600Seneca * 40,800 * 39,600 * 58.0 * 2,296,000 *Shelby 11 16,700 13,200 16,200 12,700 60.5 74.0 980,000 940,000Stark 21 8,500 5,900 8,180 5,690 56.0 70.3 458,000 400,000Summit * * * * * * * * *Trumbull 46 4,200 1,500 4,000 1,380 52.5 63.0 210,000 87,000Tuscarawas 44 2,300 1,700 1,880 1,550 69.7 63.5 131,000 98,500Union 17 12,900 7,600 12,700 6,880 52.8 67.6 671,000 465,000Van Wert 7 * 15,600 * 14,800 * 76.4 * 1,130,000Vinton * * * * * * * * *Warren * 4,100 * 4,070 * 42.8 * 174,000 *Washington 55 1,500 600 1,400 560 44.3 37.1 62,000 20,800Wayne 25 10,000 5,800 9,900 5,730 54.7 64.6 542,000 370,000Williams 10 25,800 15,500 24,500 14,600 59.9 66.4 1,467,000 970,000Wood 6 48,300 21,700 46,500 17,000 68.0 69.8 3,160,000 1,187,000Wyandot 15 21,200 9,600 21,000 8,280 68.5 68.0 1,439,000 563,000 State 880,000 500,000 850,000 450,000 58.0 69.0 49,300,000 31,050,000
TABLE 10Ohio County Estimates, 2011-2012,All Wheat: Acres, Yield and Production Ranking by Acreage Planted Acreage Harvested Yield Production County Production 2011 2012 2011 2012 2011 2012 2011 2012 Acres Acres Bu per acre Bushels
* Coun es with less than 500 acres are not published. Coun es with more than 500 acres are also not published, if necessary, to preserve the confi den ality of coun es with less than 500 acres.
District Estimates 2012 Acres Acres District Planted Harvested Yield Produc on Bushels 10 198,000 171,000 70.0 11,966,000 20 78,000 70,400 66.0 4,649,000 30 26,800 25,000 65.8 1,644,000 40 85,900 81,500 73.7 6,004,000 50 70,800 67,500 68.9 4,652,000 60 5,700 5,300 63.4 336,000 70 19,200 18,000 66.2 1,192,000 80 11,700 8,500 55.1 468,000 90 3,900 2,800 49.6 139,000
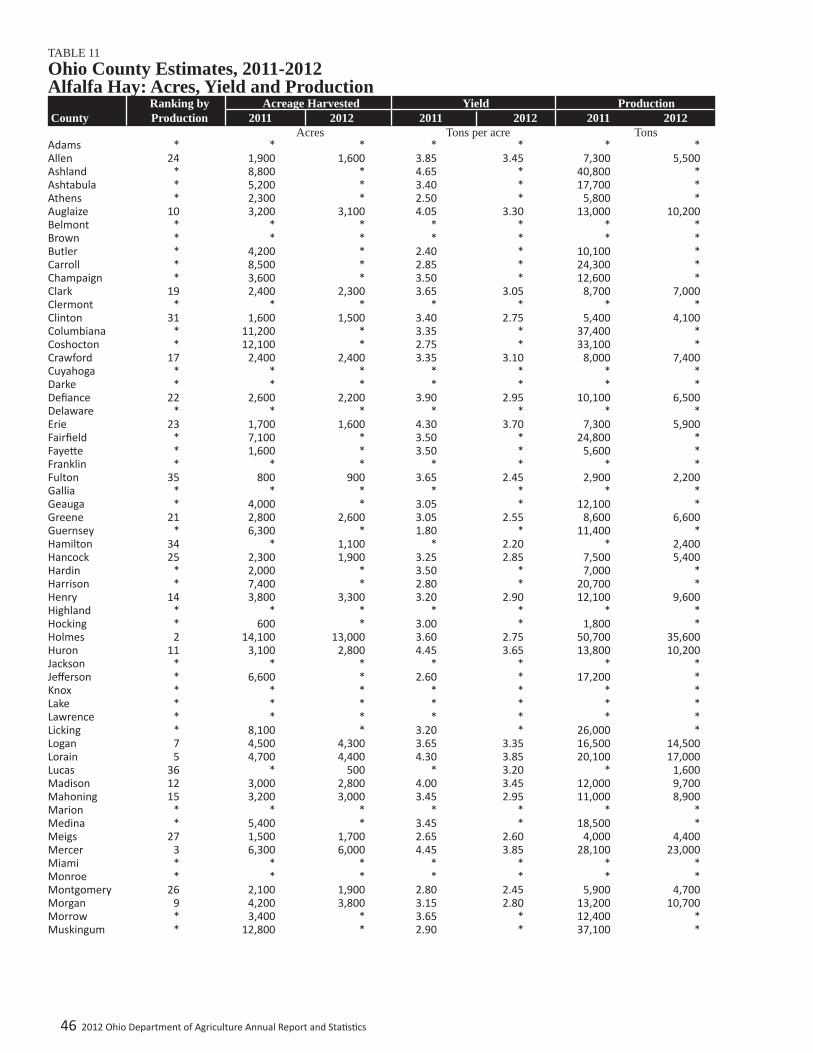
46 2012 Ohio Department of Agriculture Annual Report and Sta s cs
Adams * * * * * * *Allen 24 1,900 1,600 3.85 3.45 7,300 5,500Ashland * 8,800 * 4.65 * 40,800 *Ashtabula * 5,200 * 3.40 * 17,700 *Athens * 2,300 * 2.50 * 5,800 *Auglaize 10 3,200 3,100 4.05 3.30 13,000 10,200Belmont * * * * * * *Brown * * * * * * *Butler * 4,200 * 2.40 * 10,100 *Carroll * 8,500 * 2.85 * 24,300 *Champaign * 3,600 * 3.50 * 12,600 *Clark 19 2,400 2,300 3.65 3.05 8,700 7,000Clermont * * * * * * *Clinton 31 1,600 1,500 3.40 2.75 5,400 4,100Columbiana * 11,200 * 3.35 * 37,400 *Coshocton * 12,100 * 2.75 * 33,100 *Crawford 17 2,400 2,400 3.35 3.10 8,000 7,400Cuyahoga * * * * * * *Darke * * * * * * *Defi ance 22 2,600 2,200 3.90 2.95 10,100 6,500Delaware * * * * * * *Erie 23 1,700 1,600 4.30 3.70 7,300 5,900Fairfi eld * 7,100 * 3.50 * 24,800 *Faye e * 1,600 * 3.50 * 5,600 *Franklin * * * * * * *Fulton 35 800 900 3.65 2.45 2,900 2,200Gallia * * * * * * *Geauga * 4,000 * 3.05 * 12,100 *Greene 21 2,800 2,600 3.05 2.55 8,600 6,600Guernsey * 6,300 * 1.80 * 11,400 *Hamilton 34 * 1,100 * 2.20 * 2,400Hancock 25 2,300 1,900 3.25 2.85 7,500 5,400Hardin * 2,000 * 3.50 * 7,000 *Harrison * 7,400 * 2.80 * 20,700 *Henry 14 3,800 3,300 3.20 2.90 12,100 9,600Highland * * * * * * *Hocking * 600 * 3.00 * 1,800 *Holmes 2 14,100 13,000 3.60 2.75 50,700 35,600Huron 11 3,100 2,800 4.45 3.65 13,800 10,200Jackson * * * * * * *Jeff erson * 6,600 * 2.60 * 17,200 *Knox * * * * * * *Lake * * * * * * *Lawrence * * * * * * *Licking * 8,100 * 3.20 * 26,000 *Logan 7 4,500 4,300 3.65 3.35 16,500 14,500Lorain 5 4,700 4,400 4.30 3.85 20,100 17,000Lucas 36 * 500 * 3.20 * 1,600Madison 12 3,000 2,800 4.00 3.45 12,000 9,700Mahoning 15 3,200 3,000 3.45 2.95 11,000 8,900Marion * * * * * * *Medina * 5,400 * 3.45 * 18,500 *Meigs 27 1,500 1,700 2.65 2.60 4,000 4,400Mercer 3 6,300 6,000 4.45 3.85 28,100 23,000Miami * * * * * * *Monroe * * * * * * *Montgomery 26 2,100 1,900 2.80 2.45 5,900 4,700Morgan 9 4,200 3,800 3.15 2.80 13,200 10,700Morrow * 3,400 * 3.65 * 12,400 *Muskingum * 12,800 * 2.90 * 37,100 *
TABLE 11Ohio County Estimates, 2011-2012Alfalfa Hay: Acres, Yield and Production Ranking by Acreage Harvested Yield Production County Production 2011 2012 2011 2012 2011 2012 Acres Tons per acre Tons
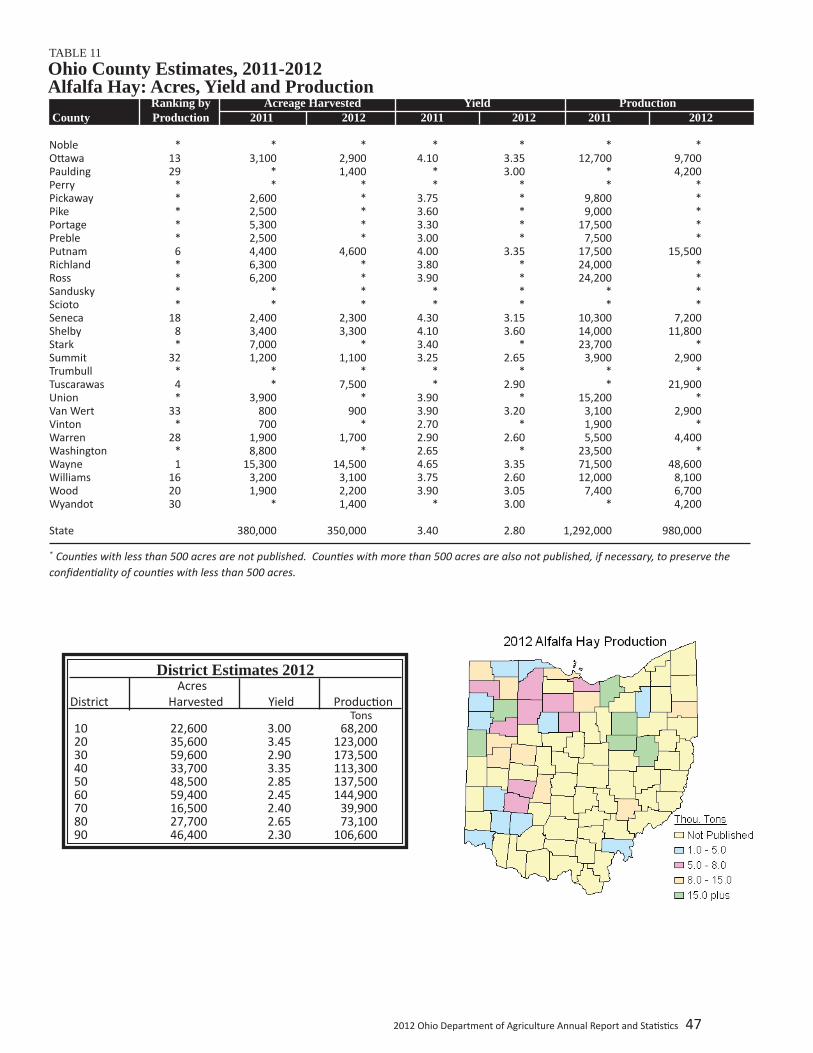
2012 Ohio Department of Agriculture Annual Report and Sta s cs 47
District Estimates 2012 Acres District Harvested Yield Produc on Tons 10 22,600 3.00 68,200 20 35,600 3.45 123,000 30 59,600 2.90 173,500 40 33,700 3.35 113,300 50 48,500 2.85 137,500 60 59,400 2.45 144,900 70 16,500 2.40 39,900 80 27,700 2.65 73,100 90 46,400 2.30 106,600
Noble * * * * * * *O awa 13 3,100 2,900 4.10 3.35 12,700 9,700Paulding 29 * 1,400 * 3.00 * 4,200Perry * * * * * * *Pickaway * 2,600 * 3.75 * 9,800 *Pike * 2,500 * 3.60 * 9,000 *Portage * 5,300 * 3.30 * 17,500 *Preble * 2,500 * 3.00 * 7,500 *Putnam 6 4,400 4,600 4.00 3.35 17,500 15,500Richland * 6,300 * 3.80 * 24,000 *Ross * 6,200 * 3.90 * 24,200 *Sandusky * * * * * * *Scioto * * * * * * *Seneca 18 2,400 2,300 4.30 3.15 10,300 7,200Shelby 8 3,400 3,300 4.10 3.60 14,000 11,800Stark * 7,000 * 3.40 * 23,700 *Summit 32 1,200 1,100 3.25 2.65 3,900 2,900Trumbull * * * * * * *Tuscarawas 4 * 7,500 * 2.90 * 21,900Union * 3,900 * 3.90 * 15,200 *Van Wert 33 800 900 3.90 3.20 3,100 2,900Vinton * 700 * 2.70 * 1,900 *Warren 28 1,900 1,700 2.90 2.60 5,500 4,400Washington * 8,800 * 2.65 * 23,500 *Wayne 1 15,300 14,500 4.65 3.35 71,500 48,600Williams 16 3,200 3,100 3.75 2.60 12,000 8,100Wood 20 1,900 2,200 3.90 3.05 7,400 6,700Wyandot 30 * 1,400 * 3.00 * 4,200 State 380,000 350,000 3.40 2.80 1,292,000 980,000
TABLE 11Ohio County Estimates, 2011-2012Alfalfa Hay: Acres, Yield and Production Ranking by Acreage Harvested Yield Production County Production20122 2010 2009 Ranking by Acreage Harvested Yield Production County Production 2011 2012 2011 2012 2011 2012
* Coun es with less than 500 acres are not published. Coun es with more than 500 acres are also not published, if necessary, to preserve the confi den ality of coun es with less than 500 acres.
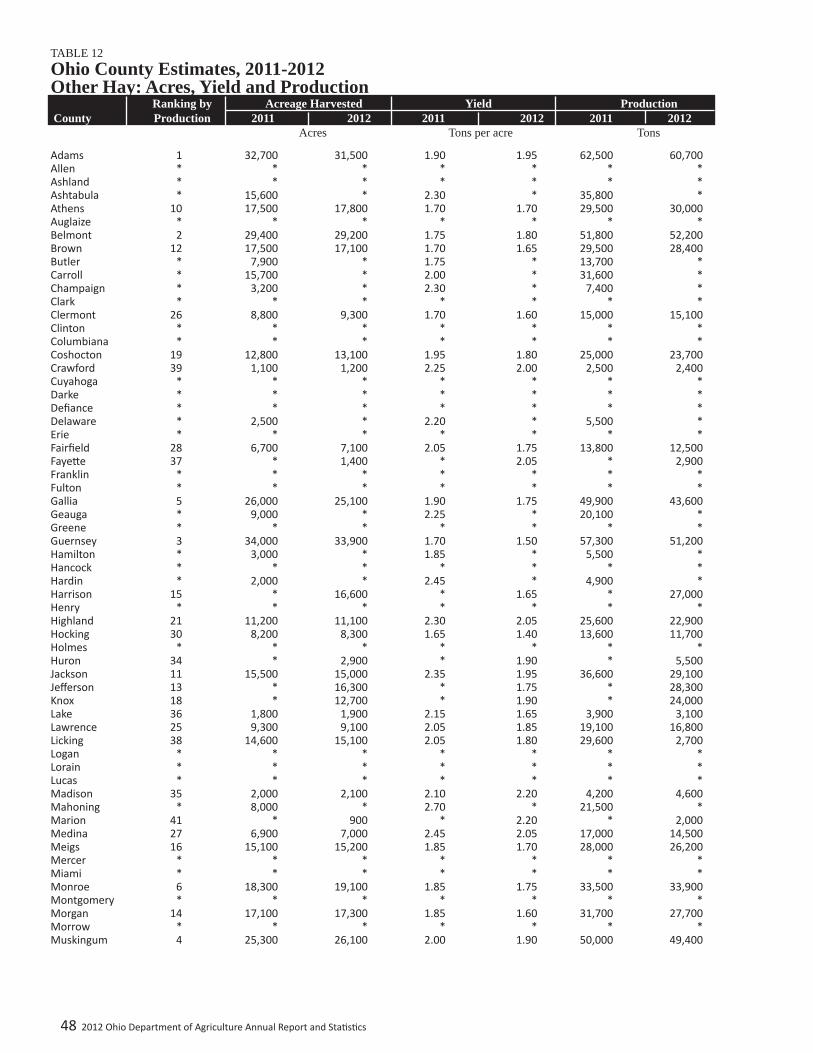
48 2012 Ohio Department of Agriculture Annual Report and Sta s cs
TABLE 12Ohio County Estimates, 2011-2012Other Hay: Acres, Yield and Production Ranking by Acreage Harvested Yield Production County Production 2011 2012 2011 2012 2011 2012 Acres Tons per acre Tons Adams 1 32,700 31,500 1.90 1.95 62,500 60,700Allen * * * * * * *Ashland * * * * * * *Ashtabula * 15,600 * 2.30 * 35,800 *Athens 10 17,500 17,800 1.70 1.70 29,500 30,000Auglaize * * * * * * *Belmont 2 29,400 29,200 1.75 1.80 51,800 52,200Brown 12 17,500 17,100 1.70 1.65 29,500 28,400Butler * 7,900 * 1.75 * 13,700 *Carroll * 15,700 * 2.00 * 31,600 *Champaign * 3,200 * 2.30 * 7,400 *Clark * * * * * * *Clermont 26 8,800 9,300 1.70 1.60 15,000 15,100Clinton * * * * * * *Columbiana * * * * * * *Coshocton 19 12,800 13,100 1.95 1.80 25,000 23,700Crawford 39 1,100 1,200 2.25 2.00 2,500 2,400Cuyahoga * * * * * * *Darke * * * * * * *Defi ance * * * * * * *Delaware * 2,500 * 2.20 * 5,500 *Erie * * * * * * *Fairfi eld 28 6,700 7,100 2.05 1.75 13,800 12,500Faye e 37 * 1,400 * 2.05 * 2,900Franklin * * * * * * *Fulton * * * * * * *Gallia 5 26,000 25,100 1.90 1.75 49,900 43,600Geauga * 9,000 * 2.25 * 20,100 *Greene * * * * * * *Guernsey 3 34,000 33,900 1.70 1.50 57,300 51,200Hamilton * 3,000 * 1.85 * 5,500 *Hancock * * * * * * *Hardin * 2,000 * 2.45 * 4,900 *Harrison 15 * 16,600 * 1.65 * 27,000Henry * * * * * * *Highland 21 11,200 11,100 2.30 2.05 25,600 22,900Hocking 30 8,200 8,300 1.65 1.40 13,600 11,700Holmes * * * * * * *Huron 34 * 2,900 * 1.90 * 5,500Jackson 11 15,500 15,000 2.35 1.95 36,600 29,100Jeff erson 13 * 16,300 * 1.75 * 28,300Knox 18 * 12,700 * 1.90 * 24,000Lake 36 1,800 1,900 2.15 1.65 3,900 3,100Lawrence 25 9,300 9,100 2.05 1.85 19,100 16,800Licking 38 14,600 15,100 2.05 1.80 29,600 2,700Logan * * * * * * *Lorain * * * * * * *Lucas * * * * * * *Madison 35 2,000 2,100 2.10 2.20 4,200 4,600Mahoning * 8,000 * 2.70 * 21,500 *Marion 41 * 900 * 2.20 * 2,000Medina 27 6,900 7,000 2.45 2.05 17,000 14,500Meigs 16 15,100 15,200 1.85 1.70 28,000 26,200Mercer * * * * * * *Miami * * * * * * *Monroe 6 18,300 19,100 1.85 1.75 33,500 33,900Montgomery * * * * * * *Morgan 14 17,100 17,300 1.85 1.60 31,700 27,700Morrow * * * * * * *Muskingum 4 25,300 26,100 2.00 1.90 50,000 49,400
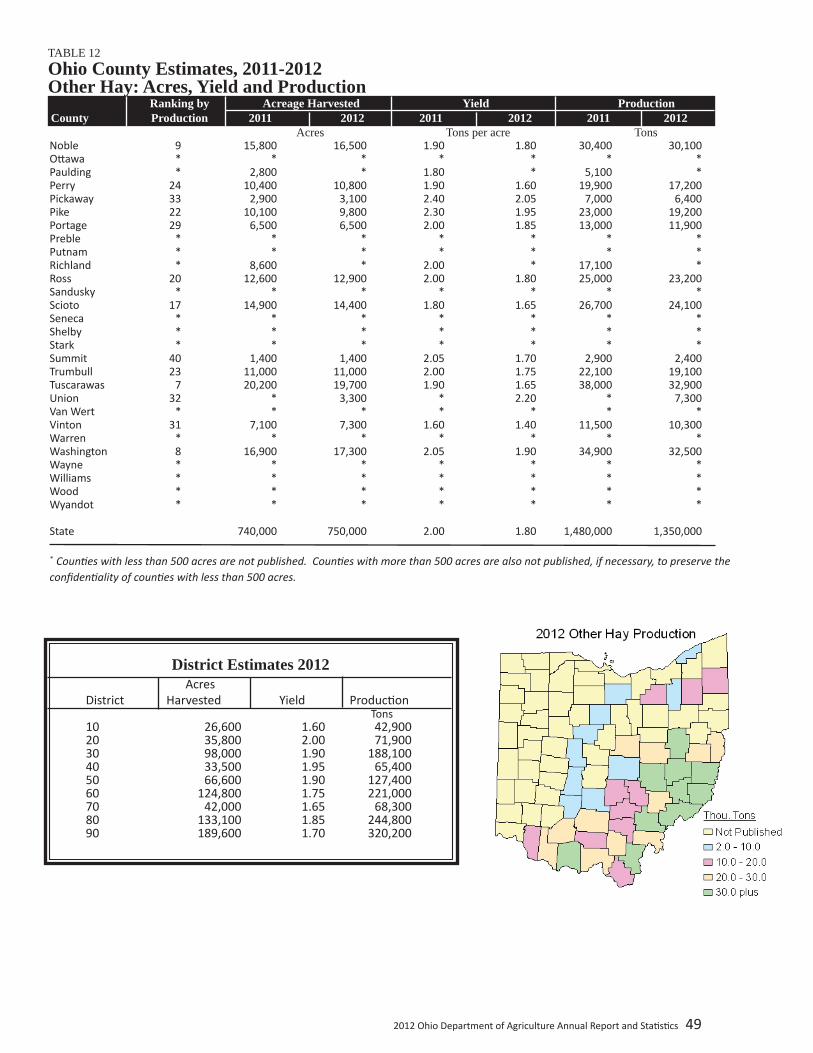
2012 Ohio Department of Agriculture Annual Report and Sta s cs 49
TABLE 12Ohio County Estimates, 2011-2012Other Hay: Acres, Yield and Production Ranking by Acreage Harvested Yield Production County Production 2011 2012 2011 2012 2011 2012 Acres Tons per acre TonsNoble 9 15,800 16,500 1.90 1.80 30,400 30,100O awa * * * * * * *Paulding * 2,800 * 1.80 * 5,100 *Perry 24 10,400 10,800 1.90 1.60 19,900 17,200Pickaway 33 2,900 3,100 2.40 2.05 7,000 6,400Pike 22 10,100 9,800 2.30 1.95 23,000 19,200Portage 29 6,500 6,500 2.00 1.85 13,000 11,900Preble * * * * * * *Putnam * * * * * * *Richland * 8,600 * 2.00 * 17,100 *Ross 20 12,600 12,900 2.00 1.80 25,000 23,200Sandusky * * * * * * *Scioto 17 14,900 14,400 1.80 1.65 26,700 24,100Seneca * * * * * * *Shelby * * * * * * *Stark * * * * * * *Summit 40 1,400 1,400 2.05 1.70 2,900 2,400Trumbull 23 11,000 11,000 2.00 1.75 22,100 19,100Tuscarawas 7 20,200 19,700 1.90 1.65 38,000 32,900Union 32 * 3,300 * 2.20 * 7,300Van Wert * * * * * * *Vinton 31 7,100 7,300 1.60 1.40 11,500 10,300Warren * * * * * * *Washington 8 16,900 17,300 2.05 1.90 34,900 32,500Wayne * * * * * * *Williams * * * * * * *Wood * * * * * * *Wyandot * * * * * * * State 740,000 750,000 2.00 1.80 1,480,000 1,350,000
* Coun es with less than 500 acres are not published. Coun es with more than 500 acres are also not published, if necessary, to preserve the confi den ality of coun es with less than 500 acres.
Acres District Harvested Yield Produc on Tons10 26,600 1.60 42,90020 35,800 2.00 71,90030 98,000 1.90 188,10040 33,500 1.95 65,40050 66,600 1.90 127,40060 124,800 1.75 221,00070 42,000 1.65 68,30080 133,100 1.85 244,80090 189,600 1.70 320,200
District Estimates 2012

50 2012 Ohio Department of Agriculture Annual Report and Sta s cs
Ranking by Non-irrigated Cropland Ranking by Pasture 2012 2012 County Cropland 2011 2012 Pasture 2011 2012
Adams 60 $56.50 $65.00 * $24.50 *Allen 14 $118.00 $143.00 * * *Ashland 52 $80.00 $84.00 5 * $32.00Ashtabula 72 $38.00 $41.00 19 * $20.50Athens * * * 23 $19.00 $15.00Auglaize 6 $133.00 $161.00 * * *Belmont 76 * $37.00 22 $20.00 $16.50Brown 48 $78.50 $90.00 * $32.00 *Butler 32 $112.00 $121.00 * * *Carroll 66 $34.50 $52.50 * $21.00 *Champaign 7 $144.00 $160.00 * * *Clark 13 $142.00 $144.00 * * *Clermont * * * * * *Clinton 23 $113.00 $133.00 * * *Columbiana 65 $47.00 $54.50 * $23.50 *Coshocton 56 $75.00 $74.50 12 $30.50 $25.00Crawford 21 $129.00 $135.00 * * *Cuyahoga * * * * * *Darke 1 $159.00 $177.00 * * *Defi ance 35 $113.00 $117.00 * * *Delaware 44 $101.00 $100.00 * * *Erie 38 $99.00 $111.00 * * *Fairfi eld 31 $102.00 $123.00 * $41.00 *Faye e 11 $126.00 $146.00 2 * $38.50Franklin 36 $95.50 $115.00 * * *Fulton 9 $125.00 $148.00 * * *Gallia * $58.00 * 11 $26.50 $26.50Geauga 73 $40.00 $39.50 * * *Greene 9 $128.00 $148.00 * * *Guernsey 73 $32.00 $39.50 13 $22.50 $24.00Hamilton * * * * * *Hancock 22 $112.00 $134.00 * * *Hardin 20 $125.00 $137.00 * * *Harrison * $32.00 * 16 $27.50 $22.50Henry 14 $138.00 $143.00 * * *Highland 43 $91.50 $103.00 3 $40.00 $34.00Hocking 49 $62.00 $89.00 * * *Holmes 47 $74.00 $92.50 1 $47.50 $48.00Huron 33 $104.00 $120.00 * * *Jackson * $39.00 * 13 * $24.00Jeff erson * * * * $22.00 *Knox 54 $70.00 $79.50 9 $35.50 $30.00Lake * * * * * *Lawrence 75 $40.00 $37.50 24 $16.50 $14.00Licking 40 $94.00 $109.00 5 $31.00 $32.00Logan 26 $113.00 $131.00 * * *Lorain 55 $78.00 $79.00 * * *Lucas 29 $110.00 $124.00 * * *Madison 8 $134.00 $150.00 * * *Mahoning 68 $40.50 $50.00 * $24.50 *Marion 12 $125.00 $145.00 * * *Medina 62 $61.00 $60.50 * * *Meigs 57 * $71.00 15 $23.00 $23.00Mercer 2 $147.00 $171.00 * * *Miami 4 $141.00 $163.00 * * *Monroe 77 $25.00 $24.50 26 $18.50 $13.00Montgomery 27 $110.00 $129.00 * * *
TABLE 13Ohio County Estimates, 2011-2012Cash Rents: Non-Irrigated Cropland and Pasture
Dollars per acre Dollars per acre

2012 Ohio Department of Agriculture Annual Report and Sta s cs 51
TABLE 13Ohio County Estimates, 2010-2011Cash Rents: Non-Irrigated Cropland and Pasture Ranking by Non-irrigated Cropland Ranking by Pasture 2011 2011 County Cropland 2010 2011 Pasture 2010 2011
Dollars per acre Dollars per acreMorgan 70 $43.00 $49.50 21 $24.50 $18.50Morrow 41 $90.50 $108.00 * * *Muskingum 58 $56.50 $68.00 18 $22.50 $21.00Noble * $23.50 * 24 $18.00 $14.00O awa 42 $103.00 $104.00 * * *Paulding 28 $116.00 $127.00 * * *Perry 53 $70.00 $83.00 7 $28.50 $31.50Pickaway 17 $120.00 $140.00 * * *Pike 50 $74.50 $86.00 * * *Portage 64 $45.00 $56.50 * * *Preble 17 $128.00 $140.00 * * *Putnam 25 $117.00 $132.00 * * *Richland 45 $80.00 $98.00 * * *Ross 38 $101.00 $111.00 17 $20.50 $22.00Sandusky 23 $120.00 $133.00 * * *Scioto 68 $50.50 $50.00 8 $34.00 $31.00Seneca 29 $107.00 $124.00 * $35.50 *Shelby 5 $137.00 $162.00 * * *Stark 59 $61.00 $65.50 * $43.50 *Summit * * * * * *Trumbull 71 $41.50 $41.50 * $25.50 *Tuscarawas 61 $59.50 $62.50 3 $38.00 $34.00Union 34 $102.00 $119.00 * * *Van Wert 3 $146.00 $166.00 * * *Vinton 66 $53.00 $52.50 10 * $29.50Warren 46 $92.50 $97.50 * * *Washington 63 $40.50 $59.00 19 $23.00 $20.50Wayne 51 $81.50 $85.00 * * *Williams 36 $116.00 $115.00 * * *Wood 17 $125.00 $140.00 * * *Wyandot 16 $122.00 $142.00 * * * State $110.00 $122.00 $35.00 $30.00
* Data not disclosed to preserve confi den ality.
Non-irrigated Cropland Pasture District 2011 2012 2011 2012 Dollars per acre
10 $123.00 $137.00 * *20 $107.00 $119.00 $39.50 $36.5030 $56.00 $60.50 $31.50 $39.0040 $139.00 $158.00 $42.00 $45.5050 $109.00 $125.00 $33.00 $33.0060 $55.50 $69.50 $25.00 $24.5070 $112.00 $128.00 * *80 $77.50 $86.50 $28.50 $26.5090 $51.50 $62.00 $22.00 $19.00
District Estimates 2011-2012
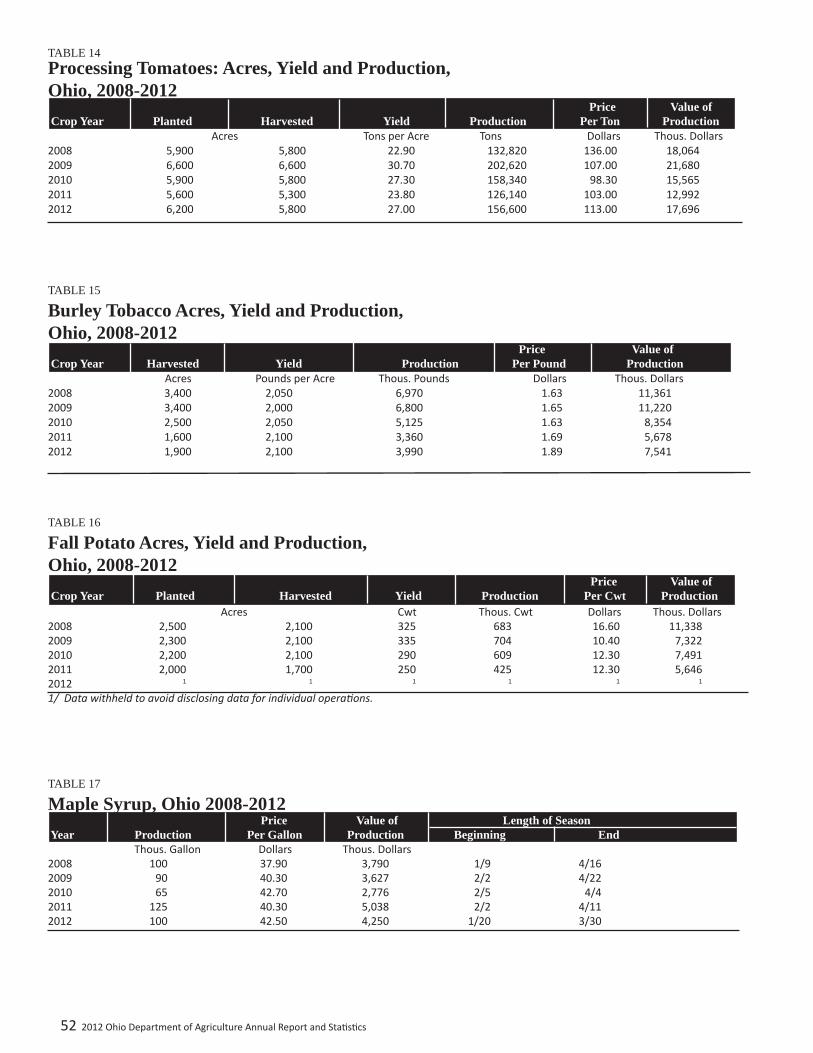
52 2012 Ohio Department of Agriculture Annual Report and Sta s cs
TABLE 14Processing Tomatoes: Acres, Yield and Production, Ohio, 2008-2012 Price Value of Crop Year Planted Harvested Yield Production Per Ton Production Acres Tons per Acre Tons Dollars Thous. Dollars2008 5,900 5,800 22.90 132,820 136.00 18,0642009 6,600 6,600 30.70 202,620 107.00 21,6802010 5,900 5,800 27.30 158,340 98.30 15,5652011 5,600 5,300 23.80 126,140 103.00 12,9922012 6,200 5,800 27.00 156,600 113.00 17,696
TABLE 15
Burley Tobacco Acres, Yield and Production,Ohio, 2008-2012 Price Value of Crop Year Harvested Yield Production Per Pound Production Acres Pounds per Acre Thous. Pounds Dollars Thous. Dollars 2008 3,400 2,050 6,970 1.63 11,3612009 3,400 2,000 6,800 1.65 11,2202010 2,500 2,050 5,125 1.63 8,3542011 1,600 2,100 3,360 1.69 5,6782012 1,900 2,100 3,990 1.89 7,541
TABLE 16
Fall Potato Acres, Yield and Production,Ohio, 2008-2012 Price Value of Crop Year Planted Harvested Yield Production Per Cwt Production Acres Cwt Thous. Cwt Dollars Thous. Dollars2008 2,500 2,100 325 683 16.60 11,3382009 2,300 2,100 335 704 10.40 7,3222010 2,200 2,100 290 609 12.30 7,4912011 2,000 1,700 250 425 12.30 5,6462012 1 1 1 1 1 1
1/ Data withheld to avoid disclosing data for individual opera ons.
TABLE 17
Maple Syrup, Ohio 2008-2012 Price Value of Length of Season Year Production Per Gallon Production Beginning End Thous. Gallon Dollars Thous. Dollars 2008 100 37.90 3,790 1/9 4/162009 90 40.30 3,627 2/2 4/222010 65 42.70 2,776 2/5 4/42011 125 40.30 5,038 2/2 4/112012 100 42.50 4,250 1/20 3/30
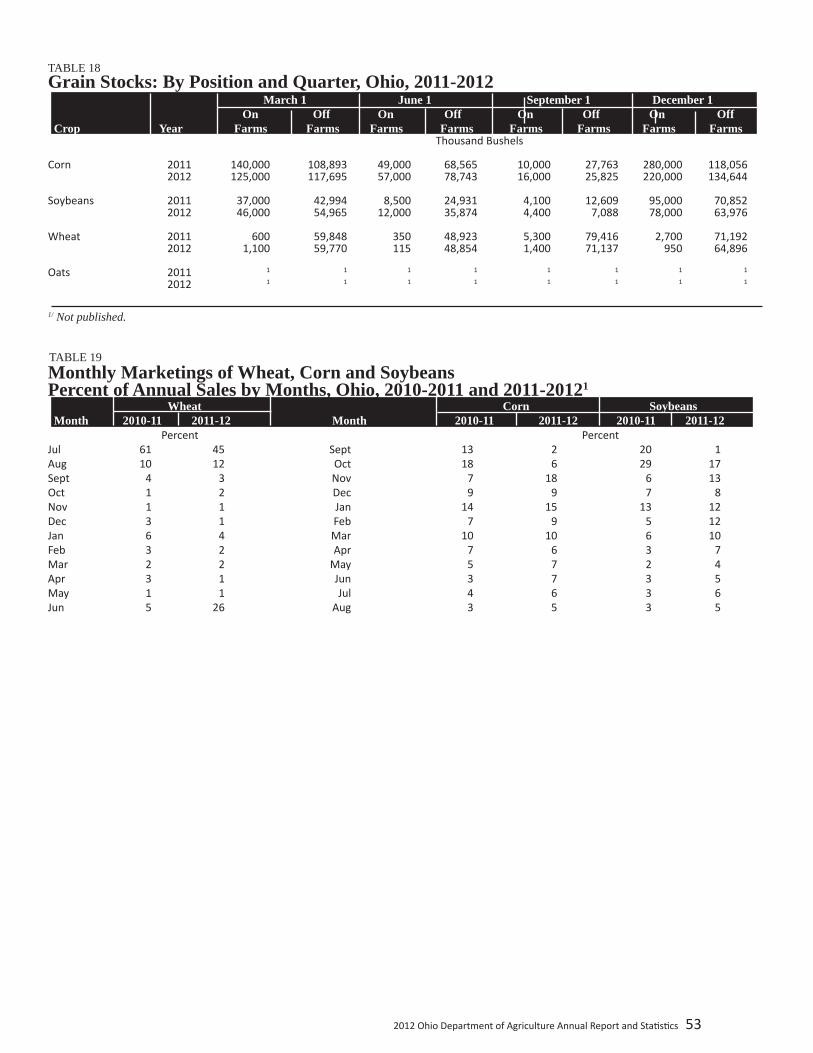
2012 Ohio Department of Agriculture Annual Report and Sta s cs 53
TABLE 19Monthly Marketings of Wheat, Corn and SoybeansPercent of Annual Sales by Months, Ohio, 2010-2011 and 2011-20121
Wheat Corn Soybeans Month 2010-11 2011-12 Month 2010-11 2011-12 2010-11 2011-12 Percent PercentJul 61 45 Sept 13 2 20 1Aug 10 12 Oct 18 6 29 17Sept 4 3 Nov 7 18 6 13Oct 1 2 Dec 9 9 7 8Nov 1 1 Jan 14 15 13 12Dec 3 1 Feb 7 9 5 12Jan 6 4 Mar 10 10 6 10Feb 3 2 Apr 7 6 3 7Mar 2 2 May 5 7 2 4Apr 3 1 Jun 3 7 3 5May 1 1 Jul 4 6 3 6Jun 5 26 Aug 3 5 3 5
TABLE 18Grain Stocks: By Position and Quarter, Ohio, 2011-2012 March 1 June 1 September 1 December 1 On Off On Off On Off On Off Crop Year Farms Farms Farms Farms Farms Farms Farms Farms Thousand Bushels
Corn 2011 140,000 108,893 49,000 68,565 10,000 27,763 280,000 118,056 2012 125,000 117,695 57,000 78,743 16,000 25,825 220,000 134,644 Soybeans 2011 37,000 42,994 8,500 24,931 4,100 12,609 95,000 70,852 2012 46,000 54,965 12,000 35,874 4,400 7,088 78,000 63,976 Wheat 2011 600 59,848 350 48,923 5,300 79,416 2,700 71,192 2012 1,100 59,770 115 48,854 1,400 71,137 950 64,896 Oats 2011 1 1 1 1 1 1 1 1
2012 1 1 1 1 1 1 1 1
1/ Not published.

54 2012 Ohio Department of Agriculture Annual Report and Sta s cs
TABLE 20Grain Stocks: Total Stocks and Percent of Production1, by Quarters, Ohio, 2011-2012 March 1 June 1 September 1 December 1 All % of All % of All % of All % of Crop Year Positions Prod. Positions Prod. Positions Prod. Positions Prod.
Thousand BushelsCorn 2011 248,893 47 117,565 22 37,763 7 398,056 78 2012 242,695 48 135,743 27 41,825 8 354,644 79 Soybeans 2011 79,994 36 33,431 15 16,709 8 165,852 76 2012 100,965 46 47,874 22 11,488 5 142,340 69 Wheat 2011 60,448 132 49,273 108 84,716 172 73,892 150 2012 60,870 123 48,969 99 89,227 287 65,846 212 Oats 2011 3 - 3 - 3 - 3 - 2012 3 - 3 - 3 - 3 - All Hay 2 2011 - - 390 14 - - 1,778 64 2012 - - 308 11 - - 1,200 52
TABLE 21Off-Farm Commercial Grain Storage Capacity,December 1, 2011-2012 Capacity Capacity Capacity County 12/1/11 12/1/12 County 12/1/11 12/1/12 County 12/1/11 12/1/12 Thousand Bushels Thousand Bushels Thousand BushelsAdams 876 876 Hancock 21,238 21,526 Paulding 6,862 6,862Allen 9,841 9,841 Hardin 6,533 6,533 Perry 247 247Ashland 2,874 2,884 Harrison 6 6 Pickaway 5,142 5,142Ashtabula 2,092 2,097 Henry 14,514 14,514 Pike 0 0Athens 0 0 Highland 1,242 337 Portage 1,796 1,944Auglaize 6,384 6,384 Hocking 1,296 1,296 Preble 4,970 4,970Belmont 38 38 Holmes 303 303 Putnam 8,306 8,306Brown 189 189 Huron 15,483 15,483 Richland 4,132 4,129Butler 2,076 2,076 Jackson 0 0 Ross 2,941 2,928Carroll 22 22 Jeff erson 0 0 Sandusky 11,644 11,644Champaign 7,154 7,154 Knox 820 820 Scioto 0 0Clark 4,021 4,773 Lake 0 0 Seneca 10,176 10,176Clermont 0 0 Lawrence 0 0 Shelby 9,334 9,334Clinton 7,192 7,001 Licking 3,240 3,240 Stark 1,302 1,291Columbiana 1,791 1,791 Logan 2,732 2,732 Summit 0 0Coshocton 3,248 3,248 Lorain 850 850 Trumbull 1,084 1,084Crawford 13,077 13,077 Lucas 55,332 55,332 Tuscarawas 1,263 1,256Cuyahoga 0 0 Madison 3,665 3,665 Union 2,392 2,392Darke 6,963 6,963 Mahoning 1,925 1,784 Van Wert 11,358 11,358Defi ance 3,310 3,651 Marion 19,225 13,508 Vinton 0 0Delaware 1,067 1,067 Medina 228 228 Warren 597 597Erie 0 0 Meigs 0 0 Washington 63 63Fairfi eld 266 323 Mercer 5,649 5,246 Wayne 5,282 5,217Faye e 9,510 9,510 Miami 6,512 6,512 Williams 8,543 8,543Franklin 7,288 6,038 Monroe 0 0 Wood 16,904 16,904Fulton 13,295 13,295 Montgomery 4,946 4,946 Wyandot 11,792 11,792Gallia 0 0 Morgan 0 0 Geauga 153 153 Morrow 6,906 6,906 Greene 490 1,114 Muskingum 1,859 1,859 Ohio 416,044 409,563Guernsey 59 59 Noble 0 0 Hamilton 9,024 9,024 O awa 3,110 3,110
1/ Percent of produc on refers to previous year’s produc on, except September 1 for wheat and oats and December 1 for corn, soybeans, and hay when current year produc on is used. 2/ The reference month for hay stocks is May instead of June and the unit is thousand tons instead of thousand bushels. 3/ Not published to avoid disclosure of individual fi rms.
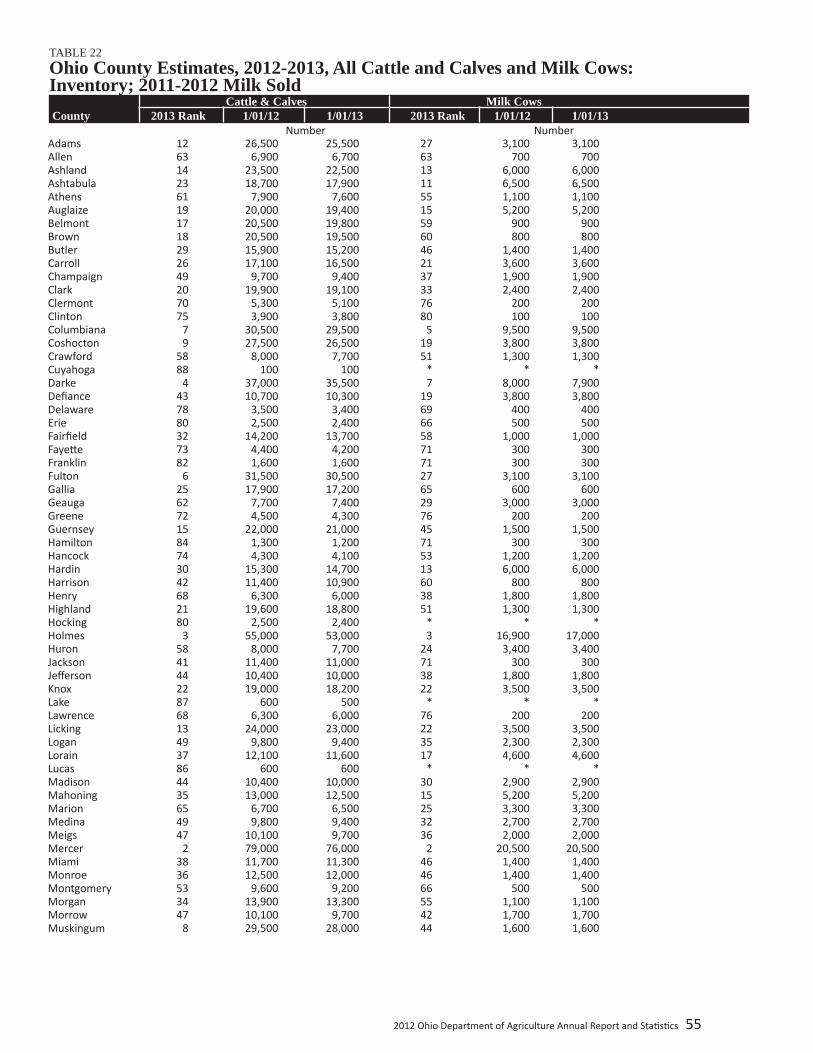
2012 Ohio Department of Agriculture Annual Report and Sta s cs 55
TABLE 22Ohio County Estimates, 2012-2013, All Cattle and Calves and Milk Cows: Inventory; 2011-2012 Milk Sold Cattle & Calves Milk Cows County 2013 Rank 1/01/12 1/01/13 2013 Rank 1/01/12 1/01/13 Number Number Adams 12 26,500 25,500 27 3,100 3,100Allen 63 6,900 6,700 63 700 700Ashland 14 23,500 22,500 13 6,000 6,000Ashtabula 23 18,700 17,900 11 6,500 6,500Athens 61 7,900 7,600 55 1,100 1,100Auglaize 19 20,000 19,400 15 5,200 5,200Belmont 17 20,500 19,800 59 900 900Brown 18 20,500 19,500 60 800 800Butler 29 15,900 15,200 46 1,400 1,400Carroll 26 17,100 16,500 21 3,600 3,600Champaign 49 9,700 9,400 37 1,900 1,900Clark 20 19,900 19,100 33 2,400 2,400Clermont 70 5,300 5,100 76 200 200Clinton 75 3,900 3,800 80 100 100Columbiana 7 30,500 29,500 5 9,500 9,500Coshocton 9 27,500 26,500 19 3,800 3,800Crawford 58 8,000 7,700 51 1,300 1,300Cuyahoga 88 100 100 * * *Darke 4 37,000 35,500 7 8,000 7,900Defi ance 43 10,700 10,300 19 3,800 3,800Delaware 78 3,500 3,400 69 400 400Erie 80 2,500 2,400 66 500 500Fairfi eld 32 14,200 13,700 58 1,000 1,000Faye e 73 4,400 4,200 71 300 300Franklin 82 1,600 1,600 71 300 300Fulton 6 31,500 30,500 27 3,100 3,100Gallia 25 17,900 17,200 65 600 600Geauga 62 7,700 7,400 29 3,000 3,000Greene 72 4,500 4,300 76 200 200Guernsey 15 22,000 21,000 45 1,500 1,500Hamilton 84 1,300 1,200 71 300 300Hancock 74 4,300 4,100 53 1,200 1,200Hardin 30 15,300 14,700 13 6,000 6,000Harrison 42 11,400 10,900 60 800 800Henry 68 6,300 6,000 38 1,800 1,800Highland 21 19,600 18,800 51 1,300 1,300Hocking 80 2,500 2,400 * * *Holmes 3 55,000 53,000 3 16,900 17,000Huron 58 8,000 7,700 24 3,400 3,400Jackson 41 11,400 11,000 71 300 300Jeff erson 44 10,400 10,000 38 1,800 1,800Knox 22 19,000 18,200 22 3,500 3,500Lake 87 600 500 * * *Lawrence 68 6,300 6,000 76 200 200Licking 13 24,000 23,000 22 3,500 3,500Logan 49 9,800 9,400 35 2,300 2,300Lorain 37 12,100 11,600 17 4,600 4,600Lucas 86 600 600 * * *Madison 44 10,400 10,000 30 2,900 2,900Mahoning 35 13,000 12,500 15 5,200 5,200Marion 65 6,700 6,500 25 3,300 3,300Medina 49 9,800 9,400 32 2,700 2,700Meigs 47 10,100 9,700 36 2,000 2,000Mercer 2 79,000 76,000 2 20,500 20,500Miami 38 11,700 11,300 46 1,400 1,400Monroe 36 12,500 12,000 46 1,400 1,400Montgomery 53 9,600 9,200 66 500 500Morgan 34 13,900 13,300 55 1,100 1,100Morrow 47 10,100 9,700 42 1,700 1,700Muskingum 8 29,500 28,000 44 1,600 1,600
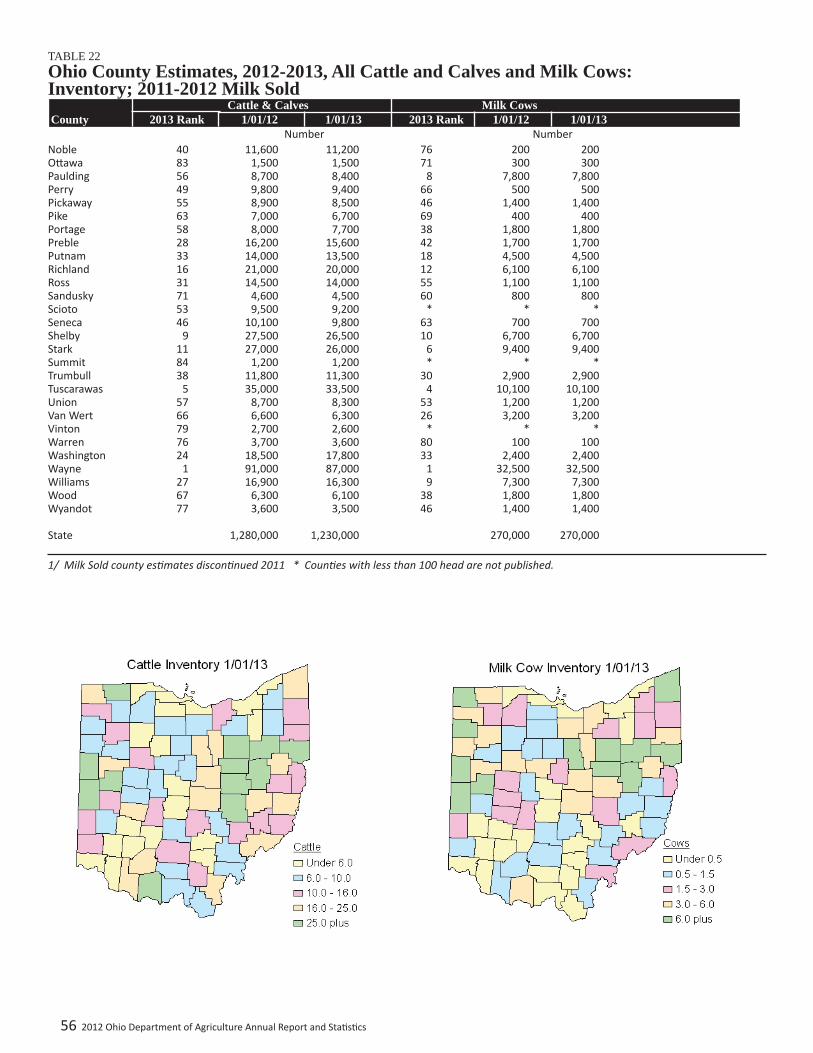
56 2012 Ohio Department of Agriculture Annual Report and Sta s cs
TABLE 22Ohio County Estimates, 2012-2013, All Cattle and Calves and Milk Cows: Inventory; 2011-2012 Milk Sold Cattle & Calves Milk Cows County 2013 Rank 1/01/12 1/01/13 2013 Rank 1/01/12 1/01/13 Number Number Noble 40 11,600 11,200 76 200 200O awa 83 1,500 1,500 71 300 300Paulding 56 8,700 8,400 8 7,800 7,800Perry 49 9,800 9,400 66 500 500Pickaway 55 8,900 8,500 46 1,400 1,400Pike 63 7,000 6,700 69 400 400Portage 58 8,000 7,700 38 1,800 1,800Preble 28 16,200 15,600 42 1,700 1,700Putnam 33 14,000 13,500 18 4,500 4,500Richland 16 21,000 20,000 12 6,100 6,100Ross 31 14,500 14,000 55 1,100 1,100Sandusky 71 4,600 4,500 60 800 800Scioto 53 9,500 9,200 * * *Seneca 46 10,100 9,800 63 700 700Shelby 9 27,500 26,500 10 6,700 6,700Stark 11 27,000 26,000 6 9,400 9,400Summit 84 1,200 1,200 * * *Trumbull 38 11,800 11,300 30 2,900 2,900Tuscarawas 5 35,000 33,500 4 10,100 10,100Union 57 8,700 8,300 53 1,200 1,200Van Wert 66 6,600 6,300 26 3,200 3,200Vinton 79 2,700 2,600 * * *Warren 76 3,700 3,600 80 100 100Washington 24 18,500 17,800 33 2,400 2,400Wayne 1 91,000 87,000 1 32,500 32,500Williams 27 16,900 16,300 9 7,300 7,300Wood 67 6,300 6,100 38 1,800 1,800Wyandot 77 3,600 3,500 46 1,400 1,400 State 1,280,000 1,230,000 270,000 270,000
1/ Milk Sold county es mates discon nued 2011 * Coun es with less than 100 head are not published.

2012 Ohio Department of Agriculture Annual Report and Sta s cs 57
TABLE 23Cattle and Calves: Ohio and United States,January 1, 2012-2013 Ohio United States Class 2012 3 2013 3 2013/12 2012 3 2013 3 2013/12 Thousand Head Percent Thousand Head PercentCa le and Calves 1,280 1,230 96 90,769 89,300 98 Cows & Heifers that calved 570 560 98 39,387 38,515 98Beef Cows 300 290 97 30,158 29,295 97Milk Cows 270 270 100 9,230 9,220 100 Heifers 500 pounds and over 245 245 100 19,338 19,130 99For Beef Cow replacement 55 55 100 5,262 5,361 102For Milk Cow replacement 120 125 104 4,622 4,551 98Other Heifers 70 65 93 9,454 9,218 98 Steers 500 pounds and over 190 185 97 15,833 15,813 100Bulls 500 pounds and over 25 20 80 2,096 2,056 98Calves under 500 pounds 250 220 88 14,115 13,787 98 Calf crop 490 480 98 35,313 34,279 97Ca le on Feed 180 160 89 14,121 13,352 95 Dollars Dollars Ca le and Calves Value per head ($) 1,040 1,100 106 1,111 1,139 103Total value ($1,000) 1,331,200 1,353,000 102 100,817,900 101,731,742 101 Number of opera ons with: Ca le 1 4 4 - 922,000 915,000 99Beef Cows 1 2 4 4 - 734,000 729,000 99Milk cows 1 2 4 4 - 60,000 58,000 971/ During 2011 and 2012. 2/ Included in number of ca le opera ons. 3/ May not add due to rounding. 4/ Data at State level no longer available on an annual basis.
TABLE 24Cattle and Calf Production,Ohio, 2008-2012 On Hand Calf Marketings On Farm Deaths Year January 1 Crop Inshipments Cattle Calves Slaughter Cattle Calves Thousand Head2008 1,250 460 52.0 359 68 4.0 22.0 29.02009 1,280 470 43.0 355 108 4.0 21.0 25.02010 1,280 450 48.0 368 125 5.0 21.0 29.02011 1,230 490 65.0 320 124 6.0 24.0 31.02012 1,280 480 51.0 391 133 5.0 22.0 30.0
TABLE 25Income from Cattle and Calf Production,Ohio, 2008-2012 Average Price per 100 lbs. Value of Home Year Production Marketings Cattle Calves Cash Receipts Consumption Gross Income Thousand Pounds Dollars Thousand Dollars2008 447,220 423,100 83.60 95.80 356,646 15,419 372,0652009 392,698 444,200 77.30 93.60 348,159 16,877 365,0362010 431,197 465,080 88.00 107.00 415,347 17,885 433,2322011 410,197 411,580 1/ 1/ 412,705 21,605 434,3102012 462,521 502,400 1/ 1/ 552,817 22,618 575,435
1/Beginning in January 2011, State level cows and calves prices were discon nued.
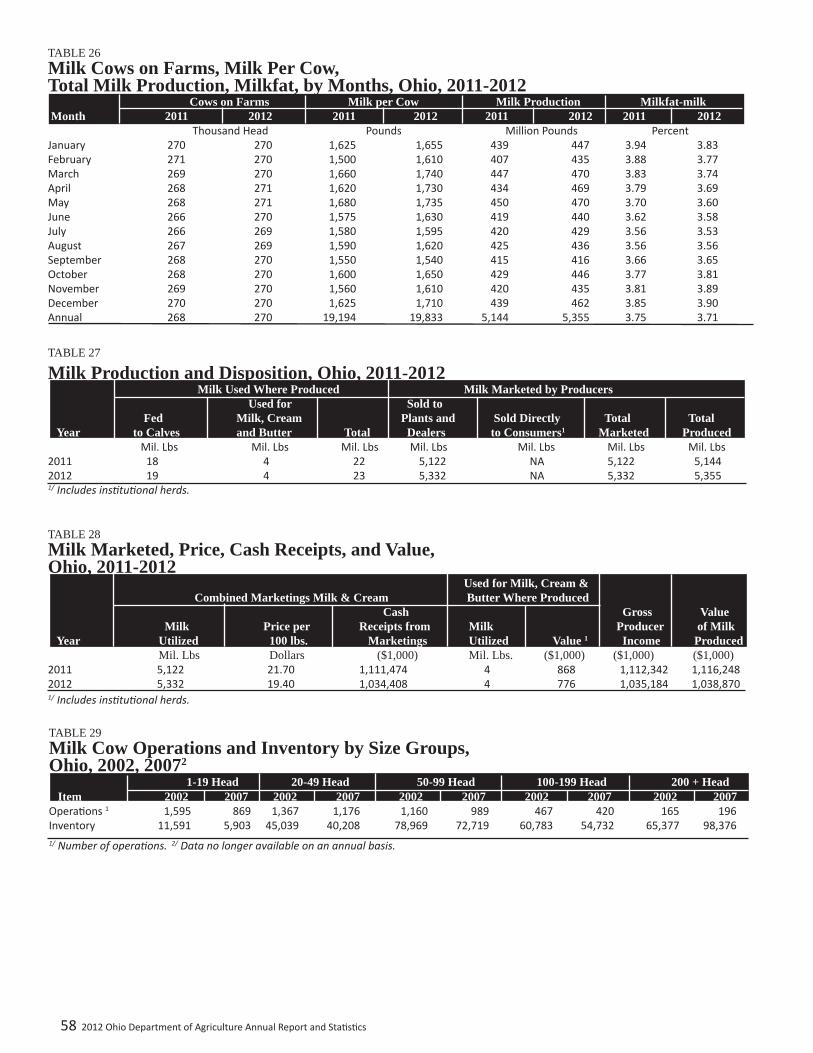
58 2012 Ohio Department of Agriculture Annual Report and Sta s cs
TABLE 26Milk Cows on Farms, Milk Per Cow,Total Milk Production, Milkfat, by Months, Ohio, 2011-2012 Cows on Farms Milk per Cow Milk Production Milkfat-milk Month 2011 2012 2011 2012 2011 2012 2011 2012 Thousand Head Pounds Million Pounds PercentJanuary 270 270 1,625 1,655 439 447 3.94 3.83February 271 270 1,500 1,610 407 435 3.88 3.77March 269 270 1,660 1,740 447 470 3.83 3.74April 268 271 1,620 1,730 434 469 3.79 3.69May 268 271 1,680 1,735 450 470 3.70 3.60June 266 270 1,575 1,630 419 440 3.62 3.58July 266 269 1,580 1,595 420 429 3.56 3.53August 267 269 1,590 1,620 425 436 3.56 3.56September 268 270 1,550 1,540 415 416 3.66 3.65October 268 270 1,600 1,650 429 446 3.77 3.81November 269 270 1,560 1,610 420 435 3.81 3.89December 270 270 1,625 1,710 439 462 3.85 3.90Annual 268 270 19,194 19,833 5,144 5,355 3.75 3.71
TABLE 27
Milk Production and Disposition, Ohio, 2011-2012 Milk Used Where Produced Milk Marketed by Producers Used for Sold to Fed Milk, Cream Plants and Sold Directly Total Total Year to Calves and Butter Total Dealers to Consumers1 Marketed Produced Mil. Lbs Mil. Lbs Mil. Lbs Mil. Lbs Mil. Lbs Mil. Lbs Mil. Lbs2011 18 4 22 5,122 NA 5,122 5,1442012 19 4 23 5,332 NA 5,332 5,3551/ Includes ins tu onal herds.
TABLE 28Milk Marketed, Price, Cash Receipts, and Value,Ohio, 2011-2012 Used for Milk, Cream & Combined Marketings Milk & Cream Butter Where Produced Cash Gross Value Milk Price per Receipts from Milk Producer of Milk Year Utilized 100 lbs. Marketings Utilized Value 1 Income Produced Mil. Lbs Dollars ($1,000) Mil. Lbs. ($1,000) ($1,000) ($1,000) 2011 5,122 21.70 1,111,474 4 868 1,112,342 1,116,2482012 5,332 19.40 1,034,408 4 776 1,035,184 1,038,8701/ Includes ins tu onal herds.
TABLE 29Milk Cow Operations and Inventory by Size Groups, Ohio, 2002, 20072
1-19 Head 20-49 Head 50-99 Head 100-199 Head 200 + Head Item 2002 2007 2002 2007 2002 2007 2002 2007 2002 2007Opera ons 1 1,595 869 1,367 1,176 1,160 989 467 420 165 196Inventory 11,591 5,903 45,039 40,208 78,969 72,719 60,783 54,732 65,377 98,3761/ Number of opera ons. 2/ Data no longer available on an annual basis.
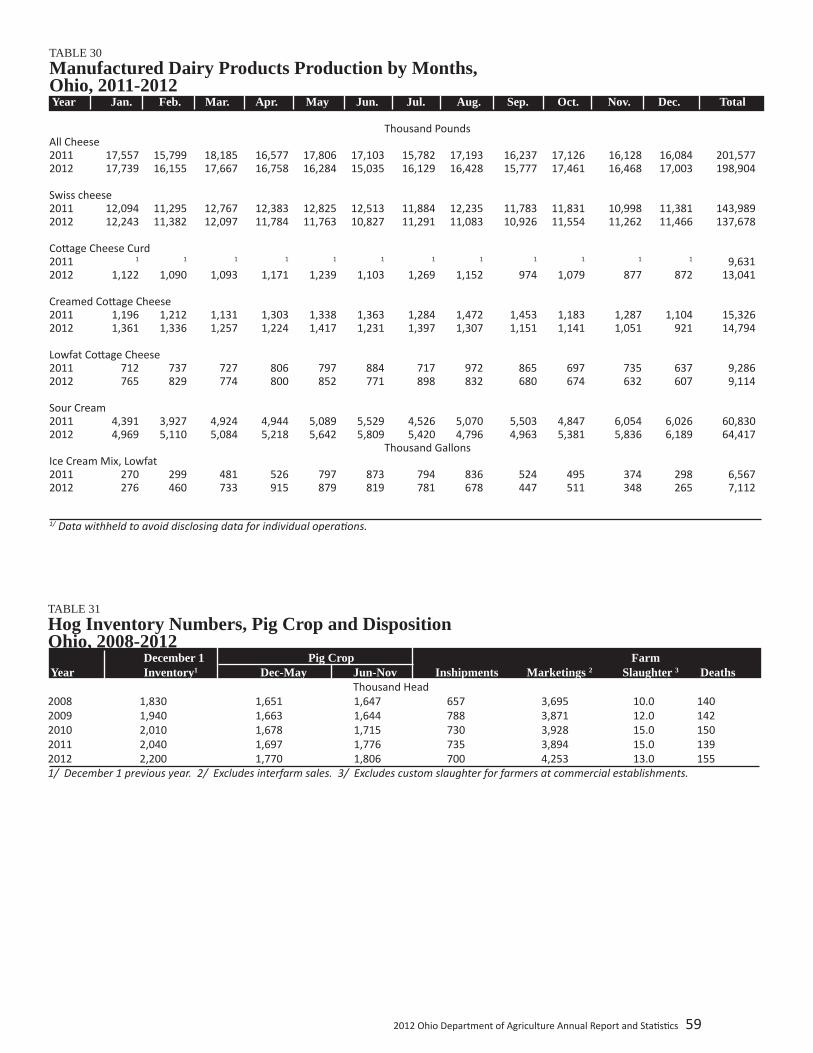
2012 Ohio Department of Agriculture Annual Report and Sta s cs 59
TABLE 31Hog Inventory Numbers, Pig Crop and DispositionOhio, 2008-2012 December 1 Pig Crop Farm Year Inventory1 Dec-May Jun-Nov Inshipments Marketings 2 Slaughter 3 Deaths Thousand Head2008 1,830 1,651 1,647 657 3,695 10.0 1402009 1,940 1,663 1,644 788 3,871 12.0 1422010 2,010 1,678 1,715 730 3,928 15.0 1502011 2,040 1,697 1,776 735 3,894 15.0 1392012 2,200 1,770 1,806 700 4,253 13.0 1551/ December 1 previous year. 2/ Excludes interfarm sales. 3/ Excludes custom slaughter for farmers at commercial establishments.
TABLE 30Manufactured Dairy Products Production by Months, Ohio, 2011-2012 Year Jan. Feb. Mar. Apr. May Jun. Jul. Aug. Sep. Oct. Nov. Dec. Total Thousand PoundsAll Cheese 2011 17,557 15,799 18,185 16,577 17,806 17,103 15,782 17,193 16,237 17,126 16,128 16,084 201,5772012 17,739 16,155 17,667 16,758 16,284 15,035 16,129 16,428 15,777 17,461 16,468 17,003 198,904 Swiss cheese 2011 12,094 11,295 12,767 12,383 12,825 12,513 11,884 12,235 11,783 11,831 10,998 11,381 143,9892012 12,243 11,382 12,097 11,784 11,763 10,827 11,291 11,083 10,926 11,554 11,262 11,466 137,678 Co age Cheese Curd 2011 1 1 1 1 1 1 1 1 1 1 1 1 9,6312012 1,122 1,090 1,093 1,171 1,239 1,103 1,269 1,152 974 1,079 877 872 13,041 Creamed Co age Cheese 2011 1,196 1,212 1,131 1,303 1,338 1,363 1,284 1,472 1,453 1,183 1,287 1,104 15,3262012 1,361 1,336 1,257 1,224 1,417 1,231 1,397 1,307 1,151 1,141 1,051 921 14,794 Lowfat Co age Cheese 2011 712 737 727 806 797 884 717 972 865 697 735 637 9,2862012 765 829 774 800 852 771 898 832 680 674 632 607 9,114 Sour Cream 2011 4,391 3,927 4,924 4,944 5,089 5,529 4,526 5,070 5,503 4,847 6,054 6,026 60,8302012 4,969 5,110 5,084 5,218 5,642 5,809 5,420 4,796 4,963 5,381 5,836 6,189 64,417 Thousand Gallons Ice Cream Mix, Lowfat 2011 270 299 481 526 797 873 794 836 524 495 374 298 6,5672012 276 460 733 915 879 819 781 678 447 511 348 265 7,112 1/ Data withheld to avoid disclosing data for individual opera ons.
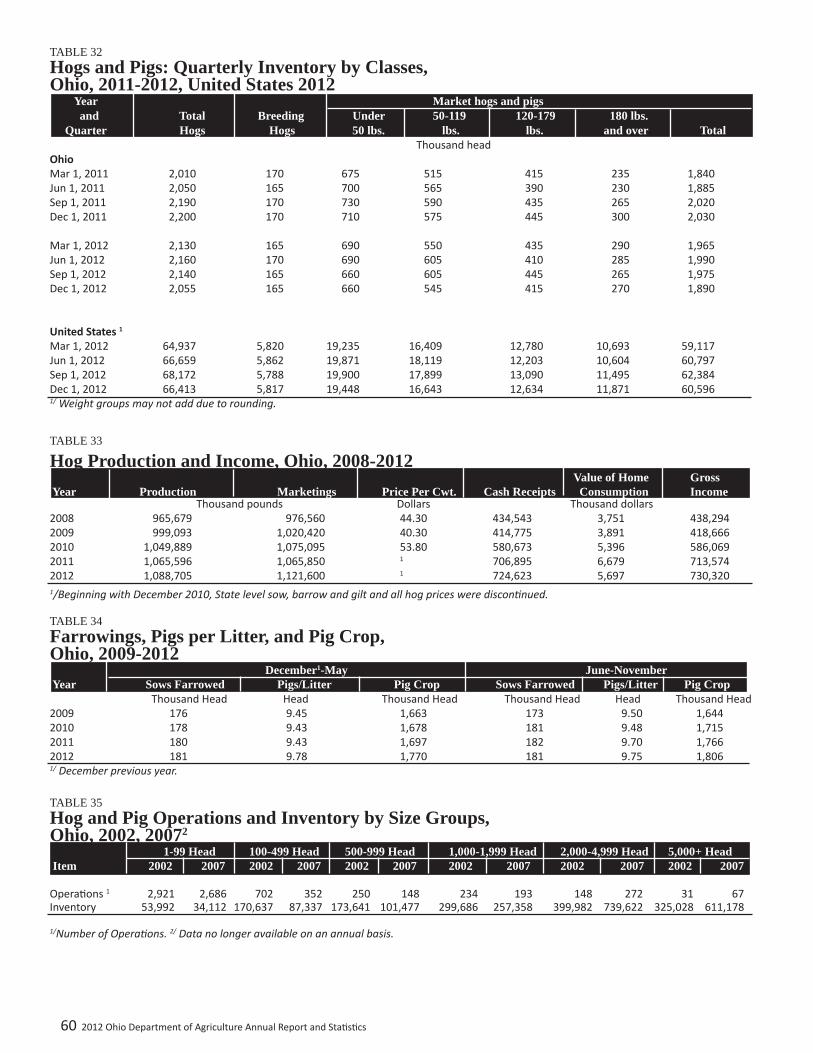
60 2012 Ohio Department of Agriculture Annual Report and Sta s cs
TABLE 33
Hog Production and Income, Ohio, 2008-2012 Value of Home Gross Year Production Marketings Price Per Cwt. Cash Receipts Consumption Income Thousand pounds Dollars Thousand dollars2008 965,679 976,560 44.30 434,543 3,751 438,2942009 999,093 1,020,420 40.30 414,775 3,891 418,6662010 1,049,889 1,075,095 53.80 580,673 5,396 586,0692011 1,065,596 1,065,850 1 706,895 6,679 713,5742012 1,088,705 1,121,600 1 724,623 5,697 730,320
TABLE 32Hogs and Pigs: Quarterly Inventory by Classes,Ohio, 2011-2012, United States 2012 Year Market hogs and pigs and Total Breeding Under 50-119 120-179 180 lbs. Quarter Hogs Hogs 50 lbs. lbs. lbs. and over Total Thousand headOhio Mar 1, 2011 2,010 170 675 515 415 235 1,840Jun 1, 2011 2,050 165 700 565 390 230 1,885Sep 1, 2011 2,190 170 730 590 435 265 2,020Dec 1, 2011 2,200 170 710 575 445 300 2,030 Mar 1, 2012 2,130 165 690 550 435 290 1,965Jun 1, 2012 2,160 170 690 605 410 285 1,990Sep 1, 2012 2,140 165 660 605 445 265 1,975Dec 1, 2012 2,055 165 660 545 415 270 1,890 United States 1 Mar 1, 2012 64,937 5,820 19,235 16,409 12,780 10,693 59,117Jun 1, 2012 66,659 5,862 19,871 18,119 12,203 10,604 60,797Sep 1, 2012 68,172 5,788 19,900 17,899 13,090 11,495 62,384Dec 1, 2012 66,413 5,817 19,448 16,643 12,634 11,871 60,596 1/ Weight groups may not add due to rounding.
TABLE 34Farrowings, Pigs per Litter, and Pig Crop,Ohio, 2009-2012 December1-May June-November Year Sows Farrowed Pigs/Litter Pig Crop Sows Farrowed Pigs/Litter Pig Crop Thousand Head Head Thousand Head Thousand Head Head Thousand Head2009 176 9.45 1,663 173 9.50 1,6442010 178 9.43 1,678 181 9.48 1,7152011 180 9.43 1,697 182 9.70 1,7662012 181 9.78 1,770 181 9.75 1,8061/ December previous year.
TABLE 35Hog and Pig Operations and Inventory by Size Groups, Ohio, 2002, 20072
1-99 Head 100-499 Head 500-999 Head 1,000-1,999 Head 2,000-4,999 Head 5,000+ Head Item 2002 2007 2002 2007 2002 2007 2002 2007 2002 2007 2002 2007
Opera ons 1 2,921 2,686 702 352 250 148 234 193 148 272 31 67Inventory 53,992 34,112 170,637 87,337 173,641 101,477 299,686 257,358 399,982 739,622 325,028 611,178
1/Number of Opera ons. 2/ Data no longer available on an annual basis.
1/Beginning with December 2010, State level sow, barrow and gilt and all hog prices were discon nued.
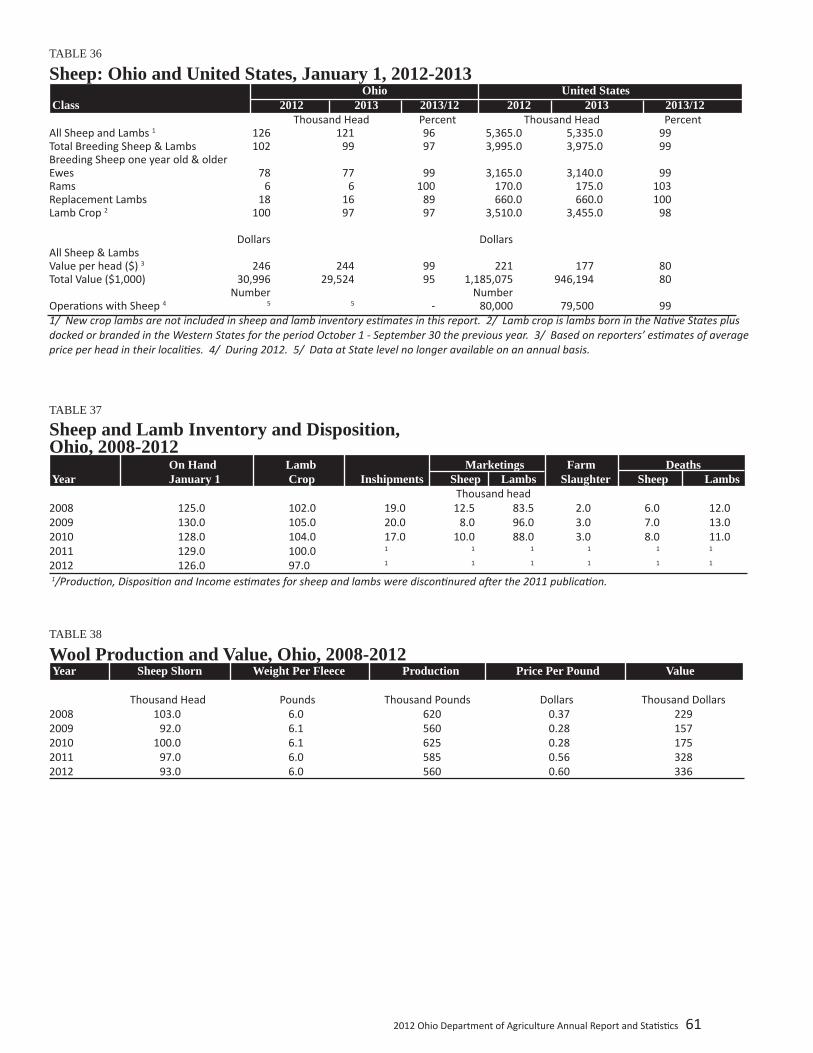
2012 Ohio Department of Agriculture Annual Report and Sta s cs 61
TABLE 36
Sheep: Ohio and United States, January 1, 2012-2013 Ohio United States Class 2012 2013 2013/12 2012 2013 2013/12 Thousand Head Percent Thousand Head PercentAll Sheep and Lambs 1 126 121 96 5,365.0 5,335.0 99Total Breeding Sheep & Lambs 102 99 97 3,995.0 3,975.0 99Breeding Sheep one year old & older Ewes 78 77 99 3,165.0 3,140.0 99Rams 6 6 100 170.0 175.0 103Replacement Lambs 18 16 89 660.0 660.0 100Lamb Crop 2 100 97 97 3,510.0 3,455.0 98 Dollars Dollars All Sheep & Lambs Value per head ($) 3 246 244 99 221 177 80Total Value ($1,000) 30,996 29,524 95 1,185,075 946,194 80 Number Number Opera ons with Sheep 4 5 5 - 80,000 79,500 991/ New crop lambs are not included in sheep and lamb inventory es mates in this report. 2/ Lamb crop is lambs born in the Na ve States plus docked or branded in the Western States for the period October 1 - September 30 the previous year. 3/ Based on reporters’ es mates of average price per head in their locali es. 4/ During 2012. 5/ Data at State level no longer available on an annual basis.
Sheep and Lamb Inventory and Disposition,Ohio, 2008-2012 On Hand Lamb Marketings Farm Deaths Year January 1 Crop Inshipments Sheep Lambs Slaughter Sheep Lambs Thousand head 2008 125.0 102.0 19.0 12.5 83.5 2.0 6.0 12.02009 130.0 105.0 20.0 8.0 96.0 3.0 7.0 13.02010 128.0 104.0 17.0 10.0 88.0 3.0 8.0 11.02011 129.0 100.0 1 1 1 1 1 1
2012 126.0 97.0 1 1 1 1 1 1
TABLE 38
Wool Production and Value, Ohio, 2008-2012 Year Sheep Shorn Weight Per Fleece Production Price Per Pound Value Thousand Head Pounds Thousand Pounds Dollars Thousand Dollars2008 103.0 6.0 620 0.37 2292009 92.0 6.1 560 0.28 1572010 100.0 6.1 625 0.28 1752011 97.0 6.0 585 0.56 3282012 93.0 6.0 560 0.60 336
TABLE 37
1/Produc on, Disposi on and Income es mates for sheep and lambs were discon nured a er the 2011 publica on.
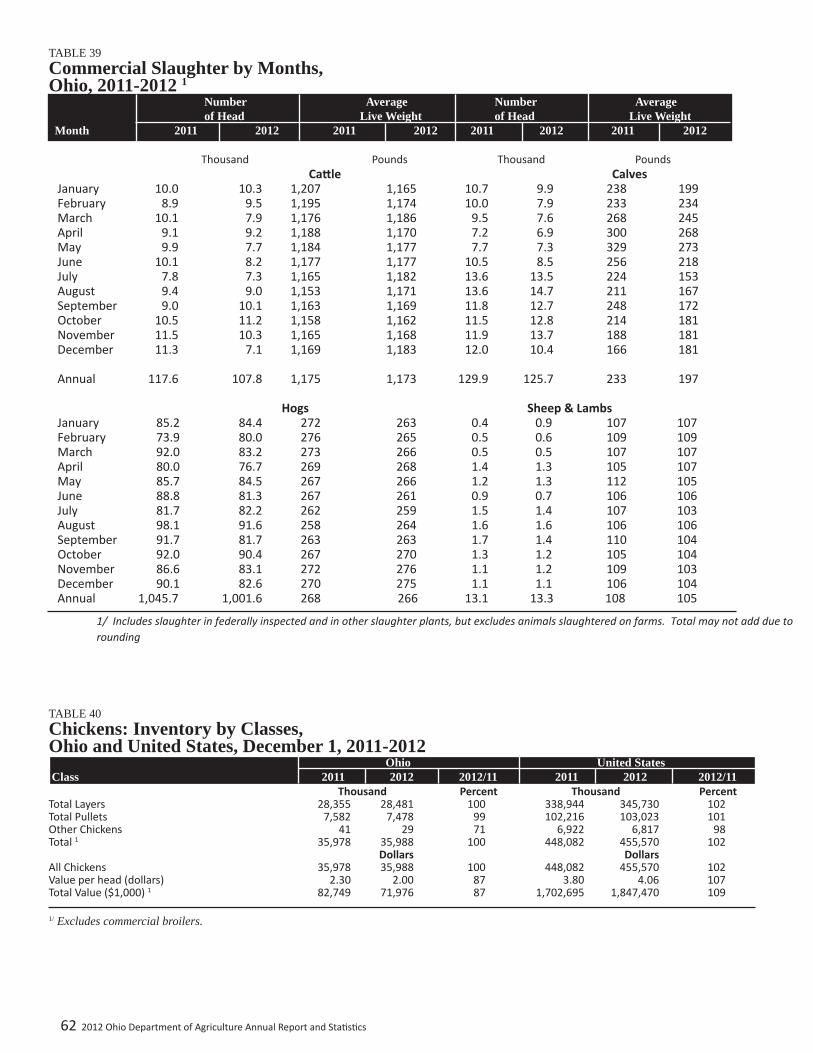
62 2012 Ohio Department of Agriculture Annual Report and Sta s cs
TABLE 40Chickens: Inventory by Classes,Ohio and United States, December 1, 2011-2012 Ohio United States Class 2011 2012 2012/11 2011 2012 2012/11 Thousand Percent Thousand PercentTotal Layers 28,355 28,481 100 338,944 345,730 102Total Pullets 7,582 7,478 99 102,216 103,023 101Other Chickens 41 29 71 6,922 6,817 98Total 1 35,978 35,988 100 448,082 455,570 102 Dollars Dollars All Chickens 35,978 35,988 100 448,082 455,570 102Value per head (dollars) 2.30 2.00 87 3.80 4.06 107Total Value ($1,000) 1 82,749 71,976 87 1,702,695 1,847,470 109 1/ Excludes commercial broilers.
TABLE 39Commercial Slaughter by Months,Ohio, 2011-2012 1
Number Average Number Average of Head Live Weight of Head Live Weight Month 2011 2012 2011 2012 2011 2012 2011 2012 Thousand Pounds Thousand Pounds
Ca le Calves January 10.0 10.3 1,207 1,165 10.7 9.9 238 199February 8.9 9.5 1,195 1,174 10.0 7.9 233 234March 10.1 7.9 1,176 1,186 9.5 7.6 268 245April 9.1 9.2 1,188 1,170 7.2 6.9 300 268May 9.9 7.7 1,184 1,177 7.7 7.3 329 273June 10.1 8.2 1,177 1,177 10.5 8.5 256 218July 7.8 7.3 1,165 1,182 13.6 13.5 224 153August 9.4 9.0 1,153 1,171 13.6 14.7 211 167September 9.0 10.1 1,163 1,169 11.8 12.7 248 172October 10.5 11.2 1,158 1,162 11.5 12.8 214 181November 11.5 10.3 1,165 1,168 11.9 13.7 188 181December 11.3 7.1 1,169 1,183 12.0 10.4 166 181 Annual 117.6 107.8 1,175 1,173 129.9 125.7 233 197 Hogs Sheep & Lambs January 85.2 84.4 272 263 0.4 0.9 107 107February 73.9 80.0 276 265 0.5 0.6 109 109March 92.0 83.2 273 266 0.5 0.5 107 107April 80.0 76.7 269 268 1.4 1.3 105 107May 85.7 84.5 267 266 1.2 1.3 112 105June 88.8 81.3 267 261 0.9 0.7 106 106July 81.7 82.2 262 259 1.5 1.4 107 103August 98.1 91.6 258 264 1.6 1.6 106 106September 91.7 81.7 263 263 1.7 1.4 110 104October 92.0 90.4 267 270 1.3 1.2 105 104November 86.6 83.1 272 276 1.1 1.2 109 103December 90.1 82.6 270 275 1.1 1.1 106 104 Annual 1,045.7 1,001.6 268 266 13.1 13.3 108 105
1/ Includes slaughter in federally inspected and in other slaughter plants, but excludes animals slaughtered on farms. Total may not add due to rounding
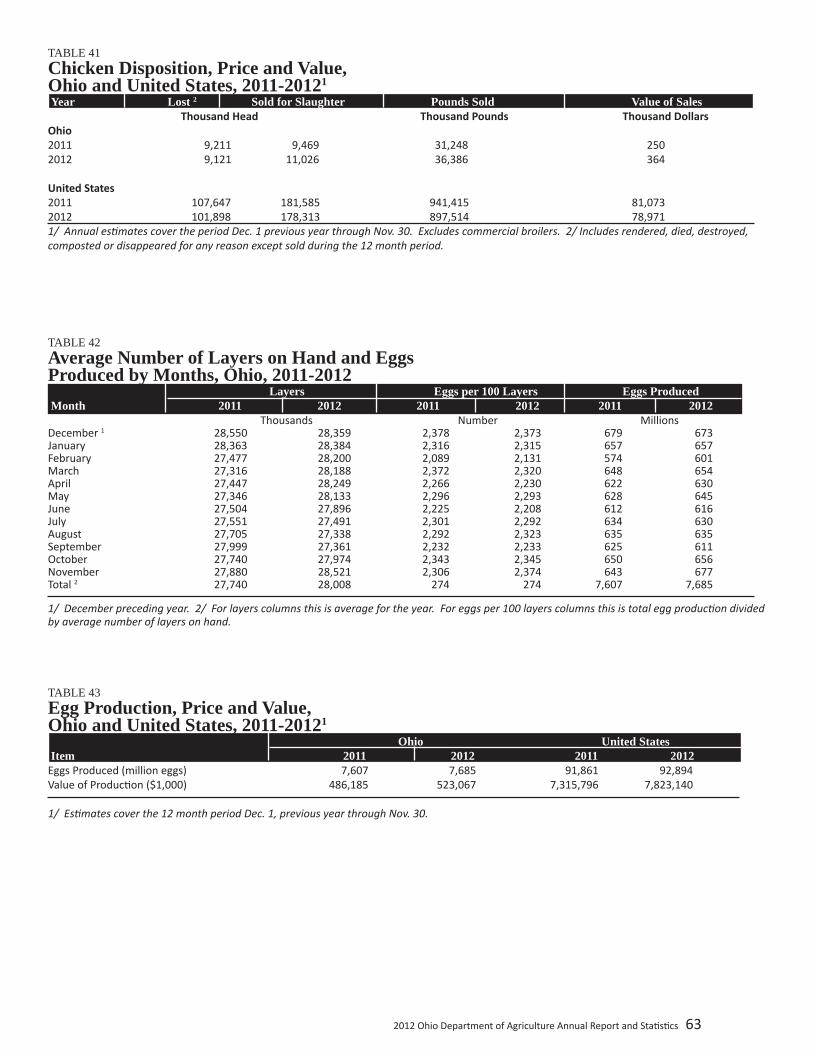
2012 Ohio Department of Agriculture Annual Report and Sta s cs 63
TABLE 41Chicken Disposition, Price and Value,Ohio and United States, 2011-20121
Year Lost 2 Sold for Slaughter Pounds Sold Value of Sales Thousand Head Thousand Pounds Thousand DollarsOhio 2011 9,211 9,469 31,248 2502012 9,121 11,026 36,386 364 United States 2011 107,647 181,585 941,415 81,0732012 101,898 178,313 897,514 78,9711/ Annual es mates cover the period Dec. 1 previous year through Nov. 30. Excludes commercial broilers. 2/ Includes rendered, died, destroyed, composted or disappeared for any reason except sold during the 12 month period.
TABLE 42Average Number of Layers on Hand and EggsProduced by Months, Ohio, 2011-2012 Layers Eggs per 100 Layers Eggs Produced Month 2011 2012 2011 2012 2011 2012 Thousands Number MillionsDecember 1 28,550 28,359 2,378 2,373 679 673January 28,363 28,384 2,316 2,315 657 657February 27,477 28,200 2,089 2,131 574 601March 27,316 28,188 2,372 2,320 648 654April 27,447 28,249 2,266 2,230 622 630May 27,346 28,133 2,296 2,293 628 645June 27,504 27,896 2,225 2,208 612 616July 27,551 27,491 2,301 2,292 634 630August 27,705 27,338 2,292 2,323 635 635September 27,999 27,361 2,232 2,233 625 611October 27,740 27,974 2,343 2,345 650 656November 27,880 28,521 2,306 2,374 643 677Total 2 27,740 28,008 274 274 7,607 7,685
TABLE 43Egg Production, Price and Value,Ohio and United States, 2011-20121
Ohio United States Item 2011 2012 2011 2012Eggs Produced (million eggs) 7,607 7,685 91,861 92,894Value of Produc on ($1,000) 486,185 523,067 7,315,796 7,823,140
1/ Es mates cover the 12 month period Dec. 1, previous year through Nov. 30.
1/ December preceding year. 2/ For layers columns this is average for the year. For eggs per 100 layers columns this is total egg produc on divided by average number of layers on hand.

64 2012 Ohio Department of Agriculture Annual Report and Sta s cs
Honey Yield Average Value Year Producing Per Production Stocks Price Per of Colonies Colony Dec 152 Pound3 Production
TABLE 45Turkey Production, Price and Value,Ohio and United States, 2011-2012 Ohio United States Item 2011 2012 2011 2012Number produced (1,000 head) 1 5,000 5,500 248,500 253,500Pounds produced (1,000 pounds) 201,000 219,450 7,273,595 7,546,695Price per pound (dollars) 2 3 3 0.682 0.721Value of produc on ($1,000) 137,082 158,223 4,960,593 5,441,1711/ Based on turkeys hatched September 1, previous year, through August 31, current year. Excludes young turkeys lost. 2/ Liveweight equivalent price. 3/ State level price per pound discon nued.
TABLE 44Broiler Production, Price and Value,Ohio and United States, 2011-20121
Ohio United States 2
Item 2011 2012 2011 2012Number produced (1,000 head) 59,600 63,200 8,336,100 8,149,100Pounds produced (1,000 pounds) 375,500 379,200 48,664,100 47,971,300Value of produc on ($1,000) 172,355 189,600 22,336,822 23,985,6501/ Broiler produc on including other domes c meat-type breeds. 2/ Excludes states producing less than 500,000 broilers.
Thousand Pounds Thousand Pounds Thousand Pounds Cents Thousand Dollars2008 14 53 742 371 168 1,2472009 11 50 550 132 281 1,5462010 18 62 1,116 346 228 2,5442011 15 66 990 228 234 2,3172012 19 60 1,140 433 242 2,7591/ For producers with 5 or more colonies. 2/ Stocks held by producers. 3/ Prices weighted by sales.
Bee Colonies and Honey Production, Ohio, 2008-20121
TABLE 46
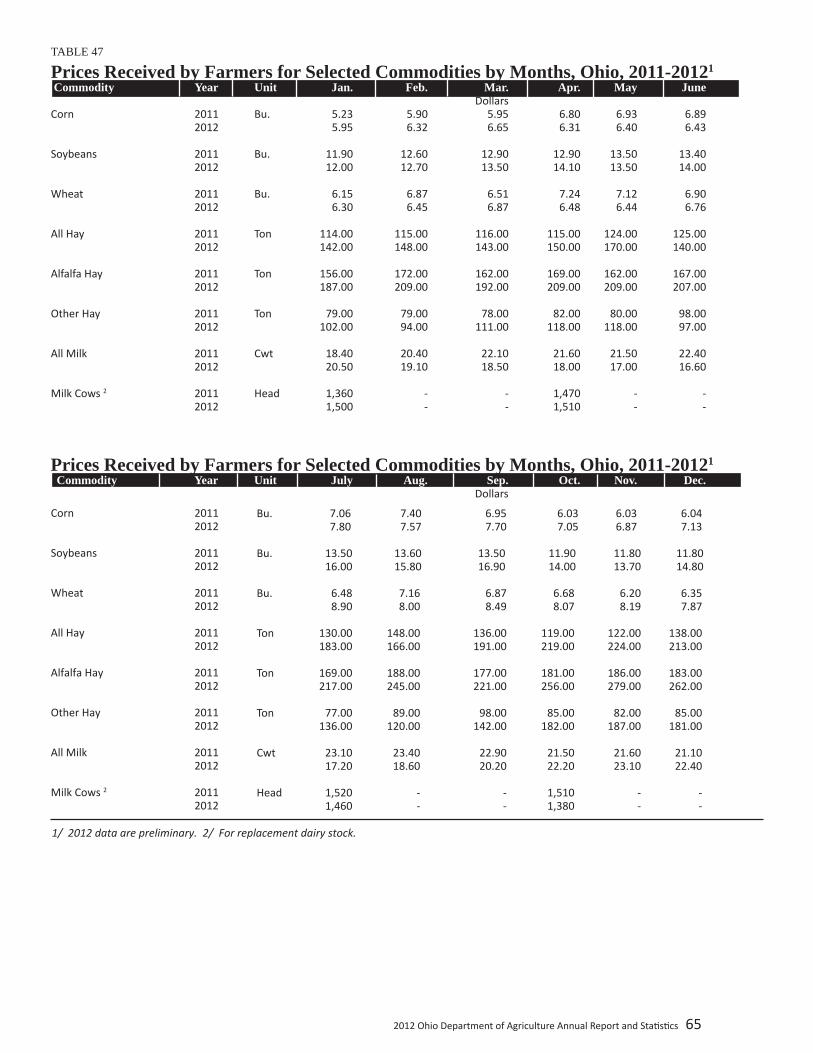
2012 Ohio Department of Agriculture Annual Report and Sta s cs 65
TABLE 47
Prices Received by Farmers for Selected Commodities by Months, Ohio, 2011-20121
Commodity Year Unit Jan. Feb. Mar. Apr. May June DollarsCorn 2011 Bu. 5.23 5.90 5.95 6.80 6.93 6.89 2012 5.95 6.32 6.65 6.31 6.40 6.43 Soybeans 2011 Bu. 11.90 12.60 12.90 12.90 13.50 13.40 2012 12.00 12.70 13.50 14.10 13.50 14.00 Wheat 2011 Bu. 6.15 6.87 6.51 7.24 7.12 6.90 2012 6.30 6.45 6.87 6.48 6.44 6.76 All Hay 2011 Ton 114.00 115.00 116.00 115.00 124.00 125.00 2012 142.00 148.00 143.00 150.00 170.00 140.00 Alfalfa Hay 2011 Ton 156.00 172.00 162.00 169.00 162.00 167.00 2012 187.00 209.00 192.00 209.00 209.00 207.00 Other Hay 2011 Ton 79.00 79.00 78.00 82.00 80.00 98.00 2012 102.00 94.00 111.00 118.00 118.00 97.00 All Milk 2011 Cwt 18.40 20.40 22.10 21.60 21.50 22.40 2012 20.50 19.10 18.50 18.00 17.00 16.60 Milk Cows 2 2011 Head 1,360 - - 1,470 - - 2012 1,500 - - 1,510 - -
Corn 2011 2012 Soybeans 2011 2012 Wheat 2011 2012 All Hay 2011 2012 Alfalfa Hay 2011 2012 Other Hay 2011 2012 All Milk 2011 2012 Milk Cows 2 2011 2012
Prices Received by Farmers for Selected Commodities by Months, Ohio, 2011-20121
Commodity Year Unit July Aug. Sep. Oct. Nov. Dec. Dollars
1/ 2012 data are preliminary. 2/ For replacement dairy stock.
Bu. 7.06 7.40 6.95 6.03 6.03 6.04 7.80 7.57 7.70 7.05 6.87 7.13 Bu. 13.50 13.60 13.50 11.90 11.80 11.80 16.00 15.80 16.90 14.00 13.70 14.80 Bu. 6.48 7.16 6.87 6.68 6.20 6.35 8.90 8.00 8.49 8.07 8.19 7.87 Ton 130.00 148.00 136.00 119.00 122.00 138.00 183.00 166.00 191.00 219.00 224.00 213.00 Ton 169.00 188.00 177.00 181.00 186.00 183.00 217.00 245.00 221.00 256.00 279.00 262.00 Ton 77.00 89.00 98.00 85.00 82.00 85.00 136.00 120.00 142.00 182.00 187.00 181.00 Cwt 23.10 23.40 22.90 21.50 21.60 21.10 17.20 18.60 20.20 22.20 23.10 22.40 Head 1,520 - - 1,510 - - 1,460 - - 1,380 - -

66 2012 Ohio Department of Agriculture Annual Report and Sta s cs
TABLE 48
Average Prices of Selected Commodities, Ohio, 2011-2012 Commodity 1 Unit 2011 2012 Dollars Corn for Grain Bu. 6.44 7.45Soybeans Bu. 13.00 14.50Wheat Bu. 6.73 8.40Oats Bu. 4.30 4.35All Hay Ton 133.00 187.00All Tobacco Lb. 1.690 1.890Grapes Ton 398.00 688.00All Wholesale Milk Cwt 21.70 19.40Milk cows2 Head 1,470 1,4601/ Crops are marke ng year average price. 2/ For milk herd replacement.
TABLE 49Average Prices Paid by Farmers for Feed and Fuels,Corn Belt 1, 2011-2013 Mar Mar Mar Item 2011 2012 2013 Dollars per Ton Hog feed 14 - 18% 367 384 481Hog Concentrate 38 - 42% protein 549 558 625Beef Ca le Concentrate 32 - 36% protein 516 532 610Dairy Feed 16% protein 381 391 411Dairy Feed 38% protein 512 531 638Laying Feed 387 403 521Turkey Grower 483 502 637 Dollars per Gallon Unleaded gas, retail 3.46 3.77 3.61Unleaded gas, bulk 3.53 3.83 3.68Diesel, bulk 3.51 3.68 3.55LP gas, bulk 1.95 2.01 1.771/Ohio, Illinois, Indiana, Iowa, Missouri.

2012 Ohio Department of Agriculture Annual Report and Sta s cs 67
TABLE 50Ohio Farm Real Estate Value, 2008-2012 Average Value Per Acre Year Farmland & Bldgs % Prev Year Cropland % Prev Year Pasture % Prev Year 2008 4,020 109 4,140 108 3,200 1182009 3,880 97 3,900 94 3,050 952010 4,000 103 4,050 104 3,000 982011 4,400 110 4,400 109 3,000 1002012 5,000 114 5,000 114 3,200 107
TABLE 51
Indexes of Prices, United States, 2011-2012 All Farm 1 Lvstk & Lvstk 1 All 1 Consumer 2 Producer 3
Products Products Crops (CPI) (Wholesale) Month 2011 2012 2011 2012 2011 2012 2011 2012 2011 2012January 166 189 137 156 189 212 220.2 226.7 192.7 200.7February 171 181 144 158 200 206 221.3 227.7 195.8 201.6March 173 184 152 160 198 211 223.5 229.4 199.2 204.2 April 176 178 156 152 200 209 224.9 230.1 203.1 203.7May 175 181 152 151 203 214 226.0 229.8 204.1 201.9June 180 183 153 152 209 215 225.7 229.5 203.9 199.8 July 181 192 155 150 207 232 225.9 229.1 204.6 200.1August 183 194 158 155 209 233 226.5 230.4 203.2 202.7September 179 195 152 156 203 227 226.9 231.4 203.7 204.4 October 184 210 154 163 203 238 226.4 231.3 201.1 203.5November 184 208 157 168 206 238 226.2 230.2 201.4 201.8December 179 199 157 166 198 226 225.7 229.6 200.2 201.5
1/ 1990 - 92 = 100. 2/ 1982 - 84 = 100. 3/ 1982 = 100.
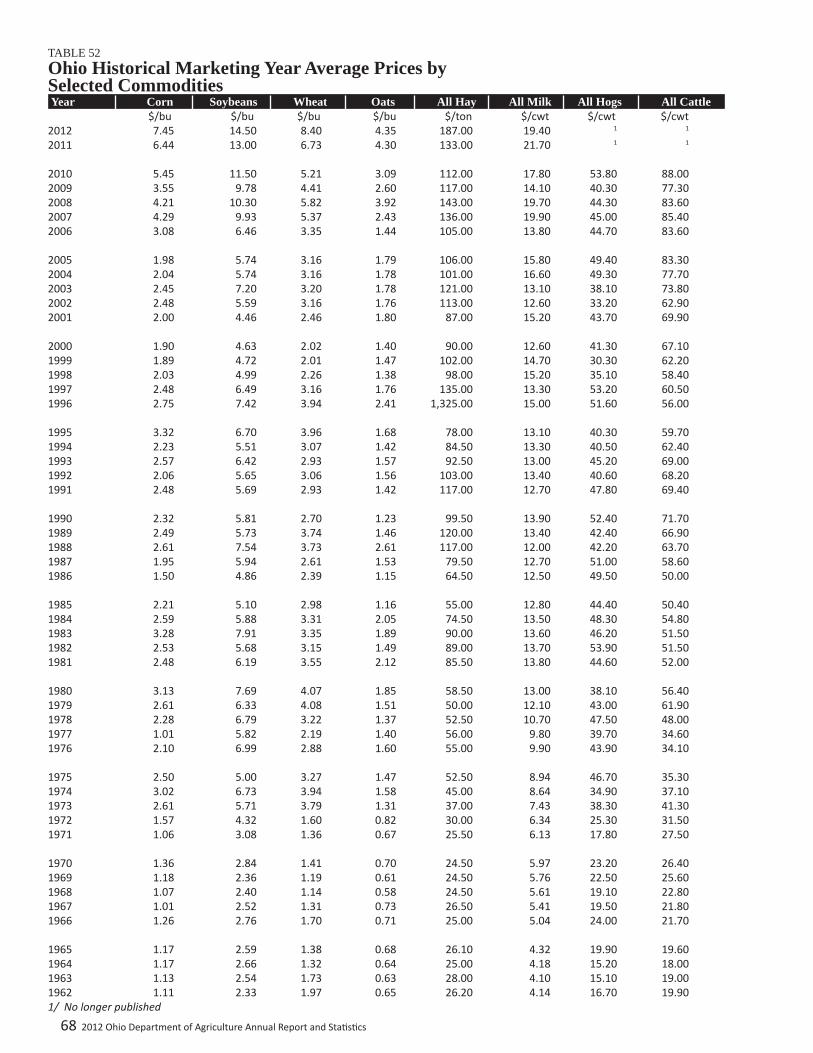
68 2012 Ohio Department of Agriculture Annual Report and Sta s cs
TABLE 52Ohio Historical Marketing Year Average Prices bySelected Commodities Year Corn Soybeans Wheat Oats All Hay All Milk All Hogs All Cattle $/bu $/bu $/bu $/bu $/ton $/cwt $/cwt $/cwt 2012 7.45 14.50 8.40 4.35 187.00 19.40 1 1
2011 6.44 13.00 6.73 4.30 133.00 21.70 1 1
2010 5.45 11.50 5.21 3.09 112.00 17.80 53.80 88.002009 3.55 9.78 4.41 2.60 117.00 14.10 40.30 77.302008 4.21 10.30 5.82 3.92 143.00 19.70 44.30 83.602007 4.29 9.93 5.37 2.43 136.00 19.90 45.00 85.402006 3.08 6.46 3.35 1.44 105.00 13.80 44.70 83.60 2005 1.98 5.74 3.16 1.79 106.00 15.80 49.40 83.302004 2.04 5.74 3.16 1.78 101.00 16.60 49.30 77.702003 2.45 7.20 3.20 1.78 121.00 13.10 38.10 73.802002 2.48 5.59 3.16 1.76 113.00 12.60 33.20 62.902001 2.00 4.46 2.46 1.80 87.00 15.20 43.70 69.90 2000 1.90 4.63 2.02 1.40 90.00 12.60 41.30 67.101999 1.89 4.72 2.01 1.47 102.00 14.70 30.30 62.201998 2.03 4.99 2.26 1.38 98.00 15.20 35.10 58.401997 2.48 6.49 3.16 1.76 135.00 13.30 53.20 60.501996 2.75 7.42 3.94 2.41 1,325.00 15.00 51.60 56.00 1995 3.32 6.70 3.96 1.68 78.00 13.10 40.30 59.701994 2.23 5.51 3.07 1.42 84.50 13.30 40.50 62.401993 2.57 6.42 2.93 1.57 92.50 13.00 45.20 69.001992 2.06 5.65 3.06 1.56 103.00 13.40 40.60 68.201991 2.48 5.69 2.93 1.42 117.00 12.70 47.80 69.40 1990 2.32 5.81 2.70 1.23 99.50 13.90 52.40 71.701989 2.49 5.73 3.74 1.46 120.00 13.40 42.40 66.901988 2.61 7.54 3.73 2.61 117.00 12.00 42.20 63.701987 1.95 5.94 2.61 1.53 79.50 12.70 51.00 58.601986 1.50 4.86 2.39 1.15 64.50 12.50 49.50 50.00 1985 2.21 5.10 2.98 1.16 55.00 12.80 44.40 50.401984 2.59 5.88 3.31 2.05 74.50 13.50 48.30 54.801983 3.28 7.91 3.35 1.89 90.00 13.60 46.20 51.501982 2.53 5.68 3.15 1.49 89.00 13.70 53.90 51.501981 2.48 6.19 3.55 2.12 85.50 13.80 44.60 52.00 1980 3.13 7.69 4.07 1.85 58.50 13.00 38.10 56.401979 2.61 6.33 4.08 1.51 50.00 12.10 43.00 61.901978 2.28 6.79 3.22 1.37 52.50 10.70 47.50 48.001977 1.01 5.82 2.19 1.40 56.00 9.80 39.70 34.601976 2.10 6.99 2.88 1.60 55.00 9.90 43.90 34.10 1975 2.50 5.00 3.27 1.47 52.50 8.94 46.70 35.301974 3.02 6.73 3.94 1.58 45.00 8.64 34.90 37.101973 2.61 5.71 3.79 1.31 37.00 7.43 38.30 41.301972 1.57 4.32 1.60 0.82 30.00 6.34 25.30 31.501971 1.06 3.08 1.36 0.67 25.50 6.13 17.80 27.50 1970 1.36 2.84 1.41 0.70 24.50 5.97 23.20 26.401969 1.18 2.36 1.19 0.61 24.50 5.76 22.50 25.601968 1.07 2.40 1.14 0.58 24.50 5.61 19.10 22.801967 1.01 2.52 1.31 0.73 26.50 5.41 19.50 21.801966 1.26 2.76 1.70 0.71 25.00 5.04 24.00 21.70 1965 1.17 2.59 1.38 0.68 26.10 4.32 19.90 19.601964 1.17 2.66 1.32 0.64 25.00 4.18 15.20 18.001963 1.13 2.54 1.73 0.63 28.00 4.10 15.10 19.001962 1.11 2.33 1.97 0.65 26.20 4.14 16.70 19.901/ No longer published
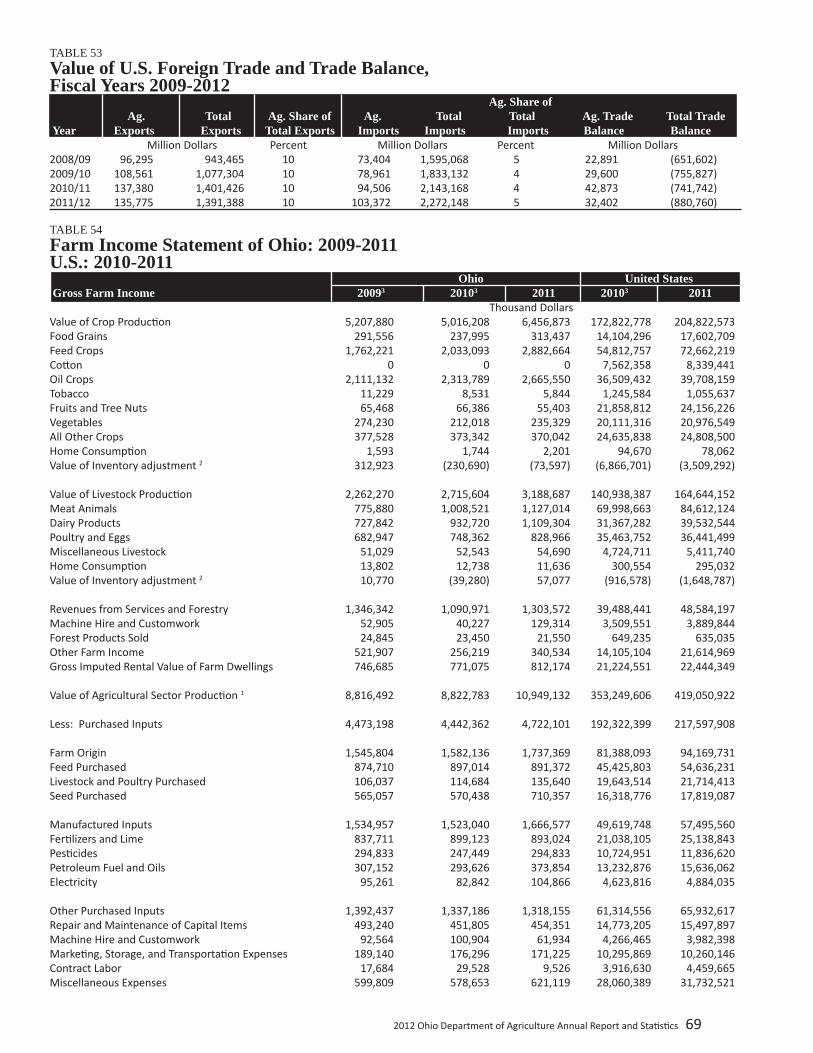
2012 Ohio Department of Agriculture Annual Report and Sta s cs 69
TABLE 53Value of U.S. Foreign Trade and Trade Balance,Fiscal Years 2009-2012 Ag. Share of Ag. Total Ag. Share of Ag. Total Total Ag. Trade Total Trade Year Exports Exports Total Exports Imports Imports Imports Balance Balance Million Dollars Percent Million Dollars Percent Million Dollars2008/09 96,295 943,465 10 73,404 1,595,068 5 22,891 (651,602)2009/10 108,561 1,077,304 10 78,961 1,833,132 4 29,600 (755,827)2010/11 137,380 1,401,426 10 94,506 2,143,168 4 42,873 (741,742)2011/12 135,775 1,391,388 10 103,372 2,272,148 5 32,402 (880,760)
TABLE 54Farm Income Statement of Ohio: 2009-2011U.S.: 2010-2011 Ohio United States Gross Farm Income 20093 20103 2011 20103 2011 Thousand DollarsValue of Crop Produc on 5,207,880 5,016,208 6,456,873 172,822,778 204,822,573 Food Grains 291,556 237,995 313,437 14,104,296 17,602,709 Feed Crops 1,762,221 2,033,093 2,882,664 54,812,757 72,662,219 Co on 0 0 0 7,562,358 8,339,441 Oil Crops 2,111,132 2,313,789 2,665,550 36,509,432 39,708,159 Tobacco 11,229 8,531 5,844 1,245,584 1,055,637 Fruits and Tree Nuts 65,468 66,386 55,403 21,858,812 24,156,226 Vegetables 274,230 212,018 235,329 20,111,316 20,976,549 All Other Crops 377,528 373,342 370,042 24,635,838 24,808,500 Home Consump on 1,593 1,744 2,201 94,670 78,062 Value of Inventory adjustment 2 312,923 (230,690) (73,597) (6,866,701) (3,509,292) Value of Livestock Produc on 2,262,270 2,715,604 3,188,687 140,938,387 164,644,152 Meat Animals 775,880 1,008,521 1,127,014 69,998,663 84,612,124 Dairy Products 727,842 932,720 1,109,304 31,367,282 39,532,544 Poultry and Eggs 682,947 748,362 828,966 35,463,752 36,441,499 Miscellaneous Livestock 51,029 52,543 54,690 4,724,711 5,411,740 Home Consump on 13,802 12,738 11,636 300,554 295,032 Value of Inventory adjustment 2 10,770 (39,280) 57,077 (916,578) (1,648,787) Revenues from Services and Forestry 1,346,342 1,090,971 1,303,572 39,488,441 48,584,197 Machine Hire and Customwork 52,905 40,227 129,314 3,509,551 3,889,844 Forest Products Sold 24,845 23,450 21,550 649,235 635,035 Other Farm Income 521,907 256,219 340,534 14,105,104 21,614,969 Gross Imputed Rental Value of Farm Dwellings 746,685 771,075 812,174 21,224,551 22,444,349 Value of Agricultural Sector Produc on 1 8,816,492 8,822,783 10,949,132 353,249,606 419,050,922 Less: Purchased Inputs 4,473,198 4,442,362 4,722,101 192,322,399 217,597,908 Farm Origin 1,545,804 1,582,136 1,737,369 81,388,093 94,169,731 Feed Purchased 874,710 897,014 891,372 45,425,803 54,636,231 Livestock and Poultry Purchased 106,037 114,684 135,640 19,643,514 21,714,413 Seed Purchased 565,057 570,438 710,357 16,318,776 17,819,087 Manufactured Inputs 1,534,957 1,523,040 1,666,577 49,619,748 57,495,560 Fer lizers and Lime 837,711 899,123 893,024 21,038,105 25,138,843 Pes cides 294,833 247,449 294,833 10,724,951 11,836,620 Petroleum Fuel and Oils 307,152 293,626 373,854 13,232,876 15,636,062 Electricity 95,261 82,842 104,866 4,623,816 4,884,035 Other Purchased Inputs 1,392,437 1,337,186 1,318,155 61,314,556 65,932,617 Repair and Maintenance of Capital Items 493,240 451,805 454,351 14,773,205 15,497,897 Machine Hire and Customwork 92,564 100,904 61,934 4,266,465 3,982,398 Marke ng, Storage, and Transporta on Expenses 189,140 176,296 171,225 10,295,869 10,260,146 Contract Labor 17,684 29,528 9,526 3,916,630 4,459,665 Miscellaneous Expenses 599,809 578,653 621,119 28,060,389 31,732,521
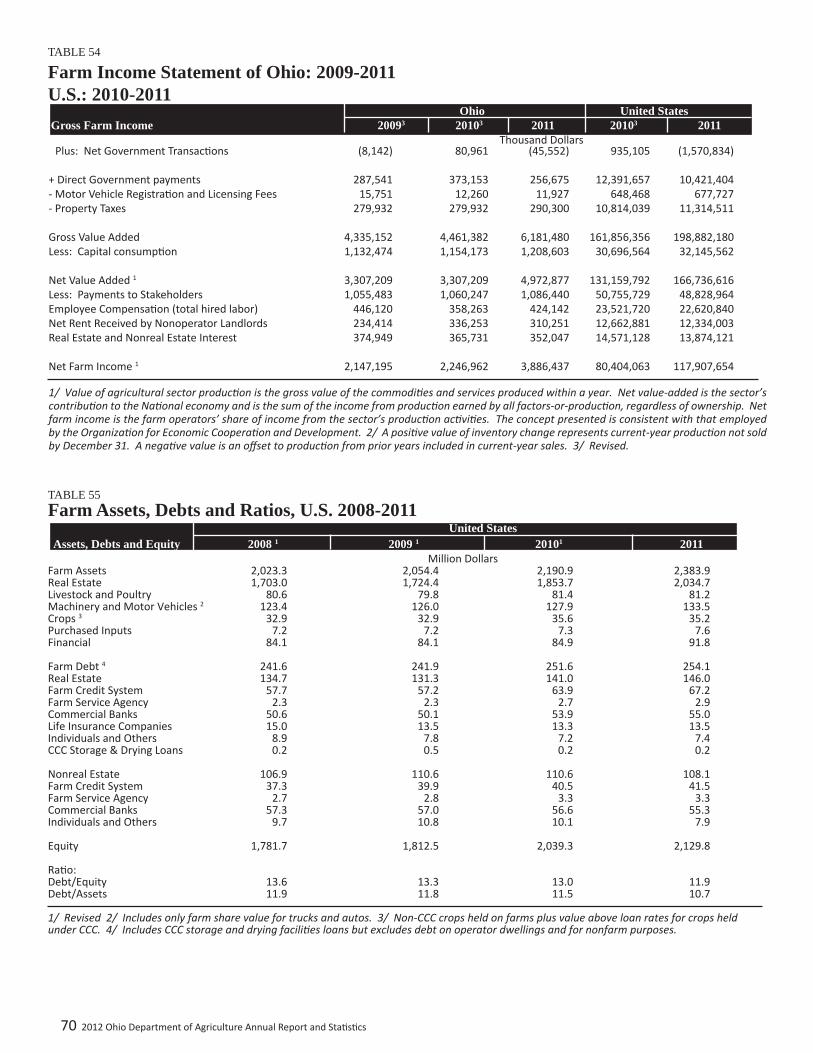
70 2012 Ohio Department of Agriculture Annual Report and Sta s cs
TABLE 54
Farm Income Statement of Ohio: 2009-2011U.S.: 2010-2011 Ohio United States Gross Farm Income 20093 20103 2011 20103 2011 Thousand Dollars
TABLE 55Farm Assets, Debts and Ratios, U.S. 2008-2011 United States Assets, Debts and Equity 2008 1 2009 1 20101 2011 Million DollarsFarm Assets 2,023.3 2,054.4 2,190.9 2,383.9 Real Estate 1,703.0 1,724.4 1,853.7 2,034.7 Livestock and Poultry 80.6 79.8 81.4 81.2 Machinery and Motor Vehicles 2 123.4 126.0 127.9 133.5 Crops 3 32.9 32.9 35.6 35.2 Purchased Inputs 7.2 7.2 7.3 7.6 Financial 84.1 84.1 84.9 91.8 Farm Debt 4 241.6 241.9 251.6 254.1 Real Estate 134.7 131.3 141.0 146.0 Farm Credit System 57.7 57.2 63.9 67.2 Farm Service Agency 2.3 2.3 2.7 2.9 Commercial Banks 50.6 50.1 53.9 55.0 Life Insurance Companies 15.0 13.5 13.3 13.5 Individuals and Others 8.9 7.8 7.2 7.4 CCC Storage & Drying Loans 0.2 0.5 0.2 0.2 Nonreal Estate 106.9 110.6 110.6 108.1 Farm Credit System 37.3 39.9 40.5 41.5 Farm Service Agency 2.7 2.8 3.3 3.3 Commercial Banks 57.3 57.0 56.6 55.3 Individuals and Others 9.7 10.8 10.1 7.9 Equity 1,781.7 1,812.5 2,039.3 2,129.8 Ra o: Debt/Equity 13.6 13.3 13.0 11.9 Debt/Assets 11.9 11.8 11.5 10.7
1/ Revised 2/ Includes only farm share value for trucks and autos. 3/ Non-CCC crops held on farms plus value above loan rates for crops held under CCC. 4/ Includes CCC storage and drying facili es loans but excludes debt on operator dwellings and for nonfarm purposes.
Plus: Net Government Transac ons (8,142) 80,961 (45,552) 935,105 (1,570,834) + Direct Government payments 287,541 373,153 256,675 12,391,657 10,421,404 - Motor Vehicle Registra on and Licensing Fees 15,751 12,260 11,927 648,468 677,727 - Property Taxes 279,932 279,932 290,300 10,814,039 11,314,511 Gross Value Added 4,335,152 4,461,382 6,181,480 161,856,356 198,882,180 Less: Capital consump on 1,132,474 1,154,173 1,208,603 30,696,564 32,145,562 Net Value Added 1 3,307,209 3,307,209 4,972,877 131,159,792 166,736,616 Less: Payments to Stakeholders 1,055,483 1,060,247 1,086,440 50,755,729 48,828,964 Employee Compensa on (total hired labor) 446,120 358,263 424,142 23,521,720 22,620,840 Net Rent Received by Nonoperator Landlords 234,414 336,253 310,251 12,662,881 12,334,003 Real Estate and Nonreal Estate Interest 374,949 365,731 352,047 14,571,128 13,874,121 Net Farm Income 1 2,147,195 2,246,962 3,886,437 80,404,063 117,907,654
1/ Value of agricultural sector produc on is the gross value of the commodi es and services produced within a year. Net value-added is the sector’s contribu on to the Na onal economy and is the sum of the income from produc on earned by all factors-or-produc on, regardless of ownership. Net farm income is the farm operators’ share of income from the sector’s produc on ac vi es. The concept presented is consistent with that employed by the Organiza on for Economic Coopera on and Development. 2/ A posi ve value of inventory change represents current-year produc on not sold by December 31. A nega ve value is an off set to produc on from prior years included in current-year sales. 3/ Revised.
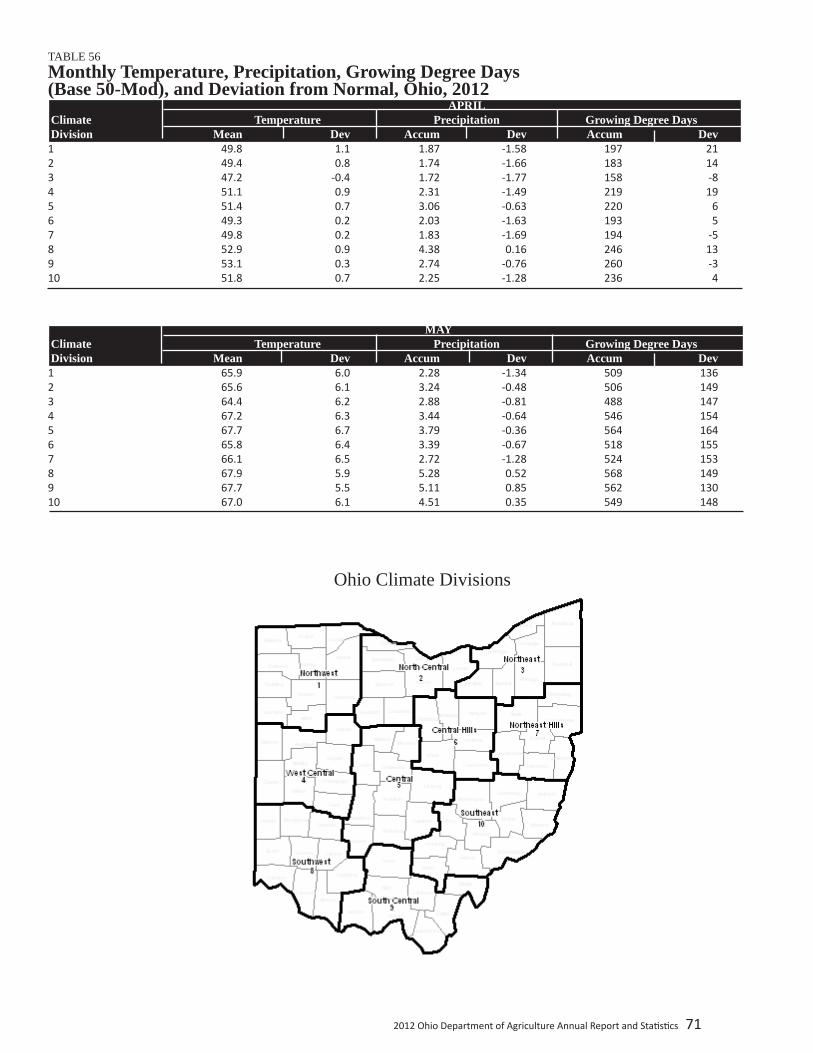
2012 Ohio Department of Agriculture Annual Report and Sta s cs 71
TABLE 56Monthly Temperature, Precipitation, Growing Degree Days(Base 50-Mod), and Deviation from Normal, Ohio, 2012 APRIL Climate Temperature Precipitation Growing Degree Days Division Mean Dev Accum Dev Accum Dev 1 49.8 1.1 1.87 -1.58 197 212 49.4 0.8 1.74 -1.66 183 143 47.2 -0.4 1.72 -1.77 158 -84 51.1 0.9 2.31 -1.49 219 195 51.4 0.7 3.06 -0.63 220 66 49.3 0.2 2.03 -1.63 193 57 49.8 0.2 1.83 -1.69 194 -58 52.9 0.9 4.38 0.16 246 139 53.1 0.3 2.74 -0.76 260 -310 51.8 0.7 2.25 -1.28 236 4
MAY Climate Temperature Precipitation Growing Degree Days Division Mean Dev Accum Dev Accum Dev 1 65.9 6.0 2.28 -1.34 509 1362 65.6 6.1 3.24 -0.48 506 1493 64.4 6.2 2.88 -0.81 488 1474 67.2 6.3 3.44 -0.64 546 1545 67.7 6.7 3.79 -0.36 564 1646 65.8 6.4 3.39 -0.67 518 1557 66.1 6.5 2.72 -1.28 524 1538 67.9 5.9 5.28 0.52 568 1499 67.7 5.5 5.11 0.85 562 13010 67.0 6.1 4.51 0.35 549 148
Ohio Climate Divisions

72 2012 Ohio Department of Agriculture Annual Report and Sta s cs
TABLE 56Monthly Temperature, Precipitation, Growing Degree Days(Base 50-Mod), and Deviation from Normal, Ohio, 2012 JUNE Climate Temperature Precipitation Growing Degree Days Division Mean Dev Accum Dev Accum Dev 1 71.6 2.3 1.82 -2.18 639 462 71.3 2.6 2.72 -1.55 639 613 69.1 2.1 2.04 -2.23 584 474 71.6 1.8 2.09 -2.40 645 345 71.6 1.8 2.88 -1.61 648 386 70.0 1.8 2.80 -1.71 609 427 69.9 1.8 2.27 -2.17 600 328 71.8 1.2 2.56 -1.78 650 179 71.1 0.7 1.97 -2.20 630 410 70.3 1.2 2.34 -2.02 613 18
JULY Climate Temperature Precipitation Growing Degree Days Division Mean Dev Accum Dev Accum Dev 1 78.3 5.3 2.74 -0.84 808 1152 77.4 4.6 3.08 -0.52 799 1113 75.4 4.4 5.08 1.12 760 1184 78.3 4.8 3.04 -0.99 816 1065 78.2 4.7 3.63 -0.57 819 1116 76.6 4.6 3.06 -0.99 781 1137 76.7 4.6 4.35 0.20 785 1158 79.2 4.7 2.80 -1.21 831 999 78.2 3.8 4.68 0.51 814 8810 77.6 4.5 3.72 -0.47 800 105
AUGUST Climate Temperature Precipitation Growing Degree Days Division Mean Dev Accum Dev Accum Dev 1 70.7 0.0 4.75 1.23 629 -72 71.0 0.3 3.80 0.11 640 33 69.5 0.0 3.91 0.24 605 24 71.5 0.0 3.03 -0.51 653 -45 72.4 0.7 2.73 -1.04 677 176 70.5 0.3 2.84 -1.03 625 27 71.3 0.8 2.81 -0.95 656 248 73.0 0.3 1.75 -2.01 694 79 73.1 0.2 1.87 -2.04 696 710 72.3 0.8 2.67 -1.28 677 19
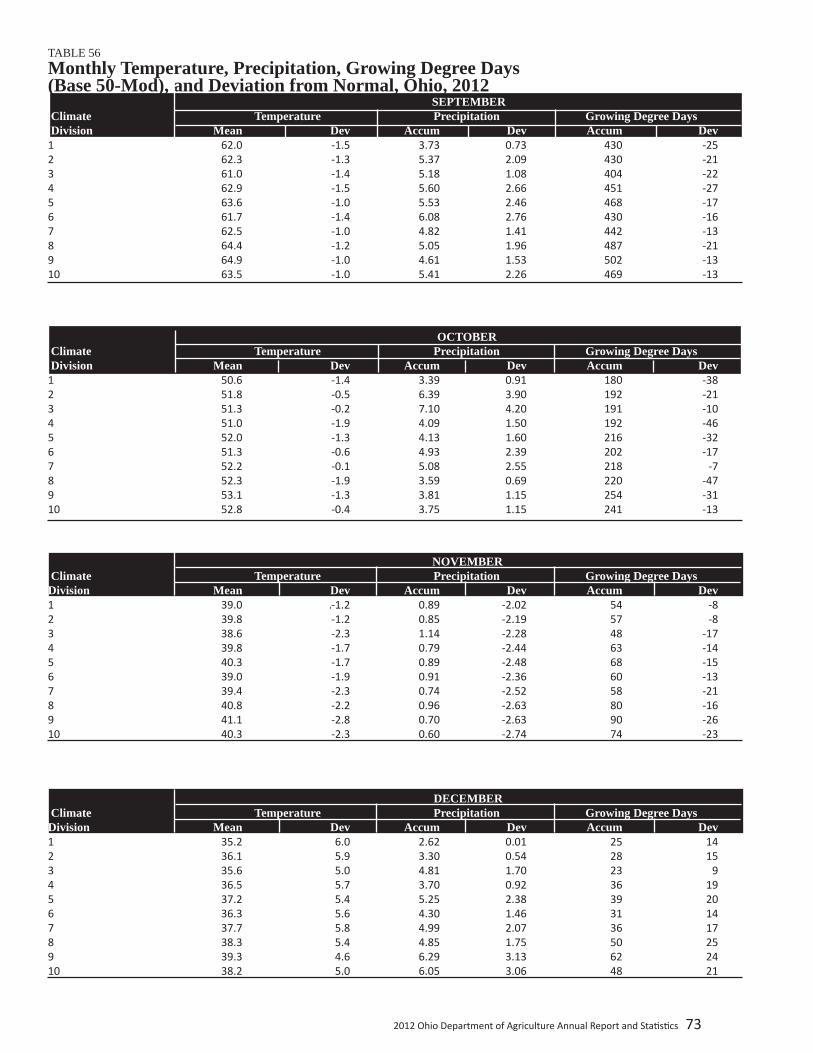
2012 Ohio Department of Agriculture Annual Report and Sta s cs 73
TABLE 56Monthly Temperature, Precipitation, Growing Degree Days(Base 50-Mod), and Deviation from Normal, Ohio, 2012 SEPTEMBER Climate Temperature Precipitation Growing Degree Days Division Mean Dev Accum Dev Accum Dev 1 62.0 -1.5 3.73 0.73 430 -252 62.3 -1.3 5.37 2.09 430 -213 61.0 -1.4 5.18 1.08 404 -224 62.9 -1.5 5.60 2.66 451 -275 63.6 -1.0 5.53 2.46 468 -176 61.7 -1.4 6.08 2.76 430 -167 62.5 -1.0 4.82 1.41 442 -138 64.4 -1.2 5.05 1.96 487 -219 64.9 -1.0 4.61 1.53 502 -1310 63.5 -1.0 5.41 2.26 469 -13
OCTOBER Climate Temperature Precipitation Growing Degree Days Division Mean Dev Accum Dev Accum Dev 1 50.6 -1.4 3.39 0.91 180 -382 51.8 -0.5 6.39 3.90 192 -213 51.3 -0.2 7.10 4.20 191 -104 51.0 -1.9 4.09 1.50 192 -465 52.0 -1.3 4.13 1.60 216 -326 51.3 -0.6 4.93 2.39 202 -177 52.2 -0.1 5.08 2.55 218 -78 52.3 -1.9 3.59 0.69 220 -479 53.1 -1.3 3.81 1.15 254 -3110 52.8 -0.4 3.75 1.15 241 -13
NOVEMBER Climate Temperature Precipitation Growing Degree DaysDivision Mean Dev Accum Dev Accum Dev 1 39.0 .-1.2 0.89 -2.02 54 -82 39.8 -1.2 0.85 -2.19 57 -83 38.6 -2.3 1.14 -2.28 48 -174 39.8 -1.7 0.79 -2.44 63 -145 40.3 -1.7 0.89 -2.48 68 -156 39.0 -1.9 0.91 -2.36 60 -137 39.4 -2.3 0.74 -2.52 58 -218 40.8 -2.2 0.96 -2.63 80 -169 41.1 -2.8 0.70 -2.63 90 -2610 40.3 -2.3 0.60 -2.74 74 -23
DECEMBER Climate Temperature Precipitation Growing Degree DaysDivision Mean Dev Accum Dev Accum Dev 1 35.2 6.0 2.62 0.01 25 142 36.1 5.9 3.30 0.54 28 153 35.6 5.0 4.81 1.70 23 94 36.5 5.7 3.70 0.92 36 195 37.2 5.4 5.25 2.38 39 206 36.3 5.6 4.30 1.46 31 147 37.7 5.8 4.99 2.07 36 178 38.3 5.4 4.85 1.75 50 259 39.3 4.6 6.29 3.13 62 2410 38.2 5.0 6.05 3.06 48 21

74 2012 Ohio Department of Agriculture Annual Report and Sta s cs
TABLE 57Last Occurrence of Critical FahrenheitTemperatures, Spring 2012 200 240 280 320 360
Stations Mo. Day Mo. Day Mo. Day Mo. Day Mo. DayAkron Canton 3 10 3 10 4 12 4 29 5 17Celina 3 10 3 10 4 11 4 27 4 29Cincinna 2 26 2 28 4 12 4 13 4 22Cleveland 3 6 3 10 4 29 4 29 4 29Columbus 2 28 3 11 4 14 4 29 5 5Coshocton 2 13 3 10 3 27 4 12 4 29Dayton 2 26 3 10 4 11 4 12 4 27Findlay 2 28 3 10 3 10 4 27 4 29Mansfi eld 2 28 3 27 4 12 4 29 4 29Marion 3 10 3 27 3 28 3 28 3 29Pandora 2 28 3 10 4 11 4 27 4 29Portsmouth 2 27 2 27 3 12 4 12 4 13Toledo 2 26 3 10 3 27 4 12 4 29Wooster 3 10 4 7 4 13 4 29 5 17Youngstown 3 27 3 30 4 29 4 29 5 17Zanesville 3 6 3 10 4 12 4 12 4 25
TABLE 58
First Occurrence of Critical FahrenheitTemperatures, Fall 2012 200 240 280 320 360
Stations Mo. Day Mo. Day Mo. Day Mo. Day Mo. DayAkron Canton 3 10 3 10 4 12 4 29 5 17Celina 3 10 3 10 4 11 4 27 4 29Cincinna 2 26 2 28 4 12 4 13 4 22Cleveland 3 6 3 10 4 29 4 29 4 29Columbus 2 28 3 11 4 14 4 29 5 5Coshocton 2 13 3 10 3 27 4 12 4 29Dayton 2 26 3 10 4 11 4 12 4 27Findlay 2 28 3 10 3 10 4 27 4 29Mansfi eld 2 28 3 27 4 12 4 29 4 29Marion 3 10 3 27 3 28 3 28 3 29Pandora 2 28 3 10 4 11 4 27 4 29Portsmouth 2 27 2 27 3 12 4 12 4 13Toledo 2 26 3 10 3 27 4 12 4 29Wooster 3 10 4 7 4 13 4 29 5 17Youngstown 3 27 3 30 4 29 4 29 5 17Zanesville 3 6 3 10 4 12 4 12 4 25

2012 Ohio Department of Agriculture Annual Report and Sta s cs 75
TABLE 59Corn Development by Selected Dates,Ohio, 2011-2012 and 2008-2012 Average Planted Silked Dent Date 2011 2012 Average 2011 2012 Average 2011 2012 Average Percent Percent PercentApril 10 0 4 0 15 0 10 1 20 0 27 5 25 1 44 13 30 1 60 22 May 5 1 73 31 10 3 82 46 15 7 90 53 20 10 96 60 25 14 100 69 30 25 100 80 June 5 58 100 90 10 89 100 98 15 100 100 100 20 25 0 0 0 30 0 0 1 July 5 0 26 6 10 1 48 16 15 5 67 29 20 17 78 47 25 34 87 63 30 47 94 75 0 2 0Aug. 5 76 98 89 1 10 210 89 99 96 2 19 615 96 100 99 4 32 1320 100 100 100 8 47 2225 16 57 3430 26 66 47Sept. 5 40 79 6010 53 89 7115 62 94 8020 71 100 8825 84 100 9330 87 100 95Oct. 5 91 100 9710 96 100 9915 100 100 100April 11 73 129 112 35 79 137 121 40 86 145 130 45 93 153 138 50 100 161 147 May 6 106 168 156 35 113 176 164 40 120 184 173 45 126 192 182 50 133 200 190
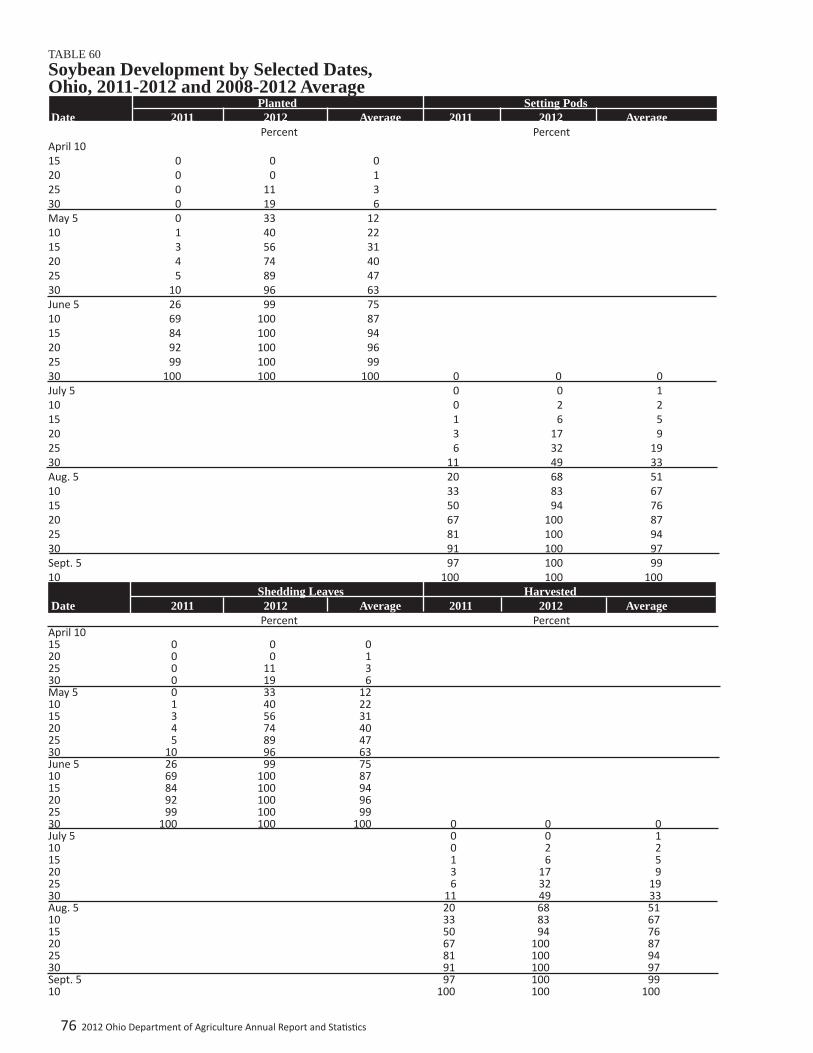
76 2012 Ohio Department of Agriculture Annual Report and Sta s cs
TABLE 60Soybean Development by Selected Dates,Ohio, 2011-2012 and 2008-2012 Average Planted Setting Pods Date 2011 2012 Average 2011 2012 Average Percent PercentApril 10 15 0 0 0 20 0 0 1 25 0 11 3 30 0 19 6 May 5 0 33 12 10 1 40 22 15 3 56 31 20 4 74 40 25 5 89 47 30 10 96 63 June 5 26 99 75 10 69 100 87 15 84 100 94 20 92 100 96 25 99 100 99 30 100 100 100 0 0 0July 5 0 0 110 0 2 215 1 6 520 3 17 925 6 32 1930 11 49 33Aug. 5 20 68 5110 33 83 6715 50 94 7620 67 100 8725 81 100 9430 91 100 97Sept. 5 97 100 9910 100 100 100 Shedding Leaves Harvested Date 2011 2012 Average 2011 2012 Average Percent PercentApril 10 15 0 0 0 20 0 0 1 25 0 11 3 30 0 19 6 May 5 0 33 12 10 1 40 22 15 3 56 31 20 4 74 40 25 5 89 47 30 10 96 63 June 5 26 99 75 10 69 100 87 15 84 100 94 20 92 100 96 25 99 100 99 30 100 100 100 0 0 0July 5 0 0 110 0 2 215 1 6 520 3 17 925 6 32 1930 11 49 33Aug. 5 20 68 5110 33 83 6715 50 94 7620 67 100 8725 81 100 9430 91 100 97Sept. 5 97 100 9910 100 100 100
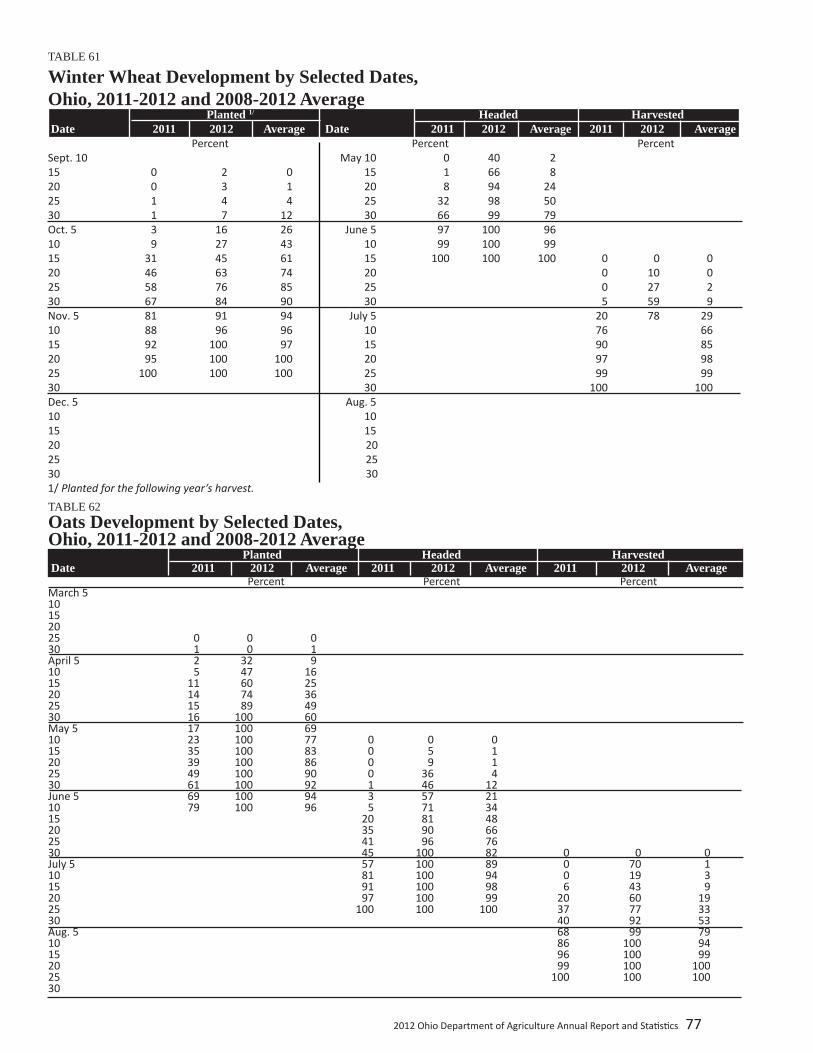
2012 Ohio Department of Agriculture Annual Report and Sta s cs 77
TABLE 61
Winter Wheat Development by Selected Dates,Ohio, 2011-2012 and 2008-2012 Average Planted 1/ Headed Harvested Date 2011 2012 Average Date 2011 2012 Average 2011 2012 Average Percent Percent PercentSept. 10 May 10 0 40 2 15 0 2 0 15 1 66 8 20 0 3 1 20 8 94 24 25 1 4 4 25 32 98 50 30 1 7 12 30 66 99 79 Oct. 5 3 16 26 June 5 97 100 96 10 9 27 43 10 99 100 99 15 31 45 61 15 100 100 100 0 0 020 46 63 74 20 0 10 025 58 76 85 25 0 27 230 67 84 90 30 5 59 9Nov. 5 81 91 94 July 5 20 78 2910 88 96 96 10 76 6615 92 100 97 15 90 8520 95 100 100 20 97 9825 100 100 100 25 99 9930 30 100 100Dec. 5 Aug. 5 10 10 15 15 20 20 25 25 30 30 1/ Planted for the following year’s harvest.TABLE 62Oats Development by Selected Dates,Ohio, 2011-2012 and 2008-2012 Average Planted Headed Harvested Date 2011 2012 Average 2011 2012 Average 2011 2012 Average Percent Percent PercentMarch 5 10 15 20 25 0 0 0 30 1 0 1 April 5 2 32 9 10 5 47 16 15 11 60 25 20 14 74 36 25 15 89 49 30 16 100 60 May 5 17 100 69 10 23 100 77 0 0 0 15 35 100 83 0 5 1 20 39 100 86 0 9 1 25 49 100 90 0 36 4 30 61 100 92 1 46 12 June 5 69 100 94 3 57 21 10 79 100 96 5 71 34 15 20 81 48 20 35 90 66 25 41 96 76 30 45 100 82 0 0 0July 5 57 100 89 0 70 110 81 100 94 0 19 315 91 100 98 6 43 920 97 100 99 20 60 1925 100 100 100 37 77 3330 40 92 53Aug. 5 68 99 7910 86 100 9415 96 100 9920 99 100 10025 100 100 10030

78 2012 Ohio Department of Agriculture Annual Report and Sta s cs
TABLE 64Alfalfa Hay Harvested by Selected Dates,Ohio, 2011-2012 and 2008-2012 Average First Cutting Second Cutting Third Cutting Date 2011 2012 Average 2011 2012 Average 2011 2012 Average Percent Percent PercentMay 5 0 0 0 10 1 8 2 15 2 20 4 20 3 39 10 25 3 65 20 30 10 81 39 June 5 41 93 57 0 0 0 10 64 98 71 0 6 1 15 82 100 83 1 18 4 20 92 100 90 3 35 9 25 94 100 93 5 53 16 30 97 100 96 16 66 26 July 5 100 100 100 30 74 41 10 46 81 56 15 56 88 69 20 69 89 80 4 8 825 82 85 10 34 1630 89 90 13 55 24Aug. 5 94 96 23 66 3810 99 100 39 70 5115 100 100 59 73 6320 69 79 7125 77 83 7930 83 90 85Sept. 5 89 95 9010 91 100 9315 92 100 9520 93 100 9625 95 100 9830 98 100 99Oct. 5 100 100 100
TABLE 63Other Hay Harvested by Selected Dates,Ohio, 2011-2012 and 2008-2012 Average First Cutting Second Cutting Third Cutting Date 2011 2012 Average 2011 2012 Average 2011 2012 Average Percent Percent PercentMay 5 0 0 0 10 1 4 1 15 2 12 3 20 2 25 6 25 3 50 15 30 8 65 31 June 5 31 79 44 10 44 88 54 0 2 0 15 60 67 0 17 1 20 71 78 0 28 4 25 75 83 2 36 7 30 82 88 5 43 13 July 5 89 92 9 54 19 10 95 97 17 60 29 15 100 99 33 71 41 0 0 020 100 100 48 73 54 0 0 125 60 76 62 0 0 430 63 79 70 3 3 8Aug. 5 75 86 78 7 21 1210 82 87 83 12 24 1615 86 87 86 16 27 2120 88 90 90 24 32 2725 91 93 93 27 44 3430 94 96 97 32 58 48Sept. 5 98 100 99 44 70 5810 100 100 100 62 77 6415 70 84 7020 74 88 7825 75 91 8330 76 92 86Oct. 5 78 99 9110 80 100 9315 84 100 9620 86 100 9825 88 100 9930 92 100 99Nov. 5 95 100 100

2012 Ohio Department of Agriculture Annual Report and Sta s cs 79
TABLE 65Days Suitable for Fieldwork in Ohio,2011-2012 and 2008-2012 Average 2011 2012 Average Date 7-Day Cumulative 7-Day Cumulative 7-Day Cumulative Number of daysMarch 31 2.4 2.4 3.1 3.1 2.0 2.0April 7 1.0 3.4 4.8 7.9 2.2 4.214 1.3 4.7 5.9 13.8 2.5 6.721 0.4 5.1 6.0 19.8 3.0 9.728 0.1 5.2 5.0 24.8 2.8 12.6May 5 0.3 5.5 3.6 28.4 2.4 14.912 2.3 7.8 2.7 31.1 2.8 17.719 0.6 8.4 5.5 36.6 2.9 20.626 1.2 9.6 6.4 43.0 4.5 25.1June 2 4.6 14.2 5.8 48.8 3.9 29.09 5.5 19.7 6.3 55.1 4.1 33.116 5.4 25.1 6.6 61.7 4.7 37.823 3.2 28.3 6.2 67.9 4.4 42.330 6.0 34.3 7.0 74.9 5.0 47.3July 7 6.2 40.5 6.1 81.0 5.8 53.114 5.6 46.1 6.8 87.8 5.8 58.821 6.0 52.1 5.8 93.6 5.4 64.228 5.6 57.7 5.6 99.2 5.3 69.5Aug. 4 5.7 63.4 6.7 105.9 5.7 75.311 5.3 68.7 5.5 111.4 5.6 80.918 6.3 75.0 5.8 117.2 5.9 86.825 4.7 79.7 6.5 123.7 5.1 92.0Sept. 1 6.2 85.9 6.2 129.9 6.4 98.38 2.3 88.2 5.2 135.1 5.4 103.715 3.7 91.9 5.9 141.0 5.5 109.222 2.5 94.4 5.6 146.6 5.5 114.729 1.8 96.2 3.9 150.5 4.3 119.1Oct. 6 3.7 99.9 4.4 154.9 4.6 123.713 4.6 104.5 5.3 160.2 5.0 128.620 2.6 107.1 5.1 165.3 5.0 133.727 2.1 109.2 5.3 170.6 4.0 137.7Nov. 3 4.3 113.5 1.5 172.1 5.6 143.310 4.8 118.3 5.1 177.2 5.8 149.117 3.1 121.4 4.4 181.6 4.0 153.124 1.9 123.3 6.0 187.6 3.3 146.2Dec. 1 1.4 124.7 1.4 147.68 1.0 125.7 15 22 29

80 2012 Ohio Department of Agriculture Annual Report and Sta s cs
2009 2009 2009 2009
TABLE 66Nursery Crops: Producers, Quantity Sold, and Sales, Ohio, 2009
Number 1,000 Plants 1,000 Dollars Percent
Percent of Sales Producers Quantity Sold Gross Sales at wholesale
Broadleaf Evergreens 133 1,354 17,030 92Coniferous Evergreens 212 971 24,860 84Deciduous Shade Trees 128 218 16,575 88Deciduous Flowering Trees 141 1 13,987 92Deciduous Shrubs 162 1,583 18,882 90Fruit and Nut Plants 56 169 241 36Ornamental Grasses 113 590 3,261 82Other Woody Ornamentals and Vines 72 1,135 1,502 86Christmas Trees, Cut and to be Cut 83 70 2,575 13Propaga on Material or Lining-out Stock 54 50,646 25,238 1
1/ Not published to avoid disclosing data for individual opera ons.
Percent of Plants Sold Trees and Plants on Hand
Bare Root Balled & Burlap Container Jan. 1 Jan.1 2009 2009 2009 2007 2010
Percent Percent Percent 1,000 Plants 1,000 PlantsBroadleaf Evergreens 1 30 1 6,432 3,448Coniferous Evergreens 1 65 1 7,104 4,603Deciduous Shade Trees 1 69 1 1,342 717Deciduous Flowering Trees 1 57 1 587 685Deciduous Shrubs 1 15 1 7,362 3,029Fruit and Nut Plants 1 1 78 - 36Ornamental Grasses 1 1 1 421 437Other Woody Ornamentals and Vines 1 1 1 792 1
Christmas Trees, Cut and to be Cut - - - 742 1,1791/ Not published to avoid disclosing data for individual opera ons.
TABLE 67Nursery Crops: Percent of Sales by Category, 2009, and Inventory, January 1, 2007 and 2010, Ohio

2012 Ohio Department of Agriculture Annual Report and Sta s cs 81
TABLE 68
Nursery Crops: Operations by Gross Value of Sales, Ohio, 2009 Operations 2009
$10,000-$99,999 436$100,000-$249,999 144$250,000-$499,999 89$500,000-$999,999 62$1,000,000-$2,499,999 32$2,500,000 or more 21Total 784
TABLE 69
Nursery Crops: Number of Hired Workers, Ohio, 2009 Hired Hired
2009
Hired Workers 9,228Hired 150 days or more 4,591Hired 149 days or less 4,637

82 2012 Ohio Department of Agriculture Annual Report and Sta s cs
TABLE 70
Commercial Floriculture Production and Value, Ohio, 2011-2012 Quantity Sold Value of Sales at Total Units Percent of Sales Wholesale Price Wholesale Crop Unit (1,000 Units) at Wholesale (Dollars) ($1,000) 1
2011 2012 2011 2012 2011 2012 2011 2012
Cut Flowers Alstroemeria Stems * * * * * * * *Carna ons, Standard Blooms - - - - - - - -Pompon, Chrysanthemums Bunches - - - - - - - -Delphinium and Larkspur Stems - * - * - * - *Gerbera Daisy Stems - * - * - * - *Gladioli Spikes * * * * * * * *Iris Stems * * * * * * * *Lilies, All Stems * * * * * * * *Lisianthus Stems * * * * * * * *Orchids Blooms - - - - - - - -Roses, All Stems - - - - - - - -Snapdragons Spikes * * * * * * * *Tulips Stems * * * * * * * *All Other Cut Flowers - - * * - - * * Po ed Flowering Plants for Indoor or Pa o Use African Violets Pots 26 91 98 45 2.31 2.29 60 208Azaleas, Finished Florist Pots 12 9 91 89 8.67 10.11 104 91Chrysanthemums, Florist Pots 163 160 63 73 3.38 3.52 551 563Lilies, Easter Pots 506 538 98 98 4.17 4.13 2,110 2,222Orchids Pots 2100 * 100 * 9.52 * 19,992 *Poinse a Pots 3,568 3,266 95 94 3.63 4.25 12,961 13,866Roses, Florist Pots 4 * 24 * 10.25 * 41 *Spring Flowering Bulbs Pots 230 221 89 89 3.85 4.22 886 932All Other Flowering Pots 523 487 53 44 3.58 3.58 1,870 1,742Foliage Pots - - 49 71 - - 1,137 3,998 Herbaceous Perennials Hardy/Garden Mums Pots 4,040 3,815 77 78 2.91 2.97 11,775 11,323Hosta Pots 537 508 83 86 3.32 3.71 1,781 1,883All Other Herb. Per. Pots 9,192 11,887 91 92 2.96 2.95 27,232 35,079 Bedding/Garden Hanging Baskets Begonia Baskets 114 154 66 73 7.76 7.87 885 1212Geraniums Vege. Cu ng Baskets 312 289 76 77 7.92 8.61 2,471 2,488Seed Baskets 104 104 96 96 7.2 7.09 749 737Impa ens Baskets 226 204 84 77 7.53 7.69 1,702 1,569Marigold Baskets * * * * * * * *New Guinea Impa ens Baskets 241 257 85 86 7.37 7.44 1,776 1,912Pansy/Viola Baskets 43 61 90 93 7.22 6.71 310 409Petunias Baskets 568 554 76 76 8.09 8.19 4,595 4,537All Other Flowering Baskets 1,384 1,412 87 88 7.59 7.65 10,505 10,802Foliage Baskets 310 291 47 47 7.46 7.32 2,313 2,130 Bedding/Garden Flats Begonia Flats 285 277 82 85 8.48 7.68 2,417 2,127Geraniums Vege. Cu ng Flats 16 41 54 21 13.76 12.12 220 497Seed Flats 57 50 64 60 10.95 11.85 624 593Impa ens Flats 684 778 79 82 7.79 7.71 5,328 5,998Marigold Flats 198 320 75 86 8.54 6.63 1,691 2,122New Guinea Impa ens Flats 5 6 39 48 14.49 10.65 72 64Pansy/Viola Flats 246 406 89 93 7.71 6.28 1,897 2,550Petunias Flats 754 763 89 89 6.63 6.57 4,999 5,013All Other Flowering Flats 1,149 1,249 77 79 7.6 7.75 8,732 9,680Vegetable type 2 Flats 426 477 65 73 8.42 7.78 3,587 3,711Bedding/Garden Po ed Plants 3
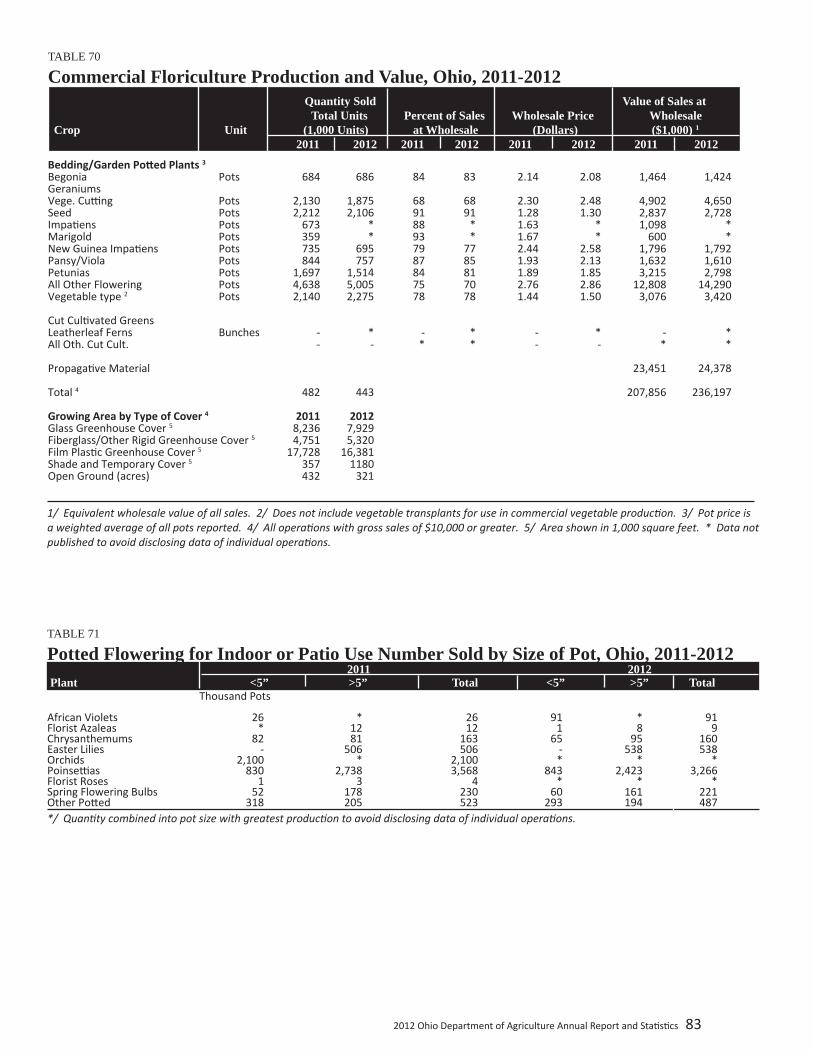
2012 Ohio Department of Agriculture Annual Report and Sta s cs 83
TABLE 70
Commercial Floriculture Production and Value, Ohio, 2011-2012 Quantity Sold Value of Sales at Total Units Percent of Sales Wholesale Price Wholesale Crop Unit (1,000 Units) at Wholesale (Dollars) ($1,000) 1
2011 2012 2011 2012 2011 2012 2011 2012
TABLE 71
Potted Flowering for Indoor or Patio Use Number Sold by Size of Pot, Ohio, 2011-2012 2011 2012 Plant <5” >5” Total <5” >5” Total Thousand Pots
African Violets 26 * 26 91 * 91Florist Azaleas * 12 12 1 8 9Chrysanthemums 82 81 163 65 95 160Easter Lilies - 506 506 - 538 538Orchids 2,100 * 2,100 * * *Poinse as 830 2,738 3,568 843 2,423 3,266Florist Roses 1 3 4 * * *Spring Flowering Bulbs 52 178 230 60 161 221Other Po ed 318 205 523 293 194 487*/ Quan ty combined into pot size with greatest produc on to avoid disclosing data of individual opera ons.
1/ Equivalent wholesale value of all sales. 2/ Does not include vegetable transplants for use in commercial vegetable produc on. 3/ Pot price is a weighted average of all pots reported. 4/ All opera ons with gross sales of $10,000 or greater. 5/ Area shown in 1,000 square feet. * Data not published to avoid disclosing data of individual opera ons.
Bedding/Garden Po ed Plants 3 Begonia Pots 684 686 84 83 2.14 2.08 1,464 1,424Geraniums Vege. Cu ng Pots 2,130 1,875 68 68 2.30 2.48 4,902 4,650Seed Pots 2,212 2,106 91 91 1.28 1.30 2,837 2,728Impa ens Pots 673 * 88 * 1.63 * 1,098 *Marigold Pots 359 * 93 * 1.67 * 600 *New Guinea Impa ens Pots 735 695 79 77 2.44 2.58 1,796 1,792Pansy/Viola Pots 844 757 87 85 1.93 2.13 1,632 1,610Petunias Pots 1,697 1,514 84 81 1.89 1.85 3,215 2,798All Other Flowering Pots 4,638 5,005 75 70 2.76 2.86 12,808 14,290Vegetable type 2 Pots 2,140 2,275 78 78 1.44 1.50 3,076 3,420 Cut Cul vated Greens Leatherleaf Ferns Bunches - * - * - * - *All Oth. Cut Cult. - - * * - - * * Propaga ve Material 23,451 24,378 Total 4 482 443 207,856 236,197 Growing Area by Type of Cover 4 2011 2012 Glass Greenhouse Cover 5 8,236 7,929 Fiberglass/Other Rigid Greenhouse Cover 5 4,751 5,320 Film Plas c Greenhouse Cover 5 17,728 16,381 Shade and Temporary Cover 5 357 1180 Open Ground (acres) 432 321
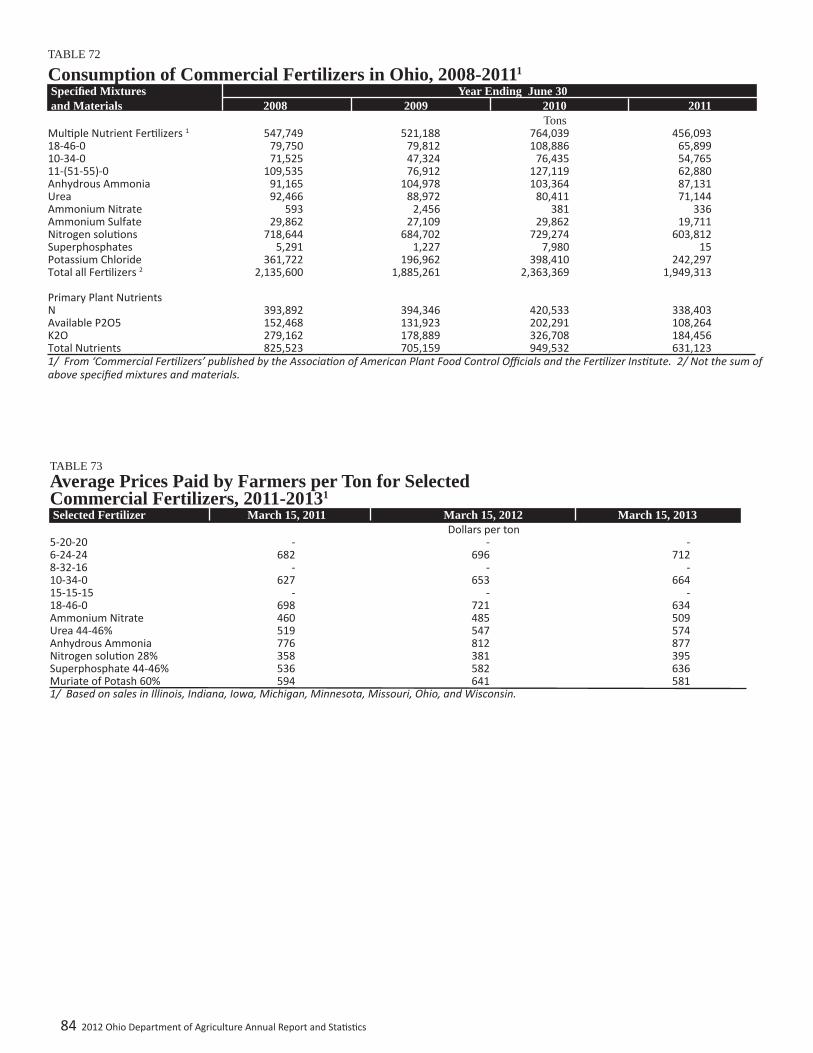
84 2012 Ohio Department of Agriculture Annual Report and Sta s cs
TABLE 73Average Prices Paid by Farmers per Ton for SelectedCommercial Fertilizers, 2011-20131
Selected Fertilizer March 15, 2011 March 15, 2012 March 15, 2013 Dollars per ton5-20-20 - - -6-24-24 682 696 7128-32-16 - - -10-34-0 627 653 66415-15-15 - - -18-46-0 698 721 634Ammonium Nitrate 460 485 509Urea 44-46% 519 547 574Anhydrous Ammonia 776 812 877Nitrogen solu on 28% 358 381 395Superphosphate 44-46% 536 582 636Muriate of Potash 60% 594 641 5811/ Based on sales in Illinois, Indiana, Iowa, Michigan, Minnesota, Missouri, Ohio, and Wisconsin.
TABLE 72
Consumption of Commercial Fertilizers in Ohio, 2008-20111
Specifi ed Mixtures Year Ending June 30 and Materials 2008 2009 2010 2011 TonsMul ple Nutrient Fer lizers 1 547,749 521,188 764,039 456,09318-46-0 79,750 79,812 108,886 65,89910-34-0 71,525 47,324 76,435 54,76511-(51-55)-0 109,535 76,912 127,119 62,880Anhydrous Ammonia 91,165 104,978 103,364 87,131Urea 92,466 88,972 80,411 71,144Ammonium Nitrate 593 2,456 381 336Ammonium Sulfate 29,862 27,109 29,862 19,711Nitrogen solu ons 718,644 684,702 729,274 603,812Superphosphates 5,291 1,227 7,980 15Potassium Chloride 361,722 196,962 398,410 242,297Total all Fer lizers 2 2,135,600 1,885,261 2,363,369 1,949,313 Primary Plant Nutrients N 393,892 394,346 420,533 338,403Available P2O5 152,468 131,923 202,291 108,264K2O 279,162 178,889 326,708 184,456Total Nutrients 825,523 705,159 949,532 631,1231/ From ‘Commercial Fer lizers’ published by the Associa on of American Plant Food Control Offi cials and the Fer lizer Ins tute. 2/ Not the sum of above specifi ed mixtures and materials.
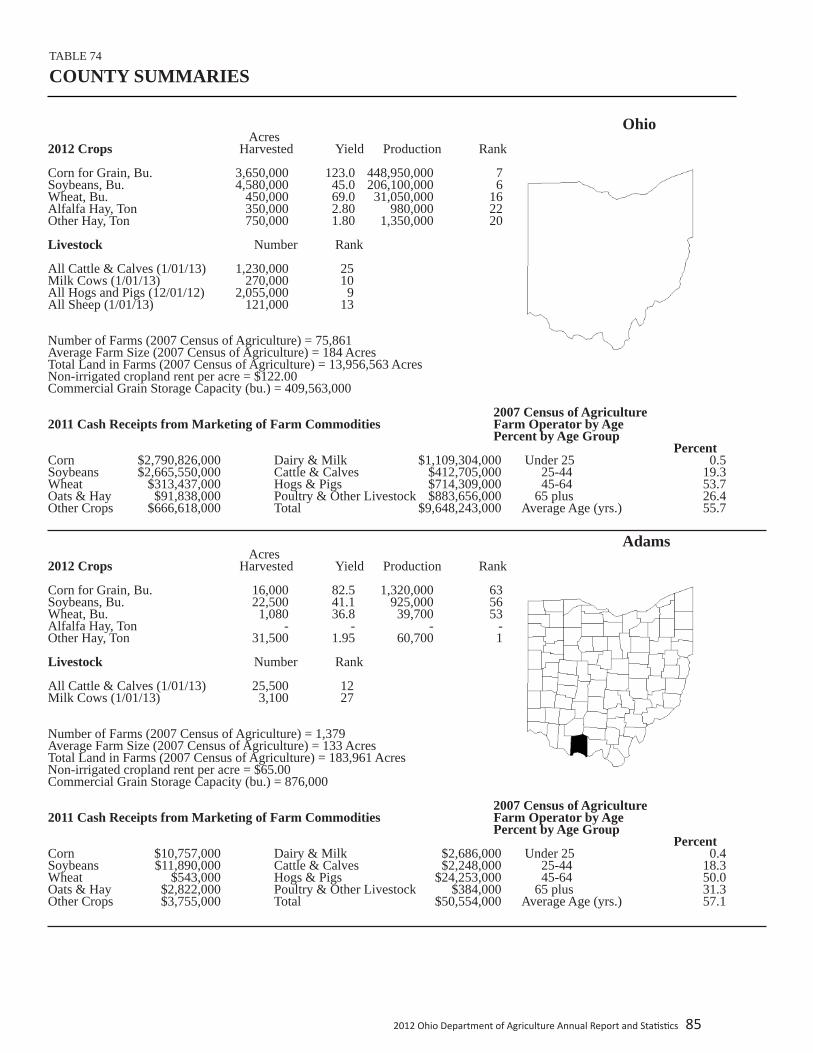
2012 Ohio Department of Agriculture Annual Report and Sta s cs 85
Ohio Acres2012 Crops Harvested Yield Production Rank
Corn for Grain, Bu. 3,650,000 123.0 448,950,000 7Soybeans, Bu. 4,580,000 45.0 206,100,000 6Wheat, Bu. 450,000 69.0 31,050,000 16Alfalfa Hay, Ton 350,000 2.80 980,000 22Other Hay, Ton 750,000 1.80 1,350,000 20
Livestock Number Rank
All Cattle & Calves (1/01/13) 1,230,000 25Milk Cows (1/01/13) 270,000 10All Hogs and Pigs (12/01/12) 2,055,000 9All Sheep (1/01/13) 121,000 13
Number of Farms (2007 Census of Agriculture) = 75,861Average Farm Size (2007 Census of Agriculture) = 184 AcresTotal Land in Farms (2007 Census of Agriculture) = 13,956,563 Acres Non-irrigated cropland rent per acre = $122.00Commercial Grain Storage Capacity (bu.) = 409,563,000 2007 Census of Agriculture2011 Cash Receipts from Marketing of Farm Commodities Farm Operator by Age Percent by Age Group PercentCorn $2,790,826,000 Dairy & Milk $1,109,304,000 Under 25 0.5Soybeans $2,665,550,000 Cattle & Calves $412,705,000 25-44 19.3Wheat $313,437,000 Hogs & Pigs $714,309,000 45-64 53.7Oats & Hay $91,838,000 Poultry & Other Livestock $883,656,000 65 plus 26.4Other Crops $666,618,000 Total $9,648,243,000 Average Age (yrs.) 55.7
Adams Acres2012 Crops Harvested Yield Production Rank
Corn for Grain, Bu. 16,000 82.5 1,320,000 63Soybeans, Bu. 22,500 41.1 925,000 56Wheat, Bu. 1,080 36.8 39,700 53Alfalfa Hay, Ton - - - -Other Hay, Ton 31,500 1.95 60,700 1
Livestock Number Rank
All Cattle & Calves (1/01/13) 25,500 12Milk Cows (1/01/13) 3,100 27
Number of Farms (2007 Census of Agriculture) = 1,379Average Farm Size (2007 Census of Agriculture) = 133 AcresTotal Land in Farms (2007 Census of Agriculture) = 183,961 Acres Non-irrigated cropland rent per acre = $65.00Commercial Grain Storage Capacity (bu.) = 876,000 2007 Census of Agriculture2011 Cash Receipts from Marketing of Farm Commodities Farm Operator by Age Percent by Age Group PercentCorn $10,757,000 Dairy & Milk $2,686,000 Under 25 0.4Soybeans $11,890,000 Cattle & Calves $2,248,000 25-44 18.3Wheat $543,000 Hogs & Pigs $24,253,000 45-64 50.0Oats & Hay $2,822,000 Poultry & Other Livestock $384,000 65 plus 31.3Other Crops $3,755,000 Total $50,554,000 Average Age (yrs.) 57.1
TABLE 74
COUNTY SUMMARIES
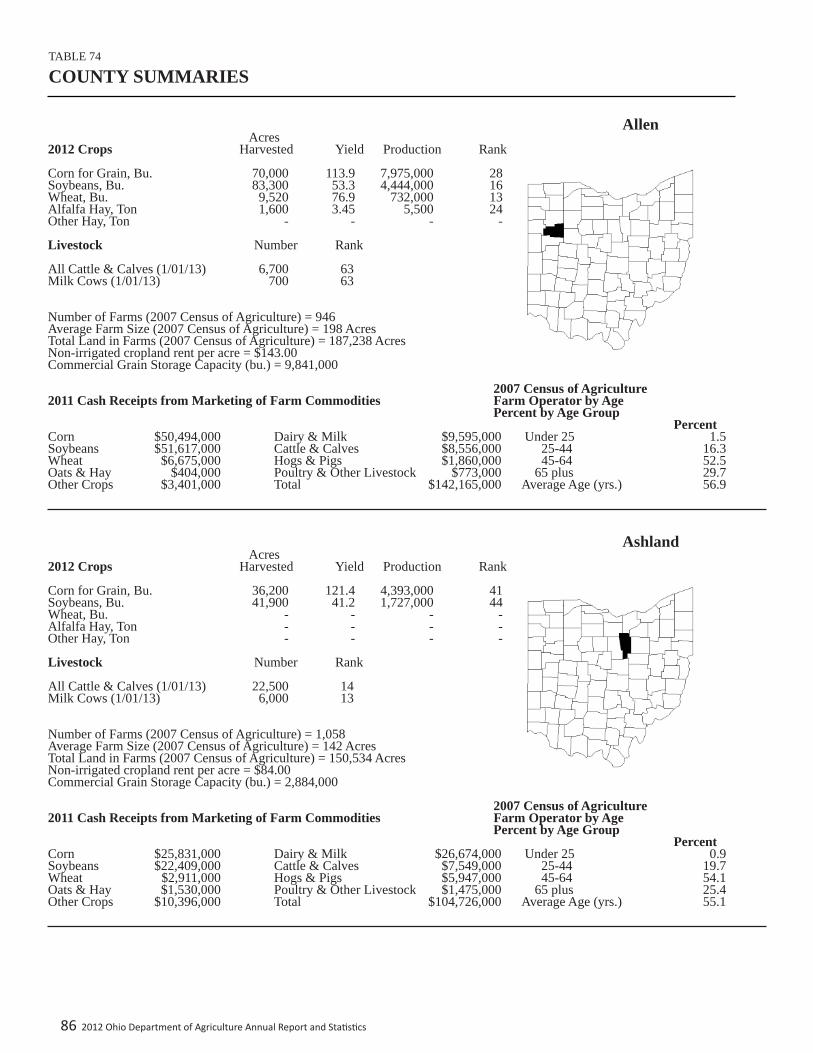
86 2012 Ohio Department of Agriculture Annual Report and Sta s cs
Allen Acres2012 Crops Harvested Yield Production Rank
Corn for Grain, Bu. 70,000 113.9 7,975,000 28Soybeans, Bu. 83,300 53.3 4,444,000 16Wheat, Bu. 9,520 76.9 732,000 13Alfalfa Hay, Ton 1,600 3.45 5,500 24Other Hay, Ton - - - -
Livestock Number Rank
All Cattle & Calves (1/01/13) 6,700 63Milk Cows (1/01/13) 700 63
Number of Farms (2007 Census of Agriculture) = 946Average Farm Size (2007 Census of Agriculture) = 198 AcresTotal Land in Farms (2007 Census of Agriculture) = 187,238 Acres Non-irrigated cropland rent per acre = $143.00Commercial Grain Storage Capacity (bu.) = 9,841,000 2007 Census of Agriculture2011 Cash Receipts from Marketing of Farm Commodities Farm Operator by Age Percent by Age Group PercentCorn $50,494,000 Dairy & Milk $9,595,000 Under 25 1.5Soybeans $51,617,000 Cattle & Calves $8,556,000 25-44 16.3Wheat $6,675,000 Hogs & Pigs $1,860,000 45-64 52.5Oats & Hay $404,000 Poultry & Other Livestock $773,000 65 plus 29.7Other Crops $3,401,000 Total $142,165,000 Average Age (yrs.) 56.9
Ashland Acres2012 Crops Harvested Yield Production Rank
Corn for Grain, Bu. 36,200 121.4 4,393,000 41Soybeans, Bu. 41,900 41.2 1,727,000 44Wheat, Bu. - - - -Alfalfa Hay, Ton - - - -Other Hay, Ton - - - -
Livestock Number Rank
All Cattle & Calves (1/01/13) 22,500 14Milk Cows (1/01/13) 6,000 13
Number of Farms (2007 Census of Agriculture) = 1,058Average Farm Size (2007 Census of Agriculture) = 142 AcresTotal Land in Farms (2007 Census of Agriculture) = 150,534 Acres Non-irrigated cropland rent per acre = $84.00Commercial Grain Storage Capacity (bu.) = 2,884,000 2007 Census of Agriculture2011 Cash Receipts from Marketing of Farm Commodities Farm Operator by Age Percent by Age Group PercentCorn $25,831,000 Dairy & Milk $26,674,000 Under 25 0.9Soybeans $22,409,000 Cattle & Calves $7,549,000 25-44 19.7Wheat $2,911,000 Hogs & Pigs $5,947,000 45-64 54.1Oats & Hay $1,530,000 Poultry & Other Livestock $1,475,000 65 plus 25.4Other Crops $10,396,000 Total $104,726,000 Average Age (yrs.) 55.1
TABLE 74
COUNTY SUMMARIES

2012 Ohio Department of Agriculture Annual Report and Sta s cs 87
Ashtabula Acres2012 Crops Harvested Yield Production Rank
Corn for Grain, Bu. 21,800 136.0 2,965,000 50Soybeans, Bu. 32,500 47.4 1,540,000 47Wheat, Bu. - - - -Alfalfa Hay, Ton - - - -Other Hay, Ton - - - -
Livestock Number Rank
All Cattle & Calves (1/01/13) 17,900 23Milk Cows (1/01/13) 6,500 11
Number of Farms (2007 Census of Agriculture) = 1,127Average Farm Size (2007 Census of Agriculture) = 143 AcresTotal Land in Farms (2007 Census of Agriculture) = 161,698 Acres Non-irrigated cropland rent per acre = $41.00Commercial Grain Storage Capacity (bu.) = 2,097,000 2007 Census of Agriculture2011 Cash Receipts from Marketing of Farm Commodities Farm Operator by Age Percent by Age Group PercentCorn $16,999,000 Dairy & Milk $25,075,000 Under 25 0.4Soybeans $14,684,000 Cattle & Calves $6,006,000 25-44 15.9Wheat $1,462,000 Hogs & Pigs $199,000 45-64 59.1Oats & Hay $2,082,000 Poultry & Other Livestock $1,338,000 65 plus 24.6Other Crops $8,786,000 Total $76,634,000 Average Age (yrs.) 56.6
Athens Acres2012 Crops Harvested Yield Production Rank
Corn for Grain, Bu. 2,420 117.8 285,000 74Soybeans, Bu. 2,400 45.0 108,000 72Wheat, Bu. - - - -Alfalfa Hay, Ton - - - -Other Hay, Ton 17,800 1.70 30,000 10
Livestock Number Rank
All Cattle & Calves (1/01/13) 7,600 61Milk Cows (1/01/13) 1,100 55
Number of Farms (2007 Census of Agriculture) = 585Average Farm Size (2007 Census of Agriculture) = 140 AcresTotal Land in Farms (2007 Census of Agriculture) = 82,182 Acres Non-irrigated cropland rent per acre = -Commercial Grain Storage Capacity (bu.) = - 2007 Census of Agriculture2011 Cash Receipts from Marketing of Farm Commodities Farm Operator by Age Percent by Age Group PercentCorn $1,930,000 Dairy & Milk $3,795,000 Under 25 0.7Soybeans $1,156,000 Cattle & Calves $2,550,000 25-44 16.1Wheat $139,000 Hogs & Pigs $132,000 45-64 53.3Oats & Hay $1,227,000 Poultry & Other Livestock $591,000 65 plus 29.9Other Crops $3,139,000 Total $14,663,000 Average Age (yrs.) 57.3
TABLE 74
COUNTY SUMMARIES

88 2012 Ohio Department of Agriculture Annual Report and Sta s cs
Auglaize Acres2012 Crops Harvested Yield Production Rank
Corn for Grain, Bu. 74,100 107.2 7,941,000 29Soybeans, Bu. 88,900 50.4 4,478,000 15Wheat, Bu. 15,200 78.9 1,199,000 5Alfalfa Hay, Ton 3,100 3.30 10,200 10Other Hay, Ton - - - -
Livestock Number Rank
All Cattle & Calves (1/01/13) 19,400 19Milk Cows (1/01/13) 5,200 15
Number of Farms (2007 Census of Agriculture) = 1,059Average Farm Size (2007 Census of Agriculture) = 201 AcresTotal Land in Farms (2007 Census of Agriculture) = 213,296 Acres Non-irrigated cropland rent per acre = $161.00Commercial Grain Storage Capacity (bu.) = 6,384,000 2007 Census of Agriculture2011 Cash Receipts from Marketing of Farm Commodities Farm Operator by Age Percent by Age Group PercentCorn $56,676,000 Dairy & Milk $19,979,000 Under 25 0.3Soybeans $56,240,000 Cattle & Calves $6,509,000 25-44 20.1Wheat $8,360,000 Hogs & Pigs $34,884,000 45-64 53.7Oats & Hay $764,000 Poultry & Other Livestock $10,697,000 65 plus 25.9Other Crops $1,190,000 Total $195,303,000 Average Age (yrs.) 55.4
Belmont Acres2012 Crops Harvested Yield Production Rank
Corn for Grain, Bu. 180 98.9 17,800 80Soybeans, Bu. - - - -Wheat, Bu. - - - -Alfalfa Hay, Ton - - - -Other Hay, Ton 29,200 1.80 52,200 2
Livestock Number Rank
All Cattle & Calves (1/01/13) 19,800 17Milk Cows (1/01/13) 900 59
Number of Farms (2007 Census of Agriculture) = 681Average Farm Size (2007 Census of Agriculture) = 190 AcresTotal Land in Farms (2007 Census of Agriculture) = 129,106 Acres Non-irrigated cropland rent per acre = $37.00Commercial Grain Storage Capacity (bu.) = 38,000 2007 Census of Agriculture2011 Cash Receipts from Marketing of Farm Commodities Farm Operator by Age Percent by Age Group PercentCorn $208,000 Dairy & Milk $4,008,000 Under 25 0.3Soybeans $177,000 Cattle & Calves $6,643,000 25-44 20.4Wheat $25,000 Hogs & Pigs $33,000 45-64 52.7Oats & Hay $2,508,000 Poultry & Other Livestock $479,000 65 plus 26.6Other Crops $4,300,000 Total $18,386,000 Average Age (yrs.) 56.2
TABLE 74
COUNTY SUMMARIES

2012 Ohio Department of Agriculture Annual Report and Sta s cs 89
Brown Acres2012 Crops Harvested Yield Production Rank
Corn for Grain, Bu. 27,500 126.9 3,491,000 46Soybeans, Bu. 81,300 48.6 3,951,000 24Wheat, Bu. 1,330 52.8 70,200 50Alfalfa Hay, Ton - - - -Other Hay, Ton 17,100 1.65 28,400 12
Livestock Number Rank
All Cattle & Calves (1/01/13) 19,500 18Milk Cows (1/01/13) 800 60
Number of Farms (2007 Census of Agriculture) = 1,487Average Farm Size (2007 Census of Agriculture) = 162 AcresTotal Land in Farms (2007 Census of Agriculture) = 240,389 Acres Non-irrigated cropland rent per acre = $90.00Commercial Grain Storage Capacity (bu.) = 189,000 2007 Census of Agriculture2011 Cash Receipts from Marketing of Farm Commodities Farm Operator by Age Percent by Age Group PercentCorn $15,288,000 Dairy & Milk $2,601,000 Under 25 0.5Soybeans $46,858,000 Cattle & Calves $6,542,000 25-44 18.5Wheat $597,000 Hogs & Pigs $3,089,000 45-64 52.3Oats & Hay $1,439,000 Poultry & Other Livestock $637,000 65 plus 28.7Other Crops $3,800,000 Total $80,856,000 Average Age (yrs.) 56.3
Butler Acres2012 Crops Harvested Yield Production Rank
Corn for Grain, Bu. 28,800 66.1 1,904,000 61Soybeans, Bu. 33,800 28.1 950,000 55Wheat, Bu. 2,290 58.5 134,000 42Alfalfa Hay, Ton - - - -Other Hay, Ton - - - -
Livestock Number Rank
All Cattle & Calves (1/01/13) 15,200 29Milk Cows (1/01/13) 1,400 46
Number of Farms (2007 Census of Agriculture) = 949Average Farm Size (2007 Census of Agriculture) = 134 AcresTotal Land in Farms (2007 Census of Agriculture) = 127,194 Acres Non-irrigated cropland rent per acre = $121.00Commercial Grain Storage Capacity (bu.) = 2,076,000 2007 Census of Agriculture2011 Cash Receipts from Marketing of Farm Commodities Farm Operator by Age Percent by Age Group PercentCorn $21,080,000 Dairy & Milk $5,266,000 Under 25 0.4Soybeans $15,475,000 Cattle & Calves $5,100,000 25-44 14.6Wheat $1,227,000 Hogs & Pigs $2,524,000 45-64 55.5Oats & Hay $806,000 Poultry & Other Livestock $684,000 65 plus 29.4Other Crops $6,447,000 Total $58,614,000 Average Age (yrs.) 57.2
TABLE 74
COUNTY SUMMARIES
90 2012 Ohio Department of Agriculture Annual Report and Sta s cs
Carroll Acres2012 Crops Harvested Yield Production Rank
Corn for Grain, Bu. 10,300 84.1 866,000 65Soybeans, Bu. 8,800 25.7 226,000 66Wheat, Bu. 840 56.1 47,100 52Alfalfa Hay, Ton - - - -Other Hay, Ton - - - -
Livestock Number Rank
All Cattle & Calves (1/01/13) 16,500 26Milk Cows (1/01/13) 3,600 21
Number of Farms (2007 Census of Agriculture) = 774Average Farm Size (2007 Census of Agriculture) = 151 AcresTotal Land in Farms (2007 Census of Agriculture) = 116,853 Acres Non-irrigated cropland rent per acre = $52.50Commercial Grain Storage Capacity (bu.) = 22,000 2007 Census of Agriculture2011 Cash Receipts from Marketing of Farm Commodities Farm Operator by Age Percent by Age Group PercentCorn $7,098,000 Dairy & Milk $13,369,000 Under 25 0.3Soybeans $3,918,000 Cattle & Calves $5,536,000 25-44 18.1Wheat $349,000 Hogs & Pigs $2,126,000 45-64 55.4Oats & Hay $1,870,000 Poultry & Other Livestock $560,000 65 plus 26.2Other Crops $22,678,000 Total $57,508,000 Average Age (yrs.) 55.9
Champaign Acres2012 Crops Harvested Yield Production Rank
Corn for Grain, Bu. 89,800 125.0 11,226,000 8Soybeans, Bu. 81,700 41.2 3,365,000 28Wheat, Bu. 3,650 78.9 288,000 34Alfalfa Hay, Ton - - - -Other Hay, Ton - - - -
Livestock Number Rank
All Cattle & Calves (1/01/13) 9,400 49Milk Cows (1/01/13) 1,900 37
Number of Farms (2007 Census of Agriculture) = 931Average Farm Size (2007 Census of Agriculture) = 220 AcresTotal Land in Farms (2007 Census of Agriculture) = 204,901 Acres Non-irrigated cropland rent per acre = $160.00Commercial Grain Storage Capacity (bu.) = 7,154,000 2007 Census of Agriculture2011 Cash Receipts from Marketing of Farm Commodities Farm Operator by Age Percent by Age Group PercentCorn $67,675,000 Dairy & Milk $6,162,000 Under 25 0.2Soybeans $44,942,000 Cattle & Calves $3,154,000 25-44 20.9Wheat $2,638,000 Hogs & Pigs $9,302,000 45-64 54.4Oats & Hay $609,000 Poultry & Other Livestock $829,000 65 plus 24.5Other Crops $4,963,000 Total $140,277,000 Average Age (yrs.) 55.1
TABLE 74
COUNTY SUMMARIES

2012 Ohio Department of Agriculture Annual Report and Sta s cs 91
Clark Acres2012 Crops Harvested Yield Production Rank
Corn for Grain, Bu. 63,800 141.8 9,050,000 21Soybeans, Bu. 63,900 40.8 2,604,000 37Wheat, Bu. 1,950 66.7 130,000 43Alfalfa Hay, Ton 2,300 3.05 7,000 19Other Hay, Ton - - - -
Livestock Number Rank
All Cattle & Calves (1/01/13) 19,100 20Milk Cows (1/01/13) 2,400 33
Number of Farms (2007 Census of Agriculture) = 744Average Farm Size (2007 Census of Agriculture) = 238 AcresTotal Land in Farms (2007 Census of Agriculture) = 177,335 Acres Non-irrigated cropland rent per acre = $144.00Commercial Grain Storage Capacity (bu.) = 4,773,000 2007 Census of Agriculture2011 Cash Receipts from Marketing of Farm Commodities Farm Operator by Age Percent by Age Group PercentCorn $57,241,000 Dairy & Milk $12,324,000 Under 25 0.5Soybeans $41,148,000 Cattle & Calves $6,408,000 25-44 21.1Wheat $1,157,000 Hogs & Pigs $4,983,000 45-64 53.8Oats & Hay $518,000 Poultry & Other Livestock $548,000 65 plus 24.6Other Crops $12,713,000 Total $137,044,000 Average Age (yrs.) 54.7
Clermont Acres2012 Crops Harvested Yield Production Rank
Corn for Grain, Bu. 18,200 118.1 2,150,000 57Soybeans, Bu. 33,800 45.0 1,522,000 48Wheat, Bu. - - - -Alfalfa Hay, Ton - - - -Other Hay, Ton 9,300 1.60 15,100 26
Livestock Number Rank
All Cattle & Calves (1/01/13) 5,100 70Milk Cows (1/01/13) 200 76
Number of Farms (2007 Census of Agriculture) = 898Average Farm Size (2007 Census of Agriculture) = 117 AcresTotal Land in Farms (2007 Census of Agriculture) = 104,691 Acres Non-irrigated cropland rent per acre = -Commercial Grain Storage Capacity (bu.) = - 2007 Census of Agriculture2011 Cash Receipts from Marketing of Farm Commodities Farm Operator by Age Percent by Age Group PercentCorn $14,037,000 Dairy & Milk $810,000 Under 25 0.2Soybeans $22,520,000 Cattle & Calves $1,711,000 25-44 14.7Wheat $343,000 Hogs & Pigs $99,000 45-64 55.0Oats & Hay $685,000 Poultry & Other Livestock $1,172,000 65 plus 30.1Other Crops $3,535,000 Total $44,916,000 Average Age (yrs.) 57.9
TABLE 74
COUNTY SUMMARIES

92 2012 Ohio Department of Agriculture Annual Report and Sta s cs
Clinton Acres2012 Crops Harvested Yield Production Rank
Corn for Grain, Bu. 74,500 148.9 11,090,000 9Soybeans, Bu. 100,300 47.6 4,770,000 10Wheat, Bu. 3,550 61.4 218,000 36Alfalfa Hay, Ton 1,500 2.75 4,100 31Other Hay, Ton - - - -
Livestock Number Rank
All Cattle & Calves (1/01/13) 3,800 75Milk Cows (1/01/13) 100 80
Number of Farms (2007 Census of Agriculture) = 799Average Farm Size (2007 Census of Agriculture) = 273 AcresTotal Land in Farms (2007 Census of Agriculture) = 218,493 Acres Non-irrigated cropland rent per acre = $133.00Commercial Grain Storage Capacity (bu.) = 7,001,000 2007 Census of Agriculture2011 Cash Receipts from Marketing of Farm Commodities Farm Operator by Age Percent by Age Group PercentCorn $66,638,000 Dairy & Milk $447,000 Under 25 0.3Soybeans $61,023,000 Cattle & Calves $1,275,000 25-44 20.9Wheat $2,040,000 Hogs & Pigs $7,143,000 45-64 47.8Oats & Hay $308,000 Poultry & Other Livestock $414,000 65 plus 31.0Other Crops $3,307,000 Total $142,598,000 Average Age (yrs.) 56.6
Columbiana Acres2012 Crops Harvested Yield Production Rank
Corn for Grain, Bu. 20,300 132.6 2,692,000 53Soybeans, Bu. 21,100 46.4 980,000 54Wheat, Bu. 4,570 66.7 305,000 32Alfalfa Hay, Ton - - - -Other Hay, Ton - - - -
Livestock Number Rank
All Cattle & Calves (1/01/13) 29,500 7Milk Cows (1/01/13) 9,500 5
Number of Farms (2007 Census of Agriculture) = 1,056Average Farm Size (2007 Census of Agriculture) = 124 AcresTotal Land in Farms (2007 Census of Agriculture) = 130,952 Acres Non-irrigated cropland rent per acre = $54.50Commercial Grain Storage Capacity (bu.) = 1,791,000 2007 Census of Agriculture2011 Cash Receipts from Marketing of Farm Commodities Farm Operator by Age Percent by Age Group PercentCorn $17,136,000 Dairy & Milk $34,755,000 Under 25 0.7Soybeans $12,088,000 Cattle & Calves $9,898,000 25-44 19.0Wheat $2,148,000 Hogs & Pigs $863,000 45-64 57.5Oats & Hay $2,215,000 Poultry & Other Livestock $7,553,000 65 plus 22.8Other Crops $7,186,000 Total $93,847,000 Average Age (yrs.) 54.9
TABLE 74
COUNTY SUMMARIES

2012 Ohio Department of Agriculture Annual Report and Sta s cs 93
Coshocton Acres2012 Crops Harvested Yield Production Rank
Corn for Grain, Bu. 26,200 117.3 3,072,000 49Soybeans, Bu. 17,000 39.6 673,000 59Wheat, Bu. 1,180 65.7 77,500 49Alfalfa Hay, Ton - - - -Other Hay, Ton 13,100 1.80 23,700 19
Livestock Number Rank
All Cattle & Calves (1/01/13) 26,500 9Milk Cows (1/01/13) 3,800 19
Number of Farms (2007 Census of Agriculture) = 1,032Average Farm Size (2007 Census of Agriculture) = 166 AcresTotal Land in Farms (2007 Census of Agriculture) = 171,084 Acres Non-irrigated cropland rent per acre = $74.50Commercial Grain Storage Capacity (bu.) = 3,248,000 2007 Census of Agriculture2011 Cash Receipts from Marketing of Farm Commodities Farm Operator by Age Percent by Age Group PercentCorn $21,097,000 Dairy & Milk $13,966,000 Under 25 0.8Soybeans $9,641,000 Cattle & Calves $8,891,000 25-44 21.1Wheat $591,000 Hogs & Pigs $10,465,000 45-64 54.9Oats & Hay $1,773,000 Poultry & Other Livestock $8,685,000 65 plus 23.2Other Crops $2,363,000 Total $77,476,000 Average Age (yrs.) 54.8
Crawford Acres2012 Crops Harvested Yield Production Rank
Corn for Grain, Bu. 81,000 135.1 10,941,000 10Soybeans, Bu. 91,400 42.8 3,915,000 26Wheat, Bu. 13,300 73.8 981,000 9Alfalfa Hay, Ton 2,400 3.10 7,400 17Other Hay, Ton 1,200 2.00 2,400 39
Livestock Number Rank
All Cattle & Calves (1/01/13) 7,700 58Milk Cows (1/01/13) 1,300 51
Number of Farms (2007 Census of Agriculture) = 682Average Farm Size (2007 Census of Agriculture) = 322 AcresTotal Land in Farms (2007 Census of Agriculture) = 219,566 Acres Non-irrigated cropland rent per acre = $135.00Commercial Grain Storage Capacity (bu.) = 13,077,000 2007 Census of Agriculture2011 Cash Receipts from Marketing of Farm Commodities Farm Operator by Age Percent by Age Group PercentCorn $75,124,000 Dairy & Milk $5,032,000 Under 25 0.4Soybeans $65,609,000 Cattle & Calves $2,583,000 25-44 19.8Wheat $8,837,000 Hogs & Pigs $23,588,000 45-64 53.4Oats & Hay $369,000 Poultry & Other Livestock $1,981,000 65 plus 26.4Other Crops $3,128,000 Total $186,256,000 Average Age (yrs.) 55.5
TABLE 74
COUNTY SUMMARIES
94 2012 Ohio Department of Agriculture Annual Report and Sta s cs
Cuyahoga Acres2012 Crops Harvested Yield Production Rank
Corn for Grain, Bu. - - - -Soybeans, Bu. - - - -Wheat, Bu. - - - -Alfalfa Hay, Ton - - - -Other Hay, Ton - - - -
Livestock Number Rank
All Cattle & Calves (1/01/13) 100 88Milk Cows (1/01/13) - -
Number of Farms (2007 Census of Agriculture) = 127Average Farm Size (2007 Census of Agriculture) = 23 AcresTotal Land in Farms (2007 Census of Agriculture) = 2,910 Acres Non-irrigated cropland rent per acre = -Commercial Grain Storage Capacity (bu.) = - 2007 Census of Agriculture2011 Cash Receipts from Marketing of Farm Commodities Farm Operator by Age Percent by Age Group PercentCorn $126,000 Dairy & Milk - Under 25 0.0Soybeans $128,000 Cattle & Calves $33,000 25-44 4.7Wheat $34,000 Hogs & Pigs $3,000 45-64 74.0Oats & Hay $62,000 Poultry & Other Livestock $280,000 65 plus 21.3Other Crops $9,117,000 Total $9,786,000 Average Age (yrs.) 58.0
Darke Acres2012 Crops Harvested Yield Production Rank
Corn for Grain, Bu. 128,600 102.7 13,210,000 4Soybeans, Bu. 136,400 42.7 5,826,000 5Wheat, Bu. 14,000 75.4 1,055,000 8Alfalfa Hay, Ton - - - -Other Hay, Ton - - - -
Livestock Number Rank
All Cattle & Calves (1/01/13) 35,500 4Milk Cows (1/01/13) 7,900 7
Number of Farms (2007 Census of Agriculture) = 1,772Average Farm Size (2007 Census of Agriculture) = 198 AcresTotal Land in Farms (2007 Census of Agriculture) = 350,450 Acres Non-irrigated cropland rent per acre = $177.00Commercial Grain Storage Capacity (bu.) = 6,963,000 2007 Census of Agriculture2011 Cash Receipts from Marketing of Farm Commodities Farm Operator by Age Percent by Age Group PercentCorn $90,423,000 Dairy & Milk $28,337,000 Under 25 0.6Soybeans $72,791,000 Cattle & Calves $11,911,000 25-44 24.6Wheat $6,840,000 Hogs & Pigs $88,042,000 45-64 52.8Oats & Hay $1,514,000 Poultry & Other Livestock $172,213,000 65 plus 22.0Other Crops $6,926,000 Total $479,001,000 Average Age (yrs.) 53.7
TABLE 74
COUNTY SUMMARIES

2012 Ohio Department of Agriculture Annual Report and Sta s cs 95
Defi ance Acres2012 Crops Harvested Yield Production Rank
Corn for Grain, Bu. 54,300 82.3 4,467,000 39Soybeans, Bu. 102,100 34.6 3,536,000 27Wheat, Bu. 10,500 62.4 655,000 14Alfalfa Hay, Ton 2,200 2.95 6,500 22Other Hay, Ton - - - -
Livestock Number Rank
All Cattle & Calves (1/01/13) 10,300 43Milk Cows (1/01/13) 3,800 19
Number of Farms (2007 Census of Agriculture) = 1,141Average Farm Size (2007 Census of Agriculture) = 204 AcresTotal Land in Farms (2007 Census of Agriculture) = 233,213 Acres Non-irrigated cropland rent per acre = $117.00Commercial Grain Storage Capacity (bu.) = 3,651,000 2007 Census of Agriculture2011 Cash Receipts from Marketing of Farm Commodities Farm Operator by Age Percent by Age Group PercentCorn $33,774,000 Dairy & Milk $17,228,000 Under 25 0.8Soybeans $43,830,000 Cattle & Calves $3,455,000 25-44 16.7Wheat $8,760,000 Hogs & Pigs $4,219,000 45-64 49.0Oats & Hay $452,000 Poultry & Other Livestock $371,000 65 plus 33.5Other Crops $496,000 Total $112,589,000 Average Age (yrs.) 57.6
Delaware Acres2012 Crops Harvested Yield Production Rank
Corn for Grain, Bu. 48,500 136.2 6,604,000 33Soybeans, Bu. 72,100 44.1 3,181,000 29Wheat, Bu. 3,900 72.1 281,000 35Alfalfa Hay, Ton - - - -Other Hay, Ton - - - -
Livestock Number Rank
All Cattle & Calves (1/01/13) 3,400 78Milk Cows (1/01/13) 400 69
Number of Farms (2007 Census of Agriculture) = 726Average Farm Size (2007 Census of Agriculture) = 190 AcresTotal Land in Farms (2007 Census of Agriculture) = 138,140 Acres Non-irrigated cropland rent per acre = $100.00Commercial Grain Storage Capacity (bu.) = 1,067,000 2007 Census of Agriculture2011 Cash Receipts from Marketing of Farm Commodities Farm Operator by Age Percent by Age Group PercentCorn $40,675,000 Dairy & Milk $1,620,000 Under 25 1.4Soybeans $37,044,000 Cattle & Calves $1,140,000 25-44 15.6Wheat $2,695,000 Hogs & Pigs $13,787,000 45-64 54.8Oats & Hay $617,000 Poultry & Other Livestock $871,000 65 plus 28.2Other Crops $11,408,000 Total $109,861,000 Average Age (yrs.) 56.8
TABLE 74
COUNTY SUMMARIES

96 2012 Ohio Department of Agriculture Annual Report and Sta s cs
Erie Acres2012 Crops Harvested Yield Production Rank
Corn for Grain, Bu. 30,700 145.0 4,452,000 40Soybeans, Bu. 34,400 47.4 1,630,000 45Wheat, Bu. 5,910 64.0 378,000 23Alfalfa Hay, Ton 1,600 3.70 5,900 23Other Hay, Ton - - - -
Livestock Number Rank
All Cattle & Calves (1/01/13) 2,400 80Milk Cows (1/01/13) 500 66
Number of Farms (2007 Census of Agriculture) = 403Average Farm Size (2007 Census of Agriculture) = 209 AcresTotal Land in Farms (2007 Census of Agriculture) = 84,085 Acres Non-irrigated cropland rent per acre = $111.00Commercial Grain Storage Capacity (bu.) = - 2007 Census of Agriculture2011 Cash Receipts from Marketing of Farm Commodities Farm Operator by Age Percent by Age Group PercentCorn $21,048,000 Dairy & Milk $1,535,000 Under 25 0.0Soybeans $18,837,000 Cattle & Calves $805,000 25-44 14.1Wheat $3,649,000 Hogs & Pigs $99,000 45-64 59.3Oats & Hay $425,000 Poultry & Other Livestock $272,000 65 plus 26.6Other Crops $22,571,000 Total $69,245,000 Average Age (yrs.) 56.5
Fairfi eld Acres2012 Crops Harvested Yield Production Rank
Corn for Grain, Bu. 62,900 108.5 6,822,000 31Soybeans, Bu. 64,200 39.5 2,539,000 39Wheat, Bu. 6,190 64.0 396,000 22Alfalfa Hay, Ton - - - -Other Hay, Ton 7,100 1.75 12,500 28
Livestock Number Rank
All Cattle & Calves (1/01/13) 13,700 32Milk Cows (1/01/13) 1,000 58
Number of Farms (2007 Census of Agriculture) = 1,112Average Farm Size (2007 Census of Agriculture) = 160 AcresTotal Land in Farms (2007 Census of Agriculture) = 177,772 Acres Non-irrigated cropland rent per acre = $123.00Commercial Grain Storage Capacity (bu.) = 323,000 2007 Census of Agriculture2011 Cash Receipts from Marketing of Farm Commodities Farm Operator by Age Percent by Age Group PercentCorn $54,959,000 Dairy & Milk $3,560,000 Under 25 0.6Soybeans $43,781,000 Cattle & Calves $4,596,000 25-44 18.7Wheat $3,655,000 Hogs & Pigs $6,412,000 45-64 53.0Oats & Hay $1,465,000 Poultry & Other Livestock $869,000 65 plus 27.7Other Crops $5,754,000 Total $125,055,000 Average Age (yrs.) 56.6
TABLE 74
COUNTY SUMMARIES
2012 Ohio Department of Agriculture Annual Report and Sta s cs 97
Fayette Acres2012 Crops Harvested Yield Production Rank
Corn for Grain, Bu. 93,100 129.0 12,011,000 6Soybeans, Bu. - - - -Wheat, Bu. 4,610 75.7 349,000 27Alfalfa Hay, Ton - - - -Other Hay, Ton 1,400 2.05 2,900 37
Livestock Number Rank
All Cattle & Calves (1/01/13) 4,200 73Milk Cows (1/01/13) 300 71
Number of Farms (2007 Census of Agriculture) = 585Average Farm Size (2007 Census of Agriculture) = 373 AcresTotal Land in Farms (2007 Census of Agriculture) = 218,250 Acres Non-irrigated cropland rent per acre = $146.00Commercial Grain Storage Capacity (bu.) = 9,510,000 2007 Census of Agriculture2011 Cash Receipts from Marketing of Farm Commodities Farm Operator by Age Percent by Age Group PercentCorn $70,116,000 Dairy & Milk $1,066,000 Under 25 0.9Soybeans $70,887,000 Cattle & Calves $1,409,000 25-44 15.7Wheat $2,422,000 Hogs & Pigs $930,000 45-64 54.4Oats & Hay $262,000 Poultry & Other Livestock $434,000 65 plus 29.1Other Crops $666,000 Total $148,196,000 Average Age (yrs.) 56.8
Franklin Acres2012 Crops Harvested Yield Production Rank
Corn for Grain, Bu. - - - -Soybeans, Bu. - - - -Wheat, Bu. - - - -Alfalfa Hay, Ton - - - -Other Hay, Ton - - - -
Livestock Number Rank
All Cattle & Calves (1/01/13) 1,600 82Milk Cows (1/01/13) 300 71
Number of Farms (2007 Census of Agriculture) = 429Average Farm Size (2007 Census of Agriculture) = 139 AcresTotal Land in Farms (2007 Census of Agriculture) = 59,601 Acres Non-irrigated cropland rent per acre = $115.00Commercial Grain Storage Capacity (bu.) = 6,038,000 2007 Census of Agriculture2011 Cash Receipts from Marketing of Farm Commodities Farm Operator by Age Percent by Age Group PercentCorn $13,565,000 Dairy & Milk $959,000 Under 25 0.0Soybeans $18,726,000 Cattle & Calves $536,000 25-44 17.7Wheat $1,296,000 Hogs & Pigs $830,000 45-64 57.1Oats & Hay $285,000 Poultry & Other Livestock $606,000 65 plus 25.2Other Crops $19,459,000 Total $56,267,000 Average Age (yrs.) 56.5
TABLE 74
COUNTY SUMMARIES
98 2012 Ohio Department of Agriculture Annual Report and Sta s cs
Fulton Acres2012 Crops Harvested Yield Production Rank
Corn for Grain, Bu. 83,000 121.4 10,080,000 15Soybeans, Bu. 87,100 47.5 4,138,000 23Wheat, Bu. 11,700 74.4 871,000 12Alfalfa Hay, Ton 900 2.45 2,200 35Other Hay, Ton - - - -
Livestock Number Rank
All Cattle & Calves (1/01/13) 30,500 6Milk Cows (1/01/13) 3,100 27
Number of Farms (2007 Census of Agriculture) = 763Average Farm Size (2007 Census of Agriculture) = 241 AcresTotal Land in Farms (2007 Census of Agriculture) = 183,913 Acres Non-irrigated cropland rent per acre = $148.00Commercial Grain Storage Capacity (bu.) = 13,295,000 2007 Census of Agriculture2011 Cash Receipts from Marketing of Farm Commodities Farm Operator by Age Percent by Age Group PercentCorn $69,529,000 Dairy & Milk $13,134,000 Under 25 0.3Soybeans $46,364,000 Cattle & Calves $10,233,000 25-44 27.0Wheat $9,199,000 Hogs & Pigs $14,120,000 45-64 49.1Oats & Hay $94,000 Poultry & Other Livestock $260,000 65 plus 23.6Other Crops $11,295,000 Total $174,232,000 Average Age (yrs.) 53.4
Gallia Acres2012 Crops Harvested Yield Production Rank
Corn for Grain, Bu. 3,060 139.5 427,000 69Soybeans, Bu. 3,240 43.5 141,000 69Wheat, Bu. - - - -Alfalfa Hay, Ton - - - -Other Hay, Ton 25,100 1.75 43,600 5
Livestock Number Rank
All Cattle & Calves (1/01/13) 17,200 25Milk Cows (1/01/13) 600 65
Number of Farms (2007 Census of Agriculture) = 993Average Farm Size (2007 Census of Agriculture) = 118 AcresTotal Land in Farms (2007 Census of Agriculture) = 116,945 Acres Non-irrigated cropland rent per acre = -Commercial Grain Storage Capacity (bu.) = - 2007 Census of Agriculture2011 Cash Receipts from Marketing of Farm Commodities Farm Operator by Age Percent by Age Group PercentCorn $2,024,000 Dairy & Milk $2,430,000 Under 25 0.3Soybeans $1,483,000 Cattle & Calves $5,771,000 25-44 20.9Wheat $85,000 Hogs & Pigs $166,000 45-64 54.2Oats & Hay $2,119,000 Poultry & Other Livestock $985,000 65 plus 24.6Other Crops $1,667,000 Total $16,734,000 Average Age (yrs.) 55.0
TABLE 74
COUNTY SUMMARIES
2012 Ohio Department of Agriculture Annual Report and Sta s cs 99
Geauga Acres2012 Crops Harvested Yield Production Rank
Corn for Grain, Bu. 3,100 130.3 404,000 71Soybeans, Bu. 3,440 50.3 173,000 67Wheat, Bu. - - - -Alfalfa Hay, Ton - - - -Other Hay, Ton - - - -
Livestock Number Rank
All Cattle & Calves (1/01/13) 7,400 62Milk Cows (1/01/13) 3,000 29
Number of Farms (2007 Census of Agriculture) = 888Average Farm Size (2007 Census of Agriculture) = 64 AcresTotal Land in Farms (2007 Census of Agriculture) = 56,558 Acres Non-irrigated cropland rent per acre = $39.50Commercial Grain Storage Capacity (bu.) = 153,000 2007 Census of Agriculture2011 Cash Receipts from Marketing of Farm Commodities Farm Operator by Age Percent by Age Group PercentCorn $2,528,000 Dairy & Milk $12,239,000 Under 25 0.0Soybeans $1,322,000 Cattle & Calves $2,482,000 25-44 22.0Wheat $336,000 Hogs & Pigs $199,000 45-64 55.9Oats & Hay $1,107,000 Poultry & Other Livestock $2,134,000 65 plus 22.2Other Crops $12,198,000 Total $34,550,000 Average Age (yrs.) 54.8
Greene Acres2012 Crops Harvested Yield Production Rank
Corn for Grain, Bu. 61,900 145.6 9,014,000 22Soybeans, Bu. 62,300 41.5 2,587,000 38Wheat, Bu. 2,790 65.6 183,000 38Alfalfa Hay, Ton 2,600 2.55 6,600 21Other Hay, Ton - - - -
Livestock Number Rank
All Cattle & Calves (1/01/13) 4,300 72Milk Cows (1/01/13) 200 76
Number of Farms (2007 Census of Agriculture) = 776Average Farm Size (2007 Census of Agriculture) = 209 AcresTotal Land in Farms (2007 Census of Agriculture) = 162,533 Acres Non-irrigated cropland rent per acre = $148.00Commercial Grain Storage Capacity (bu.) = 1,114,000 2007 Census of Agriculture2011 Cash Receipts from Marketing of Farm Commodities Farm Operator by Age Percent by Age Group PercentCorn $55,804,000 Dairy & Milk $852,000 Under 25 1.5Soybeans $42,211,000 Cattle & Calves $1,442,000 25-44 14.3Wheat $1,970,000 Hogs & Pigs $8,472,000 45-64 60.7Oats & Hay $463,000 Poultry & Other Livestock $591,000 65 plus 23.5Other Crops $18,986,000 Total $130,795,000 Average Age (yrs.) 56.2
TABLE 74
COUNTY SUMMARIES

100 2012 Ohio Department of Agriculture Annual Report and Sta s cs
Guernsey Acres2012 Crops Harvested Yield Production Rank
Corn for Grain, Bu. 3,310 125.1 414,000 70Soybeans, Bu. 2,600 39.2 102,000 74Wheat, Bu. - - - -Alfalfa Hay, Ton - - - -Other Hay, Ton 33,900 1.50 51,200 3
Livestock Number Rank
All Cattle & Calves (1/01/13) 21,000 15Milk Cows (1/01/13) 1,500 45
Number of Farms (2007 Census of Agriculture) = 883Average Farm Size (2007 Census of Agriculture) = 156 AcresTotal Land in Farms (2007 Census of Agriculture) = 137,584 Acres Non-irrigated cropland rent per acre = $39.50Commercial Grain Storage Capacity (bu.) = 59,000 2007 Census of Agriculture2011 Cash Receipts from Marketing of Farm Commodities Farm Operator by Age Percent by Age Group PercentCorn $2,199,000 Dairy & Milk $5,586,000 Under 25 0.9Soybeans $1,693,000 Cattle & Calves $7,046,000 25-44 19.7Wheat $48,000 Hogs & Pigs $2,524,000 45-64 47.7Oats & Hay $2,603,000 Poultry & Other Livestock $746,000 65 plus 31.7Other Crops $1,569,000 Total $24,018,000 Average Age (yrs.) 56.5
Hamilton Acres2012 Crops Harvested Yield Production Rank
Corn for Grain, Bu. 3,800 100.8 383,000 72Soybeans, Bu. 3,700 44.9 166,000 68Wheat, Bu. - - - -Alfalfa Hay, Ton 1,100 2.20 2,400 34Other Hay, Ton - - - -
Livestock Number Rank
All Cattle & Calves (1/01/13) 1,200 84Milk Cows (1/01/13) 300 71
Number of Farms (2007 Census of Agriculture) = 291Average Farm Size (2007 Census of Agriculture) = 73 AcresTotal Land in Farms (2007 Census of Agriculture) = 21,290 Acres Non-irrigated cropland rent per acre = -Commercial Grain Storage Capacity (bu.) = 9,024,000 2007 Census of Agriculture2011 Cash Receipts from Marketing of Farm Commodities Farm Operator by Age Percent by Age Group PercentCorn $2,967,000 Dairy & Milk $1,044,000 Under 25 1.0Soybeans $1,804,000 Cattle & Calves $402,000 25-44 13.7Wheat $120,000 Hogs & Pigs $6,000 45-64 55.3Oats & Hay $310,000 Poultry & Other Livestock $2,016,000 65 plus 29.9Other Crops $13,813,000 Total $22,488,000 Average Age (yrs.) 57.1
TABLE 74
COUNTY SUMMARIES

2012 Ohio Department of Agriculture Annual Report and Sta s cs 101
Hancock Acres2012 Crops Harvested Yield Production Rank
Corn for Grain, Bu. 90,800 144.0 13,075,000 5Soybeans, Bu. 137,400 49.8 6,839,000 2Wheat, Bu. 18,100 73.4 1,328,000 4Alfalfa Hay, Ton 1,900 2.85 5,400 25Other Hay, Ton - - - -
Livestock Number Rank
All Cattle & Calves (1/01/13) 4,100 74Milk Cows (1/01/13) 1,200 53
Number of Farms (2007 Census of Agriculture) = 922Average Farm Size (2007 Census of Agriculture) = 269 AcresTotal Land in Farms (2007 Census of Agriculture) = 247,981 Acres Non-irrigated cropland rent per acre = $134.00Commercial Grain Storage Capacity (bu.) = 21,526,000 2007 Census of Agriculture2011 Cash Receipts from Marketing of Farm Commodities Farm Operator by Age Percent by Age Group PercentCorn $72,156,000 Dairy & Milk $3,859,000 Under 25 0.2Soybeans $78,996,000 Cattle & Calves $1,375,000 25-44 18.5Wheat $14,050,000 Hogs & Pigs $12,624,000 45-64 54.9Oats & Hay $327,000 Poultry & Other Livestock $959,000 65 plus 26.4Other Crops $1,433,000 Total $185,784,000 Average Age (yrs.) 56.0
Hardin Acres2012 Crops Harvested Yield Production Rank
Corn for Grain, Bu. 97,500 137.8 13,440,000 3Soybeans, Bu. 108,400 48.3 5,241,000 6Wheat, Bu. 5,710 65.0 371,000 24Alfalfa Hay, Ton - - - -Other Hay, Ton - - - -
Livestock Number Rank
All Cattle & Calves (1/01/13) 14,700 30Milk Cows (1/01/13) 6,000 13
Number of Farms (2007 Census of Agriculture) = 847Average Farm Size (2007 Census of Agriculture) = 303 AcresTotal Land in Farms (2007 Census of Agriculture) = 256,822 Acres Non-irrigated cropland rent per acre = $137.00Commercial Grain Storage Capacity (bu.) = 6,533,000 2007 Census of Agriculture2011 Cash Receipts from Marketing of Farm Commodities Farm Operator by Age Percent by Age Group PercentCorn $69,030,000 Dairy & Milk $28,188,000 Under 25 2.0Soybeans $70,257,000 Cattle & Calves $4,932,000 25-44 20.1Wheat $5,842,000 Hogs & Pigs $21,595,000 45-64 50.5Oats & Hay $375,000 Poultry & Other Livestock $43,080,000 65 plus 27.4Other Crops $468,000 Total $243,771,000 Average Age (yrs.) 55.9
TABLE 74
COUNTY SUMMARIES

102 2012 Ohio Department of Agriculture Annual Report and Sta s cs
Harrison Acres2012 Crops Harvested Yield Production Rank
Corn for Grain, Bu. 4,050 108.9 441,000 67Soybeans, Bu. 2,800 38.6 108,000 72Wheat, Bu. - - - -Alfalfa Hay, Ton - - - -Other Hay, Ton 16,600 1.65 27,000 15
Livestock Number Rank
All Cattle & Calves (1/01/13) 10,900 42Milk Cows (1/01/13) 800 60
Number of Farms (2007 Census of Agriculture) = 418Average Farm Size (2007 Census of Agriculture) = 223 AcresTotal Land in Farms (2007 Census of Agriculture) = 93,342 Acres Non-irrigated cropland rent per acre = -Commercial Grain Storage Capacity (bu.) = 6,000 2007 Census of Agriculture2011 Cash Receipts from Marketing of Farm Commodities Farm Operator by Age Percent by Age Group PercentCorn $2,441,000 Dairy & Milk $2,921,000 Under 25 0.2Soybeans $1,176,000 Cattle & Calves $3,657,000 25-44 16.5Wheat $139,000 Hogs & Pigs $132,000 45-64 51.4Oats & Hay $2,226,000 Poultry & Other Livestock $1,759,000 65 plus 31.8Other Crops $1,380,000 Total $15,835,000 Average Age (yrs.) 57.6
Henry Acres2012 Crops Harvested Yield Production Rank
Corn for Grain, Bu. 80,300 101.1 8,118,000 27Soybeans, Bu. 100,400 49.9 5,011,000 8Wheat, Bu. 21,400 73.2 1,567,000 2Alfalfa Hay, Ton 3,300 2.90 9,600 14Other Hay, Ton - - - -
Livestock Number Rank
All Cattle & Calves (1/01/13) 6,000 68Milk Cows (1/01/13) 1,800 38
Number of Farms (2007 Census of Agriculture) = 881Average Farm Size (2007 Census of Agriculture) = 264 AcresTotal Land in Farms (2007 Census of Agriculture) = 232,238 Acres Non-irrigated cropland rent per acre = $143.00Commercial Grain Storage Capacity (bu.) = 14,514,000 2007 Census of Agriculture2011 Cash Receipts from Marketing of Farm Commodities Farm Operator by Age Percent by Age Group PercentCorn $62,743,000 Dairy & Milk $7,995,000 Under 25 0.6Soybeans $57,983,000 Cattle & Calves $2,013,000 25-44 20.2Wheat $15,894,000 Hogs & Pigs $3,953,000 45-64 54.3Oats & Hay $599,000 Poultry & Other Livestock $311,000 65 plus 25.0Other Crops $10,560,000 Total $162,054,000 Average Age (yrs.) 55.5
TABLE 74
COUNTY SUMMARIES

2012 Ohio Department of Agriculture Annual Report and Sta s cs 103
Highland Acres2012 Crops Harvested Yield Production Rank
Corn for Grain, Bu. 45,500 121.4 5,524,000 37Soybeans, Bu. 95,600 45.5 4,351,000 19Wheat, Bu. 4,990 61.7 308,000 31Alfalfa Hay, Ton - - - -Other Hay, Ton 11,100 2.05 22,900 21
Livestock Number Rank
All Cattle & Calves (1/01/13) 18,800 21Milk Cows (1/01/13) 1,300 51
Number of Farms (2007 Census of Agriculture) = 1,497Average Farm Size (2007 Census of Agriculture) = 180 AcresTotal Land in Farms (2007 Census of Agriculture) = 269,803 Acres Non-irrigated cropland rent per acre = $103.00Commercial Grain Storage Capacity (bu.) = 337,000 2007 Census of Agriculture2011 Cash Receipts from Marketing of Farm Commodities Farm Operator by Age Percent by Age Group PercentCorn $33,291,000 Dairy & Milk $5,138,000 Under 25 0.9Soybeans $54,683,000 Cattle & Calves $6,308,000 25-44 17.0Wheat $3,306,000 Hogs & Pigs $6,013,000 45-64 53.5Oats & Hay $1,322,000 Poultry & Other Livestock $920,000 65 plus 28.7Other Crops $4,061,000 Total $115,046,000 Average Age (yrs.) 56.7
Hocking Acres2012 Crops Harvested Yield Production Rank
Corn for Grain, Bu. 3,110 112.9 351,000 73Soybeans, Bu. 2,900 39.3 114,000 70Wheat, Bu. - - - -Alfalfa Hay, Ton - - - -Other Hay, Ton 8,300 1.40 11,700 30
Livestock Number Rank
All Cattle & Calves (1/01/13) 2,400 80Milk Cows (1/01/13) - -
Number of Farms (2007 Census of Agriculture) = 387Average Farm Size (2007 Census of Agriculture) = 109 AcresTotal Land in Farms (2007 Census of Agriculture) = 41,992 Acres Non-irrigated cropland rent per acre = $89.00Commercial Grain Storage Capacity (bu.) = 1,296,000 2007 Census of Agriculture2011 Cash Receipts from Marketing of Farm Commodities Farm Operator by Age Percent by Age Group PercentCorn $2,007,000 Dairy & Milk - Under 25 0.0Soybeans $1,619,000 Cattle & Calves $805,000 25-44 18.9Wheat $146,000 Hogs & Pigs $996,000 45-64 57.1Oats & Hay $542,000 Poultry & Other Livestock $259,000 65 plus 24.0Other Crops $1,080,000 Total $7,457,000 Average Age (yrs.) 55.8
TABLE 74
COUNTY SUMMARIES

104 2012 Ohio Department of Agriculture Annual Report and Sta s cs
Holmes Acres2012 Crops Harvested Yield Production Rank
Corn for Grain, Bu. 20,200 130.4 2,635,000 54Soybeans, Bu. 12,200 41.1 502,000 64Wheat, Bu. 1,330 64.4 85,700 47Alfalfa Hay, Ton 13,000 2.75 35,600 2Other Hay, Ton - - - -
Livestock Number Rank
All Cattle & Calves (1/01/13) 53,000 3Milk Cows (1/01/13) 17,000 3
Number of Farms (2007 Census of Agriculture) = 1,573Average Farm Size (2007 Census of Agriculture) = 119 AcresTotal Land in Farms (2007 Census of Agriculture) = 187,658 Acres Non-irrigated cropland rent per acre = $92.50Commercial Grain Storage Capacity (bu.) = 303,000 2007 Census of Agriculture2011 Cash Receipts from Marketing of Farm Commodities Farm Operator by Age Percent by Age Group PercentCorn $18,030,000 Dairy & Milk $60,961,000 Under 25 1.0Soybeans $7,750,000 Cattle & Calves $17,783,000 25-44 35.3Wheat $692,000 Hogs & Pigs $2,259,000 45-64 48.1Oats & Hay $2,743,000 Poultry & Other Livestock $51,580,000 65 plus 15.6Other Crops $6,184,000 Total $167,986,000 Average Age (yrs.) 49.8
Huron Acres2012 Crops Harvested Yield Production Rank
Corn for Grain, Bu. 72,000 143.5 10,330,000 14Soybeans, Bu. 92,500 44.9 4,153,000 22Wheat, Bu. 6,690 63.7 426,000 20Alfalfa Hay, Ton 2,800 3.65 10,200 11Other Hay, Ton 2,900 1.90 5,500 34
Livestock Number Rank
All Cattle & Calves (1/01/13) 7,700 58Milk Cows (1/01/13) 3,400 24
Number of Farms (2007 Census of Agriculture) = 793Average Farm Size (2007 Census of Agriculture) = 277 AcresTotal Land in Farms (2007 Census of Agriculture) = 219,369 Acres Non-irrigated cropland rent per acre = $120.00Commercial Grain Storage Capacity (bu.) = 15,483,000 2007 Census of Agriculture2011 Cash Receipts from Marketing of Farm Commodities Farm Operator by Age Percent by Age Group PercentCorn $50,115,000 Dairy & Milk $15,053,000 Under 25 0.3Soybeans $51,914,000 Cattle & Calves $2,583,000 25-44 20.8Wheat $7,470,000 Hogs & Pigs $5,448,000 45-64 55.1Oats & Hay $620,000 Poultry & Other Livestock $4,916,000 65 plus 23.8Other Crops $16,823,000 Total $154,946,000 Average Age (yrs.) 55.0
TABLE 74
COUNTY SUMMARIES
2012 Ohio Department of Agriculture Annual Report and Sta s cs 105
Jackson Acres2012 Crops Harvested Yield Production Rank
Corn for Grain, Bu. - - - -Soybeans, Bu. - - - -Wheat, Bu. - - - -Alfalfa Hay, Ton - - - -Other Hay, Ton 15,000 1.95 29,100 11
Livestock Number Rank
All Cattle & Calves (1/01/13) 11,000 41Milk Cows (1/01/13) 300 71
Number of Farms (2007 Census of Agriculture) = 462Average Farm Size (2007 Census of Agriculture) = 156 AcresTotal Land in Farms (2007 Census of Agriculture) = 71,869 Acres Non-irrigated cropland rent per acre = -Commercial Grain Storage Capacity (bu.) = - 2007 Census of Agriculture2011 Cash Receipts from Marketing of Farm Commodities Farm Operator by Age Percent by Age Group PercentCorn $2,040,000 Dairy & Milk $1,151,000 Under 25 0.4Soybeans $2,014,000 Cattle & Calves $3,690,000 25-44 12.6Wheat $76,000 Hogs & Pigs $33,000 45-64 60.0Oats & Hay $1,371,000 Poultry & Other Livestock $309,000 65 plus 27.1Other Crops $1,170,000 Total $11,858,000 Average Age (yrs.) 57.7
Jefferson Acres2012 Crops Harvested Yield Production Rank
Corn for Grain, Bu. 1,670 101.3 169,200 76Soybeans, Bu. - - - -Wheat, Bu. - - - -Alfalfa Hay, Ton - - - -Other Hay, Ton 16,300 1.75 28,300 13
Livestock Number Rank
All Cattle & Calves (1/01/13) 10,000 44Milk Cows (1/01/13) 1,800 38
Number of Farms (2007 Census of Agriculture) = 475Average Farm Size (2007 Census of Agriculture) = 146 AcresTotal Land in Farms (2007 Census of Agriculture) = 69,468 Acres Non-irrigated cropland rent per acre = -Commercial Grain Storage Capacity (bu.) = - 2007 Census of Agriculture2011 Cash Receipts from Marketing of Farm Commodities Farm Operator by Age Percent by Age Group PercentCorn $1,108,000 Dairy & Milk $7,505,000 Under 25 0.2Soybeans $363,000 Cattle & Calves $3,355,000 25-44 16.8Wheat $95,000 Hogs & Pigs $132,000 45-64 53.9Oats & Hay $1,578,000 Poultry & Other Livestock $340,000 65 plus 29.1Other Crops $1,135,000 Total $15,614,000 Average Age (yrs.) 57.5
TABLE 74
COUNTY SUMMARIES

106 2012 Ohio Department of Agriculture Annual Report and Sta s cs
Knox Acres2012 Crops Harvested Yield Production Rank
Corn for Grain, Bu. 51,700 143.7 7,430,000 30Soybeans, Bu. 52800 45.2 2385000 40Wheat, Bu. 3,300 61.5 203,000 37Alfalfa Hay, Ton - - - -Other Hay, Ton 12,700 1.90 24,000 18
Livestock Number Rank
All Cattle & Calves (1/01/13) 18,200 22Milk Cows (1/01/13) 3,500 22
Number of Farms (2007 Census of Agriculture) = 1,270Average Farm Size (2007 Census of Agriculture) = 156 AcresTotal Land in Farms (2007 Census of Agriculture) = 198,244 Acres Non-irrigated cropland rent per acre = $79.50Commercial Grain Storage Capacity (bu.) = 820,000 2007 Census of Agriculture2011 Cash Receipts from Marketing of Farm Commodities Farm Operator by Age Percent by Age Group PercentCorn $40,752,000 Dairy & Milk $15,757,000 Under 25 0.9Soybeans $32,050,000 Cattle & Calves $6,106,000 25-44 19.6Wheat $1,564,000 Hogs & Pigs $5,349,000 45-64 57.7Oats & Hay $1,964,000 Poultry & Other Livestock $1,814,000 65 plus 21.7Other Crops $9,107,000 Total $114,467,000 Average Age (yrs.) 54.6
Lake Acres2012 Crops Harvested Yield Production Rank
Corn for Grain, Bu. - - - -Soybeans, Bu. - - - -Wheat, Bu. - - - -Alfalfa Hay, Ton - - - -Other Hay, Ton 1,900 1.65 3,100 36
Livestock Number Rank
All Cattle & Calves (1/01/13) 500 87Milk Cows (1/01/13) - -
Number of Farms (2007 Census of Agriculture) = 259Average Farm Size (2007 Census of Agriculture) = 62 AcresTotal Land in Farms (2007 Census of Agriculture) = 16,065 Acres Non-irrigated cropland rent per acre = -Commercial Grain Storage Capacity (bu.) = - 2007 Census of Agriculture2011 Cash Receipts from Marketing of Farm Commodities Farm Operator by Age Percent by Age Group PercentCorn $235,000 Dairy & Milk $234,000 Under 25 0.4Soybeans $189,000 Cattle & Calves $167,000 25-44 8.1Wheat $58,000 Hogs & Pigs $19,000 45-64 60.6Oats & Hay $268,000 Poultry & Other Livestock $243,000 65 plus 30.9Other Crops $47,921,000 Total $49,338,000 Average Age (yrs.) 58.6
TABLE 74
COUNTY SUMMARIES

2012 Ohio Department of Agriculture Annual Report and Sta s cs 107
Lawrence Acres2012 Crops Harvested Yield Production Rank
Corn for Grain, Bu. 950 110.5 105,000 78Soybeans, Bu. 1,330 33.1 44,000 76Wheat, Bu. - - - -Alfalfa Hay, Ton - - - -Other Hay, Ton 9,100 1.85 16,800 25
Livestock Number Rank
All Cattle & Calves (1/01/13) 6,000 68Milk Cows (1/01/13) 200 76
Number of Farms (2007 Census of Agriculture) = 649Average Farm Size (2007 Census of Agriculture) = 101 AcresTotal Land in Farms (2007 Census of Agriculture) = 65,740 Acres Non-irrigated cropland rent per acre = $37.50Commercial Grain Storage Capacity (bu.) = - 2007 Census of Agriculture2011 Cash Receipts from Marketing of Farm Commodities Farm Operator by Age Percent by Age Group PercentCorn $548,000 Dairy & Milk $852,000 Under 25 0.0Soybeans $667,000 Cattle & Calves $2,013,000 25-44 19.7Wheat $12,000 Hogs & Pigs $33,000 45-64 53.3Oats & Hay $664,000 Poultry & Other Livestock $559,000 65 plus 27.0Other Crops $1,658,000 Total $7,010,000 Average Age (yrs.) 56.0
Licking Acres2012 Crops Harvested Yield Production Rank
Corn for Grain, Bu. 62,100 132.9 8,250,000 25Soybeans, Bu. 63,500 42.8 2,718,000 35Wheat, Bu. 4,620 65.6 303,000 33Alfalfa Hay, Ton - - - -Other Hay, Ton 15,100 1.80 2,700 38
Livestock Number Rank
All Cattle & Calves (1/01/13) 23,000 13Milk Cows (1/01/13) 3,500 22
Number of Farms (2007 Census of Agriculture) = 1,427Average Farm Size (2007 Census of Agriculture) = 158 AcresTotal Land in Farms (2007 Census of Agriculture) = 225,792 Acres Non-irrigated cropland rent per acre = $109.00Commercial Grain Storage Capacity (bu.) = 3,240,000 2007 Census of Agriculture2011 Cash Receipts from Marketing of Farm Commodities Farm Operator by Age Percent by Age Group PercentCorn $48,272,000 Dairy & Milk $13,411,000 Under 25 0.0Soybeans $37,242,000 Cattle & Calves $7,717,000 25-44 17.1Wheat $2,225,000 Hogs & Pigs $8,970,000 45-64 54.7Oats & Hay $1,797,000 Poultry & Other Livestock $73,668,000 65 plus 28.2Other Crops $14,618,000 Total $207,923,000 Average Age (yrs.) 56.7
TABLE 74
COUNTY SUMMARIES
108 2012 Ohio Department of Agriculture Annual Report and Sta s cs
Logan Acres2012 Crops Harvested Yield Production Rank
Corn for Grain, Bu. 73,900 144.1 10,652,000 12Soybeans, Bu. 85,000 49.3 4,192,000 21Wheat, Bu. 4,570 75.9 347,000 28Alfalfa Hay, Ton 4,300 3.35 14,500 7Other Hay, Ton - - - -
Livestock Number Rank
All Cattle & Calves (1/01/13) 9,400 49Milk Cows (1/01/13) 2,300 35
Number of Farms (2007 Census of Agriculture) = 956Average Farm Size (2007 Census of Agriculture) = 211 AcresTotal Land in Farms (2007 Census of Agriculture) = 201,306 Acres Non-irrigated cropland rent per acre = $131.00Commercial Grain Storage Capacity (bu.) = 2,732,000 2007 Census of Agriculture2011 Cash Receipts from Marketing of Farm Commodities Farm Operator by Age Percent by Age Group PercentCorn $54,548,000 Dairy & Milk $11,322,000 Under 25 0.1Soybeans $54,472,000 Cattle & Calves $3,154,000 25-44 20.0Wheat $2,657,000 Hogs & Pigs $6,976,000 45-64 55.5Oats & Hay $815,000 Poultry & Other Livestock $601,000 65 plus 24.4Other Crops $2,542,000 Total $137,091,000 Average Age (yrs.) 55.6
Lorain Acres2012 Crops Harvested Yield Production Rank
Corn for Grain, Bu. 28,400 152.3 4,325,000 43Soybeans, Bu. 54,400 48.4 2,632,000 36Wheat, Bu. - - - -Alfalfa Hay, Ton 4,400 3.85 17,000 5Other Hay, Ton - - - -
Livestock Number Rank
All Cattle & Calves (1/01/13) 11,600 37Milk Cows (1/01/13) 4,600 17
Number of Farms (2007 Census of Agriculture) = 873Average Farm Size (2007 Census of Agriculture) = 142 AcresTotal Land in Farms (2007 Census of Agriculture) = 124,100 Acres Non-irrigated cropland rent per acre = $79.00Commercial Grain Storage Capacity (bu.) = 850,000 2007 Census of Agriculture2011 Cash Receipts from Marketing of Farm Commodities Farm Operator by Age Percent by Age Group PercentCorn $14,410,000 Dairy & Milk $14,456,000 Under 25 0.0Soybeans $23,386,000 Cattle & Calves $3,892,000 25-44 16.2Wheat $3,344,000 Hogs & Pigs $2,093,000 45-64 59.8Oats & Hay $867,000 Poultry & Other Livestock $1,028,000 65 plus 24.1Other Crops $28,484,000 Total $91,963,000 Average Age (yrs.) 56.1
TABLE 74
COUNTY SUMMARIES
2012 Ohio Department of Agriculture Annual Report and Sta s cs 109
Lucas Acres2012 Crops Harvested Yield Production Rank
Corn for Grain, Bu. 23,000 145.3 3,341,000 47Soybeans, Bu. 30,300 52.4 1,589,000 46Wheat, Bu. 4,080 77.9 318,000 29Alfalfa Hay, Ton 500 3.20 1,600 36Other Hay, Ton - - - -
Livestock Number Rank
All Cattle & Calves (1/01/13) 600 86Milk Cows (1/01/13) - -
Number of Farms (2007 Census of Agriculture) = 372Average Farm Size (2007 Census of Agriculture) = 169 AcresTotal Land in Farms (2007 Census of Agriculture) = 62,906 Acres Non-irrigated cropland rent per acre = $124.00Commercial Grain Storage Capacity (bu.) = 55,332,000 2007 Census of Agriculture2011 Cash Receipts from Marketing of Farm Commodities Farm Operator by Age Percent by Age Group PercentCorn $19,045,000 Dairy & Milk - Under 25 0.0Soybeans $16,229,000 Cattle & Calves $201,000 25-44 17.2Wheat $3,299,000 Hogs & Pigs $1,661,000 45-64 56.5Oats & Hay $79,000 Poultry & Other Livestock $336,000 65 plus 26.3Other Crops $27,944,000 Total $68,797,000 Average Age (yrs.) 56.0
Madison Acres2012 Crops Harvested Yield Production Rank
Corn for Grain, Bu. 102,500 144.5 14,811,000 2Soybeans, Bu. 113,900 39.0 4,443,000 17Wheat, Bu. 6,050 76.2 461,000 18Alfalfa Hay, Ton 2,800 3.45 9,700 12Other Hay, Ton 2,100 2.20 4,600 35
Livestock Number Rank
All Cattle & Calves (1/01/13) 10,000 44Milk Cows (1/01/13) 2,900 30
Number of Farms (2007 Census of Agriculture) = 718Average Farm Size (2007 Census of Agriculture) = 345 AcresTotal Land in Farms (2007 Census of Agriculture) = 247,913 Acres Non-irrigated cropland rent per acre = $150.00Commercial Grain Storage Capacity (bu.) = 3,665,000 2007 Census of Agriculture2011 Cash Receipts from Marketing of Farm Commodities Farm Operator by Age Percent by Age Group PercentCorn $84,625,000 Dairy & Milk $14,222,000 Under 25 0.8Soybeans $78,242,000 Cattle & Calves $3,355,000 25-44 19.2Wheat $4,494,000 Hogs & Pigs $9,136,000 45-64 56.4Oats & Hay $410,000 Poultry & Other Livestock $698,000 65 plus 23.5Other Crops $1,148,000 Total $196,333,000 Average Age (yrs.) 55.2
TABLE 74
COUNTY SUMMARIES

110 2012 Ohio Department of Agriculture Annual Report and Sta s cs
Mahoning Acres2012 Crops Harvested Yield Production Rank
Corn for Grain, Bu. 13,800 142.0 1,960,000 59Soybeans, Bu. 15,200 49.2 748,000 58Wheat, Bu. 1,860 76.3 142,000 39Alfalfa Hay, Ton 3,000 2.95 8,900 15Other Hay, Ton - - - -
Livestock Number Rank
All Cattle & Calves (1/01/13) 12,500 35Milk Cows (1/01/13) 5,200 15
Number of Farms (2007 Census of Agriculture) = 578Average Farm Size (2007 Census of Agriculture) = 111 AcresTotal Land in Farms (2007 Census of Agriculture) = 64,082 Acres Non-irrigated cropland rent per acre = $50.00Commercial Grain Storage Capacity (bu.) = 1,784,000 2007 Census of Agriculture2011 Cash Receipts from Marketing of Farm Commodities Farm Operator by Age Percent by Age Group PercentCorn $10,411,000 Dairy & Milk $22,644,000 Under 25 0.0Soybeans $7,712,000 Cattle & Calves $4,194,000 25-44 17.8Wheat $1,118,000 Hogs & Pigs $465,000 45-64 57.8Oats & Hay $1,001,000 Poultry & Other Livestock $10,340,000 65 plus 24.4Other Crops $7,493,000 Total $65,383,000 Average Age (yrs.) 56.7
Marion Acres2012 Crops Harvested Yield Production Rank
Corn for Grain, Bu. 65,000 133.1 8,650,000 23Soybeans, Bu. 99,600 46.0 4,585,000 12Wheat, Bu. 5,240 67.4 353,000 26Alfalfa Hay, Ton - - - -Other Hay, Ton 900 2.20 2,000 41
Livestock Number Rank
All Cattle & Calves (1/01/13) 6,500 65Milk Cows (1/01/13) 3,300 25
Number of Farms (2007 Census of Agriculture) = 654Average Farm Size (2007 Census of Agriculture) = 316 AcresTotal Land in Farms (2007 Census of Agriculture) = 206,832 Acres Non-irrigated cropland rent per acre = $145.00Commercial Grain Storage Capacity (bu.) = 13,508,000 2007 Census of Agriculture2011 Cash Receipts from Marketing of Farm Commodities Farm Operator by Age Percent by Age Group PercentCorn $50,165,000 Dairy & Milk $16,802,000 Under 25 0.3Soybeans $64,200,000 Cattle & Calves $2,180,000 25-44 15.9Wheat $4,704,000 Hogs & Pigs $18,273,000 45-64 54.9Oats & Hay $398,000 Poultry & Other Livestock $611,000 65 plus 28.9Other Crops $928,000 Total $158,265,000 Average Age (yrs.) 56.9
TABLE 74
COUNTY SUMMARIES

2012 Ohio Department of Agriculture Annual Report and Sta s cs 111
Medina Acres2012 Crops Harvested Yield Production Rank
Corn for Grain, Bu. 15,900 118.2 1,879,000 62Soybeans, Bu. 30,800 39.3 1,210,000 52Wheat, Bu. 1,650 55.8 92,000 45Alfalfa Hay, Ton - - - -Other Hay, Ton 7,000 2.05 14,500 27
Livestock Number Rank
All Cattle & Calves (1/01/13) 9,400 49Milk Cows (1/01/13) 2,700 32
Number of Farms (2007 Census of Agriculture) = 951Average Farm Size (2007 Census of Agriculture) = 100 AcresTotal Land in Farms (2007 Census of Agriculture) = 95,493 Acres Non-irrigated cropland rent per acre = $60.50Commercial Grain Storage Capacity (bu.) = 228,000 2007 Census of Agriculture2011 Cash Receipts from Marketing of Farm Commodities Farm Operator by Age Percent by Age Group PercentCorn $11,420,000 Dairy & Milk $12,857,000 Under 25 0.8Soybeans $13,361,000 Cattle & Calves $3,154,000 25-44 17.7Wheat $1,494,000 Hogs & Pigs $299,000 45-64 57.7Oats & Hay $1,117,000 Poultry & Other Livestock $1,245,000 65 plus 23.8Other Crops $11,957,000 Total $56,908,000 Average Age (yrs.) 55.4
Meigs Acres2012 Crops Harvested Yield Production Rank
Corn for Grain, Bu. 3,390 130.1 441,000 67Soybeans, Bu. - - - -Wheat, Bu. - - - -Alfalfa Hay, Ton 1,700 2.60 4,400 27Other Hay, Ton 15,200 1.70 26,200 16
Livestock Number Rank
All Cattle & Calves (1/01/13) 9,700 47Milk Cows (1/01/13) 2,000 36
Number of Farms (2007 Census of Agriculture) = 551Average Farm Size (2007 Census of Agriculture) = 141 AcresTotal Land in Farms (2007 Census of Agriculture) = 77,755 Acres Non-irrigated cropland rent per acre = $71.00Commercial Grain Storage Capacity (bu.) = - 2007 Census of Agriculture2011 Cash Receipts from Marketing of Farm Commodities Farm Operator by Age Percent by Age Group PercentCorn $2,210,000 Dairy & Milk $8,315,000 Under 25 0.9Soybeans $1,065,000 Cattle & Calves $3,254,000 25-44 19.2Wheat $44,000 Hogs & Pigs $66,000 45-64 52.6Oats & Hay $1,050,000 Poultry & Other Livestock $437,000 65 plus 27.2Other Crops $11,615,000 Total $28,060,000 Average Age (yrs.) 56.3
TABLE 74
COUNTY SUMMARIES

112 2012 Ohio Department of Agriculture Annual Report and Sta s cs
Mercer Acres2012 Crops Harvested Yield Production Rank
Corn for Grain, Bu. 94,800 110.5 10,476,000 13Soybeans, Bu. 96,000 53.4 5,123,000 7Wheat, Bu. - - - -Alfalfa Hay, Ton 6,000 3.85 23,000 3Other Hay, Ton - - - -
Livestock Number Rank
All Cattle & Calves (1/01/13) 76,000 2Milk Cows (1/01/13) 20,500 2
Number of Farms (2007 Census of Agriculture) = 1,302Average Farm Size (2007 Census of Agriculture) = 225 AcresTotal Land in Farms (2007 Census of Agriculture) = 293,026 Acres Non-irrigated cropland rent per acre = $171.00Commercial Grain Storage Capacity (bu.) = 5,246,000 2007 Census of Agriculture2011 Cash Receipts from Marketing of Farm Commodities Farm Operator by Age Percent by Age Group PercentCorn $74,032,000 Dairy & Milk $84,607,000 Under 25 0.7Soybeans $62,321,000 Cattle & Calves $25,500,000 25-44 26.4Wheat $7,095,000 Hogs & Pigs $106,315,000 45-64 53.5Oats & Hay $1,139,000 Poultry & Other Livestock $214,185,000 65 plus 19.4Other Crops $2,570,000 Total $577,768,000 Average Age (yrs.) 52.7
Miami Acres2012 Crops Harvested Yield Production Rank
Corn for Grain, Bu. 78,300 110.2 8,627,000 24Soybeans, Bu. 77,600 40.9 3,170,000 31Wheat, Bu. - - - -Alfalfa Hay, Ton - - - -Other Hay, Ton - - - -
Livestock Number Rank
All Cattle & Calves (1/01/13) 11,300 38Milk Cows (1/01/13) 1,400 46
Number of Farms (2007 Census of Agriculture) = 1,048Average Farm Size (2007 Census of Agriculture) = 188 AcresTotal Land in Farms (2007 Census of Agriculture) = 196,943 Acres Non-irrigated cropland rent per acre = $163.00Commercial Grain Storage Capacity (bu.) = 6,512,000 2007 Census of Agriculture2011 Cash Receipts from Marketing of Farm Commodities Farm Operator by Age Percent by Age Group PercentCorn $52,930,000 Dairy & Milk $4,818,000 Under 25 0.6Soybeans $44,757,000 Cattle & Calves $3,791,000 25-44 19.8Wheat $3,178,000 Hogs & Pigs $4,053,000 45-64 54.4Oats & Hay $550,000 Poultry & Other Livestock $1,825,000 65 plus 25.2Other Crops $4,177,000 Total $120,083,000 Average Age (yrs.) 55.4
TABLE 74
COUNTY SUMMARIES

2012 Ohio Department of Agriculture Annual Report and Sta s cs 113
Monroe Acres2012 Crops Harvested Yield Production Rank
Corn for Grain, Bu. - - - -Soybeans, Bu. - - - -Wheat, Bu. - - - -Alfalfa Hay, Ton - - - -Other Hay, Ton 19,100 1.75 33,900 6
Livestock Number Rank
All Cattle & Calves (1/01/13) 12,000 36Milk Cows (1/01/13) 1,400 46
Number of Farms (2007 Census of Agriculture) = 636Average Farm Size (2007 Census of Agriculture) = 156 AcresTotal Land in Farms (2007 Census of Agriculture) = 99,306 Acres Non-irrigated cropland rent per acre = $24.50Commercial Grain Storage Capacity (bu.) = - 2007 Census of Agriculture2011 Cash Receipts from Marketing of Farm Commodities Farm Operator by Age Percent by Age Group PercentCorn $215,000 Dairy & Milk $5,096,000 Under 25 0.0Soybeans $49,000 Cattle & Calves $4,026,000 25-44 17.0Wheat $19,000 Hogs & Pigs $132,000 45-64 51.4Oats & Hay $1,718,000 Poultry & Other Livestock $401,000 65 plus 31.6Other Crops $1,812,000 Total $13,471,000 Average Age (yrs.) 57.8
Montgomery Acres2012 Crops Harvested Yield Production Rank
Corn for Grain, Bu. 39,400 69.1 2,723,000 52Soybeans, Bu. 39,200 29.9 1,171,000 53Wheat, Bu. 1,960 71.4 140,000 40Alfalfa Hay, Ton 1,900 2.45 4,700 26Other Hay, Ton - - - -
Livestock Number Rank
All Cattle & Calves (1/01/13) 9,200 53Milk Cows (1/01/13) 500 66
Number of Farms (2007 Census of Agriculture) = 804Average Farm Size (2007 Census of Agriculture) = 138 AcresTotal Land in Farms (2007 Census of Agriculture) = 111,000 Acres Non-irrigated cropland rent per acre = $129.00Commercial Grain Storage Capacity (bu.) = 4,946,000 2007 Census of Agriculture2011 Cash Receipts from Marketing of Farm Commodities Farm Operator by Age Percent by Age Group PercentCorn $27,603,000 Dairy & Milk $2,366,000 Under 25 0.7Soybeans $21,532,000 Cattle & Calves $3,086,000 25-44 15.2Wheat $1,131,000 Hogs & Pigs $2,990,000 45-64 55.3Oats & Hay $506,000 Poultry & Other Livestock $553,000 65 plus 28.7Other Crops $13,642,000 Total $73,412,000 Average Age (yrs.) 56.7
TABLE 74
COUNTY SUMMARIES

114 2012 Ohio Department of Agriculture Annual Report and Sta s cs
Morgan Acres2012 Crops Harvested Yield Production Rank
Corn for Grain, Bu. 2,550 106.7 272,000 75Soybeans, Bu. 2,590 42.5 110,000 71Wheat, Bu. - - - -Alfalfa Hay, Ton 3,800 2.80 10,700 9Other Hay, Ton 17,300 1.60 27,700 14
Livestock Number Rank
All Cattle & Calves (1/01/13) 13,300 34Milk Cows (1/01/13) 1,100 55
Number of Farms (2007 Census of Agriculture) = 524Average Farm Size (2007 Census of Agriculture) = 195 AcresTotal Land in Farms (2007 Census of Agriculture) = 102,271 Acres Non-irrigated cropland rent per acre = $49.50Commercial Grain Storage Capacity (bu.) = - 2007 Census of Agriculture2011 Cash Receipts from Marketing of Farm Commodities Farm Operator by Age Percent by Age Group PercentCorn $1,985,000 Dairy & Milk $4,008,000 Under 25 0.0Soybeans $964,000 Cattle & Calves $4,462,000 25-44 17.4Wheat $95,000 Hogs & Pigs $1,627,000 45-64 50.2Oats & Hay $1,363,000 Poultry & Other Livestock $364,000 65 plus 32.4Other Crops $1,464,000 Total $16,336,000 Average Age (yrs.) 56.8
Morrow Acres2012 Crops Harvested Yield Production Rank
Corn for Grain, Bu. 45,300 148.4 6,722,000 32Soybeans, Bu. 64,600 48.5 3,130,000 33Wheat, Bu. 7,820 66.9 523,000 16Alfalfa Hay, Ton - - - -Other Hay, Ton - - - -
Livestock Number Rank
All Cattle & Calves (1/01/13) 9,700 47Milk Cows (1/01/13) 1,700 42
Number of Farms (2007 Census of Agriculture) = 874Average Farm Size (2007 Census of Agriculture) = 189 AcresTotal Land in Farms (2007 Census of Agriculture) = 165,023 Acres Non-irrigated cropland rent per acre = $108.00Commercial Grain Storage Capacity (bu.) = 6,906,000 2007 Census of Agriculture2011 Cash Receipts from Marketing of Farm Commodities Farm Operator by Age Percent by Age Group PercentCorn $40,143,000 Dairy & Milk $7,548,000 Under 25 0.7Soybeans $36,080,000 Cattle & Calves $3,254,000 25-44 23.1Wheat $5,149,000 Hogs & Pigs $12,458,000 45-64 52.9Oats & Hay $746,000 Poultry & Other Livestock $1,063,000 65 plus 23.3Other Crops $4,169,000 Total $110,614,000 Average Age (yrs.) 54.0
TABLE 74
COUNTY SUMMARIES

2012 Ohio Department of Agriculture Annual Report and Sta s cs 115
Muskingum Acres2012 Crops Harvested Yield Production Rank
Corn for Grain, Bu. 18,800 132.4 2,489,000 55Soybeans, Bu. 13,500 49.2 664,000 61Wheat, Bu. 600 47.0 28,200 54Alfalfa Hay, Ton - - - -Other Hay, Ton 26,100 1.90 49,400 4
Livestock Number Rank
All Cattle & Calves (1/01/13) 28,000 8Milk Cows (1/01/13) 1,600 44
Number of Farms (2007 Census of Agriculture) = 1,162Average Farm Size (2007 Census of Agriculture) = 143 AcresTotal Land in Farms (2007 Census of Agriculture) = 166,448 Acres Non-irrigated cropland rent per acre = $68.00Commercial Grain Storage Capacity (bu.) = 1,859,000 2007 Census of Agriculture2011 Cash Receipts from Marketing of Farm Commodities Farm Operator by Age Percent by Age Group PercentCorn $15,436,000 Dairy & Milk $5,906,000 Under 25 0.3Soybeans $6,810,000 Cattle & Calves $9,394,000 25-44 17.9Wheat $277,000 Hogs & Pigs $8,139,000 45-64 51.2Oats & Hay $2,917,000 Poultry & Other Livestock $3,591,000 65 plus 30.6Other Crops $3,707,000 Total $56,181,000 Average Age (yrs.) 56.9
Noble Acres2012 Crops Harvested Yield Production Rank
Corn for Grain, Bu. 510 113.3 57,800 79Soybeans, Bu. - - - -Wheat, Bu. - - - -Alfalfa Hay, Ton - - - -Other Hay, Ton 16,500 1.80 30,100 9
Livestock Number Rank
All Cattle & Calves (1/01/13) 11,200 40Milk Cows (1/01/13) 200 76
Number of Farms (2007 Census of Agriculture) = 534Average Farm Size (2007 Census of Agriculture) = 167 AcresTotal Land in Farms (2007 Census of Agriculture) = 89,298 Acres Non-irrigated cropland rent per acre = -Commercial Grain Storage Capacity (bu.) = - 2007 Census of Agriculture2011 Cash Receipts from Marketing of Farm Commodities Farm Operator by Age Percent by Age Group PercentCorn $212,000 Dairy & Milk $682,000 Under 25 0.4Soybeans $249,000 Cattle & Calves $3,757,000 25-44 24.2Wheat 17000 Hogs & Pigs $66,000 45-64 50.2Oats & Hay $1,228,000 Poultry & Other Livestock $353,000 65 plus 25.3Other Crops $204,000 Total $6,772,000 Average Age (yrs.) 54.2
TABLE 74
COUNTY SUMMARIES
116 2012 Ohio Department of Agriculture Annual Report and Sta s cs
Ottawa Acres2012 Crops Harvested Yield Production Rank
Corn for Grain, Bu. 25,000 158.0 3,950,000 44Soybeans, Bu. 59,900 53.0 3,172,000 30Wheat, Bu. 2,050 65.9 135,000 41Alfalfa Hay, Ton 2,900 3.35 9,700 13Other Hay, Ton - - - -
Livestock Number Rank
All Cattle & Calves (1/01/13) 1,500 83Milk Cows (1/01/13) 300 71
Number of Farms (2007 Census of Agriculture) = 589Average Farm Size (2007 Census of Agriculture) = 195 AcresTotal Land in Farms (2007 Census of Agriculture) = 115,145 Acres Non-irrigated cropland rent per acre = $104.00Commercial Grain Storage Capacity (bu.) = 3,110,000 2007 Census of Agriculture2011 Cash Receipts from Marketing of Farm Commodities Farm Operator by Age Percent by Age Group PercentCorn $16,730,000 Dairy & Milk $1,066,000 Under 25 0.7Soybeans $29,937,000 Cattle & Calves $503,000 25-44 18.0Wheat $5,772,000 Hogs & Pigs $1,428,000 45-64 55.2Oats & Hay $536,000 Poultry & Other Livestock $321,000 65 plus 26.1Other Crops $5,690,000 Total $61,987,000 Average Age (yrs.) 55.9
Paulding Acres2012 Crops Harvested Yield Production Rank
Corn for Grain, Bu. 62,200 91.7 5,701,000 36Soybeans, Bu. 111,700 40.7 4,543,000 14Wheat, Bu. 21,400 64.2 1,373,000 3Alfalfa Hay, Ton 1400 3.00 4,200 29Other Hay, Ton - - - -
Livestock Number Rank
All Cattle & Calves (1/01/13) 8,400 56Milk Cows (1/01/13) 7,800 8
Number of Farms (2007 Census of Agriculture) = 754Average Farm Size (2007 Census of Agriculture) = 339 AcresTotal Land in Farms (2007 Census of Agriculture) = 255,564 Acres Non-irrigated cropland rent per acre = $127.00Commercial Grain Storage Capacity (bu.) = 6,862,000 2007 Census of Agriculture2011 Cash Receipts from Marketing of Farm Commodities Farm Operator by Age Percent by Age Group PercentCorn $36,171,000 Dairy & Milk $38,018,000 Under 25 0.5Soybeans $57,019,000 Cattle & Calves $2,818,000 25-44 16.2Wheat $14,584,000 Hogs & Pigs $6,810,000 45-64 54.9Oats & Hay $369,000 Poultry & Other Livestock $7,937,000 65 plus 28.4Other Crops $1,144,000 Total $164,874,000 Average Age (yrs.) 57.1
TABLE 74
COUNTY SUMMARIES
2012 Ohio Department of Agriculture Annual Report and Sta s cs 117
Perry Acres2012 Crops Harvested Yield Production Rank
Corn for Grain, Bu. 18,400 104.3 1,919,000 60Soybeans, Bu. 16,000 42.0 672,000 60Wheat, Bu. 860 59.1 50,800 51Alfalfa Hay, Ton - - - -Other Hay, Ton 10,800 1.60 17,200 24
Livestock Number Rank
All Cattle & Calves (1/01/13) 9,400 49Milk Cows (1/01/13) 500 66
Number of Farms (2007 Census of Agriculture) = 643Average Farm Size (2007 Census of Agriculture) = 152 AcresTotal Land in Farms (2007 Census of Agriculture) = 97,965 Acres Non-irrigated cropland rent per acre = $83.00Commercial Grain Storage Capacity (bu.) = 247,000 2007 Census of Agriculture2011 Cash Receipts from Marketing of Farm Commodities Farm Operator by Age Percent by Age Group PercentCorn $14,350,000 Dairy & Milk $2,025,000 Under 25 0.6Soybeans $8,553,000 Cattle & Calves $3,154,000 25-44 17.6Wheat $616,000 Hogs & Pigs $2,857,000 45-64 55.7Oats & Hay $967,000 Poultry & Other Livestock $407,000 65 plus 26.1Other Crops $1,411,000 Total $34,344,000 Average Age (yrs.) 55.9
Pickaway Acres2012 Crops Harvested Yield Production Rank
Corn for Grain, Bu. 95,500 96.3 9,194,000 20Soybeans, Bu. 105,800 37.1 3,924,000 25Wheat, Bu. - - - -Alfalfa Hay, Ton - - - -Other Hay, Ton 3,100 2.05 6,400 33
Livestock Number Rank
All Cattle & Calves (1/01/13) 8,500 55Milk Cows (1/01/13) 1,400 46
Number of Farms (2007 Census of Agriculture) = 832Average Farm Size (2007 Census of Agriculture) = 347 AcresTotal Land in Farms (2007 Census of Agriculture) = 288,905 Acres Non-irrigated cropland rent per acre = $140.00Commercial Grain Storage Capacity (bu.) = 5,142,000 2007 Census of Agriculture2011 Cash Receipts from Marketing of Farm Commodities Farm Operator by Age Percent by Age Group PercentCorn $74,575,000 Dairy & Milk $6,311,000 Under 25 0.2Soybeans $66,821,000 Cattle & Calves $2,852,000 25-44 13.5Wheat $5,721,000 Hogs & Pigs $11,296,000 45-64 56.3Oats & Hay $691,000 Poultry & Other Livestock $616,000 65 plus 30.0Other Crops $9,171,000 Total $178,057,000 Average Age (yrs.) 57.9
TABLE 74
COUNTY SUMMARIES

118 2012 Ohio Department of Agriculture Annual Report and Sta s cs
Pike Acres2012 Crops Harvested Yield Production Rank
Corn for Grain, Bu. - - - -Soybeans, Bu. - - - -Wheat, Bu. - - - -Alfalfa Hay, Ton - - - -Other Hay, Ton 9,800 1.95 19,200 22
Livestock Number Rank
All Cattle & Calves (1/01/13) 6,700 63Milk Cows (1/01/13) 400 69
Number of Farms (2007 Census of Agriculture) = 538Average Farm Size (2007 Census of Agriculture) = 150 AcresTotal Land in Farms (2007 Census of Agriculture) = 80,636 Acres Non-irrigated cropland rent per acre = $86.00Commercial Grain Storage Capacity (bu.) = - 2007 Census of Agriculture2011 Cash Receipts from Marketing of Farm Commodities Farm Operator by Age Percent by Age Group PercentCorn $8,277,000 Dairy & Milk $1,812,000 Under 25 0.6Soybeans $7,169,000 Cattle & Calves $2,248,000 25-44 19.7Wheat $279,000 Hogs & Pigs $332,000 45-64 51.9Oats & Hay $922,000 Poultry & Other Livestock $401,000 65 plus 27.9Other Crops $1,977,000 Total $23,421,000 Average Age (yrs.) 55.8
Portage Acres2012 Crops Harvested Yield Production Rank
Corn for Grain, Bu. 14,300 141.6 2,025,000 58Soybeans, Bu. 19,300 46.9 906,000 57Wheat, Bu. 1,360 62.8 85,400 48Alfalfa Hay, Ton - - - -Other Hay, Ton 6,500 1.85 11,900 29
Livestock Number Rank
All Cattle & Calves (1/01/13) 7,700 58Milk Cows (1/01/13) 1,800 38
Number of Farms (2007 Census of Agriculture) = 862Average Farm Size (2007 Census of Agriculture) = 96 AcresTotal Land in Farms (2007 Census of Agriculture) = 82,759 Acres Non-irrigated cropland rent per acre = $56.50Commercial Grain Storage Capacity (bu.) = 1,944,000 2007 Census of Agriculture2011 Cash Receipts from Marketing of Farm Commodities Farm Operator by Age Percent by Age Group PercentCorn $9,950,000 Dairy & Milk $7,377,000 Under 25 0.1Soybeans $9,171,000 Cattle & Calves $2,583,000 25-44 17.3Wheat $1,265,000 Hogs & Pigs $199,000 45-64 55.6Oats & Hay $1,079,000 Poultry & Other Livestock $2,242,000 65 plus 27.0Other Crops $11,669,000 Total $45,538,000 Average Age (yrs.) 56.5
TABLE 74
COUNTY SUMMARIES

2012 Ohio Department of Agriculture Annual Report and Sta s cs 119
Preble Acres2012 Crops Harvested Yield Production Rank
Corn for Grain, Bu. 79,800 76.9 6,136,000 35Soybeans, Bu. 81,400 37.7 3,071,000 34Wheat, Bu. 4,140 74.9 310,000 30Alfalfa Hay, Ton - - - -Other Hay, Ton - - - -
Livestock Number Rank
All Cattle & Calves (1/01/13) 15,600 28Milk Cows (1/01/13) 1,700 42
Number of Farms (2007 Census of Agriculture) = 1,181Average Farm Size (2007 Census of Agriculture) = 195 AcresTotal Land in Farms (2007 Census of Agriculture) = 230,616 Acres Non-irrigated cropland rent per acre = $140.00Commercial Grain Storage Capacity (bu.) = 4,970,000 2007 Census of Agriculture2011 Cash Receipts from Marketing of Farm Commodities Farm Operator by Age Percent by Age Group PercentCorn $59,150,000 Dairy & Milk $5,778,000 Under 25 0.6Soybeans $42,891,000 Cattle & Calves $5,234,000 25-44 20.3Wheat $2,225,000 Hogs & Pigs $18,273,000 45-64 53.3Oats & Hay $398,000 Poultry & Other Livestock $837,000 65 plus 25.7Other Crops $3,637,000 Total $138,426,000 Average Age (yrs.) 54.8
Putnam Acres2012 Crops Harvested Yield Production Rank
Corn for Grain, Bu. 81,200 116.9 9,494,000 18Soybeans, Bu. 133,100 48.6 6,465,000 4Wheat, Bu. 27,900 65.8 1,835,000 1Alfalfa Hay, Ton 4,600 3.35 15,500 6Other Hay, Ton - - - -
Livestock Number Rank
All Cattle & Calves (1/01/13) 13,500 33Milk Cows (1/01/13) 4,500 18
Number of Farms (2007 Census of Agriculture) = 1,316Average Farm Size (2007 Census of Agriculture) = 231 AcresTotal Land in Farms (2007 Census of Agriculture) = 303,751 Acres Non-irrigated cropland rent per acre = $132.00Commercial Grain Storage Capacity (bu.) = 8,306,000 2007 Census of Agriculture2011 Cash Receipts from Marketing of Farm Commodities Farm Operator by Age Percent by Age Group PercentCorn $70,264,000 Dairy & Milk $22,580,000 Under 25 0.8Soybeans $81,653,000 Cattle & Calves $4,529,000 25-44 20.4Wheat $15,576,000 Hogs & Pigs $29,901,000 45-64 57.3Oats & Hay $1,121,000 Poultry & Other Livestock $8,899,000 65 plus 21.5Other Crops $14,734,000 Total $249,262,000 Average Age (yrs.) 53.7
TABLE 74
COUNTY SUMMARIES
120 2012 Ohio Department of Agriculture Annual Report and Sta s cs
Richland Acres2012 Crops Harvested Yield Production Rank
Corn for Grain, Bu. 34,800 125.7 4,373,000 42Soybeans, Bu. 39,500 43.9 1,735,000 43Wheat, Bu. - - - -Alfalfa Hay, Ton - - - -Other Hay, Ton - - - -
Livestock Number Rank
All Cattle & Calves (1/01/13) 20,000 16Milk Cows (1/01/13) 6,100 12
Number of Farms (2007 Census of Agriculture) = 1,009Average Farm Size (2007 Census of Agriculture) = 145 AcresTotal Land in Farms (2007 Census of Agriculture) = 146,580 Acres Non-irrigated cropland rent per acre = $98.00Commercial Grain Storage Capacity (bu.) = 4,129,000 2007 Census of Agriculture2011 Cash Receipts from Marketing of Farm Commodities Farm Operator by Age Percent by Age Group PercentCorn $26,385,000 Dairy & Milk $25,224,000 Under 25 1.1Soybeans $23,682,000 Cattle & Calves $6,710,000 25-44 19.7Wheat $2,663,000 Hogs & Pigs $7,475,000 45-64 53.9Oats & Hay $1,277,000 Poultry & Other Livestock $3,073,000 65 plus 25.3Other Crops $6,558,000 Total $103,052,000 Average Age (yrs.) 54.8
Ross Acres2012 Crops Harvested Yield Production Rank
Corn for Grain, Bu. - - - -Soybeans, Bu. 55,500 39.6 2,196,000 41Wheat, Bu. 6,680 65.0 434,000 19Alfalfa Hay, Ton - - - -Other Hay, Ton 12,900 1.80 23,200 20
Livestock Number Rank
All Cattle & Calves (1/01/13) 14,000 31Milk Cows (1/01/13) 1,100 55
Number of Farms (2007 Census of Agriculture) = 1,009Average Farm Size (2007 Census of Agriculture) = 222 AcresTotal Land in Farms (2007 Census of Agriculture) = 223,650 Acres Non-irrigated cropland rent per acre = $111.00Commercial Grain Storage Capacity (bu.) = 2,928,000 2007 Census of Agriculture2011 Cash Receipts from Marketing of Farm Commodities Farm Operator by Age Percent by Age Group PercentCorn $41,223,000 Dairy & Milk $3,795,000 Under 25 0.1Soybeans $35,684,000 Cattle & Calves $4,697,000 25-44 16.4Wheat $3,401,000 Hogs & Pigs $664,000 45-64 52.1Oats & Hay $1,595,000 Poultry & Other Livestock $540,000 65 plus 31.4Other Crops $3,448,000 Total $95,052,000 Average Age (yrs.) 57.8
TABLE 74
COUNTY SUMMARIES

2012 Ohio Department of Agriculture Annual Report and Sta s cs 121
Sandusky Acres2012 Crops Harvested Yield Production Rank
Corn for Grain, Bu. 73,000 147.5 10,764,000 11Soybeans, Bu. 89,500 51.9 4,642,000 11Wheat, Bu. - - - -Alfalfa Hay, Ton - - - -Other Hay, Ton - - - -
Livestock Number Rank
All Cattle & Calves (1/01/13) 4,500 71Milk Cows (1/01/13) 800 60
Number of Farms (2007 Census of Agriculture) = 781Average Farm Size (2007 Census of Agriculture) = 232 AcresTotal Land in Farms (2007 Census of Agriculture) = 181,337 Acres Non-irrigated cropland rent per acre = $133.00Commercial Grain Storage Capacity (bu.) = 11,644,000 2007 Census of Agriculture2011 Cash Receipts from Marketing of Farm Commodities Farm Operator by Age Percent by Age Group PercentCorn $55,041,000 Dairy & Milk $2,793,000 Under 25 0.0Soybeans $50,517,000 Cattle & Calves $1,509,000 25-44 19.8Wheat $8,964,000 Hogs & Pigs $2,159,000 45-64 56.3Oats & Hay $713,000 Poultry & Other Livestock $279,000 65 plus 23.8Other Crops $20,399,000 Total $142,380,000 Average Age (yrs.) 54.9
Scioto Acres2012 Crops Harvested Yield Production Rank
Corn for Grain, Bu. 6,720 102.2 687,000 66Soybeans, Bu. 14,900 34.3 511,000 63Wheat, Bu. 350 36.0 12,600 56Alfalfa Hay, Ton - - - -Other Hay, Ton 14,400 1.65 24,100 17
Livestock Number Rank
All Cattle & Calves (1/01/13) 9,200 53Milk Cows (1/01/13) - -
Number of Farms (2007 Census of Agriculture) = 755Average Farm Size (2007 Census of Agriculture) = 135 AcresTotal Land in Farms (2007 Census of Agriculture) = 102,025 Acres Non-irrigated cropland rent per acre = $50.00Commercial Grain Storage Capacity (bu.) = - 2007 Census of Agriculture2011 Cash Receipts from Marketing of Farm Commodities Farm Operator by Age Percent by Age Group PercentCorn $5,337,000 Dairy & Milk $319,000 Under 25 0.4Soybeans $6,996,000 Cattle & Calves $3,086,000 25-44 21.1Wheat $152,000 Hogs & Pigs $99,000 45-64 51.4Oats & Hay $1,148,000 Poultry & Other Livestock $6,577,000 65 plus 27.2Other Crops $2,107,000 Total $25,825,000 Average Age (yrs.) 55.4
TABLE 74
COUNTY SUMMARIES
122 2012 Ohio Department of Agriculture Annual Report and Sta s cs
Seneca Acres2012 Crops Harvested Yield Production Rank
Corn for Grain, Bu. 99,500 117.4 11,679,000 7Soybeans, Bu. 130,900 38.3 5,007,000 9Wheat, Bu. - - - -Alfalfa Hay, Ton 2,300 3.15 7,200 18Other Hay, Ton - - - -
Livestock Number Rank
All Cattle & Calves (1/01/13) 9,800 46Milk Cows (1/01/13) 700 63
Number of Farms (2007 Census of Agriculture) = 1,147Average Farm Size (2007 Census of Agriculture) = 235 AcresTotal Land in Farms (2007 Census of Agriculture) = 269,371 Acres Non-irrigated cropland rent per acre = $124.00Commercial Grain Storage Capacity (bu.) = 10,176,000 2007 Census of Agriculture2011 Cash Receipts from Marketing of Farm Commodities Farm Operator by Age Percent by Age Group PercentCorn $72,924,000 Dairy & Milk $2,985,000 Under 25 0.0Soybeans $73,236,000 Cattle & Calves $3,288,000 25-44 21.4Wheat $14,597,000 Hogs & Pigs $16,611,000 45-64 51.8Oats & Hay $528,000 Poultry & Other Livestock $513,000 65 plus 26.9Other Crops $7,448,000 Total $192,133,000 Average Age (yrs.) 55.3
Shelby Acres2012 Crops Harvested Yield Production Rank
Corn for Grain, Bu. 70,200 136.1 9,552,000 17Soybeans, Bu. 89,100 49.5 4,414,000 18Wheat, Bu. 12,700 74.0 940,000 11Alfalfa Hay, Ton 3,300 3.60 11,800 8Other Hay, Ton - - - -
Livestock Number Rank
All Cattle & Calves (1/01/13) 26,500 9Milk Cows (1/01/13) 6,700 10
Number of Farms (2007 Census of Agriculture) = 1,050Average Farm Size (2007 Census of Agriculture) = 208 AcresTotal Land in Farms (2007 Census of Agriculture) = 217,969 Acres Non-irrigated cropland rent per acre = $162.00Commercial Grain Storage Capacity (bu.) = 9,334,000 2007 Census of Agriculture2011 Cash Receipts from Marketing of Farm Commodities Farm Operator by Age Percent by Age Group PercentCorn $55,157,000 Dairy & Milk $30,128,000 Under 25 0.7Soybeans $51,951,000 Cattle & Calves $8,891,000 25-44 19.9Wheat $6,230,000 Hogs & Pigs $29,236,000 45-64 57.5Oats & Hay $789,000 Poultry & Other Livestock $3,316,000 65 plus 21.9Other Crops $1,167,000 Total $186,870,000 Average Age (yrs.) 55.0
TABLE 74
COUNTY SUMMARIES

2012 Ohio Department of Agriculture Annual Report and Sta s cs 123
Stark Acres2012 Crops Harvested Yield Production Rank
Corn for Grain, Bu. 29,100 121.5 3,536,000 45Soybeans, Bu. 28,100 44.6 1,253,000 51Wheat, Bu. 5,690 70.3 400,000 21Alfalfa Hay, Ton - - - -Other Hay, Ton - - - -
Livestock Number Rank
All Cattle & Calves (1/01/13) 26,000 11Milk Cows (1/01/13) 9,400 6
Number of Farms (2007 Census of Agriculture) = 1,300Average Farm Size (2007 Census of Agriculture) = 106 AcresTotal Land in Farms (2007 Census of Agriculture) = 138,061 Acres Non-irrigated cropland rent per acre = $65.50Commercial Grain Storage Capacity (bu.) = 1,291,000 2007 Census of Agriculture2011 Cash Receipts from Marketing of Farm Commodities Farm Operator by Age Percent by Age Group PercentCorn $20,664,000 Dairy & Milk $42,602,000 Under 25 0.5Soybeans $16,155,000 Cattle & Calves $8,723,000 25-44 17.6Wheat $2,727,000 Hogs & Pigs $2,292,000 45-64 52.6Oats & Hay $1,470,000 Poultry & Other Livestock $78,442,000 65 plus 29.2Other Crops $11,430,000 Total $184,509,000 Average Age (yrs.) 56.4
Summit Acres2012 Crops Harvested Yield Production Rank
Corn for Grain, Bu. 1,200 105.6 126,700 77Soybeans, Bu. 1,780 43.1 76,800 75Wheat, Bu. - - - -Alfalfa Hay, Ton 1,100 2.65 2,900 32Other Hay, Ton 1,400 1.70 2,400 40
Livestock Number Rank
All Cattle & Calves (1/01/13) 1,200 84Milk Cows (1/01/13) - -
Number of Farms (2007 Census of Agriculture) = 334Average Farm Size (2007 Census of Agriculture) = 45 AcresTotal Land in Farms (2007 Census of Agriculture) = 15,166 Acres Non-irrigated cropland rent per acre = -Commercial Grain Storage Capacity (bu.) = - 2007 Census of Agriculture2011 Cash Receipts from Marketing of Farm Commodities Farm Operator by Age Percent by Age Group PercentCorn $1,069,000 Dairy & Milk $341,000 Under 25 0.0Soybeans $671,000 Cattle & Calves $402,000 25-44 13.8Wheat $59,000 Hogs & Pigs $3,000 45-64 59.0Oats & Hay $224,000 Poultry & Other Livestock $471,000 65 plus 27.2Other Crops $9,742,000 Total $12,985,000 Average Age (yrs.) 57.1
TABLE 74
COUNTY SUMMARIES
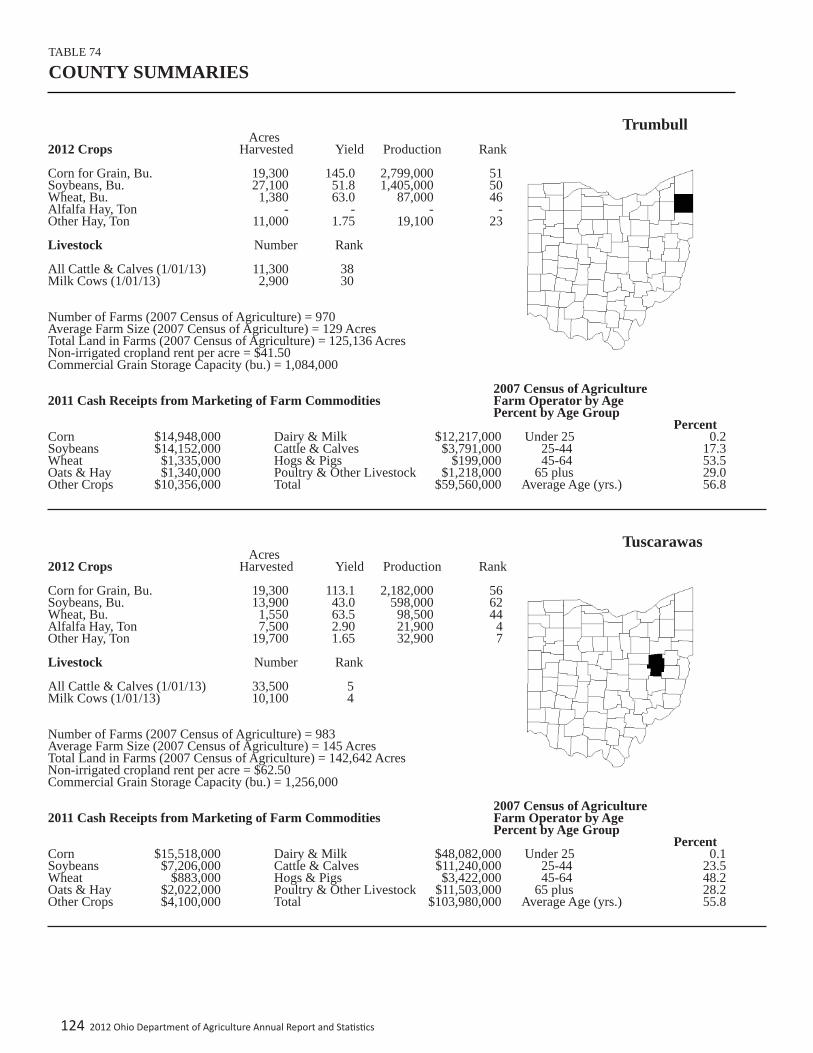
124 2012 Ohio Department of Agriculture Annual Report and Sta s cs
Trumbull Acres2012 Crops Harvested Yield Production Rank
Corn for Grain, Bu. 19,300 145.0 2,799,000 51Soybeans, Bu. 27,100 51.8 1,405,000 50Wheat, Bu. 1,380 63.0 87,000 46Alfalfa Hay, Ton - - - -Other Hay, Ton 11,000 1.75 19,100 23
Livestock Number Rank
All Cattle & Calves (1/01/13) 11,300 38Milk Cows (1/01/13) 2,900 30
Number of Farms (2007 Census of Agriculture) = 970Average Farm Size (2007 Census of Agriculture) = 129 AcresTotal Land in Farms (2007 Census of Agriculture) = 125,136 Acres Non-irrigated cropland rent per acre = $41.50Commercial Grain Storage Capacity (bu.) = 1,084,000 2007 Census of Agriculture2011 Cash Receipts from Marketing of Farm Commodities Farm Operator by Age Percent by Age Group PercentCorn $14,948,000 Dairy & Milk $12,217,000 Under 25 0.2Soybeans $14,152,000 Cattle & Calves $3,791,000 25-44 17.3Wheat $1,335,000 Hogs & Pigs $199,000 45-64 53.5Oats & Hay $1,340,000 Poultry & Other Livestock $1,218,000 65 plus 29.0Other Crops $10,356,000 Total $59,560,000 Average Age (yrs.) 56.8
Tuscarawas Acres2012 Crops Harvested Yield Production Rank
Corn for Grain, Bu. 19,300 113.1 2,182,000 56Soybeans, Bu. 13,900 43.0 598,000 62Wheat, Bu. 1,550 63.5 98,500 44Alfalfa Hay, Ton 7,500 2.90 21,900 4Other Hay, Ton 19,700 1.65 32,900 7
Livestock Number Rank
All Cattle & Calves (1/01/13) 33,500 5Milk Cows (1/01/13) 10,100 4
Number of Farms (2007 Census of Agriculture) = 983Average Farm Size (2007 Census of Agriculture) = 145 AcresTotal Land in Farms (2007 Census of Agriculture) = 142,642 Acres Non-irrigated cropland rent per acre = $62.50Commercial Grain Storage Capacity (bu.) = 1,256,000 2007 Census of Agriculture2011 Cash Receipts from Marketing of Farm Commodities Farm Operator by Age Percent by Age Group PercentCorn $15,518,000 Dairy & Milk $48,082,000 Under 25 0.1Soybeans $7,206,000 Cattle & Calves $11,240,000 25-44 23.5Wheat $883,000 Hogs & Pigs $3,422,000 45-64 48.2Oats & Hay $2,022,000 Poultry & Other Livestock $11,503,000 65 plus 28.2Other Crops $4,100,000 Total $103,980,000 Average Age (yrs.) 55.8
TABLE 74
COUNTY SUMMARIES
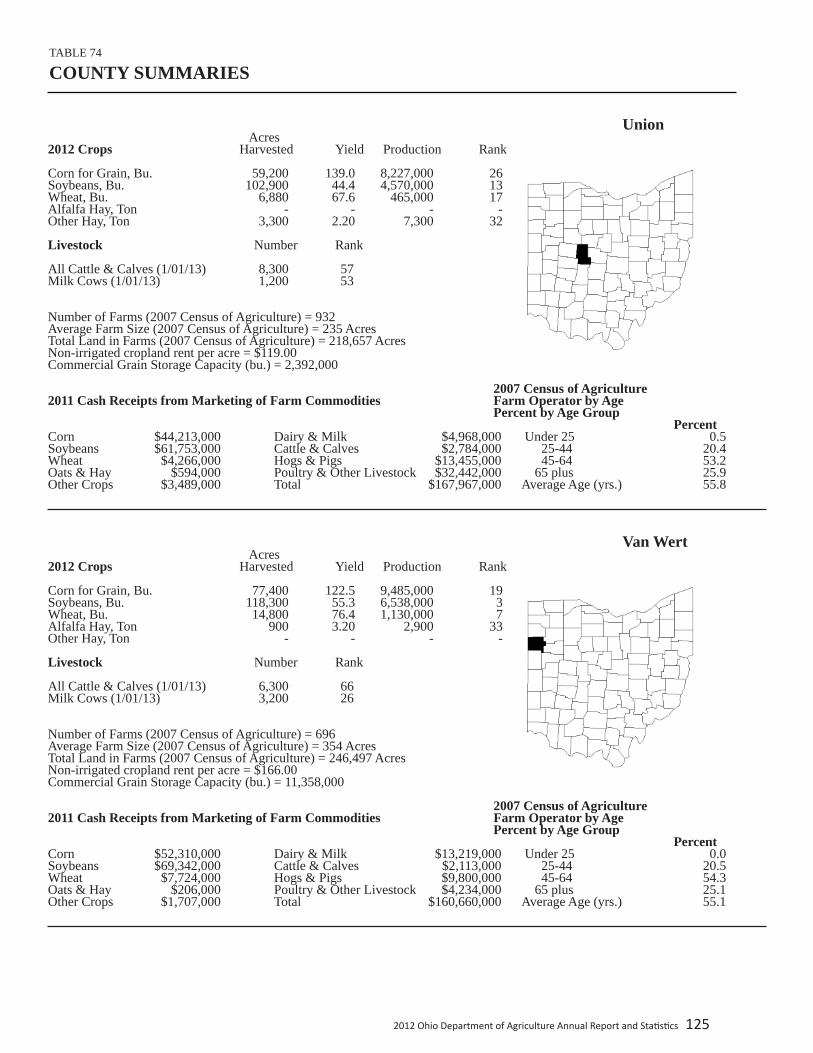
2012 Ohio Department of Agriculture Annual Report and Sta s cs 125
Union Acres2012 Crops Harvested Yield Production Rank
Corn for Grain, Bu. 59,200 139.0 8,227,000 26Soybeans, Bu. 102,900 44.4 4,570,000 13Wheat, Bu. 6,880 67.6 465,000 17Alfalfa Hay, Ton - - - -Other Hay, Ton 3,300 2.20 7,300 32
Livestock Number Rank
All Cattle & Calves (1/01/13) 8,300 57Milk Cows (1/01/13) 1,200 53
Number of Farms (2007 Census of Agriculture) = 932Average Farm Size (2007 Census of Agriculture) = 235 AcresTotal Land in Farms (2007 Census of Agriculture) = 218,657 Acres Non-irrigated cropland rent per acre = $119.00Commercial Grain Storage Capacity (bu.) = 2,392,000 2007 Census of Agriculture2011 Cash Receipts from Marketing of Farm Commodities Farm Operator by Age Percent by Age Group PercentCorn $44,213,000 Dairy & Milk $4,968,000 Under 25 0.5Soybeans $61,753,000 Cattle & Calves $2,784,000 25-44 20.4Wheat $4,266,000 Hogs & Pigs $13,455,000 45-64 53.2Oats & Hay $594,000 Poultry & Other Livestock $32,442,000 65 plus 25.9Other Crops $3,489,000 Total $167,967,000 Average Age (yrs.) 55.8
Van Wert Acres2012 Crops Harvested Yield Production Rank
Corn for Grain, Bu. 77,400 122.5 9,485,000 19Soybeans, Bu. 118,300 55.3 6,538,000 3Wheat, Bu. 14,800 76.4 1,130,000 7Alfalfa Hay, Ton 900 3.20 2,900 33Other Hay, Ton - - - -
Livestock Number Rank
All Cattle & Calves (1/01/13) 6,300 66Milk Cows (1/01/13) 3,200 26
Number of Farms (2007 Census of Agriculture) = 696Average Farm Size (2007 Census of Agriculture) = 354 AcresTotal Land in Farms (2007 Census of Agriculture) = 246,497 Acres Non-irrigated cropland rent per acre = $166.00Commercial Grain Storage Capacity (bu.) = 11,358,000 2007 Census of Agriculture2011 Cash Receipts from Marketing of Farm Commodities Farm Operator by Age Percent by Age Group PercentCorn $52,310,000 Dairy & Milk $13,219,000 Under 25 0.0Soybeans $69,342,000 Cattle & Calves $2,113,000 25-44 20.5Wheat $7,724,000 Hogs & Pigs $9,800,000 45-64 54.3Oats & Hay $206,000 Poultry & Other Livestock $4,234,000 65 plus 25.1Other Crops $1,707,000 Total $160,660,000 Average Age (yrs.) 55.1
TABLE 74
COUNTY SUMMARIES

126 2012 Ohio Department of Agriculture Annual Report and Sta s cs
Vinton Acres2012 Crops Harvested Yield Production Rank
Corn for Grain, Bu. - - - -Soybeans, Bu. - - - -Wheat, Bu. - - - -Alfalfa Hay, Ton - - - -Other Hay, Ton 7,300 1.40 10,300 31
Livestock Number Rank
All Cattle & Calves (1/01/13) 2,600 79Milk Cows (1/01/13) - -
Number of Farms (2007 Census of Agriculture) = 250Average Farm Size (2007 Census of Agriculture) = 147 AcresTotal Land in Farms (2007 Census of Agriculture) = 36,811 Acres Non-irrigated cropland rent per acre = $52.50Commercial Grain Storage Capacity (bu.) = - 2007 Census of Agriculture2011 Cash Receipts from Marketing of Farm Commodities Farm Operator by Age Percent by Age Group PercentCorn $1,108,000 Dairy & Milk $149,000 Under 25 0.0Soybeans $704,000 Cattle & Calves $872,000 25-44 19.6Wheat $19,000 Hogs & Pigs $66,000 45-64 54.8Oats & Hay $467,000 Poultry & Other Livestock $277,000 65 plus 25.6Other Crops $1,541,000 Total $5,206,000 Average Age (yrs.) 56.5
Warren Acres2012 Crops Harvested Yield Production Rank
Corn for Grain, Bu. 24,600 130.4 3,209,000 48Soybeans, Bu. 36,500 40.9 1,494,000 49Wheat, Bu. - - - -Alfalfa Hay, Ton 1,700 2.60 4,400 28Other Hay, Ton - - - -
Livestock Number Rank
All Cattle & Calves (1/01/13) 3,600 76Milk Cows (1/01/13) 100 80
Number of Farms (2007 Census of Agriculture) = 896Average Farm Size (2007 Census of Agriculture) = 105 AcresTotal Land in Farms (2007 Census of Agriculture) = 94,348 Acres Non-irrigated cropland rent per acre = $97.50Commercial Grain Storage Capacity (bu.) = 597,000 2007 Census of Agriculture2011 Cash Receipts from Marketing of Farm Commodities Farm Operator by Age Percent by Age Group PercentCorn $15,765,000 Dairy & Milk $362,000 Under 25 0.2Soybeans $20,085,000 Cattle & Calves $1,207,000 25-44 14.7Wheat $1,106,000 Hogs & Pigs $365,000 45-64 55.4Oats & Hay $637,000 Poultry & Other Livestock $1,163,000 65 plus 29.7Other Crops $7,105,000 Total $47,800,000 Average Age (yrs.) 57.8
TABLE 74
COUNTY SUMMARIES

2012 Ohio Department of Agriculture Annual Report and Sta s cs 127
Washington Acres2012 Crops Harvested Yield Production Rank
Corn for Grain, Bu. 7,750 126.6 981,000 64Soybeans, Bu. 7,520 46.8 352,000 65Wheat, Bu. 560 37.1 20,800 55Alfalfa Hay, Ton - - - -Other Hay, Ton 17,300 1.90 32,500 8
Livestock Number Rank
All Cattle & Calves (1/01/13) 17,800 24Milk Cows (1/01/13) 2,400 33
Number of Farms (2007 Census of Agriculture) = 856Average Farm Size (2007 Census of Agriculture) = 145 AcresTotal Land in Farms (2007 Census of Agriculture) = 124,069 Acres Non-irrigated cropland rent per acre = $59.00Commercial Grain Storage Capacity (bu.) = 63,000 2007 Census of Agriculture2011 Cash Receipts from Marketing of Farm Commodities Farm Operator by Age Percent by Age Group PercentCorn $7,493,000 Dairy & Milk $9,147,000 Under 25 0.4Soybeans $3,621,000 Cattle & Calves $5,972,000 25-44 15.7Wheat $394,000 Hogs & Pigs $498,000 45-64 53.7Oats & Hay $1,872,000 Poultry & Other Livestock $592,000 65 plus 30.3Other Crops $8,615,000 Total $38,208,000 Average Age (yrs.) 57.4
Wayne Acres2012 Crops Harvested Yield Production Rank
Corn for Grain, Bu. 48,200 129.2 6,226,000 34Soybeans, Bu. 43,000 46.1 1,982,000 42Wheat, Bu. 5,730 64.6 370,000 25Alfalfa Hay, Ton 14,500 3.35 48,600 1Other Hay, Ton - - - -
Livestock Number Rank
All Cattle & Calves (1/01/13) 87,000 1Milk Cows (1/01/13) 32,500 1
Number of Farms (2007 Census of Agriculture) = 1,788Average Farm Size (2007 Census of Agriculture) = 139 AcresTotal Land in Farms (2007 Census of Agriculture) = 248,409 Acres Non-irrigated cropland rent per acre = $85.00Commercial Grain Storage Capacity (bu.) = 5,217,000 2007 Census of Agriculture2011 Cash Receipts from Marketing of Farm Commodities Farm Operator by Age Percent by Age Group PercentCorn $38,382,000 Dairy & Milk $126,996,000 Under 25 1.3Soybeans $25,524,000 Cattle & Calves $29,191,000 25-44 27.2Wheat $3,433,000 Hogs & Pigs $19,934,000 45-64 51.3Oats & Hay $3,629,000 Poultry & Other Livestock $18,401,000 65 plus 20.2Other Crops $16,763,000 Total $282,256,000 Average Age (yrs.) 52.3
TABLE 74
COUNTY SUMMARIES

128 2012 Ohio Department of Agriculture Annual Report and Sta s cs
Williams Acres2012 Crops Harvested Yield Production Rank
Corn for Grain, Bu. 55,600 98.6 5,483,000 38Soybeans, Bu. 79,000 39.9 3,149,000 32Wheat, Bu. 14,600 66.4 970,000 10Alfalfa Hay, Ton 3,100 2.60 8,100 16Other Hay, Ton - - - -
Livestock Number Rank
All Cattle & Calves (1/01/13) 16,300 27Milk Cows (1/01/13) 7,300 9
Number of Farms (2007 Census of Agriculture) = 1,116Average Farm Size (2007 Census of Agriculture) = 190 AcresTotal Land in Farms (2007 Census of Agriculture) = 212,509 Acres Non-irrigated cropland rent per acre = $115.00Commercial Grain Storage Capacity (bu.) = 8,543,000 2007 Census of Agriculture2011 Cash Receipts from Marketing of Farm Commodities Farm Operator by Age Percent by Age Group PercentCorn $40,455,000 Dairy & Milk $32,005,000 Under 25 1.7Soybeans $41,234,000 Cattle & Calves $5,469,000 25-44 16.8Wheat $9,326,000 Hogs & Pigs $6,246,000 45-64 45.3Oats & Hay $585,000 Poultry & Other Livestock $1,431,000 65 plus 36.2Other Crops $5,881,000 Total $142,635,000 Average Age (yrs.) 58.4
Wood Acres2012 Crops Harvested Yield Production Rank
Corn for Grain, Bu. 111,200 136.5 15,178,000 1Soybeans, Bu. 150,300 53.6 8,063,000 1Wheat, Bu. 17,000 69.8 1,187,000 6Alfalfa Hay, Ton 2,200 3.05 6,700 20Other Hay, Ton - - - -
Livestock Number Rank
All Cattle & Calves (1/01/13) 6,100 67Milk Cows (1/01/13) 1,800 38
Number of Farms (2007 Census of Agriculture) = 1,169Average Farm Size (2007 Census of Agriculture) = 236 AcresTotal Land in Farms (2007 Census of Agriculture) = 275,552 Acres Non-irrigated cropland rent per acre = $140.00Commercial Grain Storage Capacity (bu.) = 16,904,000 2007 Census of Agriculture2011 Cash Receipts from Marketing of Farm Commodities Farm Operator by Age Percent by Age Group PercentCorn $86,792,000 Dairy & Milk $8,678,000 Under 25 1.3Soybeans $87,747,000 Cattle & Calves $2,046,000 25-44 19.6Wheat $20,090,000 Hogs & Pigs $1,760,000 45-64 52.4Oats & Hay $350,000 Poultry & Other Livestock $11,946,000 65 plus 26.8Other Crops $11,958,000 Total $231,371,000 Average Age (yrs.) 55.6
TABLE 74
COUNTY SUMMARIES
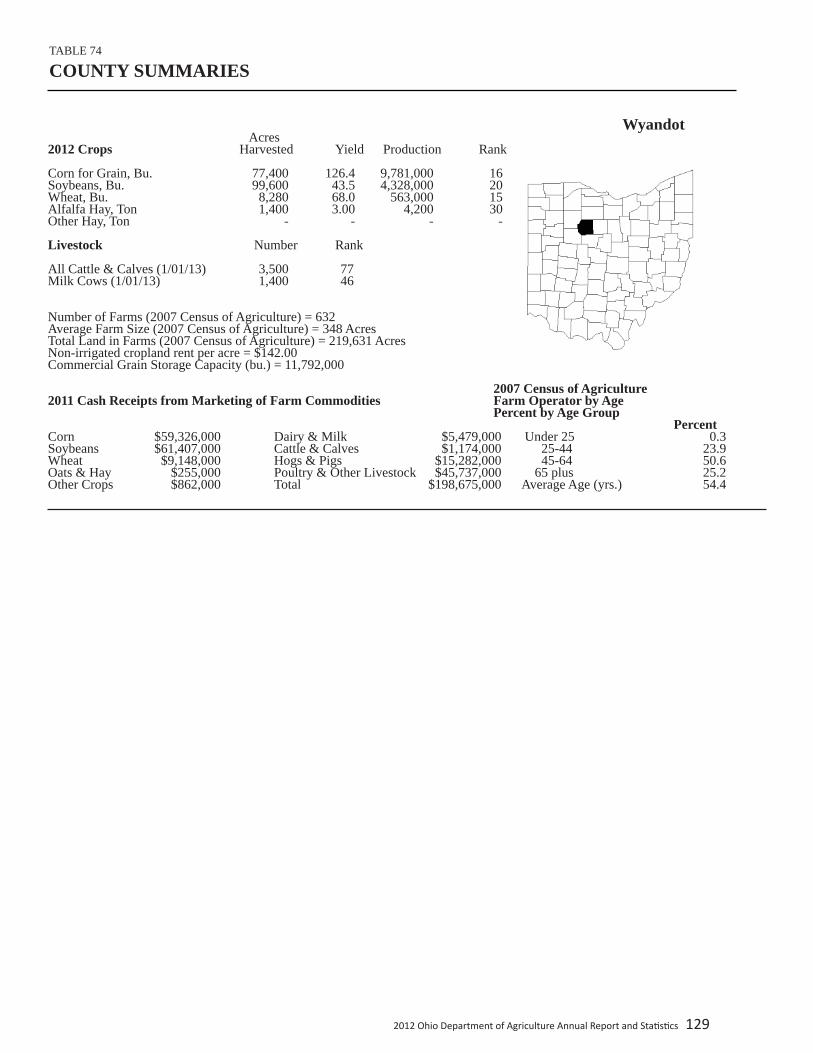
2012 Ohio Department of Agriculture Annual Report and Sta s cs 129
Wyandot Acres2012 Crops Harvested Yield Production Rank
Corn for Grain, Bu. 77,400 126.4 9,781,000 16Soybeans, Bu. 99,600 43.5 4,328,000 20Wheat, Bu. 8,280 68.0 563,000 15Alfalfa Hay, Ton 1,400 3.00 4,200 30Other Hay, Ton - - - -
Livestock Number Rank
All Cattle & Calves (1/01/13) 3,500 77Milk Cows (1/01/13) 1,400 46
Number of Farms (2007 Census of Agriculture) = 632Average Farm Size (2007 Census of Agriculture) = 348 AcresTotal Land in Farms (2007 Census of Agriculture) = 219,631 Acres Non-irrigated cropland rent per acre = $142.00Commercial Grain Storage Capacity (bu.) = 11,792,000 2007 Census of Agriculture2011 Cash Receipts from Marketing of Farm Commodities Farm Operator by Age Percent by Age Group PercentCorn $59,326,000 Dairy & Milk $5,479,000 Under 25 0.3Soybeans $61,407,000 Cattle & Calves $1,174,000 25-44 23.9Wheat $9,148,000 Hogs & Pigs $15,282,000 45-64 50.6Oats & Hay $255,000 Poultry & Other Livestock $45,737,000 65 plus 25.2Other Crops $862,000 Total $198,675,000 Average Age (yrs.) 54.4
TABLE 74
COUNTY SUMMARIES
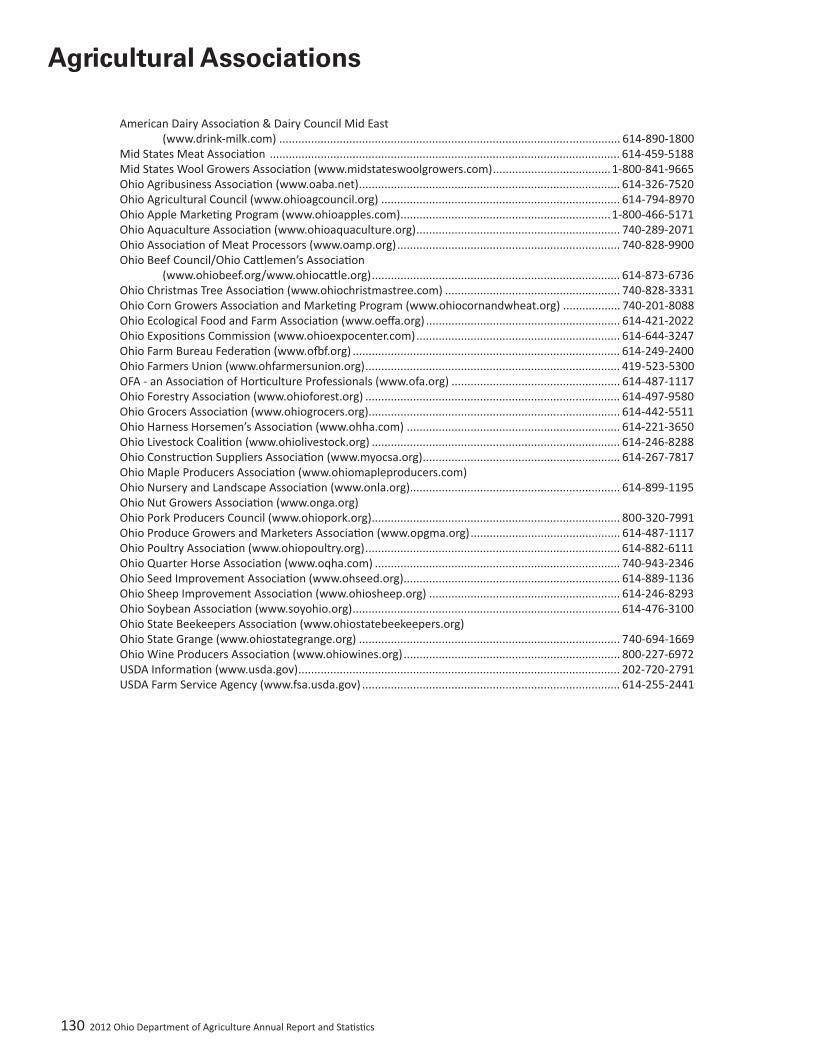
130 2012 Ohio Department of Agriculture Annual Report and Sta s cs
Agricultural Associations
American Dairy Associa on & Dairy Council Mid East (www.drink-milk.com) ........................................................................................................... 614-890-1800Mid States Meat Associa on .............................................................................................................. 614-459-5188Mid States Wool Growers Associa on (www.midstateswoolgrowers.com) .....................................1-800-841-9665Ohio Agribusiness Associa on (www.oaba.net) .................................................................................. 614-326-7520Ohio Agricultural Council (www.ohioagcouncil.org) ........................................................................... 614-794-8970Ohio Apple Marke ng Program (www.ohioapples.com) ..................................................................1-800-466-5171Ohio Aquaculture Associa on (www.ohioaquaculture.org) ................................................................ 740-289-2071Ohio Associa on of Meat Processors (www.oamp.org) ...................................................................... 740-828-9900Ohio Beef Council/Ohio Ca lemen’s Associa on (www.ohiobeef.org/www.ohioca le.org) .............................................................................. 614-873-6736Ohio Christmas Tree Associa on (www.ohiochristmastree.com) ....................................................... 740-828-3331Ohio Corn Growers Associa on and Marke ng Program (www.ohiocornandwheat.org) .................. 740-201-8088Ohio Ecological Food and Farm Associa on (www.oeff a.org) ............................................................. 614-421-2022Ohio Exposi ons Commission (www.ohioexpocenter.com) ................................................................ 614-644-3247Ohio Farm Bureau Federa on (www.o f.org) .................................................................................... 614-249-2400Ohio Farmers Union (www.ohfarmersunion.org) ................................................................................ 419-523-5300OFA - an Associa on of Hor culture Professionals (www.ofa.org) ..................................................... 614-487-1117Ohio Forestry Associa on (www.ohioforest.org) ................................................................................ 614-497-9580Ohio Grocers Associa on (www.ohiogrocers.org)............................................................................... 614-442-5511Ohio Harness Horsemen’s Associa on (www.ohha.com) ................................................................... 614-221-3650Ohio Livestock Coali on (www.ohiolivestock.org) .............................................................................. 614-246-8288Ohio Construc on Suppliers Associa on (www.myocsa.org) .............................................................. 614-267-7817Ohio Maple Producers Associa on (www.ohiomapleproducers.com)Ohio Nursery and Landscape Associa on (www.onla.org).................................................................. 614-899-1195Ohio Nut Growers Associa on (www.onga.org)Ohio Pork Producers Council (www.ohiopork.org) .............................................................................. 800-320-7991Ohio Produce Growers and Marketers Associa on (www.opgma.org) ............................................... 614-487-1117Ohio Poultry Associa on (www.ohiopoultry.org) ................................................................................ 614-882-6111Ohio Quarter Horse Associa on (www.oqha.com) ............................................................................. 740-943-2346Ohio Seed Improvement Associa on (www.ohseed.org) .................................................................... 614-889-1136Ohio Sheep Improvement Associa on (www.ohiosheep.org) ............................................................ 614-246-8293Ohio Soybean Associa on (www.soyohio.org) .................................................................................... 614-476-3100Ohio State Beekeepers Associa on (www.ohiostatebeekeepers.org)Ohio State Grange (www.ohiostategrange.org) .................................................................................. 740-694-1669Ohio Wine Producers Associa on (www.ohiowines.org) .................................................................... 800-227-6972USDA Informa on (www.usda.gov) ..................................................................................................... 202-720-2791USDA Farm Service Agency (www.fsa.usda.gov) ................................................................................. 614-255-2441
Copyright 2013, The Ohio Department of Agriculture
Equal Opportunity in Employment and Services
Ohio Department of Agriculture
General Information ..........................................................................................................614-728-6201Consumer Information .....................................................................................................800-282-1955
........................................................................................................614-466-2732E-mail / website.................................................................... [email protected]/ www.agri.ohio.govEnforcement ......................................................................................................................614-728-6240Amusement Ride Safety ...................................................................................................614-728-6280Animal Health/Animal Disease Diagnostic Laboratory .................................................614-728-6220
Communications .. ................................................................................................................614-752-9817Consumer Protection Laboratory ....................................................................................614-728-6230Dairy ....................................................................................................................................614-466-5550Fairs ....................................................................................................................................614-728-6218Farmland Preservation ......................................................................................................614-728-6210Food Safety .........................................................................................................................614-728-6250Livestock Environmental Permitting Division ................................................................614-387-0470Markets...................................... .........................................................................................614-752-9814Meat Inspection ................................................................................................................614-728-6260Ohio Grape Industries .......................................................................................................614-728-4216Ohio Proud .......................................................................................................................800-IM-PROUDPlant Health.... ....................................................................................................................614-728-6270Weights and Measures......................................................................................................614-728-6290

Ohio Department of Agriculture8995 E. Main St. Reynoldsburg, OH 43068
614-728-6200www.agri.ohio.gov
Governor John R. Kasich Lt. Governor Mary Taylor Director David T. Daniels