2012 Annual Mortgage Fraud Risk Report
18
1 Mortgage Fraud Risk Report 2012 Annual © Interthinx, Inc. 2013. All rights reserved. Interthinx and FraudGUARD are registered trademarks of Interthinx, Inc.. No part of this publication may be reproduced, stored in a retrieval system or transmitted, in any form or by any means, electronic, mechanical, photocopying, recording or otherwise, without prior written permission. The information contained within should not be construed as a recommendation by Interthinx, Inc. or Verisk Analytics for any course of action regarding financial, legal or accounting matters. 2012 Annual Mortgage Fraud Risk Report In-depth analysis of nationwide risk as indicated by the Interthinx ® Fraud Risk Indices
Transcript of 2012 Annual Mortgage Fraud Risk Report
1Mortgage Fraud Risk Report 2012 Annual
© Interthinx, Inc. 2013. All rights reserved. Interthinx and FraudGUARD are
registered trademarks of Interthinx, Inc.. No part of this publication may be
reproduced, stored in a retrieval system or transmitted, in any form or by any
means, electronic, mechanical, photocopying, recording or otherwise, without
prior written permission. The information contained within should not be
construed as a recommendation by Interthinx, Inc. or Verisk Analytics for any
course of action regarding financial, legal or accounting matters.
2012
Annual Mortgage Fraud Risk Report In-depth analysis of nationwide
risk as indicated by the
Interthinx® Fraud Risk Indices
22012 Annual
a SMARTER Approach To Risk
©2013. All rights reserved. FraudGUARD is a registered trademark of Interthinx, Inc., Interthinx is a registered trademark of Interthinx, Inc..
Executive Summary
This report highlights some of the most significant mortgage fraud risk trends based on analysis of loan applications processed in 2012 by the Interthinx FraudGUARD® system.
• The2012AnnualMortgageFraudRiskIndexvalueis150(n = 100), a 3 percent increase from2011’svalueof145.Thiscontinuesthegraduallyrisingtrendinfraudriskobservedover the past two years as markets begin to stabilize, inventories begin to shrink, and prices begin to increase.
• Therewasamarkedshiftinfraudriskfromwesttoeast,withsevenofthetop10stateslocatedintheeasternhalfoftheUS.Manyofthesestateswerehithardbymortgagefraudand foreclosures early in the boom years, and most are judicial foreclosure states where real estate sales activity was depressed before the “robo-signing” foreclosure abuse lawsuit was settled. The rise in fraud risk is an indicator that these markets may have hit a true bottom, since rising markets are more attractive to fraudsters seeking profits, and fraud is easier to commit when property values are increasing than when they are decreasing.
• DespitethedecreaseinfraudriskinthewesternUnitedStates,NevadaandArizona–perennialentrantsinthetopfive–arerankedasthe1stand3rdriskiest,respectively.Californiadroppedto6thplace–itsfirsttimefinishingoutofthetopfivesincetheinceptionoftheAnnualreportin2010–eventhoughitcontainseightoftheriskiestMetropolitanStatisticalAreas(MSAs)forEmployment/IncomeFraudRisk,sixofthe riskiestMSAsoverall,andfiveofthe25riskiestZIPcodes.
• Employment/IncomeFraudRiskisup7percentnationallyfrom2011andisparticularlyconcentrated in northern California, while Occupancy Fraud Risk declined 11 percent from one year ago, likely reflecting investors’ ability to use cash for purchases. Despite the decline in Occupancy Fraud Risk, investor loans remained significantly more risky than owner-occupied and second home loans.
• Purchaseloanapplicationswithloan-to-valueratios(LTVs)ofexactly20percentareextremelyriskywithaMortgageFraudRiskIndexof637.Itislikelythattheseloansareassociatedwithpiggy-backtypeloanswheretheborroweroriginatesaloanwithanLTV of 20 percent for simultaneous use as the down-payment for a loan with a second lender for 80 percent of the property value.
3Mortgage Fraud Risk Report 2012 Annualinterthinx.com 800.333.4510 [email protected]
Section 1: 2012 Mortgage Fraud Risk Hot Spots
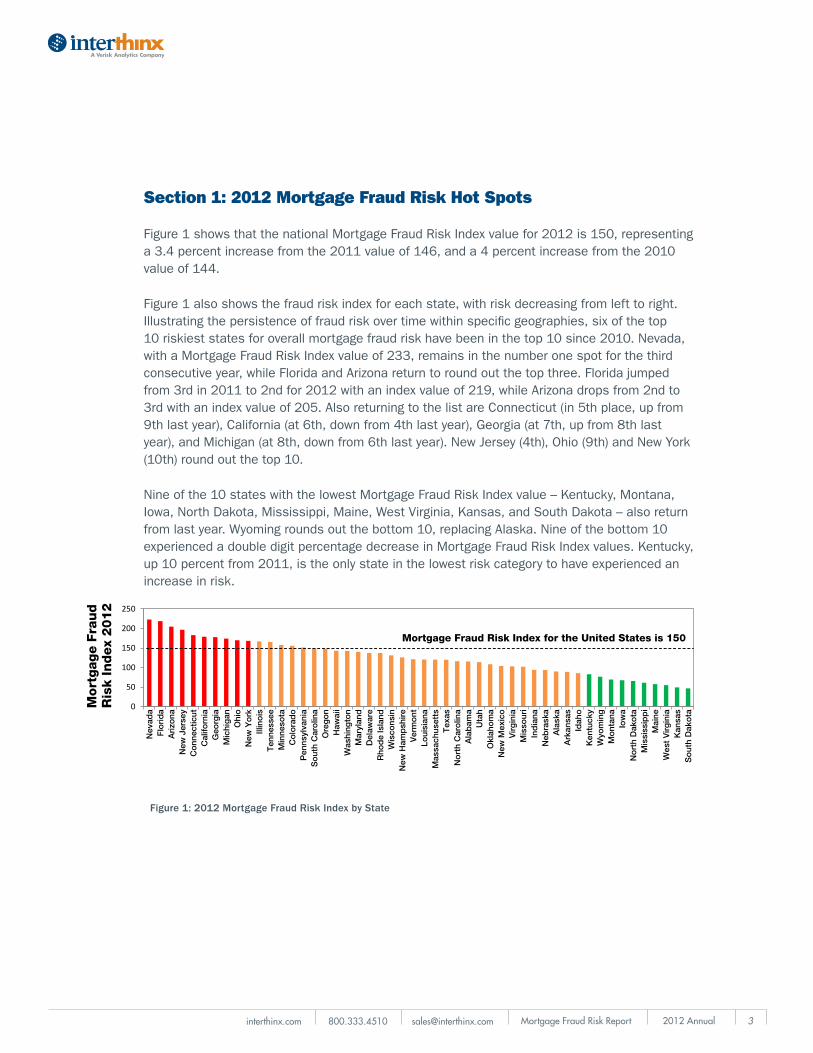
Figure1showsthatthenationalMortgageFraudRiskIndexvaluefor2012is150,representinga 3.4 percent increase from the 2011 value of 146, and a 4 percent increase from the 2010 value of 144.
Figure 1 also shows the fraud risk index for each state, with risk decreasing from left to right. Illustrating the persistence of fraud risk over time within specific geographies, six of the top 10 riskiest states for overall mortgage fraud risk have been in the top 10 since 2010. Nevada, withaMortgageFraudRiskIndexvalueof233,remainsinthenumberonespotforthethirdconsecutive year, while Florida and Arizona return to round out the top three. Florida jumped from 3rd in 2011 to 2nd for 2012 with an index value of 219, while Arizona drops from 2nd to 3rdwithanindexvalueof205.AlsoreturningtothelistareConnecticut(in5thplace,upfrom9thlastyear),California(at6th,downfrom4thlastyear),Georgia(at7th,upfrom8thlastyear),andMichigan(at8th,downfrom6thlastyear).NewJersey(4th),Ohio(9th)andNewYork(10th)roundoutthetop10.
Nineofthe10stateswiththelowestMortgageFraudRiskIndexvalue–Kentucky,Montana,Iowa,NorthDakota,Mississippi,Maine,WestVirginia,Kansas,andSouthDakota–alsoreturnfromlastyear.Wyomingroundsoutthebottom10,replacingAlaska.Nineofthebottom10experiencedadoubledigitpercentagedecreaseinMortgageFraudRiskIndexvalues.Kentucky,up 10 percent from 2011, is the only state in the lowest risk category to have experienced an increase in risk.
Figure 1: 2012 Mortgage Fraud Risk Index by State
Mortgage Fraud Risk Index for the United States is 150
Mort
gag
e F
raud
Ris
k Index
2012
0
50
100
150
200
250
Nev
ada
Flo
rid
aA
rizo
naN
ew J
erse
yC
onn
ectic
utC
alifo
rnia
Geo
rgia
Mic
hig
anO
hio
New
Yo
rkIll
ino
isT
enne
ssee
Min
neso
taC
olo
rad
oP
enns
ylva
nia
So
uth
Car
olin
aO
reg
on
Haw
aii
Was
hing
ton
Mar
ylan
dD
elaw
are
Rho
de
Isla
ndW
isco
nsin
New
Ham
psh
ire
Ver
mo
ntLo
uisi
ana
Mas
sach
uset
tsT
exas
No
rth
Car
olin
aA
lab
ama
Uta
hO
klah
om
aN
ew M
exic
oV
irg
inia
Mis
sour
iIn
dia
naN
ebra
ska
Ala
ska
Ark
ansa
sId
aho
Ken
tuck
yW
yom
ing
Mo
ntan
aIo
wa
No
rth
Dak
ota
Mis
siss
ipp
iM
aine
Wes
t V
irg
inia
Kan
sas
So
uth
Dak
ota
42012 Annual
a SMARTER Approach To Risk
©2013. All rights reserved. FraudGUARD is a registered trademark of Interthinx, Inc., Interthinx is a registered trademark of Interthinx, Inc..
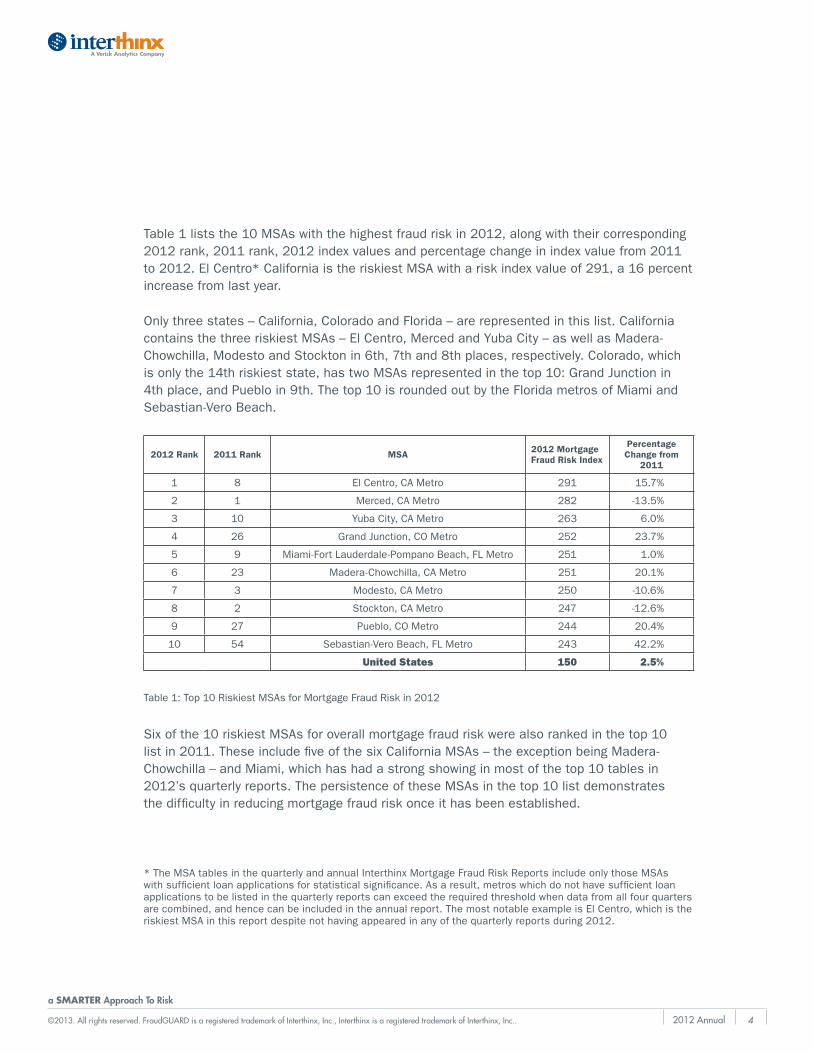
Table1liststhe10MSAswiththehighestfraudriskin2012,alongwiththeircorresponding2012 rank, 2011 rank, 2012 index values and percentage change in index value from 2011 to2012.ElCentro*CaliforniaistheriskiestMSAwithariskindexvalueof291,a16percentincrease from last year.
Onlythreestates–California,ColoradoandFlorida–arerepresentedinthislist.CaliforniacontainsthethreeriskiestMSAs–ElCentro,MercedandYubaCity–aswellasMadera-Chowchilla,ModestoandStocktonin6th,7thand8thplaces,respectively.Colorado,whichisonlythe14thriskieststate,hastwoMSAsrepresentedinthetop10:GrandJunctionin4thplace,andPuebloin9th.Thetop10isroundedoutbytheFloridametrosofMiamiandSebastian-Vero Beach.
2012 Rank 2011 Rank MSA 2012 Mortgage Fraud Risk Index
Percentage Change from
2011
1 8 ElCentro,CAMetro 291 15.7%
2 1 Merced,CAMetro 282 -13.5%
3 10 YubaCity,CAMetro 263 6.0%
4 26 GrandJunction,COMetro 252 23.7%
5 9 Miami-FortLauderdale-PompanoBeach,FLMetro 251 1.0%
6 23 Madera-Chowchilla,CAMetro 251 20.1%
7 3 Modesto,CAMetro 250 -10.6%
8 2 Stockton,CAMetro 247 -12.6%
9 27 Pueblo,COMetro 244 20.4%
10 54 Sebastian-VeroBeach,FLMetro 243 42.2%
United States 150 2.5%
*TheMSAtablesinthequarterlyandannualInterthinxMortgageFraudRiskReportsincludeonlythoseMSAswith sufficient loan applications for statistical significance. As a result, metros which do not have sufficient loan applicationstobelistedinthequarterlyreportscanexceedtherequiredthresholdwhendatafromallfourquartersarecombined,andhencecanbeincludedintheannualreport.ThemostnotableexampleisElCentro,whichistheriskiestMSAinthisreportdespitenothavingappearedinanyofthequarterlyreportsduring2012.
Sixofthe10riskiestMSAsforoverallmortgagefraudriskwerealsorankedinthetop10listin2011.TheseincludefiveofthesixCaliforniaMSAs–theexceptionbeingMadera-Chowchilla–andMiami,whichhashadastrongshowinginmostofthetop10tablesin2012’squarterlyreports.ThepersistenceoftheseMSAsinthetop10listdemonstrates the difficulty in reducing mortgage fraud risk once it has been established.
Table1:Top10RiskiestMSAsforMortgageFraudRiskin2012
5Mortgage Fraud Risk Report 2012 Annualinterthinx.com 800.333.4510 [email protected]
-21.5
-16.5
-21.9
-12.9
-11.8
-18.3
-31.3
-12.3
-21.3
-10.3
-13.3
-20.0
-13.2
-15.1
-30.1
26.532.9
55.8
22.9
26.9
12.9
18.7
30.7
34.6
17.6
18.0
48.4
20.4
30.2
13.2
21.1
-8.8
-4.7
-0.3
-5.6
-6.7
-5.0
-8.4
-8.1 3.5
7.8
1.3
4.7
7.0
0.4
1.2
-13.1
15.0
10 States with the largest Mortgage Fraud Risk Index increase between 2011 and 2012
10 States with the largest Mortgage Fraud Risk Index decrease between 2011 and 2012
Other
Section 2: Eastward Fraud Migration
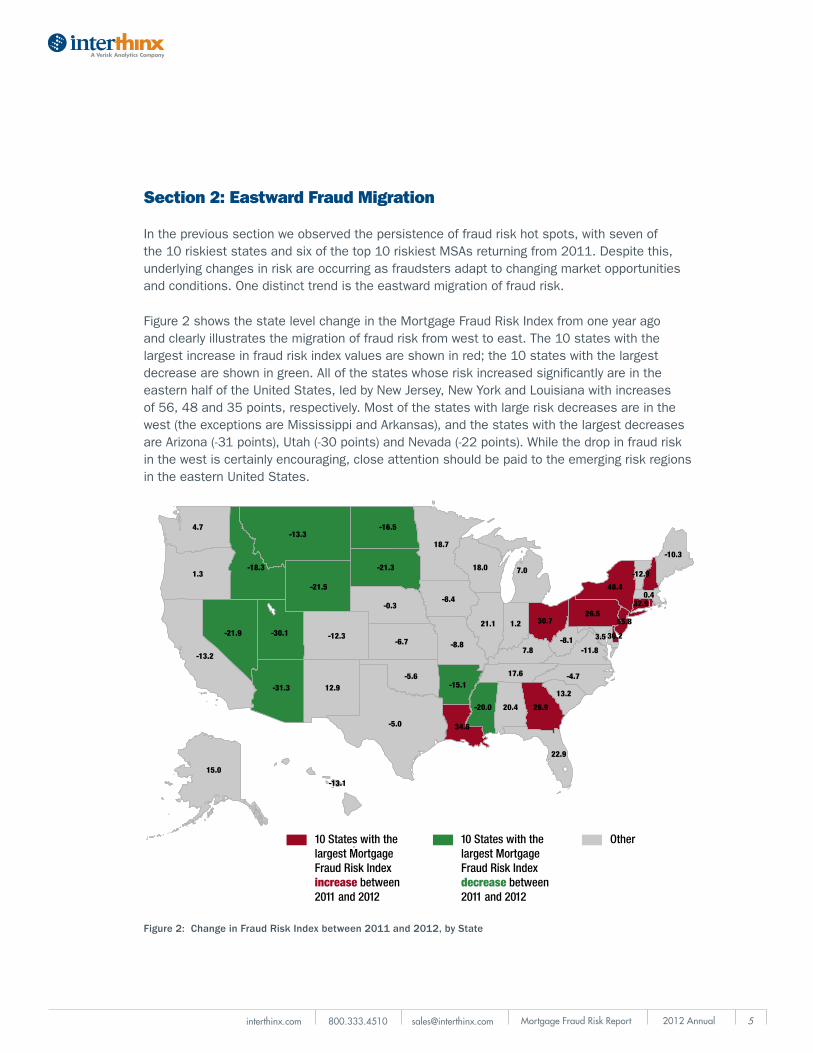
In the previous section we observed the persistence of fraud risk hot spots, with seven of the10riskieststatesandsixofthetop10riskiestMSAsreturningfrom2011.Despitethis,underlying changes in risk are occurring as fraudsters adapt to changing market opportunities and conditions. One distinct trend is the eastward migration of fraud risk.
Figure2showsthestatelevelchangeintheMortgageFraudRiskIndexfromoneyearago and clearly illustrates the migration of fraud risk from west to east. The 10 states with the largest increase in fraud risk index values are shown in red; the 10 states with the largest decrease are shown in green. All of the states whose risk increased significantly are in the easternhalfoftheUnitedStates,ledbyNewJersey,NewYorkandLouisianawithincreases of56,48and35points,respectively.Mostofthestateswithlargeriskdecreasesareinthewest(theexceptionsareMississippiandArkansas),andthestateswiththelargestdecreasesareArizona(-31points),Utah(-30points)andNevada(-22points).Whilethedropinfraudriskin the west is certainly encouraging, close attention should be paid to the emerging risk regions in the eastern United States.
Figure 2: Change in Fraud Risk Index between 2011 and 2012, by State
62012 Annual
a SMARTER Approach To Risk
©2013. All rights reserved. FraudGUARD is a registered trademark of Interthinx, Inc., Interthinx is a registered trademark of Interthinx, Inc..
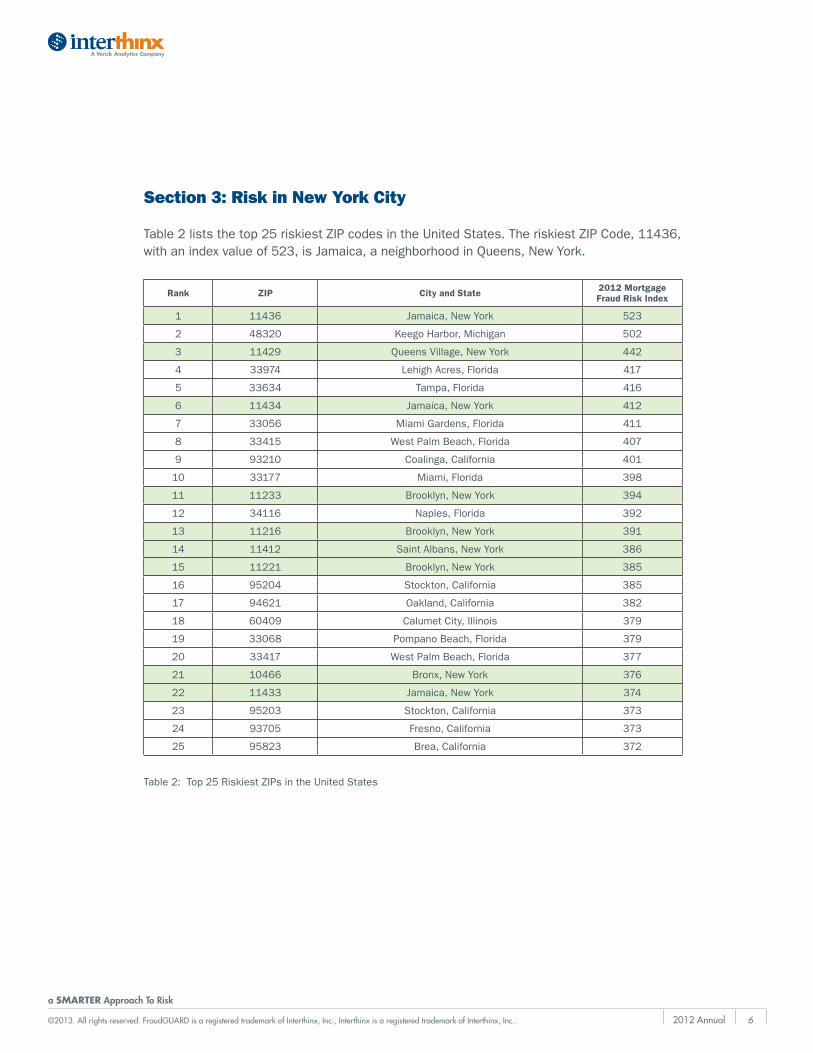
Section 3: Risk in New York City
Table2liststhetop25riskiestZIPcodesintheUnitedStates.TheriskiestZIPCode,11436,withanindexvalueof523,isJamaica,aneighborhoodinQueens,NewYork.
Rank ZIP City and State 2012 Mortgage Fraud Risk Index
1 11436 Jamaica,NewYork 523
2 48320 KeegoHarbor,Michigan 502
3 11429 QueensVillage,NewYork 442
4 33974 LehighAcres,Florida 417
5 33634 Tampa, Florida 416
6 11434 Jamaica,NewYork 412
7 33056 MiamiGardens,Florida 411
8 33415 WestPalmBeach,Florida 407
9 93210 Coalinga, California 401
10 33177 Miami,Florida 398
11 11233 Brooklyn,NewYork 394
12 34116 Naples, Florida 392
13 11216 Brooklyn,NewYork 391
14 11412 SaintAlbans,NewYork 386
15 11221 Brooklyn,NewYork 385
16 95204 Stockton, California 385
17 94621 Oakland, California 382
18 60409 Calumet City, Illinois 379
19 33068 PompanoBeach,Florida 379
20 33417 WestPalmBeach,Florida 377
21 10466 Bronx,NewYork 376
22 11433 Jamaica,NewYork 374
23 95203 Stockton, California 373
24 93705 Fresno, California 373
25 95823 Brea, California 372
Table2:Top25RiskiestZIPsintheUnitedStates
7Mortgage Fraud Risk Report 2012 Annualinterthinx.com 800.333.4510 [email protected]
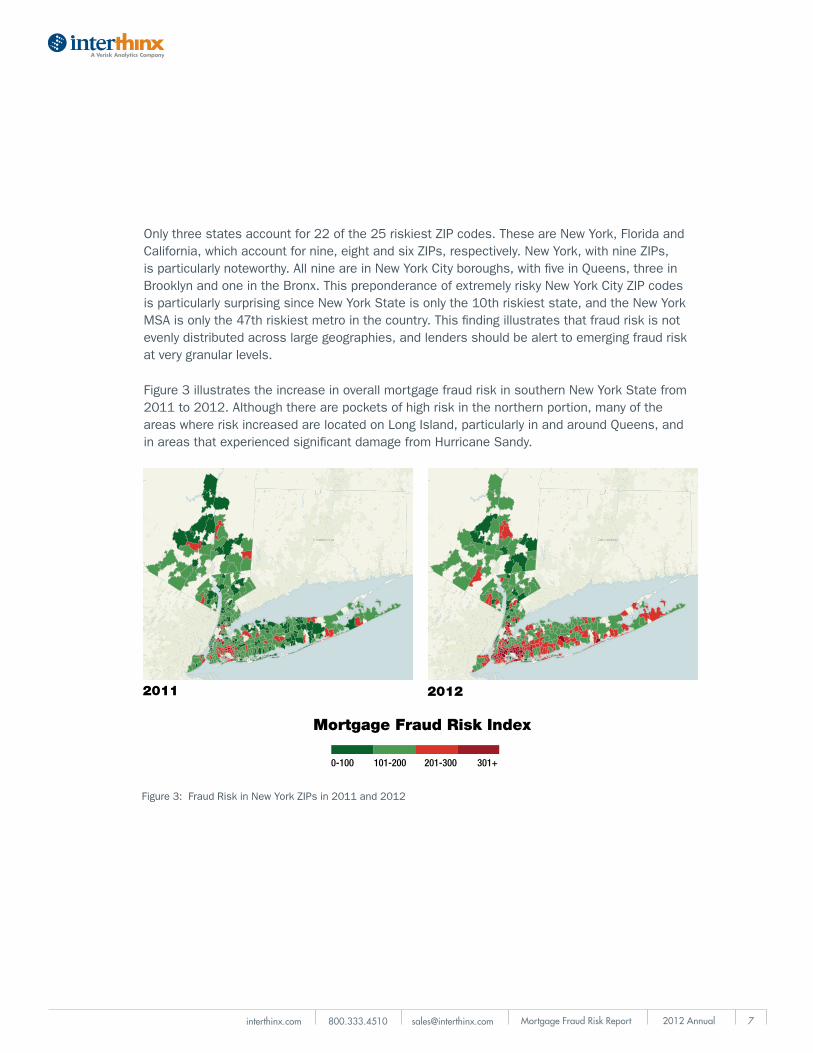
Onlythreestatesaccountfor22ofthe25riskiestZIPcodes.TheseareNewYork,FloridaandCalifornia,whichaccountfornine,eightandsixZIPs,respectively.NewYork,withnineZIPs,isparticularlynoteworthy.AllnineareinNewYorkCityboroughs,withfiveinQueens,threeinBrooklynandoneintheBronx.ThispreponderanceofextremelyriskyNewYorkCityZIPcodesisparticularlysurprisingsinceNewYorkStateisonlythe10thriskieststate,andtheNewYorkMSAisonlythe47thriskiestmetrointhecountry.Thisfindingillustratesthatfraudriskisnotevenly distributed across large geographies, and lenders should be alert to emerging fraud risk at very granular levels.
Figure3illustratestheincreaseinoverallmortgagefraudriskinsouthernNewYorkStatefrom2011 to 2012. Although there are pockets of high risk in the northern portion, many of the areaswhereriskincreasedarelocatedonLongIsland,particularlyinandaroundQueens,andinareasthatexperiencedsignificantdamagefromHurricaneSandy.
Figure3:FraudRiskinNewYorkZIPsin2011and2012
0-100 101-200 201-300 301+
Mortgage Fraud Risk Index
2011 2012
82012 Annual
a SMARTER Approach To Risk
©2013. All rights reserved. FraudGUARD is a registered trademark of Interthinx, Inc., Interthinx is a registered trademark of Interthinx, Inc..
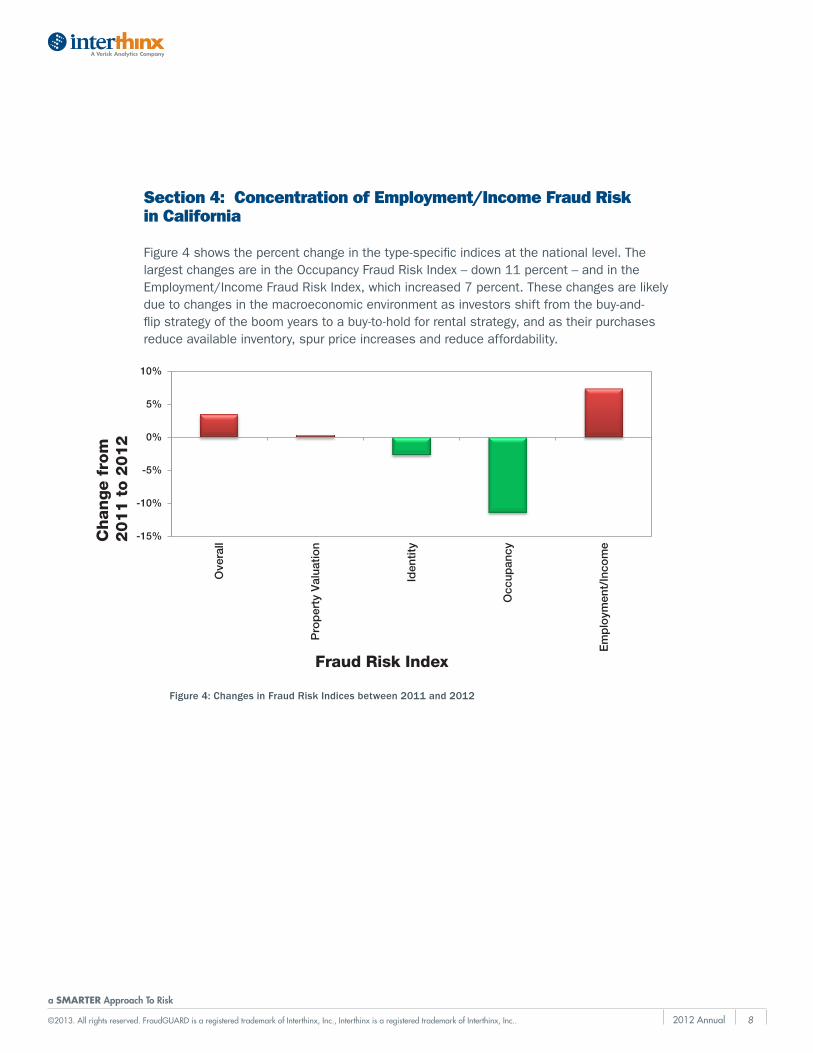
Section 4: Concentration of Employment/Income Fraud Risk in California
Figure 4 shows the percent change in the type-specific indices at the national level. The largestchangesareintheOccupancyFraudRiskIndex–down11percent–andintheEmployment/IncomeFraudRiskIndex,whichincreased7percent.Thesechangesarelikelydue to changes in the macroeconomic environment as investors shift from the buy-and-flip strategy of the boom years to a buy-to-hold for rental strategy, and as their purchases reduce available inventory, spur price increases and reduce affordability.
Figure 4: Changes in Fraud Risk Indices between 2011 and 2012
-15%
-10%
-5%
0%
5%
10%
Ove
rall
Pro
per
ty V
alua
tion
Iden
tity
Occ
upan
cy
Em
plo
ymen
t/In
com
e
Ch
an
ge f
rom
2011 t
o 2
012
Fraud Risk Index
9Mortgage Fraud Risk Report 2012 Annualinterthinx.com 800.333.4510 [email protected]
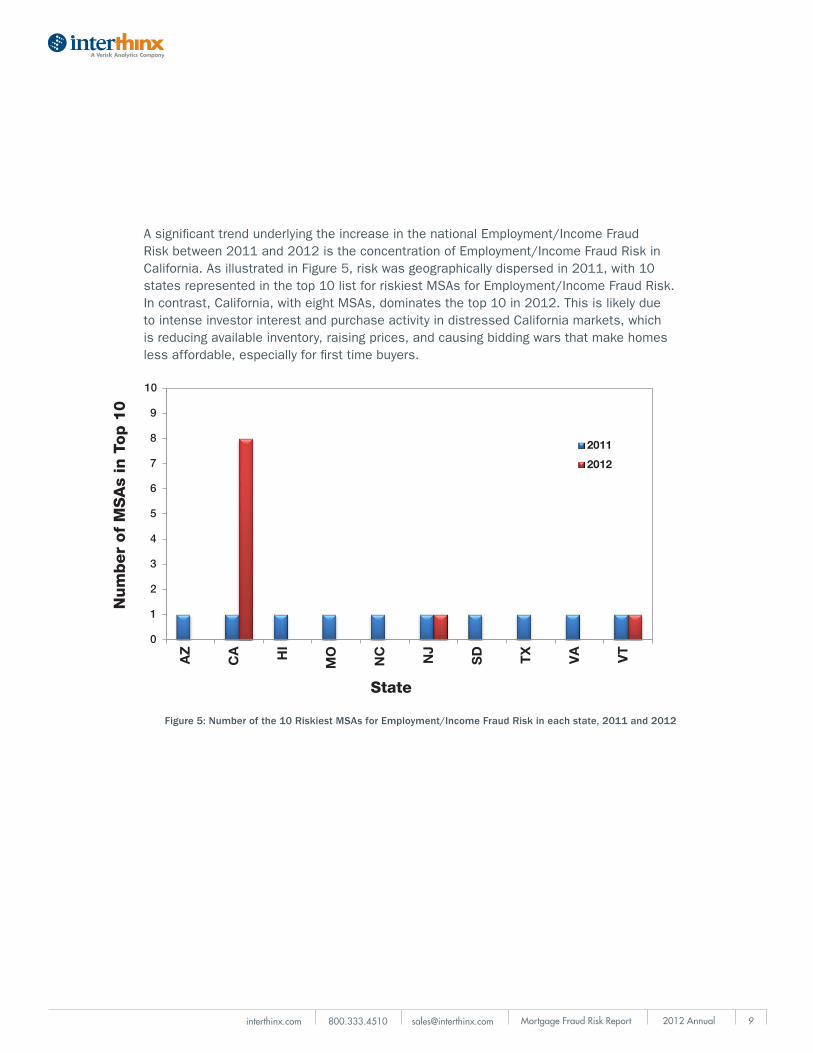
AsignificanttrendunderlyingtheincreaseinthenationalEmployment/IncomeFraudRiskbetween2011and2012istheconcentrationofEmployment/IncomeFraudRiskinCalifornia.AsillustratedinFigure5,riskwasgeographicallydispersedin2011,with10statesrepresentedinthetop10listforriskiestMSAsforEmployment/IncomeFraudRisk.Incontrast,California,witheightMSAs,dominatesthetop10in2012.Thisislikelydueto intense investor interest and purchase activity in distressed California markets, which is reducing available inventory, raising prices, and causing bidding wars that make homes less affordable, especially for first time buyers.
Figure 5: Number of the 10 Riskiest MSAs for Employment/Income Fraud Risk in each state, 2011 and 2012
0
1
2
3
4
5
6
7
8
9
10
AZ
CA HI
MO
NC NJ
SD TX
VA VT
Num
ber
of
MS
As
in T
op 1
0
State
2011
2012
102012 Annual
a SMARTER Approach To Risk
©2013. All rights reserved. FraudGUARD is a registered trademark of Interthinx, Inc., Interthinx is a registered trademark of Interthinx, Inc..
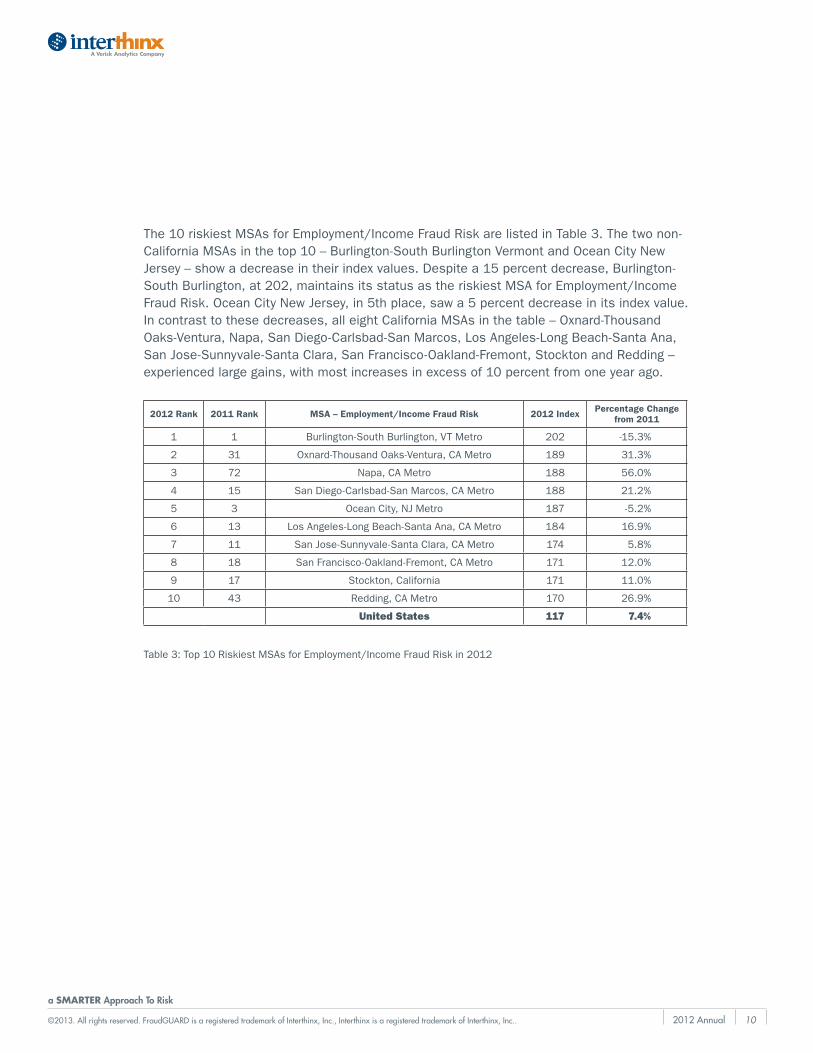
The10riskiestMSAsforEmployment/IncomeFraudRiskarelistedinTable3.Thetwonon-CaliforniaMSAsinthetop10–Burlington-SouthBurlingtonVermontandOceanCityNewJersey–showadecreaseintheirindexvalues.Despitea15percentdecrease,Burlington-SouthBurlington,at202,maintainsitsstatusastheriskiestMSAforEmployment/IncomeFraudRisk.OceanCityNewJersey,in5thplace,sawa5percentdecreaseinitsindexvalue.Incontrasttothesedecreases,alleightCaliforniaMSAsinthetable–Oxnard-ThousandOaks-Ventura,Napa,SanDiego-Carlsbad-SanMarcos,LosAngeles-LongBeach-SantaAna,SanJose-Sunnyvale-SantaClara,SanFrancisco-Oakland-Fremont,StocktonandRedding–experienced large gains, with most increases in excess of 10 percent from one year ago.
2012 Rank 2011 Rank MSA – Employment/Income Fraud Risk 2012 Index Percentage Change from 2011
1 1 Burlington-SouthBurlington,VTMetro 202 -15.3%
2 31 Oxnard-ThousandOaks-Ventura,CAMetro 189 31.3%
3 72 Napa,CAMetro 188 56.0%
4 15 SanDiego-Carlsbad-SanMarcos,CAMetro 188 21.2%
5 3 OceanCity,NJMetro 187 -5.2%
6 13 LosAngeles-LongBeach-SantaAna,CAMetro 184 16.9%
7 11 SanJose-Sunnyvale-SantaClara,CAMetro 174 5.8%
8 18 SanFrancisco-Oakland-Fremont,CAMetro 171 12.0%
9 17 Stockton, California 171 11.0%
10 43 Redding,CAMetro 170 26.9%
United States 117 7.4%
Table3:Top10RiskiestMSAsforEmployment/IncomeFraudRiskin2012
11Mortgage Fraud Risk Report 2012 Annualinterthinx.com 800.333.4510 [email protected]
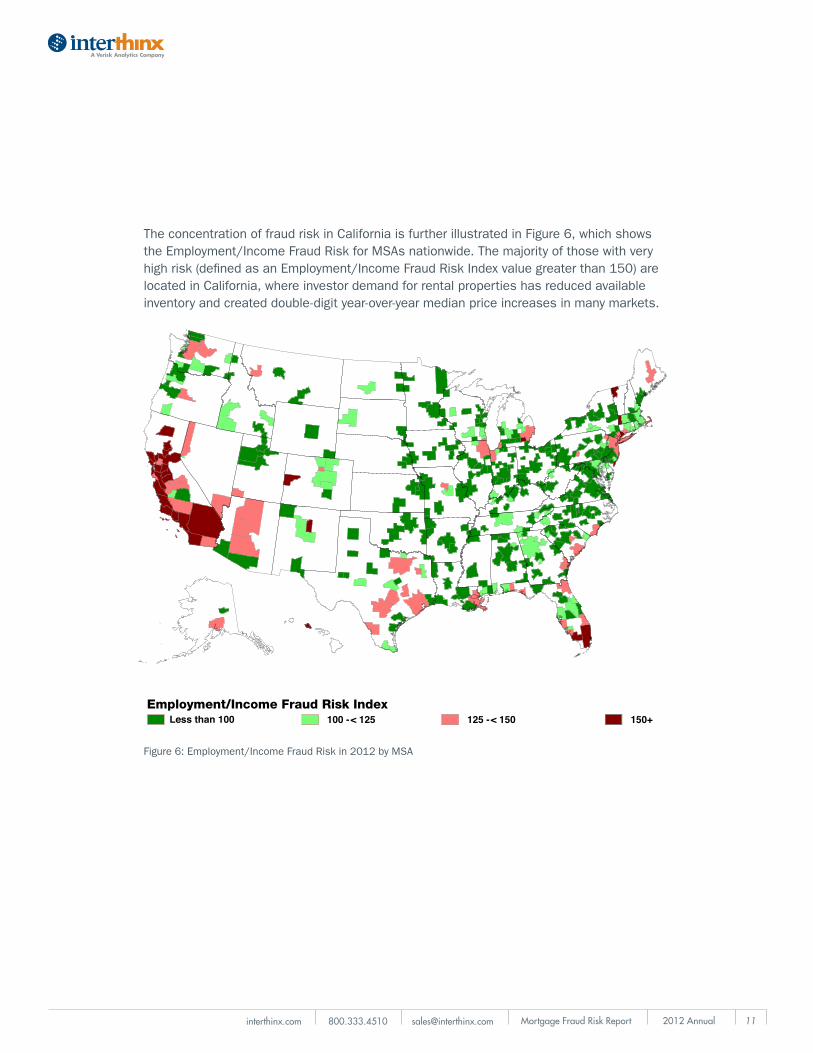
The concentration of fraud risk in California is further illustrated in Figure 6, which shows theEmployment/IncomeFraudRiskforMSAsnationwide.Themajorityofthosewithveryhighrisk(definedasanEmployment/IncomeFraudRiskIndexvaluegreaterthan150)arelocated in California, where investor demand for rental properties has reduced available inventory and created double-digit year-over-year median price increases in many markets.
Figure6:Employment/IncomeFraudRiskin2012byMSA
150+Less than 100 100 - < 125Employment/Income Fraud Risk Index
125 - < 150
122012 Annual
a SMARTER Approach To Risk
©2013. All rights reserved. FraudGUARD is a registered trademark of Interthinx, Inc., Interthinx is a registered trademark of Interthinx, Inc..
0
50
100
150
200
250
300
$1K
- $
2K
$2 -
$3K
$3K
- $
4K
$4K
- $
5K
$5K
- $
6K
$6 -
$7K
$7K
- $
8K
$8K
- $
9K
$9K
- $
10K
> $
10K
Fra
ud
Ris
k In
dex
Borrower Monthly Income
Overall Risk
Employment/Income Risk
Section 5: Non-Geographic Indicators of Mortgage Fraud Risk
In addition to the geographic factors that have been the focus of previous sections, there are a number of non-geographic factors associated with loan applications that can provideactionableintelligence,includingloancharacteristics(e.g.,loanpurpose,loanamount),propertycharacteristics(e.g.,appraisedvalue,propertytype),andborrowercharacteristics(e.g.,occupancytype,income,creditscore).
In this section we examine the non-geographic indicators of mortgage fraud risk that have contributed to the rise in overall risk observed in 2012.
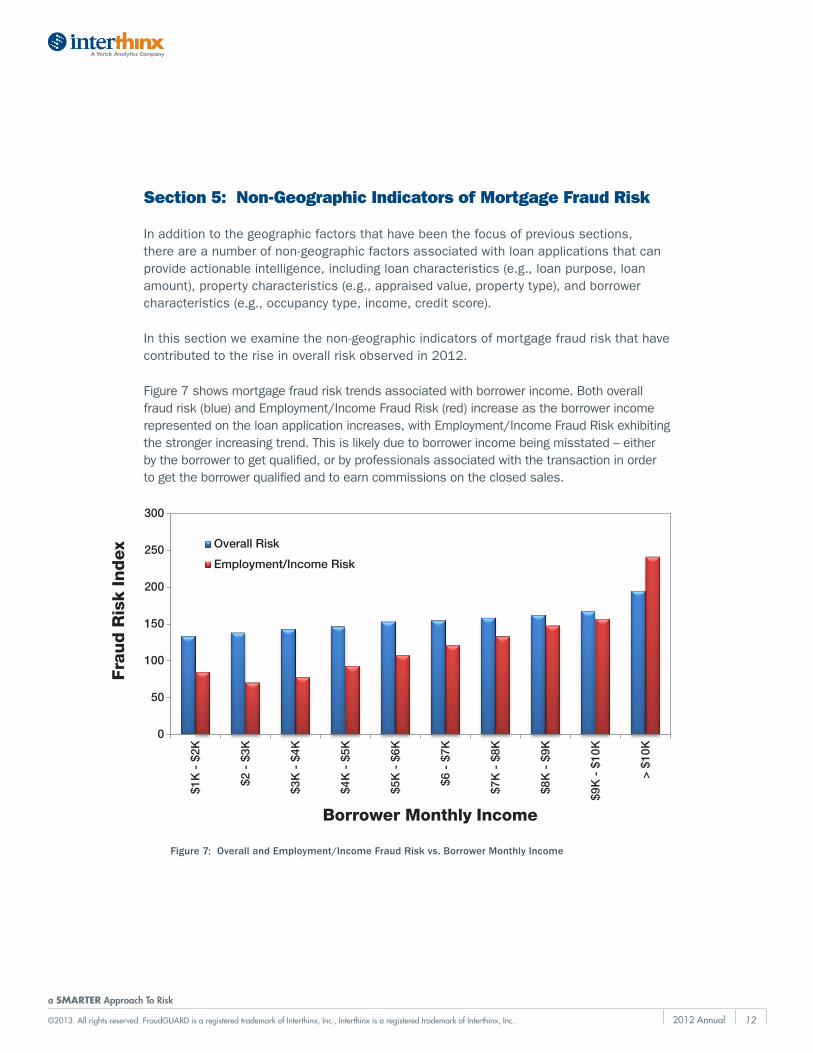
Figure7showsmortgagefraudrisktrendsassociatedwithborrowerincome.Bothoverallfraudrisk(blue)andEmployment/IncomeFraudRisk(red)increaseastheborrowerincomerepresentedontheloanapplicationincreases,withEmployment/IncomeFraudRiskexhibitingthestrongerincreasingtrend.Thisislikelyduetoborrowerincomebeingmisstated–eitherbytheborrowertogetqualified,orbyprofessionalsassociatedwiththetransactioninordertogettheborrowerqualifiedandtoearncommissionsontheclosedsales.
Figure 7: Overall and Employment/Income Fraud Risk vs. Borrower Monthly Income
132012 Annual
a SMARTER Approach To Risk
©2013. All rights reserved. FraudGUARD is a registered trademark of Interthinx, Inc., Interthinx is a registered trademark of Interthinx, Inc..
0
50
100
150
200
250
300
350
400
0 -
100K
$100
K -
$20
0K
$200
K -
$30
0K
$300
K -
$41
7K
$417
K -
$72
9.75
K
> $
729.
75K
Fra
ud
Ris
k In
dex
Loan Amount
Overall Risk
Property Valuation Index
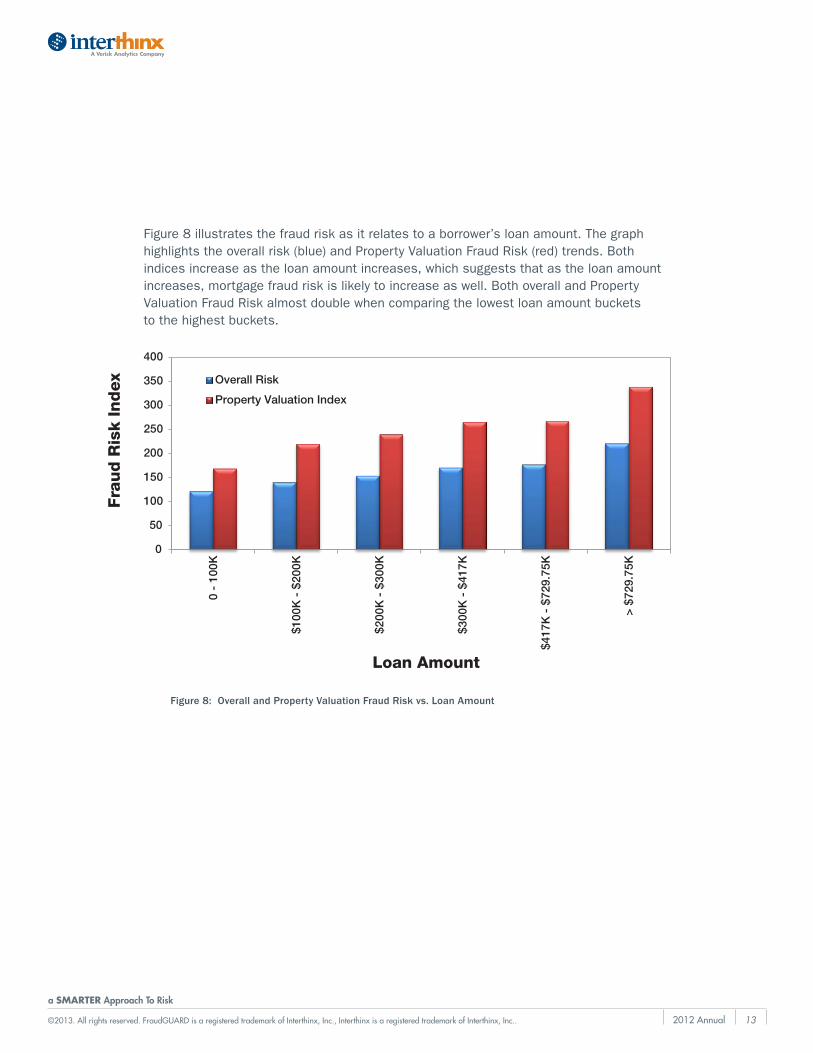
Figure 8 illustrates the fraud risk as it relates to a borrower’s loan amount. The graph highlightstheoverallrisk(blue)andPropertyValuationFraudRisk(red)trends.Bothindices increase as the loan amount increases, which suggests that as the loan amount increases,mortgagefraudriskislikelytoincreaseaswell.BothoverallandPropertyValuation Fraud Risk almost double when comparing the lowest loan amount buckets to the highest buckets.
Figure 8: Overall and Property Valuation Fraud Risk vs. Loan Amount
142012 Annual
a SMARTER Approach To Risk
©2013. All rights reserved. FraudGUARD is a registered trademark of Interthinx, Inc., Interthinx is a registered trademark of Interthinx, Inc..
0
50
100
150
200
250
Inve
sto
r
Ow
ner
Occ
upie
d
Sec
ond
Ho
me
Mort
gage F
rau
d R
isk In
dex
Occupancy Type
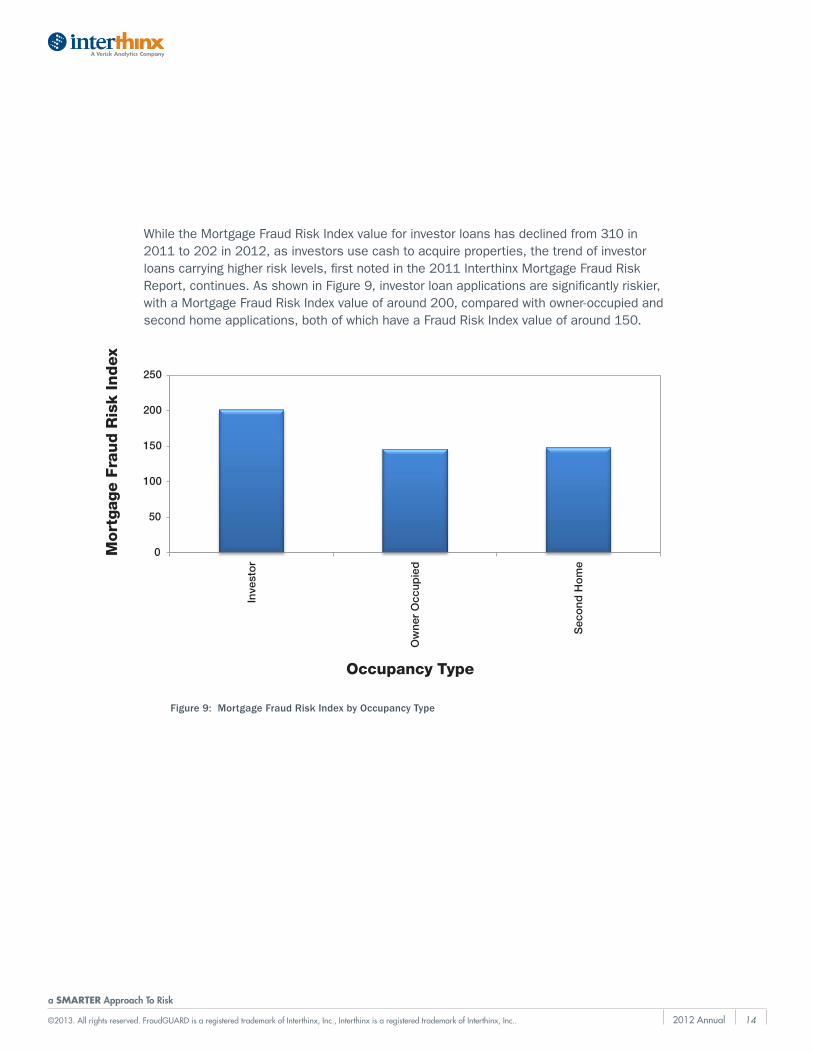
WhiletheMortgageFraudRiskIndexvalueforinvestorloanshasdeclinedfrom310in2011to202in2012,asinvestorsusecashtoacquireproperties,thetrendofinvestorloanscarryinghigherrisklevels,firstnotedinthe2011InterthinxMortgageFraudRiskReport, continues. As shown in Figure 9, investor loan applications are significantly riskier, withaMortgageFraudRiskIndexvalueofaround200,comparedwithowner-occupiedandsecondhomeapplications,bothofwhichhaveaFraudRiskIndexvalueofaround150.
Figure 9: Mortgage Fraud Risk Index by Occupancy Type
152012 Annual
a SMARTER Approach To Risk
©2013. All rights reserved. FraudGUARD is a registered trademark of Interthinx, Inc., Interthinx is a registered trademark of Interthinx, Inc..
0
50
100
150
200
250
300
350
400
0 to
1%
5% t
o 6
%
10%
to
11%
15%
to
16%
20%
to
21%
25%
to
26%
30%
to
31%
35%
to
36%
40%
to
41%
45%
to
46%
50%
to
51%
55%
to
56%
60%
to
61%
65%
to
66%
70%
to
71%
75%
to
76%
80%
to
81%
85%
to
86%
90%
to
91%
95%
to
96%
> 1
00%
Mort
gage F
rau
d R
isk Index
LTV
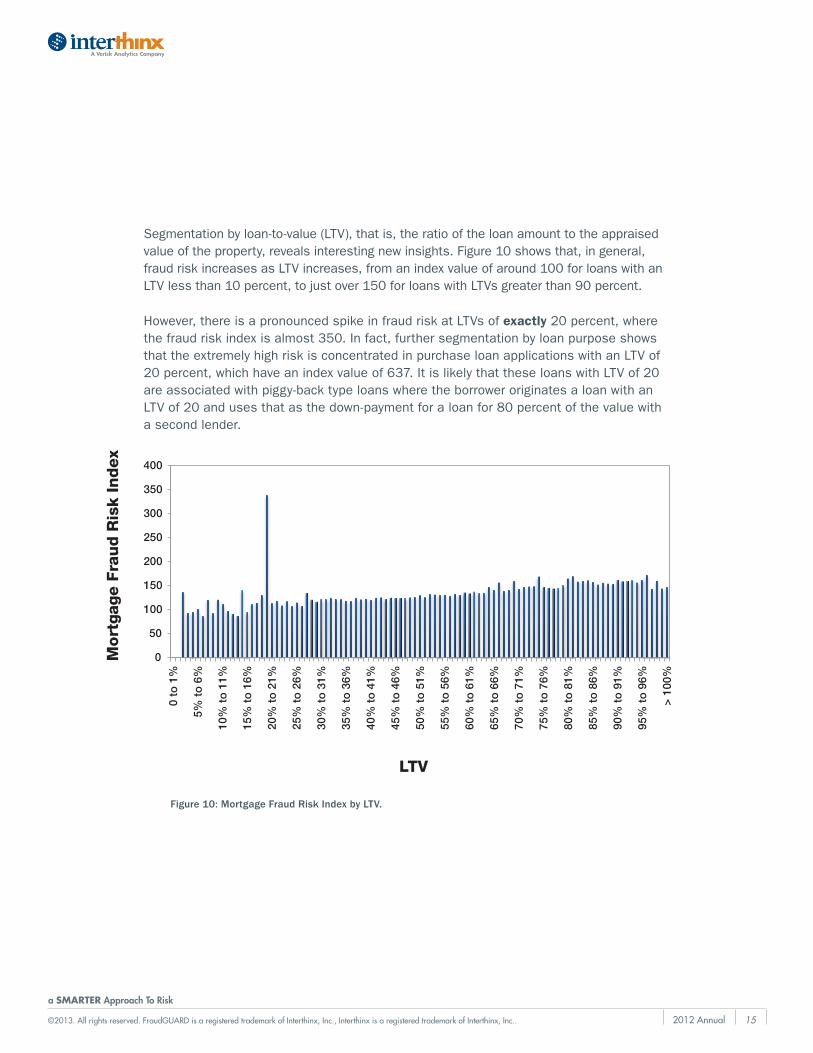
Segmentationbyloan-to-value(LTV),thatis,theratiooftheloanamounttotheappraisedvalue of the property, reveals interesting new insights. Figure 10 shows that, in general, fraudriskincreasesasLTVincreases,fromanindexvalueofaround100forloanswithanLTVlessthan10percent,tojustover150forloanswithLTVsgreaterthan90percent.
However,thereisapronouncedspikeinfraudriskatLTVsofexactly 20 percent, where thefraudriskindexisalmost350.Infact,furthersegmentationbyloanpurposeshowsthattheextremelyhighriskisconcentratedinpurchaseloanapplicationswithanLTVof20percent,whichhaveanindexvalueof637.ItislikelythattheseloanswithLTVof20are associated with piggy-back type loans where the borrower originates a loan with an LTVof20andusesthatasthedown-paymentforaloanfor80percentofthevaluewitha second lender.
Figure 10: Mortgage Fraud Risk Index by LTV.
162012 Annual
a SMARTER Approach To Risk
©2013. All rights reserved. FraudGUARD is a registered trademark of Interthinx, Inc., Interthinx is a registered trademark of Interthinx, Inc..
Extended Forecast
The changes in geographic and type-specific fraud risks observed in this report reflect changes in the residential housing market. As economic conditions change, fraud schemes are adjusted to take advantage of current conditions. Although mortgage fraud riskremainshighinthewesternUnitedStates,riskineasternstates–particularlythosethatarebeginningtorecoverfromtherealestatebust–isrisingandlendersshould be alert to emerging fraud trends in these geographies in order to prevent fraud inapplicationsfromtranslatingintodelinquenciesanddefaultsinclosedloans.Lenderswould also be well advised to proactively consider how regulatory changes, such as the“qualifiedmortgage”rulewithitsemphasisonverificationofborrowerincomeandassets, will influence fraud schemes in the future.
17Mortgage Fraud Risk Report 2012 Annualinterthinx.com 800.333.4510 [email protected]
About the Interthinx Fraud Risk Indices
TheFraudRiskIndicesarecalculatedbasedonthefrequencywithwhichindicators of fraudulent activity are detected in mortgage applications processed by the Interthinx FraudGUARD®system, a leading loan-level fraud detection tool available to lenders and investors.
TheInterthinxFraudRiskIndicesconsistoftheMortgageFraudRiskIndex,whichmeasurestheoverallriskofmortgagefraud,andthePropertyValuation,Identity,OccupancyandEmployment/IncomeIndices,whichmeasuretheriskofthesespecifictypes of fraudulent activity.
TheMortgageFraudRiskIndexconsiders40+indicatorsoffraudulentactivityincludingpropertymis-valuation;identity,occupancyandemployment/incomemisrepresentation;non arms-length transactions; property flipping; straw-buyers; “silent seconds”; and concurrent closing schemes. The four type-specific indices are based on the subset of indicators that are relevant to each type of fraudulent activity.
EachIndexiscalibratedsothatavalueof100representsanominalleveloffraudrisk,avaluecalculatedfromtheoccurrenceoffraudulentindicatorsbetween2003and2007instates with low foreclosure levels. For all five indices, a high value indicates an elevated risk of mortgage fraud and each Index is linear to simplify comparison across time and location.
The Interthinx Indices are leading indicators based predominantly on the analysis of current loanoriginations.FBIandFinCENreportsarelaggingindicatorsbecausetheyarederivedprimarilyfromSuspiciousActivityReports(SARs),themajorityofwhicharefiledaftertheloans have closed. The time lag between origination and the SAR report can be several years. For this reason, the Interthinx Fraud Risk Indices’ top geographies and type-specific findingsmaydifferfromFBIandFinCENfraudreports.
182012 Annual
a SMARTER Approach To Risk
©2013. All rights reserved. FraudGUARD is a registered trademark of Interthinx, Inc., Interthinx is a registered trademark of Interthinx, Inc..
About the Interthinx Mortgage Fraud Risk Report
The Interthinx Fraud Risk Report represents an in-depth analysis of residential mortgage fraud risk throughout the United States as indicated by the Interthinx Fraud Risk Indices. Publishedquarterly,aspartoftheFraudRiskReport,InterthinxwillreportonthegeographicregionswiththehighestMortgageFraudRiskIndexaswellasthosewiththehighestPropertyValuation,Identity,Occupancy,andEmployment/IncomeFraudRiskIndices.TheInterthinxFraudRiskIndicestracktheserisksinallStates,Metropolitanareas,Countiesandcountyequivalents,throughouttheUnitedStates.
About Interthinx
Interthinx,aVeriskAnalytics(Nasdaq:VRSK)subsidiary,providesessentialproductsand services to mitigate risk in the mortgage and retail lending marketplace. Interthinx offerssolutionsinmortgagefraudandverification,propertyvaluation,compliance,qualitycontrol, loss mitigation, retail loan loss forecasting, and capital planning that are used by the nation’s top financial institutions. Interthinx helps its clients minimize risk, increase operational efficiencies, satisfy regulator demands, manage data verification, and remain compliant.Formoreinformation,visitwww.interthinx.comorcall1-800-333-4510.
MEDIACONTACT: DepthPublicRelationsTelephone:301-337-8477Email:[email protected]