2012-2013 Trapper School Nuiqsut NUI...Spring 2012 & 2013 -- Grade 10. Results for Grade 10 High...
11
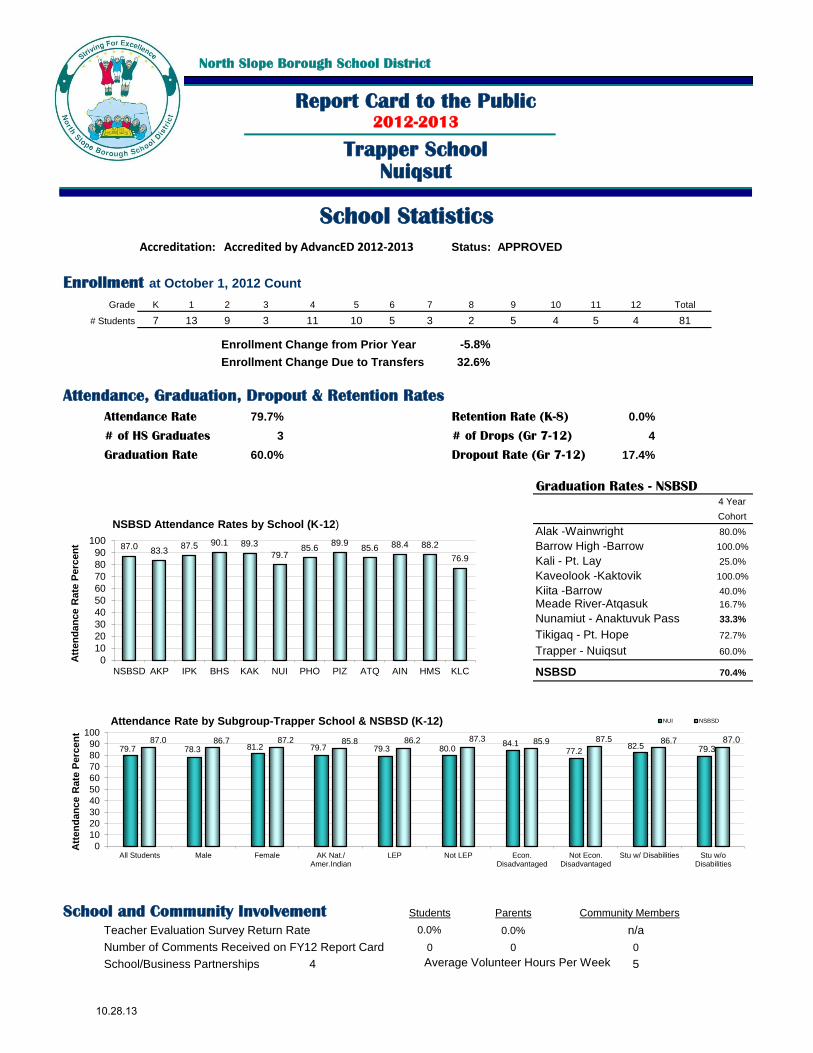
North Slope Borough School District Report Card to the Public 2012-2013 Trapper School Nuiqsut School Statistics Accreditation: Accredited by AdvancED 2012-2013 Status: APPROVED Enrollment at October 1, 2012 Count Grade K 1 2 3 4 5 6 7 8 9 10 11 12 Total # Students 7 13 9 3 11 10 5 3 2 5 4 5 4 81 Enrollment Change from Prior Year -5.8% Enrollment Change Due to Transfers 32.6% Attendance, Graduation, Dropout & Retention Rates Attendance Rate 79.7% Retention Rate (K-8) 0.0% # of HS Graduates 3 # of Drops (Gr 7-12) 4 Graduation Rate 60.0% Dropout Rate (Gr 7-12) 17.4% Graduation Rates - NSBSD 4 Year Cohort Alak -Wainwright 80.0% Barrow High -Barrow 100.0% Kali - Pt. Lay 25.0% Kaveolook -Kaktovik 100.0% Kiita -Barrow 40.0% Meade River-Atqasuk 16.7% Nunamiut - Anaktuvuk Pass 33.3% Tikigaq - Pt. Hope 72.7% Trapper - Nuiqsut 60.0% NSBSD 70.4% School and Community Involvement Students Parents Community Members Teacher Evaluation Survey Return Rate 0.0% 0.0% n/a Number of Comments Received on FY12 Report Card 0 0 0 School/Business Partnerships 4 5 Average Volunteer Hours Per Week 79.7 78.3 81.2 79.7 79.3 80.0 84.1 77.2 82.5 79.3 87.0 86.7 87.2 85.8 86.2 87.3 85.9 87.5 86.7 87.0 0 10 20 30 40 50 60 70 80 90 100 All Students Male Female AK Nat./ Amer.Indian LEP Not LEP Econ. Disadvantaged Not Econ. Disadvantaged Stu w/ Disabilities Stu w/o Disabilities Attendance Rate Percent Attendance Rate by Subgroup-Trapper School & NSBSD (K-12) NUI NSBSD 87.0 83.3 87.5 90.1 89.3 79.7 85.6 89.9 85.6 88.4 88.2 76.9 0 10 20 30 40 50 60 70 80 90 100 NSBSD AKP IPK BHS KAK NUI PHO PIZ ATQ AIN HMS KLC Attendance Rate Percent NSBSD Attendance Rates by School (K-12) 10.28.13
Transcript of 2012-2013 Trapper School Nuiqsut NUI...Spring 2012 & 2013 -- Grade 10. Results for Grade 10 High...
North Slope Borough School District
Report Card to the Public2012-2013
Trapper SchoolNuiqsut
School Statistics
Accreditation: Accredited by AdvancED 2012-2013 Status: APPROVED
Enrollment at October 1, 2012 Count
Grade K 1 2 3 4 5 6 7 8 9 10 11 12 Total
# Students 7 13 9 3 11 10 5 3 2 5 4 5 4 81
Enrollment Change from Prior Year -5.8%
Enrollment Change Due to Transfers 32.6%
Attendance, Graduation, Dropout & Retention Rates
Attendance Rate 79.7% Retention Rate (K-8) 0.0%
# of HS Graduates 3 # of Drops (Gr 7-12) 4
Graduation Rate 60.0% Dropout Rate (Gr 7-12) 17.4%
Graduation Rates - NSBSD4 Year
Cohort
Alak -Wainwright 80.0%
Barrow High -Barrow 100.0%
Kali - Pt. Lay 25.0%
Kaveolook -Kaktovik 100.0%
Kiita -Barrow 40.0%
Meade River-Atqasuk 16.7%
Nunamiut - Anaktuvuk Pass 33.3%
Tikigaq - Pt. Hope 72.7%
Trapper - Nuiqsut 60.0%
NSBSD 70.4%
School and Community Involvement Students Parents Community Members
Teacher Evaluation Survey Return Rate 0.0% 0.0% n/a
Number of Comments Received on FY12 Report Card 0 0 0
School/Business Partnerships 4 5Average Volunteer Hours Per Week
79.7 78.3 81.2 79.7 79.3 80.0 84.1
77.2 82.5 79.3
87.0 86.7 87.2 85.8 86.2 87.3 85.9 87.5 86.7 87.0
0
10
20
30
40
50
60
70
80
90
100
All Students Male Female AK Nat./Amer.Indian
LEP Not LEP Econ.Disadvantaged
Not Econ.Disadvantaged
Stu w/ Disabilities Stu w/oDisabilities
Att
en
dan
ce R
ate
Perc
en
t
Attendance Rate by Subgroup-Trapper School & NSBSD (K-12) NUI NSBSD
87.0 83.3
87.5 90.1 89.3
79.7 85.6
89.9 85.6 88.4 88.2
76.9
0
10
20
30
40
50
60
70
80
90
100
NSBSD AKP IPK BHS KAK NUI PHO PIZ ATQ AIN HMS KLC
Att
en
dan
ce R
ate
Perc
en
t
NSBSD Attendance Rates by School (K-12)
10.28.13
Trapper School, Nuiqsut -- Report Card 2012-2013 Assessments
**Not reportable
*Results for MAP cannot be published without releasing personally identifiable information.
For additional information on AYP status of schools and subgroups, see Adequate * (emergency or provisional certificate issued for reason other than not * Fewer than 20 continuously enrolled students Meade River School has been designated a "Level 1" school in "alert" status because it did
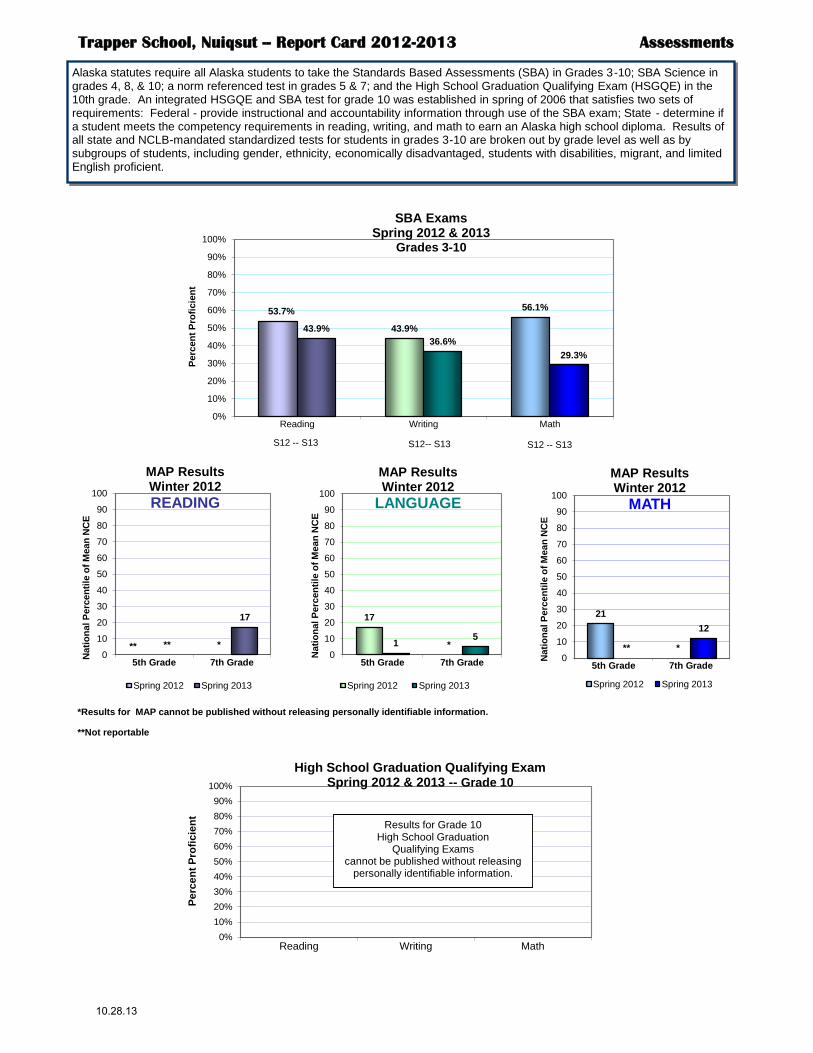
53.7%
43.9%
56.1%
43.9%
36.6%
29.3%
0%
10%
20%
30%
40%
50%
60%
70%
80%
90%
100%
Reading Writing Math
Perc
en
t P
rofi
cie
nt
SBA Exams Spring 2012 & 2013
Grades 3-10
* **
17
0
10
20
30
40
50
60
70
80
90
100
5th Grade 7th Grade
Nati
on
al P
erc
en
tile
of
Mean
NC
E
MAP Results Winter 2012
READING
Spring 2012 Spring 2013
0%
10%
20%
30%
40%
50%
60%
70%
80%
90%
100%
Reading Writing Math
Pe
rce
nt
Pro
fic
ien
t
High School Graduation Qualifying Exam Spring 2012 & 2013 -- Grade 10
Results for Grade 10 High School Graduation
Qualifying Exams cannot be published without releasing
personally identifiable information.
17
* 1 5
0
10
20
30
40
50
60
70
80
90
100
5th Grade 7th Grade
Nati
on
al P
erc
en
tile
of
Mean
NC
E
MAP Results Winter 2012
LANGUAGE
Spring 2012 Spring 2013
21
* **
12
0
10
20
30
40
50
60
70
80
90
100
5th Grade 7th Grade
Nati
on
al P
erc
en
tile
of
Mean
NC
E
MAP Results Winter 2012
MATH
Spring 2012 Spring 2013
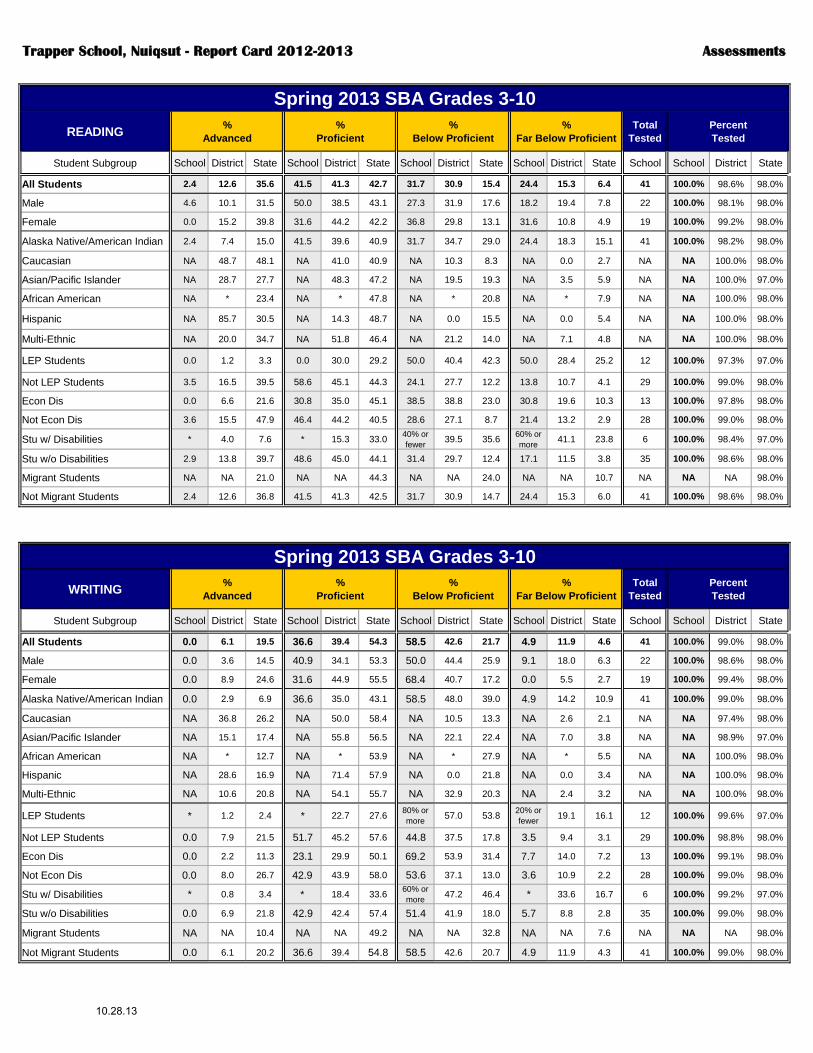
Alaska statutes require all Alaska students to take the Standards Based Assessments (SBA) in Grades 3-10; SBA Science in grades 4, 8, & 10; a norm referenced test in grades 5 & 7; and the High School Graduation Qualifying Exam (HSGQE) in the 10th grade. An integrated HSGQE and SBA test for grade 10 was established in spring of 2006 that satisfies two sets of requirements: Federal - provide instructional and accountability information through use of the SBA exam; State - determine if a student meets the competency requirements in reading, writing, and math to earn an Alaska high school diploma. Results of all state and NCLB-mandated standardized tests for students in grades 3-10 are broken out by grade level as well as by subgroups of students, including gender, ethnicity, economically disadvantaged, students with disabilities, migrant, and limited English proficient.
S12-- S13 S12 -- S13 S12 -- S13
**
10.28.13

Trapper School, Nuiqsut -- Report Card 2012-2013 Assessments
For additional information on AYP status of schools and subgroups, see Adequate Yearly * (emergency or provisional certificate issued for reason other than not * Fewer than 20 continuously enrolled students Meade River School has been designated a "Level 1" school in "alert" status because it did
58.85%
19.35%
59.70%
41.64%
61.62%
31.20%
47.02%
59.41%
48.61%
53.84%
51.4%
*
50.0%
30.8%
62.1%
*
43.9%
31.6%
54.6%
43.9%
0% 10% 20% 30% 40% 50% 60% 70% 80% 90% 100%
Stu w/o Dis
Stu w/ Dis
Not Econ Dis
Econ Dis
Not Limited English
Limited English
AK Nat/Amer Ind
Female
Male
All Students
Percent Proficient
Subgroup Performance - Trapper & NSBSD, Grades 3-10 -- READING
Trapper
NSBSD
49.3%
19.2%
52.0%
32.1%
53.1%
23.8%
37.8%
53.8%
37.7%
45.5%
42.9%
*
42.9%
23.1%
51.7%
*
36.6%
31.6%
40.9%
36.6%
0% 10% 20% 30% 40% 50% 60% 70% 80% 90% 100%
Stu w/o Dis
Stu w/ Dis
Not Econ Dis
Econ Dis
Not Limited English
Limited English
AK Nat/Amer Ind
Female
Male
All Students
Percent Proficient
Subgroup Performance - Trapper & NSBSD, Grades 3-10 -- WRITING
Trapper
NSBSD
55.1%
17.5%
56.7%
37.1%
57.3%
30.2%
43.9%
54.5%
46.4%
50.3%
34.3%
*
35.7%
15.4%
41.4%
*
29.3%
26.3%
31.8%
29.3%
0% 10% 20% 30% 40% 50% 60% 70% 80% 90% 100%
Stu w/o Dis
Stu w/ Dis
Not Econ Dis
Econ Dis
Not Limited English
Limited English
AK Nat/Amer Ind
Female
Male
All Students
Percent Proficient
Subgroup Performance -Trapper & NSBSD, Grades 3-10 -- MATH
Trapper
NSBSD
*Note: Results for some student subgroups cannot be published without disclosing personally identifiable information.
10.28.13
Trapper School, Nuiqsut - Report Card 2012-2013 Assessments
Spring 2013 SBA Grades 3-10
READING%
Advanced
%
Proficient
%
Below Proficient
%
Far Below Proficient
Total
Tested
Percent
Tested
Student Subgroup School District State School District State School District State School District State School School District State
All Students 2.4 12.6 35.6 41.5 41.3 42.7 31.7 30.9 15.4 24.4 15.3 6.4 41 100.0% 98.6% 98.0%
Male 4.6 10.1 31.5 50.0 38.5 43.1 27.3 31.9 17.6 18.2 19.4 7.8 22 100.0% 98.1% 98.0%
Female 0.0 15.2 39.8 31.6 44.2 42.2 36.8 29.8 13.1 31.6 10.8 4.9 19 100.0% 99.2% 98.0%
Alaska Native/American Indian 2.4 7.4 15.0 41.5 39.6 40.9 31.7 34.7 29.0 24.4 18.3 15.1 41 100.0% 98.2% 98.0%
Caucasian NA 48.7 48.1 NA 41.0 40.9 NA 10.3 8.3 NA 0.0 2.7 NA NA 100.0% 98.0%
Asian/Pacific Islander NA 28.7 27.7 NA 48.3 47.2 NA 19.5 19.3 NA 3.5 5.9 NA NA 100.0% 97.0%
African American NA * 23.4 NA * 47.8 NA * 20.8 NA * 7.9 NA NA 100.0% 98.0%
Hispanic NA 85.7 30.5 NA 14.3 48.7 NA 0.0 15.5 NA 0.0 5.4 NA NA 100.0% 98.0%
Multi-Ethnic NA 20.0 34.7 NA 51.8 46.4 NA 21.2 14.0 NA 7.1 4.8 NA NA 100.0% 98.0%
LEP Students 0.0 1.2 3.3 0.0 30.0 29.2 50.0 40.4 42.3 50.0 28.4 25.2 12 100.0% 97.3% 97.0%
Not LEP Students 3.5 16.5 39.5 58.6 45.1 44.3 24.1 27.7 12.2 13.8 10.7 4.1 29 100.0% 99.0% 98.0%
Econ Dis 0.0 6.6 21.6 30.8 35.0 45.1 38.5 38.8 23.0 30.8 19.6 10.3 13 100.0% 97.8% 98.0%
Not Econ Dis 3.6 15.5 47.9 46.4 44.2 40.5 28.6 27.1 8.7 21.4 13.2 2.9 28 100.0% 99.0% 98.0%
Stu w/ Disabilities * 4.0 7.6 * 15.3 33.040% or
fewer39.5 35.6
60% or
more41.1 23.8 6 100.0% 98.4% 97.0%
Stu w/o Disabilities 2.9 13.8 39.7 48.6 45.0 44.1 31.4 29.7 12.4 17.1 11.5 3.8 35 100.0% 98.6% 98.0%
Migrant Students NA NA 21.0 NA NA 44.3 NA NA 24.0 NA NA 10.7 NA NA NA 98.0%
Not Migrant Students 2.4 12.6 36.8 41.5 41.3 42.5 31.7 30.9 14.7 24.4 15.3 6.0 41 100.0% 98.6% 98.0%
Spring 2013 SBA Grades 3-10
WRITING%
Advanced
%
Proficient
%
Below Proficient
%
Far Below Proficient
Total
Tested
Percent
Tested
Student Subgroup School District State School District State School District State School District State School School District State
All Students 0.0 6.1 19.5 36.6 39.4 54.3 58.5 42.6 21.7 4.9 11.9 4.6 41 100.0% 99.0% 98.0%
Male 0.0 3.6 14.5 40.9 34.1 53.3 50.0 44.4 25.9 9.1 18.0 6.3 22 100.0% 98.6% 98.0%
Female 0.0 8.9 24.6 31.6 44.9 55.5 68.4 40.7 17.2 0.0 5.5 2.7 19 100.0% 99.4% 98.0%
Alaska Native/American Indian 0.0 2.9 6.9 36.6 35.0 43.1 58.5 48.0 39.0 4.9 14.2 10.9 41 100.0% 99.0% 98.0%
Caucasian NA 36.8 26.2 NA 50.0 58.4 NA 10.5 13.3 NA 2.6 2.1 NA NA 97.4% 98.0%
Asian/Pacific Islander NA 15.1 17.4 NA 55.8 56.5 NA 22.1 22.4 NA 7.0 3.8 NA NA 98.9% 97.0%
African American NA * 12.7 NA * 53.9 NA * 27.9 NA * 5.5 NA NA 100.0% 98.0%
Hispanic NA 28.6 16.9 NA 71.4 57.9 NA 0.0 21.8 NA 0.0 3.4 NA NA 100.0% 98.0%
Multi-Ethnic NA 10.6 20.8 NA 54.1 55.7 NA 32.9 20.3 NA 2.4 3.2 NA NA 100.0% 98.0%
LEP Students * 1.2 2.4 * 22.7 27.680% or
more57.0 53.8
20% or
fewer19.1 16.1 12 100.0% 99.6% 97.0%
Not LEP Students 0.0 7.9 21.5 51.7 45.2 57.6 44.8 37.5 17.8 3.5 9.4 3.1 29 100.0% 98.8% 98.0%
Econ Dis 0.0 2.2 11.3 23.1 29.9 50.1 69.2 53.9 31.4 7.7 14.0 7.2 13 100.0% 99.1% 98.0%
Not Econ Dis 0.0 8.0 26.7 42.9 43.9 58.0 53.6 37.1 13.0 3.6 10.9 2.2 28 100.0% 99.0% 98.0%
Stu w/ Disabilities * 0.8 3.4 * 18.4 33.660% or
more47.2 46.4 * 33.6 16.7 6 100.0% 99.2% 97.0%
Stu w/o Disabilities 0.0 6.9 21.8 42.9 42.4 57.4 51.4 41.9 18.0 5.7 8.8 2.8 35 100.0% 99.0% 98.0%
Migrant Students NA NA 10.4 NA NA 49.2 NA NA 32.8 NA NA 7.6 NA NA NA 98.0%
Not Migrant Students 0.0 6.1 20.2 36.6 39.4 54.8 58.5 42.6 20.7 4.9 11.9 4.3 41 100.0% 99.0% 98.0%
10.28.13

Trapper School, Nuiqsut - Report Card 2012-2013 Assessments
Spring 2013 SBA Grades 3-10
MATH%
Advanced
%
Proficient
%
Below Proficient
%
Far Below Proficient
Total
Tested
Percent
Tested
Student Subgroup School District State School District State School District State School District State School School District State
All Students 4.9 16.7 32.5 24.4 33.6 36.9 39.0 24.0 15.9 31.7 25.7 14.6 41 100.0% 98.8% 98.0%
Male 9.1 14.4 32.0 22.7 32.0 36.2 31.8 25.1 16.0 36.4 28.6 15.8 22 100.0% 98.6% 98.0%
Female 0.0 19.1 33.0 26.3 35.4 37.7 7.4 22.9 15.8 26.3 22.7 13.4 19 100.0% 99.0% 98.0%
Alaska Native/American Indian 4.9 11.2 16.0 24.4 32.7 33.2 39.0 24.9 22.0 31.7 31.1 28.9 41 100.0% 97.3% 98.0%
Caucasian NA 48.7 42.0 NA 33.3 37.9 NA 18.0 12.3 NA 0.0 7.8 NA NA 100.0% 98.0%
Asian/Pacific Islander NA 36.1 30.9 NA 40.7 38.3 NA 12.8 16.7 NA 10.5 14.0 NA NA 98.9% 99.0%
African American NA * 19.7 NA * 36.5 NA * 20.6 NA * 23.1 NA NA 100.0% 98.0%
Hispanic NA 57.1 26.8 NA 42.9 39.4 NA 0.0 18.5 NA 0.0 15.3 NA NA 100.0% 98.0%
Multi-Ethnic NA 27.1 32.9 NA 34.1 38.3 NA 30.6 16.2 NA 8.2 12.6 NA NA 100.0% 98.0%
LEP Students 0.0 3.9 5.3 0.0 26.3 25.5 25.0 32.6 24.8 75.0 37.3 44.3 12 100.0% 99.2% 98.0%
Not LEP Students 6.9 21.1 35.8 34.5 36.2 38.3 44.8 21.0 14.8 13.8 21.7 11.0 29 100.0% 98.6% 98.0%
Econ Dis 0.0 10.9 20.6 15.4 26.2 36.6 46.2 30.2 20.4 38.5 32.7 22.4 13 100.0% 99.1% 98.0%
Not Econ Dis 7.1 19.5 43.0 28.6 37.2 37.2 35.7 21.0 12.0 28.6 22.3 7.8 28 100.0% 98.7% 98.0%
Stu w/ Disabilities * 3.2 7.5 * 14.3 24.540% or
fewer25.4 24.1
60% or
more57.1 43.9 6 100.0% 100.0% 97.0%
Stu w/o Disabilities 5.7 18.6 36.2 28.6 36.5 38.8 40.0 23.8 14.7 25.7 21.1 10.3 35 100.0% 98.6% 98.0%
Migrant Students NA NA 22.2 NA NA 36.7 NA NA 19.3 NA NA 21.9 NA NA NA 98.0%
Not Migrant Students 4.9 16.7 33.3 24.4 33.6 37.0 39.0 24.0 15.7 31.7 25.7 14.0 41 100.0% 98.8% 98.0%
Spring 2013 SBA Grades 4, 8, and 10
SCIENCE%
Advanced
%
Proficient
%
Below Proficient
%
Far Below Proficient
Total
Tested
Percent
Tested
Student Subgroup School District State School District State School District State School District State School School District State*
All Students 0.0 6.3 27.4 7.7 15.3 29.9 38.5 27.5 23.1 53.9 50.9 19.7 13 86.7% 95.8% 95.0%
Male 0.0 6.5 29.4 12.5 14.4 29.2 62.5 31.4 21.5 25.0 47.7 19.9 8 88.9% 94.4% 95.0%
Female * 6.0 25.2 * 16.2 30.6 * 24.0 24.860% or
more53.9 19.5 5 83.3% 93.6% 95.0%
Alaska Native/American Indian 0.0 3.3 10.5 7.7 11.9 20.6 38.5 26.3 28.2 53.9 58.4 40.7 13 86.7% 94.9% 94.0%
Caucasian NA 41.2 38.8 NA 35.3 33.7 NA 17.7 18.1 NA 5.9 9.3 NA NA 100.0% 95.0%
Asian/Pacific Islander NA 8.6 18.0 NA 25.7 27.8 NA 34.3 28.6 NA 31.4 25.5 NA NA 100.0% 97.0%
African American NA * 11.6 NA * 28.9 NA * 30.8 NA * 28.8 NA NA 100.0% 96.0%
Hispanic NA * 20.3 NA * 31.1 NA * 28.2 NA * 20.4 NA NA 100.0% 97.0%
Multi-Ethnic NA 4.8 25.6 NA 23.8 33.3 NA 33.3 26.5 NA 38.1 14.6 NA NA 95.5% 95.0%
LEP Students * 0.0 1.4 * 4.6 6.0 * 21.2 26.0 * 74.2 66.6 4 100.0% 94.3% 95.0%
Not LEP Students 0.0 7.9 30.2 11.1 18.1 32.5 55.6 29.1 22.8 33.3 44.9 14.6 9 81.8% 96.2% 95.0%
Econ Dis * 0.9 14.2 * 6.5 25.4 * 24.1 29.1 * 68.5 31.3 2 66.7% 93.9% 95.0%
Not Econ Dis 0.0 9.0 38.2 9.1 19.8 33.5 36.4 29.3 18.2 54.6 42.0 10.1 11 91.7% 96.8% 96.0%
Stu w/ Disabilities * 0.0 6.8 * 9.5 18.1 * 11.9 26.8 * 78.6 48.3 2 100.0% 100.0% 94.0%
Stu w/o Disabilities 0.0 7.2 30.3 9.1 16.2 31.5 45.5 29.9 22.6 45.5 46.8 15.7 11 84.6% 95.2% 95.0%
Migrant Students NA NA 14.8 NA NA 25.4 NA NA 29.3 NA NA 30.4 NA NA NA 96.0%
Not Migrant Students 0.0 6.3 28.4 7.7 15.3 30.2 38.5 27.5 22.6 53.9 50.9 18.8 13 86.7% 95.8% 95.0%
10.28.13

Trapper School, Nuiqsut -- Report Card 2012-2013 Assessments
Grade Level Performance on Assessments
Spring 2013 Standards Based Assessments
Reading Writing Math
Number
Tested Adv. Prof.
Below
Prof.
Far
Below
Prof.
Number
Tested Adv. Prof.
Below
Prof.
Far
Below
Prof.
Number
Tested Adv. Prof.
Below
Prof.
Far
Below
Prof.
Grade 33 * * * * 3 * * * * 3 * * * *
Grade 411 0.0 63.6 9.1 27.3 11 0.0 54.6 36.4 9.1 11 18.2 18.2 18.2 45.5
Grade 511 0.0 27.3 27.3 45.5 11 0.0 36.4 63.6 0.0 11 0.0 0.0 72.7 27.3
Grade 65 0.0 60.0 40.0 0.0 5 0.0 40.0 60.0 0.0 5 0.0 40.0 20.0 40.0
Grade 72 * * * * 2 * * * * 2 * * * *
Grade 8 2 * * * * 2 * * * * 2 * * * *
Grade 9 5 20.0 40.0 40.0 0.0 5 0.0 40.0 40.0 20.0 5 0.0 60.0 20.0 20.0
Grade 10 2 * * * * 2 * * * * 2 * * * *
Trapper 3-10 41 2.4 41.5 31.7 24.4 41 0.0 36.6 58.5 4.9 41 4.9 24.4 39.0 31.7
NSBSD 3-10977 12.6 41.3 30.9 15.3 981 6.1 39.4 42.6 11.9 979 16.7 33.6 24.0 25.7
STATE 3-1074,736 35.6 42.7 15.4 6.4 74,695 19.5 54.3 21.7 4.6 74,768 32.5 36.9 15.9 14.7
Spring 2013 Standards Based Assessments
Science
Number Tested Advanced Proficient Below Proficient Far Below Proficient
Trapper 4, 8, and 10
NSBSD 4, 8, and 10
STATE 4, 8, & 10
Spring 2013 HSGQE
Reading Writing Math
Number # %
#
Not
%
Not Number # %
#
Not
%
Not Number # %
#
Not
%
Not
Tested Prof. Prof. Prof. Prof. Tested Prof. Prof. Prof. Prof. Tested Prof. Prof. Prof. Prof.
Trapper Grade 102 * * * * 2 * * * * 2 * * * *
NSBSD Grade 1088 53 60.2 35 39.8 88 33 37.5 55 62.5 87 54 62.1 33 37.9
STATE Grade 108,689 7263 83.6% 1426 16.4% 8,682 6236 71.8% 2446 28.2% 8,662 6638 76.6% 2024 23.4%
13 0.0 7.7 38.5
19.727,048 27.4 29.9 23.1
53.9
320 6.3 15.3 27.5 50.9
Percent of
Students at
Proficiency Levels
NOTES:
1) *HSGQE, SBA and MAP results are not published when fewer than 5 students are tested at a grade level or two or fewer students are reported in an individual cell. 2) N/A indicates that a school did not test students in that particular grade for that administration. 3) Percentages reported are based on the total number of students tested, not the number of students enrolled in the grade. 4) To provide more information a category has been added titled “All Grades.” Values in this row are the aggregated results from all grade levels tested for that school. This category allows the district to publish results for small schools without releasing personally identifiable information.
Percent of
Students at
Proficiency Levels
Percent of
Students at
Proficiency Levels
10.28.13

Trapper School, Nuiqsut -- Report Card 2012-2013 Assessments
Winter 2013 MAP Results
MAP - READING
Winter 2013 MAP Results
MAP - LANGUAGE
Winter 2013 MAP Results
MAP - MATH
**Not Reportable
For comparison of North Slope Borough Schools to other Alaska schools, please check Alaska Department of
Education and Early Development website: http://www.eed.state.ak.us/tls/assessment/results.html
For ASPI information for districts and schools, go to: http://www.eed.state.ak.us/akaccountability/
The District Report Card is available from the school or district office or on the NSBSD website at: www.nsbsd.org
12.0Grade 7
2 * * * *
*Results for MAP cannot be published without releasing personally identifiable information.
National Percentile
MNCE
76 - 99%tile 1 - 25%tile
Grade 511 * * * 80% or more **
Number
Tested
Number
Top Qtile
Percent
Top Qtile
Number
Bottom Qtile
Percent
Bottom Qtile
5.0Grade 7
2 * * * *
National Percentile
MNCE
76 - 99%tile 1 - 25%tile
Grade 511 * * * 80% or more 1.0
Number
Tested
Number
Top Qtile
Percent
Top Qtile
Number
Bottom Qtile
Percent
Bottom Qtile
17.0Grade 7
2 * * * *
National Percentile
MNCE
76 - 99%tile 1 - 25%tile
Grade 511 * * * 80% or more **
Number
Tested
Number
Top Qtile
Percent
Top Qtile
Number
Bottom Qtile
Percent
Bottom Qtile
For additional information on AYP status of schools and subgroups, see Adequate Yearly * (emergency or provisional certificate issued for reason other than not * Fewer than 20 continuously enrolled students Meade River School has been designated a "Level 1" school in "alert" status because it did not For additional information on AYP status of schools and subgroups, see Adequate Yearly * (emergency or provisional certificate issued for reason other than not * Fewer than 20 continuously enrolled students Meade River School has been designated a "Level 1" school in "alert" status because it did not For additional information on AYP status of schools and subgroups, see Adequate Yearly * (emergency or provisional certificate issued for reason other than not * Fewer than 20 continuously enrolled students Meade River School has been designated a "Level 1" school in "alert" status because it did not Percent of Percent of Percent of
Percent of Students in
Top and Bottom
Quartiles of National Percentile
Percent of Students in
Top and Bottom
Quartiles of National Percentile
Percent of Students in
Top and Bottom
Quartiles of National Percentile
10.28.13
Trapper School, Nuiqsut -- Report Card 2012-2013 Accountability
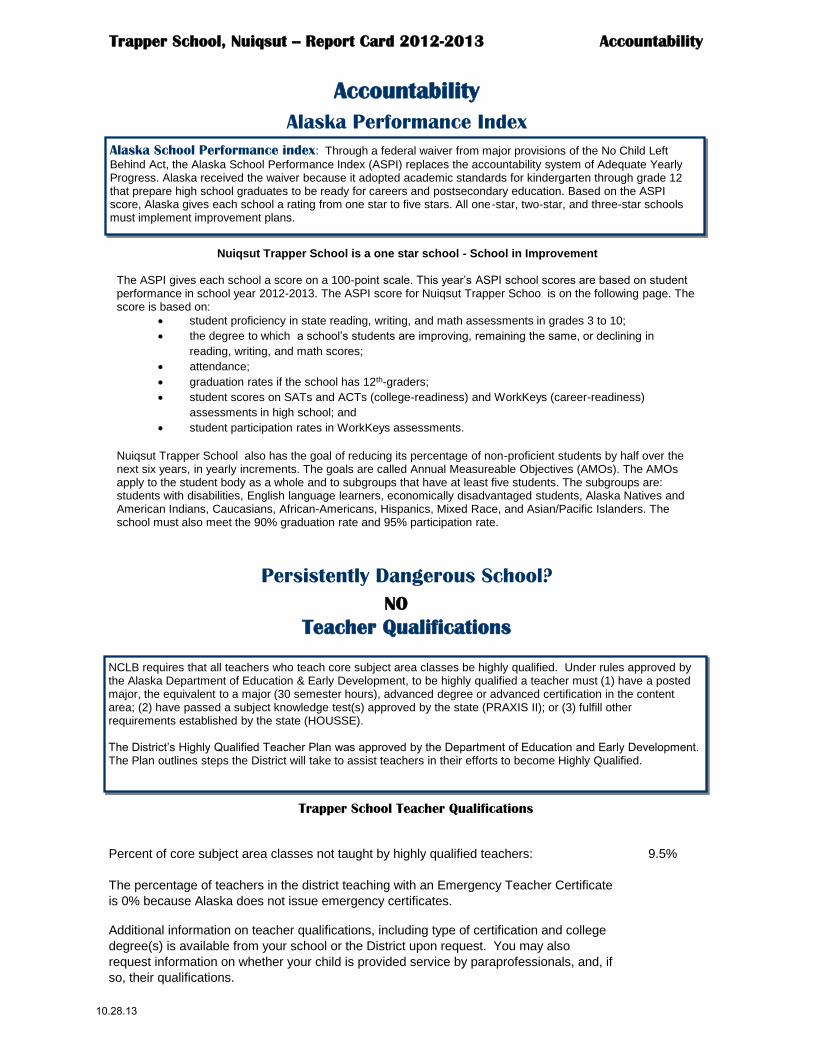
Accountability
Alaska Performance Index
NO
Teacher Qualifications
Trapper School Teacher Qualifications
Percent of core subject area classes not taught by highly qualified teachers: 9.5%
The percentage of teachers in the district teaching with an Emergency Teacher Certificate
is 0% because Alaska does not issue emergency certificates.
Additional information on teacher qualifications, including type of certification and college
degree(s) is available from your school or the District upon request. You may also
request information on whether your child is provided service by paraprofessionals, and, if
so, their qualifications.
Persistently Dangerous School?
Nuiqsut Trapper School is a one star school - School in Improvement The ASPI gives each school a score on a 100-point scale. This year’s ASPI school scores are based on student performance in school year 2012-2013. The ASPI score for Nuiqsut Trapper Schoo is on the following page. The score is based on:
student proficiency in state reading, writing, and math assessments in grades 3 to 10;
the degree to which a school’s students are improving, remaining the same, or declining in
reading, writing, and math scores;
attendance;
graduation rates if the school has 12th-graders;
student scores on SATs and ACTs (college-readiness) and WorkKeys (career-readiness)
assessments in high school; and
student participation rates in WorkKeys assessments.
Nuiqsut Trapper School also has the goal of reducing its percentage of non-proficient students by half over the next six years, in yearly increments. The goals are called Annual Measureable Objectives (AMOs). The AMOs apply to the student body as a whole and to subgroups that have at least five students. The subgroups are: students with disabilities, English language learners, economically disadvantaged students, Alaska Natives and American Indians, Caucasians, African-Americans, Hispanics, Mixed Race, and Asian/Pacific Islanders. The school must also meet the 90% graduation rate and 95% participation rate.
NCLB requires that all teachers who teach core subject area classes be highly qualified. Under rules approved by the Alaska Department of Education & Early Development, to be highly qualified a teacher must (1) have a posted major, the equivalent to a major (30 semester hours), advanced degree or advanced certification in the content area; (2) have passed a subject knowledge test(s) approved by the state (PRAXIS II); or (3) fulfill other requirements established by the state (HOUSSE). The District’s Highly Qualified Teacher Plan was approved by the Department of Education and Early Development. The Plan outlines steps the District will take to assist teachers in their efforts to become Highly Qualified.
Alaska School Performance index: Through a federal waiver from major provisions of the No Child Left
Behind Act, the Alaska School Performance Index (ASPI) replaces the accountability system of Adequate Yearly Progress. Alaska received the waiver because it adopted academic standards for kindergarten through grade 12 that prepare high school graduates to be ready for careers and postsecondary education. Based on the ASPI score, Alaska gives each school a rating from one star to five stars. All one-star, two-star, and three-star schools must implement improvement plans.
10.28.13
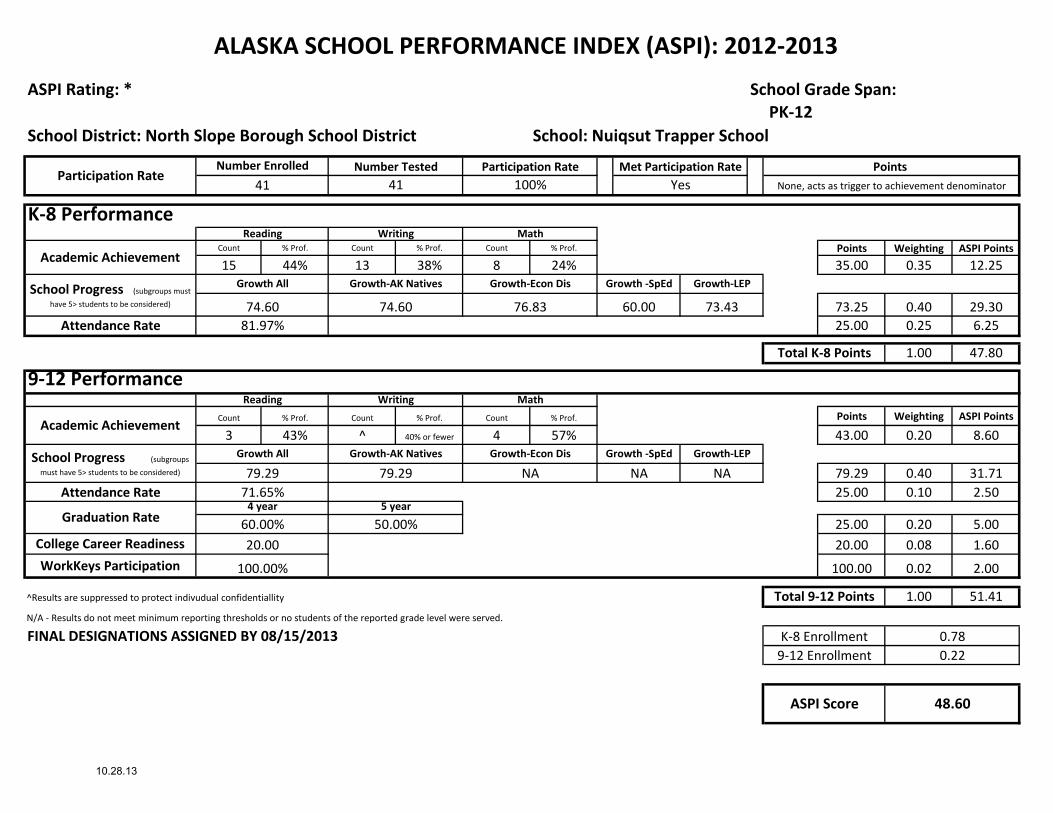
ALASKA SCHOOL PERFORMANCE INDEX (ASPI): 2012-2013
ASPI Rating: * School Grade Span:PK-12
School District: North Slope Borough School District School: Nuiqsut Trapper School
K-8 Performance
Count % Prof. Count % Prof. Count % Prof. Points Weighting ASPI Points
15 44% 13 38% 8 24% 35.00 0.35 12.25
73.25 0.40 29.30
25.00 0.25 6.25
1.00 47.80
9-12 Performance
Count % Prof. Count % Prof. Count % Prof. Points Weighting ASPI Points
3 43% ^ 40% or fewer 4 57% 43.00 0.20 8.60
79.29 0.40 31.71
25.00 0.10 2.50
25.00 0.20 5.00
^Results are suppressed to protect indivudual confidentiallity 1.00 51.41
N/A - Results do not meet minimum reporting thresholds or no students of the reported grade level were served.
FINAL DESIGNATIONS ASSIGNED BY 08/15/20130.22
ASPI Score 48.60
College Career Readiness 20.00 20.00 0.08 1.60
WorkKeys Participation 100.00% 100.00 0.02 2.00
Total 9-12 Points
K-8 Enrollment 0.78
9-12 Enrollment
Attendance Rate 71.65%
Graduation Rate4 year 5 year
60.00% 50.00%
Growth-LEP
79.29 79.29 NA NA NA
Growth -SpEd
Academic Achievement
School Progress (subgroups
must have 5> students to be considered)
Growth All Growth-AK Natives Growth-Econ Dis
Attendance Rate 81.97%
Total K-8 Points
Reading Writing Math
Growth-LEP
74.60 74.60 76.83 60.00 73.43
None, acts as trigger to achievement denominator
Reading Writing Math
Academic Achievement
Participation RateNumber Enrolled Number Tested Participation Rate Met Participation Rate Points
41 41 100% Yes
School Progress (subgroups must
have 5> students to be considered)
Growth All Growth-AK Natives Growth-Econ Dis Growth -SpEd
10.28.13

10.28.13

10.28.13