Drew Russell Chad Nelson, Physical Therapist Natalie Varel, Physical Therapist Assistant

Last updated: 03/27/14 Contact: [email protected]
2012-2013 Fact Sheet
Physical Therapist Education Programs This Fact Sheet is designed to provide the education community with current and historical information about physical therapist education programs, students and faculty. The data included in this Fact Sheet is taken from the following sources:
• The 2012 Annual Accreditation Report, completed December 2012 by US accredited programs (n=211) • The 2009, 2008, 2007, 2006 and 2005 Annual Accreditation Reports • The 1998, 2000, 2002, and 2004 Biennial Accreditation Reports • Previous surveys of the PT educational programs conducted by the Education Division • Department of Accreditation records • Licensure pass rate information provided by the FSBPT on April 2004, April 2005, April 2006, April 2007,
April 2011, and April 2012. This report describes programs in the United States. Data about accredited programs in other countries is not included in this Fact Sheet. Unless otherwise indicated, the data reflects the academic year 2012-2013.
CONTENTS The Average Physical Therapist Education Program ................................................................................2 Program Data Numbers of Programs ....................................................................................................................4 Distribution of Programs ...............................................................................................................5 Financing of Professional Education .............................................................................................8 Measures of Program Length .......................................................................................................11 Credits Required ..........................................................................................................................12 Curricular Models ........................................................................................................................13 Clinical Education ........................................................................................................................13 Outcomes .....................................................................................................................................14 Student Data Admissions ...................................................................................................................................16 Enrollment....................................................................................................................................19 Graduates .....................................................................................................................................21 Faculty Data Number of Faculty ......................................................................................................................24 Student to Faculty Ratios .............................................................................................................25 Workload .....................................................................................................................................25 Scholarship Productivity ..............................................................................................................27 Faculty Content Expertise ............................................................................................................28 Years as Faculty ...........................................................................................................................29 Demographics ..............................................................................................................................30 Degrees Held, Rank, Tenure Status .............................................................................................32 Associated Faculty .......................................................................................................................35 Salaries ........................................................................................................................................36

THE AVERAGE PHYSICAL THERAPIST EDUCATION PROGRAM
2010-2011 2011-2012 2012-2013 Type of Institution Public (51.3%)
Public (51.1%)
Public (50.3%)
Geographic Location Middle Atlantic (21.1%) (NJ, NY, PA)
Middle Atlantic (18.5%) (NJ, NY, PA)
Middle Atlantic (19.5%) (NJ, NY, PA)
Costs Annual tuition
Public 13,999
Private 28,586
Public Private
13,948 29,472
Public Private
15,025 31,716 Annual fees 1,742 1,200 1,883 1,200 1,970 1,200 Total cost of professional program (not incl. room & board)
39,082 85,289 45,750 85,289 50,294 94,251
Admissions Planned class size
2010
42
2011
44
2012
44 Number of applicants 295 357 425 Number of qualified applicants 202 235 284 Number of applicants offered place in class 81 86 86 Number of applicants enrolled 41 43 42 GPA of students enrolled 3.5 3.5 3.5 Enrollment in all classes Total number of students enrolled 118.2
125
123 Percent women 81.5% 85% 81% Percent minority 14% 17% 22% Outcomes Degree awarded DPT (89%)
DPT (90%)
DPT (90%) Number of graduates 34.5 36.5 38.6 Graduation rate (‘07, ’08, ‘09, ‘10, ‘11) 89.17% (07, 08, 09) 90.1% (08, 09, 10) 97.5% (09, 10, 11) Percent minority graduates 16.7% 17.1% 20.7% Pass rate on licensure exam, first-time takers 86.5% 87.1% (’10) 87.7 (’11) Employment rate at 6 months post graduation 99.6% 99.7% 99.5% Length of Program (Professional Phase) Curricular format 4+3 (62.1%)
4+3 (65.6%)
4+3 (65.6%) Number of weeks in class (didactic/laboratory) 85.3 86.1 86.1 Number of weeks in FT clinical education 35.9 35.9 35.9 Total weeks in program 121.2 122 122 Number contact/clock hours in class (didactic/laboratory)
1,810
1,759
1,759
Number of contact/clock hours in clinical education 1,439 1,431 1,431
Total contact/clock hours in program 3,183 3,190 3,190 2

2010-2011 2011-2012 2012-2013 + Curriculum Academic Calendar
Semesters (88%)
Semesters (89%)
Semesters (86%)
Curricular model Hybrid (68.2%) Hybrid (71%)
Hybrid (74.8%)
Number of semester credits in prerequisite phase 115.7 115.5 115.7 Number of semester credits in professional phase 114.9 116.4 116.4 Total semester credits required 230.6 232.2 232.2 Clinical Education (per accredited program) Number of clinical education sites 326
373
458 Number of sites that accepted students every year 104 99.5 98.6 Number of sites that accepted students every other year Credential CI’s CI’s that hold Certifications
45
-- --
58.7
45.3 22.4
58.8
48.3 22.4
Faculty Number of full-time core faculty 10.4
10
10 Number of part-time core faculty 1.1 1.1 2.5 Number of adjunct faculty -- -- -- Number of supportive faculty -- -- -- Number of associated faculty (adjunct and supportive)
6.8 6.9 6.9
Core faculty to student ratio 1:11 1:11 1:11 Faculty to student ratio in laboratories 1:13 1:13 1:13 Full-time core faculty characteristics Age
Director 57.3
ACCE 52
Faculty 51.7
Director ACCE Faculty 54.3 47.5 48.5
Director ACCE Faculty 56.6 49.7 49.9
Total years as faculty 22.4 16.5 13.1 21.5 11.5 13.5 21.5 11.5 13.5 Years as faculty in current program 14.5 12.5 10.1 14.5 9.5 10.4 15.3 9.7 10.6 Full-time Core Faculty Workload
% of workload allotted to teaching in entry level program
25.3 37.7 49.1 25 37 55.6 24.3 39 50
% of workload allotted to service 10.7 9.4 10.4 10.7 9.4 10.5 10.6 9.7 10.4 % of workload allotted to clinical practice 2.1 4.8 7 2.2 4.7 7 2.2 4.6 6.7 % of workload allotted to scholarship
14.9 9.5 22.4 14.7 9.7 21.3 15.7 9.7 21.6
3

NUMBERS OF PROGRAMS
Trend in Number of Accredited and Developing US PT Programs By Degree Offered (2002 – 2013)
Number of Programs by Degree Offered
Accredited PT Programs: 1979-2013
146
98
74
43
259 5 2 1
67
111
135
167
185
213222 226
238
0
50
100
150
200
250
2002 2004 2005 2006 2007 2009 2011 2012 2013
Baccalaureate
Master's
DPT
0
50
100
150
200
250
79 80 81 82 83 84 85 86 87 88 89 90 91 92 93 94 95 96 97 98 99 00 01 02 03 04 05 06 07 08 09 11 12 13
Baccalaureate Master's DPT Total
4

DISTRIBUTION OF PROGRAMS
Distribution of Accredited and Developing PT Programs (including non-US programs) By Geographical Region 2005-2013 [as of 2/2013; n=220]
2005 2006 2007 2009 2011 2012 2013
South Atlantic DE, DC, FL, GA, MD, NC, PR, SC, VA, WV
36 37 39 40 46 42 44
Middle Atlantic NJ, NY, PA 42 42 42 42 42 41 41
East North Central IL, IN, MI, OH, WI 32 33 32 34 34 33 32
West North Central IA, KS, MN, MO, NE, ND, SD
22 22 22 23 23 23 22
West South Central AR, LA, OK, TX 20 20 20 21 23 19 20 New England CT, ME, MA, NH, RI, VT 17 16 16 17 18 17 17
Pacific AK, CA, HI, OR, WA 19 18 18 20 18 19 18
East South Central AL, KY, MS, TN 12 12 12 12 13 12 14
Mountain AZ, CO, ID, MT, NV, NM, UT, WY
9 9 9 12 12 12 9
Other Canada, Scotland 5 4 4 4 3 3 3
Distribution of Accredited and Developing US PT Programs
By Regional Accreditation (n=219)
2005 2006 2007 2009 2011 2012 2013
North Central 65 67 66 69 72 70 70
Southern 54 55 55 59 63 58 54
Middle States 49 48 48 48 48 47 48
New England 17 16 16 18 18 17 18
Western 15 14 14 15 14 15 15
Northwest 8 8 8 9 10 10 9
Total 208 208 207 218 225 217 219
5

Distribution of Accredited and Developing US PT Programs by Carnegie Classification [as of 2/16/2013]
2006 Classification 2007 2008 2011 2012 2013
Number of Programs
Number of Programs
Number of Programs
Number of Programs
Number of Programs
Doctoral/Research Universities 22 22 25 22 23
Research Universities (very high research activity) 33 33 33 32 33
Research Universities (high research activity) 27 28 29 30 27
Master’s Colleges and Universities (larger programs) 56 58 62 60 57
Master’s Colleges and Universities (medium programs) 19 21 20 19 19
Master’s Colleges and Universities (smaller programs) 10 11 11 11 11
Baccalaureate Colleges – Arts & Sciences 1 1 1 2 1
Baccalaureate Colleges – Diverse Fields 3 3 4 4 3
Special Focus Institutions – Medical Schools and Medical
Centers 32 34 33 40 32
Special Focus Institutions – Other Health Professions
Schools 4 5 9 6 4
Not Classified 3 6 2 5 6
total 210 222 229 231 216
6

Distribution of Accredited and Developing US PT Programs By Carnegie Classification
Distribution of Accredited and Developing US PT Programs By Type of Institution
N= 219 Programs for 2013
1
3
23
57
19
11
6
27
33
32
4
0 10 20 30 40 50 60
Baccalaureate Colleges--Arts & Sciences
Baccalaureate Colleges--Diverse Fields
Doctoral/Research Universities
Master's Colleges and Universities (larger programs)
Master's Colleges and Universities (medium programs)
Master's Colleges and Universities (smaller programs)
Not Classified
Research Universities (high research activity)
Research Universities (very high research activity)
Special Focus Institutions--Medical schools and medical…
Special Focus Institutions--Other health professions…
110
113114
108110
100
109
115113
109
90
95
100
105
110
115
120
2007 2009 2011 2012 2013
Public Private
7

Tuition, Fees and Other Costs 2012-2013
All Programs
2012-2013
Public In-State Public Out-of-State Private
Average annual tuition
Range Median
Mean StdDev
$3,387-45,340 $14,122 $14,427 $8,472
$8,425-65,156 $29,441 $29,157 $15,990
$19,500-94,020 $29,875 $31,716 $17,381
Average annual fees
Range Median
Mean StdDev
$40-14,401 $1,553 $1,970 $1,879
$40-14,401 $1,553 $1,970 $1,879
$50-8,252 $1,084 $1,582 $1,477
Average Other Program Expenses
Range Median
Mean StdDev
$47-34,629 $3,415 $4,586 $4,211
$47-34,629 $3,415 $4,586 $4,211
$200-34,629 $3,779 $5,307 $5,358
Total cost of professional program
Range Median
Mean StdDev
$14,249-107,652 $48,515 $50,556 $28,445
$26,511-164,583 $90,796 $91,831 $49,931
$20,750-146,175 $92,277 $94,251 $49,329
8

2012-13 Annual Tuition of PT Programs (Mean and Range)
2012-13 Total Cost of Professional PT Programs (Mean and Range)
$19,500
$3,387$8,425
$94,020
$45,340
$65,156
$31,716
$14,427
$29,157
$0
$10,000
$20,000
$30,000
$40,000
$50,000
$60,000
$70,000
$80,000
$90,000
$100,000
Private Public In-State Public Out-of-State
$146,175
$107,652
$164,583
$96,117
$51,252
$93,038
$61,365
$14,249
$26,511
$0
$20,000
$40,000
$60,000
$80,000
$100,000
$120,000
$140,000
$160,000
$180,000
Private Public In-State Public Out-of-State
9

Program Expenses FY 2012-2013 (All Programs)
Total Operating Expenses (excluding salary & benefits)
Range Mean
$13,165- $9,630,328 $451,317
Total Salary Expenses (excluding benefits) Range Mean
$139,779- $5,446,711 $1,122,530
Operating and salary expense per enrolled student
Range Mean
$3,561-$42,974 $12,097
Program Expenses FY 2012-2013 by Type of Institution
Public Private Total Operating Expenses (excluding salary & benefits)
Range Mean
$13,165- $1,879,100 $211,542
$22,658- $9,630,328 $691,765
Total Salary Expenses (excluding benefits) Range Mean
$348,762- $2,583,183 $1,055,647
$139,799- $5,446,711 $1,191,360
Operating and salary expense per enrolled student
Range Mean
$3,560-$27,105 $11,569
$5,692-$42,974 $12,763
Grants and Grant Funding (2012-2013)
All Programs Total number of core faculty with grant funding 623 Total amount of grant funding $318,790,573 Total amount of above funding from NIH $220,186,301 Total number of faculty who submitted proposals for funding that were not funded or are not yet funded
495
Number of core faculty with grant funding per program
Mean Range
3.58 0-13
Amount of grant funding per program (all programs)
Mean Range
$1,81,311 $0-$39,729,031
Amount of funding from NIH per program (all programs)
Mean Range
$3,440411 $0-$33,869,614
Number of faculty who submitted proposals for funding per program that were not funded or not yet funded
Mean Range
3.19 0-16
10

MEASURES OF PROGRAM LENGTH 2012-2013
Academic Calendar
Calendar types % of programs Semesters 88% Trimesters 5.9% Quarters 5.9%
Length (in weeks) of Professional Curriculum (all degree levels)
Academic Phase (Classroom and Laboratory Instruction) Mean Range
2003-04 2004-05 2009-10 2010-11 2011-12 2012-13
78.7 79.6 85.3 85.3 85.4 93.2
47-127 44-124 43-122 71-120 48-122 34-161
Full-time Clinical Education 2003-04 2004-05 2009-10 2010-11 2011-12 2012-13
30.5 31.4 35.1 35.9 35.9 35.6
18-58 18-58 20-55 24-60 23-60 23-68
Total Length 2003-04 2004-05 2009-10 2010-11 2011-12 2012-13
109.2 111.0 120.1 121.2 122.0 122.5
69-167 67-160 65-164 95-164 86-164 75-180
Length of Professional Program
All Programs N=211
Number of weeks in didactic portion Range Mean
StdDev
23-117 47 13
Number of weeks in full time clinical education
Range Mean
StdDev
23-60 35.9 5.1
TOTAL number of weeks in program Range Mean
StdDev
75-180 122.5 15.39
Number of contact/clock hours in didactic portion
Range Mean
StdDev
930-4,688 1,905 616
Number of contact/clock hours in part time clinical education
Range Mean
StdDev
0-1,540 208
260.5
Number of contact/clock hours in full time clinical education
Range Mean
StdDev
920-2,400 1424 206
TOTAL number of contact/clock hours in program
Range Mean
StdDev
1,403-6,432 3,345 725
11

CREDITS REQUIRED
Pre-professional and Professional Semester Credits Required
All Programs
2009-2010 2010-2011 2011-2012 2012-2013
Pre-professional
Range Median
Mean StdDev
60-130 120
114.2 13.2
90-130 120
115.6 10.4
80-180 120
115.8 12.7
80-180 120 115 12.6
Professional
Range Median
Mean StdDev
90-185 116
116.5 15.7
88-151 113
113.9 12.6
81-185 115
116.4 16
41-185 115
116.3 16.9
Total
Range Median
Mean StdDev
112-305 230.5 228.1 25.4
115-271 230
228.47 18.6
107-305 230
227.9 27.9
112-305 231
229.8 24.2
Clin Ed20%
Class/Lab80%
Proportion of Credit Hours in Class/Lab and Clinical Education 2012-2013
All Programs
Clin Ed
Class/Lab
12

CURRICULAR MODELS 2007 2009 2010 2011 2012
Hybrid the curriculum is designed as a combination of two or more of the following models 60.6% 67.8% 68.2% 71% 72.5%
Traditional the curriculum begins with basic science, followed by clinical science and then by physical therapy science 19.2% 14.1% 13.2% 12.4% 12%
Systems-based the curriculum is built around physiological systems (musculoskeletal, neuromuscular, cardiopulmonary, etc.) 10.1% 9.1% 10% 9.3% 9%
Modified Problem-based
the curriculum uses the problem-based model in the later stages, but the early courses (primarily basic sciences) are presented in the more traditional format of lecture and laboratory
4.0% 5.0% 5.3% 4.7% 3.5%
Guide-based the curriculum is built around the disability model, the patient management model, and the preferred practice patterns included in the Guide to Physical Therapist Practice
2.5% 1.5% 1.6% 1% 1%
Case-based the curriculum utilizes patient cases as unifying themes throughout the curriculum 1.0% 0.5% 0.5% 0% 0.5%
Problem-based the entire curriculum (including basic and clinical science content) is built around patient problems that are the focus for student-centered learning through the tutorial process and independent activities
1.5% 1.5% 1.05% 1.6% 1.5%
Lifespan-based the curriculum is built around the physical therapy needs of individuals throughout the lifespan (e.g., the basic and clinical sciences and patient management skills, etc., related to the neonate are presented together, followed by those of childhood, adolescence, early adulthood, middle age and old age)
1.0% 0.5% 0 0 0
CLINICAL EDUCATION Length of Final Clinical Education Experience
All Programs 2009 2010 2011 2012 Number of weeks in final clinical experience
Mean Range
19 4-48
19.6 6-52
20 6-52
21.2 8-68
Clinical Education Trends
2011-12 2012-2013 Mean number of sites 373 458 Mean number of sites that accepted students
every year
101
99
Mean number of sites that accepted students
every other year
59
57
Issues in the Clinical Education Program
% Responding “Yes”
2004-2005
2006-2007
2007-2008
2009-2010
2010-2011
2011-2012
2012-2013
Changed a requirement that students have certain types of experiences (e.g., rehab, acute care)
2.0 N/D 3.0 2.5 1.6 2 21.8
Students been placed in clinical sites for which they have not had prior didactic instruction
7.0 11.5 10.6 9.5 10.6 19 10.9
Students had a clinical instructor with less than one year experience 8.0 6.5 6.1 6.5 6.3 1.4 4.7
Delayed student(s) graduation to accommodate clinical placements 1.0 0.5 0 0 0 0 .5
13

OUTCOMES
Degrees Conferred
Year
Master’s
Doctoral
All Programs 2003 3,646 1,473 5,119 2004 3,014 1,921 4,935 2005 2,431 2,811 5,242 2006 1,924 3,413 5,337 2008 782 5,027 5,809 2009 883 5,490 6,373 2010 604 5,807 6,411 2011 343 6,640 7,423 2012 240 7,758 7,998
Graduation Rates (%) 2002 2003* 2004* 2005* 2007* 2010* 2011* 2012*
Mean graduation rate 90.1 88.4 89.6 89 88.7 89.17 90.1 96.1 Range 20-100 50-100 14-100 30-100 11-100 43-100 47-100 70-100
Median 93.3 91.7 91.3 90.5 92.1 97.8 91.6 99 St Dev 12.4 10.9 10.2 11.1 11.7 8.7 7.8 10.6
*Note: Rate based on the percentage of students admitted to the professional program who complete the program within 150% of the time normally expected for completion.
Employment Rates (%) at 6 months post-graduation 2001 2002 2003 2004 2005* 2006* 2008* 2010* 2011* 2012*
Mean 94.5 94.8 95.8 98.6 99.3 99.6 99.5 99.6 99.5 99.5 Range 17-100 0-100 0-100 86-100 50-100 75-100 83-100 85-100 83-100 83-100
* To the best of the program’s ability to determine, the % of graduates employed within 6 months of passing the licensure exam.
14

PASS RATES
Pass Rates of First Time Takers on Licensure Exam
2002* 2003** 2004** 2005*** 2006*** 2007**** 2008† 2009† 2011† 2012† Mean 84.1% 74.4% 68.2% 81.1% 85.2% 86.2% 83.9% 86.5% 88.2% 87.7% Range 28.6-100 12.5-100 0-100 0-100 0-100 33-100 25-100 38-100 0-100 47-100
Median 88.5 75.8 71.4 84.1 88.6 90.9 87 90 92.5 90-9 StDev 14.6 16.3 19.3 15.9 14.3 13.8 13.9 12.2 13.9 11.71 Based on data provided by FSBPT: * on 4/19/2004; ** on 4/11/2005; *** on 4/11/2006; **** on 4/18/2007; † on 4/11/2012 for data current as of March 31, 2012; on April 17, 2013
Number of Programs by Pass Rates of First Time Takers Pass Rate Number of Programs
2003* 20043* 2005** 2006** 2007*** 2008† 2009† 2011† 2012† 0-9% 3 2 1
10-19% 1 20-29% 3 6 1 1 1 30-39% 4 6 1 1 3 1 1 40-49% 4 9 2 2 3 1 1 50-59% 14 29 12 7 3 7 5 4 8 60-69% 32 35 13 10 20 15 15 3 10 70-79% 49 43 43 26 24 31 24 27 22 80-89% 47 37 59 59 37 53 49 40 45 90-99% 22 17 39 55 69 57 77 84 96 100% 8 4 21 31 32 20 21 36 27
Total Reporting 184 189 192 192 189 187 191 197 209 Based on data provided by FSBPT: * on 4/19/2004; ** on 4/11/2005; *** on 4/11/2006; **** on 4/18/2007; † on 4/11/2012 for data current as of March 31, 2012; on April 17, 2013
15

STUDENT DATA
ADMISSIONS Trends in Admissions
2004 2006 2007 2009 2010 2011 *2012
Planned class size Mean Range
36 10-168
37 10-162
39 10-210
42.3 14-315
42 14-110
43.9 14-360
42 10-95
Number of applicants Mean Range
98 11-743
139 15-808
144 13-603
230-3 35-753
290 36-904
357 34-1,358
425 14-1,662
Number of qualified applicants
Mean Range
79 1-743
103 4-629
104 3-492
159.4 23-680
249.3 30-781
234.5 26-982
284 14-1,193
Number of applicants offered place in class
Mean Range
56 3-337
65 3-354
57 3-244
74.2 13-411
80 14-322
85.9 14-456
86 14-406
Number enrolled Mean Range
32 3-133
36 8-162
35 3-178
41.6 7-310
41 12-100
43.2 6-354
42 10-96
Number of minority students enrolled
Mean Range
5.9 0-37
6.1 0-34
6 0-41
7.1 0-69
6.21 0-36
7.2 0-104
7 0-36
GPA of students enrolled Mean Range
3.3 2.9-3.77
3.37 2.9-3.7
3.44 2.9-3.8
3.5 3.0-3.83
3.5 3.0-3.85
3.5 3.1-3.9
3.5 3.1-3.9
*Starting in 2012 and going forward, expansion programs are required to report admission data separate from parent program.
Admissions Trends by Public/Private Institutions Public
2004 2006 2007 2009 2010 2011 *2012
Planned class size Mean Range
34.7 12-90
34.8 14-90
36 14-97
37.7 14-98
42.9 16-100
39 14-102
39 14-87
Number of applicants Mean Range
89.2 17-743
120.6 27-386
148 21-404
206.3 24-557
287.3 36-748
321 81-1354
400 58-1,662
Number of qualified applicants
Mean Range
72.0 10-743
90.7 23-257
107 4-297
146.3 23-453
192.6 33-748
212 37-982
267 30-1,193
Number of applicants offered place in class
Mean Range
46.8 13-209
51.2 17-183
53 16-150
60-1 19-163
79.8 20-247
71 14-202
71 14-187
Number enrolled Mean Range
32.3 9-97
34.3 13-96
35 8-97
38.1 14-98
42.8 17-100
39 14-102
40 14-87
Number of minority students enrolled
Mean Range
5.8 0-37
5.7 0-36
5 0-38
6.2 0-38
6 0-28
6 0-35
6 0-29
GPA of students enrolled Mean Range
3.35 3.0-3.8
3.47 3.1-3.7
3.49 2.9-3.8
3.6 3.0-3.82
3.5 3.1-3.8
3.6 3.2-3.8
3.60 3.30-3.86
Private 2004 2006 2007 2009 2010 2011 2012
Planned class size Mean Range
38.1 10-168
39.7 10-162
43 10-210
47.4 20-315
41.1 14-110
50 20-360
45 10-95
Number of applicants Mean Range
109.2 11-613
157.7 15-808
140 13-603
256.4 42-763
300.5 39-892
402 34-1358
517 14-1,684
Number of qualified applicants
Mean Range
86.3 11-613
114.9 15-629
101 3-492
173.6 32-680
205.3 30-781
259 26-980
305 14-1,184
Number of applicants offered place in class
Mean Range
66.8 8-283
81.3 14-354
62 3-244
89.4 13-411
77 14-213
102 14-456
101 16-106
Number enrolled Mean Range
32.3 3-133
39.1 10-162
35 3-178
45.3 7-310
39.4 12-89
48 6-354
45 10-96
Number of minority students enrolled
Mean Range
5.9 0-33
6.6 0-34
7 0-41
8.2 0-69
6.5 0-36
8 0-104
8 0-36
GPA of students enrolled Mean Range
3.23 2.9-3.7
3.26 2.9-3.7
3.37 2.9-3.8
3.4 3.0-3.8
3.5 3.0-3.9
3.47 3.1-3.9
3.47 3.14-3.76
*Starting in 2012 and going forward, expansion programs are required to report admission data separate from parent program.
16

0
100
200
300
400
500
600
700
800
900
1000
2001 2002 2003 2004 2006 2007 2009 2010 2011 2012
Axis
Titl
e
Admission Trends: DPT Programs
Applicants
Qualified
Offers
Planned
Enrolled
17
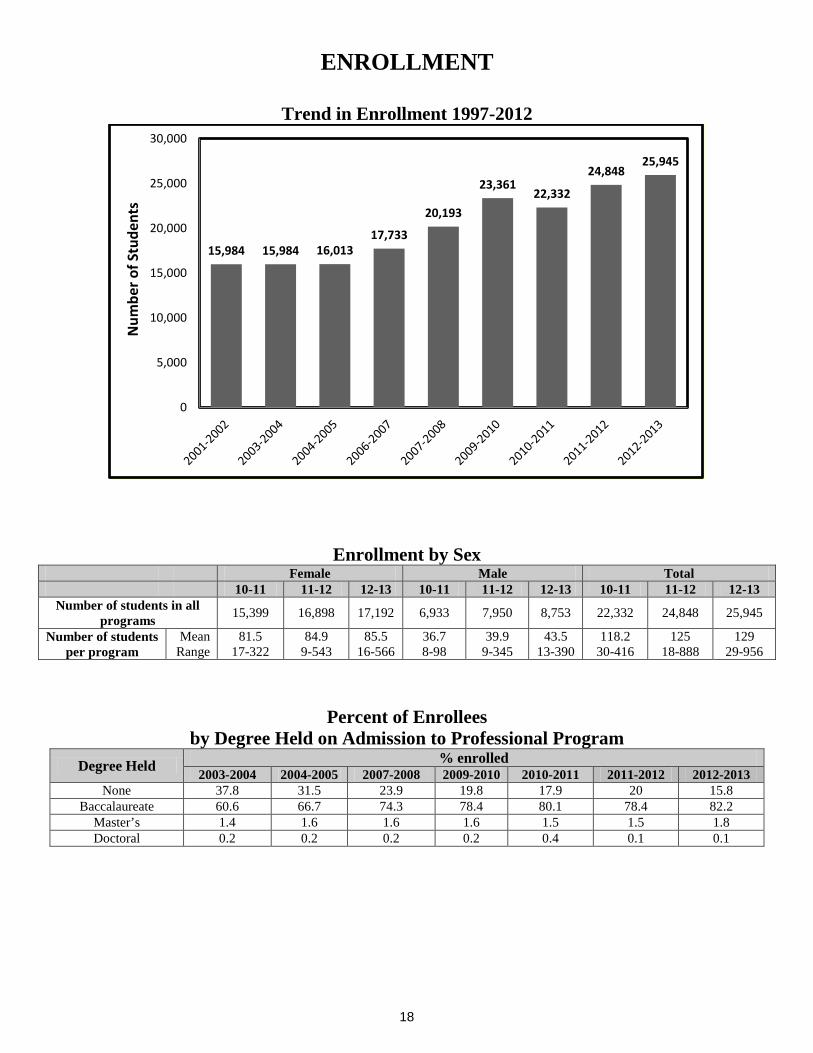
ENROLLMENT
Trend in Enrollment 1997-2012
Enrollment by Sex Female Male Total 10-11 11-12 12-13 10-11 11-12 12-13 10-11 11-12 12-13
Number of students in all programs 15,399 16,898 17,192 6,933 7,950 8,753 22,332 24,848 25,945
Number of students per program
Mean Range
81.5 17-322
84.9 9-543
85.5 16-566
36.7 8-98
39.9 9-345
43.5 13-390
118.2 30-416
125 18-888
129 29-956
Percent of Enrollees by Degree Held on Admission to Professional Program
Degree Held % enrolled 2003-2004 2004-2005 2007-2008 2009-2010 2010-2011 2011-2012 2012-2013
None 37.8 31.5 23.9 19.8 17.9 20 15.8 Baccalaureate 60.6 66.7 74.3 78.4 80.1 78.4 82.2
Master’s 1.4 1.6 1.6 1.6 1.5 1.5 1.8 Doctoral 0.2 0.2 0.2 0.2 0.4 0.1 0.1
15,984 15,984 16,01317,733
20,193
23,36122,332
24,84825,945
0
5,000
10,000
15,000
20,000
25,000
30,000N
umbe
r of S
tude
nts
18

Percent of Enrollees Who Were PTAs Prior to Enrollment
Ethnicity of Students Percent Enrolled in Professional Physical Therapist Programs
04-05
N=15,798
06-07
N=17,733
07-08
N=20,193
09-10
N=23,361
*10-11
N=22,332
11-12
N=24,848
12-13
N=5,945
African American 4.8% 4.7% 4.7% 3.8% 3.5% 3.4% 3.2% American Indian / Alaskan Native
0.5% 0.4% 0.4% 0.4% 0.4% 0.4% 0.4%
Asian -- -- -- -- 6.2% 5.9% 6.1% Asian/Pacific Islander 5.5% 5.2% 5.3% 6.0% -- -- --
Caucasian 79.4% 81.2% 81.5% 81.4% 81.7% 81.3% 80.1% Hispanic/Latino 4.8% 4.4% 4.5% 4.4% 3.9% 4% 3.9% Native Hawaiian / Other Pacific Islander
--
--
--
--
0.01%
0.5% .4%
Other 1.4% 1.8% 1.8% 1.4% -- -- -- Two or more races -- -- -- -- 0.01% 0.8% 1 Unknown 3.6% 2.3% 1.8% 2.6% 3.4% 3.7% 4.1%
*In 2010 the categories changed due to change in IPED definitions
2001-2002 2.4% 2003-2004 2.8% 2004-2005 2.4% 2007-2008 1.7% 2009-2010 1.1% 2011-2012 2012-2013
.5% 1.1%
19

GRADUATES
Total Graduates from PT Programs (projected to 2016)
Number of Graduates per Program 2002 2003 2004 2005 2007 2008 2009 2010 2011 2012
All Programs Mean Range
32.4 0-128
26 0-103
224.6 0-79
26.7 0-113
29 0-145
29 0-149
32 0-204
34.1 0-102
36.6 0-309
37.1 0-148
Baccalaureate
programs Mean
Range NA NA NA NA NA NA
NA
NA
NA
NA
Master’s programs Mean Range
31.6 0-96
26.8 0-103
24.6 0-75
27.4 0-113
29 0-88
28 0-66
32 10-61
31.8 0-74
28.6 15-39
26.5 0-34
Doctoral programs Mean Range
34.3 0-128
24.1 0-79
24.4 0-79
26 0-78
29 0-145
29 0-149
32 0-204
34.5 0-102
37.1 0-309
37.6 0-148
Public Mean Range
28.8 0-75
24.7 0-68
24.6 0-75
26.9 0-78
28 0-88
27 0-94
29 0-66
34.7 0-93
34.6 0-93
34.4 0-64
Private Mean Range
36.2 0-128
27.3 0-103
24.5 0-79
26.3 0-113
30 0-145
31 0-149
36 0-204
33.8 0-102
39 0-309
39.8 0-148
0
1,000
2,000
3,000
4,000
5,000
6,000
7,000
8,000
9,000
10,000
20

Distribution of Graduating Class Size
Percent of Graduates by Geographical Region Geographical Region States 2005
2007
2008 2009
2010
2011
2012
New England CT, ME, MA, NH, RI, VT Middle Atlantic NJ, NY, PA East North Central IL, IN, MI, OH, WI West North Central IA, KS, MN, MO, NE, ND, SD South Atlantic DE, DC, FL, GA, MD, NC, PR, SC, VA, WV East South Central AL, KY, MS, TN West South Central AR, LA, OK, TX Mountain AZ, CO, ID, MT, NV, NM, UT, WY Pacific AK, CA, HI, OR, WA
8.6
18.7 14.7 11.4 17.5
4.7 9.2 5.2
10.0
7.1
18.1 14.8 11.7 17.3
5.1 9.9 5.4
10.6
7.4
18.7 14.2 13.0 17.9
5.5 8.5 5.0 9.8
8.1
18.2 14.4 12.6 18.1
5.6 7.8 5.2
10.0
8.2
20.8 16.5 11.8 14.8
5.6 7.2 5.3 9.5
8.2
18.2 14.2
12 20.1
6 8
4.8 8.5
8.9
19.1 15.3 11.9 19.8
5.4 8
5.3 8.4
< 10 10-19 20-29 30-39 40-49 50-59 60-69 70-79 80-89 90-99 >992010 4.7 12.1 20.6 33.8 16.9 6.8 1.5 1.5 0.5 1 0.52011 0.1 2.8 18.81 31.7 20.1 11.6 3.3 2 0 3.7 5.82012 0.1 4 17 30 19 13 6 4 0 3.7 6
4.7
12.1
20.6
33.8
16.9
6.8
1.5 1.5 0.5 1 0.50.12.8
18.81
31.7
20.1
11.6
3.3 20
3.75.8
0.1
4
17
30
19
13
64
0
3.76
0
5
10
15
20
25
30
35
40Pe
rcen
t of P
rogr
ams
21

Percent of Graduates by Accrediting Region
Region
2003
2004
2005
2007
2008
2009
2010
2011
2012
New England Middle States
Southern North Central
Northwest Western *Other
11.4 23
23.4 29.8 3.6 7.6 1.1
9.7
22.7 24.9 31.0 2.8 7.6 1.1
8.5
21.1 24.3 32.2 4.1 7.6 2.2
7.1
20.3 24.3 33.3 4.1 8.3 2.6
7.4
20.9 24.1 33.5 3.9 7.6 2.6
8.1
20.4 23.4 33.3 3.9 7.7 3.2
8.6
23.1 23.2 34 3.9 7.3 6.7
8
20 24.2 31.1 3.6 6.3 6.7
8.7 22 23 32 3.3 6.5 3.5
*Other refers to Distance Education and Training Council (DETC).
Ethnicity of Graduates of Professional Physical Therapist Programs
2003 2004 2005 2007 2009 *2010 2011 2012 N=5,119 N=4,913 N=5,242 N=5,715 N=6,412 N=6,458 N=7,232 N=7,829
African American 4.1% 4.5% 4.8% 4.9% 3.9% 3.3% 3.5% 3.3% American
Indian/Alaskan Native 0.5% 0.5% 0.7% 0.5% 0.2% 0.3% 0.4% 0.3%
Asian -- -- -- -- -- 5% 5.8% 5.3% Asian/Pacific Islander 5.8% 6.5% 5.9% 5.4% 5% -- -- --
Hispanic/Latino 3.7% 5.0% 4.3% 4.9% 3.9% 3.9% 4.3% 3% Native Hawaiian/Other
Pacific Islander
--
--
--
--
--
0.7% 0.5% .4%
White 81.6% 77.9% 81.1% 81.2% 83.6% 83.3% 83% 82.5% Other 3.6% 3.1% 1.9% 1.4% 1.4% -- -- --
Two or more races -- -- -- -- -- 0.6% 0.5% 0.5% Unknown 0.7% 2.5% 1.3% 1.6% 1.9% 2.8% 2.1% 3
*In 2010 the categories changed due to change in IPED definitions
22

FACULTY DATA
Number of Faculty 2012-2013
All Programs Total number of full-time core positions 2110 Total number of part-time core positions 215
Full-time core faculty positions per program Mean
Range 10.5 4-30
Part-time core faculty positions per program
Mean Range
1.1 0-14.2
Core faculty FTEs per program Mean
Range 11.1
2-32.5
Number of associated faculty per program Mean
Range 8.1
0-127
Total FTE of associated faculty per program
Mean Range
1.5 0-35.6
Core Faculty Vacancies 2012-2013
All Programs
Total current vacancies in allocated positions 153
Total projected vacancies in allocated positions 105
Total number of new positions to be filled 50
Current vacancies in allocated positions per program
Mean Range
0.44 0-5
Projected vacancies in current positions per program
Mean Range
1.35 0-5
Number of new positions to be filled per program
Mean Range
1.39 0-5
23

Core Faculty Turnover (%)
2002-2004 2004-2005 2006-2007 2009-2010 2010-2011 2011-2012 2012-2013
Range: Mean:
Median: StDev:
0-75 12.5 11.0 13.7
0-43 13.2 12.5 7.3
0-50 6.0 0
9.3
0-44 3.7 0
6.5
0-55 4.9 0
8.5
0-40 5.3 0
7.8
1-37 11.11 10.00 7.67
Student to Faculty Ratio 2011-2012
All Programs
Number of students per core faculty member Mean
Range 11.5
2.3-45
Number of students per faculty member in laboratory experiences
Mean Range
13.4 3-32
CORE FACULTY WORKLOAD AY 2012-2013
0 20 40 60 80 100 120
ACCE
Program Director
Core Faculty
ACCE Program Director Core Faculty%Time Teaching in Entry-Level
Program 39 24.3 50.3
% Time Teaching Other Programs 1.2 2.2 4% Administrative Time 35.2 45 6.3% Time for Scholarship 9.7 15.7 21.7% Time for Clinical Practice (as
part of workload) 4.7 2 6.7
% Time for Service 9.7 10.6 10.5
2012-2013 Core Faculty Workloads(%Workload per Academic Year)
24

WORKLOAD ALL PT PROGRAMS
AY 2012-2013
% time devoted to: Teaching Entry-level Program
Administration Scholarship Service Clinical Practice
Program Director
Mean Range
24.3 0-60
45 0-90
15.7 0-70
10.6 0-50
2.2 0-50
ACCE / DCE Mean Range
39 0-90
35.2 0-90
9.7 0-75
9.6 0-50
4.7 0-60
All Other Faculty
Mean Range
50.3 0-100
6.3 0-85
21.7 0-100
10.5 0-80
6.7 0-100
Percent of Full-time Core Faculty Involvement in Scholarship AY 2012-2013
All Programs N=2,380
Not involved 3.5%
Actively engaged, but product(s) not yet disseminated 13.6%
Actively engaged, some presentations/publications or other
disseminated products 25.6%
Actively engaged, numerous presentations/publications and other
disseminated products 21.1%
25

Scholarship Productivity of Core Faculty
All Programs Total number of peer reviewed articles 2,357 Total number of other articles 592 Total number of books or book chapters 470 Total number of presentations 4,986 Total number of other scholarly products subjected to external review and disseminated
568
Total number of papers, proposals, etc submitted but not yet accepted or published 1917
Number of peer reviewed articles per program (excluding abstracts)
Mean Range StDev
11.73 0-71 13.50
Number of other articles accepted or published per program
Mean Range StDev
2.95 0-27 4.68
Number of books or book chapters published per program
Mean Range StDev
2.34 0-37 4.01
Number of presentations per program Mean Range StDev
24.81 1-138 22.12
Total number of other scholarly products subjected to external review and disseminated
Mean Range StDev
2.83 0-143 10.81
Total number of papers, proposals, etc submitted but not yet accepted or published
Mean Range StDev
9.54 0-59 9.79
26

Number of Core Faculty Enrolled in Doctoral Education
(does not include tDPT)
Academic Year Number Percent
2003-04 371 20.3%
2004-05 338 17.5%
2007-08 287 13.5%
2009-10 246 11.2%
2010-11 203 9.6%
2011-12 199 9.0%
2012-13 209 8.8%
Top 10 Areas of Core Faculty Content Expertise 2012-2013
Primary Area Secondary Area
Musculoskeletal 23.5% Other 10.3% Neuromuscular 12.1% Therapeutic Exercise 9.4% Clinical Education 10.5% Research 9.1% Pediatrics 6.3% Neuromuscular 7.8% Research 6% Professional Issues 6.8% Cardiopulmonary 5.7% Musculoskeletal 6.8% Neuroscience 5.5% Neuroscience 5.2% Anatomy 5.0% Electrotherapy/Modalities 4.7% Other 4.2% None 4.4% Physiology 2.8% Geriatrics 4.3%
Number of Core Faculty who are Certified Clinical Specialists:
2001-2002 2003-2004 2004-2005 2007-2008 2009-2010 2010-2011 2011-2012 2012-2013
436 (23.5%) 507 (27.7%) 562 (29.1%) 690 (32.8%) 754 (34.3%) 746 (35.1%) 828 (37.6%) 891 (37.4%)
27

Mean Years as a Core Faculty Member 2012-2013
Years As Faculty Member 2012-2013
13.3
11.7
22
10.4
9.6
15.3
Faculty
ACCE
Program Director
Years at Current Program Total Years
13.2
11
15.9
17.3
11.2
18
13.1
5.9
7.1
14.2
17.3
13
23.5
19.7
0 5 10 15 20 25
26+ years
21-25 years
16-20 years
11-15 years
8-10 years
4-7 years
0-3 years
Years at Current Program Total Years as Faculty
28
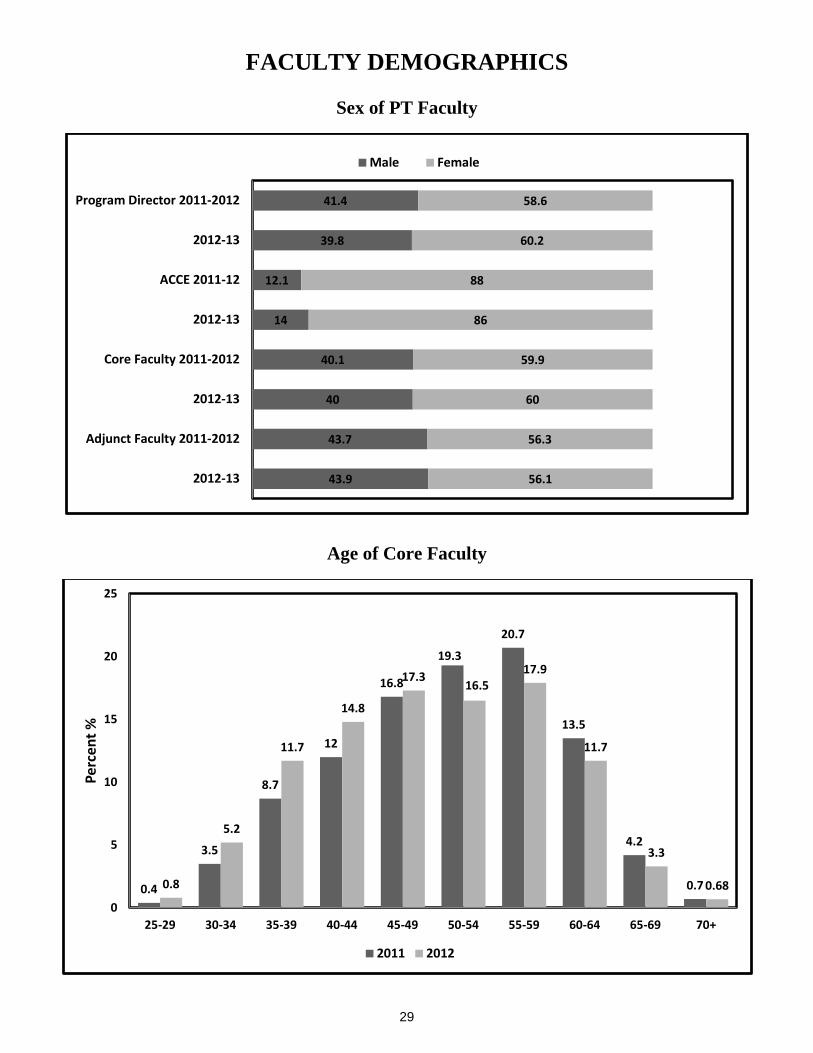
FACULTY DEMOGRAPHICS
Sex of PT Faculty
Age of Core Faculty
43.9
43.7
40
40.1
14
12.1
39.8
41.4
56.1
56.3
60
59.9
86
88
60.2
58.6
2012-13
Adjunct Faculty 2011-2012
2012-13
Core Faculty 2011-2012
2012-13
ACCE 2011-12
2012-13
Program Director 2011-2012
Male Female
0.4
3.5
8.7
12
16.8
19.3
20.7
13.5
4.2
0.70.8
5.2
11.7
14.8
17.316.5
17.9
11.7
3.3
0.68
0
5
10
15
20
25
25-29 30-34 35-39 40-44 45-49 50-54 55-59 60-64 65-69 70+
Perc
ent %
2011 2012
29

Ethnicity of Faculty 2012-2013
Program Director ACCE Core Faculty All Core
Faculty Associated
Faculty
Black or African American
8 11 48 67 52
American
Indian/Alaskan Native
1 0 0 1 3
Asian 7 7 78 92 74
White 194 253 1656 2103 1674
Hispanic/Latino of
any race 4 6 49 59 55
Native Hawaiian/Pacific
Islander 0 0 1 1 6
Two or more races 1 3 22 26 17
Unknown 1 2 27 30 34
Total 216 282 1881 2379 1915
Number of Programs That Have Minority Faculty
by Number of Minority Faculty
92
51
24
1410
3 3 1
85
57
28
168 6
2 3
0
10
20
30
40
50
60
70
80
90
100
0 1 2 3 4 5 6 7+
Num
ber o
f Pro
gram
s
Number of Minorities on Faculty
2011 2012
30

Degrees Held by Core Faculty
Entry-level Degrees Held by Core Faculty 2012-2013
704
86
110
363
45
48
63
6
17
77
10
2
225
65
22
149
52
9
1
3
140
1
1
0% 10% 20% 30% 40% 50% 60% 70% 80% 90% 100%
Other Faculty
ACCE
Program Director
Other Faculty ACCE Program DirectorBachelors 704 86 110Masters 363 45 48Certificate 63 6 17DPT 77 10 2Bachelor's + Transition DPT 225 65 22Master's + Transition DPT 149 52Certificate + Transition DPT 9 1 3Not Applicable 140 1None 1
31

Highest Academic Degree Held by Core Faculty by Primary Position Beyond Physical Therapy Degree
2012-2013
Highest Academic Degree Held by All Core Faculty Beyond Physical Therapy Degree (2012 – 2013)
0 10 20 30 40 50 60 70
PD
ACCE
Other Faculty
Percent of Faculty
PhD
Prof Doctorate
Advanced Masters
4%
16.8% 22.5%
49%
1.5%
17.5% 16.2%
47.8%
0
10
20
30
40
50
60
Bachelor's Master's Professional Doctoral PhD
2011 (n=2202) 2012 (n=2380)
32

Rank of Core Faculty by Primary Responsibility 2012-2013
Tenure Status of Core Faculty 2012-2013
12.9
14.2
3.1
2.9
42.4
40.2
32.6
30.8
19.8
20.6
49.8
53.1
46.4
45.5
61.1
59.6
6.4
4.8
5.9
5.4
8.4
7.5
0.5
0.9
2.3
3.4
4.6
0.5
1.4
1.4
4.2
4.9
1
1.4
Faculty 2011
Faculty 2012
ACCE/DCE 2011
ACCE/DCE 2012
Program Director 2011
Program Director 2012
Faculty 2011 Faculty 2012 ACCE/DCE 2011 ACCE/DCE 2012 Program Director2011
Program Director2012
Professor 12.9 14.2 3.1 2.9 42.4 40.2Assoc Prof 32.6 30.8 19.8 20.6 49.8 53.1Asst Prof 46.4 45.5 61.1 59.6 6.4 4.8Instructor 5.9 5.4 8.4 7.5 0.5Lecturer 0.9 2.3 3.4 4.6 0.5Other 1.4 1.4 4.2 4.9 1 1.4
30.6
12.1
63.6
23.3
14.2
13.4
17.3
31.6
5.7
7.1
1.4
1.4
21.8
31.9
15.8
Faculty
ACCE/DCE
Program Director
Faculty ACCE/DCE Program DirectorTenured 30.6 12.1 63.6On Tenure Track 23.3 14.2 13.4Not Eligible (on Clinical Track) 17.3 31.6 5.7Not Eligible (other reasons) 7.1 1.4 1.4No Tenure Track 21.8 31.9 15.8
33

ASSOCIATED FACULTY (2012-13)
Number of Associated Faculty by Highest Degree Held
2009 2010 2011 2012
Master’s 609 356 386 388
Professional Doctorate 221 298 234 243
PhD 419 403 435 446 None 134 576 781 731
Number of Associated Faculty who are Certified Clinical Specialists: 563 Number of Associated Faculty who are Enrolled in Doctoral Programs: 94 Number of Associated Faculty who are Enrolled in tDPT Programs: 47 Number of Associated Faculty who are Enrolled in a Master’s Program: 3
Top 12 Areas of Associated Faculty Content Expertise
Musculoskeletal 18.3%
Other 14.2%
Anatomy 9.1%
Neuromuscular 7%
Pediatrics 5.9%
Administration/Management 5%
Cardiopulmonary 4.6%
Neuroscience 4.5%
Clinical Medicine 4.2%
Electrotherapy/Modalities 3.6%
Physiology 3.3%
Research 3.1%
34

Salaries of Program Directors (n=163) in Physical Therapist Education Programs by Rank, Length of Appointment and Type of Institution
AY 2012-2013
PUBLIC INSTITUTIONS PRIVATE INSTITUTIONS 9 –9.5 months 10 – 11 months 12 months 9 – 9.5 months 10 – 11 months 12 months
LECTURER N=
Mean= Median=
Range=
INSTRUCTOR N=
Mean= Median=
Range=
1
** ** **
ASST. PROF. N=
Mean= Median=
Range=
1
** ** **
2
** ** **
2
** ** **
ASSOC. PROF. N=
Mean= Median=
Range=
6
96,336 96,228
81,500-107,738
4
87,276 85,239
81,990-96,635
24
111,205 112098
86,544-149,628
7
95,774 91,997
86,530-112,200
50
118,768 118,739
72,000-238,273 PROFESSOR
N= Mean=
Median= Range=
2
** ** **
4
141,723 137,639
74,315-217,300
34
135,474 128,273
92,621-234,239
1
** ** **
4
142,552 127,904
90,000-220,000
20
127,222 117,849
73,542-255,248 OTHER
N= Mean=
Median= Range=
1
** ** **
35

Salaries of ACCE/DCEs (n=206) in Physical Therapist Education Programs by Rank, Length of Appointment and Type of Institution
AY 2012-2013
PUBLIC INSTITUTIONS PRIVATE INSTITUTIONS 9 –9.5 months 10 – 11 months 12 months 9 – 9.5 months 10 – 11 months 12 months
LECTURER N=
Mean= Median=
Range=
2
** ** **
3
81,291 80,298
**
INSTRUCTOR N=
Mean= Median=
Range=
2
** ** **
7
77,471 76,694
69,403-90,796
7
76,595 73,000
32,802-110,000 ASST. PROF.
N= Mean=
Median= Range=
7
72,948 73,333
56,701-89,628
41
78,699 78,493
42,498-98,501
2 ** ** **
7
74,726 72,949
66,403-90,938
69
81,816 84,365
18,000-115,458 ASSOC. PROF.
N= Mean=
Median= Range=
2
** ** **
10
91,966 88,700
69,245-114,166
2 ** ** **
6
84,650 86,358
64,480-110,225
20
85,113 85,755
70,000-101,162 PROFESSOR
N= Mean=
Median= Range=
4
91,705 85,255
70,418-125,892
4
93,137 97,436
54,500-123,176
1
** ** **
OTHER N=
Mean= Median=
Range=
2
** ** **
4
71,191 74,577
50,000-85,611
4
61,822 66,525
38,000-76,240
36

Salaries of Full-time Faculty (n=1,355) in Physical Therapist Education Programs by Rank, Length of Appointment and Type of Institution
AY 2012-2013
PUBLIC INSTITUTIONS PRIVATE INSTITUTIONS 9 –9.5 months 10 – 11 months 12 months 9 – 9.5 months 10 – 11 months 12 months
LECTURER N=
Mean= Median=
Range=
3
61,954 56,063
**
2
** ** **
4
64,195 67,771
45,821-75,417
1
** ** **
1 ** ** **
INSTRUCTOR N=
Mean= Median=
Range=
9
66,527 65,404
20,440-105,417
2
** ** **
35
73,084 74,256
44,576-94,937
2
** ** **
4
60,439 60,017
57,778-63,945
25
68,056 71,050
20,700-100,000 ASST. PROF.
N= Mean=
Median= Range=
64
72,306 73,463
25,517-97,700
27
78,441 78,107
65,010-94363
202
80,617 82,076
35,464-123,431
38
65,545 64,137
47,500-97,375
48
66,113 66,133
28,900-91,966
257
79,950 82,483
13,750-114,452 ASSOC. PROF.
N= Mean=
Median= Range=
39
85,516 84,239
60,446-115,032
23
81,713 84,275
7,500-104,245
131
94,135 93,400
35,862-154,830
38
77,270 73,666
59,240-144,950
52
82,673 80,995
22,161-145,088
155
94,245 91,780
28,700-137,108 PROFESSOR
N= Mean=
Median= Range=
25
104,159 95,384
64,466-190,550
18
96,934 92,681
45,648-145,758
60
103,680 106,360
18,000-235,182
12
86,570 84,653
48,000-108,280
15
91,136 84,407
46,645-125,050
63
108,264 105,200
50,000-183,086 OTHER
N= Mean=
Median= Range=
6
72,627 77,979
38,913-83,302
4
66,457 67,470
46,000-84,888
37