2012-09-20 Market Power Shifting to Subsea Equipment Players - D. Gacicia
54
People. Ideas. Success. Guggenheim Securities, LLC Oil Services & Equipment September 20, 2012 Darren Gacicia (212) 293-3054 [email protected] Robert Miller - Associate (972) 638-5504 [email protected] Market Power Shifting to Subsea Equipment Players Upgrading FTI to Buy From Neutral GUGGENHEIM SECURITIES, LLC See pages 53 - 54 for analyst certification and important disclosures.
-
Upload
darren-gacicia -
Category
Documents
-
view
405 -
download
0
Transcript of 2012-09-20 Market Power Shifting to Subsea Equipment Players - D. Gacicia

People. Ideas. Success.
Guggenheim Securities, LLC Oil Services & Equipment
September 20, 2012
Darren Gacicia
(212) 293-3054
Robert Miller - Associate
(972) 638-5504
Market Power Shifting to Subsea Equipment Players Upgrading FTI to Buy From Neutral
GUGGENHEIM SECURITIES, LLC See pages 53 - 54 for analyst certification and important disclosures.

Investment Thesis
Market Power Shifting Toward Subsea Equipment Players. The credit crisis and recession, coupled with the Macondo incident, slowed offshore activity and
demand of equipment from 2008-2010. Market power shifted to offshore operators, as oilfield equipment players competed to win awards amid more limited
subsea tree demand. The inflection of offshore activity in 2011 marked a migration in market power back to the oilfield equipment players. In this report, we track
the shift in market power with a “deep dive” into the subsea tree business, through an in-depth analysis of subsea tree demand, manufacturing capacity, orders,
and backlog across the industry. Our analysis distills to our conclusion that visibility for demand from offshore fleet growth, rising utilization, and emergent signs of
capacity constraints likely translate into revenue growth (asset turns), improved mix/pricing (higher margins), and returns for oilfield equipment players. Given
operating leverage across equipment businesses, we believe the stage is set for upward revisions to consensus estimates and valuation multiples for subsea
players, and oilfield equipment players more broadly.
High Visibility for Subsea Tree Demand. Our revised subsea tree forecast calls for nearly three times the number of deliveries in 2017 from 2011, a ~19%
CAGR annually. We calibrated our forecast for subsea trees against the Guggenheim/PFC offshore rig supply/demand model and field-by-field data from Infield
(pgs. 10-18). Our new forecast falls below our previous estimates and below popular industry outlooks, as we tailored our assumptions to better represent
relationships with prior tree deliveries, especially related to well water depths. Albeit tempered from our original estimates, strong growth in our new forecast is
anchored by existing orders that support near-term estimates and high visibility into offshore fleet growth (pgs. 12-13). Likewise, our analysis of demand by region
and company, relative to existing orders, planned projects, and potential projects, implies strong new order flow if operators look to schedule deliveries in front of
projects in the coming years (pgs. 15-18).
Capacity Utilization Increasing. Rising demand for subsea trees likely lifts production capacity utilization from below 50% to above 70% and beyond during the
next five years. Within this report, our estimation of manufacturing capacity by major manufacturer and region suggests the subsea tree market is tightening (pgs.
20-22). The key constraints on capacity remain engineers and the supply chain (emphasis on forging), both less adjustable in the near term due to longer training
cycles and capacity/logistical solutions requiring time. As industry backlogs sit above two times current annual production capacity and new order lead times
appear poised to expand, we see potential for pricing power on the horizon (pgs. 24-25, 28).
Asset Turns and Operating Margins Set to Drive ROE Equation. Improved capacity utilization, pricing power, and expanding new order lead times look set to
drive revenue growth, asset turns, and operating margins (pg. 26). A steady rise in average revenue per tree across industry backlogs, either from improved mix or
pricing, supports our view of improving incremental economics, especially as lower margin backlog rolls off (pg. 23). The absorption of production capacity and
lengthening of lead times may also give equipment providers sway to push for greater subsea tree design standardization, likely a further boost to turns of existing
capacity and a benefit to bottom line economics (pgs. 21, 24-25). In our view, subsea tree estimates remain low as we emerge from the recession-driven lull in
tree orders and deliveries (pg. 12). Amid low expectations, we see room for upward revisions to consensus estimates and re-rating of multiples higher as investors
discount greater earnings growth.
Upgrading FTI to Buy from Neutral, Raising Price Target to $64, Increasing 2013 estimates. We are upgrading FMC Technologies to Buy from Neutral and
raising our price target to $64 from $46. Likewise, we are raising our 2013 EPS estimate to $2.70 from $2.65. As the largest subsea tree provider, FTI has the
greatest leverage to improving subsea market economics. Over the next 12 months, we believe the positive trajectory of its subsea business will overshadow risks
to its Surface business, implicit from volatility in North American activity. If our bullish thesis plays out, we anticipate upward consensus estimate revisions and
multiple expansion to propel FTI shares higher (pgs. 3, 34-36).
Positive Read-Throughs for CAM, AKSO, & GE (not covered). As most industry players will likely benefit from improved subsea economics, our analysis of the
subsea market supports our estimates and outlooks for our other Buy-rated oilfield equipment companies: Cameron (pgs. 41-42) and Aker Solutions (pgs. 43-44).
Guggenheim Securities, LLC | 972.638.5500 | guggenheimpartners.com
Market Power Shifting to Subsea Equipment Players - Upgrading FTI to Buy From Neutral PAGE 2

FTI – Upgrading to Buy – Seeking Leverage to Improving Subsea Economics
We are upgrading FTI to Buy from Neutral. We see improving subsea economics
overshadowing North American-related risks to the Surface business. Although risks for
near-term quarters from lower margin subsea backlog remains, we believe the upside from
asset turns from completion of near-term deliveries and incrementally better economics
baked into backlog should outweigh near-term risks that Subsea margins may fall below
2H12 guidance of 12.5-13.5% (pg. 35). Forecasted to expand from ~55% of operating
income, we think the outlook for the continued improvement in the trajectory of Subsea
margins since 4Q11 will remain the key driver for FTI shares. Given operating leverage in
FTI’s business model from outsourcing, we see potential upward revisions to consensus
earnings estimates with growth in the Subsea business. Additionally, we see valuation
multiple expansion for the shares as the combination of growth and a favorable return
structure hits stride. We would take advantage of the current consolidation within FTI shares
as an entry point.
Raising Our Price Target & 2013 Estimate. We are raising our price target to $64 from
$46. Given our more positive outlook, we are raising our 2013E EPS to $2.70 from $2.65.
Subsea Technologies Growth to Take Lead. After gaining 600bps of market share from
2009-2011, a competitive bidding environment and lower margin backlog has forced 2012
Subsea margin guidance down to 11-12%. Improved revenue/tree in backlog and visibility
into accelerating deliveries into 2013 (pg. 35), likely improves revenue, asset turns, and
margins through 2H12. As a result, we are more confident in 2H12 Subsea margin guidance
for an uptick to 12.5-13.5%. As industry manufacturing capacity tightens and lead times
expand, we see room for improved pricing and greater standardization of tree orders, which
may propel subsea economics ahead of our current estimates.
Surface Technologies Remains a Risk, but Reflected in Estimates. Our forecast for a
2H12 decline in North American activity risks 18-20% 2012 margin guidance for the Surface
business and leads our margin numbers lower for 2013, as backlog protection fades.
Exposure to North American surface wellheads, as well as pressure pumping equipment,
rentals, and consumables, lead us to revise our estimates below current guidance (pg. 36).
Although strength in international businesses may offset downside, negative revision risk
likely remains. In our view, upside in the Subsea business will offset this drag.
-
200
400
600
800
1,000
1,200
1,400
1,600
1,800
2,000
1Q
10
2Q
10
3Q
10
4Q
10
1Q
11
2Q
11
3Q
11
4Q
11
1Q
12
2Q
12
3Q
12E
4Q
12E
1Q
13E
2Q
13E
3Q
13E
Segm
ent
Revenue (
$m
)
Subsea Technologies Surface Technologies Energy Infrastructure
15%
25%
35%
45%
55%
1Q
06
3Q
06
1Q
07
3Q
07
1Q
08
3Q
08
1Q
09
3Q
09
1Q
10
3Q
10
1Q
11
3Q
11
1Q
12
3Q
12E
1Q
13E
3Q
13E
1Q
14E
3Q
14E
1Q
15E
3Q
15E
Retu
rn o
n E
quity(A
nnualz
ed Q
uart
ers
)
Source: Company Reports, Guggenheim Securities, LLC
Source: Company Reports, Guggenheim Securities, LLC
FTI Annualized Return on Equity
FTI Segment Revenue Breakdown
Source: FactSet, Guggenheim Securities, LLC
Company Category 2008 2009 2010 2011 2012E 2013E 1Q12 2Q12 3Q12E 4Q12E 1Q13E 2Q13E 3Q13E 4Q13E
FMC Technologies EPS 2.94 2.93 3.06 1.64 2.00 2.70 0.41 0.43 0.56 0.60 0.63 0.65 0.67 0.74
Previous EPS 2.00 2.65 0.56 0.60 0.63 0.64 0.66 0.72
Consensus EPS 2.09 2.61 0.57 0.64 0.56 0.61 0.67 0.73
Consensus EPS-High 2.16 2.90 0.60 0.71 0.63 0.66 0.73 0.87
Consensus EPS-Low 2.00 2.00 0.54 0.57 0.52 0.50 0.49 0.49
Guggenheim Securities, LLC | 972.638.5500 | guggenheimpartners.com
Market Power Shifting to Subsea Equipment Players - Upgrading FTI to Buy From Neutral PAGE 3

Guggenheim Subsea Tree Forecast Expected to Grow at 19% CAGR 2011-2017
269 258
386 338
296
237 262
464 496
539
613
736 753 757 807
853
-
100
200
300
400
500
600
700
800
900
2005
2006
2007
2008
2009
2010
2011
2012E
2013E
2014E
2015E
2016E
2017E
2018E
2019E
2020E
Subse
a T
ree D
eliv
eries
Worldwide Subsea Tree Expected Deliveries Worldwide Subsea Tree Deliveries
Guggenheim Annual Worldwide Subsea Tree Deliveries History & Forecast
Source: Infield, PFC Energy - Guggenheim
Actual subsea tree deliveries into
the market
Subsea tree deliveries expected
to nearly triple from 2011 to 2017
The subsea tree market expected
to grow at 19% CAGR from
2011-2017
Our forecast sees 2012 surpass
previous high delivery year of
2007
Guggenheim Securities, LLC | 972.638.5500 | guggenheimpartners.com
Market Power Shifting to Subsea Equipment Players - Upgrading FTI to Buy From Neutral PAGE 4

Manufacturing Capacity Utilization Suggests Market Power for Equipment Names
138
173
182
230
298
306
331
336
351
363
384
410
498
515
534
548
558
628
713
718
718
64%
74%
67%
75%
82%
54%
70%
66%58%
44%
70%
63%
77%
66%
55%
43%
47%
74%
70%
75%
85%
-
100
200
300
400
500
600
700
800
0%
10%
20%
30%
40%
50%
60%
70%
80%
90%
100%
1995
1996
1997
1998
1999
2000
2001
2002
2003
2004
2005
2006
2007
2008
2009
2010
2011
2012E
2013E
2014E
2015E
Subse
a T
ree M
anufa
cturin
g C
apacity
Capaci
ty U
tiliz
ation
Subsea Tree Manufacturing Capacity Capacity Utilization
Guggenheim Estimated Subsea Tree Production Capacity
Source: Infield, Guggenheim Securities, LLC
The ramp in estimated
deliveries in 2012 and
beyond looks set to rapidly
increase utilization of
subsea tree manufacturing
capacity across the
industry, despite capacity
expansions for all of the
major equipment providers.
The subsea tree market is
headed back to utilization
levels that heralded high
margins, high assets turns,
and favorable return
structures during that last
cycle.
We see potential for rising utilization to push
toward more standardized tree designs in order to
minimize engineering bottlenecks seen with
specially designed trees.
Guggenheim Securities, LLC | 972.638.5500 | guggenheimpartners.com
Market Power Shifting to Subsea Equipment Players - Upgrading FTI to Buy From Neutral PAGE 5

Visible Near-Term Demand Supports Estimates & Suggests Strong Order Flow
464 496
539
613
736 753 757 807
853
436 396
253
156 110
52 36 17 8
-
100
200
300
400
500
600
700
800
900
2012E 2013E 2014E 2015E 2016E 2017E 2018E 2019E 2020E
Subse
a T
ree
Deliv
eries
Guggenheim Subsea Tree Demand Forecast Ordered Wedge
Guggenheim Worldwide Subsea Tree Demand vs. Current Orderbook Existing orders and delivery dates support
our delivery forecast for 2012 and 2013.
In our view, the market does not see the
ramp in scheduled deliveries during this
year and next, which should both drive
capacity utilization and burn off lower
margin backlog awarded during the recent
downturn.
Unordered portions of demand should
translate into strong new order numbers
across companies over the next few
years.
Source: Infield, PFC Energy - Guggenheim
Guggenheim Securities, LLC | 972.638.5500 | guggenheimpartners.com
Market Power Shifting to Subsea Equipment Players - Upgrading FTI to Buy From Neutral PAGE 6

164 231
222
205
159
269
258
386
338
296
237
262
599 632 6
92
769
868
-
100
200
300
400
500
600
700
800
900
2000
2001
2002
2003
2004
2005
2006
2007
2008
2009
2010
2011
2012E
2013E
2014E
2015E
2016E
Subse
a T
ree D
eliv
eries
Guggenheim's Previous Forecast
164 231
222
205
159
269
258
386
338
296
237
262
464
496
539 6
13
736
164
231
222
205
159
269
258
386
338
296
237
262
436
396
253
156
110
-
100
200
300
400
500
600
700
800
900
2000
2001
2002
2003
2004
2005
2006
2007
2008
2009
2010
2011
2012E
2013E
2014E
2015E
2016E
Subse
a T
ree D
eliv
eries
Total Forecast Demand Delivered/Ordered
New Forecast More Conservative Than Previous Estimates
Guggenheim Annual Worldwide Subsea Tree
Deliveries History & Forecast
Source: Infield, PFC Energy - Guggenheim
Guggenheim Previous Forecast, Before Tighter
Calibration Against Historical Deliveries
Source: PFC Energy - Guggenheim
Our forecast becomes more conservative after back testing
historical well counts and tree deliveries. The key drivers of the
downward revisions stem from lowered expected subsea tree
demand from shallow water projects.
Guggenheim Securities, LLC | 972.638.5500 | guggenheimpartners.com
Market Power Shifting to Subsea Equipment Players - Upgrading FTI to Buy From Neutral PAGE 7

164 231
222
205
159
269
258
386
338
296
237
262
464
496
539 6
13
736
164
231
222
205
159
269
258
386
338
296
237
262
436
396
253
156
110
-
100
200
300
400
500
600
700
800
900
2000
2001
2002
2003
2004
2005
2006
2007
2008
2009
2010
2011
2012E
2013E
2014E
2015E
2016E
Subse
a T
ree D
eliv
eries
Total Forecast Demand Delivered/Ordered438
462
452
432
318 3
74
311
551
661
664 7
23
798
0
100
200
300
400
500
600
700
800
900
2005
2006
2007
2008
2009
2010
2011
2012E
2013E
2014E
2015E
2016E
Subse
a T
ree A
ward
s
FMC Industry Awards
Multi-Year Book-to-Build Ratio Above “1” ─ Positive Demand Indicator
Guggenheim Annual Worldwide Subsea Tree
Deliveries History & Forecast
Source: Infield, PFC Energy - Guggenheim
FMC Forecasted Industry Subsea Tree Awards as
Attributed to Quest Offshore
Source: FMC Company Presentation, Guggenheim Securities, LLC
Awards can run higher than
deliveries in any given year, as
future large orders may have
multi-year lead times.
Our forecast differs in both
approach and scale relative to
other benchmarks published in
company presentations.
Although a Quest number, FTI
guidance sees ~400-500 wet
trees ordered in 2012.
Guggenheim Securities, LLC | 972.638.5500 | guggenheimpartners.com
Market Power Shifting to Subsea Equipment Players - Upgrading FTI to Buy From Neutral PAGE 8

Key Drivers & Assumptions
Guggenheim Securities, LLC | 972.638.5500 | guggenheimpartners.com
Market Power Shifting to Subsea Equipment Players - Upgrading FTI to Buy From Neutral PAGE 9

Guggenheim/PFC Offshore Rig Demand Model Supports & Constrains Subsea
Tree Demand Outlook
Source: RigLogix, PFC Energy-Guggenheim Source: RigLogix, PFC Energy-Guggenheim
20 22 26 32 36 38 44 55 63 69 94 92 88
92 97
83 82 84 80
88
103 105 101 100 99
-
50
100
150
200
250
300
350
400
2012E 2013E 2014E 2015E 2016E
Num
ber
of
Rig
s
7500+ WD 5000-7500 WD3000-5000 WD 1000-3000 WD400-1000 WD UDW SupplyUDW & DW Supply UDW&DW&MW Supply
99 99 98 101 109
331 331 330 333 339
-
50
100
150
200
250
300
350
400
450
500
2012E 2013E 2014E 2015E 2016E
Num
ber
of
Rig
s
300-400000-300Premium & High End JackupsStandard & Lower Spec Jackups
Global Supply / Demand of Floaters Global Supply / Demand of Jackups
We derive our subsea tree model from our offshore rig supply/demand
model. Within this context, we cross-reference input data from PFC
Energy with Infield data.
Potential demand could be much greater if not constrained by rig
undersupply. Accordingly, as further new floater constructions are
announced, our model would continue to suggest upward demand
revisions for subsea trees.
Historically, shallow water activity has not proved a large source of subsea
tree demand. Our forecast for high jackup utilization, especially for
premium rigs, may offer potential upside to subsea tree demand, as plays
become both more complex and remote from existing infrastructure.
Guggenheim Securities, LLC | 972.638.5500 | guggenheimpartners.com
Market Power Shifting to Subsea Equipment Players - Upgrading FTI to Buy From Neutral PAGE 10

Assumptions Applied to Guggenheim/PFC Offshore Rig Supply/Demand Model
2005 2006 2007 2008 2009 2010 2011 2012E 2013E 2014E 2015E 2016E 2017E 2018E 2019E 2020E
Percent of Wells Needing Tieback (by well type)
Exploration 5% 5% 5% 5% 5% 5% 5% 10% 10% 10% 10% 10% 10% 10% 10% 10%
Appraisal 5% 5% 5% 5% 5% 5% 5% 10% 10% 10% 10% 10% 10% 10% 10% 10%
Development 90% 90% 90% 90% 90% 90% 90% 100% 100% 100% 100% 100% 100% 100% 100% 100%
Percent of Wells Needing a Wet Tree (by water depth)
0-300 WD 5% 5% 5% 5% 5% 5% 5% 7% 7% 7% 7% 7% 7% 7% 7% 7%
300-400 WD 5% 5% 5% 5% 5% 5% 5% 10% 10% 10% 10% 10% 10% 10% 10% 10%
400-1000 WD 10% 10% 10% 10% 10% 10% 10% 20% 25% 30% 35% 40% 45% 45% 45% 45%
1000-3000 WD 30% 30% 30% 30% 30% 30% 30% 40% 45% 50% 55% 60% 65% 65% 65% 65%
3000-5000 WD 60% 60% 60% 60% 60% 60% 60% 65% 75% 80% 85% 90% 95% 95% 95% 95%
5000-7500 WD 80% 80% 80% 80% 80% 80% 80% 90% 95% 100% 100% 100% 100% 100% 100% 100%
7500+ WD 80% 80% 80% 80% 80% 80% 85% 95% 100% 100% 100% 100% 100% 100% 100% 100%
Rig/Frictional Delays
% 0-400 WD Slippage 0% 0% 0% 0% 0% 0% 0% 0% 0%
% 1,000 WD Slippage 10% 13% 15% 15% 15% 15% 15% 15% 15%
Only a smaller number of E&A
wells have needed trees, but we
see more of these wells
transitioned to production in the
future.
We made assumptions to conform previous
subsea tree deliveries with prior well count
data, using “rules of thumb” for the probability
for tree demand among water depths.
As incremental plays become more remote,
moving away from established infrastructure,
we see the penetration of subsea tree demand
increasing, especially in the midwater.
Our forecast factors a certain amount of
demand slippage, as rig shortages push
demand further out.
Source: Guggenheim Securities, LLC
Guggenheim Securities, LLC | 972.638.5500 | guggenheimpartners.com
Market Power Shifting to Subsea Equipment Players - Upgrading FTI to Buy From Neutral PAGE 11

Midwater Subsea Tree Demand Growth Foreshadows Path for Ultra/Deepwater
-
50
100
150
200
250
300
350
400
450
1980
1981
1982
1983
1984
1985
1986
1987
1988
1989
1990
1991
1992
1993
1994
1995
1996
1997
1998
1999
2000
2001
2002
2003
2004
2005
2006
2007
2008
2009
2010
2011
Subse
a T
ree D
eliv
eries
Shallow Water Midwater Deepwater Ultra Deepwater
Subsea Tree Deliveries by Water Depth
Growth in subsea tree demand
from Midwater drilling grew
slowly with growth of the floater
fleet and transition of drilling
activity from exploration to
development.
The slow growth of subsea tree
demand for Ultra/Deepwater
projects has begun to expand
slowly, similar to what was seen
with the evolution of Midwater
demand.
Shallow water penetration has
also begun to expand, as fields
become both more complex and
more remote.
Source: Infield, Guggenheim Securities, LLC
Guggenheim Securities, LLC | 972.638.5500 | guggenheimpartners.com
Market Power Shifting to Subsea Equipment Players - Upgrading FTI to Buy From Neutral PAGE 12

Floater Fleet & Subsea Tree Market Grow in Tandem
Source: Infield, Guggenheim Securities, LLC
Total Subsea Tree Deliveries to Track Floater Deliveries
Exhibit 1: Guggenheim
100
150
200
250
300
350
400
-
100
200
300
400
500
600
700
800
1995
1996
1997
1998
1999
2000
2001
2002
2003
2004
2005
2006
2007
2008
2009
2010
2011
2012E
2013E
2014E
2015E
2016E
2017E
GLobal F
loate
r Fle
et S
izeSubse
a T
ree D
eliv
eries
Total Deliveries Total Floaters
-
50
100
150
200
250
300
350
400
-
50
100
150
200
250
300
350
400
450
1995
1996
1997
1998
1999
2000
2001
2002
2003
2004
2005
2006
2007
2008
2009
2010
2011
2012E
2013E
2014E
2015E
2016E
2017E
Glo
bal F
loate
r Fle
et S
izeSubse
a T
ree O
rders
Total Orders Total Floaters
We see the continued growth of
the floater fleet as directly
correlated with subsea tree
deliveries.
New Orders to Recover with Fleet Growth
The recession and Macondo incidents de-
railed the progression of subsea tree
orders and deliveries. We expect growth
to resume its correlation with floater fleet
growth and drilling activity.
Source: Infield, RigLogix, Guggenheim Securities, LLC Note: 2012 Subsea Orders are shown year-to-date
Source: Infield, RigLogix, Guggenheim Securities, LLC
Guggenheim Securities, LLC | 972.638.5500 | guggenheimpartners.com
Market Power Shifting to Subsea Equipment Players - Upgrading FTI to Buy From Neutral PAGE 13

Near-Term Demand More Firm, Rising Activity Supports Possible Demand
164
231
222
205
159 269
258 386
338
296
237
262
436
396
253
156
110
52
36
10 55
133
158
207
187
151
86
18
45
153
300 419
514
570
704
828
-
100
200
300
400
500
600
700
800
900
2000
2001
2002
2003
2004
2005
2006
2007
2008
2009
2010
2011
2012E
2013E
2014E
2015E
2016E
2017E
2018E
2019E
2020E
Subse
a T
ree D
eliv
eries
Delivered/Ordered Planned Project - Potential Orders Possible Project - Potential Orders
Worldwide Subsea Tree Demand Tiered by Ordered, Planned, and Possible
Source: Infield, PFC Energy - Guggenheim
Ordered and planned demand supports
estimates for 2012-2014.
Visibility on firm demand trails off later in
the forecast. In our view, an increase in
the number of announcement for EPC
and FEED studies for offshore projects
illustrate the initial steps to converting
“Possible” projects into “Planned” project.
The number of planned projects that jump
in deliveries in 2012 and 2013 remains
sustainable, even if “Possible” demand
proves at risk.
The risk lies in companies underbidding
projects, without giving weight to the wave
of “Possible” project demand.
Guggenheim Securities, LLC | 972.638.5500 | guggenheimpartners.com
Market Power Shifting to Subsea Equipment Players - Upgrading FTI to Buy From Neutral PAGE 14

0
100
200
300
400
500
600
700Petr
obra
s
Tota
l
BP
Shell
Chevro
n
Sta
toil
Exx
onM
obil
Eni
Gazp
rom
Anadark
o
Woodsi
de
Conoco
Phill
ips
Hess
Tullo
w
Pre
mie
r
Noble
BG
Gro
up
Maers
k
Apach
e
Murp
hy
Talis
man
ON
GC
Nexe
n
Inpex
EnQ
uest
Centr
ica
Husk
y
KN
OC
ATP
CN
OO
C
PEM
EX
BH
P B
illiton
GD
F S
uez
Fairfield
Queiroz
Galv
ao
Mara
thon
Relia
nce
PTT
DN
O
Lundin
Subse
a T
rees
Deliv
eries
Ordered / Undelivered Planned Project - Potential Orders Possible Project - Potential Orders
Demand from Key Operators Represents Wave of New Orders
Top Offshore Operator Subsea Tree Orders and Demand
Sources: Infield, Guggenheim Securities, LLC
The largest offshore operators have
ordered few trees in relation to their total
potential demand. In particular, the largest
operators still must order 989 trees in
order to meet planned project demand.
CVX and PBR are known for greater
engineering content and longer lead
times for orders.
BP and Shell are known for more subsea
standardization.
Wall of ordered trees and a constrained
supply chain may lead to greater subsea
tree order standardization.
Petr
obra
s
Tota
l
BP
Shell
Chevro
n
Sta
toil
Exx
onM
obil
Eni
Gazp
rom
Anadark
o
Woodsi
de
Conoco
Phillips
Hess
Tullow
Pre
mie
r
Noble
BG
Gro
up
Maers
k
Apach
e
Murp
hy
Talism
an
ON
GC
Nexe
n
Inpex
EnQ
uest
Centr
ica
Husk
y
KN
OC
ATP
CN
OO
C
PEM
EX
BH
P B
illito
n
GD
F S
uez
Fair
field
Queir
oz
Galv
ao
Mara
thon
Reliance
PTT
DN
O
Lundin
To
tal T
op
40
Oth
er
To
tal
Ordered / Undelivered 389 91 34 83 50 51 31 45 3 11 11 18 12 9 4 12 8 12 17 18 6 3 5 22 10 14 21 10 17 17 0 15 1 1 0 10 0 0 3 4 1,068 105 1,173
Planned Project - Potential Orders 62 111 120 82 125 39 72 37 48 16 10 11 14 25 8 15 25 29 12 2 10 12 14 0 9 1 5 4 2 10 8 2 13 9 1 3 3 11 6 3 989 101 1,090
Possible Project - Potential Orders 241 289 286 242 222 220 167 115 128 111 107 80 78 63 70 54 40 24 32 41 42 41 34 26 22 22 11 22 16 5 24 14 17 17 26 11 21 12 11 12 3,016 420 3,436
Total 692 491 440 407 397 310 270 197 179 138 128 109 104 97 82 81 73 65 61 61 58 56 53 48 41 37 37 36 35 32 32 31 31 27 27 24 24 23 20 19 5,073 626 5,699
Guggenheim Securities, LLC | 972.638.5500 | guggenheimpartners.com
Market Power Shifting to Subsea Equipment Players - Upgrading FTI to Buy From Neutral PAGE 15

Market Share by Top 40 Subsea Tree Customers 2000-2011
Operator
Total
Orders
'00-'11 Cameron
Aker
Solutions
GEOG
VetcoGray FMC Dril-Quip Other
Petrobras 832 27% 21% 19% 29% - 3%
Statoil 590 2% 29% 16% 53% - -
Total 295 23% 24% 2% 52% - -
Shell 275 15% 1% 37% 39% 7% -
BP 253 59% - 5% 36% - -
ExxonMobil 222 38% - 26% 36% - -
Chevron 206 28% - 41% 31% 1% -
Eni 98 42% 9% 18% 30% 1% -
Talisman 91 16% 9% 43% 32% - -
Anadarko 76 - - 9% 91% - -
Apache 67 72% 3% 10% 12% 3% -
Nexen 58 7% - 90% 2% 2% -
Canadian Natural Resources 57 35% - 9% 56% - -
ConocoPhillips 56 20% - 16% 36% 29% -
BHP Billiton 55 75% 2% 24% - - -
Woodside 55 - 16% - 84% - -
BG Group EGPC Petronas 43 100% - - - - -
Hess 41 71% 7% 10% 12% - -
Centrica 39 - - 59% 8% 33% -
Marathon 40 28% 53% 20% - - -
Maersk 34 32% - 68% - - -
Suncor Energy/Petro-Canada 33 - - - 100% - -
KNOC 33 27% - 70% - 3% -
Murphy 33 15% 48% - 30% 6% -
BG Group 31 71% - 6% 23% - -
Husky 30 100% - - - - -
ATP 29 45% - - 3% 52% -
Petronas 29 - 7% 31% 62% - -
Walter 26 - - 4% - 96% -
ADNEC 26 50% - 31% 19% - -
Tullow 26 4% - 15% 77% 4% -
CNOOC 26 - - - 100% - -
Premier 23 - - 74% 26% - -
Noble 20 75% - 10% 5% 10% -
GDF Suez 19 16% - 16% 68% - -
PetroSA 19 - - 21% 79% - -
EnQuest 18 - 33% 22% 44% - -
PEMEX 17 - - - 100% - -
Fairfield 16 94% - 6% - - -
Reliance 16 - 100% - - - -
Market Share 2000-2011
Total
Orders
'00-'11
% of
Market
Total Top 40 3,953 93%
Other 275 7%
Total Tree Demand 2000-2011 4,228
The largest 40 operators represent nearly
all of subsea tree demand.
Sources: Infield, Guggenheim Securities, LLC
Green indicates #1 provider status
Guggenheim Securities, LLC | 972.638.5500 | guggenheimpartners.com
Market Power Shifting to Subsea Equipment Players - Upgrading FTI to Buy From Neutral PAGE 16

Unordered Trees Demographics Point to Expansion of Subsea Tree Market
0
100
200
300
400
500
600
700
UK
Angola
USA
Aust
ralia
Nig
eria
Bra
zil
Norw
ay
Russ
ia (
FSU
)
Indonesi
a
Congo (
Bra
zzavill
e)
India
Ghana
Canada
Mala
ysi
a
Egypt (M
editerr
anean)
Equato
rial G
uin
ea
Moza
mbiq
ue
Falk
land I
slands
Isra
el
Italy
Aze
rbaijan (
FSU
)
Mexi
co
Republic
of
South
Afr
ica
Tanza
nia
Lib
ya
Maurita
nia
Sie
rra L
eone
Chin
a (
PRC)
Irela
nd
Russ
ia (
FSU
) (S
akhalin
)
Ivory
Coast
Phili
ppin
es
Trinid
ad
Tunis
ia
Lib
eria
Myanm
ar
Bru
nei
Guyane (
Fre
nch
Guia
na)
Vie
tnam
Oth
er
Unord
ere
d S
ubse
a T
rees
Possible Planned
0
500
1,000
1,500
2,000
2,500
3,000
SW MW DW UDW
Unord
ere
d S
ubse
a T
rees
Planned Possible
We expect Ultra/deepwater demand to
grow comparable to Midwater subsea
tree demand over time.
Unordered Midwater Demand Remains Significant
Traditional & Non-Traditional Sources of Demand
Source: Infield, Guggenheim Securities, LLC
Sources: Infield, Guggenheim Securities, LLC
Guggenheim Securities, LLC | 972.638.5500 | guggenheimpartners.com
Market Power Shifting to Subsea Equipment Players - Upgrading FTI to Buy From Neutral PAGE 17

Guggenheim “Watch List” for Subsea Tree Awards
Historical Historical
Operator Field Country Trees Preference #1 Preference #2 FTI CAM GE AKSO DRQ
Gazprom Shtokmanovskoye Russia (FSU) 72 - - - - -
Maersk Chissonga (Block 16) Angola 39 GEOG VetcoGray Cameron - - - - -
Total Egina (OML 130 Ex OPL 246) Nigeria 39 FMC Aker Solutions - - - - -
BP Green Canyon 826 Mad Dog South USA 38 Cameron FMC - - - - -
Shell Bonga North (OML 118 Ex OPL 212) Nigeria 29 FMC GEOG VetcoGray - - - - -
Chevron Lucapa (Block 14) Angola 28 GEOG VetcoGray FMC - - - - -
Chevron Rosebank UK 28 GEOG VetcoGray FMC - - - - -
BP Shah Deniz (Phase 2) Azerbaijan (FSU) 26 Cameron FMC - - - - -
Fairfield Darwin (North West Hutton Phase 2) UK 21 Cameron GEOG VetcoGray - - - - -
ExxonMobil Scarborough (WA-1-R) Australia 16 Cameron FMC - - - - -
GDF Suez Petrel (NT/RL1 & WA-6-R) (Bonaparte LNG) Australia 16 FMC Cameron - - - - -
Woodside Calliance (Ex Brecknock Sth) (WA-31-R Browse) Australia 16 FMC Aker Solutions - - - - -
Petrobras Franco (Phase 2) (2-ANP-1-RJS) Brazil 16 FMC Cameron - - - - -
Gazprom Kamennomysskoye More (Obskaya Bay) Russia (FSU) 16 - - - - -
Shell Mississippi Canyon 391-392 & 348 Appomattox USA 16 FMC GEOG VetcoGray - - - - -
Tullow Tweneboa (TEN) (Deepwater Tano) Ghana 14 FMC GEOG VetcoGray - - - - -
Chevron Nsiko (OML 140 Ex OPL 249) Nigeria 14 GEOG VetcoGray FMC - - - - -
Chevron Negage (Block 14) Angola 13 GEOG VetcoGray FMC - - - - -
Total Gindungo (Kaombo 1) (Block 32) Angola 12 FMC Aker Solutions - - - - -
Total Canela (Kaombo 2) (Block 32) Angola 12 FMC Aker Solutions - - - - -
Total Louro (Kaombo 2) (Block 32) Angola 12 FMC Aker Solutions - - - - -
PTT Cash/Maple (AC/RL7) Australia 12 - - - - -
Petrobras Carioca (Phase 1) (BM-S-9) (Sugarloaf) Brazil 12 FMC Cameron - 2 - - -
Tullow Enyenra (TEN) (Ex Owo) (Deepwater Tano) Ghana 12 FMC GEOG VetcoGray - - - - -
Noble Leviathan (Med) Israel 12 Cameron GEOG VetcoGray - - - - -
Chevron Aparo (OML 132 & OPL 249) Nigeria 12 GEOG VetcoGray FMC - - - - -
ONGC Krishna-Godavari UD-1 (KG-DWN-98/2) (D5) India 11 - - - - -
ConocoPhillips South Belut Indonesia 11 FMC - - - - -
ExxonMobil Erha North Extension (OML 133) Nigeria 11 Cameron FMC - - - - -
BP Plutao (PSVM) (Block 31 North East) Angola 10 Cameron FMC - 11 - - -
ExxonMobil Mbulumbumba (Kizomba Block 15) Angola 10 Cameron FMC - - - - -
ExxonMobil Vicango (Kizomba Block 15) Angola 10 Cameron FMC - - - - -
BP Urano (Block 31 South East) Angola 10 Cameron FMC - - - - -
Petrobras Lula North (BM-S-11) Brazil 10 FMC Cameron - - - - -
Tullow Ntomme (TEN) (Deepwater Tano) Ghana 10 FMC GEOG VetcoGray - - - - -
PEMEX Kosni Mexico 10 FMC Cameron - - - - -
Hess Green Canyon 468 Pony (Knotty Head North) USA 10 Cameron FMC - - - - -
Total Gengibre (Kaombo 1) (Block 32) Angola 9 FMC Aker Solutions - - - - -
Total Mostarda (Kaombo 2) (Block 32) Angola 9 FMC Aker Solutions - - - - -
Shell Brunei Government Geronggong Brunei 9 - - - - -
E.ON Ruhrgas Huntington UK 9 GEOG VetcoGray Cameron 4 - - - -
BP Saturno (PSVM) (Block 31 North East) Angola 8 Cameron FMC - 13 - - -
BP Cesio (PCC) (Block 18) Angola 8 Cameron FMC - - - - -
BP Chumbo (PCC) (Block 18) Angola 8 Cameron FMC - - - - -
Noble Aphrodite (Cyprus Block 12) Cyprus 8 Cameron GEOG VetcoGray - - - - -
Kosmos Odum (West Cape Three Points) Ghana 8 - - - - -
Chevron Gendalo Indonesia 8 GEOG VetcoGray FMC - - - - -
PEMEX Lakach Mexico 8 FMC Cameron - - - - -
Anadarko Windjammer/Barquentine (Prosperidade) Mozambique 8 FMC GEOG VetcoGray - - - - -
Shell DeSoto Canyon 353 & 397 & MC 393 Vicksburg USA 8 FMC GEOG VetcoGray - - - - -
Current Field Installations
Methodology: Our
“Watch List” is
comprised of the
largest potential
orders for planned
projects that
currently remain
unordered. We
have determined
the preferred
subsea tree
providers for each
operator through
an assessment of
market shares for
orders since 2000.
Sources: Infield,
Guggenheim Securities, LLC
Guggenheim Securities, LLC | 972.638.5500 | guggenheimpartners.com
Market Power Shifting to Subsea Equipment Players - Upgrading FTI to Buy From Neutral PAGE 18
Manufacturing Capacity
Guggenheim Securities, LLC | 972.638.5500 | guggenheimpartners.com
Market Power Shifting to Subsea Equipment Players - Upgrading FTI to Buy From Neutral PAGE 19
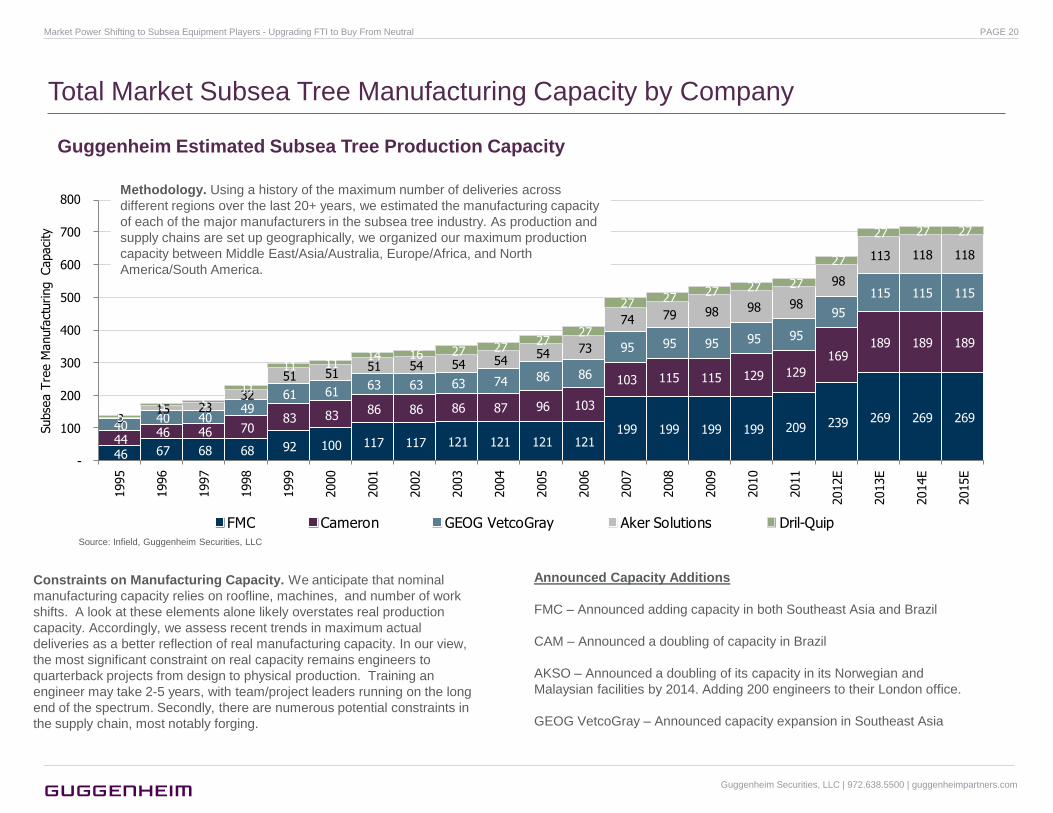
Total Market Subsea Tree Manufacturing Capacity by Company
Guggenheim Estimated Subsea Tree Production Capacity
46 67 68 68 92 100 117 117 121 121 121 121 199 199 199 199 209 239 269 269 269
44 46 46 70
83 83 86 86 86 87 96 103
103 115 115 129 129
169 189 189 189
40 40 40
49 61 61
63 63 63 74 86 86
95 95 95 95 95
95
115 115 115
3 15 23
32
51 51 51 54 54 54
54 73
74 79 98 98 98
98
113 118 118
5 5 5
11
11 11 14 16 27 27
27 27
27 27 27 27 27
27
27 27 27
-
100
200
300
400
500
600
700
800
1995
1996
1997
1998
1999
2000
2001
2002
2003
2004
2005
2006
2007
2008
2009
2010
2011
2012E
2013E
2014E
2015E
Subse
a T
ree M
anufa
cturing Capaci
ty
FMC Cameron GEOG VetcoGray Aker Solutions Dril-Quip
Methodology. Using a history of the maximum number of deliveries across
different regions over the last 20+ years, we estimated the manufacturing capacity
of each of the major manufacturers in the subsea tree industry. As production and
supply chains are set up geographically, we organized our maximum production
capacity between Middle East/Asia/Australia, Europe/Africa, and North
America/South America.
Constraints on Manufacturing Capacity. We anticipate that nominal
manufacturing capacity relies on roofline, machines, and number of work
shifts. A look at these elements alone likely overstates real production
capacity. Accordingly, we assess recent trends in maximum actual
deliveries as a better reflection of real manufacturing capacity. In our view,
the most significant constraint on real capacity remains engineers to
quarterback projects from design to physical production. Training an
engineer may take 2-5 years, with team/project leaders running on the long
end of the spectrum. Secondly, there are numerous potential constraints in
the supply chain, most notably forging.
Announced Capacity Additions
FMC – Announced adding capacity in both Southeast Asia and Brazil
CAM – Announced a doubling of capacity in Brazil
AKSO – Announced a doubling of its capacity in its Norwegian and
Malaysian facilities by 2014. Adding 200 engineers to their London office.
GEOG VetcoGray – Announced capacity expansion in Southeast Asia
Source: Infield, Guggenheim Securities, LLC
Guggenheim Securities, LLC | 972.638.5500 | guggenheimpartners.com
Market Power Shifting to Subsea Equipment Players - Upgrading FTI to Buy From Neutral PAGE 20

Manufacturing Capacity Utilization Suggests Market Power for Equipment Names
138
173
182
230
298
306
331
336
351
363
384
410
498
515
534
548
558
628
713
718
718
64%
74%
67%
75%
82%
54%
70%
66%58%
44%
70%
63%
77%
66%
55%
43%
47%
74%
70%
75%
85%
-
100
200
300
400
500
600
700
800
0%
10%
20%
30%
40%
50%
60%
70%
80%
90%
100%
1995
1996
1997
1998
1999
2000
2001
2002
2003
2004
2005
2006
2007
2008
2009
2010
2011
2012E
2013E
2014E
2015E
Subse
a T
ree M
anufa
cturin
g C
apacity
Capaci
ty U
tiliz
ation
Subsea Tree Manufacturing Capacity Capacity Utilization
Guggenheim Estimated Subsea Tree Production Capacity
Source: Infield, Guggenheim Securities, LLC
The ramp in estimated
deliveries in 2012 and
beyond looks set to rapidly
increase utilization of
subsea tree manufacturing
capacity across the
industry, despite capacity
expansions for all of the
major equipment providers.
The subsea tree market is
headed back to utilization
levels that heralded high
margins, high assets turns,
and favorable return
structures during that last
cycle.
We see potential for rising utilization to push
toward more standardized tree designs in order to
minimize engineering bottlenecks seen with
specially designed trees.
Guggenheim Securities, LLC | 972.638.5500 | guggenheimpartners.com
Market Power Shifting to Subsea Equipment Players - Upgrading FTI to Buy From Neutral PAGE 21

9 27
4
5
12
2
14
11
3
16
15
16
32
42
24
28
14 6
0 57
86
113 175
115
144
134
131
77 1
58
177 229
184
140
128
112
19 45
33 5
5
57
47
73
77
71
66
96
65
125
112
132
81
136
-
50
100
150
200
250
300
350
400
450
1995
1996
1997
1998
1999
2000
2001
2002
2003
2004
2005
2006
2007
2008
2009
2010
2011
Subse
a T
ree D
eliv
eries
ME/Asia/Australia Europe/Africa NA/LA
5 8 12 5 4 21 2 9 23 1847 53 59
22 38 3388
5858
176
92134135 93
211170119
236231
189167230
110137
139
9831
26
57
8246 81
99
98
67
102
122172171
167
167
205 93
128
0
50
100
150
200
250
300
350
400
450
1995
1996
1997
1998
1999
2000
2001
2002
2003
2004
2005
2006
2007
2008
2009
2010
2011
2012
New
Subse
a T
ree O
rders
ME/Asia/Australia Europe/Africa NA/LA
Deliveries & Manufacturing Capacity by Region
Subsea Tree Production Capacity by Region Subsea Tree Deliveries
Subsea Tree New Orders
More orders from Australia and Asia, as well as more visibility for
drilling activity in the region, has spurred an expansion of
capacity.
Recession and Macondo limited
the growth in activity.
Recession and
Macondo
reduced order
growth.
The visible expansion in activity in the Gulf of Mexico and Brazil
looks set to grow new tree orders from current depressed levels.
A fast ramp in activity in traditional markets, like the North Sea
and West Africa, looks set to increase orders from these basins.
Meanwhile, growth in activity from non-traditional African markets
will lead to growth in the overall market.
Sources: Infield, Guggenheim Securities, LLC
9
27
30
30
38
38
43
43
43
48
49
49
50
59
63
77
77
87
132
137
137
94
94
100
138
187
187
191
191
195
195
195
221
285
285
285
285
285
285
285
285
285
35
52
52 62 7
3
81
97
102
113
120
140
140 163
171
186
186
196
256 296
296
296
-
100
200
300
400
500
600
700
800
1995
1996
1997
1998
1999
2000
2001
2002
2003
2004
2005
2006
2007
2008
2009
2010
2011
2012E
2013E
2014E
2015E
Subse
a T
ree M
anufa
cturing Capaci
ty
ME/Asia/Australia Europe/Africa NA/LA
Guggenheim Securities, LLC | 972.638.5500 | guggenheimpartners.com
Market Power Shifting to Subsea Equipment Players - Upgrading FTI to Buy From Neutral PAGE 22

“Calorie Count” Subsea Backlog Indicates Uptick in Industry Economics
6.46.4
7.2
7.3 7.3
7.9
8.1 8.1
8.2
8.1
6.0
6.5
7.0
7.5
8.0
8.5
1Q10 2Q10 3Q10 4Q10 1Q11 2Q11 3Q11 4Q11 1Q12 2Q12
$/S
ubse
a T
ree
Backlog - $/Subsea Tree
We expect a backlog conversion at not much longer than two
years. Accordingly, we expect the burn off of low Rev/Tree
backlog will yield to higher Rev/Tree backlog, likely leading to
improved Asset Turns and Margins across equipment players.
Note: Average of FTI, CAM, & ASKO backlog figures.
Source: Infield, Guggenheim Securities, LLC
Revenue/Subsea Tree Improving in Industry Backlog ($M)
More revenue per tree in backlog, either
translates to an improvement in mix (more
manifolds or control systems) or better
average pricing since the bottom of the
cycle.
Guggenheim Securities, LLC | 972.638.5500 | guggenheimpartners.com
Market Power Shifting to Subsea Equipment Players - Upgrading FTI to Buy From Neutral PAGE 23

Marking Capacity Constraint and Pricing Power Through New Order Lead Time
300
500
700
900
1,100
1,300
1,500 1
Q0
1
3Q
01
1Q
02
3Q
02
1Q
03
3Q
03
1Q
04
3Q
04
1Q
05
3Q
05
1Q
06
3Q
06
1Q
07
3Q
07
1Q
08
3Q
08
1Q
09
3Q
09
1Q
10
3Q
10
1Q
11
3Q
11
1Q
12
Day
s fr
om
Ne
w O
rde
r to
De
live
ry
Trailing Twelve Month Average New Order Lead Time
Longer lead times from new orders to
delivery marked the tightening of
production capacity and foundation of
pricing power during the last cycle.
New order lead times appear to show
signs of finding a base and moving higher.
We continue to see the expansion of order
lead times as a positive indicator for the
direction of equipment player economics.
As lead times expand, operators
concerned about near-term delivery dates
will either move toward more standardized
tree designs or pay more for specialized
product that requires more engineering.
Industry Lead Times May Show Signs of Lengthening Again
Source: Infield, Guggenheim Securities, LLC
Guggenheim Securities, LLC | 972.638.5500 | guggenheimpartners.com
Market Power Shifting to Subsea Equipment Players - Upgrading FTI to Buy From Neutral PAGE 24

0
200
400
600
800
1,000
1,200
1,400
1,600
1,800
1Q
1999
4Q
1999
3Q
2000
2Q
2001
1Q
2002
4Q
2002
3Q
2003
2Q
2004
1Q
2005
4Q
2005
3Q
2006
2Q
2007
1Q
2008
4Q
2008
3Q
2009
2Q
2010
1Q
2011
4Q
2011
LTM
Rolli
ng A
vera
ge
Days
to D
eliv
er
Cameron Aker Solutions
GEOG VetcoGray FMC
Dril-Quip
Positive Lead Times Trend: Field Complexity & Shift in the Company Pack
0
500
1,000
1,500
2,000
2,500
1Q
02
3Q
02
1Q
03
3Q
03
1Q
04
3Q
04
1Q
05
3Q
05
1Q
06
3Q
06
1Q
07
3Q
07
1Q
08
3Q
08
1Q
09
3Q
09
1Q
10
3Q
10
1Q
11
3Q
11
1Q
12
LTM
Rolli
ng A
vera
ge
Days
to D
eliv
er
SW MW DW
Move to greater field complexity within ultradeepwater, greater
drilling depths, or pre-salt structures will likely lead to greater
need for engineering content.
DRQ is an outlier that will only look to win
small, high margin tree awards.
Lead times across companies appear to
be in the same channel, possibly showing
signs of inflection.
Source: Infield, Guggenheim Securities, LLC
Source: Infield, Guggenheim Securities, LLC
Guggenheim Securities, LLC | 972.638.5500 | guggenheimpartners.com
Market Power Shifting to Subsea Equipment Players - Upgrading FTI to Buy From Neutral PAGE 25

0.8
0.9
1.0
1.1
1.2
1.3
1.4
100
150
200
250
300
350
1Q
06
2Q
06
3Q
06
4Q
06
1Q
07
2Q
07
3Q
07
4Q
07
1Q
08
2Q
08
3Q
08
4Q
08
1Q
09
2Q
09
3Q
09
4Q
09
1Q
10
2Q
10
3Q
10
4Q
10
1Q
11
2Q
11
3Q
11
4Q
11
1Q
12
2Q
12
Ass
et
Turn
s
Rolli
ng N
TM
Subse
a T
ree D
eliv
eries
Rolling NTM Subsea Tree Deliveries Asset Turns
Asset Turns and Deliveries in Aggregate
Note: Average of FTI and CAM
Source: Infield, Guggenheim Securities, LLC
Since companies book revenues on
percentage of completion, a wave of
scheduled deliveries over the next four
quarters implies higher revenues and
asset turns in the coming quarters.
Accordingly, we see potential for asset
turns to recover to heights seen during the
last cycle.
Guggenheim Securities, LLC | 972.638.5500 | guggenheimpartners.com
Market Power Shifting to Subsea Equipment Players - Upgrading FTI to Buy From Neutral PAGE 26

Company Breakdown
Guggenheim Securities, LLC | 972.638.5500 | guggenheimpartners.com
Market Power Shifting to Subsea Equipment Players - Upgrading FTI to Buy From Neutral PAGE 27

Rising Backlog Coverage Has Bullish Implications
0.0
0.5
1.0
1.5
2.0
2.5
3.0
-
100
200
300
400
500
600
FMC Cameron GEOG VetcoGray Aker Solutions
Years o
f Back
log (B
ack
log/A
nnual C
apacity
)
Num
ber
of
Subse
a T
rees
in B
ack
log
-
100
200
300
400
500
600
1Q
05
2Q
05
3Q
05
4Q
05
1Q
06
2Q
06
3Q
06
4Q
06
1Q
07
2Q
07
3Q
07
4Q
07
1Q
08
2Q
08
3Q
08
4Q
08
1Q
09
2Q
09
3Q
09
4Q
09
1Q
10
2Q
10
3Q
10
4Q
10
1Q
11
2Q
11
3Q
11
4Q
11
1Q
12
2Q
12
Num
ber
of
Subse
a T
rees
in B
ack
log
Cameron Aker Solutions GEOG VetcoGray
FMC Dril-Quip
Total Subsea Trees in Backlog Subsea Trees in Backlog Over Time
CAM’s flat backlog likely
illustrates less aggressive
bidding.
FTI and GE appear to have
gained share amid more
competitive pricing.
Source: Infield, Guggenheim Securities, LLC Source: Infield, Guggenheim Securities, LLC
Except for Aker Solutions, each
company has over two years of
backlog relative to current annual
production capacity.
Guggenheim Securities, LLC | 972.638.5500 | guggenheimpartners.com
Market Power Shifting to Subsea Equipment Players - Upgrading FTI to Buy From Neutral PAGE 28

Comparative New Orders
-
50
100
150
200
250
300
1Q
01
3Q
01
1Q
02
3Q
02
1Q
03
3Q
03
1Q
04
3Q
04
1Q
05
3Q
05
1Q
06
3Q
06
1Q
07
3Q
07
1Q
08
3Q
08
1Q
09
3Q
09
1Q
10
3Q
10
1Q
11
3Q
11
1Q
12
3Q
12
Subse
a T
ree N
ew
Ord
ers
Cameron Aker Solutions GEOG VetcoGray FMC Dril-Quip
-
50
100
150
200
250
300
350
400
450
2005 2006 2007 2008 2009 2010 2011
Subse
a T
ree N
ew
Ord
ers
Cameron Aker Solutions GEOG VetcoGray FMC Dril-Quip
FTI and GE appear to have
gained share amid more
competitive pricing.
Bigger mix for CAM in 2008,
likely helped CAM from 2009-
2011.
Both 4Q and 1Q continue to demonstrate seasonally strong
patterns, as operators set budgets and place orders ahead of
newly scheduled projects.
Source: Infield, Guggenheim Securities, LLC Source: Infield, Guggenheim Securities, LLC
Guggenheim Securities, LLC | 972.638.5500 | guggenheimpartners.com
Market Power Shifting to Subsea Equipment Players - Upgrading FTI to Buy From Neutral PAGE 29

Date Operator Value ($m) Field Region Country
Subsea
Trees Delivery Comments Scope of Supply
05-Jul-12 Statoil $200 Gullfaks South Field Europe Norway 7 To commence in 2Q13 7 subsea production trees, 7 wellhead systems, 2
integrated protection structures with manifolds, and
additional controls and equipment
29-Mar-12 Petrobras $1,500 Brazil Pre-Salt L Amer Brazil 130 To commence in 2014 4 year Pre-Salt agreement ~ 130 subsea trees, subsea
multiplex controls and related tools and equipment
29-Mar-12 "initial call-off" (from contract above)
$900 Brazil Pre-Salt L Amer Brazil 78
20-Mar-12 Statoil $70 H-Nord Europe Norway 1 Throughout 2013 1 subsea production tree, 1 manifold, 1 multiphase
meter, an integrated template structure, one umbilical,
two wellheads and additional controls and equipment
10-Jan-12 Anadarko Lucius N Amer GOM 5 To commence in 4Q12 5 subsea production trees and 2 manifolds
09-Jan-12 Woodside $150 Greater Western Flank Phase 1 APAC Australia 6 To commence in 2H12
and continue through
2013
6 subsea production trees, 6 wellheads, 2 manifolds,
subsea and topside controls and flow line connection
systems
12-Dec-11 BP Block 18 Africa Angola 4 To be delivered in 2013 4 subsea trees, control systems, wellheads, tubing
hangers, well jumpers and subsea distribution systems
07-Dec-11 LLOG $40 Who Dat N Amer GOM 7 To commence in 2012 7 subsea production trees and control systems
30-Nov-11 Chevron $325 Wheatstone APAC Australia 11 To commence in 2013 11 subsea production trees, 11 wellheads, 3 manifolds,
subsea and topside controls and well access systems
20-Sep-11 BG Norge $135 Knarr Europe Norway 3 To commence in 2Q13 3 subsea production trees, 3 water injection trees, 6
subsea control modules, 5 wellheads, 2 manifolds and
other related equipment and controls.
27-Jun-11 Shell Prelude APAC Australia 7 7 large bore subsea production trees, production
manifolds, riser bases, subsea control systems and other
related equipment
06-Jun-11 Statoil $50 Visund Europe Norway 2 Commenced in 2Q12
and to continue through
1Q13
2 subsea production trees, 1 manifold and associated
subsea and topside control systems
02-Mar-11 Petrobras $125 L Amer Brazil 32 To commence in 2013 Represents the remaining equipment under a 107-tree
frame agreement that was announced in 2/2010
15-Feb-11 COP $96 3-fields APAC Indonesia 12 Commenced in 2011 3-year frame agreement COP Indonesia to manufacture
and supply of subsea production equipment (immediate
$57m call-off revenue). 12 subsea production trees,
wellheads, control systems and associated offshore
tooling and services.
24-Jan-11 CNOOC $85 Liuhua 4-1 APAC China 8 Commenced in 4Q11 8 subsea trees and tie-back to the existing Liuhua 11-1
field
FTI Recently Announced Subsea Tree Awards (2011-2012)
Source: Company Reports, Guggenheim Securities, LLC
Guggenheim Securities, LLC | 972.638.5500 | guggenheimpartners.com
Market Power Shifting to Subsea Equipment Players - Upgrading FTI to Buy From Neutral PAGE 30
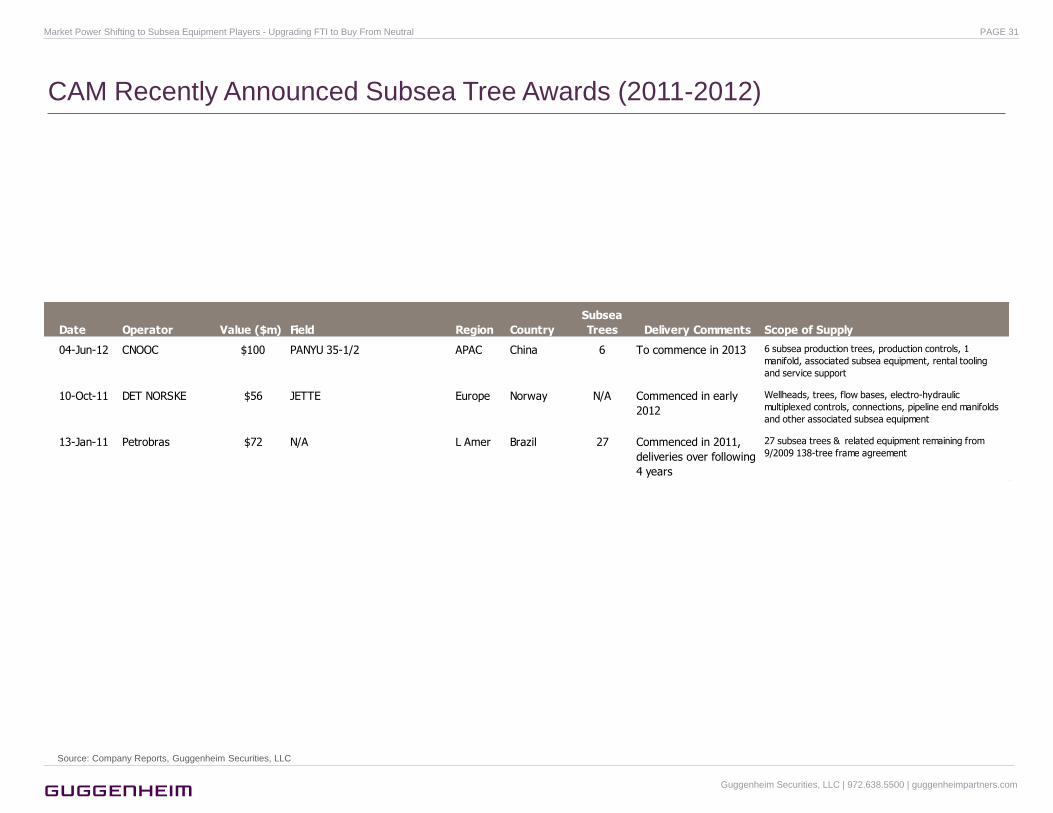
CAM Recently Announced Subsea Tree Awards (2011-2012)
Source: Company Reports, Guggenheim Securities, LLC
Date Operator Value ($m) Field Region Country
Subsea
Trees Delivery Comments Scope of Supply
04-Jun-12 CNOOC $100 PANYU 35-1/2 APAC China 6 To commence in 2013 6 subsea production trees, production controls, 1
manifold, associated subsea equipment, rental tooling
and service support
10-Oct-11 DET NORSKE $56 JETTE Europe Norway N/A Commenced in early
2012
Wellheads, trees, flow bases, electro-hydraulic
multiplexed controls, connections, pipeline end manifolds
and other associated subsea equipment
13-Jan-11 Petrobras $72 N/A L Amer Brazil 27 Commenced in 2011,
deliveries over following
4 years
27 subsea trees & related equipment remaining from
9/2009 138-tree frame agreement
Guggenheim Securities, LLC | 972.638.5500 | guggenheimpartners.com
Market Power Shifting to Subsea Equipment Players - Upgrading FTI to Buy From Neutral PAGE 31

AKSO Recently Announced Subsea Tree Awards (2011-2012)
Date Operator Value ($m) Field Region Country
Subsea
Trees Delivery Comments Scope of Supply
04-May-12 Total NOK 470 Dalia Africa Angola 7 2013-2014 7 production subsea trees, 7 wellhead systems and 7
well jumper systems, and may include some contract
options
02-May-12 Murphy Undisclosed Siakap North APAC Malaysia 13 1Q13 13 subsea trees, eight manifolds, well jumpers,
engineering for topside controls and lifecycle support
services
05-Jan-12 Marathon NOK 210 Boyla Europe Norway 4 1Q13 Engineering, procurement, construction and delivery of
4r subsea trees, 4r over-trawlable subsea structures
and control systems
29-Dec-11 Statoil NOK 400 Svalin Europe Norway 2 Final Deliveries in 3Q13 2 subsea trees, 1 four-slot integrated template structure
with process distribution manifold, subsea and topside
production control systems, wellhead systems and
remote connection systems
24-Nov-11 Statoil NOK 225 Vilje Europe Norway 1 Final Deliveries in 2Q13 1 subsea tree, satellite production flowbase and
protection structure, subsea production control system,
wellhead system, remote connection system and a 150
metre static umbilical. This contract is an extension to
the subsea production system Aker Solutions' delivered
to the Vilje field in 2006.
11-Nov-11 Lundin NOK 700 Brynhild Europe Norway 3 Final Deliveries in 2Q13 1 template-manifold structure, 1 riser base, 3 subsea
trees, 3 wellhead systems, control system, a tie-in
system, 38 kilometres of umbilicals, HP riser and rental
tooling. The contract contains several options for
additional equipment, including other field developments.
11-Aug-11 Murphy Undisclosed Kikeh APAC Malaysia Undisclosed 2013 Iincludes the delivery of deepwater oil production
equipment such as subsea trees, control modules
distribution system and manifolds that will be installed at
a water depth of 1350 meters. Aker Solutions was
responsible for the delivery of the original Kikeh scope
back in 2005. It was the first deepwater development in
Malaysia and the Asia Pacific region.
30-Mar-11 Statoil NOK 1000 Fossekall-Dompap Europe Norway 11 Final Deliveries in 2Q13 3 template-manifold structures, 11 subsea trees, a
control system and a tie-in system. The contract also
contains several options for other field developments on
the Norwegian continental shelf which Statoil may
exercise.
Source: Company Reports, Guggenheim Securities, LLC
Guggenheim Securities, LLC | 972.638.5500 | guggenheimpartners.com
Market Power Shifting to Subsea Equipment Players - Upgrading FTI to Buy From Neutral PAGE 32

Announced Alliances and Frame Agreements (2011-2012)
Source: Company Reports, Guggenheim Securities, LLC
Date Operator Type Region Country Scope of Agreement
FMC Technologies29-Mar-12 Petrobras Contract L Amer Brazil 4-year agreement with Petrobras for the supply of pre-salt subsea equipment. The total award would result in approximately $1.5Bn in
revenue to FTI if all of the subsea equipment included in the agreement is ordered. The initial call-off has an approximate value of $900m
in revenue to FTI and includes 78 subsea trees. FTI's total scope of supply could include the delivery of up to 130 subsea trees, subsea
multiplex controls and related tools and equipment. The tree systems are for use offshore Brazil in water depths up to 8,200 feet. The
equipment will be engineered at FTI's South American Technology Center and manufactured at FTI's subsea facility, both of which are
located in Rio de Janeiro, Brazil. The subsea trees will achieve 70% Brazilian local content and deliveries are scheduled to commence in
2014.
01-Dec-11 Anadarko Global Alliance
Agreement
World-wide To provide subsea systems and life-of-field services for their worldwide subsea development projects. An alliance has been in place with
Anadarko and its legacy companies since 1992 to support their Gulf of Mexico exploration and production projects. The agreement will
allow FTI to broaden its support of Anadarko's expanding E&P activities worldwide, including recent discoveries offshore the East and
West coasts of Africa.
01-Mar-11 British
Petroleum
Global Frame
Agreement
World-wide 5-year global frame agreement with BP to provide subsea production systems and life-of-field services for their worldwide subsea
development projects.
15-Feb-11 ConocoPhillips
Indonesia
Country Frame
Agreement
APAC Indonesia 3-year frame agreement with ConocoPhillips Indonesia Inc. Ltd for the manufacture and supply of subsea production equipment. The
contract includes an immediate $57 million call-off and is expected to result in approximately $96 million in total revenue to FTI if all of the
subsea equipment included in the agreement is ordered. The equipment will support 3 of ConocoPhillips Indonesia's offshore fields, which
are located in approximately 300 feet (90 meters) of water offshore Indonesia in the Natuna Sea. FTI's scope of supply includes the
manufacture of up to 12 subsea production trees, wellheads, control systems and associated offshore tooling and services. The
equipment will be engineered and manufactured at FMC's facilities in Indonesia, Singapore and Malaysia, with deliveries scheduled to
commence in 2011.
21-Dec-10 Shell Enterprise
Framework
Agreement
N Amer &
L Amer
5-year Enterprise Framework Agreement (EFA) with Shell with an option to extend the agreement for an additional 5 years. This
agreement facilitates to international projects the same mutual benefits that Shell and FTI have enjoyed through a strategic GOM
relationship that has existed over the past 17 years. Under the agreement, Shell's business units in the Americas intend to utilize FTI for
all deepwater subsea equipment projects within the scope of the agreement, unless tendering is otherwise required. Specific scope of
supply includes subsea trees, mounted controls, processing equipment, manifolds, sled components, jumpers and various other hydraulic,
chemical, electrical and control systems. This agreement for deepwater subsea equipment is also available for use by other Shell global
business units as may be allowed by local commercial and legal requirements.
Broader FTI Alliance Agreement Partners Include: Shell, BP (split w/CAM), Woodside - 5/2008, BG - 4/2010, Anadarko, Noble (for GOM) - 12/2008, Cobalt - 2/2010, LLOG (for GOM) - 4/2008 and Statoil (split w/AKSO for Norway) - 9/2007
Cameron15-Mar-11 Petrobras MOU L Amer Brazil Future technology cooperation with Petrobras & includes a $30m investment in R&D facilities at two Brazilian locations
01-Mar-11 British
Petroleum
Non-Exclusive
Global Agreement
Worldwide Engineering, Procurement, Construction and Operational Support for Subsea Production Systems. The Global Agreement recognizes that
the alignment of standards, specifications and processes and the introduction of product standardization, will optimize the use of
resources, shorten execution cycles, optimize life cycle cost and deliver superior long term value. The Agreement is aimed at developing a
long-term, collaborative, performance-based relationship between BP and Cameron, maximizing the benefits to be gained of
standardization; recognizing that this is the route to enhance quality, reliability and production availability of subsea systems.
Guggenheim Securities, LLC | 972.638.5500 | guggenheimpartners.com
Market Power Shifting to Subsea Equipment Players - Upgrading FTI to Buy From Neutral PAGE 33

FTI – Upgrading to Buy – Seeking Leverage to Improving Subsea Economics
We are upgrading FTI to Buy from Neutral. We see improving subsea economics
overshadowing North American-related risks to the Surface business. Although risks for
near-term quarters from lower margin subsea backlog remains, we believe the upside from
asset turns from completion of near-term deliveries and incrementally better economics
baked into backlog should outweigh near-term risks that Subsea margins may fall below
2H12 guidance of 12.5-13.5% (pg. 35). Forecasted to expand from ~55% of operating
income, we think the outlook for the continued improvement in the trajectory of Subsea
margins since 4Q11 will remain the key driver for FTI shares. Given operating leverage in
FTI’s business model from outsourcing, we see potential upward revisions to consensus
earnings estimates with growth in the Subsea business. Additionally, we see valuation
multiple expansion for the shares as the combination of growth and a favorable return
structure hits stride. We would take advantage of the current consolidation within FTI shares
as an entry point.
Raising Our Price Target & 2013 Estimate. We are raising our price target to $64 from
$46. Given our more positive outlook, we are raising our 2013E EPS to $2.70 from $2.65.
Subsea Technologies Growth to Take Lead. After gaining 600bps of market share from
2009-2011, a competitive bidding environment and lower margin backlog has forced 2012
Subsea margin guidance down to 11-12%. Improved revenue/tree in backlog and visibility
into accelerating deliveries into 2013 (pg. 35), likely improves revenue, asset turns, and
margins through 2H12. As a result, we are more confident in 2H12 Subsea margin guidance
for an uptick to 12.5-13.5%. As industry manufacturing capacity tightens and lead times
expand, we see room for improved pricing and greater standardization of tree orders, which
may propel subsea economics ahead of our current estimates.
Surface Technologies Remains a Risk, but Reflected in Estimates. Our forecast for a
2H12 decline in North American activity risks 18-20% 2012 margin guidance for the Surface
business and leads our margin numbers lower for 2013, as backlog protection fades.
Exposure to North American surface wellheads, as well as pressure pumping equipment,
rentals, and consumables, lead us to revise our estimates below current guidance (pg. 36).
Although strength in international businesses may offset downside, negative revision risk
likely remains. In our view, upside in the Subsea business will offset this drag.
-
200
400
600
800
1,000
1,200
1,400
1,600
1,800
2,000
1Q
10
2Q
10
3Q
10
4Q
10
1Q
11
2Q
11
3Q
11
4Q
11
1Q
12
2Q
12
3Q
12E
4Q
12E
1Q
13E
2Q
13E
3Q
13E
Segm
ent
Revenue (
$m
)
Subsea Technologies Surface Technologies Energy Infrastructure
15%
25%
35%
45%
55%
1Q
06
3Q
06
1Q
07
3Q
07
1Q
08
3Q
08
1Q
09
3Q
09
1Q
10
3Q
10
1Q
11
3Q
11
1Q
12
3Q
12E
1Q
13E
3Q
13E
1Q
14E
3Q
14E
1Q
15E
3Q
15E
Retu
rn o
n E
quity(A
nnualz
ed Q
uart
ers
)
Source: Company Reports, Guggenheim Securities, LLC
Source: Company Reports, Guggenheim Securities, LLC
FTI Annualized Return on Equity
FTI Segment Revenue Breakdown
Source: FactSet, Guggenheim Securities, LLC
Company Category 2008 2009 2010 2011 2012E 2013E 1Q12 2Q12 3Q12E 4Q12E 1Q13E 2Q13E 3Q13E 4Q13E
FMC Technologies EPS 2.94 2.93 3.06 1.64 2.00 2.70 0.41 0.43 0.56 0.60 0.63 0.65 0.67 0.74
Previous EPS 2.00 2.65 0.56 0.60 0.63 0.64 0.66 0.72
Consensus EPS 2.09 2.61 0.57 0.64 0.56 0.61 0.67 0.73
Consensus EPS-High 2.16 2.90 0.60 0.71 0.63 0.66 0.73 0.87
Consensus EPS-Low 2.00 2.00 0.54 0.57 0.52 0.50 0.49 0.49
Guggenheim Securities, LLC | 972.638.5500 | guggenheimpartners.com
Market Power Shifting to Subsea Equipment Players - Upgrading FTI to Buy From Neutral PAGE 34

5.1
5.2
6.8
7.8
7.7
8.3
8.1
8.6
8.8
8.1
0
1,000
2,000
3,000
4,000
5,000
6,000
7,000
1Q
10
2Q
10
3Q
10
4Q
10
1Q
11
2Q
11
3Q
11
4Q
11
1Q
12
2Q
12
3Q
12E
4Q
12E
1Q
13E
2Q
13E
3Q
13E
4Q
13E
4
5
6
7
8
9
10
Revenue (
$m
)
Backlo
g $
/Subse
a T
ree
Subsea Backlog Subsea Backlog ($/tree)
Key Drivers of FMC Technologies Economics Paint Bullish Picture
18.4
%
16.6
%
14.2
%
12.3
%
10.2
%
10.5
%
11.5
%
7.2
%
8.4
%
10.2
%
12.8
%
13.3
%
13.5
%
13.7
%
13.9
%
14.1
%
500
600
700
800
900
1,000
1,100
1,200
1,300
1,400
1,500
1Q
10
2Q
10
3Q
10
4Q
10
1Q
11
2Q
11
3Q
11
4Q
11
1Q
12
2Q
12
3Q
12E
4Q
12E
1Q
13E
2Q
13E
3Q
13E
4Q
13E
6%
8%
10%
12%
14%
16%
18%
20%
Revenue (
$m
) EBIT
Marg
in
Subsea Tech. Revenue Subsea Tech. EBIT %
6%
8%
10%
12%
14%
16%
18%
20%
1.0
1.1
1.1
1.2
1.2
1.3
1.3
1.4
1.4
1.5
1Q10 2Q10 3Q10 4Q10 1Q11 2Q11 3Q11 4Q11 1Q12 2Q12
EBIT
Marg
ins
Asset Turn
s
Asset Turns EBIT Margins Subsea EBIT Margin
-
20
40
60
80
100
120
140
160
180
200
1.00
1.10
1.20
1.30
1.40
1.50
1.60
1.70
1.80
1Q
06
2Q
06
3Q
06
4Q
06
1Q
07
2Q
07
3Q
07
4Q
07
1Q
08
2Q
08
3Q
08
4Q
08
1Q
09
2Q
09
3Q
09
4Q
09
1Q
10
2Q
10
3Q
10
4Q
10
1Q
11
2Q
11
3Q
11
4Q
11
1Q
12
2Q
12
Rollin
g N
TM
Subsea T
ree D
eliv
erie
s
Asset Turn
s
Asset Turns Rolling NTM Subsea Tree Deliveries
FTI Subsea margins on an
inflection pattern
Visible near-term deliveries
look set to increase revenues
and asset turns.
Both the backlog and revenue/tree track
well, indicating Subsea economics set to
improve in coming quarters.
We forecast revenue growth, but future EBIT
margins may prove conservative relative to prior
cycles, especially if our bullish outlook for the
industry materializes.
Source: Company Reports, Guggenheim Securities, LLC Source: Infield, Company Reports, Guggenheim Securities, LLC
Source: Company Reports, Guggenheim Securities, LLC Source: Infield, Company Reports, Guggenheim Securities, LLC
FTI Asset Turns & Operating Margin History FTI Asset Turns vs. NTM Subsea Tree Deliveries
FTI Subsea Revenue vs. EBIT Margin FTI Subsea Revenue vs. Backlog ($/Subsea Tree)
Guggenheim Securities, LLC | 972.638.5500 | guggenheimpartners.com
Market Power Shifting to Subsea Equipment Players - Upgrading FTI to Buy From Neutral PAGE 35

North American Levered Surface Business May Lag, but Factored in Estimates
19.1
%
17.6
% 18.4
%
17.5
%
17.6
%
18.2
%
19.6
% 20.4
%
20.6
%
20.3
%
19.0
%
17.5
%
16.0
%
16.0
%
16.0
%
16.0
%
15%
16%
17%
18%
19%
20%
21%
22%
1Q
10
2Q
10
3Q
10
4Q
10
1Q
11
2Q
11
3Q
11
4Q
11
1Q
12
2Q
12
3Q
12E
4Q
12E
1Q
13E
2Q
13E
3Q
13E
4Q
13E
0
50
100
150
200
250
300
350
400
450
EBIT
Marg
inRevenue (
$m
)
Surface Tech. Revenue Surface Tech. EBIT %
218
225 243 2
71 291 310 3
36
374
378
414
401
381
389
397
405
413
150
200
250
300
350
400
450
1Q
10
2Q
10
3Q
10
4Q
10
1Q
11
2Q
11
3Q
11
4Q
11
1Q
12
2Q
12
3Q
12E
4Q
12E
1Q
13E
2Q
13E
3Q
13E
4Q
13E
800
1,000
1,200
1,400
1,600
1,800
2,000
Revenue $
(m)
US L
and R
ig C
ount
Total US Land Rig Count Surface Tech. Revenue
249
256
236
316
275
452
358
404
425
366
355
337
344
351
358 385
0
100
200
300
400
500
600
700
1Q
10
2Q
10
3Q
10
4Q
10
1Q
11
2Q
11
3Q
11
4Q
11
1Q
12
2Q
12
3Q
12E
4Q
12E
1Q
13E
2Q
13E
3Q
13E
4Q
13E
200
250
300
350
400
450
500
Surf
ace B
acklo
g (
$m
)
Surfa
ce In
bound O
rders
($m
)
Surface Backlog Surface Inbound Orders
Source: Company Reports, Guggenheim Securities, LLC
Source: Company Reports, Guggenheim Securities, LLC
Source: Company Reports, Guggenheim Securities, LLC
FTI Surface Tech. Revenues vs. EBIT Margin FTI Surface Tech. Backlog vs. Inbound Orders
FTI Surface Tech. Revenues vs. U.S. Land Rig Count
Guggenheim Securities, LLC | 972.638.5500 | guggenheimpartners.com
Market Power Shifting to Subsea Equipment Players - Upgrading FTI to Buy From Neutral PAGE 36

FMC Technologies Summary Financials
Source: Company Reports, Guggenheim Securities, LLC
x x cIncome Statement 2011 2012E 2013E 2014E 1Q12 2Q12 3Q12E 4Q12E 1Q13E 2Q13E 3Q13E 4Q13E
Subsea Technologies 3,288.1 4,013.8 5,197.2 6,381.0 894.9 945.8 1,028.2 1,144.9 1,251.0 1,266.1 1,277.4 1,402.8
Surface Technologies 1,310.8 1,574.3 1,603.1 1,735.2 377.8 413.8 401.4 381.3 388.9 396.7 404.7 412.7
Energy Infrastructure 503.4 576.5 630.3 655.9 137.0 139.4 146.4 153.7 155.2 156.8 158.3 159.9
Intercompany eliminations (3.3) (25.4) (16.4) (16.4) (13.1) (4.1) (4.1) (4.1) (4.1) (4.1) (4.1) (4.1)
Total Revenues 5,099.0 6,139.2 7,414.2 8,755.7 1,396.6 1,494.9 1,571.8 1,675.9 1,791.0 1,815.5 1,836.3 1,971.3
Subsea Technologies 319.9 454.4 715.1 937.0 75.1 96.5 131.1 151.7 168.3 172.8 176.9 197.1
Surface Technologies 250.1 305.2 256.5 277.6 78.0 84.2 76.3 66.7 62.2 63.5 64.7 66.0
Energy Infrastructure 49.3 46.9 59.9 62.3 9.3 9.1 13.2 15.4 14.7 14.9 15.0 15.2
Corporate expense (39.4) (42.4) (53.8) (63.5) (8.5) (10.4) (11.3) (12.1) (13.0) (13.2) (13.3) (14.3)
Total EBIT 579.9 764.2 977.7 1,213.5 153.9 179.4 209.2 221.7 232.2 238.0 243.4 264.0
Interest income - 2.2 5.2 5.9 - - 1.0 1.1 1.2 1.1 1.3 1.6
Interest (expense) (8.2) (30.9) (42.0) (42.0) (3.5) (6.4) (10.5) (10.5) (10.5) (10.5) (10.5) (10.5)
Other (expense) (12.3) (77.4) (58.0) (58.0) (20.0) (28.4) (14.5) (14.5) (14.5) (14.5) (14.5) (14.5)
EBT 559.4 658.0 882.9 1,119.4 130.4 144.6 185.2 197.8 208.4 214.1 219.7 240.6
Income Tax (159.6) (170.3) (234.1) (305.7) (30.7) (40.0) (48.2) (51.4) (54.6) (56.5) (58.4) (64.5)
Minority interest (1.1) (4.8) (5.2) (5.2) (0.9) (1.3) (1.3) (1.3) (1.3) (1.3) (1.3) (1.3)
Net Income (Operating) 398.7 483.0 643.7 808.5 98.8 103.3 135.8 145.1 152.5 156.3 160.0 174.8
Other 1.9 8.6 - - - 8.6 - - - - - -
Net Income (GAAP) 400.6 491.5 643.7 808.5 98.8 111.9 135.8 145.1 152.5 156.3 160.0 174.8
EPS (GAAP)) 1.65 2.04 2.70 3.49 0.41 0.46 0.56 0.60 0.63 0.65 0.67 0.74
EPS (Operating) 1.64 2.00 2.70 3.49 0.41 0.43 0.56 0.60 0.63 0.65 0.67 0.74
Basic Shares Outstanding 241.2 240.2 237.3 230.3 240.1 240.2 240.2 240.2 239.0 237.9 236.7 235.6
Diluted Shares Outstanding 243.2 241.5 238.6 231.6 241.3 241.5 241.5 241.5 240.3 239.2 238.0 236.9
Dividend per Share - - - - - - - - - - - -
Diluted CEPS (Operating) 1.99 2.50 3.34 4.23 0.51 0.54 0.70 0.75 0.79 0.81 0.83 0.91
EBITDA 687.7 904.3 1,140.5 1,393.7 184.0 214.8 245.9 259.6 271.3 278.2 284.6 306.4
Depreciation & Amortization 107.8 140.1 162.8 180.2 30.1 35.4 36.6 38.0 39.0 40.1 41.2 42.4
Cash Flow Statement
CFO 164.8 95.7 577.5 717.0 1.7 (111.2) 104.8 100.4 99.9 181.0 188.7 108.0
CAPEX (274.0) (353.5) (296.6) (306.4) (92.0) (99.1) (78.6) (83.8) (71.6) (72.6) (73.5) (78.9)
Free Cash Flow (FCF) (109.2) (257.7) 281.0 410.6 (90.3) (210.3) 26.2 16.6 28.2 108.3 115.3 29.1
Acquisitions/Divestures/Inv. 0.3 (327.2) - - 1.0 (328.2) - - - - - -
Financing 150.0 574.8 (200.0) (400.0) 117.5 457.3 - - (50.0) (50.0) (50.0) (50.0)
Other (12.6) (15.7) - - (10.6) (5.1) - - - - - -
Increase (Decrease) in Cash 28.5 (25.8) 81.0 10.6 17.6 (86.3) 26.2 16.6 (21.8) 58.3 65.3 (20.9)
Key Balance Sheet Statistics
Total Capital 2,340.2 3,272.5 3,716.2 4,124.7 2,300.6 2,815.6 2,951.4 3,096.4 3,199.0 3,305.3 3,415.3 3,540.1
Total Debt 623.6 1,216.2 1,216.2 1,216.2 741.7 1,216.2 1,216.2 1,216.2 1,216.2 1,216.2 1,216.2 1,216.2
Net Debt 279.6 898.0 817.1 806.5 380.1 940.9 914.7 898.0 919.8 861.5 796.2 817.1
Debt/Total Capital 26.6% 37.2% 32.7% 29.5% 32.2% 43.2% 41.2% 39.3% 38.0% 36.8% 35.6% 34.4%
Net Debt/Capital 11.9% 27.4% 22.0% 19.6% 16.5% 33.4% 31.0% 29.0% 28.8% 26.1% 23.3% 23.1%
EBITDA/Interest 83.9X 29.3X 27.2X 33.2X 52.6X 33.6X 23.4X 24.7X 25.9X 26.5X 27.1X 29.2X
BVPS 5.86 7.79 9.74 11.80 6.46 6.62 7.19 7.79 8.25 8.73 9.24 9.81
Guggenheim Securities, LLC | 972.638.5500 | guggenheimpartners.com
Market Power Shifting to Subsea Equipment Players - Upgrading FTI to Buy From Neutral PAGE 37

Appendix: Company Subsea Data
Guggenheim Securities, LLC | 972.638.5500 | guggenheimpartners.com
Market Power Shifting to Subsea Equipment Players - Upgrading FTI to Buy From Neutral PAGE 38

Key Statistics: FMC Technologies
140
190
240
290
340
390
440
490
540
590
1Q
05
2Q
05
3Q
05
4Q
05
1Q
06
2Q
06
3Q
06
4Q
06
1Q
07
2Q
07
3Q
07
4Q
07
1Q
08
2Q
08
3Q
08
4Q
08
1Q
09
2Q
09
3Q
09
4Q
09
1Q
10
2Q
10
3Q
10
4Q
10
1Q
11
2Q
11
3Q
11
4Q
11
1Q
12
2Q
12
Subsea T
rees
in B
acklo
g
5.1 5.2
6.8
7.8
7.7
8.3
8.1
8.6 8.8
8.1
4
5
6
7
8
9
10
1Q
10
2Q
10
3Q
10
4Q
10
1Q
11
2Q
11
3Q
11
4Q
11
1Q
12
2Q
12
Backlo
g -
$/S
ubsea T
ree (
$m
)
0
10
20
30
40
50
60
70
80
90
100
1Q
05
2Q
05
3Q
05
4Q
05
1Q
06
2Q
06
3Q
06
4Q
06
1Q
07
2Q
07
3Q
07
4Q
07
1Q
08
2Q
08
3Q
08
4Q
08
1Q
09
2Q
09
3Q
09
4Q
09
1Q
10
2Q
10
3Q
10
4Q
10
1Q
11
2Q
11
3Q
11
4Q
11
1Q
12
2Q
12
Subsea T
rees
Ord
ere
d
-
20
40
60
80
100
120
140
160
180
200
1.00
1.10
1.20
1.30
1.40
1.50
1.60
1.70
1.80
1Q
06
2Q
06
3Q
06
4Q
06
1Q
07
2Q
07
3Q
07
4Q
07
1Q
08
2Q
08
3Q
08
4Q
08
1Q
09
2Q
09
3Q
09
4Q
09
1Q
10
2Q
10
3Q
10
4Q
10
1Q
11
2Q
11
3Q
11
4Q
11
1Q
12
2Q
12
Rollin
g N
TM
Subsea T
ree D
eliv
erie
s
Asset Turn
s
Asset Turns Rolling NTM Subsea Tree Deliveries
FTI Backlog FTI Backlog Calorie Count - $/Subsea Tree ($m)
FTI Subsea Tree Orders FTI Asset Turns vs. Rolling NTM Tree Deliveries
Source: Infield, Guggenheim Securities, LLC
Source: Company Reports, Infield, Guggenheim Securities, LLC Source: Company Reports, Guggenheim Securities, LLC
Source: Company Reports, Infield, Guggenheim Securities, LLC
Guggenheim Securities, LLC | 972.638.5500 | guggenheimpartners.com
Market Power Shifting to Subsea Equipment Players - Upgrading FTI to Buy From Neutral PAGE 39

Africa, 73
Asia, 48
Australasia, 29
Europe, 78
Latin America,
205
Middle East & Caspian
Sea, 0 North America, 70
FTI Backlog Breakdown – 503 Subsea Trees Currently Ordered but Undelivered
Other, 89
Petrobras, 199
Shell, 63
Total, 56
BP, 21
Statoil, 20
ConocoPhillips, 17
ExxonMobil, 16
Anadarko, 11 Chevron,
11
Woodside, 11
EnQuest, 10
Current FTI Backlog by Operator Current FTI Backlog by Region
Source: Infield, Guggenheim Securities, LLC Source: Infield, Guggenheim Securities, LLC
Guggenheim Securities, LLC | 972.638.5500 | guggenheimpartners.com
Market Power Shifting to Subsea Equipment Players - Upgrading FTI to Buy From Neutral PAGE 40

Key Statistics: Cameron
140
190
240
290
340
390
440
1Q
05
2Q
05
3Q
05
4Q
05
1Q
06
2Q
06
3Q
06
4Q
06
1Q
07
2Q
07
3Q
07
4Q
07
1Q
08
2Q
08
3Q
08
4Q
08
1Q
09
2Q
09
3Q
09
4Q
09
1Q
10
2Q
10
3Q
10
4Q
10
1Q
11
2Q
11
3Q
11
4Q
11
1Q
12
2Q
12
Subsea T
rees
in B
acklo
g
3.8 4.0
4.8
5.6
6.8
6.7
7.9
7.8
7.6 7.7
6.5 6.8
6.6
6.3
6.2
5.5
5.3
5.0 5
.4
4.8
5.3
6.0
0
1
2
3
4
5
6
7
8
9
1Q
07
2Q
07
3Q
07
4Q
07
1Q
08
2Q
08
3Q
08
4Q
08
1Q
09
2Q
09
3Q
09
4Q
09
1Q
10
2Q
10
3Q
10
4Q
10
1Q
11
2Q
11
3Q
11
4Q
11
1Q
12
2Q
12
Backlo
g -
$/S
ubsea T
ree (
$m
)
0
20
40
60
80
100
120
1Q
05
2Q
05
3Q
05
4Q
05
1Q
06
2Q
06
3Q
06
4Q
06
1Q
07
2Q
07
3Q
07
4Q
07
1Q
08
2Q
08
3Q
08
4Q
08
1Q
09
2Q
09
3Q
09
4Q
09
1Q
10
2Q
10
3Q
10
4Q
10
1Q
11
2Q
11
3Q
11
4Q
11
1Q
12
2Q
12
Subsea T
rees
Ord
ere
d
0
20
40
60
80
100
120
140
160
180
200
0.7
0.8
0.9
1.0
1.1
1.2
1Q
06
2Q
06
3Q
06
4Q
06
1Q
07
2Q
07
3Q
07
4Q
07
1Q
08
2Q
08
3Q
08
4Q
08
1Q
09
2Q
09
3Q
09
4Q
09
1Q
10
2Q
10
3Q
10
4Q
10
1Q
11
2Q
11
3Q
11
4Q
11
1Q
12
2Q
12
Rollin
g N
TM
Subsea T
ree D
eliv
erie
s
Asset Turn
s
Asset Turns Leading 4Q Deliveries
CAM Backlog CAM Backlog Calorie Count - $/Subsea Tree ($m)
CAM Subsea Tree Orders CAM Asset Turns vs. Rolling NTM Tree Deliveries
Source: Infield, Guggenheim Securities, LLC
Source: Company Reports, Infield, Guggenheim Securities, LLC Source: Company Reports, Guggenheim Securities, LLC
Source: Company Reports, Infield, Guggenheim Securities, LLC
Guggenheim Securities, LLC | 972.638.5500 | guggenheimpartners.com
Market Power Shifting to Subsea Equipment Players - Upgrading FTI to Buy From Neutral PAGE 41

Africa, 60
Asia, 27
Australasia, 11
Europe, 13
Latin America,
157
Middle East &
Caspian Sea, 11
North America,
28
CAM Backlog Breakdown – 307 Subsea Trees Currently Ordered but Undelivered
Other, 39
Petrobras, 147 Total,
27
Husky, 21
BHP Billiton,
15
BG Group EGPC
Petronas, 12
BP, 12
Chevron, 12
Noble, 12 PDVSA,
10
CNOOC, 6
Current CAM Backlog by Operator Current CAM Backlog by Region
Source: Infield, Guggenheim Securities, LLC Source: Infield, Guggenheim Securities, LLC
Guggenheim Securities, LLC | 972.638.5500 | guggenheimpartners.com
Market Power Shifting to Subsea Equipment Players - Upgrading FTI to Buy From Neutral PAGE 42

Key Statistics: Aker Solutions
100
110
120
130
140
150
160
170
180
190
1Q
05
2Q
05
3Q
05
4Q
05
1Q
06
2Q
06
3Q
06
4Q
06
1Q
07
2Q
07
3Q
07
4Q
07
1Q
08
2Q
08
3Q
08
4Q
08
1Q
09
2Q
09
3Q
09
4Q
09
1Q
10
2Q
10
3Q
10
4Q
10
1Q
11
2Q
11
3Q
11
4Q
11
1Q
12
2Q
12
Subsea T
rees
in B
acklo
g
10.3
9.9
10.8
11.2
11.5
14.6
16.1
15.3
13.9
12.7
4
6
8
10
12
14
16
18
1Q
10
2Q
10
3Q
10
4Q
10
1Q
11
2Q
11
3Q
11
4Q
11
1Q
12
2Q
12
Backlo
g -
$/S
ubsea T
ree (
$m
)
0
5
10
15
20
25
30
35
40
45
1Q
05
2Q
05
3Q
05
4Q
05
1Q
06
2Q
06
3Q
06
4Q
06
1Q
07
2Q
07
3Q
07
4Q
07
1Q
08
2Q
08
3Q
08
4Q
08
1Q
09
2Q
09
3Q
09
4Q
09
1Q
10
2Q
10
3Q
10
4Q
10
1Q
11
2Q
11
3Q
11
4Q
11
1Q
12
2Q
12
Subsea T
rees
Ord
ere
d
25
30
35
40
0.30
0.35
0.40
0.45
0.50
0.55
0.60
0.65
0.70
0.75
0.80
1Q10 2Q10 3Q10 4Q10 1Q11 2Q11 3Q11 4Q11 1Q12 2Q12
Rollin
g N
TM
Subsea T
ree D
eliv
erie
s
Asset Turn
s
Asset Turns Rolling NTM Subsea Tree Deliveries
AKSO Backlog AKSO Backlog Calorie Count - $/Subsea Tree ($m)
AKSO Subsea Tree Orders AKSO Asset Turns vs. Rolling NTM Tree Deliveries
Source: Infield, Guggenheim Securities, LLC
Source: Company Reports, Infield, Guggenheim Securities, LLC
Note: Assumed 5.8 NOK /USD exchange rate
Source: Company Reports, Guggenheim Securities, LLC
Source: Company Reports, Infield, Guggenheim Securities, LLC
Guggenheim Securities, LLC | 972.638.5500 | guggenheimpartners.com
Market Power Shifting to Subsea Equipment Players - Upgrading FTI to Buy From Neutral PAGE 43

Africa, 10
Asia, 19Australa
sia, 0
Europe, 66
Latin America,
43
Middle East &
Caspian Sea, 0
North America, 2
AKSO Backlog Breakdown – 140 Subsea Trees Currently Ordered but Undelivered
Other, -
Petrobras, 43
Statoil, 29 Eni, 24
Murphy, 18
Marathon, 9
Total, 7
Lundin, 4 Chinook Energy,
3
CNOOC, 3
Current AKSO Backlog by Operator Current AKSO Backlog by Region
Source: Infield, Guggenheim Securities, LLC Source: Infield, Guggenheim Securities, LLC
Guggenheim Securities, LLC | 972.638.5500 | guggenheimpartners.com
Market Power Shifting to Subsea Equipment Players - Upgrading FTI to Buy From Neutral PAGE 44

Earnings Valuations & Consensus Variances
Price Gugg EPS PE Consensus EPS EPS Variance
Company Ticker Rating 9/19 Target Upside P/NAV* 3Q12E 11 12E 13E 11 12E 13E 3Q12E 12E 13E 3Q12E 12E 13E
S&P 500 SPX 1,461 14.2 12.7 103.11 115.12
Exploration & Production
Apache APA Buy 89.21 115 29% 71% 2.33 12.00 9.90 10.36 7.4 9.0 8.6 2.23 9.88 10.58 5% 0% -2%
Anadarko APC Buy 72.55 100 38% 59% 0.82 3.37 3.07 4.49 21.5 23.6 16.2 0.73 3.43 4.34 12% -10% 4%
Devon DVN Buy 60.96 83 36% 63% 0.81 6.14 3.36 5.38 9.9 18.1 11.3 0.72 3.31 4.63 12% 2% 16%
EOG EOG Neutral 113.57 104 -8% 102% 1.06 3.77 4.70 6.54 30.1 24.2 17.4 1.00 4.56 5.29 6% 3% 24%
Noble NBL Buy 93.38 118 26% 65% 1.07 5.29 4.98 7.73 17.7 18.8 12.1 1.08 4.91 6.48 -1% 1% 19%
Pioneer PXD Neutral 107.14 94 -12% 116% 0.94 4.04 3.95 5.85 26.5 27.1 18.3 0.94 4.11 5.60 0% -4% 5%
Mean 79% 18.9 20.1 14.0
Large Cap Services
Baker Hughes BHI Neutral 48.11 48 0% NA 0.80 4.20 3.53 3.25 11.5 13.6 14.8 0.88 3.71 4.29 -9% -5% -24%
Halliburton HAL Neutral 36.41 35 -4% NA 0.74 3.35 3.20 2.80 10.9 11.4 13.0 0.70 3.16 3.49 5% 1% -20%
Schlumberger SLB Buy 74.71 80 7% NA 1.08 3.63 4.21 4.65 20.6 17.7 16.1 1.09 4.29 5.11 -1% -2% -9%
Weatherford WFT Neutral 13.20 13 -2% NA 0.26 0.73 1.05 1.15 18.1 12.6 11.5 0.28 1.07 1.47 -6% -2% -22%. 11.91 11.99 11.85 12.24 14.35
Mean 15.2 13.8 13.8
Equipment / Manufacturing
Aker Solutions AKSO Buy kr 108.60 kr 135 24% NA kr 1.96 kr 3.74 kr 7.84 kr 10.00 29.0 13.9 10.9 kr 1.92 kr 7.94 kr 10.40 2% -1% -4%
Cameron CAM Buy 57.65 67 16% NA 0.86 2.09 3.27 4.25 27.6 17.6 13.6 0.88 3.23 4.35 -2% 1% -2%
Dril-Quip DRQ Neutral 72.55 68 -6% NA 0.74 2.36 2.95 3.70 30.7 24.6 19.6 0.74 2.96 3.81 0% 0% -3%
FMC Tech FTI Buy 48.41 64 32% NA 0.56 1.65 2.00 2.70 29.3 24.2 17.9 0.57 2.09 2.61 -2% -4% 3%
Nat Oil Varco NOV Buy 82.03 96 17% NA 1.39 4.77 5.70 6.35 17.2 14.4 12.9 1.51 5.97 6.84 -8% -4% -7%
Oceaneering OII Buy 55.85 68 22% NA 0.79 2.16 2.64 3.25 25.9 21.2 17.2 0.78 2.65 3.22 1% 0% 1%
Tenaris TS Buy 42.73 50 17% NA 0.75 2.26 3.20 4.05 18.9 13.4 10.6 0.78 3.06 3.46 -4% 5% 17%98% 15.29 19.76 24.30 19.94 24.29
Mean 25.5 18.5 14.7
Offshore Drilling
Atwood Oceanics* ATW Neutral 46.68 44 -6% 111% 1.26 4.16 3.95 5.05 11.2 11.8 9.2 1.20 3.90 5.08 5% 1% -1%
Diamond DO Neutral 67.37 77 14% 105% 0.85 6.92 4.11 5.24 9.7 16.4 12.9 0.99 4.46 5.33 -14% -8% -2%
Ensco plc ESV Buy 58.10 68 17% 98% 1.30 3.15 5.20 7.30 18.4 11.2 8.0 1.30 5.27 7.06 0% -1% 3%
Noble Corp NE Buy 37.94 48 27% 97% 0.61 1.31 2.63 4.45 29.0 14.4 8.5 0.55 2.52 4.54 11% 4% -2%
Pacific Drilling PACD Buy 10.28 11 7% 86% (0.01) (0.01) 0.11 0.50 -- 93.5 20.6 0.00 0.20 0.46 -391% -44% 8%
Rowan RDC Neutral 35.97 34 -5% 100% 0.51 1.21 2.13 3.60 29.7 16.9 10.0 0.52 2.10 3.53 -2% 1% 2%
Seadrill SDRL Buy 39.62 49 24% 198% 0.70 2.54 2.87 3.33 15.6 13.8 11.9 0.71 3.09 3.51 -2% -7% -5%
Transocean RIG Neutral 45.27 50 10% 89% 0.80 1.51 2.77 4.29 30.0 16.3 10.6 0.77 2.99 4.58 4% -7% -6%
Mean 111% 20.5 24.3 11.4
Land Drilling
Helm & Payne* HP Neutral 49.09 49 0% NA 1.24 3.96 5.03 3.85 12.4 9.8 12.8 1.24 5.05 4.69 0% 0% -18%
Nabors NBR Neutral 15.65 15 -4% NA 0.38 1.50 1.78 1.15 10.4 8.8 13.6 0.40 1.85 1.81 -6% -4% -36%
Patterson UTI PTEN Neutral 17.06 16 -6% NA 0.37 2.14 1.75 0.65 8.0 9.7 26.2 0.40 1.85 1.36 -7% -5% -52%
Mean 10.3 9.4 17.5
*Quarterly EPS figures for ATW and HP reflect calendar year reporting basis. NAV figures for Offshore Drilling companies are Break-Up NAVs.
Source: FactSet, Company Reports, Guggenheim Securities, LLC
Guggenheim Securities, LLC | 972.638.5500 | guggenheimpartners.com
Market Power Shifting to Subsea Equipment Players - Upgrading FTI to Buy From Neutral PAGE 45

EBITDA & Cash Flow Valuation
Price Mkt Net Dt 2012E FCF Gugg EBITDA EV / EBITDA Gugg CFPS P / CFPS
Company 9/19 Cap Cap FCFPS Yield 11 12E 13E 11 12E 13E 11 12E 13E 11 12E 13E
S&P 500 1,461 8.5 7.9 18.3 15.5
Exploration & Production
Apache 89.21 34,901 23% 0.21 0.2% 12,551 13,396 14,507 3.6 3.3 3.1 24.97 27.53 32.50 3.6 3.2 2.7
Anadarko 72.55 36,252 35% 2.51 3.5% 7,628 7,458 9,531 6.3 6.5 5.1 5.01 15.97 16.60 14.5 4.5 4.4
Devon 60.96 24,658 15% (2.48) -4.1% 6,138 5,452 6,856 4.8 5.3 4.3 14.94 13.08 15.38 4.1 4.7 4.0
EOG 113.57 30,666 26% (8.48) -7.5% 4,619 5,668 6,513 7.7 6.2 5.4 17.14 19.30 22.13 6.6 5.9 5.1
Noble 93.38 16,808 25% (5.95) -6.4% 2,326 2,835 3,568 8.7 7.1 5.7 12.15 13.50 16.93 7.7 6.9 5.5
Pioneer 107.14 13,183 27% (9.59) -9.0% 1,614 1,670 2,385 10.0 9.7 6.8 12.96 15.23 17.14 8.3 7.0 6.3
Mean -3.9% 6.8 6.4 5.0 7.5 5.4 4.7
Large Cap Services
Baker Hughes 48.11 21,147 18% (3.19) -6.6% 4,306 4,104 4,245 5.8 6.1 5.9 7.22 7.10 7.44 6.7 6.8 6.5
Halliburton 36.41 33,779 11% (0.75) -2.1% 6,214 6,398 6,042 5.8 5.6 5.9 4.83 5.00 4.97 7.5 7.3 7.3
Schlumberger 74.71 99,142 14% (0.09) -0.1% 10,098 11,211 12,107 10.4 9.4 8.7 6.04 6.77 7.22 12.4 11.0 10.3
Weatherford 13.20 10,027 44% (1.29) -9.8% 2,621 3,089 3,393 7.0 5.9 5.4 2.22 2.67 2.93 5.9 4.9 4.5
Mean -4.6% 7.2 6.7 6.5 8.1 7.5 7.2
Equipment / Manufacturing
Aker Solutions kr 108.60 kr 29,756 37% (4.20) -3.9% kr 2,688 kr 4,633 kr 5,713 13.6 7.9 6.4 kr 6.99 kr 12.16 kr 15.14 15.5 8.9 7.2
Cameron 57.65 14,198 11% (0.99) -1.7% 1,139 1,371 1,690 13.2 10.9 8.9 3.53 4.26 5.35 16.3 13.5 10.8
Dril-Quip 72.55 2,932 -25% (0.07) -0.1% 157 191 234 17.1 14.0 11.5 3.01 3.59 4.35 24.1 20.2 16.7
FMC Tech 48.41 11,715 33% (1.07) -2.2% 688 904 1,140 18.4 14.0 11.1 2.00 2.50 3.34 24.2 19.3 14.5
Nat Oil Varco 82.03 34,979 -19% 1.36 1.7% 3,533 4,200 4,698 9.1 7.6 6.8 6.08 7.14 7.93 13.5 11.5 10.3
Oceaneering 55.85 6,026 2% 0.98 1.8% 468 599 723 13.0 10.1 8.4 3.40 4.20 5.02 16.4 13.3 11.1
Tenaris 42.73 25,222 4% 1.29 3.0% 2,452 3,053 3,718 10.5 8.4 6.9 3.25 3.93 4.89 13.1 10.9 8.78,436 10,317 12,204 21 26 31
Mean -0.2% 13.5 10.4 8.6 17.6 14.0 11.3
Offshore Drilling
Atwood Oceanics 46.68 3,051 23% (8.19) -17.5% 372 376 536 9.7 9.6 6.8 4.82 5.03 6.92 9.7 9.3 6.7
Diamond 67.37 9,366 2% 1.70 2.5% 1,654 1,198 1,495 5.7 7.9 6.4 9.79 6.99 8.40 6.9 9.6 8.0
Ensco plc 58.10 13,479 29% 0.79 1.4% 1,241 2,043 2,716 14.6 8.9 6.7 5.33 7.72 10.10 10.9 7.5 5.8
Noble Corp 37.94 9,584 35% (1.58) -4.2% 1,128 1,722 2,512 12.2 8.0 5.5 3.90 5.68 8.09 9.7 6.7 4.7
Pacific Drilling 10.28 2,159 45% (1.01) -9.9% (19) 249 377 -- 15.1 10.0 0.04 0.71 1.29 -- 14.5 8.0
Rowan 35.97 4,467 14% (0.33) -0.9% 368 553 842 14.4 9.6 6.3 2.76 4.11 5.78 13.0 8.8 6.2
Seadrill 39.62 18,592 56% 0.66 1.7% 2,323 2,495 2,915 12.2 11.4 9.7 3.70 4.10 4.78 10.7 9.7 8.3
Transocean 45.27 16,270 31% 0.46 1.0% 2,876 3,445 3,748 8.7 7.3 6.7 6.00 6.44 7.39 7.5 7.0 6.1
Mean -3.2% 11.1 9.7 7.3 9.8 9.1 6.7
Land Drilling
Helm & Payne 49.09 5,188 -14% (0.46) -0.9% 1,008 1,253 1,081 4.6 3.7 4.3 8.70 10.17 9.00 5.6 4.8 5.5
Nabors 15.65 4,545 40% (0.54) -3.4% 1,873 2,071 1,920 4.7 4.3 4.6 4.30 5.98 5.43 3.6 2.6 2.9
Patterson UTI 17.06 2,589 16% (0.71) -4.1% 957 964 750 3.3 3.2 4.2 4.95 5.18 4.50 3.4 3.3 3.8
Mean -2.8% 4.2 3.7 4.4 4.2 3.6 4.0
Source: FactSet, Company Reports, Guggenheim Securities, LLC
Guggenheim Securities, LLC | 972.638.5500 | guggenheimpartners.com
Market Power Shifting to Subsea Equipment Players - Upgrading FTI to Buy From Neutral PAGE 46

OFS EPS Comp
Source: FactSet, Company Reports, Guggenheim Securities, LLC
Ticker Company Category 2012E 2013E 1Q12 2Q12 3Q12E 4Q12E 1Q13E 2Q13E 3Q13E 4Q13E
Oil Services
SLB Schlumberger EPS 4.21 4.65 0.98 1.05 1.08 1.11 -- -- -- --
Consensus EPS 4.29 5.11 1.09 1.19 1.13 1.24 1.36 1.50
Consensus EPS-High 4.50 5.65 1.16 1.34 1.23 1.32 1.46 1.67
Consensus EPS-Low 4.15 4.25 1.03 1.08 1.05 1.15 1.27 1.33
HAL Halliburton EPS 3.20 2.80 0.89 0.80 0.74 0.76 -- -- -- --
Consensus EPS 3.16 3.49 0.70 0.76 0.75 0.85 0.94 1.05
Consensus EPS-High 3.32 4.10 0.77 0.83 0.86 0.96 1.00 1.12
Consensus EPS-Low 3.05 2.65 0.67 0.69 0.68 0.76 0.85 0.87
BHI Baker Hughes EPS 3.53 3.25 0.86 1.00 0.80 0.86 -- -- -- --
Consensus EPS 3.71 4.29 0.88 0.97 0.99 1.02 1.13 1.26
Consensus EPS-High 3.85 5.00 0.93 1.07 1.09 1.13 1.25 1.42
Consensus EPS-Low 3.45 3.20 0.72 0.82 0.87 0.92 1.04 1.06
WFT Weatherford EPS 1.05 1.15 0.25 0.23 0.26 0.31 -- -- -- --
Consensus EPS 1.07 1.47 0.28 0.33 0.32 0.34 0.42 0.47
Consensus EPS-High 1.20 1.75 0.33 0.40 0.38 0.37 0.45 0.52
Consensus EPS-Low 0.93 0.65 0.21 0.26 0.28 0.30 0.36 0.40
Equipment
AKSO-NOAKSO Aker Solutions EPS 7.84 10.00 1.84 1.89 1.96 2.15 2.24 2.40 2.57 2.79
Consensus EPS 7.94 10.40 1.92 2.26 2.23 2.53 2.55 2.85
Consensus EPS-High 8.66 11.77 2.27 2.99 2.24 2.69 2.58 2.91
Consensus EPS-Low 7.36 8.41 1.74 1.62 2.20 2.40 2.50 2.79
CAM Cameron International EPS 3.27 4.25 0.57 0.74 0.86 1.09 1.01 1.01 1.08 1.15
Consensus EPS 3.23 4.35 0.88 1.07 0.93 1.05 1.12 1.19
Consensus EPS-High 3.37 4.90 0.91 1.20 1.05 1.19 1.29 1.37
Consensus EPS-Low 2.90 3.00 0.77 0.84 0.80 0.77 0.69 0.70
DRQ Dril-Quip EPS 2.95 3.70 0.71 0.74 0.74 0.76 0.79 0.89 0.97 1.05
Consensus EPS 2.96 3.81 0.74 0.76 0.86 0.94 1.04 1.12
Consensus EPS-High 3.03 4.25 0.76 0.82 0.89 1.02 1.12 1.25
Consensus EPS-Low 2.90 3.45 0.72 0.73 0.79 0.88 0.96 1.04
FTI FMC Technologies EPS 2.00 2.70 0.41 0.43 0.56 0.60 0.63 0.65 0.67 0.74
Previous EPS 2.00 2.65 0.56 0.60 0.63 0.64 0.66 0.72
Consensus EPS 2.09 2.61 0.57 0.64 0.56 0.61 0.67 0.73
Consensus EPS-High 2.16 2.90 0.60 0.71 0.63 0.66 0.73 0.87
Consensus EPS-Low 2.00 2.00 0.54 0.57 0.52 0.50 0.49 0.49
NOV National Oilwell Varco EPS 5.70 6.35 1.42 1.46 1.39 1.43 1.45 1.53 1.63 1.74
Consensus EPS 5.97 6.84 1.51 1.57 1.63 1.67 1.77 1.86
Consensus EPS-High 6.20 7.75 1.59 1.74 1.75 1.86 2.00 2.15
Consensus EPS-Low 5.70 5.05 1.39 1.43 1.42 1.27 1.20 1.15
OII Oceaneering Intl. EPS 2.64 3.25 0.47 0.67 0.79 0.70 0.75 0.81 0.85 0.83
Consensus EPS 2.65 3.22 0.78 0.73 0.69 0.83 0.89 0.83
Consensus EPS-High 2.75 3.42 0.83 0.82 0.78 0.94 0.96 0.86
Consensus EPS-Low 2.60 3.00 0.75 0.68 0.63 0.77 0.85 0.80
TS Tenaris EPS 3.20 4.05 0.75 0.78 0.75 0.91 -- -- -- --
Consensus EPS 3.06 3.46 0.78 0.86 0.90 0.95 1.00 1.08
Consensus EPS-High 3.31 4.10 0.86 0.91 0.95 0.99 1.04 1.13
Consensus EPS-Low 2.30 2.41 0.74 0.82 0.85 0.88 0.90 1.06
Guggenheim Securities, LLC | 972.638.5500 | guggenheimpartners.com
Market Power Shifting to Subsea Equipment Players - Upgrading FTI to Buy From Neutral PAGE 47

OFS EPS Comp
Source: FactSet, Company Reports, Guggenheim Securities, LLC
Ticker Company Category 2012E 2013E 1Q12 2Q12 3Q12E 4Q12E 1Q13E 2Q13E 3Q13E 4Q13E
Offshore Drillers
ATW Atwood Oceanics EPS 3.95 5.05 1.00 0.90 0.79 1.26 1.16 1.21 1.35 1.33
Consensus EPS 3.90 5.08 1.20 1.09 1.28 1.36 1.44
Consensus EPS-High 3.98 5.84 1.29 1.20 1.35 1.43 1.64
Consensus EPS-Low 3.70 4.60 1.04 0.96 1.21 1.27 1.35
DO Diamond Offshore EPS 4.11 5.24 1.21 1.09 0.85 0.96 1.11 1.24 1.38 1.51
Consensus EPS 4.46 5.33 0.99 1.15 1.21 1.24 1.43 1.55
Consensus EPS-High 4.80 6.05 1.25 1.47 1.42 1.49 1.85 1.81
Consensus EPS-Low 4.07 4.40 0.72 0.83 0.84 0.86 1.07 1.16
ESV Ensco EPS 5.20 7.30 1.17 1.35 1.30 1.38 1.55 1.67 1.90 2.18
Consensus EPS 5.27 7.06 1.30 1.43 1.60 1.70 1.76 1.94
Consensus EPS-High 5.55 7.83 1.40 1.61 1.84 1.92 2.00 2.36
Consensus EPS-Low 5.00 6.15 1.19 1.28 1.38 1.46 1.38 1.70
NE Noble Drilling EPS 2.63 4.45 0.47 0.59 0.61 0.96 0.84 1.05 1.16 1.40
Consensus EPS 2.52 4.54 0.55 0.91 0.93 1.13 1.20 1.28
Consensus EPS-High 2.80 5.24 0.79 1.06 1.09 1.38 1.39 1.61
Consensus EPS-Low 2.19 3.95 0.43 0.77 0.82 1.01 0.97 1.00
PACD Pacific Drilling EPS 0.11 0.50 0.01 0.01 (0.01) 0.10 0.09 0.08 0.12 0.21
Consensus EPS 0.20 0.46 0.00 0.10 0.09 0.08 0.09 0.16
Consensus EPS-High 0.82 0.80 0.21 0.23 0.12 0.10 0.12 0.21
Consensus EPS-Low (0.02) 0.09 (0.08) 0.03 0.04 0.04 0.05 0.08
RDC Rowan EPS 2.13 3.60 0.46 0.51 0.51 0.65 0.74 0.85 1.01 1.00
Consensus EPS 2.10 3.53 0.52 0.63 0.82 0.84 0.94 0.89
Consensus EPS-High 2.49 4.40 0.95 0.87 0.94 0.99 1.12 1.03
Consensus EPS-Low 1.60 2.74 0.35 0.30 0.66 0.65 0.75 0.69
RIG Transocean EPS 2.77 4.29 0.53 0.73 0.80 0.72 0.76 1.01 1.22 1.30
Consensus EPS 2.99 4.58 0.77 0.87 1.01 1.17 1.23 1.11
Consensus EPS-High 4.17 5.42 0.91 1.17 1.66 1.32 1.61 1.47
Consensus EPS-Low 2.38 3.75 0.60 0.54 0.66 0.98 1.04 0.85
SDRL Seadrill EPS 2.87 3.33 0.85 0.56 0.70 0.77 0.79 0.80 0.83 0.91
Consensus EPS 3.09 3.51 0.71 0.80 0.79 0.82 0.87 0.98
Consensus EPS-High 3.79 4.50 0.83 0.96 0.92 0.96 1.02 1.19
Consensus EPS-Low 2.67 2.84 0.56 0.69 0.69 0.68 0.75 0.86
Land Drillers
HP Helmrich & Payne EPS 5.03 3.85 1.29 1.13 1.37 1.24 -- -- -- --
Consensus EPS 5.05 4.69 1.24 1.21 1.17 1.20 1.23
Consensus EPS-High 5.15 5.25 1.31 1.34 1.30 1.31 1.36
Consensus EPS-Low 4.85 3.85 1.17 1.12 1.09 1.07 1.07
NBR Nabors EPS 1.78 1.15 0.65 0.38 0.38 0.37 -- -- -- --
Consensus EPS 1.85 1.81 0.40 0.43 0.51 0.37 0.46 0.52
Consensus EPS-High 2.08 2.30 0.52 0.53 0.59 0.43 0.56 0.69
Consensus EPS-Low 1.75 1.05 0.34 0.34 0.39 0.22 0.24 0.21
PTEN Patterson-UTI Energy EPS 1.75 0.65 0.61 0.49 0.37 0.27 -- -- -- --
Consensus EPS 1.85 1.36 0.40 0.33 0.35 0.33 0.37 0.41
Consensus EPS-High 1.98 1.80 0.46 0.45 0.44 0.40 0.48 0.55
Consensus EPS-Low 1.75 0.65 0.35 0.27 0.31 0.26 0.18 0.11
Guggenheim Securities, LLC | 972.638.5500 | guggenheimpartners.com
Market Power Shifting to Subsea Equipment Players - Upgrading FTI to Buy From Neutral PAGE 48

P/E Methodology P/E Range
Oilfield Equipment Valuation Methodology: P/E Range Calculations
Source: FactSet, Company Reports, Guggenheim Securities, LLC Source: FactSet, Guggenheim Securities, LLC
kr135
$67 $68
$64
$96
$68
$109
$58
$73
$48
$82
$56
$-
$20
$40
$60
$80
$100
$120
$140
$160
$180
$200
AKSO-
OSL
CAM DRQ FTI NOV OII
$ per
share Implied '12E P/E to '13E P/E Range
Price Target
Last Price
FTI14%
CAM16%
DRQ27%
NOV22%
OII23%
AKSO10%
10.0x
12.0x
14.0x
16.0x
18.0x
20.0x
22.0x
24.0x
10% 12% 14% 16% 18%
Price T
arg
et Im
plie
d 2
013E P/E
Multip
le
Revenue Growth CAGR 2013E-2015E
FTI CAM DRQ NOV OII AKSO
Bubble size reflects 2Q12 EBITDA Margins
Guggenheim Securities, LLC | 972.638.5500 | guggenheimpartners.com
Market Power Shifting to Subsea Equipment Players - Upgrading FTI to Buy From Neutral PAGE 49

OFS Valuations & Risks
Source: FactSet, Company Reports, Guggenheim Securities, LLC
Ticker Valuation Risks
BHI BHI currently trades at approximately 14x our 2012 P/E and 6x our 2012 EV/EBITDA estimates. Our 12-month price
target of $48 is based on 14.5x our 2012 P/E and 6.0x our 2012 EV/EBITDA estimates.
BHI is in the process of eliminating redundant costs and streamlining its international operations – execution of this strategy
poses a risk. A slow dow n in NAM spending grow th is also a key risk for BHI.
HAL HAL currently trades at approximately 12x our 2012 P/E and 6x our 2012 EV/EBITDA estimates. Our 12-month price
target of $35 is based on 13x our 2012 P/E and 6.0x our 2012 EV/EBITDA estimates.
HAL's grow th has largely been driven by NAM activity and pricing improvement. Should NAM spending decelerate at a faster
rate than w e now expect, HAL shares could underperform our NEUTRAL rating.
SLB SLB currently trades at approximately 18x our 2012 P/E and 9x our 2012 EV/EBITDA estimates. Our 12-month price
target of $80 is based on 17x our 2012 P/E and 10x our 2012 EV/EBITDA estimates.
The fact that SLB is entering a period of leadership transition could w eigh on the stock. Although w e expect deepw ater to be
a safe haven, any delays or project cancellations could curb SLB's grow th prospects.
WFT WFT currently trades at approximately 13x our 2012 P/E and 6x our 2012 EV/EBITDA estimates. Our 12-month
price target of $13 is based on 13x our 2012 P/E and 6.5x our 2012 EV/EBITDA estimates.
WFT has considerable f inancial leverage, w hich can act as an accelerant to share price declines w hen cash f low grow th
falls short of expectations. Should WFT’s contract execution fail to improve, the stock could underperform our NEUTRAL
rating.
AKSO We arrive at our price target of kr135/sh by calibrating against our P/E valuation framew ork and our discounted
cash f low valuation methodology. Future estimated earnings grow th discounted by our cost of capital implies a
valuation range betw een a 20.3x multiple on our 2012 EPS estimate and a 18.2x multiple on our 2013 EPS estimate.
Our DCF valuation implies a value of $180/sh, given strong grow th over the explicit forecast, reinvestment of
capital, and a normalization of returns w ithout economic rents.
Business Model Risk - The transition to a matrix business model that crosses regional management and product management
in order to create a single point of contact w ith customers poses a risk to existing client relationships that may threaten future
orders. At the same time, the change in management structure may also lead to supply chain and other execution issues.
There is a risk that AKSO may choose to grow revenues by underbidding the competition on price. Resultant low er margin
business may challenge the company’s margin expansion goals.
CAM We arrive at our price target of $67/sh by calibrating against our P/E valuation framew ork and our discounted cash
f low valuation methodology. Future estimated earnings grow th discounted by our cost of capital implies a valuation
range betw een a 23.8x multiple on our 2012 EPS estimate and a 16.3x multiple on our 2013 EPS estimate. Our DCF
valuation implies a value of $67/sh, given strong grow th over the explicit forecast, reinvestment of capital, and a
normalization of returns w ithout economic rents.
Should order book grow th begin to retrench, it w ould cast doubt on our 2012/2013 estimates and likely lead to negative
revisions, a low er price target, and underperformance relative to our BUY rating. The volatile North American natural gas
market historically contributed 60% of Cameron’s domestic sales, comprised of its surface w ellhead, distributed valves, and
compression businesses. If the market becomes oversupplied, both conventional and unconventional natural gas operators
may cut their budgets, w hich w ould negatively impact Cameron’s operating performance.
DRQ We arrive at our price target of $68/sh by calibrating against our P/E valuation framew ork and our discounted cash
f low valuation methodology. Future estimated earnings grow th discounted by our cost of capital implies a valuation
range betw een a 23.9x multiple on our 2012 EPS estimate and a 25.2x multiple on our 2013 EPS estimate. Our DCF
valuation implies a value of $81/sh, given strong grow th over the explicit forecast, reinvestment of capital, and a
normalization of returns w ithout economic rents.
The permitting delays in the Gulf of Mexico plagued drilling activity in the region during 2010 and 2011. The slow dow n
continues to negatively impact DRQ’s w ellhead and other offshore equipment businesses. In recent months permit issuance
has accelerated, but persistent w eakness in the Gulf of Mexico remains a risk to future earnings – w hereas the Gulf of
Mexico represented 44% and 31% of revenues in 1Q10 and full year 2011, respectively. Also, given that Dril-Quip does not
hedge its steel or other inputs, the risk remains that rising input costs may erode margins on its f ixed-price equipment.
FTI We arrive at our price target of $64/sh by calibrating against our P/E valuation framew ork and our discounted cash
f low valuation methodology. Future estimated earnings grow th discounted by our cost of capital implies a valuation
range betw een a 26.6x multiple on our 2012 EPS estimate and a 24.9x multiple on our 2013 EPS estimate. Our DCF
valuation implies a value of $65/sh, given strong grow th over the explicit forecast, reinvestment of capital, and a
normalization of returns w ithout economic rents.
As a company dependent on deepw ater development, FTI’s revenue and earnings could be materially impacted by a potential
slow dow n in offshore development—be it recession or regulatory driven—w hich w ould push subsea order f low to the right
and curtail FTI’s earnings grow th trajectory. Additionally, should the North American onshore market deteriorate more than w e
are currently modeling, the stock could underperform our BUY rating.
NOV We arrive at our price target of $96/sh by calibrating against our P/E valuation framew ork and our discounted cash
f low valuation methodology. Future estimated earnings grow th discounted by our cost of capital implies a valuation
range betw een a 15.8x multiple on our 2012 EPS estimate and a 15.4x multiple on our 2013 EPS estimate. Our DCF
valuation implies a value of $124/sh, given strong grow th over the explicit forecast, reinvestment of capital, and a
normalization of returns w ithout economic rents.
Although visibility from the offshore rig market replacement cycle gives us confidence in Rig Tech’s earnings trajectory over
our forecast period (2013), w e believe uncertain macro conditions could potentially push order f low out, causing investors to
question NOV’s grow th prospects--a potential source of near-term dow nside risk.
OII We arrive at our price target of $68/sh by calibrating against our P/E valuation framew ork and our discounted cash
f low valuation methodology. Future estimated earnings grow th discounted by our cost of capital implies a valuation
range betw een a 23.4x multiple on our 2012 EPS estimate and an 22.5x multiple on our 2013 EPS estimate. Our DCF
valuation implies a value of $68/sh, given strong grow th over the explicit forecast, reinvestment of capital, and a
normalization of returns w ithout economic rents.
We assume that the ROV business grow s w ith the expansion of the offshore rigs f leet and the acceleration of offshore
drilling activity. Given OII’s strategy to pass on low er margin contracts w ith Petrobras, one of the largest incremental
consumers of offshore rigs, OII may place their grow th prospects at risk. Also, if regulatory issues persist in the GoM, they
may impede the recovery activity.
TS TS currently trades at approximately 13x our 2012 P/E and 8x our 2012 EV/EBITDA estimates. Our 12-month price
target of $50 is based on 13x our 2012 P/E and 7x our 2012 EV/EBITDA estimates.
Should global steel costs begin to rise, TS's margins w ould not expand as expected, creating a headw ind for the stock.
Additionally, should there be delays in large offshore projects, TS's pricing may not be as strong.
Guggenheim Securities, LLC | 972.638.5500 | guggenheimpartners.com
Market Power Shifting to Subsea Equipment Players - Upgrading FTI to Buy From Neutral PAGE 50
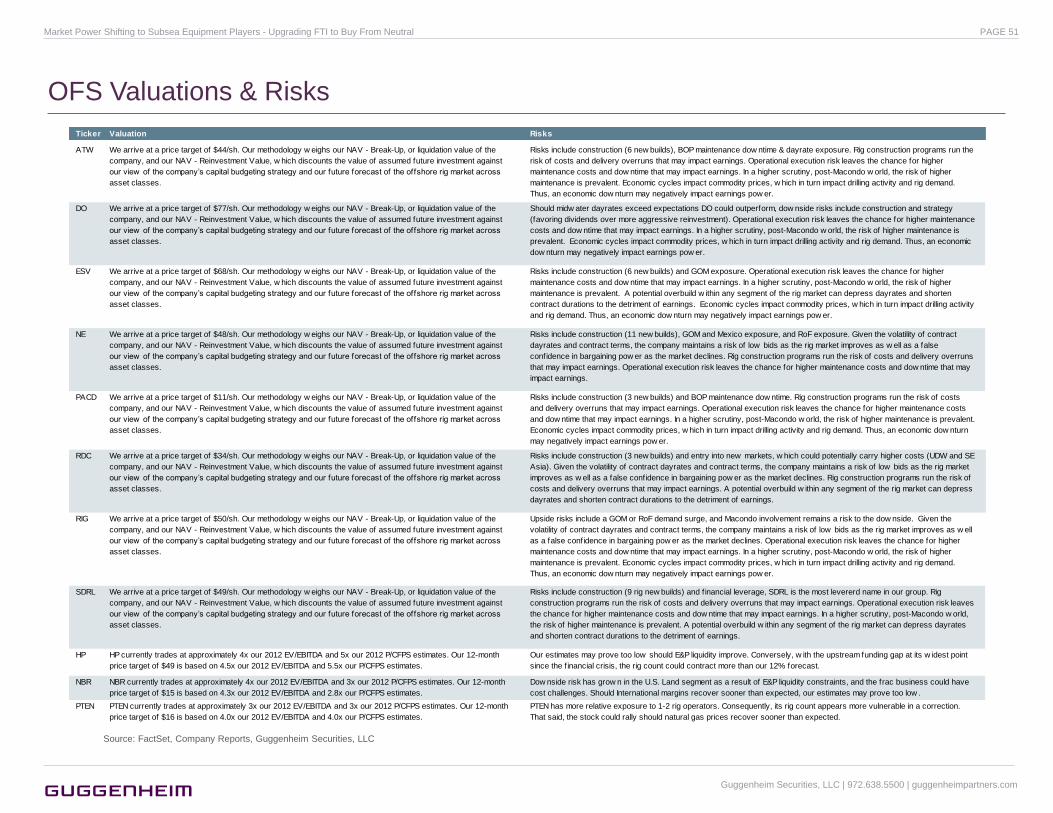
OFS Valuations & Risks
Source: FactSet, Company Reports, Guggenheim Securities, LLC
Ticker Valuation Risks
ATW We arrive at a price target of $44/sh. Our methodology w eighs our NAV - Break-Up, or liquidation value of the
company, and our NAV - Reinvestment Value, w hich discounts the value of assumed future investment against
our view of the company’s capital budgeting strategy and our future forecast of the offshore rig market across
asset classes.
Risks include construction (6 new builds), BOP maintenance dow ntime & dayrate exposure. Rig construction programs run the
risk of costs and delivery overruns that may impact earnings. Operational execution risk leaves the chance for higher
maintenance costs and dow ntime that may impact earnings. In a higher scrutiny, post-Macondo w orld, the risk of higher
maintenance is prevalent. Economic cycles impact commodity prices, w hich in turn impact drilling activity and rig demand.
Thus, an economic dow nturn may negatively impact earnings pow er.
DO We arrive at a price target of $77/sh. Our methodology w eighs our NAV - Break-Up, or liquidation value of the
company, and our NAV - Reinvestment Value, w hich discounts the value of assumed future investment against
our view of the company’s capital budgeting strategy and our future forecast of the offshore rig market across
asset classes.
Should midw ater dayrates exceed expectations DO could outperform, dow nside risks include construction and strategy
(favoring dividends over more aggressive reinvestment). Operational execution risk leaves the chance for higher maintenance
costs and dow ntime that may impact earnings. In a higher scrutiny, post-Macondo w orld, the risk of higher maintenance is
prevalent. Economic cycles impact commodity prices, w hich in turn impact drilling activity and rig demand. Thus, an economic
dow nturn may negatively impact earnings pow er.
ESV We arrive at a price target of $68/sh. Our methodology w eighs our NAV - Break-Up, or liquidation value of the
company, and our NAV - Reinvestment Value, w hich discounts the value of assumed future investment against
our view of the company’s capital budgeting strategy and our future forecast of the offshore rig market across
asset classes.
Risks include construction (6 new builds) and GOM exposure. Operational execution risk leaves the chance for higher
maintenance costs and dow ntime that may impact earnings. In a higher scrutiny, post-Macondo w orld, the risk of higher
maintenance is prevalent. A potential overbuild w ithin any segment of the rig market can depress dayrates and shorten
contract durations to the detriment of earnings. Economic cycles impact commodity prices, w hich in turn impact drilling activity
and rig demand. Thus, an economic dow nturn may negatively impact earnings pow er.
NE We arrive at a price target of $48/sh. Our methodology w eighs our NAV - Break-Up, or liquidation value of the
company, and our NAV - Reinvestment Value, w hich discounts the value of assumed future investment against
our view of the company’s capital budgeting strategy and our future forecast of the offshore rig market across
asset classes.
Risks include construction (11 new builds), GOM and Mexico exposure, and RoF exposure. Given the volatility of contract
dayrates and contract terms, the company maintains a risk of low bids as the rig market improves as w ell as a false
confidence in bargaining pow er as the market declines. Rig construction programs run the risk of costs and delivery overruns
that may impact earnings. Operational execution risk leaves the chance for higher maintenance costs and dow ntime that may
impact earnings.
PACD We arrive at a price target of $11/sh. Our methodology w eighs our NAV - Break-Up, or liquidation value of the
company, and our NAV - Reinvestment Value, w hich discounts the value of assumed future investment against
our view of the company’s capital budgeting strategy and our future forecast of the offshore rig market across
asset classes.
Risks include construction (3 new builds) and BOP maintenance dow ntime. Rig construction programs run the risk of costs
and delivery overruns that may impact earnings. Operational execution risk leaves the chance for higher maintenance costs
and dow ntime that may impact earnings. In a higher scrutiny, post-Macondo w orld, the risk of higher maintenance is prevalent.
Economic cycles impact commodity prices, w hich in turn impact drilling activity and rig demand. Thus, an economic dow nturn
may negatively impact earnings pow er.
RDC We arrive at a price target of $34/sh. Our methodology w eighs our NAV - Break-Up, or liquidation value of the
company, and our NAV - Reinvestment Value, w hich discounts the value of assumed future investment against
our view of the company’s capital budgeting strategy and our future forecast of the offshore rig market across
asset classes.
Risks include construction (3 new builds) and entry into new markets, w hich could potentially carry higher costs (UDW and SE
Asia). Given the volatility of contract dayrates and contract terms, the company maintains a risk of low bids as the rig market
improves as w ell as a false confidence in bargaining pow er as the market declines. Rig construction programs run the risk of
costs and delivery overruns that may impact earnings. A potential overbuild w ithin any segment of the rig market can depress
dayrates and shorten contract durations to the detriment of earnings.
RIG We arrive at a price target of $50/sh. Our methodology w eighs our NAV - Break-Up, or liquidation value of the
company, and our NAV - Reinvestment Value, w hich discounts the value of assumed future investment against
our view of the company’s capital budgeting strategy and our future forecast of the offshore rig market across
asset classes.
Upside risks include a GOM or RoF demand surge, and Macondo involvement remains a risk to the dow nside. Given the
volatility of contract dayrates and contract terms, the company maintains a risk of low bids as the rig market improves as w ell
as a false confidence in bargaining pow er as the market declines. Operational execution risk leaves the chance for higher
maintenance costs and dow ntime that may impact earnings. In a higher scrutiny, post-Macondo w orld, the risk of higher
maintenance is prevalent. Economic cycles impact commodity prices, w hich in turn impact drilling activity and rig demand.
Thus, an economic dow nturn may negatively impact earnings pow er.
SDRL We arrive at a price target of $49/sh. Our methodology w eighs our NAV - Break-Up, or liquidation value of the
company, and our NAV - Reinvestment Value, w hich discounts the value of assumed future investment against
our view of the company’s capital budgeting strategy and our future forecast of the offshore rig market across
asset classes.
Risks include construction (9 rig new builds) and f inancial leverage, SDRL is the most levererd name in our group. Rig
construction programs run the risk of costs and delivery overruns that may impact earnings. Operational execution risk leaves
the chance for higher maintenance costs and dow ntime that may impact earnings. In a higher scrutiny, post-Macondo w orld,
the risk of higher maintenance is prevalent. A potential overbuild w ithin any segment of the rig market can depress dayrates
and shorten contract durations to the detriment of earnings.
HP HP currently trades at approximately 4x our 2012 EV/EBITDA and 5x our 2012 P/CFPS estimates. Our 12-month
price target of $49 is based on 4.5x our 2012 EV/EBITDA and 5.5x our P/CFPS estimates.
Our estimates may prove too low should E&P liquidity improve. Conversely, w ith the upstream funding gap at its w idest point
since the f inancial crisis, the rig count could contract more than our 12% forecast.
NBR NBR currently trades at approximately 4x our 2012 EV/EBITDA and 3x our 2012 P/CFPS estimates. Our 12-month
price target of $15 is based on 4.3x our 2012 EV/EBITDA and 2.8x our P/CFPS estimates.
Dow nside risk has grow n in the U.S. Land segment as a result of E&P liquidity constraints, and the frac business could have
cost challenges. Should International margins recover sooner than expected, our estimates may prove too low .
PTEN PTEN currently trades at approximately 3x our 2012 EV/EBITDA and 3x our 2012 P/CFPS estimates. Our 12-month
price target of $16 is based on 4.0x our 2012 EV/EBITDA and 4.0x our P/CFPS estimates.
PTEN has more relative exposure to 1-2 rig operators. Consequently, its rig count appears more vulnerable in a correction.
That said, the stock could rally should natural gas prices recover sooner than expected.
Guggenheim Securities, LLC | 972.638.5500 | guggenheimpartners.com
Market Power Shifting to Subsea Equipment Players - Upgrading FTI to Buy From Neutral PAGE 51
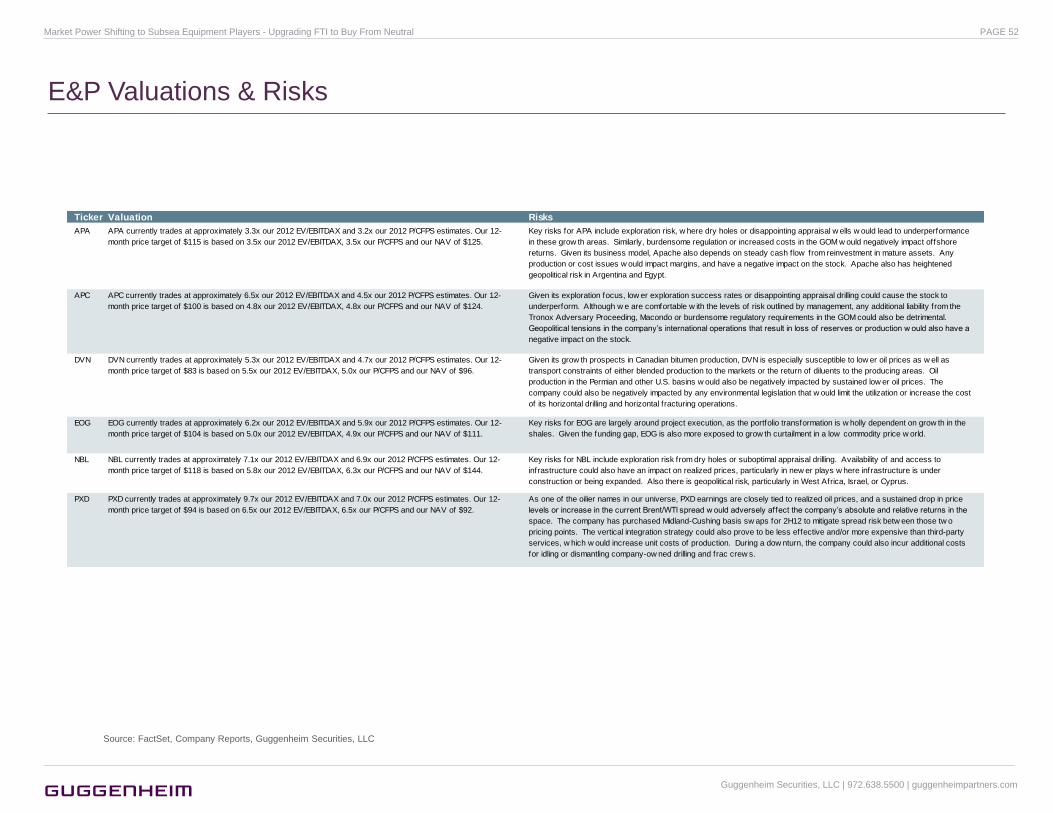
E&P Valuations & Risks
Source: FactSet, Company Reports, Guggenheim Securities, LLC
Ticker Valuation Risks1APA APA currently trades at approximately 3.3x our 2012 EV/EBITDAX and 3.2x our 2012 P/CFPS estimates. Our 12-
month price target of $115 is based on 3.5x our 2012 EV/EBITDAX, 3.5x our P/CFPS and our NAV of $125.
Key risks for APA include exploration risk, w here dry holes or disappointing appraisal w ells w ould lead to underperformance
in these grow th areas. Similarly, burdensome regulation or increased costs in the GOM w ould negatively impact offshore
returns. Given its business model, Apache also depends on steady cash flow from reinvestment in mature assets. Any
production or cost issues w ould impact margins, and have a negative impact on the stock. Apache also has heightened
geopolitical risk in Argentina and Egypt.
APC APC currently trades at approximately 6.5x our 2012 EV/EBITDAX and 4.5x our 2012 P/CFPS estimates. Our 12-
month price target of $100 is based on 4.8x our 2012 EV/EBITDAX, 4.8x our P/CFPS and our NAV of $124.
Given its exploration focus, low er exploration success rates or disappointing appraisal drilling could cause the stock to
underperform. Although w e are comfortable w ith the levels of risk outlined by management, any additional liability from the
Tronox Adversary Proceeding, Macondo or burdensome regulatory requirements in the GOM could also be detrimental.
Geopolitical tensions in the company’s international operations that result in loss of reserves or production w ould also have a
negative impact on the stock.
DVN DVN currently trades at approximately 5.3x our 2012 EV/EBITDAX and 4.7x our 2012 P/CFPS estimates. Our 12-
month price target of $83 is based on 5.5x our 2012 EV/EBITDAX, 5.0x our P/CFPS and our NAV of $96.
Given its grow th prospects in Canadian bitumen production, DVN is especially susceptible to low er oil prices as w ell as
transport constraints of either blended production to the markets or the return of diluents to the producing areas. Oil
production in the Permian and other U.S. basins w ould also be negatively impacted by sustained low er oil prices. The
company could also be negatively impacted by any environmental legislation that w ould limit the utilization or increase the cost
of its horizontal drilling and horizontal fracturing operations.
EOG EOG currently trades at approximately 6.2x our 2012 EV/EBITDAX and 5.9x our 2012 P/CFPS estimates. Our 12-
month price target of $104 is based on 5.0x our 2012 EV/EBITDAX, 4.9x our P/CFPS and our NAV of $111.
Key risks for EOG are largely around project execution, as the portfolio transformation is w holly dependent on grow th in the
shales. Given the funding gap, EOG is also more exposed to grow th curtailment in a low commodity price w orld.
NBL NBL currently trades at approximately 7.1x our 2012 EV/EBITDAX and 6.9x our 2012 P/CFPS estimates. Our 12-
month price target of $118 is based on 5.8x our 2012 EV/EBITDAX, 6.3x our P/CFPS and our NAV of $144.
Key risks for NBL include exploration risk from dry holes or suboptimal appraisal drilling. Availability of and access to
infrastructure could also have an impact on realized prices, particularly in new er plays w here infrastructure is under
construction or being expanded. Also there is geopolitical risk, particularly in West Africa, Israel, or Cyprus.
PXD PXD currently trades at approximately 9.7x our 2012 EV/EBITDAX and 7.0x our 2012 P/CFPS estimates. Our 12-
month price target of $94 is based on 6.5x our 2012 EV/EBITDAX, 6.5x our P/CFPS and our NAV of $92.
As one of the oilier names in our universe, PXD earnings are closely tied to realized oil prices, and a sustained drop in price
levels or increase in the current Brent/WTI spread w ould adversely affect the company’s absolute and relative returns in the
space. The company has purchased Midland-Cushing basis sw aps for 2H12 to mitigate spread risk betw een those tw o
pricing points. The vertical integration strategy could also prove to be less effective and/or more expensive than third-party
services, w hich w ould increase unit costs of production. During a dow nturn, the company could also incur additional costs
for idling or dismantling company-ow ned drilling and frac crew s.
Guggenheim Securities, LLC | 972.638.5500 | guggenheimpartners.com
Market Power Shifting to Subsea Equipment Players - Upgrading FTI to Buy From Neutral PAGE 52
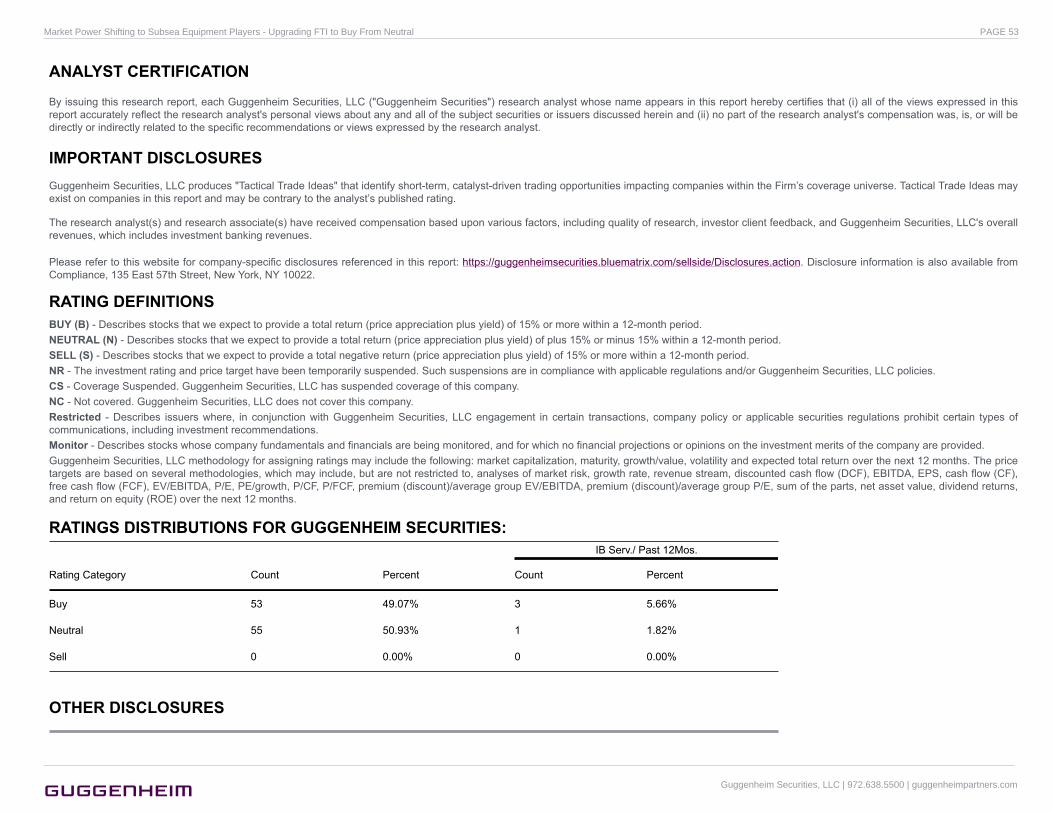
ANALYST CERTIFICATION
By issuing this research report, each Guggenheim Securities, LLC ("Guggenheim Securities") research analyst whose name appears in this report hereby certifies that (i) all of the views expressed in thisreport accurately reflect the research analyst's personal views about any and all of the subject securities or issuers discussed herein and (ii) no part of the research analyst's compensation was, is, or will bedirectly or indirectly related to the specific recommendations or views expressed by the research analyst.
IMPORTANT DISCLOSURESGuggenheim Securities, LLC produces "Tactical Trade Ideas" that identify short-term, catalyst-driven trading opportunities impacting companies within the Firm’s coverage universe. Tactical Trade Ideas mayexist on companies in this report and may be contrary to the analyst’s published rating.
The research analyst(s) and research associate(s) have received compensation based upon various factors, including quality of research, investor client feedback, and Guggenheim Securities, LLC's overallrevenues, which includes investment banking revenues.
Please refer to this website for company-specific disclosures referenced in this report: https://guggenheimsecurities.bluematrix.com/sellside/Disclosures.action. Disclosure information is also available fromCompliance, 135 East 57th Street, New York, NY 10022.
RATING DEFINITIONSBUY (B) - Describes stocks that we expect to provide a total return (price appreciation plus yield) of 15% or more within a 12-month period.NEUTRAL (N) - Describes stocks that we expect to provide a total return (price appreciation plus yield) of plus 15% or minus 15% within a 12-month period.SELL (S) - Describes stocks that we expect to provide a total negative return (price appreciation plus yield) of 15% or more within a 12-month period.NR - The investment rating and price target have been temporarily suspended. Such suspensions are in compliance with applicable regulations and/or Guggenheim Securities, LLC policies.CS - Coverage Suspended. Guggenheim Securities, LLC has suspended coverage of this company.NC - Not covered. Guggenheim Securities, LLC does not cover this company.Restricted - Describes issuers where, in conjunction with Guggenheim Securities, LLC engagement in certain transactions, company policy or applicable securities regulations prohibit certain types ofcommunications, including investment recommendations.Monitor - Describes stocks whose company fundamentals and financials are being monitored, and for which no financial projections or opinions on the investment merits of the company are provided.Guggenheim Securities, LLC methodology for assigning ratings may include the following: market capitalization, maturity, growth/value, volatility and expected total return over the next 12 months. The pricetargets are based on several methodologies, which may include, but are not restricted to, analyses of market risk, growth rate, revenue stream, discounted cash flow (DCF), EBITDA, EPS, cash flow (CF),free cash flow (FCF), EV/EBITDA, P/E, PE/growth, P/CF, P/FCF, premium (discount)/average group EV/EBITDA, premium (discount)/average group P/E, sum of the parts, net asset value, dividend returns,and return on equity (ROE) over the next 12 months.
RATINGS DISTRIBUTIONS FOR GUGGENHEIM SECURITIES:IB Serv./ Past 12Mos.
Rating Category Count Percent Count Percent
Buy 53 49.07% 3 5.66%
Neutral 55 50.93% 1 1.82%
Sell 0 0.00% 0 0.00%
OTHER DISCLOSURES
Guggenheim Securities, LLC | 972.638.5500 | guggenheimpartners.com
Market Power Shifting to Subsea Equipment Players - Upgrading FTI to Buy From Neutral PAGE 53

This research is for our clients and prospective clients only. Other than disclosures relating to Guggenheim Securities and its affiliates, this research is based on current public information that we considerreliable, but we do not represent it is accurate or complete, and it should not be relied on as such. We seek to update our research as appropriate, but various regulations may prevent us from doing so.Other than certain industry reports published on a periodic basis, the large majority of reports are published at irregular intervals as appropriate in the research analyst's judgment. Guggenheim Securitiesconducts a full-service, integrated investment banking and brokerage business, and one or more of its affiliates conduct an investment management business. Guggenheim Securities is a member of SIPC(http://www.sipc.org). Our salespeople, traders, and other professionals may provide oral or written market commentary or trading strategies to our clients and our employees trading for our own account thatreflect opinions that are contrary to the opinions expressed in this research. Guggenheim Securities or certain of its affiliates conducts an investment management business, trades for its own account, andconducts an investment business, and may make investment decisions that are inconsistent with the recommendations or views expressed in this research.
We and our affiliates, officers, directors, and employees, excluding equity and credit analysts, will from time to time have long or short positions in, act as principal in, and buy or sell, the securities or derivatives,if any, referred to in this research. We and our affiliates also may sell to or buy from customers on a principal basis the securities described herein. We and our affiliates also do business with, or that relatesto, companies covered in Guggenheim Securities’ research, and may have a position in the debt of the company or companies discussed herein.
This research is not an offer to sell or the solicitation of an offer to buy any security. It does not constitute a personal recommendation or take into account the particular investment objectives, financial situations,or needs of individual clients. Clients should consider whether any advice or recommendation in this research is suitable for their particular circumstances and, if appropriate, seek professional advice, includingtax advice. The price and value of investments referred to in this research and the income from them may fluctuate. Past performance is not a guide to future performance, future returns are not guaranteed,and a loss of original capital may occur. Fluctuations in exchange rates could have adverse effects on the value or price of, or income derived from, certain investments.
Guggenheim Securities, LLC | 972.638.5500 | guggenheimpartners.com
Market Power Shifting to Subsea Equipment Players - Upgrading FTI to Buy From Neutral PAGE 54