2012-0417 Council Work Session 5-Off System Sales and ...
29
Mission: Mission: Deliver clean affordable reliable energy and excellent customer service Off System Sales and 2011 Audited Financials City Council Work Session # 5 Mission: Mission: Deliver clean, affordable, reliable energy and excellent customer service. City Council Work Session # 5 April 17, 2012
Transcript of 2012-0417 Council Work Session 5-Off System Sales and ...
Mission:Mission: Deliver clean affordable reliable energy and excellent customer service
Off System Sales and 2011 Audited FinancialsCity Council Work Session # 5
Mission:Mission: Deliver clean, affordable, reliable energy and excellent customer service.
City Council Work Session # 5April 17, 2012

Agenda
• Decision Points
• Review 2011 Audited Financials
• Off System Sales Overview– Nodal Market
– Fuel Adjustment
April 17 , 2012 1

Decision Points
• Cash Flow Methodology
• Debt Equity Ratio
• Reserve Policies – Replenishment schedule in Revenue Requirements
General Fund Transfer Policy• General Fund Transfer Policy
• Energy Efficiency
S f C t A i t P• Scope of Customer Assistance Program coverage
April 17 , 2012 2

Response to Prior Council Requestsespo se to o Cou c equests
April 17 , 2012 3
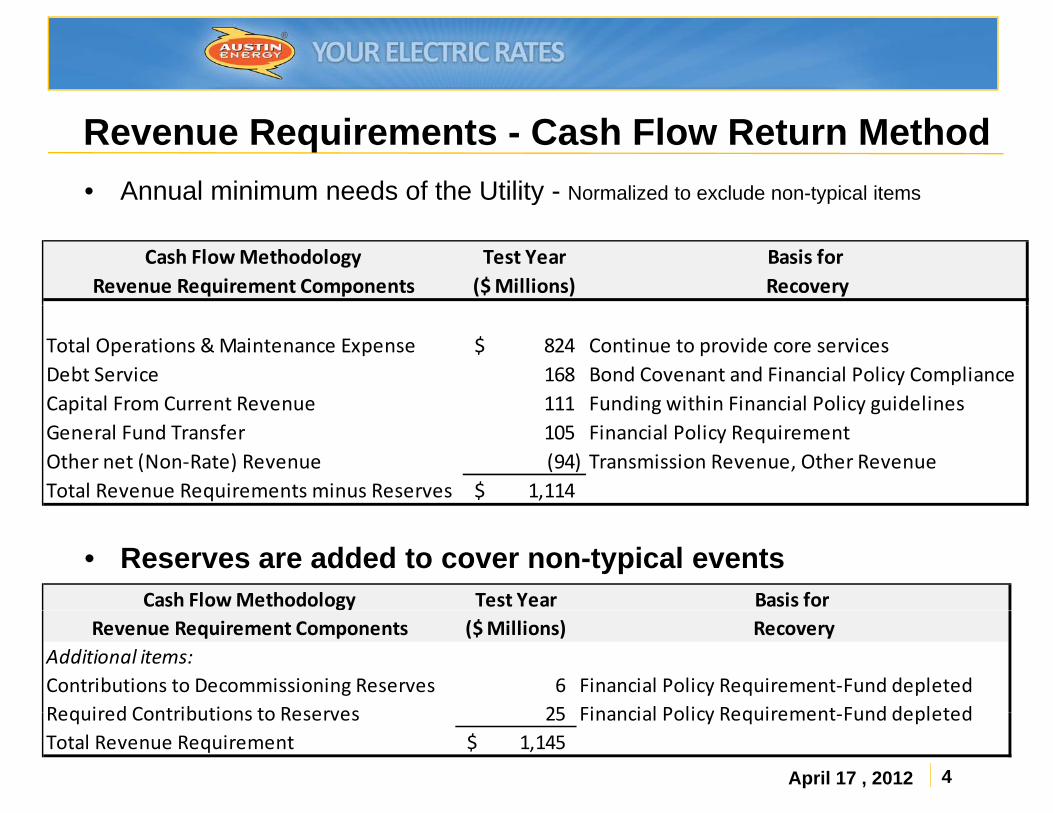
Revenue Requirements - Cash Flow Return Method• Annual minimum needs of the Utility - Normalized to exclude non-typical itemsy yp
Cash Flow Methodology Test Year Basis for Revenue Requirement Components ($ Millions) Recovery
Total Operations & Maintenance Expense 824$ Continue to provide core servicesDebt Service 168 Bond Covenant and Financial Policy ComplianceCapital From Current Revenue 111 Funding within Financial Policy guidelinesCapital From Current Revenue 111 Funding within Financial Policy guidelinesGeneral Fund Transfer 105 Financial Policy RequirementOther net (Non‐Rate) Revenue (94) Transmission Revenue, Other RevenueTotal Revenue Requirements minus Reserves 1,114$
Cash Flow Methodology Test Year Basis for
• Reserves are added to cover non-typical events
Revenue Requirement Components ($ Millions) RecoveryAdditional items:Contributions to Decommissioning Reserves 6 Financial Policy Requirement‐Fund depletedRequired Contributions to Reserves 25 Financial Policy Requirement Fund depleted
April 17 , 2012 4
Required Contributions to Reserves 25 Financial Policy Requirement‐Fund depletedTotal Revenue Requirement 1,145$

2x DSC Compared to Cash Flow M h dMethod
April 17 , 2012 5

Fitch Peer Review Ratings Report – June 2011Debt Service Coverage:
AA- Rating Median for AA- Rated Utilities 2.48
Debt Service Coverage Ratio (DSC) FY 2009 Test TestActual Year Year
With Reserves Without Reserves
Rate Revenue (Test Year at various levels) 1,033,507,095$ 1,145,071,163$ 1,114,978,025$ Oth R 132 427 698 85 966 153 85 966 153Other Revenue 132,427,698 85,966,153 85,966,153 Sub‐Total 1,165,934,794$ 1,231,037,316$ 1,200,944,178$
Operations & Maintenance 873,237,069$ 824,736,318$ 824,736,318$
Balance Available for Revenue Debt Service 292,697,724$ 406,300,999$ 376,207,861$
Revenue Debt Service 176,582,728$ 167,713,457$ 167,713,457$
April 17 , 2012 6
Debt Service Coverage (DSC) 1.66 2.42 2.24
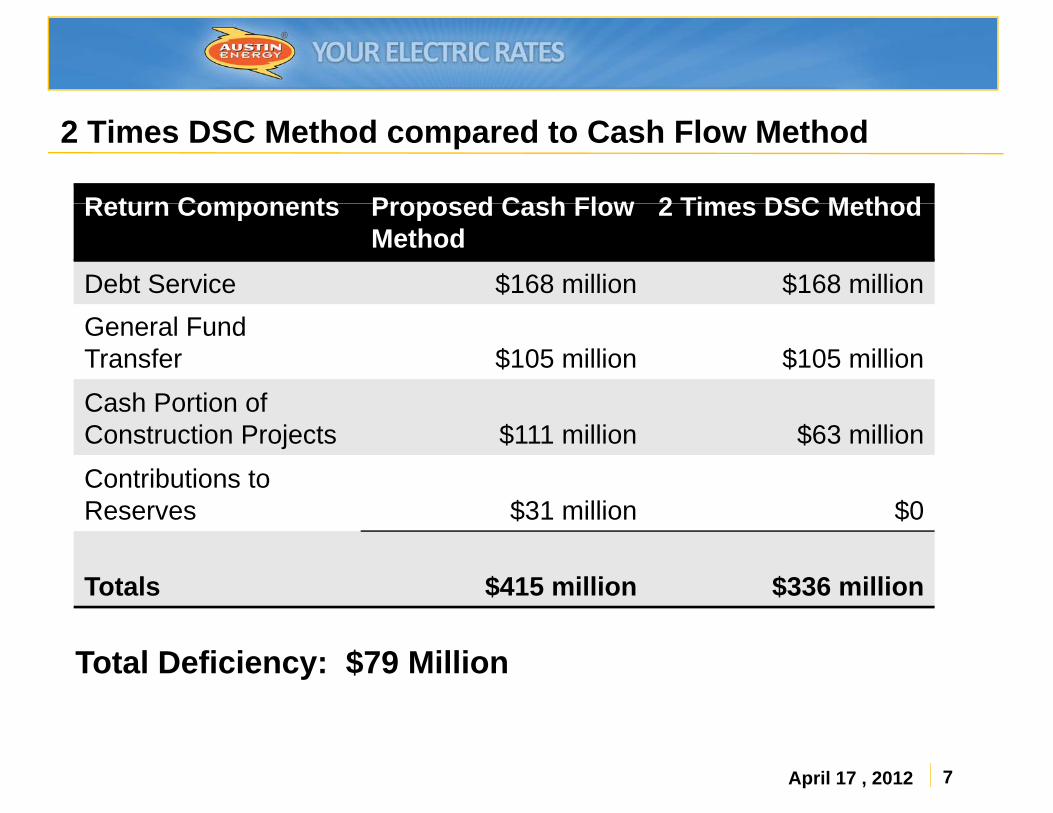
2 Times DSC Method compared to Cash Flow Method
Return Components Proposed Cash Flow 2 Times DSC MethodReturn Components Proposed Cash Flow Method
2 Times DSC Method
Debt Service $168 million $168 millionGeneral Fund Transfer $105 million $105 millionCash Portion ofCash Portion of Construction Projects $111 million $63 millionContributions to Reserves $31 million $0Reserves $31 million $0
Totals $415 million $336 million
Total Deficiency: $79 Million
April 17 , 2012 7

Increase Debt Funding of CIPIncrease Debt Funding of CIP
April 17 , 2012 8

Debt Funded Portion of Construction (CIP)
April 17 , 2012 9

Change in Reserve PoliciesChange in Reserve Policies
April 17 , 2012 10

Managing Cash
CheckbookCheckbook Savingsfor Non-Typical Events
Savingsfor Non-Typical Events
Working Capital
for Non-Typical Eventsfor Non-Typical Events
Repair and Replacement Reserve
Working Capital45 days of O&M less Fuel Strategic Reserve:
Emergency
Operating Cash
Emergency
Contingency
Rate StabilizationOperating Cash ate Stab at o
Decommissioning Reserve
April 17 , 2012 11

Financial Policy Maximums
Savingsfor Non-Typical Events
Savingsfor Non-Typical Events
Maximum for Non-Typical Events
Maximum for Non-Typical Eventsfor Non-Typical Eventsfor Non-Typical Events
Repair and Replacement Reserve
for Non-Typical Eventsfor Non-Typical Events
½ of Depreciation Expense
Strategic Reserve:
Emergency
Strategic Reserve:
60 days of O&M less FuelEmergency
Contingency
Rate Stabilization
60 days of O&M less Fuel
90 days of Power Supply Costate Stab at o
Decommissioning Reserve
90 days of Power Supply Cost
Power Plant Retirement Cost
April 17 , 2012 12

Financial Policies for Reserves
Savings for Non-Typical
Events
Savings for Non-Typical
Events
Current Savings for Non-Typical
Events
Current Savings for Non-Typical
Events
Maximum for Non-Typical
Events
Maximum for Non-Typical
EventsEventsEvents
Repair and Replacement Reserve
EventsEvents
$ 0
EventsEvents
$ 61 million
Strategic Reserve:
Emergency
Strategic Reserve:
$ 69 million
Strategic Reserve:
$ 69 milliong y
Contingency
Rate Stabilization
$ 69 million
$ 0
$ 69 million
$ 98 million
Decommissioning Reserve
$
$ 0
$
$56 million
April 17 , 2012 13

Reserve Replenishment Calculation in Revenue Requirement
• Reserve replenishment in the 2009 Test Year is $75 million:– Proposed annual recovery over 3 years = $ 25 millionProposed annual recovery over 3 years $ 25 million
– Proposed annual recovery over 5 years = $ 15 million
• Replenishment needs have increased from $75 million in the Test Year to $153 million today due to further depletion of cash in the interim:interim:
– Current annual recovery over 3 years = $ 51 million
– Current annual recovery over 5 years = $ 31 millionCurrent annual recovery over 5 years $ 31 million
April 17 , 2012 14

Operating Fund Ending Balance and Reserves
$62 $15
$19
$19
$500
Austin EnergyOperating Fund Ending Balance and Reserves(in Millions)
$169
$164
$146
$32
$46 $32
$2
$8
$12 $19
$16 $400
$222 $186 $181
$170
$168
$169 $146 $138
$138
$10 $20
$12 $4 $15
$20
$200
$300
In M
illions
$
$200 $231
$267 $247 $237
$153
$103
$157
$205 $186 $181
$170 $138
$138
$8
$100
$200
$41 $78
$149
$72 $82 $88 $107 $108 $107 $103 $126
$153 $115
$38 $0
1994 1995 1996 1997 1998 1999 2000 2001 2002 2003 2004 2005 2006 2007 2008 2009 2010 2011 2012
April 17 , 2012 15
AE Operating Fund AE Strategic Reserve Fund AE Repair & Replacement Fund Non‐nuclear Decommissioning Account

Rate Stabilization Replenishment Calculation
• Financial Policy Maximum = 90 days of Power Supply Cost– 90 days = $98 million90 days $98 million
– 60 days = $65 million
• Reducing the Rate Stabilization maximum from 90 days to 60 days decreases the Revenue Requirements
– Amortize savings over 3 years = $11 million
A ti i 5 $ 7 illi– Amortize savings over 5 years = $ 7 million
• Contributions to Reserves in the Revenue Requirements would be:Annual recovery over 3 years = $ 14 million– Annual recovery over 3 years = $ 14 million
– Annual recovery over 5 years = $ 8 million
April 17 , 2012 16

Change in General Fund T fTransfer
April 17 , 2012 17

General Fund Transfer Calculation
12% transfer rate on non-fuel (3 year average) revenue, with GFT $105M floor until 12% = $105M
• GFT increases reflect true revenue growth• GFT increases reflect true revenue growth
• Improves certainty in forecasts; removes fuel volatility
Addresses Electric Utility Commission issue on fuel in GFT• Addresses Electric Utility Commission issue on fuel in GFT
• Establishing floor of $105M mitigates impact on General Fund of changing to 12% on non-fuel revenueFund of changing to 12% on non fuel revenue
• Simplified calculation
April 17 , 2012 18

2011 Audited Financials Compared t th T t Yto the Test Year
April 17 , 2012 19

Income Statement
F th di S t b 30For the year ending September 30(In Thousands) 2009 2010 2011Operating Revenues 1,162,286$ 1,147,676$ 1,249,139$
O i E 869 247 887 152 932 802 Operating Expenses 869,247 887,152 932,802
Depreciation 114,172 121,570 132,077
Net Operating Income 178,867$ 138,954$ 184,260$
Nonoperating & Other Revenue (Expense) (18,798) 138 7,595
Interest Income 17,402 9,740 9,732
Interest Charges and Other Expense (86,530) (80,030) (81,823)
Net Income before Contributions and Transfers 90,941$ 68,802$ 119,764$
Contributions 5,956 4,856 10,261
Transfers to General Fund (95,000) (101,000) (103,758) ( ) ( ) ( )
Net Income (Loss) 1,897$ (27,342)$ 26,267$
April 17 , 2012 20

Operation and Maintenance Expenditures
FY 09 Test Year FY 11 PreliminaryPower production $168.23 MM $163.89 MMTransmission $77.82 MM $78.30 MMDistribution $49.04 MM $46.55 MMCustomer and Information $45.54 MM $46.09 MMGeneral and Administrative $104 69 MM $106 49 MMGeneral and Administrative $104.69 MM $106.49 MMTotal O&M $445.32 MM $441.32 MM
• O&M costs excludes recoverable fuelO&M costs excludes recoverable fuel
• FY 2011 O&M Costs was within 0.90 % FY 2009 Test Year
• FY 2011 does not include all Know and Measurable adjustments jthat would be made if FY 2011 was used as a Test Year
April 17 , 2012 21

Preliminary Comparison of Revenue RequirementsFY 09 Test Year FY 11 Preliminary
Total Operations & Maintenance $445 MM $441 MMTotal recoverable fuel $375 MM $442 MMOther Revenue and Expenses $(90) MM $(83) MMDebt Service $168 MM $165 MMGeneral Fund Transfer $105 MM $105 MMCapital From Current Revenue $111 MM $99 MMp $ $Required Contributions to Reserves (3 Year Recovery)
$25 MM $51 MM
Contributions to Decommissioning $6 MM $6 MMReserves (10 Year Recovery)Total Revenue Requirements $1,145 MM $1,226 MMNotes:
FY 2011 Preliminary numbers do not include Period 13 adjustments
FY 2011 CIP Expenditure reflects one-time project deferrals
FY 2011 does not include all Know and Measurable adjustments that would be made if FY 2011 was used as a Test Year
GFT is based on the FY 2012 budget
April 17 , 2012 22
GFT is based on the FY 2012 budget

Off System SalesOff System Sales
April 17 , 2012 23

ERCOT Zonal Market – Prior to December 1, 2010
• Balanced schedules were submitted to ERCOT with equal amounts of energy sales obligations and generation resources
• Excess generation, generation greater than load, was sold to other market participants when it was economical to do so and such transactions were recorded as “off system”so and such transactions were recorded as off-system” sales
• Off-system sales were scheduled as discrete transactionsOff system sales were scheduled as discrete transactions and easy to account for
• Over time, as AE load increased available excess generation decreased and correspondingly the amount of off-system sales decreased
April 17 , 2012 24

ERCOT Nodal Market – Starting December 1, 2010
• ERCOT forecasts load for the entire system
• Centralized ERCOT Generation Dispatch– Balanced schedules no longer submitted to ERCOT
– Offer all generation to ERCOT for centralized dispatch
ERCOT dispatches all available generation from least cost to most– ERCOT dispatches all available generation from least cost to most expensive to meet the ERCOT load forecast
• Austin Energy generation serves the ERCOT system load– No longer matching of AE generation with AE customer load
• AE generation in any 5 minute interval may be more or less than AE customer loadthan AE customer load
– Traditional Concept of Excess Generation (off-system sales) no longer exists in the ERCOT system
April 17 , 2012 25

Summary
• Traditional concept of off-system sales no longer applies in the nodal market
– Austin Energy no longer balances its own customer load and– Austin Energy no longer balances its own customer load and generation
– Generation serves the ERCOT market
– Energy is purchased through ERCOT
– Energy is sold through ERCOT
• Overall AE is a net buyer of energy not a net seller• Overall AE is a net buyer of energy, not a net seller
• Value to AE and customers is the Net ERCOT Settlement (i.e., net ERCOT sales revenue)( )
– Benefit of generation ownership and sales flows back to customers through fuel charge
April 17 , 2012 26

ERCOT Market Changes Driving Fuel Policy Recommendation
All ERCOT sales revenue directed to customers through theAll ERCOT sales revenue directed to customers through the fuel charge
• Test Year Adjustments to 2009 Off System Sales:Test Year Adjustments to 2009 Off System Sales:Test Year Normalization of Load & Resources (Off-system sales):
– Step 1: Remove off-system sales revenue and related off-system fuel expense from test year ($44 million)
– Step 2: Model test year load requirements needed to serve customers and AE fuel costs for owned generation
– Step 3: Adjust test year with the simulated results (replacing off-system sales revenue and associated fuel costs) ($66 million)
April 17 , 2012 27

QuestionsQuestions
April 17 , 2012 28