2011 USAID Education Strategy Reference Materials
84
2011 USAID Education Strategy Reference Materials Revised April 2012
Transcript of 2011 USAID Education Strategy Reference Materials
2011 USAID Education Strategy
Reference Materials
Revised April 2012

2
Contents 1.0 Evaluation Methods and Methodology ......................................................... 3
Recent Studies Related to Learning Outcomes ................................................... 3
Performance or Impact Evaluation Design and Timing........................................ 3
Assessments ....................................................................................................... 4
2.0 Summary of Evidence on Primary Grade Reading .......................................... 6
3.0 Literature Reviews ........................................................................................ 9
4.0 Other Resources for Early Grade Reading .................................................... 10
5.0 Further Reports and Case Studies on Early Grade Reading .......................... 11
Resources Related to Education in Crisis and Conflict ....................................... 13
Comments on Questions Raised by the USAID Education Strategy Review 2010
......................................................................................................................... 18
Studies Referenced ........................................................................................ 28
Related Papers and Data ................................................................................ 30
Improved Learning Outcomes in Donor-Financed Education Projects: RTI’s
Experience ........................................................................................................ 31
School Resources and Educational Outcomes in Developing Countries: A Review
of the Literature from 1990 to 2010 ................................................................. 37
References ..................................................................................................... 74
Appendix I: Search Terms .............................................................................. 77
Appendix II: The 79 Studies Examined in This Paper ...................................... 79

3
1.0 Evaluation Methods and Methodology
Recent Studies Related to Learning Outcomes In recent years, evaluations using randomized control trial (RCT) have assessed a variety of
education interventions. In many cases, these studies have produced evidence of significant
effects on student learning outcomes, including reading achievement, related to some of the
interventions and that evidence can be used as part of USAID education program design. In
addition to RCTs, quasi-experimental1 and other quantitative methods, as well as some forms of
qualitative research, also provide valuable evidence for program design and outcome
measurement. Other types of qualitative approaches provide important contextual and
conceptual information to enrich program design and deepen understanding of program
outcomes. It is expected that most USAID program evaluations will include a mix of evaluation
methodologies.
Several reports from RCTs and related studies, all of which contribute to the knowledge of ―what works‖ to improve learning outcomes, particularly with regard to primary grade reading,
are included in Reference Materials, including:
A literature review of studies meeting certain methodological criteria, published
between 1990 and 2010, and housed in the Education Resources Information Center
(ERIC) database on the impact of school-level inputs, e.g. books, teacher training, hours
etc. and teacher characteristics on student learning outcomes in developing countries.
A summary of many randomized control trial-based studies in developing countries evaluating a range of interventions designed to improve learning outcomes, e.g.
instructional materials, remedial and computer-aided instruction, increasing instructional
time, student and teacher attendance and teaching methods.
A review of the Research Triangle Institute’s experiences in improving the reading levels
of primary grade students in externally and government-financed education programs.
These studies are meant to serve as examples of rigorous research that can be used along with
other research to inform program design. RCT evaluations are contextually designed and any
successful attempts at replicating interventions ―proven‖ to work in one context have to be
carefully scrutinized to control for contextual factors that could influence outcomes.
A formal evaluation system needs to be in place to track progress against a program’s full set of
expected results. This is related to, but separate from operational performance reporting.
Stakeholders should periodically review progress. Reviews should be inclusive and be built into
program design from the beginning. Additional details regarding performance monitoring and
performance and impact evaluation is available in both the Implementation Guidance and the
Technical Notes documents.
Performance or Impact Evaluation Design and Timing The directly attributable number of students that will demonstrate reading gains is the total
number of students reached by USAID (or USAID jointly with other donors and host
governments) programming. Indirect beneficiaries include learners where an agreement about
1 For example: difference-in-difference, regression discontinuity, instrumental variables, and propensity score matching.

4
taking a USAID-funded pilot, intervention, or program to scale exists between USAID, the host
country and/or another donor(s), where USAID provided only a portion of the funding for a
given program in partnership with donor and country partners and/or where USAID leadership
results in other funders supporting program scaling or sustainability. It is the job of the
performance or impact evaluation, using either a cross-sectional or longitudinal design, with or
without random assignment to treatments, to confirm that the programming had the intended
positive impact on reading outcomes.
Confirmation that the programming has indeed had the intended positive impact on learning
requires a comparison between a baseline and end line (pre-test, post-test) score on a reading
test designed so that change can reasonably be attributed to the programming rather than
other extraneous factors. Whatever change is agreed upfront to be acceptable evidence of
―improved reading skills‖ (see next section) is measured at the level of the individual student.
Unless the evaluation is a census of all students, the observed change in reading skills of the
students in the sample will be the best estimate of the impact of programming on all students
reached by USAID programming.
The baseline must be done before USAID interventions begin when possible. If a
sufficiently rigorous assessment has been done within a year of the project start-up, and
there is reason to believe that reading skills have not changed substantially in that time,
then it can be used. Assessments done earlier are helpful to motivate demand for
change, but their use for baseline data may weaken the inferences that can be drawn re
program impact.
Midline data is essential to ensure that programming is being effectively implemented, but internal monitoring systems are likely to be more affordable to implement and more
easily able to collect appropriate contextual data than another large scale reading data
collection effort.
Key to assessing performance at the end-point is ensuring comparability with the
baseline data collection. For example, if a cross-sectional evaluation design is used, at
end line, the assessments must be done at the same grade level(s) and at the same
points in time as the baseline data were collected. Data should be collected at or near
the end of the intervention, using an assessment that is equated to the one used at
baseline. One approach to ensuring comparability is to develop an item test bank up
front, or several versions of the complete assessment tool.
In all cases, care must be taken to ensure confidentiality of assessments instruments. It should
be made clear to host country governments and partners that data should not be used for high
stakes performance or other evaluations of individuals or particular units of the system. At the
same time, data should be used for general, system-focused approaches to incentives and
accountability.
Assessments ASER and EGRA are the two best known oral assessments. Both have been used in a growing
number of countries. ASER is the easiest to implement individually administered test, but has
non-continuous properties. EGRA is continuous, but requires more test administration skill as
it involves counting words read per minute. Work continues on both to deepen measures of

5
comprehension. Other assessments can also be used, as long as they have sufficient,
documented levels of reliability and validity. Relying on national exams can be problematic, as
there are many issues with content, corruption, and screening, but decisions should be made in
collaboration with governments and other donors. While written assessments for the final
primary grade are the norm in most countries, in countries with low levels of student learning
there may still be a need for oral assessment at the end of primary.
Most assessments provide an overall score as well as several sub-scores. Those sub-scores are,
in effect, a description of what various scores along the continuum of low to high mean, e.g. a
high score means reading a certain number of words per minute, while a low score means
letter recognition, etc. 2
2 These indicators might include measures of non-readers (e.g., percentages of children who cannot recognize a single letter or
single word), letter recognition, word recognition, fluency, comprehension, and/or grade level literacy.
6
2.0 Summary of Evidence on Primary Grade
Reading In the past decade, primary school enrollment has increased significantly worldwide, but
children in low-income countries complete primary school at only 67% of the rate of high-income countries, and many studies have shown that these children are learning very little. In
Mali, Pakistan, and Peru, reading assessments have indicated that more than 70% of primary
school children are unable to read at their grade level.3,4 Children who do not learn to read in
the primary grades are less likely to perform well in higher grades and thus have limited
economic and developmental opportunities. The Progress in International Reading Literacy
Study (PIRLS) indicates that the average child in a developing country scores at the 5th
percentile of children in OECD countries. Research suggests that these astoundingly low
learning levels are impeding economic growth; with recent studies showing that a 10% increase
in the share of students reaching basic literacy has been demonstrated to translate into a 0.3
percentage point higher annual growth rate for the country.5
Goal 1 builds upon USAID’s long experience in primary education and more recent leadership
in supporting interventions to improve school quality, as measured through learning outcomes.
It recognizes that learning takes place at all levels, but adopts a particular focus on primary
grade reading improvement as the foundation for future learning. Though it is clear that
children’s future economic potential depends not just on reading instruction, effective reading is
a critical and necessary pre-condition for skill development in all other areas and, as such, will
be the primary target by which USAID holds itself accountable for results in basic education. 6
Learning to read is the foundation for future learning at all levels and in all subjects and is a key
contributor to all measures of education quality. Despite this, many educational systems
around the world are failing to equip learners with the necessary skills to learn to read, much
less read to learn. In many developing countries, the reading curriculum is not well-designed
and teacher preparation and professional development programs do not always teach teachers
how to teach children to read explicitly and directly. Rather, many systems assume that reading
will be acquired through the teaching of language-related skills such as spelling and dictation.
We now know that this is not the case, especially for children who have had minimal or no
exposure to print before arriving at school and are often expected to learn to read in a
language they do not speak or understand.
Though there is no single recipe for improving reading outcomes for all contexts, there is a growing consensus among international education researchers and practitioners as well as a
body of research from developed country contexts that argues for well-structured direct
instruction of reading. Some of the most common recommendations for improving instruction
are:
3 J. Das, P. Pandey, and T. Zajonc, Learning Levels and Gaps in Pakistan. World Bank Policy Research Working Paper 4067. The
World Bank, (2006). 4 USAID, EQUIP 2, Opportunity to Learn: A High Impact for Improving Educational Outcomes in Developing Countries, (2008).
5 Erik Hanushek, and L. Woessmann, National Bureau of Economic Research, Do Better Schools Lead To More Growth?:
Cognitive Skills, Economic Outcomes, and Causation, NBER Working Paper 14633, (2009). 6
For more information on USAID’s current and past programming see the Ed Data II website at: https://www.eddataglobal.org/index.cfm

7
1. Teaching Technique and Instructional Approach: Initial teacher preparation and
professional development for effective reading instruction should focus on the
systematic, language-specific teaching of letters and sounds, and appropriate
instructional routines to teach the five major component skills of reading instruction in
alphabetic languages: phonemic awareness, phonics, fluency, vocabulary, and
comprehension. All should be taught every instructional day. Ongoing professional
development should be regularly provided to teachers by existing education system staff,
who should coach and mentor teachers in classrooms to ensure effective instructional
approaches are implemented in a high fidelity fashion.
2. Texts and Materials: Effective reading textbooks and, in many contexts, daily lesson
plans, should be distributed to teachers in conjunction with teacher preparation and/or
professional development as described above. Leveled and decodable readers7,
including non-fiction texts, and/or story cards (low-cost sheets with text and pictures),
with multiple titles per reader, should be available in every classroom to engage students
at their skill level, which may be different than what the curriculum anticipates for their age/grade. Students should be encouraged to take materials home for additional
practice.
3. Language of Instruction: As reading is a process of learning to match sounds to
symbols (letters), it is much easier for students to learn to read in a language they speak
and understand. A strong foundation in a first language, especially during the early years
of school, is crucial to educational success.8 In countries where appropriate language
policies exist, USAID projects should be designed in accordance with these
policies. Where appropriate policies do not exist, USAID should engage in policy
dialogue with host country governments and partners in an attempt to improve policy,
as on other technical issues.9 Transitional bilingual programs are used in many
countries; students should not transition to reading instruction in a second language
until they are solid readers in a language they understand and have oral language
competency in the new language. Successful transition programs are well-structured
and include the direct instruction of unfamiliar letters and sounds, as well as extensive
vocabulary and comprehension instruction.
4. Assessment and Testing: Classroom-based, teacher-led assessment is the
cornerstone of effective instruction. Teachers should have clear expectations for
student learning and the tools to track achievement. Classroom coaches and
supervisors should assess students during their regular coaching and mentoring visits. In
addition, national assessment systems that measure reading skills with sufficient level of
differentiation to track changes at lower levels of skills as well as progress within the
7 A leveled reader is one that is appropriate for a given grade level; it provides appropriate support and challenge for the
development of reading skills in a given context. Readers that are decodable are designed to be easy for a child to decipher, i.e. through phonics. 8 Jenny Perlman Robinson, A Global Compact on Learning: Taking Action on Education in Developing Countries (Washington DC:
Brookings, 2011). http://www.brookings.edu/~/media/Files/rc/reports/2011/0609_global_compact/0609_global_compact.pdf 9 Studies, evaluations, visits and pilot projects, among other approaches, should be considered as possible sources of input for
policy decisions.

8
curriculum and periodic Early Grade Reading Assessment (EGRA) or Assessment Survey
Evaluation Research (ASER)-type tests should be used to measure system progress10.
Conduct randomized control trials (RCT’s) for replications and scale-ups.
5. Time Use: Reading should be taught as a subject for at least one hour per
instructional day. Additional time should be set aside for reading practice, in and out of
school. Involve parents and students in improving student and teacher attendance.
6. Tracking: Teach students at their level. Use differentiated instruction or remedial
programs to ensure students master foundational skills before moving on. Use
curricular expectations to guide teacher-led assessment and differentiate instruction for
students at different levels. Consider support for regrouping classes by skill level, at
least in the early stages of reading instruction.
7. Community and Parental Support: Develop supplemental materials
collaboratively, help communities to assess student learning, support the training and use of teacher aides inside classrooms and tutors after school hours, and help parents
to understand curricular expectations and how to support their young students in
school, even if they cannot read themselves. Learning to read well requires hours of
reading practice, much of which will have to take place outside of school hours, and
varied materials, not all of which are likely to be supplied by schools in resource-poor
contexts.
8. Use of Technology: As appropriate, USAID support can integrate technology into
early grade reading programs and activities. For example, in Liberia and the Philippines,
video is being tested to upgrade teachers’ professional skills. Other examples of
technology use for literacy include: national radio and video broadcasts; SMS for teacher
support and supervision, computers and hand-held devices for conducting early grade
reading assessments; e-readers; and using mobile phone applications.
10
See: https://www.eddataglobal.org/reading/index.cfm and www.asercentre.org
9
3.0 Literature Reviews Included in this, there are three recent reviews of evidence on primary grade reading. The first,
Glennerster, R. Grossman, D. Takavarasha, K.: 2010 Comments on Questions Raised by the
USAID Education Strategy Review was a response to the PPT as part of the USAID informal
evidence summit. The review summarizes evidence from RCT’s. An extensive bibliography is
provided. The second paper, RTI 2011: Improved Learning Outcomes in Donor-Financed
Education Projects: RTI’s Experience was also requested by the Agency and summarizes work
that RTI has implemented, evaluated, or used as inspiration. The third paper, Glewwe, P and
Hanushek, E. School Resources and Educational Outcomes in Developing Countries: A Review
of the Literature from 1990 to 2010 (forthcoming), is a very ambitious literature review of all
studies on effects of educational inputs (books, teachers, etc) on pupil outcomes cited in the
ERIC between 1990 and 2010 in developing countries that met certain quality standards.
Starting with over 9,000 studies, 79 were selected as being of adequate quality; 49 were
identified as high quality having a research design that included an effort to control for initial
differences; and finally, the 13 more rigorous evaluations, i.e. those using randomized control
trial designs.11
11
All articles and other resources are available on the USAID intranet at: http://inside.usaid.gov/EGAT/offices/edu/education_toolkit/index.cfm

10
4.0 Other Resources for Early Grade Reading USAID, ―EdData II: Education Data for Decision Making‖ (Washington, DC:
USAID, 2011).
EdData II, sponsored by the United States Agency for International Development (USAID),
provides survey expertise to help national and local governments as well as the donor
community to assess education status. Project advisors collaborate with USAID Missions, other
donors, and stakeholders to find innovative and cost-effective ways to gather and analyze
education data. They can then jointly establish relevant benchmarks that help governments,
schools and school districts, teachers, and parents or guardians provide meaningful education
for their children.12
Gove, Amber and Peter Cvelich, Early Reading: Igniting Learning for All, A Report by
the Early Grade Reading Learning Community of Practice (Research Triangle Park,
NC: Research Triangle Institute, 2011).
Many low-income countries are unable to teach all of their students to read during the early
grades of primary school. This contributes to low rates of economic growth. This report
highlights the efforts of individuals and organizations currently working to end the reading crisis.
Children need to learn to read in grades 1-3 so they can ―read to learn‖ in the upper primary
grades. Measurement of reading outcomes is the first step to addressing the problem. Efforts
to improve reading must include community- and policy-level dialogues to create contexts and
policy environment conducive to improving instruction.13
Roskos, Kathy et al. First Principles for Early Grades Reading Programs in Developing
Countries (American Institutes for Research, 2009).
Early grades reading programs should support active teaching and learning in beginning literacy.
The First Principles take into account the idea that oral language is the foundation of early
literacy success and emphasize the important of incorporating multiple forms of cognitive,
emotional, and social support to strengthen the development of pre-reading and early-reading
skills. With tips on how to draw connections between the classroom and everyday life, these
First Principles can be adapted to local setting to help educators overcome the numerous
challenges that exist in setting up early literacy programs.14
12
https://www.eddataglobal.org/ 13
https://www.eddataglobal.org/ 14
http://www.equip123.net/docs/e1-EarlyGradesToolkit.pdf

11
5.0 Further Reports and Case Studies on Early
Grade Reading Piper, Benjamin & Medina Korda,―EGRA Plus: Liberia, Program Evaluation
Report‖ (North Carolina: RTI & The Liberian Education Trust for USAID/Liberia, 2010).
This report is an impact evaluation of the EGRA Plus program at project completion, and it
presents compelling evidence that a targeted reading intervention focused on improving the
quality of reading instruction in primary schools can have a remarkably large impact on student
achievement in a relatively limited amount of time.
Malawi - USAID/Malawi. ―Task Order for the USAID/Malawi’s Teacher Professional
Development Support (TPDS) Activity‖. RFTOP. The technical assistance requested in
this RFTOP was aimed at implementing teacher education support and systems management,
with an emphasis on completing and reinforcing its introduction of the Primary Curriculum and
Assessment Reform (PCAR). Key components of the effort focused on strengthening teacher
management and support systems, enhancing teacher performance, improving early grade
literacy and numeracy for in and out of school going children and improving primary education-
related monitoring and evaluation systems and quality. While the overarching activity was on
teacher professional development, EGR was both a specific component of the activity
(assessment) and a follow-on cross-cutting area.
USAID/Mali, ―Improved Quality of Instruction to Reinforce Literacy and Numeracy
in Grades 1-6,‖ (Mali: USAID, 2008)
This Task Order is to improve the quality of instruction in Mali, with an emphasis on addressing
Mali’s low literacy rates through high-quality pre-service and in-service teacher training to Mali’s
approximately 33,000 primary school teachers, and expand the use of information technology
as a means to provide educational opportunities and literacy skills to Mali’s school-aged
population.
Alidou, Hassana, et al., ―Optimizing Learning and Education in Africa: The
Language Factor,‖ Paris, France: Paper for Presentation Association for the
Development of Education in Africa Biannual Meeting, 2006).
Insights on mother tongue and bilingual language instruction, and connections between
language, education and development. 15
Ghana Teacher Community Assistant Initiative (TCAI) 2010-2011. 16
An early grade remedial program with Ghana Teachers Association, Ghana education Services,
and National Youth Employment Program to improve reading and math in conjunction with
NALAP. The program is an adaptation of one of Pratham’s Read India to the Ghanaian context.
School committees are empowered to hire and monitor community teacher assistants who are
trained for a short time (4-15 days) to teach basic literacy and numeracy to the bottom-half of
the class in daily break-out remedial sessions.
15
http://www.unesco.org/education/uie/pdf/OptimizingEducationAfrica_ExecSummary_21Feb06.PDF 16
http://inside.usaid.gov/EGAT/offices/edu/education_toolkit/index.cfm

12
Korda, Medina and Ben Piper, EGRA Plus Liberia: Final Program Evaluation Report
(Liberia: 2011).
Presents results of an impact evaluation of the EGRA Plus: Liberia targeted reading intervention
program, at project completion. 17
RTI, Task Order 7 NALAP Formative Evaluation Report, (North Carolina: RTI
International, 2011)
This is an assessment of the ground-breaking National Literacy Acceleration Program (NALAP)
in Ghana. This program was designed to provide the education system with the materials and
training to properly implement a mother tongue policy for early grade reading using locally
developed materials and teachers’ guides. More than 5 million textbooks in 11 Ghanaian
languages have been published and distributed and more than 80,000 teachers have been
trained. The Breakthrough to Learning project yielded 70% of students and teachers in pilot
schools with good to excellent progress.18
Pinnock, Helen with research by Gowri Vijayakumar, ―Language and Education,
the Missing Link: How the Language Used in Schools Threatens the Achievement
of Education for All,‖ (CfBT and Save the Children, 2009)
The report considers the extent to which language used for teaching and learning can be a key
barrier or enabler in achieving national and international education commitments. It examines
the most appropriate policy and investment actions for national governments and discusses the
challenges which might be experienced in pursuing good practice around school language. It
assesses the extent to which donor agencies are supporting or undermining efforts to address
problems with school language, and presents recommendations for international collaboration
to produce more strategic action to remove language barriers which keep many children from
progressing through education.19
Prouty, For Girls, ―Learning is a Matter of Life and Death,‖ (Education for All Blog:
Washington, DC, May 10, 2011).
Just teaching a girl to read can cut under-5 death rates in half. Anyone who is serious about
health has to be serious about education (and vice versa). Schooling matters, but reading
matters more. If teachers don’t know how to teach reading, or the class is taught in a language
no one understands, or the books never show up, lives are lost.20
EDC, ―Tuned in to Student Success: Assessing the Impact of Interactive Radio
Instruction for the Hardest-to-Reach,‖ (EDC).
A compilation of assessments of 15 EDC IRI projects that reached students in varying grades
and living conditions in countries such as India, Pakistan, Somalia, and Haiti. In the majority of
cases, students who engaged in IRI had an advantage over students who did not. IRI classrooms
demonstrated learning advantages in approximately 80 percent of the 37 cases analyzed.21
17
https://www.eddataglobal.org/documents/index.cfm?fuseaction=pubDetail&ID=283 18
https://www.eddataglobal.org/documents/index.cfm?fuseaction=pubDetail&ID=303 19
http://toolkit.ineesite.org/toolkit/INEEcms/uploads/1024/Language_and_Education_the_Missing_Link.pdf 20
http://www.educationforallblog.org/issues/girls-education/for-girls-learning-is-a-matter-of-life-and-death 21
www.edc.org ; http://www.edc.org/newsroom/articles/radio_instruction_gets_good_reception

13
Resources Related to Education in Crisis and Conflict In addition to the resources listed in the assessment section the following tools and resources
provide important guidance for programs implemented under Goal 3.
General
UNESCO/IIEP, Guidebook for Planning Education in Emergencies and Reconstruction (2010)
Conflict
USAID, Conflict Mitigation and Management Policy, (2005)
Cross-cutting issues Disaster Risk Reduction
Kobe, Hyogo. United Nations International Strategy for Disaster Reduction:
http://www.unisdr.org/.
INEE. (2009). INEE Toolkit: Disaster Risk Reduction and Preparedness
UNISDR. (2007). Words into Action: A Guide for Implementing the Hyogo
Framework
INEE Safer School Construction Initiative
INEE Guidance Notes on Safer School Construction
United States Department of Education. (2008). A Guide to School Vulnerability
Assessments: Key Principles for Safe Schools.
Early Childhood Development
INEE. (2010). INEE Minimum Standards Toolkit: Early Childhood Development
Website on Early Childhood Development in Emergencies
Save the Children International. (2007). The Unique Needs for Children in
Emergencies: A Guide for Inclusion of Children in Emergency Operation Plans
Gender
IASC Gender Handbook in Humanitarian Action. (2007). Women, Girls, Boys & Men. Different Needs – Equal Opportunities
IASC Guidelines on GBV in Humanitarian Settings. (2005)
INEE Pocket Guide to Gender (2010)
HIV/AIDS
IASC Guidelines on HIV in Humanitarian Settings, 2010
Inclusive Education and Disability
INEE. (2009). Education in Emergencies: Including Everyone. INEE Pocket Guide to
Inclusive Education
Save the Children, UK. (2008). Making Schools Inclusive: How Change Can Happen
Psychosocial
14
Christian Children’s Fund. (2008). Starting up Child Centered Spaces in Emergencies
IASC Guidelines on Mental Health and Psychosocial Support in Emergency Settings, 2007
Save the Children, USA. (2007). Safe Spaces Program Manual
Youth
Child Trends. (2008). A Guide to Resources for Creating, Locating and Using Child and Youth Indicators Data
INEE Minimum Standards Toolkit: Adolescents and Youth
Women’s Refugee Commission. (2008). Marked Assessment Toolkit for Vocational
Training Providers and Youth
Political Violence, Crime and Gang violence
LAC/RSD’s 2006 Central America and Gang Assessment
Human Development Report for Central America 2009-2010: Opening Spaces to
Citizen Security and Human Development
World Bank Report on Crime and Violence in Central America 2011
Forthcoming UNDP Human Development Report on Citizen Security anticipated to be
published this summer. A fact sheet can be found here.
UN’s Office on Drugs and Crime Regional Organized Crime has produced regional
assessments of organized crime. The most recent include regional assessments of West
Africa and Central Asia. Transnational Crime in the West Africa Region, An Assessment of Transnational Organized Crime in Central Asia.
State Department’s International Narcotics Control Reports (Volume I & Volume II) and
the UN’s Office on Drugs and Crime World Drug Report (2011)
The 2010 Americas Barometer report can be found here.
Gender Resources
TIPS for integrating Gender into USAID Education Sector Solicitations USAID Website on Gender Equality and Women’s Empowerment
The Uganda Action Plan on UN Security Council Resolution 1325 & 1820 and the Goma Declaration
The ADS and Gender
The following resources can be accessed via: http://www.ungei.org/index_2825.html
General Resources address all three education strategy goals and provide language of gender integration.
DeJaeghere, J.G. 2004. Background Paper for Workshop 1: Quality Education and Gender Equality. Paper presented at the International Conference on Education, 47th
Session, August 13, Geneva.
Grown, Caren & Geeta Rao Gupta. Tacking Action: achieving gender equality and
empowering women. UN Millennium Project, Task Force on Education and Gender
Equality.
N.A. 2010. Practicing Gender Equality in Education. Oxfam.
15
N.A. 2005. Promising Practices and Implications for Scaling up Girls’ Education: report
of the UN Girls’ Education Initiative. South Asia Workshop held in Chandigarh, India 20-
22 September 2004, UNGEI.
N.A.2005. Scaling up Good Practices in Girls’ Education. UNESCO.
N.A. 1997. Education and Poverty: A Gender analysis. Report No. 53, Swedish
international Development Cooperation Agency. SIDA.
Goal One Resources that address gender-related issues in teacher training, curriculum design, literacy, and
classroom management.
N.A. 2002. Report on Gender and Curriculum Workshop: Integrating Gender into the Level I Basic Education curriculum in the republic of Mali. Final report (Phase II) USAID.
N.A. 2007. Se Si – Gender in Irish Education. Department of Education and Skills.
Abril, Paco et al. 2008. Gender Loops Toolbox for gender-conscious and equitable early
childhood centres. Catholic University for Applied Science.
Aksornkool, Namtip. 2004. Gender Sensitivity: a training manual for sensitizing
education managers, curriculum and material developers and media professionals to
gender concerns: Empowerment of women farmers. UNESCO.
Barwell, R. et al. 2007. Implementing curriculum change to fight poverty and promote gender equity: mathematics and science education in South Africa. Implementing
curriculum change: literature reviews – South Africa, Rwanda, and Pakistan EdQual
Working Paper No. 6. University of Bristol.
Blumberg, Rae Lesser. 2007. Gender bias in textbooks: a hidden obstacle in the road to
gender equality in education. Background paper for the Education for all global
monitoring report 2008: Education for all by 2015: will we make it? UNESCO.
Brugeilles, Carole & Sylvie Cromer. 2009. Promoting gender equality through textbooks:
A methodological guide. UNESCO.
Chege, Rose. 2004. A curriculum for the training of trainer in gender mainstreaming.
African Womens Development and Communications.
Chisholm, Linda. 2005. Gender Equality and Curriculum. The Beyond Access Project.
Dam, Geert Ten. (n.d.)The gender inclusiveness of a women’s history curriculum in secondary education. Women’s Studies International Forum, Vol. 20, No. 11997.
Halai, Anjum. 2010. Gender and Mathematics Education in Pakistan: A situation Analysis.
TMME, Vol. 7(1) pp. 47-62.
Jung, Kynugah & Haesook Chung. 2006. Gender equality in classroom instruction: introducing gender training for teachers in the republic of Korea. UNESCO: Bangkok.
Manzenreiter, Wolfram. 2004. Physical Education and the curriculum of gender
reproduction: Making body regimes in Japan.
Marshall, Harriet & Madeleine Arnot. 2008. Globalizing the School Curriculum: Gender, EFA, and Global Citizenship Education. RECOUP, University of Cambridge.
Mattu, Aamna. 2004. Gender Biases and Stereotypes in School Texts. Human Rights
Education in Asian Schools. Vol.: VII.
Mirza, Munawar. 2004. Gender analysis of school curriculum and text books. UNESCO: Islamabad.

16
Mlami, P. et al. 2005. Gender Responsive Pedagogy – A Teacher’s Handbook. Forum for
African Women Educationalists.
Nilsson, Jan. 2007. Sweden case study report 2. Developing a School Curriculum for Gender Equality. Malmo University.
Population Council. 2009. It’s all one curriculum: Vol 1&2: Guidelines for a unified
approach to sexuality, gender, HIV and human rights.
Quezada-Reyes, Zenaida. 2000. The Philippines: An agenda for Gender-Fair Education.
Sadker, David. 1999. Gender Equity: Still knocking at the classroom door. Educational
Leadership. Vol 56, April.
Vendramin, Valerija. 2003. Gender Equality in education systems: curricula framework documents. Background paper for Education for all global monitoring report 2003/4:
Gender and education for all: the leap to equality. UNESCO
N.A. 2010. Vietnam: Report of Findings. Primary Education textbook analysis from the
gender perspective. UNESCO: Ha Noi, UNESCO: IBE & Viet Nam MOET.
N.A. 2006. Educacion de mujeres y ninos en Iberoamerica: I Jounadas de Cooperacion Educativa sobre Genero y Educacion. 10-14 de Julio de 2006, Antigua (Guatemala).
Ministerio de Educacion y Ciencia de Espana, OEI, 2006.
N.A. 2002. Gender Sensitivity: A training manual for sensitizing educational managers,
curriculum and material developers and media professionals to gender concerns.
UNESCO.
N.A. 2008. Gender mainstreaming: Does it happen in education in South Africa. UNGEI.
N.A. 2008. Overcoming Barriers to Girls Education in South Africa: Deepening the
Analysis. UNICEF.
N.A. 2009. Towards Gender Equality in Education: Progress and challenges in Asia-
Pacific region: A working paper. UNICEF.
Goal 2 Resources that address gender equity and equality in policy and higher education.
Bailey, B. 2003. Gender Sensitive education policy and practice: The case of Jamaica. UNESCO.
Colclough, Christopher. 2007. Global Gender and the Construction of Equality: Conceptual Dilemmas
and Policy Practice, RECOUP Working Paper 2. RECOUP University of Cambridge.
Lloyd, Cynthia B. 2009. New Lessons on the power of education adolescent girls: a girls count report on
adolescent girls.
Maluwa-Banda, Dixie. 2003. Gender Sensitive education policy and practice: the case of Malawi. Background paper for the Education for all global monitoring report 2003/4: Gender and education for
all: the leap to equality. UNESCO: IBE.
Pareja Lara, Christina. 2003. The Gender Transversal in Bolivian Education: Policy and Practice.
Background paper for the Education for all global monitoring report 2003/4: Gender and equality for
all: the leap to equality. UNESCO.
Goal 3 Resources that address gender in contexts of conflict and crisis.
Foran, Siobhan et al. 2010. Gender Equality in and through Education: INEE Pocket guide to Gender.
INEE.

17
Huggins, A. & S. Randell. 2007. Gender Equality in Education in Rwanda: What is happening to our
Girls. Paper presented at the South African Association of Women Graduates Conference on “Drop-outs
from School and Tertiary studies: What is happening to our girls?” Capetown, May, 2007.
Mugisha, Catherine. 2005. Gender Imbalance in secondary schools, in Forced Migration Review 22,
January.
N.A. 2003. Textbooks, Curricula, Teacher Training, and the Promotion of Peace and Respect for
Diversity. World Bank.
N.A. 2003. Textbooks, Curricula, Teacher Training, and the Promotion of Peace and Respect for
Diversity. World Bank.
N.A. 2006. Ensuring a Gender Perspective in Education in Emergencies. IRC & INEE.
N.A. 2006. Gender and Education in Emergencies. IASC.

18
Comments on Questions Raised by the USAID Education
Strategy Review 2010 Rachel Glennerster, Dina Grossman, and Kudzai Takavarasha
What are the most promising methods for achieving and measuring improved learning outcomes in developing
countries, especially in the area of childhood literacy?
Measuring learning outcomes
Many learning measures in developing countries are not appropriate for the population that they
are testing. Often, the tests are too hard, which makes it impossible to pick up variation among the
lower performing students. Additionally, a test that is too hard will not be able to measure improvement
among the bottom students.
When it comes to measuring learning outcomes Pratham, the largest NGO in India, is a helpful
example of how to appropriately measure learning, as well as use that evidence to design, implement,
and evolve initiatives. Pratham has been spearheading the most impressive data collection effort on
education ever conducted in India, and by encouraging other organizations, both public and private and
within India and abroad, to join, Pratham has turned its initiative into an international knowledge-
generating movement.
Generating knowledge through basic research
The flagship of Pratham’s basic research is the Annual Status of Education Report (ASER). This is
a yearly survey that measures the enrollment as well as the reading and arithmetic levels of children
aged 6 to 14 years that Pratham carries out using local organizations and volunteers. While the
government gathers information on enrollment, infrastructure and other inputs from schools and from
household surveys, ASER provides district-level data on children’s basic reading and arithmetic skills.
ASER focuses on basic learning, especially on the ability to read simple text (up to Standard 2 level) and
the capacity to do basic arithmetic operations (at Standard 3 or 4 levels). The ASER test is a ―floor‖
level test, meaning the same test is given to all children between the ages of 5 and 16. For younger
children in Standard 1 and 2, it is not expected that they will be able to go beyond the first few tasks.
However, it is expected that older children in Standard 3 onwards will be able to comfortably go
beyond the simple tasks in the ASER assessment. Since 2005, ASER results have indicated that a
significant proportion of children in Standard 3, 4 or 5 are not able to read simple text at Standard 2
level or do basic numerical subtraction problems expected of children in early grades.
While no rigorous evaluation of the impact of ASER has been conducted, the findings of ASER’s
annual report are on the front page of every newspaper and are disseminated widely within and outside
the government at the national, state, district and village levels. Several state governments explicitly base
their annual education planning in part on the ASER results, and the findings played an important role in
the approach paper to the 11th Planning Commission. The success and importance of Pratham’s ASER in
identifying gaps in the Indian education system have not gone unnoticed outside India. Pratham, in
partnership with UNICEF and UNESCO, is conducting a yearlong study on teaching and learning in
government primary schools in India. The ASER is being launched in Pakistan and in countries in West
Africa; it is also being replicated, as UWEZO (―capability‖), in the east African nations of Tanzania,
Kenya, and Uganda, all with help and training from Pratham.
a) What methods or actions should be prioritized as having the most impact on education
quality?
Here is a summary of the common lessons that have emerged from many rigorous studies:
There is little evidence on the impact of physical inputs such as textbooks unaccompanied by
other reforms but what there is not encouraging

19
Several studies have assessed increasing number of teachers without any reforms to teaching and
have found no significant improvement in learning.
Providing education that is aimed at the right level for the child is critical for learning. This can be
achieved through a variety of approaches—from remedial education programs to tracking to
technology.
Improving accountability of teachers is critical to improving learning in formal schools. The right
incentives can improve accountability but the design of these incentives has to be done carefully
or they will not work.
Student motivation is important for learning and can be increased through incentives.
Below we provide fuller summaries of the programs and evaluations that generated this evidence:
Additional inputs do not improve learning without reform
A few of randomized evaluations examined the effects of inputs (textbooks, teachers, flipcharts, etc.) and
found them to have little, if any, impact on learning (test scores) but more work in this area would be
useful. On the other hand, several studies that involved changes in the way the education is delivered,
the pedagogy and incentives of teachers and students were among the most successful. However,
introducing computers and radios to the curriculum, which could be considered additional inputs, have
been shown to be effective in certain contexts, but more study is needed in this area.
More textbooks had no effect on test scores—a program in Kenya that lowered the ratio of children
to textbook from 4 to 2 was found to have no effect on the test scores of the average student.
Textbooks increased the scores of children with high pretest scores as well as the probability that those
who made it to the final year of school, a highly selective group, were more likely to transition to
secondary school. But the average student did not see an improvement in test scores. ─ Glewwe, Paul, Michael Kremer, and Sylvie Moulin. 2009. "Many Children Left Behind? Textbooks and Test
Scores in Kenya." American Economic Journal: Applied Economics, 1(1): 112–35.
Extra teachers alone had no effect on test scores—a program in India designed to ensure that non-
formal schools were open regularly and to encourage more girls to come to school provided a second
teacher, wherever possible a woman, to these schools. While attendance of girls did increase, test
scores did not increase. One reason was that the teachers started taking turns showing up to work and
teacher absenteeism rose. ─ Banerjee, Abhijit, S. Jacob, and M. Kremer, with J. Lanjouw and P. Lanjouw, "Moving to Universal Education!
Costs and Tradeoffs," MIT mimeo, 2005.
Extra teachers alone had no effect on test scores—a program in Kenya provided funds to schools to
hire extra teachers to relieve overcrowding in the lower grades. The extra teachers were fully qualified
but young and inexperienced (recent teacher's college graduates) and unlike the regular teachers, the
extra teachers were hired on one-year renewable contracts. Even though class size fell from an average
of 82 to 44, this group with smaller class sizes did not do better than the control group. ─ Duflo, Esther, Pascaline Dupas, and Michael Kremer. 2009. ―Peer Effects, Teacher Incentives, and the Impact of
Tracking: Evidence from a Randomized Evaluation in Kenya.‖ NBER Working Paper No. 14475.
Smaller class sizes in India did not improve test scores—a program in India provided remedial
education to some children in urban Indian schools. Under the program children falling behind were
pulled out of their classes to get special help. Those not receiving special help experienced smaller class
sizes for a large part of the day. While those getting remedial help benefited from the program those
who simply benefited from smaller class sizes did not see improved test scores. ─ Banerjee, Abhijit, Shawn Cole, Esther Duflo, and Leigh Linden.2007. "Remedying Education: Evidence from Two
Randomized Experiments in India," Quarterly Journal of Economics, 122 (3): 1235-64.

20
Adapting learning levels to the right level for the child improves learning
Many observational studies have made the point that the curricula in poor countries are often not well
adapted to the needs of poor students (for example see The Public Report on basic Education in India,
1999). This problem is exacerbated by children missing school due to sickness or labor needs at home
Tracking students into classes based on their initial level of learning increased test scores in
Kenya—the extra teacher program in Kenya discussed above hired extra teachers on renewable
contracts to relieve overcrowding. This allowed the schools to split their first grade class into two
sections, with the top and bottom halves of the distribution assigned to different sections. Both those
students in the more and less advanced tacks benefited from the system, with those assigned to the
bottom section gaining most in the basic competencies. These findings suggest that when the students in
a class have comparable levels preparation the teacher can tailor the teaching to their students. ─ Duflo, Esther, Pascaline Dupas, and Michael Kremer. 2010. ―Pupil Teacher Ratios, Teacher Management, and
Education Quality.‖ Unpublished Manuscript, J-PAL at MIT
Remedial instruction focusing on basic math and reading sharply increased test scores—Pratham,
an Indian NGO, hired local young women with some secondary education, trained them for two weeks,
and deployed them to local schools as teacher's aides specializing in remedial instruction in two large,
urban centers, Mumbai and Vadodara. The remedial curriculum targeted students in grades three and
four who did not have first-grade math and reading competencies. These students were pulled out of
the regular classroom and worked with the teacher's aide for half the four-hour school day. ─ Banerjee, Abhijit, Shawn Cole, Esther Duflo, and Leigh Linden.2007. "Remedying Education: Evidence from Two
Randomized Experiments in India," Quarterly Journal of Economics, 122 (3): 1235-64.
Rapid, remedial reading instruction increased test scores—in rural areas, Pratham trained local
volunteers for a week in its reading pedagogy and encouraged them to run after-school reading
programs. The program increased literacy among 3-4 graders by 7.9 percent. Those who could only
recognize letters at baseline and who attended the read class were 26 percent more likely to be able to
read stories at the end line. ─ Banerjee, Abhijit V., Rukmini Banerji, Esther Duflo, Rachel Glennerster, and Stuti Khemani. 2010. "Pitfalls of
Participatory Programs: Evidence from a Randomized Evaluation in Education in India." American Economic Journal:
Economic Policy, 2(1): 1–30.
Remedial summer schools increase reading levels—in Bihar, government school teachers were given
some special training to run summer school classes for four to six weeks for children who wanted to
learn more. Large gains were seen in the treatment villages. The average child who attended gained half
a reading level (i.e. nothing to reading words, words to paragraphs, paragraphs to stories).
The Pratham-model described above for remedial education, involving the addition of para-teachers in
classrooms to focus on disadvantaged students is currently being adapted to Ghana. Youth who are
looking for a first job experience will be trained to provide remedial education in schools.
Technology can also allow teaching to be adjusted to the right level for a student—in India,
Pratham provided software to schools that had computers but no software, and trained teachers how to
use it. The software was designed to improve math learning and adapted the level of question to how
well the student performed. Students test scores increased in math by 0.47standard deviations. ─ Banerjee, Abhijit, Shawn Cole, Esther Duflo, and Leigh Linden.2007. "Remedying Education: Evidence from Two
Randomized Experiments in India," Quarterly Journal of Economics, 122 (3): 1235-64.

21
Curricula may be too advanced for disadvantaged students—A study in Kenya found that lowering
the student-textbook ratio from 4 to 2 had no effect on average test scores, but improved the scores of
children with high baseline scores. This means that the average child did not benefit from textbooks;
only students who were already proficient benefited. The authors posit that the textbook (and the
curriculum) might be too advanced for the majority of the students. This suggests that changing the
curricula to target the average student and teach them basic skills could greatly benefit the majority of
students. ─ Glewwe, Paul, Michael Kremer, and Sylvie Moulin. 2009. "Many Children Left Behind? Textbooks and Test
Scores in Kenya." American Economic Journal: Applied Economics, 1(1): 112–35.
Improving the accountability of teachers improves learning
Absenteeism of teachers is high across the developing world. For example, in Uganda, on an average
day, 27 percent of teachers are not in school. One reason may be that teachers tend to get paid
whether or not they come to work and there is little real oversight from their supervisors. Making
teachers truly accountable and improving incentives reduces absenteeism and increases test scores but
incentives have to be carefully designed (see ―Showing up is the First Step‖ J-PAL 2009).
Teachers who can be hired and fired by local communities increased test scores—a program in
Kenya hired extra teachers to relieve overcrowding. The extra teachers were fully qualified but young
and inexperienced. Unlike the regular teachers, the extra teachers were hired on one-year renewable
contracts. In some schools, the parents committee was trained to monitor and manage the contract
teachers. Children assigned to the less experienced contract teacher did better than those assigned to
the regular teacher. Children with contract teachers in schools where the parents committee had been
trained did particularly well. Elsewhere the regular teacher tried to hand their class off to the contract
teacher, but where the parents committee had more oversight the contract teacher had the backing of
the parents committee to prevent this abuse. ─ Duflo, Esther, Pascaline Dupas, and Michael Kremer. 2009. ―Peer Effects, Teacher Incentives, and the Impact of
Tracking: Evidence from a Randomized Evaluation in Kenya.‖ Unpublished Manuscript, J-PAL at MIT
This result is similar to that found in India where remedial education teachers on short term contracts
had good success in increasing test scores, while reduced class sizes for regular teachers did not lead to
increased test scores. In that case however, the effects of the short-term contract cannot be
disentangled from the effects of the remedial curriculum itself and the effects of peers of comparable
achievement. ─ Banerjee, Abhijit, Shawn Cole, Esther Duflo, and Leigh Linden.2007. "Remedying Education: Evidence from Two
Randomized Experiments in India," Quarterly Journal of Economics, 122 (3): 1235-64.
Teachers facing incentives (in-kind prizes based on student performance) increased test scores,
but only in the short-run—a program in Kenya provided primary school teachers with cash prizes
based on the average performance of children in grades 4 to 8. Pedagogy did not change, teacher
attendance did not increase, homework assignments did not increase, but teachers spent more time on
test preparation, and the test scores increased the most on exams that were linked to incentives and did
not persist after the program—all of which suggests that teachers were teaching to the test. So, while
incentives do work, we have to be careful with how they are structured or else we run the danger of
changing the proximal outcomes (here test scores) without changing the outcomes that we ultimately
care about (learning.) ─ Glewwe, Paul, Nauman Ilias, and Michael Kremer. 2008. Teachers Incentives. American Economic Journal:
Applied Economics, July 2010.
A similar program in India also found that test scores in math improved by 0.28 standard deviations and
0.16 standard deviations in language when teachers were rewarded for student attendance. As in Kenya,

22
the teachers did not show up more often, but they did put in more effort, including in more test
preparation. In this study, the author is more positive about the results, suggesting that improved test
scores, however achieved, have a benefit. Nevertheless, the studies discussed here suggest that linking
teacher pay to attendance might be more cost effective than linking it to test scores particularly if long
run learning rather than just test scores is the main goal. ─ Muralidharan, Karthik and Venkateshsundararaman, 2009, Teacher Performance Pay: Experimental Evidence
from India. NBER Working Paper no 15323
Incentives are only effective when strictly implemented without supervisor discretion—A project
in Kenya offered attendance incentives to pre-primary school teachers. The school principal was
charged with monitoring attendance and awarding a bicycle to each teacher with sufficient attendance at
the end of the term. If a teacher did not qualify for the award, the school would keep the money for the
prize. In every treatment school the principal reported sufficient attendance for the teacher to get the
prize. Yet, unannounced visits in treatment and comparison schools found that absence rates were high
and exactly the same across both groups. The program had no effect. Principals did not accurately
enforce the attendance incentives. ─ Kremer Michael, Chen Daniel. 2001. An Interim Report on a Teacher Attendance Incentive Program in Kenya.
Mimeo, Harvard University.
Incentives are only effective when strictly implemented without supervisor discretion—A similar
program in India linked nurse’s pay to attendance; but this time there were machines in the clinics
monitor attendance. However, absences for legitimate reasons such as meetings could be ―excused‖ by
supervisors. In the first few months, the program increased attendance. However, the program’s
effectiveness quickly degenerated. Nurses deliberately broke several machines. Moreover, supervisors
substantially increased the number of absences they excused—even on days when no meetings were
held and no legitimate excuses were available. By failing to abide by the machine’s monitoring,
supervisors undercut the program. The effect of the program dissipated. ─ Banerjee, Abhijit, Esther Duflo, and Rachel Glennerster (2008). ―Putting a Band-Aid on a
Corpse: Incentives for Nurses in the Indian Public Health Care System.‖
Information on the returns to schooling increases attendance and test scores
Parents and students can only respond to the economic incentives for education if they know
about them, and understand their magnitude. Two studies suggest that parents and students do
not always know the full economic benefits of additional investment in formal education, and
that when they do they respond strongly. Providing information on the economic benefits of
staying in school is one of the cheapest ways to improve access to education and these studies
suggest that it can be a very effective way of incentivizing students. Direct monetary incentives,
such as scholarships, have also proven to be a successful way to incentivize learning.
Information on the earnings of adolescents who finish primary school boosted
attendance of boys and girls in Madagascar—teachers provided students (aged 9-15) and
parents with information on average wages for those who did and did not finish primary school.
A randomized evaluation found that providing this information increased attendance by 3.5
percentage points. ─ Nguyen, Trang. 2008. ―Information, Role Models, and Perceived Returns to Education: Experimental Evidence
from Madagascar.‖ Unpublished Manuscript, J-PAL at MIT
Information on returns to education improves participation, for boys in Dominican
Republic—the intervention provided male students with information on returns of education

23
in their community and in the whole country. The evaluation found that most boys thought that
the return to education was low, even though actual returns are high. The least-poor students
were less likely to drop out, with no effect on schooling outcomes for the poorest students. ─ Jensen, Robert. 2010. "The (Perceived) Returns to Education and the Demand for Schooling." Quarterly Journal
of Economics, 125(2).
Student motivation and effort is important for increased learning
When thinking about education policy and programs the motivation and choices made by the child or
adolescent are often ignored. Learning levels are low so we put in more stuff—more text books, more
teachers. Teachers are not motivated or are not performing well, so we change their incentives. We
assume that all children want to learn sufficiently to work hard despite the difficult conditions and we
don’t need to think about their motivation very much. But there is increasing evidence that child and
adolescent motivation and effort matters a lot. A number of programs successfully increased test scores
by focusing on incentivizing students in a wide range of ways.
The prospect of winning a scholarship motivated students and improved test scores in Kenya— a
program provided scholarships to sixth grade girls who performed in the top 15 percent on tests
administered by the government. Winners received a grant of US$6.40 to cover school fees paid to her
school, a grant of US$12.80 for school supplies to her family, and public recognition. The program led to
more effort by students and teachers and test scores rose by 0.19 standard deviations (0.27 in the
district where the program was administered best)—a very large increase. Interestingly the increased
effort was not just concentrated amongst high performing girls most likely to win the scholarship—boy
and girls who were unlikely to win, (as well as teachers) worked hard and performed better. ─ Kremer, Michael, Edward Miguel, and Rebecca Thornton. 2009. Incentives to Learn. Review of Economics and
Statistics 91 (3): 437-456
Direct payment to students for performance increases matriculation rates, especially for girls—in
Israel, to enroll in post-secondary schooling, a student must receive a matriculation certificate (similar to
high school graduation). Cash incentives were used to increase certification rates among low-achievers.
Direct payment was given to students for completion and for doing well in certain subjects on the high
school exit exam. An experiment found that the program increased certification among girls but had no
effect on boys. Increase in girls’ matriculation rates translated into higher chance of college attendance.
Even though much of the increase in certification came through improved test taking strategies (rather
than increased underlying learning), these girls were more likely to enroll in higher education five years
later. ─ Angrist, Joshua, and Victor Lavy. 2008. The effect of high stakes high school achievement awards: Evidence from
a Group Randomized Trial. AER (forthcoming.)
b. How effective is teacher training in improving learning outcomes? What interventions
related to teacher development are the most effective? How do we implement quality
assurance methods/measures and accreditation in teacher training centers?
There is very little evidence on the effects of teacher training. It is possible that poor teacher training
may not be driving low learning outcomes. Extremely high rates of absenteeism among teachers suggests
that just getting the teachers to school may be one of the biggest hurdles to improving education in
developing countries. Programs that have increased teacher attendance have had positive effects on test
scores. Additionally, programs that have used teachers with both minimal training and minimal
education, such as the Balsakhi program, have been extremely successful in improving learning.
Teachers need stronger incentives for Professionalization

24
When pay was linked to attendance rates, teachers showed up to teach and test scores
improved—This evaluation estimates the effect of incentives on teacher attendance and of increased
teacher attendance on students' attendance and abilities in math and language. In order to monitor
teacher attendance, each teacher in 57 NGO schools was given a camera, along with instructions to
have one student take a picture of the teacher and the class at the start and close of each school day.
The program resulted in an immediate and long lasting improvement in teacher attendance rates in
treatment schools. Students in the treatment group received more days of instruction simply because
their teachers were more likely to be at school. A year into the program, test scores in the treatment
schools were 0.17 standard deviations higher than in the comparison schools. ─ Duflo, Esther, Rema Hanna, and Stephen P. Ryan. 2010. ―Incentives Work: Getting Teachers to Come to
School,‖ Unpublished manuscript, J-PAL at MIT.
Giving teachers in-service training on specific curricula modules influences teaching and
may improve learning
Summer schools increase reading levels—in Bihar, government school teachers were given some
special training to run summer school classes for four to six weeks for children who wanted to learn
more. Large gains were seen in the treatment villages. The average child who attended gained half a
reading level (i.e. nothing to reading words, words to paragraphs, paragraphs to stories).
When a new curriculum component is implemented, teacher training will increase the likelihood
that it is taught—An HIV/AIDS component was added to the national curriculum in Kenya in 1999.
However, it was found that teachers were talking about HIV/AIDS in only about 73% of schools. A
training program on the curriculum provided in-service training for primary school teachers. The
training program increased the amount of time teachers devoted to the HIV/AIDS curriculum. However,
it was found to have no impact on students’ knowledge and behavior, no impact on teenage childbearing
rates, but increased the likelihood that girls who had started childbearing were married to the fathers of
their children. ─ Duflo, Esther, Pascaline Dupas, Michael Kremer, and Samuel Sinei. 2006. ―Education and HIV/AIDS prevention:
evidence from a randomized evaluation in Western Kenya,‖ Unpublished Manuscript, J-PAL at MIT.
Para-teachers are a quick way to overcome present distortions
Tutors from the local community improve learning for low-performing students—the Balsakhi
program is a remedial education intervention designed by Pratham. A tutor (Balsakhi) was hired at a
fraction of the cost of civil-service teachers to work with children who had fallen behind their peers in
basic reading and arithmetic. The evaluation showed that over the course of the academic year, there
was a visible improvement in learning for both low-performing students, who received remedial
education as well as for stronger students. ─ Banerjee, Abhijit, Shawn Cole, Esther Duflo, and Leigh Linden.2007. "Remedying Education: Evidence from Two
Randomized Experiments in India," Quarterly Journal of Economics, 122 (3): 1235-64.
Pratham has scaled up a slightly altered model, called Read India, which used similar teaching methods
and materials, but works with teachers in existing government schools in addition to working with local
unpaid volunteers are trained in techniques for helping children learn to read.
The full effects of training teachers are still unknown. Many important questions remain unanswered.
What is the best way to train teachers who may not themselves be very well educated? What can be
done to provide in-service current teachers with the skills they need to better target children at
different levels within a large classroom? How structured should the teaching be: should teachers be
asked to follow a very specific plan or should they be given discretion? More research is needed to
answer these and more questions.

25
2. Innovation to Overcome Challenges: What trends and innovations seem to be the most
promising for meeting current education challenges in developing countries, such as the lack of teachers,
greater demand for education at all levels due to increasing access, and the need to improve education
quality (e.g., the ―hole in the wall‖ experiments by Dr. Mitra, or lesson plans delivered to teachers by
smart phones)?
Pratham’s innovative solutions to education in developing countries have revolutionized education in
India, and are about to expand in Africa. Pratham flagship initiative, Read India consists of two steps. The
first step is Learn to Read, an activity-based accelerated program that teaches reading and basic
arithmetic in four to eight weeks and can take place within schools, in after school camps run by
volunteers or in summer camps run by government funded assistant teachers (all three methods have
been rigorously evaluated as discussed above). Children are tested at the beginning to gauge their
reading and arithmetic and are then grouped on the basis of their levels of knowledge. All activities are
then built from that level onwards, allowing the teaching to be tailored to the children’s level. An
evaluation of the Learn to Read, by J-PAL in partnership with Pratham, has found it to be highly effective.
Within three months, Pratham’s Read India remedial education program boosted letter recognition by
60 percentage points, and ability to read and comprehend a short story by 35 percentage points.
The second step, Read to Learn, helps the new readers to cement their skills with additional reading and
so complements Learn to Read. Pratham administers the Read to Learn classes in two phases. The first
phase strengthens reading, comprehension of school and/or other texts, and writing on one’s own. The
second phase ensures that the children complete the basic curricular framework for Grade 3. Read to
learn is currently being evaluated, and results are forthcoming.
a. In what instances/context are the innovations you identify most promising and why?
Pratham’s Read India Program is best suited to an environment that is resource poor and rich in
volunteers. Their programs have been run both in urban and peri-urban areas, as well as remote, rural
areas, demonstrating the versatility of the model. Pratham has created a system of recruiting and training
volunteers (or sometimes minimally paid ―Balsakhis‖ or ―child’s friends‖) within communities to serve as
teacher’s aides, and has demonstrated that even those with relatively limited education can be trained to
help with early grade teaching. This innovation has been key to the massive expansion of Pratham
programs with limited resources, as well as in remote and rural areas.
b. How effective is distance learning and what are the most effective methods (radio,
online, using mail to send written materials supplemented by teacher visits, peer
learning/teaching, etc?)
Distance learning and technology in the classroom can enhance learning when programs
are designed correctly
Supplemental computer classes improve student outcomes more than “pull-out” computer
classes—A study in India measured the impact of a Computer Assisted Learning (CAL) program
implemented in two different ways. The first group participated in a pull-out CAL program in which the
students received one hour of CAL instruction per day during school hours in lieu of the normal
curriculum. The second group participated in a supplemental in which the students received one hour of
CAL instruction per day after school, as a supplement to the normal curriculum during school. Students
who participated in the supplemental CAL program had higher average math scores than students in the
control group. However, students who participated in the pull-out CAL program actually fared worse
than students in the control group.
26
─ Linden , Leigh L. 2008. ―Complement or Substitute? The Effect of Technology on Student Achievement in India,‖
Unpublished manuscript, J-PAL at MIT.
Technology can allow teaching to be adjusted to the right level for a student—in India, Pratham
provided software to schools that had computers but no software, and trained teachers how to use it.
The software was designed to improve math learning and adapted the level of question to how well the
student performed. Students test scores increased in math by 0.47standard deviations—a massive effect.
However, when this intervention was compared to the Balsakhi remedial teachers program, it was found
to be less cost-effective than the Balsakhis, given the high cost of computers and the extremely low cost
of hiring the Balsakhis. ─ Banerjee, Abhijit, Shawn Cole, Esther Duflo, and Leigh Linden.2007. "Remedying Education: Evidence from Two
Randomized Experiments in India," Quarterly Journal of Economics, 122 (3): 1235-64.
When not incorporated into the curriculum, computers have no effect on learning—In an effort to
improve the quality of its educational system in Colombia, computers were installed in schools, teachers
were trained to use the computers in specific subjects, especially Spanish. However, the program had
surprisingly little effect on test scores, even in Spanish. In fact, the program did not increase the actual
use of the computers among students and teachers by very much. Despite the program’s focus on using
the computers for teaching a range of subjects, they were only used to teach computer usage skills.
Only 3 to 4% of students in both treatment and comparison schools reported using the computers in
language class, which was one of the focal points of the program. The results of this study highlight the
importance of implementation and training, specifically addressing the incorporation of available
computers into the educational process and curriculum. ─ Barrera-Osorio, Felipe, Leigh L. Linden. 2009. ―The Use and Misuse of Computers in Education: Evidence from a
Randomized Controlled Trial of a Language Arts Program,‖ Unpublished manuscript, J-PAL at MIT.
Radio instruction can increase test scores in the absence of text books—This intervention
compares classes in which textbooks are relatively rare with a radio-based instructional program that
uses student worksheets but no other textual material. The radio instruction positively affected test
scores and reduced the achievement gap between urban and rural students. The study took place in the
1970s and technology has clearly changed considerably since then, however, it does show the promise
of this relatively simple technology.
─ Jamisona, Dean T., Barbara Searle, Klaus Galda and Stephen P. Heyneman. 1981. ―Improving elementary
mathematics education in Nicaragua: An experimental study of the impact of textbooks and radio on
achievement,‖ Journal of Educational Psychology, 73(4): 556-567.
c. What innovations will better target disadvantaged students to close the learning gap?
Remedial education as well as tracking students has effectively raised test scores among
disadvantaged students
Tutors from the local community improve learning for low-performing students—the Balsakhi
program is a remedial education intervention designed by Pratham. A tutor was hired at a fraction of the
cost of civil-service teachers to work with children who had fallen behind their peers in basic reading
and arithmetic. The evaluation showed that over the course of the academic year, there was a visible
improvement in learning for both low-performing students, who received remedial education as well as
for stronger students. The benefits are concentrated among the lowest performing children – children
who cannot read. Within three months, Pratham’s remedial education program boosted letter
recognition by 60 percentage points, and ability to read and comprehend a short story by 35 percentage
points. ─ Banerjee, Abhijit, Shawn Cole, Esther Duflo, and Leigh Linden.2007. "Remedying Education: Evidence from Two
Randomized Experiments in India," Quarterly Journal of Economics, 122 (3): 1235-64.

27
Tracking students into classes based on their initial level of learning increased test scores in
Kenya—the extra teacher program in Kenya discussed above hired extra teachers on renewable
contracts to relieve overcrowding. This allowed the schools to split their first grade class into two
sections. In some of the schools, students were assigned to the class based on pretest scores, with the
top and bottom halves of the distribution assigned to different sections. Both those students in the more
and less advanced tacks benefited from the system, with those assigned to the bottom section gaining
most in the basic competencies. Estimates suggest that the effects are particularly large for girls in math.
These findings suggest that when the students in a class have comparable levels preparation the teacher
can tailor the teaching to their students. ─ Duflo, Esther, Pascaline Dupas, and Michael Kremer. 2010. ―Pupil Teacher Ratios, Teacher Management, and
Education Quality.‖ Unpublished Manuscript, J-PAL at MIT
3. Conflict/Crisis Environments: Conflict and crisis-affected countries pose difficult
challenges to education access and quality. What practices or interventions are most
effective in these environments for improving access and quality while contributing to
student safety and community stability?
Not many studies have been done directly in conflict areas. Some of the barriers to education in conflict
areas include lack of infrastructure, lack of working systems and low human capital. One way to create
effective education in an environment like this is to develop a pedagogical strategy that does not rely on
infrastructure, systems or human capital. The system of balsakhi and para-teachers described above
would be well-suited to a conflict or post-conflict environment. In the balsakhi program, contract
teachers, who were high-school educated and usually women, were recruited from the community and
trained for two weeks on teaching basic literacy and numeracy skills. The balsakhis use whatever space
is available (free classrooms, playground, or even hallways when necessary). A program like this, with
such low capital costs or reliance on infrastructure, could contribute to a stable education for kids in
conflict areas.
Educational infrastructure is destroyed during conflicts. Rebuilding schools and minimizing the distance
children must travel in dangerous areas to get to school increases school enrollment and learning
outcomes. A program called PACE-A in Afghanistan started schools directly in the children’s villages.
The community provided the space for the school, while PACE-A provided educational materials
(writing utensils, notebooks, books, and teacher materials) as well as training for teachers. Teachers
received standard training and students were taught the government curriculum. The presence of a
community-based school increases overall enrollment in formal schools by 42 percentage points, and
increases test scores by 1.2 standard deviations among students attending. ─ Burde, Dana, Leigh L. Linden. 2010. ―The Effect of Village-Based Schools: Evidence from a RCT in Afghanistan,‖
Unpublished manuscript, J-PAL at MIT.
Another key challenge when working in post-conflict or crisis-affected countries fully understands the
problems and designing programs to target them. In order to do this, extensive data-collection efforts
are needed.

28
Studies Referenced I. Quality – Learning Outcomes: What are the most promising methods for achieving and
measuring improved learning outcomes in developing countries, especially in the area of
childhood literacy?
a. What methods or actions should be prioritized as having the most impact on
education quality?
i. Glewwe, Paul, Michael Kremer, and Sylvie Moulin. 2009. "Many Children Left
Behind? Textbooks and Test Scores in Kenya." American Economic Journal: Applied
Economics, 1(1): 112–35.
1. Data available: http://hdl.handle.net/1902.1/11252
ii. Banerjee, Abhijit, S. Jacob, and M. Kremer, with J. Lanjouw and P. Lanjouw,
"Moving to Universal Education! Costs and Tradeoffs," MIT mimeo, 2005.
iii. Banerjee, Abhijit, Shawn Cole, Esther Duflo, and Leigh Linden.2007. "Remedying
Education: Evidence from Two Randomized Experiments in India," Quarterly
Journal of Economics, 122 (3): 1235-64.
1. Data available: http://hdl.handle.net/1902.1/QIABTVDYCJ
iv. Duflo, Esther, Pascaline Dupas, and Michael Kremer. 2009. ―Peer Effects,
Teacher Incentives, and the Impact of Tracking: Evidence from a Randomized
Evaluation in Kenya.‖ NBER Working Paper No. 14475.
v. Duflo, Esther, Pascaline Dupas, and Michael Kremer. 2010. ―Pupil Teacher
Ratios, Teacher Management, and Education Quality.‖ Unpublished Manuscript,
J-PAL at MIT
vi. Banerjee, Abhijit, Shawn Cole, Esther Duflo, and Leigh Linden.2007. "Remedying
Education: Evidence from Two Randomized Experiments in India," Quarterly
Journal of Economics, 122 (3): 1235-64.
vii. Banerjee, Abhijit V., Rukmini Banerji, Esther Duflo, Rachel Glennerster, and Stuti
Khemani. 2010. "Pitfalls of Participatory Programs: Evidence from a Randomized
Evaluation in Education in India." American Economic Journal: Economic Policy,
2(1): 1–30.
1. Data available: http://hdl.handle.net/1902.1/13084
viii. Glewwe, Paul, Nauman Ilias, and Michael Kremer. 2008. ―Teachers Incentives.‖
NBER Working Paper no. 9671
ix. Muralidharan, Karthik and Venkateshsundararaman, 2009, ―Teacher
Performance Pay: Experimental Evidence from India.‖ NBER Working Paper no
15323
x. Kremer Michael, Chen Daniel. 2001. An Interim Report on a Teacher
Attendance Incentive Program in Kenya. Mimeo, Harvard University.
xi. Banerjee, Abhijit, Esther Duflo, and Rachel Glennerster (2008). ―Putting a Band-
Aid on a
xii. Corpse: Incentives for Nurses in the Indian Public Health Care System.‖
xiii. Nguyen, Trang. 2008. ―Information, Role Models, and Perceived Returns to
Education: Experimental Evidence from Madagascar.‖ Unpublished Manuscript, J-
PAL at MIT
xiv. Jensen, Robert. 2010. "The (Perceived) Returns to Education and the Demand
for Schooling." Quarterly Journal of Economics, 125(2).
xv. Kremer, Michael, Edward Miguel, and Rebecca Thornton. 2009. ―Incentives to
Learn.‖ Review of Economics and Statistics 91 (3): 437-456
xvi. Angrist, Joshua, and Victor Lavy. 2008. The effect of high stakes high school
achievement awards: Evidence from a Group Randomized Trial. AER
(forthcoming.)

29
b. How effective is teacher training in improving learning outcomes? What
interventions related to teacher development are the most effective? How do we
implement quality assurance methods/measures and accreditation in teacher training
centers?
i. Duflo, Esther, Rema Hanna, and Stephen P. Ryan. 2010. ―Incentives Work:
Getting Teachers to Come to School,‖ Unpublished manuscript, J-PAL at MIT.
1. Data available: http://hdl.handle.net/1902.1/VZJXRPURTJ
ii. Duflo, Esther, Pascaline Dupas, Michael Kremer, and Samuel Sinei. 2006.
―Education and HIV/AIDS prevention: evidence from a randomized evaluation in
Western Kenya,‖ Unpublished Manuscript, J-PAL at MIT.
iii. Banerjee, Abhijit, Shawn Cole, Esther Duflo, and Leigh Linden.2007. "Remedying
Education: Evidence from Two Randomized Experiments in India," Quarterly
Journal of Economics, 122 (3): 1235-64.
II. Innovation to Overcome Challenges: What trends and innovations seem to be the most
promising for meeting current education challenges in developing countries, such as the lack of
teachers, greater demand for education at all levels due to increasing access, and the need to
improve education quality (e.g., the ―hole in the wall‖ experiments by Dr. Mitra, or lesson plans
delivered to teachers by smart phones)?
a. In what instances/context are the innovations you identify most promising
and why?
b. How effective is distance learning and what are the most effective methods
(radio, online, using mail to send written materials supplemented by teacher
visits, peer learning/teaching, etc?)
i. Linden, Leigh L. 2008. ―Complement or Substitute? The Effect of Technology on
Student Achievement in India,‖ Unpublished manuscript, J-PAL at MIT.
ii. Banerjee, Abhijit, Shawn Cole, Esther Duflo, and Leigh Linden.2007. "Remedying
Education: Evidence from Two Randomized Experiments in India," Quarterly
Journal of Economics, 122 (3): 1235-64.
iii. Barrera-Osorio, Felipe, Leigh L. Linden. 2009. ―The Use and Misuse of
Computers in Education: Evidence from a Randomized Controlled Trial of a
Language Arts Program,‖ Unpublished manuscript, J-PAL at MIT.
iv. Jamisona, Dean T., Barbara Searle, Klaus Galda and Stephen P. Heyneman. 1981.
―Improving elementary mathematics education in Nicaragua: An experimental
study of the impact of textbooks and radio on achievement,‖ Journal of
Educational Psychology, 73(4): 556-567.
c. What innovations will better target disadvantaged students to close the
learning gap?
i. Banerjee, Abhijit, Shawn Cole, Esther Duflo, and Leigh Linden.2007. "Remedying
Education: Evidence from Two Randomized Experiments in India," Quarterly
Journal of Economics, 122 (3): 1235-64.
ii. Duflo, Esther, Pascaline Dupas, and Michael Kremer. 2010. ―Pupil Teacher
Ratios, Teacher Management, and Education Quality.‖ Unpublished Manuscript,
J-PAL at MIT
III. Conflict/Crisis Environments: Conflict and crisis-affected countries pose difficult challenges to
education access and quality. What practices or interventions are most effective in these
environments for improving access and quality while contributing to student safety and
community stability?
a. Burde, Dana, Leigh L. Linden. 2010. ―The Effect of Village-Based Schools: Evidence from
a RCT in Afghanistan,‖ Unpublished manuscript, J-PAL at MIT.

30
Related Papers and Data Nguyen, Trang, Gerard Lassibille. 2008. ―Improving Management in Education: Evidence from a
Randomized Experiment in Madagascar,‖ Unpublished manuscript, J-PAL at MIT.
Kremer, Michael, Sylvie Moulin, Robert Namunyu. 2003. ―Decentralization: A Cautionary Tale‖
Unpublished manuscript, J-PAL at MIT.
ASER Survey Tools: http://www.asercentre.org/ngo-education-india.php?p=Tools
Data: http://www.asercentre.org/ngo-education-india.php?p=Data
31
Improved Learning Outcomes in Donor-Financed Education
Projects: RTI’s Experience July 2011 Introduction In the past decade or so, RTI has been accumulating results-based information on how to produce
specific learning outcomes. The documentation covers projects RTI has implemented, projects it has
evaluated, and projects it has used as inspiration.
These documented results leave little doubt that it is possible, in a time frame even shorter than the
average donor project, to produce significant, measureable improvement in children’s learning
outcomes—on the order of doubling, tripling, or even quadrupling children’s outcomes. Furthermore,
the potential is greatest if baseline performance is low and if there is a specific focus on a limited set of
objectives, such as early grade reading. Having multiple objectives—such as covering a variety of subjects
and grades, or reading in a variety of languages—increases the complexity, and no organization that we
know of has experience demonstrating rapid and significant changes when the objectives are far more
complex. In either case, however, achieving results requires time, careful planning, and the use of
methods that have proven effective and that may not always align with conventional wisdom or current
programs.
This brief summarizes evidence we have compiled to date on ―what works‖ to improve learning
outcomes. The key lessons are based on evaluations of eight project experiences. Six projects involved
direct implementation by RTI, one is being implemented by an African NGO and evaluated by RTI, and
one has inspired RTI. Together they show that a variety of approaches can produce results, as long as
they are strictly oriented toward achieving results. That said, with only one exception (The Gambia),
these results are being achieved in schools that are under controlled circumstances (that is, working
under a donor ―project‖). Generalizing the results to an entire education system is a frontier that, to
our knowledge, no nongovernmental organization implementing United States Agency for International
Development (USAID) projects has experienced.
In the next section we summarize three key lessons that we feel all these experiences have in common.
The third section of the brief presents an overview of the eight project experiences, to show the range
of activities on which these lessons are based, and the range of sizes of outcomes produced.
Lessons Learned The three key lessons we have learned are as follows.
The focus on learning outcomes has to be the driving concern. Process, ideology, academic
pedagogical theories divorced from content, favorite practices, received wisdom, and the usual array of
other out-comes (e.g., parent-teacher associations strengthened, education management information
system developed) all need to be secondary if the goal is improved learning outcomes. (Those other
objectives may be worthwhile on their own, but that is a different issue.) Rather, we need to expend
our energy on ―what works.‖
Such a tight focus on learning outcomes may occasionally require giving up on long-funded but largely
unproven pedagogical approaches, particularly when it comes to students in low-income countries
acquiring basic skills. Integrating reading instruction into other subjects, for example, should not take the
place of focused instruction on reading as a subject on its own, in a grade-appropriate manner.
There are five specific instructional requirements. We mnemonically refer to the requirements as
―the five T’s‖: time use, teaching technique, texts, tongue of instruction, and testing. To elaborate:

32
A. Time devoted to learning—that is, time explicitly devoted to instruction in specific subjects, such as
reading—is key. Time is wasted and children have very little opportunity to learn when
the theoretical school year and school day are too short,
schools have to teach in double shifts,
educators go on strike,
teachers have to leave the school to engage in bureaucratic transactions,
instruction stops for ―planning‖ and even in-service training (if the training is of poor quality or
not highly relevant),
both teachers and students are absent,
the available time in the school day is poorly managed,
time devoted to focused instruction within the classroom is limited and of poor quality, and
curricular guidelines reduce time devoted to direct instruction on skills.
In short, too many classrooms in the developing world simply spend too little time on focused
instruction. In the projects we manage, we strive for focused and efficient use of time.
B. Better teaching technique. A familiar refrain in many countries, particularly in Africa, is that teachers are
not taught how to teach. In particular, our experience has shown that they are not taught how to
actually teach reading. Rather, teachers are under supported with content knowledge and techniques
that work and oversupplied with vague theories or methodologies. If teachers are trained in reading
instruction, the training is too often theoretical rather than practical, and no one models for the
teachers how to introduce children to basic skills such as phonics or comprehension. In our experience,
practical support, not theory, is what teachers need and are asking for.
In the projects we have implemented, we emphasize content knowledge and teachers’ practice of
specific pedagogical skills, down to the use of routines for teaching and assessing students’ understanding
of text, before they can even read a single word. We want to directly involve children in learning, and to
create interaction between teachers and children that is as intense, positive, and content-rich as
possible. Furthermore, when the results demonstrate that the teachers need it, we provide teachers
with scripted and prescribed daily lesson plans. Although some would decry such practices as ―de-
professionalizing‖ the teacher, untrained and low-skilled teachers overwhelmingly welcome such
practical support. Moreover, once teachers become experienced, confident in their own abilities, and
knowledgeable of how to teach, the script becomes less necessary.
C. Materials provision (“texts” for short). Thanks to the efforts of governments and international agencies,
children in many countries now have access to some form of learning materials in the classroom.
Unfortunately, these are often insufficient, expensive, and poorly designed from a pedagogical cost-
effectiveness point of view because they fail to apply research findings about effective learning at
different stages of academic achievement. The effects of factors such as amount of color, the ratio of
pictures or graphics to print, and the cost of glossy paper for books are poorly understood. For
example, do these features really add to durability, and is durability more important than variety and
amount of materials? Yet many donor projects tend to see expensive, glossy books, with high graphics
content and much use of color, as innovative and necessary. International competitive bidding
requirements and perverse government tariffs (e.g., import taxes for paper but not for finished books)
further undermine the development of sustainable local publishing. All these factors raise cost, without
much evidence that this increase in cost is worthwhile in terms of producing learning outcomes.
In contrast, in projects we have implemented, we aim to provide sustainable, locally produced, abundant,
and inexpensive materials so as to dramatically improve the print environment and prevent hoarding by
school staff (―preserving‖ materials to such an extent that children never have access). The materials are

33
directly integrated into the lesson plans so as to greatly increase the probability that teachers will use
them. In addition, we supply materials that are ―off lesson‖ to foster a culture of reading for enjoyment.
D. Tongue of instruction. Research and our project experience shows that children provided with
materials and instruction in their mother tongue learn faster and more deeply than children whose
instruction starts with a language that is foreign to them. Of course, this claim assumes that the
instruction in mother tongue is of reasonable quality. If it is, skills developed in mother tongue will later
transfer (more effectively with explicit instructional strategies) to the acquisition of other languages.
Mother-tongue instruction is not always popular, however, as parents and communities often mistakenly
think that instruction solely in a foreign language (usually a colonial language) is the only way for their
children to become literate in that language, which they see as the goal of schooling and tend to value
more because of its association with formal sector employment and modernization. Therefore, parents
need information to understand that becoming literate in one’s mother tongue allows children to learn
content easily and greatly facilitates learning in another language.
Because mother-tongue instruction has been underemphasized, particularly in Africa, and has been
provided in a shoddy manner in most of the world (e.g., materials are grossly insufficient and not often
of good quality, while teachers are poorly trained to use them), the results are not always good
(although almost always better than the results in a foreign language). The lack of marked improvement
makes it harder to break the popular perception that instruction in mother tongue is not valuable.
Critics also frequently use the linguistic complexity of some African classrooms as a convenient
scapegoat for poor-quality instruction in general and mother-tongue instruction specifically, rather than
identifying context-specific solutions and focusing time and effort on improving materials and teacher
training. Specific actions therefore need to be taken to inform parents and others about the benefits of
mother-tongue education, while time needs to be invested to develop effective programs and materials.
E. Measurement (“testing” for short). A tight focus on learning outcomes requires measurement of the
results produced. The majority of our projects, and those we have evaluated or been inspired by, have
used extensive measurement in various creative ways. Oral measurement through early grade reading
assessments (EGRA), for instance, has been a welcome innovation for measuring reading out-comes in
the formative years both at the national and classroom levels. Hallmarks of the use of measurement for
results are that it has to
1. be useful to those who supervise the teachers;
2. be directly useful, transparent, and easy for the teachers themselves to inform their own
instruction; and
3. underpin communication with parents and communities, as well as national politicians.
There must be a climate of accountability.
Doing all five ―T’s‖ properly requires skill, devotion, discipline and hard work. Thus, it requires tight
management, governance, and accountability. Donor projects can supply all three, in an experimental
fashion, to ―prove‖ to governments that learning for all—and in particular reading for all—is possible.
But once the project is removed, the reforms introduced often fail to be replicated, precisely because
the managerial and governance conditions required are not yet systemic in lower-income and lower-
middle-income countries. Thus, a key task for donors and nongovernmental organizations (NGOs) is to
promote systemic change so that the sorts of practices that do lead to improved learning outcomes are
sustained.
Evidence Base from Projects
The evidence base from which we derive these lessons is drawn from the following projects.1

34
Early Grade Reading Assessment (EGRA) Plus: Liberia
At the request of the Liberian Ministry of Education, USAID supported the design and implementation of
EGRA Plus through implementing partners RTI International and the Liberian Education Trust. It was
both an intervention and a randomized control trial. Two levels of intervention—a ―light treatment‖ and
a ―full treatment‖—were applied in schools and then compared against a control group of schools that
followed the standard reading instruction approach in Liberia. In the light treatment group, reading levels
were tested and schools were informed of the results and shown how to share them with the
community through report cards. This minimal intervention was designed to test an ―accountability‖
hypothesis—to evaluate whether simply receiving information about students’ reading levels would
motivate teachers and parents to focus on reading instruction and lead to student reading gains. In the
full treatment group, reading levels were assessed; parents and communities were informed; teachers
were trained on how to continually assess student performance; and teachers were provided frequent
school-based teaching support, specified lessons plans, resource materials, and books for students to use
in class and take home.
The EGRA Plus experiment was conducted in grades 2 and 3 in 180 schools divided into three groups of
60, corresponding to the light treatment, full treatment, and control groups. The program began in
January 2009, and the final evaluation took place in June 2010. RTI found that students in the full
treatment group outperformed their peers in all reading skills. They nearly tripled the gains made by the
control group in oral reading fluency and reading comprehension. The full treatment group also
increased non-word fluency sevenfold, indicating that EGRA Plus had a particularly large impact on
improving children’s decoding—the ability to break new words into sounds and link them together—
which is a key intermediate step to unlocking fluency and comprehension. The overall effect size of the
intervention was 0.79 standard deviations (SD), considered large for social science efforts.2
District Development Support Program (DDSP) and Integrated Education Program (IEP) (South
Africa). These consecutive large-scale projects, implemented from 1998 to 2009 by RTI, covered a
broader range of grades, subjects, and schools in a more diffuse way than other projects summarized
here. They also tended toward a ―whole-school‖ approach rather than a purely pedagogical approach.
They did enhance time use, teacher content knowledge and skills, assessment, and community
participation; instruction in mother tongue was not a heavy focus.
Overall, a 20% improvement in learner performance was seen in IEP across all grades and subjects, and
DDSP produced approximately a 40% gain in numeracy. Project evaluations found that use of structured
lessons, student workbooks, and assessment practices (e.g., use of item banks) played a key role in
driving results.
Breakthrough to Literacy (BTL) (Zambia). This project was financed by the UK Department for
International Development (DFID) and implemented by the Molteno Institute of Language and Literacy a
South African NGO) between 1999 and 2005. It focused on simple, tightly focused interventions in
reading, using dedicated time, mother-tongue instruction, provision of training and materials, and very
simple but focused measurement of results. Children’s reading scores, which admittedly started with a
low base, improved in the range of 300% to 500% in just a few years.
Malindi District Experiment (Kenya). This small activity, which used a randomized design with pre-
and post-treatment measurement, was funded by USAID and implemented by Aga Khan Foundation and
RTI. The activity used simple, scripted lessons to improve reading in English and Kiswahili. It resulted in
learning outcome improvements in the range of 80% in key reading skills
such as fluency in reading connected text. The project generated surprising results in the control
schools as well, which, upon further research, may have been caused by the transference of techniques
demonstrated as effective in the treatment schools to control schools. While this ―polluted‖ the rigor of

35
the evaluation, it also demonstrated that if lessons and techniques are sufficiently structured and
practical (as opposed to theoretical), and have sufficient impact that it is visible to teachers and
principals, the innovations can spread. This was a key lesson of this project, although its applicability
probably depends on the existence of a climate of accountability and a tendency to focus on outcomes,
which was present in Kenya.
Systematic Method for Reading Success (SMRS) (South Africa). This activity, implemented under the
Integrated Education Program discussed above by RTI in collaboration with the Molteno Institute of
Language and Literacy, also used control and treatment groups, as well as pre and post measurement.
Instructional improvements focused on time use, mother-tongue instruction, simplified materials, and
use of step-by-step lesson templates.
Implemented for less than a year, this activity showed that even in such a short period, children in
treatment schools could learn two to three times faster than children in control schools. The effects
were subjected to rigorous statistical analysis, and in terms of effect sizes showed an impact of around
0.8, considered very high in education research and interventions, especially if produced in less than one
year (albeit from an extremely low base, as the grade targeted was grade 1).
Read-Learn-Lead (RLL) (Mali). The Institut pour l’Education Populaire’s (IEP) program is funded by the
William and Flora Hewlett Foundation and evaluated by RTI. Key elements are (1) tightly designed daily
lesson plans covering the essential steps of effective reading instruction, (2) the use of mother tongue
and (3) focused time for reading instruction. 1 For complete reports on the projects, please visit the EdData II project website, https://www.eddataglobal.org.
2 Effect size is a simple way of calculating the difference between two groups; in this case the average child in the treatment group outperformed the average child in the control group by 0.79 SD, and therefore exceeded the scores of 78% of students in the control group.
Despite an extremely difficult environment (strikes, curricular confusion due to simultaneous and
unfinished curricular reforms, nonprovision of learning materials by the government, lack of
accountability and certainty), this project has managed to produce improvements of several hundred
percent in only one year of intervention, with an overall effect size of around 0.4 (0.25 is considered a
good benchmark for significant impact).
Early Grade Reading Intervention (The Gambia). In early 2007, the World Bank and the government
of The Gambia partnered to conduct an early grade reading assessment in English of students in grades
1–3. From a sample of 1,200 students across 40 schools, nearly two-thirds of the students were unable
to read even a single word from a simple paragraph. In response, the government implemented a series
of activities to improve reading performance among its nation’s schoolchildren. The three-pronged
approach included (1) the creation of a national task force to identify gaps in instructional materials and
teacher training; (2) the design and implementation of a nationwide in-service training of teachers in
grades 1–3 and their monitors; and (3) the development of a Handbook of Teaching Early Grade Reading
Activities, used to conduct the nationwide trainings.
In 2009, the Ministry of Education administered a second early grade reading assessment to inform
policy makers, curriculum developers, development partners, and practitioners on the impact of the
interventions that had been implemented since 2007. Based on a sample of the same schools that
participated in the 2007 assessment, the results showed a significant, positive impact on students’ overall
mean reading scores; including an increase in the overall mean score for every early grade reading
indicator tested. Comprehension results (measured as the percentage of children attaining at least 80%
comprehension) improved by more than 600% for girls (a 23.3 percentage point increase), while boys
improved their performance by some 200% (a 10.6 percentage point increase).
Girls’ Improved Learning Outcomes (GILO) (Egypt). The USAID GILO project conducted an early
grade reading assessment in Arabic with students in grades 2, 3, and 4 in Upper Egypt in 2009. The

36
assessment revealed that while nearly half of grade 2 students met the benchmark for identifying letter
names, 50% could not identify a single letter sound. Identifying letter sounds is more crucial to decoding
and reading words than knowing the letter names. Consequently, more than half of grade 2 students
could not read a single word in isolation. In grade 4, 29% of students still could not read a single word.
To address this weakness, GILO designed a package of reading lesson plans that improved the teaching
of phonics—identifying letter sounds—using cognitive engagement techniques and supported by
instructional materials.
GILO rolled out the training to selected teachers in all four project-supported governorates before the
start of the 2010–2011 school year. The project conducted a follow-up EGRA at the end of the school
year to measure the impact of the enhanced teaching method on student learning, assessing all of the
same schools from the first EGRA, including a set of control schools. Preliminary analyses of the impact
of the intervention indicate that the enhanced reading instruction resulted in significant improvement for
the GILO-supported schools. On average, students in GILO-supported schools identified 19 more letter
sounds per minute at the end of the school year, an increase of 194% over baseline. Meanwhile, students
in the control group gained just two letter sounds per minute, an increase of only 21% over baseline.
The impact of the instruction on students’ passage reading fluency was also dramatic: an average of 10
more words read per minute—an increase of 82% over baseline—compared to three more words read
per minute among the control group—an increase of 38% over baseline. And this occurred in spite of
the fact that the students were out of school for six weeks in the spring semester during the Egyptian
revolution, indicating that they had retained what they learned.

37
School Resources and Educational Outcomes in Developing
Countries: A Review of the Literature from 1990 to 2010 Paul Glewwe (University of Minnesota)
Eric A. Hanushek (Stanford University) Sarah Humpage (University of Minnesota)
Renato Ravina (University of Minnesota)
September 2011
Abstract
Developing countries spend hundreds of billions of dollars each year on schools, educational
materials and teachers, but relatively little is known about how effective these expenditures are
at increasing students’ years of completed schooling and, more importantly, the skills that they
learn while in school. This paper examines studies published between 1990 and 2010, in both
the education literature and the economics literature, to investigate which specific school and
teacher characteristics, if any, appear to have strong positive impacts on learning and time in
school. Starting with over 9,000 studies, 79 are selected as being of sufficient quality. Then an
even higher bar is set in terms of econometric methods used, leaving 43 ―high quality‖ studies.
Finally, results are also shown separately for 13 randomized trials. The estimated impacts on
time in school and learning of most school and teacher characteristics are statistically
insignificant, especially when the evidence is limited to the ―high quality‖ studies. The few
variables that do have significant effects – e.g. availability of desks, teacher knowledge of the
subjects they teach, and teacher absence – are not particularly surprising and thus provide little
guidance for future policies and programs.

38
I. Introduction and Motivation
Economists and other researchers have accumulated a large amount of evidence that
education increases workers’ productivity and thus increases their incomes.22 There are also
many non-monetary benefits of education, such as improved health status and lowered crime
Lochner (2011)). Finally, at the country level there is also a large amount of evidence that
education increases the rate of economic growth (Hanushek and Woessmann (2008)). These
analyses all highlight the value of improving a country’s human capital and provide the
motivation for developing countries to invest in the skills of their populations. They do not,
however, indicate which types of specific investments should be pursued.
Policymakers in developing countries have quite generally accepted the message of these
benefits from improved human capital and have greatly increased their funding of education. As
seen in Table 1, since 1980 real government expenditures on education doubled in Latin
America and Sub-Saharan Africa, almost tripled in the Middle East, and increased by more than
five-fold in East Asia and by almost eight-fold in South Asia. International development agencies
have also called for greater resources to be devoted to education, and have increased their
levels of assistance for education projects in recent years, as shown in Table 2. The most consistent focus of investment has been on increasing primary and secondary
school enrollment rates, with the ultimate goal of higher levels of educational attainment. The
increases in enrollment over the past three decades, particularly at the primary level, have been
quite dramatic. From 1980 to 2008 primary and secondary enrollment rates have increased in
all regions of the developing world (Table 3), so that by 2008 gross primary enrollment rates
were at or above 100 percent in all regions, and gross secondary enrollment rates were above
50 percent in all regions except Sub-Saharan Africa.23 Similarly, Table 4 shows that primary
school completion rates increased in all regions from 1991 to 2008, and were close to 100
percent in all regions except for South Asia and Sub-Saharan Africa.
Much of the increased funding for education, particularly in the earlier periods, took the
form of building and staffing schools in areas where no school previously existed, reflecting the
simple fact that it is hard to go to school if no school exists. Moreover, there is ample
evidence that enrollment increases when the distance to the nearest school decreases. When
increased spending on existing schools makes them more attractive, either by reducing school
fees and other direct costs of schooling or by improving the quality of the educational
opportunities they provide, enrollment would be expected to increase further.24
More recently, however, attention has begun to swing toward the quality of schools and
the achievement of students – and here the evidence on outcomes is decidedly more mixed.
Over the past decade, it has become possible to follow changes in student performance on
tests offered by the Programme for International Student Assessment (PISA). While student
learning appears to be increasing in several countries, this tendency is not universal. More
22
The majority of this work, following the seminal studies of Jacob Mincer (1970, (1974), has focused on how school attainment relates to individual earnings, and there are now estimates of the return to schooling for a majority of countries in the world (Psacharopoulos and Patrinos (2004)). More recent work has added measures of achievement to this (e.g., Mulligan (1999), Murnane, Willett, Duhaldeborde, and Tyler (2000), and Lazear (2003)), although little of this relates to developing countries (see, however, Hanushek and Zhang (2009)). 23
Gross enrollment rates compare numbers of school children to the size of a specific age cohort so that grade repetition, late enrollment, and the like can lead to gross enrollment rates over 100 percent. 24
Hanushek, Lavy, and Hitomi (2008) find that school dropout decisions are very responsive to the quality of the school (in terms of value-added to achievement).

39
specifically, Table 5 presents evidence on learning among 15 year old students in 12 countries
(of which 7 are in Latin America). Examining trends from 2000 to 2009, five countries show
clear upward trends (Chile, Colombia, Peru, Tunisia and Turkey), while the rest show either
mixed or even decreasing trends. At the aggregate level, it may simply be that expanded
enrollment brings in progressively less able and less qualified students, who then pull down the
average score. Yet some countries with mixed or declining trends did not show large increases
in school enrollment, and were increasing real expenditures per student on education. For
example, in Argentina the gross secondary school enrollment rate has been about 85 percent
from 1998 to 2007, and spending per pupil was somewhat higher in 2004-06 than in 1998-2000;
yet test scores in 2007 were lower than in 2000. Similarly, Brazil’s progress has been uneven at
best, yet it experienced only a moderate increase in secondary school enrollment (7-13
percentage points) from 2000 to 2007, and real spending on education steadily increased over
time.25
The concern about quality becomes more significant in analyses of the impact on
student learning (achievement) of demand side programs that stimulate increased enrollment.
A recent survey of high quality analyses of currently popular demand side programs – fee reductions, conditional cash transfers, and school nutrition programs – the higher enrollment
induced by these programs was not accompanied by increased achievement (Hanushek
(2008)).26 It is natural to think that bringing students into school must certainly increase their
learning and achievement, but this impact may be limited to new students who were not
previously in school with no effect (or even a negative effect) on current students.
This discussion is related to a substantial body of literature, particularly for developed
countries, that suggests that money alone is not the answer to increase student learning.
Specifically, for developed countries there is substantial research indicating that overall
expenditures, and common school initiatives funded by those expenditures such as lower class
sizes or more educated teachers, are not closely related to student outcomes.27 Similar
findings, although not as strong, come from the research on schools in developing countries
(Fuller and Clarke (1994), Harbison and Hanushek (1992), Hanushek (1995)).
In response to findings that increased educational spending has had little effect on
student performance, many policymakers and researchers in both developed and developing
countries have advocated changing the way that schools are run – such as changing the
incentives faced by teachers (and by students) and, more generally, changing the way that
schools are organized.
Yet it is still possible that spending that changes basic school and teacher
characteristics, if properly directed, could play a role in improving students’ educational
outcomes in developing countries. Thus it is useful to review the more recent literature on
school spending and resources, extending the prior reviews that covered studies through the
early 1990s. Indeed, significant numbers of new studies have appeared since 1990.
25
See the World Bank’s World Development Indicators. Note that Brazil’s gross (net) secondary school enrollment rate increased from 99 (66) in 1999 to 106 (79) in 2005, Educational expenditures (in terms of real U.S. $ per secondary student) increased from, on average, about 1340 (350) from 1998 to 2000 to about 1510 (500) from 2004 to 2006 in Argentina (Brazil). 26
The only demand side program that increased achievement was a Kenyan scholarship program that directly related incentives to achievement (Kremer, Miguel, and Thornton (2009). 27
These conclusions have been controversial, and much has been written about the interpretation of the evidence. For a review of the inconsistencies of effects, see Hanushek (2003). For the range of opinions, see, for example, Burtless (1996), Mishel and Rothstein (2002), and Ehrenberg, Brewer, Gamoran, and Willms (2001).

40
More importantly, many of the newer studies employ much stronger research designs
than were previously used. The appreciation of researchers for the difficulty of obtaining clear
estimates of causal impacts has grown considerably over the past two decades. The sensitivity
to these issues, along with more care about the underlying methodological approach, suggests
that the new studies may in fact yield conclusions different from those drawn on the older
research.
This paper examines both the economics literature and the education literature
published in the last two decades to assess the extent to which school and teacher
characteristics have a causal impact on student learning and enrollment. More specifically, this
paper reviews the literature that attempts to estimate the impact of school infrastructure and
pedagogical materials (such as electricity, condition of the building, desks, blackboards and
textbooks), teacher characteristics (education, training, experience, sex, subject knowledge, and
ethnicity), and school organization (pupil-teacher ratio, teaching methods, decentralized
management, and teacher contracts and working conditions) on student enrollment and
learning.
The remainder of this paper is organized as follows. The next section describes a simple interpretive framework. This is followed by a description of the parameters of this review and
of how studies were selected for inclusion. Finally, we present the results of our review and
draw conclusions about priorities for future research.
II. Interpreting the Research on Basic Education Inputs
The overarching conceptual framework employed here considers schools as ―factories‖
that produce ―learning‖ using various school and teacher characteristics as ―inputs‖. This is the
production function approach introduced early in microeconomics courses. However, the
actual application and interpretation in education differs from the simple textbook treatment.
The reasoning underlying this conceptual framework is that the process by which
cognitive skills are learned is determined by many different factors, and production functions
are expressions, in simple terms, of this process. The relationship can be very flexible, allowing
for almost any learning process. In this sense, an education production function always exists,
although its existence does not guarantee that one can estimate it.
In the ideal case, if one can estimate this relationship, one can use information on the
costs of school characteristics, classroom materials, and even teacher characteristics to select
the combination of these that is most effective in increasing enrollment and/or student
performance (e.g. increase in test scores per dollar spent) given a limited budget. In theory,
this could also apply to pedagogical practices, which have implementation costs.
A. Relationships of Interest. It is useful to step back to consider what relationships
are of interest and how those relationships interact with households’ behavior. The theory of
the firm, where analyses of production functions are generally introduced, takes the perspective
of a decision maker who optimally chooses the combination of inputs for his or her firm. But
this perspective ignores a key reality of education: students and parents -- both important
inputs into achievement – also make their own decisions in response to the school decision
maker’s choices.
To begin, assume that the parents of the child maximize, subject to constraints, a (life-
cycle) utility function. The main arguments in the utility function are consumption of goods and
services (including leisure) at different points in time, and each child’s years of schooling and

41
learning. The constraints faced are the production function for learning, the impacts of years of
schooling and of skills obtained on the future labor incomes of children, a life-cycle budget
constraint, and perhaps some credit constraints or an agricultural production function (for which
child labor is one possible input). Following Glewwe and Kremer (2006), the production function
for learning (a structural relationship) can be depicted as:
A = a(S, Q, C, H, I) (1)
where A is skills learned (achievement), S is years of schooling, Q is a vector of school and teacher
characteristics (inputs that raise school quality), C is a vector of child characteristics (including
―innate ability‖), H is a vector of household characteristics, and I is a vector of school inputs
under the control of parents, such as children’s daily attendance and purchases of textbooks and
other school supplies. Although children acquire many different skills in school, little is lost by
treating A as a single variable.
Assume that all elements in the vectors C and H (which include parental tastes for
schooling, parental education, and children’s ―ability‖) are exogenous. Some child characteristics that affect education outcomes (such as child health) may be endogenous; they can be treated as
elements of I, all of which are endogenous.
In the simplest scenario, only one school is available and parents can do nothing to change
that school’s characteristics. Thus all variables in Q are exogenous to the household. Parents
choose S and I (subject to the above-mentioned constraints) to maximize household utility, which
implies that years of schooling S and schooling inputs I can be expressed as general functions of
the four vectors of exogenous variables:
S = f(Q, C, H, P) (2)
I = g(Q, C, H, P) (3)
where prices related to schooling (such as tuition, other fees, and prices of textbooks and
uniforms), which are also exogenous, are denoted by the vector P.
Inserting (2) and (3) into (1) gives the reduced form equation for (A):
A = h(Q, C, H, P) (4)
This reduced form equation is a causal relationship, but it is not a textbook production function
because it reflects household preferences and includes prices among its arguments.
The more realistic assumption that households can choose from more than one school
implies that Q and P are endogenous even if they are fixed for any given school. In this
scenario, households maximize utility with respect to each schooling choice, and then choose
the school that leads to the highest utility. Conditional on choosing that school, they choose S
and I, as in the case where there is only one school from which to choose.
Policymakers are primarily concerned with the impact of school and teacher
characteristics (Q) and prices related to schooling (P) on years of schooling (S) and eventual
academic achievement (A). For example, reducing class size can be seen as a change in one
element of Q, and changing tuition fees can be seen as altering one component of P. Equations
(2) and (4) show how changes in the P variables would affect S and A. In addition, equation (2)

42
also shows how changes in school and teacher quality (Q) affect students’ years of schooling
(S).
Turning to the impact of school quality variables (Q) on student learning, there are two
distinct relationships. To see this, consider a change in one element of Q, call it Qi. Equation
(1) shows how changes in Qi affect A when all other explanatory variable are held constant, and
thus provides the partial derivative of A with respect to Qi. In contrast, equation (4) provides
the total derivative of A with respect to Qi because it allows for changes in S and I in response
to the change in Qi.28 Parents may respond to higher school quality by increasing their
provision of educational inputs such as textbooks. Alternatively, if they consider higher school
quality a substitute for those inputs, they may decrease those inputs.
The fact that parental actions may reduce or reinforce school decisions may help to
explain a portion of the prior inconsistencies in estimating the impact of school resources.
Indeed, different studies could obtain different estimates of the impacts of the Q variables on
student learning because some studies estimate the production function, that is equation (1),
while others estimate the reduced form relationship in equation (4), and it is quite possible that
impacts of the Q variables will be different in these two equations. When examining the impact of school quality (Q) on academic skills (A), are the impacts
in equation (1) or equation (4) most useful for policy purposes? Equation (4) is useful because
it shows what will actually happen to A after a change in one or more element in Q. In
contrast, equation (1) will not show this because it does not account for changes in S and I in
response to changes in Q and P. Yet the impact in equation (1) is also of interest because it
may better capture overall welfare effects. Intuitively, if parents respond to an increase in Qi
by, for example, reducing purchases of inputs I, they will be able to raise household welfare by
purchasing more of some other good or service that raises utility. The impact of Q on A in
equation (4) (i.e. the total derivative) reflects the drop in A due to the reduction in I, but it
does not account for the increase in household welfare from the increased purchase of other
goods or services. In contrast, the structural impact measured in equation (1) ignores both
effects. Since these two effects have opposing impacts on household welfare, they tend to
cancel each other out, so the overall welfare effect is reasonably approximated by the change in
A measured in equation (1). This is explained more formally in Glewwe, Kremer, Moulin, and
Zitzewitz (2004).
B. Estimation Problems and Potential Solutions. Many published studies in both
the economics literature and the education literature attempt to estimate the impact of school
and teacher characteristics on enrollment and learning, but these attempts face a number of
serious estimation challenges.
Consider estimation of a simple linear specification of the production function in
equation (1):
A = β0 + β1S + βQ1Q1 + βQ2Q2 + … + βC1C1 + βC2C2 + … (1′) + βH1H1 + βH2H2 + … + βI1I1 + βI2I2 + … + uA
28
For an early development of this idea, see Kim (2001).

43
where each variable in Q, C, H and I is shown explicitly.29 An ―error term‖, uA, is added, for
several reasons. First, data never exist for all variables in Q, C, H, and I, so uA accounts for all
unobserved variables. Second, uA indicates that (1′) is only a linear approximation of (1). Third,
observed test scores (A) may measure actual skills with error, so uA includes measurement
errors in the ―true‖ A. Finally, the explanatory variables in (1′) may also have measurement
errors, which are also included in uA.
The causal impacts of the observed variables in (1′) on learning, the β coefficients, can be consistently estimated by ordinary least squares (OLS) only if uA is uncorrelated with ALL the
observed “explanatory” variables. Unfortunately, under a range of circumstances, uA is likely to be
correlated with those variables.
The potential pitfalls of statistical analysis aimed at uncovering the causal impact of
various factors on achievement are now fairly well understood. They are the subject of
graduate courses in evaluation methods as well as critiques of existing research. For detailed
discussions, see Glewwe (2002) and Glewwe and Kremer (2006); the rest of this section
summarizes both the problems and the potential solutions.
The most common generic concerns are omitted variable bias, sample selection,
endogenous program placement, and measurement errors. Turning to the first concern, if
major inputs to achievement are omitted from the estimation of equation (1), they will end up
in uA. If these omitted factors are correlated with the included variables, bias is introduced, with
the bias being proportional to the importance of the omitted factors (their coefficient in equation
(1)) and their correlation with the included factors. Similarly, school and teacher factors often
affect which children attend school and how their parents make decisions about their schooling
(see, for example, Hanushek, Lavy, and Hitomi (2008)). School quality could also be correlated
with uA if governments improve schools that have unobserved education problems (Pitt,
Rosenzweig, and Gibbons (1993)). Governments may also raise school quality in areas with good
education outcomes, if those areas have political influence (World_Bank (2001). The former
causes underestimation of school quality variables’ impacts on learning, while the latter causes
overestimation.30 Finally, measurement error – a ubiquitous problem that can be particularly
severe in developing countries – can bias estimates, often pushing estimates toward zero and
making factors look insignificant.
Considerable effort has now gone into how to deal with these problems. Besides better
measurement to correct errors in variables, the essential thrust has been to develop estimation
methods that ensure that uA is uncorrelated with the variables of interest. Most significant in
recent decades has been the design of experiments that work to ensure this, i.e., the use of
randomized control trials (RCTs); see, for example, Kremer (2003). But other methods such as regression discontinuity (RD) designs and panel data methods have also been pursued to achieve
the same goal. While these are the subject of considerable current research, there are also good
reviews and discussions of them elsewhere (e.g., Imbens and Wooldridge (2009), and Blundell
29
A common first assumption made in much of the existing literature is that equation (1) can be approximated by a linear function; this assumption is not particularly restrictive. The estimation generally relies on the model being linear in the parameters, and a variety of specifications that are nonlinear in the variables can be accommodated by this specification, say by adding adding squared or interaction terms to the variables in (1). 30
This type of problem has also been prominent in many discussions of the estimation of teacher effects in the U.S. literature. If school principals assign teachers to classrooms based on unobserved characteristics of the teachers, the ability to estimate the impact of teachers may be affected; see Rothstein (2010) and Rivkin (2008).

44
and Dias (2009)). The important fact for our purposes is that these approaches have begun to
appear in the literature on achievement in developing countries. And we explicitly include this
literature in our review below.
III. Scope of Review
We now move to the heart of this study – reviewing relevant research on the
determinants of student achievement and time in school in developing countries. This review
is, however, more limited than that statement might suggest. First, it focuses on studies from
1990 to 2010 and does not return to prior studies that have been reviewed elsewhere.
Second, it focuses only on primary and secondary education, and thus it does not include pre-
primary, vocational or post-secondary education (see Attanasio and Meghir, 2011, for a review
of the evidence on pre-primary education). Third, the primary outcome of interest is student
learning (usually measured in terms of test scores), although we also consider school
enrollment (including related phenomena such as daily attendance and years of schooling
attained).31 Finally, this paper will not examine school policies related to incentives for students
and parents (since this is covered by Behrman, Parker, and Todd (2011)), school organization and management (covered by Galiani and Perez-Truglia (2011)), the relative performance of
private and public schools (MacLeod and Urquiola (2011)) and school policies that affect child
health (Alderman and Bleakley (2011)).
The rest of this section explains how the vast literatures in economics and education
were searched. The objective of the review process was to identify as many relevant, high-
quality papers as possible. The strategy was to search a wide variety of sources, and then
systematically eliminate individual papers that do not meet a series of criteria for relevance and
quality. The first step was to conduct the search for journal articles published between 1990
and 2010 using two search engines that cover the economics and education literatures,
respectively: EconLit and the Education Resources Information Center (ERIC). The search was
conducted during October and November of 2010; for this reason, papers that were not yet
available at that time are not included in this review. The authors searched for papers that
listed both ―education‖ as a key word, and any one of a list of 72 educational inputs as keyword
(see Appendix I for this list). Because of the overwhelming number of papers found in ERIC
using these search terms (over half a million), the search was limited to papers that also
included the name of at least one developing country or the term ―developing country‖ or
―developing countries‖ in the abstract. Developing countries are defined as in the International
Monetary Fund’s list of emerging and developing countries, as published in its World Economic
Outlook Report, published in April 2010.
This search yielded a total of about 9,000 articles. Two of the authors reviewed each of
the 9,000 articles individually, selecting those that looked potentially relevant based on the
information found in the abstract (and, in some cases, looking at the introduction or conclusion
of the paper). Based on reviews of the abstracts only, papers that did not focus on developing
countries, or that did not estimate the impact of a school-level (or teacher level) variable on
31
Of the 79 papers eventually examined (see below for details), only one examined grade repetition, which is an indirect measure of student learning. Yet repetition can also depend on school policies and other factors (such as crowding in particular grades) and so it is a noisy measure of student learning. Because of this problem, and the lack of studies that examined repetition, we exclude studies of repetition in our analysis of the determinants of student learning. (The sole paper that examined repetition also has regressions with test scores as the dependent variable, so it remains one of the 79 studies.)

45
students’ educational outcomes, were eliminated. Papers selected by either of these two
authors were included in the next phase of the review; this winnowing process reduced the
total number of papers to 307.32
In addition to published papers, the authors also searched several prominent series of
working papers in economics: National Bureau of Economic Research (NBER) working papers;
World Bank Policy Research working papers; the Institute for the Study of Labor (IZA); the
Center for Economic and Policy Research (CEPR); and the CESIfo Research Network. Papers
listed as education papers on the Abdul Latif Jameel Poverty Action Lab’s website were also
searched. Working papers published before 2005 were not included, as it was assumed that
high quality working papers written before 2005 should have been published by 2010. When
the same paper appears both as a working paper and as a journal article, only the journal article
was included. Using this process, 29 working papers were added to the 307 published articles.
All four authors reviewed the abstracts of this large group of papers and narrowed the sample
to 253 by eliminating duplicate papers and papers that did not focus on one or more of the
following factors that affect students’ educational outcomes: school infrastructure and
pedagogical materials; teacher (and principal) characteristics; and school organization. In the second phase, the authors read each of the 253 papers (in contrast to first phase,
when only abstracts were read) to obtain further information about each study. During this
phase, additional papers were eliminated for lack of relevance. These fell into three categories:
1. The paper’s focus was not on a developing country (this was not clear in the abstracts of
some papers); 2. The paper focused on an education policy unrelated to school infrastructure
and pedagogical materials, teacher (and principal) characteristics, and school organization; and
3. The paper did not include quantitative analysis of the impact of a school or teacher
characteristic on students’ educational outcomes. A little more than half of the 253 papers
chosen in the first stage were eliminated at this stage, which reduced the studies considered to
112.
In a third phase, the remaining 112 papers were reviewed for their quality, considering
both the econometric methodology used and, when appropriate, covariates included in the
analysis. All articles that were based on a randomized controlled trial (RCT) were retained, as
these studies avoid, or at least minimize, many of the estimation problems discussed in Section
II. Further, estimates based on a difference in differences (DD) regression, regression
discontinuity design (RDD), or matching methods were also included. Finally, papers that used
other, simpler quantitative methods (e.g. OLS) and included at least one general family
background variable (e.g. parental schooling or household income) and school expenditure per
pupil, or one family background variable, one teacher variable, and at least one additional school
variable, were included. By excluding papers that did not meet these restrictions, the sample
was reduced to 79 papers (listed in Appendix II).
A fourth and final phase of the review made further quality distinctions. We examined
further all papers that did not use an RCT, DD or RDD estimation method. Of these, 36
papers that relied on ordinary least squares analysis of cross-sectional data failed to employ any
more sophisticated methodology to control for potential omitted variable or endogeneity bias
(such as instrumental variables or selection correction methods) and these were deemed to be
32
In the economics literature, most papers that included education as a keyword were studies of the impacts of education on some other social phenomenon, as opposed to studies that investigated the impacts of other factors on education outcomes.

46
of lower quality. While results are presented for all 79 studies, a separate analysis is also done
for the 43 papers considered to be ―high quality‖ by this more stringent methodological
criterion. The evolution of the sample is summarized in Table 6.
IV. What Have We Learned from Studies of Education in Developing Countries
Since 1990?
Based on these quality distinctions, this study presents three sets of results that focus
on student learning, as measured by test scores. In subsection A, the results of all 79 studies
are summarized. In subsection B, the results of the 43 studies that passed the higher quality bar
are separately reviewed. Subsection C shows only results from 13 randomized control trials.
Finally, Subsection D examines studies that investigate the determinants of time in school
(attendance, years of schooling, etc.) outcomes.
Obviously, there is an inevitable tradeoff between raising the standard one sets for a
study to be credible and the number of studies one has for drawing general conclusions. In
particular, when the review is limited to studies that used randomized control trials there are
only 13 studies that examined school and teacher characteristics, while there are dozens of school and teacher characteristics (including pedagogical practices) in which one may be
interested. A related issue is how many studies of a particular school or teacher characteristic
are needed to be included in the summary tables. We have set a low limit of requiring only
two studies, which some readers may argue is too low; yet it is easy for any reader to exclude
some of the rows in the summary tables that are deemed to have too few studies. The
exception to this rule is the subsection that focuses on randomized trials; all studies are
included, even when there is only one study that examined a particular school or teacher
characteristic.
Our review of the literature falls into the general category of ―meta-analysis,‖ or the
systematic combining of results from multiple studies. These techniques have been employed
for over a century, with the most intense work found in reviews of medical research. More
recently, however, various forms of meta-analysis have been applied to education research (see,
for example, Hedges and Olkin (1985) for an early application to the education literature).
Meta-analysis can be used for many different purposes, including generalizing to wider
populations, understanding the heterogeneity of effects, and improved statistical power. Here
we do not undertake any formal statistical analyses of the study results because we are
interested in the simplest issue: do studies find consistent impacts of school resources and
pedagogical factors on student achievement?
The general literature on meta-analysis does, however, raise one potentially serious
issue related to our review, that of ―publication bias.‖ In particular, if authors tend to submit
studies with positive (or negative) findings more frequently than those with null findings, or if
editors and journals are more likely to publish articles with significant results, our review of the
published work may overstate the statistical significance of any particular factor.
This problem may be less important in our review than in other areas for meta-analysis,
but in the end we are unable to assess its importance. The reason for potentially less impact
here is that many of the statistical studies reviewed here attempt to estimate the impacts of
multiple factors – such as pupil-teacher ratios along with the impact of textbooks and of
teacher experience. Thus, a given publication can easily contain a mixture of significant and
insignificant factors, whereas a medical publication that addresses a single effect (e.g., the

47
treatment outcome related to a specific drug) will be more focused on the significance or
insignificance of this single parameter. Nonetheless, we do not present any quantitative analysis
of how publication bias may affect our review.
A. Summary Results from All 79 Studies. This section casts the widest possible
net, examining the impacts of over 30 school and teacher characteristics on student test scores.
It is convenient to divide these school and teacher characteristics into three broad types: 1.
School infrastructure and pedagogical supplies; 2. Teacher (and principal) characteristics; and 3.
School organization. In some cases, one could debate whether a particular characteristic
belongs in one category or another (e.g. contract teachers could be thought of as a teacher
characteristic or a school organization characteristic); in such cases an admittedly somewhat
arbitrary assignment is made, but of course the conclusions drawn regarding any particular
school or teacher characteristic do not depend on which of these three categories it has been
assigned.
Table 7 summarizes the findings of the 79 studies in terms of the impact of the first
broad type of variables on students’ test scores. Within this broad type, the variables are
ordered by the number of estimates available from these 79 studies, starting with those with the largest number of estimates. Note that many studies present multiple estimates of the
impact of the same variable, because of multiple estimation methods or multiple subsamples. In
general, different estimation methods or estimations based on different subgroups (for example
boys and girls, or different grades) were counted as separate estimates, but adding or removing
a few variables for the same estimation method (or a similarly minor change) was not counted
as a separate estimate. In cases in which an author presents results from multiple estimations,
but argues that one is a more reliable set of estimates than the others, only the author’s
preferred estimate is included. This is likely to result in an overrepresentation of results from
studies that present multiple estimation methods and do not indicate which method is the
preferred one. In order to allow the reader to give equal weight to studies, that is not to give a
large weight to a single study that produced many different estimates of the impact of the same
variable, the numbers in parentheses show how many separate publications found a particular
impact. Finally, note that for any given estimate, there are five possible classifications:
significantly negative, insignificantly negative, zero (or insignificant but sign not reported),
insignificantly positive and significantly positive. A 10 percent significance level cut-off was used;
while this relatively generous definition of statistical significance will classify more findings as
significant, it is possible that some results that would have fit this criterion are omitted from the
analysis since some authors may not have presented results that are significant only at the 10
percent level.
1. School Infrastructure and Pedagogical Materials. Turning to the results, Table 7
summarizes the findings for eight different school infrastructure and pedagogical material
variables. By far the most commonly estimated impact is that for textbooks and workbooks;
there are 60 estimates from 21 different studies. (The numbers in parentheses add up to 33,
but this reflects the fact that some studies found different effects using different estimation
methods or different subsamples, and thus a single study can appear in parentheses more than
once; the last column in the table gives the total number of studies.) Although these studies are
not unanimous in their estimates, most of them (36) find positive effects, and most of these (26)
are significantly positive. This is what almost anyone would expect, and the number of

48
estimates that are negative and significant is quite small (four estimates from three studies).33
Thus this evidence strongly suggests that textbooks and similar materials (workbooks, exercise
books) increase student learning.
The next most commonly estimated impacts are those of basic furniture (desks, tables
and chairs) and of computers and electronic games. The evidence in Table 7 suggests that
adequate amounts of desks, tables and chairs raise student test scores, as common sense would
suggest. More specifically, of the 28 estimates from eight studies, none is negative and 15 are
positive (of which 8 are significantly positive). The evidence is even stronger if one counts
studies instead of individual estimates (the 13 estimates of zero impact are all from a single
study); all but one study finds a positive impact, and four of the eight find significantly positive
impacts. In contrast, the results for computers and related materials are less clear; 18 of the 26
estimates are statistically insignificant (and they are almost evenly divided between negative and
insignificant and positive and insignificant), while seven are significantly positive and one is
significantly negative. Given that computers can be relatively expensive, this suggests caution
when deciding whether scarce funds for education should be used to purchase computers and
related products. Another commonly estimated school characteristic is electricity.34 One would expect a
positive effect, since electric lighting should help students read and see the blackboard, and it
may also help by providing power for other useful items (e.g. fans to keep the classroom
cooler). Of the fifteen estimates in Table 7, only three are negative (and none is significantly
negative) while twelve are positive (of which six are significantly positive). A similar result holds
if one counts the number of studies with these results; of the six studies only two find negative
impacts (neither of which is significant) while five find positive but insignificant impacts and two
find significantly positive impacts. Thus the evidence gives fairly strong support to the
proposition that providing electricity to schools increases student learning.
Similarly positive effects are found for general indices of school ―infrastructure‖ and for
blackboards (and other visual aids).35 Again, this is what one would expect. Turning to a more
costly school characteristic, school libraries also appear to have generally positive impacts on
student learning as measured by test scores; this is particularly the case when each study is
given equal weight (five of the six studies found a significantly positive effect, while only one
found a significantly negative effect). Finally, it is also the case that high quality walls, roofs and
floors appear to lead to better outcomes: five of the six estimates are positive, and two of the
five are significantly positive (the sole negative estimate is not significant).
33
A significantly negative effect is not necessarily an error; it could be that some textbooks or workbooks were not well written, or not well matched to the students, and that this caused problems. More generally, one should expect some heterogeneity in the impacts. Given our 10% significance level standard, if a certain school variable had zero impact in all schools one should find that 90% of estimates are not significantly different from zero, while 5% are significantly negative and 5% are significantly positive. As will be seen, there are some cases where more than 5% are significantly positive and more than 5% are significantly negative; such a result suggests heterogeneity in the impacts due to differences across countries and across schools within the same country. 34
While electricity could simply be an general indicator of the physical condition of the school, most of the six studies that examined the impact of electricity included other measures of the physical condition of the school. We tend to interpret electricity literally, although it may just be one of the most important, and most accurately measured, dimensions of the quality of school facilities. 35
In almost all of the school infrastructure studies, the index counts whether schools have some or all of the following: library, cafeteria, science labs, playground, and computer labs. As mentioned previously, electricity could also be part of a general infrastructure measure.

49
2. Teacher (and Principal) Characteristics. Table 8 summarizes the findings from the
79 studies for teacher and principal characteristics. The most commonly examined
characteristic is the teacher’s level of education; there are 72 separate estimates from 24
distinct studies. Of these estimates, 46 found a positive impact on student learning, and 24 of
these were significantly positive. In contrast, only 15 estimates were negative, and only four of
these were significantly negative. Counting the number of studies (as opposed to distinct
parameter estimates) in each category gives similar results; only three studies found significantly
negative effects while eleven found significantly positive effects. Thus, as one would expect, the
results generally support the proposition that providing more educated teachers raises
students’ test scores. Similarly, teacher experience seems to have a positive effect, but the
evidence is not quite as strong. More specifically, 43 of the 63 estimates found no statistically
significant impact, although of the 20 that did almost all (17) found a significantly positive
effect.36
A more direct measure of teacher competence is teachers’ knowledge of the subjects
that they teach. The 79 studies include 33 estimates of the impact of teacher knowledge, as
measured by teacher test scores, on student learning. Almost all (29 out of 33) found positive effects, and most of these positive effects (18) were statistically significant. The evidence is not
quite as strong if one examines number of studies instead of number of estimates (seven studies
found significantly positive effects while only two studies’ findings were significantly negative),
but it is still strong and thus supports the common sense notion that teachers who better
understand the subjects they teach are better at increasing their students’ learning.
One teacher characteristic that has more ambiguous effects is whether the teacher is
female. There are 39 estimates, of which 13 are negative (and 6 of these are significant) and 24
are positive (and 12 are significant). While positive impacts are more common than negative
ones, when one counts the number of studies the results are even more ambiguous: four found
significant negative effects, while five found significantly positive effects. Overall, there is little
support for any systematic difference in teacher effectiveness by gender.37
The next most common teacher variable in the 79 studies is in-service teacher training.
Of the 29 estimates, 17 are insignificant (10 are negative and 7 are positive) while 11 are
significantly positive and only 1 is significantly negative. Giving each study equal weight leads to
a similar conclusion. Overall, in-service teacher training appears to have a strong positive
impact on student learning.
The last two teacher variables are a general index of teacher quality and whether the
teacher has a teaching degree (as opposed to a general degree).38 Of the 14 estimates of
indices of teacher quality, none is negative, eight are zero (or insignificant but of unknown sign)
and six are significantly positive. A similar result holds if one gives each study equal weight,
although there are only two studies. This suggests that indices of teacher quality have strong
36
Note that both of these findings about teacher characteristics are very much at odds with the U.S. evidence. In the U.S., where all teachers have bachelor’s degrees and the focus is on advanced degrees, there is virtually no evidence that more education for the teachers helps. Similarly, experience past the first few years has no effect. See Hanushek (2003). 37
There is currently a debate about the effectiveness of single sex schools and, implicitly, that female teachers may have a larger impact on girls than boys (see Billger (2009), Kaufman and Yin (2009), Park and Behrman (2010)). However, in all but one of the studies examined here estimates are not given separately for male and female students, and the sole exception found no difference. 38
The 14 estimates of teacher quality come from two studies, which define teacher quality in terms of an index of teacher experience, level of education, and scores on math and reading tests.

50
positive impacts on student learning. In contrast, the two studies that considered whether a
teacher had a teaching degree yield less clear conclusions. Of the six estimates from the two
studies, two are insignificantly negative, two have point estimates close to zero, and two have
significantly positive impacts. The same distribution holds if one gives each study equal weight.
Two principal characteristics were examined in several different studies: years of
experience and level of education, and their impacts appear to be different. In particular, years
of experience had a positive impact in five of the six estimates, and of the five positive estimates
two were statistically significant (the sole negative estimate was not significant). Giving each
study equal weight does not change this finding. In contrast, of the six estimates of the impact
of the principal’s level of education, two were significantly negative, one was significantly
positive, and the other three were not statistically significant (and the same general result holds
if each study is given equal weight). Thus principal experience appears to lead to increased
student learning, but there is no clear evidence that the same is true of principal education.
3. School Organization. Table 9 examines the third general category of school and
teacher variables, school organization. These variables focus on how schools are organized, as
opposed to the basic characteristics of schools and teachers. By far the most common variable of this type in the literature is class size, that is the pupil-teacher ratio; there were 101 separate
estimates from 29 different studies.39 Intuitively, one would expect the pupil-teacher ratio to
have a negative effect on student learning, and that was the case in 59 of the 101 estimates,
although only 30 of the 59 were statistically significant. Another 39 estimates had an
unexpected positive sign, but only 15 of these were statistically significant. In terms of numbers
of studies, instead of numbers of estimates, 26 studies found a negative impact, of which 13
were significantly negative, and 21 found a positive impact, of which 9 were significantly positive.
Overall, these estimates suggest that increases in class size usually have negative impacts
on student learning, as one would expect, but the finding that 9 of the 29 studies found a
significantly positive effect suggests caution. These positive effects could reflect either random
chance or estimation problems; an example of the latter is that schools that are of high quality
due to unobserved characteristics will attract more students, raising the pupil teacher ratio and
thus leading to a positive correlation between that ratio and student test scores. Nonetheless,
the frequency of ―unexpected‖ positive impacts, even in developing countries where pupil-
teacher ratios can be very large, is similar to the findings for developed countries (Hanushek
(2003)).
Clearer results are seen in the next two variables: teacher absenteeism and teacher
assigns homework. As one would expect, for teacher absenteeism 13 of the 15 estimates are
negative, and 7 of the 13 are significantly negative. None of the 15 estimates is positive,
although two are insignificant and of unknown sign (the paper did not report the signs of the
insignificant results). In contrast, but also as expected, teacher assignment of homework
generally has positive impacts on students’ test scores. Of the 16 estimates, 12 are significantly
positive and only four are negative (and none is significantly negative). The main caveat is that
these findings are less strong when each of the five studies is given equal weight: three are
significantly positive and two are insignificantly negative.
39
In the United States, pupil-teacher ratios and class sizes can diverge noticeably because teachers have fewer class meetings than students have courses, because teachers perform a variety of nonteaching duties, and so forth. This divergence is likely to be less important for schools in developing countries.

51
School provision of meals has been used in many developing countries to achieve two
distinct goals: improved child health and increased student learning. Four of the 79 studies
examined the impact of school meals on student test scores, producing 13 distinct estimates.
The evidence is inconclusive; seven estimates are negative, of which four are significantly
negative, while six estimates are positive (all of which are statistically significant). Considering
the number of studies gives a somewhat more positive impact; only one found a significantly
negative impact, while two found insignificantly negative impacts and three found significantly
positive impacts. Even so, the evidence does not provide strong support for this intervention,
at least as a means to raise student learning, and school meal programs have the disadvantage
that they can be relatively expensive.
The next two school organization practices yield unambiguous results. The first is one
that is unavoidable in small, rural schools: multi-grade teaching, where one teacher teaches
more than one grade in the same classroom. There are 21 estimates of its impact, based on
only four distinct studies. Four estimates (all from the same study) show a significantly negative
effect, while seven estimates yield positive effects (of which two, from two different studies, are
statistically significant). Overall, these results are decidedly ambiguous, and the actual impact may vary given other factors, such as class size and teacher characteristics. In contrast, results
are relatively unambiguous, and in the expected direction, for hours of the school day; six of
the eight estimates are positive, and four are significantly positive (although when studies are
given equal weight the distribution of the findings is less clear cut).
The results for tutoring are more ambiguous; while four of the five estimates are
positive, and two of these four are significantly positive, when studies are equally weighted two
of the three studies show a positive effect, of which one is significant, but the third shows a
significantly negative effect. While intuitively one would think that tutoring should help, and
would not have any negative effects, it could be that the tutors are simply the students’
teachers, who may be curtailing effort during the school day to obtain paying students for their
tutoring classes (for a general discussion, see Dang and Rogers (2008). Participation in tutoring
may also be an indicator that the student needs extra help, i.e., that achievement is causing
tutoring rather than the other way around.
The next two school organization variables focus on teacher pay: teacher salary and
whether the teacher is a contract teacher. There are only six estimates of the impact of
teacher salary, but all are positive and two are significantly positive, which may indicate that
higher salary raises teacher morale or leads to better selection into teaching. The findings for
contract teachers, however, indicate a possible contradiction. These teachers are hired on
short-term contracts and, in general, have relatively low qualifications, less experience, little or
no benefits, and lower salaries, a combination that might superficially suggest that these
teachers would be less effective.40 Yet five of the six estimates yield positive impacts, and four
of them are significantly positive (although the results are more ambiguous when weighted by
publication). The counterbalancing force behind the positive impact of contract teachers,
according to several researchers, is that they have much stronger incentives to perform well
than regular teachers, who are insulated from performance concerns by civil services rules.
Thus, even with lower salaries, they are induced to perform well in school (perhaps so that
they can subsequently get a regular teaching position with its higher salary and greater job
40
For a detailed review and analysis of recent research on contract teachers, see Galiani and Perez-Truglia (2011).

52
security). Overall, the teacher salary results are consistent with pay inducing more teacher
effort or leading to better selection into teaching, although the interpretation is ambiguous
because much of the variation in salaries comes from pay for different characteristics rather
than identifying the impact of increasing or decreasing the overall salary schedule for teachers.
There are only three estimates in Table 9 regarding the impact of overall school
expenditures per pupil, but the results are somewhat puzzling; in two of the three cases, the
estimated effect is significantly negative (an unexpected effect), while in the other it is
significantly positive. This measure is somewhat difficult to interpret. It could simply reflect
compensatory funding – i.e., schools that are doing poorly get additional funds. And, it is also
possible that the estimated negative effects arise because other school characteristics are
included in the regression; in both studies from which these estimates come (Nannyonjo
(2007); Du and Hu (2008)) several other school and teacher characteristics are included in the
regression. Again, however, there is little overall evidence to support a strong positive impact
of school expenditures, a repeated finding in a wide range of reviews for developed countries
(Hanushek (2003)).
The next two school variables have rather inconclusive results. The cost of enrolling in school could have a negative effect if it interferes with schooling (a child may be excluded from
school until fees are paid) or if it leads to a reduction in home-supplied pedagogical materials,
but the evidence in Table 9 is inconclusive. Similarly, the overall size of the school has no clear
tendency, and it is not clear a priori what the sign of the effect should be.
The next two variables focus on specific elements of pedagogical style: group work and
whether the teacher gives examples in class. Overall, group work seems to have a positive
impact on students’ test scores. In contrast, teachers giving examples in class is more
ambiguous (five estimates are positive, of which three are significantly positive, but two are
significantly negative).
The last school organization variable in Table 9 is student attendance. All eight
estimates from the two studies that examined student attendance are significantly positive.
This, of course, is quite plausible, and it shows that for a few variables the results are clear and
unambiguous
B. Summary Results from 43 Higher Quality Studies. This section repeats the
analysis of the last section but drops 36 studies that were deemed to be of lower quality
because they used simple OLS on cross-sectional data without attempting to use any of the
more sophisticated methods to address the potential estimation problems. As in the previous
subsection, results are shown only if the same school or teacher characteristic was examined in
two or more separate studies.
1. School Infrastructure and Pedagogical Materials. The first panel in Table 10
shows summary results for seven different school infrastructure and pedagogical material
variables (the school infrastructure index was dropped because it was considered by only one
of the 43 studies). As in subsection A, the most common estimated effect is that for textbooks
and workbooks; there are 21 estimates from 8 different studies. While intuitively one would
expect that these items would increase student learning, the estimated effects are far from
unanimous: slightly less than half of the estimates (9 out of 21) find positive effects, but only
three of these are significantly positive (and one is significantly negative). Thus, after dropping
less rigorous studies, the evidence that textbooks and similar materials (workbooks, exercise
books) increase student learning is quite weak.

53
In contrast to textbooks and workbooks, the evidence in Table 10 supports much more
strongly the hypothesis that desks, tables and chairs raise student test scores. More specifically,
all seven estimates are positive, and three of them are significantly positive. On the other hand,
the results for computers and related materials are at best only weakly supportive: 17 of the 22
estimates are statistically insignificant (and they are almost evenly divided between negative and
insignificant and positive and insignificant), but of the five that are statistically significant four are
significantly positive. These results suggest caution when advocating the introduction of
computers and related devices, especially if they are relatively expensive.
The next most commonly estimated school characteristic is electricity. While the
evidence when all 79 studies were examined strongly supported the proposition that providing
electricity to schools increases student learning, this finding completely disappears when less
rigorous studies are dropped: all six estimates are insignificant, of which three are negative and
three are positive. This result is somewhat counterintuitive, but it suggests that the impact of
providing electricity (or, more generally, better school facilities) may not be very strong.
The findings for blackboards (and other visual aids) are generally positive. More
specifically, while four of the six estimates are positive, and two are significantly positive, the two significantly positive results are from a single study. The results for libraries are almost
unanimous: four of the six estimates are significantly positive, and none is significantly negative.
The last school infrastructure variable is the quality of the schools walls, roofs and
ceilings. When all 79 studies were considered, they offered strong support that improvements
in these school characteristics raised students’ test scores. The evidence in Table 10, based on
only the higher quality studies, also strongly supports this conclusion (since all of the estimates
in Table 7 are still in Table 10).
2. Teacher Characteristics. The second panel of Table 10 summarizes the findings
from the 43 higher quality studies for teacher characteristics. (There are no results for principal
characteristics because none had more than one higher quality study.) The first characteristic,
the teacher’s level of education, has ambiguous results; of the 13 estimates 10 are statistically
insignificant (and evenly divided between insignificantly positive and insignificantly negative), and
while two of the other three are significantly positive the third is significantly negative.
Counting the number of studies in each category gives similarly ambiguous results. These
results stand in sharp contrast to those when all 79 studies were included; once lower quality
studies are eliminated there is little evidence that teachers’ level of education has any impact on
student test scores. There is some evidence that teacher experience has a positive effect; 17 of
the 28 estimates found positive effects, and 5 of the 17 are significantly positive (and only one is
significantly negative). Yet with 22 of the 28 estimates being statistically insignificant (and these
are almost even split between insignificantly negative and insignificantly positive), there is only
weak evidence that teacher experience has a beneficial effect, especially when one focuses on
the number of studies (the numbers in parentheses).
In contrast to teachers’ education and experience, more direct measures of their
competence, their knowledge of the subjects that they teach, shows very strong positive
effects. More specifically, of the 20 estimates of the impact of teacher knowledge (as measured
by test scores) on student learning, all are positive and 13 are significantly positive, which
provides very strong support to the hypothesis that teacher knowledge plays a very large role
in student learning.

54
As when all 79 studies are examined, teacher gender has an ambiguous impact within
the 43 highest quality studies. There are eight estimates: six are statistically insignificant
(although five of these are positive and only one is negative), one is significantly negative and
one is significantly positive. Looking at the counts of studies does not alter the ambiguous
results.
The last teacher characteristic in the middle panel of Table 10 is in-service teacher
training. Of the six estimates of its impact, three are significantly positive and three are
negative but insignificant. Thus the evidence at best provides only moderate support to the
hypothesis that in-service teacher training has a positive impact on students’ test scores.
3. School Organization. The third panel of Table 10 examines seven school
organization variables (nine of the variables that were in Table 7 have been dropped because
they were not included in two or more high quality studies). As in subsection A, by far the
most commonly estimated impact is that of the pupil-teacher ratio; there are 46 separate
estimates from 14 different studies. As with the 79 studies examined above, most of the
estimates are negative, with 32 (70 percent) of the 46 showing a negative impact, which is a
higher percentage than when the 79 studies were examined (58 percent). In addition, 14 of the 32 are significantly negative, while only three are significantly positive. In terms of numbers of
studies, however, the results are not as decisive. In particular, five studies found significantly
negative effects while three studies found a significantly positive effect. Overall, these results
again suggest that increases in class size usually have negative impacts on student learning, as
one would expect, but this is not always the case. Another interpretation is that the effect is
negative but it is quite small, so that random variation in estimates often yield positive point
estimates, which on occasion are significantly positive.
In contrast, the results for teacher absenteeism are clearly negative. Of the six different
estimates, all are negative and four are significantly negative. This finding also holds when each
study is given equal weight.
Turning to school meals, the evidence is scarce and remains ambiguous. In particular,
there are only three estimates from two studies; one study presents two estimates that are
significantly positive but the other study finds only an insignificantly negative impact.
The next school organization variable is multi-grade classrooms; there are ten
estimates of its impact, although they are based on only two distinct studies. Four estimates (all
from the same study) show a significantly negative effect, while six find positive effects, although
only one of the six is significantly positive. Overall, these results are decidedly ambiguous, as
was the case when all 79 studies were examined.
The next two variables in Table 10, hours of the school day and tutoring, also have
unambiguous results. Regarding the former, all four estimates (from two different studies) are
significantly positive. The results for tutoring are almost as unambiguous and equally plausible:
all four estimates are positive and two are significantly positive. This is less ambiguous than was
the case when all 79 studies were examined.
Finally, for contract teachers, the results are identical to those in Table 7 because all the
79 studies that examined the impact of contract teachers were found to be sufficiently rigorous
to be in the 43 higher quality studies. Again, if one gives equal weight to each estimate,
contract teachers appear to have strong positive impacts on students’ test scores, but, if one
gives equal weight to studies, the results are more ambiguous.
55
C. Results from 13 Randomized Control Trials. This subsection presents the
results from 13 randomized control trials (RCTs) that altered school characteristics. As noted
above, the RCT methodology is best suited for analysis of specific programs or resources that
can be identified and manipulated easily within an experiment. Thus, the evidence in this
section focuses on a more limited set of inputs; indeed, there are no results for teacher or
principal characteristics, which are difficult to randomize. Unlike the previous subsections,
results are shown even if there is only one study for a given school or teacher characteristic,
since there are very few RCTs available.
1. School Infrastructure and Pedagogical Materials. The first three rows in Table
11 show results for three different general school infrastructure and pedagogical material
characteristics that have been analyzed using randomized trials: textbooks, computers and flip
charts. Two studies examined textbooks, one in the Philippines Tan, Lane, and Lassibille
(1999)) and one in Kenya Glewwe, Kremer, and Moulin (2009)). Overall, the results suggest no
impact of providing textbooks; none of the four estimates is positive, and none is statistically
significant. This is consistent with the weak results found above (subsection B) for the 43
higher quality studies. The next variable in Table 11 is the availability of computers and related electronic
media (internet connections, educational video games, etc.). Five different RCTs have examined
the use of these types of materials. The results have been rather mixed, which is consistent
with the findings of the 43 high quality studies. Of the 20 separate estimates, eight were
negative (but only one significantly so) and twelve have been positive (of which three were
significantly positive).
To understand the variation in results, it is useful to examine each of these five studies.
Banerjee, Cole, Duflo, and Linden (2007) evaluate an intervention in Indian primary schools in
which school teachers received training on how to use educational mathematics software in the
classroom. In treatment schools, students used the software for two hours a week. After two
years of the treatment, students in treatment schools were found to score significantly higher
on math tests than students in the control group, but there was no significant difference in
language scores. In contrast, Osorio and Linden (2009) evaluated the Computers for Education
program in Colombia and found less positive results. In this program, teachers receive
computers as well as eight months of training on how to use the computers in the classroom.
In the schools in their sample, teachers were trained on how to use the computers to support
language education. Pooling results across grades 3 through 9, there were no significant results
of the intervention on any of the eight math and language skills evaluated. Disaggregated by
grade, there are significant positive effects in grade 9 and significantly negative effects in grade 8.
Linden (2008) evaluated a computer-assisted learning program in India and also found
mixed results. When students used computers instead of interacting with classroom teachers
for part of the day, the intervention had a significant negative effect on test outcomes. Students
that used the computer program after school as a complement to their classroom experience,
however, showed some (albeit insignificant) improvement. In another study conducted in India,
Inamdar (2004) evaluated a program that consisted on installing ―Minimally Invasive Education
kiosks‖ in rural Indian schools. These kiosks have internet connected computers installed
where children can explore without any adult direct intervention. Students in the experimental
group obtained better results in Grade 8 computers examination. Note, however, that the
56
sample size of this investigation is quite small, collecting information for a total of only 103
students.
Finally, Rosas et al. (2003) evaluated the effects of introducing educational videogames in
a sample of primary schools in disadvantaged areas of Chile. These videogames cover basic
mathematics and reading comprehension, and they were designed for first and second grade
students. The results indicate the children in the experimental group performed better in
mathematics, Spanish and spelling.
The last RCT that examined a school infrastructure variable is that of Glewwe, Kremer,
Moulin, and Zitzewitz (2004), who examined the impact of flip charts in Kenya. As seen in
Table 11, the results were disappointing, with a negative but statistically insignificant impact.
Note that this result does not necessarily contradict the results in the previous subsection for
the 43 high quality studies. In particular, recall that only two of the six estimates were
significantly positive.
2. School Organization. Several RCTs have been conducted that examine the ways in
which school are organized. Muralidharan and Sundararaman (2008) examine the impact of
class size on achievement in India. In this paper, class size is reduced in schools that were randomly assigned to receive an extra contract teacher. That paper presents five estimates of
the impact of class size on student achievement; three are significantly negative while two are
negative but not significant. More specifically, the effect of class size on combined math and
language test scores is significantly negative in grades one through three, but not in grades four
and five. While these findings are consistent with what one would expect, the authors cannot
separate out the class size effect from the contract teacher effect. Moreover, it is only one
study, and thus it is hard to generalize.
One RCT has considered the impact of providing school meals. Tan, Lane, and Lassibille
(1999)) found a negative but insignificant effect of this type of program in the Philippines.
Tutoring has also been examined by a randomized trial, the study of the Balsakhi tutoring
program in India by Banerjee, Cole, Duflo, and Linden (2007). That study found that providing
tutors to children who are falling behind in the curriculum greatly increased their test scores.
Turning to contract teachers, Muralidharan and Sundararaman (2008) present four
estimates of the impact of contract teachers on student performance, and all four are
significantly positive. This is somewhat more positive than the average over the 43 high quality
studies. However, recall from the discussion of this paper above that the contract teacher was
an ―extra‖ teacher. For this reason, the effect that is found could also be, at least in part, a class
size effect.
Another RCT conducted in India, Pandey, Goyal, and Sundararaman (2009), examined
the impact of community information campaigns on students’ test scores. The study presents
14 different estimates of impacts on reading, writing and math tests, varying by grade and state,
but all are statistically insignificant except for one that is significantly positive. Overall, there is
little evidence that these campaigns had sizeable effects on students’ test scores.
A final school organization variable is the provision of merit-based scholarships. The
single RCT study, conducted by Kremer, Miguel, and Thornton (2009), provides two estimates,
both of which are positive with one being statistically significantly.
D. Impact of School and Teacher Variables on Time in School. Almost all
(69) of the 79 studies examined above focused on student test scores as the outcome of
interest. Yet 18 of these studies also examined time in school variables, such as daily

57
attendance, current enrolment and years in school. This subsection reviews the findings of
these 18 studies on these time in school variables. It is of course necessary to interpret these
studies with added caution, because a variety of programs aimed directly at enrolment and
attainment—such as many conditional cash transfer programs – have failed to lead to added
learning (see the review in Hanushek (2008)). Simply increasing time in school without
commensurate additions to learning and achievement has little value (Hanushek and
Woessmann (2008)).
1. All 79 Studies. Table 12 summarizes the findings when all 79 studies are examined
(of which 18 examined time in school), for all school or teacher variables found in at least two
separate studies. The first five lines examine school infrastructure and pedagogical material
variables. The first examines textbooks and workbooks, for which there are seven estimates
from four distinct studies. These seven estimates yielded only two significant results:
textbooks/workbooks lead to increased time in school. While this is intuitively plausible, the
other five estimates are insignificant, of which two are negative and two are positive (and one is
insignificant but of unknown sign). Thus it appears that textbooks do not have a strong effect
on students’ time in school. The next two school infrastructure variables are whether the school has a library and
the condition of its roof, walls and floors. There are only two estimates, from two distinct
studies, for school library, but they are both statistically significant, in the same direction, and
intuitively plausible: school libraries increase the time the students spend in school. Only two
separate studies examined the impact of the quality of the physical building (roof, wall and floor)
on students’ time in school. Of these, one found a significantly positive effect while the other
found an insignificantly negative effect. This lack of agreement, as well as the small number of
studies, prevents any general conclusions from being drawn.
The next infrastructure variable, building new schools, has a more consistent set of
findings. Of the five distinct estimates, all are positive and four are significantly positive. A
similar finding holds when one gives each of the three studies from which these estimates come
equal weight. All three had at least one set of estimates with a significantly positive impact, and
only one had a positive but insignificant impact. Of course, these finding is of little surprise;
building new schools (which in effect reduces the distance to the nearest school, and may also
reduce capacity constraints) should increase enrollment on eventual years of completed
schooling.
Finally, a general school quality index was used in two separate studies. Together there
are five sets of estimates. All five show positive effects and four of the five are statistically
significant. Yet the evidence is somewhat less strong if one gives each study equal weight; one
study’s estimates were significantly positive while the other study’s results had a significantly
positive impact and an insignificantly positive impact. More importantly, the school quality
index in one paper is composed of several different variables, so it is unclear which variables are
the most important, and in the other paper school quality is a school fixed effect from a
previous estimation, which also does not indicate what school characteristics determine school
quality.
Table 12 presents results for three teacher characteristics: education level, experience
and in-service teacher training. For teachers’ level of education there are five estimates from
four distinct studies that point to ambiguous results: only one of the five is statistically
insignificant. While that one significant estimate is in the expected direction – more educated

58
teachers lead students’ to spend more time in school – the other four are statistically
insignificant, with two negative and two positive.
The findings for teacher experience are puzzling. While on the one hand six of the
seven estimates are positive and two are significantly positive, the one that is negative is
significantly negative, so that when one considers only the estimates that are statistically
significant one is negative and two are positive. Thus there seems to be a positive impact, but it
may be prudent to examine only the studies that are of higher quality (which is done below).
Finally, the three estimates of the impact of in-service teacher training are similar but
give an unexpected result: all three are negative and one is significantly negative. Given that
there are only two studies, one cannot draw a strong conclusion. Yet it is reasonable to
conclude that the small amount of evidence that exists provides no support for the conjecture
that in-service teacher training leads to increased student time in school.
The last three variables in Table 12 focus on school organization. For the first, the
pupil-teacher ratio, five of the seven estimates are statistically insignificant (of which three are
negative and two are positive). The two that are significant, which are from the same study,
show a positive impact. At first glance, this is an unexpected result; a higher pupil-teacher ratio would have a negative effect on learning and so would make time in school less valuable. On
the other hand, schools that are attractive for unobserved reasons will increase student
enrollment and years of schooling, which will lead to a positive correlation between time in
school and the pupil-teacher ratio that is not necessarily a causal effect. This makes it difficult
for any study (with the possible exception of a randomized trial) to determine the impact of the
pupil-teacher ratio on time spent in school.
The cost of enrolling in school (e.g. tuition) should have little direct effect on learning,
but other things being equal it should reduce time spent in school. Of the six estimates shown
in Table 12, five are negative while only one is positive. However, all six of the estimates are
statistically insignificant, so there is not strong evidence that a higher cost of enrolling in school
will lead to lower enrollment and reduced years of completed schooling. As with the pupil-
teacher ratio, there could be serious estimation problems; schools that are more expensive
may be attractive in unobserved ways, which will lead to upward bias of the impact of the cost
of attending school.
Finally, two studies examined merit based scholarships, producing three sets of
estimates. Two estimates are positive while one is negative, yet none of the estimates is
statistically significant. Thus there is no clear impact of merit scholarships on time spent in
school.
2. The 43 High Quality Studies. Table 13 also examines the impacts of school and
teacher variables on students’ time in school, but it considers only the 43 high quality studies, of
which 14 examined the impacts of those variables on time in school. Turning to school
infrastructure and pedagogical materials, the results are identical to those in Table 12 for
textbooks and workbooks, roof, walls and floors, and building new schools, because for those
categories all of the studies were high quality studies. In contrast, neither library nor school
quality index appears because neither had two or more high quality studies.
The results pertaining to teacher characteristics in Table 13 are also almost identical to
those in Table 12; of the three types of teacher characteristics considered (teacher education
teacher experience, and teacher in-service training) almost all of the studies are high quality
studies. The only exception is teacher experience, yet even here four of the five studies from

59
the full set of 79 are high quality studies; for these four studies the impact of teacher
experience on time in school is mixed, with one study finding a significant positive effect,
another finding a significant negative effect, and three finding positive but insignificant effects.
Finally, for the three school organization variables (pupil-teacher ratio, cost of attending
and merit-based scholarships) the results in Table 13 are identical to those in Table 12 since all
of the studies for each of those variables are considered to be high quality studies.
3. The 13 Randomized Trials. Lastly, Table 14 examines six randomized control trials
that have estimated impacts of school and teacher variables on students’ time in school. Two
of these studies examined the impact of providing textbooks or workbooks; two of the three
estimates in these two studies found significantly positive effects. There were also two studies
of the impact of building new schools; both found significantly positive impacts on time in
school. In contrast, there is no significant impact of merit based scholarships, with one estimate
insignificantly negative and the other insignificantly positive. Similarly, the one estimate of
school-provided meals is statistically insignificant.
VI. Conclusion and Priorities for Future Research
By describing the results sequentially by specific items and quality of studies, it is difficult to see the overall picture. The results across this review of the literature from 1990 to 2010 are
summarized in Tables 15 and 16. Table 15 does this for the results of studies that focus on
students learning, as measured by test scores, while Table 16 does the same for the results for
students’ time in school.
Table 15 summarizes the impacts of 35 different school and teacher variables on student
learning. When all 79 studies are examined, about half of these variables seem to have clear
negative or positive impacts on student learning. However, when the evidence is limited to the
43 high quality studies, only a few inputs appear to have unambiguous results.
Perhaps the clearest finding is that having a fully functioning school – one with better
quality roofs, walls or floors, with desks, tables and chairs, and with a school library – appears
conducive to student learning. Of course, these attributes may partially be signaling an interest
in, and commitment to, providing a quality education. On the personnel side, the most
consistent results reflect having teachers with greater knowledge of the subjects they teach,
having a longer school day, and providing tutoring. Additionally, and again unsurprising, it
makes a difference if the teacher shows up for work; teacher absence has a clear negative effect
on learning.
Randomized trials arguably provide the most rigorous evidence, but for most variables
there is either no study at all, or at most one study. Thus, it is currently difficult to draw
general conclusions from the available results. Somewhat surprisingly, however, for the two
variables with more than one RCT (textbooks/workbooks and computers), no clear results
have been found.
On the other hand, perhaps the most useful conclusion to draw for policy is that there
is little empirical support for a wide variety of school and teacher characteristics that some
observers may view as priorities for school spending. While one could argue that the absence
of strong results simply reflects insufficient data (low statistical power) to detect systematic
effects, it could also be the case that most of the effects are themselves small. Quite plausibly,
part of the ambiguity comes from heterogeneous treatment effects, where the impact of
various inputs depends importantly on the local circumstances, demands, and capacities.

60
Turning to Table 16, there is also meager evidence at best for what can be done to
increase students’ time in school and attainment.41 Focusing on the 43 high quality studies, only
two findings receive fairly clear support: building more schools increases students’ time in
school, and in-service teacher training reduces student time in school. The latter result is
unexpected and admittedly is based on only two studies, but it may reflect that in-service
teacher training takes teachers out of the classroom, so that the primary effect is similar to that
of teacher absence. The randomized trials to date again provide insufficient evidence for clear
policy directions, although if many more were conducted it is possible that clearer policy
conclusions could be drawn.
Taken as a whole, these studies are consistent with much of the current policy
discussion that the focus should shift from basic school and teacher characteristics to changing
incentives in schools and permitting more local decision making; if the effects are generally small
or if they depend on, say, local capacity, it is then difficult to set overall resource policies at the
national or international level. Indeed, the variation in results may reflect that some
interventions work well in some contexts but have no effect, or even negative effects, in other
contexts. This evidence would be consistent with cross-country evidence that generally indicates positive effects from more local autonomy in decision making (at least when there is
also an accountability system in place); see Hanushek and Woessmann (2011).
This state of affairs raises the question about the value of research on the effect of basic
school and teacher characteristics on student learning and time in school. The various research
efforts have led to many ambiguous results – either because there are few consistent results or
because the methodological problems are too large. A deeper appreciation for the
methodological issues in obtaining causal estimates has emerged in the past two decades. Both
the inconsistent results from past work and the distinct possibility of rather deep
methodological problems suggest that a continued quest for identifying the specific inputs of
teachers and schools from cross-sectional analyses of samples of convenience is unlikely to lead
to strong policy guidance.
But a complementary conclusion is that conducting research into policy relevant aspects
of schooling often requires early researcher involvement in the design and data collection
before programs or policies are introduced. For several classes of policy issues – largely ones
involving well-identified programs and specific resources – obtaining randomized or quasi-
randomized observations is key to instilling confidence in research results. RCTs provide the
easiest to understand research design, and it is probably the case that researchers have
historically under-invested in their use. At the same time, actually implementing these can be
time-consuming, difficult, and expensive – leading to a limited number of such analyses to date,
although a larger number are either currently underway or will soon be started.
Two other kinds of approaches offer promise. First, the availability of panel data
provides the possibility of addressing a wider range of issues while still being sensitive to the
threats to statistical analysis. For example, much of the recent analysis of large panels of
administrative data in the U.S. has shown how panel data techniques can reduce analytical
problems while opening up a much wider range of analyses.
41
One exception to this lack of evidence is the finding that conditional cash transfer programs induce greater school attendance. This is discussed in detail in Behrman, Parker, and Todd (2011).

61
Second, with the cooperation of government policy makers, randomization in the
implementation of education programs across villages or over time can provide the kinds of
variation that are needed to evaluate the impacts of these programs. This approach is distinct
from researcher-driven RCTs because the programs being evaluated are chosen by the
government. Further, given sufficient training, governments can evaluate these interventions
with no need to bring in expatriate academic researchers. More specifically, this approach
builds on local ideas for programs that local policy makers believe are likely to lead to
improvements, and it also capitalizes on the fact that funding for many programs is frequently
insufficient to introduce a new program across all possible locations. By staggering the
introduction of a given program over time, it is possible to develop a built-in control group to
assess the impact of that program. But here is where early involvement (by either higher level
decision makers or outside researchers) is essential, because, for example, giving the program
first to the most politically powerful locales or to the most needy locales (as opposed to a
random selection of locales) reduces, if not eliminates, the analytical possibilities.
Part of future success in designing and implementing effective education policies is
introducing an evaluation mindset. The absence of interest in learning about the efficacy of new programs or policies is not restricted to developing countries, but is indeed present in
developed countries. But the evidence to date reviewed in this paper underscores the
importance of this perspective. This review of existing evidence suggests little in the form of
―best policies‖ that can readily be introduced through central provision or through regulatory
approaches. This realization implies that progress is likely to proceed with local
experimentation built on local knowledge and capacities. Yet local experimentation is unlikely
to be successful unless there is a process of evaluation that works to continue the policies and
programs that rigorous evaluations demonstrate are successful and to discontinue those that
such evaluations indicate are unsuccessful.
One other aspect of this review deserves mention. Nothing has been said along the
way about the costs of any programs. Clearly, effective policy needs to consider both the
benefit side and the cost side, particularly in developing countries where resource constraints
are binding at low levels. However, very few of the existing evaluations have provided solid
information about costs of programs and policies. This topic is further addressed by Dhaliwal,
Duflo, Glennerster, and Tulloch (2011).
At the beginning of this paper we noted that education, and especially the skills
developed through high-quality education, can have an enormous positive impact on individuals’
lives and on countries’ economic growth. Yet education is a complicated process, and in both
developed and developing countries policymakers and researchers are trying to understand
which policies are most likely to improve education outcomes. In this review we have found
that, despite a large and increasingly sophisticated literature, remarkably little is known about
the impact of education policies on student outcomes in developing countries. There are two
likely reasons for this. The first is that what works best may vary considerably across countries
and even within countries, which implies that future research should attempt to understand
which policies work best in which settings. The second is that much of the literature has
focused on basic school and teacher characteristics, when in fact the ways that schools are
organized may matter most. Such a conclusion implies that future research should focus on
how schools are organized and the incentives faced by teachers, administrators, parents and
students.

62
TABLE 1 – PUBLIC EXPENDITURES ON EDUCATION IN DEVELOPING COUNTRIES: 1980
TO 2008
(MILLIONS OF 2000 U.S. DOLLARS)
Region 1980 1996 2008
East Asia and Pacific 74,887 197,309 409,106* Latin American and
Caribbean
52,017 70,176 100,694
Middle East and North
Africa
25,541 40,475 69,389
South Asia 4,315 14,972 32,092
Sub-Saharan Africa 9,336 13,110 19,188*
Source: World_Bank (1999, (2008, (2010)
Note: An asterisk indicates that data are for 2006, not 2008.
TABLE 2 – OFFICIAL DEVELOPMENT ASSISTANCE FOR EDUCATION, 1980 TO 2009 (MILLIONS OF CONSTANT 2008 U.S. DOLLARS)
1980 1990 2000 2009
All Donors 7,889 11,291 7,820 14,186
DAC (OECD Dev. Assist. Comm.)
Countries
7,889 8,914 5,642 9,492
Multilateral -- 2,377 2,178 4,445
Non-DAC Countries -- -- -- 248
Source: OECD) International Development Statistics (www.oecd.org/dac/stats/idsonline).
TABLE 3 – PRIMARY AND SECONDARY GROSS ENROLLMENT RATES: 1980 TO 2008
Primary Secondary
Region 1980 1995 2008 1980 1995 2008
East Asia and Pacific 111 115 112 43 65 73
Latin American and
Caribbean
106 111 117 42 53 88
Middle East and North
Africa
87 97 106 42 64 72
South Asia 76 99 108 27 49 52
Sub-Saharan Africa 78 75 97 14 27 33
Source: World_Bank (1998, (2010)

63
TABLE 4 – PRIMARY SCHOOL COMPLETION RATES: 1980 TO 2008
Region 1991 2008
East Asia and Pacific 100 100
Latin American and
Caribbean
83 101
Middle East and North
Africa
77 94
South Asia 76 79
Sub-Saharan Africa 50 62
Source: World_Bank (2002, (2010)
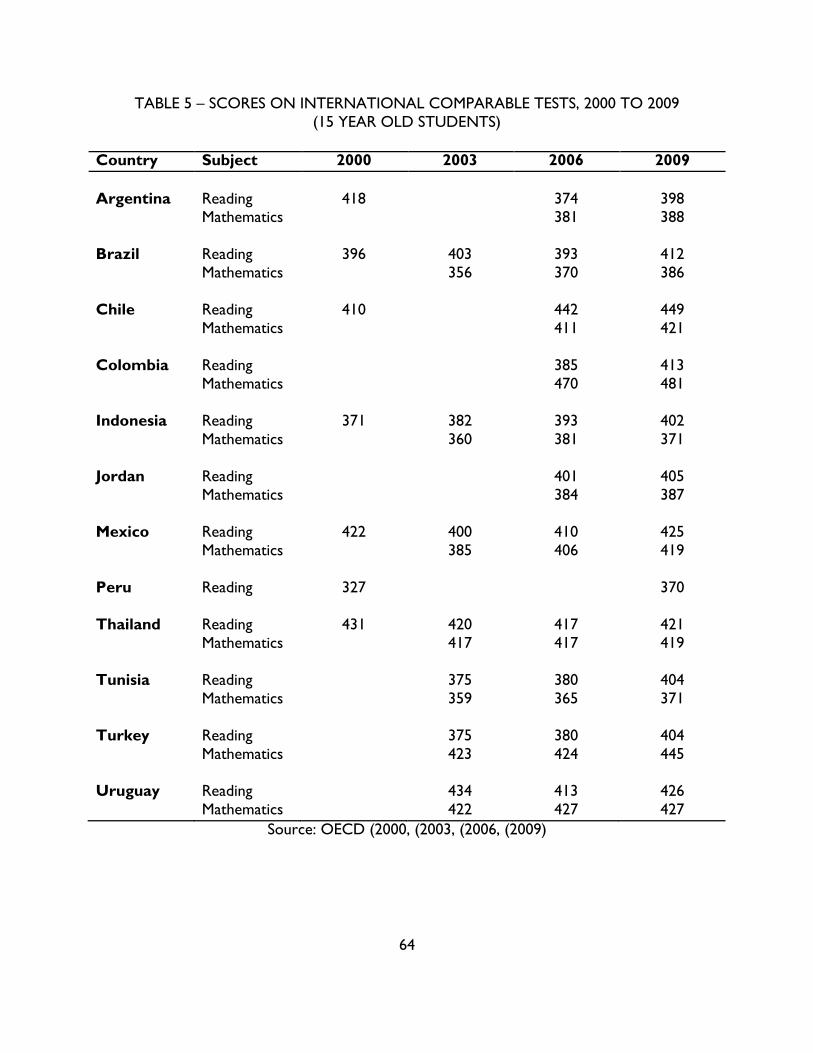
64
TABLE 5 – SCORES ON INTERNATIONAL COMPARABLE TESTS, 2000 TO 2009
(15 YEAR OLD STUDENTS)
Country Subject 2000 2003 2006 2009
Argentina Reading 418 374 398 Mathematics 381 388
Brazil Reading 396 403 393 412
Mathematics 356 370 386
Chile Reading 410 442 449
Mathematics 411 421
Colombia Reading 385 413
Mathematics 470 481
Indonesia Reading 371 382 393 402
Mathematics 360 381 371
Jordan Reading 401 405
Mathematics 384 387
Mexico Reading 422 400 410 425
Mathematics 385 406 419
Peru Reading 327 370
Thailand Reading 431 420 417 421
Mathematics 417 417 419
Tunisia Reading 375 380 404
Mathematics 359 365 371
Turkey Reading 375 380 404
Mathematics 423 424 445
Uruguay Reading 434 413 426
Mathematics 422 427 427
Source: OECD (2000, (2003, (2006, (2009)

65
TABLE 6 – STEPS USED TO SELECT PAPERS USED IN THE LITERATURE REVIEW
Review
Phase Procedures Used
Number
of Papers
1 Search EconLit and ERIC databases. ~9,000
Review abstracts of all results. 307
Add 29 working papers written after 2004. 336
Review abstracts again, eliminate duplicate papers and papers
that did not estimate the impacts of school or teacher
characteristics.
253
2 Review full papers, eliminate papers based on lack of
relevance, lack of quantitative analysis.
112
3 Eliminate papers based on methodology: lack of basic
covariates. These 79 papers are the full sample.
79
4 Exclude papers that used OLS only. The remaining 43
papers are the ―high quality‖ sample.
43
TABLE 7 – SUMMARY OF IMPACTS ON TEST SCORES OF SCHOOL INFRASTRUCTURE
AND PEDAGOGICAL SUPPLIES
(ALL 79 STUDIES)
Negative,
Significant
Negative,
Insignificant
Zero,
or
insign.
& no
sign
given
Positive,
Insignificant
Positive,
Significant
Total
Studies
Textbooks/Workbooks 4 (3) 13 (8) 7 (5) 10 (7) 26 (10) 21
Desks/Tables/Chairs 0 (0) 0 (0) 13 (1) 7 (5) 8 (4) 8
Computers/Elec. game 1 (1) 9 (5) 1 (1) 8 (3) 7 (4) 8
Electricity 0 (0) 3 (2) 0 (0) 6 (5) 6 (2) 6
School infrastr. index 0 (0) 1 (1) 7 (1) 1 (1) 13 (4) 6
Blackboard/flip chart 0 (0) 2 (2) 13 (1) 3 (3) 7 (3) 6
Library 1 (1) 3 (2) 7 (1) 1 (1) 10 (5) 6
Roof/wall/floor 0 (0) 1 (1) 0 (0) 3 (2) 2 (1) 4
1. Figures are number of estimates; figures in parentheses are number of papers/studies.
2. Includes all school infrastructure characteristics with at least two separate
papers/studies.
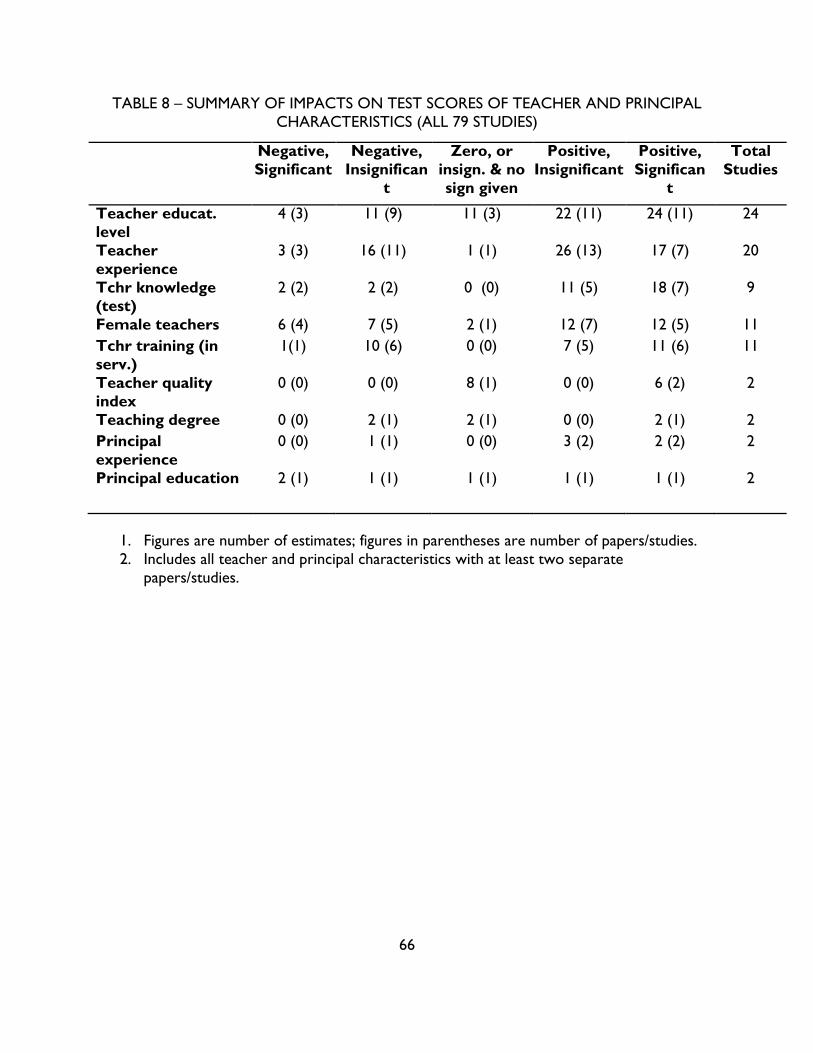
66
TABLE 8 – SUMMARY OF IMPACTS ON TEST SCORES OF TEACHER AND PRINCIPAL
CHARACTERISTICS (ALL 79 STUDIES)
Negative,
Significant
Negative,
Insignifican
t
Zero, or
insign. & no
sign given
Positive,
Insignificant
Positive,
Significan
t
Total
Studies
Teacher educat.
level
4 (3) 11 (9) 11 (3) 22 (11) 24 (11) 24
Teacher
experience
3 (3) 16 (11) 1 (1) 26 (13) 17 (7) 20
Tchr knowledge
(test)
2 (2) 2 (2) 0 (0) 11 (5) 18 (7) 9
Female teachers 6 (4) 7 (5) 2 (1) 12 (7) 12 (5) 11
Tchr training (in
serv.)
1(1) 10 (6) 0 (0) 7 (5) 11 (6) 11
Teacher quality
index
0 (0) 0 (0) 8 (1) 0 (0) 6 (2) 2
Teaching degree 0 (0) 2 (1) 2 (1) 0 (0) 2 (1) 2
Principal
experience
0 (0) 1 (1) 0 (0) 3 (2) 2 (2) 2
Principal education 2 (1) 1 (1) 1 (1) 1 (1) 1 (1) 2
1. Figures are number of estimates; figures in parentheses are number of papers/studies.
2. Includes all teacher and principal characteristics with at least two separate
papers/studies.
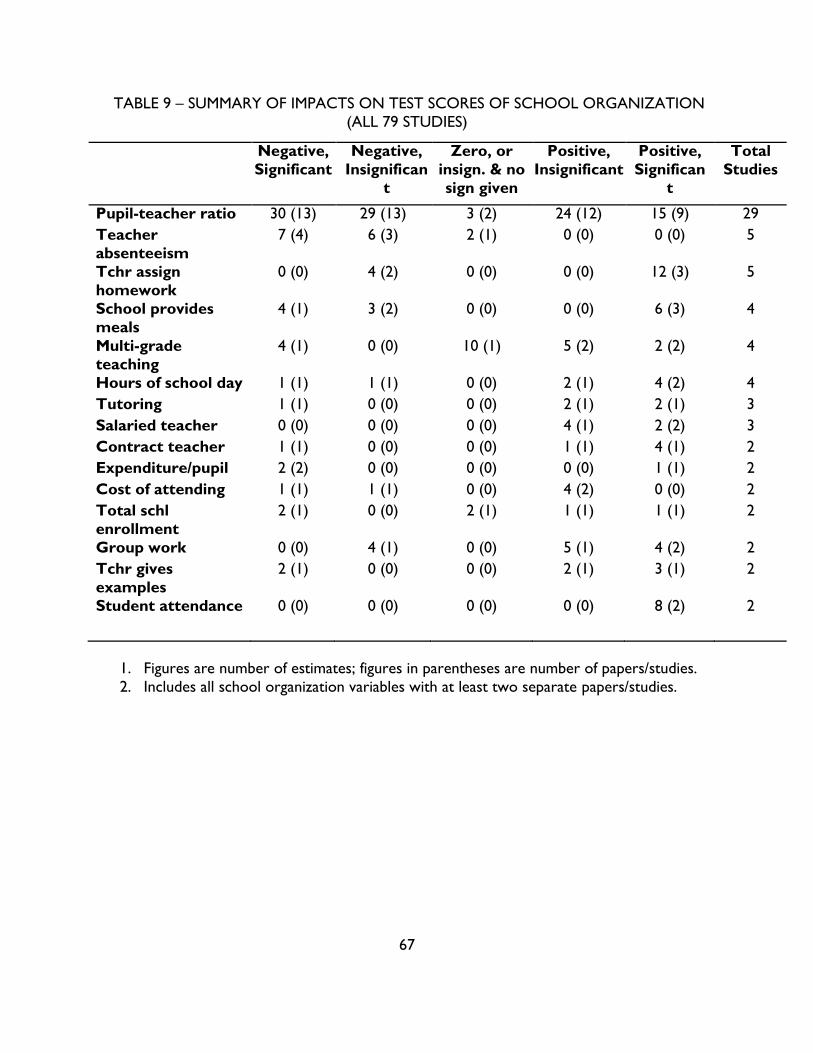
67
TABLE 9 – SUMMARY OF IMPACTS ON TEST SCORES OF SCHOOL ORGANIZATION
(ALL 79 STUDIES)
Negative,
Significant
Negative,
Insignifican
t
Zero, or
insign. & no
sign given
Positive,
Insignificant
Positive,
Significan
t
Total
Studies
Pupil-teacher ratio 30 (13) 29 (13) 3 (2) 24 (12) 15 (9) 29
Teacher
absenteeism
7 (4) 6 (3) 2 (1) 0 (0) 0 (0) 5
Tchr assign
homework
0 (0) 4 (2) 0 (0) 0 (0) 12 (3) 5
School provides
meals
4 (1) 3 (2) 0 (0) 0 (0) 6 (3) 4
Multi-grade
teaching
4 (1) 0 (0) 10 (1) 5 (2) 2 (2) 4
Hours of school day 1 (1) 1 (1) 0 (0) 2 (1) 4 (2) 4
Tutoring 1 (1) 0 (0) 0 (0) 2 (1) 2 (1) 3
Salaried teacher 0 (0) 0 (0) 0 (0) 4 (1) 2 (2) 3
Contract teacher 1 (1) 0 (0) 0 (0) 1 (1) 4 (1) 2
Expenditure/pupil 2 (2) 0 (0) 0 (0) 0 (0) 1 (1) 2
Cost of attending 1 (1) 1 (1) 0 (0) 4 (2) 0 (0) 2
Total schl
enrollment
2 (1) 0 (0) 2 (1) 1 (1) 1 (1) 2
Group work 0 (0) 4 (1) 0 (0) 5 (1) 4 (2) 2
Tchr gives
examples
2 (1) 0 (0) 0 (0) 2 (1) 3 (1) 2
Student attendance 0 (0) 0 (0) 0 (0) 0 (0) 8 (2) 2
1. Figures are number of estimates; figures in parentheses are number of papers/studies.
2. Includes all school organization variables with at least two separate papers/studies.

68
TABLE 10 – SUMMARY OF IMPACTS ON TEST SCORES OF SCHOOL VARIABLES
(43 HIGH QUALITY STUDIES)
Negative,
Significant
Negative,
Insignificant
Zero,
or
insign.
& no
sign
given
Positive,
Insignificant
Positive,
Significant
Total
Studies
School Infrastructure
Textbooks/Workbooks 1 (1) 8 (4) 3 (1) 6 (4) 3 (2) 8
Desks/Tables/Chairs 0 (0) 0 (0) 0 (0) 4 (3) 3 (2) 4
Computers/Elec. game 1 (1) 9 (5) 0 (0) 8 (3) 4 (3) 6
Electricity 0 (0) 3 (2) 0 (0) 3 (2) 0 (0) 3
Blackboard/flip chart 0 (0) 2 (2) 0 (0) 2 (2) 2 (1) 3
Library 0 (0) 1 (1) 0 (0) 1 (1) 4 (2) 3
Roof/wall/floor 0 (0) 1 (1) 0 (0) 3 (2) 2 (1) 4
Teacher Characteristics
Teacher educat. level 1 (1) 5 (5) 0 (0) 5 (4) 2 (1) 6
Teacher experience 1 (1) 10 (6) 0 (0) 12 (7) 5 (2) 9
Tchr knowledge (test) 0 (0) 0 (0) 0 (0) 7 (3) 13 (4) 5
Female teachers 1 (1) 1 (1) 0 (0) 5 (2) 1 (1) 2
Tchr training (in serv.) 0 (0) 3 (3) 0 (0) 0 (0) 3 (2) 3
School Organization
Pupil-teacher ratio 14 (5) 18 (9) 1 (1) 10 (6) 3 (3) 14
Teacher absenteeism 4 (2) 2 (2) 0 (0) 0 (0) 0 (0) 2
School provides meals 0 (0) 1 (1) 0 (0) 0 (0) 2 (1) 2
Multi-grade teaching 4 (1) 0 (0) 0 (0) 5 (2) 1 (1) 2
Hours of school day 0 (0) 0 (0) 0 (0) 0 (0) 4 (2) 2
Tutoring 0 (0) 0 (0) 0 (0) 2 (1) 2 (1) 2
Contract teacher 1 (1) 0 (0) 0 (0) 1 (1) 4 (1) 2
1. Figures are numbers of estimates; figures in parentheses are number of papers/studies.
2. Includes all school or teacher characteristics with at least two separate papers/studies.

69
TABLE 11 – SUMMARY OF IMPACTS ON TEST SCORES OF SCHOOL VARIABLES
(13 RCT STUDIES)
Negative,
Significan
t
Negative,
Insignificant
Zero, or
insign. &
no sign
given
Positive,
Insignificant
Positive,
Significant
Total
Studie
s
Textbooks/workboo
ks
0 (0) 1 (1) 3 (1) 0 (0) 0 (0) 2
Computers/Elec.
game
1 (1) 7 (4) 0 (0) 8 (3) 4 (3) 5
Blackboard/flip
chart
0 (0) 1 (1) 0 (0) 0 (0) 0 (0) 1
Pupil-teacher ratio 3 (1) 2 (1) 0 (0) 0 (0) 0 (0) 1
School provides
meals
0 (0) 1 (1) 0 (0) 0 (0) 0 (0) 1
Tutoring 0 (0) 0 (0) 0 (0) 0 (0) 2 (1) 1
Contract teachers 0 (0) 0 (0) 0 (0) 0 (0) 4 (1) 1
Comm. inform.
campgn.
0 (0) 4 (1) 5 (1) 4 (1) 1 (1) 1
Merit-based
scholarship
0 (0) 0 (0) 0 (0) 1 (1) 1 (1) 1
1. Figures are number of estimates; figures in parentheses are number of papers/studies.

70
TABLE 12 – SUMMARY OF IMPACTS OF SCHOOL & TEACHER VARIABLES ON TIME IN SCHOOL
(ALL 79 STUDIES)
Negative,
Significant
Negative,
Insignificant
Zero,
or
insign.
& no
sign
given
Positive,
Insignificant
Positive,
Significant
Total
Papers
School Infrastructure
Textbooks/workbooks 0 (0) 2 (2) 1 (1) 2 (1) 2 (2) 4
Library 0 (0) 0 (0) 0 (0) 0 (0) 2 (2) 2
Roof/wall/floor 0 (0) 1 (1) 0 (0) 0 (0) 1 (1) 2
Building new schools 0 (0) 0 (0) 0 (0) 1 (1) 4 (3) 3
School quality index 0 (0) 0 (0) 0 (0) 1 (1) 4 (2) 2
Teacher Characteristics
Teacher educat. level 0 (0) 2 (2) 0 (0) 2 (2) 1 (1) 4
Teacher experience 1 (1) 0 (0) 0 (0) 4 (3) 2 (2) 5
Tchr training (in
serv.)
1 (1) 2 (2) 0 (0) 0 (0) 0 (0) 2
School Organization
Pupil-teacher ratio 0 (0) 3 (2) 0 (0) 2 (1) 2 (1) 3
Cost of attending 0 (0) 5 (3) 0 (0) 1 (1) 0 (0) 4
Merit based
scholarship
0 (0) 1 (1) 0 (0) 2 (2) 0 (0) 2
1. Figures are number of estimates; figures in parentheses are number of papers/studies.
2. Includes all school or teacher characteristics with at least two separate papers/studies.

71
TABLE 13: SUMMARY OF IMPACTS OF SCHOOL & TEACHER VARIABLES ON TIME IN SCHOOL
(43 HIGH QUALITY STUDIES)
Negative,
Significant
Negative,
Insignificant
Zero, or
insign. &
no sign
given
Positive,
Insignificant
Positive,
Significant
Total
Papers
School Infrastucture
Textbooks/workbooks 0 (0) 2 (2) 1 (1) 2 (1) 2 (2) 4
Roof/wall/floor 0 (0) 1 (1) 0 (0) 0 (0) 1 (1) 2
Building new schools 0 (0) 0 (0) 0 (0) 1 (1) 4 (3) 3
Teacher Characteristics
Teacher educat. level 0 (0) 2 (2) 0 (0) 2 (2) 1 (1) 4
Teacher experience 1 (1) 0 (0) 0 (0) 4 (3) 1 (1) 4
Tchr training (in serv.) 1 (1) 2 (2) 0 (0) 0 (0) 0 (0) 2
School Organization
Pupil-teacher ratio 0 (0) 3 (2) 0 (0) 2 (1) 2 (1) 3
Cost of attending 0 (0) 5 (3) 0 (0) 1 (1) 0 (0) 4
Merit based scholarship 0 (0) 1 (1) 0 (0) 2 (2) 0 (0) 2
1. Figures are number of estimates; figures in parentheses are number of papers/studies.
TABLE 14 – SUMMARY OF IMPACTS OF SCHOOL & TEACHER VARIABLES ON TIME IN SCHOOL
(13 RCTS)
Negative,
Significant
Negative,
Insignificant
Zero, or
insign. &
no sign
given
Positive,
Insignificant
Positive,
Significant
Total
Papers
Textbooks/workboo
ks
0 (0) 0 (0) 1 (1) 0 (0) 2 (2) 2
Building new schools 0 (0) 0 (0) 0 (0) 1 (1) 3 (2) 2
School provides
meals
0 (0) 0 (0) 0 (0) 1 (1) 0 (0) 1
Merit based
scholarship
0 (0) 1 (1) 0 (0) 1 (1) 0 (0) 1
Figures are number of estimates; figures in parentheses are number of papers/studies.

TABLE 15 – OVERALL SUMMARY OF ESTIMATED ACHIEVEMENT IMPACTS FROM TABLES
7-11
(NUMBER OF STUDIES IN PARENTHESES)
Teacher/School Variable All 79 Studies 43 High Quality Studies RCTs
School Infrastructure
Textbooks/workbooks Mostly positive (21) Inconclusive (8) No signif. effect (2)
Desks/Tables/Chairs Almost all positive (11) All positive (4) --
Computers/Elec. game Mostly positive (8) Positive?/Ambig. (6) Inconclusive (5)
Electricity Mostly positive (6) No signif. effect (3) --
School infrastr. index Mostly positive (6) -- --
Blackboard/flip chart Mostly positive (6) Positive?/Ambig. (3) No signif. effect (1)
Library Mostly positive (6) Mostly positive (3) --
Roof/wall/floor Mostly positive (4) Mostly positive (4) --
Teacher Characteristics
Teacher educat. level Mostly positive (24) Inconclusive (6) --
Teacher experience Positive?/Ambig. (20) Positive?/Ambig. (9) --
Tchr knowledge (test) Mostly positive (9) All positive (5) --
Female teachers Inconclusive (11) Inconclusive (2) --
Tchr training (in serv.) Mostly positive (11) Positive?/Ambig. (3) --
Teacher quality index Mostly positive (2) -- --
Teaching degree Positive?/Ambig. (2) -- --
Principal experience Mostly positive (2) -- --
Principal education Inconclusive -- --
School Organization
Pupil-teacher ratio Negative?/Ambig. (29) Negative?/Ambig. (14) Negative (1)
Teacher absenteeism Almost all negative (5) All negative (2) --
Tchr assigns homework Mostly positive (5) -- --
School provides meals Positive?/Ambig. (4) Positive?/Ambig. (2) No signif. effect (1)
Multi-grade teaching Inconclusive (4) Inconclusive (2) --
Hours of school day Positive?/Ambig. (4) All positive (2) --
Tutoring Positive?/Ambig. (3) All positive (2) Positive (1)
Teacher salary Almost all positive (3) -- --
Contract teacher Positive?/Ambig. (2) Positive?/Ambig. (2) Positive (1)
Expenditure/pupil Inconclusive (2) -- --
Cost of attending Inconclusive (2) -- --
Total schl enrollment Inconclusive (2) -- --
Group work Mostly positive (2) -- --
Tchr gives examples Inconclusive (2) -- --
Student attendance All positive (2) -- --
Parent follow up Mostly positive (2) -- --
Commun. Inform. Camp. -- -- Positive?/Ambig. (1)
Merit-based scholarship -- -- Positive (1)

73
TABLE 16 – OVERALL SUMMARY OF ESTIMATED SCHOOL ATTAINMENT AND TIME
IMPACTS FROM TABLES 12-14
(NUMBER OF STUDIES IN PARENTHESES)
Teacher/School Variable All 79 Studies 43 High Quality
Studies
RCTs
School Infrastructure
Textbooks/workbooks Positive?/Ambig. (3) Positive?/Ambig. (3) Positive (1)
Library Positive (2) -- --
Roof/wall/floor Positive?/Ambig. (2) Positive?/Ambig. (2) --
Building New Schools Positive (3) Positive (3) Positive?/Ambig. (2)
School quality index Positive (2) --
Teacher Characteristics
Teacher education level Positive?/Ambig. (4) Positive?/Ambig. (4) --
Teacher experience Positive?/Ambig. (5) Positive?/Ambig. (4) --
Tchr training (in serv.) Mostly negative (2) Mostly negative (2) --
School Organization
Pupil-teacher ratio Inconclusive (3) Inconclusive (3) --
School provides meals -- -- Inconclusive (1)
Cost of attending Negative?/Ambig (4) Negative?/Ambig (4) --
Merit-based scholarship Inconclusive (2) Inconclusive (2) Inconclusive (1)

74
References Alderman, Harold, and Hoyt Bleakley. 2011 of Conference. "Child health and educational outcomes."
Paper presented at Education Policy in Developing Countries: What Do We Know, and What Should
We Do to Understand What We Don’t Know?, February 4-5, at University of Minnesota.
Banerjee, Abhijit V., Shawn Cole, Esther Duflo, and Leigh Linden. 2007. "REMEDYING EDUCATION:
EVIDENCE FROM TWO RANDOMIZED EXPERIMENTS IN INDIA." Quarterly Journal of
Economics 122, no. 3: 1235-1264.
Behrman, Jere R., Susan W. Parker, and Petra E. Todd. 2011 of Conference. "Incentives for Students and
Parents." Paper presented at Education Policy in Developing Countries: What Do We Know, and
What Should We Do to Understand What We Don’t Know?, February 4-5, at University of
Minnesota.
Billger, Sherrilyn M. 2009. "On reconstructing school segregation: The efficacy and equity of single-sex
schooling." Economics of Education Review 28, no. 3: 393-402.
Blundell, Richard, and Monica Dias. 2009. "Alternative Approaches to Evaluation in Empirical
Microeconomics." Journal of Human Resources 44, no. 3 (Summer2009): 565-640.
Burtless, Gary, ed. 1996. Does money matter? The effect of school resources on student achievement and adult
success. Washington, DC: Brookings.
Dang, Hai-Anh, and F. Halsey Rogers. 2008. "The Growing Phenomenon of Private Tutoring: Does It
Deepen Human Capital, Widen Inequalities, or Waste Resources?" The World Bank Research
Observer 23, no. 2 (September 21, 2008): 161-200.
Dhaliwal, Iqbal, Esther Duflo, Rachel Glennerster, and Caitlin Tulloch. 2011 of Conference.
"Comparative Cost-Effectiveness Analysis to Inform Policy in Developing Countries: A General
Framework with Applications for Education." Paper presented at Education Policy in Developing
Countries: What Do We Know, and What Should We Do to Understand What We Don’t Know?,
February 4-5, at University of Minnesota.
Du, Yuhong, and Yongmei Hu 2008. "Student Academic Performance and the Allocation of School
Resources." Chinese Education and Society 41, no. 5 (September/October): 8-20.
Ehrenberg, Ronald G., Dominic J. Brewer, Adam Gamoran, and J. Douglas Willms. 2001. "Class size and
student achievement." Psychological Science in the Public Interest 2, no. 1 (May): 1-30.
Fuller, Bruce, and Prema Clarke. 1994. "Raising school effects while ignoring culture? Local conditions
and the influence of classroom tools, rules, and pedagogy." Review of Educational Research 64, no.
1 (Spring): 119-157.
Galiani, Sebastian, and Ricardo Perez-Truglia. 2011 of Conference. "School Management in Developing
Countries." Paper presented at Education Policy in Developing Countries: What Do We Know, and
What Should We Do to Understand What We Don’t Know?, February 4-5, at University of
Minnesota.
Glewwe, Paul, and Michael Kremer. 2006. "Schools, teachers, and educational outcomes in developing
countries." In Handbook of the Economics of Education, edited by Eric A. Hanushek and Finis
Welch. Amsterdam: North Holland: 943-1017.
Glewwe, Paul, Michael Kremer, and Sylvie Moulin. 2009. "Many Children Left Behind? Textbooks and
Test Scores in Kenya." American Economic Journal: Applied Economics 1, no. 1: 112-35.
Glewwe, Paul, Michael Kremer, Sylvie Moulin, and Eric Zitzewitz. 2004. "Retrospective vs. prospective
analyses of school inputs: the case of flip charts in Kenya." Journal of Development Economics 74,
no. 1: 251-268.
Hanushek, Eric A. 1995. "Interpreting recent research on schooling in developing countries." World Bank
Research Observer 10, no. 2 (August): 227-246.
Hanushek, Eric A. 2003. "The failure of input-based schooling policies." Economic Journal 113, no. 485
(February): F64-F98.

75
Hanushek, Eric A. 2008. "Incentives for efficiency and equity in the school system." Perspektiven der
Wirtschaftspolitik 9, no. Special Issue: 5-27.
Hanushek, Eric A., Victor Lavy, and Kohtaro Hitomi. 2008. "Do students care about school quality?
Determinants of dropout behavior in developing countries." Journal of Human Capital 1, no. 2
(Spring): 69-105.
Hanushek, Eric A., and Ludger Woessmann. 2008. "The role of cognitive skills in economic
development." Journal of Economic Literature 46, no. 3 (September): 607-668.
Hanushek, Eric A., and Ludger Woessmann. 2011. "The economics of international differences in
educational achievement." In Handbook of the Economics of Education, Vol. 3, edited by Eric A.
Hanushek, Stephen Machin, and Ludger Woessmann. Amsterdam: North Holland: 89-200.
Hanushek, Eric A., and Lei Zhang. 2009. "Quality-consistent estimates of international schooling and skill
gradients." Journal of Human Capital 3, no. 2 (Summer): 107-143.
Harbison, Ralph W., and Eric A. Hanushek. 1992. Educational performance of the poor: lessons from rural
northeast Brazil. New York: Oxford University Press.
Hedges, Larry V., and Ingram Olkin. 1985. Statistical methods for meta-analysis. San Diego, CA: Academic
Press.
Imbens, Guido W., and Jeffrey M. Wooldridge. 2009. "Recent Developments in the Econometrics of
Program Evaluation." Journal of Economic Literature 47, no. 1 (March): 5-86.
Inamdar, Parimala. 2004. "Computer skills development by children using "hole in the wall" facilities in
rural India " Australasian Journal of Educational Technology 20, no. 3.
Kaufman, Julia, and Liqun Yin. 2009. "What matters for Chinese girls’ behavior and performance in
school: An investigation of co-educational and single-sex schooling for girls in urban China."
International Perspectives on Education and Society 10.
Kim, Hong-Kyun. 2001. "Is there a crowding-out effect between school expenditure and mother's child
care time?" Economics of Education Review 20, no. 1 (February): 71-80.
Kremer, Michael. 2003. "Randomized evaluations of educational programs in developing countries: Some
lessons." American Economic Review 93, no. 2 (May): 102-104.
Kremer, Michael, Edward Miguel, and Rebecca Thornton. 2009. "Incentives to learn." Review of Economics
and Statistics 91, no. 3 (August): 437-456.
Lazear, Edward P. 2003. "Teacher incentives." Swedish Economic Policy Review 10, no. 3: 179-214.
Linden, Leigh. 2008. "Complement or substitute? The effect of technology on student achievement in
India." JPAL Working Paper.
Lochner, Lance. 2011. "Non-Production Benefits of Education: Crime, Health, and Good Citizenship." In
Handbook of the Economics of Education, edited by Eric A. Hanushek, Stephen Machin, and Ludger
Woessmann. Amsterdam: North Holland: 183-282.
MacLeod, W. Bentley, and Miguel Urquiola. 2011 of Conference. "Competition and Educational
Productivity: Incentives Writ Large." Paper presented at Education Policy in Developing Countries:
What Do We Know, and What Should We Do to Understand What We Don’t Know?, February 4-5,
at University of Minnesota.
Mincer, Jacob. 1970. "The distribution of labor incomes: a survey with special reference to the human
capital approach." Journal of Economic Literature 8, no. 1 (March): 1-26.
Mincer, Jacob. 1974. Schooling, experience, and earnings. New York: NBER.
Mishel, Lawrence, and Richard Rothstein, eds. 2002. The class size debate. Washington, DC: Economic
Policy Institute.
Mulligan, Casey B. 1999. "Galton versus the human capital approach to inheritance." Journal of Political
Economy 107, no. 6, pt. 2 (December): S184-S224.
Muralidharan, Karthik, and Venkatesh Sundararaman. 2008. "Contract Teachers: Experimental evidence
from India." JPAL Working Paper.

76
Murnane, Richard J., John B. Willett, Yves Duhaldeborde, and John H. Tyler. 2000. "How important are
the cognitive skills of teenagers in predicting subsequent earnings?" Journal of Policy Analysis and
Management 19, no. 4 (Fall): 547-568.
Nannyonjo, Harriet. 2007. "Education Inputs in Uganda: An Analysis of Factors Influencing Learning
Achievement in Grade Six." World Bank Policy Research Paper No. 98. Washington, DC:
World Bank.
OECD. "International Development Statistics.
OECD. 2000. "Knowledge and skills for life: First results from PISA 2000."
OECD. 2003. "Learning for tomorrow's world: First results from PISA 2003."
OECD. 2006. "PISA 2006: Science competencies for tomorrow's world."
OECD. 2009. "PISA 2009 Results: What students know and can do."
Osorio, Felipe, and Leigh Linden. 2009. "The use and misuse of computers in education: evidence from a
randomized experiment in Colombia " The World Bank Policy Research Working Paper Series.
Pandey, Priyanka, Sangeeta Goyal, and Venkatesh Sundararaman. 2009. "Community participation in
public schools: impact of information campaigns in three Indian states." Education Economics 17,
no. 3: 355-375.
Park, Hyunjoon, and Jere R. Behrman. 2010. "Causal Effects of Single-Sex Schools on College
Attendance: Random Assignment in Korean High Schools." PSC Working Paper Series.
Pitt, Mark M., Mark R. Rosenzweig, and Donna M. Gibbons. 1993. "The Determinants and
Consequences of the Placement of Government Programs in Indonesia." The World Bank
Economic Review 7, no. 3 (September 1, 1993): 319-348.
Psacharopoulos, George, and Harry A. Patrinos. 2004. "Returns to investment in education: a further
update." Education Economics 12, no. 2 (August): 111-134.
Rivkin, Steven G. 2008. "Value Added Analysis and Education Policy." Calder Briefs Washington: Center
for Analysis of Longitudinal Data in Education Research.
Rosas, Ricardo, Miguel Nussbaum, Patricio Cumsille, Vladimir Marianov, Mónica Correa, Patricia Flores,
Valeska Grau, Francisca Lagos, Ximena López, Verónica López, Patricio Rodriguez, and Marcela
Salinas. 2003. "Beyond Nintendo: design and assessment of educational video games for first and
second grade students." Computers & Education 40, no. 1: 71-94.
Rothstein, Jesse. 2010. "Teacher quality in educational production: Tracking, decay, and student
achievement." Quarterly Journal of Economics 125, no. 1 (February): 175-214.
Tan, Jee-Peng, Julia Lane, and Gerard Lassibille. 1999. "Student Outcomes in Philippine Elementary
Schools: An Evaluation of Four Experiments." The World Bank Economic Review 13, no. 3: 493-
508.
World_Bank. 1998. "World Bank Development Indicators 1998."
World_Bank. 1999. "World Bank Development Indicators 1999."
World_Bank. 2001. "World Bank Development Report 2000/2001: Attacking Poverty.
World_Bank. 2002. "World Bank Development Indicators 2002."
World_Bank. 2008. "World Bank Development Indicators 2008."
World_Bank. 2010. "World Bank Development Indicators 2010."

77
Appendix I: Search Terms The methodology used to search for papers is described in detail in Section III of the paper.
This appendix reports the specific search terms used. The search terms used to search EconLit
from 1990 to 2010 are as follows. The code ―KW‖ refers to a key word.
KW=education and KW=("class size" OR "school size" OR "Student teacher ratio" OR "Pupil
teacher ratio" OR "School expenditure*" OR ―expenditure per pupil‖ OR "texbook*" OR
"instructional material*" OR "Workbook*" OR "exercise book*" OR "computer*" OR "laptop*"
OR "internet" OR "school infrastructure" OR "Facilities" OR "Building condition*" OR
"Laborator*" OR "lab" OR "labs" OR "Librar*" OR "Desk*" OR "Teaching tools" OR "teaching
guide*" OR "blackboard*" OR "chalk*" OR "electricity" OR "table*" OR "bench*" OR "chair*"
OR "roof*" OR "wall*" OR "floor*" OR "window*" OR "bathroom*" OR "plumbing" OR
"teacher quality" OR "teacher efficacy" OR "teacher knowledge" OR "teacher salar*" OR
"teacher training" OR "teacher experience" OR "teacher education" OR "teacher absenteeism"
OR "teacher gender" OR "class preparation" OR "lesson planning" OR "homework" OR
"evaluation" OR "follow-up" OR "monitoring of pupil performance" OR "testing" OR "remedial
program*" OR "teaching practices" OR "instructional time" OR "length of instructional
program" OR "hours" OR "school day" OR "curriculum" OR "principal quality" OR "principal
training" OR "principal education" OR "principal experience" OR "staff assessment*" OR
"teacher assessment" OR "school inspection*" OR "parent* involvement" OR "production
function" OR "school resources" OR "school inputs" OR "School quality" OR "Pedagogical
inputs" OR "pedagogical resources")
These search terms yielded over half a million results in ERIC. To narrow the results to a
reasonable number, results in ERIC were further limited to articles that included the name of at least one developing country or related term in the abstract. The search terms used to limit
results accordingly are as follows. The code AB refers to abstract.
AB=("developing countr*" OR "Least-Developed Countries" OR "Afghanistan" OR "Albania"
OR "Algeria" OR "Angola" OR "Antigua and Barbuda" OR "Argentina" OR "Armenia" OR
"Azerbaijan" OR "Bahamas" OR "Bahrain" OR "Bangladesh" OR "Barbados" OR "Belarus" OR
"Belize" OR "Benin" OR "Bhutan" OR "Bolivia" OR "Bosnia and Herzegovina" OR "Botswana"
OR "Brazil" OR "Brunei Darussalam" OR "Bulgaria" OR "Burkina Faso" OR "Burundi" OR
"Cambodia" OR "Cameroon" OR "Cape Verde" OR "Central African Republic" OR "Chad" OR
"Chile" OR "China" OR "Colombia" OR "Comoros" OR "Congo" OR "Costa Rica" OR "Côte
d'Ivoire" OR "Croatia" OR "Djibouti" OR "Dominica" OR "Dominican Republic" OR "Ecuador*"
OR "Egypt*" OR "El Salvador" OR ―Salvadoran‖ OR "Equatorial Guinea" OR "Eritrea" OR
"Estonia*" OR "Ethiopia*" OR "Fiji*" OR "Gabon*" OR "Gambia*" OR "Georgia*" OR "Ghana*"
OR "Grenada*" OR "Guatemala*" OR "Guinea" OR "Guinea-Bissau" OR "Guyana" OR "Haiti"
OR "Honduras" OR "Hungary" OR "India" OR "Indonesia" OR "Iran" OR "Iraq" OR "Jamaica"
OR "Jordan" OR "Kazakhstan" OR "Kenya" OR "Kiribati" OR "Kosovo" OR "Kuwait" OR
"Kyrgyz Republic" OR "Lao People's Democratic Republic" OR "Latvia" OR "Lebanon" OR
"Lesotho" OR "Liberia" OR "Libya" OR "Lithuania" OR "Macedonia" OR "Madagascar" OR
"Malawi" OR "Malaysia" OR "Maldives" OR "Mali" OR "Mauritania" OR "Mauritius" OR
"Mexico" OR "Moldova" OR "Mongolia" OR "Montenegro" OR "Morocco" OR "Mozambique"

78
OR "Myanmar" OR "Namibia" OR "Nepal" OR Nicaragua" OR "Niger" OR "Nigeria" OR
"Yugoslav" OR "Oman" OR "Pakistan" OR "Panama" OR "Papua New Guinea" OR "Paraguay"
OR "Peru" OR "Philippines" OR "Poland" OR "Qatar" OR "Romania" OR "Russia" OR
"Rwanda" OR "Samoa" OR "São Tomé and Príncipe" OR "Saudi Arabia" OR "Senegal" OR
"Serbia" OR "Seychelles" OR "Sierra Leone" OR "Solomon Islands" OR "South Africa" OR "Sri
Lanka" OR "St. Kitts and Nevis" OR "St. Lucia" OR "St. Vincent and the Grenadines" OR
"Sudan" OR "Suriname" OR "Swaziland" OR "Syrian Arab Republic" OR "Tajikistan" OR
"Tanzania" OR "Thailand" OR "Timor-Leste" OR "Togo" OR "Tonga" OR "Trinidad and
Tobago" OR "Tunisia" OR "Turkey" OR "Turkmenistan" OR "Uganda" OR "Ukraine" OR
"United Arab Emirates" OR "Uruguay" OR "Uzbekistan" OR "Vanuatu" OR "Venezuela" OR
"Vietnam" OR "Yemen" OR "Zambia" OR "Zimbabwe" OR "North Korea" OR "Cuba") and not
AB=("U.S." OR "U.K." OR "Europe" OR "US" OR "UK" OR "Japan" OR "Canada" OR
"Australia)

79
Appendix II: The 79 Studies Examined in This Paper
One of
43
papers?
One of the
13 RCTs?
Alderman, Harold, Jooseop Kim, and Peter F. Orazem. 2003. Design, evaluation, and
sustainability of private schools for the poor: The Pakistan urban and rural fellowship
school experiments. Economics of Education Review 22 (3) (6): 265-74
Yes Yes
Anderson, Joan B. 2008. Principals' role and public primary schools' effectiveness in four
Latin American cities. Elementary School Journal 109 (1) (09): 36-60
Anderson, Joan B. 2000. Factors affecting learning of mexican primary school children.
Estudios Economicos 15 (1) (January-June 2000): 117-52
Angrist, Joshua D., and Victor Lavy. 2002. New evidence on classroom computers and
pupil learning. Economic Journal 112 (482) (October 2002): 735-65 Yes
Angrist, Joshua D., and Victor Lavy. 2001. Does teacher training affect pupil learning?
evidence from matched comparisons in Jerusalem public schools. Journal of Labor
Economics 19 (2) (April 2001): 343-69
Yes
Angrist, Joshua D., and Victor Lavy. 1999. Using Maimonides' rule to estimate the effect of
class size on scholastic achievement. Quarterly Journal of Economics 114 (2) (May 1999):
533-75
Yes
Arif, G. M., and Najam us Saqib. 2003. Production of cognitive and life skills in public,
private, and NGO schools in Pakistan. Pakistan Development Review 42 (1) (Spring 2003): 1-
28
Asadullah, M. Niaz. 2005. The effect of class size on student achievement: Evidence from
Bangladesh. Applied Economics Letters 12 (4) (March 2005): 217-21 Yes
Aslam, Monazza. 2003. The determinants of student achievement in government and
private schools in Pakistan. Pakistan Development Review 42 (4) (Part 2 Winter 2003): 841-
75
Bacolod, Marigee P., and Justin L. Tobias. 2006. Schools, school quality and achievement
growth: Evidence from the Philippines. Economics of Education Review 25 (6) (December
2006): 619-32
Banerjee, Abhijit V., Shawn Cole, Esther Duflo, and Leigh Linden. 2007. Remedying
education: Evidence from two randomized experiments in India. Quarterly Journal of
Economics 122 (3) (August 2007): 1235-64
Yes Yes
Bedi, Arjun S., and Jeffery H. Marshall. 2002. Primary school attendance in Honduras.
Journal of Development Economics 69 (1) (10/1): 129-53 Yes
Bedi, Arjun S., and Jeffery H. Marshall. 1999. School attendance and student achievement:
Evidence from rural Honduras. Economic Development and Cultural Change 47 (3) (Apr.):
pp. 657-682
Yes
Behrman, Jere R., and et al. 1997. School quality and cognitive achievement production: A
case study for rural Pakistan. Economics of Education Review 16 (2) (April 1997): 127-42 Yes
Bellei, Cristian. 2009. Does lengthening the school day increase students' academic
achievement? Results from a natural experiment in Chile. Economics of Education Review 28
(5) (October 2009): 629-40
Yes
Brown, Philip H., and Albert Park. 2002. Education and poverty in rural China. Economics
of Education Review 21 (6) (December 2002): 523-41 Yes
Chen, Xinxin, Chengfang Liu, Linxiu Zhang, Yaojiang Shi, and Scott Rozelle. 2010. Does
taking one step back get you two steps forward? Grade retention and school performance
in poor areas in rural China. International Journal of Educational Development 30 (6) Rosas et
al.): 544-59
Yes
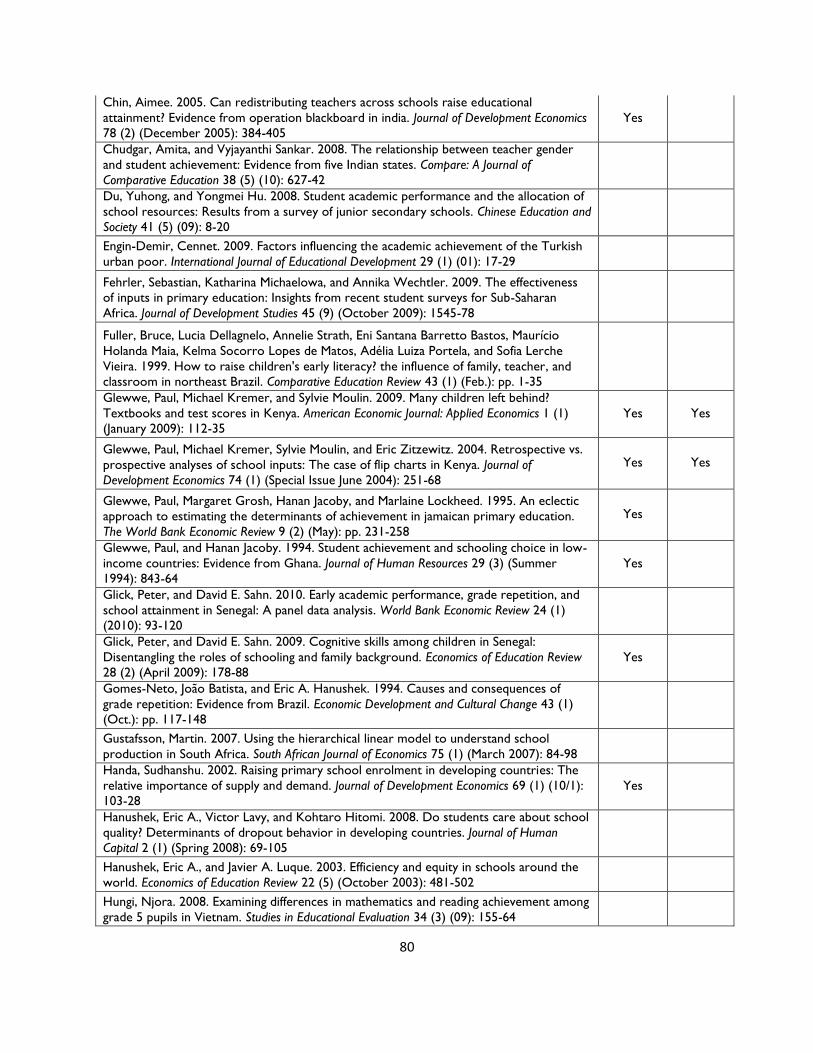
80
Chin, Aimee. 2005. Can redistributing teachers across schools raise educational
attainment? Evidence from operation blackboard in india. Journal of Development Economics
78 (2) (December 2005): 384-405
Yes
Chudgar, Amita, and Vyjayanthi Sankar. 2008. The relationship between teacher gender
and student achievement: Evidence from five Indian states. Compare: A Journal of
Comparative Education 38 (5) (10): 627-42
Du, Yuhong, and Yongmei Hu. 2008. Student academic performance and the allocation of
school resources: Results from a survey of junior secondary schools. Chinese Education and
Society 41 (5) (09): 8-20
Engin-Demir, Cennet. 2009. Factors influencing the academic achievement of the Turkish
urban poor. International Journal of Educational Development 29 (1) (01): 17-29
Fehrler, Sebastian, Katharina Michaelowa, and Annika Wechtler. 2009. The effectiveness
of inputs in primary education: Insights from recent student surveys for Sub-Saharan
Africa. Journal of Development Studies 45 (9) (October 2009): 1545-78
Fuller, Bruce, Lucia Dellagnelo, Annelie Strath, Eni Santana Barretto Bastos, Maurício
Holanda Maia, Kelma Socorro Lopes de Matos, Adélia Luiza Portela, and Sofia Lerche
Vieira. 1999. How to raise children's early literacy? the influence of family, teacher, and
classroom in northeast Brazil. Comparative Education Review 43 (1) (Feb.): pp. 1-35
Glewwe, Paul, Michael Kremer, and Sylvie Moulin. 2009. Many children left behind?
Textbooks and test scores in Kenya. American Economic Journal: Applied Economics 1 (1)
(January 2009): 112-35
Yes Yes
Glewwe, Paul, Michael Kremer, Sylvie Moulin, and Eric Zitzewitz. 2004. Retrospective vs.
prospective analyses of school inputs: The case of flip charts in Kenya. Journal of
Development Economics 74 (1) (Special Issue June 2004): 251-68
Yes Yes
Glewwe, Paul, Margaret Grosh, Hanan Jacoby, and Marlaine Lockheed. 1995. An eclectic
approach to estimating the determinants of achievement in jamaican primary education.
The World Bank Economic Review 9 (2) (May): pp. 231-258
Yes
Glewwe, Paul, and Hanan Jacoby. 1994. Student achievement and schooling choice in low-
income countries: Evidence from Ghana. Journal of Human Resources 29 (3) (Summer
1994): 843-64
Yes
Glick, Peter, and David E. Sahn. 2010. Early academic performance, grade repetition, and
school attainment in Senegal: A panel data analysis. World Bank Economic Review 24 (1)
(2010): 93-120
Glick, Peter, and David E. Sahn. 2009. Cognitive skills among children in Senegal:
Disentangling the roles of schooling and family background. Economics of Education Review
28 (2) (April 2009): 178-88
Yes
Gomes-Neto, João Batista, and Eric A. Hanushek. 1994. Causes and consequences of
grade repetition: Evidence from Brazil. Economic Development and Cultural Change 43 (1)
(Oct.): pp. 117-148
Gustafsson, Martin. 2007. Using the hierarchical linear model to understand school
production in South Africa. South African Journal of Economics 75 (1) (March 2007): 84-98
Handa, Sudhanshu. 2002. Raising primary school enrolment in developing countries: The
relative importance of supply and demand. Journal of Development Economics 69 (1) (10/1):
103-28
Yes
Hanushek, Eric A., Victor Lavy, and Kohtaro Hitomi. 2008. Do students care about school
quality? Determinants of dropout behavior in developing countries. Journal of Human
Capital 2 (1) (Spring 2008): 69-105
Hanushek, Eric A., and Javier A. Luque. 2003. Efficiency and equity in schools around the
world. Economics of Education Review 22 (5) (October 2003): 481-502
Hungi, Njora. 2008. Examining differences in mathematics and reading achievement among
grade 5 pupils in Vietnam. Studies in Educational Evaluation 34 (3) (09): 155-64
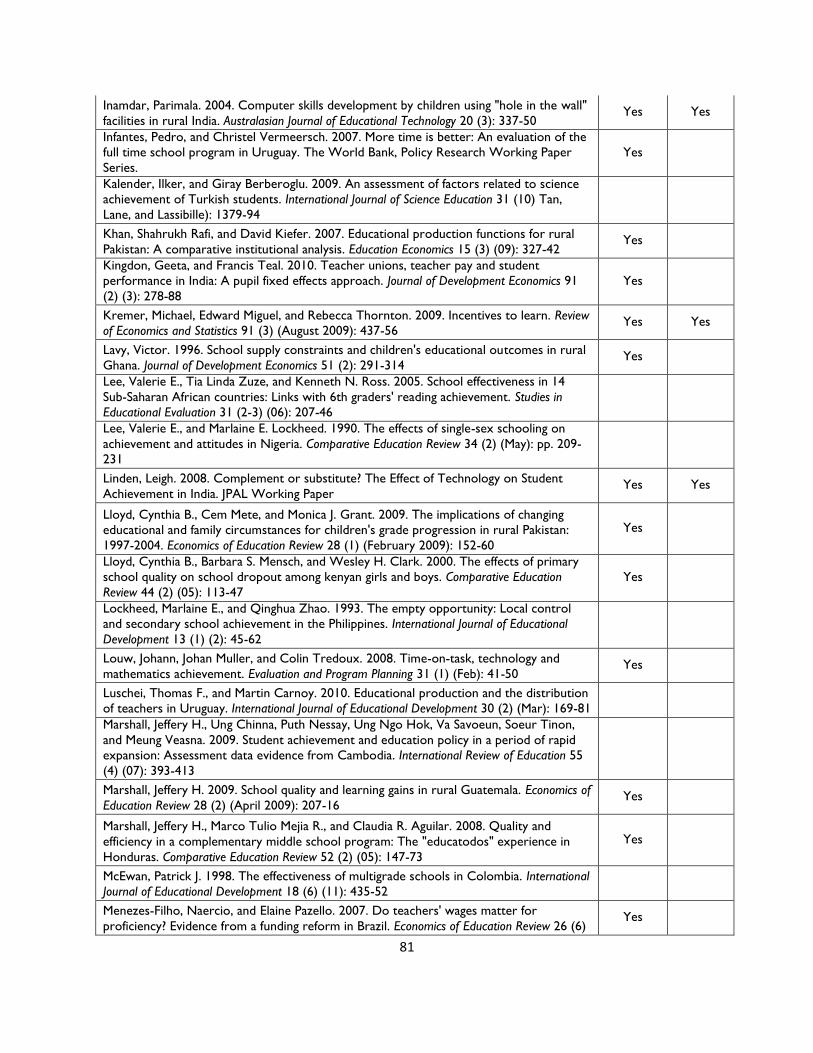
81
Inamdar, Parimala. 2004. Computer skills development by children using "hole in the wall"
facilities in rural India. Australasian Journal of Educational Technology 20 (3): 337-50 Yes Yes
Infantes, Pedro, and Christel Vermeersch. 2007. More time is better: An evaluation of the
full time school program in Uruguay. The World Bank, Policy Research Working Paper
Series.
Yes
Kalender, Ilker, and Giray Berberoglu. 2009. An assessment of factors related to science
achievement of Turkish students. International Journal of Science Education 31 (10) Tan,
Lane, and Lassibille): 1379-94
Khan, Shahrukh Rafi, and David Kiefer. 2007. Educational production functions for rural
Pakistan: A comparative institutional analysis. Education Economics 15 (3) (09): 327-42 Yes
Kingdon, Geeta, and Francis Teal. 2010. Teacher unions, teacher pay and student
performance in India: A pupil fixed effects approach. Journal of Development Economics 91
(2) (3): 278-88
Yes
Kremer, Michael, Edward Miguel, and Rebecca Thornton. 2009. Incentives to learn. Review
of Economics and Statistics 91 (3) (August 2009): 437-56 Yes Yes
Lavy, Victor. 1996. School supply constraints and children's educational outcomes in rural
Ghana. Journal of Development Economics 51 (2): 291-314 Yes
Lee, Valerie E., Tia Linda Zuze, and Kenneth N. Ross. 2005. School effectiveness in 14
Sub-Saharan African countries: Links with 6th graders' reading achievement. Studies in
Educational Evaluation 31 (2-3) (06): 207-46
Lee, Valerie E., and Marlaine E. Lockheed. 1990. The effects of single-sex schooling on
achievement and attitudes in Nigeria. Comparative Education Review 34 (2) (May): pp. 209-
231
Linden, Leigh. 2008. Complement or substitute? The Effect of Technology on Student
Achievement in India. JPAL Working Paper Yes Yes
Lloyd, Cynthia B., Cem Mete, and Monica J. Grant. 2009. The implications of changing
educational and family circumstances for children's grade progression in rural Pakistan:
1997-2004. Economics of Education Review 28 (1) (February 2009): 152-60
Yes
Lloyd, Cynthia B., Barbara S. Mensch, and Wesley H. Clark. 2000. The effects of primary
school quality on school dropout among kenyan girls and boys. Comparative Education
Review 44 (2) (05): 113-47
Yes
Lockheed, Marlaine E., and Qinghua Zhao. 1993. The empty opportunity: Local control
and secondary school achievement in the Philippines. International Journal of Educational
Development 13 (1) (2): 45-62
Louw, Johann, Johan Muller, and Colin Tredoux. 2008. Time-on-task, technology and
mathematics achievement. Evaluation and Program Planning 31 (1) (Feb): 41-50 Yes
Luschei, Thomas F., and Martin Carnoy. 2010. Educational production and the distribution
of teachers in Uruguay. International Journal of Educational Development 30 (2) (Mar): 169-81
Marshall, Jeffery H., Ung Chinna, Puth Nessay, Ung Ngo Hok, Va Savoeun, Soeur Tinon,
and Meung Veasna. 2009. Student achievement and education policy in a period of rapid
expansion: Assessment data evidence from Cambodia. International Review of Education 55
(4) (07): 393-413
Marshall, Jeffery H. 2009. School quality and learning gains in rural Guatemala. Economics of
Education Review 28 (2) (April 2009): 207-16 Yes
Marshall, Jeffery H., Marco Tulio Mejia R., and Claudia R. Aguilar. 2008. Quality and
efficiency in a complementary middle school program: The "educatodos" experience in
Honduras. Comparative Education Review 52 (2) (05): 147-73
Yes
McEwan, Patrick J. 1998. The effectiveness of multigrade schools in Colombia. International
Journal of Educational Development 18 (6) (11): 435-52
Menezes-Filho, Naercio, and Elaine Pazello. 2007. Do teachers' wages matter for
proficiency? Evidence from a funding reform in Brazil. Economics of Education Review 26 (6) Yes

82
(December 2007): 660-72
Metzler, Johannes, and Ludger Woessmann. 2010. The impact of teacher subject
knowledge on student achievement: Evidence from within-teacher withinv-student
variation. IZA Discussion Paper
Yes
Michaelowa, Katharina. 2001. Primary education quality in francophone Sub-Saharan
Africa: Determinants of learning achievement and efficiency considerations. World
Development 29 (10) (10): 1699-716
Mullens, John E., and And Others. 1996. The contribution of training and subject matter
knowledge to teaching effectiveness: A multilevel analysis of longitudinal evidence from
Belize. Comparative Education Review 40 (2) (05): 139-57
Muralidharan, Karthik, and Venkatesh Sundararaman. 2011. Contract Teachers:
Experimental evidence from India. Journal of Political Economy 119(1):39-77. Yes Yes
Nannyonjo, Harriet. 2007. Education inputs in Uganda: An analysis of factors influencing
learning achievement in grade six. World Bank Working Paper, no. 98. Africa Human
Development Series. Washington, D.C.: World Bank.
Naseer, Muhammad Farooq, Manasa Patnam, and Reehana R. Raza. 2010. Transforming
public schools: Impact of the CRI program on child learning in Pakistan. Economics of
Education Review 29 (4) (Aug): 669-83
Yes
Newman, John, and et al. 2002. An impact evaluation of education, health, and water
supply investments by the bolivian social investment fund. World Bank Economic Review 16
(2) (2002): 241-74
Yes Yes
Nonoyama-Tarumi, Yuko, and Kurt Bredenberg. 2009. Impact of school readiness
program interventions on children's learning in Cambodia. International Journal of
Educational Development 29 (1) (01): 39-45
Osorio, Felipe, and Leigh L. Linden. 2009. The use and misuse of computers in education:
Evidence from a randomized experiment in Colombia. The World Bank, Policy Research
Working Paper Series
Yes Yes
Pandey, Priyanka, Sangeeta Goyal, and Venkatesh Sundararaman. 2009. Community
participation in public schools: Impact of information campaigns in three indian states.
Education Economics 17 (3) (September 2009): 355-75
Yes Yes
Psacharopoulos, George, and And Others. 1993. Achievement evaluation of Colombia's
escuela nueva: Is multigrade the answer? Comparative Education Review 37 (3) (08): 263-76
Raudenbush, Stephen W., Suwanna Eamsukkawat, Ikechuku Di-Ibor, Mohamed Kamali,
and Wimol Taoklam. 1993. On-the-job improvements in teacher competence: Policy
options and their effects on teaching and learning in Thailand. Educational Evaluation and
Policy Analysis 15 (3) (Autumn): pp. 279-297
Rosas, R., Nussbaum,M., Cumsille, P.,Marianov, V., Correa,M., & Flores, P., et al. (2003).
Beyond Nintendo: design and assessment of educational video games for 1st and 2nd
grade students. Computers & Education, 40, 71–94
Yes Yes
Suryadarma, Daniel, Asep Suryahadi, Sudarno Sumarto, and F. Halsey Rogers. 2006.
Improving student performance in public primary schools in developing countries:
Evidence from Indonesia. Education Economics 14 (4) (Dec): 401-29
Yes
Tan, Jee-Peng, Julia Lane, and Gerard Lassibille. 1999. Student outcomes in philippine
elementary schools: An evaluation of four experiments. World Bank Economic Review 13 (3)
(September 1999): 493-508
Yes Yes
Urquiola, Miguel. 2006. Identifying class size effects in developing countries: Evidence from
rural Bolivia. Review of Economics and Statistics 88 (1) (February 2006): 171-7 Yes
Van der Berg, Servaas. 2008. How effective are poor schools? Poverty and educational
outcomes in South Africa. Studies in Educational Evaluation 34 (3) (9): 145-54

83
Van der Werf, Greetje, Bert Creemers, and Henk Guldemond. 2001. Improving parental
involvement in primary education in indonesia: Implementation, effects, and costs. School
Effectiveness and School Improvement 12 (4) (12): 447-66
Van der Werf, Greetje, Bert Creemers, Rob De Jong, and Elizabeth Klaver. 2000.
Evaluation of school improvement through an educational effectiveness model: The case
of indonesia's PEQIP project. Comparative Education Review 44 (3) (08): 329-55
Warwick, Donald P., and Haroona Jatoi. 1994. Teacher gender and student achievement
in Pakistan. Comparative Education Review 38 (3) (Aug.): pp. 377-399
Wossmann, Ludger. 2005. Educational production in East Asia: The impact of family
background and schooling policies on student performance. German Economic Review 6 (3)
(August 2005): 331-53
Yes
Yu, Guoxing, and Sally M. Thomas. 2008. Exploring school effects across southern and
Eastern African school systems and in Tanzania. Assessment in Education: Principles, Policy &
Practice 15 (3) (11): 283-305
Zhang, Yu, and David Post. 2000. Mathematics achievement in Yunnan province: The
effects of family, region, and teacher quality. Education Journal 28 (1) (07): 47-63
Zhao, Meng, and Paul Glewwe. 2010. What determines basic school attainment in
developing countries? evidence from rural China. Economics of Education Review 29 (3)
(06): 451-60

U.S. Agency for International Development
1300 Pennsylvania Avenue, NW
Washington, DC 20523
www.usaid.gov