2011 - Twin Butte Energy Ltd
66
ANNUAL REPORT 2011
Transcript of 2011 - Twin Butte Energy Ltd
1 2 0 1 1 A n n u A l R e p o R t t W I n B u t t e e n e R G Y l t D .
A n n u A l R e p o R t 2011

2 2 0 1 1 A n n u A l R e p o R t t W I n B u t t e e n e R G Y l t D .
H i g H l i g H t s
twin Butte energy ltd. (“twin Butte” or the “Company”) (tSX: tBe) is pleased to announce its financial and operational results for the three and twelve months ended December 31, 2011.
three months ended December 31 twelve months ended December 31
($ thousands, except per share amounts) 2011 2010 % Change 2011 2010 % Change
FinAnciAl
petroleum and natural gas sales 41,216 29,111 42% 146,577 101,876 44%
Funds flow (1) 16,686 12,887 29% 61,272 40,941 50%
per share basic & diluted 0.12 0.10 20% 0.45 0.32 41%
net (loss) income (37,047) (52) 7444% (19,021) 682 2889%
per share basic (0.27) (0.01) 2636% (0.14) (0.01) 1320%
per share diluted (0.27) (0.01) 2598% (0.14) (0.01) 1293%
Capital expenditures 10,056 34,039 -70% 69,272 67,438 3%
Capital dispositions (214) (1,869) -87% (11,865) (12,272) -3%
net debt (2) 77,168 96,027 -20% 77,168 96,027 -20%
opeRAting
Average daily production
Crude oil (bbl per day) 4,620 3,338 38% 4,382 2,623 67%
natural gas (Mcf per day) 16,628 21,085 -21% 17,673 22,033 -20%
natural gas liquids (bbl per day) 304 310 -2% 287 276 4%
Barrels of oil equivalent (boe per day, 6:1) 7,695 7,161 7% 7,615 6,571 16%
Average sales price
Crude oil ($ per bbl) 78.36 64.49 22% 70.26 63.56 11%
natural gas ($ per Mcf) 3.51 3.83 -8% 3.95 4.27 -7%
natural gas liquids ($ per bbl) 91.12 66.10 38% 83.34 66.35 26%
Barrels of oil equivalent ($ per boe, 6:1) 58.22 44.18 32% 52.74 42.48 24%
operating netback ($ per boe) (3)
petroleum and natural gas sales 58.22 44.18 32% 52.74 42.48 24%
Realized (loss) gain on derivative instruments (1.16) 2.51 -146% 0.61 2.22 -73%
Royalties (11.42) (8.47) 35% (10.37) (8.65) 20%
operating expenses (16.96) (13.79) 23% (15.75) (13.64) 15%
transportation expenses (1.96) (1.65) 19% (1.84) (1.60) 15%
operating netback 26.72 22.78 17% 25.39 20.81 22%
Wells drilled
Gross 12.0 28.0 -57% 125.0 88.0 42%
net 7.5 15.1 -50% 80.9 51.1 58%
Success (%) 100 100 0% 96 98 -2%
common ShAReS
Shares outstanding, end of period 135,418,937 128,197,668 6% 135,418,937 128,197,668 6%
Weighted average shares outstanding – diluted 137,313,978 128,185,784 7% 136,507,998 126,546,454 8%
(1) Funds flow from operations and funds flow from operations netback are non-GAAp measures that represent the total and the average per boe, respectively, of cash provided by operating activities, before adjusting for changes in non-cash working capital items and expenditures on decommissioning liabilities.
(2) net debt is a non-GAAp measure representing the total of bank indebtedness, accounts payables and other liabilities, less accounts receivables, deposits and prepaids.
(3) operating netback is a non-GAAp measure calculated as the average per boe of the Company’s oil and gas sales, realized gains on derivatives, less royalties, operating and transportation expenses.
3 2 0 1 1 A n n u A l R e p o R t t W I n B u t t e e n e R G Y l t D .
R e p o R t t o s H a R e H o l d e R s
Highlights of twin Butte’s highly successful 2011 are as follows:
> Record annual and quarterly production of 7,615 boe per day (an increase of 16% over 2010) and 7,695 boe per day (an increase of 7% over Q4 2010). these figures are after selling approximately 220 boe per day of production in 2011. this growth was accomplished while under spending annual cash flow.
> Increased annual and quarterly liquids production weightings to 61.3% (increased from 44.1% in 2010) and 64% (increased from 50.9% in Q4 2010) respectively. Current liquid weighting post the January 2012 combination with emerge oil & Gas Inc. (“emerge”) is approximately 80%.
> Generated record annual and quarterly funds flow of $61.3 million (50% increase over 2010) and $16.7 million (increase of 29% over Q4 2010). on a per share basis funds flow increased by 41% year over year to $0.45, and by 20% when comparing fourth quarter 2011 to 2010, or $0.12 vs. $0.10.
> executed a net capital program of $57.4 million which included the drilling of 125 gross (80.9 net) wells at a 96 percent success rate.
> Maintained an underleveraged balance sheet with year end 2011 net debt of $77.2 million compared to an existing credit facility of $128 million. eight non-core asset dispositions were completed in 2011, for proceeds of $11.9 million. An additional three dispositions valued at $6.2 million have been closed to date in 2012 further reducing the Company’s net debt. post the January 2012 combination with emerge current net debt is approximately $135 million on current bank lines of $205 million.
> Generated three year average total proved plus probable finding, development and acquisition (“FD&A”)costs of $10.59 per boe including changes in future development cost, representing a 2.5 times recycle ratio based on fourth quarter 2011 operating netbacks of $26.72 per boe. this is after accounting for technical revisions that negatively affected year end 2011 reserves.
> Announced the strategic combination with emerge which subsequently closed on January 9, 2012. this combination created an 80% oil weighted, intermediate conventional heavy oil producer with production of approximately 13,500 boe per day. post the combination the Company has implemented a monthly dividend of $0.015 per share.
Certain selected financial and operations information for the three and twelve months ended December 31, 2011 and 2010 comparatives are outlined below and should be read in conjunction with twin Butte’s audited annual Financial Statements and accompanying Management Discussion and Analysis (“MDA”). Full versions of the statements and accompanying notes along with the Company’s Annual Information Form (“AIF”) have been filed on SeDAR and also on the Company website.
coRpoRAteAs highlighted by the Company’s year-end financial and operating results, 2011 was another year of positive growth and tran-sition. over the past three years the team at twin Butte has successfully transitioned the Company from a conventional junior gas producer to a liquid weighted intermediate producer with a multiyear, low risk conventional heavy oil drilling inventory.
the strategic combination with emerge which closed in January 2012 continued that transition with current liquid weighting being approximately 80 percent. the Company’s move to a dividend paying organization has been well received in the financial markets and twin Butte believes the Company will be able to deliver attractive total returns to investors through a very sustainable dividend and moderate production per share growth for the foreseeable future. the Company’s oil leveraged assets have the potential and capital efficiency to generate sufficient cash flow to pay the strong dividend while leaving sufficient cash flow to fund internally generated annual production growth, targeted at approximately 3 to 5 percent.
the Company paid its first two dividends of $0.015 per month per share on February 15 and March 15, 2012, for shareholders of record on January 31 and February 29, 2012. It has announced shareholders of record on March 31 will receive the same dividend on April 16, 2012. the Board of Directors have approved the dividend payable for April, May and June production months, which will be payable on May 15, June 15 and July 16, 2012 respectively.

4 2 0 1 1 A n n u A l R e p o R t t W I n B u t t e e n e R G Y l t D .
FinAnciAl Consistent with the Company’s increasing liquids weighting quarterly funds flow from operations continue to increase, the fourth quarter $16.7 million being the second highest quarter ever achieved. Yearly funds flow hit a record of $61.3 million, a 50 percent increase from 2010 and a 41 percent increase in funds flow per share from 2010. As previously announced post the announcement of the emerge transaction and the decision to implement a monthly dividend, fourth quarter 2011 capital expenditures were restricted to $10.1 million (net of dispositions) representing only 60 percent of funds flow. Although this represented a lower level of spending as compared to previous quarters, production grew in the fourth quarter to 7,695 from 7,599 boe per day in the third quarter.
In addition, the Company’s balance sheet remains very strong. Year-end net debt of $77.2 million represented 1.2 times Q4 an-nualized cash flow. pro-forma the closing of the emerge transaction corporate net debt is $139 million including all transaction costs on a combined debt facility of $205 million. to date in 2012 approximately $6.2 million of proceeds has been realized from the sale of three non-core assets producing approximately 170 boe’s per day. It is anticipated the Company’s cash flow in the first quarter of 2012 will exceed dividend payments and capital expenditures thereby providing further reduction in net debt.
even with the recent widening of price differential from WtI to the WCS Canadian heavy index twin Butte’s 2012 cash flow forecast of $100 million is well protected with our hedging program. Approximately 75% of our current gas production hedged at $4.21/GJ at AeCo for the year. In addition, 45% of current heavy oil production is hedged at a WCS price of $84.04 for the first half of the year and approximately 20 percent of current heavy oil production is hedged at a WCS price of $82.70 for the second half of the year. these hedges in combination with current strip pricing and light to heavy differentials suggest twin Butte’s heavy and overall liquid wellhead price should be approximately $10 per Bbl above pricing estimated in our 2012 cash flow forecast. At the current annual dividend rate of $0.18 per share this cash flow forecast suggests an all-in (dividend and capital expenditure) payout ratio of less than 100 percent of cash flow, one of the lowest of the dividend paying e&p companies.
opeRAtionSDuring 2011 twin Butte drilled 125 gross (80.9 net) wells with a 96 percent success rate demonstrating the predictable and repeatable potential of the Company’s drilling inventory which currently is estimated to be over 500 net conventional heavy oil wells. All but 9 net wells were drilled within the Company’s core heavy oil fairway all of which were successful. one hundred percent of twin Butte’s 2012 capital will be spent in this area representing approximately 90 net wells.
At Frog lake, the Company’s most active area in 2011, 109 gross (67.8 net) wells were drilled at a 100 percent success rate. the Company’s focus in 2012 and beyond at Frog lake will be on the Rex formation which has provided very consistent results for the past two years. As discussed in the reserves section below, the Company did encounter performance issues in a Gp pool that had been drilled in 2010 at Frog lake. these performance issues suggest only minimal capital will be spent on the Gp point forward and the majority of the remaining Gp locations have been removed from twin Butte’s drilling inventory and reserve evaluation.
to date in 2012 20 gross (10.2 net) wells have been drilled successfully in the Rex formation at Frog lake. It is anticipated a total of 75 gross (43 net) wells will be drilled on this property in 2012. production from Frog lake has increased appreciably since the Company acquired the property late in 2009 and it is anticipated that this profitable growth will continue based on our current sizable drilling inventory.
outside of Frog lake, the Company has been and will be active in the greater lloydminster area at earlie, Silverdale, and primate. these areas account for the remainder of twin Butte’s conventional heavy oil drilling inventory. Although these areas have slightly different producing characteristics than Frog lake they offer the same predictability and drilling repeatability that Frog lake has and will be developed with a combination of vertical and horizontal wells. First quarter 2012 drilling has seen 6 net wells drilled at Silverdale and 6 net wells drilled at primate.
In addition, ongoing facility work to optimize operating expenses and net backs, have been completed at Frog lake and primate.
even with the current wider differentials of WtI to WCS twin Butte anticipates netbacks exceeding $35 per boe in its heavy oil areas which generate recycle ratios approaching 4 times and payouts of less than 10 months. these wells generate return on investment in the top percentile of all plays in north America and the Company believes its current sizable drilling inventory has the ability to fuel the Company’s dividend and moderate growth strategy for years to come.
the Company’s yearly capital plan of $66 million remains unchanged. Current Company production is 13,500 boe per day post the disposition of assets producing 170 boe per day.

5 2 0 1 1 A n n u A l R e p o R t t W I n B u t t e e n e R G Y l t D .
YeAR end 2011 ReSeRveStwin Butte is pleased to provide information on its oil and gas reserves as of December 31, 2011, as evaluated by the Company’s independent reserve engineering firm, McDaniel & Associates Consultants ltd (“McDaniel”). the evaluation of twin Butte’s petroleum and natural gas reserves was conducted pursuant to national Instrument 51-101 – Standards of Disclosure for oil and Gas Activities (“nI 51-101”) and the Canadian oil and Gas evaluation Handbook (“CoGeH”) reserves definitions.
Forecast prices and costs
Reserve Category
light and Medium
Crude oilGross (1)
(Mbbl)net (2)
(Mbbl)
Heavy oilGross (1)
(Mbbl)net (2)
(Mbbl)
natural Gas liquidsGross (1)
(Mbbl)net (2)
(Mbbl)
proved
Developed producing 1,059.0 934.4 2,748.7 2,203.4 1,181.9 762.3
Developed non-producing 39.9 37.7 565.4 432.3 182.0 121.7
undeveloped 303.8 268.2 3474.0 2894.6 192.5 136.1
total proved 1,402.7 1,240.3 6,788.1 5,530.4 1,556.4 1,020.1
probable 614.1 523.5 8,429.9 6,799.3 646.1 424.2
total proved plus probable 2,016.8 1,763.8 15,218.0 12,329.7 2,202.5 1,444.3
total proved plus probable Developed producing 1,326.6 1,161.2 3,568.2 2,822.2 1,431.8 923.2
Reserve Category
natural GasGross (1)
(Bcf)net (2)
(Bcf)
oil equivalentGross (1)
(Mboe)net (2)
(Mboe)
proved
Developed producing 51.8 44.4 13,614.8 11,297.4
Developed non-producing 6.9 5.7 1,942.2 1,549.4
undeveloped 8.4 7.1 5,368.3 4,484.9
total proved 67.1 57.2 20,925.2 17,331.6
probable 30.0 25.3 14,694.5 11,966.9
total proved plus probable 97.1 82.6 35,619.7 29,298.5
total proved plus probable Developed producing 63.3 54.1 16,875.5 13,929.1
(1) “Gross” reserves means the total working interest share of remaining recoverable reserves owned by twin Butte before deductions of royalties payable to others.
(2) “net” reserves means twin Butte gross reserves less all royalties payable to others.
(3) “oil equivalent” amounts have been calculated using a conversion of six thousand cubic feet of natural gas to one barrel of oil. Boes may be misleading, particularly if used in isolation. A boe conversion ratio of six thousand cubic feet of natural gas to one barrel of oil is based on an energy equivalency conversion method primarily applicable at the burner tip and does not represent a value equivalency at the wellhead.
Summary of net present value of Future net Revenue
As at December 31, 2011 Before Income taxes and Discounted at (%/year)
Reserve Category ($000s) 0% 5% 10% 15% 20%
proved
Developed producing 307,344.6 230,780.9 191,761.4 167,876.6 151,433.8
Developed non-producing 48,058.3 29,501.2 21,639.7 17,200.0 14,244.9
undeveloped 113,630.6 87,006.4 69,184.5 56,278.4 46,496.6
total proved 469,033.6 347,288.6 282,585.6 241,355.0 212,175.3
probable 420,352.7 280,194.7 211,724.6 168,404.2 137,878.2
total proved plus probable 889,386.2 627,483.3 494,310.0 409,759.0 350,053.4
total proved plus probable Developed producing 404,905.2 285,533.2 231,670.3 200,218.5 178,981.5

6 2 0 1 1 A n n u A l R e p o R t t W I n B u t t e e n e R G Y l t D .
Reserve Reconciliation
Reconciliation of Gross Company Interest Reserves (1) (2)
By principal product type
Forecast prices and Costs
light and Medium Crude oil Heavy oil
proved(mbbl)
probable(mbbl)
proved + probable
(mbbl)proved
(mbbl)probable
(mbbl)
proved + probable
(mbbl)
December 31, 2010 1,510.1 883.8 2,393.9 7,447.2 7,118.9 14,566.1
Discoveries, extensions and Improved Recoveries 98.8 42.4 141.1 2,153.1 2,172.2 4,325.3
technical Revisions 375.4 15.4 390.8 (1,507.1) (858.3) (2,365.4)
Acquisitions and Dispositions (275.0) (327.3) (602.3) (12.2) (2.8) (15.1)
production (306.6) 0 (306.6) (1,292.8) 0 (1,292.8)
december 31, 2011 1,402.7 614.2 2,016.9 6,788.1 8,429.9 15,218.0
natural Gas liquidsnatural Gas Including
Solution Gas
proved(mbbl)
probable(mbbl)
proved + probable
(mbbl)proved(mmcf)
probable(mmcf)
proved + probable
(mmcf)
December 31, 2010 1,465.4 697.5 2,162.9 74,998.7 35,019.5 110,018.2
Discoveries, extensions and Improved Recoveries 4.7 (2.6) 2.1 1,363.6 (640.8) 722.7
technical Revisions 198.3 (44.6) 153.7 (1,487.9) (3,552.5) (5,040.4)
Acquisitions and Dispositions (7.2) (4.2) (11.4) (1,355.1) (800.1) (2,155.1)
production (104.8) 0 (104.8) (6,450.6) 0 (6,450.6)
december 31, 2011 1,556.4 646.1 2,202.5 67,068.6 30,026.1 97,094.7
oil equivalent (3)
proved(mbbl)
probable(mbbl)
proved + probable
(mbbl)
December 31, 2010 22,922.5 14,536.8 37,459.3
Discoveries, extensions and Improved Recoveries 2,483.8 2,105.1 4,589.0
technical Revisions (1,181.4) (1,479.6) (2,661.0)
Acquisitions and Dispositions (520.3) (467.7) (988.1)
production (2,779.3) 0 (2,779.3)
december 31, 2011 20,925.3 14,694.6 35,619.9
(1) Gross Company interest reserves include solution gas but do not include royalty
(2) Reserve information as at December 31, 2010 and 2011 is prepared in accordance with nI 51-101
(3) oil equivalent amounts have been calculated using a conversion of six thousand cubic feet of natural gas to one barrel of oil. Boes may be misleading, particularly if used in isolation. A boe conversion ratio of six thousand cubic feet of natural gas to one barrel of oil is based on an energy equivalency conversion method primarily applicable at the burner tip and does not represent a value equivalency at the wellhead.

7 2 0 1 1 A n n u A l R e p o R t t W I n B u t t e e n e R G Y l t D .
capital program efficiency
2011 2010 2009
three Year Average
2009 - 2011
excluding Future development cost
FD&A cost – proved ($/boe)
Additions and revisions (1) 51.32 10.63 27.06 20.78
Acquisitions (net of dispositions) 18.13 4.52 8.76 7.79
total 73.40 8.62 9.60 11.73
FD&A costs – proved plus probable ($/boe)
Additions and revisions (1) 34.67 7.04 14.56 13.51
Acquisitions (net of dispositions) 9.54 3.35 5.51 5.05
total 61.08 5.91 5.99 7.61
operating netback per boe (2) 25.39 20.81 19.28 22.46
Recycle ratio (2)
proved plus probable 0.4 3.5 3.2 3.0
including Future development costs
FD&A costs – proved ($/boe)
Additions and revisions (1) 42.64 13.36 2.81 18.47
Acquisitions (net of dispositions) 18.13 16.17 10.51 11.06
total 58.95 14.28 10.15 13.31
FD&A costs – proved plus probable ($/boe)
Additions and revisions (1) 32.65 9.68 11.88 14.58
Acquisitions (net of dispositions) 9.54 12.29 8.40 8.85
total 56.95 10.48 8.59 10.59
Recycle ratio (2)
proved plus probable 0.5 2.0 2.2 2.1
(1) the aggregate of the additions and revisions costs incurred in the most recent financial year and the change during that year in estimated future development costs generally will not reflect total finding and development costs related to reserve additions for that year.
(2) Recycle ratio is calculated as operating netback divided by FD&A costs (proved plus probable). operating netback is calculated as revenue (including realized hedging gains and losses) minus royalties, production and operating expenses and transportation expenses.
under nI 51-101, the methodology to be used to calculate FD&A costs includes incorporating changes in future development capital required to bring the proved undeveloped and probable reserves to proved producing status. For continuity, twin Butte has presented FD&A costs calculated both excluding and including FDC. Changes in forecast FDC occur annually as a result of development, acquisition and disposition activities and capital cost estimates that reflect the independent evaluators best estimate of what it will cost to bring the proved undeveloped and probable reserves on production.
Reserve life index
the following table sets forth our reserve life index based on total proved and proved plus probable reserves and actual Q4 2011 production level of 7,695 boe/d.
Reserve life Index (years)
productiontotal
provedproved plus
probable
oil and nGl (bbl/d) 4,924 5.4 10.8
natural Gas (mcf/d) 16,628 11.1 16.0
oil equivalent (boe/d) 7,695 7.5 12.7

8 2 0 1 1 A n n u A l R e p o R t t W I n B u t t e e n e R G Y l t D .
mcdaniel december 31, 2011 Forecast prices
Select Summary pricing and Inflation Rate Assumptions (Forecast prices)
Year
WtICrushing
uS$
edmontonpar price
C$/bbl
Alberta Heavy12o ApIC$/bbl
AeCoSpot
C$/MMbtuInflation
Rate %/Yrexchange Rate
$uS/$Cdn
2011 act. 94.80 95.20 67.35 3.70 2.0 1.011
2012 97.50 99.00 74.00 3.50 2.0 0.975
2013 97.50 99.00 74.00 4.20 2.0 0.975
2014 100.00 101.50 75.90 4.70 2.0 0.975
2015 100.80 102.30 76.50 5.10 2.0 0.975
2016 101.70 103.20 77.10 5.55 2.0 0.975
2017 102.70 104.20 77.90 5.90 2.0 0.975
2018 103.60 105.10 78.60 6.25 2.0 0.975
2019 104.50 106.00 79.20 6.45 2.0 0.975
2020 105.40 106.90 79.90 6.70 2.0 0.975
2021 107.60 109.20 81.60 6.85 2.0 0.975
Future development costs (undiscounted)
Yearproved Reserves
($000s)
proved plus probable Reserves
($000s)
2012 16,876 28,926
2013 27,597 45,194
2014 23,590 57,979
2015 3,212 12,703
2016 1,623 854
Remaining 1,070 7,450
total (undiscounted) 73,967 153,106
net Asset value
the following net asset value (“nAV”) table shows a nAV calculation under which the Company’s reserves would be produced at forecast future prices and costs. the value is a snapshot in time and is based on various assumptions, including commodity prices and foreign exchange rates that vary over time. It should not be assumed that the nAV per share represents the fair market value of twin Butte shares. the calculations below do not reflect the value of the Company’s prospect inventory to the extent that the prospects are not recognized within the nI 51-101 compliant reserve assessment.
using twin Butte’s Reserve Value at December 31, 2011 – Forecast pricing and Costs (pre tax)
($MM except as noted) 10% Before tax 15% Before tax
proved plus probable Reserve Value 494.3 409.8
undeveloped land Value (1) 37.1 37.1
net Debt (77.2) (77.2)
option proceeds 16.1 16.1
Basic Shares outstanding 135.4 135.4
estimated net Asset value $ per Share - Basic $3.35 $2.73
Fully Diluted Shares outstanding 145.4 145.4
estimated net Asset value $ per Share – Fully diluted $3.23 $2.65
(1) Independent assessment of 207,762 net undeveloped acres at average price of $178/acre
the combined proved and probable technical revisions represent a negative revision of approximately 7 percent on the year end 2010 balance. the natural gas revision (32 percent of overall revision) was predominantly discretionary by management,

9 2 0 1 1 A n n u A l R e p o R t t W I n B u t t e e n e R G Y l t D .
as the Company’s capital expenditure forecast for the next number of years is directed strictly to oil activity. therefore twin Butte felt it was prudent to reduce the number of undeveloped gas locations represented in the report.
the negative revision associated with the Company’s heavy oil properties was predominantly associated with the redefinition of the Company’s heavy oil type well. In 2009 the type well assumed approximately 45 Mboe of recoverable oil. Based on positive overall 2010 drilling results, the type well was increased to approximately 57 Mboe at year end 2010. largely due to the underperformance of the Gp formation in one pool at Frog lake during 2011, the type well was reduced to 50 Mboe at year end 2011. this type well revision in combination with a number of undeveloped Gp locations being removed from the report accounted for the total negative revision. of note is that the proved developed producing reserves booked at year end 2010 after adjustment for production actually increased at year end 2011, and the heavy oil proved and probable reserve replacement ratio was 150% of heavy oil production, representing the positive performance of the non Gp producing wells. As noted earlier the Company’s focus at Frog lake in 2012 and beyond is on the Rex formation that has delivered consistent positive results.
the above noted revisions in combination with the additions achieved in 2011 have lead to a finding and development cost including change in forward development capital of $32.65 per boe compared to the Company’s three year average of $14.58 per boe.
Also in 2011 the Company sold a number of non-core producing and nonproducing assets. the prices received for these assets were reflective of current market conditions but were below the year-end 2011 proved and probable present values reflected in the reserve report. When combined with the 2011 finding and development costs reflected above, 2011 finding, develop-ment and acquisition costs including forward development capital changes were $56.95 per boe compared to a three year average of $10.59 per boe, or a 2.5 times recycle ratio.
outlooktwin Butte is in an enviable position in that it has a strong balance sheet, a predictable production profile and a current inventory of over 500 net heavy oil drilling locations after incorporating the emerge inventory. this will allow a sustained pace of repeatable development drilling and prioritized capital spending to maximize capital efficiencies, economic returns and minimize payout times, providing visible sustainability to twin Butte’s dividend and anticipated Company growth.
twin Butte’s employees, executive, and Board have continued to work very diligently throughout 2011 to achieve the Company’s success. the team remains extremely motivated to meet and exceed the expectations it has set and to deliver strong returns to the shareholders. our thanks goes out to all who have contributed in our success.
twin Butte anticipates 2012 will continue to see the Company progress its business plan. We believe the combination of a sustainable dividend and moderate per share growth will continue to attract investor interest. We remain committed to continually enhance the Company’s asset quality through organic growth and strategic acquisitions.
ABout t win But tetwin Butte is a value oriented, intermediate producer with a significant and growing scalable and repeatable drilling inventory focused on large original oil in-place conventional heavy oil exploitation. With a stable low decline production base the Company is well positioned to live within cash flow while providing shareholders with a sustainable dividend and moderate per share production growth potential over the long term.
Jim Saunderspresident and Chief executive officerMarch 22, 2012

10 2 0 1 1 A n n u A l R e p o R t t W I n B u t t e e n e R G Y l t D .
FoRwARd -looking StAtementSIn the interest of providing Twin Butte’s shareholders and potential investors with information regarding Twin Butte and Buffalo, including management’s
assessment of the future plans and operations of Twin Butte, certain statements contained in this report constitute forward-looking statements or
information (collectively “forward-looking statements”) within the meaning of applicable securities legislation. Forward-looking statements are typically
identified by words such as “anticipate”, “continue”, “estimate”, “expect”, “forecast”, “may”, “will”, “project”, “could”, “plan”, “intend”, “should”, “believe”,
“outlook”, “potential”, “target” and similar words suggesting future events or future performance. In particular but without limiting the foregoing, this
report contains forward-looking statements pertaining to the following: future dividend levels; the volumes and estimated value of Twin Butte’s oil and
natural gas reserves; the life of Twin Butte’s reserves; the volume and product mix of Twin Butte’s oil and natural gas production; future oil and natural
gas prices; future operational activities; and future results from operations and operating metrics, including future production growth and net debt.
In addition, statements relating to “reserves” are deemed to be forward-looking statements as they involve the implied assessment, based on certain
estimates and assumptions, that the reserves described exist in the quantities predicted or estimated and can be profitably produced in the future.
With respect to forward-looking statements contained in this report, we have made assumptions regarding, among other things: future capital expenditure
levels; future oil and natural gas prices and differentials between light, medium and heavy oil prices; results from operations including future oil and
natural gas production levels; future exchange rates and interest rates; our ability to obtain equipment in a timely manner to carry out development
activities; our ability to market our oil and natural gas successfully to current and new customers; the impact of increasing competition; our ability to
obtain financing on acceptable terms; and our ability to add production and reserves through our development and exploitation activities. Although Twin
Butte believes that the expectations reflected in the forward looking statements contained in this report, and the assumptions on which such forward-
looking statements are made, are reasonable, there can be no assurance that such expectations will prove to be correct. Readers are cautioned not to
place undue reliance on forward-looking statements included in this report, as there can be no assurance that the plans, intentions or expectations upon
which the forward-looking statements are based will occur. By their nature, forward-looking statements involve numerous assumptions, known and
unknown risks and uncertainties that contribute to the possibility that the predictions, forecasts, projections and other forward-looking statements will
not occur, which may cause Twin Butte’s actual performance and financial results in future periods to differ materially from any estimates or projections
of future performance or results expressed or implied by such forward-looking statements. These risks and uncertainties include, among other things, the
following: volatility in market prices for oil and natural gas; general economic conditions in Canada, the U.S. and globally; and the other factors described
under “Risk Factors” in Twin Butte’s most recently filed Annual Information Form available in Canada at www.sedar.com. Readers are cautioned that this
list of risk factors should not be construed as exhaustive.
The forward-looking statements contained in this report speak only as of the date of this report. Except as expressly required by applicable securities laws,
Twin Butte does not undertake any obligation to publicly update or revise any forward looking statements, whether as a result of new information, future
events or otherwise. The forward-looking statements contained in this report are expressly qualified by this cautionary statement.
Barrels of oil equivalentBarrels of oil equivalents (boe) may be misleading, particularly if used in isolation. A boe conversion ratio of 6 Mcf: 1 bbl (barrel) is based on an energy
equivalency conversion method primarily applicable at the burner tip and does not represent a value equivalency at the wellhead. In addition, as the
value ratio between natural gas and crude oil based on the current prices of natural gas and crude oil is significantly different from the energy equivalency
of 6:1, utilizing a conversion on a 6:1 basis may be misleading as an indicated value.
ReAdeR AdviSoRYThis MD&A contains non-IFRS financial measures and forward-looking statements and readers are cautioned that the MD&A should be read in
conjunction with the Company’s disclosure under “Non-IFRS Financial Measures” and “Forward-Looking Statements”. Certain information regarding
Twin Butte set forth in this report including management’s assessment of the Company’s future plans and operations, the effect on the Company and on
shareholders of Twin Butte, production increases and future production levels contain forward-looking statements that involve substantial known and
unknown risks and uncertainties. These forward-looking statements are subject to numerous risks and uncertainties, certain of which are beyond Twin
Butte’s control including, without limitation, the impact of general economic conditions, industry conditions, volatility of commodity prices, currency
fluctuations, imprecision of reserve estimates, environmental risks, competition from other producers, lack of availability of qualified personnel, stock
market volatility, and ability to access sufficient capital from internal and external sources. Twin Butte’s actual results, performance or achievements
may differ materially from those expressed in, or implied by, these forward-looking statements and, accordingly, no assurance can be given that any
events anticipated by the forward-looking statements will transpire or occur, or if any of them do so, what benefits that Twin Butte will derive there from.
Additional information on these and other factors that could affect Twin Butte’s results are included in reports on file with Canadian securities regulatory
authorities and may be accessed through the SEDAR website (www.sedar.com), or Twin Butte’s website (www.twinbutteenergy.com). Furthermore, the
forward-looking statements contained in this report are made as at the date of this report and Twin Butte does not undertake any obligation to update
publicly or to revise any of the forward-looking statements, whether as a result of new information, future events or otherwise, except as may be required
by applicable securities laws.

11 2 0 1 1 A n n u A l R e p o R t t W I n B u t t e e n e R G Y l t D .
M a n ag e M e n t ’s d i s c u s s i o n a n d a n a lys i s
Dated as of March 22, 2012
intRoduction the following Management Discussion and Analysis (“MD&A”) is management’s assessment of twin Butte energy ltd’s (“twin Butte” or the “ Company”). financial and operating results and should be read in conjunction with the message to sharehold-ers and the interim financial statements of the Company for the three and twelve months ended December 31, 2011 and 2010 and the audited financial statements and MD&A for the year ended December 31, 2010. the reader is cautioned that the aforementioned audited financial statements and MD&A for the year ended December 31, 2010 are presented using Canadian generally accepted accounting principles (“previous Canadian GAAp”) whereas the financial statements for the three and twelve months ended December 31, 2011 and the 2010 comparatives have been prepared in accordance with International Financial Reporting Standards (“IFRS”). All references to “previous GAAp” refer to Canadian GAAp before the adoption of IFRS. this MD&A is presented in Canadian dollars (except where otherwise noted). Additional information relating to the Company, including the Company’s Annual Information Form can be found on www.sedar.com.
the Company’s principal activity is the acquisition of, exploration for and the development and production of petroleum and natural gas properties in Western Canada.
transition to international Financial Reporting Standards
the financial statements, MD&A and comparative information have been prepared in Canadian dollars unless otherwise indicated and in accordance with International Financial Reporting Standards (“IFRS”) representing generally accepted ac-counting principles (“GAAp”) for publicly accountable enterprises in Canada. the transition date to IFRS was January 1, 2010 and comparative figures for 2010 and twin Butte’s financial position as at January 1, 2010 have been restated to IFRS from the previous Canadian generally accepted accounting principles (“previous GAAp”). Reconciliations to IFRS from previous GAAp financial statements including the impact of the transition on the Company’s reported financial position and financial performance, and the nature and effect of significant changes in accounting policies from those used in the Company’s finan-cial statements as at January 1, 2010, and as at and for the year ended December 31, 2010, are summarized in note 18 to the unaudited financial statements.
non-iFRS measures – Certain measures in this document do not have any standardized meaning as prescribed by non-IFRS such as operating netback, funds flow, funds flow from operations, funds flow per share, net debt and capitalization and, therefore, are considered non-IFRS measures. the Management’s Discussion and Analysis (“MD&A”) contains the term funds flow from operations or funds flow which should not be considered an alternative to, or more meaningful than, cash flow from operating activities as determined in accordance with IFRS and previous GAAp as an indicator of the Company’s performance. All references to funds flow from operations or funds flow throughout this report are based on cash flow from operating ac-tives before changes in non-cash working capital. the Company also presents funds flow from operations per share whereby per share amounts are calculated using weighted average shares outstanding consistent with the calculation of earnings per share. these measures may not be comparable to similar measures presented by other issuers. these measures have been described and presented in this document in order to provide shareholders and potential investors with additional informa-tion regarding the Company’s liquidity and its ability to generate funds to finance its operations. Management’s use of these measures has been disclosed further in this document as these measures are discussed and presented.
Basis of presentation – the reporting and measurement currency is the Canadian dollar.
boe presentation – Barrels of oil equivalent (“boe”) may be misleading, particularly if used in isolation. A boe conversion rate of 6 Mcf: 1 bbl is based on an energy equivalency conversion method primarily applicable at the burner tip and does not represent a value equivalency at the wellhead. All boe conversions in the report are derived by converting gas to oil at the ratio of six thousand cubic feet of gas to one barrel of oil.

12 2 0 1 1 A n n u A l R e p o R t t W I n B u t t e e n e R G Y l t D .
FoRwARd -looking StAtementS Certain statements contained in this MD&A constitute forward-looking information within the meaning of securities laws. Forward-looking information may relate to our future outlook and anticipated events or results and may include statements regarding the future financial position, business strategy, budgets, projected costs, capital expenditures, financial results, taxes and plans and objectives of or involving twin Butte. particularly, statements regarding our future operating results and economic performance are forward-looking statements. In some cases, forward-looking information can be identified by terms such as “may”, “will”, “should”, “expect”, “plan”, “anticipate”, “believe”, “intend”, “estimate”, “predict”, “potential”, “con-tinue” or other similar expressions concerning matters that are not historical facts.
these statements are based on certain factors and assumptions regarding expected growth, results of operations, perfor-mance and business prospects and opportunities. While we consider these assumptions to be reasonable based on informa-tion currently available to us, they may prove to be incorrect.
Forward-looking information is also subject to certain factors, including risks and uncertainties that could cause actual results to differ materially from what we currently expect. these factors include risk associated with oil and gas exploration, produc-tion, marketing, and transportation such as loss of market, volatility of commodity prices, currency fluctuations, imprecision of reserve estimates, environmental risk, and competition from other producers and ability to access sufficient capital from internal and external resources.
other than as required under securities laws, we do not undertake to update this information at any particular time.
All statements, other than statements of historical fact, which address activities, events, or developments that twin Butte expects or anticipates will or may occur in the future, are forward-looking statements within the meaning of applicable securi-ties laws. these statements are subject to certain risks and uncertainties, and may be based on estimates or assumptions that could cause actual results to differ materially from those anticipated or implied.
Further, the forward-looking statements contained in this MD&A are made as of the date hereof, and the Company does not undertake any obligation to update publicly or to revise any of the included forward-looking statements, as a result of new information, future events or otherwise, except as may be required by applicable securities laws. the Company’s forward-looking statements are expressly qualified in their entirety by this cautionary statement. Certain risk factors associated with these forward-looking statements include, but are not limited to, the following:
> Fluctuations in natural gas, condensate, nGl’s, and crude oil production levels;
> twin Butte’s inability to successfully market its natural gas, condensate, nGl’s, and crude oil;
> lower than expected market prices for natural gas, condensate, nGl’s, and crude oil;
> Adverse changes in foreign currency exchange rates and/or interest rates;
> uncertainties associated with estimating reserves;
> Competition for capital, asset acquisitions, undeveloped lands, and skilled personnel;
> operational hazards characteristic of the oil and gas industry such as: geological and drilling problems; and well produc-tion, pipeline, and mechanical difficulties;
> lower than envisaged success in the finding and development of reserves and/or higher than expected costs;
> Adverse changes in general economic conditions in Western Canada, Canada more generally, north America or globally;
> Adverse weather conditions;
> the inability of twin Butte to obtain financing on favorable terms, or at all;
> Adverse impacts from the actions of competitors;
> Adverse impacts of actions taken and/or policies established by governments or regulatory authorities including changes to tax laws, incentive programs, royalty calculations, and environmental laws and regulations; and

13 2 0 1 1 A n n u A l R e p o R t t W I n B u t t e e n e R G Y l t D .
> Reliance on natural gas and nGl processing, pipeline, and storage infrastructure not operated by twin Butte, the avail-ability of which is essential to twin Butte’s sales and marketing activities.
Additional information relating to twin Butte, including twin Butte’s financial statements can be found on SeDAR at www.sedar.com or the Company’s website at www.twinbutteenergy.com.
petRoleum And nAtuRAl gAS SAleStwin Butte realized the following production volumes, commodity prices and sales:
three months ended December 31
twelve months ended December 31
2011 2010 2011 2010
Average twin Butte Realized commodity prices (1)
Heavy oil ($ per bbl) 76.09 60.98 67.42 59.62
light & Medium oil ($ per bbl) 88.38 74.80 82.23 73.44
natural gas ($ per Mcf) 3.51 3.83 3.95 4.27
natural gas liquids ($ per bbl) 91.12 66.10 83.34 66.35
Barrels of oil equivalent ($ per boe, 6:1) 58.22 44.18 52.74 42.48
(1) the average selling prices reported are before realized derivative instrument gains/losses and transportation charges.
Benchmark pricing
WtI crude oil (uS$ per bbl) 94.06 85.17 95.12 79.53
WtI crude oil (Cdn$ per bbl) 97.86 80.68 95.52 77.82
WCS crude oil (Cdn $ per bbl) 86.91 68.74 78.13 68.11
AeCo natural gas (Cdn$ per Mcf) (2) 3.04 3.63 3.45 4.00
exchange rate – (uS$/ Cdn$) 0.98 1.01 1.01 1.03
(2) the AeCo natural gas price reported is the average daily spot price.
Sales
$000’s
Heavy oil 26,382 13,969 87,163 40,765
light & Medium oil 6,917 5,833 25,211 20,085
natural gas 5,367 7,424 25,467 34,348
natural gas liquids 2,550 1,885 8,736 6,678
total petroleum and natural gas sales 41,216 29,111 146,577 101,876
Average daily production
Heavy oil (bbl/day) 3,769 2,492 3,542 1,873
light & medium oil (bbl/day) 851 846 840 750
natural gas liquids (bbl/day) 304 310 287 276
natural gas (Mcf/day) 16,628 21,085 17,673 22,033
total (boe/d) 7,695 7,161 7,615 6,571
% oil and liquids production 64% 51% 61% 44%
Sales for the three months ended December 31, 2011 were $41.2 million, as compared to $29.1 million for the three months ended December 31, 2010 representing an increase of $12.1 million or 42%. this increase in revenue is attributed primarily to a year over year increase in average boe pricing of 32% and an increase in total boe production of 7%. production grew from 7,161 boe/d in the three months ended December 31, 2010 to 7,695 boe/d for the three months ended December 31, 2011. the increase in production came mainly from internal growth in our Frog lake area and the asset acquisition of additional Frog lake properties in Q4 2010. the average realized commodity price before derivative instruments increased 32% to $58.22

14 2 0 1 1 A n n u A l R e p o R t t W I n B u t t e e n e R G Y l t D .
during the fourth quarter up from $44.18 in the three months ended December 31, 2010, mainly due to an increase in oil prices and an increase in oil and liquids weighting to 64% from 51%, as a result of the 38% growth in oil production volumes.
Revenues for the twelve months ended December 31, 2011 were $146.6 million, as compared to $101.9 million for the twelve months ended December 31, 2010, representing an increase of $44.7 million or 44%. this increase in revenue is again attrib-uted to production increases of 16%, commodity price increase of 24%, and the increase in oil and liquids weighting from 44% to 61%. production increased from 6,571 boe/d in 2010 to 7,615 boe/d in 2011. the average realized commodity price before hedging increased from $42.48 per boe in 2010 to $52.74 in 2011.
the Company’s weighting to oil and liquids for the fourth quarter of 2011 was 64% compared to a weighting of 51% for the fourth quarter of 2010. the weighting has changed mainly due to the Company’s drilling program which has increased the percentage of oil production in the Company and has been one of the major factors in seeing total sales per boe increase despite lower or flat gas pricing from the comparative periods. With the acquisition of emerge closing in January 2012, we will see the oil/gas ratio increase further throughout the year.
RoYAltieS
three months ended December 31
twelve months ended December 31
$ 000’s 2011 2010 2011 2010
Royalty Breakdown
Heavy oil 5,493 2,984 21,129 9,913
light & Medium oil 1,626 1,088 5,138 3,782
natural Gas (137) 772 (527) 3,999
nGl’s 1,105 738 3,089 3,040
total Royalties 8,087 5,582 28,829 20,734
% of p&nG Sales 20% 19% 20% 20%
per Boe $11.42 $8.47 $10.37 $8.65
Royalties for the three months ended December 31, 2011 were $8.1 million, as compared to $5.6 million for the three months ended December 31, 2010. Royalties on an absolute basis increased as a result of increased production volumes and sales as a result of our drilling success and strategic acquisitions. liquids production comprised 64% of volumes for the fourth quarter 2011 as compared to 51% in 2010. As a percentage of sales, the average royalty rate for the fourth quarter of 2011 was 20% compared to 19% for the comparative period of 2010. the rate has increased as the Company’s oil weighting and oil prices have increased significantly. the Company continued to receive GCA credits in the quarter relating to current and prior period gas royalties. oil and liquids royalty rates were approximately 23% for the quarter, while gas royalties were (-3%) (which also includes prior period royalty credit adjustments) as a result of the lower realized pricing and the GCA credits.
Royalties for the twelve months ended December 31, 2011 were $28.8 million, as compared to $20.7 million for the twelve months ended December 31, 2010. Royalties on an absolute basis increased with increased production volumes as a result of drilling success. With this volume growth we have seen the liquids production move to 61% of total volumes up from 44% in 2010. As a percentage of revenues, the average royalty rate for the twelve month period ended December 31, 2011 was 20% compared to 20% for the comparative period of 2010. oil and liquids royalty rates were approximately 24% for the twelve months of 2011 while natural gas rates were approximately (-2)% of sales, due to the GCA credits, as compared to 24% and 12% respectively in 2010. With the higher oil prices compared to gas there is a higher royalty rate on liquids based production.
opeRAting & tRAnSpoRtAtion expenSeSoperating expenses were $12.0 million or $16.96 per boe for the quarter ended December 31, 2011 as compared to $9.1 million or $13.79 per boe for the three months ended December 31, 2010. the increase on an absolute dollar basis is mainly attribut-able to the increased production from our drilling program. While we have been able to keep costs down at Frog lake through initiatives summarized below we are seeing cost pressure in some of our other areas where we are less active. Increased costs in the quarter came from service rig, pump jack maintenance, trucking and vacuum trucks.

15 2 0 1 1 A n n u A l R e p o R t t W I n B u t t e e n e R G Y l t D .
operating expenses were $43.8 million or $15.75 per boe for the twelve months ended December 31, 2011 as compared to $32.7 million or $13.64 per boe for the twelve months ended December 31, 2010. the increase on an absolute dollar basis is mainly attributable to the production growth from acquisitions in 2010 and our internal drilling program.
the following operating initiatives have been implemented at the Frog lake area to assist with controlling operating costs. In April 2011, the Company commissioned for operations, a salt water disposal well that was drilled in late 2010, in order to save on 3rd party disposal fees. the Company, as part of an ongoing fuel gas system installation, also has tied in all wells drilled to the end of 2010 at Frog lake to use fuel gas produced from the field, replacing propane. Finally, specific chemicals are being added to break up emulsion for lower processing and trucking charges. these changes have facilitated our ability to keep operating costs at Frog lake below $14.25 year to date and we anticipate holding them at these levels over the balance of the year. the higher average corporate operating costs are largely reflective of a number of high operating gas properties where the Company remains focused on cost reductions.
operating & transportation expense three months ended December 31, twelve months ended December 31,
(000’s except per boe amounts) 2011 $ per boe 2010 $ per boe 2011 $ per boe 2010 $ per boe
operating expenses 12,004 16.96 9,085 13.79 43,761 15.75 32,709 13.64
transportation 1,386 1.96 1,085 1.65 5,113 1.84 3,842 1.60
total 13,390 18.92 10,170 15.44 48,874 17.59 36,551 15.24
transportation expenses for the three months ended December 31, 2011 were $1.4 million or $1.96 per boe compared to $1.1 million or $1.65 per boe in the prior year comparative quarter. the increase on an absolute basis is mainly attributable to the production growth from our drilling program, while on a boe basis the cost has increased slightly mainly due to the heavier oil weighting.
transportation expenses for the twelve months ended December 31, 2011 were $5.1 million or $1.84 per boe compared to $3.8 million or $1.60 per boe in the prior year comparative period. the increase on an absolute basis is mainly attributable to the production growth from acquisitions in 2010 and our internal drilling program, while on a boe basis the cost has increased mainly due the heavier oil weighting.
on a combined basis for the quarter we have higher operating and transportation costs of $18.92 per boe as compared to $15.44 per boe for the comparable period of 2010. this increase of 23% is due to inflationary pressures in the oil and gas sector and the higher heavy oil weighting. on a combined basis for the twelve month period we have operating and transportation costs of $17.59 per boe as compared to $15.24 per boe for the comparable period of 2010.
geneRAl And AdminiStRAtive (“g&A”) expenSeS
three months ended December 31
twelve months ended December 31
$ 000’s 2011 2010 2011 2010
G&A expenses 2,844 2,497 11,448 9,695
Recoveries (664) (723) (2,562) (1,903)
Capitalized G&A expenses (635) (545) (2,579) (2,073)
total net G&A expenses 1,545 1,229 6,307 5,719
total net G&A expenses ($/boe) $2.18 $1.87 $2.27 $2.38
General and administrative expenses, net of recoveries and capitalized G&A, were $1.5 million or $2.18 per boe for the cur-rent quarter as compared to $1.2 million or $1.87 per boe in the prior year comparative quarter. General and administrative expenses, net of recoveries and capitalized G&A, were $6.3 million or $2.27 per boe for the twelve month period ended December 31, 2011 as compared to $5.7 million or $2.38 per boe in the prior year comparative period.
While total G&A costs have increased for the year, comparatives due to the additional staff and costs of running the larger operation, on a per barrel basis we have seen a decline of 5% from $2.38 to $2.27 per boe.

16 2 0 1 1 A n n u A l R e p o R t t W I n B u t t e e n e R G Y l t D .
ShARe-BASed pAYment expenSe
Share-based payments three months ended December 31, twelve months ended December 31,
(000’s except per boe amounts) 2011 $ per boe 2010 $ per boe 2011 $ per boe 2010 $ per boe
total 459 0.65 357 0.54 1,393 0.50 867 0.36
During the three month period ended December 31, 2011, the Company expensed $0.5 million in stock based compensation as compared to $0.4 million in the three month period ended December 31, 2010.
During the twelve month period ended December 31, 2011, the Company expensed $1.4 million in stock based compensation as compared to $0.9 million in the prior year comparative period.
the Company granted 59,000 stock options in the fourth quarter of 2011 as compared to 1,990,650 stock option grants in the fourth quarter of 2010. total options forfeited were 150,000 in the quarter vs. 150,000 in the fourth quarter last year.
FinAnce expenSe
Finance expenses three months ended December 31, twelve months ended December 31,
(000’s except per boe amounts) 2011 $ per boe 2010 $ per boe 2011 $ per boe 2010 $ per boe
Accretion on decommissioning provision 277 0.39 247 0.38 1,078 0.39 971 0.40
Interest and bank charges 686 0.97 895 1.35 2,981 1.07 3,255 1.36
total 963 1.36 1,142 1.73 4,059 1.46 4,226 1.76
For the three months ended December 31, 2011, finance charges were $1.0 million as compared to $1.1 million in the three month period ended December 31, 2010. For the twelve months ended December 31, 2011, finance charges were $4.1 million as compared to $4.2 million in the same period last year. Average bank debt has been very similar for the twelve months ended December 31, 2011 compared to the year to date 2010 except for the late $20.7 million Frog lake acquisition in December 2010.
the Company’s current interest charge on bank borrowings is bank prime of 3.0% plus a margin of 0.50% for a total effective rate of 3.50% and averaged 3.94% for 2011. this compares to last year’s effective rate of 4.20%
deRivAtive ActivitieS During 2010 and 2011, the Company has entered into both fixed price swaps for natural gas and crude oil and sold forward calls on oil production and fixed/floating interest rate swap transactions. As part of our financial management strategy, twin Butte has adopted a commodity price and interest rate risk management program. the purpose of the program is to reduce volatility in the financial results and to stabilize and hedge future cash flow against the unpredictable commodity price envi-ronment, with an emphasis on protecting downside risk.
entering into derivative instruments is looked upon as a way for the Company to reduce go forward price risk by increasing the predictability of a portion of the Company’s future revenue stream. However, there are risks that our counterparty be-comes illiquid or the Company may not have the actual sales volumes to offset the hedge position. to reduce these risks the Company deals with a major Canadian bank as our counterparty on derivative instruments and limits the volumes hedged to approximately 65% or less of near term forecasted sales volumes and 50% over 1 year out.
the Company has recognized a realized loss on financial derivatives in the amount of $0.8 million ($1.16 per boe) for the three month period ended December 31, 2011 as compared to a gain of $1.7 million ($2.51 per boe) realized gain for the prior year comparative period. the realized loss on financial derivatives for the three month period ended December 31, 2011 amounted to a gain of $0.5 million for natural gas sales price derivatives, and a loss of $1.3 million for crude oil sales price derivatives.
the Company has recognized a realized gain on financial derivatives in the amount of $1.7 million ($0.61 per boe) for the twelve month period ended December 31, 2011 as compared to a $5.3 million ($2.22 per boe) realized gain for the prior year comparative period. the realized gain on financial derivatives for the twelve month period ended December 31, 2011 included a gain of $4.2 million for natural gas sales price derivatives, and a loss of $2.5 million for crude oil sales price derivatives.

17 2 0 1 1 A n n u A l R e p o R t t W I n B u t t e e n e R G Y l t D .
As at December 31, 2011, the Company has recognized a net unrealized financial derivatives liability in the amount of $4.1 million. the Company has recognized an unrealized loss on financial derivatives in the amount of $9.6 million for the three month period ended December 31, 2011 as compared to $3.7 million unrealized loss for the prior year comparative period.
Financial derivatives three months ended December 31, twelve months ended December 31,
(000’s except per boe amounts) 2011 $ per boe 2010 $ per boe 2011 $ per boe 2010 $ per boe
Realized gain (loss) (824) (1.16) 1,652 2.51 1,686 0.61 5,324 2.22
unrealized gain (loss) (9,554) (13.50) (3,698) (5.61) (1,385) (0.50) (1,462) (0.61)
Gain (loss) on derivatives (10,378) (14.66) (2,046) (3.10) 301 0.11 3,862 1.61
the Company has been able to utilize twin Butte’s oil production to enhance our natural gas price for 2011 year through the use of an enhanced swap, where we sold forward written calls on oil production for 2011 and 2012 at prices above our budgeted pricing, and use this value to enhance the swap price we have received on natural gas sales through october 2011 to well above the strip price. this increased gas price provides additional certainty to cash flow which is then recycled into an increased capital program.
the following is a summary of derivatives in effect as at December 31, 2011 and their related fair market values (unrealized gain (loss) positions):
crude oil Sales price derivatives
Daily barrel (“bbl”) quantity
Remaining term of contract
Fixed priceper bbl (CAD)
Fixed written call price
per bbl WtI
Fixed % WCS vs.
bbl (WtI)
Fair market value
$ 000’s
500 January 1, 2012 to December 31, 2012 $90.00 $ (1,969)
250 January 1, 2012 to December 31, 2012 $94.64 $ (543)
500 January 1, 2013 to December 31, 2013 $97.50 $ (106)
500 January 1, 2012 to December 31, 2012 $98.51 $ (417)
750 october 1, 2012 to December 31, 2012 $100.20 $ 10
300 January 1, 2012 to December 31, 2012 $100.45 $ (39)
500 July 1, 2012 to September 30, 2012 $101.05 $ 11
500 January 1, 2012 to June 30, 2012 $102.00 $ 82
500 January 1, 2012 to December 31, 2012 $110.55 $ 1,769
500 July 1, 2012 to December 31, 2012 $83.78 $ 5
500 July 1, 2012 to September 30, 2012 $84.00 $ (54)
250 January 1, 2012 to June 30, 2012 $89.65 $ 190
500 January 1, 2012 to March 31, 2012 83.55% $ (49)
1000 January 1, 2012 to June 30, 2012 84.75% $ (223)
500 April 1, 2012 to June 30, 2012 84.50% $ 4
1000 January 1, 2012 to December 31, 2012 uS $100.00 $ (3,123)
1000 January 1, 2013 to December 31, 2013 uS $110.00 $ (2,997)
Crude oil fair value position $ (7,449)
During the quarter the Company has entered into a differential Western Canada Select “WCS” swap to WtI on 500 bbl/d for the second quarter 2012 at 84.5%. the Company also entered 10 fixed rates swap $Cdn WtI swap on 5000 bbl/d at an average of $95.98 and sold a call on 1000 bbl/d for 2013 at $uS -$110. Subsequent to the quarter a written call of 1000 bbl/d at $110.00 to WtI and 500 bbl/d for 2012 at $102.70 Cdn. were entered into.

18 2 0 1 1 A n n u A l R e p o R t t W I n B u t t e e n e R G Y l t D .
natural gas Sales price derivatives
Daily giga-joule (“GJ”) quantity
Remaining term of contract
Fixed priceper GJ
(AeCo Daily)
Fixed call price per GJ
(AeCo Monthly)
Fair Market value
$ 000’s
6,000 January 1 to December 31, 2012 $4.30 $ 3,377
natural gas fair value position $ 3,377
Subsequent to the quarter, the Company entered into a fixed price swap on 6,000 GJ/d for 2012 at $4.12 AeCo.
gain/loss on dispositions
During the twelve months ended the Company disposed of two small properties for net cash proceeds of $11.9 million pro-ducing a gain of $2.6 million. this compares to last year’s dispositions proceeds $12.2 million and a gain of $1.5 million on those dispositions.
depletion & depReciAtion & impAiRmentDuring the year ended December 31, 2011, the Company tested all of its CGu’s for impairment. the e&e assets associated with these CGu’s were not included in this impairment test. three of the company’s 5 CGu’s were found to be impaired as a result of the current forecast natural gas prices which are currently much lower than the forecast a year ago leading to the lower estimated fair values.
the recoverable amount of the CGu’s was estimated based on its fair value less costs to sell. the estimate of fair value less costs to sell was determined using an after tax discount rate of 10 percent and forecasted cash flows. the forecasted cash flows are prepared over the estimated life of the reserves in the CGu’s. the prices used to estimate the fair value less cost to sell are those used by independent industry reserve engineers. Based on this assessment, the carrying value of three natural gas focused CGu’s was determined to be lower than its recoverable amount, and a non-cash impairment charge of $40.3 million was recognized. the other two CGu’s had cushions of $145 million at Frog lake and $7 million at West Central.
For the three month period ended December 31, 2011, depletion and depreciation of capital assets was $15.0 million or $21.20 per boe compared to $8.4 million or $12.73 per boe for the three month period ended December 31, 2010. Included in deple-tion and depreciation for the quarter is an impairment of $40.3 million relating to the Company’s petroleum and natural gas assets as a result of lower gas prices forecast at year end.
For the twelve month period ended December 31, 2011, depletion and depreciation of capital assets was $38.7 million or $15.42 per boe compared to $31.7 million or $13.22 per boe for the twelve month period ended December 31, 2010. the company performed the impairment calculations at December 31, 2011 to assess whether the carrying value of the petroleum and natural gas properties were recoverable. the write-down is a result of a significant reduction in the natural gas weighted reserves due to the lower gas prices forecasted. the following represent the prices that were used in the December 31, 2011 write down:
WtI
uS $/bblWtI
Cdn $/bbl
Alberta AeCo Average
Cdn $ mcf
2012 97.50 99.00 3.50
2013 97.50 99.00 4.20
2014 100.00 101.50 4.70
2015 100.80 102.30 5.10
2016 101.70 103.20 5.55
escalation rate thereafter 2% 2% 2%

19 2 0 1 1 A n n u A l R e p o R t t W I n B u t t e e n e R G Y l t D .
income tAxeSDeferred tax recovery amounted to $9.4 million for the three month period ended December 31, 2011 compared to $0.5 million recovery for the three month period ended December 31, 2010. this was mainly due to the unrealized derivative instru-ment loss and the impairment write-down booked in the fourth quarter.
Deferred income tax recovery amounted to $3.0 million for the twelve month period ended December 31, 2011, compared to a deferred income tax expense in the amount of $0.5 million for the twelve month period ended December 31, 2010. this was mainly due to the write-down booked in the twelve months ended December 31, 2011.
the Company has existing tax losses and pools of approximately $301 million.
FundS Flow FRom opeRAtionS, And net income (loSS) And compRehenSive income (loSS)
three months ended December 31, twelve months ended December 31,
(000’s except per share amounts) 2011 $ per share 2010 $ per share 2011 $ per share 2010 $ per share
Funds flow (1) 16,686 0.12 12,887 0.10 61,272 0.45 40,941 0.32
net Income (loss) (37,047) (0.27) (52) – (19,021) (0.14) 682 0.01
(1) Funds flow from operations and funds flow from operations netback are non-IFRS measures that represent the total and the average per boe, respectively, of cash provided by operating activities, before adjusting for changes in non-cash working capital items and expenditures on decommissioning liabilities.
Funds flow from operations for the three month period ended December 31, 2011 was $16.7 million, an increase of 29% from fourth quarter 2010 funds flow of $12.9 million. this represents $0.12 per diluted share compared to $0.10 per diluted share same quarter last year and $0.10 in the third quarter 2011. the increase in funds flow is due to the 7% increase in production to 7,695 boe/d from 7,161 boe/d, along with a 32% improvement in average commodity pricing.
even with significantly higher revenues, the Company posted a net loss and comprehensive loss of $37.0 million for the three month period ended December 31, 2011, equating to a basic and diluted net loss per share of $0.27, compared to a net loss and comprehensive loss of $0.0 million for the three month period ended December 31, 2010, equating to a basic and diluted net loss per share of $0.00. the loss is attributed to the write-down as a result of lower natural gas prices in the forecast.
Funds flow from operations for the twelve month period ended December 31, 2011 was $61.3 million, an increase of 50% from the twelve month period ended December 31, 2010 funds flow of $40.9 million. this also represents a 41% increase in funds flow per share, both basic and diluted of $0.45 per share for the twelve month period ended December 31, 2011 compared to $0.32 per share for the prior year comparative period. the significant increase in funds flow is due primarily to the 16% increase in production along with improved commodity weighting to oil and liquids.
Funds flow from operations calculation three months ended December 31, twelve months ended December 31,
($000’s) 2011 2010 2011 2010
Cash flow from operating activities 20,590 5,653 63,121 28,068
expenditures on decommissioning liability 517 230 1,067 541
less: change in non-cash working capital (4,421) 7,003 (2,916) 12,332
Funds flow from operations 16,686 12,886 61,272 40,941
the net loss and comprehensive loss of $37.0 million for the three month period ended December 31, 2011 includes non-cash items of depletion and depreciation of $51.1 million (including the write-down of $40.3 million), deferred tax recovery of $9.4 million, accretion on decommissioning provision of $0.3 million, unrealized loss on derivative instruments of $9.6 million and share-based payments of $0.5 million. the largest change from the prior year is the write down.
the net loss and comprehensive loss of $19.0 million for the twelve month period ended December 31, 2011 includes non-cash items including depletion and depreciation (including the write-down of $40.3 million) of $78.9 million, deferred tax recovery of $3.0 million, accretion on decommissioning provision of $1.1 million, unrealized loss on financial derivatives of $1.4 million, a gain of $2.6 million on sale of property, and exploration and evaluation of $3.6 million and stock based compensation expense of $1.4 million.

20 2 0 1 1 A n n u A l R e p o R t t W I n B u t t e e n e R G Y l t D .
the following table summarizes netbacks for the past nine quarters on a barrel of oil equivalent basis:
($ per boe) Q4 2011 Q3 2011 Q2 2011 Q1 2011 Q4 2010 Q3 2010 Q2 2010 Q1 2010 Q4 2009(1)
petroleum and natural gas sales 58.22 49.90 56.36 46.34 44.18 39.21 40.44 46.14 42.24
Royalties (11.42) (11.30) (9.98) (8.73) (8.47) (7.97) (8.72) (9.51) (7.27)
Realized gain (loss) on financial derivatives (1.16) 2.65 (0.24) 1.20 2.51 3.18 2.56 0.48 0.38
operating expenses (16.96) (16.25) (14.99) (14.73) (13.79) (12.93) (14.34) (13.47) (12.94)
transportation expenses (1.96) (1.90) (1.63) (1.87) (1.65) (1.58) (1.42) (1.77) (1.58)
operating netback(2) 26.72 23.10 29.52 22.21 22.78 19.91 18.52 21.87 20.83
General and administrative expenses (2.18) (2.04) (2.53) (2.33) (1.87) (2.34) (2.69) (2.72) (3.63)
Interest expense (0.97) (0.98) (1.26) (1.09) (1.36) (0.69) (1.43) (1.56) (2.52)
Funds flow from operations(3) 23.57 20.08 25.73 18.79 19.55 16.88 14.40 17.59 14.68
(1) the quarters in 2009 includes the previous GAAp results.
(2) operating netback is a non-IFRS measure calculated as the average per boe of the Company’s oil and gas sales, realized gains on derivatives, less royalties, operating and transportation expenses.
(3) Funds flow from operations is a non-IFRS measure that represents the total of funds provided by operating activities, before adjusting for changes in non-cash working capital items.
QuARteRlY FinAnciAl SummARYthe following table highlights twin Butte’s performance for each of the past nine quarters:
Q4 2011 Q3 2011 Q2 2011 Q1 2011 Q4 2010 Q3 2010 Q2 2010 Q1 2010 Q4 2009
($ thousands, except per share amounts)
previous Gaap
Average production (boe/d) 7,695 7,599 7,556 7,608 7,161 6,481 6,489 6,140 5,699
petroleum and natural gas sales 41,216 34,885 38,748 31,728 29,111 23,382 23,880 25,503 22,150
operating netback (per boe) 26.72 23.10 29.52 22.21 22.78 19.91 18.52 21.87 20.83
Funds flow from operations 16,686 14,042 17,686 12,789 12,887 10,069 8,261 9,724 7,714
per share basic & diluted 0.12 0.10 0.13 0.10 0.10 0.08 0.06 0.08 0.08
net income (loss) (37,047) 7,522 12,765 (2,262) (53) (2,249) (1,006) 3,989 (961)
per share basic (0.27) 0.05 0.10 (0.02) – (0.02) (0.01) 0.03 (0.01)
per share diluted (0.27) 0.06 0.09 (0.02) – (0.02) (0.01) 0.03 (0.01)
Corporate acquisitions – – 2,388 6 20,742 – – – 120539
Capital expenditures (net of dispositions) 9,842 22,071 17,257 5,847 12,340 11,765 5,309 5,633 (1,437)
total assets 340,664 370,472 348,790 338,478 337,685 306,658 300,118 302,632 308,640
net debt excluding financial derivatives 77,168 83,857 75,960 80,677 96,026 76,238 74,366 77,212 102,911
cApitAl expendituReSDuring the fourth quarter of 2011, the Company invested $9.8 million net on capital activity. the Company’s capital expendi-tures for the fourth quarter were focused predominantly in the heavy oil core area of Frog lake, drilling 12 (7.5 net) oil wells in that area.
the Company has drilled a total of 125 (80.9 net) wells in 2011, of which 96% (net) were oil wells, 2 were gas wells and 3 were Dry and Abandoned (D&A). During the twelve months ended December 31, 2011, the Company has invested $69.3 million on capital activity. In addition, the Company completed property dispositions for net proceeds of $11.9 million leaving net capital invested at $57.4 million.

21 2 0 1 1 A n n u A l R e p o R t t W I n B u t t e e n e R G Y l t D .
the following tables summarize capital expenditures, drilling results and undeveloped land positions for 2011 and 2010.
three months ended December 31
twelve months ended December 31
($ 000’s) 2011 2010 2011 2010
land acquisition (403) 6 339 664
Geological and geophysical 109 1,002 1,183 1,596
Drilling and completions 6,899 8,167 44,769 29,925
equipping and facilities 2,433 4,211 16,917 12,660
other 981 544 3,630 2,068
Gross Capital 10,019 13,930 66,838 46,913
property acquisitions – 20,525 2,394 20,525
property dispositions (214) (1,869) (11,865) (12,272)
total net capital expenditures 9,805 32,586 57,367 55,166
drilling Results
three months ended December 31 2011 2010
gross net Gross net
Crude oil 12 7.5 28 15.1
natural gas – – – –
Dry and abandoned – – – –
total 12 7.5 28 15.1
Success rate (%) 100% 100% 100% 100%
twelve months ended December 31 2011 2010
gross net Gross net
Crude oil 120 76.5 84 47.6
natural gas 2 1.4 2 2
Dry and abandoned 3 3 1 1
Service – – 1 0.5
total 125 80.9 88 51.1
Success rate (%) 98% 96% 98% 98%
undeveloped land
the Company’s undeveloped land holdings have been reduced by a combination of drilling, dispositions and expiries in the past 12 months.
three months ended December 31 2011 2010
Gross Acres 294,991 349,020
net Acres 213,273 253,588
liQuidit Y And cApitAl ReSouRceSthe Company evaluates its ability to carry on business as a going concern on a quarterly basis. the key indicator is whether the funds flow, which is after interest and G&A expenses, will be sufficient to cover all obligations. In addition, the Company budgets to use funds flow from operations to fund the majority of the capital program to sustain or grow production net of declines. Funds derived from cash flow and asset dispositions may be used to apply to the Company’s debt facility or fund the capital expenditure program.
In order to support the Company’s business plan, twin Butte’s strategy is to fund the majority of its capital expenditure pro-gram with funds flow from operations. In order to maintain the Company’s net debt at current or lower levels, twin Butte

22 2 0 1 1 A n n u A l R e p o R t t W I n B u t t e e n e R G Y l t D .
planned 2011 capital expenditures to equal approximately to funds flow and proceeds from non-core property dispositions, which has continued to provide the Company a significant undrawn portion on the Company’s credit facility borrowing.
As at December 31, 2011, the Company had a credit facility with a syndicate of two Canadian chartered banks in the amount of $128.0 million which was last renewed in november, 2011. the credit facility is composed of a $128.0 million demand revolving operating credit facility. the Company’s credit facility is subject to semi-annual review by the bank, with the next semi-annual credit facility review scheduled for April 2012. the facility is a borrowing base facility that is determined based on, among other things, the Company’s current reserve report, results of operations, current and forecasted commodity prices and the current economic environment.
the credit facility provides that advances may be made by way of direct advances, bankers’ acceptance, or standby letters of credit/guarantees. Direct advances bear interest at the bank’s prime lending rate plus an applicable margin. the applicable margin charged by the bank is dependent on the Company’s debt to cash flow ratio from the quarterly results two quarters earlier and was 3.44 % in the fourth quarter. the bankers’ acceptances bear interest at the applicable bankers’ acceptance rate plus a stamping fee, based on the Company’s debt to trailing cash flow ratio. the credit facility is secured by a demand debenture and a general security agreement covering all assets of the Company.
the Company’s bank indebtedness does not have a specific maturity date as it is a demand facility. this means that the lender has the ability to demand repayment of all outstanding indebtedness or a portion thereof at any time. If that were to occur the Company would be required to source alternate credit facilities or sell assets to repay the indebtedness. the Company reduces this risk by complying with the covenants of the banking syndicate and maintaining a reasonable undrawn balance on the facility. the covenants require maintaining a current ratio of not less than 1.0:1.0.
In the management of capital, the Company includes working capital and total net debt (defined as the sum of current assets and current liabilities including bank indebtedness and other liabilities less financial derivatives) in the definition of capital. the Company’s share capital is not subject to external restrictions; however, its credit facility value is based primarily on its petroleum and natural gas reserves and there are covenants twin Butte must comply with (note 9). the Company was in compliance with all of its financial covenants at December 31, 2011.
on an ongoing basis the Company will review its capital expenditures to ensure that funds flow and or access to credit facili-ties is available to fund these capital expenditures. the Company has the flexibility to adjust capital expenditures based on funds flow to manage debt levels.
At December 31, 2011, the Company had $80.2 million drawn on its credit facility and total net debt of $77.2 million. the Company has $47.8 million undrawn line on its credit facility. twin Butte has met all of its covenants pertaining to this loan agreement and was not required to make any repayments.
the Company confirms there are no off balance sheet financing arrangements.
ShARe cApitAlIn the fourth quarter of 2011 there were 10,000 options exercised for proceeds of $14,400.
In 2011, a total of 9,749,722 warrants were exercised for 6,824,838 twin Butte shares for total funds of $14.6 million and a total of 386,431 options were exercised for proceeds of $0.4 million.
As of March 22, 2012 the Company has 195,555,276 Common Shares, and 1,106,100 stock options outstanding and 4,375,865 share awards.
contRActuAl oBligAtionS And contingencieS the Company had other commitments and guarantees in the normal course of business, consisting of an office space lease and equipment rentals which are not considered material.
the Company is involved in legal claims associated with the normal course of operations. the Company has completed an assessment and has determined that a contingent liability is not required in the financial statements.

23 2 0 1 1 A n n u A l R e p o R t t W I n B u t t e e n e R G Y l t D .
RelAted pARt Y tRAnSActionSDuring the twelve month period ended December 31, 2011, the Company incurred costs totaling $5.2 million ($3.0 million – December 31, 2010) for oilfield services and legal counsel rendered by three companies in which an officer and director of twin Butte is a director. these costs were incurred in the normal course of business and have been recorded at exchange amount. As at December 31, 2011, the Company had $0.1 million ($1.1 million – December 31, 2010) included in accounts payable and accrued liabilities related to these transactions.
SuBSeQuent eventon January 9, 2012, twin Butte completed the business combination with emerge oil & Gas Inc. (“emerge”), which provides for the acquisition by twin Butte of all the issued and outstanding common shares of emerge on the basis of 0.585 common shares of twin Butte for each emerge share. the initial accounting for the business combination is incomplete as the Company is in the process of evaluating the fair value of the assets acquired under IFRS in order to prepare the purchase price equation for recognition, measurement and presentation in the Company’s financial results for the three month interim period ended March 31, 2012.
upon closing of the emerge acquisition , the Company completed an update to its bank facility with a syndicate of banks. the Company’s lenders have increased the Company’s total bank facility to $205 million. the credit facility includes a revolving line of credit of $177 million and an operating line of credit of $28 million. the applicable pricing grid associated with the updated facility remained as outlined in note 5.
crude oil Sales price derivative contract
Subsequent to December 31, 2011 the Company entered into the following crude oil and natural gas price derivatives:
Daily barrel (bbl) quantity term of contract
Fixed price per bbl (WtI)
Fixed call price per barrel (WtI)
500 January 1, 2013 to December 31, 2013 $102.70 Cdn
500 April 1, 2012 to December 31, 2012 $109.03 Cdn
500 January 1, 2013 to December 31, 2013 $106.31 Cdn
1000 January 1, 2013 to December 31, 2013 $110.00
And
Daily giga-joule (“GJ”) quantity term of contract
Fixed price per GJ(AeCo Monthly)
Fixed call price per barrel (WtI)
6,000 January 1, 2012 to December 31, 2012 $4.12
the Company also approved an initial annualized dividend of $0.18 per share on January 9, 2012. Dividends for the first quarter were also declared and will be $0.015 per share, per month, payable to shareholders of record at the end of each of January, February and March 2012. this dividend qualifies, and unless otherwise indicated all future dividends will qualify, as an “eli-gible dividend” for purposes of the Income tax Act ( Canada ) and corresponding provincial legislation.
cRiticAl Accounting eStimAteSthe preparation of financial statements in accordance with IFRS requires Management to make certain judgments and es-timates. Changes in these judgments and estimates could have a material impact on the Company’s financial results and financial condition.
Management relies on the estimate of reserves as prepared by the Company’s independent qualified reserves evaluator. the process of estimating reserves is critical to several accounting estimates and is complex and requires significant judgments and decisions based on available geological, geophysical, engineering and economic data. these estimates may change substantially as additional data from ongoing development and production activities becomes available and as economic conditions impact crude oil and natural gas prices, operating expense, royalty burden changes, and future development costs. Reserve estimates impact net income through depletion and impairment of petroleum and natural gas properties. the reserve estimates are also used to assess the borrowing base for the Company’s credit facilities. Revision or changes in the reserve estimates can have either a positive or a negative impact on net income and the borrowing base of the Company.
24 2 0 1 1 A n n u A l R e p o R t t W I n B u t t e e n e R G Y l t D .
Management’s process of determining the provision for deferred income taxes, the provision for decommissioning liability costs and related accretion expense, and the fair values assigned to any acquired assets and liabilities in a business combina-tion is based on estimates. these estimates are significant and can include proved and probable reserves, future production rates, future petroleum and natural gas prices, future costs, future interest rates, future tax rates and other relevant assump-tions. Revisions or changes in any of these estimates can have either a positive or a negative impact on asset and liability values and net income.
In accordance with IFRS, derivative assets and liabilities are recorded at their fair values at the reporting date, with gains and losses recognized directly into comprehensive income in the same period. the fair value of derivatives outstanding is an estimate based on pricing models, estimates, assumptions and market data available at that time. As such, the recognized amounts are non-cash items and the actual gains or losses realized on eventual cash settlement can vary materially due to subsequent fluctuations in commodity prices and foreign exchange rates as compared to the valuation assumptions.
the fair value of stock options is based on estimates using the Black-Scholes option pricing model and is recorded as share-based payments expense in the financial statements.
inteRnAtionAl FinAnciAl RepoRting StAndARdSCanadian publicly accountable enterprises have implemented International Financial Reporting Standards (“IFRS”) for the fiscal years beginning on or after January 1, 2011. the transition date to IFRS was January 1, 2010 and comparative figures for 2010 and twin Butte’s financial position as at January 1, 2010 have been restated to IFRS from the previous Canadian generally accepted accounting principles (“previous GAAp”). Reconciliations to IFRS from previous GAAp financial statements including the impact of the transition on the Company’s reported financial position and financial performance, including the nature and effect of significant changes in accounting policies from those used in the Company’s financial statements as at January 1, 2010 and December 31, 2010 as at and for the year ended December 31, 2010, are summarized in note 21 to the unaudited financial statements. the following discussion explains the significant differences between IFRS and the previous GAAp followed by the Company.
a) property and equipment
under previous GAAp, the Company, like many Canadian oil and gas reporting issuers, applied the “full cost” concept in ac-counting for its oil and gas assets. under full cost, capital expenditures were maintained in a single cost centre for each country, and the cost centre was subject to a single depletion and depreciation calculation and impairment test. under IFRS, the Company makes a much more detailed assessment of its oil and gas assets that impact depletion and impairment calcula-tions. Included in this assessment is an ongoing appraisal of exploration and evaluation expenditures (“e&e”). under Canadian GAAp, it was only necessary to track costs associated with unproved properties that would be excluded from depletion and depreciation calculations. under IFRS, a Company may choose to account for e&e under its previous GAAp and capitalize such costs without recording depreciation expense until the technical feasibility and commercial viability of the project is determined, at which time the costs are moved to development properties or expensed accordingly. twin Butte capitalizes e&e costs except for costs incurred before the acquisition of rights to explore in a separate asset account, and to moves these costs into property and equipment when technically feasible and commercially viable. As at transition on January 1, 2010, $26.8 million was reclassified from property, plant and equipment to exploration and evaluation assets.
under previous GAAp the Company did not recognize gains or losses on the disposal of oil and gas properties unless such dispositions would change the depletion rate by 20% or more while IFRS requires such recognition. this results in a change to the carrying value and a gain or loss on sale of property, plant and equipment.
b) depletion and depreciation
For previous GAAp purposes, the full cost method of accounting for oil and gas properties requires a single calculation of depletion and depreciation of the carrying value of pp&e based on proved reserves. However, IFRS requires an allocation of the amount recognized as pp&e to each significant identified component and each component depleted separately, utilizing an appropriate method of depletion. this component depletion of pp&e results in an increased number of calculations of depreciation expense and impacts the amount of depletion expense recognized. IFRS also permits the option of using either proved or proved and probable reserves in the depletion calculation. twin Butte has utilized proved and probable reserves to calculate depletion expense as we believe it represents a better approximation of useful life and depletion of reserves.

25 2 0 1 1 A n n u A l R e p o R t t W I n B u t t e e n e R G Y l t D .
c) impairment of Assets
under Canadian GAAp, impairment calculations are prepared according to a two-step test generally conducted at a country level and are not subsequently reversed. under IFRS, impairment testing is completed at an individual asset group or “Cash Generating unit” level (“CGu”) when indicators suggest there may be impairment. A CGu is defined as the smallest group of assets that produce independent cash flows. Impairment of assets at a CGu level use a one-step approach for testing and measuring asset impairment, with asset carrying values compared to the higher of “Value in use” and “Fair Value less Costs to Sell”. the IFRS methodology may result in the possibility of more frequent impairments in the carrying value of pp&e. However, under IFRS previous impairment losses must be reversed where circumstances change such that the previously recognized impairment has been reduced. the Company did not have an impairment January 1, 2010 or December 31, 2010. they did, however, have one December 31, 2011.
d) decommissioning liabilities
Both Canadian GAAp and IFRS require a company to provide for a liability related to decommissioning pp&e. Both methodolo-gies are similar and we have determined there to be no significant difference for twin Butte, other than a difference related to discount rates. Canadian GAAp requires that the decommissioning liability be discounted at a credit-adjusted risk-free rate while IFRS requires that the decommissioning liability be discounted at an appropriate rate with either the cash flows or rate adjusted for risks. twin Butte has selected to use the risk-free rate for discounting purposes as we believe this accurately represents a market-based rate for such a liability and at transition date the decommission liability was increased $8.7 million and charged to deficit.
e) Share based payments
under previous GAAp, the Company accounted for stock-based compensation plans on a straight-line basis over the term of the vesting period. under IFRS each tranche in an award is considered a separate grant with different vesting date and fair value. each grant is separately accounted for using applicable assumptions for those specific dates and different fair values and accounted for using graded vesting recognition of expense.
under previous GAAp, forfeitures of awards are recognized as they occur. the calculation of share-based compensation under IFRS reflects an estimate of the number of awards expected to vest, which is revised if subsequent information indicates that actual forfeitures are likely to differ from the estimate. As a result, the Company adjusted its expense for share-based awards by $0.1 million for the twelve months ending December 31, 2010 and recognized the corresponding adjustment to contributed surplus.
f) Flow-through shares
Flow-through shares are a Canadian tax incentive which is the subject of specific guidance under previous GAAp, however there is no specific guidance under IFRS. under Canadian GAAp, when flow through shares are issued they are recorded at face value. the related future tax liability is established for the tax effect of the difference between the tax basis and the book basis of the assets when renounced and is recorded as a reduction of share capital. there is no income statement effect associated with the issuance of these shares.
twin Butte has adopted a policy under IFRS where the proceeds from the offering are to be allocated between the sale of the shares and the sale of the tax benefit. the allocation is made based on the difference between the quoted market price of the existing shares and the amount an investor pays for the flow through shares. A liability is established for this difference that is reversed upon renunciation of the tax benefit. the difference between this liability and the deferred tax liability is recorded as an income tax expense. this has resulted in a re-classification between deficit and share capital at January 1, 2010 of $1.5 million.
g) deferred income taxes
Deferred income tax calculated according to IFRS is substantially similar to previous GAAp and arises from differences between the accounting and tax bases of assets and liabilities. to the extent that assets and liabilities have changed from transition to IFRS, the amount of deferred income tax liability has been impacted. Additionally, under previous GAAp deferred income tax liabilities were required to be disclosed as either current or long-term. under IFRS, all deferred income tax liabilities are considered to be noncurrent liabilities.

26 2 0 1 1 A n n u A l R e p o R t t W I n B u t t e e n e R G Y l t D .
h) First time Adoption of international Financial Reporting Standards
IFRS 1 provides the framework for the first time adoption of IFRS and specifies that an entity shall apply the principles under IFRS retrospectively. IFRS 1 also specifies that the adjustments that arise on retrospective conversion to IFRS from other GAAp should be directly recognized in retained earnings. Certain optional exemptions and mandatory exceptions to retrospective application are provided under IFRS 1. the Company has taken the following exemptions:
> Companies using full-cost accounting are allowed to measure their oil and gas assets at the amount determined under the previous GAAp at the date of transition. this amount is pro-rated to the underlying assets based upon the value of proved and probable reserves values at transition date, discounted at 10%.
> Companies using the full cost book value as deemed cost exemption are allowed to measure the liabilities for decommis-sioning, restoration and similar liabilities at the date of transition and recognize directly in deficit any difference between that amount and the carrying amount determined under previous GAAp.
> IFRS 3 Business Combinations has not been applied to acquisitions of subsidiaries or of interests in associates and joint ventures that occurred before January 1, 2010.
> IFRS 2 Share-based payment has not been applied to any equity instruments that were granted on or before november 7, 2002, nor has it been applied to equity instruments granted after november 7, 2002 that vested before January 1, 2010.
> IAS 17 leases has been applied as of transition date rather than at the lease’s inception date.
> IAS 23 Borrowing Costs will not be applied before January 1, 2010.
i) new standards and interpretations not yet adopted
Standards issued but not yet effective up to the date of issuance of the Company’s financial statements are listed below. this listing is of standards and interpretations issued which the Company reasonably expects to be applicable at a future date. the Company intends to adopt those standards when they become effective.
IFRS 9 Financial Instruments: Classification and Measurement
For financial assets, IFRS 9 uses a single approach to determine whether a financial asset is measured at amortized cost or fair value, and replaces the multiple rules in IAS 39. the approach in IFRS 9 is based on how an entity manages its financial instruments in the context of its business model and the contractual cash flow characteristics of the financial assets. the new standard also requires a single impairment method to be used, replacing the multiple impairment methods in IAS 39. For financial liabilities, although the classification criteria for financial liabilities will not change under IFRS 9, the approach to the fair value option for financial liabilities may require different accounting for changes to the fair value of a financial liability as a result of changes to an entity’s own credit risk. IFRS 9 is effective for annual periods beginning on or after January 1, 2013 with different transitional arrangements depending on the date of initial application. However, in August 2011, the IASB issued an exposure draft which proposed changing this effective date to annual periods beginning on or after January 1, 2015. the Company is monitoring the status of this exposure draft. the Company is currently evaluating the impact of adopting IFRS 9 on its Consolidated Financial Statements.
IFRS 11 - Joint Arrangements
IFRS 11 requires a venturer to classify its interest in a joint arrangement as a joint venture or joint operation. Joint ventures will be accounted for using the equity method of accounting whereas for a joint operation the venturer will recognize its share of the assets, liabilities, revenue and expenses of the joint operation. under existing IFRS, entities have the choice to propor-tionately consolidate or equity account for interests in joint ventures. IFRS 11 supersedes IAS 31, Interests in Joint Ventures, and SIC-13, Jointly Controlled entities—non-monetary Contributions by Venturers. the standard is effective for the periods beginning on or after January 1, 2013. the Company has yet to assess the full impact of IFRS 11.
IFRS 12 - Disclosure of Interest in Other Entities
IFRS 12 replaces the disclosure requirements previously included in IAS 27, IAS 31, and IAS 28 Investments in Associates. It sets out the extensive disclosure requirements relating to an entity’s interests in subsidiaries, joint arrangements, associates and unconsolidated structured entities. An entity is required to disclose information that helps users of its financial statements evaluate the nature of and risks associated with its interests in other entities and the effects of those interests on its financial

27 2 0 1 1 A n n u A l R e p o R t t W I n B u t t e e n e R G Y l t D .
statements. the standard is effective for the periods beginning on or after January 1, 2013. the Company has yet to assess the full impact of IFRS 12.
IFRS 13 - Fair Value Measurement
IFRS 13 is a comprehensive standard for fair value measurement and disclosure requirements for use across all IFRS standards. the new standard clarifies that fair value is the price that would be received to sell an asset, or paid to transfer a liability in an orderly transaction between market participants, at the measurement date. It also establishes disclosures about fair value measurement. under existing IFRS, guidance on measuring and disclosing fair value is dispersed among the specific standards requiring fair value measurements and in many cases does not reflect a clear measurement basis or consistent disclosures. the standard is effective for the periods beginning on or after January 1, 2013. the Company has yet to assess the full impact of IFRS 13.
In June 2011, the IASB issued an amendment to IAS 1 Presentation of Financial Statements requiring companies to group items presented within other Comprehensive Income based on whether they may be subsequently reclassified to profit or loss. this amendment to IAS 1 is effective for annual periods beginning on or after July 1, 2012 with full retrospective application. early adoption is permitted. the Company is currently evaluating the impact of adopting this amendment on its financial statements.
In December 2011, the IASB issued the following amended standards:
IFRS 7 Financial Instruments: Disclosures has been amended to provide more extensive quantitative disclosures for financial instruments that are offset in the statement of balance sheet or that are subject to enforceable master netting or similar ar-rangements.
IAS 32 Financial Instruments: presentation has been amended to clarify the requirements for offsetting financial assets and liabilities. the amendments clarify that the right to offset must be available on the current date and cannot be contingent on a future event. the amendments to IFRS 7 are effective for annual periods beginning on or after January 1, 2013 and the amendments to IAS 32 are effective for annual periods beginning on or after January 1, 2014, both requiring retrospective application. the Company is currently evaluating the impact of adopting the amendments to IFRS 7 and IAS 32 on its financial statements.
j) internal controls
In accordance with the Company’s approach to certification of internal controls required under Canadian Securities Administrators’ national instrument 52-109 and SoX 302 and 404, all entity level, information technology, disclosures and business process controls will require updating and testing to reflect changes arising from our conversion to IFRS. upon review, we have determined there to be minimal updating of processes, controls and documentation required.
ASSeSSment oF BuSineSS RiSkSthe following are the primary risks associated with the business of twin Butte. these risks are similar to those affecting other companies competing in the conventional oil and natural gas sector. twin Butte’s financial position and results of operations are directly impacted by these factors and include:
operational risk associated with the production of oil and natural gas:
> Reserve risk in respect to the quantity and quality of recoverable reserves;
> exploration and development risk of being able to add new reserves economically;
> Market risk relating to the availability of transportation systems to move the product to market;
> Commodity risk as crude oil and natural gas prices fluctuate due to market forces;
> Financial risk such as volatility of the Canadian/uS dollar exchange rate, interest rates and debt service obligations;
> environmental and safety risk associated with well operations and production facilities;
> Changing government regulations relating to royalty legislation, income tax laws, incentive programs, operating prac-tices and environmental protection relating to the oil and natural gas industry; and

28 2 0 1 1 A n n u A l R e p o R t t W I n B u t t e e n e R G Y l t D .
> Continued participation of twin Butte’s lenders.
twin Butte seeks to mitigate these risks by:
> Acquiring properties with established production trends to reduce technical uncertainty as well as undeveloped land with development potential;
> Maintaining a low cost structure to maximize product netbacks and reduce impact of commodity price cycles;
> Diversifying properties to mitigate individual property and well risk;
> Maintaining product mix to balance exposure to commodity prices;
> Conducting rigorous reviews of all property acquisitions;
> Monitoring pricing trends and developing a mix of contractual arrangements for the marketing of products with credit-worthy counterparties;
> Maintaining a hedging program to hedge commodity prices with creditworthy counterparties;
> Adhering to the Company’s safety program and adhering to current operating best practices;
> Keeping informed of proposed changes in regulations and laws to properly respond to and plan for the effects that these changes may have on our operations;
> Carrying industry standard insurance;
> establishing and maintaining adequate resources to fund future abandonment and site restoration costs; and
> Monitoring our joint venture partners’ obligations to us and cash calling for capital projects to limit the Company’s credit risk.
diScloSuRe contRolS And inteRnAl contRolS oveR FinAnciAl RepoRtingDisclosure controls and procedures have been designed to provide reasonable assurance that information required to be disclosed by the Company is recorded, processed, summarized and reported within the time periods specified under the Canadian securities law.
twin Butte’s Chief executive officer and Chief Financial officer have concluded, based on their evaluation, that the disclosure controls and procedures as of the end of December 31, 2011, are effective and provide reasonable assurance that material information related to the Company is made known to them by others within twin Butte.
twin Butte’s Chief executive officer and Chief Financial officer are responsible for establishing and maintaining internal con-trols over financial reporting (“ICFR”). they have, as at the year ended December 31, 2011, designed ICFR or caused it to be designed under their supervision, to provide reasonable assurance regarding the reliability of financial reporting and the preparation of financial statements for external purposes in accordance with IFRS. the control framework twin Butte’s officers used to design the ICFR is the Internal Control – Integrated Framework issued by the Committee of Sponsoring organizations.
twin Butte’s Chief executive officer and Chief Financial officer are required to disclose any change in the internal controls over financial reporting that occurred during our most recent interim period that has materially affected, or is reasonably likely to affect, the Company’s internal controls over financial reporting. no material changes in the internal controls were identified during the period ended December 31, 2011 that have materially affected, or are reasonably likely to materially affect, our internal controls over financial reporting.
It should be noted that a control system, including twin Butte’s disclosure and internal controls and procedures, no matter how well conceived or operated, can provide only reasonable, not absolute, assurance that the objectives of the control system will be met and it should not be expected that the disclosure and internal controls and procedures will prevent all errors or fraud.

29 2 0 1 1 A n n u A l R e p o R t t W I n B u t t e e n e R G Y l t D .
M a n ag e M e n t ’s R e p o R t
to the Shareholders of twin Butte energy ltd.
mAnAgement’S ReSponSiBilit Y FoR FinAnciAl StAtementSthe accompanying financial statements of twin Butte energy ltd. and all of the information in this Annual Report are the responsibility of management and have been approved by the Board of Directors.
the financial statements have been prepared by management in accordance with Canadian generally accepted accounting principles. When alternative accounting methods exist, management has chosen those methods it deems most appropriate in the circumstances. Financial statements are not precise since they include certain amounts based on estimates and judg-ments. Management has determined such amounts on a reasonable basis in order to ensure that the financial statements are presented fairly, in all material respects. the financial information contained elsewhere in this report has been reviewed to ensure consistency with the financial statements.
mAnAgement’S ASSeSSment oF inteRnAl contRolS oveR FinAnciAl RepoRtingManagement is also responsible for establishing and maintaining adequate internal control over the Company’s financial reporting. Management has established systems of internal controls, which are designed to provide reasonable assurance the Company’s assets are safeguarded from loss or unauthorized use and to produce reliable accounting records for the prepara-tion of financial information. Internal control systems, no matter how well designed have inherent limitations. therefore, even those systems that have been determined to be effective can only provide reasonable assurance with respect to financial statement preparation and presentation.
the Board of Directors is responsible for ensuring that management fulfils its responsibilities for financial reporting and in-ternal controls. It exercises its responsibilities primarily through the Audit Committee, which is comprised of independent, non-management directors. the Audit Committee has reviewed the financial statements with both management and the auditors. this has been reported to the Board of Directors which has approved the financial statements.
the financial statements have been audited by pricewaterhouseCoopers llp, the external auditors, in accordance with audit-ing standards generally accepted in Canada on behalf of the shareholders.
Jim Saunders R. Alan Steelepresident and Chief executive officer Vice-president, Finance & CFo
March 22, 2012

30 2 0 1 1 A n n u A l R e p o R t t W I n B u t t e e n e R G Y l t D .
i n d e p e n d e n t au d i t o R ’s R e p o R t
to the Shareholders of twin Butte energy ltd.:
We have audited the accompanying financial statements of twin Butte energy ltd., which comprise the balance sheets as at December 31, 2011, December 31, 2010 and January 1, 2010 and the statements of income (loss) and comprehensive income (loss), changes in shareholders’ equity, and cash flows for the years ended December 31, 2011 and 2010, and the related notes, which comprise a summary of significant accounting policies and other explanatory information.
management’s responsibility for the financial statements
Management is responsible for the preparation and fair presentation of these financial statements in accordance with International Financial Reporting Standards, and for such internal control as management determines is necessary to enable the preparation of financial statements that are free from material misstatement, whether due to fraud or error.
Auditor’s responsibility
our responsibility is to express an opinion on these financial statements based on our audits. We conducted our audits in accordance with Canadian generally accepted auditing standards. those standards require that we comply with ethical re-quirements and plan and perform the audits to obtain reasonable assurance about whether the financial statements are free from material misstatement.
An audit involves performing procedures to obtain audit evidence about the amounts and disclosures in the financial state-ments. the procedures selected depend on the auditor’s judgment, including the assessment of the risks of material mis-statement of the financial statements, whether due to fraud or error. In making those risk assessments, the auditor considers internal control relevant to the entity’s preparation and fair presentation of the financial statements in order to design audit procedures that are appropriate in the circumstances, but not for the purpose of expressing an opinion on the effectiveness of the entity’s internal control. An audit also includes evaluating the appropriateness of accounting policies used and the reasonableness of accounting estimates made by management, as well as evaluating the overall presentation of the financial statements.
We believe that the audit evidence we have obtained in our audits is sufficient and appropriate to provide a basis for our audit opinion.
opinion
In our opinion, the financial statements present fairly, in all material respects, the financial position of twin Butte energy ltd. as at December 31, 2011, December 31, 2010 and January 1, 2010 and its financial performance and its cash flows for the years ended December 31, 2011 and 2010 in accordance with International Financial Reporting Standards.
Chartered AccountantsCalgary, Alberta
March 22, 2012

31 2 0 1 1 A n n u A l R e p o R t t W I n B u t t e e n e R G Y l t D .
B a l a n c e s H e e t
(Cdn$ thousands)
As at Notedecember 31,
2011December 31,
2010 January 1,
2010
Note 21 Note 21
ASSetS
current Assets
Accounts receivable $ 31,731 $ 27,358 $ 20,759
Deposits and prepaid expenses 2,447 2,453 3,182
Derivative assets 5 5,449 3,947 –
39,627 33,758 23,941
non-current assets
Deferred taxes 16 7,514 4,494 4,582
exploration and evaluation 7 17,044 19,897 26,791
property and equipment 6,8 276,479 287,561 255,729
$ 340,664 $ 345,710 $ 311,043
liABilitieS And ShAReholdeRS’ eQuit Y
current liabilities
Accounts payable and accrued liabilities $ 31,158 $ 27,779 $ 29,713
Bank indebtedness 9 80,188 97,705 96,342
Derivative liabilities 5 6,419 3,293 1,224
117,765 128,777 127,279
non-current liabilities
other liabilities – 354 796
Derivative liabilities 5 3,102 3,340 –
Decommissioning provision 10 38,401 30,274 23,581
159,268 162,745 151,656
Shareholders’ equity
Share capital 11 227,520 211,538 189,504
Warrants 11 – 912 912
Contributed surplus 7,506 5,124 4,261
Deficit (53,630) (34,609) (35,290)
181,396 182,965 159,387
$ 340,664 $ 345,710 $ 311,043
Commitments and contingencies (note 20)
The accompanying notes are an integral part of these financial statements.
on Behalf of the Board of Directors:
Jim Saunders David FitzpatrickDirector Director
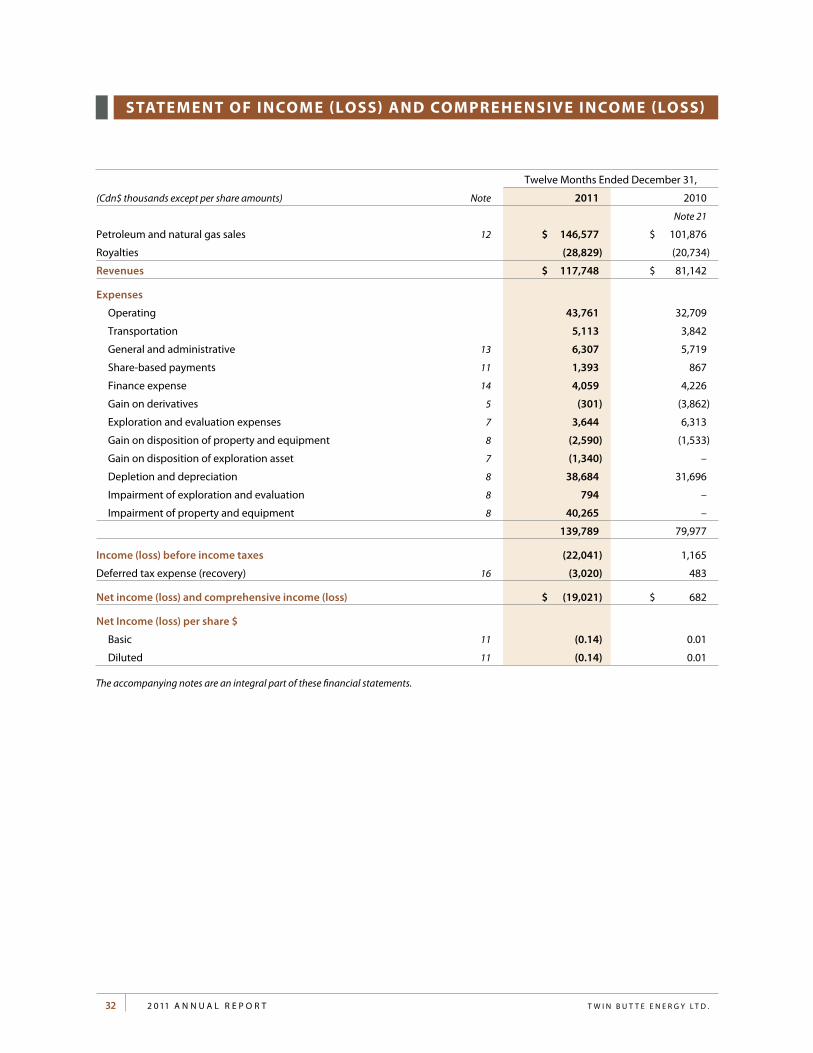
32 2 0 1 1 A n n u A l R e p o R t t W I n B u t t e e n e R G Y l t D .
state M e nt of incoM e (loss) an d coM pR e He nsive incoM e (loss)
(Cdn$ thousands except per share amounts) Note
twelve Months ended December 31,
2011 2010
Note 21
petroleum and natural gas sales 12 $ 146,577 $ 101,876
Royalties (28,829) (20,734)
Revenues $ 117,748 $ 81,142
expenses
operating 43,761 32,709
transportation 5,113 3,842
General and administrative 13 6,307 5,719
Share-based payments 11 1,393 867
Finance expense 14 4,059 4,226
Gain on derivatives 5 (301) (3,862)
exploration and evaluation expenses 7 3,644 6,313
Gain on disposition of property and equipment 8 (2,590) (1,533)
Gain on disposition of exploration asset 7 (1,340) –
Depletion and depreciation 8 38,684 31,696
Impairment of exploration and evaluation 8 794 –
Impairment of property and equipment 8 40,265 –
139,789 79,977
income (loss) before income taxes (22,041) 1,165
Deferred tax expense (recovery) 16 (3,020) 483
net income (loss) and comprehensive income (loss) $ (19,021) $ 682
net income (loss) per share $
Basic 11 (0.14) 0.01
Diluted 11 (0.14) 0.01
The accompanying notes are an integral part of these financial statements.
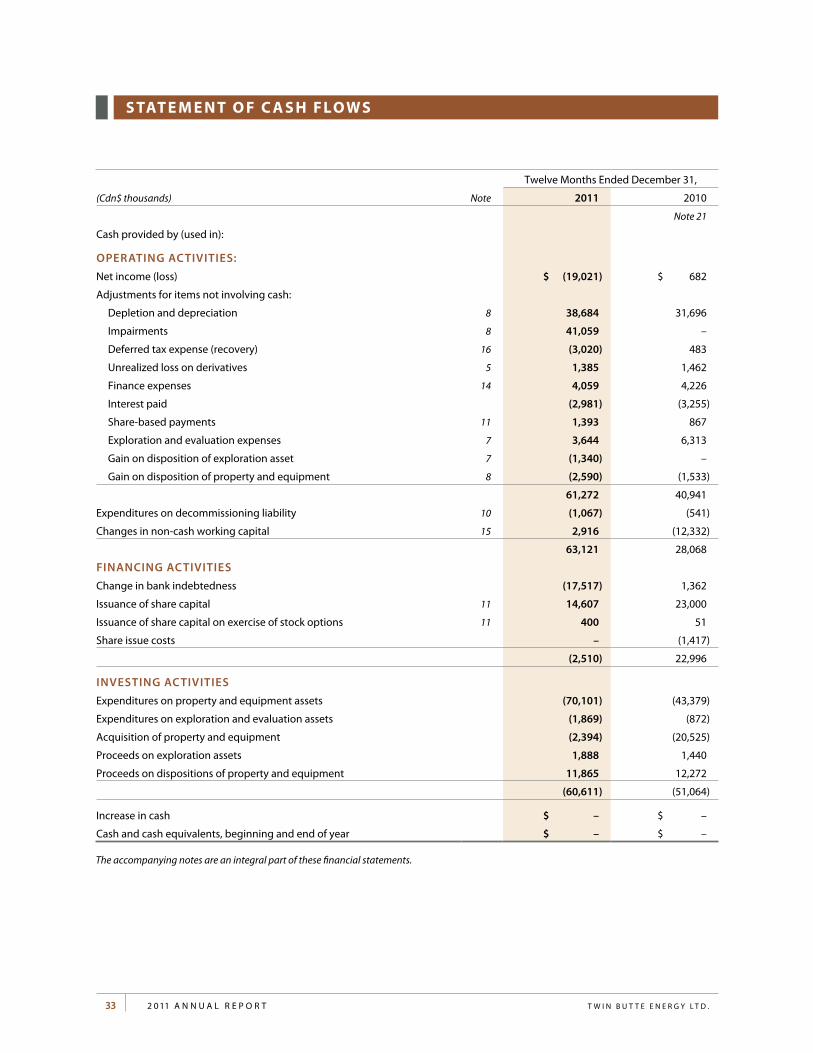
33 2 0 1 1 A n n u A l R e p o R t t W I n B u t t e e n e R G Y l t D .
s tat e M e n t o f c a s H f lo w s
(Cdn$ thousands) Note
twelve Months ended December 31,
2011 2010
Note 21
Cash provided by (used in):
opeRAting ActivitieS:
net income (loss) $ (19,021) $ 682
Adjustments for items not involving cash:
Depletion and depreciation 8 38,684 31,696
Impairments 8 41,059 –
Deferred tax expense (recovery) 16 (3,020) 483
unrealized loss on derivatives 5 1,385 1,462
Finance expenses 14 4,059 4,226
Interest paid (2,981) (3,255)
Share-based payments 11 1,393 867
exploration and evaluation expenses 7 3,644 6,313
Gain on disposition of exploration asset 7 (1,340) –
Gain on disposition of property and equipment 8 (2,590) (1,533)
61,272 40,941
expenditures on decommissioning liability 10 (1,067) (541)
Changes in non-cash working capital 15 2,916 (12,332)
63,121 28,068
FinAncing ActivitieS
Change in bank indebtedness (17,517) 1,362
Issuance of share capital 11 14,607 23,000
Issuance of share capital on exercise of stock options 11 400 51
Share issue costs – (1,417)
(2,510) 22,996
inveSting ActivitieS
expenditures on property and equipment assets (70,101) (43,379)
expenditures on exploration and evaluation assets (1,869) (872)
Acquisition of property and equipment (2,394) (20,525)
proceeds on exploration assets 1,888 1,440
proceeds on dispositions of property and equipment 11,865 12,272
(60,611) (51,064)
Increase in cash $ – $ –
Cash and cash equivalents, beginning and end of year $ – $ –
The accompanying notes are an integral part of these financial statements.

34 2 0 1 1 A n n u A l R e p o R t t W I n B u t t e e n e R G Y l t D .
s tat e M e n t o f c H a n g e s i n s H a R e H o l d e R s’ e q u i t y
twelve Months ended December 31,
(Cdn$ thousands) 2011 2010
Note 21
Share capital
Balance, beginning of year $ 211,538 $ 189,504
Common shares issued under bought deal financing – 23,000
Share issue costs – (1,023)
Common shares issued under option plan 568 57
Warrants exercised 15,414 –
Balance, end of year $ 227,520 $ 211,538
warrants
Balance, beginning of year $ 912 $ 912
Warrants expired (105) –
Warrants exercised (807) –
Balance, end of year $ – $ 912
contributed surplus
Balance, beginning of year $ 5,124 $ 4,261
Share-based payments for options exercised (168) (101)
Warrants expired 105 –
Share-based payments for options granted 2,445 964
Balance, end of year $ 7,506 $ 5,124
deficit
Balance, beginning of year $ (34,609) $ (35,290)
net income (loss) & comprehensive income (loss) (19,021) 682
Balance, end of year $ (53,630) $ (34,609)
The accompanying notes are an integral part of these financial statements.

35 2 0 1 1 A n n u A l R e p o R t t W I n B u t t e e n e R G Y l t D .
n o t e s t o f i n a n c i a l s tat e M e n t s
For the years ended December 31, 2011 and 2010
All tabular amounts are in thousands of Canadian dollars except as otherwise indicated
note 1. BuSineSS And StRuctuRe oF t win But te
twin Butte energy ltd. (“twin Butte” or “the Company”) is a growth oriented junior oil and natural gas exploration, development and production Company with properties located in Western Canada. twin Butte is domiciled and incorporated in Canada under the Business Corporation’s Act (Alberta). twin Butte’s head office address is 410, 396 – 11th Avenue SW, Calgary, Alberta, Canada. the Company’s primary listing is on the toronto Stock exchange under the symbol (tBe).
note 2. BASiS oF pRepARAtion
(a) Basis of preparation and adoption of iFRS
the Company prepares its financial statements in accordance with Canadian generally accepted accounting principles as set out in the Handbook of the Canadian Institute of Chartered Accountants (“CICA Handbook”). In 2010, the CICA Handbook was revised to incorporate International Financial Reporting Standards, and require publicly accountable enterprises to apply such standards effective for years beginning on or after January 1, 2011. Accordingly, these are the Company’s first annual statements prepared in accordance with IFRS. In the financial statements, the term “previous GAAp” refers to Canadian GAAp before the adoption of IFRS.
these financial statements have been prepared in compliance with IFRS. Subject to certain transition elections disclosed in note 21, the Company has consistently applied the accounting policies used in preparation of its opening IFRS Balance Sheet at January 1, 2010 and throughout all periods presented, as if these policies had always been in effect. note 21 discloses the impact of the transition to IFRS on the Company’s reported financial position, financial performance and cash flows, including the nature and effect of significant changes in accounting policies from those used in the Company’s financial statements for the year ended December 31, 2010 prepared under Canadian GAAp.
these financial statements were prepared under IFRS issued and outstanding as of March 22, 2012, the date the financial statements were authorized for issue by the Board of Directors.
(b) Basis of measurement
the financial statements have been prepared under the historical cost convention, except as disclosed in the significant accounting policies in note 3.
(c) Functional and presentation currency
these financial statements are presented in Canadian dollars, which is the Company’s functional currency.
note 3. SigniFicAnt Accounting policieS
the accounting policies set out below have been applied consistently to all years presented in these financial statements, and have been applied consistently by the Company, excluding optional exemptions taken by the Company on transition to IFRS (note 21). the significant accounting policies used in the preparation of these financial statements are as follows:
(a) cash and cash equivalents
Cash consists of balances held with banks, and other short-term highly liquid investments with original maturities of three months or less from inception.

36 2 0 1 1 A n n u A l R e p o R t t W I n B u t t e e n e R G Y l t D .
(b) Foreign currency translation
Monetary assets and liabilities denominated in foreign currencies are translated at exchange rates in effect at the balance sheet date. Gains and or losses on these items are included in the statement of income (loss).
(c) Financial instruments
Financial assets and liabilities are recognized when the Company becomes a party to the contractual provisions of the instrument. Financial assets are derecognized when the rights to receive cash flows from the assets have been expired or have been transferred and the Company has transferred substantially all risks and rewards of ownership. Financial liabilities are derecognized when the obligation specified in the contract is discharged, cancelled or expires.
All financial instruments are initially recognized at fair value on the balance sheet. Measurement of financial instruments subsequent to the initial recognition, as well as resulting gains and losses, are based on how each financial instrument was initially classified. the Company has classified each identified financial instrument into the following categories: fair value through profit or loss, loans and receivables, held-to-maturity investments, available for sale financial assets, and financial liabilities at amortized cost. Fair value through profit or loss financial instruments are measured at fair value with gains and losses recognized in income immediately. Available for sale financial assets are measured at fair value with gains and losses, other than impairment losses, recognized in other comprehensive income and transferred to income when the asset is derecognized. loans and receivables, held-to-maturity investments and financial liabilities at amortized cost are recognized at amortized cost using the effective interest method and impairment losses are recorded in income when incurred.
Derivative instruments executed by the Company to manage market risk associated with volatile commodity prices are classified as held for trading within fair value through profit or loss and recorded on the balance sheet at fair value as derivative assets and liabilities. Gains and losses on these derivative instruments are recorded as gains and losses on derivatives in the statement of income (loss) in the period they occur.
Gains and losses on derivative instruments are comprised of cash receipts and payments associated with periodic settlement that occurs over the life of the instrument, and non-cash gains and losses associated with changes in the fair values of the instruments, which are remeasured at each reporting date and recorded on the balance sheet. transaction costs attributed to the acquisition or issue of a derivative instrument are expensed immediately. For other financial instruments, transaction costs are added to the fair value initially recognized for a financial asset or liability.
(d) Share capital
equity instruments issued by the Company are recorded at the proceeds received, with direct issue costs as a deduction there from, net of any associated tax benefit.
(e) Jointly controlled assets
A significant portion of the Company’s oil and natural gas activities involve jointly controlled assets. the financial statements include the Company’s share of these jointly controlled assets and a proportionate share of the relevant revenue and related costs.
(f) property and equipment and exploration and evaluation assets
(i) Exploration and evaluation (E&E) expenditures
pre-license costs are recognized in the statement of income (loss) as incurred. All exploratory costs incurred subsequent to acquiring the right to explore for oil and natural gas and before technical feasibility and commercial viability of the area have been established are capitalized as e & e assets. Such costs can typically include costs to acquire land rights in areas with no proved or probable reserves assigned, geological and geophysical costs, and exploration wells.
exploration and evaluation costs initially are capitalized as either tangible or intangible according to the nature of the assets acquired. the costs are accumulated in areas by well, field or exploration area pending determination of technical feasibility and commercial viability.

37 2 0 1 1 A n n u A l R e p o R t t W I n B u t t e e n e R G Y l t D .
exploration and evaluation assets are not depreciated, and are assessed for impairment if facts and circumstances suggest that the carrying amount exceeds the recoverable amount. For purposes of impairment testing, exploration and evaluation assets are allocated to cash-generating units.
the technical feasibility and commercial viability of extracting a mineral resource from exploration and evaluation assets is considered when proved and probable reserves are determined to exist. A review of each exploration license or field is carried out, at least annually, to ascertain whether proved and probable reserves have been discovered. upon determination of proved and probable reserves, exploration and evaluation assets attributable to those reserves are first tested for impairment and then reclassified from exploration and evaluation assets to development and production assets within property and equipment. If the well or exploration project did not encounter potentially economic oil and gas quantities, the unrecoverable costs are expensed and reported in exploration and evaluation expense in the period incurred.
(ii) Development and production expenditures
Items of property and equipment, which include petroleum and natural gas development and production assets, are measured at cost less accumulated depletion and depreciation and accumulated impairment losses. Costs include e&e expenditures incurred in finding commercial reserves transferred from e&e assets, drilling and completion, production facilities, decommissioning costs, geological and geophysical costs and directly attributable costs related to development and production activities, net of any government incentive programs, and for qualifying assets, borrowing costs the purchase price or construction cost is the aggregate amount paid and the fair value of any other consideration given to acquire the asset.
When significant parts of an item of property and equipment, including oil and natural gas properties, have different useful lives, they are accounted for as separate items (major components). Gains and losses on disposal of an item of property and equipment, including oil and natural gas properties and e&e assets, are determined by comparing the proceeds from disposal with the carrying amount of property and equipment and are recognized within the statement of income (loss).
(iii) Subsequent costs
Costs incurred subsequent to commencement of production that are significant are recognized as oil and gas assets only when they increase the future economic benefits embodied in the specific asset to which they relate. Such capitalized oil and natural gas interests generally represent costs incurred in developing proved and probable reserves and bringing in or enhancing production from such reserves, and are accumulated on a field or area basis. the carrying amount of any replaced or sold component is derecognized. the costs of the day-to-day servicing of property and equipment are recognized in income as incurred.
(iv) Depletion and depreciation
the net carrying value of oil and gas properties is depleted using the unit of production method by reference to the ratio of production in the period to the related proved and probable reserves, taking into account estimated future development costs necessary to bring those reserves into production. Future development costs are estimated taking into account the level of development required to produce the reserves. these estimates are reviewed by independent reserve engineers at least annually. Major development projects are not depleted until production commences.
the Company records furniture and equipment at cost and provides depreciation on the declining balance method at a rate of 20% per annum which is designed to amortize the cost of the assets over their estimated useful lives. the Company records leasehold improvements at cost and provides depreciation on the straight-line method over the term of the lease. leased assets are depreciated over the shorter of the lease term and their useful lives. Depreciation methods, useful lives and residual values are reviewed at each financial year end, and, if necessary, changes in useful lives are accounted for prospectively.

38 2 0 1 1 A n n u A l R e p o R t t W I n B u t t e e n e R G Y l t D .
(g) Asset swaps
exchanges of development and production assets are measured at fair value unless the exchange transaction lacks commercial substance or the fair value of neither the asset received nor the asset given up is reliably measurable. the cost of the acquired asset is measured at the fair value of the asset given up, unless the fair value of the asset received is more clearly evident. Where fair value is not used, the cost of the acquired asset is measured at the carrying amount of the amount given up. Any gain or loss on derecognition of the asset given up is recognized in statement of income (loss). For exchanges or parts of exchanges that involve only exploration and evaluation assets, the exchange is accounted for at carrying value.
(h) leased assets
leases in which a significant portion of the risks and rewards of ownership are retained by the lessor are classified as operating leases. payments made under the operating leases are charged to income on a straight-line basis over the period of the lease.
(i) impairment
(i) Financial assets
A financial asset is assessed at each reporting date to determine whether there is any objective evidence that it is impaired. A financial asset is considered to be impaired if objective evidence indicates that one or more events have had a negative effect on the estimated future cash flows of that asset. An impairment loss in respect of a financial asset measured at amortized cost is calculated as the difference between its carrying amount and the present value of the estimated future cash flows discounted at the original effective interest rate. Individually significant financial assets are tested for impairment on an individual basis. the remaining financial assets are assessed collectively in groups that share similar credit risk characteristics. All impairment losses are recognized in income in the period incurred. An impairment loss is reversed if the reversal can be related objectively to an event occurring after the impairment loss was recognized. For financial assets measured at amortized cost the reversal is recognized in the statement of income (loss).
(ii) Non-financial assets
the carrying amounts of the Company’s non-financial assets are reviewed at each reporting date to determine whether there is any indication of impairment. If any such indication exists, then the asset’s recoverable amount is estimated. exploration and evaluation assets are assessed for impairment when they are reclassified to property and equipment, as oil and natural gas interests, and also if facts and circumstances suggest that the carrying amount exceeds the recoverable amount.
For the purpose of impairment testing, assets are grouped together into the smallest group of assets that generates cash inflows from continuing use that are largely independent of the cash inflows of other assets or groups of assets (the “cash-generating unit” or “CGu”). the recoverable amount of an asset or a CGu is the greater of its value in use and its fair value less costs to sell.
In assessing value in use, the estimated future cash flows are discounted to their present value using a pre-tax discount rate that reflects current market assessments of the time value of money and the risks specific to the asset. Value in use is generally computed by reference to the present value of the future cash flows expected to be derived from production of proved and probable reserves. Fair value less cost to sell is assessed utilizing market valuation based on an arm’s length transaction between active participants. In the absence of any such transactions, fair value less cost to sell is estimated by discounting the expected after-tax cash flows of the cash generating unit at an after-tax discount rate that reflects the risk of the properties in the cash generating unit. the discounted cash flow calculation is then increased by a tax-shield calculation, which is an estimate of the amount that a prospective buyer of the cash generating unit would be entitled. the carrying value of the cash generating unit is reduced by the deferred tax liability associated with its property and equipment.
An impairment loss is recognized if the carrying amount of an asset or its CGu exceeds its estimated recoverable amount. Impairment losses recognized in prior years are assessed at each reporting date for any indications that the loss has decreased or no longer exists. An impairment loss is reversed if there has been objective change in the estimates used to determine the recoverable amount. An impairment loss is reversed only to the extent

39 2 0 1 1 A n n u A l R e p o R t t W I n B u t t e e n e R G Y l t D .
that the asset’s carrying amount does not exceed the carrying amount that would have been determined, net of depreciation or depletion, if no impairment loss had been recognized.
(j) Share based payments
the Company’s compensation program currently consists of three primary components: (i) annual base salary (ii) discretionary short-term incentive cash bonus; (iii) and periodic grants of long-term incentives in the form of stock options (‘equity-settled transactions’). Awards of options are made from time to time to participants at varying levels consistent with the individual’s position and level of responsibility.
the Company follows the fair value method of valuing stock option grants. under this method, compensation costs attributable to share options granted to employees, officers and directors of the Company are measured at fair value at the date of grant and expensed over the vesting period with a corresponding increase to contributed surplus. In determining the fair value of the options granted, the Black-Scholes model is used and assumptions regarding interest rates, underlying volatility and expected life of the options are made.
A forfeiture rate is estimated on the grant date and is adjusted to reflect the actual number of options that vest. upon the exercise of the stock options, consideration paid together with the amount in contributed surplus is recorded as an increase to share capital.
(k) decommissioning provision
A decommissioning liability is recognized if, as a result of a past event, the Company has a present legal or constructive obligation that can be estimated reliably, and it is probable that an outflow of economic benefits will be required to settle the obligation. Decommissioning liabilities are determined by discounting the expected future cash flows at a risk-free rate. A corresponding asset equal to the initial estimated liability is capitalized as part of the long-lived asset. the increase in the provision due to the passage of time is recognized as a finance cost in the statement of income (loss). Actual expenditures incurred are charged against the accumulated liability. Revisions to the estimated amount and timing of the obligations are reflected as increases or decreases to the decommissioning liability.
(l) Revenue
Revenue from the sale of oil and natural gas is recorded when the significant risks and rewards of ownership of the product is transferred to the buyer, which is usually when legal title passes to the external party, sales prices and costs can be reasonably measured, and it is probable that future economic benefits will flow to the entity. For natural gas, this is generally at the time product enters the pipeline. For crude oil, this is generally at the time the product reaches a trucking terminal or pipeline. For natural gas liquids, this is generally at the time the product is processed through a gas plant. Revenue is measured net of discounts, customs duties and royalties.
Royalty income is recognized as it accrues in accordance with the terms of the overriding royalty agreements.
(m) Finance expense
Finance expense comprises interest expense on borrowings and accretion of the discount on the decommissioning provision.
(n) Borrowing costs
Borrowing costs incurred for the construction of qualifying assets are capitalized during the period of time that is required to complete and prepare the assets for their intended use or sale. the Company considers a qualifying asset to be any significant construction project expected to take more than twelve months to complete. the capitalization rate used to determine the amount of borrowing costs to be capitalized is the weighted average interest rate applicable to the Company’s outstanding general and specific borrowings during the period.
(o) income tax
Income tax expense comprises current and deferred income tax. Income tax expense is recognized in the statement of income (loss) except to the extent that it relates to items recognized directly in shareholders’ equity.
Current income tax is the expected tax payable on the taxable income for the year, using tax rates enacted or substantively enacted at the reporting date, and any adjustment to income tax payable in respect of previous years.

40 2 0 1 1 A n n u A l R e p o R t t W I n B u t t e e n e R G Y l t D .
Deferred income tax is recognized using the liability method, providing for temporary differences between the carrying amounts of assets and liabilities for financial reporting purposes and the amounts used for taxation purposes. Deferred income tax is not recognized on the initial recognition of assets or liabilities in a transaction that is not a business combination, and at the time of the transaction, affects neither accounting income nor taxable income. Deferred income tax is measured at the tax rates that are expected to be applied to temporary differences when they reverse, based on the laws that have been enacted or substantively enacted by the reporting date.
A deferred income tax asset is recognized to the extent that it is probable that future taxable profits will be available against which the temporary difference can be utilized. Deferred income tax assets are reviewed at each reporting date and are reduced to the extent that it is no longer probable that the related tax benefit will be realized. Deferred income tax assets and liabilities are only offset when they arise within the same tax jurisdiction. Deferred income tax assets and liabilities are presented as non-current.
(p) net income (loss) per share
Basic net income (loss) per share is calculated by dividing the net income (loss) of the Company by the weighted average number of common shares outstanding during the period. Diluted net income (loss) per share is determined by adjusting the net income (loss) attributable to common shareholders and the weighted average number of common shares outstanding for the effects of dilutive instruments such as options granted to employees. the treasury stock method is used to determine the dilutive effect of stock options and other dilutive instruments. the treasury stock method assumes that proceeds received from the exercise of in-the-money stock options are used to repurchase common shares at the average market price.
(q) dividends
Dividends are accrued when declared by the Board of Directors.
(r) Business combinations and goodwill
Business combinations are accounted for using the acquisition method of accounting in which the identifiable assets acquired, liabilities assumed and any non-controlling interest are recognized and measured at their fair value at the date of acquisition. Any excess of the purchase price plus any non-controlling interest over the fair value of the net assets acquired is recognized as goodwill. Any deficiency of the purchase price over the fair value of the net assets acquired is credited to net income.
At acquisition, goodwill is allocated to each of the CGus to which it relates. Subsequent measurement of goodwill is at cost less any accumulated impairment losses.
(s) new standards and interpretations not yet adopted
Standards issued but not yet effective up to the date of issuance of the Company’s financial statements are listed below. this listing is of standards and interpretations issued which the Company reasonably expects to be applicable at a future date. the Company intends to adopt those standards when they become effective.
(i) IFRS 9 Financial Instruments: Classification and Measurement uses a single approach to determine whether a financial asset is measured at amortized cost or fair value, and replaces the multiple rules in IAS 39. the approach in IFRS 9 is based on how an entity manages its financial instruments in the context of its business model and the contractual cash flow characteristics of the financial assets. the new standard also requires a single impairment method to be used, replacing the multiple impairment methods in IAS 39. For financial liabilities, although the classification criteria for financial liabilities will not change under IFRS 9, the approach to the fair value option for financial liabilities may require different accounting for changes to the fair value of a financial liability as a result of changes to an entity’s own credit risk. IFRS 9 is effective for annual periods beginning on or after January 1, 2015 with different transitional arrangements depending on the date of initial application. the Company is currently evaluating the impact of adopting IFRS 9 on its financial statements.
(ii) IFRS 10 Consolidated Financial Statements replaces IAS 27 Consolidated and Separate Financial Statements and SIC 12 Consolidation – Special purpose entities. IFRS 10 revises the definition of control and focuses on the need to have power and variable returns for control to be present. IFRS 10 provides guidance on participating and protective rights and also addresses the notion of “de facto” control. It also includes guidance related to an

41 2 0 1 1 A n n u A l R e p o R t t W I n B u t t e e n e R G Y l t D .
investor with decision making rights to determine if it is acting as a principal or agent. the standard is effective for the periods beginning on or after January 1, 2013. the Company has yet to assess the full impact of IFRS 10.
(iii) IFRS 11 Joint Arrangements requires a venturer to classify its interest in a joint arrangement as a joint venture or joint operation. Joint ventures will be accounted for using the equity method of accounting whereas for a joint operation the venturer will recognize its share of the assets, liabilities, revenue and expenses of the joint operation. under existing IFRS, entities have the choice to proportionately consolidate or equity account for interests in joint ventures. IFRS 11 supersedes IAS 31 Interests in Joint Ventures, and SIC-13 Jointly Controlled entities—non-monetary Contributions by Venturers. the standard is effective for the periods beginning on or after January 1, 2013. the Company has yet to assess the full impact of IFRS 11.
(iv) IFRS 12 Disclosure of Interest in Other Entities replaces the disclosure requirements previously included in IAS 27, IAS 31, and IAS 28 Investments in Associates. It sets out the extensive disclosure requirements relating to an entity’s interests in subsidiaries, joint arrangements, associates and unconsolidated structured entities. An entity is required to disclose information that helps users of its financial statements evaluate the nature of and risks associated with its interests in other entities and the effects of those interests on its financial statements. the standard is effective for the periods beginning on or after January 1, 2013. the Company has yet to assess the full impact of IFRS 12.
(v) IFRS 13 Fair Value Measurement is a comprehensive standard for fair value measurement and disclosure requirements for use across all IFRS standards. the new standard clarifies that fair value is the price that would be received to sell an asset, or paid to transfer a liability in an orderly transaction between market participants, at the measurement date. It also establishes disclosures about fair value measurement. under existing IFRS, guidance on measuring and disclosing fair value is dispersed among the specific standards requiring fair value measurements and in many cases does not reflect a clear measurement basis or consistent disclosures. the standard is effective for the periods beginning on or after January 1, 2013. the Company has yet to assess the full impact of IFRS 13.
(vi) In June 2011, the IASB issued an amendment to IAS 1 Presentation of Financial Statements requiring companies to group items presented within other Comprehensive Income based on whether they may be subsequently reclassified to profit or loss. this amendment to IAS 1 is effective for annual periods beginning on or after July 1, 2012 with full retrospective application. early adoption is permitted. the Company is currently evaluating the impact of adopting this amendment on its financial statements.
(vii) In December 2011, the IASB issued the following amended standards:
IFRS 7 Financial Instruments: Disclosures has been amended to provide more extensive quantitative disclosures for financial instruments that are offset in the statement of balance sheet or that are subject to enforceable master netting or similar arrangements.
IAS 32 Financial Instruments: presentation has been amended to clarify the requirements for offsetting financial assets and liabilities. the amendments clarify that the right to offset must be available on the current date and cannot be contingent on a future event. the amendments to IFRS 7 are effective for annual periods beginning on or after January 1, 2013 and the amendments to IAS 32 are effective for annual periods beginning on or after January 1, 2014, both requiring retrospective application. the Company is currently evaluating the impact of adopting the amendments to IFRS 7 and IAS 32 on its financial statements.

42 2 0 1 1 A n n u A l R e p o R t t W I n B u t t e e n e R G Y l t D .
note 4. SigniFicAnt Accounting JudgmentS, eStimAteS And ASSumptionS
the preparation of financial statements in conformity with IFRS requires management to make judgments, estimates and assumptions that affect the application of accounting policies and the reported amounts of assets, liabilities, income and expenses. Actual results may differ from these estimates, and differences could be material. estimates and underlying assumptions are reviewed on an ongoing basis. Revisions to accounting estimates are recognized in the year in which the estimates are revised and in any future years affected.
estimates and assumptions
Information about significant areas of estimation uncertainty in applying accounting policies that have the most significant effect on the amounts recognized in the financial statements is included in the following notes:
• Note 5 – valuation of financial instruments;
• Note 8 – valuation of property and equipment;
• Note 10 – measurement of decommissioning provision; and
• Note 11 – measurement of share-based compensation.
Judgements
In the process of applying the Company’s accounting policies, management has made the following judgements, apart from those involving estimates, which may have the most significant effect on the amounts recognized in the financial statements.
(a) exploration and evaluation assets
the decision to transfer assets from exploration and evaluation to property and equipment is based on the estimated proved and probable reserves used in the determination of an area’s technical feasibility and commercial viability (note 7).
(b) Reserves base
the oil and gas development and production properties are depreciated on a unit of production (“uop”) basis at a rate calculated by reference to proved and probable reserves determined in accordance with national Instrument 51-101 “Standards of Disclosure for oil and Gas Activities” and incorporate the estimated future cost of developing and extracting those reserves. proved plus probable reserves are determined using estimates of oil and natural gas in place, recovery factors and future prices. Future development costs are estimated using assumptions as to number of wells required to produce the reserves, the cost of such wells and associated production facilities and other capital costs (note 8).
proved and probable reserves are estimated using independent reserve engineer reports and represent the estimated quantities of oil, natural gas and natural gas liquids which geological, geophysical and engineering data demonstrate with a specified degree of certainty to be recoverable in future years from known reservoirs and which are considered commercially producible. proved reserves are those reserves that can be estimated with a high degree of certainty to be recoverable. It is highly likely that the actual remaining quantities recovered will exceed the estimated proved reserves. probable reserves are those additional reserves that are less certain to be recovered than proved reserves. It is equally likely that the actual remaining quantities recovered will be greater or less than the sum of the estimated proved and probable reserves.
(c) depletion of oil and gas assets
oil and gas properties are depleted using the uop method over proved plus probable reserves. the calculation of the uop rate of depletion could be impacted to the extent that actual production in the future is different from current forecast production based on proved plus probable reserves. this would generally result from significant changes in any of the factors or assumptions used in estimating reserves (note 8).
(d) determination of cash generating units
oil and gas properties are grouped into cash generating units for purposes of impairment testing. Management has evaluated the oil and gas properties of the Company, and grouped the properties into cash generating units on the

43 2 0 1 1 A n n u A l R e p o R t t W I n B u t t e e n e R G Y l t D .
basis of their ability to generate independent cash inflows, similar reserve characteristics, geographical location, and shared infrastructure (note 8).
(e) impairment indicators and calculation of impairment
At each reporting date, twin Butte assesses whether or not there are circumstances that indicate a possibility that the carrying values of exploration and evaluation assets and property and equipment are not recoverable, or impaired. Such circumstances include incidents of deterioration of commodity prices, changes in the regulatory environment, or a reduction in estimates of proved and probable reserves. When management judges that circumstances clearly indicate impairment, property and equipment and exploration and evaluation assets are tested for impairment by comparing the carrying values to their recoverable amounts. the recoverable amounts of cash generating units are determined based on the higher of value in use calculations and fair values less costs to sell. these calculations require the use of estimates and assumptions that are subject to changes as new information becomes available including information on future commodity prices, expected production volumes, quantity of reserves, discount rates, as well as future development and operating costs (note 8).
(f) decommissioning provision
Decommissioning costs will be incurred by the Company at the end of the operating life of the Company’s facilities and properties. the ultimate decommissioning liability is uncertain and can vary in response to many factors including changes to relevant legal requirements, the emergence of new restoration techniques, experience at other production sites, or changes in the risk-free discount rate. the expected timing and amount of expenditure can also change in response to changes in reserves or changes in laws and regulations or their interpretation. As a result, there could be significant adjustments to the provisions established which would affect future financial results (note 10).
(g) income taxes
the Company recognizes deferred income tax assets to the extent that it is probable that taxable profit will be available to allow the benefit of that deferred income tax asset to be utilized (note 15). Assessing the recoverability of deferred income tax assets requires the Company to make significant estimates related to expectations of future taxable income. estimates of future taxable income are based on forecast cash flows from operations and the application of existing tax laws. to the extent that future cash flows and taxable income differ significantly from estimates, the ability of the Company to realize the deferred income tax assets recorded at the reporting date could be impacted. Additionally, future changes in tax laws in the jurisdictions in which the Company operates could limit the ability of the Company to obtain tax deductions in future periods (note 16).
(h) contingencies
By their nature, contingencies will only be resolved when one or more future events occur or fail to occur. the assessment of contingencies inherently involves the exercise of significant judgment and estimates of the outcome of future events (note 19).

44 2 0 1 1 A n n u A l R e p o R t t W I n B u t t e e n e R G Y l t D .
note 5. FinAnciAl inStRumentS
Financial instruments of the Company include accounts receivables, deposits, accounts payable and accrued liabilities, bank indebtedness, other liabilities and derivative assets and liabilities. As at December 31, 2011, there were no significant differences between the carrying amounts reported on the Balance Sheet and the estimated fair values of these financial instruments due to the short terms to maturity and the floating interest rate on the bank indebtedness, excluding derivatives which are recorded at fair value.
As at december 31, 2011 As at December 31, 2010
carryingAmount
estimatedFair value
Carrying Amount
estimatedFair Value
Financial Assets
Held for trading
Derivative assets $ 5,449 $ 5,449 $ 3,947 $ 3,947
loans and receivables
Accounts receivable 31,731 31,731 27,358 27,358
Deposits 961 961 1,372 1,372
Financial liabilities
Held for trading
Derivative liabilities $ 9,521 $ 9,521 $ 6,633 $ 6,633
Financial liabilities at amortized cost
Accounts payable and accrued liabilities 31,158 31,158 27,779 27,779
Bank indebtedness 80,188 80,188 97,705 97,705
other liabilities – – 354 354
Fair value is determined following a three level hierarchy:
Level 1: Quoted prices in active markets for identical assets and liabilities. the Company does not have any financial assets or liabilities that require level 1 inputs.
Level 2: Inputs other than quoted prices included within level 1 that are observable, either directly or indirectly. Such inputs can be corroborated with other observable inputs for substantially the complete term of the contract. twin Butte uses level 2 inputs in the determination of the fair value of derivative assets and liabilities.
Level 3: under this level, fair value is determined using inputs that are not observable. twin Butte has no assets or liabilities that use level 3 inputs.
twin Butte has an established strategy to manage the risk associated with changes in commodity prices by entering into derivatives, which are recorded at fair value as derivative assets and liabilities with gains and losses recognized through the statement of income (loss). As the fair value of the contracts varies with commodity prices, they give rise to financial assets and liabilities. the fair values of the derivatives are determined by a level 2 valuation model, where pricing inputs other than quoted prices in an active market are used. these pricing inputs include quoted forward prices for commodities, foreign exchange rates, volatility and discounting, all of which can be observed or corroborated in the marketplace. the actual gains and losses realized on eventual cash settlement can vary materially due to subsequent fluctuations in commodity prices and foreign exchange rates as compared to the valuation assumptions. the Company’s activities expose it to a variety of financial risks that arise as a result of its exploration, development, production, and financing activities such as:
• credit risk;
• liquidity risk;
• price and currency risk; and
• interest rate risk.

45 2 0 1 1 A n n u A l R e p o R t t W I n B u t t e e n e R G Y l t D .
(a) credit risk
Credit risk is the risk of financial loss to the Company if a customer or counterparty to a financial instrument fails to meet its contractual obligations, and arises principally from the Company’s receivables from joint venture partners and oil and natural gas marketers. the maximum exposure to credit risk is as follows:
dec 31, 2011 Dec 31, 2010 Jan 1, 2010
Accounts receivable $ 31,731 $ 27,358 $ 20,759
Deposits 961 1,372 2,305
Derivative assets 5,449 3,947 –
$ 38,141 $ 32,677 $ 23,064
Accounts receivable, deposits, and derivative assets are subject to credit risk exposure and the carrying values reflect management’s assessment of the associated maximum exposure to such credit risk. twin Butte mitigates such credit risk by closely monitoring significant counterparties and dealing with a broad selection of partners that diversify risk within the sector. the Company’s deposits are primarily due from the Alberta provincial government and are viewed by Management as having minimal associated credit risk. to the extent that twin Butte enters derivatives to manage commodity price risk, it may be subject to credit risk associated with counterparties with which it contracts. the Company only enters into derivative contracts with major national banks to mitigate associated credit risk.
Substantially all of the Company’s accounts receivables are due from customers and joint operation partners concentrated in the Canadian oil and gas industry. As such, accounts receivables are subject to normal industry credit risks. the Company generally extends unsecured credit to these customers and therefore, the collection of accounts receivable may be affected by changes in economic or other conditions. Management believes the risk is mitigated by entering into transactions with long-standing, reputable, counterparties and partners. Wherever possible, the Company requires cash calls from its partners on capital projects before they commence. Receivables related to the sale of the Company’s petroleum and natural gas production are mainly from major marketing companies who have very good credit ratings. these revenues are normally collected on the 25th day of the month following delivery. As at December 31, 2011, $4.1 million or 12.7% of accounts receivables are outstanding for 90 days or more (December 31, 2010 – $3.4 million or 13% of accounts receivables). the Company believes that the entire net balance is collectible, and in some instances we have the ability to mitigate risk through withholding production or offsetting payables with the same parties. Management has provided for an allowance for doubtful accounts of $0.4 million at December 31, 2011 (December 31, 2010 – $0.4 million).
(b) liquidity risk
the Company is subject to liquidity risk attributed from accounts payable and other accrued liabilities, bank indebtedness, other liabilities, and derivative liabilities. Accounts payable and other accrued liabilities, and derivative liabilities are primarily due within one year of the balance sheet date and twin Butte does not anticipate any problems in satisfying the obligations from cash provided by operating activities and the existing credit facility. the Company’s bank indebtedness is subject to a $128 million credit facility agreement. Although the credit facility is a source of liquidity risk, the facility also mitigates liquidity risk by enabling twin Butte to manage interim cash flow fluctuations.
the demand revolving credit facility contains standard commercial covenants for facilities of this nature. the only financial covenant is a requirement for twin Butte to maintain a current ratio of not less than 1.0:1.0, and such ratio is to be tested at the end of each fiscal quarter. Current ratio is defined as the ratio of (i) current assets, excluding financial derivatives, plus any undrawn availability under the credit facility to (ii) current liabilities, excluding financial derivatives and the drawn portion of the credit facility. the Company is in compliance with its financial covenants.
the Company’s bank indebtedness does not have specific maturity dates. It is governed by a credit facility agreement with a syndicate of financial institutions (note 9). under the terms of the agreement, the facility is reviewed semi-annually, with the next review scheduled in April 2012. the new bank line has subsequently been extended and increased for the emerge acquisition to $205 million (note 22).
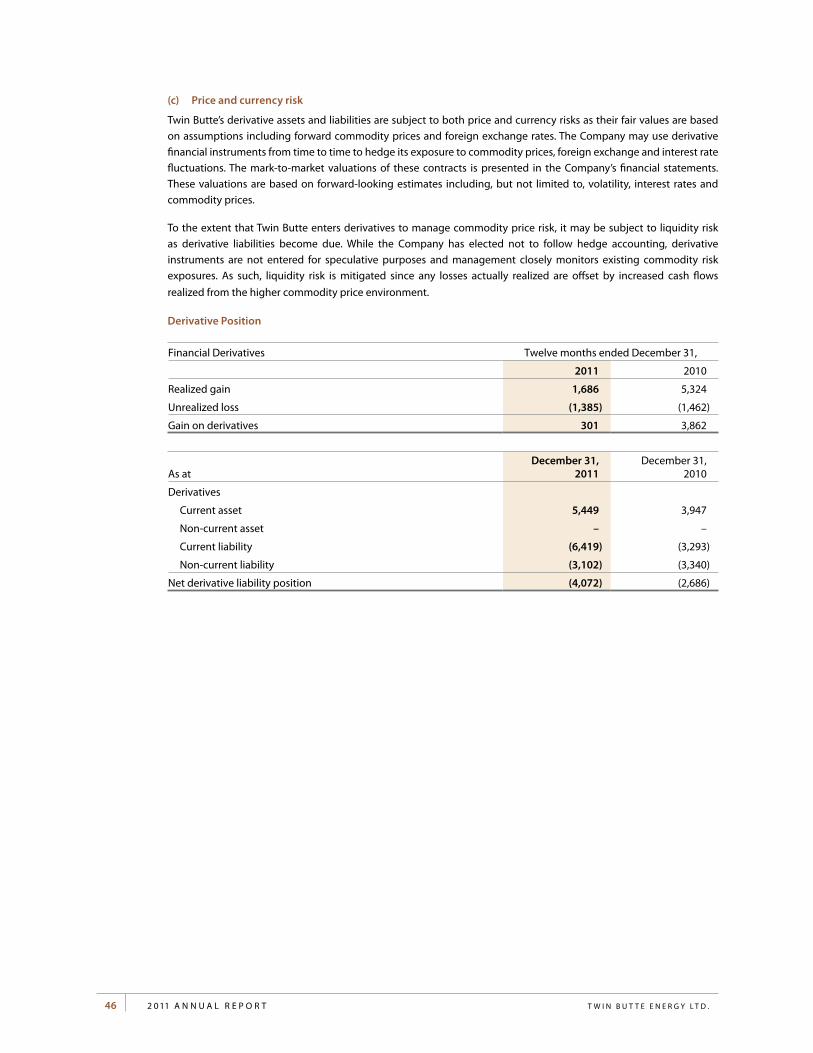
46 2 0 1 1 A n n u A l R e p o R t t W I n B u t t e e n e R G Y l t D .
(c) price and currency risk
twin Butte’s derivative assets and liabilities are subject to both price and currency risks as their fair values are based on assumptions including forward commodity prices and foreign exchange rates. the Company may use derivative financial instruments from time to time to hedge its exposure to commodity prices, foreign exchange and interest rate fluctuations. the mark-to-market valuations of these contracts is presented in the Company’s financial statements. these valuations are based on forward-looking estimates including, but not limited to, volatility, interest rates and commodity prices.
to the extent that twin Butte enters derivatives to manage commodity price risk, it may be subject to liquidity risk as derivative liabilities become due. While the Company has elected not to follow hedge accounting, derivative instruments are not entered for speculative purposes and management closely monitors existing commodity risk exposures. As such, liquidity risk is mitigated since any losses actually realized are offset by increased cash flows
realized from the higher commodity price environment.
derivative position
Financial Derivatives twelve months ended December 31,
2011 2010
Realized gain 1,686 5,324
unrealized loss (1,385) (1,462)
Gain on derivatives 301 3,862
As atdecember 31,
2011December 31,
2010
Derivatives
Current asset 5,449 3,947
non-current asset – –
Current liability (6,419) (3,293)
non-current liability (3,102) (3,340)
net derivative liability position (4,072) (2,686)

47 2 0 1 1 A n n u A l R e p o R t t W I n B u t t e e n e R G Y l t D .
crude oil Sales price derivatives
Daily barrel (“bbl”) quantity
Remaining term of contract
Fixed priceper bbl (CAD)
Fixed written call price
per bbl WtIFixed % WCS
vs. bbl (WtI)Fair market
value $ 000’s
500January 1, 2012 to December 31, 2012 $90.00 $ (1,969)
250January 1, 2012 to December 31, 2012 $94.64 $ (543)
500January 1, 2013 to December 31, 2013 $97.50 $ (106)
500January 1, 2012 to December 31, 2012 $98.51 $ (417)
750october 1, 2012 to December 31, 2012 $100.20 $ 10
300January 1, 2012 to December 31, 2012 $100.45 $ (39)
500July 1, 2012 to September 30, 2012 $101.05 $ 11
500January 1, 2012 to June 30, 2012 $102.00 $ 82
500January 1, 2012 to December 31, 2012 $110.55 $ 1,769
500July 1, 2012 to December 31, 2012 $83.78 $ 5
500July 1, 2012 to September 30, 2012 $84.00 $ (54)
250January 1, 2012 to June 30, 2012 $89.65 $ 190
500January 1, 2012 to March 31, 2012 83.55% $ (49)
1000January 1, 2012 to June 30, 2012 83.3% $ (223)
500April 1, 2012 to June 30, 2012 84.50% $ 4
1000January 1, 2012 to December 31, 2012 uS $100.00 $ (3,123)
1000January 1, 2013 to December 31, 2013 uS $110.00 $ (2,997)
Crude oil fair value position $ (7,449)
natural gas Sales price derivatives
Daily giga-joule (“GJ”)quantity Remaining term of contract
Fixed written call price per GJ(AeCo Monthly)
Fair Market value $ 000’s
6,000 January 1 to December 31, 2012 $ 4.30 $ 3,377
natural gas fair value position $ 3,377
twin Butte monitors and, when appropriate, utilizes financial derivative contracts or physical delivery contracts to manage the risk associated with changes in commodity prices. the use of derivative instruments is governed under formal policies and is subject to limits established by the Board of Directors of twin Butte. under the Company’s risk management policy, financial derivatives are not to be used for speculative purposes.
When assessing the potential impact of oil price changes on the financial derivative contracts outstanding as at December 31, 2011, a 10% increase would increase the unrealized loss at December 31, 2011 by $16.9 million, while a 10% decrease would decrease the unrealized loss at December 31, 2011 by $15.8 million.

48 2 0 1 1 A n n u A l R e p o R t t W I n B u t t e e n e R G Y l t D .
When assessing the potential impact of natural gas price changes on the financial derivative contracts outstanding as at December 31, 2011, a 10% increase would decrease the unrealized gain at December 31, 2011 by $0.6 million, while a 10% decrease would increase the unrealized gain at December 31, 2011 by $0.6 million
(d) interest rate risk
Interest rate risk is the risk that future cash flows will fluctuate as a result of changes in market interest rates. the interest charged on the outstanding bank indebtedness fluctuates with the interest rates posted by the lenders. the Company is exposed to interest rate risk and has not entered into any mitigating interest rate hedges or swaps. Had the borrowing rate been 100 basis points higher throughout the year ended December 31, 2011, net income would have decreased by $0.6 million (December 31, 2010 – $0.6 million) based on the average debt balance outstanding during the period.
(e) capital management
the Company’s objective when managing capital is to maintain a flexible capital structure which will allow it to execute on its capital investment program, which includes investing in oil and gas activities which may or may not be success-ful. therefore the Company continually strives to balance the proportion of debt and equity in its capital structure to take into account the level of risk being incurred in its capital expenditures. the Company manages its capital structure and makes adjustments relative to changes in economic conditions and the Company’s risk profile. In order to main-tain the capital structure, the Company may from time to time issue shares and adjust its capital spending to manage current and projected debt levels. the Company monitors its bank debt level and working capital in order to assess capital and operating efficiency.
In the management of capital, the Company includes working capital and total net debt (defined as the sum of current assets and current liabilities including bank indebtedness and other liabilities less financial derivatives) in the definition of capital. the Company’s share capital is not subject to external restrictions; however, its credit facility value is based primarily on its petroleum and natural gas reserves and there are covenants twin Butte must comply with (note 9). the Company strives to maintain a debt to equity level below 0.50. the Company was in compliance with all of its financial covenants at each reporting period.
dec. 31,2011 Dec 31, 2010 Jan 1, 2010
Bank indebtedness 80,188 97,705 96,342
Working capital deficit (1) (3,020) (1,678) 6,569
net debt 77,168 96,027 102,911
Shareholders’ equity 181,396 182,965 159,387
net Debt to equity 0.43 0.52 0.65
1) Working capital deficit is a non-IFRS measure that includes accounts receivables, deposits and prepaid expenses, accounts payable, accrued liabilities, and other liabilities.
As at December 31, 2011 the Company still had $47.8 million undrawn on its credit facility of $128.0 million. the work-ing capital surplus of $3.0 million and bank debt of $80.2 million, resulted in $77.2 million of net debt (December 31, 2010 – $96.0 million).
the credit facility is subject to a borrowing base review performed on a periodic basis by the banking syndicate, based primarily on reserves and using commodity prices estimated by the lenders, as well as other factors. In november 2011, the revolving credit facility was maintained at $128.0 million. A de crease to the borrowing base could lead to a reduction in the credit facility which may require repayment to the lend ers. With the completion of the emerge acquisition on January 9, 2012, the revolving credit facility was increased to $205.0 million (note 22). the next semi-annual borrowing base review is scheduled for April 2012.
the Company manages its capital structure and makes adjustments by continually monitoring its business conditions, including: the current economic conditions; the risk characteristics of the underlying assets; the depth of its investment opportunities, forecasted investment levels; the past efficiencies of our investments; the efficiencies of the forecasted investments and the desired pace of investment; current and forecasted total debt levels; current and forecasted
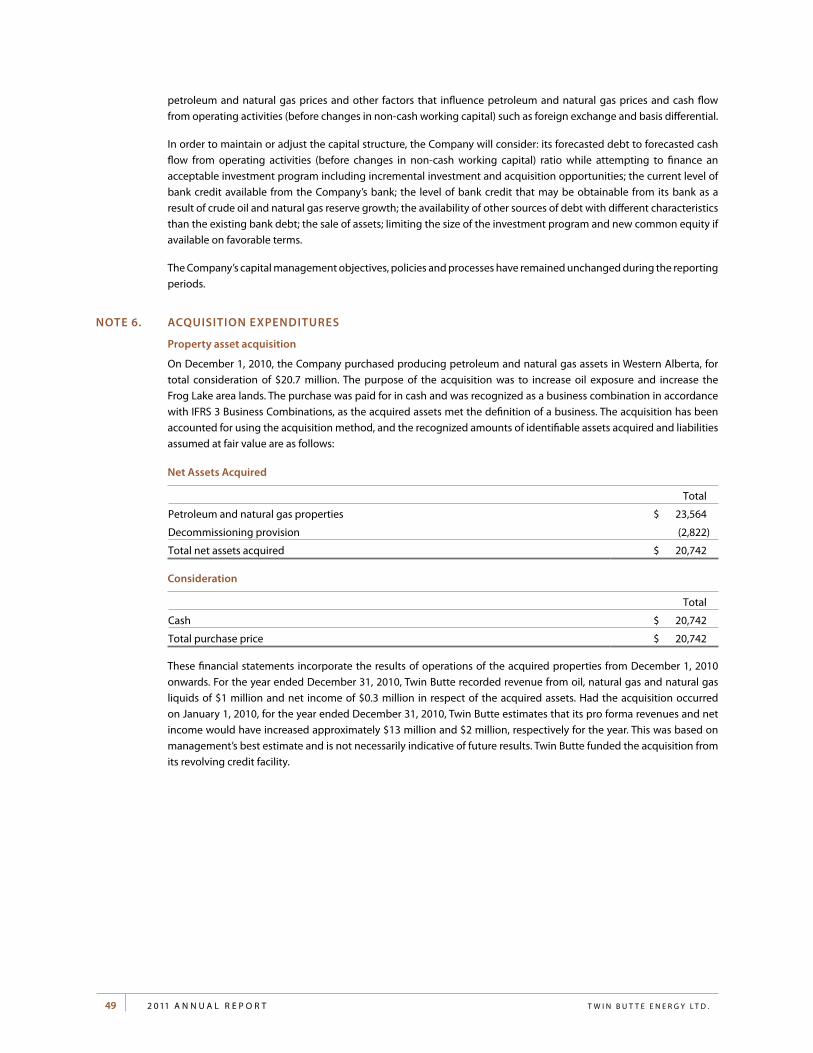
49 2 0 1 1 A n n u A l R e p o R t t W I n B u t t e e n e R G Y l t D .
petroleum and natural gas prices and other factors that influence petroleum and natural gas prices and cash flow from operating activities (before changes in non-cash working capital) such as foreign exchange and basis differential.
In order to maintain or adjust the capital structure, the Company will consider: its forecasted debt to forecasted cash flow from operating activities (before changes in non-cash working capital) ratio while attempting to finance an acceptable investment program including incremental investment and acquisition opportunities; the current level of bank credit available from the Company’s bank; the level of bank credit that may be obtainable from its bank as a result of crude oil and natural gas reserve growth; the availability of other sources of debt with different characteristics than the existing bank debt; the sale of assets; limiting the size of the investment program and new common equity if available on favorable terms.
the Company’s capital management objectives, policies and processes have remained unchanged during the reporting periods.
note 6. AcQuiSition expendituReS
property asset acquisition
on December 1, 2010, the Company purchased producing petroleum and natural gas assets in Western Alberta, for total consideration of $20.7 million. the purpose of the acquisition was to increase oil exposure and increase the Frog lake area lands. the purchase was paid for in cash and was recognized as a business combination in accordance with IFRS 3 Business Combinations, as the acquired assets met the definition of a business. the acquisition has been accounted for using the acquisition method, and the recognized amounts of identifiable assets acquired and liabilities assumed at fair value are as follows:
net Assets Acquired
total
petroleum and natural gas properties $ 23,564
Decommissioning provision (2,822)
total net assets acquired $ 20,742
consideration
total
Cash $ 20,742
total purchase price $ 20,742
these financial statements incorporate the results of operations of the acquired properties from December 1, 2010 onwards. For the year ended December 31, 2010, twin Butte recorded revenue from oil, natural gas and natural gas liquids of $1 million and net income of $0.3 million in respect of the acquired assets. Had the acquisition occurred on January 1, 2010, for the year ended December 31, 2010, twin Butte estimates that its pro forma revenues and net income would have increased approximately $13 million and $2 million, respectively for the year. this was based on management’s best estimate and is not necessarily indicative of future results. twin Butte funded the acquisition from its revolving credit facility.

50 2 0 1 1 A n n u A l R e p o R t t W I n B u t t e e n e R G Y l t D .
note 7. exploRAtion And evAluAtion ASSetS
Balance at January 1, 2010 26,791
Acquisitions 872
transferred to property, plant and equipment (55)
Dispositions (1,440)
exploration and evaluation expense – land expiries (6,271)
Balance at December 31, 2010 19,897
Acquisitions and dispositions 1,869
transferred to property, plant and equipment (39)
Impairment (794)
Dispositions (547)
exploration and evaluation expense – land expiries (3,342)
Balance at december 31, 2011 17,044
exploration and evaluation assets consist of the Company’s land and exploration projects which are pending the determination of technical feasibility. there were indicators of impairment of e&e assets at the end of 2011 for $0.8 million for land expiring in early 2012 (nil – 2010).
note 8. pRopeRt Y And eQuipment
Cost:oil & gas
propertiesoffice
equipment total
Balance at January 1, 2010 255,658 219 255,877
Additions 72,185 – 72,185
transfers from evaluation assets (note 7) 55 55
Changes in decommissioning provision 2,083 – 2,083
Disposals (10,739) – (10,739)
Balance at December 31, 2010 319,242 219 319,461
Additions 66,592 – 66,592
Acquisitions 2,394 – 2,394
Changes in decommissioning provision 8,117 – 8,117
transfers from evaluation assets (note 7) 39 – 39
Disposals (9,275) – (9,275)
Balance at december 31, 2011 387,109 219 387,328
Accumulated depletion, depreciation and impairment losses:
Balance at January 1, 2010 – 148 148
Depletion and depreciation for the period 31,695 57 31,752
Balance at December 31, 2010 31,695 205 31,900
Depletion and depreciation for the period 38,670 14 38,684
Impairment for the period 40,265 40,265
Balance at december 31, 2011 110,630 219 110,849
carrying value
January 1, 2010 255,658 71 255,729
December 31, 2010 287,547 14 287,561
december 31, 2011 276,479 – 276,479
During the year ended December 31, 2011, due to the low natural gas prices as reflected in the forward strip with respect to the Alberta producing region, the Company tested its CGu’s for impairment. three of the company’s five CGu’s were found to be impaired. All three CGu’s have very similar economics and are dependant on the price of gas.

51 2 0 1 1 A n n u A l R e p o R t t W I n B u t t e e n e R G Y l t D .
the pincher Creek CGu in the South West corner of the province had an impairment of $15.1 million. the plains CGu in the east central side of the province is a shallow oil & gas Viking formation that was impaired $16.7 million. lastly, the Deep Basin CGu located in north West Alberta was impaired $8.5 million.
the recoverable amount of the CGu’s was estimated based on its fair value less costs to sell. the estimate of fair value less costs to sell was determined using an after tax future net forecasted cash flows discount rate of 10 percent (December 31, 3010 – 10 percent). this discount rate is derived from the post-tax weighted average cost of capital for twin Butte’s peer group. the forecasted cash flows are prepared over the estimated life of the reserves in the CGu’s. the prices used to estimate the fair value less cost to sell are those used by independent industry reserve engineers. Based on this assessment, the carrying value of the three natural gas focused CGu’s were determined to be lower than the recoverable amounts, and a non-cash impairment charge of $40.3 million was recognized. the following table outlines forecasted commodity prices and exchange rates used in twin Butte’s CGu impairment tests at December 31, 2011.
WtI uS $/bbl
WtICdn $/bbl
Alberta AeCo Average
Cdn $ mcf
2012 97.50 99.00 3.50
2013 97.50 99.00 4.20
2014 100.00 101.50 4.70
2015 100.80 102.30 5.10
2016 101.70 103.20 5.55
escalation rate thereafter 2% 2% 2%
the following table indicates the change to the impairment of the property, plant and equipment with a 1% percent change to the discount rate:
2011
1% rate increase 1% rate decrease
Discount rate 9,900 (11,352)
the Company has capitalized $2.6 million of general and administrative expenses directly related to exploration and development activities for the year ended December 31, 2011 ($2.1 million – December 31, 2010). $1.1 million was capitalized for stock based compensation in 2011 (nil in 2010)
Future development costs on proved plus probable undeveloped reserves of $153.1 million as at December 31, 2011 are included in the calculation of depletion ($157.0 million – December 31, 2010).
During the year ended December 31, 2011, twin Butte completed the sale of a combination of non-core properties in Alberta for net proceeds of $11.9 million ($12.3 million – December 31, 2010). A $2.6 million gain was recognized on these transactions ($1.5 million gain – December 31, 2010)
note 9. BAnk indeBtedneSS
As at December 31, 2011, the Company had a $128 million demand revolving credit facility with a syndicate of two Canadian chartered banks. the credit facility provides that advances may be made by way of direct advances, bankers’ acceptances, or standby letters of credit/guarantees. Interest rates on the demand revolving operating credit facility fluctuate based on the revised pricing grid and range from bank prime plus 0.50% to bank prime plus 2.5%, depending upon the Company’s prior quarter debt to cash flow ratio of between less than one times to greater than three times. A debt to cash flow ratio of less than one times has interest payable at the bank’s prime lending rate plus 0.50%. A debt to cash flow ratio greater than three times has interest payable at the bank’s prime lending rate plus 2.5%. the credit facility is secured by a demand debenture and a general security agreement covering all assets of the Company. the bank currently charges prime plus 0.5%. the effective rate for the year ended December 31, 2011 was 3.5% (4.2% – 2010).

52 2 0 1 1 A n n u A l R e p o R t t W I n B u t t e e n e R G Y l t D .
the facility is a borrowing base facility that is determined based on, among other things, the Company’s current reserve report, results of operations, current and forecasted commodity prices and the current economic environment. the Company’s credit facility was reviewed and approved in november 2011. the Company’s next semi-annual credit facility review is scheduled for April 2012.
note 10. decommiSSioning pRoviSion
Decommissioning obligations are based on the Company’s net ownership in wells and facilities, and management’s best estimate of future costs to abandon and reclaim those wells and facilities as well as an estimate of the future timing of the costs to be incurred.
the Company has estimated the present value of its total decommissioning provision to be $38.4 million at December 31, 2011 ($30.3 – December 31, 2010 and $23.6 million – January 1, 2010), based on a total future liability of $41.7 million ($38.2 – December 31, 2010 and $32.8 million January 1, 2010). payments to settle the obligations occur over the operating lives of the underlying assets, estimated to be from 2 to 19 years with the majority of the costs to be incurred after 2018. A risk free rate of 2.5% was used (3.5% December 31, 2010 and 4% – January 1, 2010), and a consistent inflation rate of 2% was used to calculate the present value of the decommissioning provision.
Most of these obligations are not expected to be paid for several years, or decades, and will be funded from general resources at that time.
Changes to the decommissioning provision are as follows:
Year endeddec 31, 2011
Year endedDec 31, 2010
Decommissioning provision, beginning of year $ 30,274 $ 23,581
liabilities incurred 2,442 1,775
liabilities settled (1,067) (541)
Acquisitions 276 2,962
Dispositions (1,263) (833)
effect of the change in risk free rate 5,365 2,053
Revisions in estimated cash outflows 1,296 305
Accretion of decommissioning provision 1,078 971
Decommissioning provision, end of year $ 38,401 $ 30,274
Sensitivities
Changes to the risk-free rate or the inflation rate would have the following impact on the decommissioning liabilities:
2011 2010
As at Risk-free rate inflation rate Risk-free rate Inflation rate
one percent increase (5,365) 7,023 (3,884) 4,978
one percent decrease 7,062 (5,434) 4,951 (3,969)

53 2 0 1 1 A n n u A l R e p o R t t W I n B u t t e e n e R G Y l t D .
note 11. ShAReholdeRS’ eQuit Y
Authorized
the Company has authorized an unlimited number of voting Common Shares and an unlimited number of preferred Shares without nominal or par value.
number of Common Shares
(000’s)
Sharecapital
$
Balance at January 1, 2010 109,715 189,504
Common shares issued under bought deal financing 18,400 23,000
Share issue costs, net of tax – (1,023)
Common shares issued under option plan 83 57
Balance at December 31, 2010 128,198 211,538
Warrants exercised 6,825 15,414
Common shares issued under option plan 396 568
Balance at december 31, 2011 135,419 227,520
twelve months ended December 31,
2011 2010
Warrants
Balance, beginning of year $ 912 $ 912
Warrants expired (105) –
Warrants exercised (807) –
Balance, end of year $ – $ 912
During the year 2011, a total of 9,749,722 warrants were exercised for a total of 6,824,838 twin Butte shares at $2.14 per share for total cash consideration of $14.6 million. 1,250,228 warrants were not exercised and expired on May 10, 2011 (nil – December 31, 2010).
For the year ended December 31, 2011, 396,431 options were exercised for proceeds of $0.4 million
on February 2, 2010 the Company closed a bought deal equity financing of 18,400,000 Common Shares at a price of $1.25 per share, for gross proceeds of $23.0 million ($21.6 million net of issue costs).
Stock options and Share-based payments
the Company has a stock option plan under which options to purchase Common Shares may be granted to officers, directors, employees and consultants. the Board has approved a policy of reserving up to 10% of the outstanding Common Shares for issuance to eligible participants. the reserved amount is 13,541,894 (12,819,767 – December 31, 2010). As at December 31, 2011 there were 10,027,636 (8,560,817 – December 31, 2010) Common Shares reserved for issuance under the plan. All options awarded have a maximum term of five years and vest in equal one-third increments on each anniversary of the grant.
Stock options are measured at fair value on the date of the grant using a Black-Scholes option pricing model, and the resulting share-based payment expense is recognized on a graded-vesting basis over the related vesting period. twin Butte recorded share-based payment expense of $1.4 million for the twelve months ended December 31, 2011 (twelve months ended December 31, 2010 – $0.9 million). A 45% forfeiture rate was used to estimate the Company’s share-based payment expense for the twelve months ended December 31, 2011 (December 31, 2010: 50%).

54 2 0 1 1 A n n u A l R e p o R t t W I n B u t t e e n e R G Y l t D .
the following table sets forth a reconciliation of stock option plan activity through to December 31, 2011:
number of optionsWeighted Average
exercise price
outstanding at January 1, 2010 4,020,000 $ 0.94
Granted 5,921,150 1.54
exercised (83,333) 0.62
Forfeited (1,297,000) 1.18
outstanding at December 31, 2010 8,560,817 $ 1.33
Granted 2,609,500 2.45
exercised (396,431) 1.01
Forfeited (746,250) 1.69
outstanding at december 31, 2011 10,027,636 $ 1.60
there were 3,660,864 options exercisable as at December 31, 2011 (1,378,005 – December 31, 2010 and 411,667 – January 1, 2010) at an average exercise price of $1.21 per share ($0.95 – December 31, 2010 and $1.24 January 1, 2010).
options outstanding
december 31, 2011 December 31, 2010 January 1, 2010
exercise price
number ofoptions
outstanding
weighted Average exercise
price $
weighted Average Years to
expiry
number ofoptions
outstanding
Weighted Average exercise
price $
Weighted Average Years to
expiry
number ofoptions
outstanding
Weighted Average exercise price $
Weighted Average Years to
expiry
$0.48 – 0.91 1,115,168 0.69 2.33 1,275,000 0.68 3.32 1,630,000 0.66 4.31
$0.93 – 1.24 1,685,334 1.02 2.25 1,808,667 1.02 3.29 2,217,000 1.01 4.39
$1.31 – 1.51 2,929,734 1.34 3.34 3,476,500 1.34 4.35 – – –
$1.97 – 3.32 4,297,400 2.25 4.18 2,000,650 1.98 4.86 173,000 2.67 3.25
10,027,636 1.60 3.40 8,560,817 1.33 4.09 4,020,000 0.94 4.31
the fair value of each option granted is estimated on the date of grant using the Black-Scholes option pricing model with assumptions and resulting values for grants as follows. In 2010 and 2011, the volatility was measured at the standard deviation of continuously compounded share returns based on statistical analysis of daily share of twin Butte.
options granted intwelve months ended
december 31, 2011
options Granted in Year 2010
expected volatility 68% 70%
Risk free rate of return 1.73% 2.00%
expected stock option life 3 years 3 years
Dividend yield rate 0.0% 0.0%
Weighted average fair value of stock option grants $1.18 $0.59

55 2 0 1 1 A n n u A l R e p o R t t W I n B u t t e e n e R G Y l t D .
net income (loss) per Share
the following table sets forth the details of the denominator used for the computation of basic and diluted net income (loss) per share:
twelve months ended December 31,
2011 2010
net Income (loss) for the period (19,021) 682
Weighted average number of basic shares (000’s) 133,936 126,546
effect of dilutive securities:
employee stock options (000’s) – 923
Weighted average number of diluted shares (000’s) 133,936 127,469
net Income per share basic ($) (0.14) 0.01
net Income per share diluted ($) (0.14) 0.01
total shares issuable in exchange for the options and excluded from the diluted net income (loss) per share calculation for the twelve months ended December 31, 2011 was 4,004,070 shares (December 31, 2010 – 3,659,066 shares).
note 12. RevenueS peR pRoduct:
Revenue Year ended 2011 Year ended 2010
Heavy oil 87,163 40,765
light & Medium oil 25,211 20,085
natural gas 25,467 34,348
natural gas liquids 8,736 6,678
total petroleum and natural gas sales 146,577 101,876
note 13. geneRAl & AdminiStRAtion (“g&A”) expenSeS
twelve months ended December 31,
2011 2010
Staff salaries and benefits 6,884 4,893
Rent and insurance 600 891
office and other costs 3,964 3,911
Capitalized “G&A” (2,579) (2,073)
Capitalized overhead recoveries (2,562) (1,903)
6,307 5,719
note 14. FinAnce expenSe
twelve months ended December 31,
2011 2010
Accretion on decommissioning provision 1,078 971
Interest and bank charges 2,981 3,255
total 4,059 4,226
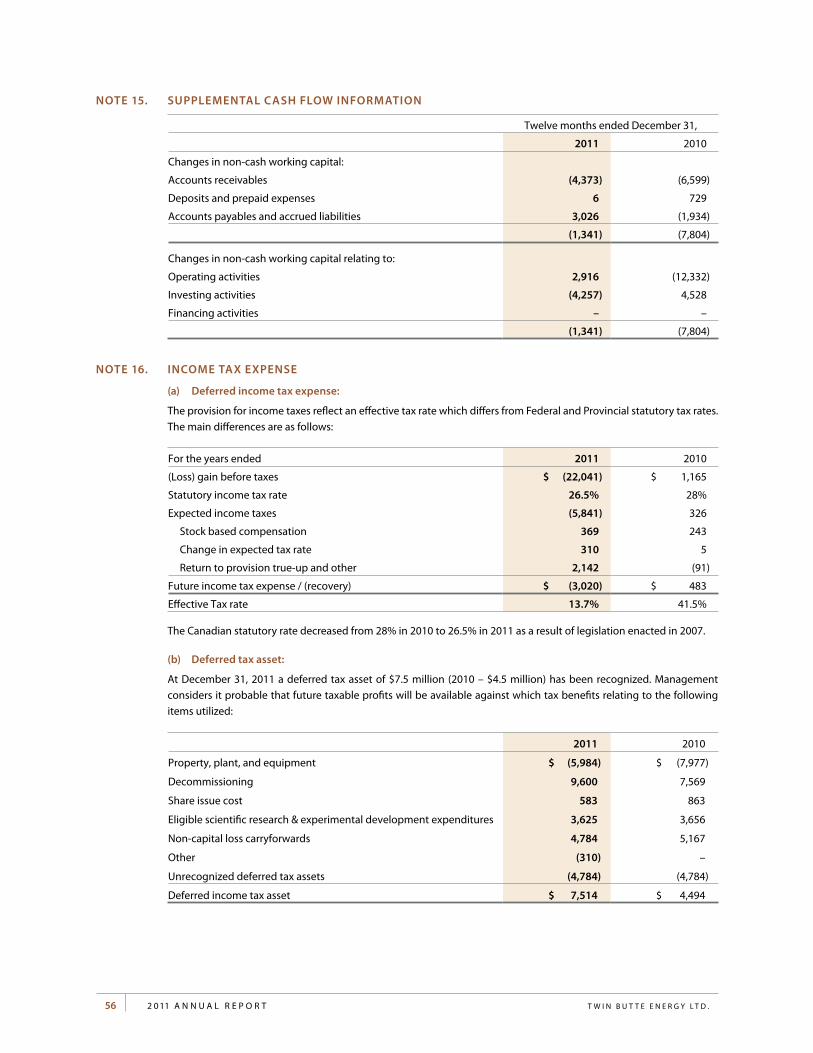
56 2 0 1 1 A n n u A l R e p o R t t W I n B u t t e e n e R G Y l t D .
note 15. SupplementAl cASh Flow inFoRmAtion
twelve months ended December 31,
2011 2010
Changes in non-cash working capital:
Accounts receivables (4,373) (6,599)
Deposits and prepaid expenses 6 729
Accounts payables and accrued liabilities 3,026 (1,934)
(1,341) (7,804)
Changes in non-cash working capital relating to:
operating activities 2,916 (12,332)
Investing activities (4,257) 4,528
Financing activities – –
(1,341) (7,804)
note 16. income tAx expenSe
(a) deferred income tax expense:
the provision for income taxes reflect an effective tax rate which differs from Federal and provincial statutory tax rates. the main differences are as follows:
For the years ended 2011 2010
(loss) gain before taxes $ (22,041) $ 1,165
Statutory income tax rate 26.5% 28%
expected income taxes (5,841) 326
Stock based compensation 369 243
Change in expected tax rate 310 5
Return to provision true-up and other 2,142 (91)
Future income tax expense / (recovery) $ (3,020) $ 483
effective tax rate 13.7% 41.5%
the Canadian statutory rate decreased from 28% in 2010 to 26.5% in 2011 as a result of legislation enacted in 2007.
(b) deferred tax asset:
At December 31, 2011 a deferred tax asset of $7.5 million (2010 – $4.5 million) has been recognized. Management considers it probable that future taxable profits will be available against which tax benefits relating to the following items utilized:
2011 2010
property, plant, and equipment $ (5,984) $ (7,977)
Decommissioning 9,600 7,569
Share issue cost 583 863
eligible scientific research & experimental development expenditures 3,625 3,656
non-capital loss carryforwards 4,784 5,167
other (310) –
unrecognized deferred tax assets (4,784) (4,784)
Deferred income tax asset $ 7,514 $ 4,494

57 2 0 1 1 A n n u A l R e p o R t t W I n B u t t e e n e R G Y l t D .
(c) unrecognized deferred tax assets:
Deferred tax assets have not been recognized in respect of the following items:
For the years ended 2011 2010 2009
unrecognized deferred tax assets:
non capital losses 4,784 4,784 4,784
4,784 4,784 4,784
At December 31, 2011, the above tax pools included $16.2 million (December 31, 2010 – $16.2 million, January 1, 2010 – $18.4 million) of Canadian non-capital losses. these losses expire no earlier than 2023.
(d) components of the net deferred income tax asset:
dec 31, 2011 Dec 31, 2010 Jan 1, 2010
Deferred tax assets:
Deferred tax assets to be recovered after more than 12 months (12,915) (12,087) (11,179)
Deferred tax assets to be recovered within 12 months (583) – –
(13,498) (12,087) (11,179)
Deferred tax liabilities:
Deferred tax liabilities to be recovered after more than 12 months 5,984 6,181 6,597
Deferred tax liabilities to be recovered within 12 months – 1,412 –
5,984 7,593 6,597
Deferred tax asset (net) (7,514) (4,494) (4,582)
the deferred income tax liabilities and assets to be settled (recovered) within 12 months represents Management’s estimate of the timing of the reversal of temporary differences and does not relate to the current income tax expense (if any) in the subsequent year.
(e) movement in deferred tax Assets:
Deferred Income tax liabilityproperty, plant
and equipment
As at January 1, 2010 6,596
Charged/(credited) to earnings 998
As at December 31, 2010 7,594
Charged/(credited) to earnings (1,610)
As at december 31, 2011 5,984
Deferred Income tax AssetsDecommissioning
liabilities tax pools total
As at January 1, 2010 (5,895) (5,283) (11,178)
Charged/(credited) to earnings (1,674) 1,159 (515)
Charged/(credited) to equity – (395) (395)
As at December 31, 2010 (7,569) (4,519) (12,088)
Charged/(credited) to earnings (2,031) 621 (1,410)
As at december 31, 2011 (9,600) (3,898) (13,498)

58 2 0 1 1 A n n u A l R e p o R t t W I n B u t t e e n e R G Y l t D .
net Deferred Income tax Assets total
As at January 1, 2010 (4,582)
Charged/(credited) to earnings 483
Charged/(credited) to equity (395)
As at December 31, 2010 (4,494)
Charged/(credited) to earnings (3,020)
As at december 31, 2011 (7,514)
note 17. AccountS ReceivABle
As Atdecember 31,
2011December 31,
2010December 31,
2009
trade 14,970 12,184 9,848
Joint operations with partners 17,073 12,897 9,082
other (312) 2,277 1,829
31,731 27,358 20,759
note 18. AccountS pAYABle And AccRued liABilitieS
As Atdecember 31,
2011December 31,
2010December 31,
2009
trade 13,691 16,187 8,028
Royalties 3,666 2,502 3,632
Joint operations with partners 3,027 2,545 7,506
Accruals 10,774 6,545 10,547
31,158 27,779 29,713
note 19. RelAted pARt Y tRAnSActionS
During the twelve month period ended December 31, 2011, the Company incurred costs totaling $5.2 million ($3.0 million – December 31, 2010) for oilfield services and legal counsel rendered by three companies in which an officer and director of twin Butte is a director. these costs were incurred in the normal course of business. As at December 31, 2011, the Company had $0.1 million ($1.1 million – December 31, 2010) included in accounts payable and accrued
liabilities related to these transactions.
key management compensation
Key management includes Directors (executive and non-executive), the executive officers, and the Vice-presidents. the compensation paid or payable to key management is as follows:
twelve months ended December 31,
2011 2010
Salaries, Director Fees and benefits 2,679 1,857
Stock Based Compensation 794 495
3,473 2,352

59 2 0 1 1 A n n u A l R e p o R t t W I n B u t t e e n e R G Y l t D .
note 20. commitmentS And contingencieS
the Company is committed to future minimum payments, of $41,000 until october 2013 for natural gas transmission and processing, and operating leases on compression equipment. twin Butte is responsible for the retirement of long-lived assets related to its oil and gas properties at the end of their useful lives. twin Butte has recognized a liability of $38.4 million (Dec 31, 2010 – $30.3 million) based on current legislation and estimated costs. Actual costs may differ from those estimated due to changes in legislation and changes in costs.
the Company had contractual obligations and commitments for base office rent and equipment as follows:
dec 31, 2011 Dec 31, 2010
2011 – 1,161
2012 764 764
thereafter – –
the Company is involved in legal claims associated with the normal course of operations. the Company has completed an assessment and has not recorded a legal provision.
note 21. explAnAtionS oF tRAnSition to iFRS
As stated in note 2 (a), these are the Company’s first annual financial statements prepared in accordance with IFRS. the Company has adopted IFRS effective January 1, 2011 in accordance with IFRS 1 First-time Adoption of International Financial Reporting Standards. the Company’s transition date is January 1, 2010 (the “transition date”) and the Company has prepared its opening IFRS balance sheet at that date.
the accounting policies set out in note 3 have been applied in preparing the financial statements for the period ended December 31, 2011, the comparative information presented in these financial statements for the period ended December 31, 2010 and the preparation of an opening IFRS balance sheet at January 1, 2010, except for certain transition elections applied under IFRS 1.
In preparing its opening IFRS balance sheet, the Company has adjusted amounts reported previously in financial statements prepared in accordance with previous GAAp. An explanation of how the transition from previous GAAp to IFRS has affected the Company’s financial position, financial performance and cash flows is set out in the following tables and the notes that accompany the tables.

60 2 0 1 1 A n n u A l R e p o R t t W I n B u t t e e n e R G Y l t D .
(a) Reconciliation of equity from canadian gAAp to iFRS
At the date of IFRS transition – January 1, 2010:
BAlAnce SheetAs at (Cdn $ thousands) Notes
previous GAAp January 1, 2010
IFRS adjustments
IFRS January 1, 2010
ASSetS
Current Assets
Accounts receivable $ 20,759 $ – $ 20,759
Deposits and prepaid expenses 3,182 – 3,182
23,941 23,941
Deferred taxes a,h 2,401 2,181 4,582
exploration and evaluation a,c – 26,791 26,791
property and equipment a,b,d,e 282,521 (26,791) 255,729
$ 308,863 $ 2,181 $ 311,043
liABilitieS And ShAReholdeRS’ eQuit Y
Current liabilities
Accounts payable and accrued liabilities $ 29,713 $ – $ 29,713
Bank indebtedness 96,342 – 96,342
Derivative liabilities 1,224 – 1,224
127,279 127,279
other liabilities 796 – 796
Decommissioning provision a,f 14,856 8,725 23,581
142,931 8,725 151,656
Shareholders’ equity
Share capital a 188,006 1,498 189,504
Warrants 912 – 912
Contributed surplus a 4,185 77 4,261
Deficit a (27,171) (8,119) (35,290)
165,932 (6,544) 159,388
$ 308,863 $ 2,181 $ 311,044

61 2 0 1 1 A n n u A l R e p o R t t W I n B u t t e e n e R G Y l t D .
As at December 31, 2010:
BAlAnce Sheet
As at (Cdn $ thousands) Notes
previous GAApDecember 31,
2010IFRS
adjustments
IFRSDecember 31,
2010
ASSetS
Current Assets
Accounts receivable $ 27,358 $ – $ 27,358
Deposits and prepaid expenses 2,453 – 2,453
Derivative assets 3,947 – 3,947
33,758 – 33,758
Deferred taxes h 2,944 1,550 4,494
exploration and evaluation assets c – 19,897 19,897
property and equipment b,d,e 300,983 (13,422) 287,561
$ 337,685 $ 8,025 $ 345,710
liABilitieS And ShAReholdeRS’ eQuit Y
Current liabilities
Accounts payable and accrued liabilities $ 27,779 $ – $ 27,779
Bank indebtedness 97,705 – 97,705
Derivative liabilities 3,293 – 3,293
128,777 – 128,777
other liabilities 354 – 354
Derivative liabilities 3,340 – 3,340
Decommissioning provision f 17,592 12,682 30,274
150,063 12,682 162,745
Shareholders’ equity
Share capital a 210,039 1,499 211,538
Warrants 912 – 912
Contributed surplus 4,989 135 5,124
Deficit g (28,318) (6,291) (34,609)
187,622 (4,657) 182,965
$ 337,685 $ 8,025 $ 345,710

62 2 0 1 1 A n n u A l R e p o R t t W I n B u t t e e n e R G Y l t D .
Reconciliation of total comprehensive income for the year ended december 31, 2010
StAtementS oF income (loSS) And compRehenSive income (loSS)
twelve Months ended December 31,
(Cdn$ thousands) Noteprevious
GAApeffect of
transition to IFRS IFRS
petroleum and natural gas sales $ 101,876 $ 101,876
Royalties (20,734) (20,734)
Revenues $ 81,142 $ 81,142
expenses
operating 32,709 – 32,709
transportation 3,842 – 3,842
General and administrative 5,719 – 5,719
Share-based payments g 809 58 867
Gain on derivatives (3,862) – (3,862)
Gain on dispositions – (1,533) (1,533)
exploration and evaluation c – 6,313 6,313
Depletion and depreciation d 39,965 (8,269) 31,696
79,182 (3,431) 75,751
operating income before finance expense
and income taxes 1,960 3,431 5,391
Finance expense i 3,255 971 4,226
Income (loss) before income taxes (1,295) 2,460 1,165
Deferred tax expense (recovery) h (147) 630 483
income (loSS) And compRehenSive
income (loSS) (1,148) 1,830 682
Income (loss) per share $
Basic & Diluted (0.01) 0.01
notes to reconciliation:
(a) elected exemptions from full retrospective application
In preparing these financial statements in accordance with IFRS 1 First-time Adoption of International Financial Reporting Standards (“IFRS 1”), the Company has applied certain of the optional exemptions from full retrospective application of IFRS. the optional exemptions are described below.
(i) Business combinations
the Company has applied the business combinations exemption in IFRS 1 to not apply IFRS 3 retrospectively to past business combinations. Accordingly, the Company has not restated business combinations that took place prior to January 1, 2010.
(ii) Share-based payments
the Company elected to apply the share-based payment exemption to awards that vested prior to January 1, 2010. Awards that were unvested at the date of transition to IFRS, being the unvested stock options, were restated retroactively. this resulted in a $0.1 million adjustment to deficit and contributed surplus at the date of transition.
(iii) Decommissioning provisions
the Company elected to apply IFRS relating to decommissioning provisions as at the date of transition to IFRS. the Company restated its decommissioning provision in accordance with IFRS at January 1, 2010. under previous GAAp asset retirement obligations were discounted at a credit adjusted risk free rate of 8%. under IFRS, the estimated cash flow to abandon and remediate the wells and facilities has been risk adjusted therefore the provision is discounted at a weighted average risk free rate of 4.0%. this resulted in an $8.7 million increase to

63 2 0 1 1 A n n u A l R e p o R t t W I n B u t t e e n e R G Y l t D .
decommissioning provision and a corresponding increase to deficit at the date of transition (the deferred tax effect of the adjustment was $2.2 million).
(iv) Oil and gas property cost basis
the Company followed a ‘full cost’ approach under the previous GAAp which is a policy no longer permitted upon transition to IFRS. the Company has elected to apply the first-time adoption exemption for full cost oil and gas entities where the carrying value of oil and gas assets at the date of transition to IFRS is measured on a deemed costs basis. exploration and evaluation assets are reclassified from the previous GAAp full cost pool to intangible exploration and evaluation assets at the amount that was recorded under previous GAAp.
the remaining full cost pool has been allocated to producing and development oil and gas properties using proved and probable reserve values discounted at 10%. this resulted in a $26.8 million recognition of exploration and evaluation assets with a corresponding decrease in oil and gas properties.
(b) property and equipment – For the purpose of impairment testing, twin Butte’s property and equipment assets were allocated to its CGu’s unlike under previous GAAp where all oil and natural gas assets are accumulated into one cost centre by country. the deemed cost of twin Butte’s oil and natural gas assets were allocated to its defined CGus based on twin Butte’s total proved plus probable reserve values discounted at 10% as at January 1, 2010, in accordance with IFRS 1. these CGus were aligned within the major geographic regions in which twin Butte operates and could change in the future as a result of significant acquisition and disposition activity.
(c) exploration and evaluation (“e&e”) expenditures – upon transition to IFRS, twin Butte reclassified all e&e expenditures that were included in the property and equipment assets balance on the balance sheet. this consisted of the carrying amount for twin Butte’s land which did not have proved or probable reserves attributed directly to related exploration properties. e&e assets are not depleted, and are assessed for impairment when indicators of impairment exist. Management identified and reclassified the following amounts from property and equipment assets to e&e in the balance sheet prepared under IFRS as at January 1, 2010 ($26.8 million) and December 31, 2010 ($19.9 million). For the year ended December 31, 2010, $6.3 million was expensed relating to lease expiries.
(d) depletion expense – twin Butte has chosen to calculate its depletion using the uop method over proved plus probable reserves, as compared to using only proved reserves under previous GAAp. As a result, the depletion expense decreased as compared to its current calculation under previous GAAp. For the twelve months ended December 31, 2010, the depletion expense decreased as compared to its current calculation under previous GAAp by $7.1 million.
For the twelve months ended December 31, 2010 accretion expense has been removed and added to Finance costs of $0.7 million
(e) impairment of pp&e assets – IFRS requires an asset impairment test to be conducted on the transition date and subsequently when indicators of impairment are present. under Canadian GAAp, impairment of long-lived assets is assessed on the basis of an asset’s estimated undiscounted future cash flows compared with the asset’s carrying amount and if impairment is indicated, discounted cash flows are prepared to quantify the amount of impairment. the impairment test under previous Canadian GAAp was done at the cost centre level. twin Butte had only one cost centre and no impairments were ever recorded.
IFRS requires the impairment test to occur at the asset level or the CGu level when long-lived assets exist that do not generate independent cash inflows. the carrying amount of the asset or CGu is compared to its recoverable amount which is the higher of the value-in-use or the fair value of the assets less the costs to sell it. twin Butte performed an impairment test on transition to IFRS as at January 1, 2010 based on fair value less estimated costs to sell. Fair value was based on the most recent reserve report as evaluated by the Company’s independent engineers. the Company did not experience any impairment on the transition date. For each of the quarters ended in 2010, twin Butte performed additional impairment evaluations as determined by internal estimates of revisions to the most recent engineering evaluation of its reserves and concluded that at no time during 2010 were any of the CGu’s considered to be impaired.
(f) decommissioning provision – under IFRS, twin Butte remeasured its liability for decommissioning provision using the risk-free rate of interest. IFRS requires that asset decommissioning provision be re-measured each reporting period for changes in the discount rate with a corresponding adjustment to the cost of property, plant and equipment.

64 2 0 1 1 A n n u A l R e p o R t t W I n B u t t e e n e R G Y l t D .
At January 1, 2010 twin Butte’s total of its decommissioning provision increased by $8.7 million to $23.6 million as the liability was revalued to reflect the estimated risk free rate of interest of 4.0% as compared to the credit adjusted risk-free rate of 8.0% used previously under Canadian GAAp. At December 31, 2010 the risk-free rate was further reduced to 3.5% and increased an additional $6.7 million decommissioning provision.
(g) Share-based payments – under previous GAAp, the Company accounted for stock-based compensation plans on a straight-line basis over the term of the vesting period. under IFRS each tranche in an award is considered a separate grant with different vesting date and fair value. each grant is separately accounted for using applicable assumptions for those specific dates and different fair values and accounted for using graded vesting recognition of expense. under previous GAAp, forfeitures of awards are recognized as they occur. the calculation of share-based compensation under IFRS reflects an estimate of the number of awards expected to vest, which is revised if subsequent information indicates that actual forfeitures are likely to differ from the estimate. As a result, the Company adjusted its expense for share-based awards by $0.1 for the year ended December 31, 2010 and recognized the corresponding adjustment to contributed surplus.
(h) Deferred income tax calculated according to IFRS is substantially similar to previous GAAp and arises from differences between the accounting and tax bases of assets and liabilities. to the extent that assets and liabilities have changed from transition to IFRS; the amount of deferred income tax asset would be impacted.
twin Butte recorded an overall increase of $2.2 million to its deferred tax asset upon transition to IFRS with the offset to opening deficit. the adjustments discussed above have also impacted deferred tax expense recognized in the statement of income (loss) for twelve months ended December 31, 2010 by $0.6 million (year ended December 31, 2009 – $0.6 million).
(i) Finance expenses
under IFRS, interest expenses and accretion expense are included as finance expenses. these individual amounts for previous GAAp have been reclassified for IFRS.
(j) Flow-through shares
Flow-through shares are a Canadian tax incentive which is the subject of specific guidance under previous GAAp, however there is no specific guidance under IFRS. under previous GAAp, when flowthrough shares are issued they are recorded at face value. the related future tax liability is established for the tax effect of the difference between the tax basis and the book basis of the assets when renounced and is recorded as a reduction of share capital. there is no income statement effect associated with the issuance of these shares.
twin Butte has adopted a policy under IFRS where the proceeds from the offering are to be allocated between the sale of the shares and the sale of the tax benefit. the allocation is made based on the difference between the quoted market price of the existing shares and the amount an investor pays for the flow through shares. A liability is established for this difference that is reversed upon renunciation of the tax benefit and as qualifying expenditures are made. the difference between this liability and the deferred tax liability is recorded as an income tax expense. this has resulted in a re-classification between deficit and share capital at January 1, 2010 of $1.5 million.
(k) Adjustments to the statement of cash flows
the transition from previous GAAp to IFRS had no significant impact on cash flows generated by the Company.
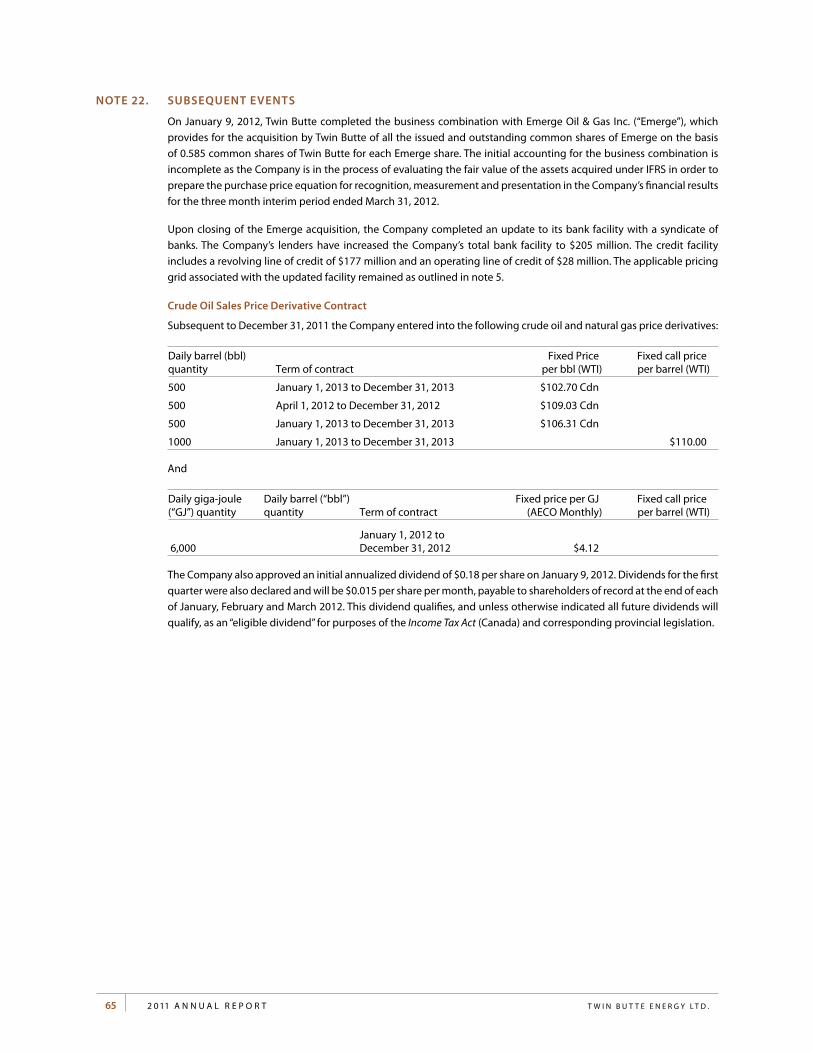
65 2 0 1 1 A n n u A l R e p o R t t W I n B u t t e e n e R G Y l t D .
note 22. SuBSeQuent eventS
on January 9, 2012, twin Butte completed the business combination with emerge oil & Gas Inc. (“emerge”), which provides for the acquisition by twin Butte of all the issued and outstanding common shares of emerge on the basis of 0.585 common shares of twin Butte for each emerge share. the initial accounting for the business combination is incomplete as the Company is in the process of evaluating the fair value of the assets acquired under IFRS in order to prepare the purchase price equation for recognition, measurement and presentation in the Company’s financial results for the three month interim period ended March 31, 2012.
upon closing of the emerge acquisition, the Company completed an update to its bank facility with a syndicate of banks. the Company’s lenders have increased the Company’s total bank facility to $205 million. the credit facility includes a revolving line of credit of $177 million and an operating line of credit of $28 million. the applicable pricing grid associated with the updated facility remained as outlined in note 5.
crude oil Sales price derivative contract
Subsequent to December 31, 2011 the Company entered into the following crude oil and natural gas price derivatives:
Daily barrel (bbl) quantity term of contract
Fixed price per bbl (WtI)
Fixed call price per barrel (WtI)
500 January 1, 2013 to December 31, 2013 $102.70 Cdn
500 April 1, 2012 to December 31, 2012 $109.03 Cdn
500 January 1, 2013 to December 31, 2013 $106.31 Cdn
1000 January 1, 2013 to December 31, 2013 $110.00
And
Daily giga-joule (“GJ”) quantity
Daily barrel (“bbl”) quantity term of contract
Fixed price per GJ(AeCo Monthly)
Fixed call priceper barrel (WtI)
6,000 January 1, 2012 to December 31, 2012 $4.12
the Company also approved an initial annualized dividend of $0.18 per share on January 9, 2012. Dividends for the first quarter were also declared and will be $0.015 per share per month, payable to shareholders of record at the end of each of January, February and March 2012. this dividend qualifies, and unless otherwise indicated all future dividends will qualify, as an “eligible dividend” for purposes of the Income Tax Act (Canada) and corresponding provincial legislation.

co R p o R at e i n f o R M at i o n
oFFiceRS
Jim SaundersPresident & Chief Executive Officer
Bob BowmanVice President, Operations
neil CathcartVice President, Exploration
Mike FabiVice President, Corporate Planning & Development
Claude GamacheVice President, Heavy Oil Geosciences
preston KraftVice President, Engineering
Bruce W. HallChief Operating Officer
Colin ogilvyVice President, Land
R. Alan SteeleVice President, Finance & CFO
BoARd oF diRectoRS
David Fitzpatrick (3)
Chairman of the Board
Jim Brown (1) (3)
John Brussa (3)
tom Greschner (2)
Jim Saunders
Warren Steckley (1) (2)
William A. (Bill) trickett (1) (2)
Member of:
(1) Audit Committee(2) Reserves Committee(3) Compensation, nominating and Governance Committee
heAd oFFicetwin Butte energy ltd.410, 396 - 11 Ave. SWCalgary AB t2R 0C5phone: 403-215-2045Fax: 403-215-2055www.twinbutteenergy.com
AuditoRS
pricewaterhouseCoopers llp
Chartered Accountants, Calgary, AB
BAnkeRS
national Bank of Canada, Calgary, AB
AtB Financial, Calgary AB
SolicitoRS
Burnet, Duckworth & palmer llpCalgary, AB
engineeRS
McDaniel & Associates Consultants ltd. Calgary, AB
RegiStRAR & tRAnSFeR Agent
Valiant trust CompanyCalgary, AB
Stock exchAnge liSting
tSXtrading Symbol “tBe”