2011 Survey of Veteran Enrollees' Health and … of Veterans Affairs Veterans Health Administration...
153
Department of Veterans Affairs Veterans Health Administration Office of the Assistant Deputy Under Secretary for Health for Policy and Planning 2011 Survey of Veteran Enrollees’ Health and Reliance Upon VA With Selected Comparison to the 1999 – 2010 Surveys March 2012
Transcript of 2011 Survey of Veteran Enrollees' Health and … of Veterans Affairs Veterans Health Administration...

Department of Veterans Affairs Veterans Health Administration
Office of the Assistant Deputy Under Secretary for Health for Policy and Planning
2011 Survey of Veteran Enrollees’ Health and Reliance Upon VA With Selected Comparison to the 1999 – 2010 Surveys
March 2012

This page intentionally left blank.

PPP rrr ooo lll ooo ggg uuu eee The face of today’s Veteran is ever changing. As service men and women transition out of active military service into civilian life, that face becomes younger and more diverse. These Veterans’ experiences reflect different conflicts and varying regions. In addition, changing economic times have left many people, including Veterans, unemployed and uninsured. Some of these Veterans are turning to the Veterans Health Administration (VHA) for the first time. The challenge for VHA is to make every Veteran feel welcome and cared for, whether they are newly enrolled in the VHA health care system or have been relying on VHA for many years. To meet this challenge, it is critical that we understand the Veterans enrolled in our system. We need to know who they are, what influences their health care choices, and how they perceive their health status. We also need to know how they currently use VHA and how they plan to use VHA in the future. Since 1999, a primary source of these data has been the “VHA Survey of Veteran Enrollees’ Health and Reliance upon VA” (Survey of Enrollees). This survey was designed to gather information on enrollees that cannot be obtained in any other way. The 2011 Survey of Enrollees is the ninth in a series of surveys that have been conducted by the Office of the Assistant Deputy Under Secretary for Health for Policy and Planning (ADUSH/P&P). The data gathered from this survey primarily informs the VA Enrollee Health Care Projection Model (EHCPM), VHA’s model for projecting enrollment, utilization, and expenditures. In addition, these data may be useful in a variety of strategic analysis areas at either the Veterans Integrated Service Network (VISN) level or National Program Office level. It contains enrollee data on marital status, period of service, combat status, ethnicity and race, employment status, public and private health insurance coverage, uninsurance, Medicare coverage, prescription drug benefit or coverage, number and costs of over-the-counter (OTC) and prescription medications, perceived health status, smoking status, and perceptions of VA health care. These data are categorized by priority, age, income levels, Operation Enduring Freedom/Operation Iraqi Freedom/Operation New Dawn (OEF/OIF/OND) status, gender, and VISN. This report has been produced by the Healthcare Analysis and Information Group and the Enrollment and Forecasting Service within VHA’s Office of the ADUSH/P&P. /s/Patricia Vandenberg, MHA Assistant Deputy Under Secretary for Health for Policy and Planning
Office of the ADUSH for Policy and Planning
1 2011 Survey of Veteran Enrollees' Health and Reliance Upon VA

This page intentionally left blank.
Office of the ADUSH for Policy and Planning
2 2011 Survey of Veteran Enrollees' Health and Reliance Upon VA

TTT aaa bbb lll eee ooo fff CCC ooo nnn ttt eee nnn ttt sss Prologue ..............................................................................................................................1 Table of Contents ...............................................................................................................3 Executive Summary ...........................................................................................................7 VHA Survey of Enrollees Overview ...............................................................................11
Demographic and Socioeconomic Characteristics of the Enrollee Population Chapter 1
Demographic Overview ...................................................................................19 All Enrollees by VISN .....................................................................................20 Priority Groups.................................................................................................21 Age Groups ......................................................................................................22 Enrollees Age 65 or Over by VISN .................................................................23 Income Groups .................................................................................................24 Enrollees with Average Household Incomes Less than $36,000 by VISN .....25 Ethnicity and Race ...........................................................................................26 Marital Status and Dependents ........................................................................27 Female Enrollees ..............................................................................................28 Female Enrollees Population by VISN ............................................................29 Active Duty Period of Service/Combat Exposure ...........................................30 OEF/OIF/OND Enrollees.................................................................................31 Enrollees in OEF/OIF/OND Conflicts by VISN .............................................32 Employment Status ..........................................................................................33 Unemployment Rate ........................................................................................33 Unemployment Rate by VISN .........................................................................35
Health Status, Key Drivers of Enrollees’ Health Care Decision Making, and Planned Future Use of VHA Health Care Services
Chapter 2
Perceived Health Status ...................................................................................22 Perceived Health Status by Priority Group ......................................................22 Perceived Health Status by Age Group ...........................................................22 Perceived Health Status by Income Group ......................................................22 Perceived Health Status of OEF/OIF/OND and Female Enrollee Populations .................................................................................................22 Perceived Health Status: VISN Overview .......................................................22 Reported Current Use of VA Services to Meet Health Care Needs ................22 Key Drivers of VHA Utilization ......................................................................22 Perception of Quality of VA Health Care ........................................................22 Perception of Cost of VA Health Care ............................................................22 Perception of Availability and Accessibility of VA Health Care ....................22 Knowledge of VA Health Benefits ..................................................................22 Perceptions of Availability of Non-VA Health Care Alternatives ..................22 Planned Current and Future Uses of VA .........................................................22 Averages of the Major Factors .........................................................................22
Office of the ADUSH for Policy and Planning
3 2011 Survey of Veteran Enrollees' Health and Reliance Upon VA

Planned Future Use ..........................................................................................22
Public and Private Health Insurance Coverage Chapter 3
Overall Results .................................................................................................25 Uninsurance .....................................................................................................26
Uninsurance by Priority Groups ................................................................27 Uninsurance by Age Groups ......................................................................28 Uninsurance by Income Groups .................................................................29 Uninsured by OEF/OIF/OND Status and Gender ......................................22
VISN Overview ...............................................................................................30 Medicare Coverage .........................................................................................32 Medicaid ..........................................................................................................22 Private Plans.....................................................................................................22 TRICARE ........................................................................................................22
Pharmaceutical Use Chapter 4
VA Prescription Drug Benefit Awareness .......................................................37 Private Insurance Prescription Benefit.............................................................38 Medicare Part D Coverage ...............................................................................38 Over-the-Counter Medications in the Last 30 Days ........................................41 Over-the-Counter Medications in the Last 30 Days from VA .........................41 Number of Prescriptions in the Last 30 Days ..................................................41 Number of Prescriptions in the Last 30 Days from VA ...................................41 Out-of-Pocket Expense for Medications ..........................................................42
VA Reliance Chapter 5
Definition of Reliance ......................................................................................61 Analysis of VA Reliance at the National Level ...............................................22 Reliance by Non-VA Health Care Insurance Coverage ..................................22 VA Reliance by Perceived Health Status.........................................................22 VA Reliance by Priority Group .......................................................................22 VA Reliance by Age Group .............................................................................22 VA Reliance by Income Group........................................................................22 VA Reliance and Employment Status ..............................................................22 VA Reliance and Marital Status ......................................................................22 VA Reliance by Race and Ethnicity ................................................................22 VA Reliance and Active Duty Period of Service & by VISN ........................22 Summary of Reliance Drivers ..........................................................................22
Cigarette Smoking Status Chapter 6
Profile of Enrollees Who Are Current Smokers ..............................................89 Cigarette Smoking Status Overview ................................................................89
Office of the ADUSH for Policy and Planning
4 2011 Survey of Veteran Enrollees' Health and Reliance Upon VA
VISN Overview (Current Smokers) .................................................................95
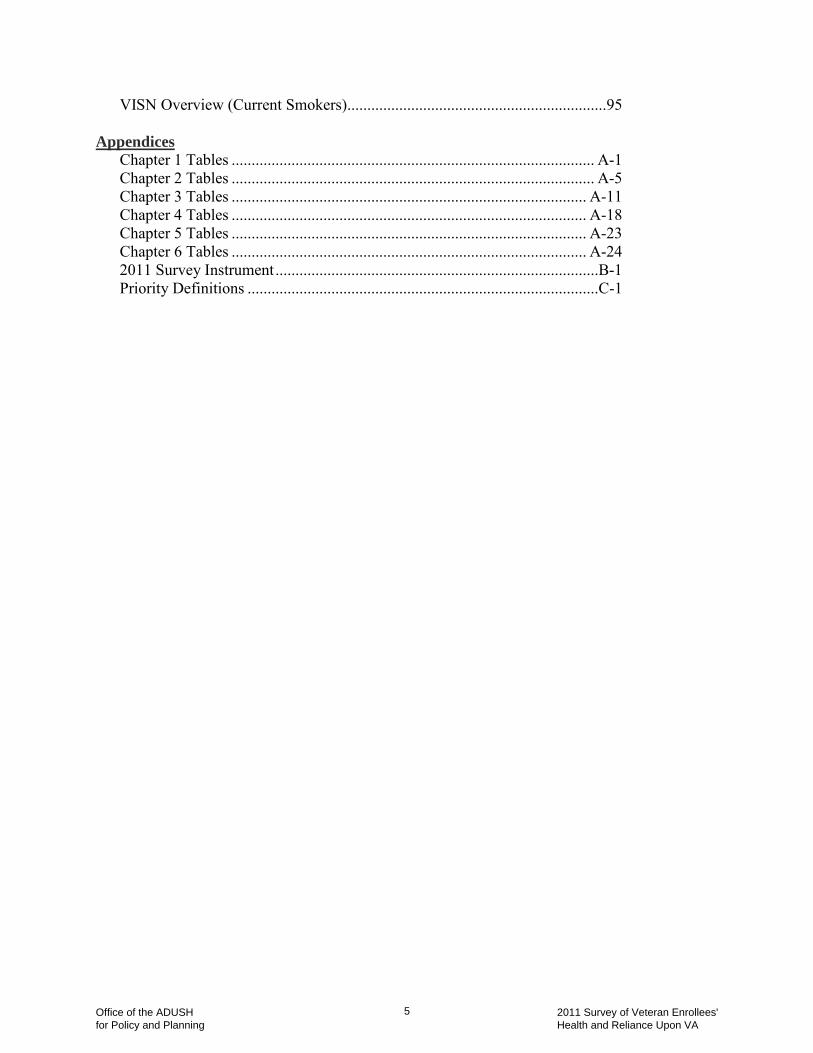
Chapter 1 Tables ........................................................................................... A-1 Appendices
Chapter 2 Tables ........................................................................................... A-5 Chapter 3 Tables ......................................................................................... A-11 Chapter 4 Tables ......................................................................................... A-18 Chapter 5 Tables ......................................................................................... A-23 Chapter 6 Tables ......................................................................................... A-24 2011 Survey Instrument .................................................................................B-1 Priority Definitions ........................................................................................C-1
Office of the ADUSH for Policy and Planning
5 2011 Survey of Veteran Enrollees' Health and Reliance Upon VA

This page intentionally left blank.
Office of the ADUSH for Policy and Planning
6 2011 Survey of Veteran Enrollees' Health and Reliance Upon VA

EEE xxx eee ccc uuu ttt iii vvv eee SSS uuu mmm mmm aaa rrr yyy I n t r odu c t ion The Survey of Enrollees was developed in 1999 in order for the VHA to better understand enrolled Veterans’ health care needs. In addition to collecting basic demographic information, the survey explores insurance coverage, VA and non-VA health care use, pharmaceutical use, attitudes and perceptions about VHA services, perceived health status, and smoking habits of Veterans enrolled in the VHA system (for the purposes of this report, these Veterans are referred to as enrollees). All of these factors are considered predictive indicators of an enrollee’s future use of VHA services and the information is not available in VHA administrative databases. The survey is conducted nationwide via telephone under the auspices of the Office of the ADUSH/P&P with the primary purpose of informing the EHCPM. In addition to supporting the EHCPM, data from the survey is used for planning purposes and policy related analyses by several offices within VA and VHA. This report is intended to provide a synopsis of all the information collected by the 2011 Survey of Enrollees in a user-friendly format. While an effort is made to suggest explanations for response patterns, this report is not intended to provide conclusions about enrollee perceptions and behaviors. However, it does attempt to point to areas which may be appropriate for further analysis. This report and reports from previous years can be found at http://www.va.gov/healthpolicyplanning/ on the internet. O v e ra l l Sur v e y M eth od o l og y The 2011 survey data collection began March 4, 2011 and ran through May 27, 2011. Interviewers completed 43,633 interviews. Of these interviews, 2,614 were completed with a knowledgeable proxy instead of the listed Veteran because of a health or mental impairment that prevented the Veteran from participating in the interview. Of these proxy interviews, 1,736 were completed by the selected Veteran’s spouse. The average interview length was 15.6 minutes. The number of contacted eligible respondents was 57,820. The overall cooperation rate (defined as the proportion of completed interviews in the number of contacted eligible respondents) was 75 percent. A fuller discussion of the survey methodology can be found in the Overview section. H igh l igh t ed R esu l t s Results of the survey are weighted to represent the population of Veteran enrollees. The enrollee population at the time of the survey weighting (September 30, 2010) was 7,895,108. Information gleaned from the survey includes socioeconomic characteristics of the enrollee population, public and private insurance coverage, health status measures, and future use of VA health care services by the Veteran enrollee population. While the following are highlighted results, each area is described in detail in their respective chapters.
Office of the ADUSH for Policy and Planning
7 2011 Survey of Veteran Enrollees' Health and Reliance Upon VA

O v e r v i ew ( Enr o l lm e n t Aw ar en es s ) Each year the survey participants are asked if they are enrolled in VA health care; 15 percent said they were not covered by VA health care and an additional 4 percent said they either did not know if they were enrolled or did not remember enrolling. Within just the Operation Enduring Freedom/Operation Iraqi Freedom/Operation New Dawn (OEF/OIF/OND) population, 21 percent of enrollees indicated they were not enrolled in VA. This discrepancy shows up in each survey and may merit further investigation to assure that Veterans who are entitled to care at VA are aware of their benefits. Ch ap t er 1 - D em o gr ap h i c and So c io e co nom i c Ch ar a c t er i s t i c s o f th e En ro l l e e Po pu l a t i on The average age of enrollees was 62 years, a year younger than the 63 year average age reported in the 2010 survey. The majority of enrollees were male, married, and white; However, Ethnicity and Race identifications tended to be more diverse among younger enrollee age groups. Women represented 6 percent of the total enrollee population and 12 percent of enrollees with OEF/OIF/OND status. The median reported annual household income for all enrollees remained steady at $35,000. Most enrollees (60%) were not in the labor force; the unemployment rate for those who were in the labor force rose from 20 percent in 2010 to 22 percent in 2011. During the same time period, the U.S. civilian unemployment rate trended downward from almost 10 percent in 2010 to 9.4 percent in 2011. As in previous years, the largest percentage of enrollees (41%) served during the Vietnam era. Ch ap t er 2 - H ea l th S ta tus , K e y D r i v er s o f Enr o l l e e s ’ H ea l th Ca r e D e c i s i on M akin g , a nd P lann e d Fu ture U se o f VHA H e a l th C ar e Se r v i c es Overall, 65 percent of enrollees considered their health status to be “Excellent/Very Good/Good”; this statistic has not changed by more than a percentage point in the last four survey cycles. Enrollees in the 45 – 64 age group have consistently rated their perceived health status lower than either the less than 45 age group or the 65+ age group in the years that the survey has been conducted. Perhaps because they tend to be younger, OEF/OIF/OND enrollees were more likely to report a favorable health status (77%) than all other enrollees (64%). Most enrollees (75%) reported that they use VA for at least some of their health care needs, an increase of 2 percentage points from the 73 percent who reported VA use in 2010. Seventeen questions that in previous years have proved to be significant predictors of VHA utilization (“key drivers”) were included in the survey; the highest level of agreement (i.e., respondents “agree” or “completely agree”) was found for questions related to “Quality,” followed by “Cost,” and then by “Availability and Accessibility of Services.”
Office of the ADUSH for Policy and Planning
8 2011 Survey of Veteran Enrollees' Health and Reliance Upon VA

Overall, the “Quality” statement “VHA health care providers treat their patients with respect” received the highest level of concurrence (84%). Users of VA care are more likely to concur with “key driver” statements than enrollees who do not use VA care. Enrollees with OEF/OIF/OND status tended to concur less with “key driver” statements than did their counterparts. The most common response to how enrollees planned to use VA services was for primary care (48%); this is an increase over the 45 percent who replied “primary care” in 2010. Ch ap t er 3 – Pu b l i c an d Pr i v a t e H ea l th In sur an c e C o v era g e o f th e Ve t e r an En ro l l ee Po pu l a t i on Although most enrollees (77%) reported some type of public or private health insurance coverage in addition to their VA health care benefits, the number of insured enrollees appears to be decreasing at an accelerating rate. It dropped from 79 percent in 2010 and 80 percent in 2008. Uninsurance rates decrease as age or as annual household income increases. Female enrollees had a higher uninsurance rate (30%) than male enrollees (23%). The types of public or private health insurance used by enrollees have remained relatively stable since 2010; enrollees with Medicare represent 51 percent of the total population just as they did in 2010. Ch ap t er 4 - Ph arm a c eu t i ca l Us e Although 77 percent of enrollees reported some form of non-VA health care insurance, only 39 percent reported some form of non-VA prescription drug coverage. Forty percent of all enrollees do not consider or do not know that their VA enrollment provided pharmaceutical benefits. Eighty-three percent of enrollees who reported taking OTC medications over a 30 day period received no OTC medications from VA. Thirty-four percent of enrollees who reported taking any prescription over a 30 day period did not use VA to fill those prescriptions. When combined with “Don’t Know” or “Refused” responses, just under 40 percent of enrollees do not consider that their VA enrollment provides drug coverage. Enrollees under the age of 45 are less likely to be aware of their VA Drug coverage (44%) than those age 45-64 (63%) or 65 and older (63%). Thirty-six percent of enrollees with Medicare have opted to purchase Medicare Part D (prescription coverage); the VHA Office of the ADUSH/P&P has begun a study to better understand why enrollees would choose Medicare Part D over VA prescription coverage.
Office of the ADUSH for Policy and Planning
9 2011 Survey of Veteran Enrollees' Health and Reliance Upon VA

Ch ap t er 5 - R e l i anc e Nationwide, the average reliance on VHA for outpatient care was 47 percent, an increase of two percentage points from 2010. A little more than half of enrollees who use health care are either not at all reliant (27%) or 100 percent reliant (25%). Economic factors impacted reliance with enrollees who were unemployed, uninsured, and/or earning less than $20,000 as they were more likely to rely on VHA for their health care. Enrollees less than 30 years of age and enrollees from 50 to 64 years of age had higher than average VA reliance (54% and 56% respectively). Enrollees who reported being married (40%) or widowed (46%) had lower VA reliance than enrollees who were divorced (62%), separated (63%), or single (62%). Enrollees who identified themselves as Asian were least reliant (42%), while enrollees who identified as Black or African-American were most reliant (57%) on VA for their health care. Ch ap t er 6 - C i ga r e t t e Sm ok ing S t a tu s Current smokers (1.6 million) made up 20 percent of the entire enrollee population. This is virtually the same percentage of enrollees documented as “current smokers” in the 2008 and 2010 surveys, and only slightly higher than the latest Center for Disease Control (CDC) estimates of 19.3 percent of U.S. adults who are current smokers. A large percentage of enrollees (68%) considered themselves a smoker at one time; of these, 71 percent are former smokers. Of the current smoker population, 27 percent reported combat exposure, 20 percent were female, and 35 percent were unemployed.
Office of the ADUSH for Policy and Planning
10 2011 Survey of Veteran Enrollees' Health and Reliance Upon VA

VVV HHH AAA SSS uuu rrr vvv eee yyy ooo fff EEE nnn rrr ooo lll lll eee eee sss OOO vvv eee rrr vvv iii eee www
VH A Su r v e y o f Enr o l l e e s B a ck gr ound and Pu rp os e In October 1996, Congress enacted the Veterans’ Health Care Eligibility Act of 1996 (Public Law 104-262). Among other requirements, this law required that VHA implement a priority-based enrollment system for Veterans who wished to use the VA health care system. The enrollment requirement became effective on October 1, 1998, the start of Fiscal Year (FY) 1999, and gave VHA the ability to plan to meet both immediate and future needs of Veterans enrolled in the system. (For the purposes of this report, these Veterans are referred to as enrollees.) The Survey of Enrollees was developed in 1999 to support VHA’s planning effort and to inform the VA EHCPM, VHA’s tool for projecting enrollment, utilization, and expenditures. Projections from the EHCPM are used to develop the medical care budget, analyze health policy scenarios, and inform management decisions affecting VHA’s delivery of care to Veterans. In addition to collecting basic demographic information about enrollees, the survey explores insurance coverage, VA and non-VA health care use, pharmaceutical use, attitudes and perceptions about VHA services (i.e., “Key Drivers”), perceived health status, and smoking habits of enrollees. Traditionally, this report reviews overall responses, as well as calculates responses by priority1
, age, income, and VISN in order to develop a “snapshot” of today’s enrollee.
When results may be impacted by changing environments, such as increasing United States (U.S.) unemployment, previous year’s results are shown to consider how the change may have impacted enrollee responses. This report also considers some enrollee perspectives or behaviors in the context of whether or not they have utilized VHA services within the last year (i.e., VA users and Non-VA users). While the overall profile of the typical enrollee continues to be that of an older, male Veteran from the Vietnam era, Veterans returning from current conflicts in Afghanistan and Iraq bring a new profile and set of expectations to the enrollee population. As will be seen in future chapters, they are younger and a greater portion of their population is female. Known as OEF/OIF/OND Veterans, these enrollees look for different attributes in a health care system, not the least of which is timely appointments. In order to increase VA’s understanding of enrolled OEF/OIF/OND Veterans, this report highlights the responses of OEF/OIF/OND Veterans for many survey questions. Where gender seems to influence responses, the difference between male and female responses is reported. This report is intended to provide a synopsis of all the information collected by the 2011 Survey of Enrollees in a user-friendly format. While an effort is made to suggest explanations for response patterns, this report is not intended to provide conclusions about enrollee perceptions and behaviors. However, it does attempt to point to areas which may be appropriate for further analysis.
1 As part of enrollment, Veterans are assigned a priority level which is based on a number of variables. This Priority level allows VA to balance demand for health care with resources, and may influence the eligibility for services. A full description of priorities can be found in Appendix C-1.
Office of the ADUSH for Policy and Planning
11 2011 Survey of Veteran Enrollees' Health and Reliance Upon VA

M e tho do lo gy The VHA Office of the ADUSH/P&P has conducted nine cycles2
of the Survey of Enrollees, with the first completed in 1999 and the last in 2011. These surveys are conducted under a multi-year Office of Management and Budget (OMB) authority. As with previous surveys, the 2011 Survey of Enrollees was an English-only, Computer-Assisted Telephone Interviewing (CATI) survey using a stratified design of enrollees to obtain a target of 42,000 completed interviews. ICF Macro, an ICF International Company, has provided technical and data collection services to VHA in support of the Survey of Enrollees since 2005.
Data for the 2011 survey was collected between March 4, 2011 and May 27, 2011. Interviewers called a total of 152,709 Veterans, from whom 43,6333
interviews were completed. Of these interviews, 2,614 were completed with a knowledgeable proxy instead of the listed Veteran because of a health or mental impairment that prevented the Veteran from participating in the interview. Of these proxy interviews, 1,736 were completed by the selected Veteran’s spouse.
Interviewed Veterans belonged to a stratified sample of 420,011 Veterans selected from the VHA Enrollment File. Enrollees were excluded from the sample if either of VA’s key Veteran data files, the Health Eligibility Center (HEC) file or the VA Vital Status File, contained a Date of Death. From this population, 298 strata based on VISN (21), enrollee type (2: pre or post)4
, priority group (7: 1-6, 7/8) and OEF/OIF/OND (2: Yes/No) were derived. The OEF/OIF/OND stratum was added in 2008 because analysis in 2005 and 2007 showed that this cohort of Veterans was under-represented among respondents. Veterans of these conflicts have been oversampled in the 2008, 2010, and 2011 surveys. The sample did not include Veterans living outside the United States or Puerto Rico or those Veterans for whom VA did not have a valid address.
In general, the characteristics of people who do not reply to a survey tend to differ from those who do participate in the survey process. Therefore, responses were adjusted statistically to account for what is referred to as “non-response bias” and is associated with non-participation. This weighting adjustment was primarily based on demographics and health care utilization administrative records. On average, interviews lasted 15.6 minutes. This was 2.5 minutes less that the 18.15 minute average interview duration in 2010, a decrease that is likely attributable to excluding questions regarding Activities of Daily Living/Instrumental Activities of Daily Living (ADL/IADL) in this survey cycle. The overall cooperation rate5
is based on 57,820 contacted eligible respondents and was 75 percent. This was a marked improvement from previous years, which have hovered around 60 percent for the last two years after dipping down to 50 percent in 2007 from 73 percent in 2005. Part of the drop in 2007 may be due to Veteran’s concerns after a laptop containing files with Veteran’s personal data was stolen in 2006. These files were not related to the Survey of Enrollees.
The improvement in cooperation rates may have been influenced by increased communication efforts to assure that all key offices in VA and that the Veterans Service Organizations were aware when the survey was fielded. In addition, the use of pre-notification letters, which were sent to each Veteran in the sample
2 Although a survey was completed in 2000, the sample size was not large enough to be appropriate for comparison purposes. Therefore, when previous year data is shown in this report, 2000 results are excluded and only eight years of data are shown. 3 Once a Veteran is contacted and agrees to complete the survey, the interview is seen through until completion, even if the target is met. Therefore, 1,633 more Veterans than the 42,000 targeted were surveyed. 4 Pre-enrollees are defined as those Veterans who used the VA Health Care System during fiscal years 1996, 1997, or 1998 or enrolled during the first six months of enrollment (October 1, 1998 to March 31, 1999). All other enrolled Veterans are considered Post-enrollees. 5 The cooperation rate is defined by the American Association for Public Opinion Research (AAPOR) as the proportion of completed interviews in the number of contacted eligible respondents.
Office of the ADUSH for Policy and Planning
12 2011 Survey of Veteran Enrollees' Health and Reliance Upon VA

beginning in 2010, likely had a positive impact on cooperation rates. These letters included Frequently Asked Questions with a toll-free number. The toll-free number was also left on answering machines after three attempts to reach the Veteran. Overview Exhibit 1 shows a comparison of enrollee population, sample size, and response/cooperation rates over the survey cycles beginning in 1999.
Overview Exhibit 1 Survey of Veteran Enrollees’ Health and Reliance Upon VA: Key Methodology Data 1999 2002 2003 2005 2007 2008 2010 2011
Enrollees represented 3,642,537 6,175,694 6,742,676 6,704,149 7,186,950 7,339,531 7,804,639 7,895,108
Enrolled population as
of: 2/3/99 12/31/01 12/31/02 12/31/04 9/30/06 4/30/08 9/30/2009 9/30/2010
Eligible Contacts 27,000 63,126 65,472 57,870 85,307 72,716 71,808 57,820
Completed Interviews 19,686 37,528 41,704 42,094 42,587 42,460 42,920 43,633
Cooperation Rate* N/A 59.4% 63.7% 72.7% 49.9% 58.4% 59.8% 75.0%
Survey Timeframe Mar 1999 Apr-May
2002 Aug-Sep
2003 Sep-Dec
2005 Jul-Sept
2007 Sept-Dec
2008 May-Aug
2010 Mar-May
2011 ** In 2008, an additional strata was added based on OEF/OIF/OND status * Based on AAPOR "cooperation rates" as defined in this section Source: 1999, 2002, 2003, 2005, 2007, 2008, and 2010 VHA Survey of Veteran Enrollees' Health and Reliance Upon VA Survey questions consisted of Introduction and Name Verification, Demographics, Economics, Period of Service, Health Status and Behaviors, Use of Non-VA Health Care Services, Types of Health Insurance Coverage, and Key Drivers (to making health care choices). These were the same questions as asked in 2010 with the exception of excluding questions related to ADL/IADL as noted previously. The full survey instrument can be found in the Appendix B-1. Results of the survey are weighted to represent the population of Veteran enrollees. The enrollee population at the time of the survey weighting (September 30, 2010) was 7,895,108. Information on the following attributes of the enrollee population and specific variables from the 2011 Survey of Enrollees are reported.
Priority Level Self-Reported Health Status Planned Future Use Age Prescription Drug Coverage Household Income Marital Status Outpatient Prescription Costs Race and Ethnicity Period of Service Prescription Medications Combat Status Employment Status Over-the-Counter Medications Key Drivers of Cigarette Smoking Enrollees’ Health Insurance Coverage: Care Decision Making - Medicaid - TRICARE/TRICARE For Life - Medicare - Medicare Part D - Private Insurance
Office of the ADUSH for Policy and Planning
13 2011 Survey of Veteran Enrollees' Health and Reliance Upon VA
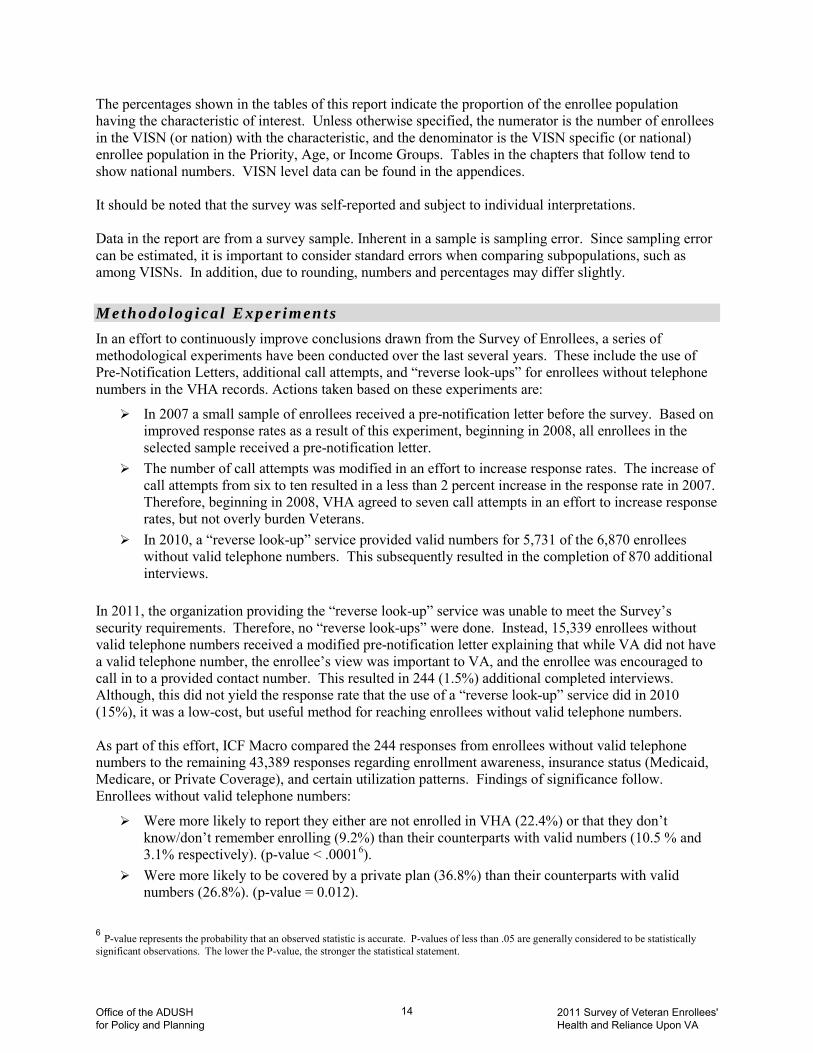
The percentages shown in the tables of this report indicate the proportion of the enrollee population having the characteristic of interest. Unless otherwise specified, the numerator is the number of enrollees in the VISN (or nation) with the characteristic, and the denominator is the VISN specific (or national) enrollee population in the Priority, Age, or Income Groups. Tables in the chapters that follow tend to show national numbers. VISN level data can be found in the appendices. It should be noted that the survey was self-reported and subject to individual interpretations. Data in the report are from a survey sample. Inherent in a sample is sampling error. Since sampling error can be estimated, it is important to consider standard errors when comparing subpopulations, such as among VISNs. In addition, due to rounding, numbers and percentages may differ slightly.
M e tho do lo g i ca l E xp e r im en t s In an effort to continuously improve conclusions drawn from the Survey of Enrollees, a series of methodological experiments have been conducted over the last several years. These include the use of Pre-Notification Letters, additional call attempts, and “reverse look-ups” for enrollees without telephone numbers in the VHA records. Actions taken based on these experiments are:
In 2007 a small sample of enrollees received a pre-notification letter before the survey. Based on improved response rates as a result of this experiment, beginning in 2008, all enrollees in the selected sample received a pre-notification letter.
The number of call attempts was modified in an effort to increase response rates. The increase of call attempts from six to ten resulted in a less than 2 percent increase in the response rate in 2007. Therefore, beginning in 2008, VHA agreed to seven call attempts in an effort to increase response rates, but not overly burden Veterans.
In 2010, a “reverse look-up” service provided valid numbers for 5,731 of the 6,870 enrollees without valid telephone numbers. This subsequently resulted in the completion of 870 additional interviews.
In 2011, the organization providing the “reverse look-up” service was unable to meet the Survey’s security requirements. Therefore, no “reverse look-ups” were done. Instead, 15,339 enrollees without valid telephone numbers received a modified pre-notification letter explaining that while VA did not have a valid telephone number, the enrollee’s view was important to VA, and the enrollee was encouraged to call in to a provided contact number. This resulted in 244 (1.5%) additional completed interviews. Although, this did not yield the response rate that the use of a “reverse look-up” service did in 2010 (15%), it was a low-cost, but useful method for reaching enrollees without valid telephone numbers. As part of this effort, ICF Macro compared the 244 responses from enrollees without valid telephone numbers to the remaining 43,389 responses regarding enrollment awareness, insurance status (Medicaid, Medicare, or Private Coverage), and certain utilization patterns. Findings of significance follow. Enrollees without valid telephone numbers:
Were more likely to report they either are not enrolled in VHA (22.4%) or that they don’t know/don’t remember enrolling (9.2%) than their counterparts with valid numbers (10.5 % and 3.1% respectively). (p-value < .00016
Were more likely to be covered by a private plan (36.8%) than their counterparts with valid numbers (26.8%). (p-value = 0.012).
).
6 P-value represents the probability that an observed statistic is accurate. P-values of less than .05 are generally considered to be statistically significant observations. The lower the P-value, the stronger the statistical statement.
Office of the ADUSH for Policy and Planning
14 2011 Survey of Veteran Enrollees' Health and Reliance Upon VA

In addition, using a review of administrative utilization records, it was noted that enrollees without valid telephone numbers were: Were less likely to use outpatient treatments for non-mental health and non-substance abuse
services (30.6%) than their counterparts with valid numbers (80.2%). (p-value < .0001). Were less likely to use outpatient treatments for mental health and substance abuse services
(4.3%) than their counterparts with valid numbers (16.5%). (p-value < .0001). Were less likely to use pharmacy services (27.9%) than their counterparts with valid numbers
(72.0%). (p-value < .0001).
En ro l lm en t Although all individuals included in the survey sample were included in VHA’s enrollment file, the survey asked each respondent if they are enrolled in VA Health Care. Interestingly, only 81 percent of enrollees replied that they were. As can be seen in the Overview Exhibit 2, almost 15 percent, or 1,167,646 enrollees, said they were not enrolled. Since VA Health Care is considered creditable coverage under the newly implemented Affordable Care Act (ACA), the implications of this finding might be a subject for further consideration. Overview Exhibit 2 Enrollee Understanding of Enrollment Status
Are you enrolled in VA health care? Response Count/Percent
Yes 6,397,153
81.0%
No 1,167,646
14.8%
I don't remember enrolling 41,326 0.52%
Don't know 285,433
3.6%
Refused 3,551 0.04%
Total 7,895,108 Certain comparisons among known enrollee characteristics stood out in relation to responses to this question:
Seventeen percent of enrollees with public or private insurance benefits other than VA said they were not enrolled as compared to 7 percent of those without any other public or private insurance benefits.
Twenty-one percent of enrolled OEF/OIF/OND Veterans indicated they were not enrolled as compared to 14 percent of all other enrollees.
Twenty percent of enrollees under the age of 45 said they were not enrolled compared to 15 percent of enrollees 65 or older and 13 percent of enrollees between the ages of 45 and 64.
As can be seen in Overview Exhibit 3, a higher percentage of enrollees in Priority groups 3, 6, and 7/8 reported that they are not enrolled. Some service-connected Veterans are automatically enrolled in VA, so this may explain some of the discrepancy.
Office of the ADUSH for Policy and Planning
15 2011 Survey of Veteran Enrollees' Health and Reliance Upon VA

Overview Exhibit 3
Finally, the difference in responses can be seen when broken out by VISN in Overview Map 1, with only 10 percent of enrollees in VISN 9 indicating they were not enrolled and 22 percent of enrollees in VISN 3 indicating they were not enrolled.
7.1% 83,514
13.6% 85,201
18.6% 207,001
7.1% 14,346
11.2% 238,188
21.3% 101,836
20.0% 437,740
P1 P2 P3 P4 P5 P6 P7 - 8 Priority Group
Enrollees who said they are NOT enrolled in VA Health Care (count and percent by Priority)
Office of the ADUSH for Policy and Planning
16 2011 Survey of Veteran Enrollees' Health and Reliance Upon VA

Overview Map 1
Office of the ADUSH for Policy and Planning
17 2011 Survey of Veteran Enrollees' Health and Reliance Upon VA

This page intentionally left blank.
Office of the ADUSH for Policy and Planning
18 2011 Survey of Veteran Enrollees'' Health and Reliance Upon VA

CCC hhh aaa ppp ttt eee rrr 111 Demographic and Socioeconomic Characteristics of the
Enrollee Population Demographic and socioeconomic information provides a unique and useful view into the characteristics of enrollees. Below are notable demographic and socioeconomic statistics.
Women represented 6 percent of the enrollee population. The largest proportion of enrollees was married (62%) and had one dependent living with them
(42%). Enrollees served in the military for an average of 6.5 years, and 43 percent were exposed to
combat during their service. On average, enrollees were released from active duty 37 years ago. The majority of enrollees served during the Vietnam era (41%).
D em o gr aph i c O v erv i ew As noted in the overview, the results of the 2011 Survey of Enrollees presented in this report are weighted to represent the population of enrollees. The enrollee population, at the time of the survey weighting (September 30, 2010) was 7,895,108, an increase of 90,469 enrollees since the 2010 report. Exhibit 1.1 2011 Survey of Enrollees Weighted Count and Percent of Enrollees
Priority Group 1 – 3 4 - 6 7 – 8 National
2,915,270 2,793,656 2,186,183
7,895,108
36.9% 35.4% 27.7%
Age Group < 45 45 - 64 65 +
1,098,642 3,251,995 3,544,470 13.9% 41.2% 44.9%
Income Group <$36,000 $36,000+ DK/Ref 4,051,276 2,926,525 917,307
51.3% 37.1% 11.6% Don’t Know/Refused to Answer (DK/Ref)
Note: Age is calculated as of September 30, 2010; as this is the date of the base file used to draw the sample. Below are the noted survey data statistics for Priority Groups, age groups, and income groups.
At 37 percent, the largest percentage of enrollees was classified into Priority Groups 1-3; however, this was closely followed by Priority Groups 4-6 at 35 percent.
Roughly 45 percent of enrollees were age 65 or over, 41 percent were 45-64, and 14 percent were under 45 years of age.
More than half of the enrollee population (51%) reported having an average household income of less than $36,000. Note: Twelve percent of the enrollees did not provide a response to the income question.
Profile of the Average Enrollee Male 62 Years Old White, Non-Hispanic Married with Dependents Annual Household Income of
$42,937
Office of the ADUSH for Policy and Planning
19 2011 Survey of Veteran Enrollees' Health and Reliance Upon VA

Al l E nr o l l e es b y VI SN In 2011, data revealed the highest percentage of enrollees (9%) resided in VISN 8, followed by VISN 16 (8%). The VISNs with the lowest percentage of enrollees were VISNs 2, 5, and 19, each with 3 percent of enrollee population. Map 1.1
Office of the ADUSH for Policy and Planning
20 2011 Survey of Veteran Enrollees' Health and Reliance Upon VA
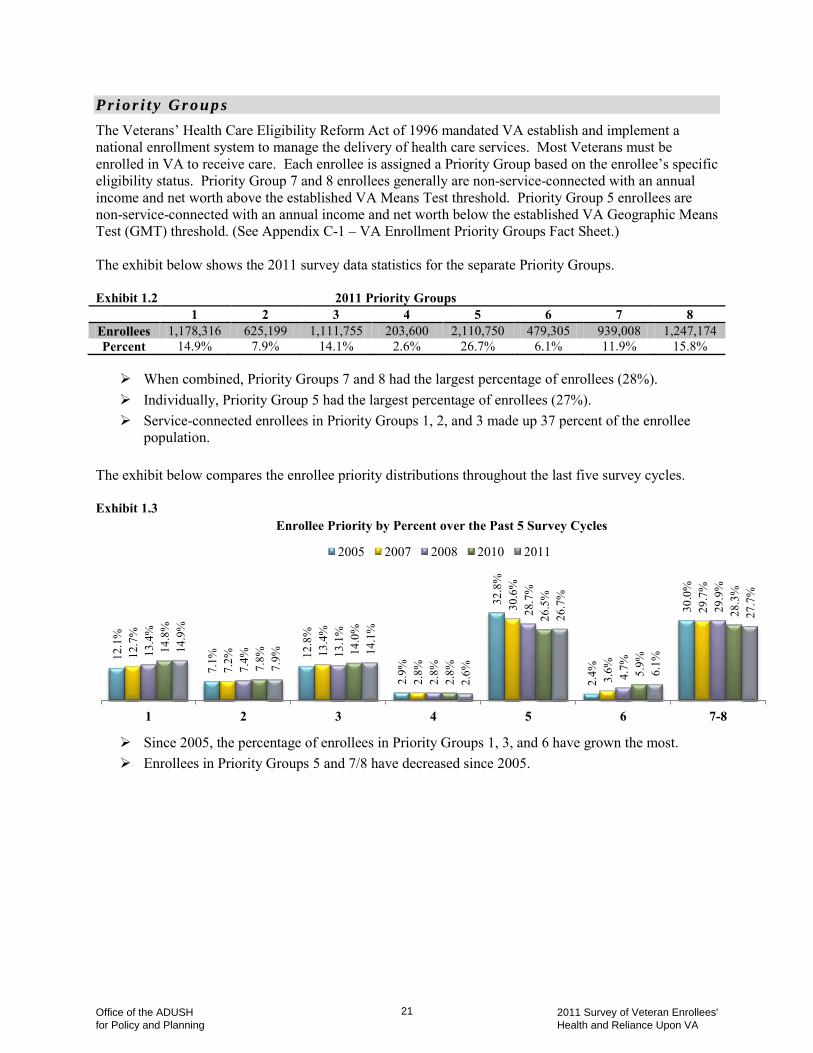
P r i or i t y Gr oup s The Veterans’ Health Care Eligibility Reform Act of 1996 mandated VA establish and implement a national enrollment system to manage the delivery of health care services. Most Veterans must be enrolled in VA to receive care. Each enrollee is assigned a Priority Group based on the enrollee’s specific eligibility status. Priority Group 7 and 8 enrollees generally are non-service-connected with an annual income and net worth above the established VA Means Test threshold. Priority Group 5 enrollees are non-service-connected with an annual income and net worth below the established VA Geographic Means Test (GMT) threshold. (See Appendix C-1 – VA Enrollment Priority Groups Fact Sheet.) The exhibit below shows the 2011 survey data statistics for the separate Priority Groups. Exhibit 1.2 2011 Priority Groups
1 2 3 4 5 6 7 8 Enrollees 1,178,316 625,199 1,111,755 203,600 2,110,750 479,305 939,008 1,247,174 Percent 14.9% 7.9% 14.1% 2.6% 26.7% 6.1% 11.9% 15.8%
When combined, Priority Groups 7 and 8 had the largest percentage of enrollees (28%). Individually, Priority Group 5 had the largest percentage of enrollees (27%). Service-connected enrollees in Priority Groups 1, 2, and 3 made up 37 percent of the enrollee
population.
The exhibit below compares the enrollee priority distributions throughout the last five survey cycles.
Exhibit 1.3
Since 2005, the percentage of enrollees in Priority Groups 1, 3, and 6 have grown the most. Enrollees in Priority Groups 5 and 7/8 have decreased since 2005.
12.1
%
7.1%
12.8
%
2.9%
32.8
%
2.4%
30.0
%
12.7
%
7.2%
13.4
%
2.8%
30.6
%
3.6%
29.7
%
13.4
%
7.4%
13.1
%
2.8%
28.7
%
4.7%
29.9
%
14.8
%
7.8%
14.0
%
2.8%
26.5
%
5.9%
28.3
%
14.9
%
7.9%
14.1
%
2.6%
26.7
%
6.1%
27.7
%
1 2 3 4 5 6 7-8
Enrollee Priority by Percent over the Past 5 Survey Cycles
2005 2007 2008 2010 2011
Office of the ADUSH for Policy and Planning
21 2011 Survey of Veteran Enrollees' Health and Reliance Upon VA

A g e Gr oup s The exhibit below compares the enrollee age distributions throughout the last five survey cycles. Exhibit 1.4
In general, this distribution has held steady from year to year. In 2011, the percentage of enrollees in the under 45 age group increased slightly. The survey estimate of the percentage of enrollees in the 45-64 age group decreased slightly. Between 2010 and 2011, the percentage of enrollees in the 65 or over age group remained
unchanged at 45 percent. Some differences between the general U.S. population (excluding citizens under the age 18) in 2010 and the VHA enrollee population in 2010 are noted below.
As of September 30, 2010, the average age of enrollees is 62 years; the median age of enrollees is 63 years, while the median age of the U.S. population during the same time frame is 37 years.
The percentage of enrollees 65 and over was much higher (45%) than the percentage of Americans 65 and over within the total U.S population (13%).
The percentage of enrollees aged 50-65 years was also much higher (36%) than the percentage of Americans aged 50-65 years within the total U.S population (19%).
The percentage of enrollees aged 30-49 years (14%) is also lower than the percentage of Americans aged 30-49 years (27%).
The percentage of enrollees under the age of 30 (5%) is much lower than the percentage of Americans under the age of 30 (17%).
Exhibit 1.5
Note: U.S. Population percentages above do not include American citizens under the age of 18. Therefore, U.S population does not total 100 percent.
14.0%
41.0% 45.0%
11.3%
42.5% 46.1%
13.9%
43.4% 42.7%
13.4%
41.6% 45.0%
13.9%
41.2% 44.9%
<45 45-64 65+ Age
Enrollee Age by Percent over the Past 5 Survey Cycles 2005 2007 2008 2010 2011
16.7%
4.8%
27.2%
14.1% 19.0%
36.2%
13.1%
44.9%
U.S. Enrollee
U.S. and Enrollee Age Groups <30 30-49 50-64 65+
Office of the ADUSH for Policy and Planning
22 2011 Survey of Veteran Enrollees' Health and Reliance Upon VA

En ro l l e es Ag e 6 5 or O ve r b y VI S N The percentage of enrollees aged 65 or over ranged from 56 percent of the enrollee population in VISN 4 to 35 percent of the enrollee population in VISN 7. VISNs 1 and 3 also had a high percentage (54%) of their population aged 65 or over. Map 1.2
Office of the ADUSH for Policy and Planning
23 2011 Survey of Veteran Enrollees' Health and Reliance Upon VA
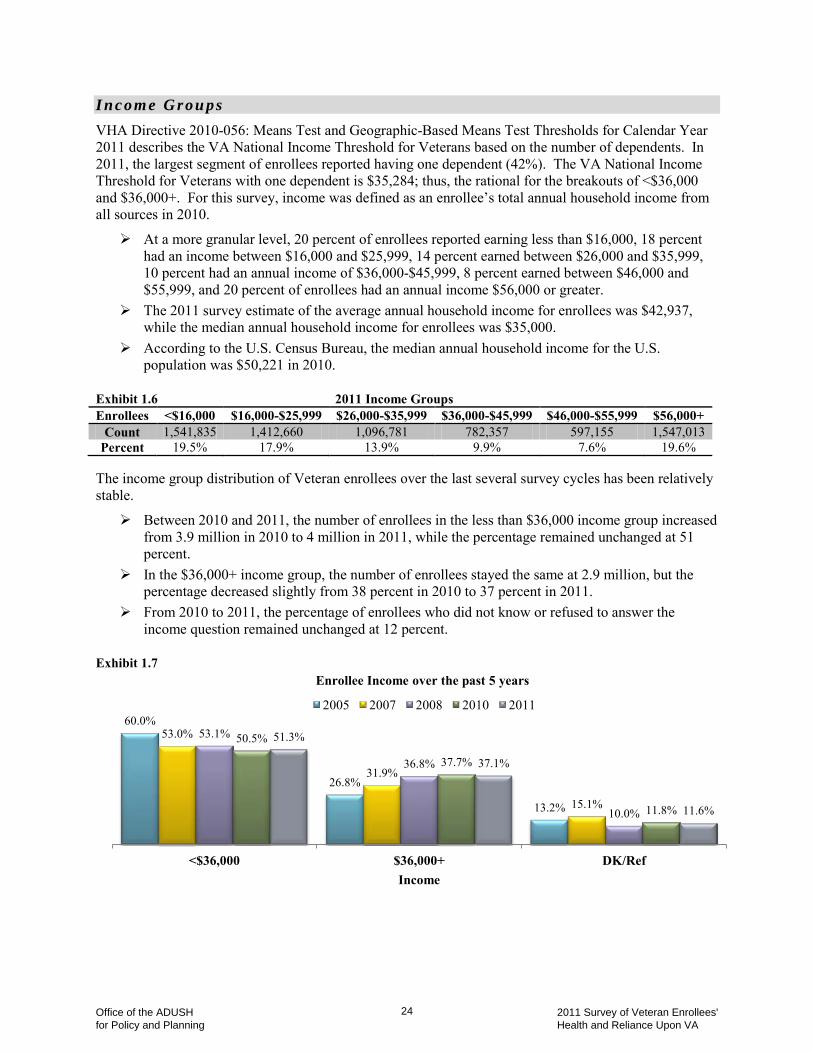
I nc om e G rou ps VHA Directive 2010-056: Means Test and Geographic-Based Means Test Thresholds for Calendar Year 2011 describes the VA National Income Threshold for Veterans based on the number of dependents. In 2011, the largest segment of enrollees reported having one dependent (42%). The VA National Income Threshold for Veterans with one dependent is $35,284; thus, the rational for the breakouts of <$36,000 and $36,000+. For this survey, income was defined as an enrollee’s total annual household income from all sources in 2010.
At a more granular level, 20 percent of enrollees reported earning less than $16,000, 18 percent had an income between $16,000 and $25,999, 14 percent earned between $26,000 and $35,999, 10 percent had an annual income of $36,000-$45,999, 8 percent earned between $46,000 and $55,999, and 20 percent of enrollees had an annual income $56,000 or greater.
The 2011 survey estimate of the average annual household income for enrollees was $42,937, while the median annual household income for enrollees was $35,000.
According to the U.S. Census Bureau, the median annual household income for the U.S. population was $50,221 in 2010.
Exhibit 1.6 2011 Income Groups Enrollees <$16,000 $16,000-$25,999 $26,000-$35,999 $36,000-$45,999 $46,000-$55,999 $56,000+
Count 1,541,835 1,412,660 1,096,781 782,357 597,155 1,547,013 Percent 19.5% 17.9% 13.9% 9.9% 7.6% 19.6%
The income group distribution of Veteran enrollees over the last several survey cycles has been relatively stable.
Between 2010 and 2011, the number of enrollees in the less than $36,000 income group increased from 3.9 million in 2010 to 4 million in 2011, while the percentage remained unchanged at 51 percent.
In the $36,000+ income group, the number of enrollees stayed the same at 2.9 million, but the percentage decreased slightly from 38 percent in 2010 to 37 percent in 2011.
From 2010 to 2011, the percentage of enrollees who did not know or refused to answer the income question remained unchanged at 12 percent.
Exhibit 1.7
60.0%
26.8%
13.2%
53.0%
31.9%
15.1%
53.1%
36.8%
10.0%
50.5%
37.7%
11.8%
51.3%
37.1%
11.6%
<$36,000 $36,000+ DK/Ref Income
Enrollee Income over the past 5 years
2005 2007 2008 2010 2011
Office of the ADUSH for Policy and Planning
24 2011 Survey of Veteran Enrollees' Health and Reliance Upon VA
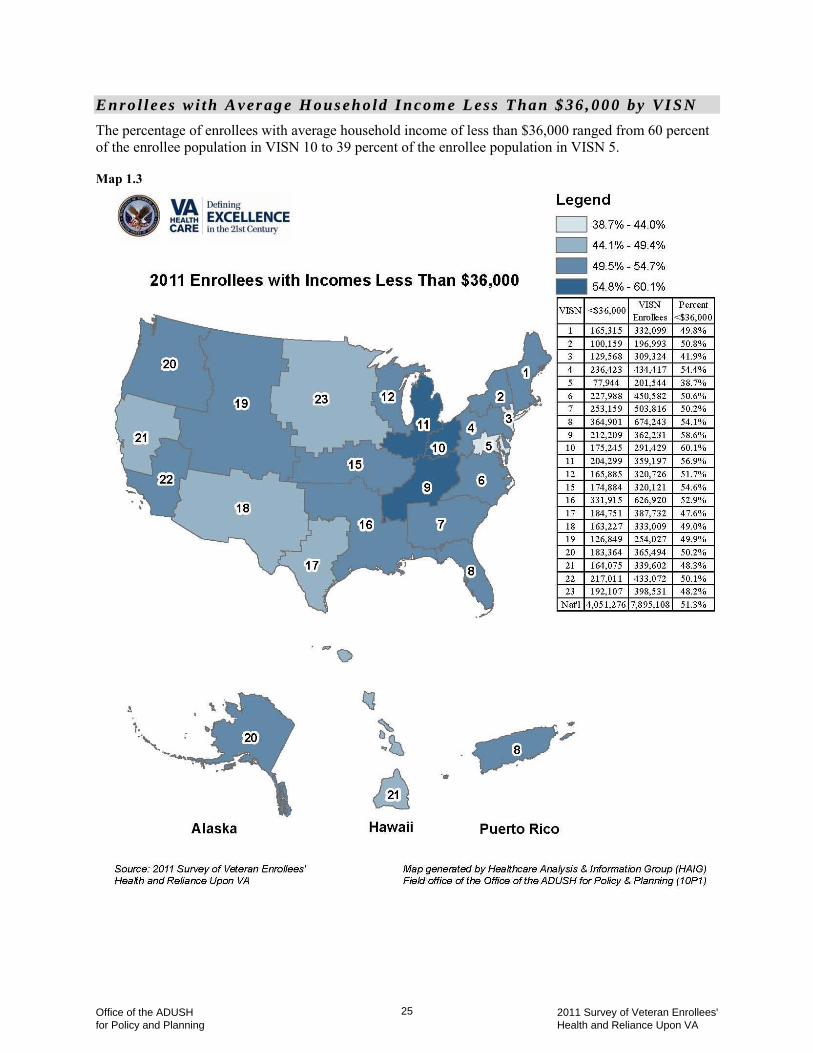
En ro l l e es w i th A v er ag e H ous eh o ld I nc om e L ess T han $ 36 , 00 0 by VI SN The percentage of enrollees with average household income of less than $36,000 ranged from 60 percent of the enrollee population in VISN 10 to 39 percent of the enrollee population in VISN 5. Map 1.3
Office of the ADUSH for Policy and Planning
25 2011 Survey of Veteran Enrollees' Health and Reliance Upon VA

Et hn i c i t y an d Ra c e The 2011 survey asked enrollees to best describe their Ethnicity and Race through a series of questions.
First, enrollees were asked if they would identify themselves as Hispanic or Latino. Six percent of the enrollees responded “yes” to this question.
The next set of questions asked enrollees to describe their race. They were told that they could choose more than one. As a result, 3 percent of enrollees chose more than one race.
Eighty-one percent of the enrollees responded that they were White and 12 percent responded that they were African American.
Other races combined including American Indian or Alaska Native (4%), Asian (1%), and Native Hawaiian or other Pacific Islander (1%), made up 6 percent of the enrollee population.
Exhibit 1.8
Comparisons of Ethnicity and Race with the general U.S. population showed the following differences.
Overall, the percentage of enrollees who identified themselves as Hispanic or Latino (6%) was notably less in comparison to the U.S. population (16%) according to the U.S. Census Bureau.
In younger age groups, the percentage of Hispanic or Latino enrollees has increased, reaching a high of 16.3% for Veterans under the age of 30.
The latest census data report that 72 percent of the American population is White, African Americans make up 13 percent, and all other races equal 6 percent of the total population (Source: U.S. Census Bureau QuickFacts, 2010 Estimates based on 2000 Census of Population and Housing).
The percentage of African-American enrollees aged 30-49 (17%) and aged 50-64 (16%) exceeds their representation in the U.S. population (13%).
Three percent of the U.S. population would also indentify themselves by two or more races according to the U.S. Census Bureau.
6.3%
80.8%
11.7% 4.2% 0.95% 0.7% 2.7%
Ethnicity: Hispanic or
Latino
White Black/African American
Native American/
Alaska Native
Asian Native Hawaiian/
Other Pacific
Total enrollees who chose > 1
race option
Any Mentioned Ethnicity and Race
Office of the ADUSH for Policy and Planning
26 2011 Survey of Veteran Enrollees' Health and Reliance Upon VA

Exhibit 1.9 Ethnicity and Race of Enrollees by Age
White <30 30-49 50-64 65+ Total
290,893 817,209 2,182,984 3,092,014 6,383,099 76.8% 73.3% 76.4% 87.2% 80.8%
Black/African American <30 30-49 50-64 65+ Total
37,731 190,376 458,033 240,458 926,598 10.0% 17.1% 16.0% 6.8% 11.7%
All Other Races <30 30-49 50-64 65+ Total
35,416 87,212 203,350 139,826 465,803 9.4% 7.8% 7.1% 3.9% 5.9%
Ethnicity: Hispanic or Latino <30 30-49 50-64 65+ Total
61,533 117,729 168,670 145,837 493,768 16.3% 10.6% 5.9% 4.1% 6.3%
Age Group Total (Denominator) 378,579 1,114,212 2,857,882 3,544,435 7,895,108
M ar i ta l S ta t us an d D e p end en t s According to a report by the Centers for Disease Control and Prevention, married adults are healthier than divorced, widowed, or never married adults. The 2011 survey captured information best describing enrollees’ current marital status.
The marital status of enrollees has remained relatively unchanged since the 2010 survey. Most enrollees (62%) reported being married; this was followed by 16 percent who reported
being divorced, 11 percent who reported being single, and 7 percent who reported being widowed.
In comparison to the U.S. population, the U.S. Census Bureau reported 54 percent of the U.S. population being married; this was followed by 27 percent being single, 10 percent being divorced, and 6 percent being widowed. This is somewhat reflective of the fact that enrollees tend to be older than the general U.S. population.
Exhibit 1.10
Enrollees were also asked to disclose the number of current dependents they have. A “dependent” was defined as anyone who relied on the enrollee for at least half of that person’s financial support; respondents were instructed not to include themselves.
Over half of the enrollee population (59%) indicated that they have one or more dependents, with one dependent (42%) being the most common response.
62.4%
16.1% 11.4% 7.2% 2.7% 0.3%
Married Divorced Single Widowed Separated DK/Ref
Marital Status
Office of the ADUSH for Policy and Planning
27 2011 Survey of Veteran Enrollees' Health and Reliance Upon VA

F em al e Enr o l l e e s According to the VA Office of Policy and Planning, the population of female Veterans has increased over the last decade. The female enrollee population has increased as well.
Six percent (485,964) of the total enrollee population were female. Female enrollees represented 12 percent of the total OEF/OIF/OND enrollee population, but only
6 percent of the non-OEF/OIF/OND enrollee population. In terms of age, female enrollees were notably younger than male enrollees. The median age for
female enrollees was 50 years compared to the median age for male enrollees which was 64 years, a difference of 14 years.
Exhibit 1.11
39 36 50
64
Female Male
Age
s
2011 U.S. and Enrollee Median Age by Gender U.S. Enrollee
Office of the ADUSH for Policy and Planning
28 2011 Survey of Veteran Enrollees' Health and Reliance Upon VA

F em al e Enr o l l e e Po pu l a t i on b y VIS N The percentage of female enrollees ranged from 9 percent of the enrollee population in VISN 17 to 4 percent of the enrollee population in VISNs 3, 9, and 10. Map 1.4
Office of the ADUSH for Policy and Planning
29 2011 Survey of Veteran Enrollees' Health and Reliance Upon VA

A ct i ve Du t y P er io d o f S e r v i c e /C om bat Ex po sur e Enrollees were asked to provide the best description of their term of active duty military service. “One term of service” would be defined as a one-time discharge from the military after continuous service. In some cases, enrollees have experienced breaks in service, and therefore have served multiple terms of service. For that reason, enrollees were asked a series of questions to determine how many terms of active duty military service they served. They were asked not to include Reserve or National Guard training, or drill periods, unless they were “activated” at the time.
Most enrollees (84%) served only one continuous tour of duty, with no breaks in service. It should be noted that the term of service often contains more than one period of service. For example, a Veteran serving during the end of the Vietnam era would have two periods of service that includes the Vietnam War and the period between Vietnam and the Gulf War. To determine period of service, enrollees were asked to provide the “year” they started and ended each of their terms of active duty military service.
The single largest segment of the enrollee population (41%) served during the Vietnam era. Of the remaining periods of service, 28 percent served between Vietnam and Gulf War, 25
percent served between Korea and Vietnam, 17 percent served during Gulf War, and 14 percent served during the Korean War.
Thirteen percent served post 2001 in the current period of service; this includes Veterans of OEF/OIF/OND.
Exhibit 1.12
Note: Percentages do not total 100% because enrollees may have responded with multiple periods of service.
Following each question regarding their active duty military service, enrollees were asked if they were ever in or exposed to combat during this term.
Forty-three percent of enrollees reported exposure to combat during their military service. A breakout of Any Mentioned Active Duty Period of Service and Exposure to Combat by VISN
can be found in the Appendix Table 1.3.
0.9% 9.2% 6.1%
13.9%
25.3%
40.6%
27.6%
16.7% 12.6%
Pre- WWII
WWII Era
Between WWII
and Korean
Korean War Era
Between Korea
and Vietnam
Vietnam Era
Between Vietnam and Gulf
War
Gulf War Era
Current Era
(Post 2001)
Any Mentioned Active Duty Period of Service Combat Status 42.5%
Office of the ADUSH for Policy and Planning
30 2011 Survey of Veteran Enrollees' Health and Reliance Upon VA

O EF/ O IF/ O ND Enr o l l e e s Operation Enduring Freedom (OEF) in Afghanistan and Operation Iraqi Freedom (OIF) are current military campaigns. OEF began in October 2001. OIF began on March 20, 2003, and continued until 2010, when Operation New Dawn (OND) began, reflecting a reduced U.S. role in Iraq. This enrollee population is distinct from those who reported a period of service since 2001 (current era), as not all current era enrollees have OEF/OIF/OND status. OEF/OIF/OND represents 68 percent of the total 997,270 enrollees who have served since 2001.
Nine percent (676,527) of the total enrollee population served in OEF/OIF/OND conflicts. Of the 1,098,642 enrollees who are 44 years old or younger, almost half of them (49%) served in
OEF/OIF/OND conflicts. The average age of enrollees, who served in OEF/OIF/OND conflicts, is 35 years. While only 6 percent of the total enrollee population described themselves as Hispanic or Latino,
13 percent of the OEF/OIF/OND enrollee population indentifies themselves as Hispanic or Latino, which is more than double the non-OEF/OIF/OND enrollee population.
OEF/OIF/OND enrollees self-reported an unemployment rate of 16 percent, which was less than the unemployment rate of the total enrollee population (22%), but greater than the unemployment rate for the general U.S. population (9%).
Office of the ADUSH for Policy and Planning
31 2011 Survey of Veteran Enrollees' Health and Reliance Upon VA

En ro l l e es in OE F/O IF /O N D Con f l i c t s b y VI SN The percentage of OEF/OIF/OND enrollees ranged from 13 percent of the enrollee population in VISNs 17 and 19 to 6 percent of the enrollee population in VISNs 4, 8, and 10. Map 1.5
Office of the ADUSH for Policy and Planning
32 2011 Survey of Veteran Enrollees' Health and Reliance Upon VA

Em pl o ym en t S t a tu s According to the American Psychological Association, research suggests that both physical and mental health is associated with socioeconomic status. Starting in 2005, in order to better understand the socioeconomic characteristics of the enrollee population, a question was asked regarding employment status.
The majority of enrollees (60%) are not in the labor force, which is defined as currently not employed (i.e., retired, a homemaker, student, etc.).
Thirty-one percent of the total enrollee population is employed, either full or part time. Nine percent of all enrollees are unemployed; this is not the unemployment rate, which is the
percent of the unemployed population in the labor force. Exhibit 1.13
*The percent of unemployed enrollees does not reflect the unemployment rate because it is a subset of the entire enrollee population; unemployment rates reflect only that part of the population that is in the labor force. U n em plo ym e n t Ra te The unemployment rate is defined by the Bureau of Labor Statistics (BLS) of the U.S. Department of Labor as the percent of the labor force that is unemployed. More precisely, the unemployment rate is the number of unemployed persons divided by the labor force, where the labor force is the number of unemployed persons plus the number of employed persons.
The national unemployment rate for enrollees is 22 percent. The average annual U.S. civilian unemployment rate was 9 percent in July of 2011. The unemployment rate for enrollees rose every year except from 2007 to 2008, while the
unemployment rate also rose every year except from 2005 to 2007 for the general U.S. population.
While the general U.S. population unemployment rate began to trend downwards in 2011, the enrollee unemployment rate rose by two percentage points between 2010 and 2011.
The unemployment rate amongst enrollees has been at least twice that of the general U.S. population since 2005.
19.9%
3.1% 4.9% 2.9% 8.8%
59.5%
0.9%
Employed Full Time
Self-Employed Full Time
Employed Part Time
Self-Employed Part Time
*Unemployed Not in the Labor Force
DK/Ref
Employment Status
Office of the ADUSH for Policy and Planning
33 2011 Survey of Veteran Enrollees' Health and Reliance Upon VA

Exhibit 1.14
Exhibits 1.15 reviews unemployment rates by Priority Groups and shows the highest unemployment rate for enrollees in Priority Group 4 (53%). Exhibit 1.15 Unemployment and Unemployment Rate by Priority Groups
Category 1 2 3 4 5 6 7 8 Enrollees in the Labor
Force 379,655 339,293 587,153 35,623 792,117 294,085 249,250 452,933
Unemployed Enrollees 105,545 49,945 95,047 18,913 293,164 40,505 45,985 45,918 Unemployment Rate 27.8% 14.7% 16.2% 53.1% 37.0% 13.8% 18.4% 10.1%
Exhibit 1.16 shows unemployment rates by age, with enrollees under the age of 30 or between the
ages of 50 and 64 having the highest unemployment rates. When reviewed by period of service (Exhibit 1.17), enrollees from the Vietnam Era and from
between Vietnam and the Gulf War had the highest unemployment rate. Although Current Era enrollees’ unemployment rate was almost 18 percent, enrollees with
OEF/OIF/OND status had a slightly lower unemployment rate (16%).
Exhibit 1.16 Unemployment and Unemployment Rate by Age Category <30 30-49 50-64 65+
Enrollees in the Labor Force 270,388 909,325 1,485,663 464,734 Unemployed Enrollees 65,518 174,786 377,812 76,906 Unemployment Rate 24.2% 19.2% 25.4% 16.6%
Exhibit 1.17 Unemployment and Unemployment Rate by Period of Service
Category WWII
Between WWII
and Korea
Korean War Era
Between Korea
and Vietnam
Vietnam Era
Between Vietnam and Gulf
War
Gulf War Era
Current Era
(Post 2001)
OEF/ OIF/ OND
Enrollees in the Labor
Force 31,054 32,673 96,182 315,182 1,211,822 1,398,753 1,030,993 784,792 536,630
Unemployed Enrollees 4,887 5,291 13,037 53,962 289,415 298,653 168,798 138,251 83,481
Unemployment Rate 15.7% 16.2% 13.6% 17.1% 23.9% 21.4% 16.4% 17.6% 15.6%
5.4% 4.4% 5.0% 9.9% 9.4%
15.6% 17.1% 15.4%
20.2% 22.2%
2005 2007 2008 2010 2011 Year
U.S. and Enrollee Unemployment Rate
U.S. Enrollee
Office of the ADUSH for Policy and Planning
34 2011 Survey of Veteran Enrollees' Health and Reliance Upon VA
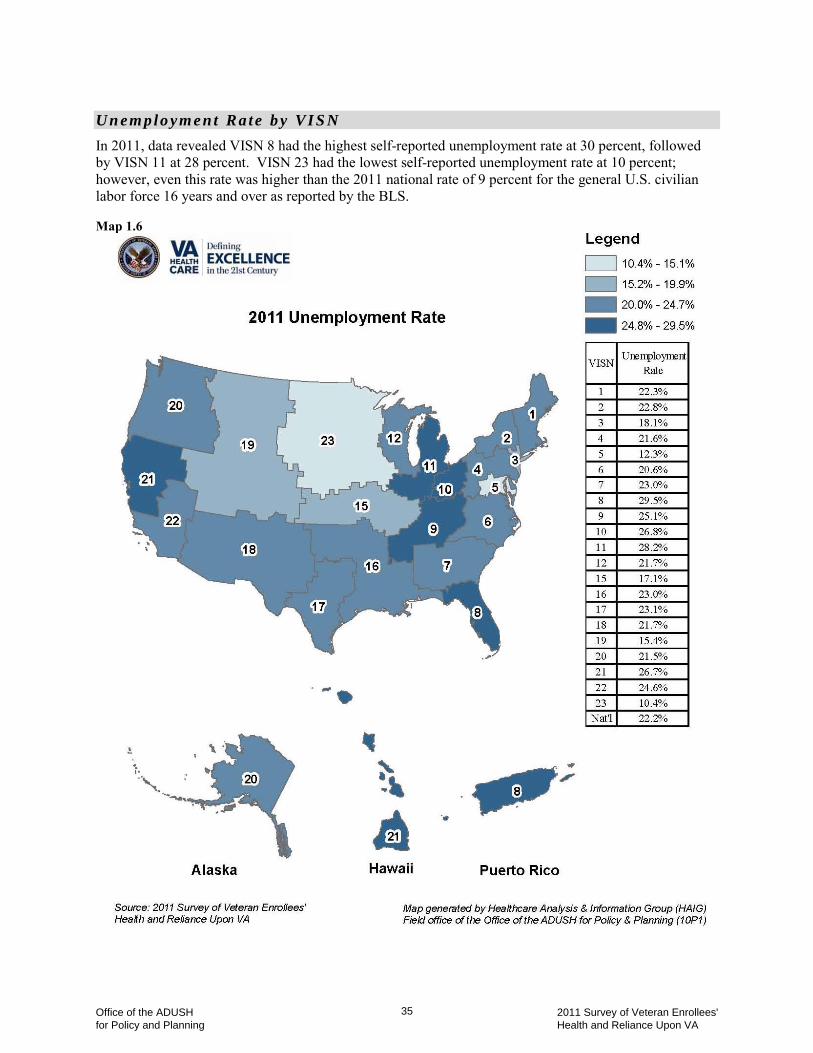
U n em plo ym e n t Ra te b y VI S N In 2011, data revealed VISN 8 had the highest self-reported unemployment rate at 30 percent, followed by VISN 11 at 28 percent. VISN 23 had the lowest self-reported unemployment rate at 10 percent; however, even this rate was higher than the 2011 national rate of 9 percent for the general U.S. civilian labor force 16 years and over as reported by the BLS. Map 1.6
Office of the ADUSH for Policy and Planning
35 2011 Survey of Veteran Enrollees' Health and Reliance Upon VA

This page intentionally left blank.
Office of the ADUSH for Policy and Planning
36 2011 Survey of Veteran Enrollees'' Health and Reliance Upon VA

CCC hhh aaa ppp ttt eee rrr 222
Health Status, Key Drivers of Enrollees’ Health Care Decision Making, and Planned Future Use of VA Health Care Services
An individual Veteran’s utilization of health care is partly explained both by perceived health status and by attitudes about health care providers. Accordingly, a section of the Survey of Enrollees is focused on self-reported health status, responses to a series of questions that are considered “key drivers” of VA utilization, and enrollees’ current and planned use of VHA health care services. Responses are discussed by age, priority, income, gender, VISN, and OEF/OIF/OND status. Enrollees were more likely to report a positive health status (Excellent/Very Good/Good) and less likely to concur with “key driver” statements related to VA utilization if they were:
Younger (under age 45) Veterans of OEF/OIF/OND Enrolled as Priority 7 or 8
Earning a household income of $36,000 or more Female
P e r c e i v ed H ea l th S t a tu s Enrollees were asked to rate their current health status compared to other people their own age using a range from excellent to poor. As shown in Exhibit 2.1, most enrollees (30%) perceived their health status as “good.” Exhibit 2.1 Perceived Health Status
Category Count Percent Excellent 899,711 11.4%
Very Good 1,911,897 24.2% Good 2,329,944 29.5% Fair 1,699,010 21.5% Poor 1,018,136 12.9%
DK/Refused 36,411 0.3% Total 7,895,108 100%
Overall, in 2011, 65 percent of Veteran enrollees reported “excellent, very good, or good” health status and, as can be seen in Exhibit 2.2, the percentage of enrollees reporting this positive health status has not changed by more than a percentage point in the last four survey cycles.
Office of the ADUSH for Policy and Planning
37 2011 Survey of Veteran Enrollees' Health and Reliance Upon VA

Exhibit 2.2
Source: 1999, 2002, 2003, 2005, 2007, 2008, 2010, and 2011 VHA Survey of Veteran Enrollees' Health and Reliance Upon VA However, there have been some slight downward trends in the last three survey cycles within the “excellent, very good, or good” categories, with a lower percentage of enrollees indicating “excellent” and more enrollees indicating “very good.” Enrollees reporting “good” were approximately the same in 2011 as in 2008. Exhibit 2.3
P e r c e i v ed H ea l th S t a tu s b y Pr i or i t y Gr ou p A Veteran’s enrollment priority group assignment is based on disability and income, among other factors. Therefore, it is not surprising that health status perception grows more positive for enrollees in priority groups 7 and 8, as these tend to be Veterans with higher incomes and without service connected disabilities. Exhibit 2.4 Enrollees Reporting “Excellent/Very Good/Good” Health Status Perceptions
(Count and Percent by Priority) 1-3 4-6 7-8
1,736,060 1,768,807 1,636,685 59.6% 63.3% 74.9%
Denominator is the national enrollee population by income (see Appendix Table 1.1)
Although response patterns have been consistent in past survey cycles, this survey cycle showed a slight decrease in the percentage of Priority 7-8 enrollees with a positive health status perception and a slight increase in the percentage of Priority 1-3 enrollees with positive health status perceptions.
56.4% 62.2% 65.0% 62.8% 64.4% 65.2% 65.3% 65.1%
42.1% 36.4% 34.4% 36.5% 34.9% 34.4% 34.2% 34.4%
1999 2002 2003 2005 2007 2008 2010 2011
Perceived Health Status Year Comparison Excellent/Very Good/Good Fair/Poor
12.6%
23.2% 29.4%
13.0%
23.6% 28.7%
11.4%
24.2% 29.5%
Excellent Very Good Good
Perceived Health Status of “Excellent/Very Good/Good” by Last Three Survey Cycles
2008 2010 2011
Office of the ADUSH for Policy and Planning
38 2011 Survey of Veteran Enrollees' Health and Reliance Upon VA

Exhibit 2.5
P e r c e i v ed H ea l th S t a tu s b y A g e Gr oup Younger enrollees (aged 45 or less) were more likely to report a positive health status compared to enrollees in other age groups, as shown in the Exhibit 2.6. Exhibit 2.6 Enrollees Reporting “Excellent/Very Good/Good” Health Status Perceptions
(Count and Percent by Age) < 45 45 - 64 65+
782,403 1,972,598 2,386,551 71.2% 60.7% 67.3%
Denominator is the national enrollee population by age (see Appendix Table 1.1)
Enrollees in the 45 - 64 age group have consistently rated their perceived health status lower than either the less than 45 age group or the 65+ age group in the years that the survey has been conducted.
In 2011, the percentage of enrollees in the 45-64 age group rating their health status positively increased slightly, while the percentage of enrollees in the 65 and older age group rating their health status positively decreased slightly.
Exhibit 2.7
Source: 2008, 2010, 2011 VHA Survey of Veteran Enrollees' Health and Reliance Upon VA
58.9% 63.0% 76.1%
57.2% 63.6% 77.7%
59.6% 63.3% 74.9%
1-3 4-6 7-8
Enrollees Reporting “Excellent/Very Good/Good” Health Status Perceptions by Priority Groups
2008 2010 2011
69.6% 61.2%
68.5% 71.5% 59.0%
69.3% 71.2% 60.7% 67.3%
<45 45-64 65+
Perceived Health Status of “Excellent/Very Good/Good” by Enrollee Age Groups
2008 2010 2011
Office of the ADUSH for Policy and Planning
39 2011 Survey of Veteran Enrollees' Health and Reliance Upon VA

P e r c e i v ed H ea l th S t a tu s b y I nc om e G ro up Positive perceptions of perceived health status appear to be influenced by income, as seen in Exhibit 2.8. Exhibit 2.8 Enrollees Reporting “Excellent/Very Good/Good” Health Status Perceptions
(Count and Percent by Income)
<$16K $16- 25,999
$26- 35,999
$36- 45,999
$46- 55,999 $56K + DK/
Refused 834,238 864,897 720,541 531,887 423,658 1,192,165 574,165 54.1% 61.2% 65.7% 68.0% 70.9% 77.1% 62.6%
Denominator is the national enrollee population by income (see Appendix Table 1.1) Previous years reviewed the influence of income on perceived health status by breaking income out in three categories: less than $36,000, $36,000 or more, and “Don’t Know/Refused.” Therefore, the exhibit below shows perceived health status by these three income categories in order to illustrate the results as compared to the last three survey cycles. While there was a small jump in positively perceived health status for all reported income categories between 2008 and 2010, this trend did not hold in 2011. For enrollees reporting household annual income of $36,000 or more, the trend actually declined slightly. Exhibit 2.9
P e r c e i v ed H ea l th S t a tu s o f OEF/ OI F/O N D an d Fem al e En ro l l e e P o pu l a t i ons OEF/OIF/OND enrollees were more likely to report a favorable health status (77%) than all other
enrollees (64%). Female enrollees were slightly more likely to report a favorable health status (68%) than male
enrollees (65%).
57.0% 70.8%
62.1% 59.5% 74.0%
62.1% 59.7% 73.4%
62.6%
<$36K $36K+ DK/Ref
Perceived Health Status of “Excellent/Very Good/Good” Comparisons by Enrollee Income Groups
2008 2010 2011
Office of the ADUSH for Policy and Planning
40 2011 Survey of Veteran Enrollees' Health and Reliance Upon VA

P e r c e i v ed H ea l th S t a tu s : VI SN O ve r v i e w Geographically, VISN 23 had the highest percentage of enrollees reporting a positive perception of health status (72%) and VISN 7 had the lowest percentage of enrollees with a positive perception of their health status (58%). Map 2.1 shows the geographic dispersal of percentages by VISN. Map 2.1
Office of the ADUSH for Policy and Planning
41 2011 Survey of Veteran Enrollees' Health and Reliance Upon VA

R e po r t ed Cur r en t U s e o f VA S e r v i c es t o M e e t H ea l th Car e Ne e ds Enrollees were asked to what extent they currently rely on VA for their health care needs. Most enrollees (75%) reported that they use VA for at least some of their health care needs, an increase of 2 percentage points from the 73 percent who reported VA use in 2010. Almost 19 percent of enrollees reported that they do not use VA, and 5 percent reported that they have no health care needs. Exhibit 2.10
Response Count Percent All of my health care needs 2,362,508 29.9%
Most of my health care needs 1,363,663 17.3% Some of my health care needs 2,213,736 28.0% None of my health care needs 1,484,923 18.8%
I have no health care needs 386,542 4.9% DK/Ref 83,737 1.1%
Total 7,895,108 100.0% Exhibit 2.11
Current Use of VA Services by Priority, Age, Income, OEF/OIF/OND Status, and Gender
Planned Future Use All Needs Most Needs
Some Needs
None of Needs
Have No Needs
Priority P1-P3 31.0% 19.8% 29.5% 16.0% 2.7% P4-P6 38.8% 17.3% 21.2% 15.2% 6.4% P7-P8 17.2% 13.8% 34.8% 27.1% 5.8%
Age <45 24.4% 17.1% 27.0% 19.6% 11.0%
45-64 40.3% 18.3% 20.8% 16.1% 3.8% 65+ 22.2% 16.3% 35.0% 21.1% 4.0%
Income <36K 39.4% 19.4% 23.9% 12.3% 3.9% 36K+ 18.4% 15.1% 33.3% 26.6% 6.0%
DK/Refused 24.7% 14.9% 29.7% 22.5% 5.6%
OEF/OIF/OND Yes 19.4% 15.9% 28.9% 22.2% 13.1% No 30.9% 17.4% 28.0% 18.5% 4.1%
Gender Male 29.8% 17.2% 28.4% 18.6% 4.8%
Female 31.2% 17.9% 22.0% 22.5% 6.0% Enrollees in Priorities 4-6, aged 45-64, and in lower income brackets (less than $36,000
household income per year), were all more likely to state they used VA health care services to meet all their needs than were enrollees in other planned used categories.
Enrollees who were OEF/OIF/OND Veterans were less likely to state that they used VA services for all their health care needs than Veterans from other eras.
While there was not much difference in how male and female enrollees responded, a slightly higher percentage of female enrollees than male enrollees either stated that they used VA services for all their health care needs or for none of their needs
A higher percentage of male enrollees than female enrollees stated that they used VA services for some of their health care needs.
Office of the ADUSH for Policy and Planning
42 2011 Survey of Veteran Enrollees' Health and Reliance Upon VA
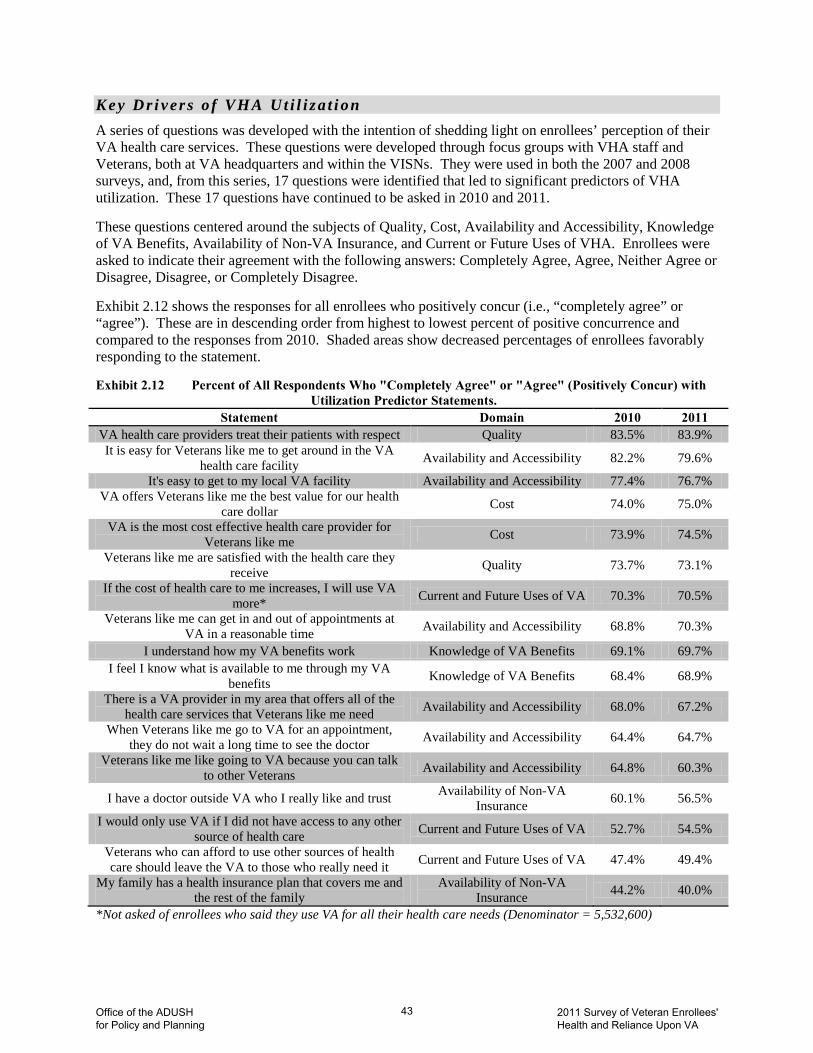
K e y D r i v er s o f VHA U t i l i z a t i on A series of questions was developed with the intention of shedding light on enrollees’ perception of their VA health care services. These questions were developed through focus groups with VHA staff and Veterans, both at VA headquarters and within the VISNs. They were used in both the 2007 and 2008 surveys, and, from this series, 17 questions were identified that led to significant predictors of VHA utilization. These 17 questions have continued to be asked in 2010 and 2011. These questions centered around the subjects of Quality, Cost, Availability and Accessibility, Knowledge of VA Benefits, Availability of Non-VA Insurance, and Current or Future Uses of VHA. Enrollees were asked to indicate their agreement with the following answers: Completely Agree, Agree, Neither Agree or Disagree, Disagree, or Completely Disagree. Exhibit 2.12 shows the responses for all enrollees who positively concur (i.e., “completely agree” or “agree”). These are in descending order from highest to lowest percent of positive concurrence and compared to the responses from 2010. Shaded areas show decreased percentages of enrollees favorably responding to the statement. Exhibit 2.12 Percent of All Respondents Who "Completely Agree" or "Agree" (Positively Concur) with
Utilization Predictor Statements. Statement Domain 2010 2011
VA health care providers treat their patients with respect Quality 83.5% 83.9% It is easy for Veterans like me to get around in the VA
health care facility Availability and Accessibility 82.2% 79.6%
It's easy to get to my local VA facility Availability and Accessibility 77.4% 76.7% VA offers Veterans like me the best value for our health
care dollar Cost 74.0% 75.0%
VA is the most cost effective health care provider for Veterans like me Cost 73.9% 74.5%
Veterans like me are satisfied with the health care they receive Quality 73.7% 73.1%
If the cost of health care to me increases, I will use VA more* Current and Future Uses of VA 70.3% 70.5%
Veterans like me can get in and out of appointments at VA in a reasonable time Availability and Accessibility 68.8% 70.3%
I understand how my VA benefits work Knowledge of VA Benefits 69.1% 69.7% I feel I know what is available to me through my VA
benefits Knowledge of VA Benefits 68.4% 68.9%
There is a VA provider in my area that offers all of the health care services that Veterans like me need Availability and Accessibility 68.0% 67.2%
When Veterans like me go to VA for an appointment, they do not wait a long time to see the doctor Availability and Accessibility 64.4% 64.7%
Veterans like me like going to VA because you can talk to other Veterans Availability and Accessibility 64.8% 60.3%
I have a doctor outside VA who I really like and trust Availability of Non-VA Insurance 60.1% 56.5%
I would only use VA if I did not have access to any other source of health care Current and Future Uses of VA 52.7% 54.5%
Veterans who can afford to use other sources of health care should leave the VA to those who really need it Current and Future Uses of VA 47.4% 49.4%
My family has a health insurance plan that covers me and the rest of the family
Availability of Non-VA Insurance 44.2% 40.0%
*Not asked of enrollees who said they use VA for all their health care needs (Denominator = 5,532,600)
Office of the ADUSH for Policy and Planning
43 2011 Survey of Veteran Enrollees' Health and Reliance Upon VA

Overall, the “Quality” statement “VA health care providers treat their patients with respect” received the highest level of concurrence (84%), i.e., “completely agree” or “agree.”
The second and third most concurred with statements were “Availablity and Accessibility” based. However, the positive ratings for these two statements decreased slightly from that reported in the 2010 survey cycle.
VHA is continuously working on reducing wait time. o Sixty-four percent of enrollees agreed that when they had an appointment at VA, they did
not wait a long time to see the doctor o Seventy percent agreed that they could get in and out of appointments in a reasonable
time; this represented a slight improvement over last year. The two statements related to availability of non-VA insurance both showed lower concurrence
than in 2010, possibly reflecting the impact of sustained higher unemployment: o Concurrence with “I have a doctor outside VA that I know and trust” fell from 60 percent
to 57 percent. o Concurrence with “My family has a health insurance plan that covers me and the rest of
my family” fell from 44 percent to 40 percent. These responses were assessed based on self-reported utilization of VA services over the previous year (2010). Enrollees were divided into four groups: 1. VA Only: Enrollees that reported they had used VA health care services only (26%); 2. VA/Non-VA: Enrollees that reported they had used both VA and non-VA health care services (32%); 3. Non-VA Only: Enrollees that reported they had only used non-VA health care services (28%); and 4. None: Enrollees that reported they had had no health care utilization in the last year (14%). Perceptions do seem to differ among those who have not used VA and those who have. In general, enrollees who used solely VA health care (VA-Only) and those who used both VA and non-VA health care (VA/Non-VA) had higher levels of concurrence with positive statements than non-VA users or those enrollees who did not use any health care. For instance, over 93 percent of VA users and 91 percent of VA/Non-VA users concurred that VA providers treated patients with respect, contrasted with the 70 percent of non-VA users who concurred with this statement. It is not possible to ascertain if non-VA Only users’ perceptions are based on previous experience with VA or other sources of information. The following sections discuss these perceptions in more detail by examining factors such as VA utilization, age, priority, income, OEF/OIF/OND status, and gender. VISN ranges are provided in the text and a full break out of responses by VISN can be found in the appendices.
Office of the ADUSH for Policy and Planning
44 2011 Survey of Veteran Enrollees' Health and Reliance Upon VA

P e r c ep t ion s o f Qua l i t y o f VA H e a l th C ar e Exhibit 2.13
The perception that VA providers treated Veterans with respect received the highest level of concurrence among the 17 key driver questions. Among VA-Only and VA/Non-VA users, over 90 percent of enrollees either agreed or completely agreed with this statement. This group was also more likely to concur that they were satisfied with the health care they received at VA.
Exhibit 2.14 Percent of Enrollees who “Agree” or “Completely Agree” with Quality Statements by Priority,
Age, Income, OEF/OIF/OND Status, and Gender
Quality Statements Veterans like me are satisfied with the health care they receive
VA health care providers treat their patients with respect
Priority P1-P3 71.2% 83.3% P4-P6 76.2% 85.6% P7-P8 71.5% 82.4%
Age <45 60.3% 76.3%
45-64 73.3% 83.8% 65+ 76.8% 86.4%
Income <36K 78.8% 88.1% 36K+ 68.3% 80.5%
DK/Refused 62.9% 76.6%
OEF/OIF/OND Yes 60.1% 79.0% No 74.3% 84.4%
Gender Male 73.7% 84.4%
Female 62.9% 76.6% These percentages did not change by more than 1 percent from 2010 in any category except for
OEF/OIF/OND enrollees. In 2010, 64 percent of OEF/OIF/OND enrollees concurred that they were satisfied with the health care they received compared to only 60 percent concurring with this statement in 2011.
Women were less likely than their male counterparts to agree with either of these statements. Geographically, enrollees in VISN 23 reported the highest concurrence with both the satisfaction
statement (80%) and the respect statement (89%). Enrollees in VISN 17 reported the lowest concurrence with the satisfaction statement (67%) and VISN 5 enrollees reported the lowest
68.2% 79.1%
53.8% 69.5%
81.8% 91.2% 85.7% 93.1%
73.1% 83.9%
Veterans like me who use VA are satisfied with the health care they receive
VA health care providers treat their patients with respect
Positive Responses to Quality Statements by Self-Reported Health Care User Status
None Non-VA Only VA and Non-VA VA-Only All Enrollees
Office of the ADUSH for Policy and Planning
45 2011 Survey of Veteran Enrollees' Health and Reliance Upon VA

concurrence with the respect statement (79%). (A complete breakout by VISN can be found in the Appendix Table 2.1).
P e r c ep t ion s o f C os t o f VA H ea l th Ca re Exhibit 2.15
Over 90 percent of VA-Only users and over 80 percent of VA/Non-VA health care users concurred with both of these statements, while 52 percent of non-VA Only users concurred with the cost-effective statement and 53 percent concurred with the best value statement. Exhibit 2.16 Percent of Enrollees who “Agree” or “Completely Agree” with Cost Statements by Priority,
Age, Income, OEF/OIF/OND Status, and Gender
Cost Statements VA is the most cost effective health care provider for Veterans like me
VA offers Veterans like me the best value for our health care dollar
Priority P1-P3 74.4% 74.7% P4-P6 79.1% 79.2% P7-P8 68.8% 70.1%
Age <45 68.2% 65.8%
45-64 77.5% 78.0% 65+ 73.7% 75.2%
Income <36K 82.1% 82.1% 36K+ 67.2% 68.8%
DK/Refused 64.3% 63.8%
OEF/OIF/OND Yes 64.9% 63.7% No 75.4% 76.1%
Gender Male 74.9% 75.4%
Female 68.8% 69.0% Although overall concurrence with these two “Cost” statements increased by one percentage
point since 2010, within the OEF/OIF/OND enrollee population, concurrence with both statements decreased by approximately two percentage points each.
Female enrollees were less likely to concur with the “Cost” statements than their male counterparts.
72.8% 71.0%
51.4% 52.8%
81.5% 82.7% 91.8% 91.7%
74.5% 75.0%
VA is the most cost-effective health care provider for Veterans like me
VA offers Veterans like me the best value for our health care dollar
Positive Responses to Cost Statements by Self-Reported Health Care User Status
None Non-VA Only VA and Non-VA VA-Only All Enrollees
Office of the ADUSH for Policy and Planning
46 2011 Survey of Veteran Enrollees' Health and Reliance Upon VA

Enrollees in Priorities 4 – 6 tended to concur with “Cost” statements more than any other priority group.
Enrollees aged 45 – 64 were more likely to concur with “Cost” statements. Enrollees with an income less than $36,000 were more likely to concur with “Cost” statements. Enrollees who served in OEF/OIF/OND were less likely than their counterparts to concur with
“Cost” statements. Enrollees in VISN 12 were most likely to concur with both statements; 80 percent agreed with
each statement. Enrollees in VISN 5 were least likely to concur with both statements; 67 percent agreed with each statement. (A complete breakout by VISN can be found in the Appendix Table 2.1).
P e r c ep t ion s o f A v a i la b i l i t y and A c c ess ib i l i t y o f VA H ea l th C ar e Se r v i c es The series of six questions related to Availability and Accessibility of VA health care services can be further broken out into three areas: “Accessibility,” “Wait Times,” and “General Camaraderie.”
Exhibit 2.17
A c c es s i b i l i t y
Enrollees are less likely to concur that there is a VA provider in their area that offers all their
needed health care services than they are to concur that it is easy to both get to and to get around their local VA health care facility.
VA-Only and VA/Non-VA users are more likely to concur with all of these statements than non-VA Only users.
75.3% 68.0% 74.7%
64.5% 56.6% 62.9%
81.0% 69.2%
86.9% 85.1% 76.0%
91.5% 76.7%
67.2% 79.6%
It is easy to get to my local VA facility
There is a VA provider in my area that offers all of the health care
services that Veterans like me need
It is easy for Veterans like me to get around in the
VA health care facility
Positive Responses to Accessibility Statements by Self-Reported Health Care User Status
None Non-VA Only VA and Non-VA VA-Only All Enrollees
Office of the ADUSH for Policy and Planning
47 2011 Survey of Veteran Enrollees' Health and Reliance Upon VA

Exhibit 2.18 Percent of Enrollees who “Agree” or “Completely Agree” with Accessibility Statements by Priority, Age, Income, OEF/OIF/OND Status, and Gender
Accessibility Statements It is easy to get to my local VA facility
There is a VA provider in my area that offers all of the health care services
that Veterans like me need
It is easy for Veterans like me to get around in the VA health care
facility
Priority P1-P3 75.5% 64.6% 80.0% P4-P6 77.9% 69.7% 82.0% P7-P8 76.7% 67.6% 76.2%
Age <45 73.1% 60.5% 74.7%
45-64 78.6% 68.7% 81.7% 65+ 76.0% 67.9% 79.3%
Income
<36K 78.2% 69.6% 84.3% 36K+ 76.1% 66.4% 75.5%
DK/Refused 71.8% 59.5% 72.4%
OEF/OIF/OND Yes 75.9% 67.5% 74.2% No 76.7% 64.7% 80.2%
Gender Male 61.9% 67.8% 79.9%
Female 54.5% 67.5% 76.6% Responses did not vary a great deal among Priority Groups, age groups, income groups, OEF/OIF/OND status, or gender, with the following exceptions, where the range of concurrence varied by more than 5 percentage points.
Female enrollees were less likely to concur than male enrollees that it was easy to get to a VA facility (55%).
OEF/OIF/OND enrollees were less likely to concur than their counterparts that it was easy to get around their VA health care facility (74%).
Enrollees under the age of 45 were less likely than older enrollees to concur with any of these statements.
Enrollees who did not provide an income were less likely to concur than those who did provide an income that there was a VA provider in their area that offered all the services that these enrollees needed (60%) or that it was easy to get around their VA health care facility (72%).
The range by VISN for each question was as follows. (VISN breakouts can be found in Appendix Table 2.2). VISN 2 (83%) had the highest concurrence with the “easy to get to the facility” statement and
VISN 5 (69%) had the lowest concurrence. VISN 10 (76%) had the highest concurrence with the “VA provider that offers all needed
services” statement and VISN 20 (61%) had the lowest concurrence VISN 23 (84%) had the highest concurrence with the “easy to get around in local facility”
statement and VISN 3 (74%) had the lowest concurrence.
Office of the ADUSH for Policy and Planning
48 2011 Survey of Veteran Enrollees' Health and Reliance Upon VA

Exhibit 2.19
W ai t T im es
Over 80 percent of VA-Only and VA/Non-VA users concurred that they were in and out of
appointments within a reasonable time and over 75 percent concurred that they did not wait a long time to see a doctor.
Only 49 percent of non-VA Only users concurred with the reasonable time statement and 43 percent non-VA Only users concurred with the length of time to see a doctor statement. As noted earlier, it is not possible to determine if these responses are related to actual experience or perception.
Exhibit 2.20 Percent of Enrollees who “Agree” or “Completely Agree” with Wait Time Statements by
Priority, Age, Income, OEF/OIF/OND Status, and Gender
Wait Time Statements Veterans like me can get in and out
of appointment at VA in a reasonable time
When Veterans like me go to VA for an appointment, they do not wait a long time to see the doctor
Priority P1-P3 67.3% 62.6% P4-P6 73.4% 67.0% P7-P8 70.3% 64.6%
Age <45 53.8% 47.4%
45-64 69.9% 64.9% 65+ 75.8% 69.9%
Income <36K 77.0% 70.8% 36K+ 63.6% 58.9%
DK/Refused 61.8% 56.3%
OEF/OIF/OND Yes 56.0% 50.1% No 71.6% 66.1%
Gender Male 71.3% 65.5%
Female 55.3% 51.8% Enrollees under 45, enrollees reporting income of $36,000 or more or those who did not provide
income information, those involved in the OEF/OIF/OND conflicts and female enrollees were much less likely than their counterparts to concur with either of these statements.
Enrollees in VISN 1 were most likely to concur that they got in and out of appointments in a reasonable time (78%) and enrollees in VISN 23 were most likely to concur that they did not wait long to see a doctor (72%).
63.9% 58.1% 48.9% 43.3%
80.9% 75.7% 83.7% 77.8% 70.3% 64.7%
Veterans like me can get in and out of an appointment at VA
in a reasonable time
When Veterans like me go to VA for an appointment,
they do not wait a long time to see the doctor
Positive Responses to Wait Times Statements by Self-Reported Health Care User Status
None Non-VA Only VA and Non-VA VA-Only All Enrollees
Office of the ADUSH for Policy and Planning
49 2011 Survey of Veteran Enrollees' Health and Reliance Upon VA

At the other end of the range for this question, enrollees in VISN 17 were the least likely to concur with either statement; 61 percent concurred with reasonable time to get in and out of an appointment and 55 percent concurred that they did not wait long to see a doctor. (A complete breakout by VISN can be found in the Appendix Table 2.3).
Exhibit 2.21
C am ara d er i e
Overall, concurrence with this statement decreased more than with any other statement, falling
from 64.8 percent concurrence in 2010 to 60.3 percent concurrences in 2011. Seventy percent of VA-Only users versus 48 percent of non-VA Only users concurred with this
statement.
Exhibit 2.22 Percent of Enrollees who “Agree” or “Completely Agree” with Camaraderie Statements by Priority, Age, Income, OEF/OIF/OND Status, and Gender
Camaraderie Statements Veterans like me like going to VA because you can talk to other Veterans
Priority P1-P3 60.7% P4-P6 64.6% P7-P8 54.2%
Age <45 60.2%
45-64 64.6% 65+ 56.3%
Income <36K 66.0% 36K+ 55.2%
DK/Refused 50.9%
OEF/OIF/OND Yes 58.1% No 60.5%
Gender Male 60.5%
Female 56.9% Enrollees in Priority 7-8, those with an income of $36,000 or more or who didn’t provide income
information, enrollees age 65 or older, and female enrollees were less likely than their counterparts to agree with this statement.
Enrollees in VISN 9 were most likely to concur with this statement (65%) and enrollees in VISN 20 were least likely to concur (52%). (A complete breakout by VISN can be found in the Appendix Table 2.3).
61.0% 48.1%
62.6% 70.2%
60.3%
Veterans like me like going to VA because you can talk to other Veterans
Positive Responses to Camaraderie Statements by Self-Reported Health Care User Status
None Non-VA Only VA and Non-VA VA-Only All Enrollees
Office of the ADUSH for Policy and Planning
50 2011 Survey of Veteran Enrollees' Health and Reliance Upon VA

Knowledge of VA Health Benefits Enrollees were asked if they felt they knew what benefits were available to them and if they felt they understood how VA health benefits work. The overall results are charted in Exhibit 2.23 below. Exhibit 2.23
VA-Only users were the most likely to concur with statements about benefits with 83 percent
concurring they knew what was available and 80 percent concurring they knew how their benefits worked. At the other end of the range, non-VA Only users concurred 53 percent and 55 percent with the respective statements.
Overall, concurrence with these statements changed by less than a percentage point from the 2010 survey.
Exhibit 2.24 Percent of Enrollees who “Agree” or “Completely Agree” with Knowledge of VA Benefits
Statements by Priority, Age, Income, OEF/OIF/OND Status, and Gender
VA Health Benefits Statements I understand how my VA benefits work
I feel I know what is available to me through my VA benefits
Priority P1-P3 72.6% 71.0% P4-P6 69.2% 68.6% P7-P8 66.3% 66.7%
Age <45 60.8% 58.3%
45-64 69.6% 68.7% 65+ 72.4% 72.4%
Income <36K 71.8% 72.2% 36K+ 66.9% 68.1%
DK/Refused 62.5% 63.5%
OEF/OIF/OND Yes 61.5% 61.1% No 70.4% 69.7%
Gender Male 69.9% 69.4%
Female 66.2% 62.0% Although enrollees under the age of 45 and enrollees with OEF/OIF/OND status were much less
likely to concur with these statements, their concurrence did increase slightly from the 2010 survey. This may reflect continuing outreach efforts to this cohort of Veterans.
62.6% 63.0% 53.0% 54.5%
76.8% 75.4% 82.5% 79.7% 69.7% 68.9%
I understand how my VA health benefits work
I feel I know what is available to me through my VA benefits
Positive Responses to Knowledge of VA Health Benefits Statements by Self-Reported Health Care User Status
None Non-VA Only VA and Non-VA VA-Only All Enrollees
Office of the ADUSH for Policy and Planning
51 2011 Survey of Veteran Enrollees' Health and Reliance Upon VA

o In 2011, 61 percent of enrollees under the age of 45 concurred that they understood how VA benefits worked versus 60 percent in 2010.
o In 2011, 58 percent of enrollees under the age of 45 concurred that they knew what benefits were available to them versus 57 percent in 2010.
o In 2011, 62 percent of OEF/OIF/OND enrollees concurred that they understood how VA benefits worked versus 60 percent in 2010.
o In 2011, 61 percent of OEF/OIF/OND enrollees concurred that they knew what benefits were available to them versus 59 percent in 2010.
An increase was also seen in Priority 1-3 enrollees’ concurrence that they knew how their health benefits worked, rising from 71 percent in 2010 to 73 percent concurring in 2011.
VISN 23 enrollees concurred equally with both statements (75%) and were more likely to concur with these statements than enrollees in any other VISN.
Enrollees in VISN 7 were least likely to concur that they knew what benefits were available to them (65%) and enrollees in VISN 3 were least likely to concur that they understood how their benefits worked (65%). (A complete breakout by VISN can be found in the Appendix Table 2.4).
P e r c ep t ion s o f A v a i la b i l i t y o f Non - VA H ea l th Ca r e A l t er na t i ve s Fifty-seven percent of all respondents reported having a doctor outside VA whom they really like and trust, while 44 percent reported having health insurance that covered them and their families. This is a 3 percentage point decrease from 2010 reporting a doctor outside VA and a 4 percentage point decrease from 2010 reporting health insurance covering both the enrollee and their families. Exhibit 2.25
Non-VA Only users were much more likely to report having a doctor outside of VA (82%). However, only 60 percent of Non-VA Only users indicated that their family had a health insurance plan. Even less of the enrollees (38%) who had not utilized any health care services indicated they had a health insurance plan. This may warrant further study to understand if lack of insurance, coupled with lack of awareness of enrollment in VA, was the reason the enrollee did not utilize any health care.
Sixty-nine percent of VA/Non-VA users indicated they had a doctor outside of VA, but only 42 percent of this group indicated they had a health insurance plan. Among VA-Only users, 21 percent indicated they had a doctor outside of VA and 18 percent indicated they had a health insurance plan.
43.7% 37.5%
81.4%
59.1% 69.1%
42.3% 20.8% 17.9%
56.5% 40.0%
I have a doctor outside VA who I really like and trust
Family has a health insurance plan
Positive Responses to Availability of Non-VA Health Care Alternatives Statements by Self-Reported Health Care User Status
None Non-VA Only VA and Non-VA VA-Only All Enrollees
Office of the ADUSH for Policy and Planning
52 2011 Survey of Veteran Enrollees' Health and Reliance Upon VA

Exhibit 2.26 Percent of Enrollees who “Agree” or “Completely Agree” with Availability of NON-VA Health Care Statements by Priority, Age, Income, OEF/OIF/OND Status, and Gender
Non-VA Care Availability Statements
I have a doctor outside VA who I really like and trust
My family has a health insurance plan that covers me and the rest of
the family
Priority P1-P3 55.1% 44.4% P4-P6 46.6% 28.3% P7-P8 71.1% 49.1%
Age <45 40.4% 44.3%
45-64 47.3% 36.5% 65+ 70.0% 41.9%
Income <36K 47.8% 26.8% 36K+ 67.5% 57.7%
DK/Refused 59.8% 41.9%
OEF/OIF/OND Yes 42.8% 50.1% No 57.8% 39.1%
Gender Male 57.0% 40.1%
Female 49.1% 38.8% Enrollees with OEF/OIF/OND status were less likely (43%) to have a doctor outside VA, but
more likely to have an insurance plan (50%). Enrollees in Priority Group 4 – 6 were less likely to have insurance (28%). Enrollees with incomes of $36,000 or more were more likely to both have a doctor that they
trusted (68%) and to have an insurance plan (58%). Women were less likely than men to have a doctor outside of VA that they trusted (49%) and
slightly less likely to have an insurance plan (39%). VISN 3 enrollees were more likely to both have a doctor outside of VA that they trusted (67%)
and to have an insurance plan (48%). Enrollees in VISN 18 were least likely to have a doctor outside of VA that they trusted (48%) and
enrollees in VISN 16 were least likely to have an insurance plan (34%). (A complete breakout by VISN can be found in the Appendix Table 2.4).
P la nn ed Cur r en t an d Fu tur e U s es o f VA Two questions attempted to explain how enrollees saw cost and access to other health care as drivers of their use of VA health care. In addition, a third question looked at whether or not VA should only be used by those Veterans who really needed it. The results are shown in Exhibit 2.27.
Office of the ADUSH for Policy and Planning
53 2011 Survey of Veteran Enrollees' Health and Reliance Upon VA

Exhibit 2.27
*Denominator excludes enrollees who said they use VA for all their health care needs In contrast with other question subject areas, enrollees who did not currently use VA were more
likely to concur with these statements than their counterparts. There was the least concurrence variance among health care user groups with the statement that
the respondent would use VA more if their cost of health care increases. It should be noted that respondents who indicated they currently use VA for all their needs were not asked this question.
Exhibit 2.28 Percent of Enrollees who “Agree” or “Completely Agree” with Current and Planned
Future Use Statements by Priority, Age, Income, OEF/OIF/OND Status, and Gender
Current and Planned Use Statements
If the cost of health care to me increases, I will use VA more*
I would only use VA if I did not have
access to any other source of health care
Veterans who can afford to use other
sources of health care should leave the VA to those who really
need it
Priority P1-P3 68.2% 49.7% 43.4% P4-P6 73.2% 56.1% 52.5% P7-P8 70.6% 58.9% 53.4%
Age <45 66.1% 50.0% 43.5%
45-64 72.4% 51.9% 46.2% 65+ 70.6% 58.2% 54.1%
Income <36K 74.7% 55.4% 51.7% 36K+ 68.9% 54.2% 48.2%
DK/Refused 61.4% 51.2% 42.8%
OEF/OIF/OND Yes 65.8% 49.5% 42.5% No 71.1% 55.0% 50.0%
Gender Male 70.9% 55.0% 50.3%
Female 64.4% 46.4% 34.3% *Denominator excludes enrollees who said they use VA for all their health care needs
70.7% 59.6% 54.5%
67.6% 67.1% 59.5%
73.1%
49.0% 44.1%
72.2%
45.1% 42.2%
70.5%
54.5% 49.4%
Feels they would use VA more if their cost of health care increases
Feels they would only use VA if had no other source of health care
Believes enrollees who can afford other sources should leave the VA
for those who need it
Positive Responses to Current and Future VA Use Statements by Self-Reported Health Care User Status
None Non-VA Only VA and Non-VA VA-Only All Enrollees
Office of the ADUSH for Policy and Planning
54 2011 Survey of Veteran Enrollees' Health and Reliance Upon VA

Enrollees in Priorities 7 – 8 were slightly more likely to agree that they would use VA only if they did not have access to any other source of health care, while enrollees in Priorities 1 – 3 were less likely to agree that VA resources should be only used by those who really need them.
Older enrollees (aged 65 and over) were more likely to concur that they would only use VA if they didn’t have access to other health care and that VA resources should be only used by those who really need them.
Younger enrollees (aged less than 45) and enrollees with lower incomes (less than $36,000 annual household income) were less likely to concur that they would use VA more, if their health care costs increased.
OEF/OIF/OND enrollees and female enrollees were also less likely to concur with any of these statements than their counterparts.
A v er ag e s o f th e Ma jo r F a c t or s The major factors regarding enrollees’ decision-making process about whether to utilize VA services were averaged across all items to acquire an understanding of priorities in enrollees’ decision making. The highest level of agreement was found for statements related to quality, followed by cost, and then by availability and accessibility of services. Exhibit 2.29
Quality Cost Availability & Accessibility of Services
Knowledge of VA Health
Benefits
Availability of NON VA
Health Care DK/Ref 4.7% 5.3% 4.3% 3.2% 2.9% Completely disagree 1.5% 1.4% 2.6% 2.5% 11.2% Disagree 6.5% 8.2% 14.3% 16.5% 33.0% Neither agree/Disagree 8.8% 10.4% 8.9% 8.4% 4.6% Completely agree/Agree 78.5% 74.8% 69.8% 69.3% 48.3%
0%
10%
20%
30%
40%
50%
60%
70%
80%
90%
100%
Averages of Enrollee's Health Care Decision Making
Office of the ADUSH for Policy and Planning
55 2011 Survey of Veteran Enrollees' Health and Reliance Upon VA

P la nn ed Fu tu r e Use All survey respondents were asked how they plan to use VA services in the future. As in prior years when this question has been asked, the most common response is to use VA for primary care (48%). This is an increase over the 45 percent who replied primary care in 2010. Responses for other categories remained within a percentage point of the 2010 responses with the exception of those reporting “No Plans to Use VA”. The percent of enrollees reporting no plans fell from 14 percent in 2010 to 12 percent in 2011. After decreasing from 11 percent in 2008 to 8 percent in 2010, the percentage of respondents that indicated they would use VA for prescriptions remained level at 8 percent in 2010. All responses can be seen in the following chart and table. Exhibit 2.30
0% 5% 10% 15% 20% 25% 30% 35% 40% 45% 50%
Primary Care
Backup Care
Safety Net
Prescriptions
Specialized Care
Other
No Plans to Use VA
DK/Ref
Primary Reason for Planned Future Use
2005
2007
2008
2010
2011
Office of the ADUSH for Policy and Planning
56 2011 Survey of Veteran Enrollees' Health and Reliance Upon VA

Exhibit 2.31 Reasons for Planned Future Use by Year Category 2005 2007 2008 2010 2011
Primary Care 3,148,146 47.0% 2,989,191 41.6% 3,156,803 43.0% 3,521,906 45.1% 3,749,190 47.5%
Backup Care 654,786 9.8% 826,064 11.5% 983,625 13.4% 1,048,487 13.4% 1,031,459 13.1%
Safety Net 549,704 8.2% 820,110 11.4% 941,029 12.8% 956,675 12.3% 929,874 11.8%
Prescriptions 1,160,628 17.3% 959,342 13.3% 805,479 11.0% 639,292 8.2% 655,546 8.3%
Specialized Care 183,912 2.7% 226,938 3.2% 229,718 3.1% 283,914 3.6% 294,893 3.7%
Other 218,332 3.3% 132,589 1.8% 117,921 1.6% 84,904 1.1% 84,825 1.1%
No Plans to Use VA 610,136 9.1% 989,005 13.8% 931,406 12.7% 1,059,551 13.6% 909,144 11.5%
DK/Ref 178,506 2.7% 243,712 3.4% 173,551 2.4% 209,910 2.7% 240,176 3.0%
The exhibit below shows how planned future use of VA services breaks out by priority, age, income, OEF/OIF/OND status, and gender. Exhibit 2.32 Planned Future Use of VA Services by Priority, Age, Income, OEF/OIF Status, and Gender
Planned Future Use Primary Care Back-Up Safety
Net Pre-
scriptions Specialized
Care No
Plans
Priority P1-P3 50.8% 14.4% 10.8% 5.3% 5.6% 9.1% P4-P6 56.4% 10.1% 10.9% 6.4% 2.7% 9.6% P7-P8 31.6% 15.1% 14.2% 14.8% 2.7% 17.2%
Age <45 43.0% 16.3% 18.9% 2.5% 5.5% 10.6%
45-64 59.8% 11.8% 10.7% 4.2% 3.3% 6.9% 65+ 37.6% 13.3% 10.5% 13.9% 3.6% 16.0%
Income <36K 58.1% 9.8% 8.8% 8.2% 2.7% 8.4% 36K+ 35.0% 17.7% 16.5% 8.3% 5.1% 14.3%
DK/Refused 40.5% 12.5% 9.8% 8.5% 3.9% 16.5%
OEF/OIF/OND Yes 36.8% 18.5% 20.3% 3.3% 4.9% 12.9% No 48.5% 12.6% 11.0% 8.8% 3.6% 11.4%
Gender Male 47.3% 13.0% 11.8% 8.6% 3.7% 11.5%
Female 50.8% 14.0% 11.9% 3.6% 4.7% 11.4% Enrollees in Priorities 7 – 8 and enrollees with OEF/OIF/OND status were much less likely to
state they planned to use VA for Primary Care, but more likely to use VA as a Back-Up or as a Safety Net.
Enrollees in Priorities 7 – 8 were much more likely to state their planned use of VA Services was for Prescriptions.
Enrollees aged 45-64 were more likely to state that they planned to use VA for Primary Care, as were enrollees with annual household incomes less than $36,000.
Gender did not impact most categories; although women were much less likely to state they planned to use VA services for prescriptions and slightly more likely to state they planned to use VA services for Primary Care.
Office of the ADUSH for Policy and Planning
57 2011 Survey of Veteran Enrollees' Health and Reliance Upon VA
Reviewing planned future use by VISN reveals some variation. For example, while only 35 percent of all enrollees in VISN 3 stated they plan to use VA in the future as a primary source of care, over 54 percent of enrollees in VISN 18 stated they plan to use VA for that purpose. Similarly, enrollee stated plans to use VA for prescriptions ranged from a low of 5 percent in VISN 22 to a high of 13 percent in VISN 12. A full break-out of planned use can be found in the Appendix Table 2.6.
Office of the ADUSH for Policy and Planning
58 2011 Survey of Veteran Enrollees' Health and Reliance Upon VA

CCC hhh aaa ppp ttt eee rrr 333
Public and Private Health Insurance Coverage The term health insurance is used to describe any program that helps pay for medical expenses, whether through privately purchased insurance, social insurance, or a non-insurance social welfare program funded by the government. The availability of health insurance, either public or private, is believed to be a factor in an enrollee’s decision to use their VA health care benefit. For instance, of those enrollees who reported they only used non-VA health care sources (2,231,148), 93 percent had some other source of public or private health care insurance. However, among the VA-only health care users, 56 percent had another source of public or private health care insurance. This chapter explores the types of insurances enrollees have, including the demographics of those who don’t have any source of health care insurance other than their VA benefits. This includes Private Insurance, Medicare, Medicaid, and TRICARE. O v e ra l l R esu l t s Although most enrollees (77%) reported some type of public or private health insurance coverage in addition to their VA health care benefits, the number of insured enrollees appears to be decreasing at an accelerating rate. In 2010, 79 percent of the enrollee population reported coverage, and in 2008, 80 percent of the enrollee population reported coverage. Exhibit 3.1 shows the types of all reported coverage that enrollees are using. When broken out by type, the changes from 2010 are less than 1 percentage point, with the following exceptions: Medicaid coverage among enrollees (7%) fell 1.2 percentage points. Enrollees using an HMO (13%) fell 1.4 percentage points. Enrollees with private prescription drug coverage (24%) fell 1.6 percentage points.
Exhibit 3.1 Health Insurance Coverage Reported by Enrollees Surveyed Medicare** Medicare
Advantage* Medicare Part A*
Medicare Part B* Medigap* Medicare Part D*
4,024,036 852,736 2,674,692 2,459,139 1,487,210 1,466,009 51.0% 21.2% 84.3% 77.5% 47.0% 36.4%
Medicaid** TRICARE** Private Insurance** Private Drug
Coverage** No Coverage**
HMO Non-HMO Total 583,514 1,291,524 1,045,043 973,109 2,302,827 1,864,961 1,811,958
7.4% 16.4% 13.2% 12.3% 29.2% 23.6% 23.0% Percentages do not total 100 percent because enrollees may have multiple coverage Total Private Insurance numbers include Don’t Know/Refused responses to HMO/Non-HMO *Denominator is enrollees with Medicare ** Denominator is all enrollees.
Profile of Enrollee Public and Private Health Insurance Coverage:
77% of enrollees have access to health insurance other than their VA benefits..
The younger an enrollee, the more likely they are uninsured.
The lower the household income, the more likely an enrollee is uninsured.
Office of the ADUSH for Policy and Planning
59 2011 Survey of Veteran Enrollees' Health and Reliance Upon VA

U nin sur an c e The term “uninsurance” in this report refers to the lack of any type of health insurance coverage, either public or private, other than health care benefits provided by VA. The survey asks a comprehensive set of questions regarding types of insurance and those enrollees who indicate that they do not have either Medicare, Medicaid, TRICARE, or Private Insurance are considered uninsured. These questions have varied over the survey cycles, so for trending purposes, only the last three survey cycles are discussed. Uninsurance continued to increase in 2011, rising to 23 percent of the enrollee population from 21 percent in 2010 and 20 percent in 2008. Comparatively, according to the U.S. Census Bureau, the percentage of Americans without insurance was 15 percent in 2008 and 16 percent in 2010 (figures are not available for 2011). Uninsurance is impacted both by unemployment rates and by the changing demographics of enrollees. As noted in Chapter One, unemployment among enrollees has continued to rise and, since health
insurance in the United States is strongly tied to employment, it is not surprising that uninsurance among enrollees has also increased.
In 2003, Priority 8 enrollment was suspended and re-opened in 2009; this enrollment group has the lowest unemployment rate (10%).
As enrollees age, they become eligible for Medicare and are, therefore no longer uninsured. The influx of younger enrollees separating from service, but not yet employed, may impact
uninsurance. The following sections examine uninsurance by Priority, Age, Income, OEF/OIF/OND Status, and by Gender.
Exhibit 3.2 Uninsured by Priority Group
Uninsurance by Priority Group
Priority 2008 2010 2011
P1-P3 476,676 576,251 621,347 19.2% 20.2% 21.3%
P4-P6 812,416 842,104 907,617 30.6% 30.6% 32.5%
P7-8 206,431 242,888 282,994
9.4% 11.0% 12.9% Denominator is the national enrollee population by Priority
Uninsurance rates increased slightly in all of the Priority Groups, with the largest increase occurring in Priority Groups 7 – 8.
Priority Groups 4 – 6 had the highest percentage (32%) of enrollees lacking any other public or private insurance coverage other than VA health care.
The uninsurance rate for Priority Groups 4 – 6 is an increase from the last few survey cycles when the uninsurance rate for these priorities has been near 31 percent.
Office of the ADUSH for Policy and Planning
60 2011 Survey of Veteran Enrollees' Health and Reliance Upon VA
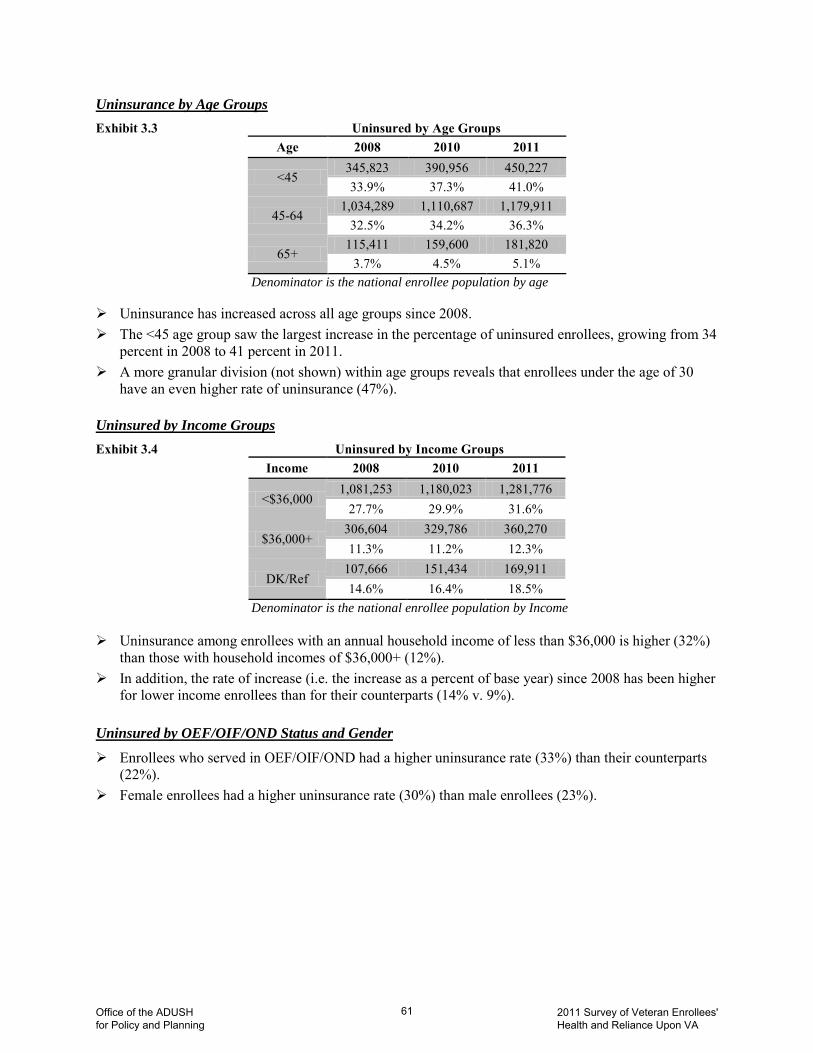
Exhibit 3.3 Uninsured by Age Groups
Uninsurance by Age Groups
Age 2008 2010 2011
<45 345,823 390,956 450,227 33.9% 37.3% 41.0%
45-64 1,034,289 1,110,687 1,179,911
32.5% 34.2% 36.3%
65+ 115,411 159,600 181,820
3.7% 4.5% 5.1% Denominator is the national enrollee population by age
Uninsurance has increased across all age groups since 2008. The <45 age group saw the largest increase in the percentage of uninsured enrollees, growing from 34
percent in 2008 to 41 percent in 2011. A more granular division (not shown) within age groups reveals that enrollees under the age of 30
have an even higher rate of uninsurance (47%).
Exhibit 3.4 Uninsured by Income Groups
Uninsured by Income Groups
Income 2008 2010 2011
<$36,000 1,081,253 1,180,023 1,281,776
27.7% 29.9% 31.6%
$36,000+ 306,604 329,786 360,270 11.3% 11.2% 12.3%
DK/Ref 107,666 151,434 169,911 14.6% 16.4% 18.5%
Denominator is the national enrollee population by Income
Uninsurance among enrollees with an annual household income of less than $36,000 is higher (32%) than those with household incomes of $36,000+ (12%).
In addition, the rate of increase (i.e. the increase as a percent of base year) since 2008 has been higher for lower income enrollees than for their counterparts (14% v. 9%).
Enrollees who served in OEF/OIF/OND had a higher uninsurance rate (33%) than their counterparts (22%).
Uninsured by OEF/OIF/OND Status and Gender
Female enrollees had a higher uninsurance rate (30%) than male enrollees (23%).
Office of the ADUSH for Policy and Planning
61 2011 Survey of Veteran Enrollees' Health and Reliance Upon VA

VI S N O ve r v i ew The percent of uninsured enrollees ranged from 15 percent in VISN 3 to 30 percent in VISN 22. Uninsurance by all VISNs can be seen in Map 3.1. Most VISNs experienced an increase since 2010 in uninsured enrollees, with VISN 5, 6, and 7 having the highest increases in their uninsured enrollee population of approximately 4 percentage points each. Conversely, VISNs 19 and 23 had decreases in their uninsured enrollee population of slightly more than 1 percentage point since 2010. Map 3.1
Office of the ADUSH for Policy and Planning
62 2011 Survey of Veteran Enrollees' Health and Reliance Upon VA

M e di ca r e Co v er ag e All enrollees were asked if they were covered by Medicare. If they were, the survey further distinguished if they had coverage under any of the following types of Medicare coverage: Medicare Part A (hospital care), Medicare Part B (coverage for physician visits), Medicare Advantage, Medigap, or Medicare Part D. As shown earlier in Exhibit 3.1, 51 percent of enrollees are covered by Medicare. Of these enrollees, 21 percent use Medicare Advantage and 47 percent have Medigap. Eighty-four percent of enrollees with Medicare have Medicare Part A and 78 percent have Medicare
Part B. Exhibit 3.5 shows use of the Medicare coverages reviewed by Priority Groups, Age Groups, Income Groups, OEF/OIF/OND Status, and Gender.
Exhibit 3.5 Medicare Coverages by Priority, Age, Income, OEF/OIF/OND Status, and Gender
Category Medicare Medicare Part A*
Medicare Part B*
Medicare Advantage* Medigap*
Priority P1-P3 41.1% 83.3% 75.6% 17.0% 36.0% P4-P6 48.2% 81.8% 72.7% 22.5% 36.3% P7-P8 67.7% 87.6% 83.8% 23.4% 66.2%
Age <45 5.0% 72.5% 66.3% 12.0% 17.5%
45-64 21.1% 78.5% 64.6% 17.8% 24.0% 65+ 92.6% 85.9% 80.6% 22.0% 52.5%
Income <36K 55.3% 83.1% 74.0% 22.2% 42.8% 36K+ 43.4% 87.0% 83.4% 20.6% 52.0%
DK/Refused 55.9% 83.3% 78.5% 18.1% 51.8%
OEF/OIF/OND Yes 4.1% 65.4% 67.0% 14.5% 21.0% No 55.4% 84.5% 77.6% 21.2% 47.1%
Gender Male 52.8% 84.4% 77.5% 21.4% 47.2%
Female 23.3% 82.3% 79.2% 15.2% 37.6% *Denominator is count of enrollees in category with Medicare A higher percentage of Priority 7 – 8 enrollees have Medicare (68%) and this Priority Group is much
more likely to have Medigap (66%) than other priority groupings (36%). A higher percentage of enrollees with annual household incomes less than $36,000 have Medicare
(55%) than those with incomes of $36,000 or more (43%); this may reflect lower incomes among retirees.
Only 4 percent of OEF/OIF/OND enrollees use Medicare; this is most certainly because this population is younger and not Medicare eligible.
Female enrollees (23%) were less likely than male enrollees to have Medicare; the median age of female enrollees is younger than the median age of male enrollees.
Within VISNs, the percent of enrollees using Medicare ranged from 42.1 percent in VISN 22 to 62.4% in VISN 4. Appendix Table 3.1 shows percents for all VISNs.
The Medicare Prescription Drug, Improvement, and Modernization Act (Public Law 108-173, 117 Stat. 2066, called Medicare Modernization Act or MMA) was enacted in December 2003. Availability of drug
Office of the ADUSH for Policy and Planning
63 2011 Survey of Veteran Enrollees' Health and Reliance Upon VA

coverage through Medicare, Medicare Part D, has shifted coverage trends for enrollees, which will be discussed further in the Prescription Drug Section of Chapter 4. M e di ca id Although only 7 percent of enrollees are on Medicaid, as can be seen in Exhibit 3.6, factors such as priority, age, income, gender and OEF/OIF/OND status have an impact on who falls into this category.
Exhibit 3.6 Medicaid Coverage by Priority, Age, Income, OEF/OIF/OND Status, and Gender
Category Medicaid
Priority P1-P3 6.0% P4-P6 9.1% P7-P8 7.6%
Age <45 2.1%
45-64 4.6% 65+ 11.6%
Income <36K 9.2% 36K+ 4.8%
DK/Refused 7.8%
OEF/OIF/OND Yes 1.9% No 7.9%
Gender Male 3.8%
Female 7.6% Denominator is population by category
Enrollees in Priority Groups 4 – 6 were more likely than their counterparts in other priority groups to
be on Medicaid (9%). Almost 12 percent of enrollees age 65 or more reported using Medicaid; this is more than double the
percent of enrollees aged 45-64 on Medicaid (5%) and six times more than the percent of enrollees aged less than 45 on Medicaid (2%).
Enrollees with lower incomes were more likely to be on Medicaid (9%) than those reporting incomes of $36,000 or more.
Only 2 percent of the OEF/OIF/OND enrollee population is on Medicaid versus 8 percent of their counterparts.
Almost 8 percent of the female enrollee population is on Medicaid versus 4 percent of the male enrollee population.
Within VISNs, the percent of enrollees using Medicaid ranged from 5 percent in VISN 21 to 10 percent in VISN 2. Appendix Table 3.1 shows percents for all VISNs.
Office of the ADUSH for Policy and Planning
64 2011 Survey of Veteran Enrollees' Health and Reliance Upon VA

P r i v a t e P l ans Thirty percent of enrollees (2,302,827) indicated they had some sort of private health insurance available to them. The survey asked enrollees who had private health insurance how they had access to this insurance. A little more than a third of enrollees with private health insurance (35%) access it through their employers. An additional 22 percent access it through a former employer and 18 percent access it through a family member. All the responses are shown in Exhibit 3.7. Exhibit 3.7 Count and Percent of Private Coverage Providers
Category Percent of Enrollees with Private Coverage
Number of Enrollees
Current Employer, Including COBRA 34.9% 803,290 Former Employer 22.3% 513,850 Family Member 17.5% 402,180
Individually Purchased Coverage 14.9% 342,138 Federal, State, County or local community health services program 6.9% 157,676
DK/Refused 2.1% 49,149 Other 1.5% 34,546
Total 100% 2,302,827 When reviewed by demographic factors (Exhibit 3.9), income is clearly a factor in whether or not an enrollee had private insurance. When further broken out, the disparity in access to private health insurance among income groups is even more apparent, as can be seen in the bar chart below. Exhibit 3.8 Private Insurance Coverage by Income
10.4% 18.1%
28.8% 35.8%
42.3% 49.7%
<$16,000 $16,000- 25,999
$26,000- $35,999
$36,000- 45,999
$46,000- 55,999
$56,000
Income Bracket
Office of the ADUSH for Policy and Planning
65 2011 Survey of Veteran Enrollees' Health and Reliance Upon VA

Exhibit 3.9 Private Insurance Coverage by Priority, Age, Income, OEF/OIF/OND Status, and Gender
Category Private Insurance
Priority P1-P3 31.7% P4-P6 22.3% P7-P8 34.7%
Age <45 38.5%
45-64 33.2% 65+ 22.5%
Income <36K 18.1% 36K+ 44.5%
DK/Refused 29.3%
OEF/OIF/OND Yes 40.2% No 28.1%
Gender Male 28.8%
Female 34.2% Denominator is population by category
Enrollees with OEF/OIF/OND status, female enrollees, and younger enrollees were more likely to
have private insurance coverage than their counterparts. Enrollees in Priority Group 4 – 6 were less likely to have private insurance (22%) than their
counterparts in other priority groupings. Within VISNs, the percent of enrollees with private insurance ranged from 23 percent in VISN 16 to
42 percent in VISN 3. Appendix Table 3.1 shows percents for all VISNs. T RIC ARE The survey also asks if enrollees are covered by the DoD’s TRICARE or TRICARE For Life health care programs. This insurance program is made available to all active duty service members, National Guard and Reserve members, retirees, and their family members. Within the enrollee population, 16 percent reported that they had TRICARE coverage. Exhibit 3.10 TRICARE Coverage by Priority, Age, Income, OEF/OIF/OND Status, and Gender
Category TRICARE
Priority P1-P3 31.0% P4-P6 7.3% P7-P8 8.4%
Age <45 19.5%
45-64 18.2% 65+ 13.7%
Income <36K 7.9% 36K+ 27.3%
DK/Refused 18.7%
OEF/OIF/OND Yes 30.2% No 15.1%
Gender Male 15.8%
Female 25.2% Denominator is population by category
Office of the ADUSH for Policy and Planning
66 2011 Survey of Veteran Enrollees' Health and Reliance Upon VA

Enrollees in Priority Group 1 – 3 are much more likely than enrollees in other priority groups to use
TRICARE. However, when Priority Group 4 – 6 is broken out to individual priorities (not shown), Priority 6
shows a different pattern than Priorities 4 and 5; 19 percent of Priority 6 enrollees have TRICARE, whereas 7 percent of Priority 4 enrollees and 5 percent of Priority 5 enrollees have TRICARE.
As with private insurance, enrollees with higher incomes are more likely to have TRICARE than those with less income.
Enrollees with OEF/OIF/OND status (30%) and female enrollees (25%) are much more likely than their counterparts to have TRICARE.
Within VISNs, the percent of enrollees using TRICARE ranged from 7 percent in VISN 3 to 28 percent in VISN 5. Appendix Table 3.1 shows percents for all VISNs.
Office of the ADUSH for Policy and Planning
67 2011 Survey of Veteran Enrollees' Health and Reliance Upon VA

This page intentionally left blank.
Office of the ADUSH for Policy and Planning
68 2011 Survey of Veteran Enrollees' Health and Reliance Upon VA

CCC hhh aaa ppp ttt eee rrr 444 Pharmaceutical Use
While 77 percent of enrollees reported some form of non-VA health care insurance, only 39 percent reported some form of non-VA prescription drug coverage. To better understand the demographics of enrollees with prescription drug coverage and their overall medication utilization, the Survey of Enrollees asked a series of pharmaceutical use questions. This chapter provides an overview of their responses to questions regarding prescription drug insurance coverage, utilization of both prescription drugs and OTC medication, and out-of-pocket expenses for prescriptions. Below are notable 2011 statistics:
Thirty-six percent of the 4 million enrollees who reported having Medicare Coverage also have Medicare Part D coverage.
Forty percent of all enrollees do not consider or do not know that their VA enrollment provides drug benefits.
Eighty-three percent of enrollees who reported taking OTC medications in the last 30 days received no OTC medications from the VA.
Forty-three percent of enrollees reported that they had taken more than five prescription medications in the last 30 days.
Twenty percent of enrollees indicated that they did not have monthly out-of-pocket expenses. VA Prescription Drug Benefit Awareness
Enrollees were asked whether they had prescription drug benefit from VA. Theoretically, all enrollees should respond positively since enrollment in VA provides both prescription drugs and OTC medications as a basic benefit with minimal co-payments. Exhibit 4.1 VA Prescription Drug Benefit Reported
Category Count Percent Yes 4,751,701 60.2% No 2,718,506 34.4%
DK/Ref 424,900 5.4% Denominator 7,895,108
The percent of enrollees indicating VA provided them with Prescription Drug Benefits fell from
65 percent in 2008 survey to just over 60 percent in 2010 and 2011. When combined with “Don’t Know” responses, 40 percent of enrollees do not appear to be aware
that they have access to pharmaceuticals through VHA. This is important because studies show that people without prescription drug benefits are less likely to access the benefits of pharmaceuticals.
Sixty-three percent of OEF/OIF/OND enrollees do not consider that their VA enrollment provides drug benefits in comparison to 40 percent of all enrollees.
Priority Groups 7-8 are somewhat less likely to be aware of VA drug benefits (54%) compared to Priority Groups 1-3 (65%) and Priority Groups 4-6 (60%).
Enrollees under the age of 45 are less likely to be aware of their VA drug benefits (42%) than those age 45-64 (63%) or 65+ (63%).
Enrollees with incomes under $36,000 per year were more likely to be aware of their VA prescription drug benefits (67%) compared to enrollees with incomes of $36,000+ per year (52%).
Office of the ADUSH for Policy and Planning
69 2011 Survey of Veteran Enrollees' Health and Reliance Upon VA

When broken out by the VISNs, the percent of enrollees reporting VA prescription drug benefits ranged from 49 percent (VISN 3) to 65 percent (VISNs 8, 9, and 12).
A breakout of VA drug benefit awareness can be found in Appendix Tables 4.1 and 4.2.
Private Insurance Prescription Benefit All enrollees who responded positively to having private insurance coverage were asked if that benefit included prescription drugs. Exhibit 4.2 Private Insurance Including Prescription Benefit
Category Count Percent Yes 1,864,961 81.0% No 360,965 15.7%
DK/Ref 76,901 3.3% Private Insurance Coverage = 2,302,827
Eighty-one percent of those enrollees who responded positively to having private insurance
coverage reported that their private insurance provided prescription benefits. The percentage of enrollees by VISN with private insurance prescription coverage ranged from
74 percent in VISN 12 to 87 percent in VISN 22.
A breakout of private insurance prescription benefit can be found in Appendix Table 4.1.
Medicare Part D Coverage
In 2003, Congress passed the MMA which authorized Medicare beneficiaries to participate in a prescription drug plan, known as Medicare Part D. Enrollment in Medicare Part D began in 2006. Medicare beneficiaries had a window of time within which to enroll or be penalized with higher premiums if they chose to enroll at some date in the future. This two-tier premium practice continues as new beneficiaries become eligible for Medicare. They may elect not to enroll in Medicare Part D upon becoming eligible, but their premium will be higher if they decide to enroll at a future date. However, Medicare beneficiaries with “creditable coverage” at the time of eligibility are not subject to the higher premium if they decide to enroll in Medicare Part D at a later date. For the purposes of Medicare Part D, enrollment in the VA health care system is considered “creditable coverage.” An additional attribute of Medicare Part D is a coverage gap, known as the “doughnut hole,” which places a temporary limit on what the plan will cover for pharmaceuticals after a certain amount (approximately $2,500) is spent until a ceiling (approximately $4,000) is reached. Items that count toward these limits include yearly deductibles, coinsurance, and copayments. In March 2010, The Affordable Care Act (ACA) was passed. The ACA is comprehensive health care legislation that includes provisions to expand coverage, control health costs, and improve the health care delivery system. A provision in the ACA seeks to fill the “doughnut hole” by the year 2020 through a combination of subsidies from pharmaceutical companies and the Federal Government. Progress in this area will continue to influence enrollees’ choice to opt for Medicare Part D, despite their VA pharmaceutical benefits.
Office of the ADUSH for Policy and Planning
70 2011 Survey of Veteran Enrollees' Health and Reliance Upon VA

As in other survey cycles, in 2011, enrollees who reported they had Medicare Coverage were asked if they were enrolled in Medicare Part D. Exhibit 4.3 Medicare Part D Coverage by Medicare Beneficiaries
Category Count Percent Yes 1,466,009 36.4% No 2,262,258 56.2%
DK/Ref 295,768 7.4% Medicare Coverage = 4,024,036
Thirty-six percent of enrollees with Medicare benefits reported having Medicare Part D
prescription benefits.
Exhibit 4.4 Medicare Part D Coverage by Priority, Age, Income, OEF/OIF/OND Status, and Gender
Category Medicare
Part D
Priority P1-P3 29.5% P4-P6 39.9% P7-P8 38.9%
Age <45 33.4%
45-64 32.5% 65+ 37.3%
Income <36K 38.3% 36K+ 33.1%
DK/Refused 36.4%
OEF/OIF/OND Yes 25.6% No 36.5%
Gender Male 36.5%
Female 34.4% *Categories do not total 100 percent as the denominator is count of enrollees in each category with Medicare.
Enrollees in Priority Groups 1-3 were least likely to purchase Part D (30%) compared to enrollees
in Priority Groups 4-6 (40%) or 7-8 (39%). Thirty-seven percent of enrollees with Medicare age 65 and over reported purchasing Part D
coverage compared to 33 percent of enrollees under the age of 65. Thirty-eight percent of enrollees with income less than $36,000 per year reported enrolling in Part
D compared to 33 percent of enrollees with income of $36,000+ per year. Regionally, the percentage of enrollees with “Part D” coverage ranged from 30 percent in VISN 9
to 49 percent in VISN 22, as can be seen in Map 4.1.
Office of the ADUSH for Policy and Planning
71 2011 Survey of Veteran Enrollees' Health and Reliance Upon VA

Map 4.1
Office of the ADUSH for Policy and Planning
72 2011 Survey of Veteran Enrollees' Health and Reliance Upon VA

In order to be considered “creditable coverage” for the purposes of Medicare Part D enrollment, a plan has to be considered as good as or better than the Medicare Part D plan. Since VA enrollment is considered “creditable coverage,” further examination to understand why enrollees would also pay for Medicare D plan seems merited. As can be seen in the exhibit below, non-patients (49%) are more likely to respond that they have Medicare Part D coverage than patients (31%). Exhibit 4.5
Denominators: Non Patients - 1,171,182 | Patients – 2,852,854 | Enrollees – 4,024,036
Other factors that might influence enrollees acquiring Medicare Part D Coverage include:
Most enrollees (62%) reported being married. o A spouse of an enrollee can obtain VA benefits only if the spouse is a qualified Veteran
herself or himself. The spouse may choose to have Medicare Part D coverage. Enrollees may choose to have Medicare Part D coverage to obtain prescriptions drugs prescribed
by non-VA physicians that are not on the VA formulary. Enrollees who are a patient or inmate in an institution of another government agency (i.e., a state
Veteran home, state mental institution, etc.) do not have creditable coverage from VA while in that institution.
Enrollees who live in a nursing home that doesn’t allow them to use or access VA drug benefits may choose to have Medicare Part D coverage.
Enrollees who live a long way from the nearest VA medical facility may prefer to receive medical care from local providers and prescription drugs from local pharmacies.
Some enrollees may be auto-enrolled in Medicare Part D. o Most individuals who qualify for both Medicare and Medicaid automatically receive the
Medicare Drug Benefit. Additionally, individuals with full or low income subsidies are eligible to be automatically enrolled.
Over-The-Counter (OTC) Medications in the Last 30 Days
In order to understand OTC medication usage patterns, respondents of the survey were asked about the number of different OTC medications taken over the last 30 days from any source, followed by a question about the number of different OTC medications provided by VA in the last 30 days. Exhibit 4.6 summarizes the results by showing the number of enrollees who reported they took none, one, two, or three or more OTC medications from any source in a 30 day period.
31.1%
49.4% 36.4%
61.2%
44.0% 56.2%
7.7% 6.6% 7.4%
Patients Non-Patients All Enrollees
Medicare Part D Coverage by Patient/Non-Patient/All Enrollees with Medicare Coverage
Yes No DK/Ref
Office of the ADUSH for Policy and Planning
73 2011 Survey of Veteran Enrollees' Health and Reliance Upon VA

Exhibit 4.6 Number of OTC Medications Taken in 30 Day Period Mean = 1.87
Category Count Percent 0 2,709,533 34.3% 1 1,737,244 22.0% 2 1,267,131 16.1%
3+ 2,023,510 25.6% DK/Ref 157,689 2.0%
Denominator 7,895,108 The mean number of OTC medications taken in a 30 day period was 1.87. Thirty-four percent of the enrollees reported no OTC medications usage in a 30 day period.
As enrollees with OEF/OIF/OND status represent VA’s newest population, their responses were reviewed separately as well as part of the entire enrollee population.
Exhibit 4.7 Number of OTC Medications Taken in a 30 day period OEF/OIF/OND Enrollees Only
Category Count Percent 0 310,828 45.9% 1 162,391 24.0% 2 104,958 15.5%
3+ 93,436 13.8% DK/Ref 4,913 0.7%
Denominator 676,527
Forty-six percent of OEF/OIF/OND enrollees reported no OTC medication usage in a thirty day period, indicating that this population is less likely than the overall enrollee population (34%) to use OTC Medications.
OTC Medications in the Last 30 Days from VA
The 5,027,886 enrollees who reported any OTC use in a 30 day period were asked how many of their OTC medications were obtained from VA. The table below shows the number of enrollees who received none, one, or two or more OTC medications in a 30 day period from VA. Exhibit 4.8 Number of OTC Medications in a 30 Day Period from VA
Mean = 0.52 Category Count Percent
0 4,169,137 82.9% 1 315,265 6.3%
2+ 514,797 10.2% DK/Ref 28,688 0.6%
Enrollees reporting OTC use in last 30 days=5,027,886
The mean OTC medications obtained from VA was 0.52. With the overall mean OTC medications reported as 1.87, it appears as though those enrollees that did use OTC medications purchased the majority of their OTC medications outside of VA.
Approximately 83 percent of all enrollees who reported using OTC medications in a 30 day period reported receiving no OTC medications from VA.
Office of the ADUSH for Policy and Planning
74 2011 Survey of Veteran Enrollees' Health and Reliance Upon VA

o Convenience, plus the VHA co-payment of $8-$9 for each 30-day supply might have factored into enrollee decisions to purchase their OTC medications on their own.
A higher percentage of enrollees in Priority Groups 1-3 (19%) and Priority Groups 4-6 (18%) than enrollees in Priority Groups 7-8 (14%) reported they had obtained some of their OTC medications from VA. o This might be due to the VA eligibility guidelines; Veterans enrolled in Priority 1 have no co-
pay amount and Priority Groups 2-6 have a cap on the amount that they can be charged for medication co-pays yearly.
o There is no cap on annual co-pay amounts for outpatient medications provided to Veterans in Priority Groups 7-8, which might make them less inclined to use VA for OTC medications.
Exhibit 4.9 Number of OTC Medications Taken in a 30 Day Period from VA OEF/OIF/OND Enrollees Only
Category Count Percent 0 299,549 83.0% 1 30,328 8.4%
2+ 30,110 8.4% DK/Ref 798 0.2%
Denominator 360,786
Although a lower percentage of OEF/OIF/OND enrollees used OTC medications, the pattern of those who did was closely matched to the general enrollee population with 83 percent of both populations opting to get their OTC medications somewhere other than VA.
Number of Prescriptions in the Last 30 Days
The survey also probed the enrollee’s use of prescription medications, both overall and from VA. Respondents first were asked the number of prescriptions they had used from any source in the last 30 days. The table below shows the number of enrollees who used none, one to two, three to four, or more than five prescriptions from any provider in the last 30 days. Exhibit 4.10 Number of Prescriptions in a 30 Day Period from Any Source
Mean = 4.7 Category Count Percent
0 1,199,138 15.2% 1-2 1,472,593 18.7% 3-4 1,731,388 21.9% 5+ 3,368,647 42.7%
DK/Ref 123,341 1.6% Denominator 7,895,108
On average, enrollees reported taking 4.7 prescriptions in a 30 day period. Forty-three percent of enrollees reported that they had taken more than 5 prescription medications
in the last 30 days.
Comparative data reported by the National Center for Health Statistics (NCHS) shows that only 11 percent of the overall American population takes more than 5 prescription medications. As has been noted before, some of this difference is because the Veteran population is older than the general population and might have co-morbidity issues. This also might be due to Veterans’ overall access to coverage for prescription medications.
Office of the ADUSH for Policy and Planning
75 2011 Survey of Veteran Enrollees' Health and Reliance Upon VA
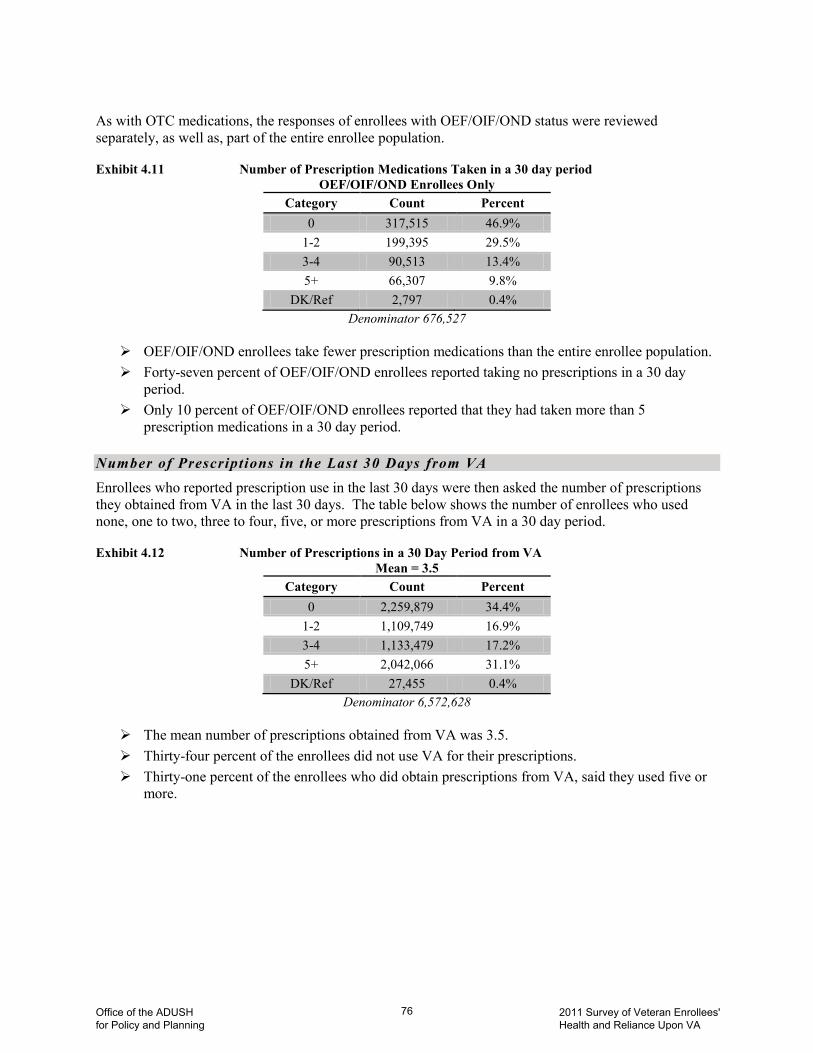
As with OTC medications, the responses of enrollees with OEF/OIF/OND status were reviewed separately, as well as, part of the entire enrollee population. Exhibit 4.11 Number of Prescription Medications Taken in a 30 day period
OEF/OIF/OND Enrollees Only Category Count Percent
0 317,515 46.9% 1-2 199,395 29.5% 3-4 90,513 13.4% 5+ 66,307 9.8%
DK/Ref 2,797 0.4% Denominator 676,527
OEF/OIF/OND enrollees take fewer prescription medications than the entire enrollee population. Forty-seven percent of OEF/OIF/OND enrollees reported taking no prescriptions in a 30 day
period. Only 10 percent of OEF/OIF/OND enrollees reported that they had taken more than 5
prescription medications in a 30 day period. Number of Prescriptions in the Last 30 Days from VA
Enrollees who reported prescription use in the last 30 days were then asked the number of prescriptions they obtained from VA in the last 30 days. The table below shows the number of enrollees who used none, one to two, three to four, five, or more prescriptions from VA in a 30 day period. Exhibit 4.12 Number of Prescriptions in a 30 Day Period from VA
Mean = 3.5 Category Count Percent
0 2,259,879 34.4% 1-2 1,109,749 16.9% 3-4 1,133,479 17.2% 5+ 2,042,066 31.1%
DK/Ref 27,455 0.4% Denominator 6,572,628
The mean number of prescriptions obtained from VA was 3.5. Thirty-four percent of the enrollees did not use VA for their prescriptions. Thirty-one percent of the enrollees who did obtain prescriptions from VA, said they used five or
more.
Office of the ADUSH for Policy and Planning
76 2011 Survey of Veteran Enrollees' Health and Reliance Upon VA

Exhibit 4.13 Number of Prescription Medications Obtained from VA in a 30 day period OEF/OIF/OND Enrollees Only Category Count Percent
0 136,258 38.3% 1-2 117,601 33.0% 3-4 59,980 16.8% 5+ 41,201 11.6%
DK/Ref 1,175 0.3% Denominator 356,215
Slightly more OEF/OIF/OND enrollees (38%) chose to obtain their prescriptions from sources
other than VA than enrollees in the overall population (34%). Twelve percent of OEF/OIF/OND enrollees used VA for five or more prescription medications
over a 30 day period.
Exhibit 4.14 Number of Prescriptions in the Last 30 Days from VA by Age Groups (<30, 30-49, 50-64, 65+) N=6,572,628
Category <30 30-49 50-64 65+
Count Percent Count Percent Count Percent Count Percent 0 56,795 34.1% 270,114 35.9% 428,063 29.1% 320,285 38.0%
1-2 69,771 41.9% 186,567 24.8% 707,296 16.4% 1,225,674 14.1% 3-4 25,694 15.4% 129,923 17.3% 397,773 18.2% 455,639 16.6% 5+ 14,107 8.5% 162,791 21.6% 443,229 36.0% 534,632 30.7%
DK/Ref 69 0.0% 2,828 0.4% 874,957 0.3% 990,210 0.6% Total 166,436 100.0% 752,223 100.0% 2,429,818 100.0% 3,224,150 100.0%
Denominators are column totals
Prescription drug use increased with age. Thirty-three percent of the enrollees over the age of 50 took five or more prescription drugs in the last 30 days from VA in comparison to enrollees in the 30-49 (22%), and less than 30 years of age groups (9%). The average age of the OEF/OIF/OND enrollee group is 35 years.
Comparative data reported by the NCHS shows that among older Americans (aged 60 and over), more than 76 percent used two or more prescription drugs and 37 percent used five or more prescription drugs in a month.
Out-of-Pocket Expense for Medications
Enrollee respondents were asked to identify their average monthly out-of-pocket expenses for prescription and over-the-counter medications. Health insurance premiums were excluded. The table below shows a break out of the responses for average monthly out-of-pocket expenses for medications (OTC and prescription).
Office of the ADUSH for Policy and Planning
77 2011 Survey of Veteran Enrollees' Health and Reliance Upon VA

Exhibit 4.15 Monthly Out-of-Pocket Expenses for Medications Mean = $65.69 | Median = $20 Count Percent
$0 1,577,730 20.0% $1-19 1,600,846 20.3%
$20-49 1,934,331 24.5% $50-199 1,719,634 21.8% $200+ 411,015 5.2%
DK/Ref 651,552 8.3% Denominator 7,895,108
Twenty percent of enrollees in 2010 and 2011 indicated they did not have out-of-pocket
expenses. An additional 20 percent indicated expenses less than $20. The low out-of-pocket expense may
be partially explained by the implementation of Medicare Part D in January 2006 which has reduced out-of-pocket costs for elderly persons.
Results were very skewed by extremely high outliers; therefore, the median of $20 should be considered the more representative amount.
Results ranged from $0 (20%) to $200+ (5%).
Office of the ADUSH for Policy and Planning
78 2011 Survey of Veteran Enrollees' Health and Reliance Upon VA

Profile of the More Reliant Enrollee:
Was uninsured
In poor health status
Earned less than $20,000
50-64 years old
Was unemployed
Was separated (single)
Was Black / African-American
CCC hhh aaa ppp ttt eee rrr 555
VA Reliance With over half of all enrollees eligible for Medicare and approximately 77 percent of all enrollees reporting some type of insurance coverage, clearly not all health care for enrolled Veterans was provided in VA settings. Def in i t i on o f Re l i ance
The 2011 survey asked enrollees two questions on their overall use of medical services in 2010. Enrollees were first asked to recall non-VA outpatient visits or trips within either the year 2010 or the last 3 months of 2010, and then asked to recall VA outpatient visits or trips within the same time period. The dependence upon enrollees’ recall decreases the overall reliability of the data when compared to actual VA healthcare utilization. However, the ability to profile VA reliance based on an enrollee perspective is worthwhile in analyzing actual versus perceived reliance in further studies. VA reliance is setting-specific (e.g., outpatient) and is defined as the number of visits or trips in a VA setting reported by an enrollee divided by the sum of all visits in both VA and non-VA settings. For example, if an enrollee’s outpatient care was provided entirely by VA, then his/her reported outpatient VA reliance is one (1.0), meaning 100 percent of the enrollee’s self-reported outpatient care was provided by VA. If an enrollee’s outpatient care was provided entirely outside VA, the reported outpatient VA reliance is zero (0.0); meaning VA provided 0 percent of the enrollee’s self-reported outpatient care. If an enrollee reported no visits or trips at all, neither VA nor non-VA, then his/her outpatient reliance is undefined. Thus, only enrollees who utilize some outpatient care in either a VA and/or non-VA setting have a defined reliance factor for that setting. Therefore, the data reported in this chapter is reported as percentages (i.e., the percentage of outpatient visits provided by VA within the reference year/months). Note: Outpatient visits exclude dental, mental health, substance abuse, and/or trips to a pharmacy.
A n a l y s i s o f V A R e l i a n c e a t t h e N a t i on a l L e v e l
It is instructive to look at VA reliance at the National Level. Reliance on VA care for approximately 18 percent of enrollees (1,451,019) was undefined. They
did not consume any outpatient health care services either VA or non-VA; they could not recall the numbers of VA, VA paid, or non-VA visits; or they refused to answer the questions. These enrollees are not part of the denominator for the remainder of this chapter.
Of the enrollees with a defined VA reliance factor, 27 percent had 0 percent reliance, and 25 percent had 100 percent reliance. It is interesting to note that more than half of enrollees are either not at all reliant or 100 percent reliant (See Exhibit 5.1).
Nationwide, the average reliance on VA for outpatient care was 47 percent.
Office of the ADUSH for Policy and Planning
79 2011 Survey of Veteran Enrollees' Health and Reliance Upon VA

Exhibit 5.1
Note: Does not include enrollees who did not consume any health care services in 2011 (18%).
R e l i a n c e b y N o n - V A H e a l t h C a r e I n s u r a n c e C o v e r a g e
Enrollees with no public or private health insurance coverage had the highest average VA reliance, 78 percent.
Enrollees with any form of non-VA insurance coverage, either public or private, showed a lower mean reliance (38%) than the overall mean reliance (47%). (See Exhibit 5.2)
Reliance was lowest when enrollees had Medigap coverage (30%) or private insurance (30%). Exhibit 5.2
27.3%
7.6%12.1%
6.3%3.5%
24.8%
0% 1-25% 26-50% 51-75% 76-99% 100%
VA Mean Reliance for Enrollees
40.7% 29.5% 43.3% 33.6% 30.4%
Medicare Medigap Medicaid Tricare Private Insurance
Mean Reliance by Various Insurance Coverage
Mean Reliance with InsuranceOverall Mean Reliance Overall Mean Reliance without Insurance Coverage
78%
38%
47%
Office of the ADUSH for Policy and Planning
80 2011 Survey of Veteran Enrollees' Health and Reliance Upon VA

V A R e l i a n c e b y P e r c e i v e d H e a l t h S t a t u s
VA reliance was found to be related to perceived health status. Overall, VA reliance increased as perceived health status declined. (See Exhibit 5.3) Enrollees with fair and poor perceived health status had higher than average VA reliance.
Enrollees with poor perceived health status had 52 percent VA reliance and enrollees with fair perceived health status had 50 percent reliance on VA for outpatient services.
Conversely, enrollees who perceived their health status as excellent or very good had lower than average VA reliance. Enrollees with excellent perceived health status relied on VA for 43 percent of their outpatient visits and enrollees with very good perceived health status relied on VA for 44 percent of their outpatient visits.
Exhibit 5.3
V A R e l i a n c e b y P r i o r i t y G r o u p
VA reliance varied among Priority Groups. Priority Group 8 Veterans had the lowest VA Reliance (30%) of all Priority Groups. Priority
Group 8 Veterans are generally not service connected, and their income is above the means test threshold.
Priority Groups 1 (58%), 4 (64%), and 5 (58%) had higher than average VA reliance on VA health care.
Priority Group 1 Veterans are those enrollees with service-connected disabilities rated 50 percent or more and/or Veterans determined by VA to be unemployable due to service-connected conditions.
Priority Group 4 Veterans are those enrollees receiving aid and attendance or housebound benefits and/or are catastrophically disabled.
Priority Group 5 Veterans are non-service connected Veterans and non-compensable service-connected veterans rated 0 percent disabled by VA with annual income and/or net worth below the VA national income threshold and geographically-adjusted income threshold for their resident location. These Veterans are generally eligible for Medicaid programs. In previous years, this group had a lower-than-average VA reliance. This increase in VA reliance in Priority Group 5 Veterans may be due to the nationwide trend of stricter standards for Medicaid enrollment, and decreases in the number of providers accepting Medicaid reimbursement, as reported by Kaiser Commission on Medicaid and the Uninsured 2010 state survey results.
42.5% 44.3% 46.0%50.2% 51.8%
Excellent Very Good Good Fair Poor
Mean Reliance by Perceived Health Status
Office of the ADUSH for Policy and Planning
81 2011 Survey of Veteran Enrollees' Health and Reliance Upon VA

Exhibit 5.4
V A R e l i a n c e b y A g e G r o u p
In the general population, health care utilization generally increases with age (2011, U.S. Census Bureau). In this analysis, the outcome was not the total health care utilization, but the percentage of the utilization paid by VA; therefore, a different pattern emerged. Reliance dropped considerably in the population aged 65 years or more. This can be related to the enrollees’ eligibility of Medicare insurance at age 65. From observing Exhibit 5.5 below, the relationship between VA reliance and age groups are measured for four age bands: less than 30, 30 to 49, 50 to 64, and 65+. Enrollees less than 30 years of age and enrollees from 50 to 64 years of age had higher than
average VA reliance (54% and 56% respectively).
The lowest VA reliance of 39 percent was for enrollees who were 65 years of age or older. This is close to the 41 percent reliance among enrollees covered by Medicare.
Uninsurance rose by age group. Therefore, it is possible that the difficulty in obtaining non-VA insurance is a factor in reliance as people age and insurance becomes more difficult to obtain at a reasonable cost. This is demonstrated by the trend of increasing reliance in uninsured enrollees by age group.
The largest difference in VA reliance was displayed between insured and uninsured enrollees in the 65+ age group. Uninsured enrollees in this age group had 85 percent reliance, as opposed to their insured counterparts with 37 percent reliance. The trend of increased reliance with age is apparent in the uninsured enrollee population.
As enrollees age, reliance appears less dependent upon perceived health status, as demonstrated by the trend of decreasing difference in VA reliance between Fair/Poor health status and Excellent/Very Good/Good categories.
In the <30 age group, VA reliance is highest for Fair/Poor perceived health status (63%) , as compared to 50 percent reliance for Excellent/Very Good/Good health status.
Exhibit 5.5 Mean Reliance by Insurance Coverage and Perceived Health Status Groups by Age
Age Group
Mean Reliance
Mean Reliance by Insurance Status Mean Reliance by Health Status
Uninsured Insured Difference Fair/Poor Excellent/Very Good/Good Difference
<30 53.6% 71.0% 39.3% 31.7% 63.0% 50.3% 12.7%
30-49 46.3% 72.2% 33.3% 38.9% 52.1% 43.2% 8.9%
50-64 55.9% 80.4% 42.8% 37.6% 59.2% 53.7% 5.5%
65+ 39.4% 84.8% 37.2% 47.6% 40.9% 38.6% 2.3%
National Mean 46.9%
57.8%44.8% 43.3%
64.0%58.0%
38.2% 39.0%29.5%
1 2 3 4 5 6 7 8
Priority Group
Mean Reliance by Priority Group
Office of the ADUSH for Policy and Planning
82 2011 Survey of Veteran Enrollees' Health and Reliance Upon VA

V A R e l i a n c e b y I n c o m e G r o u p
There appears to be a strong correlation between income and VA reliance. Generally, as income increases, reliance on VA decreases. Enrollees with incomes less than $36,000 had over 56 percent reliance on VA for outpatient
services. (See Exhibit 5.6)
The correlations become even more evident when looking at further breakdown of income levels in Exhibit 5.7. Enrollees with incomes less than $20,000 had 63 percent reliance on VA for outpatient services.
Exhibit 5.6
Exhibit 5.7
V A R e l i a n c e a n d E m p l o y m e n t S t a t us
VA reliance was also found to be related to employment status. (See Exhibit 5.8) Enrollees employed full-time had the least VA reliance, 39 percent.
Enrollees not in the labor force had a VA reliance factor of 46 percent, which was closest to the national average.
Enrollees with other types of employment status had higher than average VA reliance, including self employed full time (49%), employed part time (51%), and self-employed part time (55%).
Enrollees who were unemployed had a much higher than average VA reliance (64%).
56.7%
36.0%
< $36,000 ≥ $36,000
Mean Reliance by Income Group
63.3%51.2%
43.1%31.2%
<$20,000 $20,000-$34,999 $35,000-$50,000 >$50,000
Mean Reliance by Income Group
Office of the ADUSH for Policy and Planning
83 2011 Survey of Veteran Enrollees' Health and Reliance Upon VA

Exhibit 5.8
V A R e l i a n c e a n d M a r i t a l S t a t u s
Enrollees who reported being married (40%) or widowed (46%) had lower VA reliance than enrollees who were divorced (62%), separated (63%), or single (62%). (See Exhibit 5.9) Exhibit 5.9
V A R e l i a n c e b y R a c e a n d E t h n i c i t y
Ethnicity appears to affect VA reliance. Enrollees who identified themselves as Hispanic or Latino had a higher VA reliance (52%) than those who are not Hispanic or Latino (47%).
VA reliance also varies amongst those enrollees based on their first listed race. Enrollees who identified themselves as Asian were least reliant (42%), while enrollees identified as Black or African-American were most reliant (57%) on VA for their health care.
Reliance amongst “multi-race” enrollees, or the 2.7 percent of enrollees who chose more than one race, was higher than average, at 52 percent.
38.5%49.2% 51.2% 55.3%
63.7%46.4%
Employed Full Time
Self Employed Full Time
Employed Part Time
Self-employed Part Time
Unemployed Not in Labor Force
Mean Reliance by Employment Status
National Mean Reliance (47%)
40.2% 45.9%62.1% 63.2% 62.2%
Married Widowed Divorced Separated Single - Never Married
Mean Reliance by Marital Status
Office of the ADUSH for Policy and Planning
84 2011 Survey of Veteran Enrollees' Health and Reliance Upon VA

Exhibit 5.10
V A R e l i a n c e a n d A c t i v e Du t y P e r i od o f S e r v i c e
VA Reliance seemed to be related to period of service. (See Exhibit 5.11) Enrollees who reported service during Vietnam had the highest VA reliance (52%).
Enrollees who reported service between Vietnam and the Gulf War also reported higher than average VA reliance (48%).
Enrollees with reliance much lower than the national average included those who report service during World War II (33%), Korea (35%), and between World War II and Korea (34%). This is likely related to the age of these enrollees and their Medicare eligibility.
Exhibit 5.11
V A R e l i a n c e b y V I S N
There is significant regional variation in VA reliance, as demonstrated in the map (Map 5.1). VISN 9 had the highest VA Reliance (53%).
VISN 3 had the lowest VA reliance (37%).
Table 5.1 in the Appendix contains more specific VISN-level VA reliance data.
52.2%46.6%
51.7%41.7%
56.8%51.4%
45.4%51.8%
Hispanic or Latino
Neither Hispanic
nor Latino
American Indian or Alaska Native
Asian Black or African-
American
Native Hawaiian or
Other Pacific Islander
White Multi Race
Mean Reliance by Ethnicity and Race
39.7%33.1% 33.6% 35.0%
42.1%
51.8% 48.3%42.1% 43.3%
Before WWII
WWII Era Between WWII and
Korea
Korean War Era
Between Korea and Vietnam
Vietnam Era
Between Vietnam and Gulf
War
Gulf War Era
Current Era
Mean Reliance by Period of Service
Office of the ADUSH for Policy and Planning
85 2011 Survey of Veteran Enrollees' Health and Reliance Upon VA

Map 5.1
Office of the ADUSH for Policy and Planning
86 2011 Survey of Veteran Enrollees' Health and Reliance Upon VA

S u m m a r y o f R e l i an c e D r i v er s
The findings suggest that the principal drivers of VA reliance were enrollee non-VA health insurance coverage, self-reported health status, and income. The association observed with age, marriage, employment status, period or service, race, and ethnicity may only be secondarily related to VA reliance, as they are proxies for non-VA health insurance coverage. VA reliance also depends on what type of non-VA health insurance coverage enrollees had. Enrollees who had some type of non-VA insurance had lower than average VA reliance (38%), while those without insurance had much higher than average VA reliance (78%).
Office of the ADUSH for Policy and Planning
87 2011 Survey of Veteran Enrollees' Health and Reliance Upon VA

This page intentionally left blank.
Office of the ADUSH for Policy and Planning
88 2011 Survey of Veteran Enrollees' Health and Reliance Upon VA
CCC hhh aaa ppp ttt eee rrr 666
Cigarette Smoking Status
P r of i l e o f En ro l l e es Wh o Ar e Cur r en t Sm ok er s Enrollees with no public or private insurance were considerably more likely to smoke than those
with insurance. Enrollees who reported combat status were more likely to be current smokers. Black/African Americans were more likely to report being current smokers than other races. Enrollees who were unemployed were more likely to report being current smokers. OEF/OIF/OND Veterans were more likely to report being current smokers. Enrollees who were patients were somewhat more likely to report being current smokers. Enrollees who reported fair or poor health status were more likely to report being current
smokers. Enrollees over age 65 were much less likely to report being current smokers compared to other
age groups.
Ci g ar e t t e Sm oki ng S t a tu s O v er v i ew The U.S. Center for Disease Control and Prevention has reported that cigarette smoker prevalence for adults has decreased over the years, but declines have slowed in recent years. According to the Health and Human Services Department, cigarette smoking continues to be the leading preventable cause of death in the United States. Therefore, it is important to understand the smoking habits of our enrollee population, to continue to reduce the prevalence of smoking for Veterans.
The following three questions on Cigarette Smoking were included on the 2011 survey. Based on answers to these questions, enrollees were classified into one or more of five groups: 1) never smokers; 2) ever smokers; 3) current smokers; 4) former smokers; and 5) recent quitters.
Have you smoked at least 100 cigarettes in your life? Enrollees who responded “no” were classified as never smokers. Enrollees who responded “yes” or “don’t know,” or who refused to answer were classified as ever
smokers and were considered the Smoker Population. These ever smoker respondents were then asked the following two questions.
Do you now smoke cigarettes every day, some days, or not at all? Enrollees who responded “every day,” “some days,” “don’t know,” or who refused to answer
were classified as current smokers. If the response to this question was “not at all” then the enrollees were classified as former
smokers. During the past 12 months, have you stopped smoking for more than one day because you were trying to quit smoking?
Enrollees responding “yes” to this question were classified as recent quitters.
Office of the ADUSH for Policy and Planning
89 2011 Survey of Veteran Enrollees' Health and Reliance Upon VA

Exhibit 6.1 Smoking Status Classifications Percent
Enrollees Enrollee Count Classification
68.0% 5.4 million
Ever smokers, based on responses of “yes,” “don’t know,” or “refused to answer”: Have you smoked at least 100 cigarettes in your life?
1.6 million (29%) of the ever smoker population are classified as current smokers
3.8 million (71%) of the ever smoker population are classified as former smokers
1.3 million (24%) of the ever smoker population are classified as recent quitters (have stopped smoking within the last 12 months.)
32.0% 2.5 million Never smokers are enrollees who have never smoked Does not total to 100 percent because enrollees could respond to more than one. The responses to these three questions can be evaluated to compare smoking status in several different ways:
as a percentage of the overall enrollee population by priority, age, and income groups; as a percentage of the response to the question that determined the ever smoker population; and as a percentage of the enrollee smoking status, (e.g., current smoker, former smoker, or recent
quitter);
As noted in previous reports, enrollees in different priority, age, income groups, and OEF/OIF/OND statuses show different levels of current smokers. In order to understand behaviors, it is also helpful to compare cigarette smoking status by other cohorts as well:
as a percentage of the enrollee population by ethnicity, race, gender, patient status, combat status, OEF/OIF/OND status, employment status; and insurance status.
Current smokers (1,558,900) made up 19.7 percent of the entire enrollee population. This is virtually the same as the percentage of enrollees documented as “current smokers” in the 2008 and 2010 surveys, and slightly higher than the latest 2010 Center for Disease Control estimate of 19.3 percent of U.S. adults who were current smokers. When the ever smoker population (5,367,301) is used as a denominator, current smokers:
Were more likely to be in Priority 4-6 (38%). Were more likely to be less than 45 years of age (53%). Were more likely to be in the less than $36,000 (34%) income group. Were more likely to be OEF/OIF/OND Veterans (48%). (See Exhibit 6.4)
When comparing the data by other special populations, current smokers:
Were more likely to be non-Hispanic (19.8%). Were more likely to be Black (28%). Were more likely to be female (20%). Were more likely to be patient in care (20%). Were more likely to have reported combat status (27%). Were more likely to be unemployed (35%). Were more likely to be uninsured (35%). (See Exhibit 6.5)
Office of the ADUSH for Policy and Planning
90 2011 Survey of Veteran Enrollees' Health and Reliance Upon VA

Former smokers were 48 percent (3,808,401) of the entire enrollee population (7,895,108). These enrollees responded that while they have smoked more than 100 cigarettes in their entire lives (i.e., ever smokers), they currently did not smoke cigarettes at all. When compared using the ever smoker population as a denominator, former smokers:
Were mostly Priority 7-8 enrollees (83%). Were more likely to be in the age group 65 or over (87%). Were more likely to be in the $36,000 plus annual household income group (77%). Were more likely to not be OEF/OIF/OND Veterans (72%). (See Exhibit 6.4)
Recent quitters are the portion of the enrollees who responded that although they have smoked more than 100 cigarettes in their lifetime, during the last 12 months they stopped smoking for more than one day because they were trying to quit.
With the enrollee population as a denominator, 17 percent were categorized as recent quitters. When the ever smoker population is used as the denominator, 24 percent were recent quitters,
virtually no change from 2010. When the enrollee population is used, recent quitters were more likely to be OEF/OIF/OND
Veterans (21%).
When the ever smoker population is used as the denominator (5,367,301), recent quitters: Were more likely to be in Priority Groups 4-6 (29%). Were more likely to be in the less than 45 age group (45%). Were more likely to be in the less than $36,000 income group (28%). Were more likely to be OEF/OIF/OND Veterans (44%). (See Exhibit 6.4)
The recent quitter population can be compared by those enrollees who reported being current or former smokers. Over half of current smokers (57%) and 11 percent of former smokers reported that they recently tried to quit smoking (within the last 12 months). (See Tables 6.6 and 6.7 in the Appendix.) Results of the 2011 survey indicate essentially no change has occurred since 2008 with respect to reducing the enrollee current smoker population. Results comparing the 2005 through 2011 surveys indicate that the number of current smokers has decreased only slightly.
Current smokers comprised 19.7 percent of the entire enrollee population. (See Exhibit 6.2) Exhibit 6.2 Enrollee Current Smokers by Year
Year Current Smokers Count
Enrollees Count
Percent Current Smokers
2005 1,485,496 6,704,150 22.2% 2007 1,547,757 7,186,950 21.5% 2008 1,445,469 7,339,532 19.7% 2010 1,533,668 7,804,639 19.7% 2011 1,558,900 7,895,108 19.7%
Similar results between the years are noted for all other smoking statuses. (See Exhibit 6.3)
Of the entire enrollee population, 68 percent reported that they have ever smoked. Of those enrollees who reported that they have ever smoked:
o Twenty-nine percent were current smokers.
Office of the ADUSH for Policy and Planning
91 2011 Survey of Veteran Enrollees' Health and Reliance Upon VA

o Seventy-one percent were former smokers. Of the enrollee population who has ever smoked, 24 percent were recent quitters. When the
recent quitter population is compared by those enrollees who reported being current or former smokers: o Fifty-seven percent of current smokers reported that they tried to quit within the last 12
months. o Eleven percent of former smokers reported quitting within the last 12 months. (See Tables 6.6
and 6.7 in the Appendix.) Of all enrollees surveyed, 32 percent reported that they have never smoked.
Exhibit 6.3 Enrollee Smoking Status by Year
2005 2007 2008 2010 2011 Ever Smokers 4,770,915 5,032,198 5,152,557 5,282,388 5,367,301
% Enrollee Population 71.2% 70.0% 70.2% 67.7% 68.0% Never Smoked 1,886,413 2,154,752 2,186,974 2,522,252 2,527,807
% Enrollee Population 28.1% 30.0% 29.8% 32.3% 32.0% Current Smokers 1,485,496 1,547,757 1,445,468 1,533,667 1,558,900
% Ever Smoker Population 31.1% 30.8% 28.1% 29.0% 29.0% % Enrollee Population 22.2% 21.5% 19.7% 19.7% 19.7%
Former Smokers 3,319,049 3,484,441 3,707,089 3,748,720 3,808,401 % Ever Smoker Population 69.6% 69.2% 71.9% 71.0% 71.0%
% Enrollee Population 49.5% 48.5% 50.5% 48.0% 48.2% Recent Quitters 1,196,242 1,229,544 1,313,820 1,292,191 1,303,176
% Ever Smoker Population 25.1% 24.4% 25.5% 24.5% 24.3% % Enrollee Population 17.8% 17.1% 17.9% 16.6% 16.5%
Enrollee Population 6,704,150 7,186,950 7,339,531 7,804,639 7,895,108 Exhibit 6.4 contains detailed information on counts and percentages for responses to the questions on Cigarette Smoking. Exhibit 6.5 contains detailed information on counts and percentages for current smokers by special populations. Tables 6.1 through 6.5 in the Appendix provide VISN breakdowns of current smokers, former smokers, recent quitters, never smokers, and ever smokers by priority, age, and income groups, utilizing the enrollee populations by priority, age, and income as the denominator. Tables 6.6 and 6.7 contains VISN breakdowns on enrollees who reported recently trying to quit, displayed by current and former smoker status.
Office of the ADUSH for Policy and Planning
92 2011 Survey of Veteran Enrollees' Health and Reliance Upon VA

Exhibit 6.4 Enrollee Smoking Status by Priority, Age, Income, OEF/OIF/OND
Priority Group Age Groups
1-3 4-6 7-8 <45 45-64 65+ Ever Smokers 1,895,323 2,001,933 1,470,045 553,131 2,285,319 2,528,850
% Ever Smoker 35.3% 37.3% 27.4% 10.3% 42.6% 47.1% % Enrollee Population 65.0% 71.7% 67.2% 50.3% 70.3% 71.3%
Never Smokers 1,019,947 791,722 716,138 545,562 966,660 1,015,585 % Never Smoked 40.3% 31.3% 28.3% 21.6% 38.2% 40.2%
% Enrollee Population 35.0% 28.3% 32.8% 49.7% 29.7% 28.7% Current Smokers 550,663 763,783 244,455 291,602 930,816 336,482
% Current Smokers 35.3% 49.0% 15.7% 18.7% 59.7% 21.6% % Ever Smoker 29.1% 38.2% 16.6% 52.7% 40.7% 13.3%
% Enrollee Population 18.9% 27.3% 11.2% 26.5% 28.6% 9.5% Former Smokers 1,344,660 1,238,151 1,225,590 261,530 1,354,503 2,192,369
% Former Smokers 35.3% 32.5% 32.2% 6.9% 35.6% 57.6% % Ever Smoker 70.9% 61.8% 83.4% 47.3% 59.3% 86.7%
% Enrollee Population 46.1% 44.3% 56.1% 23.8% 41.7% 61.9% Recent Quitters 477,836 589,359 235,981 249,780 708,109 345,287
% Recent Quitters 36.7% 45.2% 18.1% 19.2% 54.3% 26.5% % Ever Smoker 25.2% 29.4% 16.1% 45.2% 31.0% 13.7%
% Enrollee Population 16.4% 21.1% 10.8% 22.7% 21.8% 9.7% Enrollee Population 2,915,270 2,793,656 2,186,183 1,098,642 3,251,995 3,544,470
Income Groups OEF/OIF/OND 2011 <$36k $36k+ DK/Ref Yes No
Ever Smokers 2,925,504 1,831,212 610,585 324,999 5,042,302 5,367,301 % Ever Smoker 54.5% 34.1% 11.4% 6.1% 93.9%
% Enrollee Population 72.2% 62.6% 66.6% 48.0% 69.9% 68.0% Never Smokers 1,125,772 1,095,313 306,721 351,528 2,176,279 2,527,807
% Never Smoked 44.5% 43.3% 12.1% 13.9% 86.1% % Enrollee Population 27.8% 37.4% 33.4% 52.0% 30.1% 32.0%
Current Smokers 978,582 427,573 152,745 155,939 1,402,962 1,558,900 % Current Smokers 62.8% 27.4% 9.8% 10.0% 90.0%
% Ever Smoker 33.5% 23.3% 25.0% 48.0% 27.8% 29.0% % Enrollee Population 24.2% 14.6% 16.7% 23.0% 19.4% 19.7%
Former Smokers 1,946,922 1,403,639 457,840 169,060 3,639,341 3,808,401 % Former Smokers 51.1% 36.9% 12.0% 4.4% 95.6%
% Ever Smoker 66.5% 76.7% 75.0% 52.0% 72.2% 71.0% % Enrollee Population 48.1% 48.0% 49.9% 25.0% 50.4% 48.2%
Recent Quitters 810,365 389,251 103,560 142,998 1,160,178 1,303,176 % Recent Quitters 62.2% 29.9% 7.9% 11.0% 89.0%
% Ever Smoker 27.7% 21.3% 17.0% 44.0% 23.0% 24.3% % Enrollee Population 20.0% 13.3% 11.3% 21.1% 16.1% 16.5%
Enrollee Population 4,051,276 2,926,525 917,307 676,527 7,218,581 7,895,108
Office of the ADUSH for Policy and Planning
93 2011 Survey of Veteran Enrollees' Health and Reliance Upon VA

Exhibit 6.5 Current Smokers (N=1,558,900) by Special Populations
Current Smoker
Count Percent Total Enrollees
Ethnicity Hispanic/Latino 92,387 18.7% 493,768 Non-Hispanic/Latino 1,445,189 19.8% 7,283,914
Race (could choose more than 1)
White 1,174,904 18.4% 6,383,099 Black 255,515 27.6% 926,598
American Indian/Alaska Native 12,621 22.2% 56,832
Asian 14,117 18.9% 74,754 Native Hawaiian/Other
Pacific Islander 12,621 22.2% 56,832
Age Group <30 103,760 27.4% 378,579 30-49 289,084 25.9% 1,114,212 50-64 829,575 29.0% 2,857,882 65+ 336,482 9.5% 3,544,435
Gender Female 98,336 20.2% 485,964 Male 1,460,565 19.7% 7,409,144
Public/Private Insurance Yes 931,092 15.3% 6,083,150 No 627,808 34.6% 1,811,958
Combat Status Yes 909,456 27.1% 3,357,747 No 649,444 14.3% 4,537,361
Health Status Excellent 114,318 12.7% 899,711 Very Good 322,245 16.9% 1,911,897
Good 456,725 19.6% 2,329,944 Fair 390,205 23.0% 1,699,010 Poor 267,204 26.2% 1,018,136
Patient Status Yes 1,099,002 20.4% 5,377,504 No 459,898 18.3% 2,517,604
Employment Status Employed 501,988 20.6% 2,435,088 Unemployed 245,372 35.3% 695,021
Not in Labor Force 784,320 16.7% 4,694,397
Office of the ADUSH for Policy and Planning
94 2011 Survey of Veteran Enrollees' Health and Reliance Upon VA

VI S N O ve r v i ew ( Cu rr en t Sm ok er s ) The number and percent of current smokers has shown a slight but steady decrease since the 2005 survey, and appears to be leveling off. See Table 6.1 in the Appendix for enrollee current smokers characteristics displayed by VISN, priority, age, and income. Exhibit 6.6 Percent Current Smokers by VISN
VISN 2008 2010 2011 2010-2011 Difference
1 16.7% 15.7% 16.9% 1.2% 2 20.4% 19.4% 21.1% 1.7% 3 12.8% 15.0% 14.5% -0.5% 4 16.6% 19.1% 17.0% -2.1% 5 18.4% 16.6% 19.0% 2.4% 6 22.1% 21.5% 18.6% -2.9% 7 19.7% 20.0% 19.8% -0.2% 8 18.9% 15.9% 17.5% 1.6% 9 24.3% 24.1% 24.7% 0.6%
10 24.8% 22.6% 23.6% 1.0% 11 20.6% 24.4% 21.7% -2.7% 12 19.3% 23.0% 20.2% -2.8% 15 20.4% 20.5% 23.7% 3.2% 16 20.7% 22.2% 22.5% 0.3% 17 22.2% 20.6% 21.7% 1.1% 18 21.9% 19.1% 19.5% 0.4% 19 18.5% 17.1% 17.2% 0.1% 20 20.1% 18.1% 20.1% 2.0% 21 17.9% 20.0% 20.2% 0.2% 22 18.4% 17.2% 19.0% 1.8% 23 19.1% 19.5% 16.9% -2.6%
National 19.7% 19.7% 19.7% 0.10% VISNs 6, 11, and 12 showed the largest reduction in the percent of current smokers (3%) between
2010 and 2011. In 2011, data revealed VISN 9 (25%), VISN 10 (24%), and VISN 15 (24%) had the highest
percentage of current smokers. VISN 3 had the lowest percentage of current smokers, with15 percent. VISN 15 showed the largest increase (3%) in enrollees who reported they were current smokers.
Office of the ADUSH for Policy and Planning
95 2011 Survey of Veteran Enrollees' Health and Reliance Upon VA

Map 6.1 provides a visual distribution of the enrollee current smoker population by VISN. Map 6.1
Office of the ADUSH for Policy and Planning
96 2011 Survey of Veteran Enrollees' Health and Reliance Upon VA

AAA ppp ppp eee nnn ddd iii xxx TTT aaa bbb lll eee sss
Ch ap t er 1 - D em o gr ap h i cs Table 1.1 Socioeconomic Characteristics of Enrollees
VISN VISN Total
Priority Age Income 1 - 3 4 - 6 7 - 8 <45 45-64 65+ <$36K $36K+ DK/Ref
1 332,099 112,516 103,078 116,505 38,264 115,123 178,711 165,315 128,454 38,329 33.9% 31.0% 35.1% 11.5% 34.7% 53.8% 49.8% 38.7% 11.5%
2 196,993 55,934 71,901 69,158 23,542 78,937 94,514 100,159 75,666 21,168 28.4% 36.5% 35.1% 12.0% 40.1% 48.0% 50.8% 38.4% 10.7%
3 309,324 79,450 84,321 145,553 29,535 112,894 166,896 129,568 137,316 42,440 25.7% 27.3% 47.1% 9.5% 36.5% 54.0% 41.9% 44.4% 13.7%
4 434,417 116,378 164,545 153,493 46,854 146,534 241,028 236,423 139,098 58,897 26.8% 37.9% 35.3% 10.8% 33.7% 55.5% 54.4% 32.0% 13.6%
5 201,544 90,872 61,747 48,925 31,860 90,912 78,772 77,944 97,406 26,194 45.1% 30.6% 24.3% 15.8% 45.1% 39.1% 38.7% 48.3% 13.0%
6 450,582 186,234 154,648 109,699 71,133 200,155 179,294 227,988 173,327 49,267 41.3% 34.3% 24.3% 15.8% 44.4% 39.8% 50.6% 38.5% 10.9%
7 503,816 226,821 170,628 106,367 78,218 248,033 177,565 253,159 182,594 68,063 45.0% 33.9% 21.1% 15.5% 49.2% 35.2% 50.2% 36.2% 13.5%
8 674,243 223,382 243,937 206,924 71,945 263,703 338,595 364,901 234,397 74,946 33.1% 36.2% 30.7% 10.7% 39.1% 50.2% 54.1% 34.8% 11.1%
9 362,231 127,896 152,460 81,876 41,182 162,216 158,799 212,209 112,309 37,713 35.3% 42.1% 22.6% 11.4% 44.8% 43.8% 58.6% 31.0% 10.4%
10 291,429 81,041 130,667 79,722 37,112 122,682 131,635 175,245 82,153 34,031 27.8% 44.8% 27.4% 12.7% 42.1% 45.2% 60.1% 28.2% 11.7%
11 359,197 123,347 144,730 91,121 41,453 163,054 154,690 204,299 115,622 39,276 34.3% 40.3% 25.4% 11.5% 45.4% 43.1% 56.9% 32.2% 10.9%
12 320,726 91,876 107,241 121,609 44,286 121,698 154,742 165,885 118,806 36,036 28.6% 33.4% 37.9% 13.8% 37.9% 48.2% 51.7% 37.0% 11.2%
15 320,121 112,811 119,337 87,972 42,571 135,184 142,366 174,884 109,318 35,918 35.2% 37.3% 27.5% 13.3% 42.2% 44.5% 54.6% 34.1% 11.2%
16 626,920 259,500 222,627 144,793 88,049 271,099 267,773 331,915 219,077 75,928 41.4% 35.5% 23.1% 14.0% 43.2% 42.7% 52.9% 34.9% 12.1%
17 387,732 186,334 125,587 75,811 79,073 162,055 146,604 184,751 158,790 44,191 48.1% 32.4% 19.6% 20.4% 41.8% 37.8% 47.6% 41.0% 11.4%
18 333,009 130,936 118,270 83,803 49,977 138,119 144,913 163,227 131,261 38,522 39.3% 35.5% 25.2% 15.0% 41.5% 43.5% 49.0% 39.4% 11.6%
19 254,027 108,448 83,478 62,101 47,540 99,889 106,598 126,849 103,488 23,690 42.7% 32.9% 24.4% 18.7% 39.3% 42.0% 49.9% 40.7% 9.3%
20 365,494 162,595 123,559 79,340 59,485 155,646 150,363 183,364 142,528 39,603 44.5% 33.8% 21.7% 16.3% 42.6% 41.1% 50.2% 39.0% 10.8%
21 339,602 127,023 121,743 90,835 42,911 146,357 150,334 164,075 137,549 37,977 37.4% 35.8% 26.7% 12.6% 43.1% 44.3% 48.3% 40.5% 11.2%
22 433,072 155,151 171,499 106,422 85,140 179,615 168,317 217,011 163,299 52,761 35.8% 39.6% 24.6% 19.7% 41.5% 38.9% 50.1% 37.7% 12.2%
23 398,531 156,724 117,655 124,153 48,512 138,091 211,927 192,107 164,067 42,357 39.3% 29.5% 31.2% 12.2% 34.7% 53.2% 48.2% 41.2% 10.6%
Nat’l 7,895,108 2,915,270 2,793,656 2,186,183 1,098,642 3,251,995 3,544,436 4,051,276 2,926,525 917,307 36.9% 35.4% 27.7% 13.9% 41.2% 44.9% 51.3% 37.1% 11.6%
Denominator is the enrollee population by VISN Total by Priority Groups is used for VISN total
Office of the ADUSH for Policy and Planning
A-1 2011 Survey of Veteran Enrollees' Health and Reliance Upon VA

Table 1.2 Enrollee Marital Status
VISN Married Widowed Divorced Separated Single DK/Ref
1 207,804 31,597 46,963 7,406 37,183 1,146 62.6% 9.5% 14.1% 2.2% 11.2% 0.4%
2 118,525 18,204 28,089 6,044 25,532 600 60.2% 9.2% 14.3% 3.1% 13.0% 0.3%
3 187,004 29,084 32,170 7,326 52,429 1,311 60.5% 9.4% 10.4% 2.4% 16.9% 0.4%
4 281,299 39,921 56,280 12,344 44,068 506 64.8% 9.2% 13.0% 2.8% 10.1% 0.1%
5 115,464 15,138 33,321 8,967 27,701 953 57.3% 7.5% 16.5% 4.4% 13.7% 0.5%
6 300,945 31,870 62,285 11,944 42,935 603 66.8% 7.1% 13.8% 2.7% 9.5% 0.1%
7 323,827 30,427 72,660 19,447 56,572 884 64.3% 6.0% 14.4% 3.9% 11.2% 0.2%
8 407,174 44,074 122,263 23,368 76,151 1,213 60.4% 6.5% 18.1% 3.5% 11.3% 0.2%
9 244,849 27,244 57,684 8,601 23,310 543 67.6% 7.5% 15.9% 2.4% 6.4% 0.2%
10 172,647 19,142 55,014 8,217 36,172 239 59.2% 6.6% 18.9% 2.8% 12.4% 0.1%
11 215,011 32,264 68,177 4,326 39,140 279 59.9% 9.0% 19.0% 1.2% 10.9% 0.1%
12 190,574 23,978 50,711 7,646 47,382 435 59.4% 7.5% 15.8% 2.4% 14.8% 0.1%
15 204,763 23,589 53,350 7,884 29,845 690 64.0% 7.4% 16.7% 2.5% 9.3% 0.2%
16 396,175 40,189 106,535 27,366 53,383 3,272 63.2% 6.4% 17.0% 4.4% 8.5% 0.5%
17 254,643 19,100 66,486 9,940 35,249 2,314 65.7% 4.9% 17.1% 2.6% 9.1% 0.6%
18 200,306 24,784 60,165 6,582 40,251 920 60.2% 7.4% 18.1% 2.0% 12.1% 0.3%
19 166,094 17,236 39,299 4,854 25,678 867 65.4% 6.8% 15.5% 1.9% 10.1% 0.3%
20 222,914 17,322 72,008 8,460 42,811 1,980 61.0% 4.7% 19.7% 2.3% 11.7% 0.5%
21 196,222 23,081 61,582 6,102 51,459 1,156 57.8% 6.8% 18.1% 1.8% 15.2% 0.3%
22 230,702 32,637 82,021 10,629 76,511 572 53.3% 7.5% 18.9% 2.5% 17.7% 0.1%
23 286,015 27,164 43,852 2,909 38,223 368 71.8% 6.8% 11.0% 0.7% 9.6% 0.1%
Nat’l 4,922,958 568,043 1,270,916 210,359 901,982 20,850 62.4% 7.2% 16.1% 2.7% 11.4% 0.3%
Denominator is the enrollee population by VISN
Office of the ADUSH for Policy and Planning
A-2 2011 Survey of Veteran Enrollees' Health and Reliance Upon VA

Table 1.3 Any Mentioned Active Duty Period of Service
VISN Before WWII* WWII Era
Between WWII &
Korea
Korean Era
Between Korea & Vietnam
Vietnam Era
Between Vietnam & Gulf War
Gulf War Era
Current Era
Combat Status
1 39,053 27,430 59,991 102,461 116,851 72,559 43,013 31,568 130,352
11.8% 8.3% 18.1% 30.9% 35.2% 21.8% 13.0% 9.5% 39.3%
2 23,126 11,150 27,339 48,400 72,811 45,468 22,709 20,502 76,763
11.7% 5.7% 13.9% 24.6% 37.0% 23.1% 11.5% 10.4% 39.0%
3 45,460 25,617 50,448 76,161 115,198 49,312 24,534 29,297 119,293
14.7% 8.3% 16.3% 24.6% 37.2% 15.9% 7.9% 9.5% 38.6%
4 61,156 33,553 77,723 123,585 151,542 84,215 46,852 36,704 167,343
14.1% 7.7% 17.9% 28.4% 34.9% 19.4% 10.8% 8.4% 38.5%
5 17,178 12,124 25,681 44,161 79,852 77,997 55,737 38,450 82,247
8.5% 6.0% 12.7% 21.9% 39.6% 38.7% 27.7% 19.1% 40.8%
6 33,632 24,257 54,611 102,126 185,398 149,494 94,112 70,072 202,795
7.5% 5.4% 12.1% 22.7% 41.1% 33.2% 20.9% 15.6% 45.0%
7 26,280 26,106 61,474 112,543 216,808 196,953 120,786 73,988 230,228
5.2% 5.2% 12.2% 22.3% 43.0% 39.1% 24.0% 14.7% 45.7%
8 59,969 45,988 116,670 197,084 267,256 181,663 94,628 61,896 242,380
8.9% 6.8% 17.3% 29.2% 39.6% 26.9% 14.0% 9.2% 36.0%
9 23,595 14,252 39,542 98,678 165,294 102,010 53,810 37,883 166,744
6.5% 3.9% 10.9% 27.2% 45.6% 28.2% 14.9% 10.5% 46.0%
10 29,784 14,985 40,610 70,281 120,903 76,911 33,596 25,069 116,370
10.2% 5.1% 13.9% 24.1% 41.5% 26.4% 11.5% 8.6% 39.9%
11 35,257 20,807 53,848 82,100 155,803 87,256 44,752 32,007 154,773
9.8% 5.8% 15.0% 22.9% 43.4% 24.3% 12.5% 8.9% 43.1%
12 34,023 19,089 47,368 80,573 121,938 63,925 39,923 32,843 130,710
10.6% 6.0% 14.8% 25.1% 38.0% 19.9% 12.4% 10.2% 40.8%
15 33,037 18,317 39,935 79,016 128,911 84,454 52,515 37,958 142,096
10.3% 5.7% 12.5% 24.7% 40.3% 26.4% 16.4% 11.9% 44.4%
16 47,208 43,448 75,236 163,704 270,670 194,888 130,563 89,893 273,404
7.5% 6.9% 12.0% 26.1% 43.2% 31.1% 20.8% 14.3% 43.6%
17 26,043 21,881 44,738 90,356 158,850 145,365 96,183 73,864 180,913
6.7% 5.6% 11.5% 23.3% 41.0% 37.5% 24.8% 19.1% 46.7%
18 29,604 20,993 42,383 81,700 137,010 90,041 60,065 46,849 152,803
8.9% 6.3% 12,7% 24.5% 41.1% 27.0% 18.0% 14.1% 45.9%
19 21,704 14,834 31,662 60,023 102,093 74,339 50,873 44,292 115,181
8.5% 5.8% 12.5% 23.6% 40.2% 29.3% 20.0% 17.4% 45.3%
20 27,072 20,865 37,539 95,395 157,553 110,727 72,166 53,691 163,404
7.4% 5.7% 10.3% 26.1% 43.1% 30.3% 19.7% 14.7% 44.7%
21 30,911 18,546 38,722 82,562 155,159 84,260 45,300 42,488 151,693
9.1% 5.5% 11.4% 24.3% 45.7% 24.8% 13.3% 12.5% 44.7%
22 34,529 23,993 53,523 97,721 183,894 127,637 86,723 74,321 198,861
8.0% 5.5% 12.4% 22.6% 42.5% 29.5% 20.0% 17.2% 45.9%
23 49,032 22,310 75,359 105,159 140,970 79,562 47,070 43,633 159,397
12.3% 5.6% 18.9% 26.4% 35.4% 20.0% 11.8% 10.9% 40.0%
Nat'l 70,798 727,654 480,544 1,094,402 1,993,790 3,204,765 2,175,625 1,315,912 997,270 3,357,747 0.92% 9.2% 6.1% 13.9% 25.3% 40.6% 27.6% 16.7% 12.6% 42.5%
Pre-WWII VISN breakouts are not provided due to inconsistencies related to sample size Denominator is the enrollee population by VISN Percentages do not total 100 percent because enrollees may have responded with multiple periods of service ~Before World War II (WWII): <1942 ~Korean Era: 1951-1954 ~Between Vietnam and Gulf War: 1975-1990 ~WWII Era: 1942-1946 ~Between Korea and Vietnam: 1955-1964 ~Gulf War Era: 1991-2001 ~Between WWII and Korea: 1947-1950 ~Vietnam Era: 1965-1974 ~Current Era >2001
Office of the ADUSH for Policy and Planning
A-3 2011 Survey of Veteran Enrollees' Health and Reliance Upon VA

Table 1.4 Enrollee Employment Status
VISN Employed Full Time
Self-Employed Full Time
Employed Part Time
Self-Employed Part Time
Unemployed Not in the
Labor Force
DK/Ref Unemployment Rate
1 57,317 8,098 20,246 6,983 26,552 210,589 2,314 22.3% 17.3% 2.4% 6.1% 2.1% 8.0% 63.4% 0.7%
2 35,352 6,206 9,820 4,488 16,505 123,260 1,362 22.8% 17.9% 3.2% 5.0% 2.3% 8.4% 62.6% 0.7%
3 50,319 12,340 12,785 6,917 18,148 206,374 2,441 18.1% 16.3% 4.0% 4.1% 2.2% 5.9% 66.7% 0.8%
4 69,630 11,121 16,860 7,778 29,013 295,062 4,953 21.6% 16.0% 2.6% 3.9% 1.8% 6.7% 67.9% 1.1%
5 63,404 5,797 9,430 3,357 11,530 105,902 2,125 12.3% 31.5% 2.9% 4.7% 1.7% 5.7% 52.6% 1.1%
6 104,766 16,863 27,943 17,699 43,359 236,964 2,986 20.6% 23.3% 3.7% 6.2% 3.9% 9.6% 52.6% 0.7%
7 123,692 13,643 22,292 17,952 52,918 268,094 5,225 23.0% 24.6% 2.7% 4.4% 3.6% 10.5% 53.2% 1.0%
8 106,517 15,067 30,106 22,211 72,872 423,859 3,611 29.5% 15.8% 2.2% 4.5% 3.3% 10.8% 62.9% 0.5%
9 67,703 10,097 13,210 9,639 33,683 225,496 2,403 25.1% 18.7% 2.8% 3.7% 2.7% 9.3% 62.3% 0.7%
10 45,699 8,743 13,931 7,400 27,740 186,814 1,103 26.8% 15.7% 3.0% 4.8% 2.5% 9.5% 64.1% 0.4%
11 53,857 9,583 18,877 7,772 35,397 229,633 4,079 28.2% 15.0% 2.7% 5.3% 2.2% 9.9% 63.9% 1.1%
12 52,822 9,663 13,308 9,095 23,504 210,705 1,630 21.7% 16.5% 3.0% 4.2% 2.8% 7.3% 65.7% 0.5%
15 68,354 14,914 11,734 7,134 21,125 193,626 3,233 17.1% 21.4% 4.7% 3.7% 2.2% 6.6% 60.5% 1.0%
16 133,133 17,808 25,920 19,058 58,415 362,806 9,780 23.0% 21.2% 2.8% 4.1% 3.0% 9.3% 57.9% 1.6%
17 95,357 13,284 19,750 11,745 42,045 199,966 5,585 23.1% 24.6% 3.4% 5.1% 3.0% 10.8% 51.6% 1.4%
18 66,473 12,201 17,143 7,688 28,688 197,877 2,939 21.7% 20.0% 3.7% 5.2% 2.3% 8.6% 59.4% 0.9%
19 63,105 9,391 14,663 10,536 17,842 136,794 1,694 15.4% 24.8% 3.7% 5.8% 4.2% 7.0% 53.9% 0.7%
20 77,890 11,359 21,015 9,089 32,598 210,893 2,651 21.5% 21.3% 3.1% 5.8% 2.5% 8.9% 57.7% 0.7%
21 61,644 10,816 22,135 12,262 38,837 192,279 1,628 26.7% 18.2% 3.2% 6.5% 3.6% 11.4% 56.6% 0.5%
22 101,362 13,651 17,847 17,107 48,950 230,106 4,049 24.6% 23.4% 3.2% 4.1% 4.0% 11.3% 53.1% 0.9%
23 74,655 16,062 26,311 14,093 15,298 247,299 4,812 10.4% 18.7% 4.0% 6.6% 3.5% 3.8% 62.1% 1.2%
Nat’l 1,573,051 246,708 385,328 230,001 695,021 4,694,397 70,602 22.2% 19.9% 3.1% 4.9% 2.9% 8.8% 59.5% 0.9% Denominator is the enrollee population by VISN Unemployment rate=100*(unemployed/(employed + unemployed))
Office of the ADUSH for Policy and Planning
A-4 2011 Survey of Veteran Enrollees' Health and Reliance Upon VA

Ch ap t er 2 – H ea l th S ta tus , K ey D r i ver s o f Enr o l l e e s ’ H ea l th Ca r e D ec i s i on M akin g , a nd P lann ed Fu ture U se o f VHA H ea l th C ar e Ser v i ces
Table 2.1 Positive Responses to Quality and Cost Statements
VISN
Quality Cost Veterans like me are satisfied
with the health care they receive
VA health care providers treat their patients with
respect
VA is the most cost effective health care
provider for Veterans like me
VA offers Veterans like me the best value for our
health care dollar
1 256,252 293,158 252,299 247,096 77.2% 88.3% 76.0% 74.4%
2 149,776 166,614 147,216 144,734 76.0% 84.6% 74.7% 73.5%
3 212,943 250,444 207,949 212,924 68.8% 81.0% 67.2% 68.8%
4 331,082 371,827 321,240 321,975 76.2% 85.6% 73.9% 74.1%
5 135,792 158,744 135,338 135,280 67.4% 78.8% 67.2% 67.1%
6 312,988 367,081 337,000 334,860 69.5% 81.5% 74.8% 74.3%
7 346,224 406,733 369,366 370,729 68.7% 80.7% 73.3% 73.6%
8 510,168 592,315 519,729 508,964 75.7% 87.8% 77.1% 75.5%
9 274,621 315,963 275,870 280,412 75.8% 87.2% 76.2% 77.4%
10 217,184 244,989 224,199 226,570 74.5% 84.1% 76.9% 77.7%
11 272,577 313,150 277,035 275,926 75.9% 87.2% 77.1% 76.8%
12 246,599 272,284 257,642 256,728 76.9% 84.9% 80.3% 80.0%
15 225,049 261,516 239,857 242,291 70.3% 81.7% 74.9% 75.7%
16 449,833 506,424 464,051 472,207 71.8% 80.8% 74.0% 75.3%
17 258,711 318,585 273,677 281,712 66.7% 82.2% 70.6% 72.7%
18 257,774 281,142 258,901 258,501 77.4% 84.4% 77.7% 77.6%
19 185,283 215,213 184,935 188,823 72.9% 84.7% 72.8% 74.3%
20 252,063 301,032 255,991 262,131 69.0% 82.4% 70.0% 71.7%
21 246,032 275,150 253,401 256,247 72.4% 81.0% 74.6% 75.5%
22 306,777 358,701 318,552 330,677 70.8% 82.8% 73.6% 76.4%
23 319,929 356,329 308,137 314,771 80.3% 89.4% 77.3% 79.0%
Nat'l 5,767,657 6,627,393 5,882,386 5,923,558 73.1% 83.9% 74.5% 75.0%
Denominator is the enrollee population by VISN
Office of the ADUSH for Policy and Planning
A-5 2011 Survey of Veteran Enrollees' Health and Reliance Upon VA

Table 2.2 Positive Responses to Accessibility Statements
VISN It's easy to get to my local VA facility
There is a VA provider in my area that offers all of the health care
services that Veterans like me need
It is easy for Veterans like me to get around in the VA health care facility
1 248,620 224,121 265,223 74.9% 67.5% 79.9%
2 163,513 148,659 163,222 83.0% 75.5% 82.9%
3 224,098 214,701 227,589 72.4% 69.4% 73.6%
4 336,514 308,863 342,465 77.5% 71.1% 78.8%
5 139,695 135,533 152,812 69.3% 67.2% 75.8%
6 350,344 296,383 359,531 77.8% 65.8% 79.8%
7 366,838 312,903 392,823 72.8% 62.1% 78.0%
8 541,830 470,178 555,427 80.4% 69.7% 82.4%
9 283,638 249,689 298,778 78.3% 68.9% 82.5%
10 239,960 220,832 241,266 82.3% 75.8% 82.8%
11 272,891 237,779 291,249 76.0% 66.2% 81.1%
12 249,164 215,089 261,627 77.7% 67.1% 81.6%
15 247,778 212,156 254,827 77.4% 66.3% 79.6%
16 475,341 385,813 488,374 75.8% 61.5% 77.9%
17 288,416 251,083 304,326 74.4% 64.8% 78.5%
18 256,571 224,938 278,854 77.0% 67.6% 83.7%
19 191,361 160,010 196,254 75.3% 63.0% 77.3%
20 266,461 223,388 280,233 72.9% 61.1% 76.7%
21 264,660 235,341 268,741 77.9% 69.3% 79.1%
22 330,726 293,698 329,739 76.4% 67.8% 76.1%
23 313,543 285,761 334,963 78.7% 71.7% 84.0%
Nat'l 6,051,962 5,306,920 6,288,323 76.7% 67.2% 79.6%
Denominator is the enrollee population by VISN
Office of the ADUSH for Policy and Planning
A-6 2011 Survey of Veteran Enrollees' Health and Reliance Upon VA

Table 2.3 Positive Responses to Wait Times and Camaraderie Statements
VISN Wait Times Camaraderie
Veterans like me can get in and out of appointments at VA in a
reasonable time
When Veterans like me go to VA for an appointment, they do not wait a
long time to see the doctor
Veterans like me like going to VA because you can talk to other
Veterans
1 257,513 230,308 203,606 77.5% 69.3% 61.3%
2 147,020 139,732 121,352 74.6% 70.9% 61.6%
3 211,788 187,333 183,258 68.5% 60.6% 59.2%
4 317,188 295,945 269,184 73.0% 68.1% 62.0%
5 127,426 117,573 112,468 63.2% 58.3% 55.8%
6 301,068 272,141 281,241 66.8% 60.4% 62.4%
7 326,992 309,411 300,509 64.9% 61.4% 59.6%
8 507,925 468,551 396,261 75.3% 69.5% 58.8%
9 266,213 250,512 235,279 73.5% 69.2% 65.0%
10 217,128 207,494 181,634 74.5% 71.2% 62.3%
11 259,696 239,956 230,947 72.3% 66.8% 64.3%
12 240,733 227,488 204,720 75.1% 70.9% 63.8%
15 228,132 214,619 190,823 71.3% 67.0% 59.6%
16 425,980 375,563 376,951 67.9% 59.9% 60.1%
17 238,050 214,178 231,989 61.4% 55.2% 59.8%
18 233,869 211,792 202,968 70.2% 63.6% 60.9%
19 169,651 156,791 141,587 66.8% 61.7% 55.7%
20 246,656 230,887 191,466 67.5% 63.2% 52.4%
21 240,812 218,161 194,550 70.9% 64.2% 57.3%
22 282,974 252,582 255,355 65.3% 58.3% 59.0%
23 302,442 286,233 251,619 75.9% 71.8% 63.1%
Nat'l 5,549,257 5,107,248 4,757,766 70.3% 64.7% 60.3%
Denominator is the enrollee population by VISN
Office of the ADUSH for Policy and Planning
A-7 2011 Survey of Veteran Enrollees' Health and Reliance Upon VA

Table 2.4 Positive Responses to Knowledge of VA Health Benefits and Non-VA Health Care Alternative Statements
VISN Knowledge of VA Health Benefits Knowledge of Non-VA Health Care Alternatives
I understand how my VA benefits work
I feel I know what is available to me through
my VA benefits
I have a doctor outside VA who I really like and
trust
My family has a health insurance plan that covers me
and the rest of the family
1 246,002 242,943 212,099 146,500 74.1% 73.2% 63.9% 44.1%
2 139,042 139,014 120,571 87,431 70.6% 70.6% 61.2% 44.4%
3 199,807 202,324 206,147 148,776 64.6% 65.4% 66.6% 48.1%
4 290,499 292,035 271,852 184,046 66.9% 67.2% 62.6% 42.4%
5 135,669 134,642 115,221 93,831 67.3% 66.8% 57.2% 46.6%
6 309,808 306,769 248,434 172,641 68.8% 68.1% 55.1% 38.3%
7 346,798 325,802 281,267 191,613 68.8% 64.7% 55.8% 38.0%
8 492,832 481,084 384,264 245,279 73.1% 71.4% 57.0% 36.4%
9 264,474 257,176 191,767 136,560 73.0% 71.0% 52.9% 37.7%
10 202,728 205,672 173,196 123,522 69.6% 70.6% 59.4% 42.4%
11 252,139 243,272 220,126 153,611 70.2% 67.7% 61.3% 42.8%
12 223,509 222,088 177,290 124,682 69.7% 69.2% 55.3% 38.9%
15 224,420 219,981 188,932 127,931 70.1% 68.7% 59.0% 40.0%
16 428,438 433,556 341,959 215,585 68.3% 69.2% 54.5% 34.4%
17 269,093 267,304 208,396 152,729 69.4% 68.9% 53.7% 39.4%
18 239,352 234,050 160,836 124,638 71.9% 70.3% 48.3% 37.4%
19 175,415 174,923 136,871 110,321 69.1% 68.9% 53.9% 43.4%
20 241,348 240,896 184,893 136,680 66.0% 65.9% 50.6% 37.4%
21 228,915 229,417 179,223 129,332 67.4% 67.6% 52.8% 38.1%
22 291,855 289,031 220,227 161,528 67.4% 66.7% 50.9% 37.3%
23 297,191 300,030 239,462 191,226 74.6% 75.3% 60.1% 48.0%
Nat'l 5,499,335 5,442,009 4,463,033 3,158,463 69.7% 68.9% 56.5% 40.0%
Denominator is the enrollee population by VISN
Office of the ADUSH for Policy and Planning
A-8 2011 Survey of Veteran Enrollees' Health and Reliance Upon VA
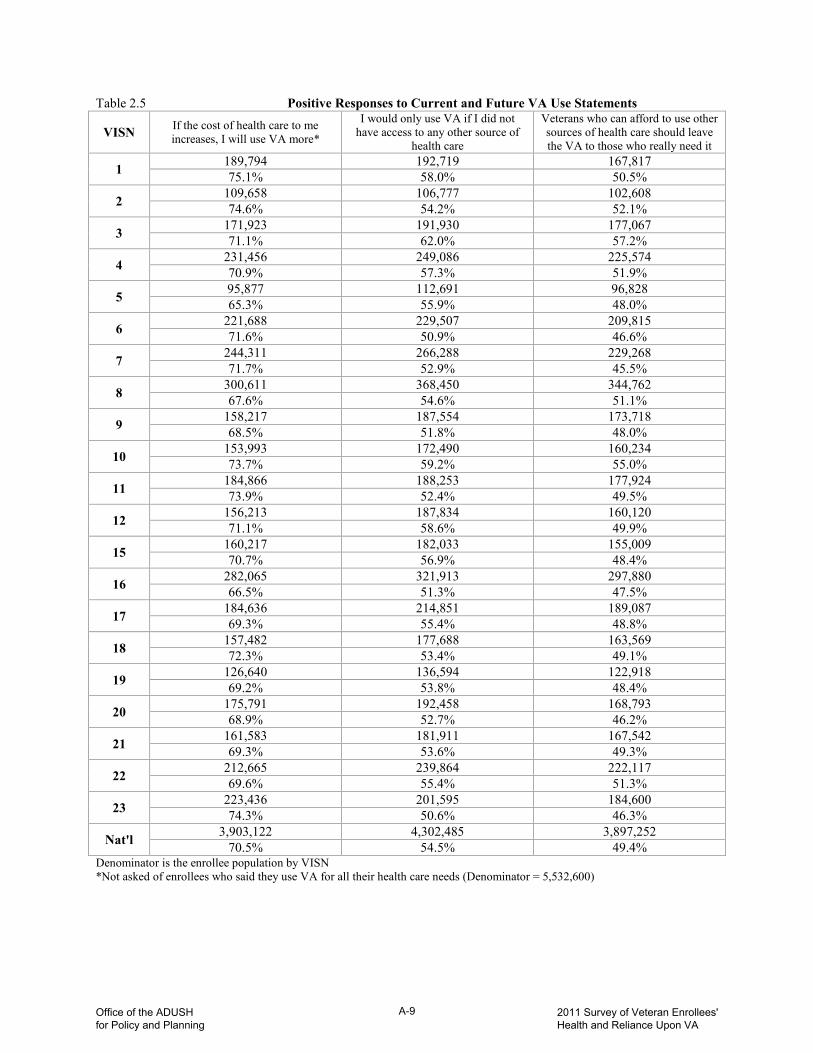
Table 2.5 Positive Responses to Current and Future VA Use Statements
VISN If the cost of health care to me increases, I will use VA more*
I would only use VA if I did not have access to any other source of
health care
Veterans who can afford to use other sources of health care should leave the VA to those who really need it
1 189,794 192,719 167,817 75.1% 58.0% 50.5%
2 109,658 106,777 102,608 74.6% 54.2% 52.1%
3 171,923 191,930 177,067 71.1% 62.0% 57.2%
4 231,456 249,086 225,574 70.9% 57.3% 51.9%
5 95,877 112,691 96,828 65.3% 55.9% 48.0%
6 221,688 229,507 209,815 71.6% 50.9% 46.6%
7 244,311 266,288 229,268 71.7% 52.9% 45.5%
8 300,611 368,450 344,762 67.6% 54.6% 51.1%
9 158,217 187,554 173,718 68.5% 51.8% 48.0%
10 153,993 172,490 160,234 73.7% 59.2% 55.0%
11 184,866 188,253 177,924 73.9% 52.4% 49.5%
12 156,213 187,834 160,120 71.1% 58.6% 49.9%
15 160,217 182,033 155,009 70.7% 56.9% 48.4%
16 282,065 321,913 297,880 66.5% 51.3% 47.5%
17 184,636 214,851 189,087 69.3% 55.4% 48.8%
18 157,482 177,688 163,569 72.3% 53.4% 49.1%
19 126,640 136,594 122,918 69.2% 53.8% 48.4%
20 175,791 192,458 168,793 68.9% 52.7% 46.2%
21 161,583 181,911 167,542 69.3% 53.6% 49.3%
22 212,665 239,864 222,117 69.6% 55.4% 51.3%
23 223,436 201,595 184,600 74.3% 50.6% 46.3%
Nat'l 3,903,122 4,302,485 3,897,252 70.5% 54.5% 49.4%
Denominator is the enrollee population by VISN *Not asked of enrollees who said they use VA for all their health care needs (Denominator = 5,532,600)
Office of the ADUSH for Policy and Planning
A-9 2011 Survey of Veteran Enrollees' Health and Reliance Upon VA

Table 2.6 Reasons for Planned Future Use Reported by Enrollees
VISN Primary Backup Safety Net Prescriptions Specialized Care Other No Plans To
Use VA DK/Ref
1 135,071 42,973 50,076 36,904 14,579 4,246 39,616 8,634 40.7% 12.9% 15.1% 11.1% 4.4% 1.3% 11.9% 2.6%
2 82,525 26,682 28,940 18,842 5,129 2,063 27,414 5,398 41.9% 13.5% 14.7% 9.6% 2.6% 1.0% 13.9% 2.7%
3 106,936 43,987 48,577 30,719 9,621 3,199 55,564 10,720 34.6% 14.2% 15.7% 9.9% 3.1% 1.0% 18.0% 3.5%
4 179,405 59,377 52,968 48,787 11,896 4,484 64,616 12,883 41.3% 13.7% 12.2% 11.2% 2.7% 1.0% 14.9% 3.0%
5 83,463 27,697 25,964 12,359 10,027 2,645 31,553 7,836 41.4% 13.7% 12.9% 6.1% 5.0% 1.3% 15.7% 3.9%
6 229,061 57,756 48,444 31,570 19,012 5,307 47,763 11,670 50.8% 12.8% 10.8% 7.0% 4.2% 1.2% 10.6% 2.6%
7 253,072 73,149 54,552 33,740 19,364 3,395 50,196 16,347 50.2% 14.5% 10.8% 6.7% 3.8% 0.7% 10.0% 3.2%
8 348,715 85,078 69,437 59,453 21,298 7,532 67,676 15,054 51.7% 12.6% 10.3% 8.8% 3.2% 1.1% 10.0% 2.2%
9 194,767 45,111 35,540 27,119 11,564 2,561 37,337 8,232 53.8% 12.5% 9.8% 7.5% 3.2% 0.7% 10.3% 2.3%
10 130,914 38,528 38,368 32,207 7,336 3,816 27,787 12,473 44.9% 13.2% 13.2% 11.1% 2.5% 1.3% 9.5% 4.3%
11 168,968 51,036 41,439 36,185 14,452 3,719 35,487 7,912 47.0% 14.2% 11.5% 10.1% 4.0% 1.0% 9.9% 2.2%
12 149,761 41,686 36,002 40,817 9,537 3,938 33,393 5,592 46.7% 13.0% 11.2% 12.7% 3.0% 1.2% 10.4% 1.7%
15 149,872 39,439 33,859 35,767 12,500 2,708 34,451 11,524 46.8% 12.3% 10.6% 11.2% 3.9% 0.8% 10.8% 3.6%
16 326,059 66,683 60,329 43,691 28,734 4,247 75,276 21,902 52.0% 10.6% 9.6% 7.0% 4.6% 0.7% 12.0% 3.5%
17 189,505 43,143 43,426 22,563 19,303 6,135 50,514 13,144 48.9% 11.1% 11.2% 5.8% 5.0% 1.6% 13.0% 3.4%
18 180,223 39,660 42,481 17,959 12,813 2,336 27,981 9,557 54.1% 11.9% 12.8% 5.4% 3.8% 0.7% 8.4% 2.9%
19 120,678 33,694 31,014 17,242 9,923 3,013 32,598 5,864 47.5% 13.3% 12.2% 6.8% 3.9% 1.2% 12.8% 2.3%
20 171,870 53,297 36,677 27,810 14,403 7,131 42,372 11,935 47.0% 14.6% 10.0% 7.6% 3.9% 2.0% 11.6% 3.3%
21 172,394 49,172 35,791 19,073 10,533 3,119 37,358 12,161 50.8% 14.5% 10.5% 5.6% 3.1% 0.9% 11.0% 3.6%
22 197,218 60,479 67,704 20,298 20,628 5,950 43,758 17,037 45.5% 14.0% 15.6% 4.7% 4.8% 1.4% 10.1% 3.9%
23 178,713 52,835 48,286 42,439 12,242 3,281 46,435 14,300 44.8% 13.3% 12.1% 10.6% 3.1% 0.8% 11.7% 3.6%
Nat’l 3,749,190 1,031,459 929,874 655,546 294,893 84,825 909,144 240,176
47.5% 13.1% 11.8% 8.3% 3.7% 1.1% 11.5% 3.0% Denominator is the Enrollees by VISN
Office of the ADUSH for Policy and Planning
A-10 2011 Survey of Veteran Enrollees' Health and Reliance Upon VA

Ch ap t er 3 – Pu b l i c & Pr i va t e H ea l th I nsu ran ce Co ver age
Table 3.1 Health Insurance Coverage Reported by Enrollees VISN Medicare Medicaid TRICARE Private Insurance No Coverage
1 195,804 32,716 37,595 111,771 56,446 59.0% 9.9% 11.3% 33.7% 17.0%
2 104,193 19,452 23,499 76,135 35,748 52.9% 9.9% 11.9% 38.6% 18.1%
3 182,382 26,411 21,155 130,981 47,109 59.0% 8.5% 6.8% 42.3% 15.2%
4 271,051 41,698 41,893 151,335 73,021 62.4% 9.6% 9.6% 34.8% 16.8%
5 86,307 14,590 56,916 63,008 42,208 42.8% 7.2% 28.2% 31.3% 20.9%
6 210,680 24,483 92,723 122,496 114,395 46.8% 5.4% 20.6% 27.2% 25.4%
7 221,641 33,213 128,925 138,713 128,220 44.0% 6.6% 25.6% 27.5% 25.4%
8 388,586 58,277 100,941 160,070 164,186 57.6% 8.6% 15.0% 23.7% 24.4%
9 187,261 19,791 56,011 93,257 90,386 51.7% 5.5% 15.5% 25.7% 25.0%
10 152,238 19,311 28,735 94,692 64,295 52.2% 6.6% 9.9% 32.5% 22.1%
11 182,049 31,065 38,444 116,785 87,736 50.7% 8.6% 10.7% 32.5% 24.4%
12 167,838 27,936 25,978 97,041 77,077 52.3% 8.7% 8.1% 30.3% 24.0%
15 162,754 21,906 45,277 87,136 68,286 50.8% 6.8% 14.1% 27.2% 21.3%
16 311,118 45,330 135,882 142,499 150,153 49.6% 7.2% 21.7% 22.7% 24.0%
17 174,763 26,806 103,527 95,563 94,711 45.1% 6.9% 26.7% 24.6% 24.4%
18 163,689 21,613 60,566 94,427 79,428 49.2% 6.5% 18.2% 28.4% 23.9%
19 117,370 17,091 52,091 71,248 61,559 46.2% 6.7% 20.5% 28.0% 24.2%
20 170,699 24,025 69,077 101,891 92,982 46.7% 6.6% 18.9% 27.9% 25.4%
21 163,249 16,831 52,655 107,095 89,611 48.1% 5.0% 15.5% 31.5% 26.4%
22 182,451 23,160 71,902 115,165 131,410 42.1% 5.3% 16.6% 26.6% 30.3%
23 227,914 37,809 47,731 131,522 62,992 57.2% 9.5% 12.0% 33.0% 15.8%
Nat’l 4,024,036 583,514 1,291,524 2,302,827 1,811,958
51.0% 7.4% 16.4% 29.2% 23.0% Percentages do not total 100 percent because enrollees may have responded with multiple coverage Denominator is enrollees by VISN
Office of the ADUSH for Policy and Planning
A-11 2011 Survey of Veteran Enrollees' Health and Reliance Upon VA

Table 3.2 Health Insurance Coverage Reported by Enrollees by Priority
VISN Medicare Medicaid TRICARE
P1-3 P4-6 P7-8 P1-3 P4-6 P7-8 P1-3 P4-6 P7-8
1 51,606 56,377 87,822 6,778 16,010 9,928 24,175 6,396 7,024 45.9% 54.7% 75.4% 6.0% 15.5% 8.5% 21.5% 6.2% 6.0%
2 22,028 36,526 45,640 4,419 7,489 7,544 11,725 5,454 6,320 39.4% 50.8% 66.0% 7.9% 10.4% 10.9% 21.0% 7.6% 9.1%
3 39,541 40,577 102,264 7,316 8,204 10,892 10,064 6,093 4,998 49.8% 48.1% 70.3% 9.2% 9.7% 7.5% 12.7% 7.2% 3.4%
4 53,554 100,836 116,661 7,053 18,484 16,161 24,056 10,962 6,875 46.0% 61.3% 76.0% 6.1% 11.2% 10.5% 20.7% 6.7% 4.5%
5 30,147 28,265 27,894 3,435 6,264 4,891 43,783 5,647 7,486 33.2% 45.8% 57.0% 3.8% 10.1% 10.0% 48.2% 9.1% 15.3%
6 68,114 68,156 74,410 8,236 10,220 6,027 70,411 11,933 10,379 36.6% 44.1% 67.8% 4.4% 6.6% 5.5% 37.8% 7.7% 9.5%
7 90,780 68,800 62,060 15,257 10,940 7,016 96,046 17,294 15,585 40.0% 40.3% 58.3% 6.7% 6.4% 6.6% 42.3% 10.1% 14.7%
8 108,304 135,078 145,203 14,209 30,238 13,830 72,506 14,068 14,367 48.5% 55.4% 70.2% 6.4% 12.4% 6.7% 32.5% 5.8% 6.9%
9 55,353 74,933 56,975 7,188 8,306 4,296 38,000 10,721 7,290 43.3% 49.1% 69.6% 5.6% 5.4% 5.2% 29.7% 7.0% 8.9%
10 32,940 64,370 54,928 4,480 7,704 7,127 14,605 8,865 5,266 40.6% 49.3% 68.9% 5.5% 5.9% 8.9% 18.0% 6.8% 6.6%
11 52,765 64,750 64,534 6,143 18,130 6,793 20,624 9,557 8,263 42.8% 44.7% 70.8% 5.0% 12.5% 7.5% 16.7% 6.6% 9.1%
12 35,754 42,982 89,102 5,376 11,125 11,435 14,096 7,724 4,157 38.9% 40.1% 73.3% 5.9% 10.4% 9.4% 15.3% 7.2% 3.4%
15 44,339 56,282 62,133 6,044 10,383 5,480 32,747 7,132 5,398 39.3% 47.2% 70.6% 5.4% 8.7% 6.2% 29.0% 6.0% 6.1%
16 110,227 112,428 88,463 15,260 21,933 8,138 98,189 18,880 18,812 42.5% 50.5% 61.1% 5.9% 9.9% 5.6% 37.8% 8.5% 13.0%
17 72,705 58,211 43,847 10,680 10,659 5,467 82,708 11,252 9,568 39.0% 46.4% 57.8% 5.7% 8.5% 7.2% 44.4% 9.0% 12.6%
18 53,271 59,072 51,347 6,099 9,790 5,723 45,113 9,493 5,960 40.7% 49.9% 61.3% 4.7% 8.3% 6.8% 34.5% 8.0% 7.1%
19 39,944 36,342 41,083 5,443 7,844 3,805 38,175 6,633 7,283 36.8% 43.5% 66.2% 5.0% 9.4% 6.1% 35.2% 7.9% 11.7%
20 59,234 59,590 51,875 6,520 10,773 6,732 55,310 6,784 6,983 36.4% 48.2% 65.4% 4.0% 8.7% 8.5% 34.0% 5.5% 8.8%
21 51,452 51,193 60,605 7,356 6,425 3,050 31,791 10,583 10,282 40.5% 42.1% 66.7% 5.8% 5.3% 3.4% 25.0% 8.7% 11.3%
22 51,139 74,660 56,651 6,696 9,231 7,233 49,350 9,056 13,496 33.0% 43.5% 53.2% 4.3% 5.4% 6.8% 31.8% 5.3% 12.7%
23 74,167 56,290 97,457 8,687 14,337 14,785 30,189 10,031 7,512 47.3% 47.8% 78.5% 5.5% 12.2% 11.9% 19.3% 8.5% 6.1%
Nat’l 1,197,365 1,345,718 1,480,953 162,673 254,489 166,352 903,662 204,558 183,303
41.1% 48.2% 67.7% 5.6% 9.1% 7.6% 31.0% 7.3% 8.4% Continues on next page
Percentages do not total 100 percent because enrollees may have responded with multiple coverage Denominator is enrollees by Priority and VISN
Office of the ADUSH for Policy and Planning
A-12 2011 Survey of Veteran Enrollees' Health and Reliance Upon VA

Table 3.2 (cont.) Health Insurance Coverage Reported by Enrollees by Priority
VISN Private Insurance No Coverage P1-3 P4-6 P7-8 P1-3 P4-6 P7-8
1 44,354 24,370 43,047 21,897 26,898 7,651 39.4% 23.6% 36.9% 19.5% 26.1% 6.6%
2 22,392 21,632 32,111 11,418 17,571 6,759 40.0% 30.1% 46.4% 20.4% 24.4% 9.8%
3 37,254 20,617 73,111 11,873 25,606 9,630 46.9% 24.5% 50.2% 14.9% 30.4% 6.6%
4 44,391 45,472 61,472 22,737 36,713 13,572 38.1% 27.6% 40.0% 19.5% 22.3% 8.8%
5 29,551 14,370 19,086 14,377 20,977 6,853 32.5% 23.3% 39.0% 15.8% 34.0% 14.0%
6 54,616 35,323 32,556 44,014 55,496 14,885 29.3% 22.8% 29.7% 23.6% 35.9% 13.6%
7 66,833 31,707 40,173 40,407 68,710 19,103 29.5% 18.6% 37.8% 17.8% 40.3% 18.0%
8 51,389 46,730 61,951 52,378 81,183 30,624 23.0% 19.2% 29.9% 23.4% 33.3% 14.8%
9 39,585 27,759 25,912 26,325 53,952 10,109 31.0% 18.2% 31.6% 20.6% 35.4% 12.3%
10 30,533 34,050 30,109 18,082 38,662 7,551 37.7% 26.1% 37.8% 22.3% 29.6% 9.5%
11 52,888 33,656 30,240 25,741 49,929 12,065 42.9% 23.3% 33.2% 20.9% 34.5% 13.2%
12 34,297 24,965 37,779 23,329 38,494 15,254 37.3% 23.3% 31.1% 25.4% 35.9% 12.5%
15 32,773 29,042 25,320 22,691 35,420 10,176 29.1% 24.3% 28.8% 20.1% 29.7% 11.6%
16 63,102 37,845 41,552 55,977 70,119 24,056 24.3% 17.0% 28.7% 21.6% 31.5% 16.6%
17 47,398 23,448 24,717 40,683 41,256 12,772 25.4% 18.7% 32.6% 21.8% 32.9% 16.8%
18 35,751 29,281 29,396 31,075 33,022 15,331 27.3% 24.8% 35.1% 23.7% 27.9% 18.3%
19 32,526 19,298 19,423 23,735 28,285 9,538 30.0% 23.1% 31.3% 21.9% 33.9% 15.4%
20 51,196 26,187 24,509 37,244 43,263 12,476 31.5% 21.2% 30.9% 22.9% 35.0% 15.7%
21 46,457 28,115 32,523 29,186 46,324 14,100 36.6% 23.1% 35.8% 23.0% 38.1% 15.5%
22 47,012 31,773 36,381 42,632 67,583 21,195 30.3% 18.5% 34.2% 27.5% 39.4% 19.9%
23 59,248 35,947 36,327 25,545 28,153 9,295 37.8% 30.6% 29.3% 16.3% 23.9% 7.5%
Nat’l 923,546 621,585 757,696 621,347 907,617 282,994 31.7% 22.2% 34.7% 21.3% 32.5% 12.9%
Percentages do not total 100 percent because enrollees may have responded with multiple coverage Denominator is enrollees by Priority and VISN
Office of the ADUSH for Policy and Planning
A-13 2011 Survey of Veteran Enrollees' Health and Reliance Upon VA

Table 3.3 Health Insurance Coverage Reported by Enrollees by Age
VISN Medicare Medicaid TRICARE
< 45 45-64 65+ < 45 45-64 65+ < 45 45-64 65+
1 2,350 27,048 166,406 475 8,648 23,593 7,429 14,081 16,086 6.1% 23.5% 93.1% 1.2% 7.5% 13.2% 19.4% 12.2% 9.0%
2 1,573 17,536 85,084 596 5,321 13,534 4,450 10,346 8,703 6.7% 22.2% 90.0% 2.5% 6.7% 14.3% 18.9% 13.1% 9.2%
3 1,572 24,637 156,172 766 6,463 19,182 4,785 9,234 7,136 5.3% 21.8% 93.6% 2.6% 5.7% 11.5% 16.2% 8.2% 4.3%
4 2,811 37,129 231,111 1,481 9,211 31,007 6,528 15,738 19,628 6.0% 25.3% 95.9% 3.2% 6.3% 12.9% 13.9% 10.7% 8.1%
5 3,062 12,693 70,551 535 4,603 9,451 7,669 30,975 18,272 9.6% 14.0% 89.6% 1.7% 5.1% 12.0% 24.1% 34.1% 23.2%
6 2,779 40,449 167,452 1,078 6,924 16,481 16,524 45,110 31,089 3.9% 20.2% 93.4% 1.5% 3.5% 9.2% 23.2% 22.5% 17.3%
7 3,156 53,972 164,512 2,050 12,202 18,960 17,286 66,484 45,155 4.0% 21.8% 92.6% 2.6% 4.9% 10.7% 22.1% 26.8% 25.4%
8 5,994 66,440 316,152 3,126 15,942 39,210 10,313 44,110 46,518 8.3% 25.2% 93.4% 4.3% 6.0% 11.6% 14.3% 16.7% 13.7%
9 1,555 40,705 145,001 1,229 3,905 14,657 10,133 24,971 20,908 3.8% 25.1% 91.3% 3.0% 2.4% 9.2% 24.6% 15.4% 13.2%
10 1,280 26,204 124,754 667 3,391 15,254 4,310 13,624 10,802 3.4% 21.4% 94.8% 1.8% 2.8% 11.6% 11.6% 11.1% 8.2%
11 3,115 34,796 144,138 938 8,320 21,807 8,554 16,722 13,168 7.5% 21.3% 93.2% 2.3% 5.1% 14.1% 20.6% 10.3% 8.5%
12 1,448 20,691 145,699 438 6,100 21,398 3,808 12,759 9,411 3.3% 17.0% 94.2% 1.0% 5.0% 13.8% 8.6% 10.5% 6.1%
15 1,358 26,790 134,606 1,166 6,029 14,711 5,966 26,825 12,487 3.2% 19.8% 94.5% 2.7% 4.5% 10.3% 14.0% 19.8% 8.8%
16 2,684 59,265 249,169 1,779 14,792 28,759 22,424 65,493 47,965 3.0% 21.9% 93.1% 2.0% 5.5% 10.7% 25.5% 24.2% 17.9%
17 6,549 34,435 133,779 423 8,108 18,274 19,741 44,319 39,467 8.3% 21.2% 91.3% 0.5% 5.0% 12.5% 25.0% 27.3% 26.9%
18 2,726 28,832 132,131 576 4,884 16,153 8,771 28,690 23,105 5.5% 20.9% 91.2% 1.2% 3.5% 11.1% 17.6% 20.8% 15.9%
19 2,471 16,690 98,209 1,114 3,861 12,116 11,765 20,912 19,414 5.2% 16.7% 92.1% 2.3% 3.9% 11.4% 24.7% 20.9% 18.2%
20 3,144 33,177 134,378 1,301 6,692 16,032 11,905 30,068 27,105 5.3% 21.3% 89.4% 2.2% 4.3% 10.7% 20.0% 19.3% 18.0%
21 1,874 29,122 132,253 543 3,317 12,971 7,612 18,101 26,942 4.4% 19.9% 88.0% 1.3% 2.3% 8.6% 17.7% 12.4% 17.9%
22 2,369 31,505 148,576 1,130 4,711 17,318 13,899 31,931 26,072 2.8% 17.5% 88.3% 1.3% 2.6% 10.3% 16.3% 17.8% 15.5%
23 1,064 24,318 202,532 1,388 5,438 30,984 9,935 21,224 16,573 2.2% 17.6% 95.6% 2.9% 3.9% 14.6% 20.5% 15.4% 7.8%
Nat’l 54,936 686,436 3,282,664 22,797 148,865 411,852 213,805 591,714 486,005 5.0% 21.1% 92.6% 2.1% 4.6% 11.6% 19.5% 18.2% 13.7%
Continues on next page
Percentages do not total 100 percent because enrollees may have responded with multiple coverage Denominator is enrollees by Age and VISN
Office of the ADUSH for Policy and Planning
A-14 2011 Survey of Veteran Enrollees' Health and Reliance Upon VA
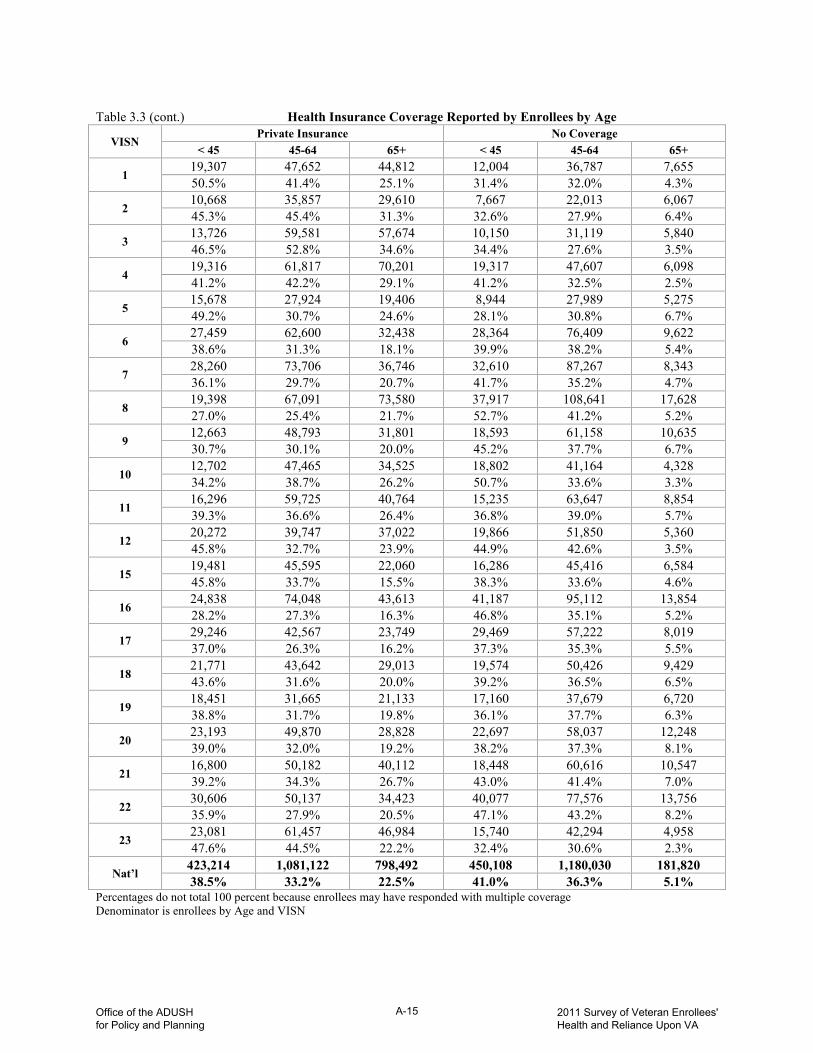
Table 3.3 (cont.) Health Insurance Coverage Reported by Enrollees by Age
VISN Private Insurance No Coverage
< 45 45-64 65+ < 45 45-64 65+
1 19,307 47,652 44,812 12,004 36,787 7,655 50.5% 41.4% 25.1% 31.4% 32.0% 4.3%
2 10,668 35,857 29,610 7,667 22,013 6,067 45.3% 45.4% 31.3% 32.6% 27.9% 6.4%
3 13,726 59,581 57,674 10,150 31,119 5,840 46.5% 52.8% 34.6% 34.4% 27.6% 3.5%
4 19,316 61,817 70,201 19,317 47,607 6,098 41.2% 42.2% 29.1% 41.2% 32.5% 2.5%
5 15,678 27,924 19,406 8,944 27,989 5,275 49.2% 30.7% 24.6% 28.1% 30.8% 6.7%
6 27,459 62,600 32,438 28,364 76,409 9,622 38.6% 31.3% 18.1% 39.9% 38.2% 5.4%
7 28,260 73,706 36,746 32,610 87,267 8,343 36.1% 29.7% 20.7% 41.7% 35.2% 4.7%
8 19,398 67,091 73,580 37,917 108,641 17,628 27.0% 25.4% 21.7% 52.7% 41.2% 5.2%
9 12,663 48,793 31,801 18,593 61,158 10,635 30.7% 30.1% 20.0% 45.2% 37.7% 6.7%
10 12,702 47,465 34,525 18,802 41,164 4,328 34.2% 38.7% 26.2% 50.7% 33.6% 3.3%
11 16,296 59,725 40,764 15,235 63,647 8,854 39.3% 36.6% 26.4% 36.8% 39.0% 5.7%
12 20,272 39,747 37,022 19,866 51,850 5,360 45.8% 32.7% 23.9% 44.9% 42.6% 3.5%
15 19,481 45,595 22,060 16,286 45,416 6,584 45.8% 33.7% 15.5% 38.3% 33.6% 4.6%
16 24,838 74,048 43,613 41,187 95,112 13,854 28.2% 27.3% 16.3% 46.8% 35.1% 5.2%
17 29,246 42,567 23,749 29,469 57,222 8,019 37.0% 26.3% 16.2% 37.3% 35.3% 5.5%
18 21,771 43,642 29,013 19,574 50,426 9,429 43.6% 31.6% 20.0% 39.2% 36.5% 6.5%
19 18,451 31,665 21,133 17,160 37,679 6,720 38.8% 31.7% 19.8% 36.1% 37.7% 6.3%
20 23,193 49,870 28,828 22,697 58,037 12,248 39.0% 32.0% 19.2% 38.2% 37.3% 8.1%
21 16,800 50,182 40,112 18,448 60,616 10,547 39.2% 34.3% 26.7% 43.0% 41.4% 7.0%
22 30,606 50,137 34,423 40,077 77,576 13,756 35.9% 27.9% 20.5% 47.1% 43.2% 8.2%
23 23,081 61,457 46,984 15,740 42,294 4,958 47.6% 44.5% 22.2% 32.4% 30.6% 2.3%
Nat’l 423,214 1,081,122 798,492 450,108 1,180,030 181,820 38.5% 33.2% 22.5% 41.0% 36.3% 5.1%
Percentages do not total 100 percent because enrollees may have responded with multiple coverage Denominator is enrollees by Age and VISN
Office of the ADUSH for Policy and Planning
A-15 2011 Survey of Veteran Enrollees' Health and Reliance Upon VA

Table 3.4 Health Insurance Coverage Reported by Enrollees by Income
VISN Medicare Medicaid TRICARE
<$36K $36K+ DK/Ref <$36K $36K+ DK/Ref <$36K $36K+ DK/Ref
1 108,307 63,837 23,661 23,156 7,374 2,187 8,403 24,891 4,300 65.5% 49.7% 61.7% 14.0% 5.7% 5.7% 5.1% 19.4% 11.2%
2 61,136 31,793 11,264 13,483 4,439 1,530 7,609 12,886 3,004 61.0% 42.0% 53.2% 13.5% 5.9% 7.2% 7.6% 17.0% 14.2%
3 76,679 77,353 28,350 13,551 7,150 5,710 6,810 11,764 2,581 59.2% 56.3% 66.8% 10.5% 5.2% 13.5% 5.3% 8.6% 6.1%
4 158,993 69,863 42,195 27,982 7,211 6,505 13,356 22,072 6,465 67.2% 50.2% 71.6% 11.8% 5.2% 11.0% 5.6% 15.9% 11.0%
5 43,000 32,234 11,073 10,247 2,980 1,363 5,796 42,119 9,001 55.2% 33.1% 42.3% 13.1% 3.1% 5.2% 7.4% 43.2% 34.4%
6 117,623 66,281 26,776 13,763 5,971 4,749 16,762 64,709 11,252 51.6% 38.2% 54.3% 6.0% 3.4% 9.6% 7.4% 37.3% 22.8%
7 127,271 64,285 30,084 18,291 10,196 4,725 36,299 74,642 17,984 50.3% 35.2% 44.2% 7.2% 5.6% 6.9% 14.3% 40.9% 26.4%
8 209,871 127,634 51,080 35,934 17,104 5,240 29,628 60,516 10,797 57.5% 54.5% 68.2% 9.8% 7.3% 7.0% 8.1% 25.8% 14.4%
9 118,102 45,223 23,937 12,550 6,204 1,037 17,598 32,864 5,550 55.7% 40.3% 63.5% 5.9% 5.5% 2.7% 8.3% 29.3% 14.7%
10 95,937 34,653 21,648 13,304 3,571 2,437 10,254 16,562 1,920 54.7% 42.2% 63.6% 7.6% 4.3% 7.2% 5.9% 20.2% 5.6%
11 110,275 49,053 22,721 22,399 4,955 3,711 12,542 21,769 4,133 54.0% 42.4% 57.8% 11.0% 4.3% 9.4% 6.1% 18.8% 10.5%
12 92,762 54,934 20,142 16,152 8,072 3,712 8,074 13,925 3,979 55.9% 46.2% 55.9% 9.7% 6.8% 10.3% 4.9% 11.7% 11.0%
15 100,310 44,864 17,580 14,871 4,276 2,760 9,335 28,493 7,449 57.4% 41.0% 48.9% 8.5% 3.9% 7.7% 5.3% 26.1% 20.7%
16 180,330 93,646 37,142 35,581 6,314 3,435 30,073 85,862 19,946 54.3% 42.7% 48.9% 10.7% 2.9% 4.5% 9.1% 39.2% 26.3%
17 89,274 62,077 23,412 14,297 7,391 5,117 19,688 66,125 17,714 48.3% 39.1% 53.0% 7.7% 4.7% 11.6% 10.7% 41.6% 40.1%
18 89,143 54,660 19,886 12,097 6,353 3,162 15,095 37,731 7,740 54.6% 41.6% 51.6% 7.4% 4.8% 8.2% 9.2% 28.7% 20.1%
19 65,158 39,806 12,406 11,195 4,961 935 12,863 31,589 7,639 51.4% 38.5% 52.4% 8.8% 4.8% 3.9% 10.1% 30.5% 32.2%
20 96,137 56,773 17,789 16,347 5,983 1,694 13,044 48,370 7,663 52.4% 39.8% 44.9% 8.9% 4.2% 4.3% 7.1% 33.9% 19.4%
21 79,239 66,420 17,590 10,459 4,588 1,785 15,039 29,677 7,940 48.3% 48.3% 46.3% 6.4% 3.3% 4.7% 9.2% 21.6% 20.9%
22 97,003 58,890 26,558 12,677 7,722 2,761 16,928 44,434 10,540 44.7% 36.1% 50.3% 5.8% 4.7% 5.2% 7.8% 27.2% 20.0%
23 125,606 74,714 27,594 24,806 7,316 5,688 15,489 28,482 3,761 65.4% 45.5% 65.1% 12.9% 4.5% 13.4% 8.1% 17.4% 8.9%
Nat’l 2,242,156 1,268,992 512,888 373,142 140,131 70,240 320,684 799,482 171,358
55.3% 43.4% 55.9% 9.2% 4.8% 7.7% 7.9% 27.3% 18.7% Continues on next page
Percentages do not total 100 percent because enrollees may have responded with multiple coverage Denominator is enrollees by Income and VISN
Office of the ADUSH for Policy and Planning
A-16 2011 Survey of Veteran Enrollees' Health and Reliance Upon VA

Table 3.4 (cont.) Health Insurance Coverage Reported by Enrollees by Income
VISN Private Insurance No Coverage <$36K $36K+ DK/Ref <$36K $36K+ DK/Ref
1 35,052 65,293 11,425 38,191 12,326 5,929 21.2% 50.8% 29.8% 23.1% 9.6% 15.5%
2 24,022 44,606 7,507 24,531 6,981 4,236 24.0% 59.0% 35.5% 24.5% 9.2% 20.0%
3 34,940 79,179 16,863 31,489 11,245 4,375 27.0% 57.7% 39.7% 24.3% 8.2% 10.3%
4 57,683 72,819 20,832 52,231 14,052 6,738 24.4% 52.4% 35.4% 22.1% 10.1% 11.4%
5 13,670 41,580 7,757 26,872 10,765 4,570 17.5% 42.7% 29.6% 34.5% 11.1% 17.4%
6 40,721 67,860 13,915 81,141 26,114 7,139 17.9% 39.2% 28.2% 35.6% 15.1% 14.5%
7 41,423 78,587 18,703 88,011 22,073 18,135 16.4% 43.0% 27.5% 34.8% 12.1% 26.6%
8 50,392 91,316 18,362 122,189 27,978 14,019 13.8% 39.0% 24.5% 33.5% 11.9% 18.7%
9 31,843 49,251 12,163 70,306 14,353 5,727 15.0% 43.9% 32.3% 33.1% 12.8% 15.2%
10 41,615 42,327 10,749 50,428 8,140 5,727 23.7% 51.5% 31.6% 28.8% 9.9% 16.8%
11 41,445 59,716 15,624 67,584 14,031 6,121 20.3% 51.6% 39.8% 33.1% 12.1% 15.6%
12 28,908 56,835 11,298 55,630 16,318 5,129 17.4% 47.8% 31.4% 33.5% 13.7% 14.2%
15 29,828 45,337 11,970 49,237 12,791 6,258 17.1% 41.5% 33.3% 28.2% 11.7% 17.4%
16 50,841 75,450 16,208 105,440 27,117 17,596 15.3% 34.4% 21.3% 31.8% 12.4% 23.2%
17 29,043 57,378 9,142 65,838 20,643 8,230 15.7% 36.1% 20.7% 35.6% 13.0% 18.6%
18 27,352 54,676 12,400 51,181 19,607 8,641 16.8% 41.7% 32.2% 31.4% 14.9% 22.4%
19 20,263 44,821 6,164 44,179 12,867 4,514 16.0% 43.3% 26.0% 34.8% 12.4% 19.1%
20 31,579 58,661 11,651 64,493 18,452 10,036 17.2% 41.2% 29.4% 35.2% 12.9% 25.3%
21 26,079 69,685 11,331 63,439 18,192 7,980 15.9% 50.7% 29.8% 38.7% 13.2% 21.0%
22 34,756 68,093 12,316 87,460 30,646 13,304 16.0% 41.7% 23.3% 40.3% 18.8% 25.2%
23 40,019 79,157 12,345 41,905 15,581 5,506 20.8% 48.2% 29.1% 21.8% 9.5% 13.0%
Nat’l 731,475 1,302,627 268,725 1,281,776 360,271 169,911 18.1% 44.5% 29.3% 31.6% 12.3% 18.5%
Percentages do not total 100 percent because enrollees may have responded with multiple coverage Denominator is enrollees by Income and VISN
Office of the ADUSH for Policy and Planning
A-17 2011 Survey of Veteran Enrollees' Health and Reliance Upon VA

Ch ap t er 4 – Ph arma ceu t i ca l Us e Table 4.1 VA, Private and Medicare Prescription Coverage
VISN Awareness of VA Prescription
Coverage (all enrollees)
Private Insurance Drug Benefit (for enrollees covered by private
insurance = 2,302,827)
Medicare Part D Drug Benefit (for Medicare beneficiaries = 4,024,036)
Yes No DK/Ref Yes No DK/Ref Yes No DK/Ref
1 207,893 109,779 14,427 92,634 16,992 2,145 76,742 103,769 15,293 62.6% 33.1% 4.3% 82.9% 15.2% 1.9% 39.2% 53.0% 7.8%
2 108,719 78,919 9,356 64,099 10,082 1,954 40,308 56,131 7,754 55.2% 40.1% 4.7% 84.2% 13.2% 2.6% 38.7% 53.9% 7.4%
3 151,150 145,781 12,393 109,574 17,345 4,062 77,164 95,311 9,906 48.9% 47.1% 4.0% 83.7% 13.2% 3.1% 42.3% 52.3% 5.4%
4 261,483 154,987 17,946 117,746 30,202 3,387 100,400 148,010 22,641 60.2% 35.7% 4.1% 77.8% 20.0% 2.2% 37.0% 54.6% 8.4%
5 103,069 86,783 11,692 53,729 7,217 2,062 27,882 52,823 5,601 51.1% 43.1% 5.8% 85.3% 11.5% 3.3% 32.3% 61.2% 6.5%
6 261,762 169,825 18,995 102,517 14,435 5,543 77,555 119,096 14,028 58.1% 37.7% 4.2% 83.7% 11.8% 4.5% 36.8% 56.5% 6.7%
7 305,968 164,445 33,403 108,536 26,241 3,935 76,236 132,699 12,705 60.7% 32.6% 6.6% 78.2% 18.9% 2.8% 34.4% 59.9% 5.7%
8 437,110 202,258 34,875 132,019 22,619 5,432 143,233 217,228 28,124 64.8% 30.0% 5.2% 82.5% 14.1% 3.4% 36.9% 55.9% 7.2%
9 234,865 104,738 22,629 76,359 13,512 3,386 55,303 115,125 16,833 64.8% 28.9% 6.2% 81.9% 14.5% 3.6% 29.5% 61.5% 9.0%
10 172,807 105,315 13,307 81,107 12,417 1,167 62,699 73,603 15,936 59.3% 36.1% 4.6% 85.7% 13.1% 1.2% 41.2% 48.3% 10.5%
11 229,934 119,990 9,273 91,954 23,386 1,444 65,968 106,510 9,572 64.0% 33.4% 2.6% 78.7% 20.0% 1.2% 36.2% 58.5% 5.3%
12 207,606 96,773 16,346 71,469 21,446 4,126 57,866 99,851 10,120 64.7% 30.2% 5.1% 73.6% 22.1% 4.3% 34.5% 59.5% 6.0%
15 200,274 102,367 17,479 67,895 16,309 2,932 52,087 102,158 8,509 62.6% 32.0% 5.5% 77.9% 18.7% 3.4% 32.0% 62.8% 5.2%
16 369,960 223,401 33,559 112,787 23,441 6,272 106,147 183,448 21,523 59.0% 35.6% 5.4% 79.1% 16.4% 4.4% 34.1% 59.0% 6.9%
17 237,528 126,984 23,220 80,153 12,233 3,177 57,339 101,238 16,186 61.3% 32.8% 6.0% 83.9% 12.8% 3.3% 32.8% 57.9% 9.3%
18 207,908 106,592 18,509 73,925 15,378 5,124 61,620 89,750 12,318 62.4% 32.0% 5.6% 78.3% 16.3% 5.4% 37.6% 54.8% 7.5%
19 147,308 90,935 15,784 56,046 12,274 2,928 40,139 68,589 8,641 58.0% 35.8% 6.2% 78.7% 17.2% 4.1% 34.2% 58.4% 7.4%
20 214,421 124,705 26,368 80,173 18,457 3,261 57,104 102,106 11,489 58.7% 34.1% 7.2% 78.7% 18.1% 3.2% 33.5% 59.8% 6.7%
21 197,836 122,554 19,212 91,452 11,732 3,910 63,882 83,423 15,944 58.3% 36.1% 5.7% 85.4% 11.0% 3.7% 39.1% 51.1% 9.8%
22 237,696 157,860 37,515 100,384 9,918 4,864 88,869 78,015 15,567 54.9% 36.5% 8.7% 87.2% 8.6% 4.2% 48.7% 42.8% 8.5%
23 256,403 123,517 18,611 100,404 25,328 5,789 77,465 133,372 17,077 64.3% 31.0% 4.7% 76.3% 19.3% 4.4% 34.0% 58.5% 7.5%
Nat’l 4,751,701 2,718,506 424,900 1,864,961 360,965 76,901 1,466,009 2,262,258 295,768
60.2% 34.4% 5.4% 81.0% 15.7% 3.3% 36.4% 56.2% 7.4%
Office of the ADUSH for Policy and Planning
A-18 2011 Survey of Veteran Enrollees' Health and Reliance Upon VA

Table 4.2 Enrollee Awareness of VA Drug Coverage by Priority, Age, and Income
VISN Priority Age Income P1-3 P4-6 P7-8 <45 45-64 65+ <$36K $36K+ DK/Ref
1 77,210 64,319 66,363 14,677 73,145 120,070 112,776 72,855 22,261 68.6% 62.4% 57.0% 38.4% 63.5% 67.2% 68.2% 56.7% 58.1%
2 38,846 41,021 28,852 8,756 45,066 54,896 64,207 33,784 10,727 69.4% 57.1% 41.7% 37.2% 57.1% 58.1% 64.1% 44.6% 50.7%
3 47,785 47,800 55,565 10,029 57,530 83,591 74,390 56,909 19,851 60.1% 56.7% 38.2% 34.0% 51.0% 50.1% 57.4% 41.4% 46.8%
4 81,228 92,905 87,350 17,309 91,107 153,067 161,328 69,745 30,411 69.8% 56.5% 56.9% 36.9% 62.2% 63.5% 68.2% 50.1% 51.6%
5 43,734 37,557 21,779 13,442 45,926 43,701 53,840 37,097 12,132 48.1% 60.8% 44.5% 42.2% 50.5% 55.5% 69.1% 38.1% 46.3%
6 116,744 87,431 57,587 29,851 123,800 108,111 145,556 89,235 26,972 62.7% 56.5% 52.5% 42.0% 61.9% 60.3% 63.8% 51.5% 54.7%
7 139,986 109,480 56,502 29,167 166,618 110,183 176,025 91,717 38,226 61.7% 64.2% 53.1% 37.3% 67.2% 62.1% 69.5% 50.2% 56.2%
8 165,406 149,545 122,159 40,089 187,032 209,989 258,176 128,412 50,522 74.0% 61.3% 59.0% 55.7% 70.9% 62.0% 70.8% 54.8% 67.4%
9 89,127 99,808 45,930 19,252 111,536 104,077 147,690 62,916 24,259 69.7% 65.5% 56.1% 46.7% 68.8% 65.5% 69.6% 56.0% 64.3%
10 55,876 76,088 40,843 19,346 78,715 74,746 112,830 42,313 17,664 68.9% 58.2% 51.2% 52.1% 64.2% 56.8% 64.4% 51.5% 51.9%
11 82,110 95,828 51,996 19,682 107,539 102,713 143,119 64,661 22,154 66.6% 66.2% 57.1% 47.5% 66.0% 66.4% 70.1% 55.9% 56.4%
12 58,856 67,566 81,183 17,159 83,292 107,155 116,416 67,129 24,061 64.1% 63.0% 66.8% 38.7% 68.4% 69.2% 70.2% 56.5% 66.8%
15 72,979 75,454 51,841 18,288 83,298 98,688 122,098 55,947 22,230 64.7% 63.2% 58.9% 43.0% 61.6% 69.3% 69.8% 51.2% 61.9%
16 164,630 123,966 81,365 27,975 163,112 178,874 215,197 114,811 39,952 63.4% 55.7% 56.2% 31.8% 60.2% 66.8% 64.8% 52.4% 52.6%
17 120,885 75,620 41,024 40,954 102,595 93,979 128,915 87,081 21,532 64.9% 60.2% 54.1% 51.8% 63.3% 64.1% 69.8% 54.8% 48.7%
18 88,606 71,667 47,635 22,590 92,005 93,312 112,901 72,322 22,684 67.7% 60.6% 56.8% 45.2% 66.6% 64.4% 69.2% 55.1% 58.9%
19 64,540 47,744 35,024 17,195 62,230 67,883 86,279 48,521 12,508 59.5% 57.2% 56.4% 36.2% 62.3% 63.7% 68.0% 46.9% 52.8%
20 103,489 69,255 41,677 27,516 90,944 95,961 119,108 74,525 20,787 63.6% 56.1% 52.5% 46.3% 58.4% 63.8% 65.0% 52.3% 52.5%
21 84,370 68,521 44,945 16,039 91,035 90,762 109,216 67,811 20,809 66.4% 56.3% 49.5% 37.4% 62.2% 60.4% 66.6% 49.3% 54.8%
22 95,058 99,363 43,275 33,044 112,689 91,963 131,522 77,832 28,343 61.3% 57.9% 40.7% 38.8% 62.7% 54.6% 60.6% 47.7% 53.7%
23 107,884 66,046 82,473 16,710 91,746 147,947 135,461 94,105 26,838 68.8% 56.1% 66.4% 34.4% 66.4% 69.8% 70.5% 57.4% 63.4%
Nat’l 1,899,349 1,666,986 1,185,367 459,072 2,060,961 2,231,668 2,727,051 1,509,729 514,921 65.2% 59.7% 54.2% 41.8% 63.4% 63.0% 67.3% 51.6% 56.1%
Denominator is the enrollee population by Priority, Age, or Income by VISN
Office of the ADUSH for Policy and Planning
A-19 2011 Survey of Veteran Enrollees' Health and Reliance Upon VA

Table 4.3 Enrollee Medicare Part D Drug Coverage by Priority, Age and Income
VISN Priority Age Income P1-3 P4-6 P7-8 <45 45-64 65+ <$36K $36K+ DK/Ref
1 12,469 27,757 36,516 1,356 11,638 63,747 47,122 21,719 7,902 24.2% 49.2% 41.6% 57.7% 43.0% 38.3% 43.5% 34.0% 33.4%
2 7,061 15,255 17,993 486 5,927 33,895 26,907 9,853 3,548 32.1% 41.8% 39.4% 30.9% 33.8% 39.8% 44.0% 31.0% 31.5%
3 12,861 18,123 46,180 245 9,307 67,613 36,730 27,301 13,134 32.5% 44.7% 45.2% 15.6% 37.8% 43.3% 47.9% 35.3% 46.3%
4 17,632 37,589 45,180 937 14,323 85,141 57,307 26,433 16,660 32.9% 37.3% 38.7% 33.3% 38.6% 36.8% 36.0% 37.8% 39.5%
5 8,566 9,231 10,085 754 3,809 23,320 15,464 8,526 3,893 28.4% 32.7% 36.2% 24.6% 30.0% 33.1% 36.0% 26.4% 35.2%
6 19,019 29,511 29,025 672 11,090 65,793 49,858 19,759 7,938 27.9% 43.3% 39.0% 24.2% 27.4% 39.3% 42.4% 29.8% 29.6%
7 23,996 25,273 26,966 1,017 18,110 57,108 48,533 18,007 9,695 26.4% 36.7% 43.5% 32.2% 33.6% 34.7% 38.1% 28.0% 32.2%
8 35,904 51,702 55,628 2,291 25,683 115,259 80,991 42,483 19,760 33.2% 38.3% 38.3% 38.2% 38.7% 36.5% 38.6% 33.3% 38.7%
9 13,319 23,427 18,557 265 11,460 43,578 35,127 13,495 6,681 24.1% 31.3% 32.6% 17.0% 28.2% 30.1% 29.7% 29.8% 27.9%
10 9,051 27,535 26,113 96 4,496 58,107 37,421 13,154 12,124 27.5% 42.8% 47.5% 7.5% 17.2% 46.6% 39.0% 38.0% 56.0%
11 14,874 25,927 25,167 1,825 11,982 52,161 41,417 17,587 6,964 28.2% 40.0% 39.0% 58.6% 34.4% 36.2% 37.6% 35.9% 30.7%
12 11,273 17,814 28,779 713 6,093 51,061 31,504 18,947 7,415 31.5% 41.4% 32.3% 49.2% 29.4% 35.0% 34.0% 34.5% 36.8%
15 10,715 21,540 19,832 232 8,389 43,466 31,664 14,113 6,309 24.2% 38.3% 31.9% 17.1% 31.3% 32.3% 31.6% 31.5% 35.9%
16 29,794 46,830 29,524 1,495 22,087 82,565 69,627 24,765 11,754 27.0% 41.7% 33.4% 55.7% 37.3% 33.1% 38.6% 26.4% 31.6%
17 19,655 23,439 14,245 2,156 8,089 47,094 33,205 16,507 7,627 27.0% 40.3% 32.5% 32.9% 23.5% 35.2% 37.2% 26.6% 32.6%
18 17,438 20,826 23,357 1,097 8,082 52,441 33,234 19,712 8,675 32.7% 35.3% 45.5% 40.2% 28.0% 39.7% 37.3% 36.1% 43.6%
19 10,708 15,467 13,965 34 5,213 34,892 25,669 10,724 3,746 26.8% 42.6% 34.0% 1.4% 31.2% 35.5% 39.4% 26.9% 30.2%
20 17,656 19,853 19,595 970 10,223 45,911 33,272 18,377 5,454 29.8% 33.3% 37.8% 30.8% 30.8% 34.2% 34.6% 32.4% 30.7%
21 17,215 19,836 26,830 386 10,583 52,913 34,202 24,653 5,026 33.5% 38.7% 44.3% 20.6% 36.3% 40.0% 43.2% 37.1% 28.6%
22 20,585 38,682 29,601 917 11,690 76,262 48,086 27,219 13,564 40.3% 51.8% 52.3% 38.7% 37.1% 51.3% 49.6% 46.2% 51.1%
23 23,933 21,020 32,512 424 4,643 72,398 42,229 26,624 8,613 32.3% 37.3% 33.4% 39.8% 19.1% 35.7% 33.6% 35.6% 31.2%
Nat’l 353,723 536,637 575,650 18,367 222,916 1,224,725 859,569 419,958 186,482 29.5% 39.9% 38.9% 33.4% 32.5% 37.3% 38.3% 33.1% 36.4%
Denominator is the enrollee population with Medicare by Priority, Age or Income by VISN
Office of the ADUSH for Policy and Planning
A-20 2011 Survey of Veteran Enrollees' Health and Reliance Upon VA
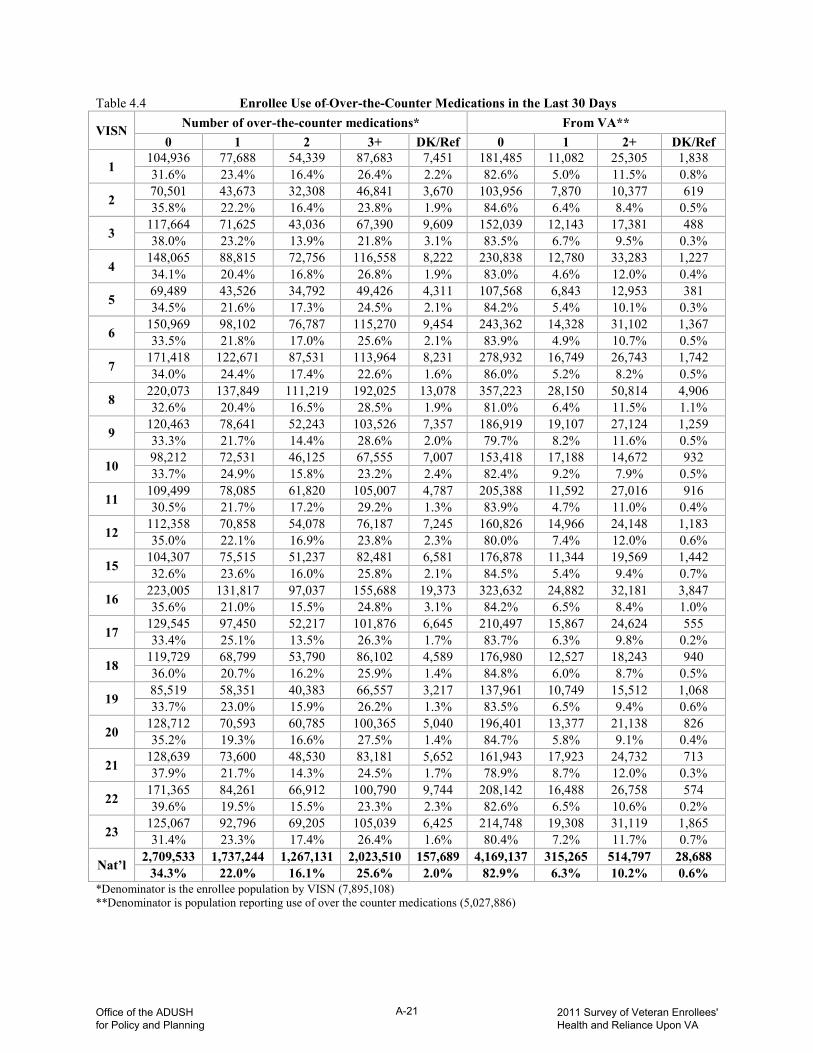
Table 4.4 Enrollee Use of Over-the-Counter Medications in the Last 30 Days
VISN Number of over-the-counter medications* From VA** 0 1 2 3+ DK/Ref 0 1 2+ DK/Ref
1 104,936 77,688 54,339 87,683 7,451 181,485 11,082 25,305 1,838 31.6% 23.4% 16.4% 26.4% 2.2% 82.6% 5.0% 11.5% 0.8%
2 70,501 43,673 32,308 46,841 3,670 103,956 7,870 10,377 619 35.8% 22.2% 16.4% 23.8% 1.9% 84.6% 6.4% 8.4% 0.5%
3 117,664 71,625 43,036 67,390 9,609 152,039 12,143 17,381 488 38.0% 23.2% 13.9% 21.8% 3.1% 83.5% 6.7% 9.5% 0.3%
4 148,065 88,815 72,756 116,558 8,222 230,838 12,780 33,283 1,227 34.1% 20.4% 16.8% 26.8% 1.9% 83.0% 4.6% 12.0% 0.4%
5 69,489 43,526 34,792 49,426 4,311 107,568 6,843 12,953 381 34.5% 21.6% 17.3% 24.5% 2.1% 84.2% 5.4% 10.1% 0.3%
6 150,969 98,102 76,787 115,270 9,454 243,362 14,328 31,102 1,367 33.5% 21.8% 17.0% 25.6% 2.1% 83.9% 4.9% 10.7% 0.5%
7 171,418 122,671 87,531 113,964 8,231 278,932 16,749 26,743 1,742 34.0% 24.4% 17.4% 22.6% 1.6% 86.0% 5.2% 8.2% 0.5%
8 220,073 137,849 111,219 192,025 13,078 357,223 28,150 50,814 4,906 32.6% 20.4% 16.5% 28.5% 1.9% 81.0% 6.4% 11.5% 1.1%
9 120,463 78,641 52,243 103,526 7,357 186,919 19,107 27,124 1,259 33.3% 21.7% 14.4% 28.6% 2.0% 79.7% 8.2% 11.6% 0.5%
10 98,212 72,531 46,125 67,555 7,007 153,418 17,188 14,672 932 33.7% 24.9% 15.8% 23.2% 2.4% 82.4% 9.2% 7.9% 0.5%
11 109,499 78,085 61,820 105,007 4,787 205,388 11,592 27,016 916 30.5% 21.7% 17.2% 29.2% 1.3% 83.9% 4.7% 11.0% 0.4%
12 112,358 70,858 54,078 76,187 7,245 160,826 14,966 24,148 1,183 35.0% 22.1% 16.9% 23.8% 2.3% 80.0% 7.4% 12.0% 0.6%
15 104,307 75,515 51,237 82,481 6,581 176,878 11,344 19,569 1,442 32.6% 23.6% 16.0% 25.8% 2.1% 84.5% 5.4% 9.4% 0.7%
16 223,005 131,817 97,037 155,688 19,373 323,632 24,882 32,181 3,847 35.6% 21.0% 15.5% 24.8% 3.1% 84.2% 6.5% 8.4% 1.0%
17 129,545 97,450 52,217 101,876 6,645 210,497 15,867 24,624 555 33.4% 25.1% 13.5% 26.3% 1.7% 83.7% 6.3% 9.8% 0.2%
18 119,729 68,799 53,790 86,102 4,589 176,980 12,527 18,243 940 36.0% 20.7% 16.2% 25.9% 1.4% 84.8% 6.0% 8.7% 0.5%
19 85,519 58,351 40,383 66,557 3,217 137,961 10,749 15,512 1,068 33.7% 23.0% 15.9% 26.2% 1.3% 83.5% 6.5% 9.4% 0.6%
20 128,712 70,593 60,785 100,365 5,040 196,401 13,377 21,138 826 35.2% 19.3% 16.6% 27.5% 1.4% 84.7% 5.8% 9.1% 0.4%
21 128,639 73,600 48,530 83,181 5,652 161,943 17,923 24,732 713 37.9% 21.7% 14.3% 24.5% 1.7% 78.9% 8.7% 12.0% 0.3%
22 171,365 84,261 66,912 100,790 9,744 208,142 16,488 26,758 574 39.6% 19.5% 15.5% 23.3% 2.3% 82.6% 6.5% 10.6% 0.2%
23 125,067 92,796 69,205 105,039 6,425 214,748 19,308 31,119 1,865 31.4% 23.3% 17.4% 26.4% 1.6% 80.4% 7.2% 11.7% 0.7%
Nat’l 2,709,533 1,737,244 1,267,131 2,023,510 157,689 4,169,137 315,265 514,797 28,688 34.3% 22.0% 16.1% 25.6% 2.0% 82.9% 6.3% 10.2% 0.6%
*Denominator is the enrollee population by VISN (7,895,108) **Denominator is population reporting use of over the counter medications (5,027,886)
Office of the ADUSH for Policy and Planning
A-21 2011 Survey of Veteran Enrollees' Health and Reliance Upon VA
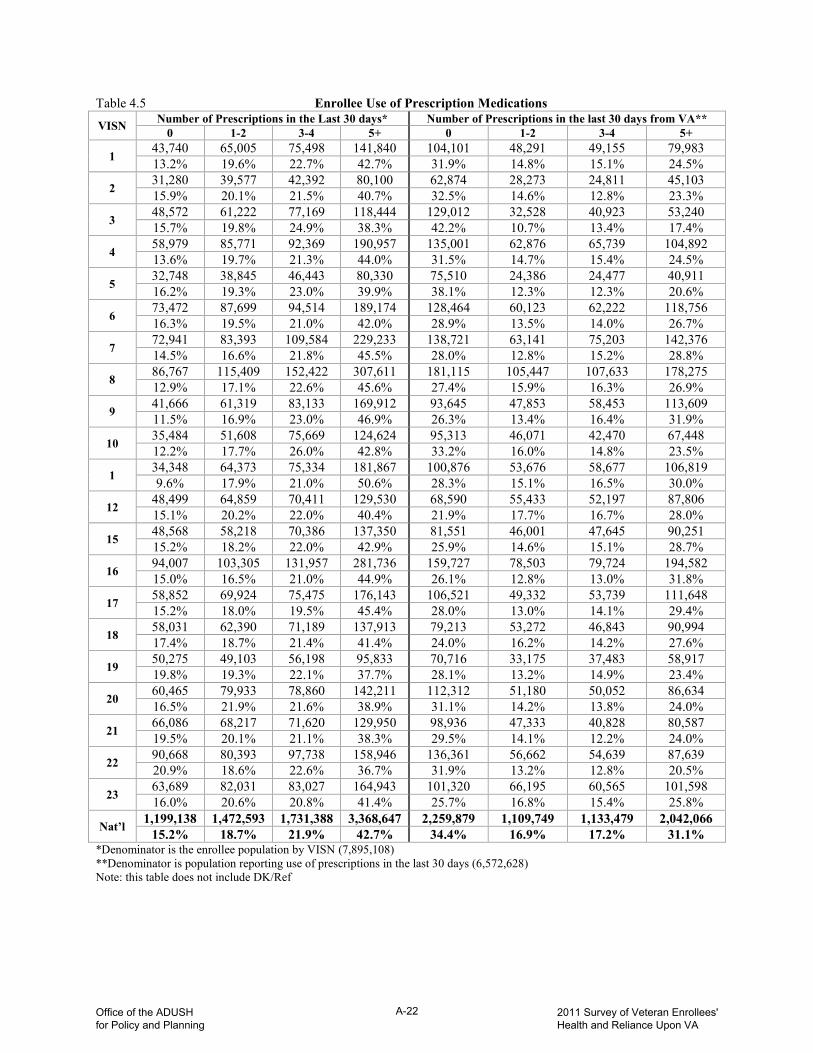
Table 4.5 Enrollee Use of Prescription Medications
VISN Number of Prescriptions in the Last 30 days* Number of Prescriptions in the last 30 days from VA** 0 1-2 3-4 5+ 0 1-2 3-4 5+
1 43,740 65,005 75,498 141,840 104,101 48,291 49,155 79,983 13.2% 19.6% 22.7% 42.7% 31.9% 14.8% 15.1% 24.5%
2 31,280 39,577 42,392 80,100 62,874 28,273 24,811 45,103 15.9% 20.1% 21.5% 40.7% 32.5% 14.6% 12.8% 23.3%
3 48,572 61,222 77,169 118,444 129,012 32,528 40,923 53,240 15.7% 19.8% 24.9% 38.3% 42.2% 10.7% 13.4% 17.4%
4 58,979 85,771 92,369 190,957 135,001 62,876 65,739 104,892 13.6% 19.7% 21.3% 44.0% 31.5% 14.7% 15.4% 24.5%
5 32,748 38,845 46,443 80,330 75,510 24,386 24,477 40,911 16.2% 19.3% 23.0% 39.9% 38.1% 12.3% 12.3% 20.6%
6 73,472 87,699 94,514 189,174 128,464 60,123 62,222 118,756 16.3% 19.5% 21.0% 42.0% 28.9% 13.5% 14.0% 26.7%
7 72,941 83,393 109,584 229,233 138,721 63,141 75,203 142,376 14.5% 16.6% 21.8% 45.5% 28.0% 12.8% 15.2% 28.8%
8 86,767 115,409 152,422 307,611 181,115 105,447 107,633 178,275 12.9% 17.1% 22.6% 45.6% 27.4% 15.9% 16.3% 26.9%
9 41,666 61,319 83,133 169,912 93,645 47,853 58,453 113,609 11.5% 16.9% 23.0% 46.9% 26.3% 13.4% 16.4% 31.9%
10 35,484 51,608 75,669 124,624 95,313 46,071 42,470 67,448 12.2% 17.7% 26.0% 42.8% 33.2% 16.0% 14.8% 23.5%
1 34,348 64,373 75,334 181,867 100,876 53,676 58,677 106,819 9.6% 17.9% 21.0% 50.6% 28.3% 15.1% 16.5% 30.0%
12 48,499 64,859 70,411 129,530 68,590 55,433 52,197 87,806 15.1% 20.2% 22.0% 40.4% 21.9% 17.7% 16.7% 28.0%
15 48,568 58,218 70,386 137,350 81,551 46,001 47,645 90,251 15.2% 18.2% 22.0% 42.9% 25.9% 14.6% 15.1% 28.7%
16 94,007 103,305 131,957 281,736 159,727 78,503 79,724 194,582 15.0% 16.5% 21.0% 44.9% 26.1% 12.8% 13.0% 31.8%
17 58,852 69,924 75,475 176,143 106,521 49,332 53,739 111,648 15.2% 18.0% 19.5% 45.4% 28.0% 13.0% 14.1% 29.4%
18 58,031 62,390 71,189 137,913 79,213 53,272 46,843 90,994 17.4% 18.7% 21.4% 41.4% 24.0% 16.2% 14.2% 27.6%
19 50,275 49,103 56,198 95,833 70,716 33,175 37,483 58,917 19.8% 19.3% 22.1% 37.7% 28.1% 13.2% 14.9% 23.4%
20 60,465 79,933 78,860 142,211 112,312 51,180 50,052 86,634 16.5% 21.9% 21.6% 38.9% 31.1% 14.2% 13.8% 24.0%
21 66,086 68,217 71,620 129,950 98,936 47,333 40,828 80,587 19.5% 20.1% 21.1% 38.3% 29.5% 14.1% 12.2% 24.0%
22 90,668 80,393 97,738 158,946 136,361 56,662 54,639 87,639 20.9% 18.6% 22.6% 36.7% 31.9% 13.2% 12.8% 20.5%
23 63,689 82,031 83,027 164,943 101,320 66,195 60,565 101,598 16.0% 20.6% 20.8% 41.4% 25.7% 16.8% 15.4% 25.8%
Nat’l 1,199,138 1,472,593 1,731,388 3,368,647 2,259,879 1,109,749 1,133,479 2,042,066 15.2% 18.7% 21.9% 42.7% 34.4% 16.9% 17.2% 31.1%
*Denominator is the enrollee population by VISN (7,895,108) **Denominator is population reporting use of prescriptions in the last 30 days (6,572,628) Note: this table does not include DK/Ref
Office of the ADUSH for Policy and Planning
A-22 2011 Survey of Veteran Enrollees' Health and Reliance Upon VA

Ch ap t er 5 – VA Rel ian ce Table 5.1 Enrollee Reliance on VA by VISN
VISN Mean Reliance 0% Reliant 1-25%
Reliant 26-50% Reliant
51-75% Reliant
76-99% Reliant
100% Reliant
1 42.0% 98,974 32,325 48,971 19,425 12,344 68,050 29.8% 9.7% 14.7% 5.8% 3.7% 20.5%
2 44.0% 59,124 13,416 24,751 11,268 7,183 43,842 30.0% 6.8% 12.6% 5.7% 3.6% 22.3%
3 37.0% 106,953 23,030 33,156 14,084 9,768 55,437 34.6% 7.4% 10.7% 4.6% 3.2% 17.9%
4 42.4% 125,883 47,032 61,422 25,984 11,882 94,367 29.0% 10.8% 14.1% 6.0% 2.7% 21.7%
5 41.5% 68,551 12,920 17,742 9,965 5,112 45,673 34.0% 6.4% 8.8% 4.9% 2.5% 22.7%
6 46.1% 126,907 30,055 53,249 31,339 16,920 107,080 28.2% 6.7% 11.8% 7.0% 3.8% 23.8%
7 46.8% 135,862 36,113 66,128 35,657 13,444 125,098 27.0% 7.2% 13.1% 7.1% 2.7% 24.8%
8 49.8% 153,693 66,914 91,244 45,352 33,790 174,699 22.8% 9.9% 13.5% 6.7% 5.0% 25.9%
9 52.6% 85,957 26,625 47,770 28,732 15,632 107,033 23.7% 7.4% 13.2% 7.9% 4.3% 29.5%
10 47.6% 81,871 16,579 39,800 23,251 11,800 70,875 28.1% 5.7% 13.7% 8.0% 4.0% 24.3%
11 46.7% 99,047 33,843 43,014 18,798 14,230 92,166 27.6% 9.4% 12.0% 5.2% 4.0% 25.7%
12 50.0% 72,779 29,605 42,243 20,335 8,426 86,167 22.7% 9.2% 13.2% 6.3% 2.6% 26.9%
15 47.6% 81,905 25,339 35,153 19,159 12,571 77,690 25.6% 7.9% 11.0% 6.0% 3.9% 24.3%
16 48.0% 165,361 37,204 77,639 39,293 20,100 154,129 26.4% 5.9% 12.4% 6.3% 3.2% 24.6%
17 48.5% 109,692 27,532 40,873 23,897 14,808 107,254 28.3% 7.1% 10.5% 6.2% 3.8% 27.7%
18 52.5% 79,939 17,591 37,006 25,305 12,541 93,002 24.0% 5.3% 11.1% 7.6% 3.8% 27.9%
19 46.9% 72,355 17,817 27,235 16,535 9,471 64,080 28.5% 7.0% 10.7% 6.5% 3.7% 25.2%
20 46.6% 105,353 27,573 35,909 23,830 10,538 94,481 28.8% 7.5% 9.8% 6.5% 2.9% 25.9%
21 48.8% 91,156 19,188 32,818 16,907 10,247 91,101 26.8% 5.7% 9.7% 5.0% 3.0% 26.8%
22 46.1% 130,605 27,070 41,044 21,912 11,951 112,777 30.2% 6.3% 9.5% 5.1% 2.8% 26.0%
23 47.2% 100,706 35,160 55,181 28,014 14,395 94,942 25.3% 8.8% 13.8% 7.0% 3.6% 23.8%
Nat’l 46.9% 2,152,672 602,932 952,346 499,042 277,153 1,959,943 27.3% 7.6% 12.1% 6.3% 3.5% 24.8%
Denominator is the enrollee population by VISN 0% Reliance indicates that the enrollee’s outpatient care was provided entirely outside VA 100% Reliance indicates 100 percent of the enrollee’s self-reported outpatient care was provided by VA Reliance factors do not include respondents who reported “0” visits for both VA and Non-VA, did not know, or refused to answer the questions.
Office of the ADUSH for Policy and Planning
A-23 2011 Survey of Veteran Enrollees' Health and Reliance Upon VA

Ch ap t er 6 – C ig ar e t t e Sm ok ing S t a tu s Table 6.1 Current Smokers by Priority, Age, and Income
VISN Priority Age Income
1 - 3 4 - 6 7 – 8 <45 45-64 65+ <$36K $36K+ DK/Ref
1 19,060 23,891 13,187 9,836 32,727 13,576 32,664 18,124 5,350 16.9% 23.2% 11.3% 25.7% 28.4% 7.6% 19.8% 14.1% 14.0%
2 12,205 20,272 9,056 6,497 26,450 8,587 24,881 14,055 2,597 21.8% 28.2% 13.1% 27.6% 33.5% 9.1% 24.8% 18.6% 12.3%
3 13,458 20,556 10,838 6,242 26,918 11,691 24,288 14,459 6,104 16.9% 24.4% 7.4% 21.1% 23.8% 7.0% 18.7% 10.5% 14.4%
4 24,102 39,098 10,653 14,204 41,309 18,339 47,147 20,259 6,446 20.7% 23.8% 6.9% 30.3% 28.2% 7.6% 19.9% 14.6% 10.9%
5 15,021 16,406 6,921 6,297 25,140 6,912 20,644 12,843 4,861 16.5% 26.6% 14.1% 19.8% 27.7% 8.8% 26.5% 13.2% 18.6%
6 33,343 37,204 13,363 15,581 51,689 16,641 52,811 24,137 6,962 17.9% 24.1% 12.2% 21.9% 25.8% 9.3% 23.2% 13.9% 14.1%
7 40,834 46,137 12,996 16,736 62,328 20,903 59,200 28,460 12,307 18.0% 27.0% 12.2% 21.4% 25.1% 11.8% 23.4% 15.6% 18.1%
8 38,193 59,523 20,080 13,330 72,801 31,665 84,973 21,953 10,870 17.1% 24.4% 9.7% 18.5% 27.6% 9.4% 23.3% 9.4% 14.5%
9 29,913 51,511 7,987 15,609 54,516 19,287 62,907 20,500 6,004 23.4% 33.8% 9.8% 37.9% 33.6% 12.1% 29.6% 18.3% 15.9%
10 20,765 39,115 8,807 12,394 40,123 16,170 50,322 12,719 5,646 25.6% 29.9% 11.0% 33.4% 32.7% 12.3% 28.7% 15.5% 16.6%
11 27,716 38,703 11,403 12,701 51,653 13,467 51,231 20,520 6,070 22.5% 26.7% 12.5% 30.6% 31.7% 8.7% 25.1% 17.7% 15.5%
12 19,404 33,757 11,493 14,370 38,691 11,593 41,003 16,421 7,230 21.1% 31.5% 9.5% 32.4% 31.8% 7.5% 24.7% 13.8% 20.1%
15 25,424 38,114 12,367 14,176 49,478 12,252 45,696 22,760 7,450 22.5% 31.9% 14.1% 33.3% 36.6% 8.6% 26.1% 20.8% 20.7%
16 49,730 72,453 18,805 26,196 84,193 30,599 92,307 33,556 15,126 19.2% 32.5% 13.0% 29.8% 31.1% 11.4% 27.8% 15.3% 19.9%
17 38,594 32,658 12,840 22,250 46,323 15,518 49,241 26,217 8,634 20.7% 26.0% 16.9% 28.1% 28.6% 10.6% 26.7% 16.5% 19.5%
18 24,186 33,494 7,383 12,366 36,360 16,336 37,718 20,259 7,087 18.5% 28.3% 8.8% 24.7% 26.3% 11.3% 23.1% 15.4% 18.4%
19 16,855 19,097 7,723 11,784 23,624 8,267 27,182 13,398 3,095 15.5% 22.9% 12.4% 24.8% 23.7% 7.8% 21.4% 12.9% 13.1%
20 28,376 34,144 11,035 12,800 46,351 14,404 46,092 19,226 8,237 17.5% 27.6% 13.9% 21.5% 29.8% 9.6% 25.1% 13.5% 20.8%
21 21,723 36,348 10,619 10,327 40,617 17,745 43,711 19,632 5,346 17.1% 29.9% 11.7% 24.1% 27.8% 11.8% 26.6% 14.3% 14.1%
22 27,491 41,098 13,857 21,650 44,120 16,676 47,480 24,716 10,250 17.7% 24.0% 13.0% 25.4% 24.6% 9.9% 21.9% 15.1% 19.4%
23 24,269 30,205 13,043 16,257 35,405 15,855 37,085 23,359 7,073 15.5% 25.7% 10.5% 33.5% 25.6% 7.5% 19.3% 14.2% 16.7%
Nat’l 550,663 763,783 244,455 291,602 930,816 336,482 978,582 427,573 152,745 18.9% 27.3% 11.2% 26.5% 28.6% 9.5% 24.2% 14.6% 16.7%
Denominator is the enrollee population by Priority, Age or Income by VISN
Office of the ADUSH for Policy and Planning
A-24 2011 Survey of Veteran Enrollees' Health and Reliance Upon VA

Table 6.2 Former Smokers by Priority, Age, and Income
VISN Priority Age Income
1 - 3 4 - 6 7 – 8 <45 45-64 65+ <$36K $36K+ DK/Ref
1 55,867 45,269 71,937 10,299 49,006 113,767 85,847 66,531 20,695 49.7% 43.9% 61.7% 26.9% 42.6% 63.7% 51.9% 51.8% 54.0%
2 27,601 29,814 38,418 5,806 32,456 57,570 48,453 34,867 12,513 49.3% 41.5% 55.6% 24.7% 41.1% 60.9% 48.4% 46.1% 59.1%
3 39,833 35,502 78,248 7,807 45,004 100,772 64,101 68,688 20,794 50.1% 42.1% 53.8% 26.4% 39.9% 60.4% 49.5% 50.0% 49.0%
4 54,466 88,029 90,596 13,221 67,594 152,277 123,709 73,613 35,770 46.8% 53.5% 59.0% 28.2% 46.1% 63.2% 52.3% 52.9% 60.7%
5 30,957 26,471 23,970 6,135 30,225 45,038 35,168 36,370 9,860 34.1% 42.9% 49.0% 19.3% 33.2% 57.2% 45.1% 37.3% 37.6%
6 81,716 58,578 65,801 15,739 76,971 113,385 101,299 83,174 21,621 43.9% 37.9% 60.0% 22.1% 38.5% 63.2% 44.4% 48.0% 43.9%
7 97,843 73,426 52,314 13,791 102,262 107,530 111,467 78,977 33,139 43.1% 43.0% 49.2% 17.6% 41.2% 60.6% 44.0% 43.3% 48.7%
8 101,015 117,227 123,600 15,537 117,683 208,622 178,410 119,024 44,408 45.2% 48.1% 59.7% 21.6% 44.6% 61.6% 48.9% 50.8% 59.3%
9 62,530 61,996 50,294 9,484 66,997 98,339 100,044 55,162 19,614 48.9% 40.7% 61.4% 23.0% 41.3% 61.9% 47.1% 49.1% 52.0%
10 33,784 55,413 45,677 10,446 46,092 78,335 78,871 39,061 16,942 41.7% 42.4% 57.3% 28.1% 37.6% 59.5% 45.0% 47.5% 49.8%
11 57,129 75,091 50,767 9,181 76,467 97,339 107,809 55,552 19,626 46.3% 51.9% 55.7% 22.1% 46.9% 62.9% 52.8% 48.0% 50.0%
12 42,002 46,155 78,703 12,215 53,084 101,562 83,254 66,710 16,897 45.7% 43.0% 64.7% 27.6% 43.6% 65.6% 50.2% 56.2% 46.9%
15 52,464 56,509 48,003 10,203 54,913 91,859 88,274 50,718 17,984 46.5% 47.4% 54.6% 24.0% 40.6% 64.5% 50.5% 46.4% 50.1%
16 125,771 92,981 73,393 21,532 101,803 168,810 155,819 101,877 34,449 48.5% 41.8% 50.7% 24.5% 37.6% 63.0% 46.9% 46.5% 45.4%
17 79,398 56,273 35,613 14,988 65,401 90,894 85,499 67,540 18,245 42.6% 44.8% 47.0% 19.0% 40.4% 62.0% 46.3% 42.5% 41.3%
18 58,759 51,844 42,735 10,068 58,157 85,112 80,820 56,595 15,922 44.9% 43.8% 51.0% 20.1% 42.1% 58.7% 49.5% 43.1% 41.3%
19 48,995 32,994 33,049 9,331 44,328 61,378 57,906 44,971 12,160 45.2% 39.5% 53.2% 19.6% 44.4% 57.6% 45.6% 43.5% 51.3%
20 78,867 57,784 43,713 16,537 65,715 98,111 88,731 72,593 19,040 48.5% 46.8% 55.1% 27.8% 42.2% 65.2% 48.4% 50.9% 48.1%
21 61,010 47,273 49,039 12,689 62,856 81,777 71,728 67,038 18,556 48.0% 38.8% 54.0% 29.6% 42.9% 54.4% 43.7% 48.7% 48.9%
22 70,557 75,851 53,201 23,547 74,169 101,893 99,795 72,997 26,817 45.5% 44.2% 50.0% 27.7% 41.3% 60.5% 46.0% 44.7% 50.8%
23 84,096 53,671 76,521 12,973 63,317 137,998 99,918 91,580 22,790 53.7% 45.6% 61.6% 26.7% 45.9% 65.1% 52.0% 55.8% 53.8%
Nat’l 1,344,660 1,238,151 1,225,590 261,530 1,354,503 2,192,369 1,946,922 1,403,639 457,840
46.1% 44.3% 56.1% 23.8% 41.7% 61.9% 48.1% 48.0% 49.9% Denominator is the enrollee population by Priority, Age or Income by VISN
Office of the ADUSH for Policy and Planning
A-25 2011 Survey of Veteran Enrollees' Health and Reliance Upon VA

Table 6.3 Recent Quitters by Priority, Age, and Income
VISN Priority Age Income
1 - 3 4 - 6 7 - 8 <45 45-64 65+ <$36K $36K+ DK/Ref
1 17,008 21,370 14,245 8,058 28,603 15,963 32,931 16,199 3,494 15.1% 20.7% 12.2% 21.1% 24.8% 8.9% 19.9% 12.6% 9.1%
2 10,922 14,678 6,822 5,653 17,398 9,373 18,485 11,985 1,953 19.5% 20.4% 9.9% 24.0% 22.0% 9.9% 18.5% 15.8% 9.2%
3 15,015 19,104 17,925 7,543 25,878 18,624 25,732 20,613 5,699 18.9% 22.7% 12.3% 25.5% 22.9% 11.2% 19.9% 15.0% 13.4%
4 17,854 31,259 13,402 11,110 28,665 22,740 43,109 15,772 3,634 15.3% 19.0% 8.7% 23.7% 19.6% 9.4% 18.2% 11.3% 6.2%
5 13,810 13,969 6,989 5,691 20,875 8,202 18,732 12,775 3,260 15.2% 22.6% 14.3% 17.9% 23.0% 10.4% 24.0% 13.1% 12.4%
6 30,505 27,430 9,039 13,006 36,670 17,298 39,099 23,034 4,842 16.4% 17.7% 8.2% 18.3% 18.3% 9.6% 17.1% 13.3% 9.8%
7 38,829 32,472 10,739 12,164 50,812 19,064 51,611 24,891 5,538 17.1% 19.0% 10.1% 15.6% 20.5% 10.7% 20.4% 13.6% 8.1%
8 34,396 47,729 19,408 13,966 54,595 32,972 71,864 22,839 6,830 15.4% 19.6% 9.4% 19.4% 20.7% 9.7% 19.7% 9.7% 9.1%
9 23,843 32,115 7,946 10,897 37,244 15,763 43,472 16,873 3,558 18.6% 21.1% 9.7% 26.5% 23.0% 9.9% 20.5% 15.0% 9.4%
10 16,061 29,619 7,841 14,065 27,859 11,598 37,970 10,836 4,716 19.8% 22.7% 9.8% 37.9% 22.7% 8.8% 21.7% 13.2% 13.9%
11 23,633 33,528 14,573 9,427 45,648 16,659 47,008 17,627 7,099 19.2% 23.2% 16.0% 22.7% 28.0% 10.8% 23.0% 15.2% 18.1%
12 17,981 20,895 16,197 11,564 29,044 14,465 30,488 20,259 4,326 19.6% 19.5% 13.3% 26.1% 23.9% 9.3% 18.4% 17.1% 12.0%
15 21,069 31,531 9,684 11,573 36,060 14,650 39,882 17,153 5,248 18.7% 26.4% 11.0% 27.2% 26.7% 10.3% 22.8% 15.7% 14.6%
16 44,231 53,195 15,311 19,899 63,455 29,383 73,163 29,577 9,997 17.0% 23.9% 10.6% 22.6% 23.4% 11.0% 22.0% 13.5% 13.2%
17 33,153 26,145 10,333 20,821 35,040 13,770 43,767 20,265 5,599 17.8% 20.8% 13.6% 26.3% 21.6% 9.4% 23.7% 12.8% 12.7%
18 18,118 29,124 7,273 11,441 27,379 15,696 30,994 18,878 4,643 13.8% 24.6% 8.7% 22.9% 19.8% 10.8% 19.0% 14.4% 12.1%
19 15,975 15,536 8,956 11,044 20,175 9,248 25,018 12,709 2,739 14.7% 18.6% 14.4% 23.2% 20.2% 8.7% 19.7% 12.3% 11.6%
20 23,638 26,566 7,143 10,041 32,944 14,362 33,336 18,152 5,860 14.5% 21.5% 9.0% 16.9% 21.2% 9.6% 18.2% 12.7% 14.8%
21 18,992 24,800 5,870 10,108 26,928 12,627 32,035 14,516 3,112 15.0% 20.4% 6.5% 23.6% 18.4% 8.4% 19.5% 10.6% 8.2%
22 22,046 37,519 12,503 20,176 38,455 13,438 42,575 23,010 6,483 14.2% 21.9% 11.7% 23.7% 21.4% 8.0% 19.6% 14.1% 12.3%
23 20,756 20,775 13,780 11,536 24,384 19,391 29,094 21,288 4,928 13.2% 17.7% 11.1% 23.8% 17.7% 9.2% 15.1% 13.0% 11.6%
Nat’l 477,836 589,359 235,981 249,780 708,109 345,287 810,365 389,251 103,560 16.4% 21.1% 10.8% 22.7% 21.8% 9.7% 20.0% 13.3% 11.3%
Denominator is the enrollee population by Priority, Age or Income by VISN
Office of the ADUSH for Policy and Planning
A-26 2011 Survey of Veteran Enrollees' Health and Reliance Upon VA

Table 6.4 Enrollees Who Never Smoked by Priority, Age, and Income
VISN Priority Age Income
1 - 3 4 - 6 7 – 8 <45 45-64 65+ <$36K $36K+ DK/Ref
1 37,589 33,918 31,381 18,129 33,390 51,368 46,804 43,799 12,285 33.4% 32.9% 26.9% 47.4% 29.0% 28.7% 28.3% 34.1% 32.1%
2 16,128 21,815 21,684 11,238 20,031 28,357 26,825 26,744 6,058 28.8% 30.3% 31.4% 47.7% 25.4% 30.0% 26.8% 35.3% 28.6%
3 26,160 28,263 56,467 15,485 40,972 54,433 41,180 54,169 15,542 32.9% 33.5% 38.8% 52.4% 36.3% 32.6% 31.8% 39.4% 36.6%
4 37,810 37,418 52,245 19,429 37,632 70,413 65,567 45,225 16,681 32.5% 22.7% 34.0% 41.5% 25.7% 29.2% 27.7% 32.5% 28.3%
5 44,894 18,870 18,034 19,429 35,547 26,823 22,132 48,193 11,473 49.4% 30.6% 36.9% 61.0% 39.1% 34.1% 28.4% 49.5% 43.8%
6 71,175 58,866 30,535 39,813 71,495 49,268 73,877 66,016 20,684 38.2% 38.1% 27.8% 56.0% 35.7% 27.5% 32.4% 38.1% 42.0%
7 88,143 51,066 41,057 47,692 83,443 49,132 82,492 75,157 22,617 38.9% 29.9% 38.6% 61.0% 33.6% 27.7% 32.6% 41.2% 33.2%
8 84,174 67,187 63,245 43,079 73,220 98,308 101,519 93,420 19,668 37.7% 27.5% 30.6% 59.9% 27.8% 29.0% 27.8% 39.9% 26.2%
9 35,453 38,952 23,594 16,021 40,805 41,173 49,258 36,647 12,094 27.7% 25.5% 28.8% 38.9% 25.2% 25.9% 23.2% 32.6% 32.1%
10 26,493 36,139 25,237 14,272 36,467 37,130 46,052 30,374 11,443 32.7% 27.7% 31.7% 38.5% 29.7% 28.2% 26.3% 37.0% 33.6%
11 38,502 30,936 28,951 19,571 34,933 43,884 45,259 39,550 13,580 31.2% 21.4% 31.8% 47.2% 21.4% 28.4% 22.2% 34.2% 34.6%
12 30,470 27,329 31,413 17,702 29,924 41,587 41,628 35,674 11,909 33.2% 25.5% 25.8% 40.0% 24.6% 26.9% 25.1% 30.0% 33.0%
15 34,922 24,714 27,603 18,192 30,793 38,254 40,914 35,840 10,485 31.0% 20.7% 31.4% 42.7% 22.8% 26.9% 23.4% 32.8% 29.2%
16 83,999 57,193 52,594 40,320 85,102 68,364 83,789 83,644 26,352 32.4% 25.7% 36.3% 45.8% 31.4% 25.5% 25.2% 38.2% 34.7%
17 68,342 36,656 27,359 41,835 50,330 40,192 50,011 65,034 17,312 36.7% 29.2% 36.1% 52.9% 31.1% 27.4% 27.1% 41.0% 39.2%
18 47,990 32,932 33,686 27,543 43,602 43,464 44,689 54,407 15,513 36.7% 27.8% 40.2% 55.1% 31.6% 30.0% 27.4% 41.4% 40.3%
19 42,598 31,387 21,330 26,424 31,937 36,953 41,760 45,119 8,435 39.3% 37.6% 34.3% 55.6% 32.0% 34.7% 32.9% 43.6% 35.6%
20 55,352 31,631 24,592 30,267 43,461 37,847 48,540 50,709 12,326 34.0% 25.6% 31.0% 50.9% 27.9% 25.2% 26.5% 35.6% 31.1%
21 44,291 38,121 31,178 19,895 42,883 50,812 48,636 50,879 14,075 34.9% 31.3% 34.3% 46.4% 29.3% 33.8% 29.6% 37.0% 37.1%
22 57,103 54,550 39,364 39,943 61,326 49,748 69,737 65,587 15,693 36.8% 31.8% 37.0% 46.9% 34.1% 29.6% 32.1% 40.2% 29.7%
23 48,358 33,778 34,589 19,282 39,369 58,074 55,104 49,127 12,494 30.9% 28.7% 27.9% 39.7% 28.5% 27.4% 28.7% 29.9% 29.5%
Nat’l 1,019,947 791,722 716,138 545,562 966,660 1,015,585 1,125,772 1,095,313 306,721
35.0% 28.3% 32.8% 49.7% 29.7% 28.7% 27.8% 37.4% 33.4% Denominator is the enrollee population by Priority, Age or Income by VISN
Office of the ADUSH for Policy and Planning
A-27 2011 Survey of Veteran Enrollees' Health and Reliance Upon VA

Table 6.5 Enrollees Who Ever Smoked by Priority, Age, and Income
VISN Priority Age Income
1 - 3 4 - 6 7 – 8 <45 45-64 65+ <$36K $36K+ DK/Ref
1 74,927 69,160 85,124 20,135 81,733 127,343 118,511 84,655 26,045 66.6% 67.1% 73.1% 52.6% 71.0% 71.3% 71.7% 65.9% 67.9%
2 39,806 50,086 47,474 12,303 58,906 66,157 73,334 48,923 15,110 71.2% 69.7% 68.6% 52.3% 74.6% 70.0% 73.2% 64.7% 71.4%
3 53,290 56,058 89,085 14,049 71,922 112,463 88,389 83,147 26,898 67.1% 66.5% 61.2% 47.6% 63.7% 67.4% 68.2% 60.6% 63.4%
4 78,568 127,127 101,249 27,425 108,902 170,616 170,856 93,872 42,215 67.5% 77.3% 66.0% 58.5% 74.3% 70.8% 72.3% 67.5% 71.7%
5 45,978 42,877 30,892 12,432 55,365 51,950 55,812 49,213 14,721 50.6% 69.4% 63.1% 39.0% 60.9% 65.9% 71.6% 50.5% 56.2%
6 115,059 95,782 79,164 31,320 128,660 130,025 154,110 107,311 28,583 61.8% 61.9% 72.2% 44.0% 64.3% 72.5% 67.6% 61.9% 58.0%
7 138,678 119,563 65,309 30,526 164,590 128,433 170,667 107,437 45,446 61.1% 70.1% 61.4% 39.0% 66.4% 72.3% 67.4% 58.8% 66.8%
8 139,207 176,750 143,680 28,866 190,484 240,287 263,382 140,977 55,278 62.3% 72.5% 69.4% 40.1% 72.2% 71.0% 72.2% 60.1% 73.8%
9 92,443 113,508 58,281 25,093 121,513 117,626 162,951 75,662 25,619 72.3% 74.5% 71.2% 60.9% 74.9% 74.1% 76.8% 67.4% 67.9%
10 54,548 94,527 54,485 22,840 86,215 94,505 129,193 51,779 22,588 67.3% 72.3% 68.3% 61.5% 70.3% 71.8% 73.7% 63.0% 66.4%
11 84,845 113,793 62,170 21,882 128,121 110,806 159,040 76,072 25,696 68.8% 78.6% 68.2% 52.8% 78.6% 71.6% 77.8% 65.8% 65.4%
12 61,406 79,912 90,196 26,585 91,775 113,155 124,256 83,131 24,126 66.8% 74.5% 74.2% 60.0% 75.4% 73.1% 74.9% 70.0% 67.0%
15 77,889 94,623 60,369 24,379 104,391 104,111 133,970 73,478 25,433 69.0% 79.3% 68.6% 57.3% 77.2% 73.1% 76.6% 67.2% 70.8%
16 175,501 165,434 92,199 47,728 185,997 199,409 248,126 135,433 49,575 67.6% 74.3% 63.7% 54.2% 68.6% 74.5% 74.8% 61.8% 65.3%
17 117,991 88,932 48,453 37,238 111,725 106,412 134,741 93,756 26,878 63.3% 70.8% 63.9% 47.1% 68.9% 72.6% 72.9% 59.0% 60.8%
18 82,945 85,337 50,117 22,434 94,517 101,449 118,537 76,854 23,009 63.3% 72.2% 59.8% 44.9% 68.4% 70.0% 72.6% 58.6% 59.7%
19 65,850 52,091 40,771 21,116 67,952 69,645 85,089 58,369 15,255 60.7% 62.4% 65.7% 44.4% 68.0% 65.3% 67.1% 56.4% 64.4%
20 107,243 91,928 54,748 29,337 112,067 112,515 134,824 91,818 27,277 66.0% 74.4% 69.0% 49.3% 72.0% 74.8% 73.5% 64.4% 68.9%
21 82,732 83,622 59,658 23,016 103,474 99,522 115,439 86,670 23,902 65.1% 68.7% 65.7% 53.6% 70.7% 66.2% 70.4% 63.0% 62.9%
22 98,048 116,949 67,058 45,196 118,289 118,569 147,275 97,713 37,067 63.2% 68.2% 63.0% 53.1% 65.9% 70.4% 67.9% 59.8% 70.3%
23 108,366 83,877 89,564 29,230 98,722 153,853 137,003 114,939 29,864 69.1% 71.3% 72.1% 60.3% 71.5% 72.6% 71.3% 70.1% 70.5%
Nat’l 1,895,323 2,001,933 1,470,045 553,131 2,285,319 2,528,850 2,925,504 1,831,212 610,585
65.0% 71.7% 67.2% 50.3% 70.3% 71.3% 72.2% 62.6% 66.6% Denominator is the enrollee population by Priority, Age or Income by VISN
Office of the ADUSH for Policy and Planning
A-28 2011 Survey of Veteran Enrollees' Health and Reliance Upon VA

Table 6.6 Enrollees Who Reported Recently Trying to Quit by 'Current' and 'Former Smokers'
VISN Enrollee Population
Total Recent Quitters
Percent Enrollee
Population
Total Current Smokers
Percent Enrollee
Population
Total Former Smokers
Percent Enrollee
Population 1 332,099 52,624 15.8% 56,138 16.9% 173,073 52.1% 2 196,993 32,423 16.5% 41,534 21.1% 95,833 48.6% 3 309,324 52,045 16.8% 44,851 14.5% 153,583 49.7% 4 434,417 62,515 14.4% 73,852 17.0% 233,091 53.7% 5 201,544 34,768 17.3% 38,348 19.0% 81,398 40.4% 6 450,582 66,974 14.9% 83,910 18.6% 206,095 45.7% 7 503,816 82,040 16.3% 99,967 19.8% 223,583 44.4% 8 674,243 01,533 15.1% 117,795 17.5% 341,842 50.7% 9 362,231 63,903 17.6% 89,412 24.7% 174,820 48.3%
10 291,429 53,521 18.4% 68,687 23.6% 134,874 46.3% 11 359,197 71,734 20.0% 77,822 21.7% 182,987 50.9% 12 320,726 55,073 17.2% 64,654 20.2% 166,860 52.0% 15 320,121 62,283 19.5% 75,905 23.7% 156,976 49.0% 16 626,920 112,737 18.0% 140,988 22.5% 292,145 46.6% 17 387,732 69,631 18.0% 84,092 21.7% 171,284 44.2% 18 333,009 54,515 16.4% 65,063 19.5% 153,337 46.0% 19 254,027 40,467 15.9% 43,675 17.2% 115,038 45.3% 20 365,494 57,347 15.7% 73,555 20.1% 180,364 49.3% 21 339,602 49,663 14.6% 68,690 20.2% 157,322 46.3% 22 433,072 72,069 16.6% 82,446 19.0% 199,609 46.1% 23 398,531 55,311 13.9% 67,517 16.9% 214,289 53.8%
Nat’l 7,895,108 1,303,176 16.5% 1,558,900 19.7% 3,808,401 48.2% Table 6.7 Current and Former Smokers Who Have Recently Tried to Quit
VISN Current Smokers Number Percent 'Current Smoker' Population Former Smokers Number Percent 'Former
Smoker' Population 1 34,452 61.4% 18,172 10.5% 2 22,694 54.6% 9,729 10.2% 3 29,139 65.0% 22,905 14.9% 4 37,914 51.3% 24,600 10.6% 5 24,303 63.4% 10,464 12.9% 6 48,414 57.7% 18,560 9.0% 7 57,489 57.5% 24,551 11.0% 8 67,425 57.2% 34,108 10.0% 9 49,117 54.9% 14,786 8.5%
10 38,266 55.7% 15,256 11.3% 11 47,264 60.7% 24,470 13.4% 12 33,596 52.0% 21,477 12.9% 15 42,161 55.5% 20,122 12.8% 16 84,932 60.2% 27,805 9.5% 17 52,821 62.8% 16,810 9.8% 18 39,576 60.8% 14,939 9.7% 19 28,346 64.9% 12,121 10.5% 20 39,773 54.1% 17,574 9.7% 21 35,310 51.4% 14,353 9.1% 22 47,098 57.1% 24,971 12.5% 23 34,392 50.9% 20,919 9.8%
Nat’l 894,484 57.4% 408,692 10.7%
Office of the ADUSH for Policy and Planning
A-29 2011 Survey of Veteran Enrollees' Health and Reliance Upon VA

This page intentionally left blank.
Office of the ADUSH for Policy and Planning
A-30 2011 Survey of Veteran Enrollees' Health and Reliance Upon VA

(CATI) SURVEY OF VETERAN ENROLLEES’ HEALTH AND RELIANCE UPON VA
2011 Survey of Enrollees Survey Instrument (Jan 2011)
INTENDED AUDIENCE: Priority 1 through 8 Veterans who have applied or are currently enrolled for VA health care services. PROGRAMMER NOTE: Interviewers will leave messages about the study on respondent answering machines. The CATI script should prompt interviewers to leave a message every third time. Display the following message: "Hi, I am calling for <respondents name> to complete the VA health survey. Please call 1-888-871-0345 and refer to Masterid xxxxxxxxx to schedule an appointment to complete a survey." ///PROGRAMMER: START TIMER1/// ///ASK ALL/// INTRO. Hello, my name is <interviewer first and last name.> I’m calling on behalf of VA, the Department of Veteran Affairs. May I speak with <INSERT NAME>? 01 RESPONDENT AVAILABLE ///SKIP TO INTRO2A/// 02 RESPONDENT NOT AVAILABLE ///SKIP TO CB1/// 03 RESPONDENT UNABLE TO DO INTERVIEW PHYSICAL/MENTAL HEALTH REASON///SKIP TO PROXY/// 04 DO NOT KNOW RESPONDENT/DO NOT RECOGNIZE NAME – 05 RESPONDENT NOT AT NUMBER ///SKIP TO BADNUM/// 06 TERMINATION SCREEN ///ASK IF INTRO=05/// BADNUM. Do you have a telephone number where I might be able to reach <INSERT NAME>? 01 YES – MAKE NEW NUMBER DISPOSITION, COLLECT TELEPHONE NUMBER ///TERM AS DISPO 186/// 02 NO –///TERM/// ///ASK IF INTRO=01/// INTRO2A. We are conducting a survey on behalf of VA about Veterans’ use of health care services and needs. You may have recently received a letter from Dr. Petzel, the Under Secretary for Health for the Department of Veteran Affairs, inviting you to participate in this survey. Your name was randomly selected from a list of Veterans who enrolled to use VA health care services. This survey will take 10-20 minutes. 01 YES, CONTINUE //GO TO INTRO2AA// 02 REQUESTED CALLBACK ///SKIP TO CB1/// 03 RESPONDENT HESITATES/NEED MORE INFORMATION ///CONTINUE TO INTRO2B/// 04 RESPONDENT DID NOT RECEIVE LETTER //RESPONDENT HESITATES/NEEDS MORE
INFORMATION/CONTINUE TO INTRO2B// ///ASK IF INTRO2A IN (03,04)///
Office of the ADUSH for Policy and Planning
B-1 2011 Survey of Veteran Enrollees' Health and Reliance Upon VA

(CATI) SURVEY OF VETERAN ENROLLEES’ HEALTH AND RELIANCE UPON VA
INTRO2B. IF NECESSARY MORE INFORMATION: This survey is about how many Veterans use VA services and what types of services they do or do not use. IF NECESSARY CONFIDENTIALITY: Your name and answers will be linked. However, VA will protect your identity and answers to the extent allowed under the law. Your answers will in no way affect your benefits. No information that you provide will be released to the general public in a way that can be traced back to you. ONLY IF LEGITIMACY IS QUESTIONED READ: This survey has been reviewed and approved by the VHA Office of the Assistant Deputy Under Secretary for Health for Policy and Planning and the Office of Management and Budget. If you have any questions regarding the legitimacy of this survey, you may call the Department of Veterans Affairs in Washington, D.C. at 1-877-222-8387. 01 YES, CONTINUE 02 REQUESTED CALLBACK ///GO TO CB1/// ///ASK IF INTRO2A=01 OR INTRO2B=01/// INTRO2AA. Everything we talk about will be confidential, although this call may be monitored and recorded for quality assurance. Your participation is voluntary – you can choose not to answer any question or end the survey at anytime without an explanation. Your benefits will not change as a result of your answering any questions. If you choose not to participate, or answer a question, your benefits will also not be affected. However, your participation is important for this survey’s success – we need to talk to Veterans like you. Would now be a good time? *** INTERVIEWER: IF RESPONDENT HESITATES OR NEED MORE INFO – ENTER “01” – YES, CONTINUE. 01 YES, CONTINUE //GO TO SECTION A// 02 REQUESTED CALLBACK ///ASK IF INTRO=03/// PROXY We are conducting a survey about Veterans’ use of health care services and needs. <INSERT NAME> may have recently received a letter from Dr. Petzel, the Under Secretary for Health for the Department of Veteran Affairs, inviting <INSERT NAME> to participate in this survey. <INSERT NAME> was randomly selected from a list of Veterans who enrolled to use VA health care services. This is an important survey, would you be able to answer questions about <INSERT NAME>’s health care, insurance and health status? IF NECESSARY MORE INFORMATION: This survey is about how many Veterans use VA services and what types of services they do or do not use. IF NECESSARY CONFIDENTIALITY: <INSERT NAME>’s name and answers will be linked. However, VA will protect <INSERT NAME>’s identity and answers to the extent allowed under the law. Your answers will in no way affect <INSERT NAME>’s benefits. No information that you provide will be released to the general public in a way that can be traced back to <INSERT NAME>. ONLY IF LEGITIMACY IS QUESTIONED READ: This survey has been reviewed and approved by the VHA Office of the Assistant Deputy Under Secretary for Health for Policy and Planning and the Office of Management and Budget. If you have any questions regarding the legitimacy
Office of the ADUSH for Policy and Planning
B-2 2011 Survey of Veteran Enrollees' Health and Reliance Upon VA

(CATI) SURVEY OF VETERAN ENROLLEES’ HEALTH AND RELIANCE UPON VA
of this survey, you may call the Department of Veterans Affairs in Washington, D.C. at 1-877-222-8387. 01 YES, CONTINUE //GO TO PROXY2// 02 NO ///TERM/// 01 YES – CREATE VARIABLE “PROXY= 01 IF PROXY INTERVIEW AND 00 IF NOT PROXY” 02 NO – TERMINATE CREATE DISPOSITION NO ELIGIBLE PROXY, RESPONDENT UNABLE ///ASK IF PROXY=01/// PROXY2. This survey will take 10-20 minutes. Everything we talk about will be confidential, although this call may be monitored and recorded for quality assurance. Your participation on behalf of <INSERT NAME> is voluntary – you can choose not to answer any question or end the survey at anytime without an explanation. <INSERT NAME> benefits will not change as a result of your answering any questions. If you choose not to participate, or answer a question, <INSERT NAME> benefits will also not be affected. However, your participation on behalf of <INSERT NAME> is important for this survey’s success – we need to talk to Veterans like <INSERT NAME>. Would now be a good time? ***INTERVIEWER: IF RESPONDEN HESITATES OR NEED MORE INFO – ENTER “01” – YES. CONTINUE. IF NECESSARY CONFIDENTIALITY: <INSERT NAME>’s name and answers will be linked. However, VA will protect <INSERT NAME>’s identity and answers to the extent allowed under the law. Your answers will in no way affect <INSERT NAME>’s benefits. No information that you provide will be released to the general public in a way that can be traced back to <INSERT NAME>. 01 YES 02 NO ///GO TO CB1/// ///ASK IF PROXY2=01/// PROXY3. IF NECESSARY MORE INFORMATION: This survey is about how many Veterans use VA services and what types of services they do or do not use. IF NECESSARY CONFIDENTIALITY: <INSERT NAME>’s name and answers will be linked. However, VA will protect <INSERT NAME>’s identity and answers to the extent allowed under the law. Your answers will in no way affect <INSERT NAME>’s benefits. No information that you provide will be released to the general public in a way that can be traced back to <INSERT NAME> . ONLY IF LEGITIMACY IS QUESTIONED READ: This survey has been reviewed and approved by the VHA Office of the Assistant Deputy Under Secretary for Health for Policy and Planning and the Office of Management and Budget. If you have any questions regarding the legitimacy of this survey, you may call the Department of Veterans Affairs in Washington, D.C. at 1-877-222-8387.
Office of the ADUSH for Policy and Planning
B-3 2011 Survey of Veteran Enrollees' Health and Reliance Upon VA

(CATI) SURVEY OF VETERAN ENROLLEES’ HEALTH AND RELIANCE UPON VA
01 YES 02 NO ///SKIP TO CB1/// ///ASK IF PROXY=01/// RESIDE Does <INSERT NAME> still live at this telephone number or somewhere else? 01 STILL AT LOCATION 02 DIFFERENT LOCATION 98 DON’T KNOW 99 REFUSED ///ASK IF RESIDE IN (02,98,99) RESIDE_1 In what state does <INSERT NAME> live? /PROVIDE LIST OF STATE NAMES, INCLUDE PR/ 98 DON’T KNOW 99 REFUSED ///ASK IF PROXY=01/// RELATION Before we begin, could you tell me how you would describe your relationship to <INSERT NAME>? I am going to read you a list. Are you <INSERT NAME>’s… (READ LIST) 01 Spouse 02 Significant other 03 Parent 04 Sibling 05 Child 06 Some other relative 07 Friend
08 Caregiver 09 Guardian or Attorney 10 Social Worker or Case Worker 97 Some other relation 98 DON’T KNOW 99 REFUSED
///ASK IF INTRO=02 OR INTRO2A=02 OR INTRO2AA=02 OR CB1. When may we call back? ///PROGRAMMER: END TIMER1/// ///PROGRAMMER: START TIMER2/// A: Health Insurance Module ///ASK IF INTRO2AA=01 OR PROXY2=01/// PRETA. Many of the following questions may be simply answered as either yes or no. However, if you are unsure about it, just let me know and I will note that. /IF PROXY=01 ALSO ASK/ Please remember when answering that we are talking about <INSERT NAME> I would like to first ask about health care benefits ……. ///ASK IF INTRO2AA=01 OR PROXY2=01/// PREA1. Are you enrolled in VA health care? /IF PROXY=01/ Is <INSERT NAME> enrolled in VA Health care?
Office of the ADUSH for Policy and Planning
B-4 2011 Survey of Veteran Enrollees' Health and Reliance Upon VA

(CATI) SURVEY OF VETERAN ENROLLEES’ HEALTH AND RELIANCE UPON VA
01 YES 02 NO 03 I DON’T REMEMBER ENROLLING 98 DON’T KNOW 99 REFUSED
///ASK IF INTRO2AA=01 OR PROXY2=01/// A1. Are you covered by Medicare? /IF PROXY=01ASK/ Is <INSERT NAME> covered by Medicare?
01 YES 02 //SKIP TO A7// NO 98 //SKIP TO A7// DON’T KNOW 99 //SKIP TO A7// REFUSED
///ASK IF A1=01/// A2. Did you choose to receive your Medicare coverage through a Medicare Advantage Plan
and not through the Original Medicare Plan? Medicare Advantage Plans include Medicare HMOs (Health Maintenance Organizations), Medicare PPOs (Preferred Provider Organizations), Medicare Special Needs Plans, and Medicare Private Fee-for-Service Plans.
//IF PROXY=01ASK// Did <INSERT NAME> choose to receive Medicare coverage through a Medicare Advantage Plan and not through the Original Medicare Plan? Medicare Advantage Plans include Medicare HMOs (Health Maintenance Organizations), Medicare PPOs (Preferred Provider Organizations), Medicare Special Needs Plans, and Medicare Private Fee-for-Service Plans. 01 //SKIP TO A6// YES 02 NO 98 DON’T KNOW 99 REFUSED
///ASK IF A2 IN (02,98,99) A3. Does your Medicare coverage pay for care if you are hospitalized? //IF PROXY=01ASK// Does <INSERT NAME>’s Medicare coverage pay for care if hospitalized?
[INTERVIEWER NOTE: This type of Medicare is also sometimes called "Part A"; if they have it, there is generally no premium because they or a spouse paid for it through payroll taxes while they were working.]
01 YES 02 NO 98 DON’T KNOW 99 REFUSED
///ASK IF A2 IN (02,98,99) A4. Does your Medicare coverage pay for doctor's office visits?
Office of the ADUSH for Policy and Planning
B-5 2011 Survey of Veteran Enrollees' Health and Reliance Upon VA

(CATI) SURVEY OF VETERAN ENROLLEES’ HEALTH AND RELIANCE UPON VA
//IF PROXY=01ASK// Does <INSERT NAME>’s Medicare coverage pay for doctor’s office visits?
[INTERVIEWER NOTE: This type of Medicare is also sometimes called "Part B"; if they have it, they generally pay a monthly fee or premium which may be directly deducted from their Social Security check.] 01 YES 02 NO 98 DON’T KNOW 99 REFUSED
///ASK IF A2 IN (02,98,99) A5. Do you purchase any private health care coverage to supplement Medicare; that is to
pay for services Medicare does not pay for? //IF PROXY=01ASK// Does <INSERT NAME> purchase any private health care
coverage to supplement Medicare; that is to pay for services Medicare does not pay for? [IINTERVIEWER NOTE DO NOT READ: "YES" - TYPES OF PRIVATE INSURANCE A
PERSON CAN PURCHASE TO SUPPLEMENT MEDICARE INCLUDE MEDIGAP OR MEDICARE SUPPLEMENT. DOES NOT INCLUDE MEDICARE ADVANTAGE OR MEDICARE + CHOICE.]
[INTERVIEWER NOTE DO NOT READ: "NO" - A TYPE OF INSURANCE THAT DOES
NOT COUNT IS THE DEPARTMENT OF DEFENSE'S TRICARE FOR LIFE PLAN FOR MEDICARE ELIGIBLE MILITARY RETIREES.] 01 YES 02 NO 98 DON’T KNOW 99 REFUSED
///ASK IF A1=01/// A6. Do you have Medicare prescription drug coverage, "Part D"? //IF PROXY=01ASK// Does <INSERT NAME> have Medicare prescription drug
coverage, "Part D?” 01 YES 02 NO 98 DON’T KNOW 99 REFUSED
///ASK IF INTRO2AA=01 OR PROXY2=01/// A7. Are you currently covered by Medicaid for any of your health care? //IF PROXY=01ASK// Is <INSERT NAME> currently covered by Medicaid for any of his
or her health care?
[IF NECESSARY: Medicaid is a program that pays for Medical Assistance for certain individuals with low incomes and resources and is provided by your State governments' social services department.]
Office of the ADUSH for Policy and Planning
B-6 2011 Survey of Veteran Enrollees' Health and Reliance Upon VA

(CATI) SURVEY OF VETERAN ENROLLEES’ HEALTH AND RELIANCE UPON VA
[INTERVIEWER NOTE: "Medical Assistance" = "Medicaid" in some States.] //RECALL LIST FROM 2005 FOR STATE MEDICAID PLAN NAME//
01 YES 02 NO 98 DON’T KNOW 99 REFUSED
///ASK IF INTRO2AA=01 OR PROXY2=01/// A8. Are you currently covered by the Department of Defense's TRICARE or TRICARE for
Life health care programs? //IF PROXY=01ASK// Is <INSERT NAME> covered by the Department of Defense's
TRICARE or TRICARE for Life health care programs? 01 YES 02 NO 98 DON’T KNOW 99 REFUSED
///ASK IF INTRO2AA=01 OR PROXY2=01/// A9. Are you currently covered by any other individual or group health plan, that either you, or
an employer, or someone else, such as a family member obtains for you? //IF PROXY=01ASK// Is <INSERT NAME> currently covered by any other individual or
group health plan that either <INSERT NAME>, or an employer, or someone else, such as a family member obtains for <INSERT NAME>?
[INTERVIEWER NOTE DO NOT READ: "YES" - DO COUNT ANY PRIVATE RETIREE
HEALTH INSURANCE PLAN.] [INTERVIEWER NOTE DO NOT READ: "NO" - DO NOT COUNT PRIVATE MEDIGAP,
MEDICARE SUPPLEMENT, MEDICARE ADVANTAGE, OR MEDICARE + CHOICE PLANS.]
01 YES 02 //SKIP TO A13// NO 98 //SKIP TO A13// DON’T KNOW 99 //SKIP TO A13// REFUSED
///ASK IF A9=01/// A10. Who provides this coverage? If more than one source applies, please indicate the
primary source.
[INTERVIEWER: READ LIST CAN ONLY SELECT ONE]
01 Current employer, including COBRA coverage 02 Former employer 03 Individually purchased coverage 04 Federal, State, County, or local community health services program 05 Family member, such as a spouse, parent, etc. 97 Or from somewhere else? (SPECIFY)
Office of the ADUSH for Policy and Planning
B-7 2011 Survey of Veteran Enrollees' Health and Reliance Upon VA

(CATI) SURVEY OF VETERAN ENROLLEES’ HEALTH AND RELIANCE UPON VA
98 DON’T KNOW 99 REFUSED
///ASK IF A10=97/ // A10_O. Who provides this coverage?
01 //TEXT RESPONSE// 98 DON’T KNOW 99 REFUSED
///ASK IF A10_O=01/// A10_V [INTERVIEWER: CAN YOUR SPECIFY RESPONSE BE CODED USING THE LIST BELOW IF YES, SELECT NOW. 01 Current employer, including COBRA coverage 02 Former employer 03 Individually purchased coverage 04 Federal, State, County, or local community health services program 05 Family member, such as a spouse, parent, etc. 96 NO, UNIQUE RESPONSE ///ASK IF A9=01/// A11. Does this coverage include prescription drug coverage?
01 YES 02 NO 98 DON’T KNOW 99 REFUSED
///ASK IF A9=01/// A12. Is this coverage provided through an HMO or other managed care organization?
[IF NECESSARY: An HMO or Health Maintenance Organization or other managed care coverage requires you to use certain doctors, hospitals, and other providers. If you use health care services or providers who are not in the plan, you pay more, or all of the cost for that health care.]
01 YES 02 NO 98 DON’T KNOW 99 REFUSED
///ASK IF INTRO2AA=01 OR PROXY2=01/// A13. Do you currently have a prescription drug benefit from VA? //IF PROXY=01ASK// Does <INSERT NAME> currently have a have prescription drug
benefit from VA?
01 YES
Office of the ADUSH for Policy and Planning
B-8 2011 Survey of Veteran Enrollees' Health and Reliance Upon VA

(CATI) SURVEY OF VETERAN ENROLLEES’ HEALTH AND RELIANCE UPON VA
02 NO 98 DON’T KNOW 99 REFUSED
///ASK IF INTRO2AA=01 OR PROXY2=01/// A14A. How many different over the counter medications did you use in the last 30 days?
//IF PROXY=01ASK// How many different over the counter medications did <INSERT NAME> use in the last 30 days?
[IF NECESSARY: Your best guess is fine.]
________ [0 – 50] 98 DON’T KNOW 99 REFUSED
///ASK IF A14A NOT IN (0, 98, 99) /// A14B. Of these over the counter medications, how many did you obtain from VA?
//IF PROXY=01ASK// Of these over the counter medications, how many did <INSERT NAME> obtain from VA?
[INTERVIEWER NOTE: THESE MEDICATIONS COME FROM SOME VA FACILITY OR THROUGH THE MAIL FROM VA. DOES NOT REFER TO MEDICATIONS WHERE A RESPONDENT IS REIMBURSED FOR THE OUT OF POCKET COSTS.]
[IF NECESSARY: Your best guess is fine.] ________ [0 – 50]
98 DON’T KNOW 99 REFUSED
///ASK IF INTRO2AA=01 OR PROXY2=01/// A15A. How many different prescription medications did you use in the last 30 days?
//IF PROXY=01ASK// How many different prescription medications did <INSERT NAME> use in the last 30 days?
[IF NECESSARY: Your best guess is fine.] ________ [0 – 50]
98 DON’T KNOW 99 REFUSED
///ASK IF A15A NOT IN (0, 98, 99)/// A15B. Of these prescription medications, how many did you obtain from VA?
//IF PROXY=01ASK// Of these prescription medications, how many did <INSERT NAME> obtain from VA?
[INTERVIEWER NOTE: THESE MEDICATIONS COME FROM SOME VA FACILITY OR THROUGH THE MAIL FROM VA. DOES NOT REFER TO MEDICATIONS WHERE A RESPONDENT IS REIMBURSED FOR THE OUT OF POCKET COSTS.]
[IF NECESSARY: Your best guess is fine.]
Office of the ADUSH for Policy and Planning
B-9 2011 Survey of Veteran Enrollees' Health and Reliance Upon VA
(CATI) SURVEY OF VETERAN ENROLLEES’ HEALTH AND RELIANCE UPON VA
________ [0 – 50]
98 DON’T KNOW 99 REFUSED
///ASK IF INTRO2AA=01 OR PROXY2=01/// PA16. On average, how much do you spend out-of-pocket for all your over the counter and
prescription medications on a monthly basis, not including any health insurance premiums you may pay?
//IF PROXY=01ASK// On average, how much does <INSERT NAME> spend out-of-pocket for all <INSERT NAME>’s over the counter and prescription medications on a monthly basis, not including any health insurance premiums <INSERT NAME> may pay? [IF NECESSARY: Your best guess is fine.]
01 GAVE RESPONSE 98 DON’T KNOW 99 REFUSED ///ASK IF PA16=01/// A16. On average, how much do you spend out-of-pocket for all your over the counter and
prescription medications on a monthly basis, not including any health insurance premiums you may pay?
//IF PROXY=01ASK// On average, how much does <INSERT NAME> spend out-of-pocket for all <INSERT NAME>’s over the counter and prescription medications on a monthly basis, not including any health insurance premiums <INSERT NAME> may pay?
[IF NECESSARY: Your best guess is fine.]
________ ENTER NUMBER [0 – 9999] ///PROGRAMMER: END TIMER2/// ///PROGRAMMER: START TIMER3/// Section B: Reliance on VA ///ASK IF INTRO2AA=01 OR PROXY2=01/// PREB1. Next, I will be asking you about use of medical health services in 2010 from both Non-VA sources, as well as from VA. First, my questions are about Non-VA provided Health Care Services.
/IF PROXY=01/ Next, I will be asking you about <INSERT NAME>’s use of medical or mental health services in 2010 from both Non-VA sources, as well as from VA. First, my questions are about Non-VA provided Health Care Services.
///ASK IF SPLIT=1, ELSE SKIP TO B11B/// B11A. In 2010, how many outpatient visits or trips, did you make to any Non-VA doctor’s office, hospital, or outpatient clinic? Please do not count dental, mental health, substance abuse visits or any visits paid for by VA?
Office of the ADUSH for Policy and Planning
B-10 2011 Survey of Veteran Enrollees' Health and Reliance Upon VA

(CATI) SURVEY OF VETERAN ENROLLEES’ HEALTH AND RELIANCE UPON VA
/IF PROXY=01/ In 2010, how many outpatient visits or trips, did <INSERT NAME> make to any Non-VA doctor’s office, hospital, or outpatient clinic? Please do not count dental, mental health, substance abuse visits or any visits paid for by VA?
[INTERVIEWER NOTE: PAID FOR INCLUDES ANY PART/PORTION OF.] [IF NECESSARY: Your best guess is fine.] 01 ENTER NUMBER [RANGE=0- 366] 998 DON’T KNOW 999 REFUSED ///ASK IF SPLIT=2, ELSE SKIP TO B22/// B11B. From October through December 2010, how many outpatient visits or trips, did you make to any Non-VA doctor’s office, hospital, or outpatient clinic? Please do not count dental, mental health, substance abuse visits or any visits paid for by VA? /IF PROXY=01/ From October through December 2010, how many outpatient visits or
trips, did <INSERT NAME> make to any Non-VA doctor’s office, hospital, or outpatient clinic? Please do not count dental, mental health, substance abuse visits or any visits paid for by VA? [IF NECESSARY: Your best guess is fine.]
[INTERVIEWER NOTE: PAID FOR INCLUDES ANY PART/PORTION OF.] 01 ENTER NUMBER [RANGE=0- 366] 998 DON’T KNOW 999 REFUSED PREB22 Now, the next few questions are in regards to any VA provided Health care. ///ASK IF SPLIT=1, ELSE SKIP TO B22B/// B22A. In 2010, how many outpatient visits or trips did you make that were paid for by VA? That
would include the number of times you went to a VA doctor, hospital or clinic for medical care or received medical care somewhere else that was paid for by VA. Do not count dental or mental health visits or trips to a pharmacy. [IF NECESSARY: Your best guess is fine.] /IF PROXY=01/ In 2010, how many outpatient visits or trips did <INSERT NAME> make that were paid for by VA? That would include the number of times <INSERT NAME> went to a VA doctor, hospital or clinic for medical care or received medical care somewhere else that was paid for by VA. Do not count dental or mental health visits or trips to a pharmacy. [INTERVIEWER NOTE: PAID FOR INCLUDES ANY PART/PORTION OF.]
01 ENTER NUMBER [RANGE=0-366] 998 DON’T KNOW 999 REFUSED
Office of the ADUSH for Policy and Planning
B-11 2011 Survey of Veteran Enrollees' Health and Reliance Upon VA
(CATI) SURVEY OF VETERAN ENROLLEES’ HEALTH AND RELIANCE UPON VA
///ASK IF SPLIT=2, ELSE SKIP TO B25/// B22B. From October through December 2010, how many outpatient visits or trips did you
make that were paid for by VA? That would include the number of times you went to a VA doctor, hospital or clinic for medical care or received medical care somewhere else that was paid for by VA. Do not count dental or mental health visits or trips to a pharmacy. [IF NECESSARY: Your best guess is fine.] /IF PROXY=01/ From October through December 2010, how many outpatient visits or trips did <INSERT NAME> make that were paid for by VA? That would include the number of times <INSERT NAME> went to a VA doctor, hospital or clinic for medical care or received medical care somewhere else that was paid for by VA. Do not count dental or mental health visits or trips to a pharmacy. [INTERVIEWER NOTE: PAID FOR INCLUDES ANY PART/PORTION OF.]
01 ENTER NUMBER [RANGE=0-366] 998 DON’T KNOW 999 REFUSED ///ASK IF INTRO2AA=01 OR PROXY2=01/// B25. I am going to read you a list of possible ways you could use VA for your health care in
the future. Please listen to them all, and then tell me the one that best describes the primary way you plan to use VA health care in the future. Do you plan to use VA as….
/IF PROXY=01/ I am going to read you a list of possible ways <INSERT NAME> could use VA for health care in the future. Please listen to them all, and then tell me the one that best describes the primary way <INSERT NAME> plans to use VA health care in the future. Does <INSERT NAME> plan to use VA as [INTERVIEWER: PLEASE READ ENTIRE LIST. CHOOSE ONLY ONE. IF RESPONDENT WILL NOT PICK ONE, ENTER INTO “OTHER” BOTH RESPONSES]
01 Your primary source of health care; /IF PROXY=01/ a primary source of health care 02 Backup to non-VA care for some minor services /IF PROXY=01/ As backup to non-VA care for some minor services 03 A “safety net” to use only if needed 04 For prescriptions; 05 For specialized care 06 Some other way; 07 Or do you have No plans to use VA for health care /IF PROXY=01/ Or does <INSERT NAME> have no plans to use VA for health care? 98 DON’T KNOW 99 REFUSED
///ASK IF B25=06/// B25_O. Could you please tell me how you primarily plan to use VA for health care in the future?
Office of the ADUSH for Policy and Planning
B-12 2011 Survey of Veteran Enrollees' Health and Reliance Upon VA

(CATI) SURVEY OF VETERAN ENROLLEES’ HEALTH AND RELIANCE UPON VA
/IF PROXY=01/ Could you please tell me how <INSERT NAME> primarily plans to use VA for health care in the future?
///ASK IF B25_O=01/// B25_V. [INTERVIEWER: CAN YOUR SPECIFY RESPONSE BE CODED USING THE LIST BELOW IF YES, SELECT NOW. 01 Your primary source of health care;
/IF PROXY=01/ a primary source of health care 02 Backup to non-VA care for some minor services
/IF PROXY=01/ As backup to non-VA care for some minor services 03 A “safety net” to use only if needed 04 For prescriptions; 05 For specialized care 96 NO, UNIQUE RESPONSE ///PROGRAMMER: END TIMER3/// ///ASK IF INTRO2AA=01 OR PROXY2=01/// C1. Please tell me how you would complete the following statement…. I use VA services to meet…. ///IF PROXY=01/// Please tell me how <INSERT NAME> would complete the following
statement… [INTERVIEWER PLEASE READ LIST]
01 All of my health care needs 02 Most of my health care needs 03 Some of my health care needs 04 None of my health care needs 05 I have no healthcare needs 98 DON’T KNOW 99 REFUSED
///PROGRAMMER: START TIMER4/// Section D: Key Drivers ///ASK ALL RESPONDENTS/// ///ASK IF INTRO2AA=01 OR PROXY2=01/// PRED5 I am now going to read you a list of statements and I would like you to tell me for each
statement if you completely agree, agree, neither agree nor disagree, disagree, or completely disagree.
/IF PROXY=01/ I’m going to read you a list of statements and I would like you to tell me for each
statement if <INSERT NAME> completely agrees, agrees, neither agrees nor disagrees, disagrees, or completely disagrees.
///ASK D12B:D12G IF INTRO2AA=01 OR PROXY2=01///
Office of the ADUSH for Policy and Planning
B-13 2011 Survey of Veteran Enrollees' Health and Reliance Upon VA

(CATI) SURVEY OF VETERAN ENROLLEES’ HEALTH AND RELIANCE UPON VA
Quality //ROTATE// D12b Veterans like me who use VA are satisfied with the health care they receive. D12g VA health care providers treat their patients with respect. Would you… (READ LIST)?
01 Completely Agree 02 Agree 03 Neither agree nor disagree 04 Disagree 05 Completely Disagree 98 DON’T KNOW 99 REFUSED
//END ROTATE// ///ASK D11A:D11C IF INTRO2AA=01 OR PROXY2=01/// Cost //ROTATE// D11a VA is the most cost-effective health care provider for Veterans like me. D11c VA offers Veterans like me the best value for our health care dollar. Would you… (READ LIST)?
01 Completely Agree 02 Agree 03 Neither agree nor disagree 04 Disagree 05 Completely Disagree 98 DON’T KNOW 99 REFUSED
//END ROTATE// ///ASK D13B:D13C IF INTRO2AA=01 OR PROXY2=01/// Availability and Accessibility of Services //ROTATE// D13b Veterans like me can get in and out of an appointment at VA in a reasonable time. D13c When Veterans like me go to VA for an appointment; they do not wait a long time
to see the doctor. Would you… (READ LIST)?
01 Completely Agree 02 Agree 03 Neither agree nor disagree 04 Disagree 05 Completely Disagree 98 DON’T KNOW 99 REFUSED
Office of the ADUSH for Policy and Planning
B-14 2011 Survey of Veteran Enrollees' Health and Reliance Upon VA

(CATI) SURVEY OF VETERAN ENROLLEES’ HEALTH AND RELIANCE UPON VA
//END ROTATE// ///ASK D13E:D13F IF INTRO2AA=01 OR PROXY2=01/// Convenience of Location //ROTATE// D13e There is a VA provider in my area that offers all of the health care services that
Veterans like me need. D14a It is easy for Veterans like me to get around in the VA health care facility. D15f It is easy to get to my local VA facility. Would you… (READ LIST)?
01 Completely Agree 02 Agree 03 Neither agree nor disagree 04 Disagree 05 Completely Disagree 98 DON’T KNOW 99 REFUSED
//END ROTATE// ///ASK D10C IF INTRO2AA=01 OR PROXY2=01/// Other Factors: Friends Using VA Services //ROTATE// D10c Veterans like me like going to VA because you can talk to other Veterans. Would you… (READ LIST)?
01 Completely Agree 02 Agree 03 Neither agree nor disagree 04 Disagree 05 Completely Disagree 98 DON’T KNOW 99 REFUSED
//END ROTATE// ///ASK D14C:D14D IF INTRO2AA=01 OR PROXY2=01/// Knowledge of VA Health Benefits //ROTATE// D14c I feel I know what is available to me through my VA benefits. D14d I understand how my VA health benefits work. Would you… (READ LIST)?
01 Completely Agree 02 Agree 03 Neither agree nor disagree 04 Disagree 05 Completely Disagree
Office of the ADUSH for Policy and Planning
B-15 2011 Survey of Veteran Enrollees' Health and Reliance Upon VA

(CATI) SURVEY OF VETERAN ENROLLEES’ HEALTH AND RELIANCE UPON VA
98 DON’T KNOW 99 REFUSED
///ASK D16D:D16E IF INTRO2AA=01 OR PROXY2=01/// Availability of NON-VA Health Care Alternatives //ROTATE// D16d I have a doctor outside VA who I really like and trust. D16e My family has a health insurance plan that covers me and the rest of the family. Would you… (READ LIST)?
01 Completely Agree 02 Agree 03 Neither agree nor disagree 04 Disagree 05 Completely Disagree 98 DON’T KNOW 99 REFUSED
//END ROTATE// ///ASK D16C AND D16F IF INTRO2AA=01 OR PROXY2=01/// Other Issues //ROTATE// D16c I would only use VA if I did not have access to any other source of health care. D16f Veterans who can afford to use other sources of health care should leave the VA
to those who really need it. ///ASK IF C1 NE 01/// D16b If the cost of health care to me increases, I will use VA more. Would you… (READ LIST)?
01 Completely Agree 02 Agree 03 Neither agree nor disagree 04 Disagree 05 Completely Disagree 98 DON’T KNOW 99 REFUSED
//END ROTATE// ///PROGRAMMER: END TIMER4/// ///PROGRAMMER: START TIMER5/// Section E: Demographics ///ASK IF INTRO2AA=01 OR PROXY2=01/// PREE1. Now, I’d like to ask you about your current health.
/IF PROXY=01/ Now, I’d like to ask you about <INSERT NAME>’s current health. ///ASK IF INTRO2AA=01 OR PROXY2=01/// E1. Compared to other people your age, would you say your health is:
Office of the ADUSH for Policy and Planning
B-16 2011 Survey of Veteran Enrollees' Health and Reliance Upon VA

(CATI) SURVEY OF VETERAN ENROLLEES’ HEALTH AND RELIANCE UPON VA
/IF PROXY=01/ Compared to other people <INSERT NAME>’s age, would you say <INSERT NAME>’s health is:
[INTERVIEWER PLEASE READ LIST] 01 Excellent 02 Very good 03 Good 04 Fair, or 05 Poor 98 DON’T KNOW 99 REFUSED
///ASK IF INTRO2AA=01 OR PROXY2=01/// PREE2. The next few questions are about cigarette smoking. ///ASK IF INTRO2AA=01 OR PROXY2=01/// E2. Have you smoked at least 100 cigarettes in your entire life?
/IF PROXY=01/ Has <INSERT NAME> smoked at least 100 cigarettes in <INSERT NAME>’s entire life?
01 YES 02 (SKIP TO PREE5) NO 98 DON’T KNOW 99 REFUSED ///ASK IF E2 in (01,98,99)/// E3. Do you now smoke cigarettes every day, some days, or not at all?
/IF PROXY=01/ Does <INSERT NAME> now smoke cigarettes every day, some days, or not at all?
01 Every day 02 Some days 03 Not at all 98 DON’T KNOW 99 REFUSED ///ASK IF E2 in (01,98,99)/// E4. During the past 12 months, have you stopped smoking for more than one day because you were trying to quit smoking?
/IF PROXY=01/ During the past 12 months, has <INSERT NAME> stopped smoking for more than one day because <INSERT NAME> was trying to quit smoking?
[INTERVIEWER: IF THE RESPONDENT MENTIONS: “I quit smoking more than a year ago/over 12 months ago/longer than a year ago, etc… CODE RESPONSE AS “NO”]
Office of the ADUSH for Policy and Planning
B-17 2011 Survey of Veteran Enrollees' Health and Reliance Upon VA

(CATI) SURVEY OF VETERAN ENROLLEES’ HEALTH AND RELIANCE UPON VA
01 YES 02 NO 98 DON’T KNOW 99 REFUSED ///ASK IF INTRO2AA=01 OR PROXY2=01/// PREE5 We are almost finished. The last questions are for demographic purposes only. ///ASK IF INTRO2AA=01 OR PROXY2=01///
E5. Which of the following best describes your current marital status? /IF PROXY=01/ Which of the following best describes <INSERT NAME>’s current marital status? [INTERVIEWER READ LIST.]
01 Married 02 Widowed 03 Divorced 04 Separated 05 Single – Never Married 98 DON’T KNOW 99 REFUSED ///ASK IF INTRO2AA=01 OR PROXY2=01///
E6. ///IF E5 IN (01,04)/// Not including yourself, how many dependents, such as your spouse or dependent children do you currently have? /IF E5 NE 01 OR 04 ASK/ Not including yourself, how many dependents, do you currently have? /IF PROXY=01AND E5=01 OR 04 ASK/ Not including <INSERT NAME>, how many dependents, such as a spouse or dependent children does <INSERT NAME> currently have? /IF PROXY=01 AND E5 NE 01 OR 04 ASK/ Not including <INSERT NAME>, how many dependents, does <INSERT NAME> currently have? [INTERVIEWER NOTE: “DEPENDENT” IS ANYONE WHO RELIES ON THE RESPONDENT FOR AT LEAST HALF OF THAT PERSON’S FINANCIAL SUPPORT.]
01 ENTER NUMBER [RANGE=0-97] 98 DON’T KNOW 99 REFUSED PERIOD OF SERVICE ///ASK IF INTRO2AA=01 OR PROXY2=01///
Office of the ADUSH for Policy and Planning
B-18 2011 Survey of Veteran Enrollees' Health and Reliance Upon VA

(CATI) SURVEY OF VETERAN ENROLLEES’ HEALTH AND RELIANCE UPON VA
PREE6A. In the following, we would like to obtain some information on your active duty military history. Most Veterans have served only one continuous tour of duty, with no breaks in service. A one time discharge from the military after continuous service is one term of service. However, some Veterans have experienced breaks in service and thus have served multiple terms of service. /IF PROXY=01/ In the following, we would like to obtain some information on <INSERT NAME>’s active duty military history. Most Veterans have served only one continuous tour of duty, with no breaks in service. A one time discharge from the military after continuous service is one term of service. However, some Veterans have experienced breaks in service and thus have served multiple terms of service.
///ASK IF INTRO2AA=01 OR PROXY2=01///
E6A. How many terms of active duty military service have you served? Please do not include Reserve or National Guard training or drill periods unless “activated” at the time.
/IF PROXY=01/ How many terms of active duty military service has <INSERT NAME> served? Please do not include Reserve or National Guard training or drill periods unless “activated” at the time. [INTERVIEWER NOTE: WE ARE ONLY RECORDING THE FIRST SIX PERIODS.] ENTER NUMBER [1-6] 98 (SKIP TO E8) DON’T KNOW 99 (SKIP TO E8) REFUSED
///ASK IF E6A NOT IN (98,99)/// E6AT. /IFE6A >1/I would like to ask you the year you started and ended each of these terms of
active duty military service. Starting with your first…
/IF E6A=1/ I would like to ask you the year you started and ended this term of active duty military service. /IF PROXY=01/I would like to ask you the year <INSERT NAME> started and ended each of these terms of active duty military service. Starting with <INSERT NAME’s> first… /IF PROXY=01 and E6=1/I would like to ask you the year <INSERT NAME> started and ended this term of active duty military service.
/START LOOP EQUAL TO E6A/ ///ASK IF E6A NOT IN (98,99)/// //E6B_1=1ST PERIOD; E6B_2=2ND PERIOD; E6B_3=3RD PERIOD…UP TO E6B_6=6TH
PERIOD// E6B_1. What year did your <first> term of active duty military service start?
/IF E6A=1/ What year did your term of active duty military service start? /IF PROXY=01/ What year did <INSERT NAME>’s <first> term of active duty military service start?
Office of the ADUSH for Policy and Planning
B-19 2011 Survey of Veteran Enrollees' Health and Reliance Upon VA

(CATI) SURVEY OF VETERAN ENROLLEES’ HEALTH AND RELIANCE UPON VA
/IF PROXY=01 and E6A=1/ What year did <INSERT NAME>’s term of active duty military service start?
01 ENTER YEAR [RANGE: >=1918] 9998 DON’T KNOW 9999 REFUSED ///ASK IF E6A NOT IN (98,99)/// //E6C_1=1ST PERIOD; E6C_2=2ND PERIOD; E6C_3=3RD PERIOD…UP TO E6C_6=6TH
PERIOD// E6C_1. What year did your <first> term of active duty military service end?
/IF E6A=1/ What year did your term of active duty military service end? /IF PROXY=01/ What year did <INSERT NAME>’s <first> term of active duty military service end? /IF PROXY=01 and E6A=1/ What year did <INSERT NAME>’s term of active duty military service end?
01 ENTER YEAR [RANGE: >=1918] 9998 DON’T KNOW 9999 REFUSED COMBAT STATUS ///ASK IF E6A NOT IN (98,99)/// //E7_1=1ST PERIOD; E7_2=2ND PERIOD; E7_3=3RD PERIOD…UP TO E7_6=6TH PERIOD// E7_1. During this term of military service were you ever in or exposed to combat?
/IF PROXY=01/ During this term of military service was <INSERT NAME> ever in or exposed to combat?
01 YES 02 NO 98 DON’T KNOW 99 REFUSED /END LOOP/ EMPLOYMENT STATUS ///ASK IF INTRO2AA=01 OR PROXY2=01///
E8. How would you best characterize your employment status? I am going to read you a list. Please listen to all of the choices and then tell me which best describes you. Are you … [INTERVIEWERNOTE: IF RESPONDENT IS ON VACATION OR LEAVE, PLEASE ASK HOW THE RESPONDENT WOULD NORMALLY DESCRIBE HIS/HER EMPLOYMENT STATUS.]
Office of the ADUSH for Policy and Planning
B-20 2011 Survey of Veteran Enrollees' Health and Reliance Upon VA

(CATI) SURVEY OF VETERAN ENROLLEES’ HEALTH AND RELIANCE UPON VA
01 Employed Fulltime 02 Self-employed fulltime 03 Employed part-time 04 Self employed part-time 05 Unemployed, looking for work, or laid off 06 Currently not employed – either retired, a homemaker, student, etc. 98 DON’T KNOW 99 REFUSED ETHNICITY AND RACE ///ASK IF INTRO2AA=01 OR PROXY2=01///
E9. Would you describe yourself as Hispanic, or Latino? /IF PROXY=01/ Would you describe <INSERT NAME> as Hispanic, or Latino? 01 YES 02 NO 98 DON’T KNOW 99 REFUSED ///ASK IF INTRO2AA=01 OR PROXY2=01///
E10. I am going to read you a list, please tell me which of the following describes your race? You can choose more than one. Are you …
/IF PROXY=01/ I am going to read you a list, please tell me which of the following describes <INSERT NAME>’s race? You can choose more than one…. [INTERVIEWER NOTE: PLEASE READ LIST.]
/MUL=5/ 01 American Indian or Alaska Native 02 Asian 03 Black or African-American 04 Native Hawaiian or Other Pacific Islander 05 White 98 DON’T KNOW 99 REFUSED
HOUSEHOLD INCOME ///ASK IF INTRO2AA=01 OR PROXY2=01///
PE11. Could you please tell me what your total annual household income was from all sources in 2010.
/IF PROXY=01/ Could you please tell me what was <INSERT NAME>’s total annual household income was from all sources in 2010.
Office of the ADUSH for Policy and Planning
B-21 2011 Survey of Veteran Enrollees' Health and Reliance Upon VA

(CATI) SURVEY OF VETERAN ENROLLEES’ HEALTH AND RELIANCE UPON VA
[IF NECESSARY: I would like to remind you that everything we discuss is confidential, and that your answer to this question will not affect your benefits.] [IF NECESSARY: Your best guess or estimate is fine.]
01 GAVE RESPONSE (ANNUALLY) ///GO TO E11Y/// 02 GAVE RESPONSE (MONTHLY) ///GO TO E11M/// 98 DON’T KNOW 99 REFUSED
///ASK IF PE11=01/// E11Y. Could you please tell me what your total annual household income was from all sources in 2010.
/IF PROXY=01/ Could you please tell me what was <INSERT NAME>’s total annual household income was from all sources in 2010. [IF NECESSARY: I would like to remind you that everything we discuss is confidential, and that your answer to this question will not affect your benefits.] [IF NECESSARY: Your best guess or estimate is fine.]
[RANGE=$1 - $999,999] ///SKIP TO E11c./// ///ASK IF PE11=02/// E11M. Could you please tell me what your total annual household income was from all sources in 2010.
/IF PROXY=01/ Could you please tell me what was <INSERT NAME>’s total annual household income was from all sources in 2010. [IF NECESSARY: I would like to remind you that everything we discuss is confidential, and that your answer to this question will not affect your benefits.] [IF NECESSARY: Your best guess or estimate is fine.]
[RANGE=1-83,333] ///SKIP TO E11c./// ///CALCULATE VARIABLE E11MTOT. E11MTOT= E11M * 12/// ///ASK IF PE11 IN (98,99)/// E11a. This information is critical for VA for planning purposes. Could you please tell me which of the following best describes your 2010 total annual household income from all sources. Would you say it is….. /IF PROXY=01/ This information is critical for VA for planning purposes. Could you please tell me which of the following best describes <INSERT NAME>’s 2010 total annual household income from all sources. Would you say it is…..
(READ LIST [ROUND UP “999], THEN FOLLOW-UP AS INDICATED)
Office of the ADUSH for Policy and Planning
B-22 2011 Survey of Veteran Enrollees' Health and Reliance Upon VA

(CATI) SURVEY OF VETERAN ENROLLEES’ HEALTH AND RELIANCE UPON VA
01 Less than $16,000 02 $16,000 - $25,999, 03 $26,000 - $35,999, 04 $36,000 - $45,999, 05 $46,000 - $55,999, OR 06 $56,000 or over? 98 DON’T KNOW 99 REFUSED
///ASK IF E11A=01 E11B1. Is it…?
01 Under $11,000, or 02 $11,000 - $15,999? 98 DON’T KNOW 99 REFUSED
///ASK IF E11A=02 E11B2. Is it…?
03 $16,000 – $20,999 04 $21,000 - $25,999? 98 DON’T KNOW 99 REFUSED
///ASK IF E11A=03 E11B3. Is it…?
05 $26,000 – $30,999 06 $31,000 - $35,999? 98 DON’T KNOW 99 REFUSED
///ASK IF E11A=04 E11B4. Is it…?
07 $36,000 – $40,999 08 $41,000 - $45,999? 98 DON’T KNOW 99 REFUSED
///ASK IF E11A=05 E11B5. Is it…?
09 $46,000 – $50,999 10 $51,000 - $55,999? 98 DON’T KNOW 99 REFUSED
///ASK IF INTRO2AA=01 OR PROXY2=01/// E11c. Can you please tell me which state you are in?
Office of the ADUSH for Policy and Planning
B-23 2011 Survey of Veteran Enrollees' Health and Reliance Upon VA

(CATI) SURVEY OF VETERAN ENROLLEES’ HEALTH AND RELIANCE UPON VA
//National list of two letter abbreviations and PR for Puerto Rico// /IF PROXY=01/ Can you please tell me which state <INSERT NAME> is in? 95 OTHER 98 DON’T KNOW 99 REFUSED ///PROGRAMMER: END TIMER5/// THANKS. That’s all I have. Thank you for your participation. The information you have
provided will help VA to better serve all Veterans in the future. Thank you and goodbye.
Office of the ADUSH for Policy and Planning
B-24 2011 Survey of Veteran Enrollees' Health and Reliance Upon VA

VA Enrollment Priority Groups Fact Sheet Enrollment Priority 1 •Veterans with service-connected disabilities rated
50 percent or more disabling
Enrollment Priority 2 •Veterans with service-connected disabilities rated
30 percent or 40 percent disabling
Enrollment Priority 3 •Veterans who are former POWs •Veterans awarded the Purple Heart •Veterans whose discharge was for a disability that
was incurred or aggravated in the line of duty •Veterans with service-connected disabilities rated
10 percent or 20 percent disabling •Veterans awarded special eligibility classification
under Title 38, U.S.C., Section 1151, "benefits for individuals disabled by treatment or vocational rehabilitation"
Enrollment Priority 4 •Veterans who are receiving aid and attendance or
housebound benefits •Veterans who have been determined by VA to be
catastrophically disabled
Enrollment Priority 5 • Non-service-connected Veterans and non-
compensable service-connected Veterans rated 0 percent disabled whose annual income and net worth are below the established VA Means Test thresholds
•Veterans receiving VA pension benefits •Veterans eligible for Medicaid benefits
Enrollment Priority 6 •World War I Veterans •Mexican Border War Veterans •Veterans solely seeking care for disorders
associated with: •exposure to herbicides while serving in Vietnam;
or •exposure to ionizing radiation during atmospheric
testing or during the occupation of Hiroshima and Nagasaki; or
• for disorders associated with service in the Gulf War;
•for any illness associated with service in combat in a war after the Gulf War or during a period of hostility after November 11, 1998; or
•Compensable 0 percent service-connected Veterans
Enrollment Priority 7 •Veterans who agree to pay specified copayments
with income and/or net worth above the VA Means Test threshold and income below the HUD geographic index
•Sub-priority a: Non-compensable 0 percent service-connected Veterans who were enrolled in the VA Health Care System on a specified date and who have remained enrolled since that date
•Sub-priority c: Non-service-connected Veterans who were enrolled in the VA Health Care System on a specified date and who have remained enrolled since that date
•Sub-priority e: Non-compensable 0 percent service-connected Veterans not included in Sub-priority a above
•Sub-priority g: Non-service-connected Veterans not included in Sub-priority c above
Enrollment Priority 8 •Veterans with income and/or net worth above the
VA Means Test threshold and the HUD geographic index who agree to pay specified copayments
•Sub-priority a: Non-compensable 0 percent service connected Veterans enrolled as of January 16, 2003 and who have remained enrolled since that
•Sub-priority c: Non-service connected Veterans enrolled as of January 16, 2003 and who have remained enrolled since that date
•Sub-priority e: Non-compensable 0 percent service connected Veterans applying for enrollment after January 16, 2003
• Sub-priority g: Non-service connected Veterans applying for enrollment after January 16, 2003
Additional Information: VHA DIRECTIVE 2003- (Date) B-2 The term service-connected means, with respect to a condition or disability, that VA has determined that the condition or disability was incurred in or aggravated by military service. Some Veterans may have to agree to pay copayments to be placed in certain priority groups.
C-1Office of the ADUSH for Policy and Planning
2011 Survey of Veteran Enrollees' Health and Reliance Upon VA