2011 STATISTICAL POCKET BOOK OF THE PUNJAB
380
2011 STATISTICAL POCKET BOOK OF THE PUNJAB BUREAU OF STATISTICS GOVERNMENT OF THE PUNJAB LAHORE
Transcript of 2011 STATISTICAL POCKET BOOK OF THE PUNJAB

2011 STATISTICAL POCKET BOOK
OF THE PUNJAB
BUREAU OF STATISTICS GOVERNMENT OF THE PUNJAB
LAHORE

2011 STATISTICAL POCKET BOOK
OF THE PUNJAB
BUREAU OF STATISTICS GOVERNMENT OF THE PUNJAB
LAHORE
PREFACE
Statistical Pocket Book of the Punjab is a regular annual publication of Bureau of Statistics. It serves as a handy reference book for important Provincial Statistics. This publication contains data on almost all sectors of the Provincial economy at various administrative levels. It also includes some national data on important subjects like Major Crops, Foreign Trade, Number of Villages Electrified, Labour Force & Employment, National Accounts, Population, Prices and Transport etc.
The present issue of the publication is 34th in the series. The scope of the publication is being kept under constant review and format of the series is revised in the light of Comments of the various stakeholders and line departments so as to enhance the utility of the publication. It is hoped that data given in the booklet will prove to be useful for the administrators, planners, researchers and other users.
The co-operation extended by various Federal and Provincial Organizations and the Autonomous Bodies in supplying the relevant information is gratefully acknowledged.
Comments and suggestions for improving the format and contents of future issue of this publication will be welcome.
CH. SHAMIM RAFIQUE Director General Bureau of Statistics, Government of the Punjab 2-Begum Road, Lahore. Dated: 30th June, 2011

ii

iii
SYMBOLS AND EQUIVALENTS
- = Nil or Insignificant
N.A. = Not Available
n.a. = Not Applicable
Divn. = Division
Distt. = District
N.R. = Not Reported
N.E.S. = Not elsewhere shown
FATA = Federally Administered Tribal Areas
(p) = Provisional
( r ) = Revised
Rs. = Rupees
One Lac. = 100,000 = 100 Thousand
Ten Lacs = 1,000,000 = 1 Million
One Crore = 10,000,000 = 10 Million
Note:- In some tables, Totals may not tally with the sum of their component items due to independent rounding off totals and their component items.

iv
METRIC CONVERSION TABLE LENGTH
1 Inch = 2.539 Centimetres 1 Foot = 0.305 Metre 1 Yard = 0.914 Metre 1 Furlong = 0.201 Kilometre 1 Mile = 1.609 Kilometre 1 Nautical Mile = 1.852 Kilometres 1 Centimetre = 0.39 Inch 1 Metre = 3.2808 Feet 1 Metre = 1.09361 Yards 1 Kilometre = 4.97095 Furlongs 1 Kilometre = 0.62 Mile 1 Kilometre = 0.54 Nautical Mile 1 Cubic Metre = 35.314724 Cubic Feet 1 Square Kilometre = 0.386102 Square Mile 1 Square Kilometre = 247.1047 Acres AREA
1 Acre = 0.405 Hectare 1 Hectare = 2.4711 Acres WEIGHT
1 Chattank = 0.058 Kilogram 1 Seer = 0.933 Kilogram 1 Lb. = 0.454 Kilogram 1 Maund = 37.324 Kilogram 1 Metric Ton (2205 Lbs.) = 1000 Kilograms 1 Long Ton (2240 Lbs.) = 1016 Kilograms

v
METRIC CONVERSION TABLE - Concld. 1 Short Ton (2000 Lbs.) = 907 Kilograms 1 Ounce = 0.028 Kilogram 1 Kilogram = 17.147 Chattanks 1 Kilogram = 1.07 Seers 1 Kilogram = 2.2046 Lbs. 1 Kilogram = 0.027 Maund 1 Kilogram = 0.00098 Long Ton 1 Kilogram = 0.0011 Short Ton 1 Kilogram = 35.273 Ounces 1 Quintal = 2.6792 Maunds 1 Quintal = 100 Kilograms 1 Bale = 375 Lbs. 1 Bale = 170 Kgs. VOLUME
1 Pint = 0.568 Litre 1 Gallon (Imp.) = 4.546 Litres 1 Gallon (U.S.) = 3.785 Litres 1 Litre = 1.761 Pints 1 Litre = 0.22 Gallon (Imp.) 1 Litre = 0.264 Gallon (U.S.) 1 Barrel = 158.98 Litres
vi
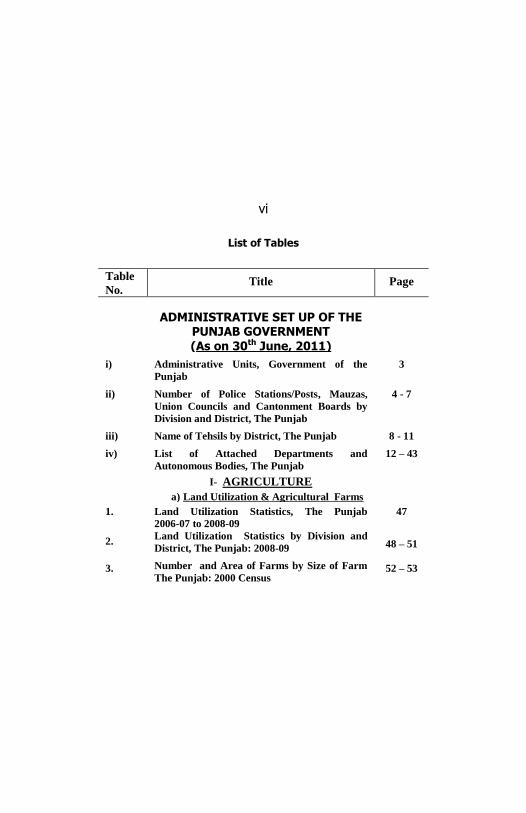
List of Tables
Table
No. Title Page
ADMINISTRATIVE SET UP OF THE PUNJAB GOVERNMENT (As on 30th June, 2011)
i) Administrative Units, Government of the
Punjab
3
ii) Number of Police Stations/Posts, Mauzas,
Union Councils and Cantonment Boards by
Division and District, The Punjab
4 - 7
iii) Name of Tehsils by District, The Punjab 8 - 11
iv) List of Attached Departments and
Autonomous Bodies, The Punjab
12 – 43
I- AGRICULTURE a) Land Utilization & Agricultural Farms 1. Land Utilization Statistics, The Punjab
2006-07 to 2008-09
47
2. Land Utilization Statistics by Division and
District, The Punjab: 2008-09 48 – 51
3. Number and Area of Farms by Size of Farm
The Punjab: 2000 Census
52 – 53

vii
Table
No. Title Page
b) Agricultural Inputs 4. Rainfall at Selected Stations
The Punjab: 2006 to 2010
54
5. Canal Withdrawals, The Punjab
2000-01 to 2009-10
55
6. Sale of Fertilizers by Type
The Punjab: 2000-01 to 2009-10
56
7. Monthly Sale of Fertilizers
The Punjab: 2005-06 to 2009-10
57
8. Sale of Fertilizers by Division and District
The Punjab: 2005-06 to 2009-10
58 – 59
9. Distribution of Indigenous Improved Seeds by
Crop, The Punjab: 2005-06 to 2009-10
60
c) Area and Production
10. Cropped Area by Crop, The Punjab: 2009-10 61
11. Number of Mauzas and Cropped Area
by Division and District, The Punjab: 2009-10
62 – 63
12. Area Sown, Un-irrigated & Irrigated by Mode of Irrigation, Division and District The Punjab: 2009-10
64 – 67
13. Area Irrigated by Mode of Irrigation
The Punjab: 2005-06 to 2009-10
68
14. Area Sown Under Major Crops by Mode of
Irrigation, The Punjab: 2005-06 to 2010-11
69 – 72

viii
Table
No. Title Page
15. Production of Important Crops, Pakistan and
The Punjab: 2008-09 and 2009-10
73 16. Area, Production and Yield-Rate of Important
Crops, The Punjab: 2005-06 to 2010-11
74 – 79 17. Area and Production of Wheat by Division
and District, The Punjab: 2009-10
80 – 81 18. Area and Production of Rice by Division and
District, The Punjab: 2009-10 and 2010-11
82 – 83 19. Area and Production of Cotton by Division
and District, The Punjab: 2009-10 and 2010-11
84 – 85 20. Area and Production of Sugarcane by Division
and District The Punjab: 2009-10 and 2010-11
86 – 87 21. Area and Production of Rice by Variety
The Punjab: 2001-02 to 2010-11
88 22. Area and Production of Various Oil Seeds
The Punjab: 2000-01 to 2009-10
89 23. Area and Production of Potato and Onion
The Punjab: 2000-01 to 2009-10
90 24. Area and Production of Pulses, Condiments
and Fodder, The Punjab: 2008-09 and
2009-10
91
25. Area and Production of Rabi Fruit
The Punjab: 2008-09 and 2009-10
92
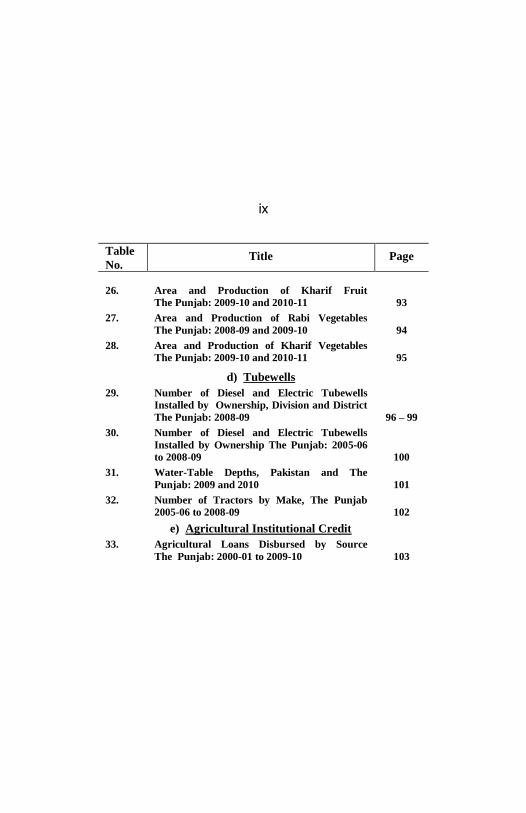
ix
Table
No. Title Page
26. Area and Production of Kharif Fruit
The Punjab: 2009-10 and 2010-11
93 27. Area and Production of Rabi Vegetables
The Punjab: 2008-09 and 2009-10
94 28. Area and Production of Kharif Vegetables
The Punjab: 2009-10 and 2010-11
95 d) Tubewells 29. Number of Diesel and Electric Tubewells
Installed by Ownership, Division and District
The Punjab: 2008-09
96 – 99 30. Number of Diesel and Electric Tubewells
Installed by Ownership The Punjab: 2005-06
to 2008-09
100 31. Water-Table Depths, Pakistan and The
Punjab: 2009 and 2010
101 32. Number of Tractors by Make, The Punjab
2005-06 to 2008-09
102 e) Agricultural Institutional Credit 33. Agricultural Loans Disbursed by Source
The Punjab: 2000-01 to 2009-10
103
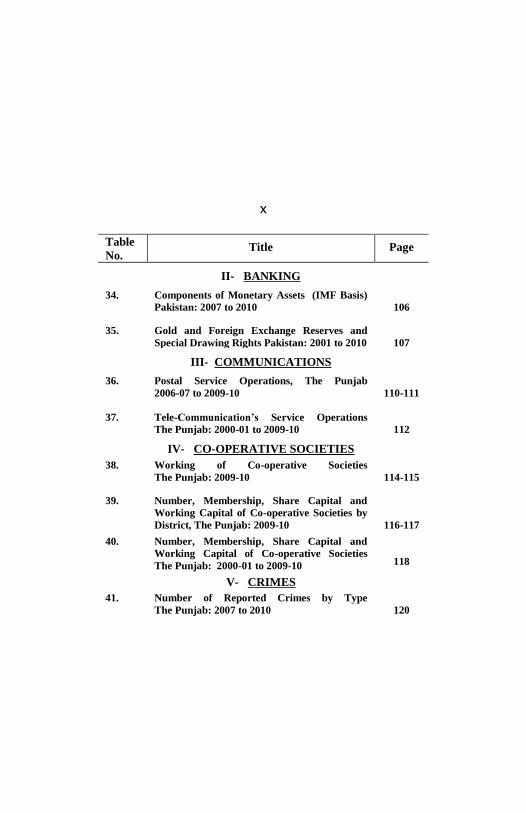
x
Table
No. Title Page
II- BANKING 34. Components of Monetary Assets (IMF Basis)
Pakistan: 2007 to 2010
106
35. Gold and Foreign Exchange Reserves and
Special Drawing Rights Pakistan: 2001 to 2010
107
III- COMMUNICATIONS 36. Postal Service Operations, The Punjab
2006-07 to 2009-10
110-111
37. Tele-Communication’s Service Operations
The Punjab: 2000-01 to 2009-10
112
IV- CO-OPERATIVE SOCIETIES
38. Working of Co-operative Societies
The Punjab: 2009-10
114-115
39. Number, Membership, Share Capital and
Working Capital of Co-operative Societies by
District, The Punjab: 2009-10
116-117 40. Number, Membership, Share Capital and
Working Capital of Co-operative Societies
The Punjab: 2000-01 to 2009-10
118 V- CRIMES 41. Number of Reported Crimes by Type
The Punjab: 2007 to 2010
120

xi
Table
No. Title Page
VI- EDUCATION 42. Number, Enrolment and Teaching Staff of
Educational Institutions, The Punjab
Academic Year 2009-10
122-128
43. Number, Enrolment and Teaching Staff of
Schools, The Punjab: 2000-01 to 2009-10
129-130 44. Number, Enrolment and Teaching Staff of
Arts and Science Colleges and Higher
Secondary Schools, The Punjab: 2000-01 to
2009-10
131-132 45. Enrolment in Arts and Science Intermediate
and Degree Colleges (Punjab Govt. Federal Govt. and Private Organizations & Higher Secondary Schools) (Punjab Govt. Pakistan Air Force and Private Organizations) by Study Group and Sex, The Punjab: 2009-10
133 46. Number, Enrolment and Teaching Staff of
Universities, The Punjab: 2000-01 to 2009-10
134-137 47. Post-Graduate Enrolment in Affiliated
Colleges, The Punjab: 2000-01 to 2009-10
138 48. Number, Enrolment and Teaching Staff of
Institute of Education and Research and Elementary Teachers Training Colleges The Punjab: 2000-01 to 2009-10
139 49. Number, Enrolment and Teaching Staff of
Professional Colleges, The Punjab: 2000-01 to
2009-10
140-147

xii
Table
No. Title Page
50. Number, Enrolment and Teaching Staff of
Technical Institutes, The Punjab: 2000-01 to
2009-10
148-150
51. Number, Enrolment and Teaching Staff in the
Special Education Institutions, The Punjab
As on 31st December, 2010
151 52. Number, Enrolment and Teaching Staff of
Govt. Mosque Schools by Division and
District, The Punjab: 2009-10
152-153 53. Number, Enrolment and Teaching Staff of
Govt. Primary Schools for Boys & Girls by
Division and District, The Punjab: 2009-10
154-157 54. Number, Enrolment and Teaching Staff of
Govt. Middle Schools for Boys & Girls by
Division and District, The Punjab: 2009-10
158-161 55. Number, Enrolment and Teaching Staff of
Govt. High Schools for Boys & Girls by
Division and District, The Punjab: 2009-10
162-165 56. Number, Enrolment & Teaching Staff of Arts
& Science Intermediate & Degree Colleges by
Division and District, The Punjab: 2009-10
166-167 57. Enrolment and Estimated Population Eligible
at Various Stages of Education by Grade
and Sex at stages I-XIV Classes,
The Punjab: 2009-10
168-171
58. Literacy Ratio by District, The Punjab 1981 and 1998 Censuses
172-173

xiii
Table
No. Title Page
59. Literacy Ratio by Sex Urban/Rural Areas (Population: 10 years and Above), The Punjab: 1998 and 2009-10
174 VII- FISHERIES 60. Fish Production (Quantity and Value) by
Area, The Punjab: 2005-06 to 2009-10
176 VIII- FOODGRAINS
61. Procurement of Wheat by PASSCO and Food
Department, The Punjab: 2001-02 to 2010-11
179 62. Procurement of Wheat by Food Department
on Voluntary Basis by District, The Punjab
2006-07 to 2010-11
180-181
63. Offtake (Releases) of Wheat by Division &
District, The Punjab: 2005-06 to 2009-10
182-183
64. Foodgrains Storage Capacity with Food
Department by Division & District, The
Punjab As on 30th June, 2010
184-185 65. Wheat Imports into Pakistan and Receipts of
Imported Wheat in The Punjab: 2000-01 to
2009-10
186 66. Sugar Production and Stocks, The Punjab
2000-01 to 2009-10
187

xiv
Table
No. Title Page
IX- FOREIGN TRADE
67. Quantum Indices of Imports and Exports 2007-08 to 2009-10
190-191
68. Balance of Trade, Pakistan: 2000-01 to
2009-10
192 69. Exports and Imports by Economic Category
Pakistan: 2006-07 to 2009-10
193 70. Pakistan’s Exports and Imports by Principal
Country: 2008-09 and 2009-10
194-195 71. Imports and Exports by Commodity Group
Pakistan: 2008-09 and 2009-10
196 X- FORESTRY
72. Forest Area by Administrative Jurisdiction
and Enactment, The Punjab: 2009-10
198–201 73. Timber and Firewood Production (Quantity
and Value), The Punjab: 2000-01 to 2009-10
202 XI- FUEL AND POWER 74. Installed Generating Capacity of Power
Stations, National Grid WAPDA: 2005-06 to
2009-10
204-206 75. Gas Consumption by Consumer Group
The Punjab: 2000-01 to 2009-10
207
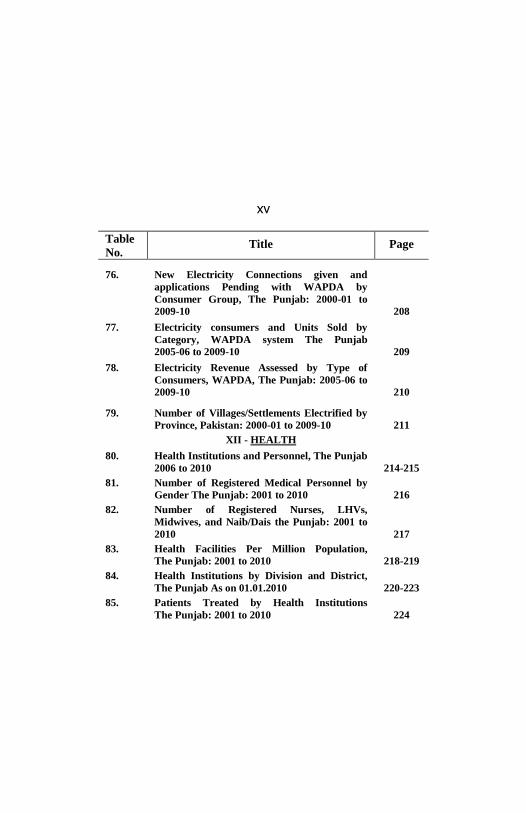
xv
Table
No. Title Page
76. New Electricity Connections given and
applications Pending with WAPDA by
Consumer Group, The Punjab: 2000-01 to
2009-10
208 77. Electricity consumers and Units Sold by
Category, WAPDA system The Punjab
2005-06 to 2009-10
209 78. Electricity Revenue Assessed by Type of
Consumers, WAPDA, The Punjab: 2005-06 to
2009-10
210 79. Number of Villages/Settlements Electrified by
Province, Pakistan: 2000-01 to 2009-10
211 XII - HEALTH 80. Health Institutions and Personnel, The Punjab
2006 to 2010
214-215 81. Number of Registered Medical Personnel by
Gender The Punjab: 2001 to 2010
216 82. Number of Registered Nurses, LHVs,
Midwives, and Naib/Dais the Punjab: 2001 to
2010
217 83. Health Facilities Per Million Population,
The Punjab: 2001 to 2010
218-219 84. Health Institutions by Division and District,
The Punjab As on 01.01.2010
220-223 85. Patients Treated by Health Institutions
The Punjab: 2001 to 2010
224
xvi
Table
No. Title Page
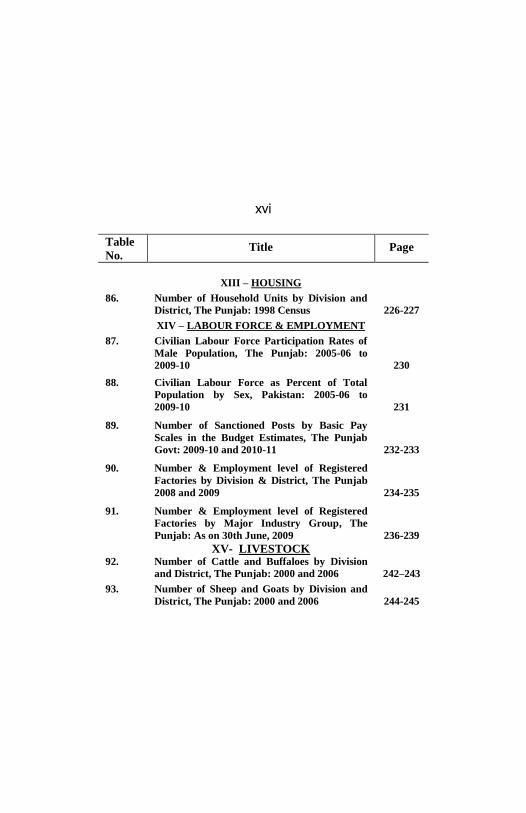
XIII – HOUSING 86. Number of Household Units by Division and
District, The Punjab: 1998 Census
226-227 XIV – LABOUR FORCE & EMPLOYMENT 87. Civilian Labour Force Participation Rates of
Male Population, The Punjab: 2005-06 to
2009-10
230 88. Civilian Labour Force as Percent of Total
Population by Sex, Pakistan: 2005-06 to
2009-10
231 89. Number of Sanctioned Posts by Basic Pay
Scales in the Budget Estimates, The Punjab
Govt: 2009-10 and 2010-11
232-233 90. Number & Employment level of Registered
Factories by Division & District, The Punjab
2008 and 2009
234-235 91. Number & Employment level of Registered
Factories by Major Industry Group, The
Punjab: As on 30th June, 2009
236-239
XV- LIVESTOCK
92. Number of Cattle and Buffaloes by Division
and District, The Punjab: 2000 and 2006
242–243 93. Number of Sheep and Goats by Division and
District, The Punjab: 2000 and 2006
244-245

xvii
Table
No. Title Page
94. Number of Veterinary Hospitals Dispensaries
and Centers by Division and District, The
Punjab: 2009-10
246–247
95. Number of Livestock, The Punjab
2000 and 2006
248 96. Animals Slaughtered in Recognized and
Un-Recognized Slaughter Houses by Type
The Punjab: 2005-06 to 2009-10
249 XVI – MANUFACTURING INDUSTRIES 97. Average Monthly Employment in 22 Selected
Large-Scale Industries The Punjab: 2009-10
252 98. Industrial Production of Selected Large-Scale
Industries, The Punjab: 2008-09 and 2009-10
253-255 99. Production of Major Manufactured Items
Pakistan and The Punjab: 2009-10
256 100. Index of Industrial Production, The Punjab
2006-07 to 2009-10
257 101. Summary Statistics of Census of
Manufacturing Industries by Major Industry
Group, The Punjab: 2005-06
258-263 102. Summary Statistics of Census of
Manufacturing Industries by District
The Punjab: 2005-06
264-267

xviii
Table
No. Title Page
103. Number of Registered Factories by Division
and District, The Punjab: 2009
268-269 104. Number of Registered Factories by Major
Industry Group, The Punjab: 2009
270-273 105. Summary Statistics of Censuses of
Manufacturing Industries, The Punjab
1991-92 to 2005-06
274 106. Industry-wise Loans Disbursed by Pakistan
Industrial Credit and Investment Corporation
Limited in the Punjab: 2005-06 to 2009-10
275 XVII- MINING 107. Mineral Production by District,
The Punjab: 2009-10
278-279 108. Mineral Production, The Punjab: 2006-07 to
2009-10
280 XVIII– NATIONAL ACCOUNTS 109. Gross National Product, Pakistan
(At Constant Factor Cost of 1999-00) 2008-09
to 2010-11
282-283 110. Gross National Product, Pakistan (At Current
Factor Cost) 2008-09 to 2010-11
284-285

xix
Table
No. Title Page
111. Sectoral Shares in Gross Domestic Product
(GDP) – Pakistan 2008-09 to 2010-11
286 XIX – POPULATION 112. Area, Population and Density by Province
Pakistan: 1972, 1981 and 1998 Censuses
288-289 113. Population and Percentage of Population by
Province, Pakistan: 1951, 1961, 1972, 1981 and
1998 Censuses
290 114. Estimated Population, The Punjab: 2002 to
2011
291 115. Area, Population and Density by Division and
District, The Punjab: 1981 and 1998 Censuses
292-293 116. Estimated Population by Division and District,
The Punjab: 2011
294-295 117. Population by Division and District and Sex
The Punjab: 1998 Census
296-297
118. Population by Urban and Rural Area, Division
and District, The Punjab 1981 and 1998
Censuses
298-299 119. Area and Population by Tehsil, The Punjab
1981 and 1998 Censuses
300-306 120. Population by Age-Group, The Punjab: 1998
Census
307 121. Population by Religion, Urban and Rural
Area, The Punjab: 1998 Census
308

xx
Table
No. Title Page
122. Disabled Population by Nature of Disability
and Sex, The Punjab: 1998 Census
309 123. Population of Major Cities 1981 and 1998
Censuses and Estimated Population, 2011
310 XX– PRICES 124. Index Number of Wholesale Prices by
Commodity Group, Pakistan: 2001-02 to
2009-10
312 125. Index Numbers of Wholesale Prices by
Important Commodities: 2008-09 and 2009-10
313 126. Combined Consumer Price Index Number by
Commodity Group, Pakistan: 2007-08 to
2009-10
314 127. Average Retail Prices of Nine Essential
Commodities, The Punjab: 2005-06 to 2009-10
315 128. Ex-Depot Sale Prices of POL Items, Pakistan
01-01-2010 to 01-06-2011
316 129. Inflation Rates in Pakistan: 2001-02 to 2009-10 317
130. Weekly Exchange Rates of U.S. Dollar:
2010 and June 2011
318-319 131. Spot Bullion Quotations at Lahore: 2000-01 to
2009-10
320 132. Monthly Average Wholesale Prices of Wheat
in Important Markets, The Punjab: 2009-10
321

xxi
Table
No. Title Page
133. Monthly Average Wholesale Prices of Rice
(Basmati) in Important Markets, The Punjab
2009-10
322 134. Monthly Average Wholesale Prices of Gram
(Whole) in Important Markets, The Punjab
2009-10
323 135. Monthly Average Wholesale Prices of Kappas
(American) in Important Markets, The
Punjab: 2008-09 and 2009-10 (Cotton Season)
324 136. Procurement/Support Prices of Agricultural
Commodities, The Punjab 2004-05 to 2010-11
325 137. Number of Market Committees, Grain and
Vegetable Markets, The Punjab: 2005-06 and
2009-10
325 138. Number of Utility Stores by Urban & Rural
Areas Punjab: 2004 to 2010
326
XXI– PUBLIC FINANCE 139. Revenue and Capital Receipts (Summary) The
Punjab: 2010-11 and 2011-12
328-329 140. Revenue Expenditure (Summary) by
Important Heads, The Punjab: 2010-11 and
2011-12
330-333 141. Total Capital Disbursements of the Punjab
Government: 2010-11 and 2011-12
334
xxii
Table
No. Title Page
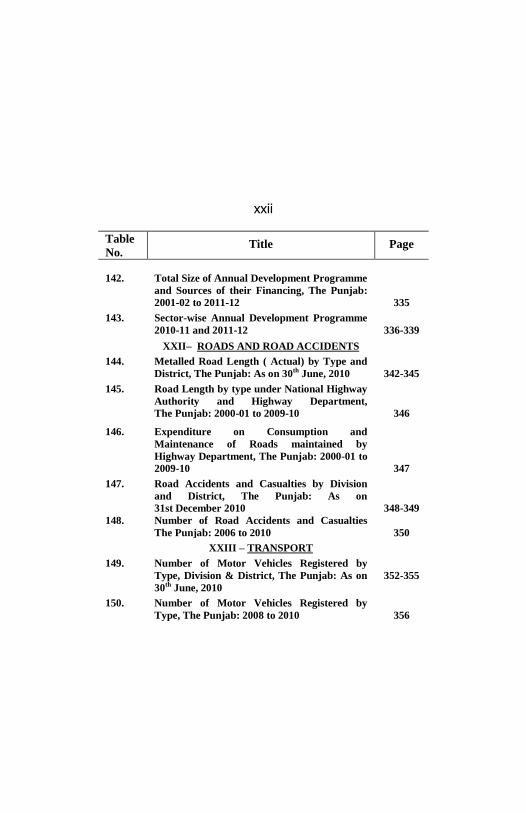
142. Total Size of Annual Development Programme
and Sources of their Financing, The Punjab:
2001-02 to 2011-12
335 143. Sector-wise Annual Development Programme
2010-11 and 2011-12
336-339 XXII– ROADS AND ROAD ACCIDENTS 144. Metalled Road Length ( Actual) by Type and
District, The Punjab: As on 30th June, 2010
342-345 145. Road Length by type under National Highway
Authority and Highway Department,
The Punjab: 2000-01 to 2009-10
346 146. Expenditure on Consumption and
Maintenance of Roads maintained by
Highway Department, The Punjab: 2000-01 to
2009-10
347 147. Road Accidents and Casualties by Division
and District, The Punjab: As on
31st December 2010
348-349
148. Number of Road Accidents and Casualties
The Punjab: 2006 to 2010
350 XXIII – TRANSPORT 149. Number of Motor Vehicles Registered by
Type, Division & District, The Punjab: As on
30th June, 2010
352-355
150. Number of Motor Vehicles Registered by
Type, The Punjab: 2008 to 2010
356

xxiii
Table
No. Title Page
151. Pakistan Railways Locomotives, Freight and
Passengers: 2007-08 to 2009-10
357 152. Rail Passengers by Class: 2000-01 to 2009-10 358 153. Pakistan Railways Passenger and Freight
Traffic: 2006-07 to 2009-10
359
XXIV – ZAKAT 154. Number of Local Zakat Committees by
Division and District, The Punjab: 2009-10
362 155. Disbursement of Zakat Funds and Number of
Beneficiaries, The Punjab: 2007-08 and
2008-09
363 Telephone Numbers of Bureau of Statistics
2-Begum Road, Lahore
364-365 Addresses/Telephone Numbers of Field
Offices, Bureau of Statistics
366-368

ADMINISTRATIVE SET-UP
OF
THE PUNJAB GOVERNMENT
(AS ON 30TH JUNE, 2011)

2
3
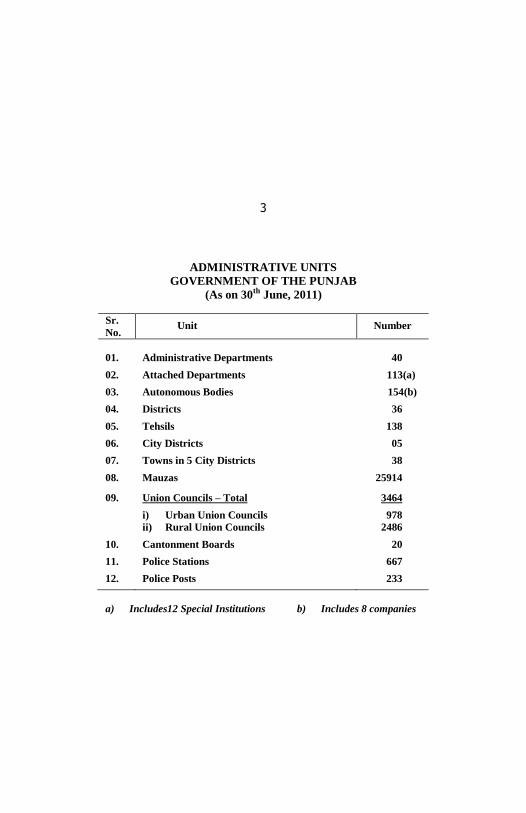
ADMINISTRATIVE UNITS
GOVERNMENT OF THE PUNJAB
(As on 30th June, 2011)
Sr.
No. Unit Number
01. Administrative Departments 40
02. Attached Departments 113(a)
03. Autonomous Bodies 154(b)
04. Districts 36
05. Tehsils 138
06. City Districts 05
07. Towns in 5 City Districts 38
08. Mauzas 25914
09. Union Councils – Total
i) Urban Union Councils
ii) Rural Union Councils
3464
978
2486
10. Cantonment Boards 20
11. Police Stations 667
12. Police Posts 233
a) Includes12 Special Institutions b) Includes 8 companies
4
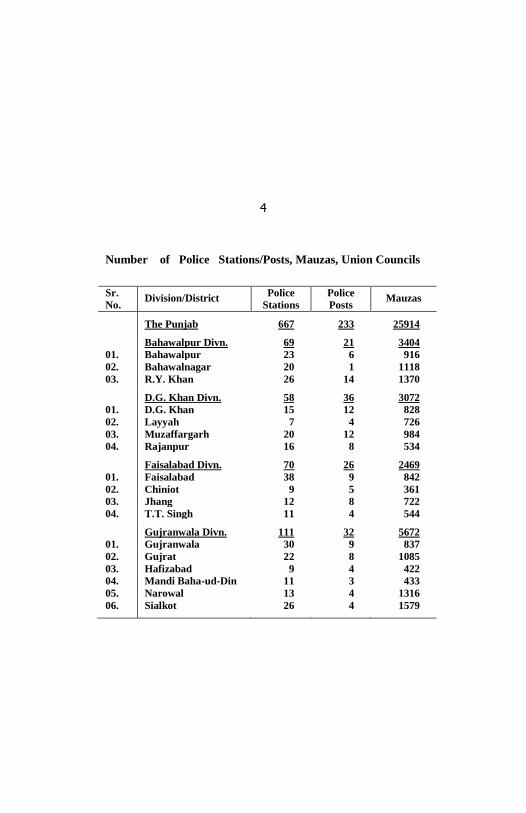
Number of Police Stations/Posts, Mauzas, Union Councils
Sr.
No. Division/District
Police
Stations
Police
Posts Mauzas
The Punjab 667 233 25914 Bahawalpur Divn. 69 21 3404
01. Bahawalpur 23 6 916
02. Bahawalnagar 20 1 1118
03. R.Y. Khan 26 14 1370 D.G. Khan Divn. 58 36 3072
01. D.G. Khan 15 12 828
02. Layyah 7 4 726
03. Muzaffargarh 20 12 984
04. Rajanpur 16 8 534 Faisalabad Divn. 70 26 2469
01. Faisalabad 38 9 842
02. Chiniot 9 5 361
03. Jhang 12 8 722
04. T.T. Singh 11 4 544 Gujranwala Divn. 111 32 5672
01. Gujranwala 30 9 837
02. Gujrat 22 8 1085
03. Hafizabad 9 4 422
04. Mandi Baha-ud-Din 11 3 433
05. Narowal 13 4 1316
06. Sialkot 26 4 1579
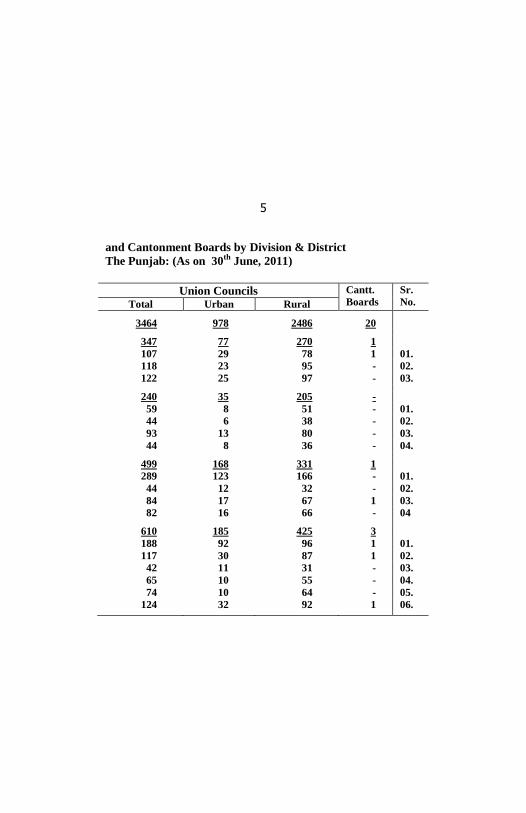
5
and Cantonment Boards by Division & District
The Punjab: (As on 30th June, 2011)
Union Councils Cantt.
Boards
Sr.
No. Total Urban Rural
3464 978 2486 20
347 77 270 1
107 29 78 1 01.
118 23 95 - 02.
122 25 97 - 03.
240 35 205 -
59 8 51 - 01.
44 6 38 - 02.
93 13 80 - 03.
44 8 36 - 04.
499 168 331 1
289 123 166 - 01.
44 12 32 - 02.
84 17 67 1 03.
82 16 66 - 04
610 185 425 3
188 92 96 1 01.
117 30 87 1 02.
42 11 31 - 03.
65 10 55 - 04.
74 10 64 - 05.
124 32 92 1 06.
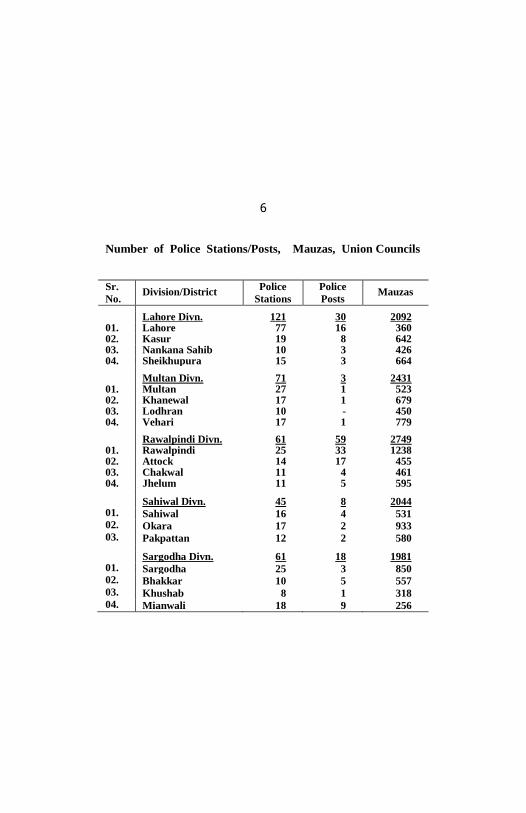
6
Number of Police Stations/Posts, Mauzas, Union Councils
Sr.
No. Division/District
Police
Stations
Police
Posts Mauzas
Lahore Divn. 121 30 2092 01. Lahore 77 16 360 02. Kasur 19 8 642 03. Nankana Sahib 10 3 426 04. Sheikhupura 15 3 664 Multan Divn. 71 3 2431 01. Multan 27 1 523 02. Khanewal 17 1 679 03. Lodhran 10 - 450 04. Vehari 17 1 779 Rawalpindi Divn. 61 59 2749 01. Rawalpindi 25 33 1238 02. Attock 14 17 455 03. Chakwal 11 4 461 04. Jhelum 11 5 595 Sahiwal Divn. 45 8 2044 01. Sahiwal 16 4 531 02. Okara 17 2 933 03. Pakpattan 12 2 580 Sargodha Divn. 61 18 1981 01. Sargodha 25 3 850 02. Bhakkar 10 5 557 03. Khushab 8 1 318 04. Mianwali 18 9 256

7
and Cantonment Boards by Division & District
The Punjab: (As on 30th June, 2011)
Union Councils Cantt.
Boards
Sr.
No. Total Urban Rural
432 193 239 2 150 122 28 2 01. 113 26 87 - 02. 57 9 48 - 03.
112 36 76 - 04.
391 108 283 1 129 65 64 1 01. 100 17 83 - 02. 73 11 62 - 03. 89 15 74 - 04.
369 89 280 10 175 56 119 5 01. 72 13 59 3 02. 68 8 60 - 03. 54 12 42 2 04.
266 49 217 1 89 14 75 - 01.
114 26 88 1 02. 63 9 54 - 03.
310 74 236 1 161 40 121 1 01. 42 9 33 - 02. 51 13 38 - 03.
56 12 44 - 04.

8
NAME OF TEHSILS BY DISTRICT, THE PUNJAB
(AS ON 30th JUNE. 2011) Tehsils/Towns Tehsils/Towns
The Punjab 1. Bahawalpur Distt.
Ahmadpur East
Bahawalpur City
Bahawalpur Sadar
Hasilpur
Khairpur Tamewali
Yazman 2. Bahawalnagar Distt.
Bahawalnagar
Chishtian
Fort Abbas
Haroonabad
Minchinabad 3. R. Y. Khan Distt.
Khanpur
Liaquatpur
Rahim Yar Khan
Sadiqabad 4. D.G.Khan Distt.
D.G. Khan
Taunsa
5. Layyah Distt.
Chobara Karor Layyah
6. Muzaffargarh Distt. Alipur Jatoi Kot Addu Muzaffargarh
7. Rajanpur Distt.
Jampur Rajanpur Rojhan
8. Faisalabad City Distt. Chak Jhumra Town Iqbal Town Jinnah Town Lyallpur Town Madina Town Jaranwala Town Sammundri Town Tandlianwala Town
9. Chiniot Distt. Chiniot Bhowana Lalian
- Contd.

9
NAME OF TEHSILS BY DISTRICT, THE PUNJAB
(AS ON 30TH JUNE, 2011)
Tehsils/Towns Tehsils/Towns
10. Jhang Distt Ahmadpur Sial 18-Hazari Jhang Shorkot
11. Toba Tek Singh Distt.
Gojra Kamalia Toba Tek Singh
12. Gujranwala City Distt.
Aroop Town Khialli Shahpur Town Nandipur Town Qila Dedar Singh Town Naushera Virkan Town Kamoke Town Wazirabad Town
13. Gujrat Distt.
Gujrat Kharian Sarai Alamgir
14. Hafizabad Distt.
Hafizabad Pindi Bhattian
15. M. Baha-ud-Din Distt.
Malakwal
Mandi Baha-ud-Din
Phalia
16. Narowal Distt. Narowal Shakargarh Zafarwal
17. Sialkot Distt.
Daska
Pasrur
Sambrial
Sialkot
18. Lahore City Distt. Aziz Bhatti Town Data Ganj Buksh Town Gulberg Town Iqbal Town Nishtar Town Ravi Town Samanabad Town Shalimar Town
Wagha Town
19. Kasur Distt. Chunian Kasur Kot Radha Kishan Pattoki
20. Nankana Sahib Distt.
Shahkot
Sangla Hill
Nankana Sahib
- Contd.

10
NAME OF TEHSILS BY DISTRICT, THE PUNJAB (AS ON 30TH JUNE, 2011)
Tehsils/Towns Tehsils/Towns
21. Sheikhupura Distt.
Ferozewala
Muridke
Safdarabad
Sharaqpur
Sheikhupura
22. Multan City Distt. Bosan Town Mousa Pak (Shaheed) Town Shah Rukan-e-Alam Town Sher Shah Town Jalalpur Pirwala Town Shujabad Town
23. Khanewal Distt.
Jahanian
Kabirwala
Khanewal
Mian Channu
24. Lodhran Distt.
Dunyapur
Karor Pacca
Lodhran
25. Vehari Distt.
Burewala
Mailsi
Vehari
26. Rawalpindi City Distt.
Gujar Khan Town
Kahuta Town
Kallar Syedan Town
Kotli Sattian Town
Murree Town
Pothohar Town
Rawal Town
Taxila Town
27. Attock Distt.
Attock
Fateh Jhang
Hazro
Hassanabdal
Jand
Pindi Gheb
28. Chakwal Distt. Chakwal Choa Saiden Shah Kalar Kahar Talagang
29. Jhelum Distt.
Dina
Jhelum
Pind Dadan Khan
Sohawa
-Contd.

11
NAME OF TEHSILS BY DISTRICT, THE PUNJAB
(AS ON 30TH JUNE, 2011)
Tehsils/Towns Tehsils/Towns
30. Sahiwal Distt.
Chichawatni
Sahiwal
31. Okara Distt.
Depalpur
Okara
Renal Khurd
32. Pakpattan Distt.
Arifwala
Pakpattan
33. Sargodha Distt.
Bhalwal
Kot Moman
Sahiwal
Sargodha
Shahpur
Sillanwali
34. Bhakkar Distt. Bhakkar Darya Khan Kalur Kot
Mankera
35. Khushab Distt. Khushab Nurpur
Quaidabad
36. Mianwali Distt. Isa Khel Mianwali Piplan
Source: - Board of Revenue, Punjab, Lahore.

12
LIST OF ATTACHED DEPARTMENTS AND AUTONOMOUS BODIES, THE PUNJAB
(AS ON 30TH JUNE, 2011) Sr.
No. Department
Head of Attached
Departments
Autonomous
Bodies 1. Agriculture
Department
1. Dir. Gen. Agri.
(Ext. & AR),
Punjab
2. Dir. Gen. Agri.
(Field), Punjab
3. Dir. Gen. Agri.
(Research),
Punjab
4. Dir. Gen. Agri.
(Water Manage-
ment), Punjab
5. Dir. Gen. Pest
Warning &
Quality Control
of Pesticides,
Punjab
6. Dir. of Agri.
Information,
Punjab
7. Dir. of Agri.
Crop Reporting
Service, Punjab
1. Punjab Seed
Corporation
2. University of
Agriculture
Faisalabad
3. Punjab Agri.
Research
Board
4. Pir Mehr Ali
Shah
University of
Arid Agri.
Rawalpindi
5. Market
Committees
Provincial
Fund Board
-Contd.

13
LIST OF ATTACHED DEPARTMENTS AND
AUTONOMOUS BODIES, THE PUNJAB (AS ON 30TH JUNE, 2011)
Sr.
No. Department
Head of Attached
Departments
Autonomous
Bodies
8. Chief, Planning
and Evaluation
Cell
9. Chief. WTO Cell
10. Dir. of Agri.
(Economic and
Marketing),
Punjab
11. Chief
Coordinator,
Regional Agri.
Economic Dev.
Centre
12. Dir. of
Floriculture
(T&R)
13. Director Punjab
Institute of Agri.
Marketing
Company Punjab Agri.
Marketing
Company
(PAMCO)
2. Auqaf and
Religious
Affairs
Department
-
Punjab Auqaf
Organization
- Contd.

14
LIST OF ATTACHED DEPARTMENTS AND
AUTONOMOUS BODIES, THE PUNJAB (AS ON 30TH JUNE, 2011)
Sr. No.
Department Head of Attached Departments
Autonomous Bodies
3. Chief
Minister’s
Inspection
Team
- -
4. Colonies
Department
- 1. Punjab
Privatization
Board
2. Killa Gift Fund
Trust,
Faisalabad
3. Killa Gift Fund
Trust, Toba
Tek Singh
5.
Communi-
cations
Works
Department
1. Chief Architect,
Punjab
2. Chief Engineer,
Building, North
Zone
3. Chief Engineer,
Building, South
Zone
4. Chief Engineer,
Highways, North
Zone
-
- Contd.
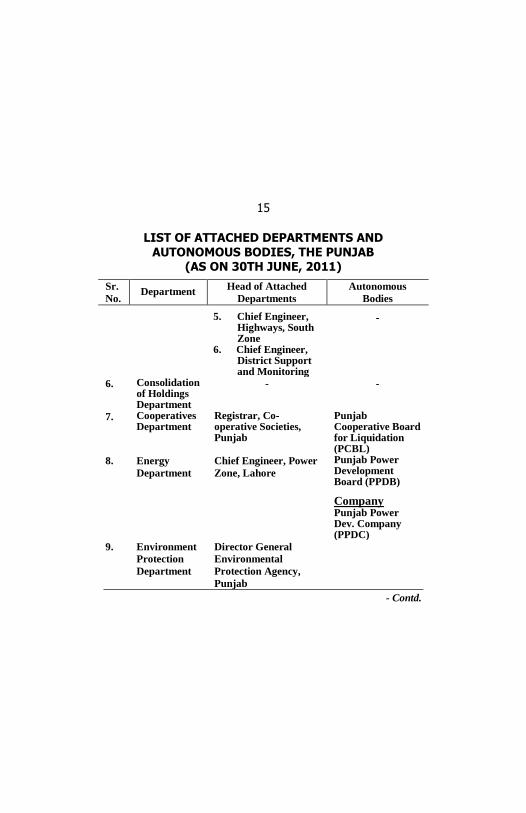
15
LIST OF ATTACHED DEPARTMENTS AND
AUTONOMOUS BODIES, THE PUNJAB (AS ON 30TH JUNE, 2011)
Sr.
No. Department
Head of Attached
Departments
Autonomous
Bodies 5. Chief Engineer,
Highways, South Zone
6. Chief Engineer, District Support and Monitoring
-
6. Consolidation of Holdings Department
- -
7. Cooperatives Department
Registrar, Co-operative Societies, Punjab
Punjab Cooperative Board for Liquidation (PCBL)
8. Energy
Department
Chief Engineer, Power
Zone, Lahore
Punjab Power Development Board (PPDB)
Company Punjab Power Dev. Company (PPDC)
9. Environment
Protection
Department
Director General
Environmental
Protection Agency,
Punjab
- Contd.

16
LIST OF ATTACHED DEPARTMENTS AND AUTONOMOUS BODIES, THE PUNJAB
(AS ON 30TH JUNE, 2011) Sr. No. Department
Head of Attached Departments
Autonomous Bodies
10. Excise &
Taxation Department
Dir. Gen. Excise & Taxation, Punjab
-
11. Finance
Department
1. Provincial Director, Local Fund Audit
2. Chief Inspector of Treasuries and Accounts
-
1. 2.
Special Institutions Punjab Pension Fund Bank of Punjab
-
12. Food Department
1. Director Food, Punjab
2. Cane Commissioner, Punjab
13. Forestry, Wildlife, Fisheries and Tourism Department
1. Chief Conservator of Forests (Planning, Monitoring and Evaluation), Punjab, Lahore
2. Chief Conservator of Forests (Central Zone), Lahore
Tourism Development Corporation of Punjab (TDCP)
- Contd.

17
LIST OF ATTACHED DEPARTMENTS AND AUTONOMOUS BODIES, THE PUNJAB
(AS ON 30TH JUNE, 2011)
Sr.
No. Department
Head of Attached
Departments
Autonomous
Bodies
3. Chief
Conservator of
Forests (Northern
Zone),
Rawalpindi
4. Chief
Conservator of
Forests (Southern
Zone), Multan
5. Dir. Gen.
(Wildlife and
Parks), Punjab
6. Dir. Gen.
Fisheries, Punjab
-
14. Governor’s
Secretariat
- -
15. Health
Department
1. Dir. Gen. Health
Services, Punjab
2. Dir. General
Nursing, Punjab
3. Dir. Blood
Transfusion
Services, Punjab
1. Nursing
Examination
Board
2. King Edward
Medical
University,
Lahore
- Contd.

18
LIST OF ATTACHED DEPARTMENTS AND AUTONOMOUS BODIES, THE PUNJAB
(AS ON 30TH JUNE, 2011)
Sr. No.
Department Head of Attached
Departments Autonomous
Bodies 3. University of
Health Sciences, Lahore
4. Punjab Pharmacy Council
5. Punjab Medical Faculty
6. Allama Iqbal Medical College/Jinnah Hospital, Lahore
7. Services Institute of Medical Sciences/ Services Hospital, Lahore
8. Fatima Jinnah Medical College/Sir Ganga Ram Hospital, Lahore
- Contd.

19
LIST OF ATTACHED DEPARTMENTS AND AUTONOMOUS BODIES, THE PUNJAB
(AS ON 30TH JUNE, 2011)
Sr. No. Department
Head of Attached Departments
Autonomous Bodies
9. Postgraduate Medical Institute/Lahore General Hospital, Lahore
10. Punjab Medical College/Allied Hospitals, Faisalabad
11. Rawalpindi Medical College/ Allied Hospitals, Rawalpindi
12. Nishtar Medical College/ Hospital, Multan
13. Quaid-e-Azam Medical, College/B.V. Hospital, Bahawalpur
14. Sheik Zayed Medical College/ Hospital, Rahim Yar Khan
15. Punjab Institute of Cardiology, Lahore
16. Nishtar Institute of Dentistry, Multan
- Contd.

20
LIST OF ATTACHED DEPARTMENTS AND AUTONOMOUS BODIES, THE PUNJAB
(AS ON 30TH JUNE, 2011)
Sr.
No. Department
Head of Attached
Departments
Autonomous
Bodies 17. Faisalabad
Institute of Cardiology
18. Multan Institute of Cardiology
19. Punjab Health Foundation
20. Provincial Quality Control Board
16. Higher Education Department
1. Director Public Instructions (Colleges), Punjab
2. Dir. Gen. Public Libraries, Punjab
3. Dir. Gen. Sports, Punjab
1. Boards of Intermediate & Secondary Education, Lahore, Gujranwala, Rawalpindi, Sargodha, Multan, Bahawalpur, Faisalabad and Dear Ghazi Khan
- Contd.
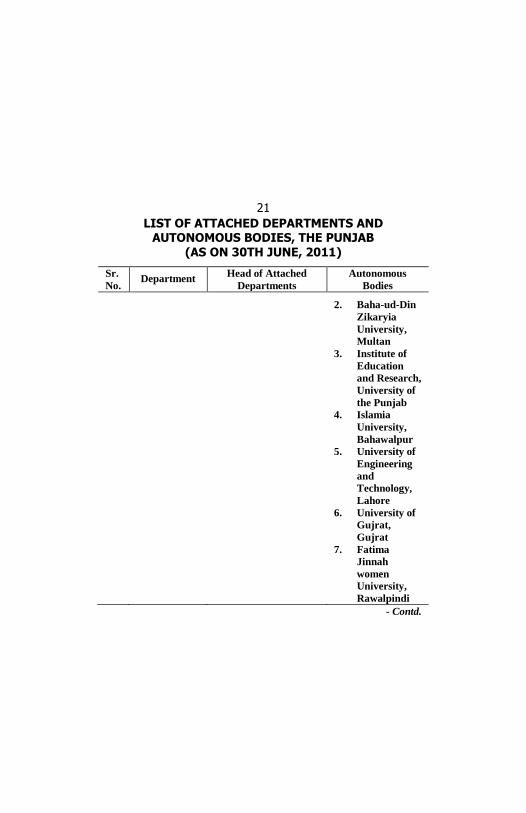
21
LIST OF ATTACHED DEPARTMENTS AND AUTONOMOUS BODIES, THE PUNJAB
(AS ON 30TH JUNE, 2011)
Sr.
No. Department
Head of Attached
Departments
Autonomous
Bodies 2. Baha-ud-Din
Zikaryia
University,
Multan
3. Institute of
Education
and Research,
University of
the Punjab
4. Islamia
University,
Bahawalpur
5. University of
Engineering
and
Technology,
Lahore
6. University of
Gujrat,
Gujrat
7. Fatima
Jinnah
women
University,
Rawalpindi
- Contd.

22
LIST OF ATTACHED DEPARTMENTS AND AUTONOMOUS BODIES, THE PUNJAB
(AS ON 30TH JUNE, 2011)
Sr.
No. Department
Head of Attached
Departments
Autonomous
Bodies 8. University of
the Punjab, Lahore
9. University of Education Lahore
10. University of Engineering and Technology, Taxila
11. University of Sargodha, Sargodha
12. Government College University, Lahore
13. Lahore College for Women University, Lahore
14. Government College University, Faisalabad
- Contd.

23
LIST OF ATTACHED DEPARTMENTS AND
AUTONOMOUS BODIES, THE PUNJAB (AS ON 30TH JUNE, 2011)
Sr.
No. Department
Head of Attached
Departments
Autonomous
Bodies
15. Government
Fatima
Jinnah
College for
Women,
Chuna
Mandi,
Lahore
16. Queen Mary
College,
Lahore
17. Government
College,
Kahuta
18. The Quaid-e-
Azam
Library,
Bagh-e-
Jinnah,
Lahore
19. Punjab
Public
Library,
Lahore
-Contd.

24
LIST OF ATTACHED DEPARTMENTS AND AUTONOMOUS BODIES, THE PUNJAB
(AS ON 30TH JUNE, 2011)
Sr. No. Department
Head of Attached Departments
Autonomous Bodies
20. Punjab Library Foundation, Lahore
21. Govt. Sadiq Degree College (W), College Road, Bahawalpur
22. Govt. Post Graduate College, D.G. Khan
23. Govt. SE College, Bahawlapur
24. Govt. College for Women, D G Khan
25. Govt. Post Graduate
College, Samanabad, Faisalabad
26. Govt. College for Women, Madina Town, Faisalabad
-Contd.

25
LIST OF ATTACHED DEPARTMENTS AND
AUTONOMOUS BODIES, THE PUNJAB (AS ON 30TH JUNE, 2011)
Sr. No.
Department Head of Attached
Departments Autonomous
Bodies 27. Govt. College
for Women, Satellite Town, Gujranwala
28. Govt. College for Boys, Satellite, Town, Gujranwala
29. Govt. Murray College, Sialkot
30. Govt. Post Graduate College for Women, Sialkot
31. Govt. College of Science, Wahdat Road, Lahore
32. Govt. Islamia College Civil Lines, Lahore
33. Govt. MAO College, Lahore
- Contd.

26
LIST OF ATTACHED DEPARTMENTS AND
AUTONOMOUS BODIES, THE PUNJAB (AS ON 30TH JUNE, 2011)
Sr. No. Department
Head of Attached Departments
Autonomous Bodies
34. Govt. Post
Graduate
College for
Women,
Samanabad,
Lahore
35. Govt. Post
Graduate
Islamia
College for
Women,
Cooper Road,
Lahore
36. Govt. College
for Women,
Gulberg,
Lahore 37. Govt.
Emerson College, Bosan Road, Multan
38. Govt. College for Women, Katchery Road, Multan
- Contd.

27
LIST OF ATTACHED DEPARTMENTS AND AUTONOMOUS BODIES, THE PUNJAB
(AS ON 30TH JUNE, 2011)
Sr. No. Department
Head of Attached Departments
Autonomous Bodies
39. Govt. Gordon College, Rawalpindi
40. Govt. Post Graduate College for Women, Satellite Town, Rawalpindi
41. Govt. Post Graduate College, Taliawnwala, Jhelum
42. Govt. Post Graduate College, Teshil Chowk, Chakwal
43. Govt. College
Farid Town,
Sahiwal 44. Govt. Post
Graduate College for Women, Sahiwal
- Contd.

28
LIST OF ATTACHED DEPARTMENTS AND AUTONOMOUS BODIES, THE PUNJAB
(AS ON 30TH JUNE, 2011)
Sr. No. Department
Head of Attached Departments
Autonomous Bodies
45. Govt. Ambala Muslim College, Sargodha
46. Govt. College for Women, Chandi Chowk, Sargodha
47. Lawrence College, Ghora Gali, Murree
48. School of Mathematical sciences Lahore (GCU)
49. Punjab
Sports Board
Special Institution Aitcheson College, Lahore
17. Home
Department
1. Inspector Gen. of Police, Punjab, Lahore
1. Child Protection and Welfare Bureau, Punjab
- Contd.
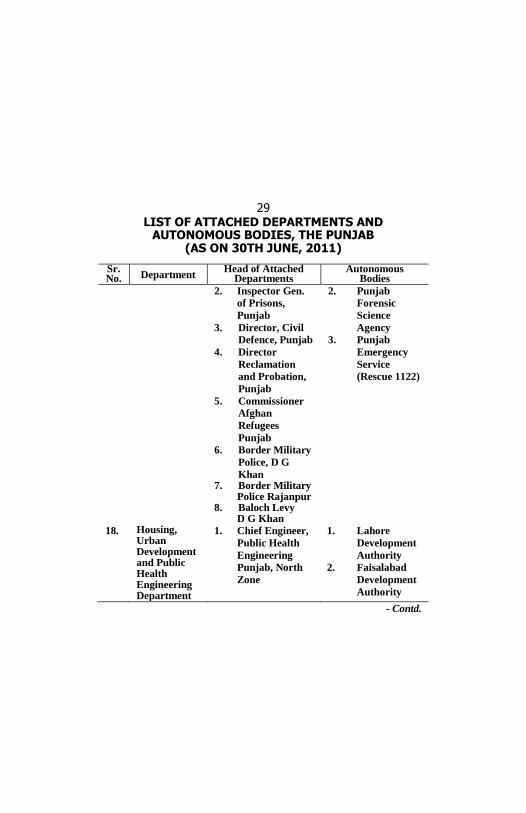
29
LIST OF ATTACHED DEPARTMENTS AND AUTONOMOUS BODIES, THE PUNJAB
(AS ON 30TH JUNE, 2011)
Sr. No. Department
Head of Attached Departments
Autonomous Bodies
2. Inspector Gen.
of Prisons,
Punjab
3. Director, Civil
Defence, Punjab
4. Director
Reclamation
and Probation,
Punjab
5. Commissioner
Afghan
Refugees
Punjab
6. Border Military
Police, D G
Khan 7. Border Military
Police Rajanpur 8. Baloch Levy
D G Khan
2. Punjab
Forensic
Science
Agency
3. Punjab
Emergency
Service
(Rescue 1122)
18. Housing, Urban Development and Public Health Engineering Department
1. Chief Engineer,
Public Health
Engineering
Punjab, North
Zone
1. Lahore
Development
Authority
2. Faisalabad
Development
Authority
- Contd.

30
LIST OF ATTACHED DEPARTMENTS AND AUTONOMOUS BODIES, THE PUNJAB
(AS ON 30TH JUNE, 2011)
Sr. No. Department
Head of Attached Departments
Autonomous Bodies
2. Chief Engineer,
Public Health
Engineering
Punjab, South
Zone
3. Multan Development Authority
4. Gujranwala Development Authority
5. Rawalpindi Development Authority
6 Parks and Horticulture Authority, Lahore.
7. Improvement Trust, Murree
8. Improvement Trust, Sargodha
9. Punjab Housing and Town Planning Agency (PHATA)
Company Punjab Land Development Company (PLDC)
- Contd.

31
LIST OF ATTACHED DEPARTMENTS AND AUTONOMOUS BODIES, THE PUNJAB
(AS ON 30TH JUNE, 2011)
Sr. No. Department
Head of Attached Departments
Autonomous Bodies
19. Human
Rights and
Minorities
Affairs
Department
Director of Human
Rights
-
20. Industries
Commerce
and
Investment
Department
1. Director of
Industries,
Punjab
2. Controller,
Printing and
Stationery,
Punjab
3. Director,
Consumer
Protection
Council (CPC)
4. CEO, Punjab
China Bureau
(PCB)
1. Punjab Small
Industries
Corporation
(PSIC)
2. Punjab Board
of Investment
and Trade
(PBIT)
Companies 1 Punjab
Industrial
Estates
Development
and
Management
Company
(PIEDMC)
- Contd.

32
LIST OF ATTACHED DEPARTMENTS AND AUTONOMOUS BODIES, THE PUNJAB
(AS ON 30TH JUNE, 2011)
Sr. No. Department
Head of Attached Departments
Autonomous Bodies
2. Faisalabad
Industrial
Estate
Development
and
Management
Company
(FIEDMC)
3. Technical
Education
and
Vocational
Training
Company
Special Institution
Technical Education and Vocational Training Authority (TEVTA)
21. Irrigation
Department
1. Chief Engineer
Irrigation,
Lahore Zone,
Lahore
2. Chief Engineer
Irrigation,
Development
Zone, Lahore
1. Punjab Irrigation and Drainage Authority (PIDA)
2. Punjab Engineering Academy, Niaz Beg, Lahore
- Contd.

33
LIST OF ATTACHED DEPARTMENTS AND AUTONOMOUS BODIES, THE PUNJAB
(AS ON 30TH JUNE, 2011)
Sr. No. Department
Head of Attached Departments
Autonomous Bodies
3. Chief Engineer Irrigation, Research Zone, Lahore
4. Chief engineer Irrigation, Drainage and Flood Zone, Lahore
5. Chief Engineer Irrigation, Greater Thal Canal, Adhi Kot
6. Chief engineer irrigation, Planning and Review Zone, Lahore
7. Chief Engineer Irrigation, Faisalabad Zone, Faisalabad
8. Chief Engineer Irrigation, Sargodha Zone, Sargodha
- Contd.

34
LIST OF ATTACHED DEPARTMENTS AND AUTONOMOUS BODIES, THE PUNJAB
(AS ON 30TH JUNE, 2011)
Sr. No. Department
Head of Attached Departments
Autonomous Bodies
9. Chief Engineer
Irrigation,
Multan Zone,
Multan
10. Chief Engineer
Irrigation, D G
Khan Zone,
D G Khan
11. Chief Engineer
Irrigation,
Bahawalpur
Zone,
Bahawalpur
12. Director Land
Reclamation
Punjab, Lahore
22. Information,
Culture and
Youth Affair
Department
1. Dir. Gen, of
Public
Relations,
Punjab
2. Dir. Gen. of
Archaeology,
Punjab
1. Punjab Council of Arts
2. Lahore Museum
3. Bahawalpur Museum
4. Bab-e-Pakistan Trust
- Contd.

35
LIST OF ATTACHED DEPARTMENTS AND AUTONOMOUS BODIES, THE PUNJAB
(AS ON 30TH JUNE, 2011)
Sr. No. Department
Head of Attached Departments
Autonomous Bodies
5. The Punjab
Journalists
Housing
Foundation
6. The Punjab
Institute of
Language,
Art and
Culture
7. Lahore Arts
Council,
Lahore
23. Labour and
Human
Resource
Department
1. Director of
Labour Welfare,
Punjab
2. Chairman,
Minimum
Wages Board,
Punjab
1. Punjab
employees
Social
Security
Institution
2. Punjab
Workers
Welfare Board
24. Law and
Parlimentary
Affairs
Department
1. Administrator
General and
Official Trustee,
Punjab
Punjab judicial
Academy
- Contd.
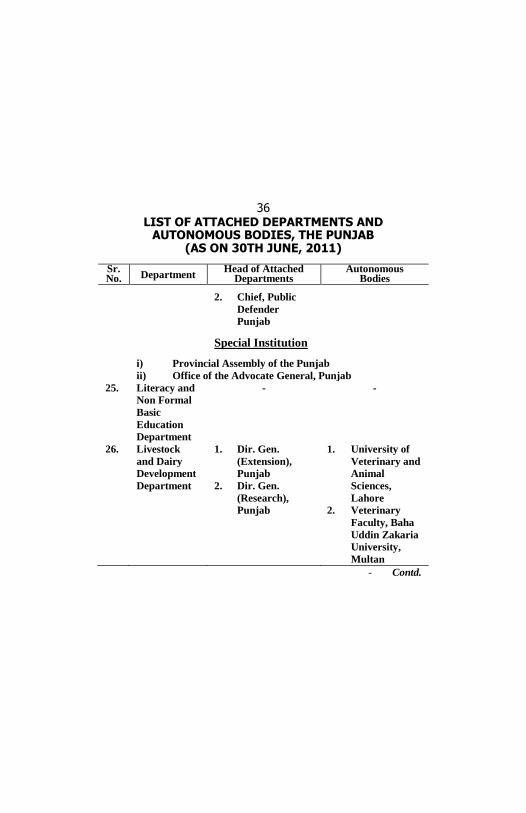
36
LIST OF ATTACHED DEPARTMENTS AND AUTONOMOUS BODIES, THE PUNJAB
(AS ON 30TH JUNE, 2011)
Sr. No. Department
Head of Attached Departments
Autonomous Bodies
2. Chief, Public
Defender
Punjab
Special Institution
i) Provincial Assembly of the Punjab
ii) Office of the Advocate General, Punjab
25. Literacy and
Non Formal
Basic
Education
Department
- -
26. Livestock
and Dairy
Development
Department
1. Dir. Gen.
(Extension),
Punjab
2. Dir. Gen.
(Research),
Punjab
1. University of
Veterinary and
Animal
Sciences,
Lahore
2. Veterinary
Faculty, Baha
Uddin Zakaria
University,
Multan
- Contd.

37
LIST OF ATTACHED DEPARTMENTS AND AUTONOMOUS BODIES, THE PUNJAB
(AS ON 30TH JUNE, 2011)
Sr. No. Department
Head of Attached Departments
Autonomous Bodies
3. Veterinary
Faculty, Pir
Mehr Ali
Shah
University of
Arid Agri.
Rawalpindi
4. University
College of
Veterinary
and Animal
Sciences,
Islamia
University,
Bahawalpur
5. Veterinary
College,
Jhang
6. Punjab
Livestock and
Dairy Dev.
Board
7. Punjab
Poultry
Research and
Dev. Board
- Contd.
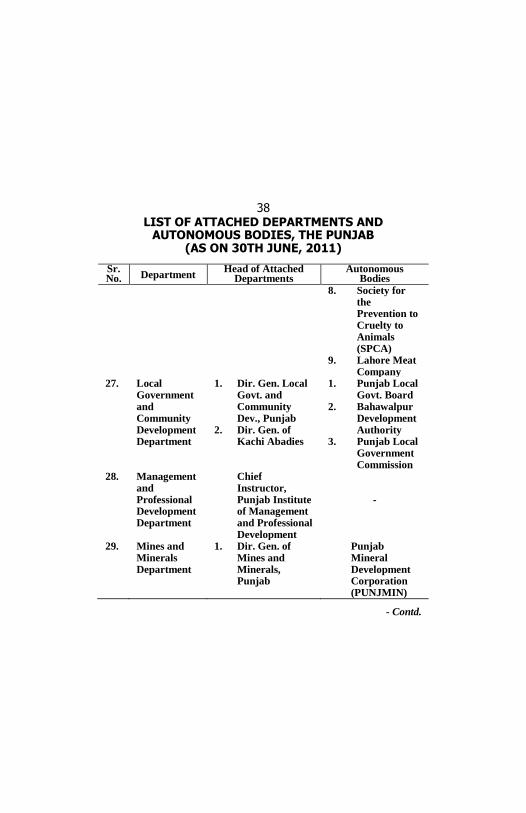
38
LIST OF ATTACHED DEPARTMENTS AND AUTONOMOUS BODIES, THE PUNJAB
(AS ON 30TH JUNE, 2011)
Sr. No. Department
Head of Attached Departments
Autonomous Bodies
8. Society for the Prevention to Cruelty to Animals (SPCA)
9. Lahore Meat Company
27. Local Government and Community Development Department
1. Dir. Gen. Local Govt. and Community Dev., Punjab
2. Dir. Gen. of Kachi Abadies
1. Punjab Local Govt. Board
2. Bahawalpur Development Authority
3. Punjab Local Government Commission
28. Management and Professional Development Department
Chief Instructor, Punjab Institute of Management and Professional Development
-
29. Mines and Minerals Department
1. Dir. Gen. of Mines and Minerals, Punjab
Punjab Mineral Development Corporation (PUNJMIN)
- Contd.
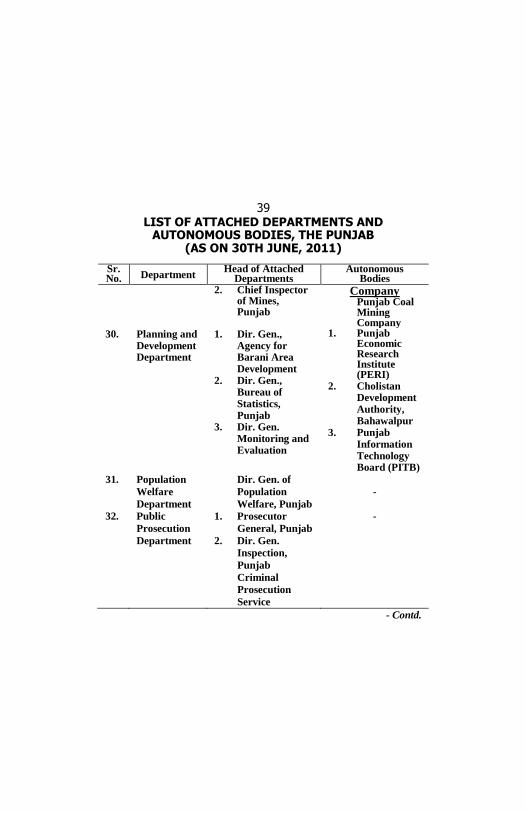
39
LIST OF ATTACHED DEPARTMENTS AND AUTONOMOUS BODIES, THE PUNJAB
(AS ON 30TH JUNE, 2011)
Sr. No. Department
Head of Attached Departments
Autonomous Bodies
2. Chief Inspector of Mines, Punjab
Company Punjab Coal Mining Company
30. Planning and Development Department
1. Dir. Gen., Agency for Barani Area Development
2. Dir. Gen., Bureau of Statistics, Punjab
3. Dir. Gen. Monitoring and Evaluation
1. Punjab Economic Research Institute (PERI)
2. Cholistan DevelopmentAuthority, Bahawalpur
3. Punjab Information Technology Board (PITB)
31. Population
Welfare
Department
Dir. Gen. of
Population
Welfare, Punjab
-
32. Public
Prosecution
Department
1. Prosecutor
General, Punjab
2. Dir. Gen.
Inspection,
Punjab
Criminal
Prosecution
Service
-
- Contd.

40
LIST OF ATTACHED DEPARTMENTS AND AUTONOMOUS BODIES, THE PUNJAB
(AS ON 30TH JUNE, 2011)
Sr. No. Department
Head of Attached Departments
Autonomous Bodies
33. Relief and
Crisis
Management
Department
1. Dir. Gen., Relief
and Crisis
Management
2. Dir. Gen.,
Provincial
Disaster
Management
Authority
(PDMA)
-
34. Revenue
Department
Director, Land
Records, Punjab
Board of Revenue
Endowment Fund
for Rural Education
Trust
Special Institution
Punjab Land Commission
35. School
Education
Department
1. Director Public
Instruction (SE)
2. Director Public
Instruction (EE)
3. Program
Director,
Directorate of
Staff
Development
1. Punjab Text
Books Board
2. Punjab
Examination
Commission
3. Punjab
Education
Foundation
4. Punjab
Teachers’
Foundation
- Contd.

41
LIST OF ATTACHED DEPARTMENTS AND AUTONOMOUS BODIES, THE PUNJAB
(AS ON 30TH JUNE, 2011)
Sr. No. Department
Head of Attached Departments
Autonomous Bodies
4. Project
Director,
Children
Library
Complex Punjab
5. Director,
Punjab
Education
Assessment
System
5. The Punjab
Danish
Schools and
Centers of
Excellence
Authority
6. Cadet College
Hassan Abdal 7. Government
Central Model School, Lower Mall, Lahore
Special Institution
Sadiq Public School, Bahawalpur
36. Services and General Adminis-tration Department (Including Services, Implemen-tation and Coordination Regulations and Archives Wings)
1. Dir Gen. Anti-
Corruption
Establishment,
Punjab
2. Dir. Gen.
Protocol,
Punjab
1. Punjab
Government
Servants
Benevolent
Fund Board
2. Punjab Govt.
Employees
Welfare fund
Board
- Contd.

42
LIST OF ATTACHED DEPARTMENTS AND AUTONOMOUS BODIES, THE PUNJAB
(AS ON 30TH JUNE, 2011)
Sr. No. Department
Head of Attached Departments
Autonomous Bodies
3. The Punjab
Government
Housing
Foundation
4. The Punjab
Procurement
Regulatory
Authority
(PPRA)
Special Institutions
i) Lahore High Court
ii) Office of the Provincial Ombudsman
iii) Punjab Service Tribunal
iv) Punjab Public Service Commission
37. Social
Welfare,
Women
Development
and Bait-ul-
Maal
Department
1. Dir. Gen., Social
Welfare,
Women Dev.
and Bait-ul-
Maal Punjab
2. Director,
Women Dev.,
Punjab
1. Punjab Social
Services
Board
2. Punjab Bait-
ul-Maal
Council
3. Punjab
Welfare
Trust for the
Disabled
- Contd.

43
LIST OF ATTACHED DEPARTMENTS AND AUTONOMOUS BODIES, THE PUNJAB
(AS ON 30TH JUNE, 2011)
Sr. No. Department
Head of Attached Departments
Autonomous Bodies
38. Special
Education
Department
Director, Special
Education, Punjab
The Punjab Fund
for Rehabilitation of
Special Persons
39. Transport
Department
1. Chairman,
Provincial
Transport
Authority
2. Chairman,
Regional
Transport
Authorities
Punjab Road
Transport
Corporation
(Defunct)
Company Lahore Transport
Company (LTC)
40. Zakat and
Ushr
Department
Administrator, Zakat
and Ushr Punjab
-

AGRICULTURE

AGRICULTURE
47
Table 1 :- Land Utilization Statistics, The Punjab
(Thousand Hectares)
Classification 2006-
07 2007-
08 2008-
09 1. Geographical
Area (2+3)
20630
20630
20630
2. Non Reported Area 2950 2949 2949
3. Reported Area
(4+5)
17680
17681
17681
4. Cultivated Area
Total (i+ii)
12602
12570
12567
i. Net Sown 11043 10943 11032
ii. Current
Fallow
1559
1627
1535
5. Un-Cultivated Area -
Total (i to iii)
5078
5111
5114
i) Culturable
Waste
1614
1630
1573
ii) Forest 498 497 498
iii) Area Not
Available for
Cultivation
2966
2984
3043
6. Cropped Area 17094 16967 17139
7. Area Sown more
than Once
6051
6024
6107 Note: Includes Islamabad. Source:-Bureau of Statistics, Punjab, Lahore.

AGRICULTURE
48
Table 2:- Land Use Statistics by Division and District
Sr.
No.
Division/
District
Reported
Area
Cultivated Area
Total Net
Sown
Current
Fallow The Punjab 17681 12567 11032 1535
Bahawalpur Div. 2155 1673 1547 126 01. Bahawalpur 613 434 400 34 02. Bahawalnagar 725 601 577 24 03. R.Y. Khan 817 638 570 68
D.G. Khan 3158 1735 1324 411
01. D.G. Khan 936 429 280 149
02. Layyah 628 474 369 105
03. Muzaffargarh 831 439 381 58
04. Rajanpur 763 393 294 99
Faisalabad Divn. 1791 1475 1402 73
01. Faisalabad 584 515 514 1
02. Chiniot 264 216 188 28
03. Jhang 616 481 444 37
04. T.T. Singh 327 263 256 7
Gujranwala Divn. 1727 1409 1308 101
01. Gujranwala 369 290 276 14
02. Gujrat 321 253 231 22
03. Hafizabad 235 197 164 33
04. M. B. Din 268 222 193 29
05. Narowal 232 195 194 1
06. Sialkot 302 252 250 2
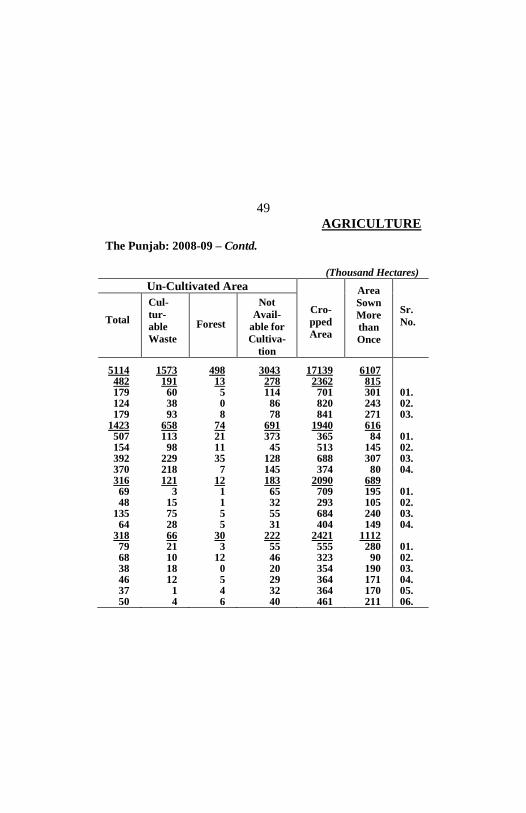
AGRICULTURE
49
The Punjab: 2008-09 – Contd.
(Thousand Hectares)
Un-Cultivated Area
Cro-
pped
Area
Area
Sown
More
than
Once
Sr.
No.
Total
Cul-
tur-
able
Waste
Forest
Not
Avail-
able for
Cultiva-
tion
5114 1573 498 3043 17139 6107 482 191 13 278 2362 815 179 60 5 114 701 301 01. 124 38 0 86 820 243 02. 179 93 8 78 841 271 03.
1423 658 74 691 1940 616 507 113 21 373 365 84 01. 154 98 11 45 513 145 02. 392 229 35 128 688 307 03. 370 218 7 145 374 80 04. 316 121 12 183 2090 689 69 3 1 65 709 195 01. 48 15 1 32 293 105 02.
135 75 5 55 684 240 03. 64 28 5 31 404 149 04.
318 66 30 222 2421 1112 79 21 3 55 555 280 01. 68 10 12 46 323 90 02. 38 18 0 20 354 190 03. 46 12 5 29 364 171 04. 37 1 4 32 364 170 05. 50 4 6 40 461 211 06.

AGRICULTURE
50
Table 2:- Land Use Statistics by Division and District
Sr.
No.
Division/
District
Reported
Area
Cultivated Area
Total Net
Sown
Current
Fallow
Lahore Divn. 1326 1024 920 104 01. Lahore 178 114 81 33 02. Kasur 469 361 349 12 03. Nankana Sahib 236 191 171 20 04. Sheikhupura 443 358 319 39 Multan Divn. 1524 1312 1238 74 01. Multan 379 303 256 47 02. Khanewal 428 367 360 7 03. Lodhran 280 249 239 10 04. Vehari 437 393 383 10 Rawalpindi Divn. 2246 990 718 272 01. Rawalpindi 525 231 184 47 02. Attock 693 315 224 91 03. Chakwal 669 319 244 75 04. Jhelum 359 125 66 59 Sahiwal Divn. 1031 849 835 14 01. Sahiwal 320 262 258 4 02. Okara 439 341 336 5 03. Pakpattan 272 246 241 5 Sargodha Divn. 2630 2052 1726 326 01. Sargodha 586 513 433 80 02. Bhakkar 813 716 691 25 03. Khushab 654 468 340 128 04. Mianwali 577 355 262 93 Islamabad 93 48 14 34

AGRICULTURE
51
The Punjab: 2008-09– Concld. (Thousand Hectares)
Un-Cultivated Area
Cro-pped Area
Area Sown More than Once
Sr. No.
Total
Cul-tur-able Waste
Forest
Not Available for Culti-va-tion
302 107 11 184 1531 612 64 5 1 58 183 103 01.
108 26 6 76 539 190 02. 45 25 0 20 316 145 03. 85 51 4 30 493 174 04.
212 74 5 133 2154 916 76 42 0 34 518 262 01. 61 26 4 31 576 216 02. 31 2 1 28 442 203 03. 44 4 0 40 618 235 04.
1256 199 244 813 826 108 294 75 68 151 230 46 01. 378 34 73 271 241 17 02. 350 34 58 258 257 13 03. 234 56 45 133 98 32 04. 182 65 7 110 1446 611 58 15 4 39 433 175 01. 98 44 2 52 615 279 02. 26 6 1 19 398 157 03.
578 90 91 397 2343 616 73 20 1 52 712 279 01. 97 13 36 48 853 162 02.
186 27 41 118 433 92 03. 222 30 13 179 345 83 04. 45 2 11 32 26 12
Source:- Bureau of Statistics, Punjab, Lahore.

AGRICULTURE
52
Table 3:- Number and Area of Farms
Sr.
No.
Size of Farm (Hectares)
Farms
(‘000’)
Number
% With
Total
All Farms 3864.2 100.0
Government Farms 0.1 -
Private Farms-Total 3864.1 100.0
01. Under 0.5 703.6 18.2
02. 0.5 to Under 1 617.3 16.0
03. 1 to Under 2 844.2 21.8
04. 2 to Under 3 597.9 15.5
05. 3 to Under 5 536.4 13.9
06. 5to Under 10 368.4 9.5
07. 10 to Under 20 149.0 3.9
08. 20 to Under 40 36.7 1.0
09. 40 to Under 60 5.7 0.1
10. 60.0 and Above 4.9 0.1

AGRICULTURE
53
By Size of Farm, The Punjab: 2000 Census
(Area in Thousand Hectares)
Farm Area Cultivated Area Sr.
No. Total % With
Total Total
% With
Total
11262.0 100.0 10313.6 100.0
26.8 0.2 18.3 0.2
11235.2 99.8 10295.3 99.8
201.1 1.8 191.3 1.8 01.
459.4 4.1 443.7 4.3 02.
1166.8 10.3 1124.4 10.9 03.
1403.9 12.5 1341.7 13.0 04.
2081.5 18.5 1955.0 19.0 05.
2422.3 21.5 2221.4 21.5 06.
1858.6 16.5 1645.8 16.0 07.
909.2 8.1 789.9 7.7 08.
263.1 2.3 211.3 2.0 09.
469.3 4.2 370.8 3.6 10.
Source:- Agricultural Census Organization, Govt. of Pakistan,
Lahore.

AGRICULTURE
54
Table 4 :- Rainfall at Selected Stations , The Punjab
(Millimeters)
Station 2006 2007 2008 2009 2010
Bahawalnagar 174 317 220 251 195
Bahawalpur 168 228 221 147 225
Faisalabad 444 352 657 377 545
Jhelum 1233 833 826 542 791
Khanpur 146 171 302 128 325
Lahore 751 660 614 372 540
Mianwali 425 753 858 472 948
Multan 156 262 248 119 287
Murree 1692 1521 1594 1280 1682
Rawalpindi 1598 1828 1388 607 1088
Sargodha 481 696 551 266 602
Shorkot 205 401 521 417 479
Sialkot 864 888 925 586 1027
Source:- Regional Meteorological Centre, 46-Jail Road, Lahore.

AGRICULTURE
55
Table 5:- Canal Withdrawals, The Punjab
(Million Acre Feet)
Year Total Kharif Rabi
2000-01 44.58 32.57 12.01
2001-02 40.42 28.71 11.71
2002-03 48.62 33.79 14.83
2003-04 55.38 37.47 17.91
2004-05 44.16 32.03 12.13
2005-06 55.11 38.04 17.07
2006-07 53.45 36.32 17.13
2007-08 55.40 39.32 16.08
2008-09 49.72 35.56 14.16
2009-10 50.74 36.52 14.22
Source:- Directorate of Water Resource Management WAPDA, Lahore

AGRICULTURE
56
Table 6:- Sale of Fertilizers by Type , The Punjab
(Thousand Nutrient Tons)
Year Total Nitrogenous Phosphatic Potassic
2000-01 2045 1554 474 17
2001-02 1935 1525 394 16
2002-03 2042 1573 453 16
2003-04 2255 1753 484 18
2004-05 2583 1915 640 28
2005-06 2690 2059 608 23
2006-07 2381 1671 673 37
2007-08 2497 2025 444 28
2008-09 2554 2058 462 34
2009-10 3143 2505 620 18
Source:- Director General Agriculture (Ext. & A.R.) Punjab, Lahore.

AGRICULTURE
57
Table 7:- Monthly Sale of Fertilizers, The Punjab
(Thousand Nutrient Tons)
Month 2005-
06
2006-
07
2007-
08
2008-
09
2009-
10
Total 2690 2381 2497 2554 3143
July 252 185 288 175 338
August 213 138 177 174 309
September 198 113 125 195 249
October 278 287 190 260 217
November 310 414 407 322 323
December 323 370 307 247 449
January 217 130 224 234 253
February 158 120 147 184 192
March 168 99 155 182 175
April 140 76 137 161 163
May 183 164 184 196 239
June 250 285 156 224 236
Source:- Director General Agriculture (Ext. & A.R.) Punjab, Lahore.
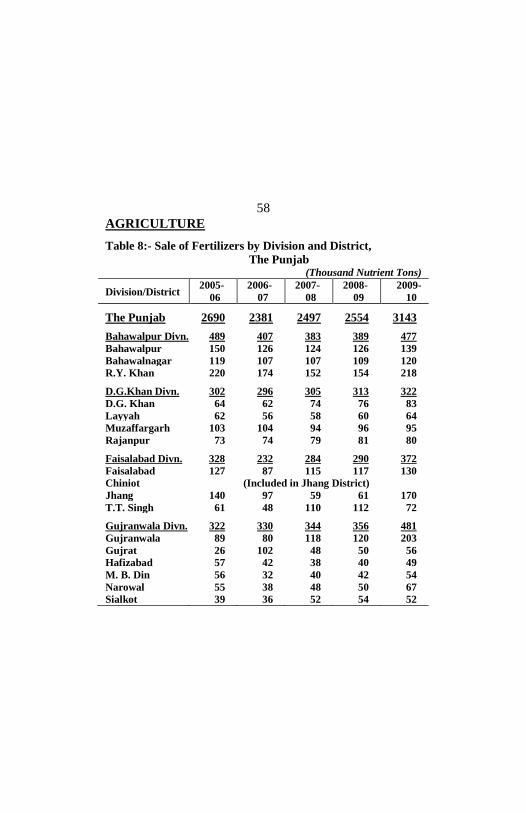
AGRICULTURE
58
Table 8:- Sale of Fertilizers by Division and District,
The Punjab (Thousand Nutrient Tons)
Division/District 2005-
06
2006-
07
2007-
08
2008-
09
2009-
10
The Punjab 2690 2381 2497 2554 3143 Bahawalpur Divn. 489 407 383 389 477
Bahawalpur 150 126 124 126 139
Bahawalnagar 119 107 107 109 120
R.Y. Khan 220 174 152 154 218 D.G.Khan Divn. 302 296 305 313 322
D.G. Khan 64 62 74 76 83
Layyah 62 56 58 60 64
Muzaffargarh 103 104 94 96 95
Rajanpur 73 74 79 81 80 Faisalabad Divn. 328 232 284 290 372
Faisalabad 127 87 115 117 130
Chiniot (Included in Jhang District)
Jhang 140 97 59 61 170
T.T. Singh 61 48 110 112 72 Gujranwala Divn. 322 330 344 356 481
Gujranwala 89 80 118 120 203
Gujrat 26 102 48 50 56
Hafizabad 57 42 38 40 49
M. B. Din 56 32 40 42 54
Narowal 55 38 48 50 67
Sialkot 39 36 52 54 52
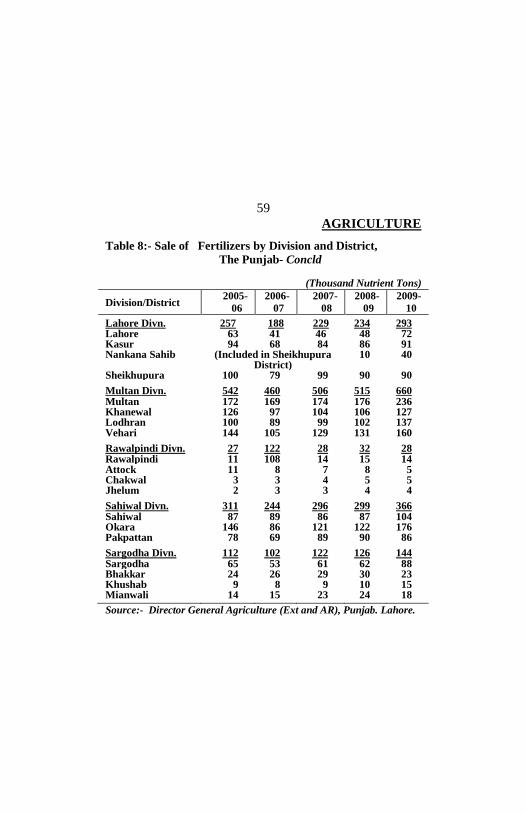
AGRICULTURE
59
Table 8:- Sale of Fertilizers by Division and District,
The Punjab- Concld
(Thousand Nutrient Tons)
Division/District 2005-
06
2006-
07
2007-
08
2008-
09
2009-
10 Lahore Divn. 257 188 229 234 293 Lahore 63 41 46 48 72 Kasur 94 68 84 86 91 Nankana Sahib (Included in Sheikhupura
District) 10 40
Sheikhupura 100 79 99 90 90 Multan Divn. 542 460 506 515 660 Multan 172 169 174 176 236 Khanewal 126 97 104 106 127 Lodhran 100 89 99 102 137 Vehari 144 105 129 131 160 Rawalpindi Divn. 27 122 28 32 28 Rawalpindi 11 108 14 15 14 Attock 11 8 7 8 5 Chakwal 3 3 4 5 5 Jhelum 2 3 3 4 4 Sahiwal Divn. 311 244 296 299 366 Sahiwal 87 89 86 87 104 Okara 146 86 121 122 176 Pakpattan 78 69 89 90 86 Sargodha Divn. 112 102 122 126 144 Sargodha 65 53 61 62 88 Bhakkar 24 26 29 30 23 Khushab 9 8 9 10 15 Mianwali 14 15 23 24 18 Source:- Director General Agriculture (Ext and AR), Punjab. Lahore.

AGRICULTURE
60
Table 9 :- Distribution of Indigenous Improved Seeds by
Crop, The Punjab
(Metric Tons)
Crop 2005-
06
2006-
07
2007-
08
2008-
09
2009-
10
Total 43674 54634 50188 43665 65542
Wheat 37715 49475 44360 37824 61239
Paddy 1978 2131 2576 2541 2202
Cotton 3277 2281 2060 2164 1255
Maize 192 80 178 95 151
Gram 47 60 54 67 77
Potato 465 607 960 974 618
Source:- Director Marketing, Punjab Seed Corporation, Lahore.

AGRICULTURE
61
Table 10:- Cropped Area by Crop, The Punjab: 2009-10
(Thousand Hectares)
Crop Cropped Area % of Total
The Punjab 16639* 100.0
Wheat 6914 41.6
Fodder 1909 11.5
Cotton 2436 14.6
Rice 1932 11.6
Gram 967 5.8
Sugarcane 607 3.6
Maize (AUTUMN) 391 2.3
Bajra 395 2.4
Rape and Mustard 111 0.7
Jowar 184 1.1
Potato 127 0.8
Others 666 4.0
* Includes Islamabad. Source:-Bureau of Statistics, Punjab, Lahore.

AGRICULTURE
62
Table 11:- Number of Mauzas and Cropped Area by
Division/District Number of
Mauzas
Cropped Area
(‘000’ Hectares)
The Punjab 26115 16639 Bahawalpur Divn. 3404 2321
Bahawalpur 916 709
Bahawalnagar 1118 817
R.Y. Khan 1370 795 D.G.Khan Divn. 3072 1960
D.G. Khan 828 376
Layyah 726 514
Muzaffargarh 984 672
Rajanpur 534 398 Faisalabad Divn. 2469 2063
Faisalabad 842 703
Chiniot 361 290
Jhang 722 680
T.T. Singh 544 390 Gujranwala Divn. 5672 2276
Gujranwala 837 549
Gujrat 1085 286
Hafizabad 422 354
Mandi Baha-ud-Din 433 340
Narowal 1316 311
Sialkot 1579 436
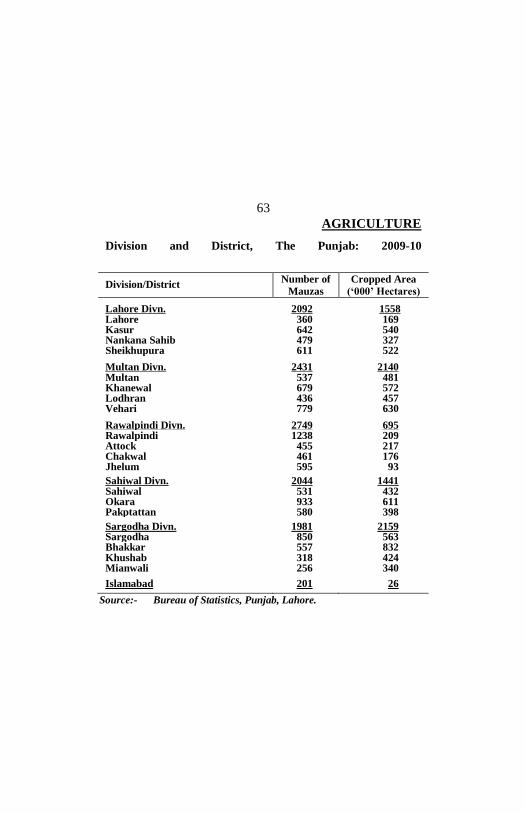
AGRICULTURE
63
Division and District, The Punjab: 2009-10
Division/District Number of
Mauzas
Cropped Area
(‘000’ Hectares) Lahore Divn. 2092 1558 Lahore 360 169 Kasur 642 540 Nankana Sahib 479 327 Sheikhupura 611 522 Multan Divn. 2431 2140 Multan 537 481 Khanewal 679 572 Lodhran 436 457 Vehari 779 630 Rawalpindi Divn. 2749 695 Rawalpindi 1238 209 Attock 455 217 Chakwal 461 176 Jhelum 595 93 Sahiwal Divn. 2044 1441 Sahiwal 531 432 Okara 933 611 Pakptattan 580 398 Sargodha Divn. 1981 2159 Sargodha 850 563 Bhakkar 557 832 Khushab 318 424 Mianwali 256 340 Islamabad 201 26
Source:- Bureau of Statistics, Punjab, Lahore.

AGRICULTURE
64
Table 12:- Area Sown, Un-Irrigated and Irrigated by Mode
Sr.
No.
Division/District
Total
Area
Sown
Un-
Irrigated
Irrigated
Total Canals
The Punjab 16639 1966 14673 3419 Bahawalpur Divn. 2321 31 2290 1132
01. Bahawalpur 709 7 702 231
02. Bahawalnagar 817 16 801 516
03. R.Y. Khan 795 8 787 385 D.G. Khan Divn. 1960 172 1788 313
01. D.G. Khan 376 29 347 128
02. Layyah 514 102 412 31
03. Muzaffargarh 672 14 658 80
04. Rajanpur 398 27 371 74 Faisalabad Divn. 2063 75 1988 782
01. Faisalabad 703 1 702 459
02. Chiniot 290 0 290 60
03. Jhang 680 74 606 29
04. T.T. Singh 390 0 390 234 Gujranwala Divn. 2276 235 2041 172
01. Gujranwala 549 3 546 129
02. Gujrat 286 125 161 31
03. Hafizabad 354 1 353 4
04. M. B. Din 340 4 336 3
05. Narowal 311 83 228 2
06. Sialkot 436 19 417 3
AGRICULTURE
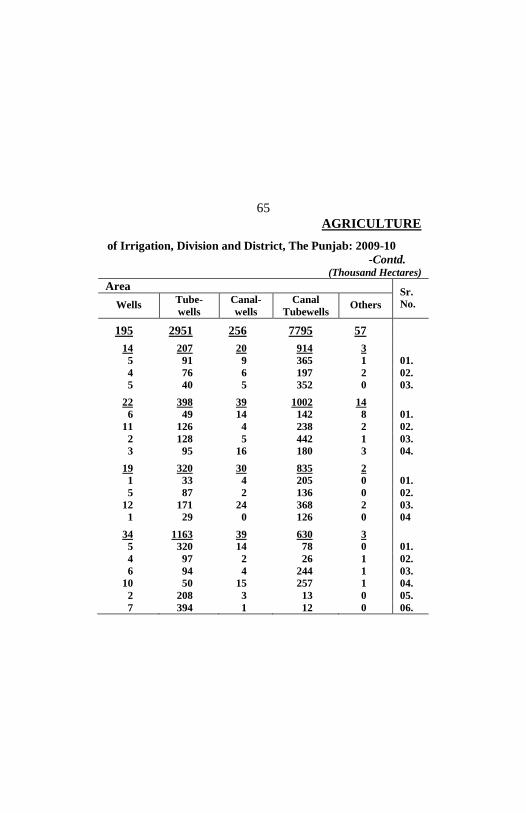
65
of Irrigation, Division and District, The Punjab: 2009-10
-Contd. (Thousand Hectares)
Area Sr.
No. Wells Tube-
wells
Canal-
wells
Canal
Tubewells Others
195 2951 256 7795 57
14 207 20 914 3
5 91 9 365 1 01.
4 76 6 197 2 02.
5 40 5 352 0 03.
22 398 39 1002 14
6 49 14 142 8 01.
11 126 4 238 2 02.
2 128 5 442 1 03.
3 95 16 180 3 04.
19 320 30 835 2
1 33 4 205 0 01.
5 87 2 136 0 02.
12 171 24 368 2 03.
1 29 0 126 0 04
34 1163 39 630 3
5 320 14 78 0 01.
4 97 2 26 1 02.
6 94 4 244 1 03.
10 50 15 257 1 04.
2 208 3 13 0 05.
7 394 1 12 0 06.

AGRICULTURE
66
Table 12:- Area Sown, Un-Irrigated and Irrigated by Mode
Sr.No.
Division/District
Total Area Sown
Un-Irri-gated
Irrigated
Total Canals
Lahore Divn. 1558 6 1552 274 01. Lahore 169 4 165 40 02. Kasur 540 2 538 216 03. Nankana Sahib 327 0 327 11 04. Sheikhupura 522 0 522 7 Multan Divn. 2140 15 2125 83 01. Multan 481 13 468 9 02. Khanewal 572 2 570 27 03. Lodhran 457 0 457 38 04. Vehari 630 0 630 9 Rawalpindi Divn. 695 615 80 6 01. Rawalpindi 209 198 11 2 02. Attock 217 189 28 2 03. Chakwal 176 165 11 2 04. Jhelum 93 63 30 0 Sahiwal Divn. 1441 1 1440 132 01. Sahiwal 432 1 431 50 02. Okara 611 0 611 81 03. Pakpattan 398 0 398 1 Sargodha Divn. 2159 791 1368 525 01. Sargodha 563 1 562 207 02. Bhakkar 832 427 405 128 03. Khushab 424 278 146 85 04. Mianwali 340 85 255 105
Islamabad 26 25 1 0
AGRICULTURE
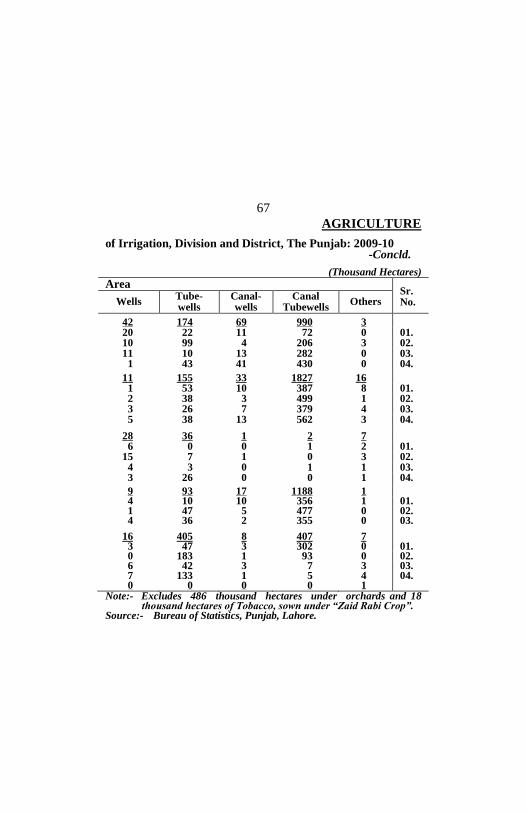
67
of Irrigation, Division and District, The Punjab: 2009-10 -Concld.
(Thousand Hectares)
Area Sr. No. Wells
Tube-wells
Canal-wells
Canal Tubewells
Others
42 174 69 990 3 20 22 11 72 0 01. 10 99 4 206 3 02. 11 10 13 282 0 03.
1 43 41 430 0 04.
11 155 33 1827 16 1 53 10 387 8 01. 2 38 3 499 1 02. 3 26 7 379 4 03. 5 38 13 562 3 04.
28 36 1 2 7 6 0 0 1 2 01.
15 7 1 0 3 02. 4 3 0 1 1 03. 3 26 0 0 1 04.
9 93 17 1188 1 4 10 10 356 1 01. 1 47 5 477 0 02. 4 36 2 355 0 03.
16 405 8 407 7 3 47 3 302 0 01. 0 183 1 93 0 02. 6 42 3 7 3 03. 7 133 1 5 4 04. 0 0 0 0 1
Note:- Excludes 486 thousand hectares under orchards and 18 thousand hectares of Tobacco, sown under “Zaid Rabi Crop”.
Source:- Bureau of Statistics, Punjab, Lahore.

AGRICULTURE
68
Table 13:- Area Irrigated by Mode of Irrigation, The Punjab
(Thousand Hectares)
Mode of
Irrigation
2005-
06
2006-
07
2007-
08
2008-
09
2009-
10
Total 14057 14063 14219 14437 14673
Canals 3462 3400 3465 3436 3419
Canal-
Tubewells
7419
7423
7507
7654
7795
Canal-Wells 198 213 166 191 256
Wells 152 140 174 184 195
Tubewells 2784 2846 2852 2912 2951
Others 42 41 55 60 57
Note:- Excludes the Irrigated area of Tobacco Sown under ‘Zaid Rabi
Crop and area under orchards.
Source:- Bureau of Statistics, Punjab, Lahore.

AGRICULTURE
69
Table 14:- Area Sown Under Major Crops by Mode of
Irrigation, The Punjab
(Thousand Hectares)
Mode of Irrigation 2005-
06
2006-
07
2007-
08
2008-
09
2009-
10
WHEAT*
Area Sown
6484
6433
6402
6836
6914
Un-Irrigated Area 653 710 660 692 550
Irrigated Area
5831
5723
5742
6144
6364
Canals 1341 1318 1346 1392 1438
Wells 60 59 84 80 95
Tubewells 1361 1350 1337 1431 1466
Canal-Wells 82 79 73 77 117
Canal-Tubewells 2967 2895 2873 3141 3223
Others 20 22 29 23 25
* Includes Islamabad

AGRICULTURE
70
Table 14:- Area Sown Under Major Crops by Mode of
Irrigation, The Punjab - Contd.
(Thousand Hectares)
Mode of Irrigation 2006-
07
2007-
08
2008-
09
2009-
10
2010-
11
RICE
Area Sown
1728
1724
1978
1932
1767
Un-Irrigated Area 16 16 20 13 1
Irrigated Area
1712
1708
1958
1919
1766
Canals 218 223 259 242 203
Wells 17 16 29 29 27
Tubewells 484 499 543 522 477
Canal-Wells 51 35 40 49 57
Canal-Tubewells 941 931 1083 1074 984
Others
1 4 4 3 18

AGRICULTURE
71
Table 14:- Area Sown Under Major Crops by Mode of
Irrigation, The Punjab - Contd.
(Thousand Hectares)
Mode of Irrigation 2006-
07
2007-
08
2008-
09
2009-
10
2010-
11
SUGARCANE
Area Sown
712
827
667
607
672
Un-Irrigated Area 3 3 4 2 0
Irrigated Area
709
824
663
605
672
Canals 234 272 212 193 201
Wells 5 7 7 5 5
Tubewells 99 124 85 81 93
Canal-Wells 10 6 8 8 10
Canal-Tubewells 360 413 350 317 359
Others 1 2 1 1 4

AGRICULTURE
72
Table 14:- Area Sown Under Major Crops by Mode of
Irrigation, The Punjab - Concld.
(Thousand Hectares)
Mode of Irrigation 2006-
07
2007-
08
2008-
09
2009-
10
2010-
11
COTTON
Area Sown
2463
2425
2224
2436
2201
Un-Irrigated Area 20 38 33 18 -
Irrigated Area
2443
2387
2191
2418
2201
Canals 652 654 613 663 585
Wells 15 14 15 12 13
Tubewells 255 224 201 270 237
Canal-Wells 21 13 16 33 20
Canal-Tubewells 1496 1478 1340 1433 1316
Others 4 4 6 7 30
Source:- Bureau of Statistics, Punjab, Lahore.

AGRICULTURE
73
Table 15:- Production of Important Crops, Pakistan and
The Punjab
(Thousand Metric Tons)
Crop
2008-09 2009-10
Pak-
istan
Pun-
jab
%
Share
of the
Punjab
Pak-
istan
Pun-
jab
%
Share
of the
Punjab Wheat 24033 18420 76.6 23311 17919 76.9
Cotton
(‘000’
Bales)
11819
8751
74.0
12913
8552
66.2
Sugarcane 50045 32295 64.5 49373 31324 63.4
Rice(Total) 6952 3643 52.4 6883 3713 53.9
i) Basmati
ii) Medium
& Coarse
2901
4051
2602
1041
89.7
25.7
2732
4151
2475
1238
90.6
29.8
Maize 3593 2627 73.1 3262 2502 76.7
Gram 740 658 88.9 562 488 86.9
Rape Seed
& Mustard 188 114 60.9 151 96 63.6
Source:- Ministry of Food and Agriculture, Government of Pakistan,
Islamabad.

AGRICULTURE
74
Table 16:- Area, Production and Yield-Rate of Important
Crops, The Punjab
Item 2006-
07
2007-
08
2008-
09
2009-
10
2010-
11
RICE* Area
(‘000’ Hectares)
1728
1724
1978
1932
1767
Production (Cleaned)
(‘000’ Tonnes)
3076
3286
3643
3713
3384
Yield Per Hectare
(Kgs.)
1779
1907
1842
1922
1915
BAJRA Area (‘000’ Hectares) 367 368 387 395 394
Irrigated 216 220 235 255 279
Un-Irrigated 151 148 152 140 115
Production
(‘000’ Tonnes)
217
224
247
245
270
Irrigated 164 171 189 200 221
Un-Irrigated 53 53 58 45 49
Yield Per Hectare
(Kgs.)
591
608
639
620
686
Irrigated 760 776 805 785 792
Un-Irrigated 351 358 382 321 429

AGRICULTURE
75
Table 16:- Area, Production and Yield-Rate of Important
Crops, The Punjab – Contd.
Item 2006-
07
2007-
08
2008-
09
2009-
10
2010-
11
JOWAR
Area(‘000’ Hectares) 184 189 183 184 180
Irrigated 86 88 90 102 94
Un-Irrigated 98 101 93 82 86
Production
(‘000’ Tonnes)
101
104
103
104
107
Irrigated 62 65 65 72 69
Un-Irrigated 39 39 38 32 38
Yield Per Hectare
(Kgs.)
549
553
562
562
594
Irrigated 721 739 720 700 735
Un-Irrigated 398 386 409 390 439
COTTON Area (‘000’ Hectares) 2463 2425 2223 2436 2201
Irrigated 2443 2387 2191 2418 2201
Un-Irrigated 20 38 32 18 -
Production
(‘000’ Bales)
10350
9062
8751
8552
7854
Yield Per Hectare
(Kgs.)
715
636
630
597
607
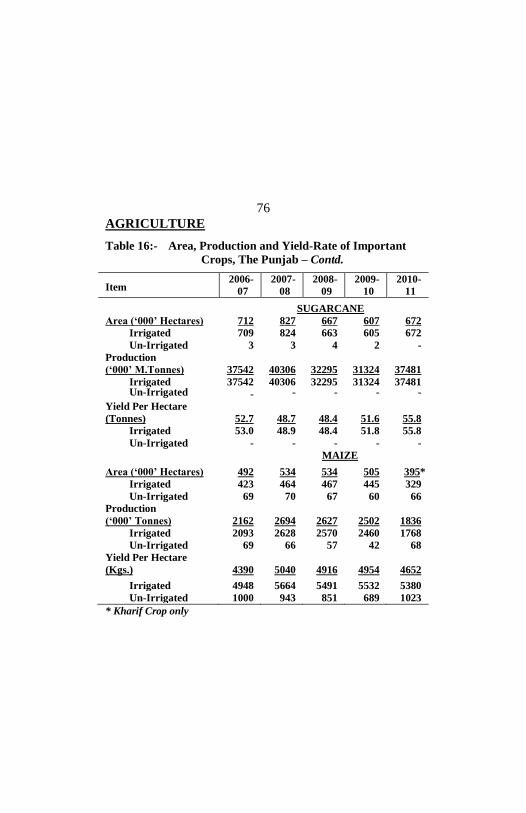
AGRICULTURE
76
Table 16:- Area, Production and Yield-Rate of Important
Crops, The Punjab – Contd.
Item 2006-
07
2007-
08
2008-
09
2009-
10
2010-
11 SUGARCANE
Area (‘000’ Hectares) 712 827 667 607 672
Irrigated 709 824 663 605 672
Un-Irrigated 3 3 4 2 -
Production
(‘000’ M.Tonnes)
37542
40306
32295
31324
37481
Irrigated 37542 40306 32295 31324 37481 Un-Irrigated - - - - -
Yield Per Hectare
(Tonnes)
52.7
48.7
48.4
51.6
55.8
Irrigated 53.0 48.9 48.4 51.8 55.8
Un-Irrigated - - - - -
MAIZE Area (‘000’ Hectares) 492 534 534 505 395*
Irrigated 423 464 467 445 329
Un-Irrigated 69 70 67 60 66
Production
(‘000’ Tonnes)
2162
2694
2627
2502
1836
Irrigated 2093 2628 2570 2460 1768
Un-Irrigated 69 66 57 42 68
Yield Per Hectare
(Kgs.)
4390
5040
4916
4954
4652
Irrigated 4948 5664 5491 5532 5380
Un-Irrigated 1000 943 851 689 1023
* Kharif Crop only
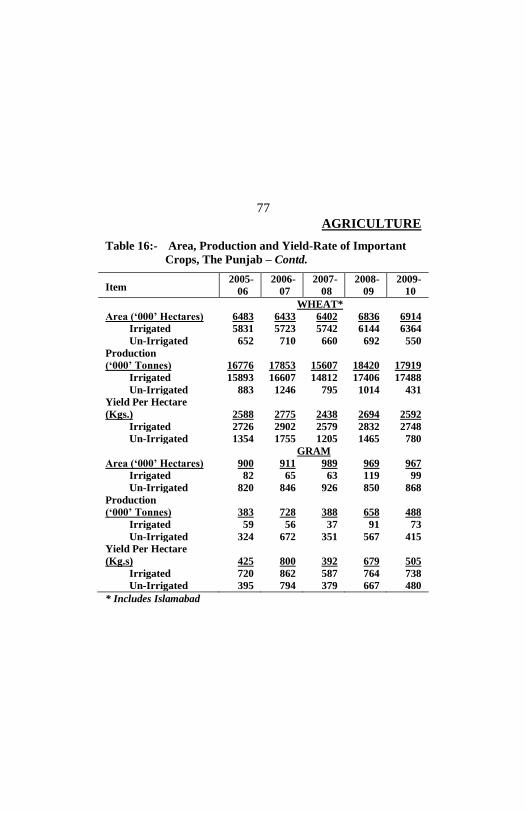
AGRICULTURE
77
Table 16:- Area, Production and Yield-Rate of Important
Crops, The Punjab – Contd.
Item 2005-
06
2006-
07
2007-
08
2008-
09
2009-
10
WHEAT*
Area (‘000’ Hectares) 6483 6433 6402 6836 6914
Irrigated 5831 5723 5742 6144 6364
Un-Irrigated 652 710 660 692 550
Production
(‘000’ Tonnes)
16776
17853
15607
18420
17919
Irrigated 15893 16607 14812 17406 17488
Un-Irrigated 883 1246 795 1014 431
Yield Per Hectare
(Kgs.)
2588
2775
2438
2694
2592
Irrigated 2726 2902 2579 2832 2748
Un-Irrigated 1354 1755 1205 1465 780
GRAM
Area (‘000’ Hectares) 900 911 989 969 967
Irrigated 82 65 63 119 99
Un-Irrigated 820 846 926 850 868
Production
(‘000’ Tonnes)
383
728
388
658
488
Irrigated 59 56 37 91 73
Un-Irrigated 324 672 351 567 415
Yield Per Hectare
(Kg.s)
425
800
392
679
505
Irrigated 720 862 587 764 738
Un-Irrigated 395 794 379 667 480
* Includes Islamabad

AGRICULTURE
78
Table 16:- Area, Production and Yield-Rate of Important
Crops, The Punjab – Contd.
Item 2005-
06
2006-
07
2007-
08
2008-
09
2009-
10
BARLEY
Area (‘000’ Hectares) 35 37 33 33 32
Irrigated 26 27 24 24 24
Un-Irrigated 9 10 9 9 8
Production
(‘000’Tonnes)
32
35
29
30
28
Irrigated 26 27 24 25 23
Un-Irrigated 6 8 5 5 5
Yield Per Hectare
(Kgs.)
920
935
881
921
897
Irrigated 1000 1000 1000 1008 980
Un-Irrigated 667 800 556 556 630
RAPE & MUSTARD
Area (‘000’ Hectares) 128 136 127 143 111
Irrigated 95 95 91 101 82
Un-Irrigated 33 41 36 42 29
Production
(‘000’Tonnes)
109
120
103
121
96
Irrigated 88 94 83 96 80
Un-Irrigated 21 26 20 25 16
Yield Per Hectare
(Kgs.)
851
886
817
844
863
Irrigated 926 989 912 947 974
Un-Irrigated 636 634 556 595 550

AGRICULTURE
79
Table 16:- Area, Production and Yield-Rate of Important
Crops, The Punjab – Concld.
Item 2005-
06
2006-
07
2007-
08
2008-
09
2009-
10
TOBACCO*
Area (‘000’ Hectares)
18 18 17 16 18
Production
(‘000’ M.Tons)
22
22
20
20
24
Yield Per Hectare
(Kgs.)
1220
1222
1199
1229
1317
* Area and production of Rice and Tobacco is entirely irrigated.
Source:- i) For area except tobacco:-
Bureau of Statistics, Punjab,
Lahore.
ii) For area of Tobacco and Production of all the
Crops:-
Directorate of Agriculture, Crop Reporting
Service, Punjab, Lahore.

AGRICULTURE
80
Table 17 :- Area and Production of Wheat by Division
Division/District
Area (‘000’
Hectares)
Production (‘000’
M. Tons)
Total Irri-
gated Total
Irri-
gated
The Punjab 6914 6364 17919 17488 Bahawalpur Divn. 991 979 2832 2821
Bahawalpur 305 302 861 859
Bahawalnagar 354 350 1059 1056
Rahim Yar Khan 332 327 912 906 D.G.Khan Divn. 864 832 2275 2250
D.G. Khan 178 165 449 436
Layyah 202 197 515 512
Muzaffargarh 316 309 859 854
Rajanpur 168 161 452 448 Faisalabad Divn. 870 869 2421 2420
Faisalabad 303 303 861 861
Chiniot 120 120 328 328
Jhang 283 282 772 771
T.T. Singh 164 164 460 460 Gujranwala Divn. 1049 934 2481 2385
Gujranwala 234 233 754 752
Gujrat 143 80 206 153
Hafizabad 161 161 412 412
Mandi Baha-ud-Din 135 133 348 346
Narowal 167 127 307 277
Sialkot 209 200 454 445

AGRICULTURE
81
and District: The Punjab: 2009-10
Division/District
Area (‘000’ Hectares)
Production (‘000’ M. Tons)
Total Irri-gated Total
Irri-gated
Lahore Divn. 638 636 1666 1663 Lahore 64 63 164 162 Kasur 210 209 570 569 Nankana Sahib 141 141 374 374 Sheikhupura 223 223 558 558 Multan Divn. 927 920 2640 2633 Multan 208 202 520 514 Khanewal 242 241 729 728 Lodhran 204 204 603 603 Vehari 273 273 788 788 Rawalpindi Divn. 356 41 337 97 Rawalpindi 98 5 88 10 Attock 146 16 143 38 Chakwal 67 5 41 12 Jhelum 45 15 65 37 Sahiwal Divn. 531 531 1783 1782 Sahiwal 151 151 456 455 Okara 221 221 753 753 Pakpattan 159 159 574 574 Sargodha Divn. 675 622 1472 1437 Sargodha 225 225 505 505 Bhakkar 185 178 426 420 Khushab 83 71 159 151 Mianwali 182 148 382 361 (Islamabad) 13 0 12 0 Source:- Directorate of Agriculture, Crop Reporting Service, Punjab,
Lahore.

AGRICULTURE
82
Table 18:- Area and Production of Rice by Division and
Division/District
Rice
2009-10 2010-11 Area
(‘000’
Hec-
tares)
Produc-
tion
(‘000’
Tonnes)
Area
(‘000’
Hec-
tares)
Produc-
tion
(‘000’
Tonnes)
The Punjab 1932 3713 1767 3384 Bahawalpur Divn. 100 194 92 172 Bahawalpur 7 11 6 10 Bahawalnagar 67 139 63 127 Rahim Yar Khan 26 44 23 35 D.G.Khan Divn. 91 189 53 103 D.G. Khan 41 98 29 61 Layyah 10 17 4 7 Muzaffargarh 27 47 15 26 Rajanpur 13 27 5 9 Faisalabad Divn. 169 284 151 276 Faisalabad 33 54 26 47 Chiniot 34 56 33 64 Jhang 66 110 59 103 T.T. Singh 36 64 33 62 Gujranwala Divn. 777 1563 735 1442 Gujranwala 248 549 241 507 Gujrat 45 76 41 64 Hafizabad 133 277 127 263 Mandi Baha-ud-Din 88 161 82 138 Narowal 92 147 90 158 Sialkot 171 353 154 312

AGRICULTURE
83
District: The Punjab: 2009-10 and 2010-2011 Division/District
Rice
2009-10 2010-11 Area (‘000’ Hec-tares)
Produc-tion (‘000’ Tonnes)
Area (‘000’ Hec-tares)
Produc-tion (‘000’ Tonnes)
Lahore Divn. 433 786 410 717 Lahore 35 63 33 59 Kasur 90 169 79 147 Nankana Sahib 102 184 96 173 Sheikhupura 206 370 202 338 Multan Divn. 77 122 67 115 Multan 14 21 11 17 Khanewal 26 44 25 43 Lodhran 10 15 7 11 Vehari 27 42 24 44 Rawalpindi Divn. 2 2 1 2 Rawalpindi 0 0 0 0 Attock 0 0 0 0 Chakwal 0 0 0 0 Jhelum 2 2 1 2 Sahiwal Divn. 207 455 196 458 Sahiwal 30 54 27 55 Okara 125 280 122 287 Pakpattan 52 121 47 116 Sargodha Divn. 76 118 62 101 Sargodha 48 81 40 63 Bhakkar 2 4 1 2 Khushab 22 28 18 30 Mianwali 4 5 3 6 Note:- Area sown and production of rice is almost irrigated. Source:- Directorate of Agriculture, Crop Reporting Service, Punjab,
Lahore.

AGRICULTURE
84
Table 19:- Area and Production of Cotton by Division and
Division/District
Cotton
2009-10 2010-11 Area
(‘000’
Hec-
tares)
Produc-
tion
(Lint)
(‘000’
Bales)
Area
(‘000’
Hec-
tares)
Produc-
tion (Lint)
(‘000’
Bales)
The Punjab 2436 8552 2201 7854 Bahawalpur Divn. 790 3010 745 2904 Bahawalpur 282 969 272 1100 Bahawalnagar 232 898 226 927 Rahim Yar Khan 276 1143 247 877 D.G.Khan Divn. 465 1597 262 894 D.G. Khan 98 356 66 213 Layyah 49 127 44 112 Muzaffargarh 176 488 94 385 Rajanpur 142 626 58 184 Faisalabad Divn. 180 452 166 410 Faisalabad 52 151 51 130 Chiniot 3 7 3 6 Jhang 70 151 64 162 T.T. Singh 55 143 48 112 Gujranwala Divn. 2 3 2 2 Gujranwala 0 0 0 0 Gujrat 0 0 0 0 Hafizabad 0 0 0 0 Mandi Baha-ud-Din 2 3 2 2 Narowal 0 0 0 0 Sialkot 0 0 0 0
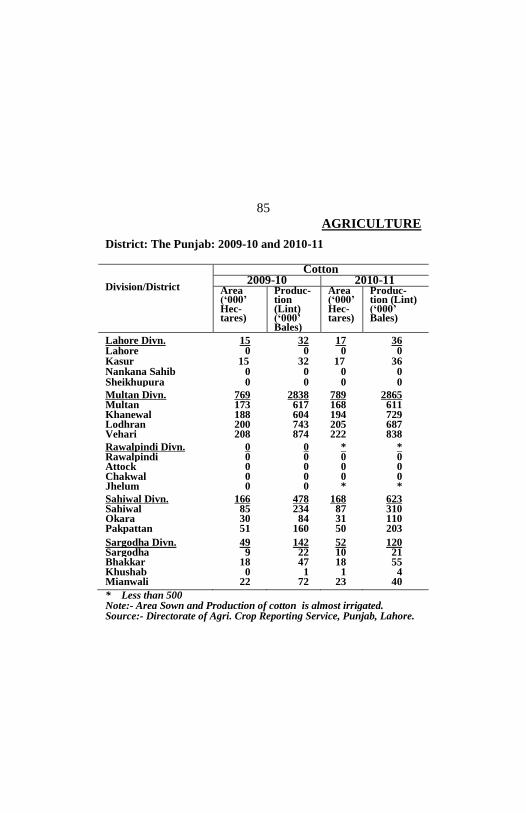
AGRICULTURE
85
District: The Punjab: 2009-10 and 2010-11
Division/District
Cotton 2009-10 2010-11
Area (‘000’ Hec-tares)
Produc-tion (Lint) (‘000’ Bales)
Area (‘000’ Hec-tares)
Produc-tion (Lint) (‘000’ Bales)
Lahore Divn. 15 32 17 36 Lahore 0 0 0 0 Kasur 15 32 17 36 Nankana Sahib 0 0 0 0 Sheikhupura 0 0 0 0 Multan Divn. 769 2838 789 2865 Multan 173 617 168 611 Khanewal 188 604 194 729 Lodhran 200 743 205 687 Vehari 208 874 222 838 Rawalpindi Divn. 0 0 * * Rawalpindi 0 0 0 0 Attock 0 0 0 0 Chakwal 0 0 0 0 Jhelum 0 0 * * Sahiwal Divn. 166 478 168 623 Sahiwal 85 234 87 310 Okara 30 84 31 110 Pakpattan 51 160 50 203 Sargodha Divn. 49 142 52 120 Sargodha 9 22 10 21 Bhakkar 18 47 18 55 Khushab 0 1 1 4 Mianwali 22 72 23 40 * Less than 500 Note:- Area Sown and Production of cotton is almost irrigated. Source:- Directorate of Agri. Crop Reporting Service, Punjab, Lahore.

AGRICULTURE
86
Table 20:- Area and Production of Sugarcane by Division and
Division/District
Sugarcane 2009-10 2010-11
Area (‘000’ Hec-tares)
Produc-tion (‘000’ Tonnes)
Area (‘000’ Hec-tares)
Produc-tion (‘000’ Tonnes)
The Punjab 607 31324 672 37481 Bahawalpur Divn. 106 6611 125 8503 Bahawalpur 11 592 15 1023 Bahawalnagar 14 704 16 958 Rahim Yar Khan 81 5315 94 6522 D.G Khan Divn. 60 3465 51 2858 D.G. Khan 4 197 2 138 Layyah 12 623 9 467 Muzaffargarh 31 1671 28 1452 Rajanpur 13 974 12 801 Faisalabad Divn. 212 10494 240 13072 Faisalabad 96 4690 105 5472 Chiniot 4150 1962 44 2455 Jhang 41 2016 49 2723 T.T. Singh 36 1826 42 2422 Gujranwala Divn. 41 1660 47 2040 Gujranwala 2 75 2 97 Gujrat 2 93 2 107 Hafizabad 6 214 5 206 Mandi Baha-ud-Din 28 1193 34 1518 Narowal 2 49 2 61
Sialkot 1 36 2 51
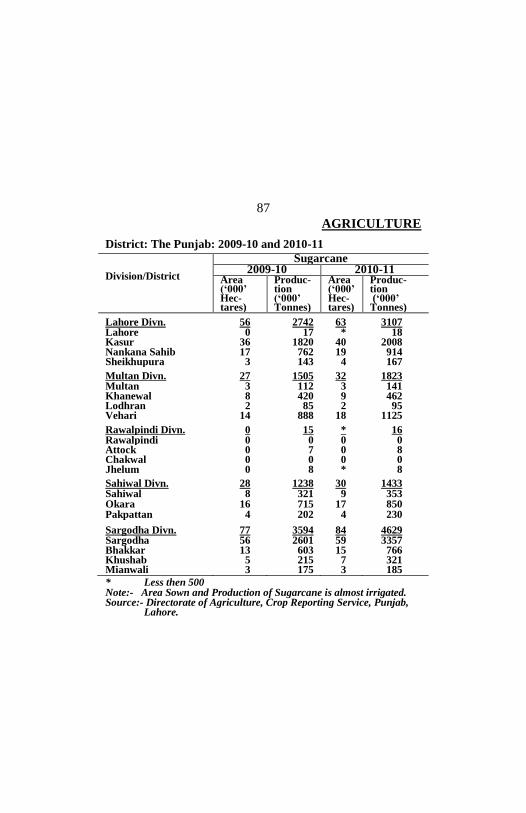
AGRICULTURE
87
District: The Punjab: 2009-10 and 2010-11
Division/District
Sugarcane 2009-10 2010-11
Area (‘000’ Hec-tares)
Produc-tion (‘000’ Tonnes)
Area (‘000’ Hec-tares)
Produc-tion (‘000’ Tonnes)
Lahore Divn. 56 2742 63 3107 Lahore 0 17 * 18 Kasur 36 1820 40 2008 Nankana Sahib 17 762 19 914 Sheikhupura 3 143 4 167 Multan Divn. 27 1505 32 1823 Multan 3 112 3 141 Khanewal 8 420 9 462 Lodhran 2 85 2 95 Vehari 14 888 18 1125 Rawalpindi Divn. 0 15 * 16 Rawalpindi 0 0 0 0 Attock 0 7 0 8 Chakwal 0 0 0 0 Jhelum 0 8 * 8 Sahiwal Divn. 28 1238 30 1433 Sahiwal 8 321 9 353 Okara 16 715 17 850 Pakpattan 4 202 4 230 Sargodha Divn. 77 3594 84 4629 Sargodha 56 2601 59 3357 Bhakkar 13 603 15 766 Khushab 5 215 7 321 Mianwali 3 175 3 185
* Less then 500 Note:- Area Sown and Production of Sugarcane is almost irrigated. Source:- Directorate of Agriculture, Crop Reporting Service, Punjab, Lahore.
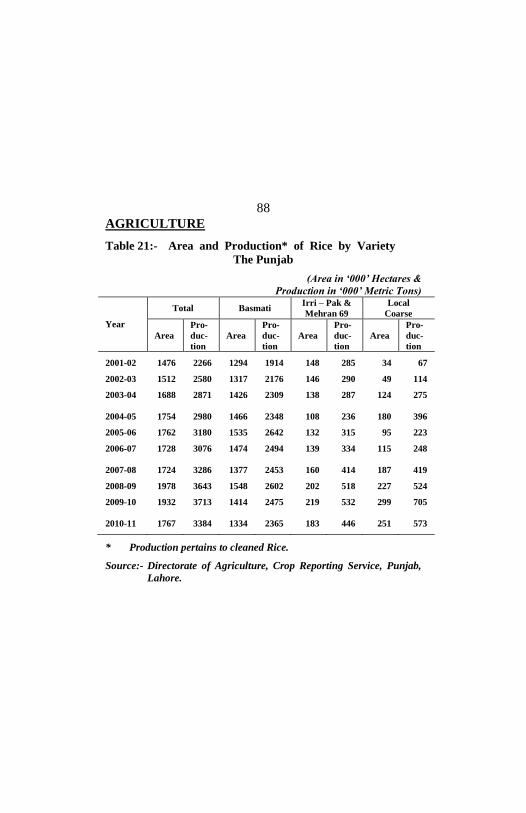
AGRICULTURE
88
Table 21:- Area and Production* of Rice by Variety
The Punjab
(Area in ‘000’ Hectares &
Production in ‘000’ Metric Tons)
Year
Total Basmati Irri – Pak &
Mehran 69
Local
Coarse
Area
Pro-
duc-
tion
Area
Pro-
duc-
tion
Area
Pro-
duc-
tion
Area
Pro-
duc-
tion 2001-02 1476 2266 1294 1914 148 285 34 67
2002-03 1512 2580 1317 2176 146 290 49 114
2003-04 1688 2871 1426 2309 138 287 124 275
2004-05 1754 2980 1466 2348 108 236 180 396
2005-06 1762 3180 1535 2642 132 315 95 223
2006-07 1728 3076 1474 2494 139 334 115 248
2007-08 1724 3286 1377 2453 160 414 187 419
2008-09 1978 3643 1548 2602 202 518 227 524
2009-10 1932 3713 1414 2475 219 532 299 705
2010-11 1767 3384 1334 2365 183 446 251 573
* Production pertains to cleaned Rice. Source:- Directorate of Agriculture, Crop Reporting Service, Punjab,
Lahore.
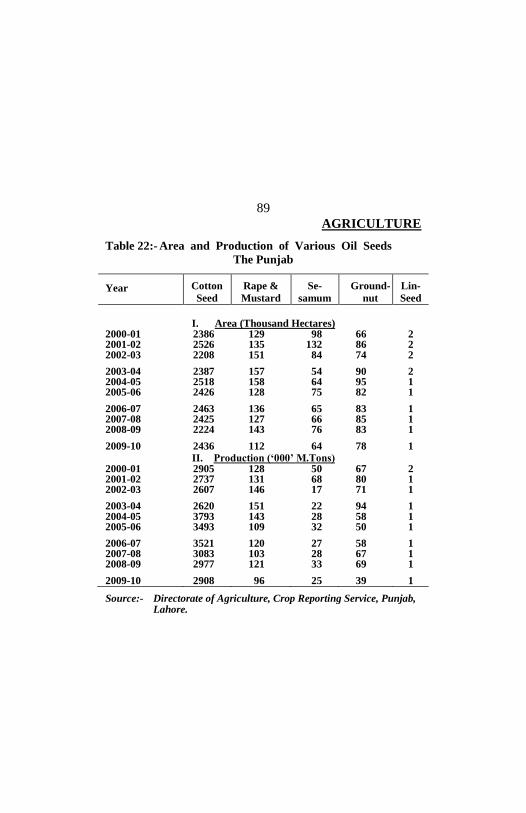
AGRICULTURE
89
Table 22:- Area and Production of Various Oil Seeds
The Punjab Year Cotton
Seed
Rape &
Mustard
Se-
samum
Ground-
nut
Lin-
Seed
I. Area (Thousand Hectares) 2000-01 2386 129 98 66 2 2001-02 2526 135 132 86 2 2002-03 2208 151 84 74 2 2003-04 2387 157 54 90 2 2004-05 2518 158 64 95 1 2005-06 2426 128 75 82 1 2006-07 2463 136 65 83 1 2007-08 2425 127 66 85 1 2008-09 2224 143 76 83 1 2009-10 2436 112 64 78 1
II. Production (‘000’ M.Tons) 2000-01 2905 128 50 67 2 2001-02 2737 131 68 80 1 2002-03 2607 146 17 71 1 2003-04 2620 151 22 94 1 2004-05 3793 143 28 58 1 2005-06 3493 109 32 50 1 2006-07 3521 120 27 58 1 2007-08 3083 103 28 67 1 2008-09 2977 121 33 69 1 2009-10 2908 96 25 39 1 Source:- Directorate of Agriculture, Crop Reporting Service, Punjab, Lahore.
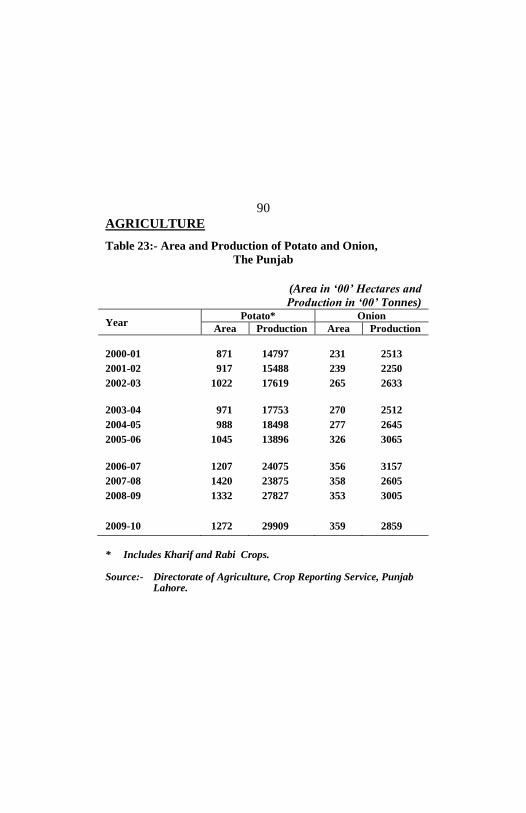
AGRICULTURE
90
Table 23:- Area and Production of Potato and Onion,
The Punjab
(Area in ‘00’ Hectares and
Production in ‘00’ Tonnes)
Year Potato* Onion
Area Production Area Production
2000-01 871 14797 231 2513
2001-02 917 15488 239 2250
2002-03 1022 17619 265 2633
2003-04 971 17753 270 2512
2004-05 988 18498 277 2645
2005-06 1045 13896 326 3065
2006-07 1207 24075 356 3157
2007-08 1420 23875 358 2605
2008-09 1332 27827 353 3005
2009-10 1272 29909 359 2859
* Includes Kharif and Rabi Crops. Source:- Directorate of Agriculture, Crop Reporting Service, Punjab Lahore.
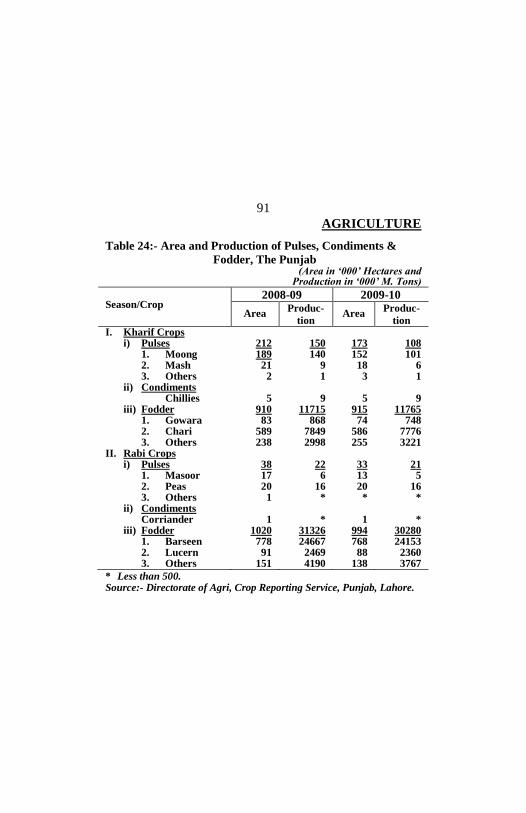
AGRICULTURE
91
Table 24:- Area and Production of Pulses, Condiments &
Fodder, The Punjab (Area in ‘000’ Hectares and
Production in ‘000’ M. Tons)
Season/Crop 2008-09 2009-10
Area Produc-
tion Area
Produc-
tion I. Kharif Crops i) Pulses 212 150 173 108 1. Moong 189 140 152 101 2. Mash 21 9 18 6 3. Others 2 1 3 1 ii) Condiments Chillies 5 9 5 9 iii) Fodder 910 11715 915 11765 1. Gowara 83 868 74 748 2. Chari 589 7849 586 7776 3. Others 238 2998 255 3221 II. Rabi Crops i) Pulses 38 22 33 21 1. Masoor 17 6 13 5 2. Peas 20 16 20 16 3. Others 1 * * * ii) Condiments Corriander 1 * 1 * iii) Fodder 1020 31326 994 30280 1. Barseen 778 24667 768 24153 2. Lucern 91 2469 88 2360 3. Others 151 4190 138 3767
* Less than 500. Source:- Directorate of Agri, Crop Reporting Service, Punjab, Lahore.
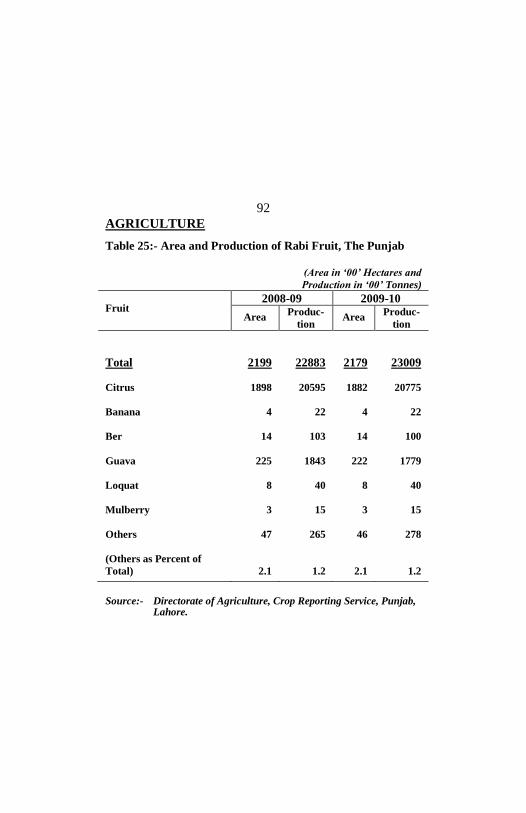
AGRICULTURE
92
Table 25:- Area and Production of Rabi Fruit, The Punjab
(Area in ‘00’ Hectares and
Production in ‘00’ Tonnes)
Fruit 2008-09 2009-10
Area Produc-
tion Area
Produc-
tion
Total 2199 22883 2179 23009
Citrus 1898 20595 1882 20775
Banana 4 22 4 22
Ber 14 103 14 100
Guava 225 1843 222 1779
Loquat 8 40 8 40
Mulberry 3 15 3 15
Others 47 265 46 278
(Others as Percent of
Total)
2.1
1.2
2.1
1.2
Source:- Directorate of Agriculture, Crop Reporting Service, Punjab, Lahore.
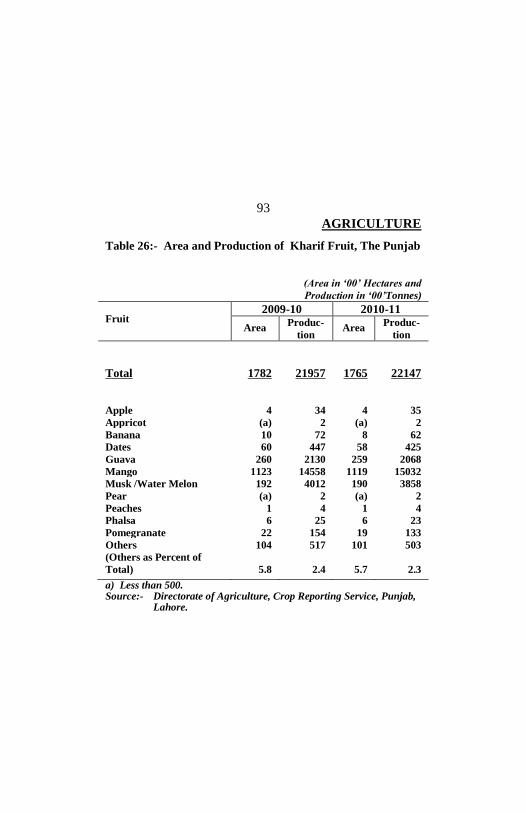
AGRICULTURE
93
Table 26:- Area and Production of Kharif Fruit, The Punjab
(Area in ‘00’ Hectares and
Production in ‘00’Tonnes)
Fruit 2009-10 2010-11
Area Produc-
tion Area
Produc-
tion
Total 1782 21957 1765 22147
Apple 4 34 4 35
Appricot (a) 2 (a) 2
Banana 10 72 8 62
Dates 60 447 58 425
Guava 260 2130 259 2068
Mango 1123 14558 1119 15032
Musk /Water Melon 192 4012 190 3858
Pear (a) 2 (a) 2
Peaches 1 4 1 4
Phalsa 6 25 6 23
Pomegranate 22 154 19 133
Others 104 517 101 503
(Others as Percent of
Total)
5.8
2.4
5.7
2.3
a) Less than 500. Source:- Directorate of Agriculture, Crop Reporting Service, Punjab, Lahore.

AGRICULTURE
94
Table 27 :- Area and Production of Rabi Vegetables
The Punjab
(Area in ‘00’ Hectares and
Production in ‘00’ Tonnes)
Vegetable 2008-09 2009-10
Area Produc-
tion Area
Produc-
tion
Total 840 14270 847 13993
Turnip 96 1881 100 1929
Carrot 88 1687 86 1615
Spinach 32 519 32 441
Tomato 56 725 60 779
Cauliflower 75 1597 75 1515
Cabbage 24 433 24 443
Sweet Potato 6 98 6 95
Radish 63 1169 63 1164
Others 400 6161 401 6012
(Others as Percent of
Total)
47.6
43.2
47.3
43.0
Source:- Directorate of Agriculture, Crop Reporting Service, Punjab Lahore.
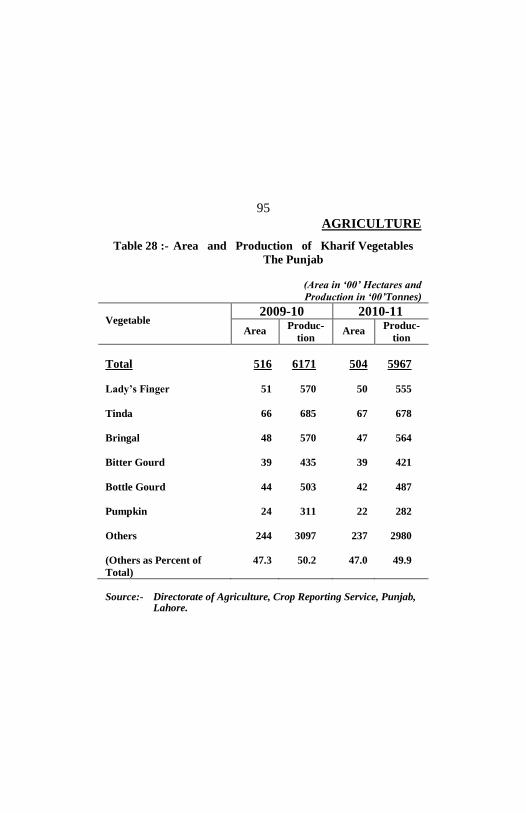
AGRICULTURE
95
Table 28 :- Area and Production of Kharif Vegetables
The Punjab
(Area in ‘00’ Hectares and
Production in ‘00’Tonnes)
Vegetable 2009-10 2010-11
Area Produc-
tion Area
Produc-
tion
Total 516 6171 504 5967
Lady’s Finger 51 570 50 555
Tinda 66 685 67 678
Bringal 48 570 47 564
Bitter Gourd 39 435 39 421
Bottle Gourd 44 503 42 487
Pumpkin 24 311 22 282
Others 244 3097 237 2980
(Others as Percent of
Total)
47.3 50.2 47.0 49.9
Source:- Directorate of Agriculture, Crop Reporting Service, Punjab, Lahore.

AGRICULTURE
96
Table 29 :- Number of Diesel and Electric Tubewells
Sr.
No. Division/District Total
Total Private Govt. The Punjab 941071 939187 1884 Bahawalpur Divn. 104054 103663 391
01. Bahawalpur 21102 20991 111
02. Bahawalnagar 37795 37795 0
03. Rahim Yar Khan 45157 44877 280 D.G. Khan Divn. 145750 145017 733
01. D.G.Khan 18456 18433 23
02. Layyah 52883 52859 24
03. Muzaffargarh 51466 50780 686
04. Rajanpur 22945 22945 0 Faisalabad Divn. 103408 103305 103
01. Faisalabad 30118 30086 32
02. Chiniot 14065 14065 0
03. Jhang 41616 41607 9
04. Toba Tek Singh 17609 17547 62 Gujranwala Divn. 265099 265039 60
01. Gujranwala 60269 60261 8
02. Gujrat 26032 26000 32
03. Hafizabad 26809 26809 0
04. Mandi Baha-ud-Din 47172 47167 5
05. Narowal 41761 41759 2
06. Sialkot 63056 63043 13

AGRICULTURE
97
Installed by Ownership, Division and District,
The Punjab 2008-09-Contd.
Diesel Electric Sr.
No. Total Private Govt. Total Private Govt.
837922 837832 90 103149 101355 1794
96158 96152 6 7896 7511 385
18151 18147 4 2951 2844 107 01.
36289 36289 0 1506 1506 0 02.
41718 41716 2 3439 3161 278 03.
142649 142648 1 3101 2369 732
17967 17967 0 489 466 23 01.
52326 52325 1 557 534 23 02.
50282 50282 0 1184 498 686 03.
22074 22074 0 871 871 0 04.
87272 87267 5 16136 16038 98
27028 27025 3 3090 3061 29 01.
9360 9360 0 4705 4705 0 02.
35622 35620 2 5994 5987 7 03.
15262 15262 0 2347 2285 62 04.
242750 242744 6 22349 22295 54
49636 49636 0 10633 10625 8 01.
23195 23195 0 2837 2805 32 02.
24218 24218 0 2591 2591 0 03.
46241 46237 4 931 930 1 04.
40964 40963 1 797 796 1 05.
58496 58495 1 4560 4548 12 06.

AGRICULTURE
98
Table 29 :- Number of Diesel and Electric Tubewells
Sr.
No. Division/District Total
Total Private Govt. Lahore Divn. 82968 82890 78 01. Lahore 5221 5189 32 02. Kasur 28507 28461 46 03 Nankana Sahib 18994 18994 0 04. Sheikhupura 30246 30246 0 Multan Divn. 61877 61807 70 01. Multan 13044 13023 21 02. Khanewal 19546 19504 42 03. Lodhran 10829 10827 2 04. Vehari 18458 18453 5 Rawalpindi Divn. 14191 14129 62 01. Rawalpindi 371 345 26 02. Attock 608 578 30 03. Chakwal 4454 4452 2 04. Jhelum 8758 8754 4 Sahiwal Divn. 66391 66245 146 01. Sahiwal 16207 16137 70 02. Okara 33693 33670 23 03. Pakpattan 16491 16438 53 Sargodha Divn. 97333 97092 241
01 Sargodha 41228 41219 9
02. Bhakkar 35951 35880 71
03. Khushab 9087 8981 106
04. Mianwali 11067 11012 55

AGRICULTURE
99
Installed by Ownership, Division and District,
The Punjab 2008-09 - Concld.
Diesel Electric Sr.
No. Total Private Govt. Total Private Govt.
67409 67409 0 15559 15481 78 3434 3434 0 1787 1755 32 01.
21379 21379 0 7128 7082 46 02. 16435 16435 0 2559 2559 0 03. 26161 26161 0 4085 4085 0 04.
43879 43872 7 17998 17935 63 10918 10915 3 2126 2108 18 01. 15688 15686 2 3818 40 02.
5229 5229 0 5600 5598 2 03. 12044 12042 2 6414 6411 3 04.
13073 13068 5 1118 1061 57
281 281 0 90 64 26 01. 467 467 0 141 111 30 02.
4112 4111 1 342 341 1 03. 8213 8209 4 545 545 0 04.
50850 50824 26 15541 15421 120 13075 13072 3 3132 3065 67 01. 28618 28618 2 5075 5054 21 02.
9157 9136 21 7334 7302 32 03.
93882 93848 34 3451 3244 207 40166 40166 0 1062 1053 9 01. 35236 35210 26 715 670 45 02.
8878 8878 0 209 103 106 03. 9602 9594 8 1465 1418 47 04.
Source:- Directorate of Agriculture, Crop Reporting Service,
Punjab, Lahore.

AGRICULTURE
100
Table 30 :- Number of Diesel and Electric Tubewells Installed
by Ownership, The Punjab
Item 2005-
06
2006-
07
2007-
08
2008-
09
1. Total (2+3)
i) Private
ii) Govt.
857770
855219
2551
884228
881890
2338
872444
870186
2258
941071
939187
1884
2. Diesel-Total
i) Private
ii) Govt.
776329
776243
86
799029
798924
105
783362
783271
91
837922
837832
90
3. Electric-Total
i) Private
ii) Govt.
81441
78976
2465
85199
82966
2233
89082
86915
2167
103149
101355
1794
Source:- Directorate of Agriculture, Crop Reporting Service,
Punjab, Lahore.
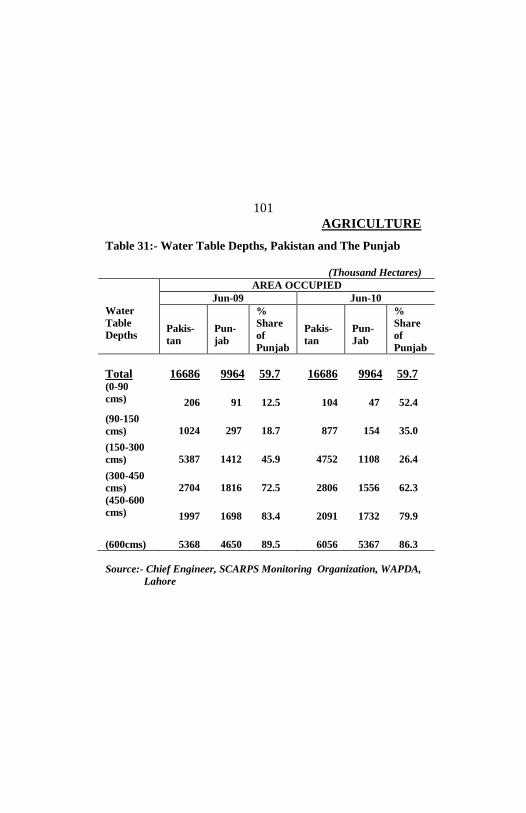
AGRICULTURE
101
Table 31:- Water Table Depths, Pakistan and The Punjab
(Thousand Hectares)
Water
Table
Depths
AREA OCCUPIED
Jun-09 Jun-10
Pakis-
tan
Pun-
jab
%
Share
of
Punjab
Pakis-
tan
Pun-
Jab
%
Share
of
Punjab
Total 16686 9964 59.7 16686 9964 59.7 (0-90
cms) 206 91 12.5 104 47 52.4
(90-150
cms) 1024 297 18.7 877 154 35.0
(150-300
cms) 5387 1412 45.9 4752 1108 26.4
(300-450
cms) 2704 1816 72.5 2806 1556 62.3
(450-600
cms) 1997 1698 83.4 2091 1732 79.9
(600cms) 5368 4650 89.5 6056 5367 86.3
Source:- Chief Engineer, SCARPS Monitoring Organization, WAPDA,
Lahore

AGRICULTURE
102
Table 32:- Number of Tractors by Make, The Punjab
Year
Make 2005-06 2006-07 2007-08 2008-09
Total 339655 365179 378676 399991
Fiat (640) 34809 38548 39694 44545
Fiat (480) 100198 110969 115863 122393
Massey Ferguson 142230 159658 167593 173631
International 1273 1355 1446 1370
Belarus 13162 14491 14612 15352
Ford (4000/4600) 13074 11739 11901 12655
Ford (3000/3600) 22197 13615 13567 13690
Others 12712 14804 14000 16355
Source:- Directorate of Agriculture, Crop Reporting Service, Punjab,
Lahore.

AGRICULTURE
103
Table 33: Agricultural Loans Disbursed by Source,
The Punjab
(Rs. in Million)
Year
Total
Loans
Agricul-
tural
Develop-
ment
Bank of
Pakistan
Commer-
cial
Banks
Agricul-
tural
Co-
Operative
Societies
Taccavi
1 2=3
to 6 3 4 5 6
2000-01 27099 19590 7423 80 6
2001-02 32692 21123 11395 168 6
2002-03 38122 22490 15247 377 7 2003-04 50466 23320 24279 2867
Funds
not
allo-
cated
2004-05 70434 29085 39098 2251
2005-06 94882 38261 55212 1409 2006-07 114464 45313 66122 3029
2007-08 133219 53372 78149 1698
2008-09 153007 60696 91271 1040 2009-10 168044 64438 102202 1404
Source:- i) For Column 3, Agricultural Development Bank of
Pakistan, Islamabad. ii) For Column 4, State Bank of Pakistan, Karachi.
iii) For Column 5, Registrar, Co-operative Societies, Punjab, Lahore
iv) For Column 6, Board of Revenue Punjab, Lahore.
BANKING

BANKING 106
Table 34:- Components of Monetary Assets, (IMF Basis)
Pakistan (As on 30th June) (Rs. in Million)
Type of Assets 2007 2008 2009 2010
I. Monetary Assets 4065155 4689142 5137219 5777234
II. Currency in
Circulation (1-2-3)
840181
982325
1152173
1295385
1. Currency Issued 898388 1051473 1229375 1383175
2. Held by State
Bank of Pakistan
136
182
196
117
3. In Tills of
Scheduled Banks
58071
68966
77006
87673
III. Deposits-Total
( 1 to 4)
3224974
3706817
3985046
4481849
1. Scheduled
Bank’s Demand
Deposits
1455509
3072997
3206433
3594070
2. Scheduled
Bank’s
Time Deposits
1556601
366129
493587
535678
3. Residents’
Foreign Currency
Deposits
207312
263430
280364
345438
4. Other Deposits
with State Bank
of Pakistan
5552
4261
4662
6663
Source:- State Bank of Pakistan, Karachi.

BANKING 107
Table 35:- Gold and Foreign Exchange Reserves and Special
Drawing Rights, Pakistan (As on 30th June)
(Rs. in Million)
Year
Total
Gold Foreign
Exchange
Special
Drawing
Rights
2001 169752 36199 133272 281
2002 328599 40020 288069 510
2003 619841 41918 563831 14092
2004 694828 48305 632696 13827
2005 680715 54746 612399 13570
2006 768192 77557 677511 13124
2007 934007 82598 838607 12802
2008 769596 133096 621731 14769
2009 961570 160099 789035 12436
2010 1403064 223511 1072015 107538
Source:- State Bank of Pakistan, Karachi.

COMMUNICATIONS

COMMUNICATIONS
110
Table 36 :- Postal Service Operations, The Punjab
Item Unit 2006-
07
2007-
08
2008-
09
2009-
10
Post Offices Number 7300 7287 6140 3689
Letter Boxes Thousand 13 13 26 71
Mail Lines* Thousand
Kilometres
98
60
5
34
Un-Registered
Articles
Million
223
254
218
773
Registered
Letters
"
150
447
1144
2135
Insured Letters
Thousand 7 14 6 -
Insured Parcels
Thousand 3 4 83 -
V.P. Letters
Thousand 588 288 190 171
* Excluding Air distance.

COMMUNICATIONS
111
Table 36 :- Postal Service Operations, The Punjab
Item Unit 2006-
07
2007-
08
2008-
09
2009-
10
Money Orders
Issued
Number
Thousand 4482 5633 4048 1900
Value
Million Rs. 10845 10467 10072 72103
Money Orders
Paid
Number
Thousand 5836 7567 5714 6297
Value Million Rs. 17819 18701 21530 12556
Source:- Pakistan Postal Services Corporation, Islamabad.
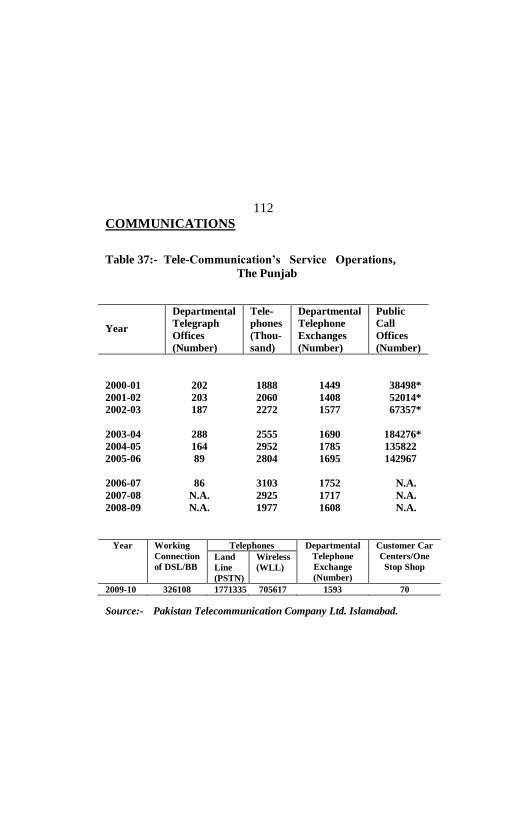
COMMUNICATIONS
112
Table 37:- Tele-Communication’s Service Operations,
The Punjab
Year
Departmental
Telegraph
Offices
(Number)
Tele-
phones
(Thou-
sand)
Departmental
Telephone
Exchanges
(Number)
Public
Call
Offices
(Number)
2000-01 202 1888 1449 38498*
2001-02 203 2060 1408 52014*
2002-03 187 2272 1577 67357*
2003-04 288 2555 1690 184276*
2004-05 164 2952 1785 135822
2005-06 89 2804 1695 142967
2006-07 86 3103 1752 N.A.
2007-08 N.A. 2925 1717 N.A.
2008-09 N.A. 1977 1608 N.A.
Year Working
Connection
of DSL/BB
Telephones Departmental
Telephone
Exchange
(Number)
Customer Car
Centers/One
Stop Shop Land
Line
(PSTN)
Wireless
(WLL)
2009-10 326108 1771335 705617 1593 70
Source:- Pakistan Telecommunication Company Ltd. Islamabad.

CO-OPERATIVE
SOCIETIES

CO-OPERATIVE SOCIETIES
114
Table 38 :- Working of Co-operative Societies,
Sr.
No.
Item
Total
Provincial
Co-
operative
Bank
01. Number 33320 1
02. Membership (000) 1687 39
03. Share Capital 906 435
04. Reserve Fund 839 394
05. Other Funds 3507 3084
06. Deposits 7528 1519
07. Loans 13137 7551
08. Working Capital 25917 12983
09. Profit & Loss -2 -1
10. Cost of Management 922 680
Loans Advanced
11. Individuals 7401 1403
12. Societies 6195 5651
Receipt from Loans Paid
13. Individuals 7449 1681
14. Societies 6701 6166
Percentage of Recovery of Loans
15. Individuals 100.65 119.81
16.
Societies 108.17 109.11

CO-OPERATIVE SOCIETIES
115
The Punjab: 2009-10
(Amount in Million Rupees)
Central
Non-
Credit
Societies
Agricultural Co-
operative Societies
Non-Agricultural Co-
operative Societies
Sr.
No. Credit Others Credit Others
187 27777 1996 452 2907 01.
33 1081 78 56 400 02.
23 139 23 9 277 03.
19 341 13 3 69 04.
29 50 10 1 333 05.
14 80 99 18 5798 06.
22 3985 1213 7 359 07.
107 4595 1358 38 6836 08.
-2 8 4 1 -12 09.
13 2 2 1 224 10.
7 5695 258 20 18 11.
13 29 66 5 431 12.
6 5473 253 19 17 13.
12 27 63 4 429 14.
85.71 96.10 98.06 95.00 94.44 15.
92.31 93.10 95.45 80.00 99.54 16.
Source:- Registrar, Co-operative Societies, Punjab, Lahore.
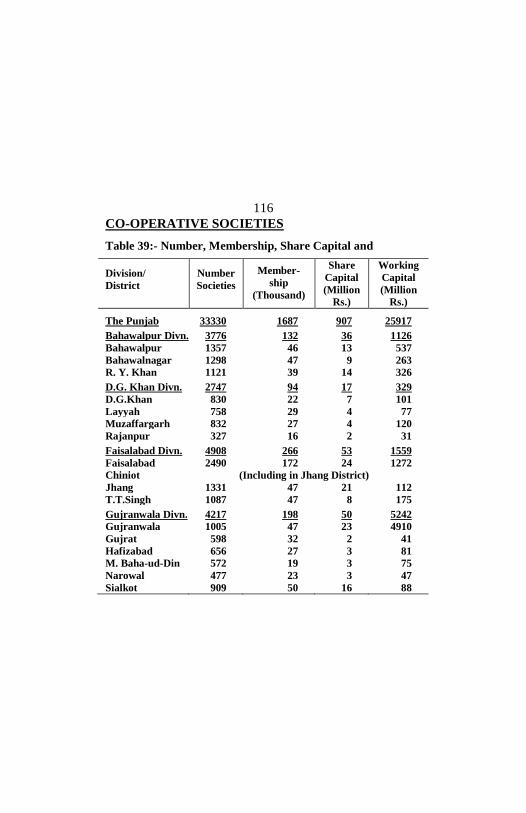
CO-OPERATIVE SOCIETIES
116
Table 39:- Number, Membership, Share Capital and
Division/
District
Number
Societies
Member-
ship
(Thousand)
Share
Capital
(Million
Rs.)
Working
Capital
(Million
Rs.) The Punjab 33330 1687 907 25917 Bahawalpur Divn. 3776 132 36 1126
Bahawalpur 1357 46 13 537
Bahawalnagar 1298 47 9 263
R. Y. Khan 1121 39 14 326 D.G. Khan Divn. 2747 94 17 329
D.G.Khan 830 22 7 101
Layyah 758 29 4 77
Muzaffargarh 832 27 4 120
Rajanpur 327 16 2 31 Faisalabad Divn. 4908 266 53 1559
Faisalabad 2490 172 24 1272
Chiniot (Including in Jhang District)
Jhang 1331 47 21 112
T.T.Singh 1087 47 8 175 Gujranwala Divn. 4217 198 50 5242
Gujranwala 1005 47 23 4910
Gujrat 598 32 2 41
Hafizabad 656 27 3 81
M. Baha-ud-Din 572 19 3 75
Narowal 477 23 3 47
Sialkot 909 50 16 88
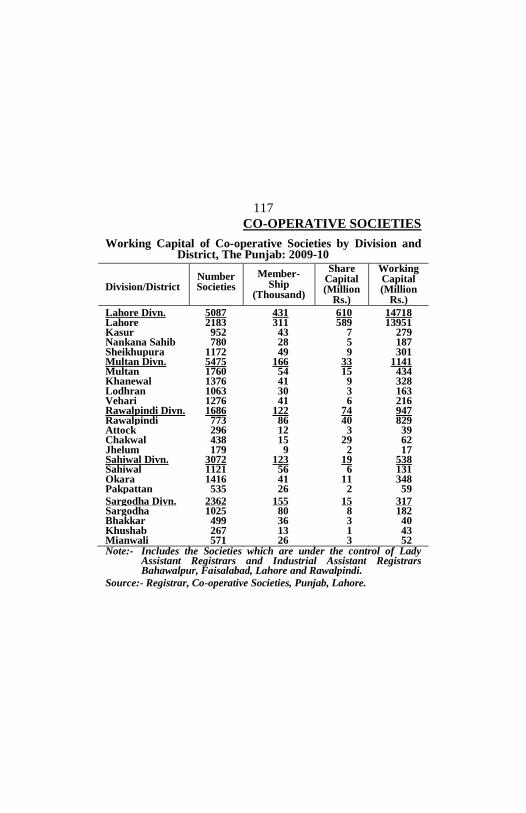
CO-OPERATIVE SOCIETIES
117
Working Capital of Co-operative Societies by Division and District, The Punjab: 2009-10
Division/District Number Societies
Member- Ship
(Thousand)
Share Capital (Million
Rs.)
Working Capital (Million
Rs.) Lahore Divn. 5087 431 610 14718 Lahore 2183 311 589 13951 Kasur 952 43 7 279 Nankana Sahib 780 28 5 187 Sheikhupura 1172 49 9 301 Multan Divn. 5475 166 33 1141 Multan 1760 54 15 434 Khanewal 1376 41 9 328 Lodhran 1063 30 3 163 Vehari 1276 41 6 216 Rawalpindi Divn. 1686 122 74 947 Rawalpindi 773 86 40 829 Attock 296 12 3 39 Chakwal 438 15 29 62 Jhelum 179 9 2 17 Sahiwal Divn. 3072 123 19 538 Sahiwal 1121 56 6 131 Okara 1416 41 11 348 Pakpattan 535 26 2 59 Sargodha Divn. 2362 155 15 317 Sargodha 1025 80 8 182 Bhakkar 499 36 3 40 Khushab 267 13 1 43 Mianwali 571 26 3 52 Note:- Includes the Societies which are under the control of Lady
Assistant Registrars and Industrial Assistant Registrars Bahawalpur, Faisalabad, Lahore and Rawalpindi.
Source:- Registrar, Co-operative Societies, Punjab, Lahore.

CO-OPERATIVE SOCIETIES
118
Table 40:- Number, Membership, Share Capital and
Working Capital of Co-operative Societies,
The Punjab
Year
Number
Member-
ship
(‘000’)
Share
Capital
(Million
Rs.)
Working
Capital
(Million
Rs.)
2000-01 43369 2247 552 13788
2001-02 41750 2231 573 15176
2002-03 41606 2189 545 16128
2003-04 40973 2143 690 21045
2004-05 34649 1805 913 24006
2005-06 33955 1694 913 26256
2006-07 33554 1640 909 30481
2007-08 33506 1680 851 25449
2008-09 33444 1687 878 26482
2009-10 33330 1687 907 25917
Source:- Registrar, Co-operative Societies, Punjab, Lahore.

CRIMES

CRIMES
120
Table 41:- Number of Reported Crimes by Type, The Punjab
Offence No. of Cases Reported 2007 2008 2009 2010
All Reported 344925 385616 383379 386437
Murder 5184 5671 5836 6242
Attempted Murder 6755 7128 6784 7309
Hurt 23334 23669 22067 21388
Rioting 203 261 207 148
Assault on Public
Servants
1345
1475
1666
1811
Rape 1497 2023 2345 2581
Kidnapping/Abduction 7712 11155 11924 13497
Dacoity 1446 2136 2352 2752
Robbery 11225 13949 13968 16604
Burglary 8703 11216 11561 12683
Motor Vehicles Theft 10386 11982 14061 18738
Cattle Theft 8472 8022 8640 7661
Ordinary theft 23437 29729 29886 31929
Others n.e.s. 235226 257200 252082 243094
Source:- Deputy Inspector General of Police (Crimes) Punjab,
Lahore.

EDUCATION

EDUCATION
122
Table 42:- Number, Enrolment and Teaching Staff of
Type of Institution Academic
Year
Insti-
tution
Enrol-
ment
Teaching
Staff I. Schools (‘000’)
a) Mosque 2009-10 3342 212 5039
b) Primary “ 43970 4794 120695
c) Middle “ 7534 2129 75910
d) High “ 4839 3051 97798
II. Colleges
a) Intermediate “ 226 52 4007 b) Degree “ 675 672 19089 III. Higher Secondary
Schools
a) I-X Classes “ 636 385 6588 b) XI-XII Classes “ 82
IV. Universities (Number)
a) General “ 10 93282 4949 b) Engineering “ 2 12694 883 c) Agriculture “ 1 10810 562 d) ARID Agriculture
“
1
4655
180
e) LUMS “ 1 2486 143 f) University of Lahore
“
1
7342
421
g) University of
Education
Lahore
“
1
11116
311

EDUCATION
123
Educational Institutions, The Punjab – Contd.
Type of Institution Academic
Year
Insti-
tution
Enrol-
ment
Teaching
Staff
h) University of Veterinary & Animal Sciences
2009-10
1
4874
196 i) University of Central Punjab
“
1
4334
121
j) GIFT University “ 1 1289 71 k) University of Health Sciences Lahore
“
1
10889
2421 l) University of Management & Technology, Johar Town, Lahore
“
1
3553
179 m)The Minhaj University Model Town, Lahore
“
1
309
60 n) Preston University Faisalabad, Campus.
“
1
630
43 o) Foundation University Rawalpindi.
“
1
1568
333

EDUCATION
124
Table 42:- Number, Enrolment and Teaching Staff of
Type of Institution Academic
Year
Insti-
tution
Enrol-
ment
Teaching
Staff
p) Preston
University, Lahore Campus
2009-10
1
1472
49 q) National
University of Computer & Emerging Sciences, Lahore
“ 1 2112 96
r) National University of Modern Languages, Lahore
“ 1 2191 37
s) King Edward Medical University, Lahore
“ 1 1400 236
t) Virtual University of Pakistan
“ 1 24874 213
u) University of Sargodha
“ 1 9929 465
v) Forman Christion College University, Lahore
“ 1 4450 229
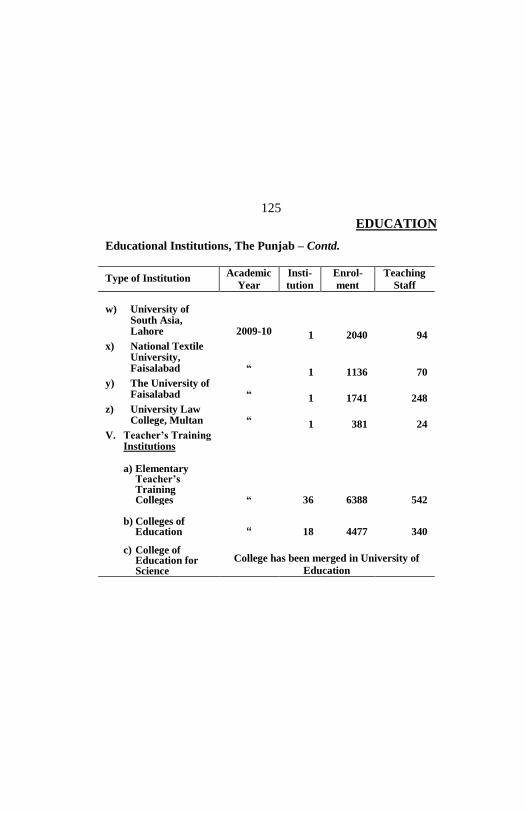
EDUCATION
125
Educational Institutions, The Punjab – Contd.
Type of Institution Academic
Year
Insti-
tution
Enrol-
ment
Teaching
Staff
w) University of
South Asia, Lahore
2009-10 1 2040 94 x) National Textile
University, Faisalabad
“ 1 1136 70
y) The University of Faisalabad
“ 1 1741 248
z) University Law College, Multan
“ 1 381 24
V. Teacher’s Training Institutions
a) Elementary Teacher’s Training Colleges
“
36
6388
542 b) Colleges of Education
“
18
4477
340
c) College of Education for Science
College has been merged in University of
Education
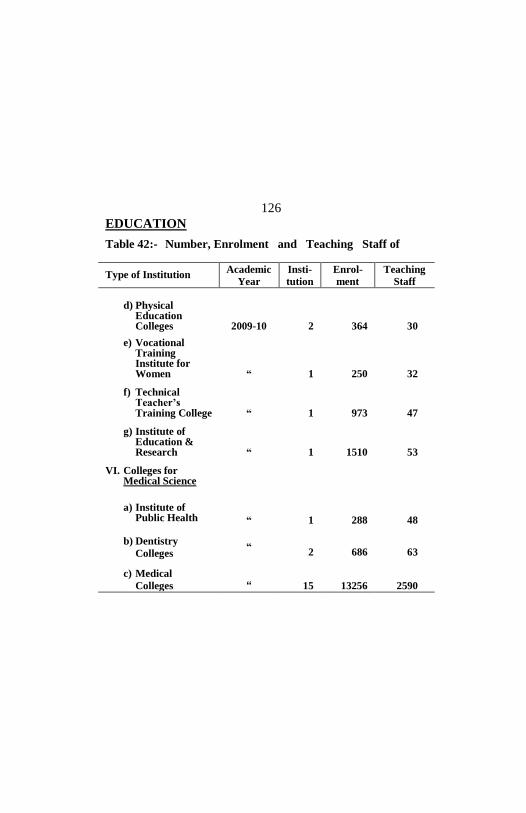
EDUCATION
126
Table 42:- Number, Enrolment and Teaching Staff of
Type of Institution Academic
Year
Insti-
tution
Enrol-
ment
Teaching
Staff
d) Physical Education Colleges
2009-10
2
364
30
e) Vocational Training Institute for Women
“
1
250
32
f) Technical Teacher’s Training College
“
1
973
47
g) Institute of Education & Research
“
1
1510
53
VI. Colleges for Medical Science
a) Institute of Public Health
“
1
288
48
b) Dentistry
Colleges
“
2
686
63
c) Medical
Colleges
“
15
13256
2590
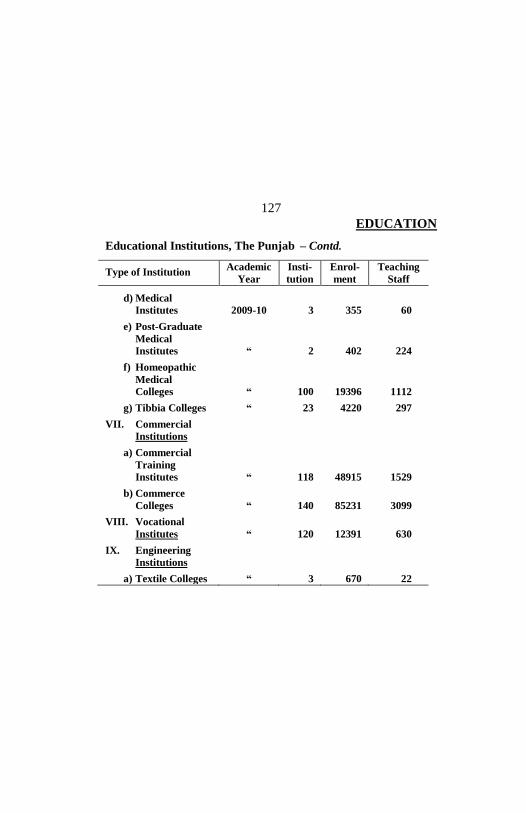
EDUCATION
127
Educational Institutions, The Punjab – Contd.
Type of Institution Academic
Year
Insti-
tution
Enrol-
ment
Teaching
Staff d) Medical
Institutes
2009-10
3
355
60
e) Post-Graduate
Medical
Institutes
“
2
402
224
f) Homeopathic
Medical
Colleges
“
100
19396
1112
g) Tibbia Colleges “ 23 4220 297
VII. Commercial
Institutions
a) Commercial
Training
Institutes
“
118
48915
1529
b) Commerce
Colleges
“
140
85231
3099
VIII. Vocational
Institutes
“
120
12391
630
IX. Engineering
Institutions
a) Textile Colleges “ 3 670 22
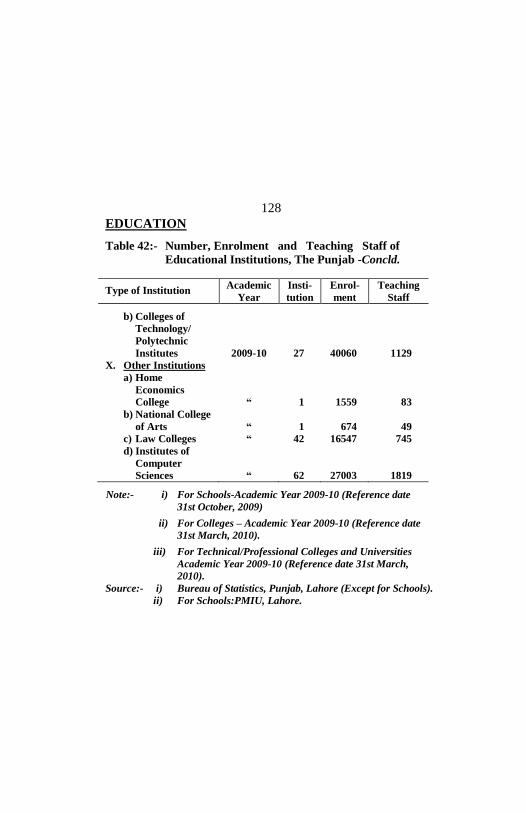
EDUCATION
128
Table 42:- Number, Enrolment and Teaching Staff of
Educational Institutions, The Punjab -Concld.
Type of Institution Academic
Year
Insti-
tution
Enrol-
ment
Teaching
Staff b) Colleges of
Technology/
Polytechnic
Institutes
2009-10
27
40060
1129
X. Other Institutions
a) Home
Economics
College
b) National College
of Arts
c) Law Colleges
d) Institutes of
Computer
Sciences
“
“
“
“
1
1
42
62
1559
674
16547
27003
83
49
745
1819 Note:- i) For Schools-Academic Year 2009-10 (Reference date
31st October, 2009)
ii) For Colleges – Academic Year 2009-10 (Reference date
31st March, 2010).
iii) For Technical/Professional Colleges and Universities
Academic Year 2009-10 (Reference date 31st March,
2010).
Source:- i) Bureau of Statistics, Punjab, Lahore (Except for Schools).
ii) For Schools:PMIU, Lahore.

EDUCATION
129
Table 43 :- Number, Enrolment and Teaching Staff of Schools,
The Punjab – Contd.
Year Number Enrolment
(‘000’)
Teaching
Staff
I. MOSQUE SCHOOLS 2000-01 8082 348 8852
2001-02 7863 338 15452
2002-03 7742 342 16518 2003-04 7400 318 11996
2004-05 7474 372 11728
2005-06 7289 380 12060 2006-07 5754 343 10116
2007-08 4926 305 6381
2008-09 4087 233 5063 2009-10 3342 212 5039
II. PRIMARY SCHOOLS 2000-01 44068 4174 133183
2001-02 44172 4152 129051
2002-03 44253 4208 138084 2003-04 44185 4291 129618
2004-05 44176 4875 131975
2005-06 44313 5121 133476 2006-07 44687 5244 134993
2007-08 44617 5199 125863
2008-09 44970 5037 120500 2009-10 43970 4794 120695
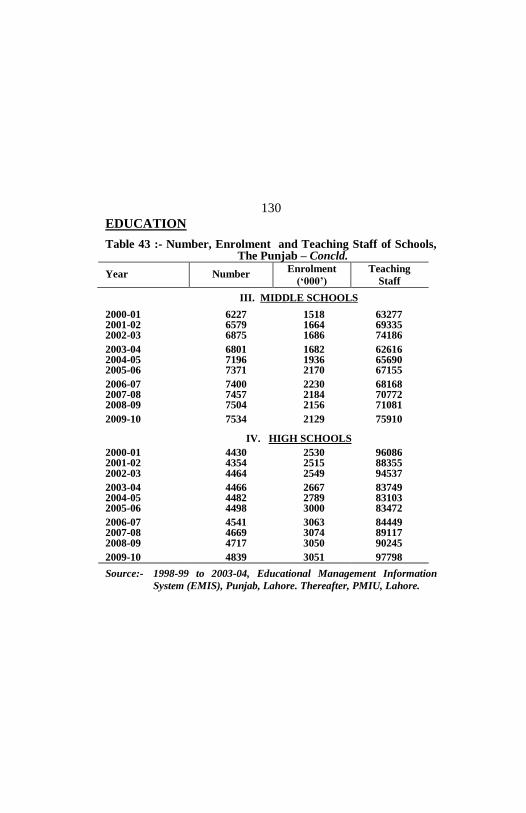
EDUCATION
130
Table 43 :- Number, Enrolment and Teaching Staff of Schools, The Punjab – Concld.
Year Number Enrolment
(‘000’)
Teaching
Staff
Source:- 1998-99 to 2003-04, Educational Management Information
System (EMIS), Punjab, Lahore. Thereafter, PMIU, Lahore.
III. MIDDLE SCHOOLS 2000-01 6227 1518 63277 2001-02 6579 1664 69335 2002-03 6875 1686 74186 2003-04 6801 1682 62616 2004-05 7196 1936 65690 2005-06 7371 2170 67155 2006-07 7400 2230 68168 2007-08 7457 2184 70772 2008-09 7504 2156 71081 2009-10 7534 2129 75910
IV. HIGH SCHOOLS 2000-01 4430 2530 96086 2001-02 4354 2515 88355 2002-03 4464 2549 94537 2003-04 4466 2667 83749 2004-05 4482 2789 83103 2005-06 4498 3000 83472 2006-07 4541 3063 84449 2007-08 4669 3074 89117 2008-09 4717 3050 90245 2009-10 4839 3051 97798

EDUCATION
131
Table 44:- Number, Enrolment and Teaching Staff of Arts and
Science Colleges and Higher Secondary Schools,
The Punjab - Contd.
Year Number Enrolment
(‘000’)
Teaching
Staff
INTER & DEGREE COLLEGES
2000-01 510 437 15817
2001-02 514 462 15168
2002-03 531 492 16248 2003-04 585 548 17371
2004-05 618 600 18421
2005-06 672 619 19131 2006-07 694 651 20049
2007-08 744 675 20255
2008-09 839 704 22454 2009-10 901 724 23096
INTER COLLEGES
2000-01 149 29 2253
2001-02 149 31 2140
2002-03 156 32 2482 2003-04 181 34 2934
2004-05 202 38 3207
2005-06 203 40 3419 2006-07 204 44 3591
2007-08 177 34 3460
2008-09 214 41 3948 2009-10 226 52 4007
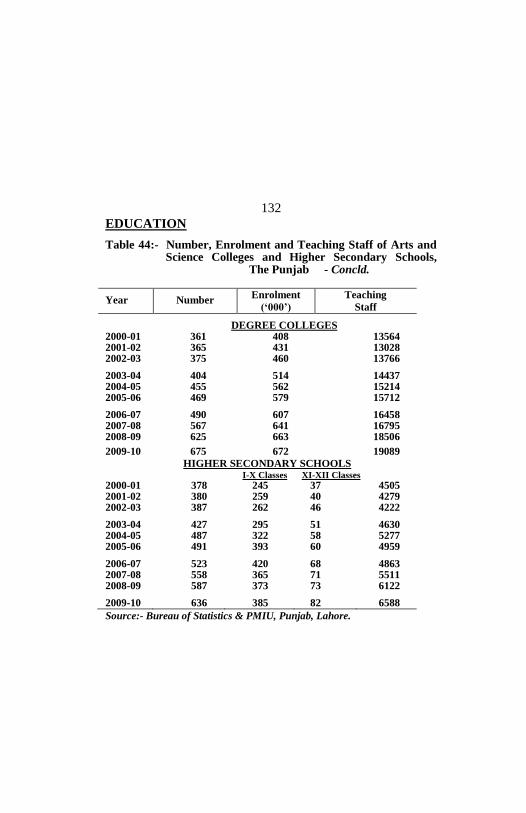
EDUCATION
132
Table 44:- Number, Enrolment and Teaching Staff of Arts and Science Colleges and Higher Secondary Schools, The Punjab - Concld.
Year Number Enrolment
(‘000’)
Teaching
Staff
DEGREE COLLEGES 2000-01 361 408 13564 2001-02 365 431 13028 2002-03 375 460 13766 2003-04 404 514 14437 2004-05 455 562 15214 2005-06 469 579 15712 2006-07 490 607 16458 2007-08 567 641 16795 2008-09 625 663 18506 2009-10 675 672 19089
HIGHER SECONDARY SCHOOLS I-X Classes XI-XII Classes
2000-01 378 245 37 4505 2001-02 380 259 40 4279 2002-03 387 262 46 4222 2003-04 427 295 51 4630 2004-05 487 322 58 5277 2005-06 491 393 60 4959 2006-07 523 420 68 4863 2007-08 558 365 71 5511 2008-09 587 373 73 6122 2009-10 636 385 82 6588
Source:- Bureau of Statistics & PMIU, Punjab, Lahore.

EDUCATION
133
Table 45:- Enrolment in Arts & Science Intermediate and
Degree Colleges (Punjab Govt. Federal Govt. &
Private Organizations) and Higher Secondary
Schools (Punjab Govt. Pakistan Air Force & Private
Organizations) by Study Group and Sex
The Punjab: 2009-10
Study Group Total Boys Girls
Total 806227 350032 456195
i) Intermediate Classes 598273 281270 317003
a) Pre-Medical 81264 26389 54875
b) Pre-Engineering 94780 74071 20709
c) Computer Science 60716 30859 29857
d) Humanities 294379 102986 191393
e) Commerce, Home
Economics & Others
67134
46965
20169 ii) Degree Classes 189854 63133 126721
a) B.Sc. 35226 13603 21623
b) B.A. 119657 24905 94752
c) B.C.S. 3243 1718 1525
d) B. Com 30857 22521 8336
e) Others 871 386 485 iii) Post Graduate Classes 18100 5629 12471
a) M. Sc. 5560 2164 3396
b) M.A. 12425 3384 9041
c) M.Com 115 81 34
Source:- Bureau of Statistics, Punjab, Lahore
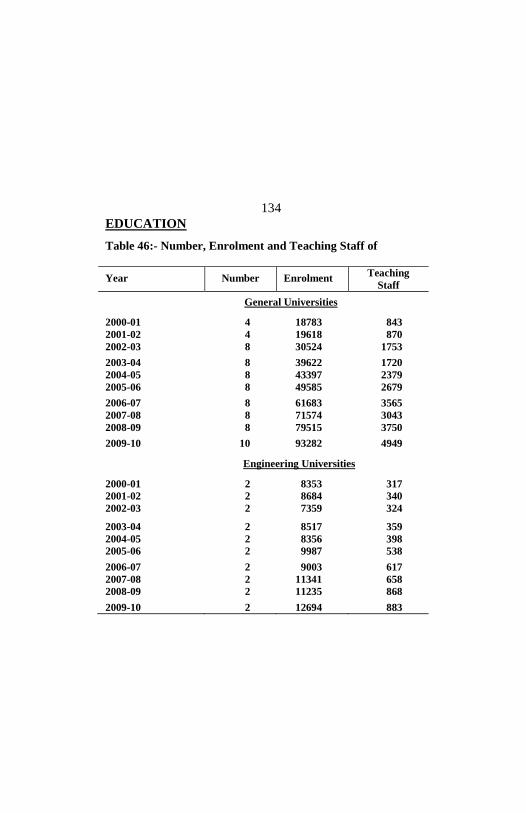
EDUCATION
134
Table 46:- Number, Enrolment and Teaching Staff of
Year Number Enrolment Teaching
Staff
General Universities
2000-01 4 18783 843
2001-02 4 19618 870
2002-03 8 30524 1753 2003-04 8 39622 1720
2004-05 8 43397 2379
2005-06 8 49585 2679 2006-07 8 61683 3565
2007-08 8 71574 3043
2008-09 8 79515 3750 2009-10 10 93282 4949
Engineering Universities
2000-01 2 8353 317
2001-02 2 8684 340
2002-03 2 7359 324 2003-04 2 8517 359
2004-05 2 8356 398
2005-06 2 9987 538 2006-07 2 9003 617
2007-08 2 11341 658
2008-09 2 11235 868 2009-10 2 12694 883

EDUCATION
135
Universities, The Punjab - Contd.
Year Number Enrolment Teaching
Staff
Agricultural University
2000-01 1 6059 409
2001-02 1 6463 409
2002-03 1 6045 388 2003-04 1 6504 408
2004-05 1 6674 424
2005-06 1 5341 399 2006-07 1 8076 562
2007-08 1 9302 594
2008-09 1 11828 542 2009-10 1 10810 562 Arid University of Agriculture
2000-01 1 3222 85
2001-02 1 3817 92
2002-03 1 3795 91 2003-04 1 2477 165
2004-05 1 2750 165
2005-06 1 3042 165 2006-07 1 3184 149
2007-08 1 3838 158
2008-09 1 4677 178 2009-10 1 4655 180

EDUCATION
136
Table 46:- Number, Enrolment and Teaching Staff of
Year Number Enrolment Teaching
Staff
University of Health Sciences 2004-05 1 7031 894 2005-06 1 8082 1188 2006-07 1 8557 1334 2007-08 1 11729 2065 2008-09 1 10887 2268 2009-10 1 10889 2421
University of Veterinary & Animal Sciences 2004-05 1 690 87 2005-06 1 766 121 2006-07 1 1610 160 2007-08 1 1986 151 2008-09 1 3999 214 2009-10 1 4874 196
University of Education 2004-05 1 13106 220 2005-06 1 13373 220 2006-07 1 13373 220 2007-08 1 6434 297 2008-09 1 8248 278 2009-10 1 11116 311
Lahore University of Management Sciences(LUMS) 2000-01 1 886 47 2001-02 1 1091 53 2002-03 1 1386 84 2003-04 1 1746 93 2004-05 1 2029 97 2005-06 1 2257 103
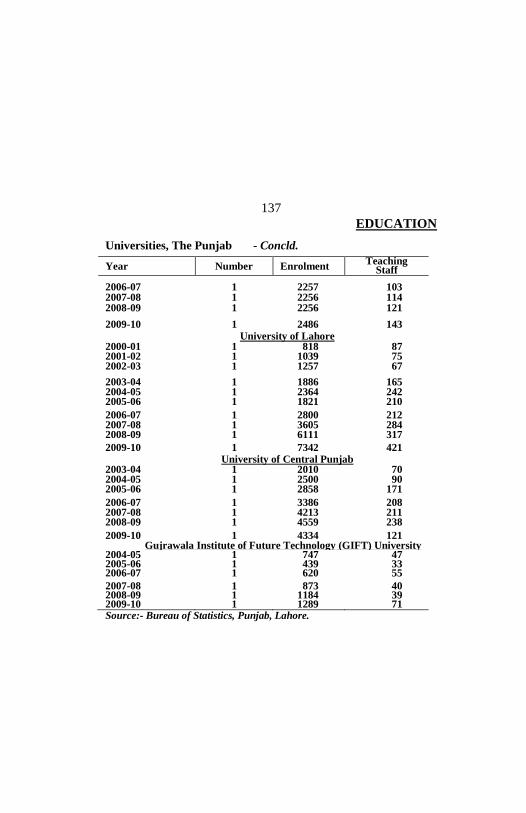
EDUCATION
137
Universities, The Punjab - Concld.
Year Number Enrolment Teaching
Staff 2006-07 1 2257 103 2007-08 1 2256 114 2008-09 1 2256 121 2009-10 1 2486 143
University of Lahore 2000-01 1 818 87 2001-02 1 1039 75 2002-03 1 1257 67 2003-04 1 1886 165 2004-05 1 2364 242 2005-06 1 1821 210 2006-07 1 2800 212 2007-08 1 3605 284 2008-09 1 6111 317 2009-10 1 7342 421
University of Central Punjab 2003-04 1 2010 70 2004-05 1 2500 90 2005-06 1 2858 171 2006-07 1 3386 208 2007-08 1 4213 211 2008-09 1 4559 238 2009-10 1 4334 121
Gujrawala Institute of Future Technology (GIFT) University 2004-05 1 747 47 2005-06 1 439 33 2006-07 1 620 55 2007-08 1 873 40 2008-09 1 1184 39 2009-10 1 1289 71 Source:- Bureau of Statistics, Punjab, Lahore.

EDUCATION
138
Table 47:- Post-Graduate Enrolment in Affiliated Colleges,
The Punjab
Year Total Punjab
University
Multan
University
Bahawalpur
University
2000-01 10945 8063 2130 752
2001-02 11446 8622 2064 760
2002-03 12182 9158 2325 699
2003-04 14673 11393 2540 740
2004-05 17150 13440 2910 800
2005-06 13361 8461 3596 1304
2006-07 20561 14875 4123 1563
2007-08 24742 18779 4311 1652
2008-09 23428 17695 4047 1686
2009-10 17501 10419 4245 2837
Source:- Bureau of Statistics, Punjab, Lahore.

EDUCATION
139
Table 48 :- Number, Enrolment and Teaching Staff of
the Institute of Education and Research
and Elementary Teacher’s Training Colleges,
The Punjab
Year Number Enrolment Teaching
Staff
Institute of Education & Research (IER-PU)
2000-01 1 1519 40 2001-02 1 1421 46 2002-03 1 1421 46 2003-04 1 1707 52 2004-05 1 1579 51 2005-06 1 1600 81 2006-07 1 1244 65
2007-08 1 1720 50
2008-09 1 1242 53 2009-10 1 1510 53
Elementary Teacher’s Training Colleges
2000-01 35 2041 627 2001-02 35 1105 540 2002-03 36 6528 558 2003-04 36 7466 600 2004-05 36 10611 551 2005-06 36 8860 551 2006-07 36 5420 483 2007-08 36 5818 538 2008-09 36 5558 523 2009-10 36 6388 542
Source:- Bureau of Statistics, Punjab, Lahore.
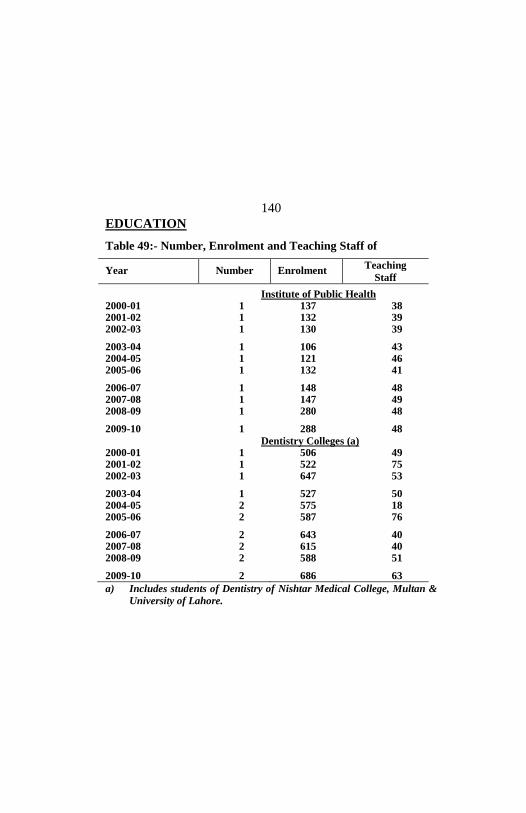
EDUCATION
140
Table 49:- Number, Enrolment and Teaching Staff of
Year Number Enrolment Teaching
Staff Institute of Public Health 2000-01 1 137 38 2001-02 1 132 39 2002-03 1 130 39 2003-04 1 106 43 2004-05 1 121 46 2005-06 1 132 41 2006-07 1 148 48 2007-08 1 147 49 2008-09 1 280 48 2009-10 1 288 48
Dentistry Colleges (a) 2000-01 1 506 49 2001-02 1 522 75 2002-03 1 647 53 2003-04 1 527 50 2004-05 2 575 18 2005-06 2 587 76 2006-07 2 643 40 2007-08 2 615 40 2008-09 2 588 51 2009-10 2 686 63
a) Includes students of Dentistry of Nishtar Medical College, Multan &
University of Lahore.
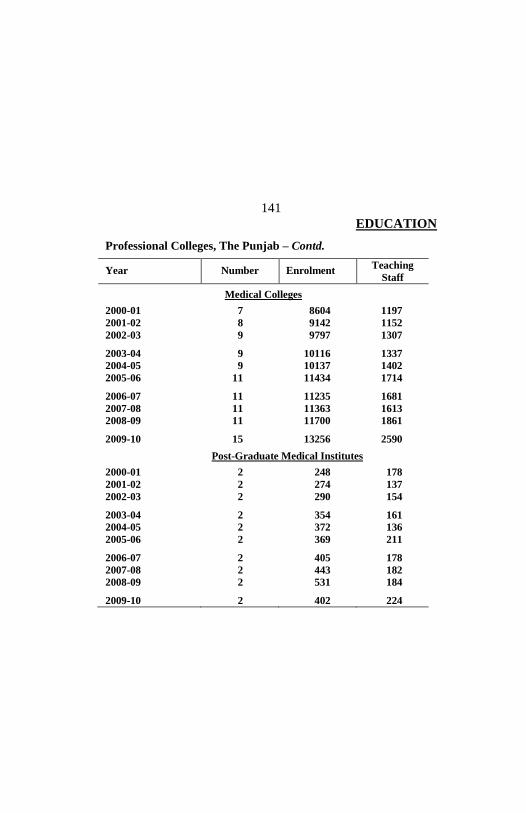
EDUCATION
141
Professional Colleges, The Punjab – Contd.
Year Number Enrolment Teaching
Staff
Medical Colleges
2000-01 7 8604 1197
2001-02 8 9142 1152
2002-03 9 9797 1307 2003-04 9 10116 1337
2004-05 9 10137 1402
2005-06 11 11434 1714 2006-07 11 11235 1681
2007-08 11 11363 1613
2008-09 11 11700 1861 2009-10 15 13256 2590
Post-Graduate Medical Institutes
2000-01 2 248 178
2001-02 2 274 137
2002-03 2 290 154 2003-04 2 354 161
2004-05 2 372 136
2005-06 2 369 211 2006-07 2 405 178
2007-08 2 443 182
2008-09 2 531 184 2009-10 2 402 224
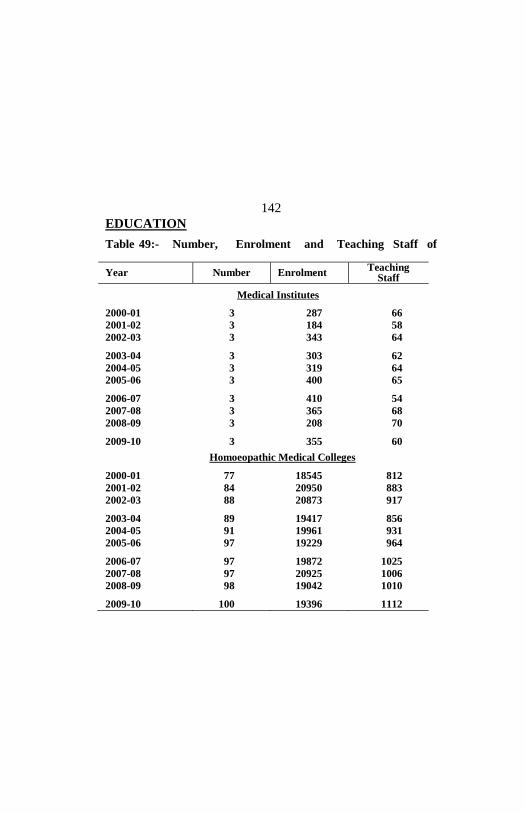
EDUCATION
142
Table 49:- Number, Enrolment and Teaching Staff of
Year Number Enrolment Teaching
Staff Medical Institutes 2000-01 3 287 66
2001-02 3 184 58
2002-03 3 343 64 2003-04 3 303 62
2004-05 3 319 64
2005-06 3 400 65 2006-07 3 410 54
2007-08 3 365 68
2008-09 3 208 70 2009-10 3 355 60
Homoeopathic Medical Colleges 2000-01 77 18545 812
2001-02 84 20950 883
2002-03 88 20873 917 2003-04 89 19417 856
2004-05 91 19961 931
2005-06 97 19229 964 2006-07 97 19872 1025
2007-08 97 20925 1006
2008-09 98 19042 1010 2009-10 100 19396 1112

EDUCATION
143
Professional Colleges, The Punjab – Contd.
Year Number Enrolment Teaching
Staff Tibbia Colleges 2000-01 22 5960 271 2001-02 22 5764 280 2002-03 22 5708 257 2003-04 23 5820 280 2004-05 23 5317 253 2005-06 23 5382 276 2006-07 23 5248 301 2007-08 23 4655 275 2008-09 23 4282 314 2009-10 23 4220 297 Commerce Colleges 2000-01 57 34745 1137 2001-02 60 39431 1341 2002-03 63 40572 1595 2003-04 70 42060 1670 2004-05 69 42154 1392 2005-06 75 53701 1893 2006-07 86 56381 1906 2007-08 94 79434 2494 2008-09 104 80357 2434 2009-10 140 85231 3099 Colleges of Education 2000-01 8 3929 306 2001-02 8 3700 289 2002-03 8 3769 294 2003-04 8 4316 303 2004-05 8 5578 240 2005-06 11 6306 340 2006-07 11 6017 256 2007-08 14 6627 314 2008-09 12 2880 199 2009-10 18 4477 340
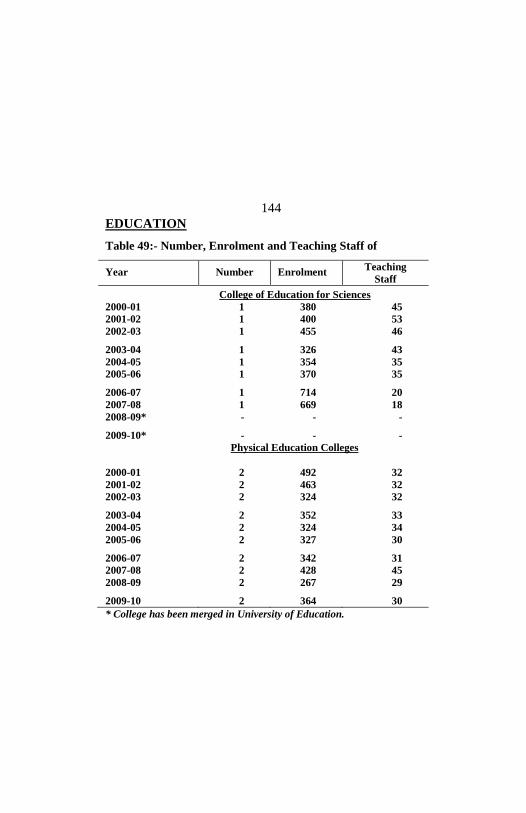
EDUCATION
144
Table 49:- Number, Enrolment and Teaching Staff of
Year Number Enrolment Teaching
Staff
College of Education for Sciences
2000-01 1 380 45
2001-02 1 400 53
2002-03 1 455 46 2003-04 1 326 43
2004-05 1 354 35
2005-06 1 370 35 2006-07 1 714 20
2007-08 1 669 18
2008-09* - - - 2009-10* - - -
Physical Education Colleges
2000-01 2 492 32
2001-02 2 463 32
2002-03 2 324 32 2003-04 2 352 33
2004-05 2 324 34
2005-06 2 327 30 2006-07 2 342 31
2007-08 2 428 45
2008-09 2 267 29 2009-10 2 364 30
* College has been merged in University of Education.

EDUCATION
145
Professional Colleges, The Punjab - Contd.
Year Number Enrolment Teaching
Staff
Home Economics College
2000-01 1 1413 89
2001-02 1 1428 91
2002-03 1 1369 89 2003-04 1 1380 88
2004-05 1 1452 75
2005-06 1 1479 93 2006-07 1 1525 93
2007-08 1 1576 66
2008-09 1 1757 76 2009-10 1 1559 83
Law Colleges
2000-01 29 13064 600
2001-02 32 12787 574
2002-03 34 13708 576 2003-04 36 14100 590
2004-05 36 16116 741
2005-06 38 15920 702 2006-07 38 16581 756
2007-08 42 16772 757
2008-09 42 16763 723 2009-10 42 16547 745

EDUCATION
146
Table 49:- Number, Enrolment and Teaching Staff of
Year Number Enrolment Teaching
Staff
National College of Arts
2000-01 1 590 57
2001-02 1 600 57
2002-03 1 825 57 2003-04 1 634 56
2004-05 1 680 56
2005-06 1 691 57 2006-07 1 674 57
2007-08 1 648 54 2008-09 1 665 49 2009-10 1 674 49
Institutes of Computer Sciences
2000-01 28 9944 606 2001-02 35 9469 824 2002-03 37 11058 968 2003-04 47 11358 1070 2004-05 41 12130 1020 2005-06 50 17315 1040 2006-07 57 20230 1225 2007-08 58 27545 1976 2008-09 59 26050 1832 2009-10 62 27003 1819
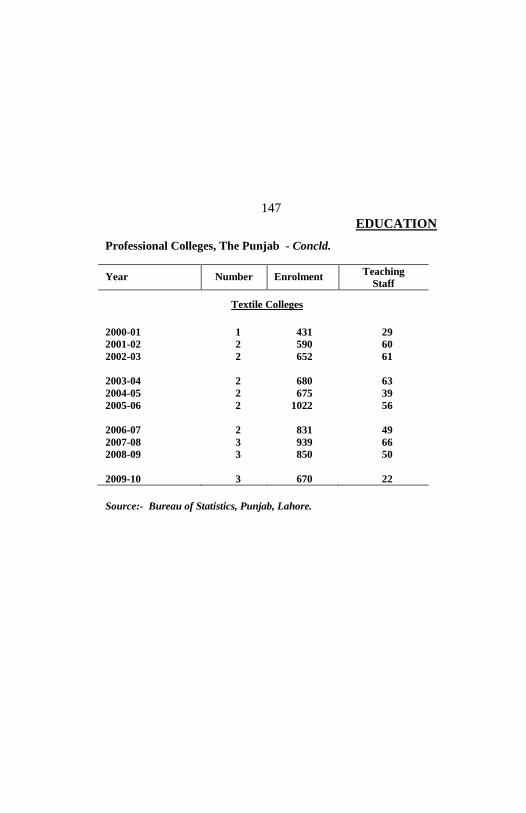
EDUCATION
147
Professional Colleges, The Punjab - Concld.
Year Number Enrolment Teaching
Staff
Textile Colleges
2000-01 1 431 29
2001-02 2 590 60
2002-03 2 652 61
2003-04 2 680 63
2004-05 2 675 39
2005-06 2 1022 56
2006-07 2 831 49
2007-08 3 939 66
2008-09 3 850 50
2009-10 3 670 22
Source:- Bureau of Statistics, Punjab, Lahore.
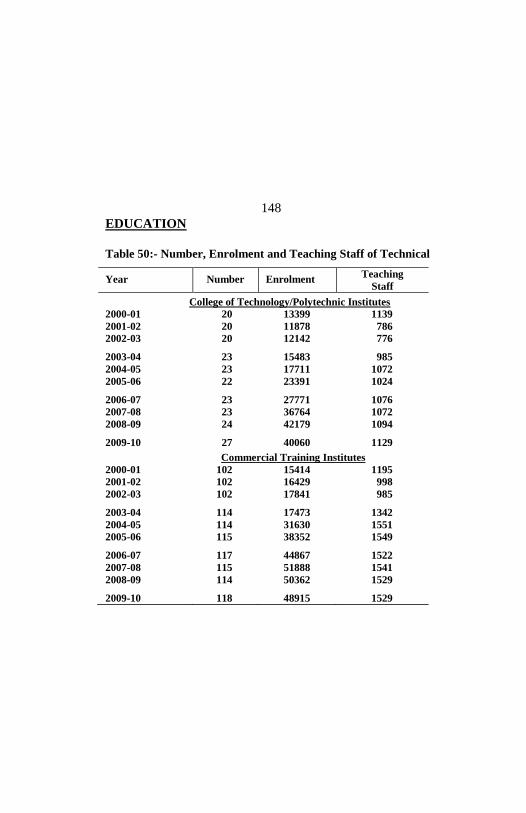
EDUCATION
148
Table 50:- Number, Enrolment and Teaching Staff of Technical
Year Number Enrolment Teaching
Staff
College of Technology/Polytechnic Institutes
2000-01 20 13399 1139
2001-02 20 11878 786
2002-03 20 12142 776 2003-04 23 15483 985
2004-05 23 17711 1072
2005-06 22 23391 1024 2006-07 23 27771 1076
2007-08 23 36764 1072
2008-09 24 42179 1094 2009-10 27 40060 1129
Commercial Training Institutes
2000-01 102 15414 1195
2001-02 102 16429 998
2002-03 102 17841 985 2003-04 114 17473 1342
2004-05 114 31630 1551
2005-06 115 38352 1549 2006-07 117 44867 1522
2007-08 115 51888 1541
2008-09 114 50362 1529 2009-10 118 48915 1529

EDUCATION
149
Institutes, The Punjab – Contd.
Year Number Enrolment Teaching
Staff
Vocational Institutes
2000-01 100 4394 658 2001-02 100 4536 536 2002-03 100 4721 530 2003-04 111 5067 557 2004-05 111 7416 620 2005-06 113 13758 671 2006-07 113 11802 655 2007-08 121 15167 706 2008-09 121 10310 664 2009-10 120 12391 630
Vocational Teacher’s Training Institute for Women
2000-01 1 300 42 2001-02 1 259 31 2002-03 1 276 31 2003-04 1 280 32 2004-05 1 222 31 2005-06 1 230 31 2006-07 1 340 32
2007-08 1 320 38
2008-09 1 280 40 2009-10 1 250 32

EDUCATION
150
Table 50:- Number, Enrolment and Teaching Staff of Technical
Institutes, The Punjab - Concld.
Year Number Enrolment Teaching
Staff
Technical Teacher’s Training College
2000-01 1 295 55
2001-02 1 264 55
2002-03 1 270 56
2003-04 1 220 43
2004-05 1 269 30
2005-06 1 405 39
2006-07 1 285 45
2007-08 1 686 44
2008-09 1 906 39
2009-10 1 973 47
Source:- Technical Education & Vocational Training Authority
(TEVTA), Lahore.

EDUCATION
151
Table 51:- Number, Enrolment and Teaching Staff in the Special Education Institutions, The Punjab As on 31st December, 2010
Type of Institution
No. Enrolment Teaching
Staff
Total Boys Total Male Schools for Hearing Impaired
34 5505 3466 345 135
Schools for Visually Impaired
13 700 481 145 110
Schools for Mentally Retarded
9 479 367 70 38
Schools for Physically Disabled
2 155 92 20 7
Degree College for Special Education
2 384 303 28 6
Special Education Centres (Cater 4 Disabilities)
112 11344 7570 395 122
Teacher’s Training College for the Teachers Hearing Impaired
1 32 10 13 2
Teacher’s Training College for the Teachers of Blind
1 43 15 22 5
In-service Teacher’s Training College for the Teachers of Disabled
1 0 0 9 0
Source:- Special Education Department, 31-Sher Shah Block,
New Garden Town, Lahore.

EDUCATION
152
Table 52:- Number, Enrolment and Teaching Staff of Govt.
Division/District Number Enrolment Teaching Staff
The Punjab 3342 212380 5039 Bahawalpur Divn. 898 51966 1430
Bahawalpur 55 3482 86
Bahawalnagar 205 10261 305
Rahim Yar Khan 638 38223 1039 D.G.Khan Division 903 65850 1391
D.G.Khan 461 29277 731
Layyah 20 1060 23
Muzaffargarh 298 28501 410
Rajanpur 124 7012 227 Faisalabad Divn. 144 7473 189
Faisalabad 52 3035 82
Chiniot 5 243 7
Jhang 2 182 3
T.T.Singh 85 4013 97 Gujranwala Divn. 295 18591 491
Gujranwala 57 4440 95
Gujrat 101 3960 133
Hafizabad 23 1977 42
Mandi Baha-ud-Din 16 998 33
Narowal 98 7216 188
Sialkot 0 0 0

EDUCATION
153
Mosque Schools by Division & District,
The Punjab: 2009-10
Divison/District Number Enrolment Teaching Staff Lahore Divn. 149 11687 276 Lahore 45 4673 104 Kasur 26 1709 41 Nankana Sahib 5 270 6 Sheikhupura 73 5035 125 Multan Divn. 253 19794 429 Multan 106 7132 121 Khanewal 58 3726 73 Lodhran 27 1455 38 Vehari 62 7481 197 Rawalpindi Divn. 113 3097 103 Rawalpindi 78 1913 63 Attock 1 73 3 Chakwal 28 898 29 Jhelum 6 213 8 Sahiwal Divn. 182 12446 248
Sahiwal 0 0 0
Okara 105 6782 133
Pakpattan 77 5664 115 Sargodha Divn. 405 21476 482
Sargodha 73 4454 111
Bhakkar 230 11846 236
Khushab 0 0 0
Mianwali 102 5176 135
Source:- PMIU, Lahore.
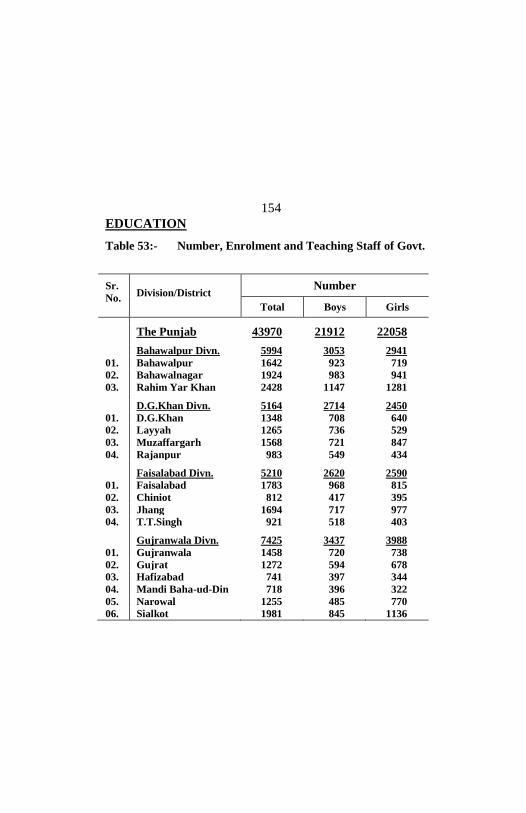
EDUCATION
154
Table 53:- Number, Enrolment and Teaching Staff of Govt.
Sr.
No.
Division/District Number
Total Boys Girls The Punjab 43970 21912 22058 Bahawalpur Divn. 5994 3053 2941
01. Bahawalpur 1642 923 719
02. Bahawalnagar 1924 983 941
03. Rahim Yar Khan 2428 1147 1281 D.G.Khan Divn. 5164 2714 2450
01. D.G.Khan 1348 708 640
02. Layyah 1265 736 529
03. Muzaffargarh 1568 721 847
04. Rajanpur 983 549 434 Faisalabad Divn. 5210 2620 2590
01. Faisalabad 1783 968 815
02. Chiniot 812 417 395
03. Jhang 1694 717 977
04. T.T.Singh 921 518 403 Gujranwala Divn. 7425 3437 3988
01. Gujranwala 1458 720 738
02. Gujrat 1272 594 678
03. Hafizabad 741 397 344
04. Mandi Baha-ud-Din 718 396 322
05. Narowal 1255 485 770
06. Sialkot 1981 845 1136
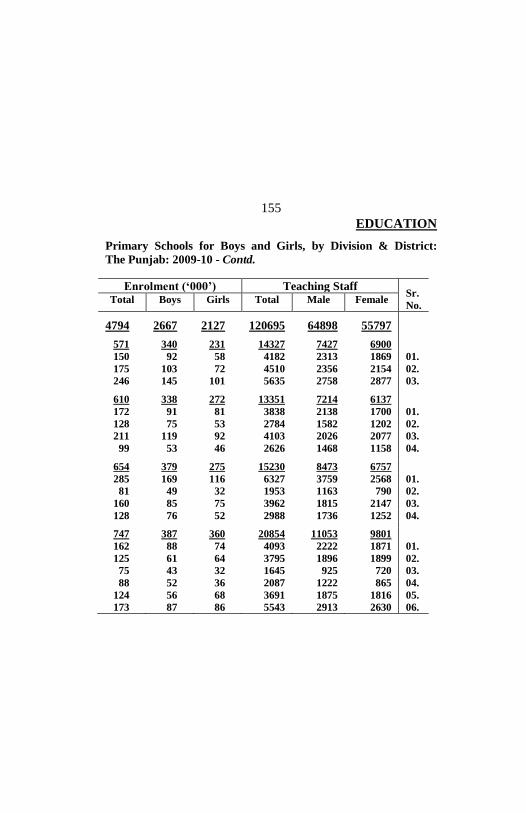
EDUCATION
155
Primary Schools for Boys and Girls, by Division & District:
The Punjab: 2009-10 - Contd.
Enrolment (‘000’) Teaching Staff Sr.
No. Total Boys Girls Total Male Female
4794 2667 2127 120695 64898 55797
571 340 231 14327 7427 6900
150 92 58 4182 2313 1869 01.
175 103 72 4510 2356 2154 02.
246 145 101 5635 2758 2877 03.
610 338 272 13351 7214 6137
172 91 81 3838 2138 1700 01.
128 75 53 2784 1582 1202 02.
211 119 92 4103 2026 2077 03.
99 53 46 2626 1468 1158 04.
654 379 275 15230 8473 6757
285 169 116 6327 3759 2568 01.
81 49 32 1953 1163 790 02.
160 85 75 3962 1815 2147 03.
128 76 52 2988 1736 1252 04.
747 387 360 20854 11053 9801
162 88 74 4093 2222 1871 01.
125 61 64 3795 1896 1899 02.
75 43 32 1645 925 720 03.
88 52 36 2087 1222 865 04.
124 56 68 3691 1875 1816 05.
173 87 86 5543 2913 2630 06.
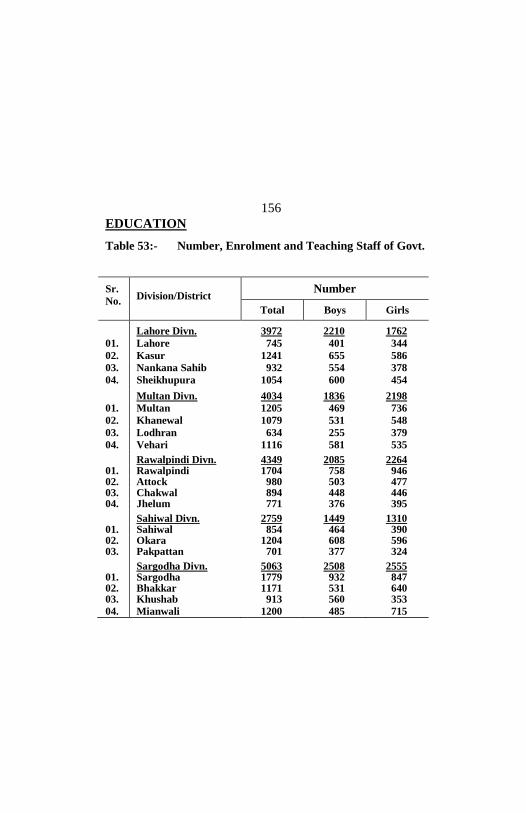
EDUCATION
156
Table 53:- Number, Enrolment and Teaching Staff of Govt.
Sr.
No.
Division/District Number
Total Boys Girls Lahore Divn. 3972 2210 1762
01. Lahore 745 401 344
02. Kasur 1241 655 586
03. Nankana Sahib 932 554 378
04. Sheikhupura 1054 600 454 Multan Divn. 4034 1836 2198
01. Multan 1205 469 736
02. Khanewal 1079 531 548
03. Lodhran 634 255 379
04. Vehari 1116 581 535 Rawalpindi Divn. 4349 2085 2264 01. Rawalpindi 1704 758 946 02. Attock 980 503 477 03. Chakwal 894 448 446 04. Jhelum 771 376 395 Sahiwal Divn. 2759 1449 1310 01. Sahiwal 854 464 390 02. Okara 1204 608 596 03. Pakpattan 701 377 324 Sargodha Divn. 5063 2508 2555 01. Sargodha 1779 932 847 02. Bhakkar 1171 531 640 03. Khushab 913 560 353
04. Mianwali 1200 485 715

EDUCATION
157
Primary Schools for Boys and Girls, by Division & District:
The Punjab: 2009-10 - Concld.
Enrolment (‘000’) Teaching Staff Sr.
No. Total Boys Girls Total Male Female
514 299 215 12412 7203 5209 135 78 57 3330 1865 1465 01. 168 92 76 3730 2150 1580 02. 99 63 36 2482 1555 927 03.
112 66 46 2870 1633 1237 04.
527 288 239 12115 6361 5754 161 78 83 3845 1827 2018 01. 146 84 62 3332 1866 1466 02. 68 35 33 1655 793 862 03.
152 91 61 3283 1875 1408 04.
324 157 167 11373 5805 5568 122 56 66 4404 2105 2299 01. 85 45 40 2721 1469 1252 02. 60 29 31 2204 1143 1061 03. 57 27 30 2044 1088 956 04.
357 210 147 7889 4565 3324 113 65 48 2453 1408 1045 01. 149 90 59 3536 2064 1472 02. 95 55 40 1900 1093 807 03.
490 269 221 13144 6797 6347 193 109 84 5046 2675 2371 01. 117 62 55 2721 1323 1398 02. 76 47 29 2401 1461 940 03.
104 51 53 2976 1338 1638 04.
Source:- PMIU, Lahore.

EDUCATION
158
Table 54:- Number, Enrolment and Teaching Staff of Govt.
Sr.
No.
Division/District Number
Total Boys Girls The Punjab 7534 3163 4371 Bahawalpur Divn. 918 388 530
01. Bahawalpur 244 93 151
02. Bahawalnagar 339 130 209
03. Rahim Yar Khan 335 165 170 D.G.Khan Divn. 664 339 325
01. D.G.Khan 171 98 73
02. Layyah 212 87 125
03. Muzaffargarh 202 104 98
04. Rajanpur 79 50 29 Faisalabad Divn. 976 352 624
01. Faisalabad 426 131 295
02. Chiniot 74 32 42
03. Jhang 193 97 96
04. T.T.Singh 283 92 191 Gujranwala Divn. 1121 423 698
01. Gujranwala 297 121 176
02. Gujrat 193 72 121
03. Hafizabad 85 31 54
04. Mandi Baha-ud-Din 145 48 97
05. Narowal 160 69 91
06. Sialkot 241 82 159

EDUCATION
159
Middle Schools for Boys and Girls, by Division & District:
The Punjab: 2009-10 - Contd.
Enrolment (‘000’) Teaching Staff Sr.
No. Total Boys Girls Total Male Female
2129 997 1132 75910 34701 41209
211 106 105 8288 3773 4515
52 24 28 2231 997 1234 01.
67 31 36 2926 1167 1759 02.
92 51 41 3131 1609 1522 03.
169 101 68 6415 3557 2858
43 27 16 1643 972 671 01.
47 24 23 1985 933 1052 02.
61 37 24 2012 1150 862 03.
18 13 5 775 502 273 04.
307 125 182 9988 3917 6071
155 54 101 4633 1577 3056 01.
18 9 9 566 270 296 02.
55 32 23 1984 1032 952 03.
79 30 49 2805 1038 1767 04.
320 135 185 11664 5115 6549
96 42 54 3197 1521 1676 01.
46 16 30 1830 746 1084 02.
21 9 12 878 358 520 03.
45 16 29 1407 518 889 04.
49 24 25 1755 838 917 05.
63 28 35 2597 1134 1463 06.
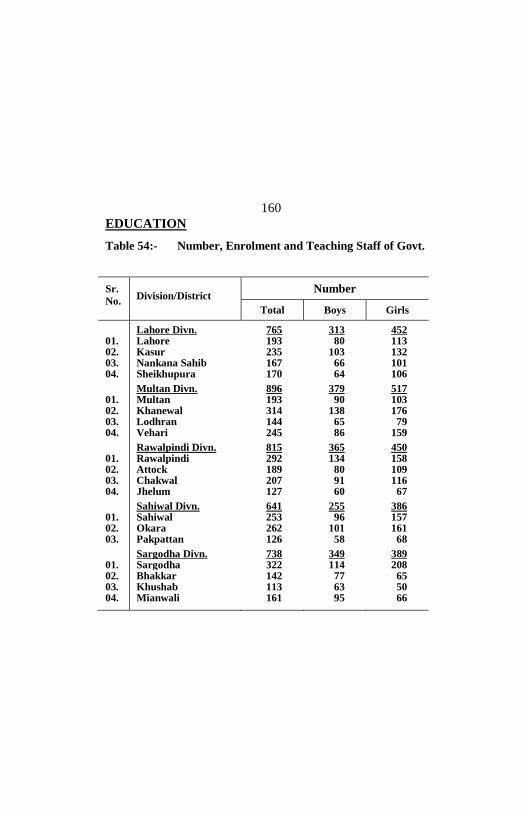
EDUCATION
160
Table 54:- Number, Enrolment and Teaching Staff of Govt.
Sr.
No.
Division/District Number
Total Boys Girls Lahore Divn. 765 313 452 01. Lahore 193 80 113 02. Kasur 235 103 132 03. Nankana Sahib 167 66 101 04. Sheikhupura 170 64 106 Multan Divn. 896 379 517 01. Multan 193 90 103 02. Khanewal 314 138 176 03. Lodhran 144 65 79 04. Vehari 245 86 159 Rawalpindi Divn. 815 365 450 01. Rawalpindi 292 134 158 02. Attock 189 80 109 03. Chakwal 207 91 116 04. Jhelum 127 60 67 Sahiwal Divn. 641 255 386 01. Sahiwal 253 96 157 02. Okara 262 101 161 03. Pakpattan 126 58 68 Sargodha Divn. 738 349 389 01. Sargodha 322 114 208 02. Bhakkar 142 77 65 03. Khushab 113 63 50 04. Mianwali 161 95 66
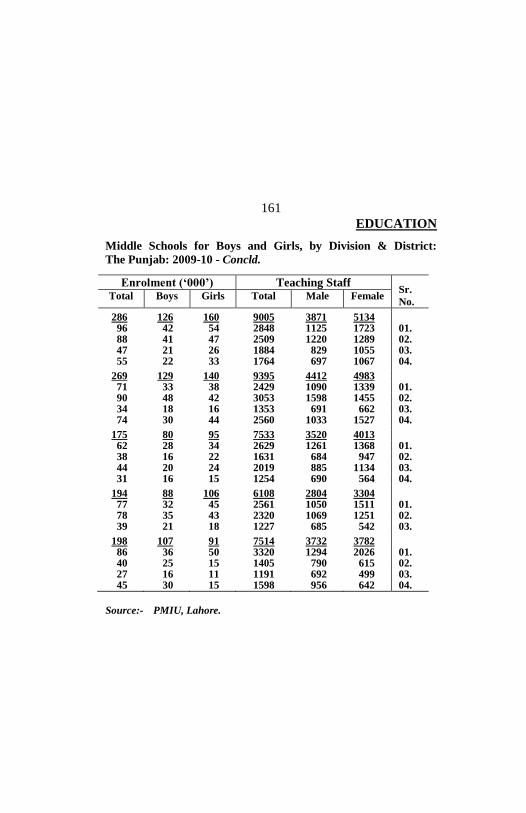
EDUCATION
161
Middle Schools for Boys and Girls, by Division & District:
The Punjab: 2009-10 - Concld.
Enrolment (‘000’) Teaching Staff Sr.
No. Total Boys Girls Total Male Female
286 126 160 9005 3871 5134 96 42 54 2848 1125 1723 01. 88 41 47 2509 1220 1289 02. 47 21 26 1884 829 1055 03. 55 22 33 1764 697 1067 04.
269 129 140 9395 4412 4983 71 33 38 2429 1090 1339 01. 90 48 42 3053 1598 1455 02. 34 18 16 1353 691 662 03. 74 30 44 2560 1033 1527 04.
175 80 95 7533 3520 4013 62 28 34 2629 1261 1368 01. 38 16 22 1631 684 947 02. 44 20 24 2019 885 1134 03. 31 16 15 1254 690 564 04.
194 88 106 6108 2804 3304 77 32 45 2561 1050 1511 01. 78 35 43 2320 1069 1251 02. 39 21 18 1227 685 542 03.
198 107 91 7514 3732 3782 86 36 50 3320 1294 2026 01. 40 25 15 1405 790 615 02. 27 16 11 1191 692 499 03. 45 30 15 1598 956 642 04.
Source:- PMIU, Lahore.

EDUCATION
162
Table 55:- Number, Enrolment and Teaching Staff of Govt.
Sr.
No.
Division/District Number
Total Boys Girls The Punjab 4839 2974 1865 Bahawalpur Divn. 446 293 153
01. Bahawalpur 124 78 46
02. Bahawalnagar 154 99 55
03. Rahim Yar Khan 168 116 52 D.G.Khan Divn. 343 225 118
01. D.G.Khan 102 63 39
02. Layyah 93 54 39
03. Muzaffargarh 99 75 24
04. Rajanpur 49 33 16 Faisalabad Divn. 656 394 262
01. Faisalabad 355 199 156
02. Chiniot 54 40 14
03. Jhang 108 77 31
04. T.T.Singh 139 78 61 Gujranwala Divn. 808 458 350
01. Gujranwala 177 98 79
02. Gujrat 215 125 90
03. Hafizabad 46 32 14
04. Mandi Baha-ud-Din 83 59 24
05. Narowal 99 58 41
06. Sialkot 188 86 102

EDUCATION
163
High Schools for Boys and Girls, by Division & District:
The Punjab: 2009-10 - Contd.
Enrolment (‘000’) Teaching Staff Sr.
No. Total Boys Girls Total Male Female
3051 1774 1277 97798 59841 37957
281 174 107 9672 6391 3281
73 42 31 2812 1810 1002 01.
88 57 31 3204 2080 1124 02.
120 75 45 3656 2501 1155 03.
192 118 74 6597 4262 2335
45 24 21 1760 1046 714 01.
55 33 22 1845 1097 748 02.
66 45 21 2080 1514 566 03.
26 16 10 912 605 307 04.
429 256 173 12733 7933 4800
250 141 109 7107 4151 2956 01.
33 22 11 934 667 267 02.
67 49 18 2075 1528 547 03.
79 44 35 2617 1587 1030 04.
530 285 245 16913 9824 7089
135 70 65 4181 2448 1733 01.
118 60 58 3804 2135 1669 02.
30 22 8 1025 786 239 03.
49 31 18 1547 1092 455 04.
68 38 30 2096 1202 894 05.
130 64 66 4260 2161 2099 06.

EDUCATION
164
Table 55:- Number, Enrolment and Teaching Staff of Govt.
Sr.
No.
Division/District Number
Total Boys Girls Lahore Divn. 570 334 236 01. Lahore 285 141 144 02. Kasur 115 76 39 03. Nankana Sahib 81 58 23 04. Sheikhupura 89 59 30 Multan Divn. 472 314 158 01. Multan 135 99 36 02. Khanewal 157 100 57 03. Lodhran 73 51 22 04. Vehari 107 64 43 Rawalpindi Divn. 746 429 317 01. Rawalpindi 287 167 120 02. Attock 195 112 83 03. Chakwal 163 94 69 04. Jhelum 101 56 45 Sahiwal Divn. 344 240 104 01. Sahiwal 148 97 51 02. Okara 131 94 37 03. Pakpattan 65 49 16 Sargodha Divn. 454 287 167 01. Sargodha 221 123 98 02. Bhakkar 73 52 21 03. Khushab 78 57 21 04. Mianwali 82 55 27
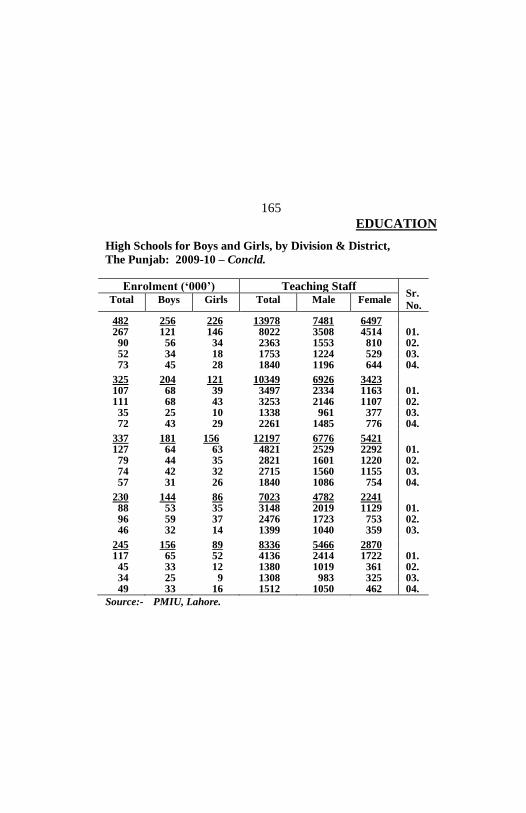
EDUCATION
165
High Schools for Boys and Girls, by Division & District,
The Punjab: 2009-10 – Concld.
Enrolment (‘000’) Teaching Staff Sr.
No. Total Boys Girls Total Male Female
482 256 226 13978 7481 6497 267 121 146 8022 3508 4514 01. 90 56 34 2363 1553 810 02. 52 34 18 1753 1224 529 03. 73 45 28 1840 1196 644 04.
325 204 121 10349 6926 3423 107 68 39 3497 2334 1163 01. 111 68 43 3253 2146 1107 02. 35 25 10 1338 961 377 03. 72 43 29 2261 1485 776 04.
337 181 156 12197 6776 5421 127 64 63 4821 2529 2292 01. 79 44 35 2821 1601 1220 02. 74 42 32 2715 1560 1155 03. 57 31 26 1840 1086 754 04.
230 144 86 7023 4782 2241 88 53 35 3148 2019 1129 01. 96 59 37 2476 1723 753 02. 46 32 14 1399 1040 359 03.
245 156 89 8336 5466 2870 117 65 52 4136 2414 1722 01. 45 33 12 1380 1019 361 02. 34 25 9 1308 983 325 03. 49 33 16 1512 1050 462 04.
Source:- PMIU, Lahore.

EDUCATION
166
Table 56 :- Number, Enrolment and Teaching Staff of Arts
Division/
District
Intermediate
Colleges Degree Colleges
No.
En-
rol-
ment
Teach-
ing
Staff
No. Enrol-
ment
Teach-
ing
Staff The Punjab 226 52177 4007 675 671459 19089 Bahawalpur Divn. 21 2471 273 64 57653 1732
Bahawalpur 7 1138 120 24 21628 721
Bahawalnagar 11 931 113 19 15177 412
R. Y. Khan 3 402 40 21 20848 599
D.G.Khan Divn. 16 3011 236 39 30741 809
D.G.Khan 4 451 59 8 9446 252
Layyah 1 142 12 11 8701 189
Muzaffargarh 8 1922 118 13 8830 283
Rajanpur 3 496 47 7 3764 85 Faisalabad Divn. 52 11232 824 104 103066 2829 Faisalabad 25 5741 369 65 69419 1823 Chiniot 5 644 99 8 5786 186 Jhang 14 3408 233 11 10073 346 T.T.Singh 8 1439 123 20 17788 474 Gujranwala Divn. 26 3419 361 115 116873 2750 Gujranwala 14 2096 217 33 37699 961 Gujrat 5 425 50 41 27330 739 Hafizabad 1 87 13 4 3672 82 M. B. Din 1 145 13 9 7795 135 Narowal 1 7 8 11 8573 247 Sialkot 4 659 60 17 31804 586
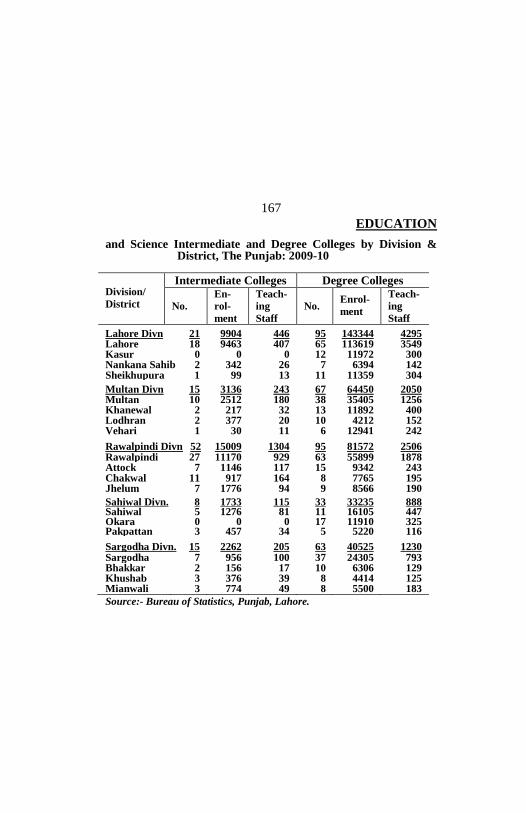
EDUCATION
167
and Science Intermediate and Degree Colleges by Division & District, The Punjab: 2009-10
Division/
District
Intermediate Colleges Degree Colleges
No.
En-
rol-
ment
Teach-
ing
Staff
No. Enrol-
ment
Teach-
ing
Staff Lahore Divn 21 9904 446 95 143344 4295 Lahore 18 9463 407 65 113619 3549 Kasur 0 0 0 12 11972 300 Nankana Sahib 2 342 26 7 6394 142 Sheikhupura 1 99 13 11 11359 304 Multan Divn 15 3136 243 67 64450 2050 Multan 10 2512 180 38 35405 1256 Khanewal 2 217 32 13 11892 400 Lodhran 2 377 20 10 4212 152 Vehari 1 30 11 6 12941 242 Rawalpindi Divn. 52 15009 1304 95 81572 2506 Rawalpindi 27 11170 929 63 55899 1878 Attock 7 1146 117 15 9342 243 Chakwal 11 917 164 8 7765 195 Jhelum 7 1776 94 9 8566 190 Sahiwal Divn. 8 1733 115 33 33235 888 Sahiwal 5 1276 81 11 16105 447 Okara 0 0 0 17 11910 325 Pakpattan 3 457 34 5 5220 116 Sargodha Divn. 15 2262 205 63 40525 1230 Sargodha 7 956 100 37 24305 793 Bhakkar 2 156 17 10 6306 129 Khushab 3 376 39 8 4414 125 Mianwali 3 774 49 8 5500 183
Source:- Bureau of Statistics, Punjab, Lahore.
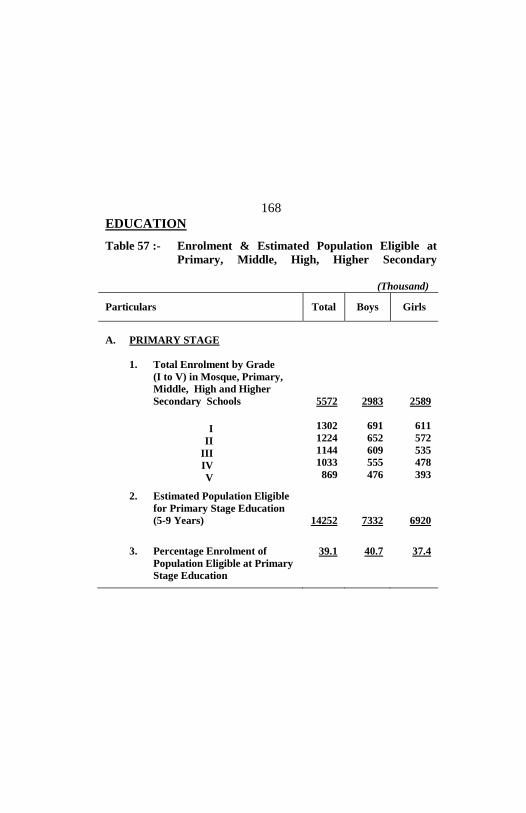
EDUCATION
168
Table 57 :- Enrolment & Estimated Population Eligible at
Primary, Middle, High, Higher Secondary
(Thousand)
Particulars Total Boys Girls
A. PRIMARY STAGE
1. Total Enrolment by Grade
(I to V) in Mosque, Primary,
Middle, High and Higher
Secondary Schools
I
II
III
IV
V
5572
1302
1224
1144
1033
869
2983
691
652
609
555
476
2589
611
572
535
478
393 2. Estimated Population Eligible
for Primary Stage Education
(5-9 Years)
14252
7332
6920
3. Percentage Enrolment of
Population Eligible at Primary
Stage Education
39.1
40.7
37.4

EDUCATION
169
Various Stages of Education by Grade and Sex at
And College Stage (I-XIV Classes), The Punjab: 2009-10- Contd.
(Thousand)
Particulars Total Boys Girls
B. MIDDLE STAGE
1. Total Enrolment by Grade
(VI-VIII) Middle, High and
Higher Secondary Schools
VI
VII
VIII
2014
737
656
621
1148
414
375
359
866
323
281
262
2. Estimated Population Eligible
for Middle Stage Education
(10-12 Years)
7250
3736
3514
3. Percentage Enrolment of
Population Eligible at Middle
Stage Education.
27.8
30.7
24.6
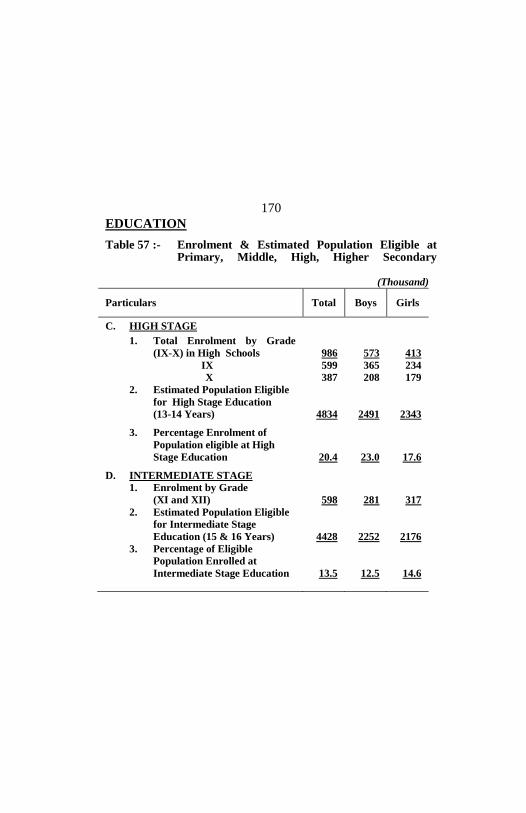
EDUCATION
170
Table 57 :- Enrolment & Estimated Population Eligible at Primary, Middle, High, Higher Secondary
(Thousand)
Particulars Total Boys Girls
C. HIGH STAGE
1. Total Enrolment by Grade
(IX-X) in High Schools
IX
X
986
599
387
573
365
208
413
234
179
2. Estimated Population Eligible
for High Stage Education
(13-14 Years)
4834
2491
2343
3. Percentage Enrolment of
Population eligible at High
Stage Education
20.4
23.0
17.6
D. INTERMEDIATE STAGE
1. Enrolment by Grade
(XI and XII)
2. Estimated Population Eligible
for Intermediate Stage
Education (15 & 16 Years)
3. Percentage of Eligible
Population Enrolled at
Intermediate Stage Education
598
4428
13.5
281
2252
12.5
317
2176
14.6
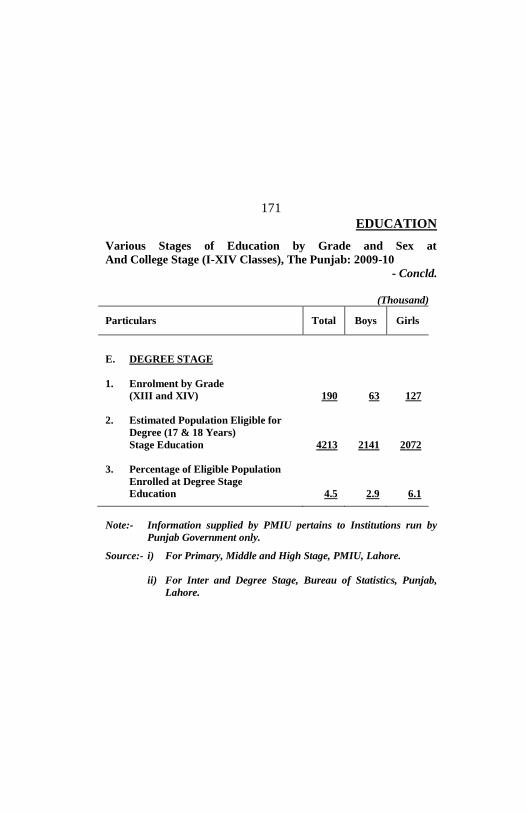
EDUCATION
171
Various Stages of Education by Grade and Sex at
And College Stage (I-XIV Classes), The Punjab: 2009-10
- Concld.
(Thousand)
Particulars Total Boys Girls
E. DEGREE STAGE
1. Enrolment by Grade
(XIII and XIV)
2. Estimated Population Eligible for
Degree (17 & 18 Years)
Stage Education
190
4213
63
2141
127
2072
3. Percentage of Eligible Population
Enrolled at Degree Stage
Education
4.5
2.9
6.1
Note:- Information supplied by PMIU pertains to Institutions run by
Punjab Government only. Source:- i) For Primary, Middle and High Stage, PMIU, Lahore.
ii) For Inter and Degree Stage, Bureau of Statistics, Punjab,
Lahore.

EDUCATION
172
Table 58 :- Literacy Ratio by District, The Punjab
(Percentage)
District
All Areas/
Both Sexes 1998 Census
1981 1998 Urban Rural Male Fe-
male
The Punjab 27.4 46.6 64.5 38.0 57.2 35.1
Bahawalpur 2 20.4 35.0 57.0 26.3 44.9 24.0
Bahawalnagar 19.5 35.1 51.9 30.8 45.5 23.8
R. Y. Khan 20.0 33.1 57.0 26.9 43.4 21.8 D.G.Khan 16.3 30.6 61.8 25.0 42.1 18.1
Layyah 18.9 38.7 62.5 34.9 53.0 23.4
Muzaffargarh 16.8 28.4 55.5 24.1 40.9 14.8
Rajanpur 12.5 20.7 49.9 15.5 29.0 11.3 Faisalabad 31.8 51.9 64.2 42.5 60.9 42.2
Jhang 20.3 37.1 57.5 30.7 51.5 21.4
T.T.Singh 30.3 50.5 63.2 47.5 61.3 39.1 Gujranwala 29.9 56.6 64.0 48.7 63.6 48.8
Gujrat 31.3 62.2 72.8 57.9 73.0 51.6
Hafizabad 30.3 50.5 63.2 47.5 61.3 39.1
M. B. Din 23.4 47.4 67.1 43.8 58.8 35.6
Narowal 25.5 52.7 67.5 50.5 65.6 39.8
Sialkot
30.8 58.9 72.3 53.8 65.9 51.5

EDUCATION
173
Table 58 :- Literacy Ratio by District, The Punjab .
(Percentage)
District
All Areas/
Both Sexes 1998 Census
1981 1998 Urban Rural Male Fe-
male
Lahore 48.4 64.7 69.1 41.7 69.1 59.7
Kasur 18.7 36.2 49.4 32.2 47.6 23.4
Nankana Sahib (Included in Sheikhupura District)
Sheikhupura 5 22.4 43.8 57.6 38.8 53.3 33.3 Multan 23.5 43.4 60.9 29.5 53.3 32.3
Khanewal 25.6 39.9 60.8 35.4 53.6 25.1
Lodhran 14.9 29.9 47.7 26.8 42.7 16.0
Vehari 19.2 36.8 56.7 32.9 49.4 23.2 Rawalpindi 46.6 70.4 76.0 63.9 81.2 59.2
Attock 21.1 49.3 69.4 43.7 66.9 32.0
Chakwal 39.7 56.7 70.7 54.8 73.4 42.2
Jhelum 38.9 68.9 77.2 58.6 77.7 50.5 Sahiwal 21.7 43.9 65.8 39.4 54.7 32.3
Okara 24.8 37.8 58.7 31.3 49.3 25.0
Pakpattan 16.9 34.7 57.6 30.8 47.0 21.3 Sargodha 24.9 46.3 64.2 39.1 59.2 32.7
Bhakkar 17.7 34.2 55.1 30.1 49.7 17.6
Khushab 21.4 40.5 51.6 36.7 59.8 21.8
Mianwali 21.4 42.8 57.1 38.3 63.8 22.1
Source:- Population Census Organization, Islamabad

EDUCATION
174
Table 59:- Literacy Ratios by Sex, Urban & Rural Areas
(Population 10 years and Above), The Punjab
(Percentage) Area
Sex
All Areas Urban Areas Rural Areas
1998
Census
2009-
10
1998
Census
2009-
10
1998
Census
2009-
10
Total 46.6 59.6 64.5 73.5 38.0 52.5
Male
57.2 69.1 70.9 78.9 50.4 64.0
Female 35.1 49.8 57.2 67.8 24.8 40.7
Note:- Literacy ratio is the percentage of Literates (10 years & above)
in the total population.
Source:- i) For 1998: Population Census Organization, Islamabad.
ii) For 2009-10: Federal Bureau of Statistics, Islamabad
(LFS Survey).

FISHERIES
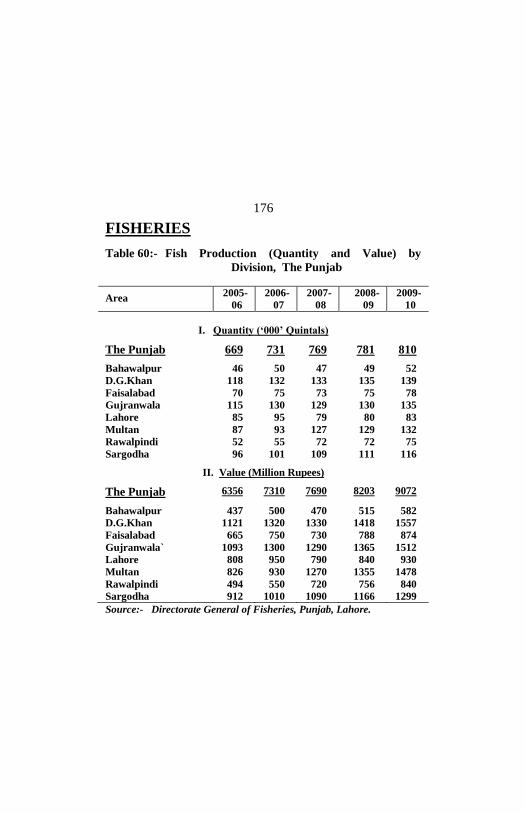
FISHERIES
176
Table 60:- Fish Production (Quantity and Value) by
Division, The Punjab
Area 2005-
06
2006-
07
2007-
08
2008-
09
2009-
10
I. Quantity (‘000’ Quintals)
The Punjab 669 731 769 781 810 Bahawalpur 46 50 47 49 52
D.G.Khan 118 132 133 135 139
Faisalabad 70 75 73 75 78
Gujranwala 115 130 129 130 135
Lahore 85 95 79 80 83
Multan 87 93 127 129 132
Rawalpindi 52 55 72 72 75
Sargodha 96 101 109 111 116
II. Value (Million Rupees)
The Punjab 6356 7310 7690 8203 9072 Bahawalpur 437 500 470 515 582
D.G.Khan 1121 1320 1330 1418 1557
Faisalabad 665 750 730 788 874
Gujranwala` 1093 1300 1290 1365 1512
Lahore 808 950 790 840 930
Multan 826 930 1270 1355 1478
Rawalpindi 494 550 720 756 840
Sargodha 912 1010 1090 1166 1299
Source:- Directorate General of Fisheries, Punjab, Lahore.

FOOD GRAINS

FOODGRAINS
179
Table 61:- Procurement of Wheat by PASSCO and Food
Department, The Punjab
(Hundred Metric Tons)
Year Total PASSCO Food
Department
2001-02 40870 15725 25145
2002-03 38197 9761 28436
2003-04 31943 7852 24091
2004-05 32421 8233 24188
2005-06 34353 9973 24380
2006-07 38052 12424 25628
2007-08 38377 12689 25688
2008-09 34114 8540 25574
2009-10 79244 21430 57814
2010-11 48493 11275(p) 37218
Source:- i) For PASSCO: Pakistan Agricultural Storage &
Services Corporation(PASSCO) Limited, Lahore.
ii) For Food Department: Food Directorate, Punjab
Lahore.
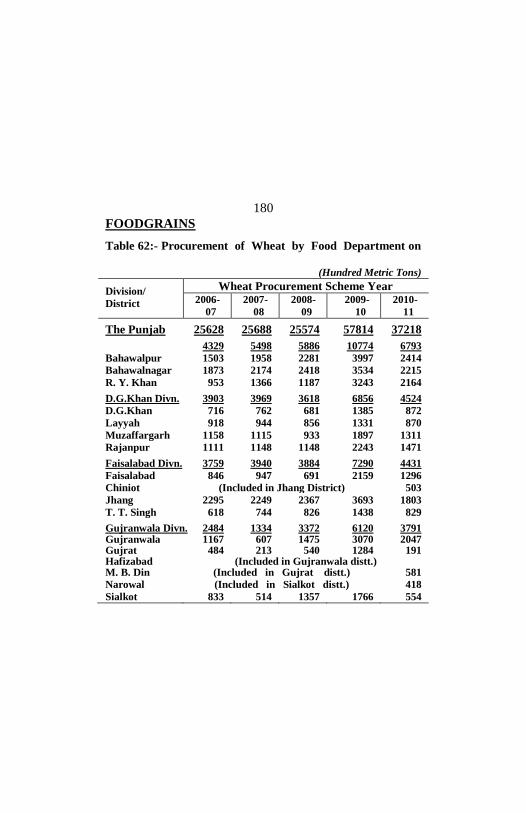
FOODGRAINS
180
Table 62:- Procurement of Wheat by Food Department on
(Hundred Metric Tons)
Division/
District
Wheat Procurement Scheme Year 2006-
07
2007-
08
2008-
09
2009-
10
2010-
11
The Punjab 25628 25688 25574 57814 37218 4329 5498 5886 10774 6793
Bahawalpur 1503 1958 2281 3997 2414
Bahawalnagar 1873 2174 2418 3534 2215
R. Y. Khan 953 1366 1187 3243 2164 D.G.Khan Divn. 3903 3969 3618 6856 4524
D.G.Khan 716 762 681 1385 872
Layyah 918 944 856 1331 870
Muzaffargarh 1158 1115 933 1897 1311
Rajanpur 1111 1148 1148 2243 1471 Faisalabad Divn. 3759 3940 3884 7290 4431
Faisalabad 846 947 691 2159 1296
Chiniot (Included in Jhang District) 503
Jhang 2295 2249 2367 3693 1803
T. T. Singh 618 744 826 1438 829 Gujranwala Divn. 2484 1334 3372 6120 3791 Gujranwala 1167 607 1475 3070 2047 Gujrat 484 213 540 1284 191 Hafizabad (Included in Gujranwala distt.) M. B. Din (Included in Gujrat distt.) 581
Narowal (Included in Sialkot distt.) 418
Sialkot 833 514 1357 1766 554

FOODGRAINS
181
Voluntary Basis by Division and District, The Punjab
(Hundred Metric Tons)
Division/District
Wheat Procurement Scheme Year 2006-
07 2007-
08 2008-
09 2009-
10 2010-
11 Lahore Divn. 1102 679 1445 4900 3004 Lahore 118 50 54 643 413 Kasur 317 206 341 1546 1000 Nankana Sahib (Included in Sheikhupura district) 648 Sheikhupura 667 423 1050 2711 943 Multan Divn. 4355 4857 2845 9733 6533 Multan 1159 1263 500 3288 2239 Khanewal 1372 1446 997 2672 1789 Lodhran 638 881 438 1544 959 Vehari 1186 1267 910 2229 1546 Rawalpindi Divn. 48 15 49 183 26 Rawalpindi 18 6 13 19 1 Attock 10 1 12 92 11 Chakwal 10 5 15 37 1 Jhelum 10 3 9 35 13 Sahiwal Divn. 2904 2795 2481 7018 4821 Sahiwal 1193 1365 993 2853 1956 Okara 1201 854 1036 2651 1818 Pakpattan 510 576 452 1514 1047 Sargodha Divn. 2744 2601 1994 4940 3295 Sargodha 1257 843 705 2213 1246 Bhakkar 1037 1222 899 1901 1312 Khushab (Included in Sargodha district) 178 Mianwali 450 536 390 826 559
Source:- Food Directorate, Punjab, Lahore.
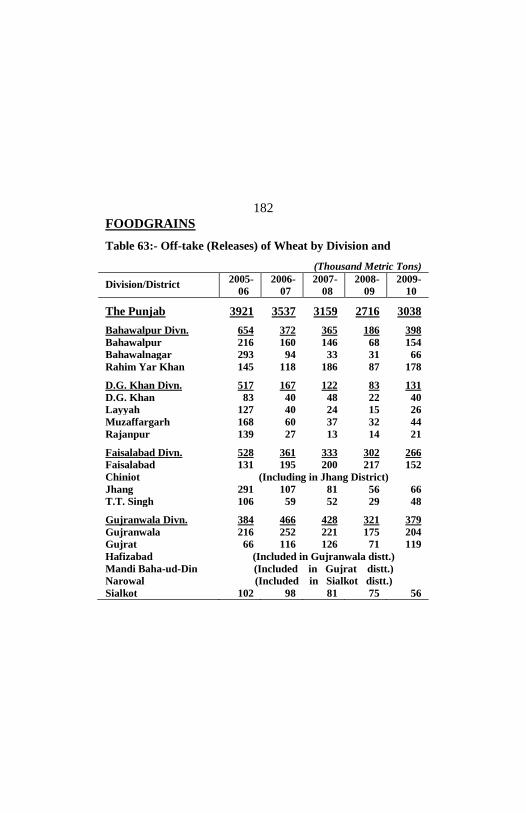
FOODGRAINS
182
Table 63:- Off-take (Releases) of Wheat by Division and
(Thousand Metric Tons)
Division/District 2005-
06
2006-
07
2007-
08
2008-
09
2009-
10
The Punjab 3921 3537 3159 2716 3038 Bahawalpur Divn. 654 372 365 186 398
Bahawalpur 216 160 146 68 154
Bahawalnagar 293 94 33 31 66
Rahim Yar Khan 145 118 186 87 178 D.G. Khan Divn. 517 167 122 83 131
D.G. Khan 83 40 48 22 40
Layyah 127 40 24 15 26
Muzaffargarh 168 60 37 32 44
Rajanpur 139 27 13 14 21 Faisalabad Divn. 528 361 333 302 266
Faisalabad 131 195 200 217 152
Chiniot (Including in Jhang District)
Jhang 291 107 81 56 66
T.T. Singh 106 59 52 29 48 Gujranwala Divn. 384 466 428 321 379
Gujranwala 216 252 221 175 204
Gujrat 66 116 126 71 119
Hafizabad (Included in Gujranwala distt.)
Mandi Baha-ud-Din (Included in Gujrat distt.)
Narowal (Included in Sialkot distt.)
Sialkot 102 98 81 75 56
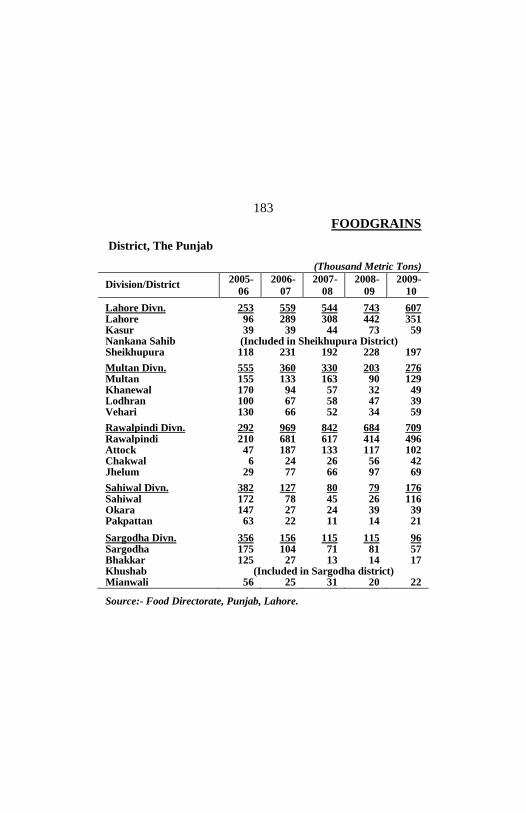
FOODGRAINS
183
District, The Punjab
(Thousand Metric Tons)
Division/District 2005-
06
2006-
07
2007-
08
2008-
09
2009-
10 Lahore Divn. 253 559 544 743 607 Lahore 96 289 308 442 351 Kasur 39 39 44 73 59 Nankana Sahib (Included in Sheikhupura District) Sheikhupura 118 231 192 228 197 Multan Divn. 555 360 330 203 276 Multan 155 133 163 90 129 Khanewal 170 94 57 32 49 Lodhran 100 67 58 47 39 Vehari 130 66 52 34 59 Rawalpindi Divn. 292 969 842 684 709 Rawalpindi 210 681 617 414 496 Attock 47 187 133 117 102 Chakwal 6 24 26 56 42 Jhelum 29 77 66 97 69 Sahiwal Divn. 382 127 80 79 176 Sahiwal 172 78 45 26 116 Okara 147 27 24 39 39 Pakpattan 63 22 11 14 21 Sargodha Divn. 356 156 115 115 96 Sargodha 175 104 71 81 57 Bhakkar 125 27 13 14 17 Khushab (Included in Sargodha district) Mianwali 56 25 31 20 22 Source:- Food Directorate, Punjab, Lahore.

FOODGRAINS
184
Table 64:- Foodgrains Storage Capacity with Food
(Thousand Metric Tons)
Division/District
Total House
Type
Silos/Bins/
Bini Shell
Open
Bulk
Head
The Punjab 2219 1586 628 5 Bahawalpur Divn. 323 255 68 - Bahawalpur 101 44 57 - Bahawalnagar 105 95 10 - Rahim Yar Khan 117 116 1 - D.G. Khan Divn. 103 96 7 - D.G. Khan 9 7 2 - Layyah 42 39 3 - Muzaffargarh 44 43 1 - Rajanpur 8 7 1 - Faisalabad Divn. 388 267 121 - Faisalabad 182 130 52 - Chiniot (Including in Jhang District) Jhang 133 85 48 - T.T. Singh 73 52 21 - Gujranwala Divn. 147 139 8 - Gujranwala 88 82 6 - Gujrat 26 25 1 - Hafizabad (Included in Gujranwala district) Mandi Baha-ud-Din (Included in Gujrat district) Narowal (Included in Sialkot district)
Sialkot 33 32 1 -

FOODGRAINS
185
Department by Division and District, The Punjab: As on 30th June, 2010
(Thousand Metric Tons) Division/District
Total
House Type
Silos/Bins/ Bini Shell
Open Bulk Head
Lahore Divn. 238 225 13 - Lahore 90 80 10 - Kasur 47 45 2 - Nankana Sahib (Included in Sheikhupura) Sheikhupura 101 100 1 - Multan Divn. 411 194 212 5 Multan 89 44 45 - Khanewal 128 48 80 - Lodhran 78 76 2 - Vehari 116 26 85 5 Rawalpindi Divn. 168 131 37 - Rawalpindi 133 97 36 - Attock 16 15 1 - Chakwal 5 5 - - Jhelum 14 14 - - Sahiwal Divn. 292 203 89 - Sahiwal 90 78 12 - Okara 98 92 6 - Pakpattan 104 33 71 - Sargodha Divn. 149 76 73 - Sargodha 93 32 61 - Bhakkar 25 22 3 - Khushab 17 13 4 - Mianwali 14 9 5 - Source:- Food Directorate, Punjab, Lahore.

FOODGRAINS
186
Table 65:- Wheat Imports into Pakistan and Receipts of
Imported Wheat in the Punjab
(Thousand Metric Tons)
Year
Pakistan
Receipts of Imported
Wheat in the Punjab Quantity Percentage
2000-01 * - -
2001-02 * - -
2002-03 * - -
2003-04 * - -
2004-05 1368 467 34.1
2005-06 815 - -
2006-07 * * -
2007-08 1708 386 22.6
2008-09 2685 667 24.8
2009-10 * - - * No Wheat was imported because of self sufficiency.
Source:- Ministry of Food and Agriculture (MINFAL), Government
of Pakistan, Islamabad.

FOODGRAINS
187
Table 66:- Sugar Production and Stocks, The Punjab
(Hundred Metric Tons)
Year
Production
(During the
Season)
Sold in
Open
Market
Balance
with Sugar
Mills
2000-01 14371 9794 4620
2001-02 21185 14312 11493
2002-03 22517 22058 11952
2003-04 24232 23351 12833
2004-05 21120 12990 20963
2005-06 16065 12132 24896
2006-07 22732 19959 27669
2007-08 29220 20350 36539
2008-09 20118 10120 46537
2009-10 18491 17258 47770
Note:- The Closing balance with Sugar Mills during 1999-00 was 43
hundred metric tons.
Source:- Food Directorate, Punjab, Lahore.

FOREIGN TRADE

FOREIGN TRADE
189

FOREIGN TRADE
190
Table 67:- Quantum Indices of Imports and Exports
Commodity Group Imports
2007-
08
2008-
09
2009-
10 (p)
All Groups 279.04 287.17 268.60
1. Food & Live
Animals
215.32
250.08
152.80
2. Beverages and
Tobacco
472.93
357.04
383.26
3. Crude Materials
Inedible except fuel
634.62
611.41
520.60
4. Minerals Fuel &
Lubricants
235.18
219.07
225.40
5. Animal/Vegetable
Oil & Fats
115.03
118.96
160.66
6. Chemicals 244.40 209.42 249.21
7. Manufactured
Goods
221.28
197.27
215.21
8. Machinery &
Transport
Equipment
371.00
472.81
358.13
9. Misc. Manufactured
Goods
340.31
272.85
281.01

FOREIGN TRADE
191
Base: 1990-91=100
Commodity Group Exports
2007-
08
2008-
09
2009-
10 (p)
All Groups 187.89 178.00 194.41
1. Food & Live
Animals
207.64
206.61
254.54
2. Beverages and
Tobacco
291.57
233.15
258.74
3. Crude Materials
Inedible except fuel
181.66
140.65
243.10
4. Minerals Fuel &
Lubricants
571.26
393.57
323.42
5. Chemicals 942.99 1054.11 991.98
6. Manufactured
Goods
173.88
170.86
187.74
7. Machinery &
Transport
Equipment
714.23
1848.54
1262.30
8. Misc. Manufactured
Goods
198.98
174.14
168.77
Source:- Federal Bureau of Statistics, Karachi.

FOREIGN TRADE
192
Table 68:- Balance of Trade, Pakistan
(Rs. in Million)
Year Exports Re-
Exports Imports
Re-
Imports
Balance of
Trade
1 2 3 4 5 6=(2+3
-4-5)
2000-01 539070 3711 627000 745 (-) 84964
2001-02 560947 4307 634630 688 (-) 70064
2002-03 652294 2943 714372 342 (-) 59477
2003-04 709036 24025 897825 819 (-) 165583
2004-05 854088 6077 1223079 4729 (-) 367643
2005-06 984841 7717 1711158 614 (-) 719214
2006-07 1029312 9726 1851806 232 (-) 813000
2007-08 1196638 45528 2512072 691 (-)1270597
2008-09 1383718 21927 2723570 1643 (-)1319568
2009-10(p) 1617458 23470 2910975 14 (-)1270061
Source:- Federal Bureau of Statistics, Karachi.
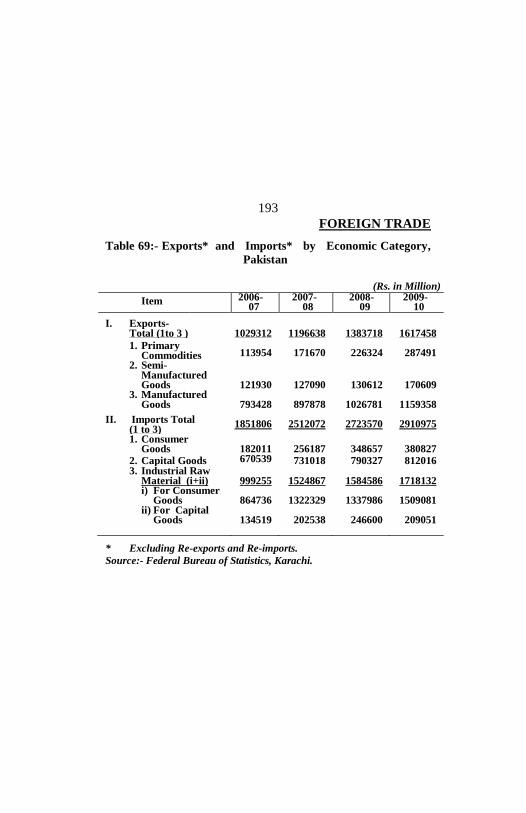
FOREIGN TRADE
193
Table 69:- Exports* and Imports* by Economic Category,
Pakistan
(Rs. in Million)
Item 2006- 07
2007- 08
2008- 09
2009- 10
I. Exports- Total (1to 3 )
1029312
1196638
1383718
1617458
1. Primary Commodities
113954
171670
226324
287491
2. Semi- Manufactured Goods
121930
127090
130612
170609 3. Manufactured Goods
793428
897878
1026781
1159358
II. Imports Total (1 to 3)
1851806
2512072
2723570
2910975
1. Consumer Goods
182011
256187
348657
380827
2. Capital Goods 670539 731018 790327 812016 3. Industrial Raw Material (i+ii)
999255
1524867
1584586
1718132
i) For Consumer Goods
864736
1322329
1337986
1509081
ii) For Capital Goods
134519
202538
246600
209051
* Excluding Re-exports and Re-imports.
Source:- Federal Bureau of Statistics, Karachi.
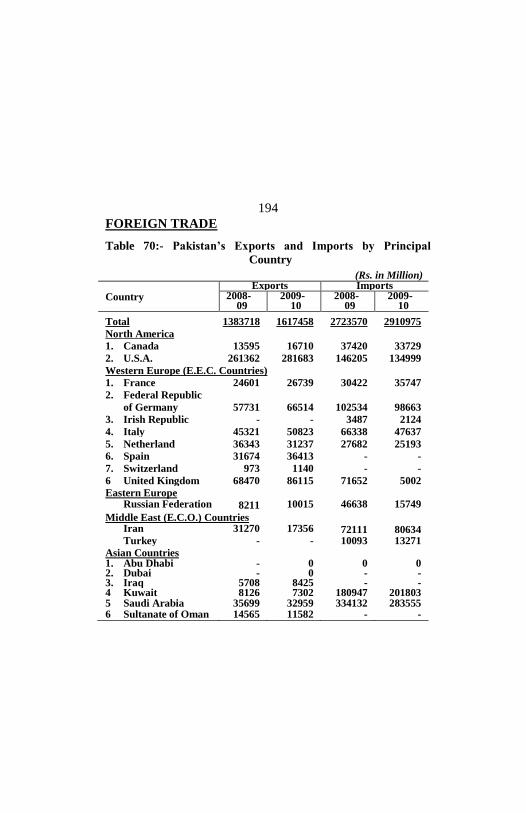
FOREIGN TRADE
194
Table 70:- Pakistan’s Exports and Imports by Principal
Country
(Rs. in Million) Country
Exports Imports 2008-
09 2009-
10 2008-
09 2009-
10 Total 1383718 1617458 2723570 2910975
North America
1. Canada 13595 16710 37420 33729
2. U.S.A. 261362 281683 146205 134999
Western Europe (E.E.C. Countries)
1. France 24601 26739 30422 35747
2. Federal Republic
of Germany
57731
66514
102534
98663
3. Irish Republic - - 3487 2124
4. Italy 45321 50823 66338 47637
5. Netherland 36343 31237 27682 25193
6. Spain 31674 36413 - -
7. Switzerland 973 1140 - -
6 United Kingdom 68470 86115 71652 5002
Eastern Europe Russian Federation 8211 10015 46638 15749
Middle East (E.C.O.) Countries Iran 31270 17356 72111 80634 Turkey - - 10093 13271
Asian Countries 1. Abu Dhabi - 0 0 0 2. Dubai - 0 - - 3. Iraq 5708 8425 - - 4 Kuwait 8126 7302 180947 201803 5 Saudi Arabia 35699 32959 334132 283555 6 Sultanate of Oman 14565 11582 - -
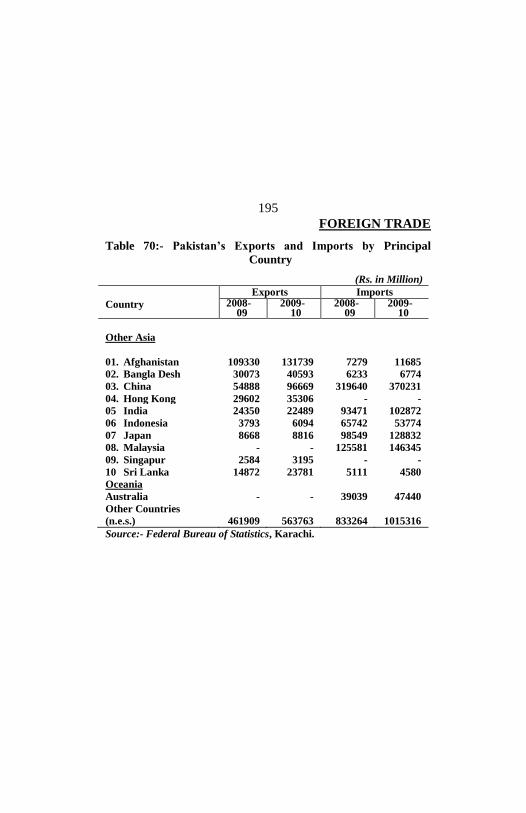
FOREIGN TRADE
195
Table 70:- Pakistan’s Exports and Imports by Principal
Country
(Rs. in Million)
Country
Exports Imports 2008-
09 2009-
10 2008-
09 2009-
10
Other Asia
01. Afghanistan 109330 131739 7279 11685
02. Bangla Desh 30073 40593 6233 6774
03. China 54888 96669 319640 370231
04. Hong Kong 29602 35306 - -
05 India 24350 22489 93471 102872
06 Indonesia 3793 6094 65742 53774
07 Japan 8668 8816 98549 128832
08. Malaysia - - 125581 146345
09. Singapur 2584 3195 - -
10 Sri Lanka 14872 23781 5111 4580
Oceania
Australia - - 39039 47440
Other Countries
(n.e.s.)
461909
563763
833264
1015316
Source:- Federal Bureau of Statistics, Karachi.

FOREIGN TRADE
196
Table 71 :- Imports and Exports by Commodity
Group, Pakistan (Rs. in Million)
Commodity Groups Imports Exports
2008- 09
2009- 10
2008- 09
2009- 10
Total-All Groups 2723570 2910974 1383718 1617456 1. Food and Live Animals
183415
141006
227012
272241
2. Beverages and Tobacco
1492
2354
1887
2409
3. Crude Material inedible except fuels
222254
234702
31539
54819
4. Mineral Fuels, Lubricants and related Material
797189
883653
62959
84452 5. Animals and Vege- table Oils & Fats
124316
120975
10566
7966
6. Chemicals 409810 492227 47289 62252 7. Manufactured Goods Classified Chiefly by Material
271679
294972
614420
694861 8. Machinery and Transport Equipment
626012
616893
20754
19293 9. Misc. Manufac- tured Articles
83342
89101
367237
419063
10. Commodities and Transactions not classified according to kind
4061
35091
55
100
Source:- Federal Bureau of Statistics, Karachi.

FORESTRY

FORESTRY
198
Table 72:- Forest Area by Administrative Jurisdiction and
Sr.
No.
Division/
District
Total
Com-
pact
Protected Forest
Total
Linear
(Run-
ning
K.M)
Compact
Area
Under
Provin-
cial
Govt.
Area
Trans-
ferred to
District
Govt. The Punjab 630725 48910 268987 9886 Bahawalpur Divn. 117569 9720 100780 - 01. Bahawalpur 82059 2403 71574 - 02. Bahawalnagar 11011 4780 9313 - 03. R.Y.Khan 24499 2538 19893 - D.G.Khan Divn. 111790 5824 68149 1429 01. D.G.Khan 8062 1083 7313 - 02. Layyah 13896 1109 10791 - 03. Muzaffargarh 77351 2304 38622 371 04. Rajanpur 12481 1328 11423 1058 Faisalabad Divn. 15025 6255 11998 3026 01. Faisalabad 1361 2386 434 927 02. Jhang 7644 2562 6877 767 03. T.T.Singh 6020 1307 4687 1332
Gujanwala Divn. 21540 5330 70 215 01. Gujranwala 1768 1495 - - 02. Gujrat 2094 646 70 - 03. Hafizabad 872 811 - 215 04. M.B. Din 5552 1238 - - 05. Narowal 5313 319 - - 06. Sialkot 5940 821 - -
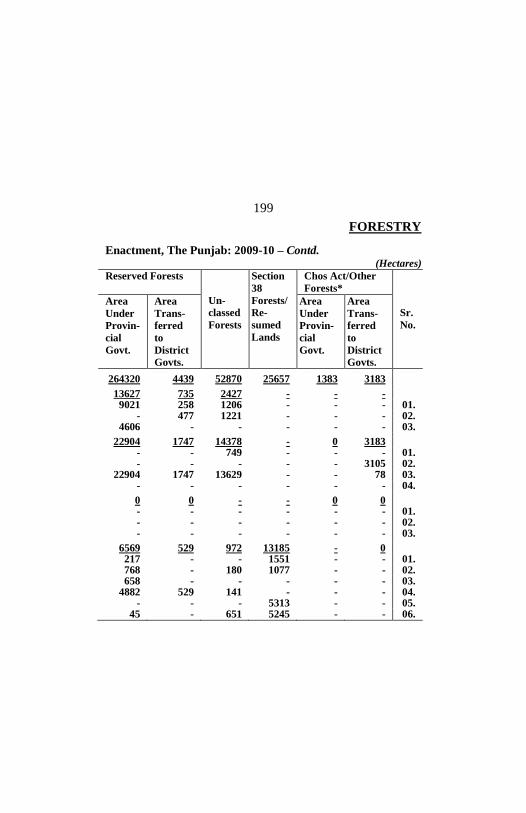
FORESTRY
199
Enactment, The Punjab: 2009-10 – Contd. (Hectares)
Reserved Forests
Un-
classed
Forests
Section
38
Forests/
Re-
sumed
Lands
Chos Act/Other
Forests*
Sr.
No.
Area
Under
Provin-
cial
Govt.
Area
Trans-
ferred
to
District
Govts.
Area
Under
Provin-
cial
Govt.
Area
Trans-
ferred
to
District
Govts. 264320 4439 52870 25657 1383 3183
13627 735 2427 - - -
9021 258 1206 - - - 01. - 477 1221 - - - 02.
4606 - - - - - 03.
22904 1747 14378 - 0 3183 - - 749 - - - 01. - - - - - 3105 02.
22904 1747 13629 - - 78 03. - - - - - - 04.
0 0 - - 0 0 - - - - - - 01. - - - - - - 02. - - - - - - 03.
6569 529 972 13185 - 0 217 - - 1551 - - 01. 768 - 180 1077 - - 02. 658 - - - - - 03.
4882 529 141 - - - 04. - - - 5313 - - 05.
45 - 651 5245 - - 06.

FORESTRY
200
Table 72:- Forest Area by Administrative Jurisdiction and
Sr.
No.
District
Total
Com-
pact
Protected Forest
Total
Linear
(Run-
ning
K.M)
Compact
Area
Under
Provin-
cial
Govt.
Area
Trans-
ferred to
District
Govt. Lahore Divn. 9548 5596 0 - 01. Lahore 949 1002 - - 02. Kasur 5578 1593 - - 03. Nankana Sahib 1068 530 - - 04. Sheikhupura 1954 2472 - - Multan Divn. 4541 2588 4153 112 01. Multan 0 726 - - 02. Khanewal 3682 1102 3406 - 03. Lodhran 747 760 747 - 04. Vehari 112 - - 112 Rawalpindi Divn. 226265 2001 18670 - 01. Rawalpindi 57940 647 18670 - 02. Attock 65942 681 - - 03. Chakwal 63658 415 - - 04. Jhelum 38725 258 - - Sahiwal Divn. 10169 5432 6486 241 01. Sahiwal 4663 3368 4663 - 02. Okara 4869 2064 1823 241 03. Pakpattan 637 - - - Sargodha Divn. 114278 6163 58680 4863 01. Sargodha 581 2595 38 543 02. Bhakkar 6427 1365 4253 2174 03. Khushab 76264 1123 39059 1403 04. Mianwali 31006 1080 15330 743

FORESTRY
201
Enactment, The Punjab: 2009-10 – Concld. (Hectares)
Reserved Forests Un-classed Forests
Section 38 Forests/ Re-sumed Lands
Chos Act/Other Forests*
Sr. No.
Area Under Provin-cial Govt.
Area Trans-ferred to District Govts.
Area Under Provin-cial Govt.
Area Trans-ferred to District Govts.
7834 515 0 1200 - - 838 - - 110 - - 01.
5063 515 - - - - 02. 283 - - 784 - - 03.
1649 - - 305 - - 04. 0 276 - - - - - - - - - - 01. - 276 - - - - 02. - - - - - - 03. - - - - - - 04.
169094 0 33237 4944 320 - 37196 - 1711 363 - - 01. 63769 - - 2173 - - 02. 38635 - 23155 1868 - - 03. 29494 - 8371 540 320 - 04.
2782 637 - 23 - - - - - - - - 01.
2782 - - 23 - - 02. - 637 - - - - 03.
41510 0 1856 6306 1063 0 - - - - - - 01. - - - - - - 02.
34415 - - 324 1063 - 03. 7095 - 1856 5982 - - 04.
* Includes Civil Reserved Forests, Civil Un-classed Forests, Guzara Forests and Military Un-classed Forests.
Source:- Forestry, Wildlife, Fisheries and Tourism Department, Government of the Punjab, Lahore

FORESTRY
202
Table 73:- Timber and Firewood Production (Quantity and
Value), The Punjab
Year
Timber Firewood Quantity
(‘000’ Cubic
Metres)
Value
(‘000’
Rs.)
Quantity
(‘000’ Cubic
Metres)
Value
(‘000’
Rs.)
2000-01 43 239820 40 85300
2001-02 28 350000 48 17220
2002-03 135 713900 108 49725
2003-04 167 598288 31 18252
2004-05 54 193428 135 79380
2005-06 41 737008 59 34692
2006-07 33 164385 36 2678
2007-08 39 485072 32 7085
2008-09 55 274837 22 17076
2009-10 21 269552 9 12992
Source:- Forestry Wildlife and Fisheries Department, Government
of the Punjab, Lahore.
FUEL AND POWER

FUEL AND POWER
204
Table 74:- Installed Generating Capacity of Power Stations
(Megawatts)
Type/Power Station 2005-
06
2006-
07
2007-
08
2008-
09
2009-
10 WAPDA National Grid
(A+B+C+D+E)
17395
17526
17827
18021
18948
A. Hydel-Total (i+ii) 6463 6444 6444 6444 6444
i) Major Hydel 6355 6355 6355 6355 6355
1. Mangla 1000 1000 1000 1000 1000
2. Tarbela 3478 3478 3478 3478 3478
3. Warsak 243 243 243 243 243
4. Chashma 184 184 184 184 184
5. Ghazi Brotha 1450 1450 1450 1450 1450
ii) Small Hydel 108 89 89 89 89 1) Chichoki Mallian
13
13
13
13
13
2) Dargai 20 20 20 20 20 3) Kurram Garhi
4
4
4
4
4
4) Malakand 20 * * * * 5) Nandipur 14 14 14 14 14 6) Rasul 22 22 22 22 22 7) Renala 1 1 1 1 1 8) Chitral 1 1 1 1 1 9) Shadiwal 13 14 14 14 14 B. Thermal Total (i to iv)
4834
4834
4900
4900
4885
i) Steam 3119 3119 3184 3184 3184 1) Faisalabad 132 132 132 132 132 2) Guddu 640 640 640 640 640

FUEL AND POWER
205
National Grid, WAPDA - Contd.
(Megawatts)
Type/Power Station 2005-
06
2006-
07
2007-
08
2008-
09
2009-
10
3) Jamshoro 850 850 850 850 850
4) Multan 130 130 195 195 195
5) Muzaffargarh 1350 1350 1350 1350 1350
6) Pasni 17 17 17 17 17 ii) Coal 150 150 150 150 150
Lakhra 150 150 150 150 150 iii) Gas Turbine 132 132 133 133 118
i) Punjgur 38 38 39 39 39
ii) Quetta 35 35 35 35 35
iii) Shahdara 59 59 59 59 44 iv) Combined Cycle 1433 1433 1433 1433 1433 1) Faisalabad 244 244 244 244 244
2) Guddu 1015 1015 1015 1015 1015
3) Kotri 174 174 174 174 174
* Retired from Public Sector.
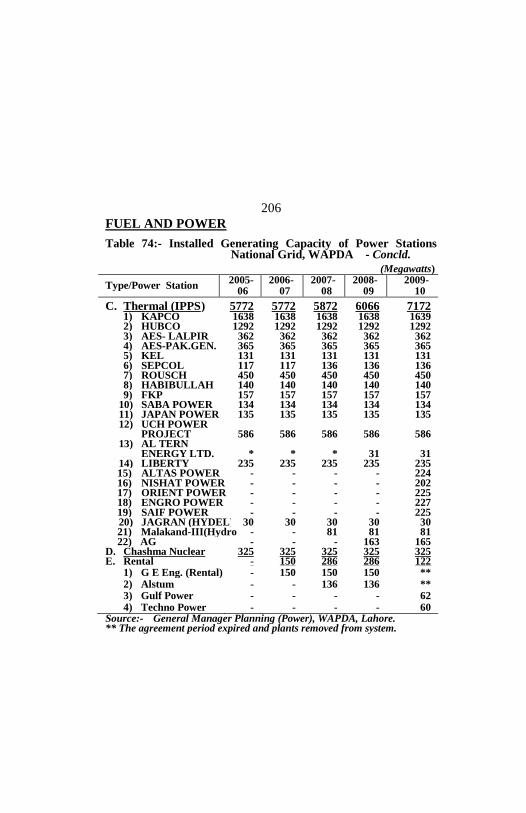
FUEL AND POWER
206
Table 74:- Installed Generating Capacity of Power Stations National Grid, WAPDA - Concld.
(Megawatts)
Type/Power Station 2005-
06 2006-
07 2007-
08 2008-
09 2009-
10 C. Thermal (IPPS ) 5772 5772 5872 6066 7172 1) KAPCO 1638 1638 1638 1638 1639 2) HUBCO 1292 1292 1292 1292 1292 3) AES- LALPIR 362 362 362 362 362 4) AES-PAK.GEN. 365 365 365 365 365 5) KEL 131 131 131 131 131 6) SEPCOL 117 117 136 136 136 7) ROUSCH 450 450 450 450 450 8) HABIBULLAH 140 140 140 140 140 9) FKP 157 157 157 157 157 10) SABA POWER 134 134 134 134 134 11) JAPAN POWER 135 135 135 135 135 12) UCH POWER PROJECT
586
586
586
586
586
13) AL TERN ENERGY LTD.
*
*
*
31
31
14) LIBERTY 235 235 235 235 235 15) ALTAS POWER - - - - 224 16) NISHAT POWER - - - - 202 17) ORIENT POWER - - - - 225 18) ENGRO POWER - - - - 227 19) SAIF POWER - - - - 225 20) JAGRAN (HYDEL) 30 30 30 30 30 21) Malakand-III(Hydro) - - 81 81 81 22) AG - - - 163 165 D. Chashma Nuclear 325 325 325 325 325 E. Rental - 150 286 286 122 1) G E Eng. (Rental) - 150 150 150 ** 2) Alstum - - 136 136 ** 3) Gulf Power - - - - 62 4) Techno Power - - - - 60 Source:- General Manager Planning (Power), WAPDA, Lahore. ** The agreement period expired and plants removed from system.

FUEL AND POWER
207
Table 75:- Gas Consumption by Consumer Group,
The Punjab
(Thousand Decca Metres)
Year Total House-
hold
Commer-
cial
Indus-
trial
Others
(a)
2000-01 810065 222559 34561 551230 1715
2001-02 844640 227132 38250 577857 1401
2002-03 896615 241393 39441 613697 2084
2003-04 1200148 246742 42539 908489 2378
2004-05 1427550 277593 48875 1098383 2699
2005-06 1506825 272147 52653 1179609 2416
2006-07 1505163 305514 56996 1141575 1078
2007-08 1560922 337472 59388 1164719 2343
2008-09 1522576 351796 64676 1103353 2751
2009-10 1521674 355072 68577 1096653 1372
a) Includes Gas carried for other companies through Sui Northern
System. Note:- Sui Northern System supplies gas to its Consumers not only
from Sui field but also from Meyal and Tut fields which are
situated near Rawalpindi and are owned by M/S Attock Oil
Company.
Source:- Sui Northern Gas Pipelines Limited, Lahore.
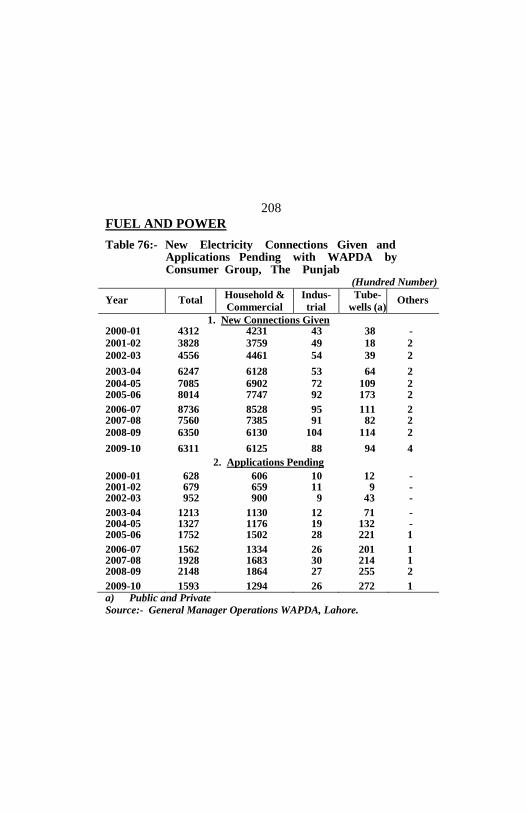
FUEL AND POWER
208
Table 76:- New Electricity Connections Given and Applications Pending with WAPDA by Consumer Group, The Punjab
(Hundred Number)
Year Total Household &
Commercial
Indus-
trial
Tube-
wells (a) Others
1. New Connections Given 2000-01 4312 4231 43 38 -
2001-02 3828 3759 49 18 2
2002-03 4556 4461 54 39 2 2003-04 6247 6128 53 64 2
2004-05 7085 6902 72 109 2 2005-06 8014 7747 92 173 2 2006-07 8736 8528 95 111 2 2007-08 7560 7385 91 82 2
2008-09 6350 6130 104 114 2 2009-10 6311 6125 88 94 4
2. Applications Pending
2000-01 628 606 10 12 - 2001-02 679 659 11 9 - 2002-03 952 900 9 43 - 2003-04 1213 1130 12 71 - 2004-05 1327 1176 19 132 - 2005-06 1752 1502 28 221 1 2006-07 1562 1334 26 201 1 2007-08 1928 1683 30 214 1 2008-09 2148 1864 27 255 2 2009-10 1593 1294 26 272 1 a) Public and Private
Source:- General Manager Operations WAPDA, Lahore.

FUEL AND POWER
209
Table 77:- Electricity Consumers and Units Sold by
Category, WADPA System, The Punjab
Year 2005-
06
2006-
07
2007-
08
2008-
09
2009-
10
I. Number of Consumers (Hundred Number) Total
116966 125647 133769 139851 146324
1. Domestic 98754 106476 113783 119130 124836
2. Commercial 14938 15670 16316 16839 17400
3. Industrial 1732 1829 1914 2012 2104
4. Agricultural 1469 1596 1676 1787 1896
5. Public Lighting 49 52 55 58 62
6. Others 24 24 25 25 26
II. Units Sold (Million KWH) Total
42018 45294 45040 43466 45906
1. Domestic 18884 20563 20376 19796 20825
2. Commercial 2953 3375 3470 3351 3529
3. Industrial 13998 14798 14383 13334 13640
4. Agricultural 3669 3831 4036 4294 5088
5. Public Lighting 170 204 221 230 235
6. Others
2344 2523 2554 2461 2589
Source:- General Manager Operation, WAPDA, Lahore.

FUEL AND POWER
210
Table 78 :- Electricity Revenue Assessed by Type of Consumer,
WAPDA, The Punjab
(Rs. in Million)
Item 2005-
06
2006-
07
2007-
08
2008-
09
2009-
10
Total 189043 207778 238873 284185 361554
Domestic 66822 75020 92057 105364 134362
Commercial 23830 27653 32781 39089 47894
Industrial 70680 75821 80990 99813 123606
Agricultural 14113 14857 18095 21888 32582
Public Lighting 1260 1559 1728 2054 2791
Others (a) 12338 12868 13222 15977 20319
a) Includes electricity supplied under Bulk Supply Traction and
Tariff ‘H’ and revenue assessed under these categories as well
as Services. Meter Rental Charges.
Source:- General Manager Operation, WAPDA, Lahore.

FUEL AND POWER
211
Table 79 :- Number of Villages/Settlements Electrified by
Province, Pakistan
Year Pakis-
tan
N.W.F.P
Pun-
jab
(a)
Sindh
Balo-
chis-
tan
FATA
2000-01 69884 11373 37443 14535 3243 3290
2001-02 71583 11888 38181 14862 3345 3307
2002-03 73829 12022 39834 15145 3511 3317
2003-04 81022 13238 43900 16377 4186 3321
2004-05 90489 15396 48796 17832 5105 3360
2005-06 103253 17662 57280 18914 5873 3524
2006-07 117499 19671 67020 20595 6689 3524
2007-08 128301 21163 73753 22006 7694 3524
2008-09 137808 78586 22229 23880 9328 3785
2009-10 153227 86097 24449 27095 11583 4003 Note:-The figures indicate progressive totals. a) Includes Islamabad. Source:- Chief Engineer Rural Electrification WAPDA, Lahore.

HEALTH

HEALTH
214
Table 80:- Health Institutions and Personnel, The Punjab
(Number)
Item 2006 2007 2008 2009 2010
1. Hospitals
i) Number 308 325 326 326 328
ii) Beds 34612 36851 37653 37742 38715 2. Dispensaries
i) Number 1333 1260 1286 1303 1323
ii) Beds 1973 316 358 359 387 3. Rural Health
Centres
i) Number 295 333 334 334 336
ii) Beds 5900 5866 5934 6002 6060 4. T.B. Clinics
i) Number 41 40 40 40 40
ii) Beds 72 294 295 379 381 5. Basic Health
Units
i) Number 2456 2529 2535 2535 2535
ii) Beds 4912 4908 4930 4934 4938 6. Sub Health
Centres (No.)
454
520
533
536
541
Note:- Fluctuation in the number of Health Institutions is due to closure of
Hospitals run by Pakistan Railways, Social Security Institutions and
non response by some private organizations.
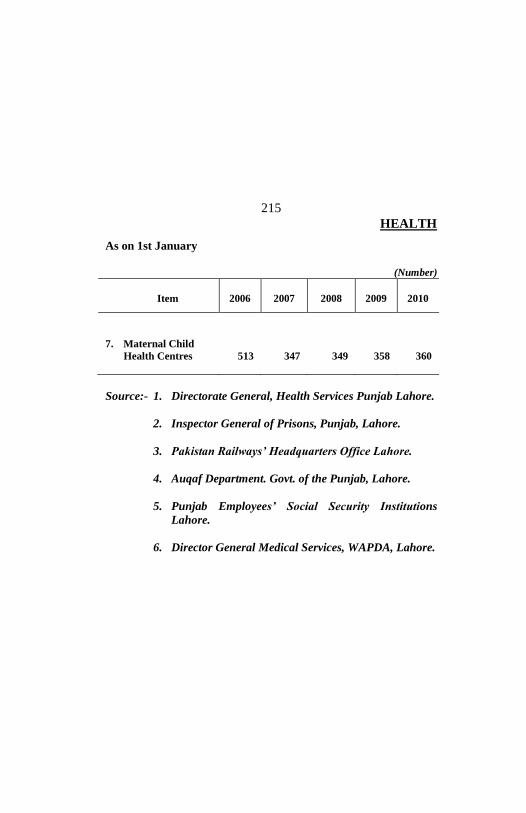
HEALTH
215
As on 1st January
(Number)
Item 2006 2007 2008 2009 2010
7. Maternal Child
Health Centres
513
347
349
358
360
Source:- 1. Directorate General, Health Services Punjab Lahore.
2. Inspector General of Prisons, Punjab, Lahore.
3. Pakistan Railways’ Headquarters Office Lahore.
4. Auqaf Department. Govt. of the Punjab, Lahore.
5. Punjab Employees’ Social Security Institutions
Lahore.
6. Director General Medical Services, WAPDA, Lahore.

HEALTH
216
Table 81 :- Number of Registered Medical Personnel by
Gender, The Punjab
(Progressive Nos.)
Calendar
Year Doctors (M.B.B.S) Dentists (BDS) Total Male Total Male
2001 39212 26704 1871 1193
2002 41193 27680 1999 1246
2003 43334 28723 2170 1320
2004 45487 29721 2450 1434
2005 48065 30694 2664 1511
2006 50302 31700 2888 1603
2007 52531 32666 3229 1714
2008 43663 25339 3308 1644
2009 45786 26124 3641 1740
2010 47721 26881 3928 1810
Source:- Pakistan Medical & Dental Council (PMDC), Islamabad.
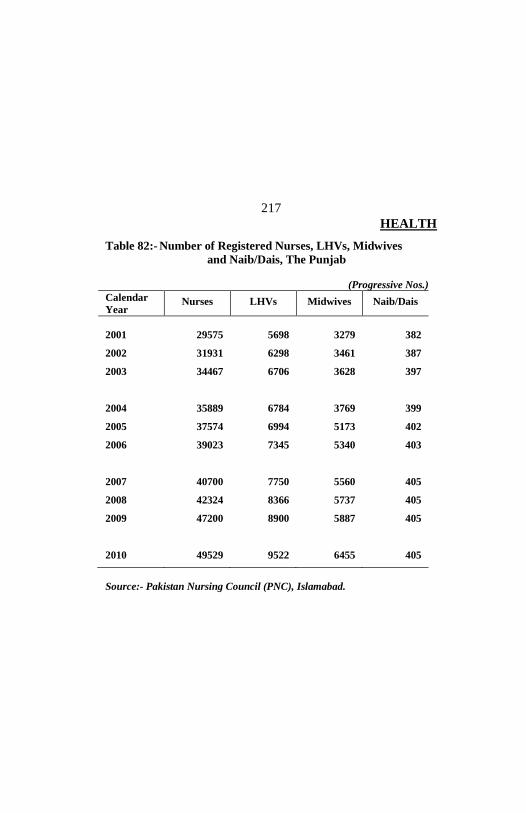
HEALTH
217
Table 82:- Number of Registered Nurses, LHVs, Midwives
and Naib/Dais, The Punjab
(Progressive Nos.)
Calendar
Year Nurses LHVs Midwives Naib/Dais
2001 29575 5698 3279 382
2002 31931 6298 3461 387
2003 34467 6706 3628 397
2004 35889 6784 3769 399
2005 37574 6994 5173 402
2006 39023 7345 5340 403
2007 40700 7750 5560 405
2008 42324 8366 5737 405
2009 47200 8900 5887 405
2010 49529 9522 6455 405
Source:- Pakistan Nursing Council (PNC), Islamabad.

HEALTH
218
Table 83: Health Facilities Per Million Population,
Sr.
No.
Calendar
Year
No. of
Hospi-
tals/Dis-
pen-
saries
No. of
Beds in
Hospi-
tals/Dis-
pen-
saries
Progressive Number
Doctors Dentists Nurses
01. 2001 1750 33946 39212 1871 29575
02. 2002 1751 35433 41193 1999 31931
03. 2003 1539 35329 43334 2170 34467
04. 2004 1533 35272 45487 2450 35889
05. 2005 1641 36585 48065 2664 37574
06. 2006 1641 36585 50302 2888 39023
07. 2007 1585 37167 52531 3229 40700
08. 2008 1612 38011 43663 3308 42324
09. 2009 1629 38101 45786 3641 47200
10. 2010 1651 39102 47721 3928 49529
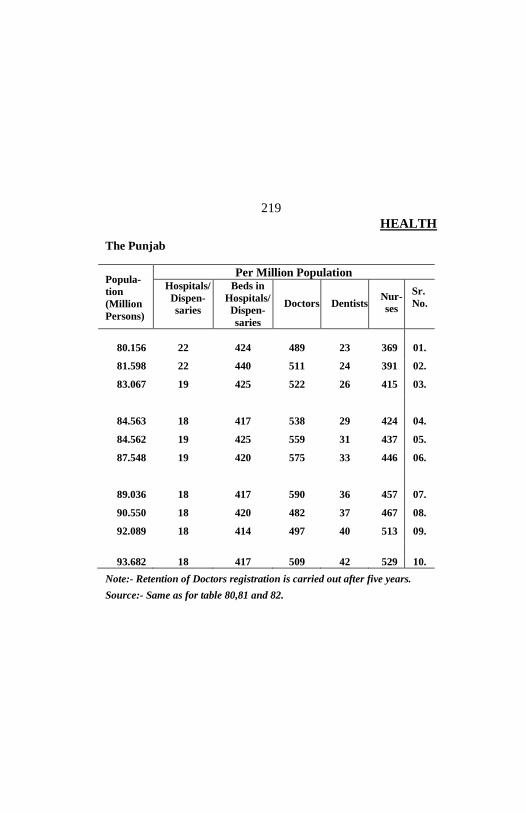
HEALTH
219
The Punjab
Popula-
tion
(Million
Persons)
Per Million Population Hospitals/
Dispen-
saries
Beds in
Hospitals/
Dispen-
saries
Doctors
Dentists Nur-
ses
Sr.
No.
80.156 22 424 489 23 369 01.
81.598 22 440 511 24 391 02.
83.067 19 425 522 26 415 03.
84.563 18 417 538 29 424 04.
84.562 19 425 559 31 437 05.
87.548 19 420 575 33 446 06.
89.036 18 417 590 36 457 07.
90.550 18 420 482 37 467 08.
92.089 18 414 497 40 513 09.
93.682 18 417 509 42 529 10.
Note:- Retention of Doctors registration is carried out after five years.
Source:- Same as for table 80,81 and 82.

HEALTH
220
Table 84:- Number of Health Institutions by Division and
Sr.
No.
Division/District
Hospitals
Dispensaries
No. Beds No. Beds
The Punjab 328 38715 1323 387 Bahawalpur Divn. 31 3452 181 4
01. Bahawalpur 13 1850 70 4
02. Bahawalnagar 7 493 47 0
03. Rahim Yar Khan 11 1109 64 0 D.G.Khan Divn. 24 1703 91 4
01. D.G.Khan 6 491 35 4
02. Layyah 4 455 14 0
03. Muzaffargarh 9 496 31 0
04. Rajanpur 5 261 11 0 Faisalabad Divn. 40 4417 206 7
01. Faisalabad 24 3344 129 0
02. Chiniot 2 188 16 3
03. Jhang 10 485 36 4
04. Toba Tek Singh 4 400 25 0 Gujranwala Divn. 49 3371 159 142
01. Gujranwala 14 1197 49 84
02. Gujrat 12 631 28 24
03. Hafizabad 2 185 12 4
04. Mandi Baha-ud-Din 6 159 20 0
05. Narowal 2 80 15 20
06. Sialkot 13 1119 35 10

HEALTH
221
District, The Punjab (As on 1st January, 2010) – Contd.
R.H.
Centres
B.H. Units
T.B. Clinics
S.H.
Cen-
tres
M.C.H
Cen-
tres
Sr.
No.
No. Beds No. Beds No. Beds No. No. 336 6060 2535 4938 40 381 541 360
40 774 288 556 9 36 35 25
11 202 77 142 3 0 0 10 01.
10 200 105 202 3 0 35 7 02.
19 372 106 212 3 36 0 8 03.
34 626 205 396 4 72 90 13
11 184 54 106 3 36 34 5 01.
3 60 42 84 0 0 15 2 02.
14 262 77 142 1 36 24 4 03.
6 120 32 64 0 0 17 2 04.
40 674 341 658 5 84 103 23
18 270 171 334 2 84 35 12 01.
5 100 36 72 1 0 17 2 02.
10 182 65 120 1 0 31 6 03.
7 122 69 132 1 0 20 3 04.
51 930 411 804 6 17 114 44 14 208 93 176 1 0 35 9 01.
9 180 89 178 0 0 31 9 02. 5 82 32 62 1 0 16 4 03. 8 160 52 100 1 6 14 4 04. 7 140 57 112 1 0 2 4 05. 8 160 88 176 2 11 16 14 06.

HEALTH
222
Table 84:- Number of Health Institutions by Division and
Sr.
No.
Division/District
Hospitals
Dispensaries
No. Beds No. Beds
Lahore Divn. 62 14074 219 30
01. Lahore 42 12850 121 0 02. Kasur 7 437 27 0 03. Nankana Sahib 3 124 22 0 04. Sheikhupura 10 663 49 30
Multan Divn. 31 3045 112 10
01. Multan 15 2311 48 0 02. Khanewal 8 332 16 0 03. Lodhran 4 132 11 10 04. Vehari 4 270 37 0
Rawalpindi Divn. 41 4875 150 24
01. Rawalpindi 17 3576 87 24 02. Attock 9 565 25 0 03. Chakwal 5 250 11 0 04. Jhelum 10 484 27 0
Sahiwal Divn. 17 1477 66 46
01. Sahiwal 8 827 24 4 02. Okara 4 411 28 42 03. Pakpattan 5 239 14 0
Sargodha Divn. 33 2301 139 120
01. Sargodha 16 1257 51 64 02. Bhakkar 3 255 41 56 03. Khushab 8 403 34 0 04. Mianwali 6 386 13 0
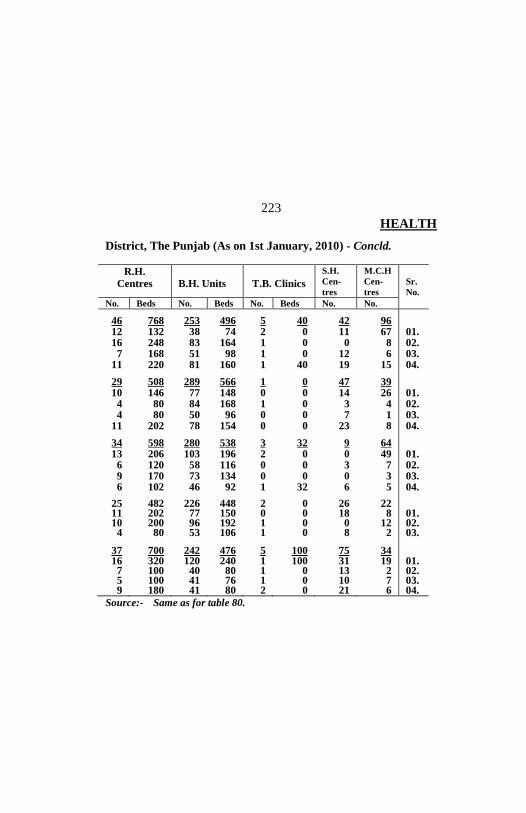
HEALTH
223
District, The Punjab (As on 1st January, 2010) - Concld.
R.H.
Centres
B.H. Units
T.B. Clinics
S.H.
Cen-
tres
M.C.H
Cen-
tres
Sr.
No.
No. Beds No. Beds No. Beds No. No.
46 768 253 496 5 40 42 96 12 132 38 74 2 0 11 67 01. 16 248 83 164 1 0 0 8 02.
7 168 51 98 1 0 12 6 03. 11 220 81 160 1 40 19 15 04.
29 508 289 566 1 0 47 39 10 146 77 148 0 0 14 26 01.
4 80 84 168 1 0 3 4 02. 4 80 50 96 0 0 7 1 03.
11 202 78 154 0 0 23 8 04.
34 598 280 538 3 32 9 64 13 206 103 196 2 0 0 49 01.
6 120 58 116 0 0 3 7 02. 9 170 73 134 0 0 0 3 03. 6 102 46 92 1 32 6 5 04.
25 482 226 448 2 0 26 22 11 202 77 150 0 0 18 8 01. 10 200 96 192 1 0 0 12 02.
4 80 53 106 1 0 8 2 03.
37 700 242 476 5 100 75 34 16 320 120 240 1 100 31 19 01.
7 100 40 80 1 0 13 2 02. 5 100 41 76 1 0 10 7 03. 9 180 41 80 2 0 21 6 04.
Source:- Same as for table 80.

HEALTH
224
Table 85:- Patients Treated by Health Institutions,
The Punjab
(Thousand Number)
Calendar
Year
Punjab
Hospitals Dis-
pen-
saries
Other
Health
Centres(a) Total In-
Door
Out-
Door
2001 37843 26367 1627 24740 2395 9081
2002 37890 26414 1674 24740 2395 9081
2003 37890 26414 1674 24740 2395 9081
2004 51496 39940 1999 37941 2475 9081
2005 60933 49377 2390 46987 2475 9081
2006 67027 54315 2629 51686 2723 9989
2007 79830 65360 2078 63282 3514 10956
2008 86512 70126 2291 67835 4019 12367
2009 87912 70390 2405 67985 4364 13158
2010 89997 70987 2568 68219 4500 14510 a) Includes Patients treated in R.H.Cs, BHUs, Sub-Health Centres,T.B.
Clinics and M.C.H. Centres. Note:- Excludes the patients treated in the Health institutions run by
Social Security and includes the patient treated in Health
Institutions run by WAPDA. Source:- Same as for table 80.

HOUSING

HOUSING
226
Table 86:- Number of Household Units by Division and
(‘000’ Nos.)
Division/District 1998 Inter-
censal
Growth Total Urban Rural
The Punjab 10538 3200 7338 1.99 Bahawalpur Divn. 1078 231 847 2.36
Bahawalpur 355 93 262 2.56
Bahawalnagar 307 56 251 1.90
Rahim Yar Khan 416 82 334 2.55 D.G. Khan Divn. 872 115 757 2.46
D.G. Khan 209 30 179 2.26
Layyah 152 19 133 2.26
Muzaffargarh 359 46 313 2.58
Rajanpur 152 20 132 2.68 Faisalabad Divn. 1412 451 961 1.69
Faisalabad 751 315 436 1.88
Jhang 434 95 339 1.38
T.T. Singh 227 41 186 1.68 Gujranwala Divn. 1580 477 1103 1.73
Gujranwala 449 226 223 2.28
Gujrat 305 79 226 1.65
Hafizabad 117 30 87 1.56
Mandi Baha-ud-Din 173 25 148 1.30
Narowal 170 21 149 1.15
Sialkot 366 96 270 1.72

HOUSING
227
District, The Punjab: 1998 Housing Census
(‘000’ Nos.)
Division/District 1998 Inter-
censal Growth Total Urban Rural
Lahore Divn. 1675 919 756 2.35 Lahore 881 731 150 2.95 Kasur 338 75 263 1.67 Nankana Sahib (Included in Sheikhupura District) Sheikhupura 456 113 343 1.79 Multan Divn. 1188 294 894 2.04 Multan 433 176 257 1.49 Khanewal 293 50 243 1.87 Lodhran 161 22 139 4.60 Vehari 301 46 255 1.94 Rawalpindi Divn. 1065 371 694 1.86 Rawalpindi 521 270 251 2.32 Attock 207 42 165 1.68 Chakwal 187 21 166 2.64 Jhelum 150 38 112 0.04 Sahiwal Divn. 804 140 664 1.76 Sahiwal 267 42 225 0.96 Okara 338 72 266 2.29 Pakpattan 199 26 173 2.05 Sargodha Divn. 864 202 662 1.72 Sargodha 411 111 300 1.69 Bhakkar 159 25 134 2.14 Khushab 145 36 109 2.69 Mianwali 149 30 119 1.38 Source:- Population Census Organization, Govt. of Pakistan
Islamabad.
LABOUR FORCE AND
EMPLOYMENT
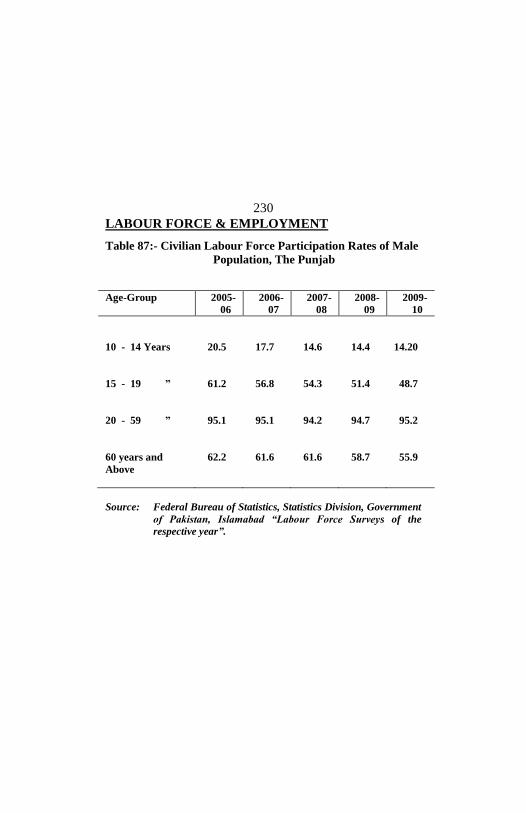
LABOUR FORCE & EMPLOYMENT
230
Table 87:- Civilian Labour Force Participation Rates of Male
Population, The Punjab
Age-Group 2005-
06
2006-
07
2007-
08
2008-
09
2009-
10
10 - 14 Years 20.5 17.7 14.6 14.4 14.20
15 - 19 ” 61.2 56.8 54.3 51.4 48.7
20 - 59 ” 95.1 95.1 94.2 94.7 95.2
60 years and
Above
62.2 61.6 61.6 58.7 55.9
Source: Federal Bureau of Statistics, Statistics Division, Government
of Pakistan, Islamabad “Labour Force Surveys of the
respective year”.

LABOUR FORCE & EMPLOYMENT
231
Table 88:- Civilian Labour Force as Percent of Total
Population by Sex, Pakistan
Year
Sex
2005-
06
2006-
07
2007-
08
2008-
09
2009-
10
I. Total 32.22 31.82 30.67 32.81 32.98
i) Male 25.73 25.24 25.36 25.59 25.49
ii) Female 6.49 6.58 6.81 7.22 7.50
II. Employed
Total 30.22 30.13 30.50 31.02 31.17
i) Male 24.33 24.10 24.27 24.45 24.35
ii) Female 5.89 6.03 6.23 6.57 6.82
III. Un-Employed
Total 2.00 1.69 1.67 1.79 1.81
i) Male 1.39 1.14 1.09 1.14 1.15
ii) Female 0.61 0.55 0.58 0.65 0.66
Source:- Federal Bureau of Statistics, Statistics Division, Government
of Pakistan, Islamabad “Labour Force Surveys of the
respective year”.

LABOUR FORCE & EMPLOYMENT
232
Table 89:- Number of Sanctioned Posts by Basic Pay Scales
Basic Pay Scale/Equivalent 2009-10 2010-11
Grand Total (i to v) 386625 406625
i) BPS-1-4-Total
1
2
3
4
88744
54016
21088
8027
5613
96907
56847
24524
8444
7092
ii) BPS-5-15-Total
5
6
7
8
9
10
11
12
13
14
15
251814
147927
4436
35328
459
20630
655
9490
4625
530
26468
1266
260828
151227
4216
35971
843
24424
971
10214
4636
577
26605
1144
iii) BPS-16 11322 11981

LABOUR FORCE & EMPLOYMENT
233
in the Budget Estimates, The Punjab Government*
Basic Pay Scale Equivalent 2009-10 2010-11
iv) BPS-17-22-Total
17
18
33430
18998
10571
35166
19622
11575
19
20
21
22
2923
805
128
5
3008
826
129
6
v) Un-Classified
1315 1743
* The information of District Government has not been
compiled / supplied by source agency.
Source:- Finance Department, Government of the Punjab, Lahore.

LABOUR FORCE & EMPLOYMENT
234
Table 90 :- Number & Employment level of Registered
(Number)
Division/District Factories Estimated
Employment 2008 2009 2008 2009
The Punjab 8549 10255 803874 858577 Bahawalpur Divn. 719 734 35365 33476
Bahawalpur 335 344 13996 14164
Bahawalnagar 158 179 5686 6136
Rahim Yar Khan 226 211 15683 13176 D.G.Khan Divn. 371 413 41680 42536
D.G.Khan 89 107 7797 8142
Layyah 104 104 7287 7287
Muzaffargarh 130 130 24905 24884
Rajanpur 48 72 1691 2223 Faisalabad Divn. 1096 1175 151714 155198
Faisalabad 768 801 127989 129778
Chiniot 45 47 4741 5247
Jhang 184 194 12315 13853
T.T.Singh 99 133 6669 6320 Gujranwala Divn. 1975 2454 89242 100924
Gujranwala 949 1039 31604 33053
Gujrat 377 526 14931 17327
Hafizabad 37 66 6540 6682
Mandi Baha-ud-Din 25 86 4019 5440
Narowal 20 20 362 362
Sialkot 567 717 31786 38060

LABOUR FORCE & EMPLOYMENT
235
Factories by Division and District,
The Punjab: (As on 30th June, 2009)
(Number) Division/District Factories
Estimated Employment
2008 2009 2008 2009 Lahore Divn. 2753 3201 354441 379726 Lahore 1805 1899 153876 157303 Kasur 349 408 89702 92611 Nankana Sahib 120 183 18924 25249 Sheikhupura 479 711 91939 104563 Multan Divn. 747 884 51949 55020 Multan 319 427 24831 27282 Khanewal 163 163 14913 14913 Lodhran 87 116 2041 2661 Vehari 178 178 10164 10164 Rawalpindi Divn. 443 593 40270 44156 Rawalpindi 321 319 19891 19860 Attock 52 52 6068 6068 Chakwal 42 136 7607 10737 Jhelum 28 86 6704 7491 Sahiwal Divn. 302 413 16371 18770 Sahiwal 160 160 7406 7406 Okara 81 77 6887 6818 Pakpattan 61 176 2078 4546 Sargodha Divn. 143 388 22842 28771 Sargodha 79 325 5892 12250 Bhakkar 15 15 2030 2030 Khushab 30 29 11655 11095 Mianwali 19 19 3265 3396
Source:- Bureau of Statistics, Punjab, Lahore.

LABOUR FORCE & EMPLOYMENT
236
Table 91 :- Number & Employment level of Registered
(Number)
Major Industry Group No. of
Factories
Estimated
Employment All Industrial Groups 10255 858577 Farming of Animals 6 680 Meat, Fruit, Vegetable, Oil & Fats 1200 38652 Dairy Products 91 12429 Grain Mill Products & Animal Feed 797 20226 Other Food Products Including Sugar & Tea
159
52863
Beverages 30 6667 Tobacco Products 9 3076 Textile Spinning, Weaving & Finishing
1326
350513
Other Textiles 181 20550 Knitted & Crocheted Fabrics & Articles
262
27292
Wearing Apparel, Except Fur Apparel
216
37193
Tanning & Dressing of Leather 206 9853 Footwear 84 11681 Sawmilling 7 Planning of Wood 2 162 Products of Wood 40 2191 Paper & Paper Products 170 13076 Publishing 72 4163 Printing 13 217 Refined Petroleum Products 17 1493

LABOUR FORCE & EMPLOYMENT
237
Factories by Major Industry Group,
The Punjab: (As on 30th June, 2009) – Contd.
(Number)
Major Industry Group No. of
Factories
Estimated
Employment Basic Chemicals 114 12232 Other Chemical Products 318 23045 Rubber Products 61 2686 Plastics Products 106 6807 Glass & Glass Products 39 5353 Non-Metallic Minerals Products N.E.C.
2234
67138
Basic Iron & Steel 404 15990 Basic Precious & Non-Ferrous Metals 36 977 Casting of Metals 4 61 Structural Metal Products 16 770 Other Fabricated Metal Products 329 9029 General-Purpose Machinery 86 3103 Special-Purpose Machinery 379 13943 Domestic Appliances N.E.C. 324 9776 Electric Motors/Generators/ Transformers
49
8157
Electricity Distribution & Control Apparatus
11
359
Insulated Wire & Cables 15 928 Accumulators, Cells & Batteries 8 235 Electric Lams & Lighting Equipment 9 795 Other Electrical Equipment N.E.C. 23 1163 Electron Valves & Tubes etc. 6 441 TV, Radio, Telegraphy Apparatus 5 101

LABOUR FORCE & EMPLOYMENT
238
Table 91 :- Number & Employment level of Registered
(Number)
Major Industry Group No. of
Factories
Estimated
Employment
Medical Precision Instruments 213 11705
Watches & Clocks 2 46
Motor Vehicles 53 4889
Bodies for Motor Vehicles & Trailers 20 586
Parts & Accessories for Motor Vehicles
49
2706
Building & Repair of Ships & Boats 3 140
Railway Locomotives & Rolling Stock
18
12957
Transport Equipment N.E.C. 108 7604
Furniture 58 1131
Manufacturing N.E.C. 166 12342
Recycling of Non-Metal Waste & Scrap
12
172
Prod. Transmission & Distribution of Electricity
45
5742
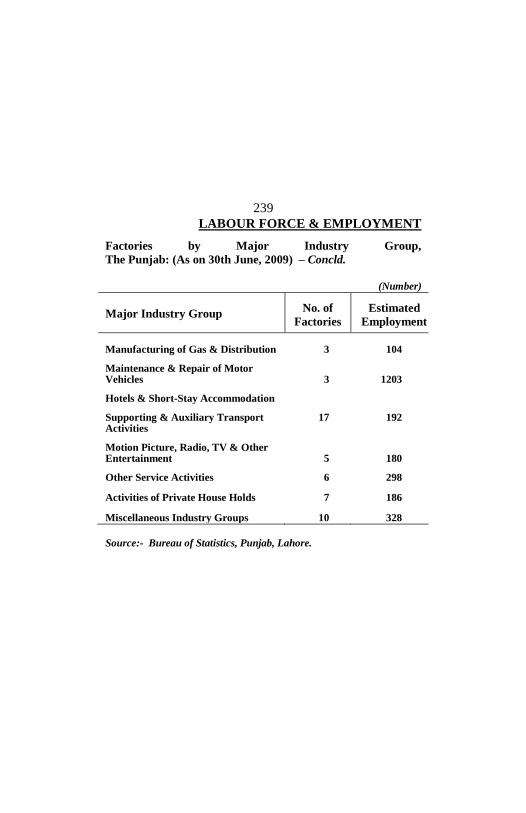
LABOUR FORCE & EMPLOYMENT
239
Factories by Major Industry Group,
The Punjab: (As on 30th June, 2009) – Concld.
(Number)
Major Industry Group No. of
Factories
Estimated
Employment
Manufacturing of Gas & Distribution 3 104
Maintenance & Repair of Motor Vehicles
3
1203
Hotels & Short-Stay Accommodation
Supporting & Auxiliary Transport Activities
17 192
Motion Picture, Radio, TV & Other Entertainment
5
180
Other Service Activities 6 298
Activities of Private House Holds 7 186
Miscellaneous Industry Groups 10 328
Source:- Bureau of Statistics, Punjab, Lahore.
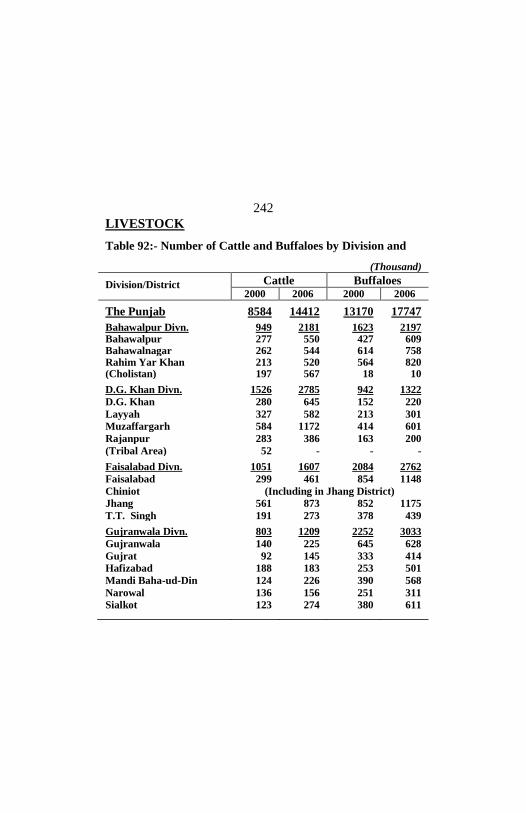
LIVESTOCK
242
Table 92:- Number of Cattle and Buffaloes by Division and
(Thousand)
Division/District Cattle Buffaloes 2000 2006 2000 2006
The Punjab 8584 14412 13170 17747 Bahawalpur Divn. 949 2181 1623 2197 Bahawalpur 277 550 427 609 Bahawalnagar 262 544 614 758 Rahim Yar Khan 213 520 564 820 (Cholistan) 197 567 18 10 D.G. Khan Divn. 1526 2785 942 1322
D.G. Khan 280 645 152 220
Layyah 327 582 213 301
Muzaffargarh 584 1172 414 601
Rajanpur 283 386 163 200
(Tribal Area) 52 - - - Faisalabad Divn. 1051 1607 2084 2762
Faisalabad 299 461 854 1148
Chiniot (Including in Jhang District)
Jhang 561 873 852 1175
T.T. Singh 191 273 378 439 Gujranwala Divn. 803 1209 2252 3033
Gujranwala 140 225 645 628
Gujrat 92
188
145 333
253
414
Hafizabad 183 501
Mandi Baha-ud-Din 124 226 390 568
Narowal 136 156 251 311
Sialkot 123 274 380 611
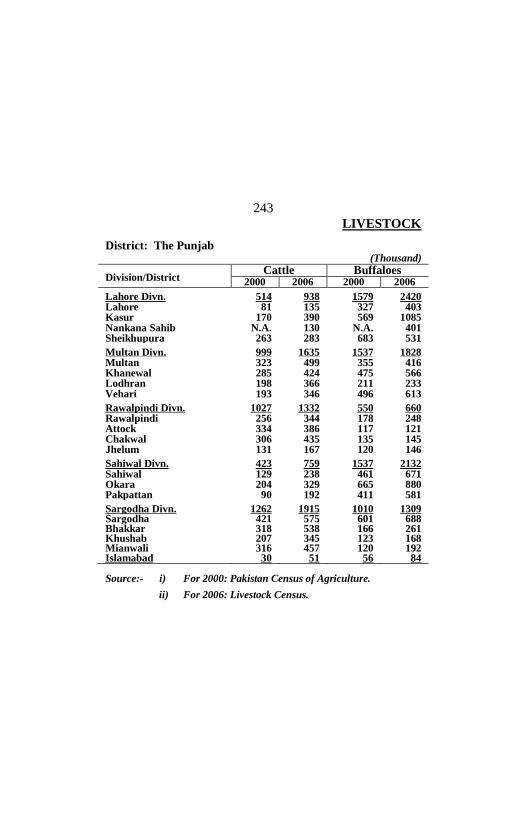
LIVESTOCK
243
District: The Punjab
(Thousand)
Division/District Cattle Buffaloes
2000 2006 2000 2006 Lahore Divn. 514 938 1579 2420 Lahore 81 135 327 403 Kasur 170 390 569 1085 Nankana Sahib N.A. 130 N.A. 401 Sheikhupura 263 283 683 531 Multan Divn. 999 1635 1537 1828 Multan 323 499 355 416 Khanewal 285 424 475 566 Lodhran 198 366 211 233 Vehari 193 346 496 613 Rawalpindi Divn. 1027 1332 550 660 Rawalpindi 256 344 178 248 Attock 334 386 117 121 Chakwal 306 435 135 145 Jhelum 131 167 120 146 Sahiwal Divn. 423 759 1537 2132 Sahiwal 129 238 461 671 Okara 204 329 665 880 Pakpattan 90 192 411 581 Sargodha Divn. 1262 1915 1010 1309 Sargodha 421 575 601 688 Bhakkar 318 538 166 261 Khushab 207 345 123 168 Mianwali 316 457 120 192 Islamabad 30 51 56 84
Source:- i) For 2000: Pakistan Census of Agriculture.
ii) For 2006: Livestock Census.
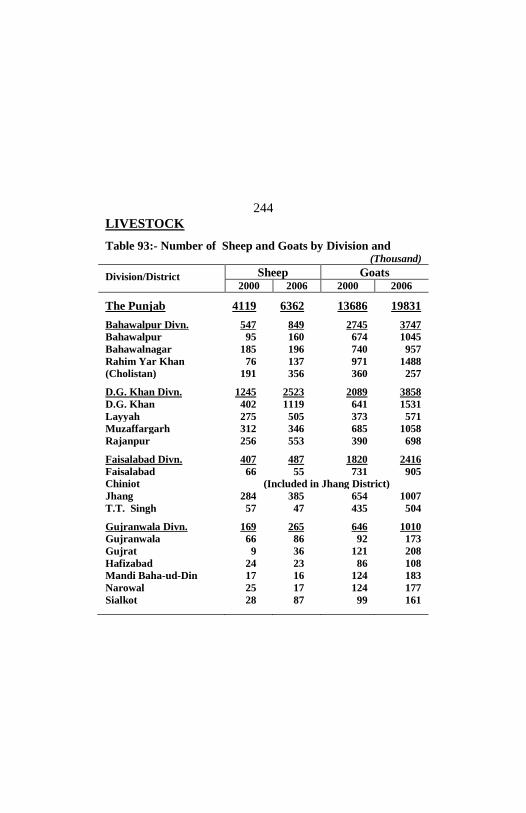
LIVESTOCK
244
Table 93:- Number of Sheep and Goats by Division and (Thousand)
Division/District Sheep Goats 2000 2006 2000 2006
The Punjab 4119 6362 13686 19831 Bahawalpur Divn. 547 849 2745 3747
Bahawalpur 95 160 674 1045
Bahawalnagar 185 196 740 957
Rahim Yar Khan 76 137 971 1488
(Cholistan) 191 356 360 257 D.G. Khan Divn. 1245 2523 2089 3858
D.G. Khan 402 1119 641 1531
Layyah 275 505 373 571
Muzaffargarh 312 346 685 1058
Rajanpur 256 553 390 698 Faisalabad Divn. 407 487 1820 2416
Faisalabad 66 55 731 905
Chiniot (Included in Jhang District)
Jhang 284 385 654 1007
T.T. Singh 57 47 435 504 Gujranwala Divn. 169 265 646 1010
Gujranwala 66 86 92 173
Gujrat 9 36 121 208
Hafizabad 24 23 86 108
Mandi Baha-ud-Din 17 16 124 183
Narowal 25 17 124 177
Sialkot 28 87 99 161

LIVESTOCK
245
District: The Punjab (Thousand)
Division/District Sheep Goats 2000 2006 2000 2006
Lahore Divn. 222 254 554 924 Lahore 27 41 67 118 Kasur 94 99 197 366 Nankana Sahib N.A 39 N.A. 256 Sheikhupura 101 75 290 184 Multan Divn. 411 378 1901 2371 Multan 114 81 392 594 Khanewal 147 156 607 712 Lodhran 67 40 371 428 Vehari 83 101 531 637 Rawalpindi Divn. 308 415 1331 2001 Rawalpindi 10 17 293 489 Attock 156 181 415 629 Chakwal 100 158 449 580 Jhelum 42 59 174 303 Sahiwal Divn. 175 199 887 1151 Sahiwal 54 50 386 478 Okara 77 91 272 356 Pakpattan 44 58 229 317 Sargodha Divn. 628 991 1662 2276 Sargodha 101 134 473 588 Bhakkar 284 460 440 656 Khushab 92 167 351 529 Mianwali 151 230 398 503 Islamabad 7 1 51 77
Source:- i) For 2000: Pakistan Census of Agriculture.
ii) For 2006: Livestock Census.

LIVESTOCK
246
Table 94:- Number of Veterinary Hospitals, Dispensaries and
Division/District Veterinary
Hospitals
Veterinary
Dispensaries
Veterinary
Centres
The Punjab 548 1447 1589 Bahawalpur Divn. 63 214 234
Bahawalpur 16 92 65
Bahawalnagar 21 83 80
Rahim Yar Khan 26 39 89 D.G.Khan Divn. 46 180 144
D.G.Khan 12 58 52
Layyah 9 25 33
Muzaffargarh 16 86 30
Rajanpur 9 11 29 Faisalabad Divn. 88 162 180
Faisalabad 38 49 118
Chiniot 5 24 -
Jhang 17 71 3
Toba Tek Singh 28 18 59 Gujranwala Divn. 91 160 288
Gujranwala 15 70 25
Gujrat 13 35 56
Hafizabad 8 19 25
Mandi Baha-ud-Din 12 19 50
Narowal 20 5 52
Sialkot 23 12 80

LIVESTOCK
247
Centres by Division and District, The Punjab: 2009-10
Division/District Veterinary
Hospitals
Veterinary
Dispensaries
Veterinary
Centres Lahore Divn. 63 208 149 Lahore 24 5 26 Kasur 13 69 43 Nankana Sahib 14 58 32 Sheikhupura 12 76 48 Multan Divn. 49 93 142 Multan 15 22 41 Khanewal 10 15 57 Lodhran 6 4 17 Vehari 18 42 27 Rawalpindi Divn. 47 129 183 Rawalpindi 13 29 74 Attock 10 35 54 Chakwal 14 54 21 Jhelum 10 11 34 Sahiwal Divn. 24 190 58 Sahiwal 6 75 - Okara 15 95 32 Pakpattan 3 20 26 Sargodha Divn. 77 111 211 Sargodha 32 38 80 Bhakkar 10 47 39 Khushab 16 21 43 Mianwali 19 5 49 Source:- i) Directorate of Livestock and Dairy Development (Ext.)
Punjab, Lahore.
ii) Directorate of Livestock and Dairy, Development, Barani Area, PVTV, Rawalpindi.
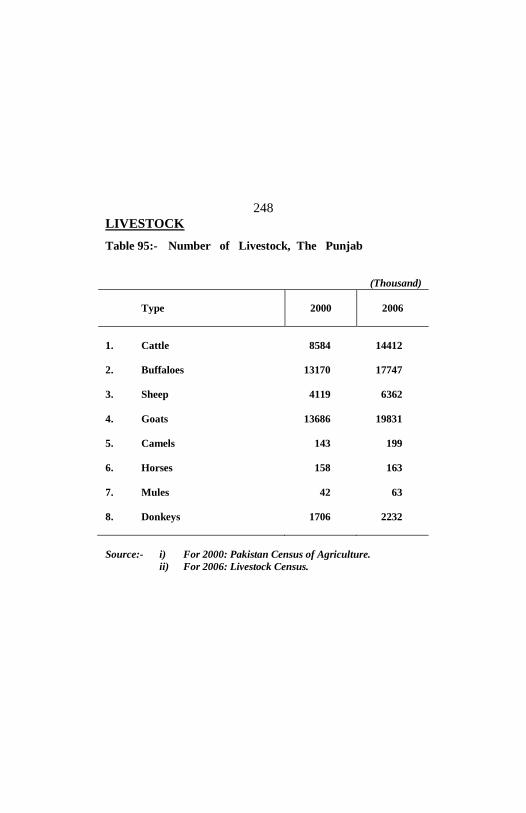
LIVESTOCK
248
Table 95:- Number of Livestock, The Punjab
(Thousand)
Type
2000
2006
1. Cattle 8584 14412
2. Buffaloes 13170 17747
3. Sheep 4119 6362
4. Goats 13686 19831
5. Camels 143 199
6. Horses 158 163
7. Mules 42 63
8. Donkeys 1706 2232
Source:- i) For 2000: Pakistan Census of Agriculture.
ii) For 2006: Livestock Census.

LIVESTOCK
249
Table 96:- Animals Slaughtered in Recognized and
Un-Recognized Slaughter Houses by Type,
The Punjab
(Hundred Number)
Animal 2005-
06
2006-
07
2007-
08
2008-
09
2009-
10
Total 82692 87880 125244 123935 123775
Cattle 11928 12250 18121 18191 19570
Buffaloes 10639 14750 19453 25078 20866
Sheep 21944 21850 33622 31147 31892
Goats 38161 38990 53952 49469 51404
Others 20 40 96 50 43
Source:- i) Directorate of Animal Health, Livestock & Dairy
Development, Punjab, Lahore.
ii) Directorate of Livestock and Dairy, Development,
Barani Area, PVTV, Rawalpindi.

MANUFACTURING
INDUSTRIES

MANUFACTURING INDUSTRIES
252
Table 97:- Average Monthly Employment in 22 Selected
Large-Scale Industries, The Punjab: 2009-10
Industry
Factories
Covered
Employment
Total Production
Workers
Vegetable Ghee 54 3449 2176
Sugar 46 24448 15250
Soft Drinks & Juices 37 6925 3324
Cigarettes 3 1269 1083
Cotton Textiles 295 168727 144487
Woolen Textiles 27 1797 1478
Jute Textiles 10 10094 8931
Leather Tanning 60 1711 1325
Footwear 16 8667 7152
Paper & Paper Board 41 5398 4178
Fertilizers 5 4878 3388
Paints & Varnishes 10 1071 537
Soap 50 1675 1200
Tyres & Tubes 7 973 771
Cement 13 6272 4292
Steel Bars/Angles 39 1134 782
Diesel Engines 21 223 154
Electric Transformers 5 6639 5289
Electric Motors 16 63 57
Electric Fans 47 2124 1748
Bicycles 3 2124 1892
Tractors 4 703 414
Source:- Bureau of Statistics, Punjab, Lahore

MANUFACTURING INDUSTRIES
253
Table 98:- Industrial Production of Selected Large-Scale
Industries, The Punjab – Contd.
Industry/Item
Unit of Quan-tity
2008-09 2009-10 No. of Fac-tories Cove-red
Pro-duc-tion
No. of Fac-tories Cove-red
Pro-duc-tion
1. Vegetable Ghee ‘000’ M.Ton
54
428
54
520
2. Sugar " 45 1926 46 1987 3. Soft Drinks
& Juices
(000 litres) 37
37
i) Coca Cola 7-Up etc.
"
19
1445760
19
1041643
ii) Fruit Juices (Tops, Benz, Shezan etc.)
"
18
67932
18
68020 4. Cigarettes Million
Nos.
3
43058
3
37296 5. Cotton Textiles 288 295 i)Cotton Yarn ‘000’
M.Tons
256
744
170
824 ii) M.M/Blended Yarn
" 110
454
113
447
iii)Cotton Cloth
Million Metres
53
350
33
369
iv) M.M./ Blended Cloth
"
10
79
10
89 6. Woolen Textiles M.Tons 27 27 i) Woolen Yarn " 17 1046 17 1154

MANUFACTURING INDUSTRIES
254
Table 98:- Industrial Production of Selected Large-Scale
Industry/Item
Unit of Quan-tity
2008-09 2009-10 No. of Fac-tories Cove-red
Pro-duc-tion
No. of Fac-tories Cove-red
Pro-duc-tion
ii) Woolen and Worsted Cloth
‘000’ Metres
5
991
5
825 iii)Blankets Blankets ‘000’
Nos.
6
0
6
0 7. Jute Textiles M. Tons 10 97473 10 78487 i) Sacking -do- 72030 53955 ii) Hessian -do- 14943 13080
iii)Twine -do- 10500 11452 8. Leather Tanning
31
60
i) Upper Leather
‘000’ Sq. Mtrs.
5980
10465
ii) Sole Leather M.Tons 156 215 9. Footwear ‘000’
Pairs
16
30979
16
34817 10. Paper & Paper Board
M.Tons
40
410635
41
406044
11. Sulphuric Acid -do- 3 44083 3 34425 12. Fertilizers ‘000’
M.Tons
5
4116
5
4129
13 Paints & Varnishes
9
10
i) Paints ‘000’ Litres
34040
38252
ii) Varnishes -do- 281 251
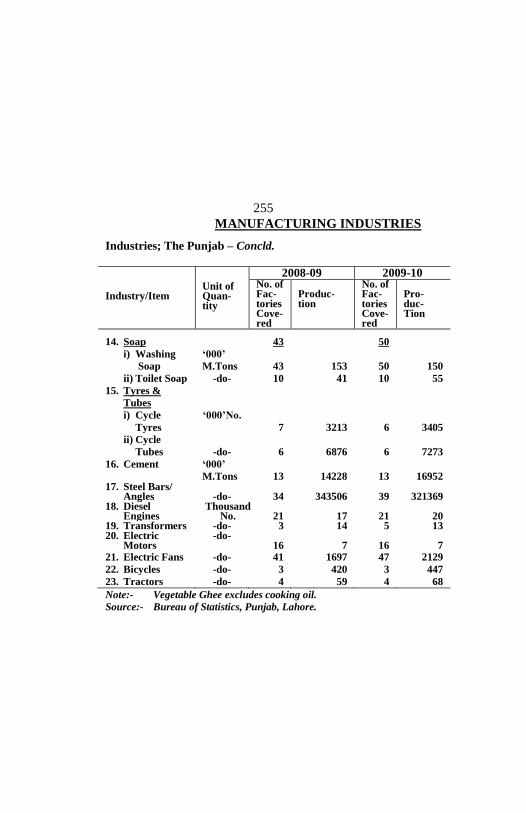
MANUFACTURING INDUSTRIES
255
Industries; The Punjab – Concld.
Industry/Item
Unit of Quan-tity
2008-09 2009-10 No. of Fac-tories Cove-red
Produc-tion
No. of Fac-tories Cove-red
Pro-duc- Tion
14. Soap 43 50
i) Washing
Soap
‘000’
M.Tons
43
153
50
150
ii) Toilet Soap -do- 10 41 10 55
15. Tyres &
Tubes
i) Cycle
Tyres
‘000’No.
7
3213
6
3405
ii) Cycle
Tubes
-do-
6
6876
6
7273
16. Cement ‘000’
M.Tons
13
14228
13
16952 17. Steel Bars/ Angles
-do-
34
343506
39
321369
18. Diesel Engines
Thousand No.
21
17
21
20
19. Transformers -do- 3 14 5 13 20. Electric Motors
-do- 16
7
16
7
21. Electric Fans -do- 41 1697 47 2129
22. Bicycles -do- 3 420 3 447
23. Tractors -do- 4 59 4 68
Note:- Vegetable Ghee excludes cooking oil.
Source:- Bureau of Statistics, Punjab, Lahore.

MANUFACTURING INDUSTRIES
256
Table 99:- Production of Major Manufactured Items
Pakistan and The Punjab
Item Unit of
Quantity
2009-10
Pak-
istan
Pun-
Jab
%
Share of
Punjab
Cotton Yarn Million Kgs. 2159 824 38.2
Cotton Cloth Million Sq.
Metres
762 369 48.4
Vegetable Ghee* ‘000’ M.Tons 1070 607 56.7
Sugar -do- 3132 1987 63.4
Fertilizers -do- 5855 4129 70.5
Cement -do- 31160 16952 54.4
Paper and
Paper Board
-do- 427 406 95.1
Soda Ash -do- 427 427 100.0
Caustic Soda -do- 194 194 100.0
Sulphuric Acid -do- 95 34 35.8
Cigarettes Million Nos. 65292 37296 57.1
* Including Cooking Oil.
Source:- i) For Pakistan: Federal Bureau of Statistics, Karachi.
ii) For Punjab: Bureau of Statistics, Punjab, Lahore.

MANUFACTURING INDUSTRIES
257
Table 100:- Index of Industrial Production, The Punjab
(Base: 1980-81=100)
Month 2006-07 2007-08 2008-09 2009-10
July 540.1 642.1 625.2 631.5
August 549.5 630.0 602.2 630.2
September 517.8 629.4 586.0 637.1
October 530.0 625.6 584.3 634.4
November 579.8 662.0 617.0 681.4
December 696.2 795.4 707.6 781.3
January 673.8 783.5 740.5 777.2
February 658.3 795.4 787.0 775.5
March 754.1 823.5 701.0 694.0
April 626.0 717.0 660.0 687.4
May 611.0 657.0 673.8 701.9
June 618.8 632.2 658.1(r) 693.5
Monthly Average 613.0 699.4 661.9 693.8
Source:- Bureau of Statistics, Punjab, Lahore.
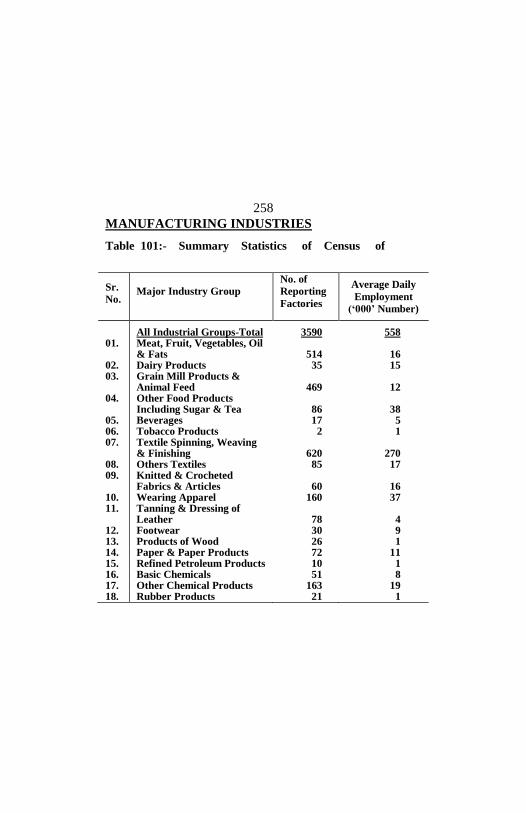
MANUFACTURING INDUSTRIES
258
Table 101:- Summary Statistics of Census of
Sr.
No.
Major Industry Group
No. of
Reporting
Factories
Average Daily
Employment
(‘000’ Number)
All Industrial Groups-Total 3590 558 01. Meat, Fruit, Vegetables, Oil
& Fats
514
16 02. Dairy Products 35 15 03. Grain Mill Products &
Animal Feed
469
12 04. Other Food Products
Including Sugar & Tea
86
38 05. Beverages 17 5 06. Tobacco Products 2 1 07. Textile Spinning, Weaving
& Finishing
620
270 08. Others Textiles 85 17 09. Knitted & Crocheted
Fabrics & Articles
60
16 10. Wearing Apparel 160 37 11. Tanning & Dressing of
Leather
78
4 12. Footwear 30 9 13. Products of Wood 26 1 14. Paper & Paper Products 72 11 15. Refined Petroleum Products 10 1 16. Basic Chemicals 51 8 17. Other Chemical Products 163 19 18. Rubber Products 21 1

MANUFACTURING INDUSTRIES
259
Manufacturing Industries by Major Industry Group
The Punjab: 2005-06 – Contd. (Cost/Value in Million Rupees)
Em-ploy-ment Cost
Value of Fixed Assets
Indus-trial Cost
Value of industrialProduc-
tion
CensusValue Added
In-direct Taxes
Sr. No.
67748 648436 900898 1405698 504800 71451
1651 12644 112904 152014 39110 3397 01.
3350 16871 30778 56409 25631 1916 02. 1375 11390 70320 85688 15368 674 03.
3148 48019 61279 85492 24213 7544 04.
625 3049 7418 14332 6914 3632 05.
141 950 2622 10683 8061 5750 06. 29324 286441 273118 411903 138785 2181 07.
1383 12656 21091 31460 10369 191 08.
1332 4774 9942 15175 5233 128 09.
3814 20749 30525 64488 33963 376 10.
317 1808 6878 9683 2805 78 11.
1317 1969 4125 8947 4822 497 12.
79 5661 600 1858 1258 59 13. 1642 24553 23370 48367 24997 4227 14. 653 1048 56026 64071 8045 6230 15.
3977 78991 25176 80252 55076 13410 16. 3686 14682 23706 43017 19311 3153 17.
59 229 496 912 416 55 18.
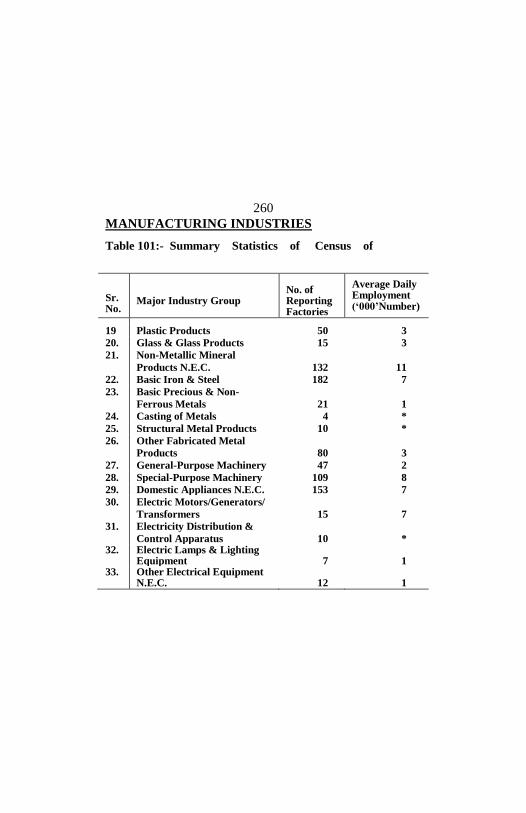
MANUFACTURING INDUSTRIES
260
Table 101:- Summary Statistics of Census of
Sr. No.
Major Industry Group
No. of Reporting Factories
Average Daily Employment (‘000’Number)
19 Plastic Products 50 3
20. Glass & Glass Products 15 3
21. Non-Metallic Mineral
Products N.E.C.
132
11
22. Basic Iron & Steel 182 7
23. Basic Precious & Non-
Ferrous Metals
21
1
24. Casting of Metals 4 *
25. Structural Metal Products 10 *
26. Other Fabricated Metal
Products
80
3
27. General-Purpose Machinery 47 2
28. Special-Purpose Machinery 109 8
29. Domestic Appliances N.E.C. 153 7
30. Electric Motors/Generators/
Transformers
15
7
31. Electricity Distribution &
Control Apparatus
10
* 32. Electric Lamps & Lighting
Equipment
7
1 33. Other Electrical Equipment
N.E.C.
12
1

MANUFACTURING INDUSTRIES
261
Manufacturing Industries by Major Industry Group
The Punjab: 2005-06 - Contd. (Cost/Value in Million Rupees)
Em-ploy-ment Cost
Value of Fixed Assets
Indus-trial Cost
Value of industrialProduc-
tion
CensusValue Added
In-direct Taxes
Sr. No.
271 1476 3325 4527 1202 401 19.
288 3874 1880 3171 1291 375 20.
2112
66845
17660
45167
27507
11911
21.
803 5109 42341 51910 9569 1229 22.
77
482
3931
4975
1044
538
23.
4 20 36 54 18 5 24.
24 91 447 557 110 15 25.
463
1189
1945
3746
1801
289
26.
406 636 2442 3862 1420 211 27.
1587 2719 21027 29516 8489 297 28.
454 2136 5140 8220 3080 569 29.
461
4447
8004
12738
4734
1216
30.
28
54
827
911
84
13
31.
47
384
246
452
206
25
32.
45
388
333
564
231
27
33.
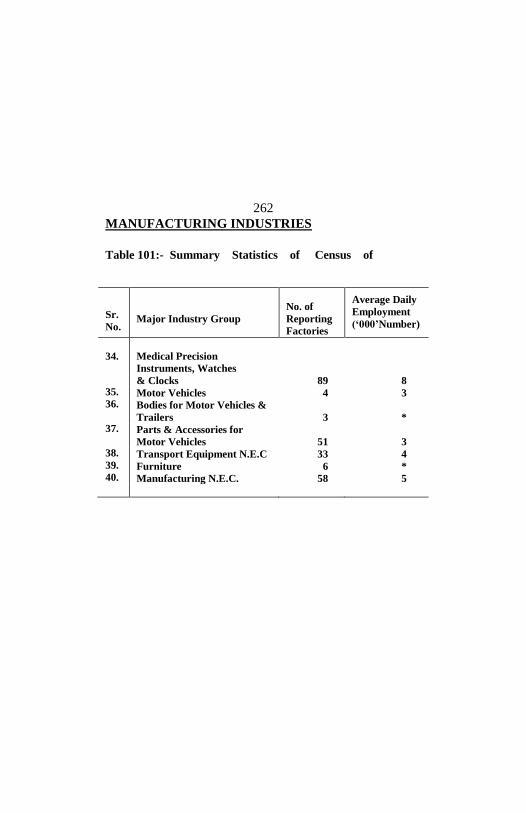
MANUFACTURING INDUSTRIES
262
Table 101:- Summary Statistics of Census of
Sr.
No.
Major Industry Group
No. of
Reporting
Factories
Average Daily
Employment
(‘000’Number)
34. Medical Precision
Instruments, Watches
& Clocks 89 8 35. Motor Vehicles 4 3 36. Bodies for Motor Vehicles &
Trailers
3
* 37. Parts & Accessories for
Motor Vehicles
51
3 38. Transport Equipment N.E.C 33 4 39. Furniture 6 * 40. Manufacturing N.E.C. 58 5

MANUFACTURING INDUSTRIES
263
Manufacturing Industries by Major Industry Group
The Punjab: 2005-06 - Concld. (Cost/Value in Million Rupees)
Em-
ploy-
ment
Cost
Value of
Fixed
Assets
Indus-
trial
Cost
Value of industrialProduc-
tion
CensusValue Added
In-
direct
Taxes
Sr.
No.
775 5030 4892 9403 4511 204 34.
702 3066 14010 21979 7969 4 35.
21
40
172
313
141
42
36.
266
923
2447
3604
1157
248
37.
318 1224 4099 5793 1694 259 38.
8 39 72 92 20 8 39.
715 1780 5248 9393 4145 67 40.
* Due to Rounding, Employment is zero.
Source:- Bureau of Statistics, Punjab, Lahore

MANUFACTURING INDUSTRIES
264
Table 102:- Summary Statistics of Census of Manufacturing
Sr.
No.
Division / District
No. of
Report-
ing
Fact-
ories
Average
Daily
Employment
(‘000’ No.)
Employ-
ment
Cost
The Punjab 3590 558 67748
Bahawalpur Divn. 237 15 1993
01. Bahawalpur 114 5 762
02. Bahawalnagar 17 1 74
03. Rahim Yar Khan 106 9 1157
D.G.Khan Divn. 162 30 3201
01. D.G.Khan 64 7 801
02. Layyah 6 1 65
03. Muzaffargarh 61 21 2272
04. Rajanpur 31 1 63
Faisalabad Divn. 518 123 10485
01. Faisalabad 418 110 9583
02. Chiniot (Included in
03. Jhang 51 8 573
04. T.T.Singh 49 5 329
Gujranwala Divn. 907 60 5336
01. Gujranwala 440 19 1660
02. Gujrat 190 11 772
03. Hafizabad 27 6 596
04. Mandi Bah-ud-Din 18 3 263
05. Narowal 17 * 19
06. Sialkot 215 21 2026

MANUFACTURING INDUSTRIES
265
Industries by Division and District, The Punjab: 2005-06 – Contd.
(Cost/Value in Million Rupees)
Value of
Fixed
Assets
Indus-
trial Cost
Value of
Industrial
Production
Census
Value
Added
In-direct
Taxes
Sr.
No.
648436 900898 1405698 504800 71448
16956 65813 91489 25676 4604
7863 20177 24513 4336 466 01. 943 3361 4572 1211 239 02.
8150 42275 62404 20129 3899 03.
42027 63872 96378 32506 4252 19490 17277 31058 13781 2437 01.
1116 2166 3016 850 227 02. 20526 32648 48582 15934 1376 03.
895 11781 13722 1941 212 04.
118069 152129 231443 79314 5963 101691 127856 203355 75499 4891 01.
Jhang District) 02. 10085 15698 17925 2227 610 03.
6293 8575 10163 1588 462 04.
34937 63658 106523 42865 2718 11719 29946 36773 6827 1572 01.
5155 6855 11325 4470 348 02. 3592 3899 7005 3106 136 03. 2938 3550 5339 1789 454 04.
85 1716 1953 237 * 05.
11448 17692 44128 26436 208 06.
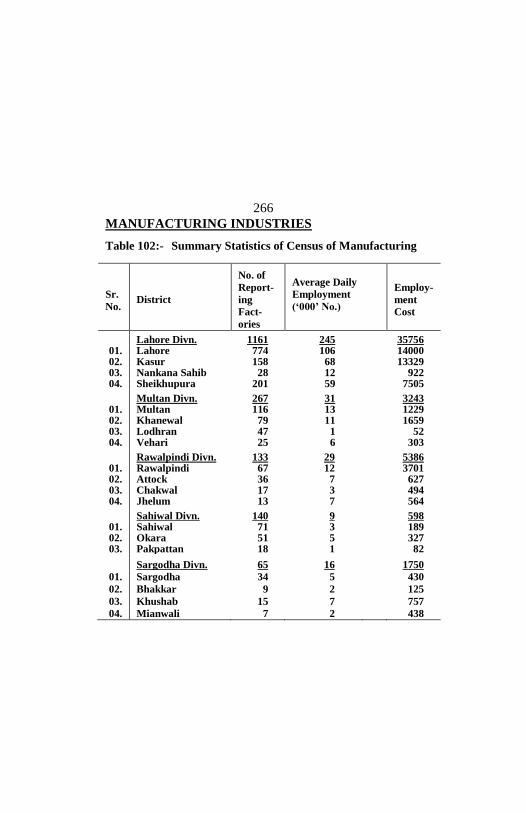
MANUFACTURING INDUSTRIES
266
Table 102:- Summary Statistics of Census of Manufacturing
Sr.
No.
District
No. of
Report-
ing
Fact-
ories
Average Daily
Employment
(‘000’ No.)
Employ-
ment
Cost
Lahore Divn. 1161 245 35756
01. Lahore 774 106 14000 02. Kasur 158 68 13329 03. Nankana Sahib 28 12 922 04. Sheikhupura 201 59 7505
Multan Divn. 267 31 3243
01. Multan 116 13 1229 02. Khanewal 79 11 1659 03. Lodhran 47 1 52 04. Vehari 25 6 303
Rawalpindi Divn. 133 29 5386
01. Rawalpindi 67 12 3701 02. Attock 36 7 627 03. Chakwal 17 3 494 04. Jhelum 13 7 564
Sahiwal Divn. 140 9 598 01. Sahiwal 71 3 189 02. Okara 51 5 327 03. Pakpattan 18 1 82
Sargodha Divn. 65 16 1750
01. Sargodha 34 5 430
02. Bhakkar 9 2 125
03. Khushab 15 7 757
04. Mianwali 7 2 438
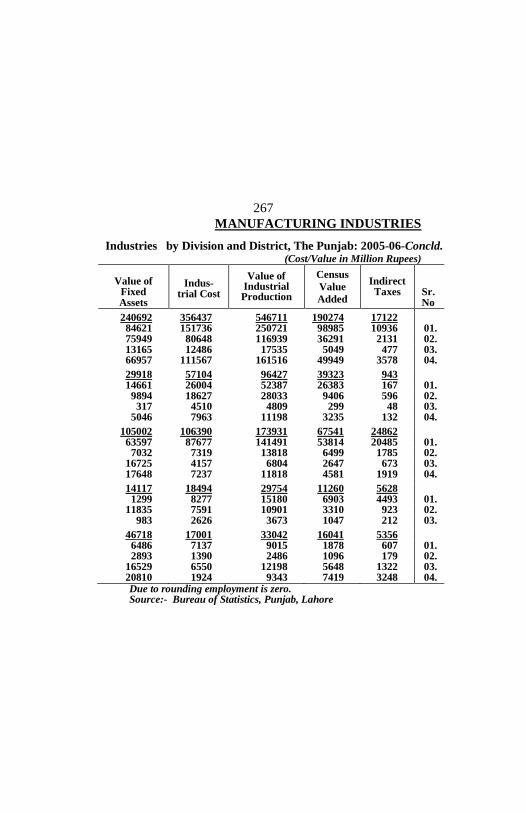
MANUFACTURING INDUSTRIES
267
Industries by Division and District, The Punjab: 2005-06-Concld. (Cost/Value in Million Rupees)
Value of
Fixed Assets
Indus-trial Cost
Value of Industrial Production
Census
Value
Added
Indirect Taxes
Sr. No
240692 356437 546711 190274 17122 84621 151736 250721 98985 10936 01. 75949 80648 116939 36291 2131 02. 13165 12486 17535 5049 477 03. 66957 111567 161516 49949 3578 04.
29918 57104 96427 39323 943 14661 26004 52387 26383 167 01.
9894 18627 28033 9406 596 02. 317 4510 4809 299 48 03.
5046 7963 11198 3235 132 04.
105002 106390 173931 67541 24862 63597 87677 141491 53814 20485 01.
7032 7319 13818 6499 1785 02. 16725 4157 6804 2647 673 03. 17648 7237 11818 4581 1919 04.
14117 18494 29754 11260 5628
1299 8277 15180 6903 4493 01. 11835 7591 10901 3310 923 02.
983 2626 3673 1047 212 03.
46718 17001 33042 16041 5356 6486 7137 9015 1878 607 01. 2893 1390 2486 1096 179 02.
16529 6550 12198 5648 1322 03. 20810 1924 9343 7419 3248 04. Due to rounding employment is zero. Source:- Bureau of Statistics, Punjab, Lahore

MANUFACTURING INDUSTRIES
268
Table 103:- Number of Registered Factories by Division
Division/District No. of Factories Employing Persons
(As on 30th June) Total Less than 100 100 or More
The Punjab 10255 9023 1232 Bahawalpur Divn. 734 706 28
Bahawalpur 344 332 12
Bahawalnagar 179 174 5
Rahim Yar Khan 211 200 11 D.G.Khan Din. 413 371 42
D.G.Khan 107 96 11
Layyah 104 101 3
Muzaffargarh 130 103 27
Rajanpur 72 71 1 Faisalabad Divn. 1175 981 194
Faisalabad 801 638 163
Chiniot 47 39 8
Jhang 194 178 16
T.T.Singh 133 126 7 Gujranwala Divn. 2454 2322 132
Gujranwala 1039 1002 37
Gujrat 526 512 14
Hafizabad 66 62 4
Mandi Bah-ud-Din 86 81 5
Narowal 20 19 1
Sialkot 717 646 71

MANUFACTURING INDUSTRIES
269
and District, The Punjab: 2009
Division/District No. of Factories Employing Persons
(As on 30th June) Total Less than 100 100 or More
Lahore Divn. 3201 2554 647 Lahore 1899 1635 264 Kasur 408 252 156 Nankana Sahib 183 144 39 Sheikhupura 711 523 188 Multan Divn. 884 822 62 Multan 427 394 33 Khanewal 163 144 19 Lodhran 116 115 1 Vehari 178 169 9 Rawalpindi Din. 593 530 63 Rawalpindi 319 294 25 Attock 52 38 14 Chakwal 136 125 11 Jhelum 86 73 13 Sahiwal Divn. 413 384 29 Sahiwal 160 147 13 Okara 77 64 13 Pakpattan 176 173 3 Sargodha Divn. 388 353 35 Sargodha 325 312 13 Bhakkar 15 13 2 Khushab 29 16 13 Mianwali 19 12 7
Source:- Bureau of Statistics, Punjab, Lahore.

MANUFACTURING INDUSTRIES
270
Table 104 :- Number of Registered Factories by Major
Major Industry Group
No. of Factories
Employing Persons
(As on 30th June)
Total Less
than 100
100 or
More All Industrial Groups-Total 10255 9023 1232 Farming of Animals 6 5 1 Meat, Fruit, Vegetables, Oil & Fats 1200 1141 59 Dairy Products 91 68 23 Grain Mill Products & Animal Feed
797 780 17
Other Food Products Including Sugar & Tea
159 96 63
Beverages 30 18 12 Tobacco Products 9 3 6 Textile Spinning, Weaving & Finishing
1326 846 480
Others Textiles 181 152 29 Knitted & Crocheted Fabrics & Articles
262 208 54
Wearing, Apparel, Except Fur Apparel
216 155 61
Tanning & Dressing of Leather 206 183 23 Footwear 84 76 8 Sawmilling & Planing of Wood 2 1 1 Products of Wood 40 34 6
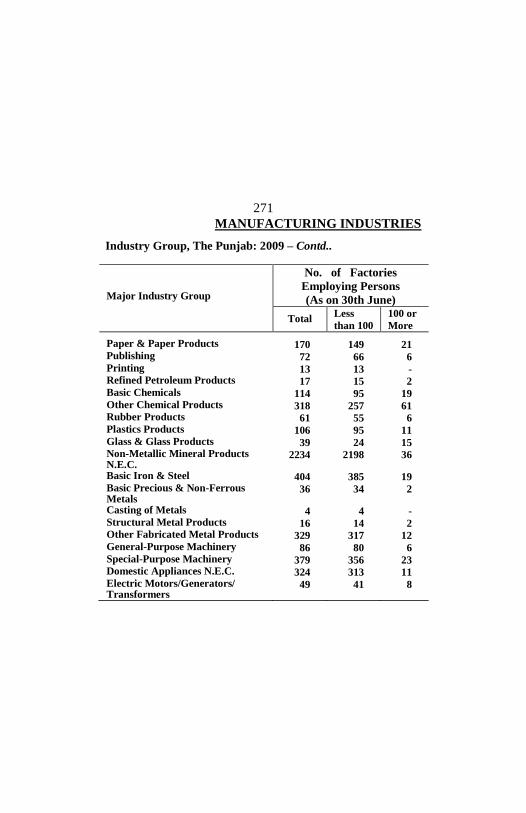
MANUFACTURING INDUSTRIES
271
Industry Group, The Punjab: 2009 – Contd..
Major Industry Group
No. of Factories
Employing Persons
(As on 30th June)
Total Less
than 100
100 or
More Paper & Paper Products 170 149 21 Publishing 72 66 6 Printing 13 13 - Refined Petroleum Products 17 15 2 Basic Chemicals 114 95 19 Other Chemical Products 318 257 61 Rubber Products 61 55 6 Plastics Products 106 95 11 Glass & Glass Products 39 24 15 Non-Metallic Mineral Products N.E.C.
2234 2198 36
Basic Iron & Steel 404 385 19 Basic Precious & Non-Ferrous Metals
36 34 2
Casting of Metals 4 4 - Structural Metal Products 16 14 2 Other Fabricated Metal Products 329 317 12 General-Purpose Machinery 86 80 6 Special-Purpose Machinery 379 356 23 Domestic Appliances N.E.C. 324 313 11 Electric Motors/Generators/ Transformers
49 41 8
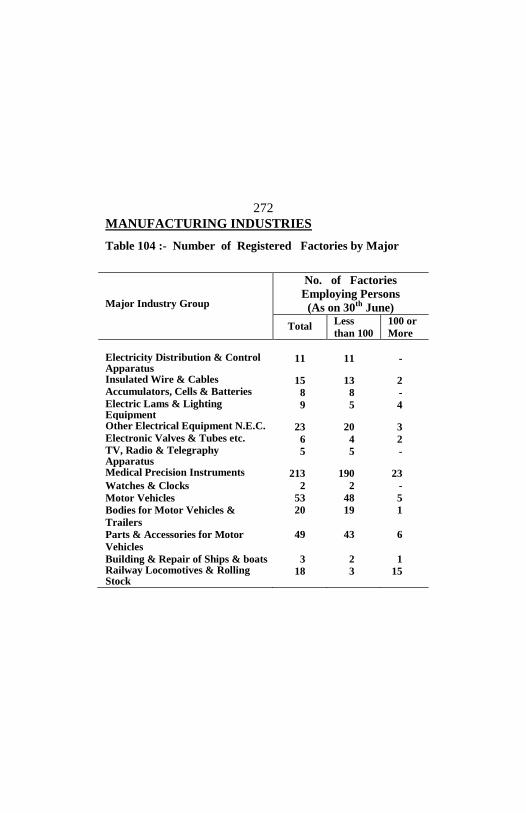
MANUFACTURING INDUSTRIES
272
Table 104 :- Number of Registered Factories by Major
Major Industry Group
No. of Factories
Employing Persons
(As on 30th June)
Total Less
than 100
100 or
More Electricity Distribution & Control Apparatus
11 11 -
Insulated Wire & Cables 15 13 2 Accumulators, Cells & Batteries 8 8 - Electric Lams & Lighting Equipment
9 5 4
Other Electrical Equipment N.E.C. 23 20 3 Electronic Valves & Tubes etc. 6 4 2 TV, Radio & Telegraphy Apparatus
5 5 -
Medical Precision Instruments 213 190 23
Watches & Clocks 2 2 -
Motor Vehicles 53 48 5
Bodies for Motor Vehicles &
Trailers
20 19 1
Parts & Accessories for Motor
Vehicles
49 43 6
Building & Repair of Ships & boats 3 2 1 Railway Locomotives & Rolling Stock
18 3 15

MANUFACTURING INDUSTRIES
273
Industry Group, The Punjab: 2009 - Concld.
Major Industry Group
No. of Factories
Employing Persons
(As on 30th June)
Total Less
than 100
100 or
More Transport Equipment N.E.C 108 90 18 Furniture 58 58 - Manufacturing N.E.C 166 136 30 Recycling of Non-Metal Waste & Scrap
12 12 -
Prod. Transmission & Distribution of Electricity
45 28 17
Manufacturing of Gas & Distribution
3 3 -
Maintenance & Repair of Motor Vehicles
3 1 2
Supporting & Auxiliary Transport Activities
17 17 -
Motion Picture, Radio, T.V. & Other Entertainment
5 5 -
Other Service Activities 6 6 - Activities of Private House Holds 7 7 - Miscellaneous Industry Groups 10 10 -
Source:- Bureau of Statistics, Punjab, Lahore
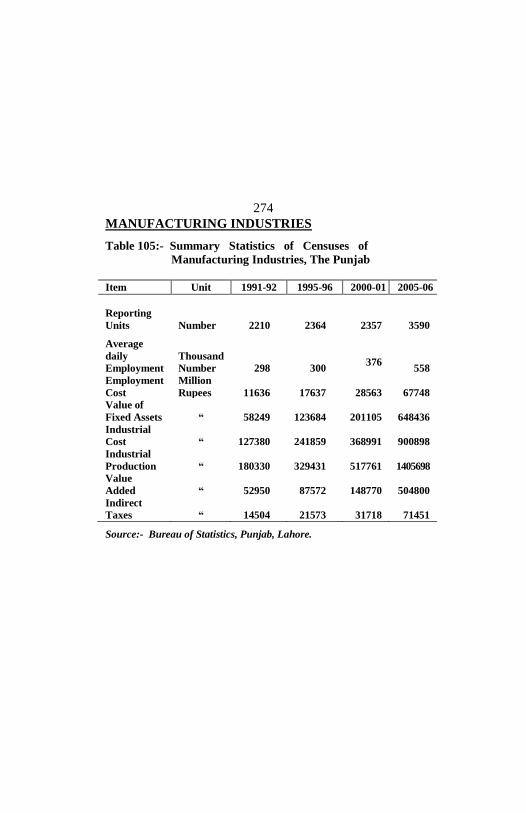
MANUFACTURING INDUSTRIES
274
Table 105:- Summary Statistics of Censuses of
Manufacturing Industries, The Punjab
Item Unit 1991-92 1995-96 2000-01 2005-06
Reporting
Units
Number
2210
2364
2357
3590 Average
daily
Employment
Thousand
Number
298
300
376
558
Employment
Cost
Million
Rupees
11636
17637
28563
67748
Value of
Fixed Assets
“
58249
123684
201105
648436
Industrial
Cost
“
127380
241859
368991
900898
Industrial
Production
“
180330
329431
517761
1405698
Value
Added
“
52950
87572
148770
504800
Indirect
Taxes
“
14504
21573
31718
71451 Source:- Bureau of Statistics, Punjab, Lahore.

MANUFACTURING INDUSTRIES
275
Table 106 :- Industry-wise Loans Disbursed by the
Pakistan Industrial Credit and Investment
Corporation Limited in the Punjab
(Million Rupees)
Industrial Group 2005-
06
2006-
07
2007-
08
2008-
09
2009-
10
Loans Disbursed-Total 2321 1391 0 0 0
1. Food Beverages
and Tobacco
64
56
-
-
-
2. Cotton Textiles 1348 855 - - -
3. Other Textile - - - - -
4. Sugar 141 - - - -
5. Engineering 23 - - - -
6. Chemicals,
Ceramics & Glass
71
-
-
-
-
7. Cement 56 358 - - -
8. Fuel and Energy 20 - - - -
9. Non Industrial
Local Products
126
-
-
-
-
10. Wood Products 11 - - - -
11. Miscellaneous 461 122 - - -
Note:- Includes lease financing.
Source:- Pakistan Industrial Credit and Investment Corporation
Limited (PICIC), Karachi.

MINING
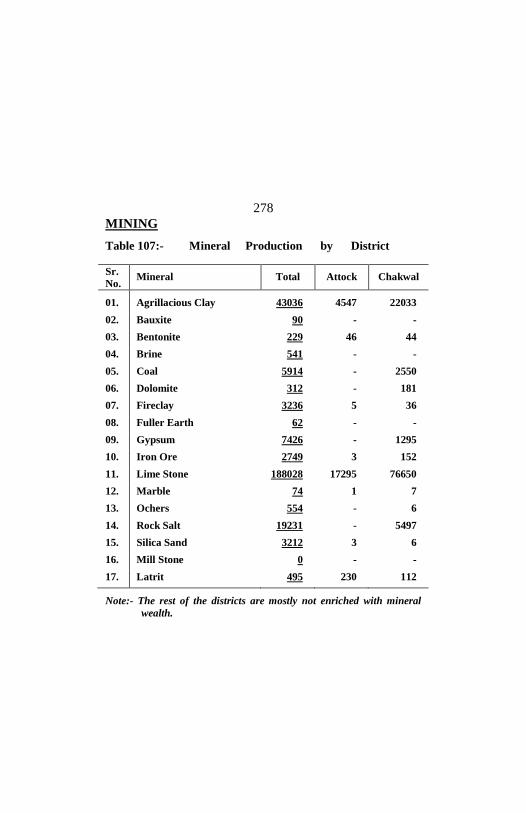
MINING
278
Table 107:- Mineral Production by District
Sr.
No. Mineral Total Attock Chakwal
01. Agrillacious Clay 43036 4547 22033
02. Bauxite 90 - -
03. Bentonite 229 46 44
04. Brine 541 - -
05. Coal 5914 - 2550
06. Dolomite 312 - 181
07. Fireclay 3236 5 36
08. Fuller Earth 62 - -
09. Gypsum 7426 - 1295
10. Iron Ore 2749 3 152
11. Lime Stone 188028 17295 76650
12. Marble 74 1 7
13. Ochers 554 - 6
14. Rock Salt 19231 - 5497
15. Silica Sand 3212 3 6
16. Mill Stone 0 - -
17. Latrit 495 230 112
Note:- The rest of the districts are mostly not enriched with mineral
wealth.
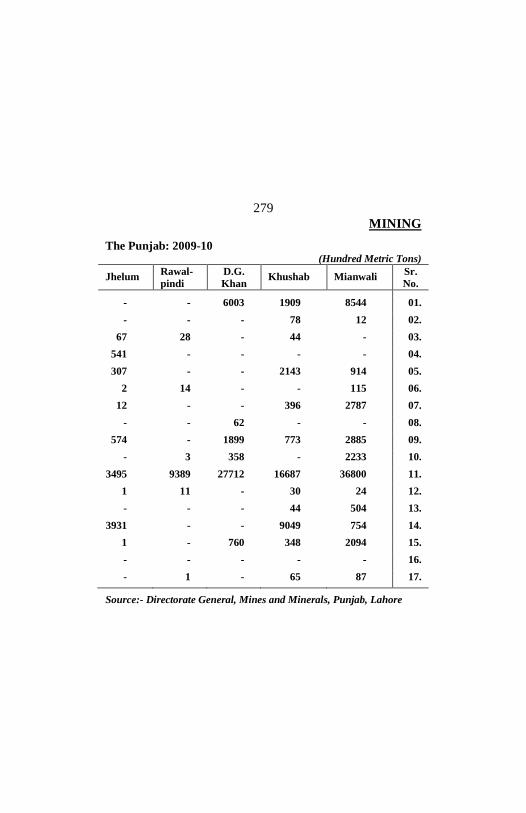
MINING
279
The Punjab: 2009-10 (Hundred Metric Tons)
Jhelum Rawal-
pindi
D.G.
Khan Khushab Mianwali
Sr.
No.
- - 6003 1909 8544 01.
- - - 78 12 02.
67 28 - 44 - 03.
541 - - - - 04.
307 - - 2143 914 05.
2 14 - - 115 06.
12 - - 396 2787 07.
- - 62 - - 08.
574 - 1899 773 2885 09.
- 3 358 - 2233 10.
3495 9389 27712 16687 36800 11.
1 11 - 30 24 12.
- - - 44 504 13.
3931 - - 9049 754 14.
1 - 760 348 2094 15.
- - - - - 16.
- 1 - 65 87 17. Source:- Directorate General, Mines and Minerals, Punjab, Lahore
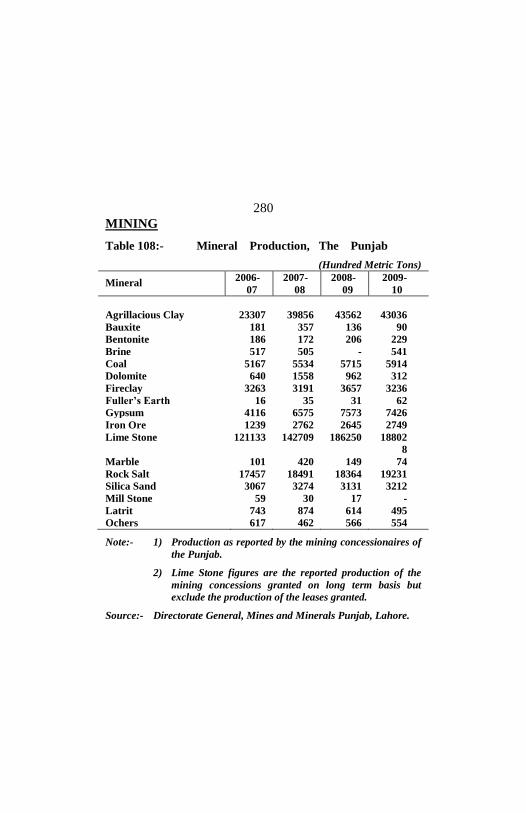
MINING
280
Table 108:- Mineral Production, The Punjab
(Hundred Metric Tons)
Mineral 2006-
07
2007-
08
2008-
09
2009-
10
Agrillacious Clay 23307 39856 43562 43036
Bauxite 181 357 136 90
Bentonite 186 172 206 229
Brine 517 505 - 541
Coal 5167 5534 5715 5914
Dolomite 640 1558 962 312
Fireclay 3263 3191 3657 3236
Fuller’s Earth 16 35 31 62
Gypsum 4116 6575 7573 7426
Iron Ore 1239 2762 2645 2749
Lime Stone 121133 142709 186250 18802
8
Marble 101 420 149 74
Rock Salt 17457 18491 18364 19231
Silica Sand 3067 3274 3131 3212
Mill Stone 59 30 17 -
Latrit 743 874 614 495
Ochers 617 462 566 554 Note:- 1) Production as reported by the mining concessionaires of
the Punjab.
2) Lime Stone figures are the reported production of the
mining concessions granted on long term basis but
exclude the production of the leases granted. Source:- Directorate General, Mines and Minerals Punjab, Lahore.

NATIONAL
ACCOUNTS

NATIONAL ACCOUNTS
282
Table 109:- Gross National Product, Pakistan at Constant
(Rs. in Million)
Sector 2008-09 2009-10 (r) 2010-11 (p) Commodity Prod. Sector
2580671 2702290 2715883
1. Agriculture 1195002 1201945 1216523 ` i) Major Crops 402135 392651 376822 ii) Minor Crops 137201 126481 132571 iii) Livestock 620253 646783 670743 iv) Fishing 21319 21626 22041 v) Forestry 14094 14404 14346 Industrial Sector 1385669 1500345 1499360 2. Mining & Quarrying
137348
140378
140971
3. Manufacturing 998846 1054276 1085440 a) Large-Scale 665285 698062 704936 b) Small-Scale 258173 277562 298407 c) Slaughtering 75388 78652 82097 4. Construction 112884 144985 146169 5. Electricity &Gas Distribution
136591
160706
126780
Services Sector 2895045 2979241 3101523 6. Transport, Storage & Communication
558703
574101
581388 7. Wholesale & Retail Trade
921375
963368
1000477
8. Finance & Insurance
312818
277555
260172
9. Ownership of Dwellings
150629
155916
158707
10. Public Admn. & Defense
332108
340508
385506
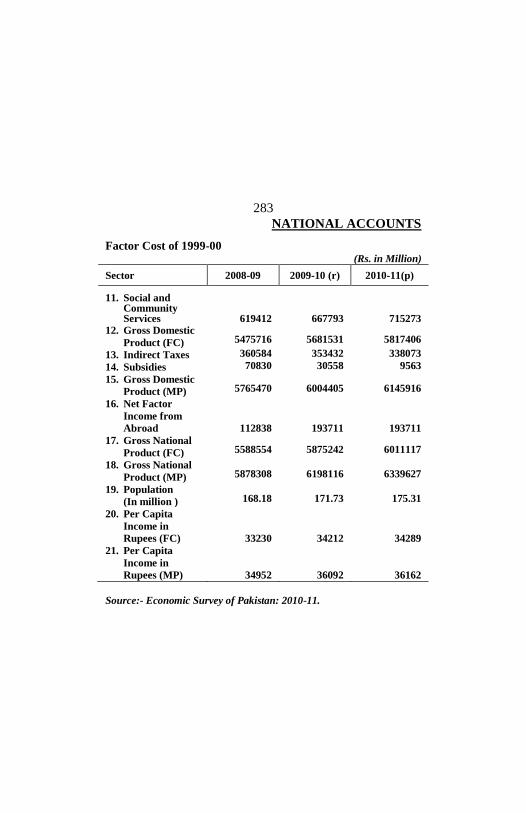
NATIONAL ACCOUNTS
283
Factor Cost of 1999-00 (Rs. in Million)
Sector 2008-09 2009-10 (r) 2010-11(p) 11. Social and
Community Services
619412
667793
715273 12. Gross Domestic
Product (FC)
5475716
5681531
5817406
13. Indirect Taxes 360584 353432 338073
14. Subsidies 70830 30558 9563
15. Gross Domestic
Product (MP)
5765470
6004405
6145916
16. Net Factor
Income from
Abroad
112838
193711
193711
17. Gross National
Product (FC)
5588554
5875242
6011117
18. Gross National
Product (MP)
5878308
6198116
6339627
19. Population
(In million )
168.18
171.73
175.31
20. Per Capita
Income in
Rupees (FC)
33230
34212
34289
21. Per Capita
Income in
Rupees (MP)
34952
36092
36162
Source:- Economic Survey of Pakistan: 2010-11.

NATIONAL ACCOUNTS
284
Table 110:- Gross National Product, Pakistan At Current
(Rs. in Million)
Sector 2008-09 2009-10 (r) 2010-11(p)
1. Agriculture 2611526 2978950 3698658 ` i) Major Crops 979148 1082408 1424927 ii) Minor Crops 237536 262586 363749 iii) Livestock 1299865 1533716 1802221 iv) Fishing 59514 60347 61403 v) Forestry 35463 39893 46358 2. Mining & Quarrying
346412
371233
431907
3. Manufacturing 2069482 2487069 3167947 a) Large-Scale 1502879 1809446 2319590 b) Small-Scale 395005 449933 544771 c) Slaughtering 171598 227690 303586 4. Construction 294990 352530 396777 5. Electricity &Gas Distribution
284091
366827
326426
6. Transport, Storage & Communication
1587934
1846735
2132844 7. Wholesale & Retail Trade
2104337
2464342
3115906
8. Finance & Insurance
621508
616116
649701
9. Ownership of Dwellings
298789
345555
401687
10. Public Admn. & Defense
662723
757140
975296
11. Social and Community Services
1228670
1480018
1810338
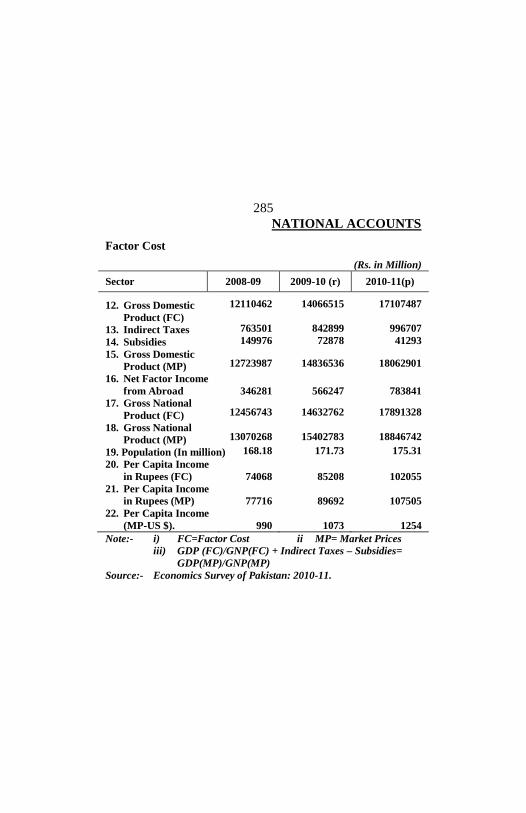
NATIONAL ACCOUNTS
285
Factor Cost
(Rs. in Million)
Sector 2008-09 2009-10 (r) 2010-11(p)
12. Gross Domestic
Product (FC)
12110462 14066515 17107487
13. Indirect Taxes 763501 842899 996707
14. Subsidies 149976 72878 41293
15. Gross Domestic
Product (MP)
12723987
14836536
18062901
16. Net Factor Income
from Abroad
346281
566247
783841
17. Gross National
Product (FC)
12456743
14632762
17891328
18. Gross National
Product (MP)
13070268
15402783
18846742
19. Population (In million) 168.18 171.73 175.31
20. Per Capita Income
in Rupees (FC)
74068
85208
102055
21. Per Capita Income
in Rupees (MP)
77716
89692
107505
22. Per Capita Income
(MP-US $).
990
1073
1254
Note:- i) FC=Factor Cost ii MP= Market Prices
iii) GDP (FC)/GNP(FC) + Indirect Taxes – Subsidies=
GDP(MP)/GNP(MP)
Source:- Economics Survey of Pakistan: 2010-11.
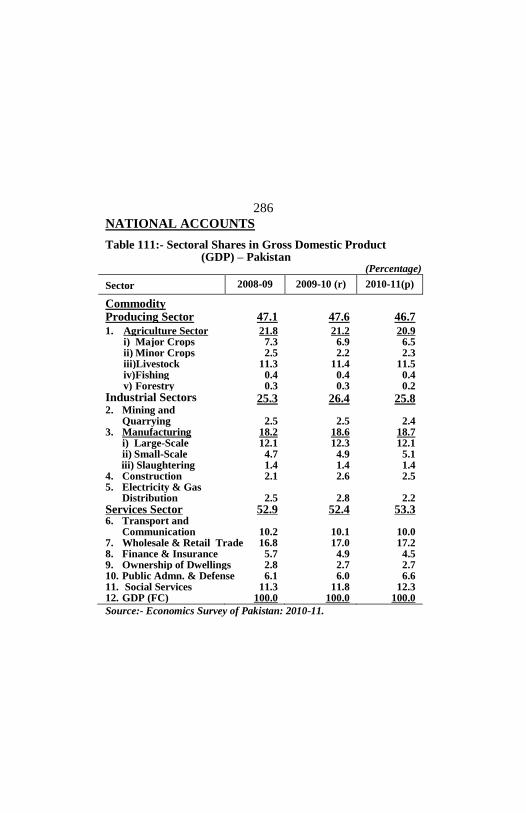
NATIONAL ACCOUNTS
286
Table 111:- Sectoral Shares in Gross Domestic Product (GDP) – Pakistan
(Percentage)
Sector 2008-09 2009-10 (r) 2010-11(p) Commodity Producing Sector
47.1
47.6
46.7
1. Agriculture Sector 21.8 21.2 20.9 i) Major Crops 7.3 6.9 6.5 ii) Minor Crops 2.5 2.2 2.3 iii)Livestock 11.3 11.4 11.5 iv) Fishing 0.4 0.4 0.4 v) Forestry 0.3 0.3 0.2 Industrial Sectors 25.3 26.4 25.8 2. Mining and Quarrying
2.5
2.5
2.4
3. Manufacturing 18.2 18.6 18.7 i) Large-Scale 12.1 12.3 12.1 ii) Small-Scale 4.7 4.9 5.1 iii) Slaughtering 1.4 1.4 1.4 4. Construction 2.1 2.6 2.5 5. Electricity & Gas Distribution
2.5
2.8
2.2
Services Sector 52.9 52.4 53.3 6. Transport and Communication
10.2
10.1
10.0
7. Wholesale & Retail Trade 16.8 17.0 17.2 8. Finance & Insurance 5.7 4.9 4.5 9. Ownership of Dwellings 2.8 2.7 2.7 10. Public Admn. & Defense 6.1 6.0 6.6 11. Social Services 11.3 11.8 12.3 12. GDP (FC) 100.0 100.0 100.0
Source:- Economics Survey of Pakistan: 2010-11.
POPULATION
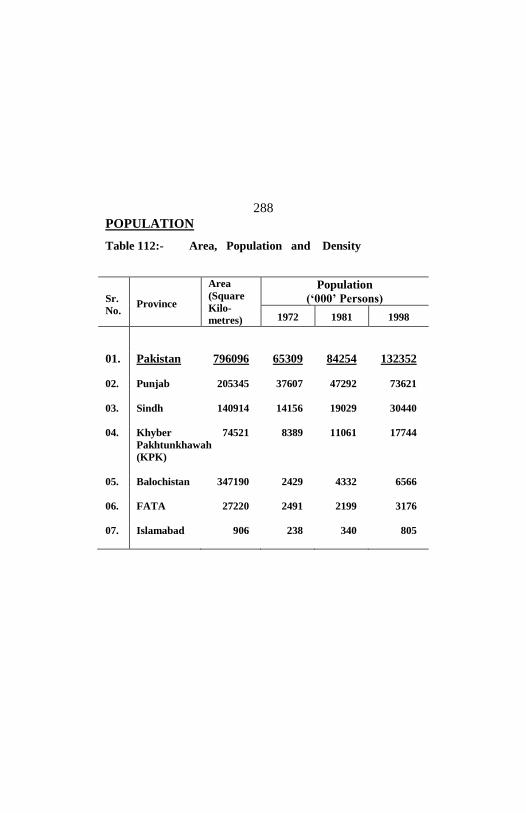
POPULATION
288
Table 112:- Area, Population and Density
Sr.
No.
Province
Area
(Square
Kilo-
metres)
Population
(‘000’ Persons)
1972 1981 1998
01. Pakistan 796096 65309 84254 132352
02. Punjab 205345 37607 47292 73621
03. Sindh 140914 14156 19029 30440
04. Khyber
Pakhtunkhawah
(KPK)
74521 8389 11061 17744
05. Balochistan 347190 2429 4332 6566
06. FATA 27220 2491 2199 3176
07. Islamabad
906 238 340 805
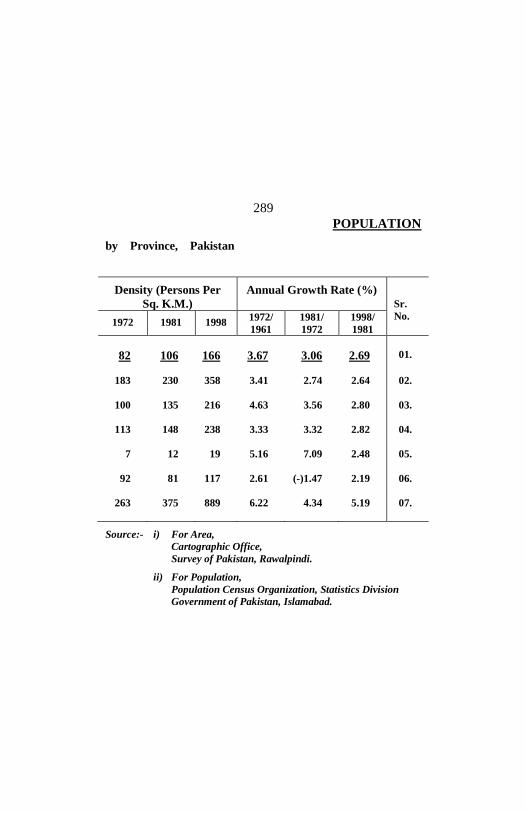
POPULATION
289
by Province, Pakistan
Density (Persons Per
Sq. K.M.)
Annual Growth Rate (%)
Sr.
No. 1972 1981 1998
1972/
1961
1981/
1972
1998/
1981
82 106 166 3.67 3.06 2.69 01.
183 230 358 3.41 2.74 2.64 02.
100 135 216 4.63 3.56 2.80 03.
113 148 238 3.33 3.32 2.82 04.
7 12 19 5.16 7.09 2.48 05.
92 81 117 2.61 (-)1.47 2.19 06.
263 375 889 6.22 4.34 5.19 07.
Source:- i) For Area,
Cartographic Office,
Survey of Pakistan, Rawalpindi.
ii) For Population,
Population Census Organization, Statistics Division
Government of Pakistan, Islamabad.

POPULATION
290
Table 113:- Population and Percentage of Population by
Province, Pakistan
(Thousand Persons)
Province 1951 1961 1972 1981 1998
Pakistan 33740 42880 65309 84254 132352
(100.00) (100.00) (100.00) (100.00) (100.00)
Punjab 20541 25464 37607 47292 73621
(60.88) (59.38) (57.58) (56.13) (55.62)
Sindh 6048 8367 14156 19029 30440
(17.93) (19.51) (21.68) (22.59) (22.99)
KPK 4557 5731 8389 11061 17744
(13.51) (13.37) (12.85) (13.13) (13.41)
Balochistan 1167 1353 2429 4332 6566
(3.46) (3.16) (3.72) (5.14) (4.96)
FATA 1332 1847 2491 2199 3176
(3.95) (4.31) (3.81) (2.61) (2.40)
Islamabad 96 118 238 340 805
(0.28)
(0.28) (0.36) (0.40) (0.61)
Note:- Figures in Parenthesis are percentages.
Source:- Population Census Organization, Statistics Division
Government of Pakistan, Islamabad.

POPULATION
291
Table 114:- Estimated Population, The Punjab
(Thousand persons)
Year As on 30th June As on 31st December
2002 80875 81598
2003 82330 83067
2004 83811 84563
2005 85320 86085
2006 86813 87548
2007 88289 89036
2008 89790 90550
2009 91316 92089
2010 92869 93682
2011 94401 95153
Source:- Bureau of Statistics, Punjab, Lahore.
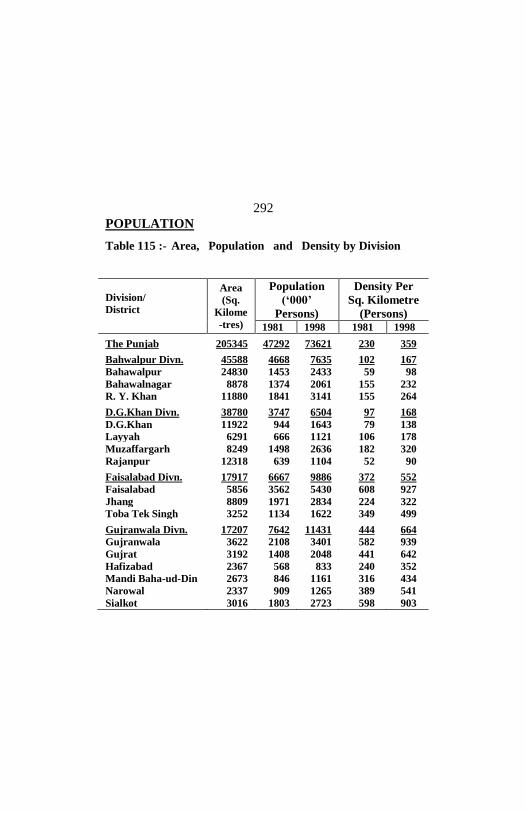
POPULATION
292
Table 115 :- Area, Population and Density by Division
Division/
District
Area
(Sq.
Kilome
-tres)
Population
(‘000’
Persons)
Density Per
Sq. Kilometre
(Persons) 1981 1998 1981 1998
The Punjab 205345 47292 73621 230 359 Bahwalpur Divn. 45588 4668 7635 102 167
Bahawalpur 24830 1453 2433 59 98
Bahawalnagar 8878 1374 2061 155 232
R. Y. Khan 11880 1841 3141 155 264 D.G.Khan Divn. 38780 3747 6504 97 168
D.G.Khan 11922 944 1643 79 138
Layyah 6291 666 1121 106 178
Muzaffargarh 8249 1498 2636 182 320
Rajanpur 12318 639 1104 52 90 Faisalabad Divn. 17917 6667 9886 372 552
Faisalabad 5856 3562 5430 608 927
Jhang 8809 1971 2834 224 322
Toba Tek Singh 3252 1134 1622 349 499 Gujranwala Divn. 17207 7642 11431 444 664
Gujranwala 3622 2108 3401 582 939
Gujrat 3192 1408 2048 441 642
Hafizabad 2367 568 833 240 352
Mandi Baha-ud-Din 2673 846 1161 316 434
Narowal 2337 909 1265 389 541
Sialkot 3016 1803 2723 598 903

POPULATION
293
and District, The Punjab Division/ District
Area (Sq.
Kilome-tres)
Population (‘000’
Persons)
Density Per Sq. Kilometre
(Persons) 1981 1998 1981 1998
Lahore Divn. 11729 7183 12016 612 1024 Lahore 1772 3545 6319 2001 3566 Kasur 3995 1528 2376 382 595 Nankana Sahib 2720 938 1273 345 468 Sheikhupura 3242 1172 2048 362 632 Multan Divn. 15211 5409 8447 356 555 Multan 3720 1970 3117 530 838 Khanewal 4349 1370 2068 315 476 Lodhran 2778 740 1172 266 422 Vehari 4364 1329 2090 305 479 Rawalpindi Divn. 22253 4433 6660 199 299 Rawalpindi 5285 2121 3364 401 637 Attock 6857 877 1275 128 186 Chakwal 6524 776 1084 119 166 Jhelum 3587 659 937 184 261 Sahiwal Divn. 10302 3612 5362 351 520 Sahiwal 3201 1281 1843 400 576 Okara 4377 1487 2232 340 510 Pakpattan 2724 844 1287 310 472 Sargodha Divn. 26358 3931 5680 149 215 Sargodha 5854 1912 2666 327 455 Bhakkar 8153 666 1051 82 129 Khushab 6511 641 906 98 139 Mianwali 5840 712 1057 122 181 Source:- Population Census Organization, Statistics Division, Govt. of
Pakistan, Islamabad.

POPULATION
294
Table 116 :- Estimated Population by Division and District
(Thousand Persons)
Division/District As on 30-06-2011 As on 31-12-2011
The Punjab 94401 95153 Bahawalpur Divn. 10069 10159
Bahawalpur 3247 3277
Bahawalnagar 2584 2603
R. Y. Khan 4238 4279 D.G.Khan Divn. 8856 8943
D.G.Khan 2241 2263
Layyah 1500 1514
Muzaffargarh 3615 3652
Rajanpur 1500 1514 Faisalabad Divn. 12324 12411 Faisalabad 6873 6924 Chiniot 1163 1170 Jhang 2308 2324 T.T.Singh 1980 1993 Gujranwala Divn. 14336 14441 Gujranwala 4441 4479 Gujrat 2525 2542 Hafizabad 1031 1038 Mandi Baha-ud-Din 1384 1392 Narowal 1522 1531 Sialkot 3433 3459
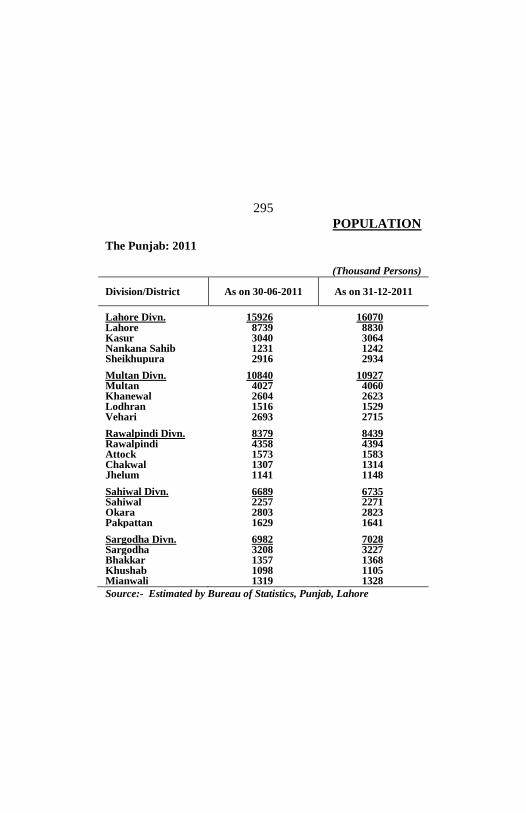
POPULATION
295
The Punjab: 2011
(Thousand Persons)
Division/District As on 30-06-2011 As on 31-12-2011
Lahore Divn. 15926 16070 Lahore 8739 8830 Kasur 3040 3064 Nankana Sahib 1231 1242 Sheikhupura 2916 2934 Multan Divn. 10840 10927 Multan 4027 4060 Khanewal 2604 2623 Lodhran 1516 1529 Vehari 2693 2715 Rawalpindi Divn. 8379 8439 Rawalpindi 4358 4394 Attock 1573 1583 Chakwal 1307 1314 Jhelum 1141 1148 Sahiwal Divn. 6689 6735 Sahiwal 2257 2271 Okara 2803 2823 Pakpattan 1629 1641 Sargodha Divn. 6982 7028 Sargodha 3208 3227 Bhakkar 1357 1368 Khushab 1098 1105 Mianwali 1319 1328
Source:- Estimated by Bureau of Statistics, Punjab, Lahore
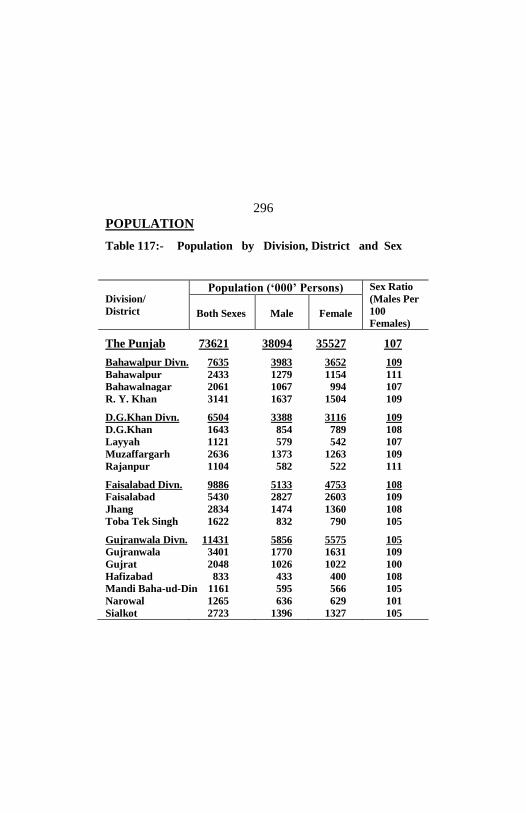
POPULATION
296
Table 117:- Population by Division, District and Sex
Division/
District
Population (‘000’ Persons) Sex Ratio
(Males Per
100
Females)
Both Sexes
Male
Female
The Punjab 73621 38094 35527 107 Bahawalpur Divn. 7635 3983 3652 109
Bahawalpur 2433 1279 1154 111
Bahawalnagar 2061 1067 994 107
R. Y. Khan 3141 1637 1504 109 D.G.Khan Divn. 6504 3388 3116 109
D.G.Khan 1643 854 789 108
Layyah 1121 579 542 107
Muzaffargarh 2636 1373 1263 109
Rajanpur 1104 582 522 111 Faisalabad Divn. 9886 5133 4753 108
Faisalabad 5430 2827 2603 109
Jhang 2834 1474 1360 108
Toba Tek Singh 1622 832 790 105 Gujranwala Divn. 11431 5856 5575 105
Gujranwala 3401 1770 1631 109
Gujrat 2048 1026 1022 100
Hafizabad 833 433 400 108
Mandi Baha-ud-Din 1161 595 566 105
Narowal 1265 636 629 101
Sialkot 2723 1396 1327 105

POPULATION
297
The Punjab: 1998 Census
Division/ District
Population (‘000’ Persons) Sex Ratio (Males Per 100 Females)
Both Sexes
Male
Female
Lahore Divn. 12016 6302 5714 110 Lahore 6319 3329 2990 111 Kasur 2376 1244 1132 110 Nankana Sahib 1273 660 613 108 Sheikhupura 2048 1069 979 109 Multan Divn. 8447 4401 4046 109 Multan 3117 1636 1481 110 Khanewal 2068 1072 996 108 Lodhran 1172 609 563 108 Vehari 2090 1084 1006 108 Rawalpindi Divn. 6660 3345 3315 101 Rawalpindi 3364 1723 1641 105 Attock 1275 636 639 100 Chakwal 1084 518 566 92 Jhelum 937 468 469 100 Sahiwal Divn. 5362 2789 2573 108 Sahiwal 1843 953 890 107 Okara 2232 1167 1065 110 Pakpattan 1287 669 618 108 Sargodha Divn. 5680 2897 2783 104 Sargodha 2666 1373 1293 106 Bhakkar 1051 543 508 107 Khushab 906 451 455 99 Mianwali 1057 530 527 101
Source:- Population Census Organization, Statistics Division, Govt. of
Pakistan, Islamabad.
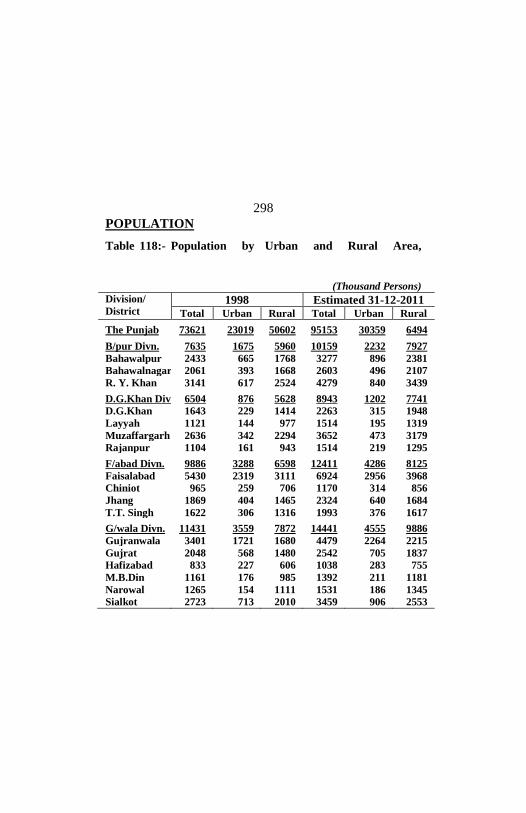
POPULATION
298
Table 118:- Population by Urban and Rural Area,
(Thousand Persons)
Division/
District 1998 Estimated 31-12-2011
Total Urban Rural Total Urban Rural The Punjab 73621 23019 50602 95153 30359 6494 B/pur Divn. 7635 1675 5960 10159 2232 7927
Bahawalpur 2433 665 1768 3277 896 2381
Bahawalnagar 2061 393 1668 2603 496 2107
R. Y. Khan 3141 617 2524 4279 840 3439 D.G.Khan Divn. 6504 876 5628 8943 1202 7741
D.G.Khan 1643 229 1414 2263 315 1948
Layyah 1121 144 977 1514 195 1319
Muzaffargarh 2636 342 2294 3652 473 3179
Rajanpur 1104 161 943 1514 219 1295 F/abad Divn. 9886 3288 6598 12411 4286 8125
Faisalabad 5430 2319 3111 6924 2956 3968
Chiniot 965 259 706 1170 314 856
Jhang 1869 404 1465 2324 640 1684
T.T. Singh 1622 306 1316 1993 376 1617 G/wala Divn. 11431 3559 7872 14441 4555 9886
Gujranwala 3401 1721 1680 4479 2264 2215
Gujrat 2048 568 1480 2542 705 1837
Hafizabad 833 227 606 1038 283 755
M.B.Din 1161 176 985 1392 211 1181
Narowal 1265 154 1111 1531 186 1345
Sialkot 2723 713 2010 3459 906 2553
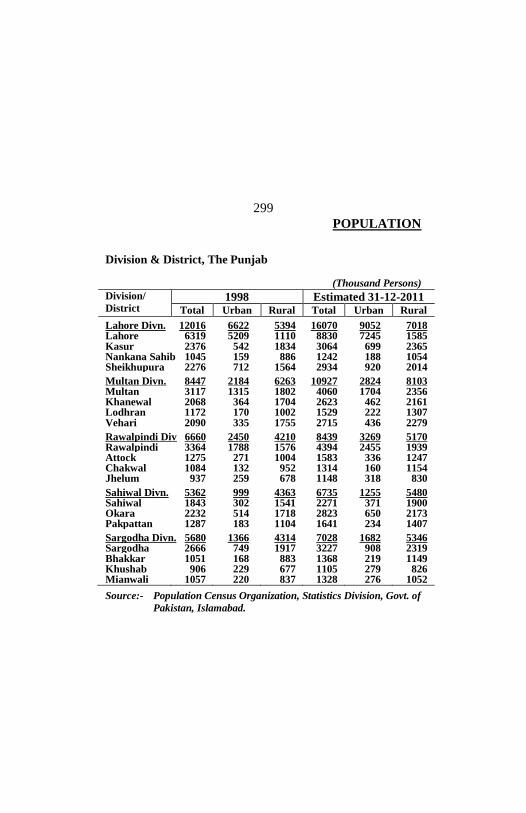
POPULATION
299
Division & District, The Punjab
(Thousand Persons)
Division/
District 1998 Estimated 31-12-2011
Total Urban Rural Total Urban Rural Lahore Divn. 12016 6622 5394 16070 9052 7018 Lahore 6319 5209 1110 8830 7245 1585 Kasur 2376 542 1834 3064 699 2365 Nankana Sahib 1045 159 886 1242 188 1054 Sheikhupura 2276 712 1564 2934 920 2014 Multan Divn. 8447 2184 6263 10927 2824 8103 Multan 3117 1315 1802 4060 1704 2356 Khanewal 2068 364 1704 2623 462 2161 Lodhran 1172 170 1002 1529 222 1307 Vehari 2090 335 1755 2715 436 2279 Rawalpindi Divn. 6660 2450 4210 8439 3269 5170 Rawalpindi 3364 1788 1576 4394 2455 1939 Attock 1275 271 1004 1583 336 1247 Chakwal 1084 132 952 1314 160 1154 Jhelum 937 259 678 1148 318 830 Sahiwal Divn. 5362 999 4363 6735 1255 5480 Sahiwal 1843 302 1541 2271 371 1900 Okara 2232 514 1718 2823 650 2173 Pakpattan 1287 183 1104 1641 234 1407 Sargodha Divn. 5680 1366 4314 7028 1682 5346 Sargodha 2666 749 1917 3227 908 2319 Bhakkar 1051 168 883 1368 219 1149 Khushab 906 229 677 1105 279 826 Mianwali 1057 220 837 1328 276 1052 Source:- Population Census Organization, Statistics Division, Govt. of
Pakistan, Islamabad.

POPULATION
300
Table 119:- Area and Population by Tehsil, The Punjab
District/Tehsil Area
(Sq.K.M.)
Population
(‘000’ Persons) 1981 1998
The Punjab 205345 47292 73621 Bahawalpur Distt. 24830 1453 2433 Ahmadpur East 1707 444 718
Bahawalpur 2372 457 807
Hasilpur 1372 197 318
Khairpur Tame Wali 888 117 185
Yazman 18491 238 405 Bahawalnagar Distt. 8878 1374 2061 Bahawalnagar 1729 367 542
Chishtian 1500 327 498
Fort Abbas 2536 196 285
Haroonabad 1295 258 382
Minchinabad 1818 226 354 R.Y. Khan Distt. 11880 1841 3141 Khanpur 1246 421 684
Liaquatpur 6727 395 699
Rahim Yar Khan 1715 575 986
Sadiqabad
2192 450 772

POPULATION
301
1981 & 1998 Censuses – Contd.
District/Tehsil Area
(Sq.K.M.)
Population
(‘000’ Persons) 1981 1998
D.G.Khan Distt. 11922 944 1643 D.G.Khan 3814 636 1151
Taunsa 2769 226 366
Tribal Area 5339 82 126
Layyah Distt. 6291 666 1121 Chaubara 2754 94 161
Karor 1824 226 369
Layyah 1712 346 591
Muzaffargarh Distt. 8249 1498 2636 Alipur 1391 231 398
Jatoi 1010 242 447
Kot Addu 3471 450 808
Muzaffargarh 2377 575 983
Rajanpur Distt. 12318 639 1104 Jampur 2322 276 485
Rajanpur 2078 214 397
Rojhan 2905 127 208
Tribal Area 5013 21 14
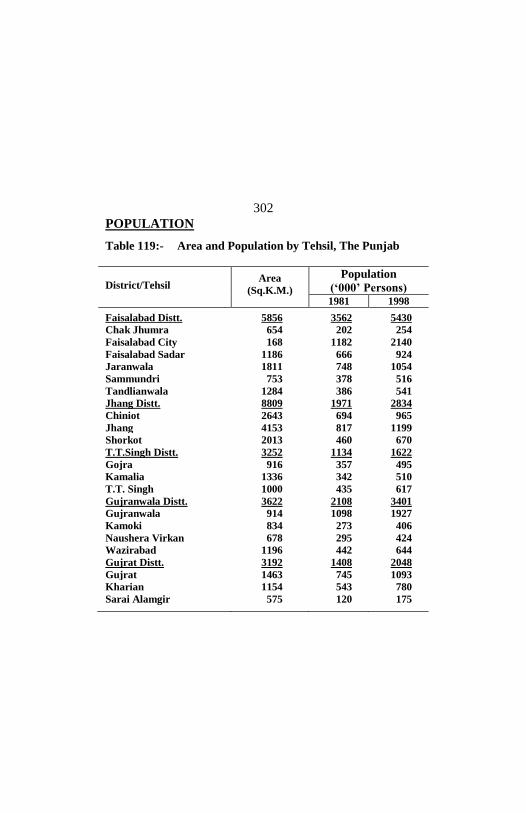
POPULATION
302
Table 119:- Area and Population by Tehsil, The Punjab
District/Tehsil Area
(Sq.K.M.)
Population
(‘000’ Persons) 1981 1998
Faisalabad Distt. 5856 3562 5430
Chak Jhumra 654 202 254
Faisalabad City 168 1182 2140
Faisalabad Sadar 1186 666 924
Jaranwala 1811 748 1054
Sammundri 753 378 516
Tandlianwala 1284 386 541
Jhang Distt. 8809 1971 2834
Chiniot 2643 694 965
Jhang 4153 817 1199
Shorkot 2013 460 670
T.T.Singh Distt. 3252 1134 1622
Gojra 916 357 495
Kamalia 1336 342 510
T.T. Singh 1000 435 617
Gujranwala Distt. 3622 2108 3401
Gujranwala 914 1098 1927
Kamoki 834 273 406
Naushera Virkan 678 295 424
Wazirabad 1196 442 644
Gujrat Distt. 3192 1408 2048
Gujrat 1463 745 1093
Kharian
Sarai Alamgir
1154
575
543
120
780
175

POPULATION
303
1981 & 1998 Censuses – Contd.
District/Tehsil Area
(Sq.K.M.)
Population
(‘000’ Persons) 1981 1998
Hafizabad Distt. 2367 568 833 Hafizabad 1189 332 485 Pindi Bhattian 1178 236 348 Mandi Baha-ud-Din Distt 2673 846 1161 Malakwal 759 240 300 Mandi Baha-ud-Din 759 325 461 Phalia 1155 281 400 Narowal Distt. 2337 909 1265 Narowal 1065 443 627 Shakargarh 1272 466 638 Sialkot Distt. 3016 1803 2723 Daska 1026 574 861 Pasrur 978 426 612 Sialkot 1012 803 1250 Lahore Distt. 1772 3545 6319 Lahore Cantt. 917 2032 3778 Lahore City 855 1513 2541 Kasur Distt. 3995 1528 2376 Chunian 1212 389 585 Kasur 1891 736 1157 Pattoki 892 403 634 Nankana Sahib Distt. 2720 772 1045 Sangle Hill
{N.A. 124 170
Shahkot 139 191 Nankana Sahib 509 684
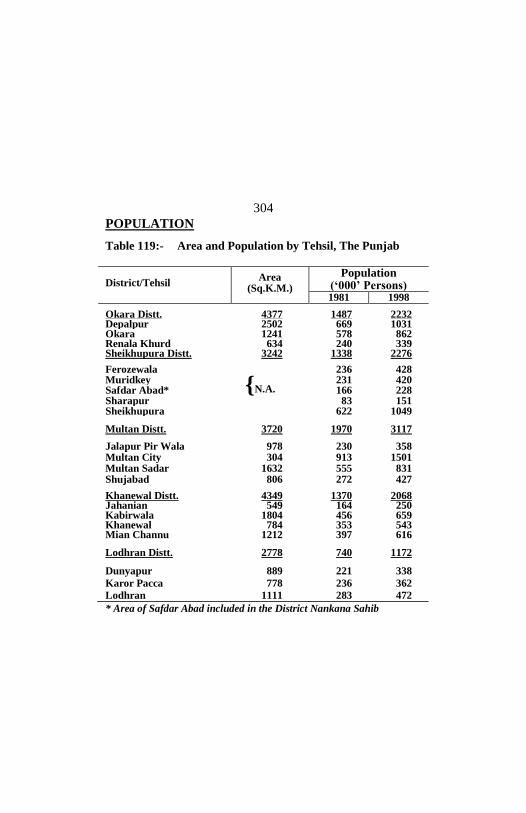
POPULATION
304
Table 119:- Area and Population by Tehsil, The Punjab
District/Tehsil
Area (Sq.K.M.)
Population (‘000’ Persons) 1981 1998
Okara Distt. 4377 1487 2232 Depalpur 2502 669 1031 Okara 1241 578 862 Renala Khurd 634 240 339 Sheikhupura Distt. 3242 1338 2276 Ferozewala
{N.A.
236 428 Muridkey 231 420 Safdar Abad* 166 228 Sharapur 83 151 Sheikhupura 622 1049 Multan Distt. 3720 1970 3117 Jalapur Pir Wala 978 230 358 Multan City 304 913 1501 Multan Sadar 1632 555 831 Shujabad 806 272 427 Khanewal Distt. 4349 1370 2068 Jahanian 549 164 250 Kabirwala 1804 456 659 Khanewal 784 353 543 Mian Channu 1212 397 616 Lodhran Distt. 2778 740 1172 Dunyapur 889 221 338
Karor Pacca 778 236 362
Lodhran 1111 283 472
* Area of Safdar Abad included in the District Nankana Sahib

POPULATION
305
1981 & 1998 Censuses – Contd.
District/Tehsil Area
(Sq.K.M.)
Population
(‘000’ Persons) 1981 1998
Pakpattan Distt. 2724 844 1287
Arifwala 1241 406 604
Pakpattan 1483 438 683
Sahiwal Distt. 3201 1281 1843
Chichawatni 1591 553 785
Sahiwal 1610 728 1058
Vehari Distt. 4364 1329 2090
Burewala 1295 473 730
Mailsi 1639 442 705
Vehari 1430 414 655 Rawalpindi Distt. 5285 2121 3364 Gujar Khan 1457 360 494 Kahuta 1096 232 313 Kotli Sattain 304 83 81 Murree 434 157 177 Rawalpindi 1682 1066 1928 Taxila 312 223 371
Attock Distt. 6857 877 1275
Attock 1350 323 501
Fateh Jang 1249 149 214
Hassanabdal 350 93 136
Jand 2043 165 228
Pindi Gheb 1865 147 196

POPULATION
306
Table 119:- Area and Population by Tehsil, The Punjab
1981 & 1998 Censuses – Concld.
District/Tehsil Area
(Sq.K.M.)
Population
(‘000’ Persons) 1981 1998
Chakwal Distt. 6524 776 1084 Chakwal 3120 428 598 Choa Saidan Shah 472 80 106 Talagang 2932 268 380 Jhelum Distt. 3587 659 937 Jhelum 1062 353 517 Pind Dadan Khan 1267 188 264 Sohawa 1258 118 156 Sargodha Distt. 5854 1912 2666 Bhalwal 2115 633 820 Sahiwal 829 173 237 Sargodha 1536 723 1081 Shahpur 767 206 274 Sillanwali 607 177 254 Bhakkar Distt. 8153 666 1051 Bhakkar 2427 265 425 Darya Khan 1719 147 233 Kalur Kot 2239 147 223 Mankera 1768 107 170 Khushab Distt. 6511 641 906 Khushab 4011 516 731 Nurpur 2500 125 175 Mianwali Distt. 5840 712 1057 Isa Khel 1863 160 257 Mianwali 2689 374 532 Piplan 1288 178 268 Source:- Population Census Organization, Statistics Division, Govt. of
Pakistan, Islamabad.
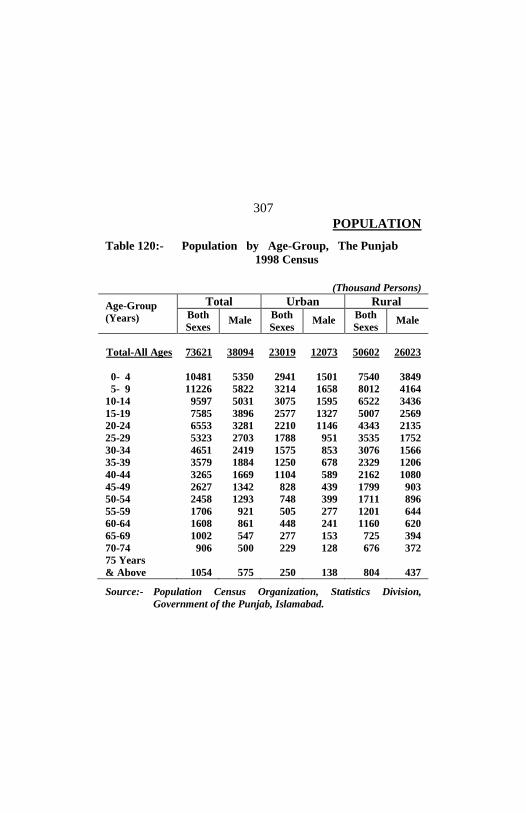
POPULATION
307
Table 120:- Population by Age-Group, The Punjab
1998 Census
(Thousand Persons)
Age-Group
(Years)
Total Urban Rural Both
Sexes Male
Both
Sexes Male
Both
Sexes Male
Total-All Ages 73621 38094 23019 12073 50602 26023
0- 4 10481 5350 2941 1501 7540 3849
5- 9 11226 5822 3214 1658 8012 4164
10-14 9597 5031 3075 1595 6522 3436
15-19 7585 3896 2577 1327 5007 2569
20-24 6553 3281 2210 1146 4343 2135
25-29 5323 2703 1788 951 3535 1752
30-34 4651 2419 1575 853 3076 1566
35-39 3579 1884 1250 678 2329 1206
40-44 3265 1669 1104 589 2162 1080
45-49 2627 1342 828 439 1799 903
50-54 2458 1293 748 399 1711 896
55-59 1706 921 505 277 1201 644
60-64 1608 861 448 241 1160 620
65-69 1002 547 277 153 725 394
70-74 906 500 229 128 676 372
75 Years
& Above
1054
575
250
138
804
437 Source:- Population Census Organization, Statistics Division,
Government of the Punjab, Islamabad.
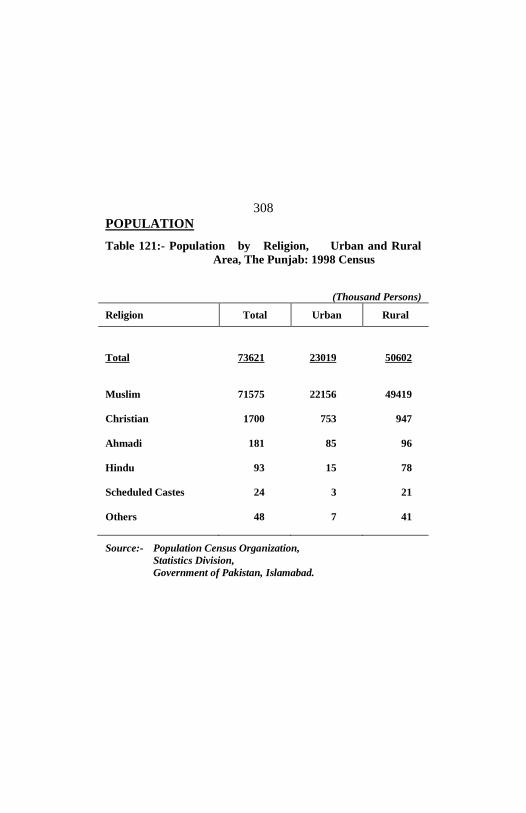
POPULATION
308
Table 121:- Population by Religion, Urban and Rural
Area, The Punjab: 1998 Census
(Thousand Persons)
Religion Total Urban Rural
Total 73621 23019 50602
Muslim 71575 22156 49419
Christian 1700 753 947
Ahmadi 181 85 96
Hindu 93 15 78
Scheduled Castes 24 3 21
Others
48 7 41
Source:- Population Census Organization,
Statistics Division,
Government of Pakistan, Islamabad.

POPULATION
309
Table 122:- Disabled Population by Nature of Disability and
Sex, The Punjab: 1998 Census
(Thousand Persons)
Nature of Disability Total Male Female
Disabled-Total 1827 1074 753
Crippled 381 236 145
Blind 155 85 70
Deaf and Dumb 149 85 64
Having more than one
disability
147
78
69
Mentally Retarded 144 78 66
Insane 123 72 51
Other Disability
728 440 288
Source:- Population Census Organization,
Statistics Division,
Government of Pakistan, Islamabad.
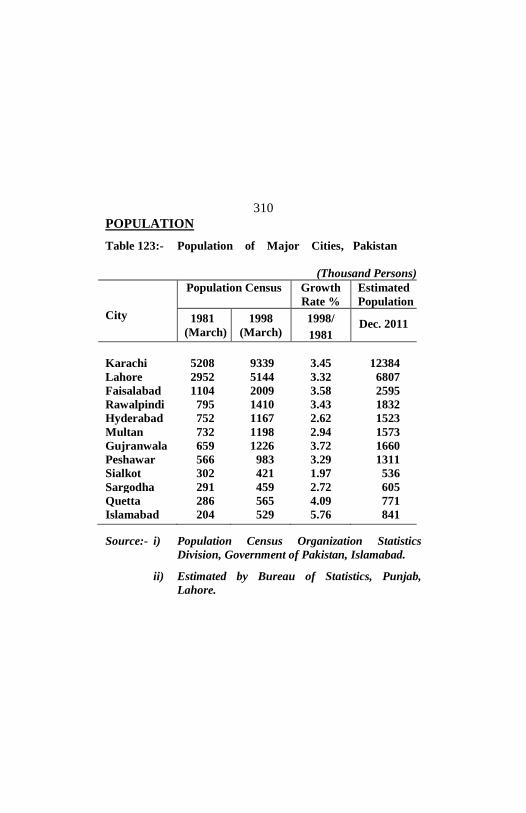
POPULATION
310
Table 123:- Population of Major Cities, Pakistan
(Thousand Persons)
City
Population Census Growth
Rate %
Estimated
Population
1981
(March)
1998
(March)
1998/
1981 Dec. 2011
Karachi 5208 9339 3.45 12384
Lahore 2952 5144 3.32 6807
Faisalabad 1104 2009 3.58 2595
Rawalpindi 795 1410 3.43 1832
Hyderabad 752 1167 2.62 1523
Multan 732 1198 2.94 1573
Gujranwala 659 1226 3.72 1660
Peshawar 566 983 3.29 1311
Sialkot 302 421 1.97 536
Sargodha 291 459 2.72 605
Quetta 286 565 4.09 771
Islamabad 204 529 5.76 841
Source:- i) Population Census Organization Statistics
Division, Government of Pakistan, Islamabad.
ii) Estimated by Bureau of Statistics, Punjab,
Lahore.

PRICES

PRICES
312
Table 124 :- Index Numbers of Wholesale Prices by
Commodity Group, Pakistan
Year
Gene-
ral
Food
Raw
Mate-
rials
Fuel,
Light-
ing &
Lubri-
cants
Manu-
fac-
tures
Build-
ing
Mate-
rials
(Base: 2000-01=100)
2001-02 102.08 102.05 100.95 103.08 101.91 101.81
2002-03 107.77 105.62 115.51 115.95 103.67 102.90
2003-04 116.30 112.99 135.12 119.23 111.83 126.46
2004-05 124.14 125.03 110.44 138.01 113.05 143.79
2005-06 136.68 133.78 121.93 174.57 116.35 144.18
2006-07 146.17 145.68 138.85 184.13 119.92 151.82
2007-08 170.15 173.27 156.57 223.34 128.33 162.18
2008-09 201.10 213.54 184.45 258.96 140.67 213.00
2009-10 226.49 239.01 238.11 296.48 154.94 201.40
Source:- Federal Bureau of Statistics, Karachi.

PRICES
313
Table 125 :- Index Numbers of Wholesale Prices by
Important Commodities (2000-01=100)
Commodity 2008-09 2009-10
Wheat 277.87 300.58
Rice 356.43 317.20
Gram (Whole) 178.85 215.86
Gram (Split) 181.63 161.42
Masoor 350.16 335.31
Mash 153.96 252.57
Moong 166.24 261.58
Vegetable Ghee 254.49 262.63
Sugar refined 142.52 209.50
Spices 193.34 226.21
Cotton 153.12 203.31
Wool 139.70 142.19
Hides 153.34 134.44
Skin 110.10 103.38
Cotton Seed (Raw Material) 242.65 275.47
Mustard & Rapeseed 305.35 282.46
Tobacco 192.88 222.13
Cotton Yarn 101.67 138.40
Cotton Textile 140.87 148.86
Cigarettes 161.01 189.93
Fertilizers 310.97 296.81
Cement 139.03 129.05
Source:- Federal Bureau of Statistics, Karachi.

PRICES
314
Table 126:- Combined Consumer Price Index Numbers by
Commodity Group Pakistan
(Base: 2000-01=100)
Commodity 2007-
08
2008-
09
2009-
10
General
158.90 191.90 214.41
Food, Beverages & Tobacco
174.36 215.69 242.59
Apparel, Textile & Footwear
133.79 152.82 162.49
House Rent
154.48 180.90 205.88
Fuel & Lighting
158.48 198.92 226.90
Household Furniture & Equipment
141.08 159.58 169.76
Transport & Communication
155.47 192.55 204.15
Recreation & Entertainment
107.86 120.00 127.09
Education
140.88 165.27 185.74
Clearing Laundry & Personal
Appearance
138.30
163.17
180.52
Medicine/Medicare 132.23 147.25 157.02 Source:- Federal Bureau of Statistics, Karachi.
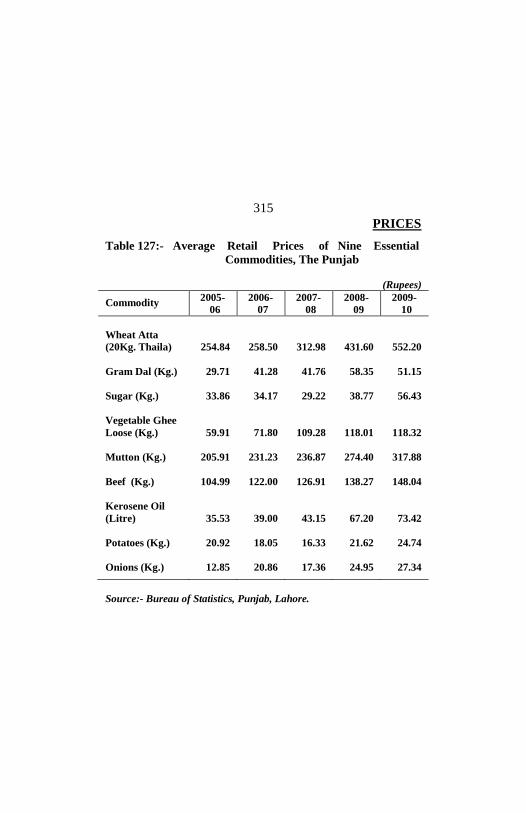
PRICES
315
Table 127:- Average Retail Prices of Nine Essential
Commodities, The Punjab
(Rupees)
Commodity 2005-
06
2006-
07
2007-
08
2008-
09
2009-
10
Wheat Atta
(20Kg. Thaila)
254.84
258.50
312.98
431.60
552.20
Gram Dal (Kg.)
29.71 41.28 41.76 58.35 51.15
Sugar (Kg.)
33.86 34.17 29.22 38.77 56.43
Vegetable Ghee
Loose (Kg.)
59.91
71.80
109.28
118.01
118.32
Mutton (Kg.)
205.91 231.23 236.87 274.40 317.88
Beef (Kg.)
104.99 122.00 126.91 138.27 148.04
Kerosene Oil
(Litre)
35.53
39.00
43.15
67.20
73.42
Potatoes (Kg.)
20.92 18.05 16.33 21.62 24.74
Onions (Kg.)
12.85 20.86 17.36 24.95 27.34
Source:- Bureau of Statistics, Punjab, Lahore.

PRICES
316
Table 128:- Ex-Depot Sale Prices of P.O.L. Items, Pakistan
( Rupees Per Litre) Effective
Dates of Prices Motor
Gassoline HSD Kerosene Oil
01-01-2010 65.11 68.56 60.75
01-02-2010 71.21 71.89 64.07
01-03-2010 70.57 69.89 61.47
01-04-2010 73.14 73.35 64.81
01-05-2010 75.08 76.80 68.89
01-06-2010 69.04 75.72 65.49
01-07-2010 67.95 71.98 65.38
01-08-2010 67.73 73.30 64.85
01-09-2010 67.26 74.60 65.57
01-10-2010 66.99 73.82 65.80
01-11-2010 71.96 78.33 70.95
01-12-2010 71.96 78.33 70.95
01-01-2011 79.67 82.58 74.99
07-01-2011 71.96 78.33 70.95
01-02-2011 80.19 86.09 77.95
04-02-2011 76.58 82.21 74.45
01-04-2011 83.56 92.89 84.01
01-05-2011 88.41 97.31 89.70
01-06-2011 86.71 94.11 84.65
Source:- Hydrocarbon Development Institute of Pakistan, Islamabad.

PRICES
317
Table 129:- Inflation Rates in Pakistan
Year Consumer Price Index Inflation Rate
Based on CPI
(CPI at 2000-01 Base)
2001-02 103.54 3.54
2002-03 106.75 3.10
2003-04 111.63 4.57
2004-05 121.98 9.27
2005-06 131.64 7.92
2006-07 141.87 7.77
2007-08 158.90 12.00
2008-09 191.90 20.77
2009-10 214.41 11.73
Source:- Federal Bureau of Statistics, Karachi.

PRICES
318
Table 130 :- Weekly Exchange Rates of U.S.Dollar - Contd
Year/Month
Date
(Saturday)
Exchange Rates (Rs. Per U.S.Dollar)
Buying (Exports)
Selling (Imports)
2010 July 3rd 85.40 85.60 10th 85.55 85.75 17th 85.50 85.70 24th 85.50 85.70 31st 85.55 85.75 August 7th 85.65 85.85 14th 85.60 85.80 21st 85.60 85.80 28th 85.55 85.75 September 4th 85.50 85.70 11th 85.90 86.10 18th 85.65 85.85 25th 85.70 85.90 October 2nd 86.15 86.35 9th 85.85 86.05 16th 85.85 86.05 23rd 85.80 86.00 30th 85.80 86.00 November 6th 85.60 85.80
13th 85.30 85.50
20th 85.30 85.50
27th 85.40 85.60 December 4th 85.55 85.75
11th 85.65 85.85
18th 85.70 85.90
25th 85.75 85.95

PRICES
319
Table 130 :- Weekly Exchange Rates of U.S.Dollar - Concld Year/Month
Date
(Saturday)
Exchange Rates (Rs. Per U.S.Dollar)
Buying (Exports)
Selling (Imports)
2011 January 1st 85.50 85.70 8th 85.70 85.90 15th 85.60 85.80 22nd 85.75 85.95 29th 85.74 85.84 February 5th 85.40 85.60 12th 85.25 85.40 19th 85.30 85.50 26th 85.45 85.65 March 5th 85.40 85.60 12th 85.20 85.40 19th 85.30 85.50 26th 85.10 85.30 April 3rd (Sunday) 85.15 85.35
8th (Friday) 84.90 85.10 16th 84.10 84.30 23rd 84.15 84.35 30th 84.60 84.80 May 7th 84.65 84.80 14th 84.60 84.80 21st 85.70 85.90 28th 85.70 85.90 June 4th 86.10 86.35 11th 85.75 85.85 18th 85.60 85.80 25th 85.50 85.70 Source:- Daily News paper ‘The Dawn’ Karachi.
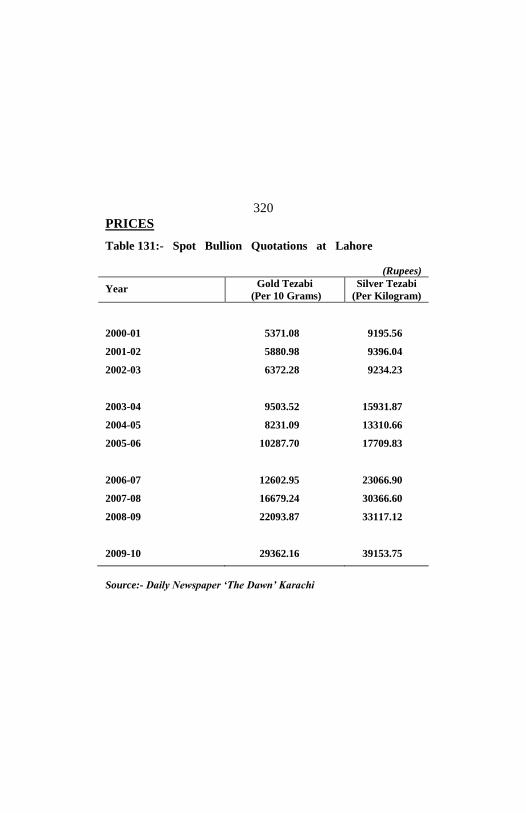
PRICES
320
Table 131:- Spot Bullion Quotations at Lahore
(Rupees)
Year Gold Tezabi
(Per 10 Grams)
Silver Tezabi
(Per Kilogram)
2000-01 5371.08 9195.56
2001-02 5880.98 9396.04
2002-03 6372.28 9234.23
2003-04 9503.52 15931.87
2004-05 8231.09 13310.66
2005-06 10287.70 17709.83
2006-07 12602.95 23066.90
2007-08 16679.24 30366.60
2008-09 22093.87 33117.12
2009-10 29362.16 39153.75
Source:- Daily Newspaper ‘The Dawn’ Karachi
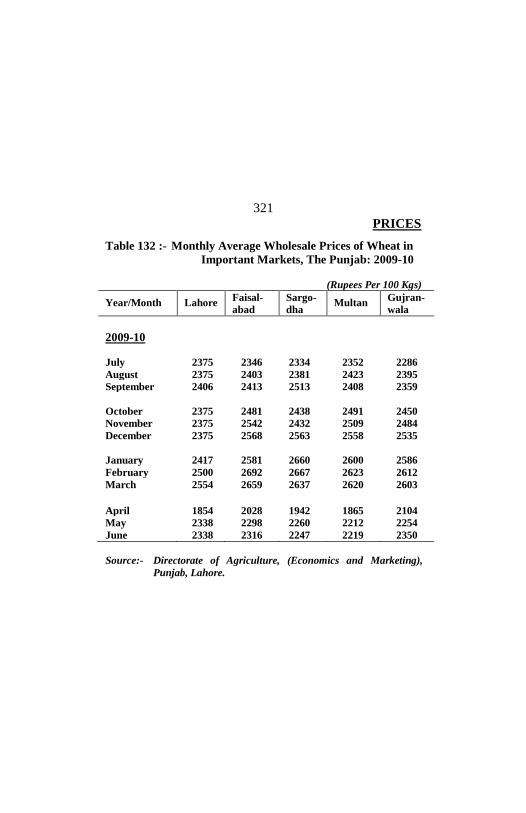
PRICES
321
Table 132 :- Monthly Average Wholesale Prices of Wheat in
Important Markets, The Punjab: 2009-10
(Rupees Per 100 Kgs)
Year/Month Lahore Faisal-
abad
Sargo-
dha Multan
Gujran-
wala
2009-10
July 2375 2346 2334 2352 2286
August 2375 2403 2381 2423 2395
September 2406 2413 2513 2408 2359
October 2375 2481 2438 2491 2450
November 2375 2542 2432 2509 2484
December 2375 2568 2563 2558 2535
January 2417 2581 2660 2600 2586
February 2500 2692 2667 2623 2612
March 2554 2659 2637 2620 2603
April 1854 2028 1942 1865 2104
May 2338 2298 2260 2212 2254
June 2338 2316 2247 2219 2350
Source:- Directorate of Agriculture, (Economics and Marketing),
Punjab, Lahore.
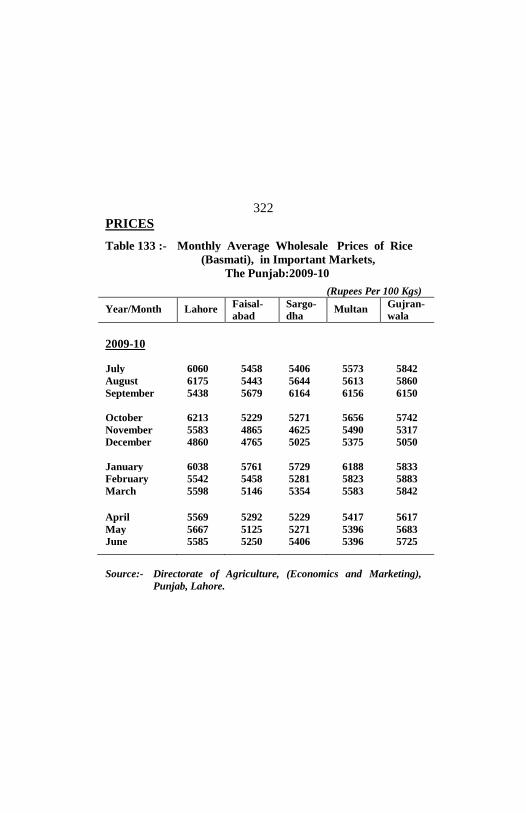
PRICES
322
Table 133 :- Monthly Average Wholesale Prices of Rice
(Basmati), in Important Markets,
The Punjab:2009-10
(Rupees Per 100 Kgs)
Year/Month Lahore Faisal-
abad
Sargo-
dha Multan
Gujran-
wala
2009-10
July 6060 5458 5406 5573 5842
August 6175 5443 5644 5613 5860
September 5438 5679 6164 6156 6150
October 6213 5229 5271 5656 5742
November 5583 4865 4625 5490 5317
December 4860 4765 5025 5375 5050
January 6038 5761 5729 6188 5833
February 5542 5458 5281 5823 5883
March 5598 5146 5354 5583 5842
April 5569 5292 5229 5417 5617
May 5667 5125 5271 5396 5683
June 5585 5250 5406 5396 5725
Source:- Directorate of Agriculture, (Economics and Marketing),
Punjab, Lahore.

PRICES
323
Table 134 :- Monthly Average Wholesale Prices of Gram (Whole) in Important Markets, The Punjab: 2009-10
(Rupees Per 100 Kgs)
Year/Month Lahore Faisal-
abad Sargodha Multan Gujran-
wala
2009-10
July 3646 3401 3322 3487 3675
August 3623 3419 3391 3399 3730
September 3430 3607 3604 2990 3650
October 3440 3163 3131 3189 3667
November 3538 3263 3340 3449 3758
December 3950 3350 3490 3656 3790
January 4371 3915 3971 4016 4075
February 4425 4136 4063 4174 4471
March 4596 4115 4030 4173 4446
April 4567 4252 4188 4357 4671
May 4629 4173 4132 4451 4638
June
4479 4298 4288 4324 4658
Source:- Directorate of Agriculture, (Economics and Marketing),
Punjab, Lahore.

PRICES
324
Table 135 :- Monthly Average Wholesale Prices of Kappas
(American) in Important Markets, The Punjab
(Rupees Per 100 Kgs)
Year/Month Khane-
wal Multan R.Y.
Khan
Baha-
walpur Vehari
2008-09
September 4078 3945 4125 4012 4062
October 3712 3614 3802 3712 3787
November 3625 3474 3594 3584 3642
December 3864 3774 3945 3822 3885
January 4065 3977 4216 4027 4186
February 4012 3926 4123 3997 4136
2009-10
September 4156 4140 4224 4300 4288
October 4522 4427 4572 4608 4488
November 4986 4884 5172 5044 5041
December 5243 5124 5417 5286 5322
January 5351 5285 5586 5428 5613
February 6186 5972 6324 6075 6242
Source:- Directorate of Agriculture, (Economics and Marketing),
Punjab, Lahore.
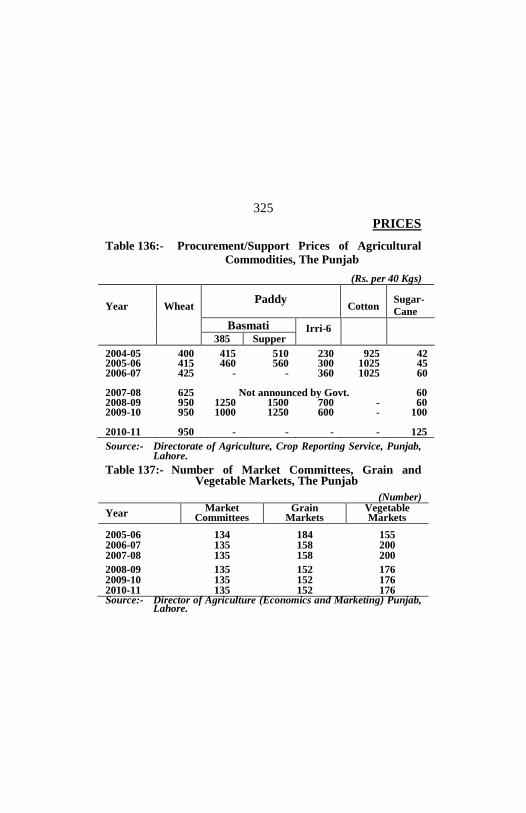
PRICES
325
Table 136:- Procurement/Support Prices of Agricultural
Commodities, The Punjab
(Rs. per 40 Kgs)
Year
Wheat
Paddy
Cotton Sugar-
Cane
Basmati Irri-6
385 Supper 2004-05 400 415 510 230 925 42 2005-06 415 460 560 300 1025 45 2006-07 425 - - 360 1025 60 2007-08 625 Not announced by Govt. 60 2008-09 950 1250 1500 700 - 60 2009-10 950 1000 1250 600 - 100 2010-11 950 - - - - 125 Source:- Directorate of Agriculture, Crop Reporting Service, Punjab, Lahore. Table 137:- Number of Market Committees, Grain and Vegetable Markets, The Punjab
(Number)
Year Market
Committees Grain
Markets Vegetable Markets
2005-06 134 184 155 2006-07 135 158 200 2007-08 135 158 200 2008-09 135 152 176 2009-10 135 152 176 2010-11 135 152 176 Source:- Director of Agriculture (Economics and Marketing) Punjab, Lahore.

PRICES
326
Table 138:- Number of Utility Stores by Urban and
Rural Areas, The Punjab
Period Total Urban Rural
01-06-2004 149 105 44
01-06-2005 166 113 53
01-04-2006 212 134 78
31-12-2006 397 194 203
31-12-2009 3215 919 2296
30-06-2010 2434 727 1707
Source:- Utility Store Corporation of Pakistan (Pvt.) Ltd.,
Islamabad.

PUBLIC FINANCE 327
PUBLIC FINANCE
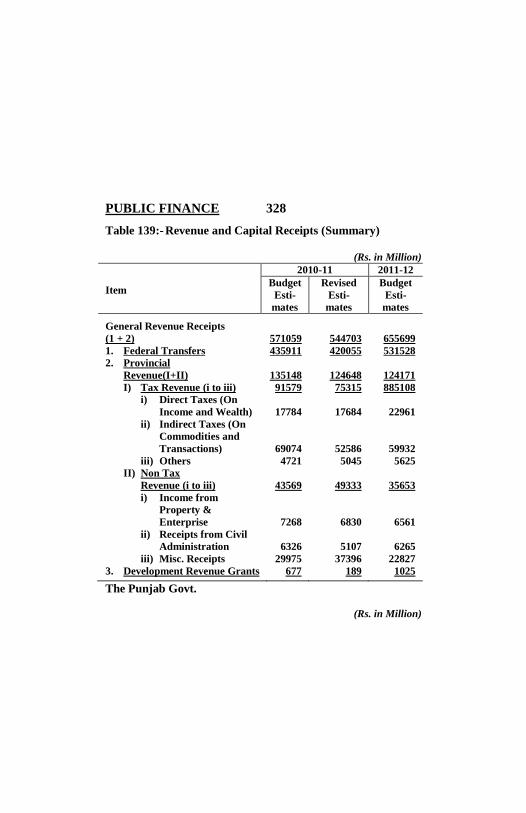
PUBLIC FINANCE 328
Table 139:- Revenue and Capital Receipts (Summary)
(Rs. in Million)
Item
2010-11 2011-12
Budget
Esti-
mates
Revised
Esti-
mates
Budget
Esti-
mates General Revenue Receipts
(1 + 2)
571059
544703
655699
1. Federal Transfers 435911 420055 531528
2. Provincial
Revenue(I+II)
135148
124648
124171
I) Tax Revenue (i to iii) 91579 75315 885108
i) Direct Taxes (On
Income and Wealth)
17784
17684
22961
ii) Indirect Taxes (On
Commodities and
Transactions)
69074
52586
59932
iii) Others 4721 5045 5625
II) Non Tax
Revenue (i to iii)
43569
49333
35653
i) Income from
Property &
Enterprise
7268
6830
6561
ii) Receipts from Civil
Administration
6326
5107
6265
iii) Misc. Receipts 29975 37396 22827
3. Development Revenue Grants
677 189 1025
The Punjab Govt.
(Rs. in Million)

PUBLIC FINANCE 329
Item
2010-11 2011-12
Budget
Esti-
mates
Revised
Esti-
mates
Budget
Esti-
mates
4. Capital Receipts (i+ii) 234647 253966 305235
i) General Capital Receipts
222050 248504 286625
ii) Development Capital
Receipts
12597
5462
18610
Source:- Finance Department, Government of the Punjab, Lahore.

PUBLIC FINANCE 330
Table 140:- Revenue Expenditure (Summary) by Important
(Rs. in Million)
Item
2010-11 2011-12
Budget
Esti-
mates
Revised
Esti-
mates
Budget
Esti-
mates Current Revenue
Expenditure (Net)
365787
374575
404750
1. General Public Service 222146 216462 245735
2. Public Order and Safety
Affairs
63017
64775
69245
3. Economic Affairs 44889 42449 61601
4. Environment Protection 47 59 58
5. Housing and
Community Amenities
3502
2004
2640
6. Health 22000 21870 25485
7. Recreational Culture
and Religion
881
1004
1022
8. Education Affairs and
Services
28885
28301
27141
9. Social Protection 1420 10651 1823
10. Subsidies (21000) (13000) (30000)

PUBLIC FINANCE 331
Heads, The Punjab Govt. – Contd.
(Rs. in Million) Item
2010-11 2011-12 Budget
Esti-mates
Revised Esti-
mates
Budget Esti-
mates Development Revenue Expenditure
100099
81432
127207
Human Rights and Minority Affairs
0
30
20
Law and Parliamentary Affairs 0 12 0 Finance Department 0 0 6445 Board of Revenue 213 33 620 District Governments 9391 18388 9391 TMAs 2609 2792 2609
Regional Planning 2700 300 1900
Cholistan Development Authority 438 321 580
Souther Punjab 2000 103 4131
Agency for Barani Area Dev. 1264 223 489 Services & General Administration Department
20
0
0
Human Resource Management (MPDD)
8
8
0
Planning & Development 1775 436 4952 Police 42 6 0 Jails & Convict Settlement 0 26 0 Home Department 1649 1646 456 Emergency Services 1710 1082 1481 Public Prosecution 2 15 0 Child Protection 0 48 0 Commerce & Investment 140 24 91 Labour Human Resources 61 33 92 Agriculture 2882 1022 2975
Table 140:- Revenue Expenditure (Summary) by Important

PUBLIC FINANCE 332
(Rs. in Million)
Item
2010-11 2011-12 Budget
Esti-mates
Revised Esti-
mates
Budget Esti-
mates Livestock 1753 675 2385 Canal Irrigation 488 364 359 Preservation of Wildlife & Control
86
46
116
Forestry 450 376 344 Fisheries 89 46 290 Food Department 0 33 230 TEVTA 2079 1560 2000 Punjab Small Industry Corporation
206
124
2731
Printing & Stationery 0 0 10 Mines & Mineral 90 28 159 Transport 6311 23 6700 Roads 286 111 50 Communications and Works (Others)
0
0
0
Tourism 130 43 250 Environment Protection Planning
335
101
266
Physical Housing & Planning (Urban Dev.)
7040
5173
8044
Rural Works Programme (LG & CD)
5879
7987
7000
Water Supply, Sewerage & Drainage
9792
10605
10025

PUBLIC FINANCE 333
Heads, The Punjab Govt.– Concld.
(Rs. in Million)
Item
2010-11 2011-12 Budget
Esti-mates
Revised Esti-
mates
Budget Esti-
mates General Hospital Services 11309 10995 16558
Population Welfare Measures 1865 1341 2860
Others ( Other Health Facilities and Preventive Measures)
2134 1067 693
Sports 230 0 26
Information & Culture 167 62 107
Religious Affairs and Aquaf 176 86 120
Information Technology 1002 828 0
Literacy 800 52 750
Universities/Colleges/Institutes (Higher Education)
2998 1855 4440
Special Education 200 3 362
School Education + Danish School
16681 11144 23350
Social Welfare Measures 619 84 325
Zakat & Ushr 0 72 425 Source:- Finance Department, Govt. of the Punjab, Lahore.
Table 141:- Total Capital Disbursements of
The Punjab Government

PUBLIC FINANCE 334
(Rs. in Million)
Item
2010-11 2011-12 Budget
Esti-mates
Revised Esti-
mates
Budget Esti-
mates I. Current Capital Expen-
diture-Total (1 to 7)
222378
271397
305867 1. State Trading in Foodgrains
and Sugar
132174
130079
136734 2. State Trading in Medical
Stores and Coal
19
21
24 3. Loans to Govt. Servants 100 0 100 4. Loans to
Municipalities/Autonomous Bodies etc.
11531
8468
10987 5. Permanent Debt. 0 0 0 6. Floating Debt. 44535 105828 114576 7. Repayment of Loans from
the Federal Government
32019
27001
32446 8. Investment 2000 0 11000 II. Development Capital
Expenditure
95916
57336
92793 1. Irrigation Works 10639 8072 10891 2. Agriculture Implements & Research
146
147
124
3. Town Development 650 287 1200 4. Roads & Bridges 49781 37086 38252 5. Public Buildings 34700 10844 42326 6. Loans to Municipalities/ Abs 0
0
0
Source:- Finance Department, Govt. of the Punjab, Lahore.
Table 142:- Total Size of Annual Development Programmes
and Sources of Financing, The Punjab

PUBLIC FINANCE 335
(Rs. in Million)
Year
Total Size of A.D.P.
Financing
Total (a)
Provin-cial Contri-bution
Federal Grants
Foreign Project Assis-tance
2001-02 B.E. 20130 19500 8932 4000 6568 2002-03 “ 21593 20750 12979 341 7430 2003-04 “ 31357 30500 22200 - 8300 2004-05 “ 44456 43440 34700 - 8740 2005-06 “ 55535 53000 43127 - 9873 2006-07 “ 117125 100000 91124 - 8876 2007-08 “ 150000 150000 142056 45 7899 2008-09 “ 160000 160000 147763 1226 11011 2009-10 “ 175000 148750 135721 2558 10471 2010-11 “ 193500 193500 168226 677 12597 2011-12 220000 220000 200365 1025 18610
a) The gap between the resource availability and the size of the
programme was met by utilization of the Punjab Government’s
cash balance.
Source:- Finance Deptt. Govt. of the Punjab, Lahore.
Table 143:- Sector-wise Annual Development Programme,
(Rs. in Million)
Items
2010-11 2011-12
Original
Allo-
cation
Revised
Allo-
cation
Original
Allo-
cation
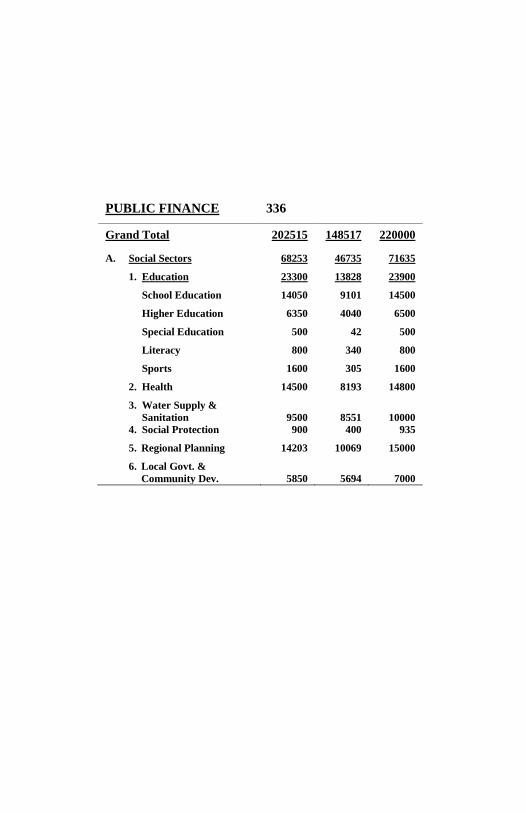
PUBLIC FINANCE 336
Grand Total 202515 148517 220000
A. Social Sectors 68253 46735 71635
1. Education 23300 13828 23900
School Education 14050 9101 14500
Higher Education 6350 4040 6500
Special Education 500 42 500
Literacy 800 340 800
Sports 1600 305 1600
2. Health 14500 8193 14800
3. Water Supply &
Sanitation
9500
8551
10000
4. Social Protection 900 400 935
5. Regional Planning 14203 10069 15000
6. Local Govt. &
Community Dev.
5850
5694
7000
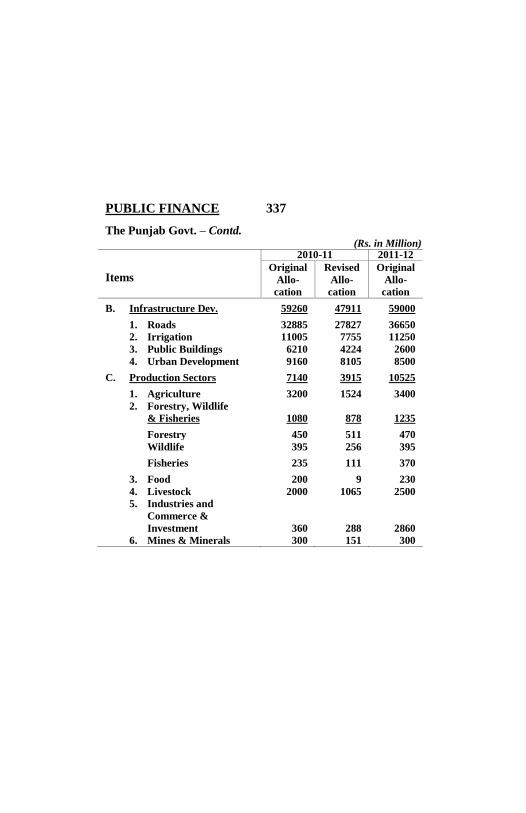
PUBLIC FINANCE 337
The Punjab Govt. – Contd. (Rs. in Million)
Items
2010-11 2011-12
Original
Allo-
cation
Revised
Allo-
cation
Original
Allo-
cation
B. Infrastructure Dev. 59260 47911 59000
1. Roads 32885 27827 36650
2. Irrigation 11005 7755 11250
3. Public Buildings 6210 4224 2600
4. Urban Development 9160 8105 8500
C. Production Sectors 7140 3915 10525
1. Agriculture 3200 1524 3400
2. Forestry, Wildlife
& Fisheries
1080
878
1235
Forestry 450 511 470
Wildlife 395 256 395
Fisheries 235 111 370
3. Food 200 9 230
4. Livestock 2000 1065 2500
5. Industries and
Commerce &
Investment
360
288
2860
6. Mines & Minerals 300 151 300

PUBLIC FINANCE 338
Table 143:- Sector-wise Annual Development Programme
(Rs. in Million)
Items
2010-11 2011-12
Original
Allo-
cation
Revised
Allo-
cation
Original
Allo-
cation
D. Services Sectors 6910 3472 11750
1. Information
Technology
1960
1666
2000
2. Labour & Human
Resource Dev.
85
45
100
3. Transport 1190 233 7300
4. Emergency Service 2000 1310 2100
5. Tourism 1675 218 250 E. Others
6366
2023
5890
1. Environment 335 138 350
2. Information, Culture
& Youth Affairs
295
170
170
3. Religious Affairs &
Auqaf
276
136
150
4. Access to Justice
Programme
50
470
0
5. Planning & Dev. 5195 894 5000
6. Human Rights &
Minority Affairs
215
215
220
The Punjab Govt. – Concld. (Rs. in Million)

PUBLIC FINANCE 339
Items
2010-11 2011-12
Original
Allo-
cation
Revised
Allo-
cation
Original
Allo-
cation Total Core Programme 147929 104056 158800
F. Special Programme 34071 23946 29200
District/TMA Development Programme
12000
12000
12000
District Packages 1450 1450 5500 New Initiatives / Medical Colleges
1500
1500
1500
Special Infrastructure 19121 7473 1200 Extra PFC Grants 0 1523 0 Coal Based Thermal Power Generation
0
0
9000
G. Daanish School System 3000 3000 3000 H. TEVTA/TEVTC 2000 2000 2000 I. DLIs for MDGs 6500 6500 8500 J. Punjab Education
Endowment Fund (PEEF)
2000
2000
2000 K. Punjab Education
Foundation (PEF)
4500
4500
6000 L. Low Income Housing 650 650 1200 M. Population Welfare 1865 1865 2860 N. Companies; FIDMC,
PLDC, SWM, PLDDB, PARB etc.
0
0
6440
Source:- Finance Department, Government of the Punjab, Lahore.
341
ROADS AND ROAD
ACCIDENTS

ROADS AND ROAD ACCIDENTS
342
Table 144:- Metalled Road Length (Actual) by
Authority and Highway Department,
Sr.
No. District Total
National
Highways
Motorway
The Punjab 74097.48 1610.39 387.00 North Zone 32956.63 482.95 329.00
01. Gujranwala 2297.12 69.52 45.50
02. Gujrat 1543.30 61.82 0.00
03. Hafizabad 1142.02 0.00 0.00
04. M. B.Din 1264.15 0.00 0.00
05. Narowal 1049.98 0.00 0.00
06. Sialkot 1997.08 0.00 0.00
07. Lahore 1244.41 48.43 0.00
08. Kasur 1721.37 53.13 0.00
09. Nankana Sahib 1342.67 0.00 0.00
10. Sheikhupura 1287.69 31.80 67.50
11. Rawalpindi 3682.75 97.38 38.00
12. Attock 2100.83 68.54 8.00
13. Chakwal 2549.32 0.00 79.00
14. Jhelum 1311.75 52.33 20.00
15. Sargodha 2918.53 0.00 71.00
16. Bhakkar 2120.03 0.00 0.00
17. Khushab 1702.89 0.00 0.00
18. Mianwali 1680.74 0.00 0.00

ROADS AND ROAD ACCIDENTS
343
Type and District, under National Highway
The Punjab, (As on 30th June, 2010) – Contd.
(Kilometres)
Provincial
Roads
R&B
Sector
Farm to
Market
Roads
Sugar
Cess
Roads
Ex-Distt.
Council
Roads
Sr.
No.
8997.73 5964.09 39029.86 3373.65 14734.76
4802.90 3256.66 16992.41 1164.41 5928.30
247.25 175.65 1481.32 16.66 261.22 01.
241.02 150.67 968.42 26.82 94.55 02.
152.96 0.00 843.32 11.14 134.60 03.
255.96 57.52 694.53 252.30 3.84 04.
152.46 0.00 795.42 0.00 102.10 05.
354.78 112.98 1305.51 30.54 193.27 06. 0
113.60 245.31 343.47 0.00 493.60 07.
203.64 206.19 649.89 209.80 398.72 08.
61.15 261.29 478.87 142.64 398.72 09.
325.38 66.35 496.72 16.60 283.34 10.
600.15 684.27 1618.64 0.00 644.31 11.
240.14 230.62 931.54 0.00 621.99 12.
353.65 91.88 1432.18 0.00 592.61 13.
178.40 20.09 921.73 0.00 119.20 14.
459.53 398.79 1084.82 280.09 624.30 15. 341.36 121.25 1335.21 95.78 226.43 16. 262.85 307.42 878.22 82.04 172.36 17. 258.62 126.38 732.60 0.00 563.14 18.

ROADS AND ROAD ACCIDENTS
344
Table 144:- Metalled Road Length (Actual) by
Authority and Highway Department, Sr.
No. District Total
National
Highways
Motorway
South Zone 41082.85 1127.44 0.00
01. Bahawalpur 2579.87 95.83 0.00 02. Bahawalnagar 2526.56 0.00 0.00 03. R. Y. Khan 4023.69 146.83 0.00
04. D.G.Khan 1699.98 314.94 0.00 05. Layyah 1361.33 0.00 0.00 06. Muzaffargarh 2637.97 42.03 0.00 07. Rajanpur 1729.31 177.05 0.00
08. Faisalabad 3726.73 0.00 0.00
09. Jhang 4132.83 0.00 0.00
10. T.T.Singh 1976.58 0.00 0.00
11. Multan 1972.92 139.53 0.00
12. Khanewal 2203.03 76.67 0.00
13. Lodhran 1471.11 0.00 0.00
14. Vehari 2845.54 0.00 0.00
15. Sahiwal 1808.36 88.55 0.00
16. Okara 2631.17 46.01 0.00
17. Pakpattan 1755.87 0.00 0.00 (Islamabad) 5.00 - 5.00 Pindi Bhattian/
*Faisalabad
53.00
-
53.00

ROADS AND ROAD ACCIDENTS
345
Type and District, under National Highway The Punjab, (As on 30th June, 2010) – Concld.
(Kilometres)
Provincial
Roads
R&B
Sector
Farm to
Market
Roads
Sugar
Cess
Roads
Ex-Distt.
Council
Roads
Sr.
No
4194.83 2707.43 22037.45 2209.24 8806.46
345.28 334.86 1210.41 89.97 503.52 01. 456.88 0.00 1806.90 114.26 148.52 02. 202.31 640.43 2081.53 381.84 570.75 03.
12.47 192.23 993.58 0.00 186.76 04.
255.81 25.76 982.83 28.63 68.30 05. 397.24 104.83 1296.52 60.20 737.15 06.
0.00 245.49 1289.59 17.18 0.00 07.
394.15 261.68 1127.83 534.75 1408.32 08. 584.62 61.23 967.42 304.91 2214.65 09. 299.06 40.36 965.48 223.25 448.43 10.
134.61 123.48 872.65 0.00 702.65 11. 180.57 133.14 1394.80 41.44 376.41 12. 101.10 86.07 962.54 0.00 321.40 13. 319.08 79.58 1845.60 30.21 571.07 14.
118.44 62.24 1231.60 91.03 216.50 15. 195.34 218.11 1869.83 186.46 115.42 16. 197.87 97.94 1138.34 105.11 216.61 17.
(-) (-) (-) (-) (-)
(-) (-) (-) (-) (-)
* District-wise break up not available. Source:- Planning & Design Directorate, Punjab Highway Department, Lahore.

ROADS AND ROAD ACCIDENTS
346
Table 145 :- Road Length by Type under National Highway
Authority and Highway Department, The Punjab (Kilometres)
Year
Total Road* Length
High Type Mo-tor-way
Low Type Roads
Natio-nal High-ways
Pro-vin-cial Roads
Ex-Dis-trict Co-uncil Roads
Farm to Mar-ket Roads
Sugar Cess Roads
2000-01 43998 1610 14067 - 24785 2887 334 315 2001-02 44827 1610 14567 - 25134 2864 334 318 2002-03 60431 1610 14630 10333 30160 3046 334 318 2003-04 65459 1610 14630 12921 32469 3117 387** 325 2004-05 69799 1610 14630 13521 36138 3188 387 325 2005-06 71010 1610 14630 14132 36620 3306 387 325 2006-07 71010 1610 14630 14132 36620 3306 387 325
2007-08 72240 1610 14526 14448 37625 3319 387 325
2008-09 74422 1610 14962 14735 39030 3373 387 325 2009-10 74422 1610 14962 14735 39030 3373 387 325
* Excluding Roads under Local Bodies and Cantonment Boards.
Note:- i) High Type Roads include:- ii) Low Type Roads include:-
1. Granular
1. Black Top 2. Stabilized
2. Concrete 3. Natural Surface
3. Macadam 4. Brick Paved
5. Banked Earth
6. Other Track Way
** Includes 334 Kilometers Lahore – Islamabad Motorway and 53
Kilometers Pindi Bhattian – Faisalabad Motorway. Source:- Planning & Design Directorate, Punjab Highway Department, Lahore.

ROADS AND ROAD ACCIDENTS
347
Table 146:- Expenditure on Construction and Maintenance of
Roads Maintained by Highway Department,
The Punjab
(Rs. in Million)
Year Total Construction Maintenance
2000-01 2518 1494 1024
2001-02 1548 964 584
2002-03 1934 1394 540
2003-04 3978 3515 463
2004-05 11512 10999 513
2005-06 22822 21962 860
2006-07 23603 22753 850
2007-08 15494 14192 1302
2008-09 22559 20844 1715
2009-10 24259 22933 1326
Source:- Chief Engineer Punjab, Highway Department, Lahore.
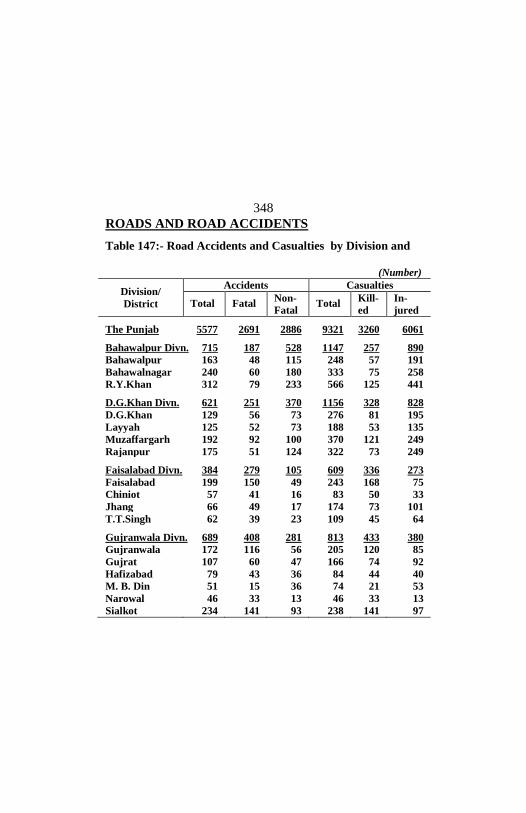
ROADS AND ROAD ACCIDENTS
348
Table 147:- Road Accidents and Casualties by Division and
(Number)
Division/
District
Accidents Casualties
Total Fatal Non-
Fatal Total
Kill-
ed
In-
jured The Punjab 5577 2691 2886 9321 3260 6061 Bahawalpur Divn. 715 187 528 1147 257 890
Bahawalpur 163 48 115 248 57 191
Bahawalnagar 240 60 180 333 75 258
R.Y.Khan 312 79 233 566 125 441 D.G.Khan Divn. 621 251 370 1156 328 828
D.G.Khan 129 56 73 276 81 195
Layyah 125 52 73 188 53 135
Muzaffargarh 192 92 100 370 121 249
Rajanpur 175 51 124 322 73 249 Faisalabad Divn. 384 279 105 609 336 273
Faisalabad 199 150 49 243 168 75
Chiniot 57 41 16 83 50 33
Jhang 66 49 17 174 73 101
T.T.Singh 62 39 23 109 45 64 Gujranwala Divn. 689 408 281 813 433 380
Gujranwala 172 116 56 205 120 85
Gujrat 107 60 47 166 74 92
Hafizabad 79 43 36 84 44 40
M. B. Din 51 15 36 74 21 53
Narowal 46 33 13 46 33 13
Sialkot 234 141 93 238 141 97

ROADS AND ROAD ACCIDENTS
349
District, The Punjab, As on 31st December, 2010
(Number)
Division/ District
Accidents Casualties
Total Fatal Non-Fatal
Total Kill-ed
In-jured
Lahore Divn. 1182 661 521 1810 730 1080 Lahore 751 406 345 1021 428 593 Kasur 153 89 64 305 114 191 Nankana Sahib 50 33 17 72 37 35 Sheikhupura 228 133 95 412 151 261 Multan Divn. 377 204 173 819 290 529 Multan 88 47 41 156 59 97 Khanewal 134 67 67 274 103 171 Lodhran 34 24 10 108 44 64 Vehari 121 66 55 281 84 197 Rawalpindi Divn. 832 321 511 1626 439 1187 Rawalpindi 384 138 246 610 152 458 Attock 155 68 87 300 134 166 Chakwal 149 56 93 351 79 272 Jhelum 144 59 85 365 74 291 Sahiwal Divn. 279 170 109 462 192 270 Sahiwal 101 66 35 162 76 86 Okara 117 71 46 208 80 128 Pakpattan 61 33 28 92 36 56 Sargodha Divn. 498 210 288 879 255 624 Sargodha 263 122 141 469 150 319 Bhakkar 122 36 86 216 42 174 Khushab 57 26 31 131 34 97 Mianwali 56 26 30 63 29 34 Source:- Deputy Inspector General of Police Traffic, Punjab, Lahore.
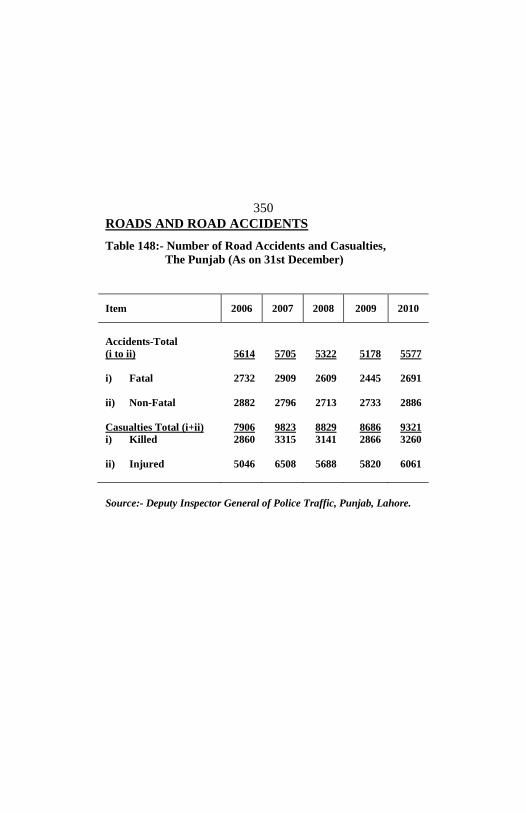
ROADS AND ROAD ACCIDENTS
350
Table 148:- Number of Road Accidents and Casualties,
The Punjab (As on 31st December)
Item 2006 2007 2008 2009 2010
Accidents-Total
(i to ii)
5614
5705
5322
5178
5577
i) Fatal
ii) Non-Fatal
2732
2882
2909
2796
2609
2713
2445
2733
2691
2886
Casualties Total (i+ii) 7906 9823 8829 8686 9321
i) Killed
ii) Injured
2860
5046
3315
6508
3141
5688
2866
5820
3260
6061
Source:- Deputy Inspector General of Police Traffic, Punjab, Lahore.
TRANSPORT
351
TRANSPORT

TRANSPORT
352
Table 149:- Number of Motor Vehicles ‘Registered’
Sr.
No.
Division/
District Total
Motor
Cars
Jeeps &
Station
Wagons
Motor
Cycles
and
Scoo-
ters
Trucks
The Punjab 7483860 1156353 5253715 46545 Bahawalpur Divn. 608179 30175 487125 981
01. Bahawalpur 201168 15638 158300 427
02. Bahawalnagar 104446 2248 78050 78
03. R.Y. Khan 302565 12289 250775 476 D.G. Khan Divn. 379003 11950 276284 721
01. D.G. Khan 233694 4817 167122 240
02. Layyah 50139 3375 38796 32
03. Muzaffargarh 68061 3227 45923 428
04. Rajanpur 27109 531 24443 21
Faisalabad Divn. 793236 79731 612825 4861
01. Faisalabad 603454 75342 469002 4403
02. Chioniot 2184 31 2003 1
03. Jhang 99419 2758 69178 373
04. T.T. Singh 88179 1600 72642 84
Gujranwala Divn. 953565 58876 784397 2413
01. Gujranwala 372733 22340 312069 1304
02. Gujrat 185129 8900 151703 585
03. Hafizabad 25641 253 20759 6
04. M. B. Din 49154 583 42568 12
05. Narowal 18832 149 13411 4
06. Sialkot 302076 26651 243887 502

TRANSPORT
353
by Type, Division and District, The Punjab:
As on 30th June, 2010 – Contd.
Deli-
very
Vans
Buses
Taxis
Auto
Rick-
shaws
Other Vehicles Sr.
No. Tractors Others
102681 72103 18217 175921 652284 6041
4343 2107 410 3697 79124 217
549 832 401 2956 21977 88 01.
305 192 0 589 22860 124 02.
3489 1083 9 152 34287 5 03.
795 518 59 1136 87239 301
123 184 44 506 60522 136 01.
277 51 0 163 7319 126 02.
321 257 5 467 17411 22 03.
74 26 10 0 1987 17 04.
7130 6588 0 21270 60509 322
6487 5418 0 15631 27126 45 01.
0 0 0 47 102 0 02.
537 1092 0 3556 21684 241 03.
106 78 0 2036 11597 36 04.
9803 4712 558 11686 80577 543
2912 1560 212 4312 27702 322 01.
1946 2108 57 3096 16651 83 02.
238 9 0 16 4344 16 03.
97 14 0 829 5029 22 04.
153 17 1 409 4683 5 05.
4457 1004 288 3024 22168 95 06.
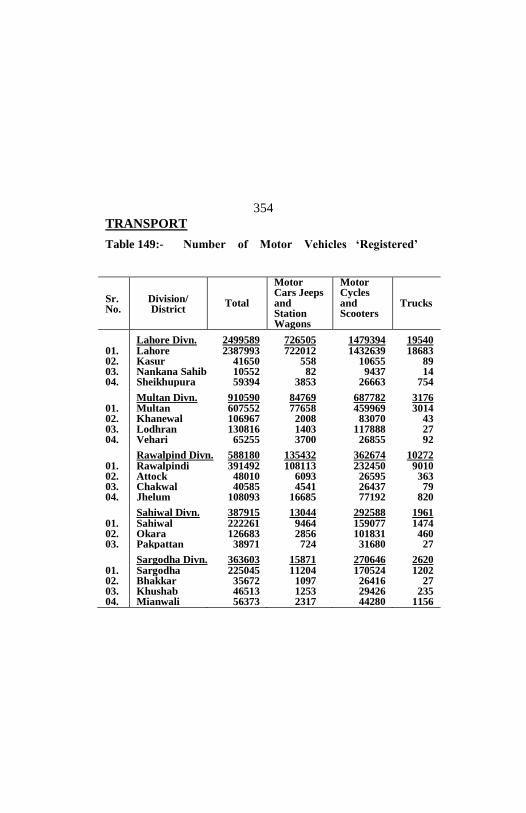
TRANSPORT
354
Table 149:- Number of Motor Vehicles ‘Registered’
Sr. No.
Division/ District
Total
Motor Cars Jeeps and Station Wagons
Motor Cycles and Scooters
Trucks
Lahore Divn. 2499589 726505 1479394 19540 01. Lahore 2387993 722012 1432639 18683 02. Kasur 41650 558 10655 89 03. Nankana Sahib 10552 82 9437 14 04. Sheikhupura 59394 3853 26663 754 Multan Divn. 910590 84769 687782 3176 01. Multan 607552 77658 459969 3014 02. Khanewal 106967 2008 83070 43 03. Lodhran 130816 1403 117888 27 04. Vehari 65255 3700 26855 92 Rawalpind Divn. 588180 135432 362674 10272 01. Rawalpindi 391492 108113 232450 9010 02. Attock 48010 6093 26595 363 03. Chakwal 40585 4541 26437 79 04. Jhelum 108093 16685 77192 820 Sahiwal Divn. 387915 13044 292588 1961 01. Sahiwal 222261 9464 159077 1474 02. Okara 126683 2856 101831 460 03. Pakpattan 38971 724 31680 27 Sargodha Divn. 363603 15871 270646 2620 01. Sargodha 225045 11204 170524 1202 02. Bhakkar 35672 1097 26416 27 03. Khushab 46513 1253 29426 235 04. Mianwali 56373 2317 44280 1156

TRANSPORT
355
by Type, Division and District, The Punjab: As on 30th June,
2010 - Concld.
Deli-
very
Vans
Buses
Taxis
Auto
Rick-
shaws
Other Vehicles Sr.
No. Tractors Others
45875 35233 11789 91903 87372 1978
45094 34132 11789 87541 34220 1883 01. 420 158 0 1747 27983 40 02.
16 4 0 1 988 10 03. 345 939 0 2614 24181 45 04.
7420 5951 890 11410 107769 1423 6713 5846 748 10392 41979 1233 01. 190 27 142 334 21118 35 02. 115 20 0 682 10664 17 03. 402 58 0 2 34008 138 04.
20114 12768 4156 21712 20196 856 16690 11898 4057 6184 2397 693 01.
1118 119 0 5998 7705 19 02. 934 145 94 3654 4680 21 03.
1372 606 5 5876 5414 123 04.
1517 1393 12 1395 75879 126 1168 962 12 514 49520 70 01. 255 396 0 875 19971 39 02. 94 35 0 6 6388 17 03.
5684 2833 343 11712 53619 275 3708 2231 322 5635 30113 106 01. 179 157 0 1646 6121 29 02. 494 307 21 3399 11346 32 03.
1303 138 0 1032 6039 108 04.
Source:- Additional Director General, Excise & Taxation, Punjab
Lahore.

TRANSPORT
356
Table 150 :- Number of Motor Vehicles Registered by Type,
The Punjab (As on 30th June)
Type of Motor Vehicle 2008 2009 2010
Total 5697935 6468737 7483860
1. Motor Cars, Jeeps
and Station Wagons
1026071
1091920
1156353
2. Motor Cycles and
Scooters
3711923
4366154
5253715
3. Trucks 43010 44506 46545
4. Delivery Vans 91932 96201 102681
5. Buses 69991 71341 72103
6. Taxis 17811 17946 18217
7. Auto-Rickshaws 140630 154901 175921
8. Tractors 591484 620283 652284
9. Others 5083 5485 6041 Source:- Additional Director General, Excise & Taxation, Punjab
Lahore.
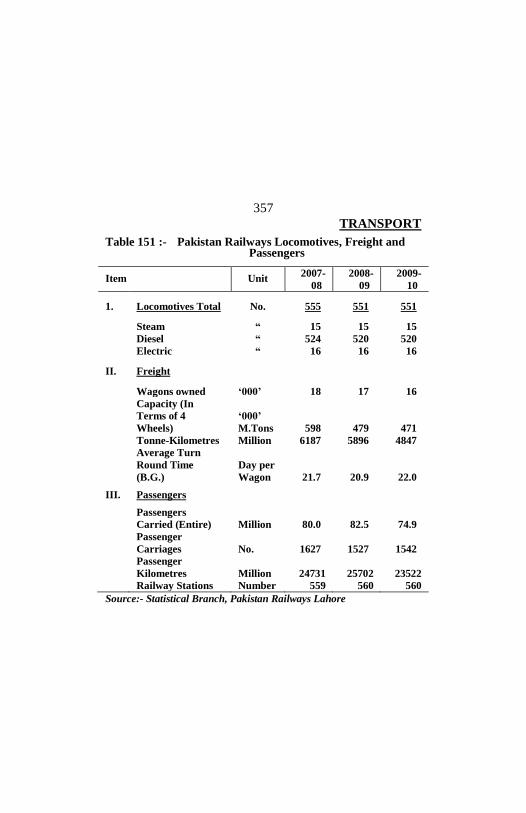
TRANSPORT
357
Table 151 :- Pakistan Railways Locomotives, Freight and Passengers
Item Unit 2007-
08
2008-
09
2009-
10
1. Locomotives Total No. 555 551 551
Steam “ 15 15 15
Diesel “ 524 520 520
Electric “ 16 16 16
II. Freight
Wagons owned ‘000’ 18 17 16
Capacity (In
Terms of 4
Wheels)
‘000’
M.Tons
598
479
471
Tonne-Kilometres Million 6187 5896 4847
Average Turn
Round Time
(B.G.)
Day per
Wagon
21.7
20.9
22.0
III. Passengers
Passengers
Carried (Entire)
Million
80.0
82.5
74.9
Passenger
Carriages
No.
1627
1527
1542
Passenger
Kilometres
Million
24731
25702
23522
Railway Stations Number 559 560 560
Source:- Statistical Branch, Pakistan Railways Lahore
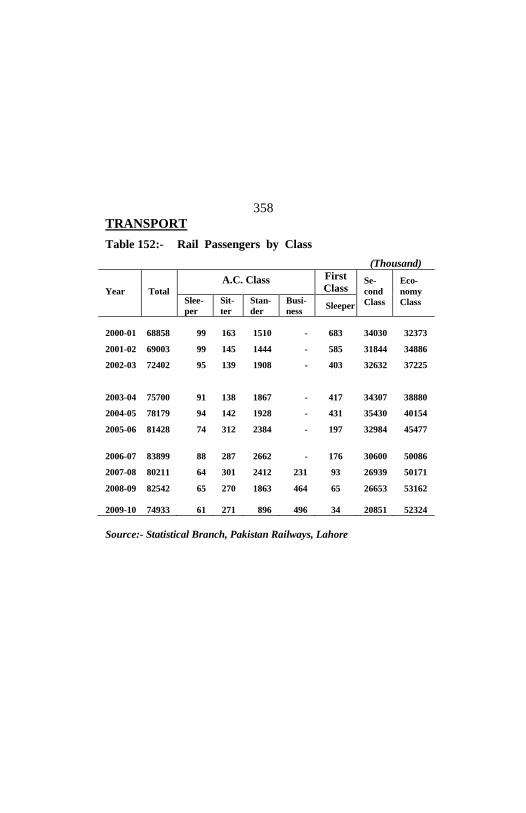
TRANSPORT
358
Table 152:- Rail Passengers by Class
(Thousand)
Year
Total
A.C. Class First
Class Se-
cond
Class
Eco-
nomy
Class Slee-
per
Sit-
ter
Stan-
der
Busi-
ness Sleeper
2000-01 68858 99 163 1510 - 683 34030 32373
2001-02 69003 99 145 1444 - 585 31844 34886
2002-03 72402 95 139 1908 - 403 32632 37225
2003-04 75700 91 138 1867 - 417 34307 38880
2004-05 78179 94 142 1928 - 431 35430 40154
2005-06 81428 74 312 2384 - 197 32984 45477
2006-07 83899 88 287 2662 - 176 30600 50086
2007-08 80211 64 301 2412 231 93 26939 50171
2008-09 82542 65 270 1863 464 65 26653 53162
2009-10 74933 61 271 896 496 34 20851 52324
Source:- Statistical Branch, Pakistan Railways, Lahore

TRANSPORT
359
Table 153 :-Pakistan Railways Passenger and Freight Traffic
Item/Unit 2006-
07
2007-
08
2008-
09
2009-
10
Passenger Traffic
i) Number of
Passengers Carried
by Rail (Million)
84
80
82
75
ii) Passenger
Kilometres
(Million)
26446
24731
25702
23522
iii) Average No. of
Kilometres
Travelled by a
Passenger
315.2
309.0
311.7
313.9
Freight Traffic
i) Metric Tons
Carried by Rail
(Million)
6
7
6
6
ii) Metric Tons Kilo-
metres (Million)
5454
6187
5896
4847
iii) Average Kilo-
metres Travelled
by a Metric Ton
849.0
855.3
850.0
830.6
Source:- Statistical Branch, Pakistan Railways, Lahore

ZAKAT
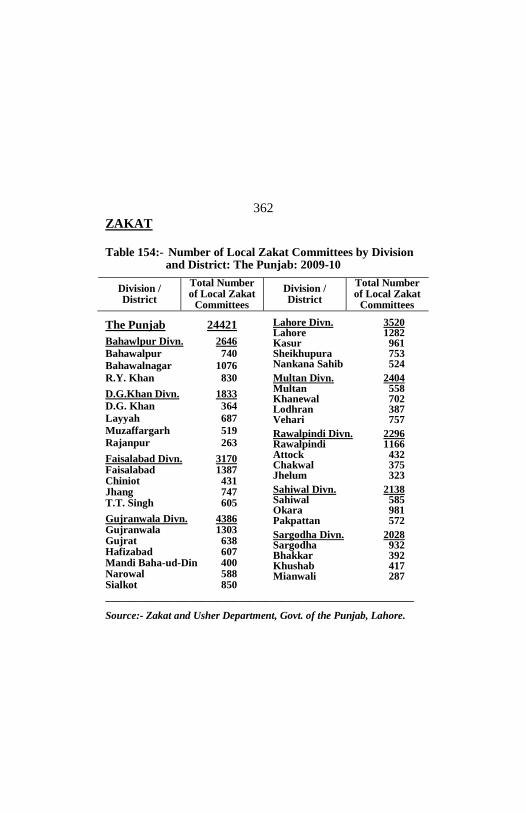
ZAKAT
362
Table 154:- Number of Local Zakat Committees by Division and District: The Punjab: 2009-10
Division / District
Total Number of Local Zakat
Committees
Division / District
Total Number of Local Zakat
Committees
The Punjab 24421 Bahawlpur Divn. 2646
Bahawalpur 740
Bahawalnagar 1076
R.Y. Khan 830 D.G.Khan Divn. 1833
D.G. Khan 364
Layyah 687
Muzaffargarh 519
Rajanpur 263 Faisalabad Divn. 3170 Faisalabad 1387 Chiniot 431 Jhang 747 T.T. Singh 605 Gujranwala Divn. 4386 Gujranwala 1303 Gujrat 638 Hafizabad 607 Mandi Baha-ud-Din 400 Narowal 588 Sialkot 850
Lahore Divn. 3520 Lahore 1282 Kasur 961 Sheikhupura 753 Nankana Sahib 524 Multan Divn. 2404 Multan 558 Khanewal 702 Lodhran 387 Vehari 757 Rawalpindi Divn. 2296 Rawalpindi 1166 Attock 432 Chakwal 375 Jhelum 323 Sahiwal Divn. 2138 Sahiwal 585 Okara 981 Pakpattan 572 Sargodha Divn. 2028 Sargodha 932 Bhakkar 392 Khushab 417 Mianwali 287
__________________________________________________________
Source:- Zakat and Usher Department, Govt. of the Punjab, Lahore.
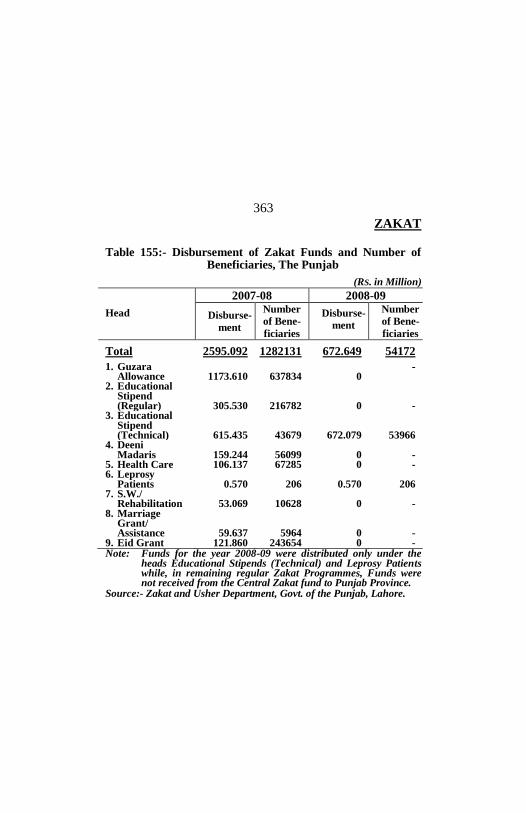
ZAKAT
363
Table 155:- Disbursement of Zakat Funds and Number of Beneficiaries, The Punjab
(RS. in Million)
Head
2007-08 2008-09
Disburse-
ment
Number
of Bene-
ficiaries
Disburse-
ment
Number
of Bene-
ficiaries
Total
2595.092 1282131 672.649 54172
1. Guzara Allowance
1173.610
637834
0
-
2. Educational Stipend
(Regular)
305.530
216782
0
- 3. Educational Stipend
(Technical)
615.435
43679
672.079
53966 4. Deeni Madaris
159.244
56099
0
-
5. Health Care 106.137 67285 0 - 6. Leprosy
Patients
0.570
206
0.570
206 7. S.W./ Rehabilitation
53.069
10628
0
-
8. Marriage Grant/ Assistance
59.637
5964
0
- 9. Eid Grant 121.860 243654 0 - Note: Funds for the year 2008-09 were distributed only under the
heads Educational Stipends (Technical) and Leprosy Patients while, in remaining regular Zakat Programmes, Funds were not received from the Central Zakat fund to Punjab Province.
Source:- Zakat and Usher Department, Govt. of the Punjab, Lahore.
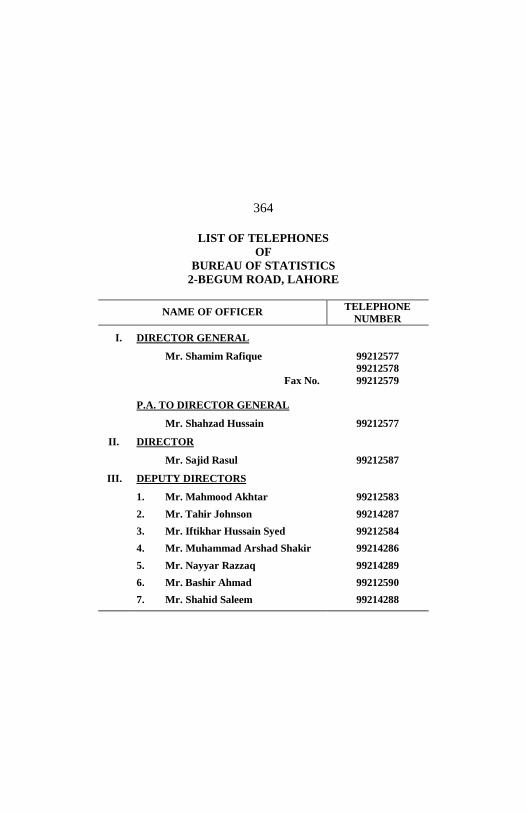
364
LIST OF TELEPHONES
OF
BUREAU OF STATISTICS
2-BEGUM ROAD, LAHORE
NAME OF OFFICER TELEPHONE
NUMBER I. DIRECTOR GENERAL
Mr. Shamim Rafique 99212577
99212578
Fax No.
99212579
P.A. TO DIRECTOR GENERAL
Mr. Shahzad Hussain 99212577
II. DIRECTOR Mr. Sajid Rasul 99212587
III. DEPUTY DIRECTORS
1. Mr. Mahmood Akhtar 99212583
2. Mr. Tahir Johnson 99214287
3. Mr. Iftikhar Hussain Syed 99212584
4. Mr. Muhammad Arshad Shakir 99214286
5. Mr. Nayyar Razzaq 99214289
6. Mr. Bashir Ahmad 99212590
7. Mr. Shahid Saleem 99214288

365
NAME OF OFFICER TELEPHONE
NUMBER
IV. SENIOR SYSTEM ANALYST
Mr. Muhammad Mumtaz Ahmad 99212588
V. ASSISTANT DIRECTOR
Mr. Muhammad Akram Adeeb 99212591
VI. STATISTICAL OFFICERS
1. Mr. Masood Ali
2. Mr. Muhammad Usman
99212589
99212580

366
ADDRESSES/TELEPHONE NUMBERS
OF
BUREAU OF STATISTICS
(FIELD OFFICES)
NAME OF OFFICER TELEPHONE
NUMBER
1. Mr. Zaheer Ahmad,
Assistant Director,
House No. 24, Z-Block, Model Town,
Bahawalnagar.
063-9240045
2. Mr. Mohammad Akhtar Javaid,
Deputy Director,
Tosha Khana Near CDA,
Bahawalpur.
062-9250193
3. Assistant Director,
Ward No.7, Near Ali Hospital,
Mandi Town, Bhakkar.
0453-9200338
4. Mr. Muhammad Saeed Shakir,
Statistical Officer,
Near Sui Gas office,
2nd Floor, P.M.U.Building,
Rawalpindi Road, Chakwal.
0543-554086
5. Mr. Shehzad Kashif Farooq,
Deputy Director,
House No. 394-C,
Kheyaban -e- Sarwar, D.G. Khan.
064-9260356
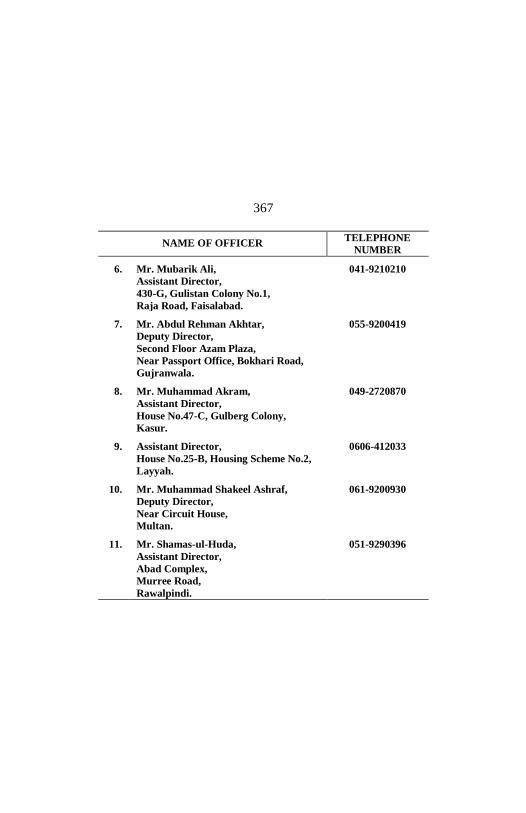
367
NAME OF OFFICER TELEPHONE
NUMBER
6. Mr. Mubarik Ali,
Assistant Director,
430-G, Gulistan Colony No.1,
Raja Road, Faisalabad.
041-9210210
7. Mr. Abdul Rehman Akhtar,
Deputy Director,
Second Floor Azam Plaza,
Near Passport Office, Bokhari Road,
Gujranwala.
055-9200419
8. Mr. Muhammad Akram,
Assistant Director,
House No.47-C, Gulberg Colony,
Kasur.
049-2720870
9. Assistant Director,
House No.25-B, Housing Scheme No.2,
Layyah.
0606-412033
10. Mr. Muhammad Shakeel Ashraf,
Deputy Director,
Near Circuit House,
Multan.
061-9200930
11. Mr. Shamas-ul-Huda,
Assistant Director,
Abad Complex,
Murree Road,
Rawalpindi.
051-9290396
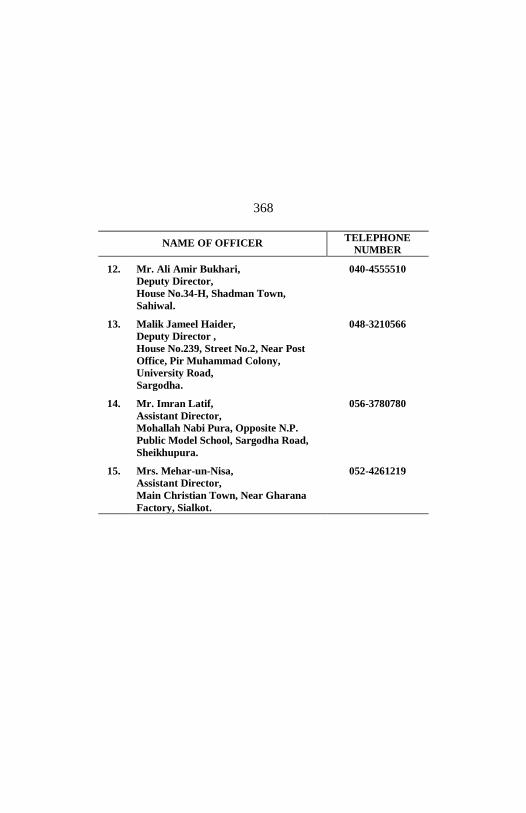
368
NAME OF OFFICER TELEPHONE
NUMBER 12. Mr. Ali Amir Bukhari,
Deputy Director,
House No.34-H, Shadman Town,
Sahiwal.
040-4555510
13. Malik Jameel Haider,
Deputy Director ,
House No.239, Street No.2, Near Post
Office, Pir Muhammad Colony,
University Road,
Sargodha.
048-3210566
14. Mr. Imran Latif,
Assistant Director,
Mohallah Nabi Pura, Opposite N.P.
Public Model School, Sargodha Road,
Sheikhupura.
056-3780780
15. Mrs. Mehar-un-Nisa,
Assistant Director,
Main Christian Town, Near Gharana
Factory, Sialkot.
052-4261219