2011 SOUTH AUSTRALIAN STATE BUDGET IMPACT SURVEYReport 1: Impact on delivery of Government services
20
AISR – Budget impact on delivery of Government Services 1 SOUTH AUSTRALIAN STATE BUDGET IMPACT SURVEY Report 1: Impact on delivery of Government services Ann-Louise Hordacre John Spoehr April 2011 Report prepared for: Public Service Association of South Australia
-
Upload
peter-christopher -
Category
Documents
-
view
213 -
download
0
description
2011 SOUTH AUSTRALIAN STATE BUDGET IMPACT SURVEY Report 1: Impact on delivery of Government services
Transcript of 2011 SOUTH AUSTRALIAN STATE BUDGET IMPACT SURVEYReport 1: Impact on delivery of Government services

AISR – Budget impact on delivery of Government Services 1
SOUTH AUSTRALIAN STATE BUDGET IMPACT SURVEY
Report 1: Impact on delivery of Government services
Ann-Louise Hordacre John Spoehr
April 2011
Report prepared for: Public Service Association of South Australia

AISR – Budget impact on delivery of Government Services i
CONTENTS
KEY FINDINGS AT A GLANCE ....................................................................................................................................... 1
1 INTRODUCTION .................................................................................................................................................. 2
2 METHODOLOGY ................................................................................................................................................. 2
3 SURVEY FINDINGS .............................................................................................................................................. 2
3.1 RESPONDENT CHARACTERISTICS ................................................................................................................................ 2
3.2 WORKPLACE.......................................................................................................................................................... 2
3.3 BUDGET IMPACT .................................................................................................................................................... 4
3.3.1 Level of staff cutbacks ................................................................................................................................... 4
3.3.2 Impact of staff cutbacks on Government services ........................................................................................ 6
3.3.3 Impact of cutbacks on Portfolio areas .......................................................................................................... 9
APPENDIX A: DEMOGRAPHIC PROFILE .......................................................................................................................14
APPENDIX B: DISTRIBUTION OF RESPONDENTS IN PORTFOLIO AREAS AND WORK CHARACTERISTICS ......................15

AISR – Budget impact on delivery of Government Services 1
KEY FINDINGS AT A GLANCE
KEY FINDINGS AT A GLANCE
3,380 members of the PSA of South Australia took part in the survey.
o Respondents were a representative cross-section of PSA members.
o They were currently working an average of 2.7 hours overtime per week, with 85% of all
overtime being unpaid.
More than half the respondents reported that their work unit and/or their agency were inadequately
staffed prior to the announcements in the 2010-11 State Budget.
In more than 80% of cases duties were reallocated amongst existing staff, after staff cutbacks from
work units.
PSA members believe that the negative impact of staff cuts after the 2009-10 State Budget on
Government delivery of community services will be amplified as a result of the 2010-11 Budget.
o This finding is consistent across all Portfolio areas.
As a result of the 2009-10 State Budget:
o 66.0% reported negative impacts on their ability to meet client or community needs
o 64.9% reported negative impacts on the level of service delivery to the community
o 54.4% reported negative impacts on their ability to meet SA Strategic Plan targets
o 54.1% reported negative impacts on the quality of service delivery from their work unit
o 51.1% reported negative impacts on the maintenance of publicly funded infrastructure
After the 20010-11 State Budget:
o 79.0% expected negative impacts on their ability to meet client or community needs
o 78.2% expected negative impacts on the level of service delivery to the community
o 70.8% expected negative impacts on their ability to meet SA Strategic Plan targets
o 69.1% expected negative impacts on the quality of service delivery from their work unit
o 68.6% expected negative impacts on the maintenance of publicly funded infrastructure
AISR – Budget impact on delivery of Government Services 2
1 INTRODUCTION
The South Australian Budget Impact Survey was developed collaboratively with the Public Service Association
(PSA) of South Australia. It consisted of a number of multiple and free response questions exploring the
perceived impact of the South Australian Budget for 2010-11 on the delivery of State Government services to
the community, and the impact on the work quality, workload and work satisfaction of employees.
This report focuses on the perspectives of PSA members on the impact of the State Budget on the delivery of
Government Services. A companion report considers the effects of the State Budget on staff.
2 METHODOLOGY
The survey was tested with a working group of PSA members to ensure questions and response options were
appropriate, and the online survey was free of technical problems. Minor revisions were made to the survey as
a result of feedback from this process. On 1 December 2010, approximately 13,000 PSA members from South
Australian Government funded agencies received an invitation to participate in the survey, with a web-link to
the Survey Monkey site. Two emails were subsequently sent, thanking those who had already participated and
reminding those yet to complete the survey. The survey closed on 22 December 2010.
3 SURVEY FINDINGS
3.1 RESPONDENT CHARACTERISTICS
In total, 3,380 members of the PSA of South Australia1 took part in the survey, representing approximately 26%
of those invited. The gender distribution of survey respondents, eligible PSA members and the entire public
sector is similar, with approximately one-third males and two-thirds females (see Appendix A).
The average age for survey respondents was 48.1 years, very similar to the average age of eligible PSA
members (47.8 years). The negative skew of respondents by age group is consistent with the age profile of
eligible PSA members (see Appendix A). However, the total South Australian Public Sector shows a younger
(and flatter) profile. Only 20.3% of survey respondents (and 22.3% of eligible PSA members) were less than 40
years old, compared to 35.8% of the Public Sector as a whole (noting the Public Sector includes a high number
of teachers, nurses and police who are likely to be members of other unions).
Most respondents (80.9%) reported working primarily in Metropolitan Adelaide, with 16.5% reporting working
mainly in regional areas. Only 0.4% were unable to specify one main location and reported working across
both regional and metropolitan areas. The remaining 2.1% failed to provide a response.
3.2 WORKPLACE
Almost all survey respondents worked in a Government agency, department or health service. The proportion
of respondents usually working in each Government Agency (or Department) is shown in Figure 1. The highest
proportion of respondents came from the Departments of Families and Communities and Health, with 21.7%
and 21.4%, respectively.
1 Tables and figures include all respondents, except where otherwise indicated in a table note.

AISR – Budget impact on delivery of Government Services 3
Figure 1: Government Agency of usual work
Of the 120 respondents who indicated they worked in a Government Business Enterprise or a Statutory
Authority, most common responses were for the Legal Services Commission and WorkCover SA. Twenty-two
enterprises or statutory authorities were listed in the 38 ‘other’ responses. The distribution of respondents
within the different areas of the Justice; Transport, Energy and Infrastructure; Families and Communities;
Trade and Economic Development; and Environment portfolios are shown in Appendix B.
Almost two-thirds of respondents (62.3%) were classified as administrative services officers (ASO). Of the
remainder, the most common employment classifications were operational services officers (OPS) and allied
health professional (AHP) with 12.3% and 8.6% of respondents, respectively, in each classification (see
Appendix B). Most respondents (87.2%) reported they had ongoing employment, while 6.7% reported they
were on contract.
Respondents reported being employed for an average of 37.1 hours per week, and working and average of 2.7
hours overtime per week. Eighty-five percent of this overtime was unpaid. The distribution of paid and unpaid
overtime, by the usual hours the member is employed for reveals that the time spent on paid overtime was
relatively consistent for all categories, the amount of unpaid overtime was higher for those working longer
hours, overall (see Figure 2).
21.7% 21.4%
12.5%9.6% 9.4%
5.4%3.9% 3.7% 3.7% 3.2% 2.1% 0.8% 0.8% 0.5% 0.2% 0.1% 0.2% 0.9%
%
10%
20%
30%Fa
mili
es &
Co
mm
un
itie
s
Hea
lth
Just
ice
Tran
spo
rt, E
ner
gy &
In
fras
tru
ctu
re
Edu
cati
on
& C
hild
ren
's
Serv
ices
Furt
her
Ed
., E
mp
loym
ent,
Sc
ien
ce &
Tec
hn
olo
gy
Trea
sury
& F
inan
ce
Pre
mie
r &
Cab
inet
Envi
ron
men
t
Pri
mar
y In
du
stri
es &
R
eso
urc
es Wat
er
Au
dit
or-
Gen
eral
's
Pla
nn
ing
& L
oca
l G
ove
rnm
ent
Trad
e &
Eco
no
mic
D
evel
op
men
t
Par
liam
ent
or
Elec
tora
te s
taff
Tou
rism
No
ne
of
the
abo
ve
No
res
po
nse
Agency of employment (n=3,258)

AISR – Budget impact on delivery of Government Services 4
Figure 2: Average hours of paid and unpaid overtime by the average hours respondent is employed to work
Administrative work was common for respondents, and also the most common area of work for the work
areas of respondents. One-third of respondents (33.5%) reported usually being engaged in administrative
work, while almost one-quarter worked in units predominantly engaged with administration (see Appendix B).
3.3 BUDGET IMPACT
3.3.1 LEVEL OF STAFF CUTBACKS
More than half the respondents reported that their work unit (57.2%) and/or their agency (56.6%) were
inadequately staffed prior to the announcements in the 2010-11 State Budget (see Figure 3).
Figure 3: Staffing levels for respondent’s unit and agency prior to 2010-11 State Budget
One-half of respondents (51.6%, n= 1744) indicated their work unit had experienced staff cutbacks in the
preceding 12 months, with one-third of these being considered ‘significant cutbacks’. Figure 4 shows that in
more than 80% of cases duties were reallocated amongst existing staff after cutbacks from work units. This
was slightly less common when cutbacks were considered ‘significant’, and if this was the case, duties tended
to be abolished all together. Of those who reported cutbacks in the previous 12 months, three-quarters
believed that these cutbacks were directly attributable to the Budget (see Figure 5).
1.50.9 1.0
1.62.2
5.0
0.90.3 0.3 0.4
0.9
0
1
2
3
4
5
6
0 to 8 hours (n=19)
9 to 16 hours (n=51)
17 to 24 hours
(n=178)
25 to 32 hours
(n=277)
33 to 40 hours
(n=2431)
More than 40 hours
(n=274)
Ho
urs
Hours employed to work
Overtime
Unpaid Paid
28.8%
57.2%
1.2% 3.1%9.7%
17.6%
56.6%
1.9%
14.2%9.7%
%
20%
40%
60%
Yes, adequately staffed
No, inadequately
staffed
Overstaffed Don't know No response
Staffing levels
Your unit Your agency

AISR – Budget impact on delivery of Government Services 5
Figure 4: Reallocation of duties in work units experiencing cutbacks in previous 12 months
Note, 4 respondents provided no response regarding the allocation of duties, these are not included in the figure.
Figure 5: Main reason for staff cutbacks in the work unit
Yes - significant cutbacks (n=500)
Yes - moderate cutbacks (n=611)
Yes - minor cutbacks (n=633)
Other (n=94) 7.4% 5.6% 3.7%
Don't know (n=100) 3.2% 6.1% 7.5%
The duties were reallocated amongst existing staff (n=1458)
80.0% 84.9% 85.7%
The duties were abolished altogether (n=88)
9.4% 3.4% 3.2%
0%
20%
40%
60%
80%
100%
Reallocation of duties (n=1740)
Budget-related, 78.6%
Skill shortage, 2.6%
Efficiency dividend, 3.7%
Reduced number of
staff required to do the
work, 14.7%
No response, 0.3%
Reason for cutbacks (n-1,744)
AISR – Budget impact on delivery of Government Services 6
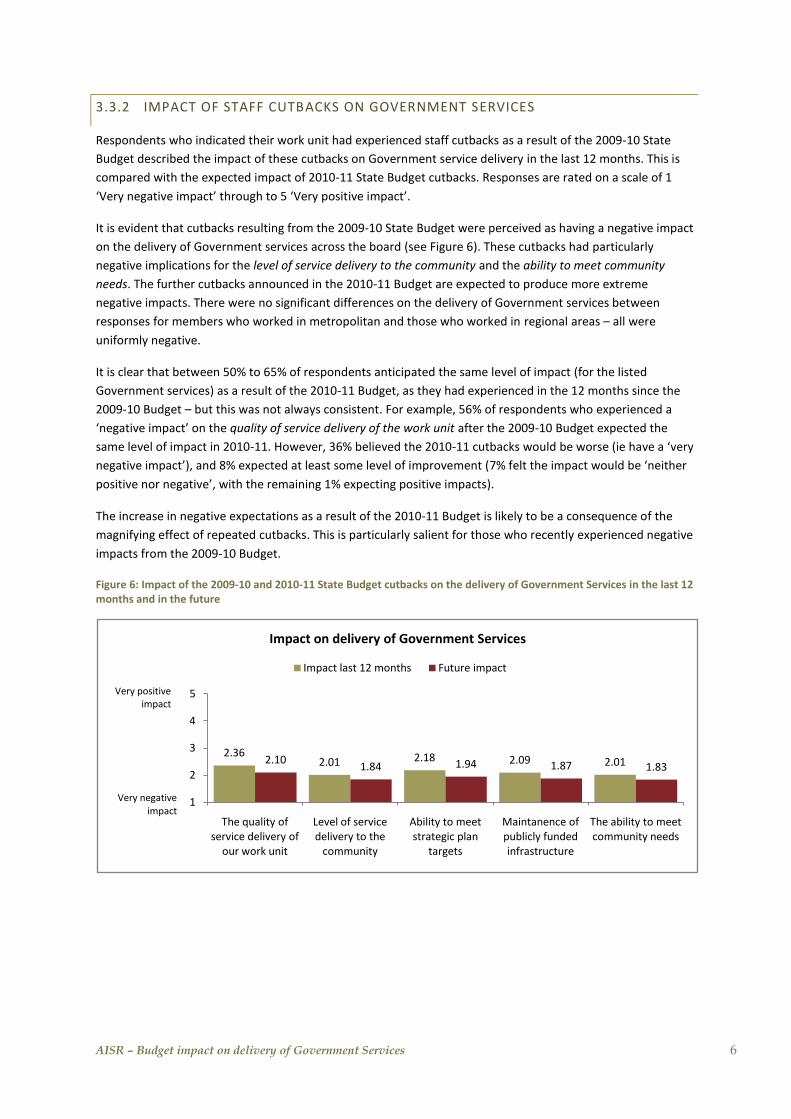
3.3.2 IMPACT OF STAFF CUTBACKS ON GOVERNMENT SERVICES
Respondents who indicated their work unit had experienced staff cutbacks as a result of the 2009-10 State
Budget described the impact of these cutbacks on Government service delivery in the last 12 months. This is
compared with the expected impact of 2010-11 State Budget cutbacks. Responses are rated on a scale of 1
‘Very negative impact’ through to 5 ‘Very positive impact’.
It is evident that cutbacks resulting from the 2009-10 State Budget were perceived as having a negative impact
on the delivery of Government services across the board (see Figure 6). These cutbacks had particularly
negative implications for the level of service delivery to the community and the ability to meet community
needs. The further cutbacks announced in the 2010-11 Budget are expected to produce more extreme
negative impacts. There were no significant differences on the delivery of Government services between
responses for members who worked in metropolitan and those who worked in regional areas – all were
uniformly negative.
It is clear that between 50% to 65% of respondents anticipated the same level of impact (for the listed
Government services) as a result of the 2010-11 Budget, as they had experienced in the 12 months since the
2009-10 Budget – but this was not always consistent. For example, 56% of respondents who experienced a
‘negative impact’ on the quality of service delivery of the work unit after the 2009-10 Budget expected the
same level of impact in 2010-11. However, 36% believed the 2010-11 cutbacks would be worse (ie have a ‘very
negative impact’), and 8% expected at least some level of improvement (7% felt the impact would be ‘neither
positive nor negative’, with the remaining 1% expecting positive impacts).
The increase in negative expectations as a result of the 2010-11 Budget is likely to be a consequence of the
magnifying effect of repeated cutbacks. This is particularly salient for those who recently experienced negative
impacts from the 2009-10 Budget.
Figure 6: Impact of the 2009-10 and 2010-11 State Budget cutbacks on the delivery of Government Services in the last 12 months and in the future
2.362.01 2.18 2.09 2.012.10
1.84 1.94 1.87 1.83
1
2
3
4
5
The quality of service delivery of
our work unit
Level of service delivery to the
community
Ability to meet strategic plan
targets
Maintanence of publicly funded infrastructure
The ability to meet community needs
Impact on delivery of Government Services
Impact last 12 months Future impact
Very negative impact
Very positive impact

AISR – Budget impact on delivery of Government Services 7
Figures 7 through 11 show comparisons of the impact of recent cutbacks alongside anticipated impacts of the
current State Budget. It is noteworthy that whilst perceptions regarding the ‘negative’ impact remain fairly
consistent, there is a marked increase in the proportions rating the impacts as ‘very negative’.
Figure 7: Impact of the 2009-10 and 2010-11 State Budget cutbacks on the quality of service delivery of the work unit in the last 12 months and in the future
Figure 8: Impact of the 2009-10 and 2010-11 State Budget cutbacks on the level of service delivery to the community in the last 12 months and in the future
Figure 9: Impact of the 2009-10 and 2010-11 State Budget cutbacks on the ability to meet SA Strategic Plan targets in the last 12 months and in the future
9.2%
44.9%29.5%
3.3% 0.7%12.3%
23.6%
45.5%
24.7%
2.3% 1.2% 2.6%
0%
20%
40%
60%
80%
100%
Very negative Negative Neither positive nor negative
Positive Very positive Not applicable
The quality of service delivery of the work unit
Impact last 12 months Future impact
25.3%39.6%
17.4%2.4% 1.0%
14.3%
37.7% 40.5%
14.9%1.7% 1.3% 3.8%
0%
20%
40%
60%
80%
100%
Very negative Negative Neither positive nor negative
Positive Very positive Not applicable
Level of service delivery to the community
Impact last 12 months Future impact
17.3%
37.1%24.0%
2.2% 0.7%
18.6%30.2%
40.7%
18.5%
1.6% 1.0%8.1%
0%
20%
40%
60%
80%
100%
Very negative Negative Neither positive nor negative
Positive Very positive Not applicable
Ability to meet strategic plan targets
Impact last 12 months Future impact

AISR – Budget impact on delivery of Government Services 8
Figure 10: Impact of the 2009-10 and 2010-11 State Budget cutbacks on the maintenance of publicly funded infrastructure in the last 12 months and in the future
Figure 11: Impact of the 2009-10 and 2010-11 State Budget cutbacks on the ability to meet client/ community needs in the last 12 months and in the future
21.9%29.1%
21.9%
1.5% 0.9%
24.6%34.3% 34.3%
17.1%1.6% 1.0%
11.8%
0%
20%
40%
60%
80%
100%
Very negative Negative Neither positive nor negative
Positive Very positive Not applicable
Maintenance of publicly funded infrastructure
Impact last 12 months Future impact
24.7%
41.4%
17.0%2.2% 1.0%
13.7%
38.1% 40.9%
14.2%1.9% 1.2% 3.7%
0%
20%
40%
60%
80%
100%
Very negative Negative Neither positive nor negative
Positive Very positive Not applicable
The ability to meet client/community needs
Impact last 12 months Future impact

AISR – Budget impact on delivery of Government Services 9
3.3.3 IMPACT OF CUTBACKS ON PORTFOLIO AREAS
Figure 12 shows the impact of recent cutbacks on the quality of service delivery of the work unit across the
Portfolio areas. Respondents from all Portfolio areas uniformly anticipated an increased level of negative
impacts as a result of the 2010-11 State Budget. This was most marked in the Department of Environment and
Natural Resources, with a significant reduction in rating from 2.30 to 1.83.
Respondents provided examples of how the quality of service delivery will be impacted by cutbacks in their
Portfolios:
Cutting 13.5 positions in the Family Day Care program will have a devastating impact on child care service
provision. The positions are essential training, operational, child protection, finance and management roles.... It
will mean a reduction in service provision as it will be very difficult to recruit, train and support home based
educators.... (Department of Education and Children’s Services)
.... Deterioration of service delivery is already being experienced by the public, by vendors and contractors. Bills not
being paid or not being paid on time, invoices lost, and Agencies managing their finances internally (keeping copies
of everything) while required to use Shared Services - thereby duplicating work... (Auditor-Generals)
Figure 12: Impact of the 2009-10 and 2010-11 State Budget cutbacks on the quality of service delivery of the work unit in the last 12 months and in the future for Portfolio areas
Note, due to low response rates, results are not shown for Parliament or Electorate staff or Tourism. Also note that while responses for Trade and Economic Development are presented they should be viewed with caution due to low Ns.
2.6
0
2.3
7
2.3
0
2.2
9
2.4
1
2.4
0
2.3
0
2.5
3
2.3
3
2.4
8
2.2
0
2.3
5
2.4
9
2.3
0
2.2
4
2.0
6
1.8
3
2.0
3
2.1
0
2.0
7
2.0
7
2.2
4
2.2
4
2.1
9
1.7
5 2.2
2
2.3
4
2.0
7
1
2
3
4
5
Au
dit
or-
Gen
eral
's
Edu
cati
on
an
d
Ch
ildre
n's
Ser
vice
s
Envi
ron
men
t
Fam
ilies
an
d
Co
mm
un
itie
s
Furt
her
Ed
uca
tio
n,
Emp
loym
ent,
Sci
ence
…
Hea
lth
Just
ice
Pla
nn
ing
and
Lo
cal
Go
vern
men
t
Pre
mie
r an
d C
abin
et
Pri
mar
y In
du
stri
es a
nd
R
eso
urc
es
Trad
e an
d E
con
om
ic
Dev
elo
pm
ent
Tran
spo
rt, E
ner
gy a
nd
In
fras
tru
ctu
re
Trea
sury
an
d F
inan
ce
Wat
er
The quality of service delivery of the work unit
Impact last 12 months Future impact
Very negative impact
Very positive impact

AISR – Budget impact on delivery of Government Services 10
PSA members expected further negative impacts to the level of service delivery to the community as a result
of the 2010-2011 State Budget cutbacks - despite starting from a low base due to the 2009-10 cutbacks (see
Figure 13)2. In this case, 25% of all respondents rated a ‘very negative impact’ after the 2009-10 State Budget,
while 38% provided this rating for future impacts.
Respondents provided examples of how the level of service delivery to the community will be impacted by
ongoing cutbacks in their Portfolios:
The ability of the state government to provide an efficient and equitable service to the community (community aged
care) is being steadily eroded leaving a very depleted and demoralised work group to provide increasingly less
services to an increasing number of people. This will lead to more unsafe and poorly serviced / managed situations
in the community especially in the area of complex case management ... (Department for Families and
Communities)
The ability to provide a competitive, quality, educational program on a shoestring budget that relies on the goodwill
of the people delivering the program cannot go on endlessly. (Department of Further Education, Employment,
Science and Technology)
Figure 13: Impact of the 2009-10 and 2010-11 State Budget cutbacks on the level of service delivery to the community in the last 12 months and in the future for Portfolio areas
Note, due to low response rates, results are not shown for Parliament or Electorate staff or Tourism. Also note that while responses for Trade and Economic Development are presented they should be viewed with caution due to low Ns.
2 It should be noted that it is likely that the flatter profile, with smaller differences between the impacts experienced in the
last 12 months and those expected in the future, were the result of a ‘floor effect’. This occurs when responses accumulate at the bottom of a rating scale (ie respondents could not provide a value of less than 1).
2.1
3
2.1
6
1.9
2
1.8
3 2.2
3
1.9
7
2.0
2
2.0
6
2.1
4
1.9
8
2.2
5
2.1
1
2.2
8
1.9
1
2.0
0
1.8
0
1.6
9
1.7
1
1.7
9
1.8
4
1.9
1
1.9
5
1.8
3
1.9
9
2.0
0
1.9
4
2.1
7
1.8
8
1
2
3
4
5
Au
dit
or-
Gen
eral
's
Edu
cati
on
an
d
Ch
ildre
n's
Ser
vice
s
Envi
ron
men
t
Fam
ilies
an
d
Co
mm
un
itie
s
Furt
her
Ed
uca
tio
n,
Emp
loym
ent,
Sci
ence
…
Hea
lth
Just
ice
Pla
nn
ing
and
Lo
cal
Go
vern
men
t
Pre
mie
r an
d C
abin
et
Pri
mar
y In
du
stri
es a
nd
R
eso
urc
es
Trad
e an
d E
con
om
ic
Dev
elo
pm
ent
Tran
spo
rt, E
ner
gy a
nd
In
fras
tru
ctu
re
Trea
sury
an
d F
inan
ce
Wat
er
Level of service delivery to the community
Impact last 12 months Future impact
Very negative impact
Very positive impact

AISR – Budget impact on delivery of Government Services 11
The South Australian Government’s Strategic Plan provides a “blueprint for our prosperity and wellbeing, to
deliver a society where health, equality, safety, enterprise and creativity underpin a quality of life that is the
envy of the world.”3 Government Departments and staff are charged with meeting the targets outlined in the
plan. However, PSA members believe that the staff cutbacks announced in the 2010-11 will further impact
their ability to meet Strategic Plan targets (see Figure 14).
Lack of services to the community in general. Strategic Plans for increasing Education and Employment will not be
able to be met with the lack of staff. (Department of Further Education, Employment, Science and Technology)
Most of our work programs aligned with biodiversity conservation are deeply affected by the budget, this is
fundamentally flawed in view of the corporate strategic plans objectives (Department of Environment and Natural
Resources)
.... The reason the community is positively affected and maintenance budgets are negatively affected is that
stations (in areas in decline and where services can be offered from a nearby station) will remain open. Budgets are
stretched to maintain these facilities and opportunities to meet strategic targets e.g. reducing energy efficiency
administrative costs cannot be realised. (Department of Justice)
Figure 14: Impact of the 2009-10 and 2010-11 State Budget cutbacks on the ability to meet SA Strategic Plan targets in the last 12 months and in the future for Portfolio areas
Note, due to low response rates, results are not shown for Parliament or Electorate staff or Tourism. Also note that while responses for Trade and Economic Development are presented they should be viewed with caution due to low Ns.
3 http://www.saplan.org.au/plan-2010
2.3
3
2.1
9
2.1
4
2.0
9
2.2
9
2.1
8
2.1
5
2.4
4
2.2
1
2.1
7
2.4
0
2.2
5
2.4
2
2.0
7
2.0
0
1.8
7
1.8
8
1.8
8
1.8
8
1.9
0
1.9
7
2.0
5
2.0
1
2.0
7
1.9
2
2.0
3
2.1
7
1.9
5
1
2
3
4
5
Au
dit
or-
Gen
eral
's
Edu
cati
on
an
d
Ch
ildre
n's
Ser
vice
s
Envi
ron
men
t
Fam
ilies
an
d
Co
mm
un
itie
s
Furt
her
Ed
uca
tio
n,
Emp
loym
ent,
Sci
ence
…
Hea
lth
Just
ice
Pla
nn
ing
and
Lo
cal
Go
vern
men
t
Pre
mie
r an
d C
abin
et
Pri
mar
y In
du
stri
es a
nd
R
eso
urc
es
Trad
e an
d E
con
om
ic
Dev
elo
pm
ent
Tran
spo
rt, E
ner
gy a
nd
In
fras
tru
ctu
re
Trea
sury
an
d F
inan
ce
Wat
er
Ability to meet Strategic Plan targets
Impact last 12 months Future impact
Very negative impact
Very positive impact

AISR – Budget impact on delivery of Government Services 12
Respondents from all Portfolio areas expressed the belief that the maintenance of publicly funded
infrastructure would be further negatively impacted by the cutbacks outlined in the 2010-11 State Budget (see
Figure 15). Respondents did not consider these to be abstract nor intangible, and commented on how short-
term budgetary gains produce substantial and long-term problems for the state.
While capital project funding is at a very high level, operating budget for maintenance of existing infrastructure is
reducing causing significant degradation of infrastructure (roads are rougher, it takes longer to repair jetties,
bridges etc) (Department for Transport, Energy and Infrastructure)
The government must remember that cutting prison infrastructure will place more crims on the street that in the
long turn will negate any savings from budget cuts due to resources being used to apprehend them and the social
impact on the community ... (Department of Justice)
.... Cutbacks to monitoring networks will mean that future research will be severely hampered by data gaps. By not
maintaining the existing infrastructure this will cause additional future expense when it is realised that these
monitoring networks are a valuable resource that are required for good and meaningful research. (Department for
Water)
Figure 15: Impact of the 2009-10 and 2010-11 State Budget cutbacks on the maintenance of publicly funded infrastructure in the last 12 months and in the future for Portfolio areas
Note, due to low response rates, results are not shown for Parliament or Electorate staff or Tourism. Also note that while responses for Trade and Economic Development are presented they should be viewed with caution due to low Ns.
2.2
5
2.1
2
1.9
4
1.9
8
2.2
2
2.0
6
2.0
9 2.6
7
2.1
2
2.0
0
2.0
0
2.2
2
2.3
9
2.1
4
2.0
0
1.8
2
1.7
3
1.8
5
1.7
9
1.8
1
1.9
2 2.4
0
1.9
0
1.9
6
1.6
7
1.9
0
2.2
0
2.0
0
1
2
3
4
5
Au
dit
or-
Gen
eral
's
Edu
cati
on
an
d
Ch
ildre
n's
Ser
vice
s
Envi
ron
men
t
Fam
ilies
an
d
Co
mm
un
itie
s
Furt
her
Ed
uca
tio
n,
Emp
loym
ent,
Sci
ence
…
Hea
lth
Just
ice
Pla
nn
ing
and
Lo
cal
Go
vern
men
t
Pre
mie
r an
d C
abin
et
Pri
mar
y In
du
stri
es a
nd
R
eso
urc
es
Trad
e an
d E
con
om
ic
Dev
elo
pm
ent
Tran
spo
rt, E
ner
gy a
nd
In
fras
tru
ctu
re
Trea
sury
an
d F
inan
ce
Wat
er
Maintenance of publicly funded infrastructure
Impact last 12 months Future impact
Very negative impact
Very positive impact

AISR – Budget impact on delivery of Government Services 13
Portfolio areas work with and respond to client and community needs in different ways. Whilst all Portfolios
report that they have experienced negative impacts from the 2009-10 State Budget and are expecting further
negative impacts from the 2010-11 Budget, staff from the Department for Families and Communities and the
Department of Health expected particularly poor outcomes from staff cutbacks to programs.
They are cutting the Anti Poverty Program for outside clients, therefore only working with Families SA clients.... This
will have a very negative impact on the general community as the non government agencies will have to take on
OUR work load and they already cannot meet all the community’s needs. There are many people out there who are
vulnerable to enter our system, the Antipoverty Team have done a lot of preventative work to prevent some families
entering our department. (Department for Families and Communities)
Impact on the ability to respond to the community needs will lead to increase in isolation, health problems,
challenging behaviours in children, increased child protection notifications etc. and no funds to continue with
community early interventions that are adaptable to the community's specific needs. (Department of Health)
Figure 16: Impact of the 2009-10 and 2010-11 State Budget cutbacks on the ability to meet client/ community needs in the last 12 months and in the future for Portfolio areas
Note, due to low response rates, results are not shown for Parliament or Electorate staff or Tourism. Also note that while responses for Trade and Economic Development are presented they should be viewed with caution due to low Ns.
2.2
1
2.1
1
1.8
6
1.7
9 2.1
9
2.0
4
2.0
3
2.2
9
2.1
5
2.0
6
2.2
0
2.1
3
2.2
2
1.9
3
2.0
5
1.8
0
1.6
8
1.6
8
1.8
4
1.8
1
1.9
0
2.0
0
1.9
0
1.9
3
1.7
5
1.9
0
2.2
1
1.9
3
1
2
3
4
5
Au
dit
or-
Gen
eral
's
Edu
cati
on
an
d
Ch
ildre
n's
Ser
vice
s
Envi
ron
men
t
Fam
ilies
an
d
Co
mm
un
itie
s
Furt
her
Ed
uca
tio
n,
Emp
loym
ent,
Sci
ence
…
Hea
lth
Just
ice
Pla
nn
ing
and
Lo
cal
Go
vern
men
t
Pre
mie
r an
d C
abin
et
Pri
mar
y In
du
stri
es a
nd
R
eso
urc
es
Trad
e an
d E
con
om
ic
Dev
elo
pm
ent
Tran
spo
rt, E
ner
gy a
nd
In
fras
tru
ctu
re
Trea
sury
an
d F
inan
ce
Wat
er
The ability to meet client/ community needs
Impact last 12 months Future impact
Very negative impact
Very positive impact

AISR – Budget impact on delivery of Government Services 14
APPENDIX A: DEMOGRAPHIC PROFILE
Figure A 1: Gender distribution of survey respondents compared to eligible PSA members and the total SA Public Sector
Source Public Sector data: Table 3. 4
,5
Figure A 2: Age distribution of respondents compared to eligible PSA members and the total SA Public Sector
Source Public Sector data: Table 3.5
4 Proportions presented for demographic questions include eligible responses only.
5 Commissioner for Public Sector Employment. (2009). South Australian Public Sector Workforce Information, June 2009:
Government of South Australia
64.2%
35.8%
65.9%
34.1%
65.7%
34.3%
%
20%
40%
60%
80%
Female Male
Gender
Survey Eligible PSA members Public sector (total)
1.0%
3.8%
7.5%8.0%
11.7%
15.9%
22.2%
19.4%
9.1%
1.4%
0.1%
1.6%
4.5%
7.5% 8.6%
12.2%
15.2%
19.8%
18.8%
9.6%
2.1%
0.6%
4.9%
9.3% 9.9%11.1%
12.4%14.7%
16.1%
13.1%
6.2%
1.6%
0%
5%
10%
15%
20%
25%
15 to 19 20 to 24 25 to 29 30 to 34 35 to 39 40 to 44 45 to 49 50 to 54 55 to 59 60 to 64 65 and over
Age group
Survey PSA member Public Sector

AISR – Budget impact on delivery of Government Services 15
APPENDIX B: DISTRIBUTION OF RESPONDENTS IN PORTFOLIO AREAS AND WORK
CHARACTERISTICS
Figure A 3: Government Business Enterprise or Statutory Authority of usual work
Figure A 4: Area of employment: Justice portfolio
11.7% 11.7%7.5% 7.5% 5.8% 4.2% 4.2%
1.7% 0.8%
31.7%
13.3%
%
10%
20%
30%
40%
Legal Services Comm.
WorkCover SA
SA Water EPA Lotteries Comm
Forestry SA SACE Board Adelaide Festival
Centre Trust
HomeStart Finance
Other No response
Enterprise or statutory authority (n=120)
35.4%
24.3%
16.0%11.8%
3.9% 3.7% 1.7% 1.0% 0.2% 2.0%
%
10%
20%
30%
40%
Dep
artm
ent
of
Co
rrec
tio
nal
Ser
vice
s
Att
orn
ey-G
ener
al's
D
epar
tmen
t
SA P
olic
e
Co
urt
s A
dm
inis
trat
ion
A
uth
ori
ty
SA F
ire
and
Em
erge
ncy
Se
rvic
es C
om
mis
sio
n
Co
un
try
Fire
Ser
vice
Stat
e Em
erge
ncy
Ser
vice
SA M
etro
po
litan
Fir
e Se
rvic
e
Elec
tora
l Co
mm
issi
on
of
SA
No
res
po
nse
Justice portfolio (n=407)

AISR – Budget impact on delivery of Government Services 16
Figure A 5: Area of employment: Transport, Energy & Infrastructure portfolio
Figure A 6: Area of employment: Families & Communities portfolio
Figure A 7: Area of employment: Trade & Economic Development portfolio
Figure A 8: Area of employment: Environment portfolio
Figure A 9: Current employment classification
Figure A 10: Current employment status
99.4%
0.6%%
20%
40%
60%
80%
100%
Department of Transport, Energy and
Infrastructure
TransAdelaide
Transport, Energy and Infrastructure portfolio (n=312)
44.4%
19.8%
34.9%
0.1% 0.8%%
10%
20%
30%
40%
50%
Department for Families
and Communities
Housing SA Families SA Disabilities SA
No response
Families and Communities portfolio (n=708)
93.3%
6.7%
%
20%
40%
60%
80%
100%
Department of Trade and Economic Development
Defence SA
Trade and Economic Development portfolio (n=15)
88.4%
10.7%0.8%
%
20%
40%
60%
80%
100%
Department of Environment and Natural Resources
Environment Protection Authority
No response
Environment portfolio (n=121)
ASO62.3%
OPS12.3%
AHP8.6%
Other14.3%
No response
2.5%
Employment classification
Ongoing87.2%
Temporary1.3%
Contract6.7%
Casual0.3%
No response
4.4%
Employment status

AISR – Impact on delivery of Government Services 17
Figure A 11: Description of the usual nature of respondents work and the work usually undertaken by their work unit
33.5%
9.6%
7.0%5.9%
4.5% 4.5% 4.0% 3.6% 3.3% 2.6% 2.0% 2.0% 1.7% 1.4% 1.0% 1.4%
3.9%
8.2%
23.0%
11.5%
3.3%
10.2%
4.1%5.9%
4.1%3.1%
6.4%
3.9%
2.0% 2.0% 1.7% 2.1% 1.5% 1.4%
5.0%
8.8%
0%
10%
20%
30%
40%
Usual nature of your work Usual nature of work in your work unit

AISR – Impact on delivery of Government Services 18