©2011 PRESIDENT AND FELLOWS OF HARVARD COLLEGE A CHALLENGING AND TURBULENT TIME NeighborWorks...
26
©2011 PRESIDENT AND FELLOWS OF HARVARD COLLEGE A CHALLENGING AND TURBULENT TIME NeighborWorks Homeownership Symposium Eric Belsky February 2012 1
-
Upload
frederick-chase -
Category
Documents
-
view
215 -
download
0
Transcript of ©2011 PRESIDENT AND FELLOWS OF HARVARD COLLEGE A CHALLENGING AND TURBULENT TIME NeighborWorks...
© 2 0 1 1 P R E S I D E N T A N D F E L L O W S O F H A R V A R D C O L L E G E
1
A CHALLENGING AND TURBULENT TIME
NeighborWorks Homeownership Symposium
Eric Belsky
February 2012
© 2 0 1 1 P R E S I D E N T A N D F E L L O W S O F H A R V A R D C O L L E G E
2
A CHALLENGING TIME

© 2 0 1 1 P R E S I D E N T A N D F E L L O W S O F H A R V A R D C O L L E G E
Enormous Amounts of Home Equity Have Been Destroyed
3
Note: Dollar values are adjusted for inflation by the CPI-U for All Items. Sources: Federal Reserve Board, Flow of Funds, Balance sheet tables.
19
70
:31
97
1:3
19
72
:31
97
3:3
19
74
:31
97
5:3
19
76
:31
97
7:3
19
78
:31
97
9:3
19
80
:31
98
1:3
19
82
:31
98
3:3
19
84
:31
98
5:3
19
86
:31
98
7:3
19
88
:31
98
9:3
19
90
:31
99
1:3
19
92
:31
99
3:3
19
94
:31
99
5:3
19
96
:31
99
7:3
19
98
:31
99
9:3
20
00
:32
00
1:3
20
02
:32
00
3:3
20
04
:32
00
5:3
20
06
:32
00
7:3
20
08
:32
00
9:3
20
10
:32
01
1:3
02468
1012141618
Home equity Mortgage debt
Trillions of 2011 dollars
Recent home equity decline takes us
back to 1984 levels

© 2 0 1 1 P R E S I D E N T A N D F E L L O W S O F H A R V A R D C O L L E G E
More than 11 Million Mortgaged Homeowners Are Underwater
Source: CoreLogic
Share of Mortgaged HomeownersUnderwater in 2011:3
Less than 10 Percent
10 - 25 Percent
25 - 33 Percent
Greater than 33 Percent (up to 58)
No Data

© 2 0 1 1 P R E S I D E N T A N D F E L L O W S O F H A R V A R D C O L L E G E
5
Unemployment Rate Remains Elevated
2000 2001 2002 2003 2004 2005 2006 2007 2008 2009 2010 20110
1
2
3
4
5
6
7
8
9
10
11
3.9
5.7 6.0 5.7 5.44.9
4.45.0
7.3
9.99.4
8.5
Unemployment rate (Percent)
Note: Unemployment rates are seasonally-adjusted and for the month of December. Source: Bureau of Labor Statistics.

© 2 0 1 1 P R E S I D E N T A N D F E L L O W S O F H A R V A R D C O L L E G E
6
Disparities in Unemployment By Age and Race Are Large
Source: Moody’s Economy.com and Bureau of Labor Statistics, Current Population Survey.
16 to 24 25 to 34 35 to 44 45 to 540
5
10
15
20
25
30
15.9
9.06.8 6.5
18.1
9.8 9.1 9.9
27.3
17.4
12.49.7
All Races Hispanic or Latino Black or African American
Age Categories
Unemployment Rate, 2011:4
© 2 0 1 1 P R E S I D E N T A N D F E L L O W S O F H A R V A R D C O L L E G E
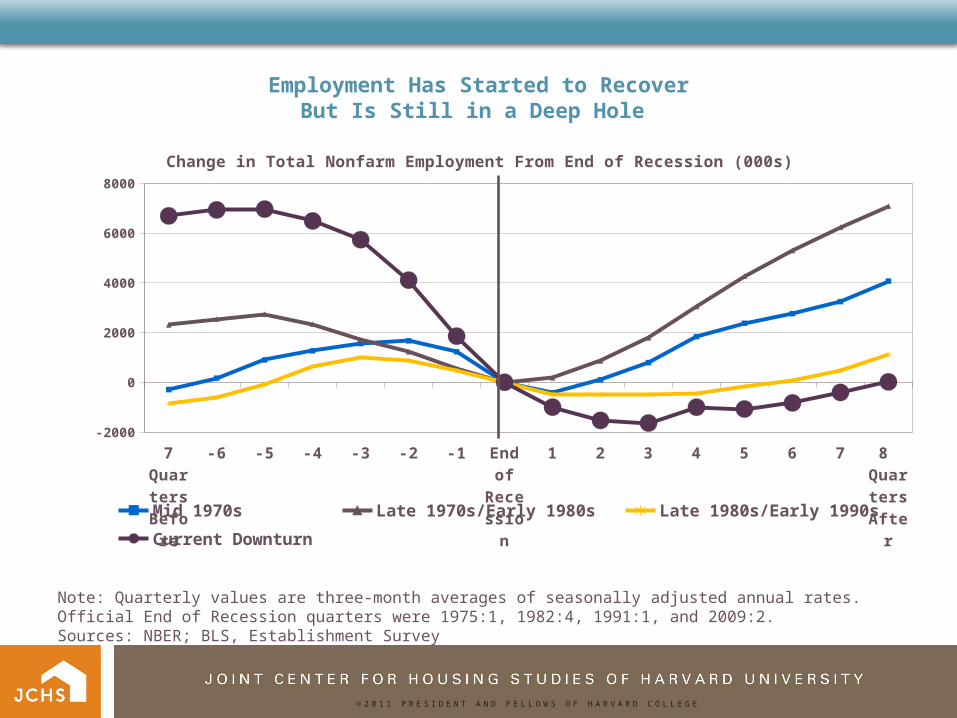
Employment Has Started to RecoverBut Is Still in a Deep Hole
Note: Quarterly values are three-month averages of seasonally adjusted annual rates. Official End of Recession quarters were 1975:1, 1982:4, 1991:1, and 2009:2. Sources: NBER; BLS, Establishment Survey
7QuartersBe-fore
-6 -5 -4 -3 -2 -1 Endof
Re-cession
1 2 3 4 5 6 7 8 QuartersAf-ter
-2000
0
2000
4000
6000
8000
Change in Total Nonfarm Employment From End of Recession (000s)
Mid 1970s Late 1970s/Early 1980s Late 1980s/Early 1990s
Current Downturn

© 2 0 1 1 P R E S I D E N T A N D F E L L O W S O F H A R V A R D C O L L E G E
8
Low-Tier Homes Have Been Hit Hardest by Price Declines
Las Vegas
Miami
Tampa
Los Angeles
San Diego
Seattle
Portland
Boston
-70 -60 -50 -40 -30 -20 -10 0
High-tier Low-tier
Percent decline in home prices, peak to November 2011
Source: JCHS tabulations of S&P/Case-Shiller Tiered HPI data.

© 2 0 1 1 P R E S I D E N T A N D F E L L O W S O F H A R V A R D C O L L E G E
9
High-Cost Lending Was Highest Among Low-Income and Minority Homeowners
Minority Mixed White05
101520253035404550
Low Income Middle Income High Income
Census Tract Type
High-cost loans as a share of all loans originated in 2005 (Percent)
Notes: Includes originations of conventional 1-4 unit owner-occupied home purchase loans. Low/middle/high income neighborhoods are census tracts with median family income in 2000 that is less than 80%/80-120%/greater than 120% of the 2000 area median family income. White/mixed/minority neighborhoods are tracts with a minority population share less than 10%/10-50%/greater than 50% of population in 2000. Source: JCHS enhanced HMDA database

© 2 0 1 1 P R E S I D E N T A N D F E L L O W S O F H A R V A R D C O L L E G E
Minority Mixed White0123456789
Low Income Moderate Income High Income
Census Tract Type
Foreclosures Have Been Concentrated In Low-Income Markets and Communities of Color
Notes: Minority census tracts were more than 50% minority in 2000; mixed census tracts were 10–50% minority; white census tracts were less than 10% minority. Low-/moderate-/high-income census tracts had median family incomes is less than 80%/80–120%/more than 120% of the metropolitan area median. Estimates are based on a HUD model of the share of loans foreclosed from January 2007 to June 2008.Sources: JCHS tabulations of HUD 2008 Neighborhood Stabilization Program data and US Census Bureau, 2000 Decennial Census.
Median Estimated 18-Month Foreclosure Rate, 2008 (Percent)

© 2 0 1 1 P R E S I D E N T A N D F E L L O W S O F H A R V A R D C O L L E G E
Even With the Will, The WayTowards Homeownership is Tougher
2006 2007 2008 2009 20100
10
20
30
40
50
60
70
80
90
100
Share of FHA-Insured Mort-gages by Dollar Volume
(Percent)
Below 640 640-679 680-850
2006 20090
10
20
30
40
50
60
70
80
90
100
Share of Freddie Mac and Fannie Mae Originations (Percent)
High Risk Moderate Risk Low Risk
Notes: High (low) risk loans are to borrowers with credits scores under 690 (above 750) and have loan-to-value ratios above 85% (below 75%). FHA data exclude records with no credit score information.Sources: Barclays Capital, GSEs: Back to the Future, US Interest Rates Strategy, 2009; US Department of Housing and Urban Development.
Credit Score
© 2 0 1 1 P R E S I D E N T A N D F E L L O W S O F H A R V A R D C O L L E G E
12
A TURBULENT TIME
© 2 0 1 1 P R E S I D E N T A N D F E L L O W S O F H A R V A R D C O L L E G E
13
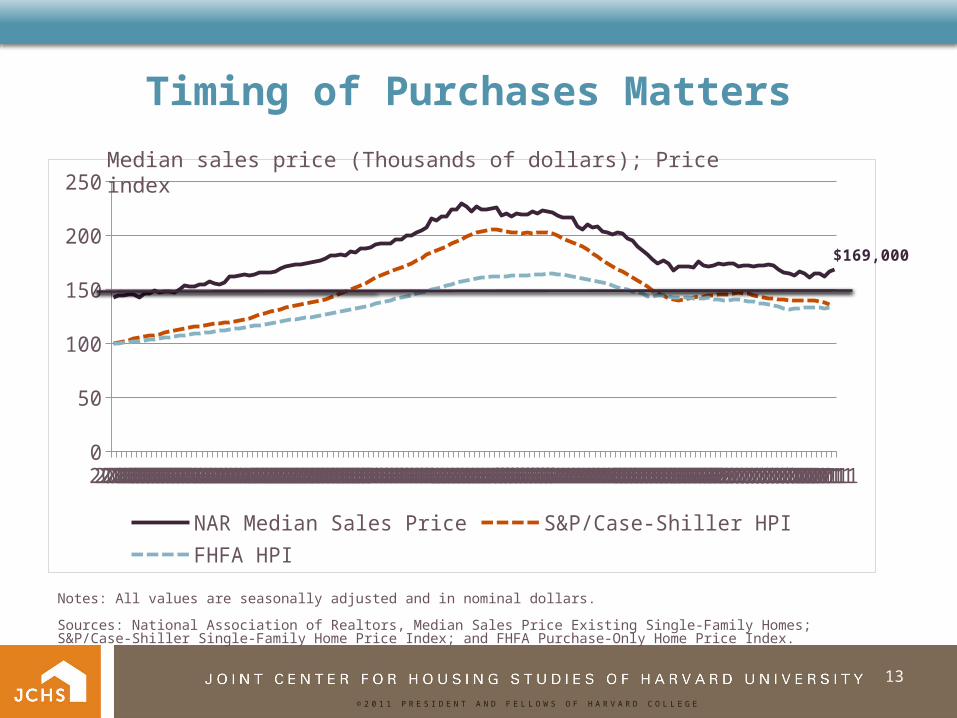
Timing of Purchases Matters
2000200020002000200020002000200020002000200020002001200120012001200120012001200120012001200120012002200220022002200220022002200220022002200220022003200320032003200320032003200320032003200320032004200420042004200420042004200420042004200420042005200520052005200520052005200520052005200520052006200620062006200620062006200620062006200620062007200720072007200720072007200720072007200720072008200820082008200820082008200820082008200820082009200920092009200920092009200920092009200920092010201020102010201020102010201020102010201020102011201120112011201120112011201120112011201120110
50
100
150
200
250
$169,000
NAR Median Sales Price S&P/Case-Shiller HPIFHFA HPI
Median sales price (Thousands of dollars); Price index
Notes: All values are seasonally adjusted and in nominal dollars.
Sources: National Association of Realtors, Median Sales Price Existing Single-Family Homes; S&P/Case-Shiller Single-Family Home Price Index; and FHFA Purchase-Only Home Price Index.

© 2 0 1 1 P R E S I D E N T A N D F E L L O W S O F H A R V A R D C O L L E G E
14
Price-to-Income Ratios Have Fallen Dramatically in Hardest-Hit States
1991
1992
1993
1994
1995
1996
1997
1998
1999
2000
2001
2002
2003
2004
2005
2006
2007
2008
2009
2010
2011
0
50
100
150
200
250
Arizona California Florida Nevada United States
Price-to-Income Index (1990:1 = 100)
Notes: Price-to-income ratios were calculated as the housing price index over median household income. House price values are from the fourth-quarter, except in 2011, which takes the latest-available third quarter values.Sources: FHFA Purchase-Only Home Price Index (NSA); US Census Bureau, Current Population Survey; Moody’s Analytics Income Forecast

© 2 0 1 1 P R E S I D E N T A N D F E L L O W S O F H A R V A R D C O L L E G E
15
Over Long-Run Prices Tend to Rise With Average Household Incomes
19751977
19791981
19831985
19871989
19911993
19951997
19992001
20032005
20072009
0
1
2
3
4
5
6
7
Median Sales Price Mean Household Income
Multiples of 1975 Value
Note: All values are in nominal dollars.
Sources: NAR Median Sales Price, Existing Single Family Homes; Moody’s Economy.com tabulations of US Census Bureau CPS data

© 2 0 1 1 P R E S I D E N T A N D F E L L O W S O F H A R V A R D C O L L E G E
16
Homeownership Is At Its Most Affordable Levels Since At Least 1971
1971197319751978198019821985198719891992199419961999200120032006200820100
50
100
150
200
250NAR Affordability Index
Source: NAR Composite Affordability Index.

© 2 0 1 1 P R E S I D E N T A N D F E L L O W S O F H A R V A R D C O L L E G E
Yet the Share of Renters Intending to Buy Has Fallen
2003 Jan 2010 Jun 2010 2010: Q3 2010: Q40
10
20
30
40
50
60 5752
3842
39
Share of Renters Likely to Buy in Next Three Years (Percent)
Source: Fannie Mae National Housing Survey.

© 2 0 1 1 P R E S I D E N T A N D F E L L O W S O F H A R V A R D C O L L E G E
Still Homeownership Is Still VERY Favorably Viewed
Jan
201
0
Jun
201
0
201
0:Q
3
201
0:Q
4
201
1: Q
1
201
1: Q
2
201
1: Q
30
20
40
60
80
100 89 91 92 90 92 90 92
Owners
Share Stating Owning Makes More Sense Than Renting (Percent)
Source: Fannie Mae National Housing Survey.
Jan
201
0
Jun
201
0
201
0:Q
3
201
0:Q
4
201
1: Q
1
201
1: Q
2
201
1: Q
30
20
40
60
80
100
7569 70 68
74 72 70
Renters

© 2 0 1 1 P R E S I D E N T A N D F E L L O W S O F H A R V A R D C O L L E G E
And People Perceive that Now IS a Good Time to Buy
2003
Jan
201
0
Jun
201
0
Sep
t 201
0
201
0:Q
4
201
1:Q
1
201
1:Q
2
201
1:Q
30
20
40
60
80
100
62 6268 67 64 64 66 67
Owners
Share Stating Now is a Good to Buy (Percent)
Source: Fannie Mae National Housing Survey, Q3 2010.
2003
Jan
201
0
Jun
201
0
Sep
t 201
0
201
0:Q
4
201
1:Q
1
201
1:Q
2
201
1:Q
30
20
40
60
80
100
56 58 59 60 55 58 59 55
Renters
© 2 0 1 1 P R E S I D E N T A N D F E L L O W S O F H A R V A R D C O L L E G E
20
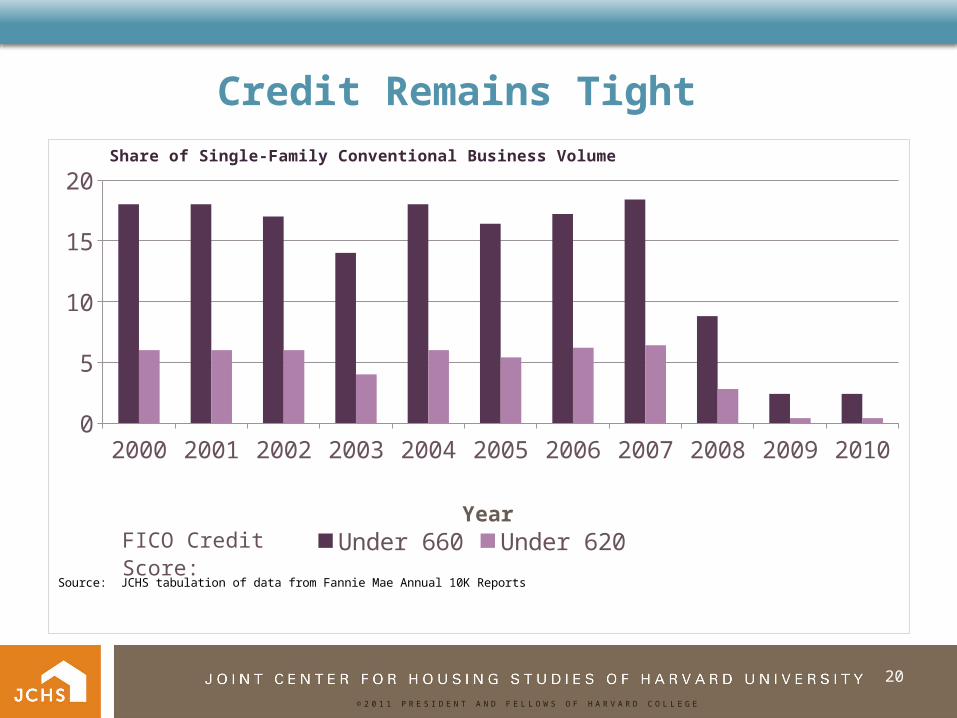
Credit Remains Tight
2000 2001 2002 2003 2004 2005 2006 2007 2008 2009 20100
5
10
15
20
Under 660 Under 620Year
Share of Single-Family Conventional Business Volume
Source: JCHS tabulation of data from Fannie Mae Annual 10K Reports
FICO Credit Score:

© 2 0 1 1 P R E S I D E N T A N D F E L L O W S O F H A R V A R D C O L L E G E
21
Financing Constraints Weigh Heavily, Especially on Potential First-Time Buyers
I May Not Qualify for a Mortgage
I Cannot Afford the Downpayment
0
10
20
30
40
50
60
70
80
1418
38
55
Owners Renters
Stated Reasons for Staying Out of The Housing Market (Per-cent of Respondents)
Source: Hanley Wood Housing 360 Survey, 2011.
Mortgage Accessability ...0
10
20
30
40
50
60
70
80
41
75
Owners Renters
Percent of Respondents
Source: Fannie Mae National Housing Survey, 2011:Q3.
© 2 0 1 1 P R E S I D E N T A N D F E L L O W S O F H A R V A R D C O L L E G E
22
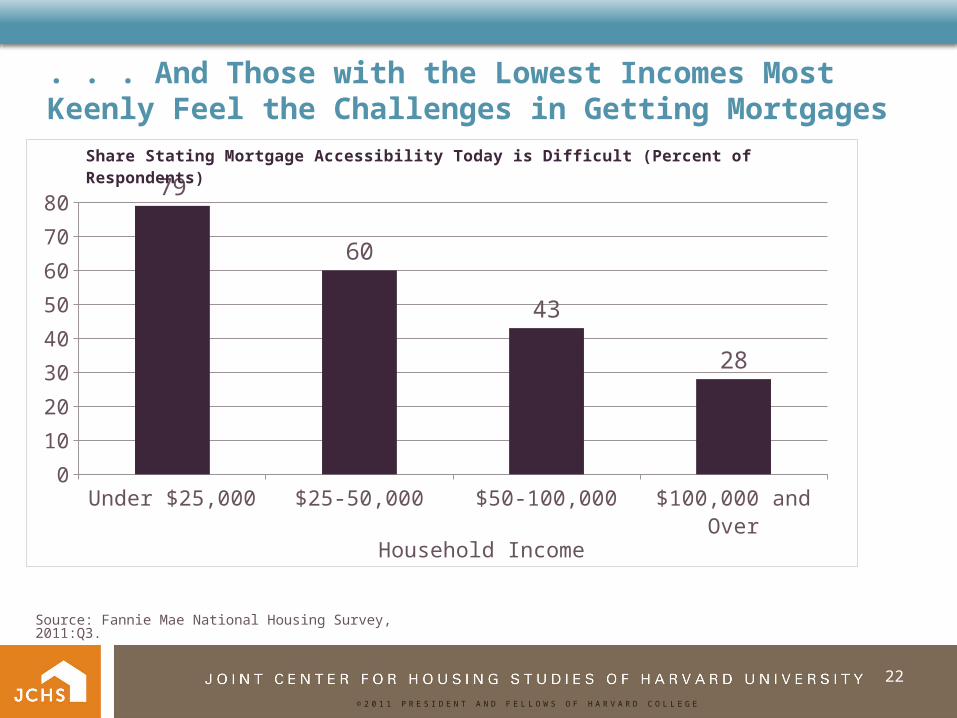
. . . And Those with the Lowest Incomes Most Keenly Feel the Challenges in Getting Mortgages
Under $25,000 $25-50,000 $50-100,000 $100,000 and Over
0
10
20
30
40
50
60
70
8079
60
43
28
Share Stating Mortgage Accessibility Today is Difficult (Percent of Respondents)
Household Income
Source: Fannie Mae National Housing Survey, 2011:Q3.

© 2 0 1 1 P R E S I D E N T A N D F E L L O W S O F H A R V A R D C O L L E G E
Delinquencies Have Ebbed But Foreclosure Pipeline Near Record Levels
90+ Days In Foreclosure0.0
1.0
2.0
3.0
4.0
5.0
6.0
Average 2000:1 to 2005:1 2010:12011:3
Share of Mortgages in Service (Percent)
Year
Source: Mortgage Bankers Association of America
© 2 0 1 1 P R E S I D E N T A N D F E L L O W S O F H A R V A R D C O L L E G E
24
THE PATH FORWARD

© 2 0 1 1 P R E S I D E N T A N D F E L L O W S O F H A R V A R D C O L L E G E
NWA Had it Right
• Full-cycle lending and sustainability matters
• Carefully educating and underwriting borrowers matters
• Flexibility in underwriting low credit score and low wealth borrowers is possible when done properly and with the right products

© 2 0 1 1 P R E S I D E N T A N D F E L L O W S O F H A R V A R D C O L L E G E
Seven-Point Plan
• Dispel myths about what caused risks to homeowners to mount and about the role of low-income housing policy
• Reassert evidence that shows can lend prudently to lower income/wealth/credit score borrowers
• Continue to research what works and doesn’t
• Show that full-cycle lending model is worth investing in
• Continue to fight for homebuyer assistance programs and housing finance reform that preserves access
• Remain flexible and responsive to housing demand in your markets
• Explore collaborations with Housing Finance Agencies