Purva Silver Sands - New Housing Project Mundhwa PunePurva silver sands pune

2011 Oil Sands Report Card Lars Christian Bacher, president of Statoil Canada
2012-04-25

Strategic Context
Position as industry leader in HSE and
carbon efficiency
Safe and sustainable performance a competitive advantage
Continue to leverage and further develop
technology positions
Technology increasingly important for access, value creation and growth
Upstream focused adding value through
selective midstream positions
Attractive outlook for upstream oil and gas
Revitalise NCS with high value barrels
Develop a leading global
exploration company
Continue portfolio management
to enhance value creation
Create value from a superior
gas position
Build material positions in 3-5 new offshore business
clusters
Apply technology to expand in
unconventionals
Production above 2.5 million
boe/d in 2020
Unconventionals are key to our strategy
2012-04-25 2

Statoil in North America
Strategic positions across North America
2012-04-25 3

Substantial resources in Canadian oil sands
• Significant reserve additions
• Competitive fiscal and royalty regimes
• Strong cash flow
• Technology upside
Rationale Reserves
25 21 203037
4760
92102
143151
174
211
265
0
50
100
150
200
250
300
Saud
i Ara
bia
Vene
zuela
Cana
da Iran
Iraq
Kuwait
Abu D
habi
Russ
iaLib
ya
Nigeria
Kazh
akhs
tanQata
r
United
Stat
esCh
ina
billi
on b
arre
ls
Source: Canadian Association of Petroleum Producers
2012-04-25 4

Cash flow for a typical SAGD plant
2012-04-25 5

Kai Kos Deseh projects
2012-04-25 6

Leismer Demonstration Project
* Steam-assisted gravity drainage
** Steam to oil ratio
• Rated capacity 18,800 boe/d (based on SOR** 3.0)
• First oil January 2011 (efficient ramp up of production)
• Current production ~ 14,000 boe/d
• More than five million barrels produced to date
• Demonstration plant providing valuable operational experience
• Technology pilots
SAGD* facility
2012-04-25 7

Successful start up
2012-04-25 8

Land
ü Land reclamation
ü 182 000 seedlings planted in 2011
ü OSLI land stewardship collaboration
2012-04-25 9

Water
ü No surface water used in production
ü Surface water monitoring
ü Observation and monitoring wells
ü Reduced liquid discharge
2012-04-25 10
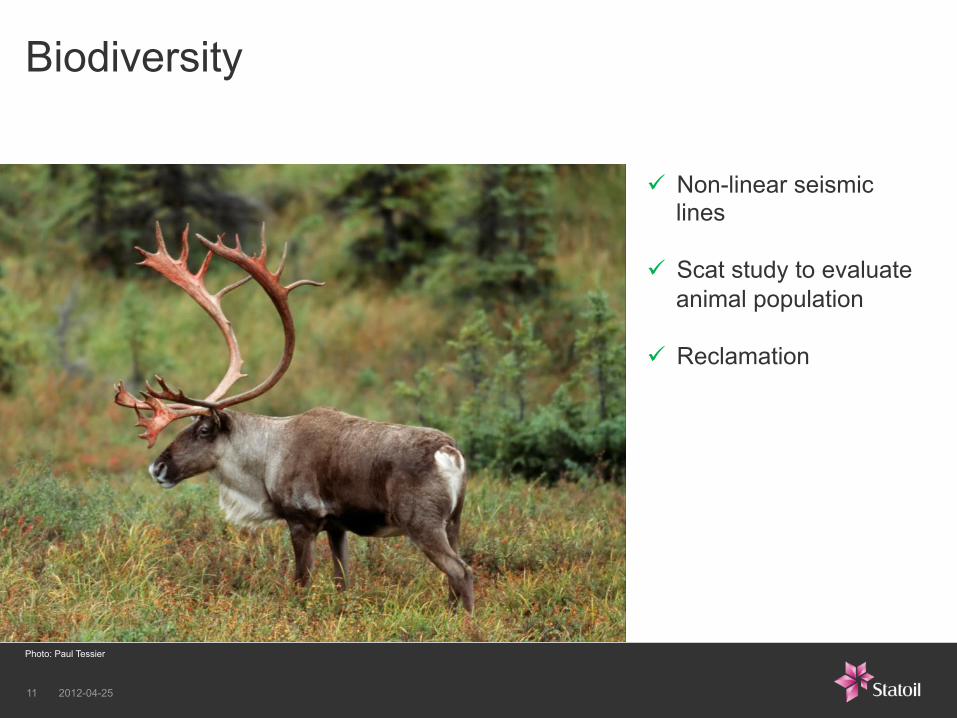
Biodiversity
ü Non-linear seismic lines
ü Scat study to evaluate animal population
ü Reclamation
Photo: Paul Tessier
2012-04-25 11

Global energy-related emissions
Global emissions
Canada’s two per cent
GHG emissions from oil sands: § just over 1/1000th of global GHG emissions § 6.5% of Canada’s GHG emissions § 29% reduction in intensity from 1990
Sources: 1. U.S. Dept. of Energy/EIA 2. Environment Canada
2012-04-25 12

Crude production
Crude transport
Distribution of refined products
Crude upgrading
Crude refining
0 50 100 150 200
West Texas Intermediate Canadian Heavy (Bow River)
Saudi Medium (ave)
Average US Domestic Crude (2005)
Mexico-Maya) Average US Barrel Consumed (2005)
Canadian Oil Sands: Mining Dilbit
Venezuela-Bachaquero Canadian Oil Sands: Mining Bitumen
Canadian Oil Sands: SAGD Dilbit
Average Oil Sands Imported to United States (2009)
Canadian Oil Sands: Mining SCO
Nigeria Light Crude Canadian Oil Sands: SAGD Bitumen
Venezuelan Partial Upgrader California Heavy Oil
Canadian Oil Sands: SAGD SCO
Middle East Heavy Oil CSS Bitumen
Kg CO2e per barrel refined products
2012-04-25 13

CO2 Ambition
2012-04-25 14
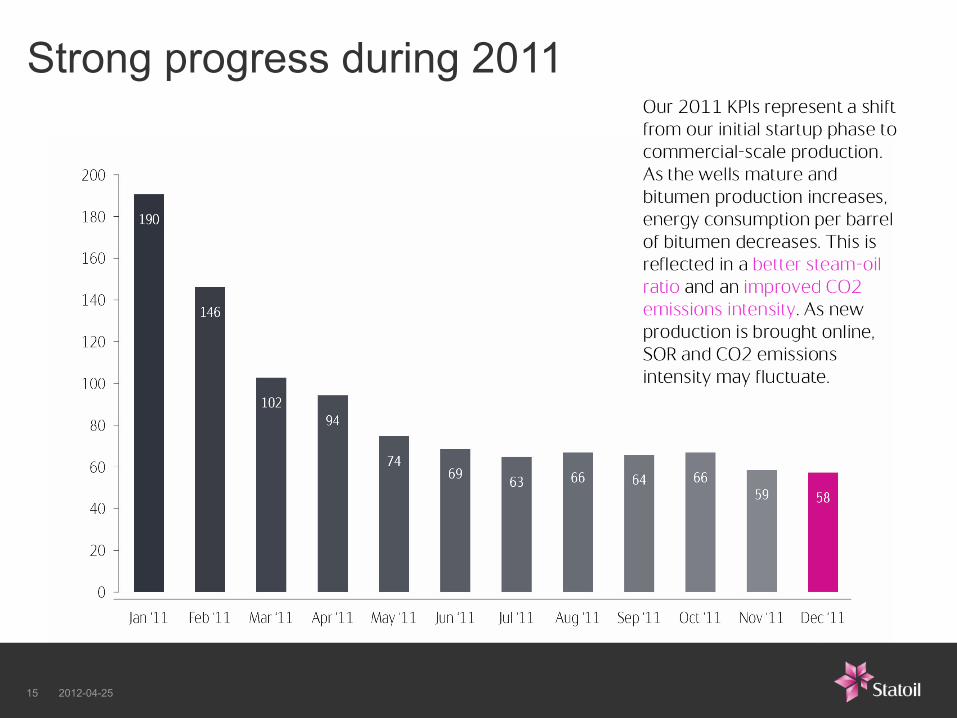
Strong progress during 2011
2012-04-25 15

Working with our neighbours
ü Working with Aboriginal and Metis nations
ü Local Opportunity Centre established
ü Capacity building in Northern Alberta
ü Ski Fit North programme supports youth in local schools
2012-04-25 16

Committed to transparency
2012-04-25 17

2011 Oil Sands Report Card
Lars Christian Bacher President, Statoil Canada www.statoil.com
2012-04-25 18