2011 Northern California Commercial Real Estate Overvie Cassidy Turley Northern... · 2011 Northern...
56
An annual report on Commercial Real Estate in Alameda, Contra Costa, El Dorado, Marin, Monterey, Napa, Placer, Sacramento, San Francisco, San Mateo, Santa Clara, Santa Cruz, Solano, Sonoma, and Yolo Counties. 2011 Northern California Commercial Real Estate Overview
Transcript of 2011 Northern California Commercial Real Estate Overvie Cassidy Turley Northern... · 2011 Northern...
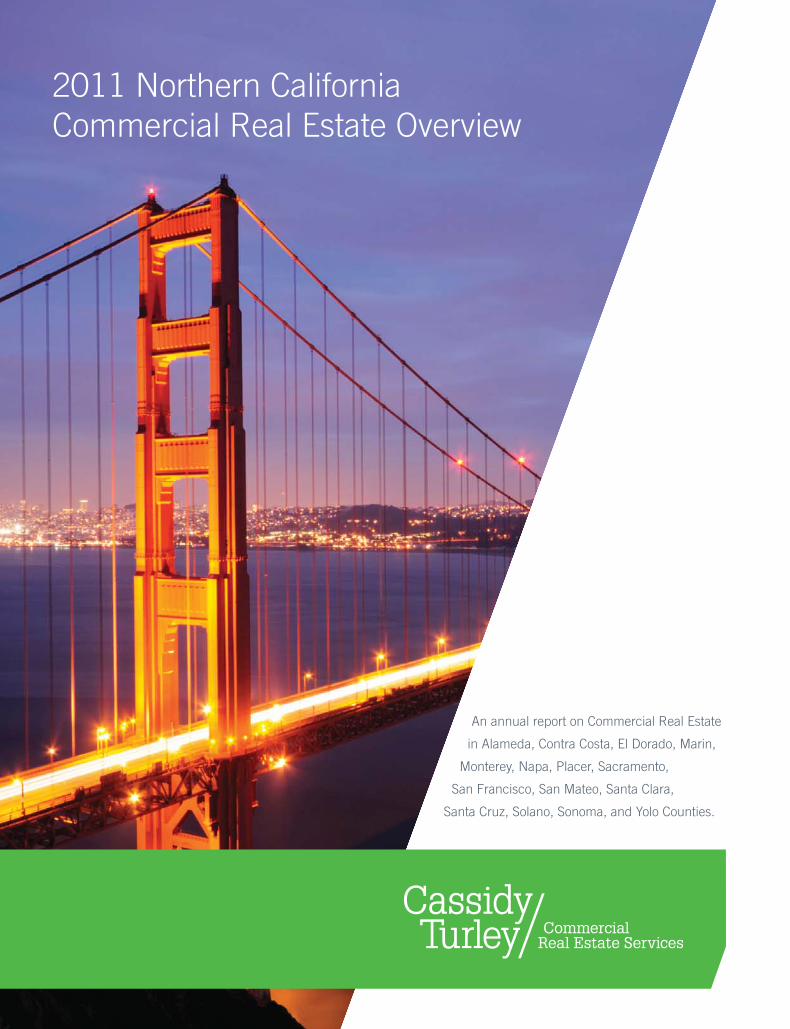
An annual report on Commercial Real Estate
in Alameda, Contra Costa, El Dorado, Marin,
Monterey, Napa, Placer, Sacramento,
San Francisco, San Mateo, Santa Clara,
Santa Cruz, Solano, Sonoma, and Yolo Counties.
2011 Northern CaliforniaCommercial Real Estate Overview

www.ctbt.com
We are Cassidy Turley.

CAPITAL MARKETS
CORPORATE SERVICES
PROJECT & DEVELOPMENT SERVICES
PROJECT LEASING
PROPERTY MANAGEMENT
TENANT REPRESENTATION
INT
RO
DU
CT
ION
INTRODUCTION
The 2011 Northern California Commercial Real Estate Overview
is an annual review of the major markets covered by each of
Cassidy Turley’s 15 regional offi ces.
This guide offers summaries and specifi c local submarket
information that are easily located and quickly understood.
This overview represents only a fraction of our research
capabilities. Each of Cassidy Turley’s regional offi ces provides
quarterly reports and custom building-by-building analysis as a
service to our customers.
Our Insight. Your Advantage.
2011 Northern CaliforniaCommercial Real Estate Overview
TA
BL
E O
F C
ON
TE
NT
S
TABLE OF CONTENTS
Introduction 6
Corporate Overview 8
Offi ce Overview 10
R&D Overview 12
Warehouse Overview 14
Shopping Center Overview 16
Multi-Family Overview 22
Investment Overview 24
San Francisco County Overview 26
Santa Clara County Overview 28
San Mateo County Overview 30
I-80/880 Corridor Overview 32
North I-680 Corridor Overview 34
Tri-Valley Overview 36
Sacramento Valley Overview 38
Marin County Overview 40
Sonoma County Overview 42
Napa County / Solano County Overviews 44
Santa Cruz County Overview 46
Monterey County Overview 48
Addendum - City by City Data 50
Credits & Terms 54
For a digital ebook version of this book, go to www.ctbt.com/Overview2011

6 CASSIDY TURLEY
CE
O L
ET
TE
R CEO LETTER
There is no doubt that 2010 was a rollercoaster year for commercial real estate in Northern California. We entered the year in the depths of the worst economic downturn since the Great Depression. Vacancy levels for all property types were up across the board. Rents had dropped substantially for nearly every commercial real estate property type. Commercial delinquencies and foreclosures were reaching record levels and the overall mood was one of gloom.
2010 began against this dour backdrop. Unemployment in California was well above the 12% mark and above the 10% mark in most Bay Area cities. Once again we heard the economists speaking of “jobless recoveries” and commercial real estate being the “last shoe to drop.” Commercial real estate always is a lagging indicator of the economy, so it makes sense that we are the last to feel the impacts of a downturn and the last to recover. And so many questioned whether our local markets would even hit bottom in 2010.
But after a weak start, the local commercial real estate market found footing in 2010. Led by a resurgent tech sector, offi ce product along the Highway 101 Corridor from Mountain View to Market Street began to post the largest occupancy growth numbers we have seen in years. Prime retail space was suddenly in high demand again as a wave of discounters, grocery store chains, off-price retailers and a new crop of quick service and fast casual restaurant concepts sought to take advantage of once-in-a-generation rental rates. Most of the region’s industrial markets showed signs of stabilization. Last, but not least, what had been a stagnant investment market in 2009, came back to life by year-end with trophy offi ce properties in San Francisco’s urban core leading the charge.
Perhaps most importantly, against all of the challenges of the past year, we closed 2010 with not just resurgent activity, but resurgent optimism. We still have a long way to go on the road to recovering from the “Great Recession.” Though plenty of challenges remain, the overriding sense is that the worst is now behind us.
WE ARE CASSIDY TURLEYJust as 2010 was a year in which the Bay Area commercial real estate markets showed remarkable resilience and growth during challenging times, the same holds true of our company. In 2010, BT Commer-cial joined forces with other leading private commercial real estate fi rms to form Cassidy Turley, immediately the largest privately held commercial real estate services fi rm in the nation. We are a national team of dedicated professionals with over 100 years of successful client relationships. We have over 3,000 professionals in 60 offi ces nationwide and completed transactions valued over $17 billion in 2010. We manage over 430 million square feet on behalf of private, institutional and corporate clients and support over 25,700 domestic corporate services locations. Cassidy Turley serves owners, investors and occupiers with a full spectrum of integrated commercial real estate services—including capital markets, corporate services, project leasing, property management, project and development services, and tenant representation. We were recently ranked in the Top 10 on the Lipsey Company’s Commercial Real Estate Top Brands Survey, and were ranked #1 by Real Estate Alert for Offi ce Sales in three of the top six U.S. markets.
As part of this continued effort to improve our capabilities, I am also very pleased to share that in 2010 Cassidy Turley BT Commercial and CPS CORFAC International reached an agreement to merge ownership. In doing so, we became the #1 commercial real estate brokerage fi rm in the Silicon Valley in terms of agent count according to the San Jose/Silicon Valley Business Journal. We also hold the #1 commercial brokerage fi rm ranking in both the San Francisco and Peninsula markets. Our market presence now includes over 400 professionals and staff in 15 offi ces locally and recorded over $3.1 billion in transactions in 2010.
Also in 2010, Cassidy Turley reached an agreement to form a partner-ship with London-based GVA Grimley, one of the U.K.’s leading fi rms and the controlling fi rm in GVA Worldwide in order to improve our delivery of services internationally. Indeed, 2010 was a year in which there are a lot of exciting changes happening within our fi rm.
Our fi rm also continues to grow within the United States. In 2010, three former Colliers affi liates, Houston in New Jersey, Moore in Louisville and Barry in Milwaukee as well as a former NAI affi liate, Fuller, in Denver also merged in to Cassidy Turley. And, in January, we expanded to the Dallas and Houston markets with our merger with Capstar Commercial Real Estate Services.
There will be more growth in 2011 and more changes that will continue to enhance the resources and services we provide to you. We are eager to continue working with you and to expand our relationship across our expanded business lines and geography. Though our name may have changed last year, we have not changed our commitment to our market leading research products. In fact, we will continue to improve in this effort, because we know that information is vital to your decision making process. Our research and knowledge are the core capability that allows Cassidy Turley BT Commercial to produce over 50 different quarterly market reports — the most of any commercial real estate services fi rm in Northern California. Our commitment to research is our commitment to you; our clients, so that you may have a better understanding of our markets’ past, present and projected future.
THE MARKETSo, what is driving this new sense of optimism in the Bay Area?
It is new technology, driven by social media, wireless, hand held devices and cloud computing. We lead in the percentage of our workforce that is in high tech with Silicon Valley double that of the next market which happens to be San Francisco and even as we evolve from legacy tech to the new tech, the percentage of our workforce dedicated to this sector will increase. Of the ten largest social networking sites, six are headquartered in the Bay Area, but more impressively, they account for 85% of the monthly unique visitors to the top 10 sites. Of the fi ve largest U.S. Search Engines, three are headquartered in the Bay Area and more impressively they account for 88% of all unique searches in the US. The fact is that the resurgence of the Bay Area economy has been driven by these fi rms and our region’s outsized role in the development of the next generation of technology.
So how did each of the product types perform in 2010?
OFFICEBay Area offi ce vacancy ended 2010 at 16.6%, down from 17.4% in 2009. We track 59 separate offi ce submarkets in the Bay Area. Of those 59 markets, 33 showed positive net absorption and 26 were negative for the year. The one consistent factor was that markets with strong tech clusters were the winners. On the whole, what we have seen is that the Highway 101 Corridor from Mountain View in Silicon Valley to Market Street in San Francisco is where the growth has been concentrated.
Asking rents for offi ce space stabilized over the course of the past twelve months. The current average asking rent in the Bay region is $2.44 per square foot (on a monthly full service basis). This number has not budged since the fi rst quarter of 2010. That being said, we are already seeing rental rate growth in the region’s strongest offi ce submarkets, while stabilization is taking place in most of the weaker trade areas.
All told, the market absorbed over 2.6 million square feet of space in 2010—nearly all of it in the fi nal half of the year. What is more telling is the fact that this represents a swing of over 9.1 million square feet compared to 2009 when the market hemorrhaged over 6.5 million square feet of occupancy.
To Our Valued Clients,
2011 NORTHERN CALIFORNIA COMMERCIAL REAL ESTATE OVERVIEW 7
CE
O L
ET
TE
R
Clearly, we are a boom and bust market. This should not come as a surprise considering that we are a tech market. But we think that it is interesting to note that in comparison to the dot bomb implosion of 2001, this economic downturn has actually been much milder locally. All told, the region lost a total of roughly 27 million square feet of occupancy during the “Great Recession.” In the tech wreck of 2001/2002, the market lost 65 million square feet. That net absorption has turned positive once more tells us that, so long as the ongoing fragile economic recovery is not derailed, that the San Francisco Bay region offi ce market is beginning to enter its next boom phase.
We are currently tracking active tenant space requirements of over 5.2 million square feet, 45% of which is in our traditional services industries. Some of these will end up as renewals or consolidations rather than growth. But even with that caveat, we believe that both the San Francisco and Silicon Valley offi ce markets will record occupancy growth in the range of two million square feet in 2011. The San Mateo County offi ce market could record one million square feet of occupancy growth in the coming year. The real challenge will be for East and North Bay markets which typically have not had as strong a tech presence. But, improving economic fundamentals should also see most of these trade areas stabilizing over the fi rst half of the year and posting modest improvement by late 2011.
R&D2010 was a year of stabilization for R&D space in the Bay Area. Today’s vacancy rate of 18.1% is the same as it was exactly one year ago. Two years ago this number stood at 15.5%. Though total occupancy growth was slightly negative—to the tune of roughly 66,000 square feet, the good news is that the market has fi nally found its fl oor. Average asking rents for R&D space in the Bay Area also stabilized in 2010. They declined slightly from $1.11 per square foot (on a monthly triple net basis) to $1.10 over the past year. They had peaked in 2007 at $1.36 per square foot.
We are tracking 7.8 million square feet of R&D and offi ce require-ments in the Silicon Valley and 101 Corridor markets alone. Leasing activity and touring were picking up as 2010 came to a close. These trends are escalating in 2011. If 2010 was a year of stabilization, 2011 will be a year of recovery. Net absorption will trend positive throughout the year, with momentum building heading into the fi nal half of 2011. Our worst case scenario is that the market absorbs 1.5 million square feet of space this year. Our likely case forecast is for two million square feet of occupancy growth. An unexpectedly robust economic turnaround could mean as much as 2.5 million square feet of expansion.
WAREHOUSEVacancy for warehouse space in the Bay Area also stabilized in 2010. Today’s vacancy rate of 9.4% is the same as it was exactly one year ago. Two years ago this number stood at 6.6%. Total occupancy growth was just over 5,000 square feet—or virtually zero.
There are two factors that hammered the previously rock solid warehouse market over the past few years. First, the global supply chain has become much more effi cient; and, second, warehousing has largely become a month to month business with third party logistics fi rms tying their lease commitments to the terms of their contracts with their clients. The good news is that as consumers begin to spend more—as they have been doing since last year’s stellar holiday shop-ping season—warehouse vacancies will begin to fall rapidly. 2011 will be a year of modest recovery. Net absorption will continue to trend positive throughout the year, with momentum building heading into the fi nal half of the year.
MANUFACTURINGVacancy for manufacturing space in the Bay Area climbed from 6.8% to 7.4% over the course of 2010. Manufacturing space has been negatively impacted by both off-shoring and technology. The global supply chain has become so effi cient and information-centric that when consumers stop buying, factories stop producing literally overnight. These trends have translated into the region losing over 3.7 million square feet of occupancy since 2008. The Bay Area manufacturing market lost 924,000 square feet of occupancy in 2010, but net absorption should turn minimally positive in 2011. Increased consumer spending will also spur manufacturing demand, though these trends likely won’t translate into occupancy growth until late in the year.
RETAILThe San Francisco Bay Area shopping center market closed 2010 with an overall vacancy rate of 6.8%. One year ago this number stood at 7.6%. The Bay Area continues to rank in the top fi ve U.S. markets in terms or retail activity. Throughout the past year, discounters, off-price apparel chains, new grocery players (discount, organic and ethnic-themed) scoured the market for deals on superior space that had been vacated in the last wave of bankruptcies. Meanwhile, restaurant chains continue to drive the market for smaller space. Retailers will continue to boost expansion plans throughout the Bay Area—a trend that will mean further declines in vacancy. Right now the big problem is that the region is running low on fi rst-tier space to accommodate the growth plans of top chains. Look for fi rst and second-tier shopping centers to continue to record occupancy growth in 2011 and for rental rate growth to be strong.
INVESTMENTThe Bay Area investment market showed improvement in both overall activity and valuation metrics in 2010. Total sale volume tallied $7.8 billion in 2010 for offi ce, industrial, retail and multi-family transac-tions. This was a dramatic, 122% improvement from a year ago when the total volume registered $3.5 billion. And activity will only increase further in 2011. Last year investors were focused on core urban offi ce and trophy shopping center assets. In many cases properties traded at cap rates in the 5% to 6% range. This year investors will increasingly look to other property types, secondary and tertiary markets and will increasingly be willing to explore partially stabilized properties in light of improving economic fundamentals.
MULTI-FAMILYLastly, our multi-family sector remained tight throughout the downturn and currently has a market-wide vacancy rate of 4.6%. As the economy heats up and households begin to “unbundle” we should see very strong upward movement in multifamily rents.
There is a new sense of optimism in the marketplace. It is one that is tempered by rationality and grounded in reality, as opposed to stoked by irrational exuberance. There is no doubt that we are still in the midst of a very fragile recovery and that many challenges lay ahead. Even as our hearts and prayers go out to the victims of the recent terrible tragedy in Japan, we still do not know what the full impact of this catastrophe will be. Likewise, rising fuel prices could threaten one of the current engines driving recovery—the resurgent U.S. consumer. There will still be challenges in the months to come, but better times are fi nally here. The worst of the “Great Recession” is, at last, behind us.
Thank you,
Mike KammCEOCassidy Turley BT Commercial
8 CASSIDY TURLEY
CO
RP
OR
AT
E O
VE
RV
IEW CORPORATE OVERVIEW
About Cassidy TurleyCassidy Turley is a leading commercial real estate services provider with 3,000 professionals in 60 offi ces nationwide. The company represents a wide range of clients—from small businesses to Fortune 500 companies, from local non-profi ts to major institutions. The fi rm completed transactions valued at $17 billion in 2010, manages 430 million square feet on behalf of private, institutional and corporate clients and supports over 25,000 domestic corporate services locations. Cassidy Turley serves owners, investors and occupiers with a full spectrum of integrated commercial real estate services—including capital markets, tenant representation, corporate services, project leasing, property management, project and development services, and research and consulting. In 2010, the fi rm enhanced its global service delivery outside of North America through its partnership with GVA.
Cassidy Turley provides regional real estate services with the combination of two market leaders, Cassidy Turley BT Commercial, in Northern California, and Cassidy Turley CPS, in Silicon Valley. The dominant market presence includes over 400 professionals and staff in 15 offi ces locally and recorded over $3.1 billion in transactions in 2010.
Offering Comprehensive Services
• Capital Markets• Distressed Asset Services • Land Acquisition and Disposition• Landlord Representation
• Owner/Occupier Sales• Project and Development Services• Property Management
PRACTICE GROUPS
Our practice groups are comprised of professionals with deep expertise unique to particular property types and within specifi c industries.
INVESTOR SERVICES
From fi nance and investment sales, to leasing and management services, our deep connections in the institutional and private sectors help you seize opportunities and maximize returns.
OCCUPIER SERVICES
Cassidy Turley has a proven track record of analyzing your space needs and executing effi cient and value-added strategies to meet them.
• Auction Services• Financial Advisory Services
• Location Advisory and Incentives• Sustainability Consulting
SPECIALTY SERVICES
Fully integrated into our core service offerings, Cassidy Turley has specialized capabilities to meet the evolving needs of our investor and occupier clients.
• Corporate Services• Land Acquisition and Disposition• Owner/Occupier Sales
• Project and Development Services• Tenant Representation
Key Statistics
• Cassidy Turley is one of the largest real estate services companies in the U.S.
• 60 offi ces
• 360 principals
• 3,000 associates
• 940 brokers
• 2010 transactions - Gross transaction volume
$17 billion - Gross capital markets volume
$6.7 billion
• 430 million sf property management portfolio
• 430 million sf leasing portfolio
• 25,700+ Corporate Services locations and 128 million sf
• Automotive• Food Facilities• Global Supply Chain• Golf & Resort Properties
• Healthcare• Higher Education• Hospitality• Law Firm
• Life Sciences• Mission Critical• Multi-Family• Net Lease
• Not-for-Profi t• Retail• Self Storage
2011 NORTHERN CALIFORNIA COMMERCIAL REAL ESTATE OVERVIEW 9
CO
RP
OR
AT
E O
VE
RV
IEW
About Cassidy Turley BT Commercial
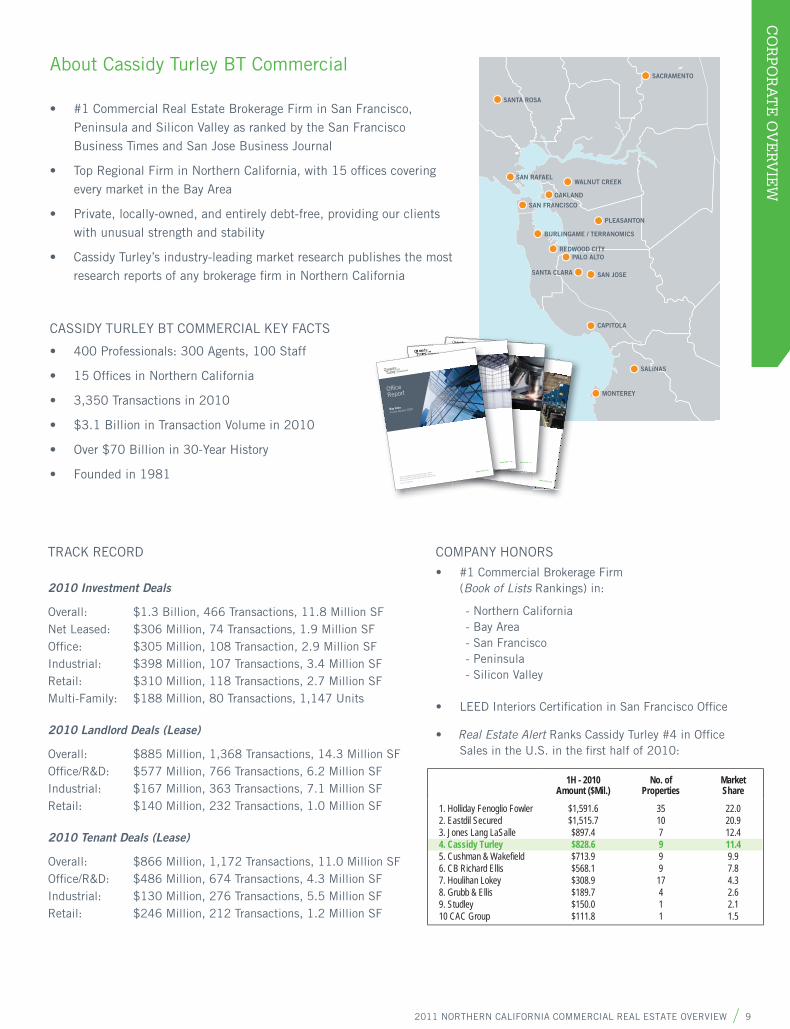
#1 Commercial Real Estate Brokerage Firm in San Francisco, • Peninsula and Silicon Valley as ranked by the San Francisco Business Times and San Jose Business Journal
Top Regional Firm in Northern California, with 15 offi ces covering • every market in the Bay Area
Private, locally-owned, and entirely debt-free, providing our clients • with unusual strength and stability
Cassidy Turley’s industry-leading market research publishes the most • research reports of any brokerage fi rm in Northern California
CASSIDY TURLEY BT COMMERCIAL KEY FACTS
400 Professionals: 300 Agents, 100 Staff •
15 Offi ces in Northern California•
3,350 Transactions in 2010 •
$3.1 Billion in Transaction Volume in 2010 •
Over $70 Billion in 30-Year History •
Founded in 1981•
SACRAMENTO
WALNUT CREEK
SANTA ROSA
SAN RAFAEL
SAN FRANCISCO
BURLINGAME / TERRANOMICS
PALO ALTO
SAN JOSE
CAPITOLA
SALINAS
MONTEREY
OAKLAND
REDWOOD CITY
PLEASANTON
SANTA CLARA
Offi ces in Burlingame, Capitola, Monterey, Napa, Oakland,
Palo Alto, Pleasanton, Redwood City, Sacramento, Salinas,
San Francisco, San Jose, San Rafael, Santa Rosa, Walnut Creek
Broker Lic #00825241
www.ctbt.com
City, State Year
ManufacturingReport
Bay AreaFourth Quarter 2009
www.ctbt.com
Offi ces in Burlingame, Capitola, Monterey, Napa, Oakland, Palo Alto, Pleasanton, Redwood City, Sacramento, Salinas, San Francisco, San Jose, San Rafael, Santa Rosa, Walnut CreekBroker Lic #00825241
www.ctbt.com
City, State YearBay AreaFourth Quarter 2009
wwwwwwww.ctbt.comOffi ces in Burlingame, Capitola, Monterey, Napa, Oakland,
Palo Alto, Pleasanton, Redwood City, Sacramento, Salinas,
San Francisco, San Jose, San Rafael, Santa Rosa, Walnut Creek
Broker Lic #00825241
www.ctbt.com
City, State Year
WarehouseReport
Bay AreaFourth Quarter 2009
,a Rosa, WalnWalnut Cut CreeCreekek
,
Offices in Burlingame, Capitola, Monterey, Napa, Oakland,
fiPalo Alto, Pleasanton, Redwood City, Sacramento, Salinas,
San Francisco, San Jose, San Rafael, Santa Rosa, Walnut Creek
Broker Lic #00825241
www.ctbt.co
WarehouseReport
Bay AreaFourth Quarter 2009
ta Rosa Wa,
Offi ces in Burlingame, Capitola, Monterey, Napa, Oakland,
Palo Alto, Pleasanton, Redwood City, Sacramento, Salinas,
San Francisco, San Jose, San Rafael, Santa Rosa, Walnut Creek
Broker Lic #00825241
www.ctbt.com
City, State Year
Offi ceReport
Bay Area
Fourth Quarter 2009
TRACK RECORD
2010 Investment Deals
Overall: $1.3 Billion, 466 Transactions, 11.8 Million SF Net Leased: $306 Million, 74 Transactions, 1.9 Million SF Offi ce: $305 Million, 108 Transaction, 2.9 Million SF Industrial: $398 Million, 107 Transactions, 3.4 Million SF Retail: $310 Million, 118 Transactions, 2.7 Million SF Multi-Family: $188 Million, 80 Transactions, 1,147 Units
2010 Landlord Deals (Lease)
Overall: $885 Million, 1,368 Transactions, 14.3 Million SF Offi ce/R&D: $577 Million, 766 Transactions, 6.2 Million SF Industrial: $167 Million, 363 Transactions, 7.1 Million SF Retail: $140 Million, 232 Transactions, 1.0 Million SF
2010 Tenant Deals (Lease)
Overall: $866 Million, 1,172 Transactions, 11.0 Million SF Offi ce/R&D: $486 Million, 674 Transactions, 4.3 Million SF Industrial: $130 Million, 276 Transactions, 5.5 Million SF Retail: $246 Million, 212 Transactions, 1.2 Million SF
COMPANY HONORS
#1 Commercial Brokerage Firm • (Book of Lists Rankings) in:
- Northern California - Bay Area - San Francisco - Peninsula - Silicon Valley
LEED Interiors Certifi cation in San Francisco Offi ce•
• Real Estate Alert Ranks Cassidy Turley #4 in Offi ceSales in the U.S. in the fi rst half of 2010:
1H - 2010Amount ($Mil.)
No. ofProperties
MarketShare
1. Holliday Fenoglio Fowler2. Eastdil Secured3. Jones Lang LaSalle4. Cassidy Turley5. Cushman & Wakefi eld6. CB Richard Ellis7. Houlihan Lokey8. Grubb & Ellis9. Studley10 CAC Group
$1,591.6$1,515.7$897.4$828.6$713.9$568.1$308.9$189.7$150.0$111.8
35107999
17411
22.020.912.411.49.97.84.32.62.11.5
10 CASSIDY TURLEY
OF
FIC
E O
VE
RV
IEW
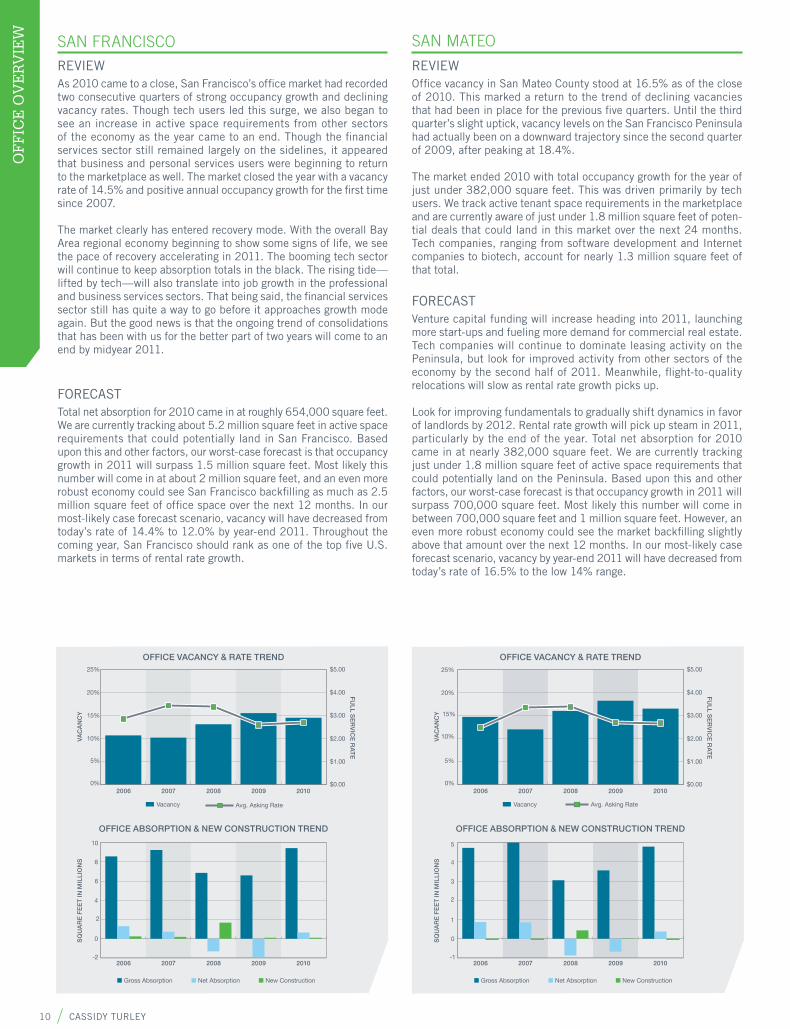
REVIEWOffi ce vacancy in San Mateo County stood at 16.5% as of the close of 2010. This marked a return to the trend of declining vacancies that had been in place for the previous fi ve quarters. Until the third quarter’s slight uptick, vacancy levels on the San Francisco Peninsula had actually been on a downward trajectory since the second quarter of 2009, after peaking at 18.4%.
The market ended 2010 with total occupancy growth for the year of just under 382,000 square feet. This was driven primarily by tech users. We track active tenant space requirements in the marketplace and are currently aware of just under 1.8 million square feet of poten-tial deals that could land in this market over the next 24 months. Tech companies, ranging from software development and Internet companies to biotech, account for nearly 1.3 million square feet of that total.
FORECASTVenture capital funding will increase heading into 2011, launching more start-ups and fueling more demand for commercial real estate. Tech companies will continue to dominate leasing activity on the Peninsula, but look for improved activity from other sectors of the economy by the second half of 2011. Meanwhile, fl ight-to-quality relocations will slow as rental rate growth picks up.
Look for improving fundamentals to gradually shift dynamics in favor of landlords by 2012. Rental rate growth will pick up steam in 2011, particularly by the end of the year. Total net absorption for 2010 came in at nearly 382,000 square feet. We are currently tracking just under 1.8 million square feet of active space requirements that could potentially land on the Peninsula. Based upon this and other factors, our worst-case forecast is that occupancy growth in 2011 will surpass 700,000 square feet. Most likely this number will come in between 700,000 square feet and 1 million square feet. However, an even more robust economy could see the market backfi lling slightly above that amount over the next 12 months. In our most-likely case forecast scenario, vacancy by year-end 2011 will have decreased from today’s rate of 16.5% to the low 14% range.
SAN MATEO
OFFICE VACANCY & RATE TREND
OFFICE ABSORPTION & NEW CONSTRUCTION TREND
2006 2007 2008 2009 2010
2006 2007 2008 2009 2010-1
0
1
2
3
4
5
0%
5%
10%
15%
20%
25%
$0.00
$1.00
$2.00
$3.00
$4.00
$5.00
VA
CA
NC
YS
QU
AR
E F
EE
T IN
MIL
LIO
NS
FU
LL S
ER
VIC
E R
AT
E
Vacancy Avg. Asking Rate
Gross Absorption Net Absorption New Construction
REVIEWAs 2010 came to a close, San Francisco’s offi ce market had recorded two consecutive quarters of strong occupancy growth and declining vacancy rates. Though tech users led this surge, we also began to see an increase in active space requirements from other sectors of the economy as the year came to an end. Though the fi nancial services sector still remained largely on the sidelines, it appeared that business and personal services users were beginning to return to the marketplace as well. The market closed the year with a vacancy rate of 14.5% and positive annual occupancy growth for the fi rst time since 2007.
The market clearly has entered recovery mode. With the overall Bay Area regional economy beginning to show some signs of life, we see the pace of recovery accelerating in 2011. The booming tech sector will continue to keep absorption totals in the black. The rising tide—lifted by tech—will also translate into job growth in the professional and business services sectors. That being said, the fi nancial services sector still has quite a way to go before it approaches growth mode again. But the good news is that the ongoing trend of consolidations that has been with us for the better part of two years will come to an end by midyear 2011.
FORECASTTotal net absorption for 2010 came in at roughly 654,000 square feet. We are currently tracking about 5.2 million square feet in active space requirements that could potentially land in San Francisco. Based upon this and other factors, our worst-case forecast is that occupancy growth in 2011 will surpass 1.5 million square feet. Most likely this number will come in at about 2 million square feet, and an even more robust economy could see San Francisco backfi lling as much as 2.5 million square feet of offi ce space over the next 12 months. In our most-likely case forecast scenario, vacancy will have decreased from today’s rate of 14.4% to 12.0% by year-end 2011. Throughout the coming year, San Francisco should rank as one of the top fi ve U.S. markets in terms of rental rate growth.
SAN FRANCISCO
OFFICE VACANCY & RATE TREND
OFFICE ABSORPTION & NEW CONSTRUCTION TREND
2006 2007 2008 2009 2010
2006 2007 2008 2009 2010-2
0
2
4
6
8
10
0%
5%
10%
15%
20%
25%
$0.00
$1.00
$2.00
$3.00
$4.00
$5.00
Avg. Asking Rate
VA
CA
NC
YS
QU
AR
E F
EE
T IN
MIL
LIO
NS
FU
LL S
ER
VIC
E R
AT
E
Vacancy
Gross Absorption Net Absorption New Construction
OFFICE OVERVIEW

2011 NORTHERN CALIFORNIA COMMERCIAL REAL ESTATE OVERVIEW 11
OF
FIC
E O
VE
RV
IEW
REVIEWThe Santa Clara County offi ce market entered 2010 with a vacancy rate of 18.8% and over 13.5 million square feet of available space. Vacancy levels actually peaked during the fi rst quarter of the year, topping out at 18.9%. This is where the market fi nally hit bottom after nearly three challenging years. Since that time, vacancy has been on a downward trend. As 2010 came to a close, the overall vacancy rate had dropped to 17.2%. Meanwhile, the market recorded occupancy growth of over 1.6 million square feet for the year—including a robust fourth quarter that alone saw over 680,000 square feet of positive net absorption. Rents are fi nally beginning to show signs of stabilization. The current average asking rent for offi ce space is $2.54 per square foot and has changed little over the last half of 2010. One year ago, this number stood at $2.66 per square foot. Two years ago, this number stood at $3.11.
FORECASTThe market fi nally hit bottom in 2010 and was clearly in recovery mode as the year came to an end. A surge in demand, driven by tech users, was already driving gains in occupancy. A gradually improving economy in 2011 should only intensify this trend. We track active user space requirements in the marketplace and are currently aware of as much as 7.8 million square feet of offi ce and R&D requirements that could land throughout Silicon Valley and the southern San Francisco Peninsula over the next 24 months. We expect deal activity to continue to build velocity heading deeper into 2011 and vacancy rates to fall. That being said, though we do expect robust occupancy growth for offi ce product in 2011, with current vacancy levels in the mid-teens and nearly 12.5 million square feet of existing vacancy to work through, it will take some time before the market achieves equilibrium. Still, look for rental rate growth to begin to occur in the region’s strongest submarkets and best-quality projects in 2011. Market conditions still favor tenants, but the pendulum is beginning to swing the other way. The window for opportunistic tenants to take advantage of today’s reduced rents may be a brief one.
SANTA CLARA
OFFICE VACANCY & RATE TREND
OFFICE ABSORPTION & NEW CONSTRUCTION TREND
2006 2007 2008 2009 2010
2006 2007 2008 2009 2010-2
0
2
4
6
8
10
12
0%
5%
10%
15%
20%
25%
$0.00
$1.00
$2.00
$3.00
$4.00
$5.00
VA
CA
NC
YS
QU
AR
E F
EE
T IN
MIL
LIO
NS
FU
LL S
ER
VIC
E R
AT
E
Vacancy Avg. Asking Rate
Gross Absorption Net Absorption New Construction
I-80/880 CORRIDOR
OFFICE VACANCY & RATE TREND
OFFICE ABSORPTION & NEW CONSTRUCTION TREND
2006 2007 2008 2009 2010
2006 2007 2008 2009 2010-1
0
1
2
3
4
0%
5%
10%
15%
20%
25%
$0.00
$1.00
$2.00
$3.00
$4.00
$5.00
VA
CA
NC
YS
QU
AR
E F
EE
T IN
MIL
LIO
NS
FU
LL S
ER
VIC
E R
AT
E
Vacancy Avg. Asking Rate
Gross Absorption Net Absorption New Construction
REVIEWThe vacancy rate for offi ce space in the East Bay market currently stands at 17.2%. This marks a slight increase from the 16.7% rate recorded during the third quarter of 2010. The market recorded just over 164,000 square feet of positive net absorption in 2010.
Over the past two years, leasing activity in the East Bay has been dominated by user consolidations, early renewals at reduced rates (“blend and extend” deals), and fl ight-to-quality relocations. Though renewals still account for the lion’s share of deal activity, the good news is that the market is fi nally seeing the return of actual growth deals. We track active tenant space requirements in the marketplace, and this number is up signifi cantly from where it stood just one year ago. We are currently aware of over 700,000 square feet of potential offi ce deals in the marketplace that could land over the next 24 months.
The current average asking rent for offi ce space in the region is $2.14 per square foot (on a monthly full service basis). Though there was some minimal movement in both directions over the course of 2010, rental rates have stabilized.
FORECASTWith medical and governmental users having historically driven growth in the East Bay, this market will see little direct growth from the Bay Area’s booming tech sector. But a rising tide lifts all boats, and increased job creation heading into 2011 will help boost demand above today’s levels in the coming year.
Total net absorption for 2010 came in at roughly 164,000 square feet. We are currently tracking about 700,000 million square feet in active space requirements that could potentially land in the East Bay. In 2011, this number will most likely come in at about 300,000 square feet; however, an even more robust economy could see the East Bay backfi lling as much as 400,000 square feet of offi ce space over the next 12 months. In our most-likely-case forecast scenario, vacancy by year-end 2011 will have decreased from today’s rate of 17.2% to 16.1%.
Leasing activity will continue on its upward trajectory in 2011, but the tech bounce that other Bay Area markets feel will be minimal in the East Bay. Rents have stabilized, but it will likely be late 2011 before the East Bay offi ce market sees rental rate growth, and this will be minimal, at best.
12 CASSIDY TURLEY
R&
D O
VE
RV
IEW
R&D OVERVIEW
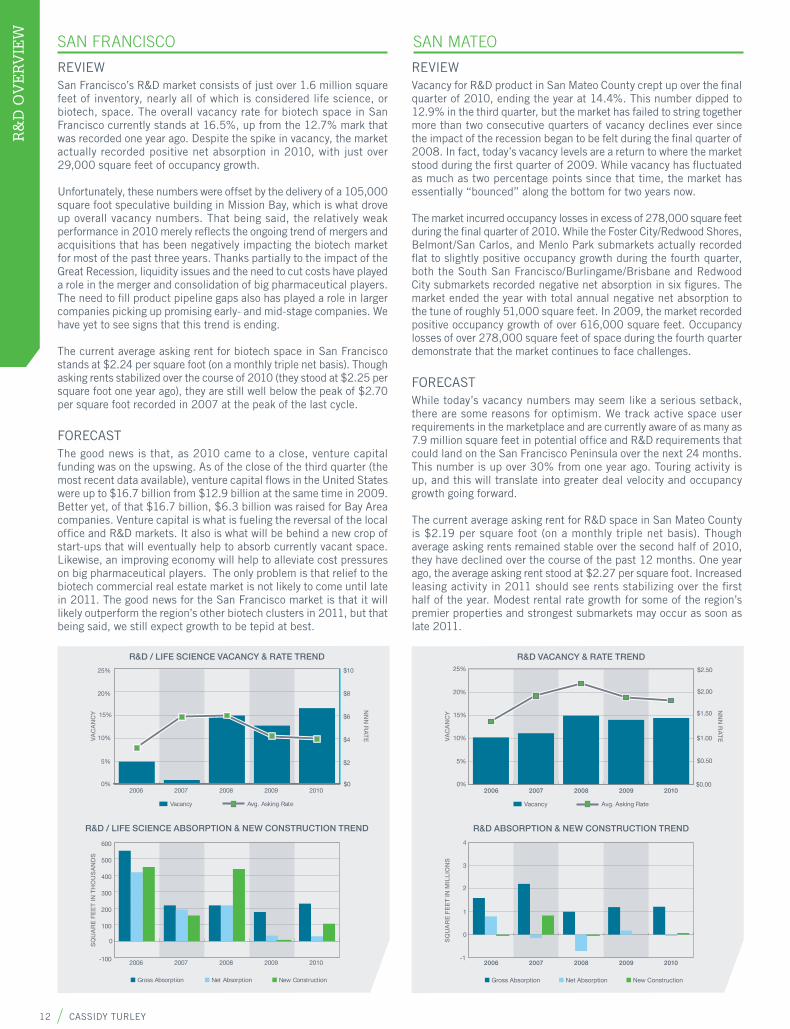
REVIEWSan Francisco’s R&D market consists of just over 1.6 million square feet of inventory, nearly all of which is considered life science, or biotech, space. The overall vacancy rate for biotech space in San Francisco currently stands at 16.5%, up from the 12.7% mark that was recorded one year ago. Despite the spike in vacancy, the market actually recorded positive net absorption in 2010, with just over 29,000 square feet of occupancy growth.
Unfortunately, these numbers were offset by the delivery of a 105,000 square foot speculative building in Mission Bay, which is what drove up overall vacancy numbers. That being said, the relatively weak performance in 2010 merely refl ects the ongoing trend of mergers and acquisitions that has been negatively impacting the biotech market for most of the past three years. Thanks partially to the impact of the Great Recession, liquidity issues and the need to cut costs have played a role in the merger and consolidation of big pharmaceutical players. The need to fi ll product pipeline gaps also has played a role in larger companies picking up promising early- and mid-stage companies. We have yet to see signs that this trend is ending.
The current average asking rent for biotech space in San Francisco stands at $2.24 per square foot (on a monthly triple net basis). Though asking rents stabilized over the course of 2010 (they stood at $2.25 per square foot one year ago), they are still well below the peak of $2.70 per square foot recorded in 2007 at the peak of the last cycle.
FORECASTThe good news is that, as 2010 came to a close, venture capital funding was on the upswing. As of the close of the third quarter (the most recent data available), venture capital fl ows in the United States were up to $16.7 billion from $12.9 billion at the same time in 2009. Better yet, of that $16.7 billion, $6.3 billion was raised for Bay Area companies. Venture capital is what is fueling the reversal of the local offi ce and R&D markets. It also is what will be behind a new crop of start-ups that will eventually help to absorb currently vacant space. Likewise, an improving economy will help to alleviate cost pressures on big pharmaceutical players. The only problem is that relief to the biotech commercial real estate market is not likely to come until late in 2011. The good news for the San Francisco market is that it will likely outperform the region’s other biotech clusters in 2011, but that being said, we still expect growth to be tepid at best.
SAN FRANCISCO SAN MATEO
REVIEWVacancy for R&D product in San Mateo County crept up over the fi nal quarter of 2010, ending the year at 14.4%. This number dipped to 12.9% in the third quarter, but the market has failed to string together more than two consecutive quarters of vacancy declines ever since the impact of the recession began to be felt during the fi nal quarter of 2008. In fact, today’s vacancy levels are a return to where the market stood during the fi rst quarter of 2009. While vacancy has fl uctuated as much as two percentage points since that time, the market has essentially “bounced” along the bottom for two years now.
The market incurred occupancy losses in excess of 278,000 square feet during the fi nal quarter of 2010. While the Foster City/Redwood Shores, Belmont/San Carlos, and Menlo Park submarkets actually recorded fl at to slightly positive occupancy growth during the fourth quarter, both the South San Francisco/Burlingame/Brisbane and Redwood City submarkets recorded negative net absorption in six fi gures. The market ended the year with total annual negative net absorption to the tune of roughly 51,000 square feet. In 2009, the market recorded positive occupancy growth of over 616,000 square feet. Occupancy losses of over 278,000 square feet of space during the fourth quarter demonstrate that the market continues to face challenges.
FORECASTWhile today’s vacancy numbers may seem like a serious setback, there are some reasons for optimism. We track active space user requirements in the marketplace and are currently aware of as many as 7.9 million square feet in potential offi ce and R&D requirements that could land on the San Francisco Peninsula over the next 24 months. This number is up over 30% from one year ago. Touring activity is up, and this will translate into greater deal velocity and occupancy growth going forward.
The current average asking rent for R&D space in San Mateo County is $2.19 per square foot (on a monthly triple net basis). Though average asking rents remained stable over the second half of 2010, they have declined over the course of the past 12 months. One year ago, the average asking rent stood at $2.27 per square foot. Increased leasing activity in 2011 should see rents stabilizing over the fi rst half of the year. Modest rental rate growth for some of the region’s premier properties and strongest submarkets may occur as soon as late 2011.
R&D / LIFE SCIENCE VACANCY & RATE TREND
R&D / LIFE SCIENCE ABSORPTION & NEW CONSTRUCTION TREND
2006 2007 2008 2009 2010
2006 2007 2008 2009 2010-100
0
100
200
300
400
500
600
0%
5%
10%
15%
20%
25%
$0
$2
$4
$6
$8
$10
VA
CA
NC
YS
QU
AR
E F
EE
T IN
TH
OU
SA
ND
S
NN
N R
AT
E
Vacancy Avg. Asking Rate
Gross Absorption Net Absorption New Construction
R&D VACANCY & RATE TREND
R&D ABSORPTION & NEW CONSTRUCTION TREND
2006 2007 2008 2009 2010
2006 2007 2008 2009 2010-1
0
1
2
3
4
0%
5%
10%
15%
20%
25%
$0.00
$0.50
$1.00
$1.50
$2.00
$2.50
VA
CA
NC
YS
QU
AR
E F
EE
T IN
MIL
LIO
NS
NN
N R
AT
E
Vacancy Avg. Asking Rate
Gross Absorption Net Absorption New Construction
2011 NORTHERN CALIFORNIA COMMERCIAL REAL ESTATE OVERVIEW 13
R&
D O
VE
RV
IEW
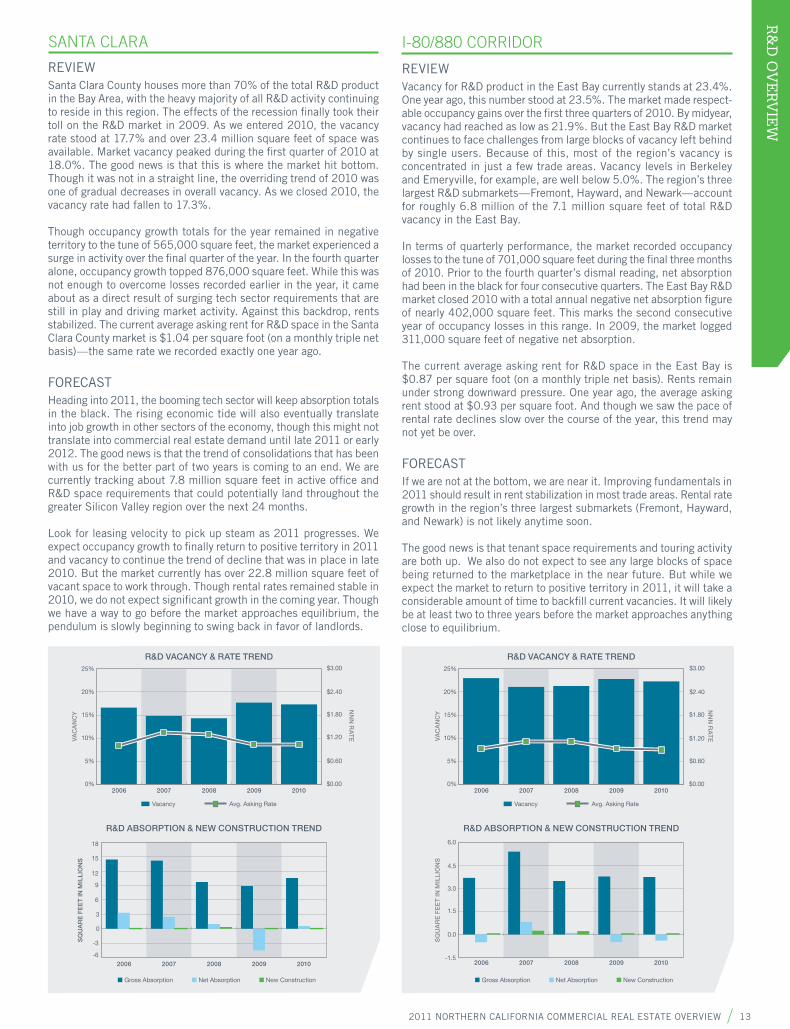
REVIEWSanta Clara County houses more than 70% of the total R&D product in the Bay Area, with the heavy majority of all R&D activity continuing to reside in this region. The effects of the recession fi nally took their toll on the R&D market in 2009. As we entered 2010, the vacancy rate stood at 17.7% and over 23.4 million square feet of space was available. Market vacancy peaked during the fi rst quarter of 2010 at 18.0%. The good news is that this is where the market hit bottom. Though it was not in a straight line, the overriding trend of 2010 was one of gradual decreases in overall vacancy. As we closed 2010, the vacancy rate had fallen to 17.3%.
Though occupancy growth totals for the year remained in negative territory to the tune of 565,000 square feet, the market experienced a surge in activity over the fi nal quarter of the year. In the fourth quarter alone, occupancy growth topped 876,000 square feet. While this was not enough to overcome losses recorded earlier in the year, it came about as a direct result of surging tech sector requirements that are still in play and driving market activity. Against this backdrop, rents stabilized. The current average asking rent for R&D space in the Santa Clara County market is $1.04 per square foot (on a monthly triple net basis)—the same rate we recorded exactly one year ago.
FORECASTHeading into 2011, the booming tech sector will keep absorption totals in the black. The rising economic tide will also eventually translate into job growth in other sectors of the economy, though this might not translate into commercial real estate demand until late 2011 or early 2012. The good news is that the trend of consolidations that has been with us for the better part of two years is coming to an end. We are currently tracking about 7.8 million square feet in active offi ce and R&D space requirements that could potentially land throughout the greater Silicon Valley region over the next 24 months.
Look for leasing velocity to pick up steam as 2011 progresses. We expect occupancy growth to fi nally return to positive territory in 2011 and vacancy to continue the trend of decline that was in place in late 2010. But the market currently has over 22.8 million square feet of vacant space to work through. Though rental rates remained stable in 2010, we do not expect signifi cant growth in the coming year. Though we have a way to go before the market approaches equilibrium, the pendulum is slowly beginning to swing back in favor of landlords.
SANTA CLARA
R&D ABSORPTION & NEW CONSTRUCTION TREND
2006 2007 2008 2009 2010-6
-3
0
3
6
9
12
15
18
R&D VACANCY & RATE TREND
2006 2007 2008 2009 20100%
5%
10%
15%
20%
25%
$0.00
$0.60
$1.20
$2.40
$3.00
$1.80
Vacancy Avg. Asking Rate
SQ
UA
RE
FE
ET
IN M
ILL
ION
S
Gross Absorption Net Absorption New Construction
NN
N R
AT
E
VA
CA
NC
YREVIEWVacancy for R&D product in the East Bay currently stands at 23.4%. One year ago, this number stood at 23.5%. The market made respect-able occupancy gains over the fi rst three quarters of 2010. By midyear, vacancy had reached as low as 21.9%. But the East Bay R&D market continues to face challenges from large blocks of vacancy left behind by single users. Because of this, most of the region’s vacancy is concentrated in just a few trade areas. Vacancy levels in Berkeley and Emeryville, for example, are well below 5.0%. The region’s three largest R&D submarkets—Fremont, Hayward, and Newark—account for roughly 6.8 million of the 7.1 million square feet of total R&D vacancy in the East Bay.
In terms of quarterly performance, the market recorded occupancy losses to the tune of 701,000 square feet during the fi nal three months of 2010. Prior to the fourth quarter’s dismal reading, net absorption had been in the black for four consecutive quarters. The East Bay R&D market closed 2010 with a total annual negative net absorption fi gure of nearly 402,000 square feet. This marks the second consecutive year of occupancy losses in this range. In 2009, the market logged 311,000 square feet of negative net absorption.
The current average asking rent for R&D space in the East Bay is $0.87 per square foot (on a monthly triple net basis). Rents remain under strong downward pressure. One year ago, the average asking rent stood at $0.93 per square foot. And though we saw the pace of rental rate declines slow over the course of the year, this trend may not yet be over.
FORECASTIf we are not at the bottom, we are near it. Improving fundamentals in 2011 should result in rent stabilization in most trade areas. Rental rate growth in the region’s three largest submarkets (Fremont, Hayward, and Newark) is not likely anytime soon.
The good news is that tenant space requirements and touring activity are both up. We also do not expect to see any large blocks of space being returned to the marketplace in the near future. But while we expect the market to return to positive territory in 2011, it will take a considerable amount of time to backfi ll current vacancies. It will likely be at least two to three years before the market approaches anything close to equilibrium.
I-80/880 CORRIDOR
R&D VACANCY & RATE TREND
R&D ABSORPTION & NEW CONSTRUCTION TREND
2006 2007 2008 2009 2010
2006 2007 2008 2009 2010-1.5
0.0
1.5
3.0
4.5
6.0
0%
5%
10%
15%
20%
25%
$0.00
$0.60
$1.20
$1.80
$2.40
$3.00
VA
CA
NC
YS
QU
AR
E F
EE
T IN
MIL
LIO
NS
NN
N R
AT
E
Vacancy Avg. Asking Rate
Gross Absorption Net Absorption New Construction
14 CASSIDY TURLEY
WA
RE
HO
USE
OV
ER
VIE
WWAREHOUSE OVERVIEW
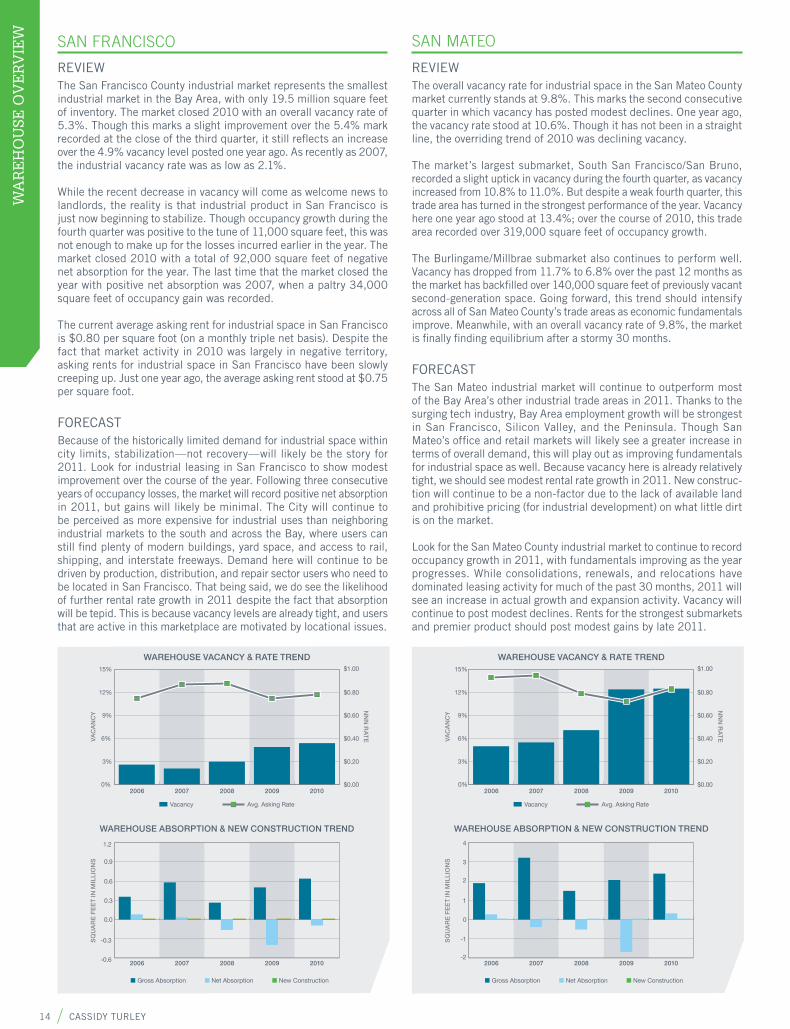
REVIEWThe overall vacancy rate for industrial space in the San Mateo County market currently stands at 9.8%. This marks the second consecutive quarter in which vacancy has posted modest declines. One year ago, the vacancy rate stood at 10.6%. Though it has not been in a straight line, the overriding trend of 2010 was declining vacancy.
The market’s largest submarket, South San Francisco/San Bruno, recorded a slight uptick in vacancy during the fourth quarter, as vacancy increased from 10.8% to 11.0%. But despite a weak fourth quarter, this trade area has turned in the strongest performance of the year. Vacancy here one year ago stood at 13.4%; over the course of 2010, this trade area recorded over 319,000 square feet of occupancy growth.
The Burlingame/Millbrae submarket also continues to perform well. Vacancy has dropped from 11.7% to 6.8% over the past 12 months as the market has backfi lled over 140,000 square feet of previously vacant second-generation space. Going forward, this trend should intensify across all of San Mateo County’s trade areas as economic fundamentals improve. Meanwhile, with an overall vacancy rate of 9.8%, the market is fi nally fi nding equilibrium after a stormy 30 months.
FORECASTThe San Mateo industrial market will continue to outperform most of the Bay Area’s other industrial trade areas in 2011. Thanks to the surging tech industry, Bay Area employment growth will be strongest in San Francisco, Silicon Valley, and the Peninsula. Though San Mateo’s offi ce and retail markets will likely see a greater increase in terms of overall demand, this will play out as improving fundamentals for industrial space as well. Because vacancy here is already relatively tight, we should see modest rental rate growth in 2011. New construc-tion will continue to be a non-factor due to the lack of available land and prohibitive pricing (for industrial development) on what little dirt is on the market.
Look for the San Mateo County industrial market to continue to record occupancy growth in 2011, with fundamentals improving as the year progresses. While consolidations, renewals, and relocations have dominated leasing activity for much of the past 30 months, 2011 will see an increase in actual growth and expansion activity. Vacancy will continue to post modest declines. Rents for the strongest submarkets and premier product should post modest gains by late 2011.
REVIEWThe San Francisco County industrial market represents the smallest industrial market in the Bay Area, with only 19.5 million square feet of inventory. The market closed 2010 with an overall vacancy rate of 5.3%. Though this marks a slight improvement over the 5.4% mark recorded at the close of the third quarter, it still refl ects an increase over the 4.9% vacancy level posted one year ago. As recently as 2007, the industrial vacancy rate was as low as 2.1%.
While the recent decrease in vacancy will come as welcome news to landlords, the reality is that industrial product in San Francisco is just now beginning to stabilize. Though occupancy growth during the fourth quarter was positive to the tune of 11,000 square feet, this was not enough to make up for the losses incurred earlier in the year. The market closed 2010 with a total of 92,000 square feet of negative net absorption for the year. The last time that the market closed the year with positive net absorption was 2007, when a paltry 34,000 square feet of occupancy gain was recorded.
The current average asking rent for industrial space in San Francisco is $0.80 per square foot (on a monthly triple net basis). Despite the fact that market activity in 2010 was largely in negative territory, asking rents for industrial space in San Francisco have been slowly creeping up. Just one year ago, the average asking rent stood at $0.75 per square foot.
FORECASTBecause of the historically limited demand for industrial space within city limits, stabilization—not recovery—will likely be the story for 2011. Look for industrial leasing in San Francisco to show modest improvement over the course of the year. Following three consecutive years of occupancy losses, the market will record positive net absorption in 2011, but gains will likely be minimal. The City will continue to be perceived as more expensive for industrial uses than neighboring industrial markets to the south and across the Bay, where users can still fi nd plenty of modern buildings, yard space, and access to rail, shipping, and interstate freeways. Demand here will continue to be driven by production, distribution, and repair sector users who need to be located in San Francisco. That being said, we do see the likelihood of further rental rate growth in 2011 despite the fact that absorption will be tepid. This is because vacancy levels are already tight, and users that are active in this marketplace are motivated by locational issues.
SAN MATEOSAN FRANCISCO
WAREHOUSE VACANCY & RATE TREND
WAREHOUSE ABSORPTION & NEW CONSTRUCTION TREND
2006 2007 2008 2009 2010
2006 2007 2008 2009 2010-0.6
-0.3
0.0
0.3
0.6
0.9
1.2
0%
3%
6%
9%
12%
15%
$0.00
$0.20
$0.40
$0.60
$0.80
$1.00
VA
CA
NC
YS
QU
AR
E F
EE
T IN
MIL
LIO
NS
NN
N R
AT
E
Vacancy Avg. Asking Rate
Gross Absorption Net Absorption New Construction
WAREHOUSE VACANCY & RATE TREND
WAREHOUSE ABSORPTION & NEW CONSTRUCTION TREND
2006 2007 2008 2009 2010
2006 2007 2008 2009 2010
0%
3%
6%
9%
12%
15%
-2
-1
0
1
2
3
4
$0.00
$0.20
$0.40
$0.60
$0.80
$1.00
VA
CA
NC
YS
QU
AR
E F
EE
T IN
MIL
LIO
NS
NN
N R
AT
E
Vacancy Avg. Asking Rate
Gross Absorption Net Absorption New Construction

2011 NORTHERN CALIFORNIA COMMERCIAL REAL ESTATE OVERVIEW 15
WA
RE
HO
USE
OV
ER
VIE
W
REVIEWThe Santa Clara County warehouse market closed 2010 with an overall vacancy rate of 9.3%. The good news is that this is below the midyear 2010 peak of 9.8%. The bad news is that it is still above the 8.7% level that we saw at the end of 2009. While vacancy remains well below the peak level of 14.0% that we saw at the height of the last market downturn, the fact remains that local warehouse vacancy has remained well above the 8.0% mark for going on three years now. Meanwhile, the Santa Clara warehouse market recorded over 228,000 square feet of occupancy losses over the course of 2010.
The news is not all bad. Though the market ended the year in the red, most of these occupancy losses were incurred over the fi rst half of 2010. And while deal activity in general has been dominated by renewals and consolidations over the past 12 months, we did see an increase in actual growth requirements over the fi nal six months of the year. Meanwhile, rents stabilized over the course of 2010. Today’s current average asking rent of $0.44 per square foot (on a monthly triple net basis) has remained fi rmly in place for going on two years now.
FORECASTWhile it is too soon to say that the market has turned the corner, we do believe that it is currently at—or very near—bottom. Tenant space requirements are up, and our brokers report increased touring activity. Leasing momentum picked up as 2010 came to a close, and this trend, so far, has rolled over into 2011. Improving Bay Area economic fundamentals are already driving recovery for offi ce and retail product, and this will translate into increased demand for warehouse space; unfortunately, the industrial sector will be the last to see this boost. Look for the fi rst half of 2011 to be about stabilization, with signs of modest recovery becoming evident by the fi nal half of the year. The pendulum will slowly begin to swing in favor of landlords. However, with over 2.9 million square feet of space currently available throughout the marketplace, it will take some time before any signifi cant rental rate growth will be possible.
SANTA CLARA
WAREHOUSE VACANCY & RATE TREND
WAREHOUSE ABSORPTION & NEW CONSTRUCTION TREND
2006 2007 2008 2009 2010
2006 2007 2008 2009 2010-1
0
1
2
3
4
0%
3%
6%
9%
12%
15%
$0.00
$0.20
$0.40
$0.60
$0.80
$1.00
VA
CA
NC
YS
QU
AR
E F
EE
T IN
MIL
LIO
NS
NN
N R
AT
E
Vacancy Avg. Asking Rate
Gross Absorption Net Absorption New Construction
REVIEWThe overall vacancy rate for warehouse space in the East Bay currently stands at 10.1%. This marks the second consecutive quarter in which vacancy has held at this rate. It also marks the fourth consecutive quarter of either decreasing or fl at vacancy. The market essentially remained stable throughout 2010. One year ago the vacancy rate stood at 9.9%.
In terms of quarterly performance, the market recorded occupancy losses to the tune of 80,000 square feet during the fourth quarter. Net absorption was in the black during the second and third quarters of 2010, when the market absorbed a combined 490,000 square feet of space. All told, the East Bay warehouse market recorded occupancy losses of nearly 106,000 square feet in 2010. This marks the fourth consecutive year of negative net absorption for this product type. But the news is not all bad. Though negative net absorption means that the economy is contracting, 2010’s loss of 106,000 square feet of occupancy is downright paltry compared to where the market has been.
In 2007, the East Bay warehouse market lost over 945,000 square feet of occupancy. It hemorrhaged just over 1 million square feet in 2008. The market recorded nearly 1.9 million square feet of negative net absorption in 2009. The good news? The bleeding has stopped. While 2010 was a year of stabilization, 2011 will be a year of recovery.
The current average asking rent is $0.37 per square foot (on a monthly triple net basis). The Berkeley submarket leads all trade areas in terms of highest average asking rent, at $0.58 per square foot. The Newark submarket, with an average asking rent of $0.32 per square foot, is the region’s most affordable trade area. While today’s average asking rent of $0.37 per square foot remains virtually unchanged from the previous quarter, this number stood at $0.40 just one year ago. While rents have either stabilized or posted minimal gains in the Emeryville, Oakland, and Hayward submarkets, they continue to face downward pressure in nearly every other trade area.
FORECASTImproving fundamentals in 2011 will result in rent stabilization in most trade areas over the fi rst half of the year. More than likely, it will be 2012 before we see any signifi cant traction for rents.
I-80/880 CORRIDOR
WAREHOUSE VACANCY & RATE TREND
WAREHOUSE ABSORPTION & NEW CONSTRUCTION TREND
2006 2007 2008 2009 2010
2006 2007 2008 2009 2010-3
0
3
6
9
12
0%
3%
6%
9%
12%
15%
$0.00
$0.20
$0.40
$0.60
$0.80
$1.00
VA
CA
NC
YS
QU
AR
E F
EE
T IN
MIL
LIO
NS
NN
N R
AT
E
Vacancy Avg. Asking Rate
Gross Absorption Net Absorption New Construction

16 CASSIDY TURLEY
SHO
PP
ING
CE
NT
ER
OV
ER
VIE
WSHOPPING CENTER OVERVIEW
The San Francisco Bay Area shopping center market closed 2010 with an overall vacancy rate of 6.8%. At the end of 2009, this number stood at 7.6%. The Bay Area continues to rank in the top fi ve U.S. markets in terms of retail activity. The current national average for shopping center vacancy is 10.9%.
This rebound has been led by a surge of activity from a select group of players. Grocery players remain particularly active; Safeway inked a number of deals in 2010 and is looking at as many as six or seven Bay Area openings in 2011. Fresh & Easy fi nally will be launching its Northern California presence beginning in March. The U.K.’s largest retailer has over 40 stores throughout Northern California—some of which have had leases in place for as long as three years—that it will be launching this year.
Grocery Outlet also has been active; the chain has at least 15 new West Coast stores lined up for 2011. In Northern California, this includes new locations in Davis, Fremont, and South San Francisco. Ethnic grocer Mi Pueblo has signed a few recent deals and continues to look for sites. Organic chains Henry’s Farmers Market, Sunfl ower Farmers Market, and Sprouts have also been active, opening new stores in 2010 and continuing to look for sites. Other players on the move include Big Lots!, Save-A-Lot, Stein Mart, 99 Ranch Market, and other players.
Target and Wal-Mart have both been active in the marketplace. Target recently inked deals at the Metreon in San Francisco and has other deals in the works locally. Wal-Mart is looking at adding as many as 12 Sacramento region stores and is also looking in the South Bay and East Bay. Both Target and Wal-Mart are experimenting with new formats. Target is exploring a new smaller urban design while also rolling out its P-Fresh grocery sections to as many as 300 stores this year.
Wal-Mart is looking at opening as many as 300 stores throughout the United States and Canada over the next 30 months, including125,000 square foot or greater Superstores; 80,000 square foot stand-alone grocery stores (the chain acquired a couple of former Mervyns stores for just this purpose); and 30,000 to 40,000 square foot neighbor-hood small-grocery formats. We’ve even heard of a couple of 10,000 square foot urban grocery deals done by Wal-Mart in other markets recently.
Walgreens and CVS both remain active, but we have also seen activity tick up from a wide array of users outside of the grocery, drug, and category killers. Ross Dress for Less, T. J. Maxx, and Marshalls have all inked numerous deals in the region and continue to scout for new sites. Also on the move is 24 Hour Fitness, with as many as four new Bay Area health clubs in its sights. Crunch Fitness is also in the market. Sleep Train has been particularly active, with as many as seven new Bay Area stores slated to open in the next year. The same goes for Mattress Discounters, Goodwill, Tuesday Morning, PETCO, Rochester Big & Tall, and DSW shoe stores.
Restaurant chains continue to drive the market for smaller space. Five Guys Burgers and Fries has been active both in opening units in 2010 and in looking for sites for 2011. Smashburger is reportedly looking to head to the Bay Area after having successfully launched in Sacramento in 2010. Chick-fi l-A is launching locally, with as many as four new restaurants slated to open in the fi rst half of 2011. In-N-Out is also actively looking for sites and opening new restaurants throughout Northern California. Gott’s Roadside, formerly Taylor’s Refresher, is also looking for additional Bay Area locations.
Meanwhile, Yogurtland inked 10 local deals in 2010 and will likely match that number in the coming year. Chipotle, Panda Express, Qdoba, Panera Bread, Sweet Tomatoes, and Rubio’s all remain active. Casual restaurant chains have also boosted their expansion plans. IHOP, Sizzler, Fresh Choice, BJ’s Brewhouse, Johnny Rockets, and Denny’s are just a few chains that either have recently opened new
units or are looking to open restaurants throughout the region over the coming year.
Vacancy within the Bay Area currently stands at 6.8%, indicating continued improvement over the past six months, but this is not to say that recovery for the retail market has been even. Activity throughout 2010 was driven by larger national credit tenants. Discounters, off-price apparel chains, and new grocery players (discount, organic, and ethnic-themed) scoured the market for deals on superior second-generation junior-anchor and big-box space that had been vacated in the last wave of bankruptcies. Roughly 120 million square feet of big-box space has been vacated since 2008. By the close of 2010, just under 40 million square feet of this space had been backfi lled. This trend played out strongly in the Bay Area, where nearly all of the vacant fi rst-tier big-box spaces have now been accounted for.
But if larger deals from box and junior-box users have helped to take large chunks of vacancy off the market, the market for leasing smaller in-line space continues to face some challenges. Activity here was also driven in 2010 by national players. Food concepts, both new and old, were particularly active. But the mom-and-pop sector remains missing in action and is unlikely to return to the marketplace in any large numbers until the housing market begins to recover (home equity loans are the initial line of funding for many of these start-ups). This has had a particularly dire impact on unanchored retail strip centers.
Unfortunately, because our survey tracks only shopping centers of 50,000 square feet or more, strip retail centers are not covered in our statistics. But we estimate strip retail vacancy levels throughout the Bay Area to be two to three times greater than those posted in the region’s larger, anchored shopping centers. The hardest-hit markets, in terms of strip retail vacancy, are those in the Bay Area’s outlying reaches. In many of the communities on the outermost pattern of growth, strip centers were built ahead of housing at the peak of the last real estate cycle.
There are some other factors to consider as well. Retail vacancy is a tricky number to track. Overall vacancy numbers certainly give an accurate big-picture view of the sector’s health, but they don’t tell the full story. Unlike offi ce space, which is largely a commodity property type that varies little beyond simple class distinctions from one market to the next, retail centers have a myriad of other variables that come into play.
Breaking down shopping centers by type—malls, power centers, neighborhood centers, strip, etc.—can help, but this has its limitations as well. This is because the largest single factor impacting vacancy for shopping centers remains location. “Location, location, location” is the old mantra, but the real key to strength in today’s marketplace is location, strong anchors, tenant mix, attractive design/architecture and fi nishes, top-quality property management, and superior leasing teams. That being said, to fully understand what is happening in the retail world, it might be most helpful to break the market into three tiers.
BAY AREA Shopping Center Gross Leasable Area
Neighborhood25%
Other12% Community
38%Strip4%
Power21%
BAY AREA SHOPPING CENTER OVERVIEW
2011 NORTHERN CALIFORNIA COMMERCIAL REAL ESTATE OVERVIEW 17
SHO
PP
ING
CE
NT
ER
OV
ER
VIE
W
First-tier properties are those within vibrant urban marketplaces or located at top suburban intersections or along trade corridors. They boast successful anchor tenants that help drive traffi c to their centers, and they have strong existing tenant mixes. Throughout the Bay Area, fi rst-tier centers are uniformly posting lower vacancy levels and are currently positioned for rental rate growth, if not already achieving it. With a diminished pool of tenants seeking space, these tier-one centers are seeing the most touring activity and the most deals.
Second-tier centers can be situated within vibrant urban marketplaces or even located at top suburban intersections or along trade corridors, but if so, they are lacking in terms of either strong anchor tenants or tenant mix. More often, however, in built-out markets they are in secondary locations—not “on the main drag” but around the corner. They tend to be near the action, but not in it. They also can be in primary locations in small trade areas, such as being the only supermarket-anchored shopping center in a small bedroom commu-nity. These centers are seeing some spillover of deals from the region’s fi rst-tier centers but have had to be much more competitive with their rents to land tenants. Vacancy for these centers remains elevated, though it is slowly improving. Rental rate growth, on the other hand, has largely not happened yet for most of these centers, though many (not all) will be in position to post modest growth later in 2011.
Third-tier centers would be defi ned as the weakest locations within the urban or suburban core, or weaker centers in smaller or rural markets. Unanchored strip retail, with a few exceptions, would largely fall into this category. This category also includes aging shopping centers challenged by obsolescence issues or in dire need of upgrades. With today’s diminished pool of tenants, few are even touring third-tier projects. The deals that are being inked at these centers are almost exclusively value driven—usually with mom-and-pop tenants. The lack of small retail start-ups in the marketplace is having a particularly profound impact on these shopping centers. They almost uniformly boast the highest vacancy levels. Rents are only now beginning to stabilize for this product type (with a few exceptions in both direc-tions), and for these landlords 2011 is less likely to be a year of recovery than one of stabilization.
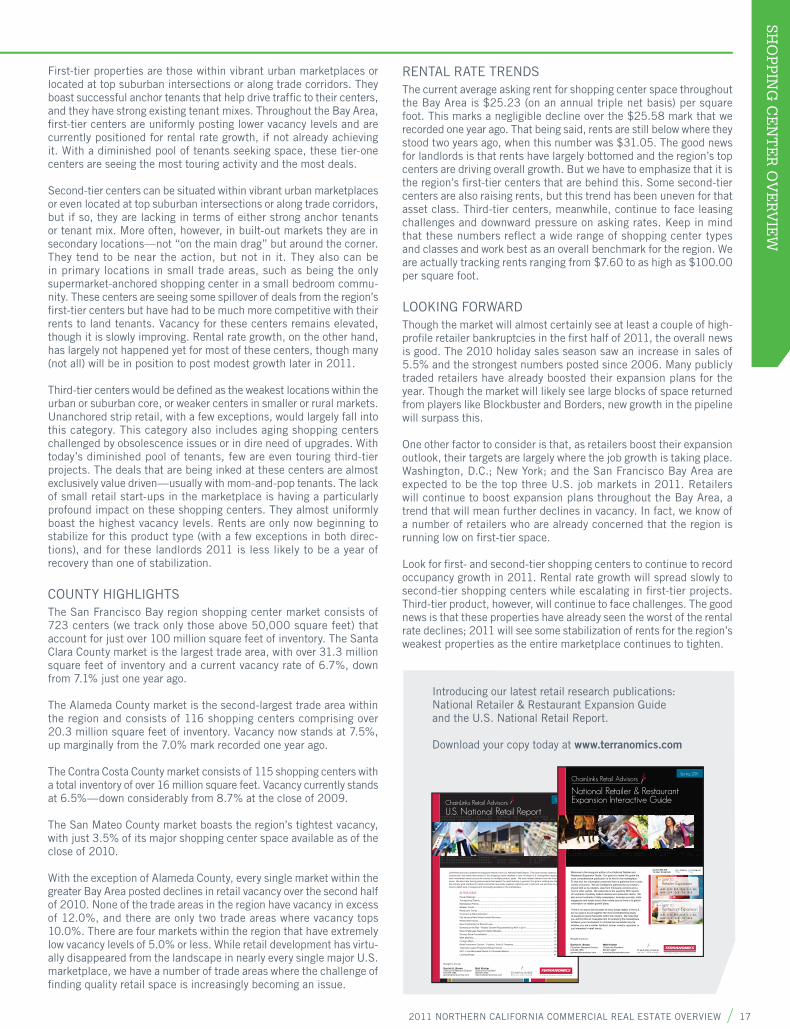
COUNTY HIGHLIGHTSThe San Francisco Bay region shopping center market consists of 723 centers (we track only those above 50,000 square feet) that account for just over 100 million square feet of inventory. The Santa Clara County market is the largest trade area, with over 31.3 million square feet of inventory and a current vacancy rate of 6.7%, down from 7.1% just one year ago.
The Alameda County market is the second-largest trade area within the region and consists of 116 shopping centers comprising over 20.3 million square feet of inventory. Vacancy now stands at 7.5%, up marginally from the 7.0% mark recorded one year ago.
The Contra Costa County market consists of 115 shopping centers with a total inventory of over 16 million square feet. Vacancy currently stands at 6.5%—down considerably from 8.7% at the close of 2009.
The San Mateo County market boasts the region’s tightest vacancy, with just 3.5% of its major shopping center space available as of the close of 2010.
With the exception of Alameda County, every single market within the greater Bay Area posted declines in retail vacancy over the second half of 2010. None of the trade areas in the region have vacancy in excess of 12.0%, and there are only two trade areas where vacancy tops 10.0%. There are four markets within the region that have extremely low vacancy levels of 5.0% or less. While retail development has virtu-ally disappeared from the landscape in nearly every single major U.S. marketplace, we have a number of trade areas where the challenge of fi nding quality retail space is increasingly becoming an issue.
RENTAL RATE TRENDSThe current average asking rent for shopping center space throughout the Bay Area is $25.23 (on an annual triple net basis) per square foot. This marks a negligible decline over the $25.58 mark that we recorded one year ago. That being said, rents are still below where they stood two years ago, when this number was $31.05. The good news for landlords is that rents have largely bottomed and the region’s top centers are driving overall growth. But we have to emphasize that it is the region’s fi rst-tier centers that are behind this. Some second-tier centers are also raising rents, but this trend has been uneven for that asset class. Third-tier centers, meanwhile, continue to face leasing challenges and downward pressure on asking rates. Keep in mind that these numbers refl ect a wide range of shopping center types and classes and work best as an overall benchmark for the region. We are actually tracking rents ranging from $7.60 to as high as $100.00 per square foot.
LOOKING FORWARDThough the market will almost certainly see at least a couple of high-profi le retailer bankruptcies in the fi rst half of 2011, the overall news is good. The 2010 holiday sales season saw an increase in sales of 5.5% and the strongest numbers posted since 2006. Many publicly traded retailers have already boosted their expansion plans for the year. Though the market will likely see large blocks of space returned from players like Blockbuster and Borders, new growth in the pipeline will surpass this.
One other factor to consider is that, as retailers boost their expansion outlook, their targets are largely where the job growth is taking place. Washington, D.C.; New York; and the San Francisco Bay Area are expected to be the top three U.S. job markets in 2011. Retailers will continue to boost expansion plans throughout the Bay Area, a trend that will mean further declines in vacancy. In fact, we know of a number of retailers who are already concerned that the region is running low on fi rst-tier space.
Look for fi rst- and second-tier shopping centers to continue to record occupancy growth in 2011. Rental rate growth will spread slowly to second-tier shopping centers while escalating in fi rst-tier projects. Third-tier product, however, will continue to face challenges. The good news is that these properties have already seen the worst of the rental rate declines; 2011 will see some stabilization of rents for the region’s weakest properties as the entire marketplace continues to tighten.
Spring 2011ChainLinks Retail Advisors
U.S. National Retail Report
Matt KircherChainLinks President650.931.2220 [email protected]
Garrick H. BrownChainLinks Research Director916.329.1558 [email protected]
Brought to you by:
Chainlinks is proud to present the inaugural edition of our U.S. National Retail Report. This report covers vacancy, absorption, construction and rental rate trends for the shopping center markets in over 40 major U.S. metropolitan regions. We also track investment trends across the country for multiple product types. We track retailer demand from the local to national levels. We also track the big picture trends that impact the retail industry in general. Our goal is nothing less than to create the industry gold standard for retail commercial real estate research reporting and to that end, we will strive to give you the most in-depth level of analysis and forecasting available in the marketplace.
IN THIS ISSUEPower Rankings .......................................................................................................................................2
Transactional Trends ...............................................................................................................................2
Marketplace Trends .................................................................................................................................2
Retailer Trends .........................................................................................................................................4
Restaurant Trends ....................................................................................................................................5
Economic & Retail Indicators .................................................................................................................6
Flat Vacancy Rate Hides Uneven Recovery ............................................................................................8
Rental Rate Trends ..................................................................................................................................9
New Construction at Record Lows ........................................................................................................11
Demand on the Rise - Retailer Growth Requirements Up 40% in 2011 ...............................................11
More Challenges Ahead for Media Retailers .........................................................................................13
Grocery Store Consolidation .................................................................................................................13
M&A Madness ........................................................................................................................................15
Foreign Affairs ........................................................................................................................................17
Retail Investment Outlook - Trophies, Trash & ‘Tweeners .....................................................................18
Triple Net Leased Properties Remain Strong ........................................................................................18
2011: From Bifurcated Market to Trifurcated Market ............................................................................19
Looking Ahead .......................................................................................................................................21
Welcome to the inaugural edition of our National Retailer and Restaurant Expansion Guide. Our goal is to make this guide the most comprehensive publication of its kind in the marketplace. To that end, the information presented here is gathered from a wide variety of sources. We use intelligence gathered by our brokers, shared with us by retailers, data from third-party vendors and a host of other parties. We subscribe to the quarterly SEC reports of hundreds of publicly traded retailers and restaurant chains. We also scour hundreds of daily newspapers, business journals, trade magazines and nearly every other media source there is to gather information on retailer growth plans.
There is no way to list the plans of every single retailer in the U.S., but our goal is to put together the most comprehensive study of expansion plans that exists within the industry. We hope that you will find this an invaluable tool for analyzing the marketplace whatever your involvement in commercial real estate may be, whether you are a retailer, landlord, broker, investor, appraiser or just interested in retail trends.
>> JUMP TO Restaurant Expansion
A-B | C-D | E-F | G-H | I -J | K-L M-N | O-P | Q-S | T-V | W-Z
>> JUMP TO Retailer Expansion
A-B | C-D | E-F | G-H | I -J | K-L M-N | O-P | Q-S | T-V | W-Z
Spring 2011
CLICK BELOW TO GET STARTED
ChainLinks Retail Advisors
National Retailer & Restaurant Expansion Interactive Guide
Matt KircherChainLinks President 650.931.2220 [email protected]
Garrick H. BrownChainlinks Research Director 916.329.1558 [email protected]
Brought to you by:
ZOOM IN ZOOM OUT
Introducing our latest retail research publications:National Retailer & Restaurant Expansion Guide and the U.S. National Retail Report.
Download your copy today at www.terranomics.com
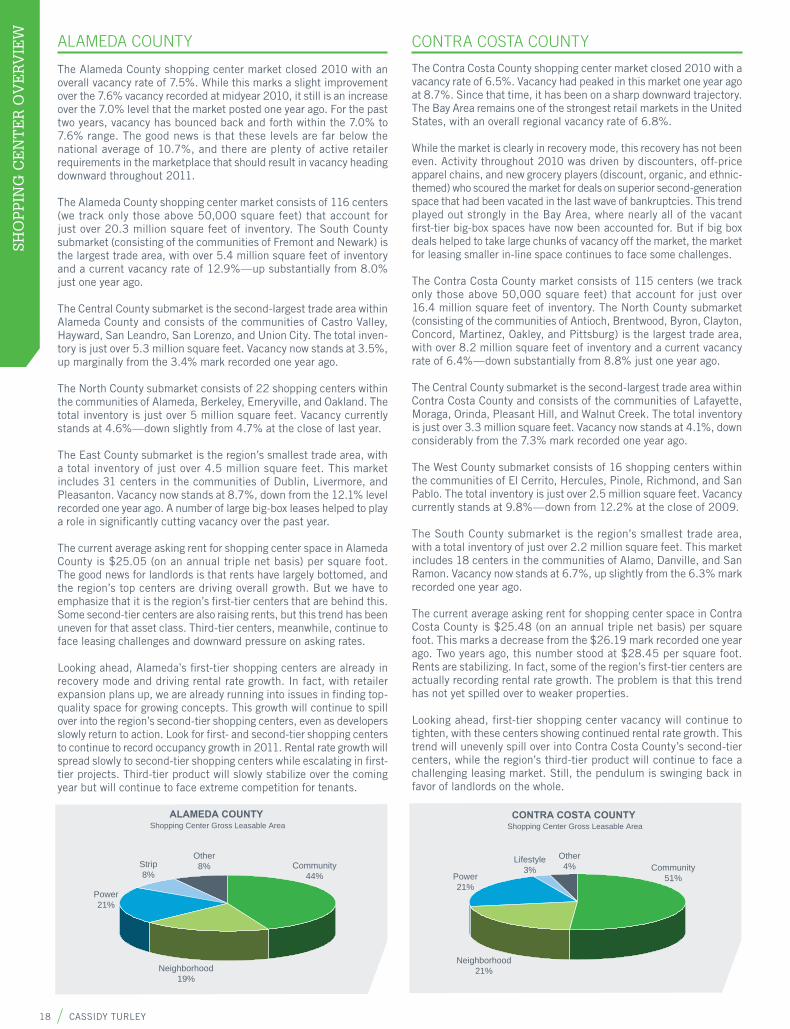
18 CASSIDY TURLEY
SHO
PP
ING
CE
NT
ER
OV
ER
VIE
WSHOPPING CENTER OVERVIEW
The Alameda County shopping center market closed 2010 with an overall vacancy rate of 7.5%. While this marks a slight improvement over the 7.6% vacancy recorded at midyear 2010, it still is an increase over the 7.0% level that the market posted one year ago. For the past two years, vacancy has bounced back and forth within the 7.0% to 7.6% range. The good news is that these levels are far below the national average of 10.7%, and there are plenty of active retailer requirements in the marketplace that should result in vacancy heading downward throughout 2011.
The Alameda County shopping center market consists of 116 centers (we track only those above 50,000 square feet) that account for just over 20.3 million square feet of inventory. The South County submarket (consisting of the communities of Fremont and Newark) is the largest trade area, with over 5.4 million square feet of inventory and a current vacancy rate of 12.9%—up substantially from 8.0% just one year ago.
The Central County submarket is the second-largest trade area within Alameda County and consists of the communities of Castro Valley, Hayward, San Leandro, San Lorenzo, and Union City. The total inven-tory is just over 5.3 million square feet. Vacancy now stands at 3.5%, up marginally from the 3.4% mark recorded one year ago.
The North County submarket consists of 22 shopping centers within the communities of Alameda, Berkeley, Emeryville, and Oakland. The total inventory is just over 5 million square feet. Vacancy currently stands at 4.6%—down slightly from 4.7% at the close of last year.
The East County submarket is the region’s smallest trade area, with a total inventory of just over 4.5 million square feet. This market includes 31 centers in the communities of Dublin, Livermore, and Pleasanton. Vacancy now stands at 8.7%, down from the 12.1% level recorded one year ago. A number of large big-box leases helped to play a role in signifi cantly cutting vacancy over the past year.
The current average asking rent for shopping center space in Alameda County is $25.05 (on an annual triple net basis) per square foot. The good news for landlords is that rents have largely bottomed, and the region’s top centers are driving overall growth. But we have to emphasize that it is the region’s fi rst-tier centers that are behind this. Some second-tier centers are also raising rents, but this trend has been uneven for that asset class. Third-tier centers, meanwhile, continue to face leasing challenges and downward pressure on asking rates.
Looking ahead, Alameda’s fi rst-tier shopping centers are already in recovery mode and driving rental rate growth. In fact, with retailer expansion plans up, we are already running into issues in fi nding top-quality space for growing concepts. This growth will continue to spill over into the region’s second-tier shopping centers, even as developers slowly return to action. Look for fi rst- and second-tier shopping centers to continue to record occupancy growth in 2011. Rental rate growth will spread slowly to second-tier shopping centers while escalating in fi rst-tier projects. Third-tier product will slowly stabilize over the coming year but will continue to face extreme competition for tenants.
ALAMEDA COUNTY
ALAMEDA COUNTY Shopping Center Gross Leasable Area
Neighborhood19%
Power21%
Strip8%
Community44%
Other8%
The Contra Costa County shopping center market closed 2010 with a vacancy rate of 6.5%. Vacancy had peaked in this market one year ago at 8.7%. Since that time, it has been on a sharp downward trajectory. The Bay Area remains one of the strongest retail markets in the United States, with an overall regional vacancy rate of 6.8%.
While the market is clearly in recovery mode, this recovery has not been even. Activity throughout 2010 was driven by discounters, off-price apparel chains, and new grocery players (discount, organic, and ethnic-themed) who scoured the market for deals on superior second-generation space that had been vacated in the last wave of bankruptcies. This trend played out strongly in the Bay Area, where nearly all of the vacant fi rst-tier big-box spaces have now been accounted for. But if big box deals helped to take large chunks of vacancy off the market, the market for leasing smaller in-line space continues to face some challenges.
The Contra Costa County market consists of 115 centers (we track only those above 50,000 square feet) that account for just over 16.4 million square feet of inventory. The North County submarket (consisting of the communities of Antioch, Brentwood, Byron, Clayton, Concord, Martinez, Oakley, and Pittsburg) is the largest trade area, with over 8.2 million square feet of inventory and a current vacancy rate of 6.4%—down substantially from 8.8% just one year ago.
The Central County submarket is the second-largest trade area within Contra Costa County and consists of the communities of Lafayette, Moraga, Orinda, Pleasant Hill, and Walnut Creek. The total inventory is just over 3.3 million square feet. Vacancy now stands at 4.1%, down considerably from the 7.3% mark recorded one year ago.
The West County submarket consists of 16 shopping centers within the communities of El Cerrito, Hercules, Pinole, Richmond, and San Pablo. The total inventory is just over 2.5 million square feet. Vacancy currently stands at 9.8%—down from 12.2% at the close of 2009.
The South County submarket is the region’s smallest trade area, with a total inventory of just over 2.2 million square feet. This market includes 18 centers in the communities of Alamo, Danville, and San Ramon. Vacancy now stands at 6.7%, up slightly from the 6.3% mark recorded one year ago.
The current average asking rent for shopping center space in Contra Costa County is $25.48 (on an annual triple net basis) per square foot. This marks a decrease from the $26.19 mark recorded one year ago. Two years ago, this number stood at $28.45 per square foot. Rents are stabilizing. In fact, some of the region’s fi rst-tier centers are actually recording rental rate growth. The problem is that this trend has not yet spilled over to weaker properties.
Looking ahead, fi rst-tier shopping center vacancy will continue to tighten, with these centers showing continued rental rate growth. This trend will unevenly spill over into Contra Costa County’s second-tier centers, while the region’s third-tier product will continue to face a challenging leasing market. Still, the pendulum is swinging back in favor of landlords on the whole.
CONTRA COSTA COUNTY
CONTRA COSTA COUNTY Shopping Center Gross Leasable Area
Neighborhood21%
Power21%
Other4% Community
51%
Lifestyle3%
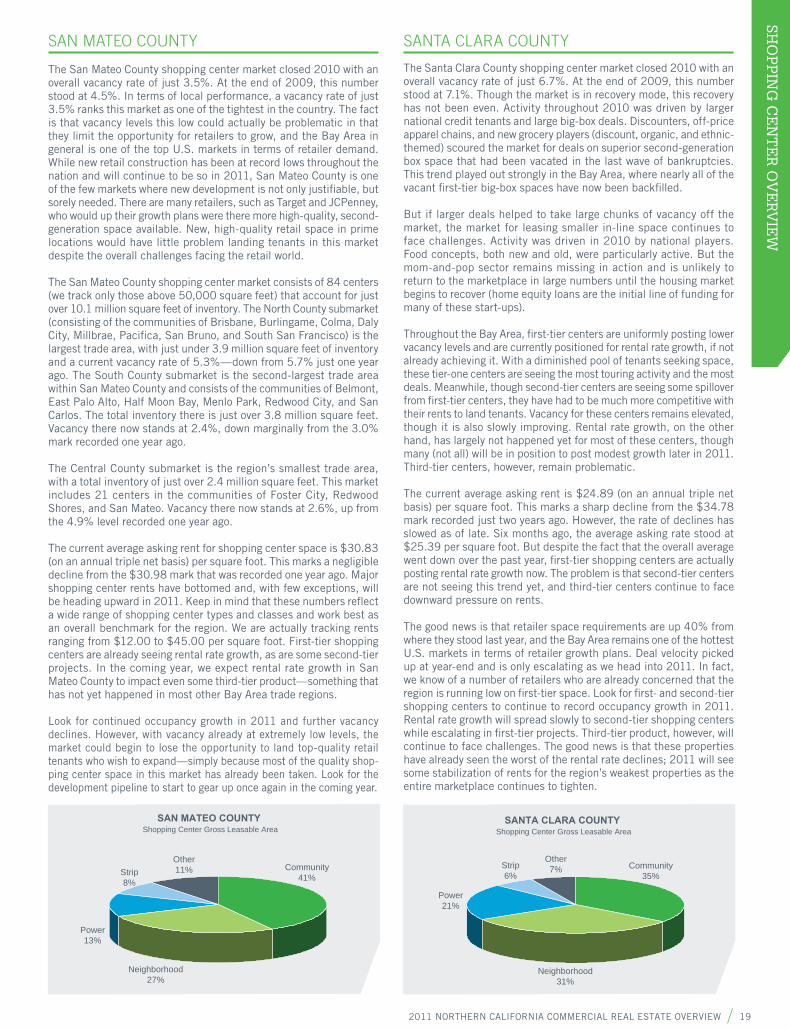
2011 NORTHERN CALIFORNIA COMMERCIAL REAL ESTATE OVERVIEW 19
SHO
PP
ING
CE
NT
ER
OV
ER
VIE
W
The San Mateo County shopping center market closed 2010 with an overall vacancy rate of just 3.5%. At the end of 2009, this number stood at 4.5%. In terms of local performance, a vacancy rate of just 3.5% ranks this market as one of the tightest in the country. The fact is that vacancy levels this low could actually be problematic in that they limit the opportunity for retailers to grow, and the Bay Area in general is one of the top U.S. markets in terms of retailer demand. While new retail construction has been at record lows throughout the nation and will continue to be so in 2011, San Mateo County is one of the few markets where new development is not only justifi able, but sorely needed. There are many retailers, such as Target and JCPenney, who would up their growth plans were there more high-quality, second-generation space available. New, high-quality retail space in prime locations would have little problem landing tenants in this market despite the overall challenges facing the retail world.
The San Mateo County shopping center market consists of 84 centers (we track only those above 50,000 square feet) that account for just over 10.1 million square feet of inventory. The North County submarket (consisting of the communities of Brisbane, Burlingame, Colma, Daly City, Millbrae, Pacifi ca, San Bruno, and South San Francisco) is the largest trade area, with just under 3.9 million square feet of inventory and a current vacancy rate of 5.3%—down from 5.7% just one year ago. The South County submarket is the second-largest trade area within San Mateo County and consists of the communities of Belmont, East Palo Alto, Half Moon Bay, Menlo Park, Redwood City, and San Carlos. The total inventory there is just over 3.8 million square feet. Vacancy there now stands at 2.4%, down marginally from the 3.0% mark recorded one year ago.
The Central County submarket is the region’s smallest trade area, with a total inventory of just over 2.4 million square feet. This market includes 21 centers in the communities of Foster City, Redwood Shores, and San Mateo. Vacancy there now stands at 2.6%, up from the 4.9% level recorded one year ago.
The current average asking rent for shopping center space is $30.83 (on an annual triple net basis) per square foot. This marks a negligible decline from the $30.98 mark that was recorded one year ago. Major shopping center rents have bottomed and, with few exceptions, will be heading upward in 2011. Keep in mind that these numbers refl ect a wide range of shopping center types and classes and work best as an overall benchmark for the region. We are actually tracking rents ranging from $12.00 to $45.00 per square foot. First-tier shopping centers are already seeing rental rate growth, as are some second-tier projects. In the coming year, we expect rental rate growth in San Mateo County to impact even some third-tier product—something that has not yet happened in most other Bay Area trade regions.
Look for continued occupancy growth in 2011 and further vacancy declines. However, with vacancy already at extremely low levels, the market could begin to lose the opportunity to land top-quality retail tenants who wish to expand—simply because most of the quality shop-ping center space in this market has already been taken. Look for the development pipeline to start to gear up once again in the coming year.
SAN MATEO COUNTY
SAN MATEO COUNTY Shopping Center Gross Leasable Area
Neighborhood27%
Power13%
Strip8%
Community41%
Other11%
SANTA CLARA COUNTY
The Santa Clara County shopping center market closed 2010 with an overall vacancy rate of just 6.7%. At the end of 2009, this number stood at 7.1%. Though the market is in recovery mode, this recovery has not been even. Activity throughout 2010 was driven by larger national credit tenants and large big-box deals. Discounters, off-price apparel chains, and new grocery players (discount, organic, and ethnic-themed) scoured the market for deals on superior second-generation box space that had been vacated in the last wave of bankruptcies. This trend played out strongly in the Bay Area, where nearly all of the vacant fi rst-tier big-box spaces have now been backfi lled.
But if larger deals helped to take large chunks of vacancy off the market, the market for leasing smaller in-line space continues to face challenges. Activity was driven in 2010 by national players. Food concepts, both new and old, were particularly active. But the mom-and-pop sector remains missing in action and is unlikely to return to the marketplace in large numbers until the housing market begins to recover (home equity loans are the initial line of funding for many of these start-ups).
Throughout the Bay Area, fi rst-tier centers are uniformly posting lower vacancy levels and are currently positioned for rental rate growth, if not already achieving it. With a diminished pool of tenants seeking space, these tier-one centers are seeing the most touring activity and the most deals. Meanwhile, though second-tier centers are seeing some spillover from fi rst-tier centers, they have had to be much more competitive with their rents to land tenants. Vacancy for these centers remains elevated, though it is also slowly improving. Rental rate growth, on the other hand, has largely not happened yet for most of these centers, though many (not all) will be in position to post modest growth later in 2011. Third-tier centers, however, remain problematic.
The current average asking rent is $24.89 (on an annual triple net basis) per square foot. This marks a sharp decline from the $34.78 mark recorded just two years ago. However, the rate of declines has slowed as of late. Six months ago, the average asking rate stood at $25.39 per square foot. But despite the fact that the overall average went down over the past year, fi rst-tier shopping centers are actually posting rental rate growth now. The problem is that second-tier centers are not seeing this trend yet, and third-tier centers continue to face downward pressure on rents.
The good news is that retailer space requirements are up 40% from where they stood last year, and the Bay Area remains one of the hottest U.S. markets in terms of retailer growth plans. Deal velocity picked up at year-end and is only escalating as we head into 2011. In fact, we know of a number of retailers who are already concerned that the region is running low on fi rst-tier space. Look for fi rst- and second-tier shopping centers to continue to record occupancy growth in 2011. Rental rate growth will spread slowly to second-tier shopping centers while escalating in fi rst-tier projects. Third-tier product, however, will continue to face challenges. The good news is that these properties have already seen the worst of the rental rate declines; 2011 will see some stabilization of rents for the region’s weakest properties as the entire marketplace continues to tighten.
SANTA CLARA COUNTY Shopping Center Gross Leasable Area
Neighborhood31%
Power21%
Other7% Community
35%Strip6%

20 CASSIDY TURLEY
SHO
PP
ING
CE
NT
ER
OV
ER
VIE
WSHOPPING CENTER OVERVIEW
MARIN COUNTY
The Marin County shopping center market closed 2010 with an overall vacancy rate of just 4.4%. At the end of 2009, this number stood at 6.3%. Vacancy peaked in the region at the midyear mark of 2009 at 6.4% but has been heading steadily downward ever since. The Marin County shopping center market consists of 36 centers (we track only those above 50,000 square feet) that account for just over 3.7 million square feet of inventory.
The North County submarket (consisting of San Rafael and Novato) is the largest trade area, with over 1.9 million square feet of inventory and a current vacancy rate of 3.9%—down from 8.6% just one year ago. The Central County submarket consists of the communities of Corte Madera, Greenbrae, San Anselmo, Fairfax, and Larkspur. The total inventory there is just over 1 million square feet. Vacancy now stands at 6.0%, down from 6.4% one year ago. The South County submarket is the region’s smallest trade area, with a total inventory of just under 700,000 square feet. This market includes eight shopping centers in the communities of Marin City, Mill Valley, and Tiburon. Vacancy there now stands at 3.4%, down from 4.8% one year ago.
The current average asking rent for shopping center space in Marin County is $29.42 (on an annual triple net basis) per square foot. This marks a sharp decline from the $33.78 mark that was recorded just one year ago, but it also marks an increase over the $27.87 rate recorded two years ago. Keep in mind, however, that these numbers refl ect a wide range of shopping center types and classes and work best as an overall benchmark for the region. We are actually tracking rents ranging from $15.00 to $60.00 per square foot. And, as we discussed earlier in our report, despite the fact that the overall average went down over the past year, fi rst-tier shopping centers are actually posting rental rate growth now. The problem is that second-tier centers are not seeing this trend yet, and third-tier centers continue to face downward pressure on rents.
In terms of the submarket with the highest rents in the marketplace, the Central County leads all other areas, with a current average asking rate of $35.91 per square foot. Rents there range from $16.20 to $60.00 per square foot. In terms of rents within local communities, Mill Valley continues to lead the pack, with an average asking rate of $44.80 per square foot and a typical range of $42.00 to $54.00 per square foot.
The Marin market currently boasts one of the lowest vacancy rates of any Bay Area trade area and already has a shortage of available fi rst-tier locations. With retailer demand up substantially, look for the market to continue to tighten. Second- and third-tier centers will increasingly benefi t from the overall tightness in the marketplace, and rental rate growth should be robust in 2011. The only problem is that some growth opportunities could be lost because of the limited amount of space available. Look for developers to increasingly return to the marketplace in the coming months.
The Sonoma County shopping center market closed 2010 with an overall vacancy rate of 11.9%. At the end of 2009, this number stood at 13.1%. While vacancy levels are still elevated, the market has made great strides over the past year.
The Sonoma County shopping center market consists of 44 centers that account for just over 5.4 million square feet of inventory. The Central County submarket (which includes the communities of Cotati, Rohnert Park, and Santa Rosa) is the largest trade area, with over 3.3 million square feet of inventory and a current vacancy rate of 13.7%—down from 15.2% just one year ago. The South County submarket is the second-largest trade area within Sonoma County and has a total inventory of just under 1.3 million square feet. The communities of Petaluma and Sonoma are included in this trade area. Vacancy there now stands at 12.2%—a slight increase from the 12.0% mark recorded one year ago. The North County submarket is the smallest of Sonoma’s trade areas, with just under 800,000 square feet of inventory. Vacancy there now stands at just 3.3%, down from the 5.8% level recorded one year ago.
The current average asking rent for shopping center space in Sonoma County is $20.29 (on an annual triple net basis) per square foot. This marks a sharp decline from the $27.19 mark that was recorded just two years ago. Since that time, the overall average has been on a downward trajectory. However, the rate of decline has slowed as of late—most of the damage done occurred in 2009. One year ago, the average asking rate stood at $22.90 per square foot. But the deeper story behind these numbers is that fi rst-tier shopping centers are actually posting rental rate growth now. The problem is that second-tier centers are not seeing this trend yet, and third-tier centers continue to face downward pressure on rents. In terms of the submarket with the highest rents in the marketplace, the Healdsburg trade area leads all other areas, with a current average asking rate of $27.00 per square foot.
Though the market will almost certainly see at least a couple of high-profi le retailer bankruptcies over the fi rst half of 2011 (as this report went to press, Borders had just announced Chapter 11 reorganization and plans to close a minimum of 200 stores by April), the overall news is good. The holiday sales season of 2010 saw an increase in sales of 5.5% and the strongest numbers posted since 2006. Many publicly traded retailers have already boosted their expansion plans for the year. Though the market will likely see large blocks of space returned from players like Blockbuster and Borders, new growth in the pipeline will surpass this.
The San Francisco Bay Area remains one of the top fi ve markets in the United States in terms of retailer expansion plans. In fact, we know of a number of retailers who are already concerned that the region is running low on fi rst-tier space. Look for fi rst- and second-tier shopping centers to continue to record occupancy growth in 2011. Rental rate growth will spread slowly to second-tier shopping centers while escalating in fi rst-tier projects. Third-tier product, however, will continue to face challenges, but these properties have already seen the worst of the rental rate declines.
SONOMA COUNTY
MARIN COUNTY Shopping Center Gross Leasable Area
Neighborhood35%
Power21%
Specialty11%
Community20%
Other13%
SONOMA COUNTYShopping Center Gross Leasable Area
Neighborhood29%
Free-Standing1% Community
39%
Strip1%Power
30%
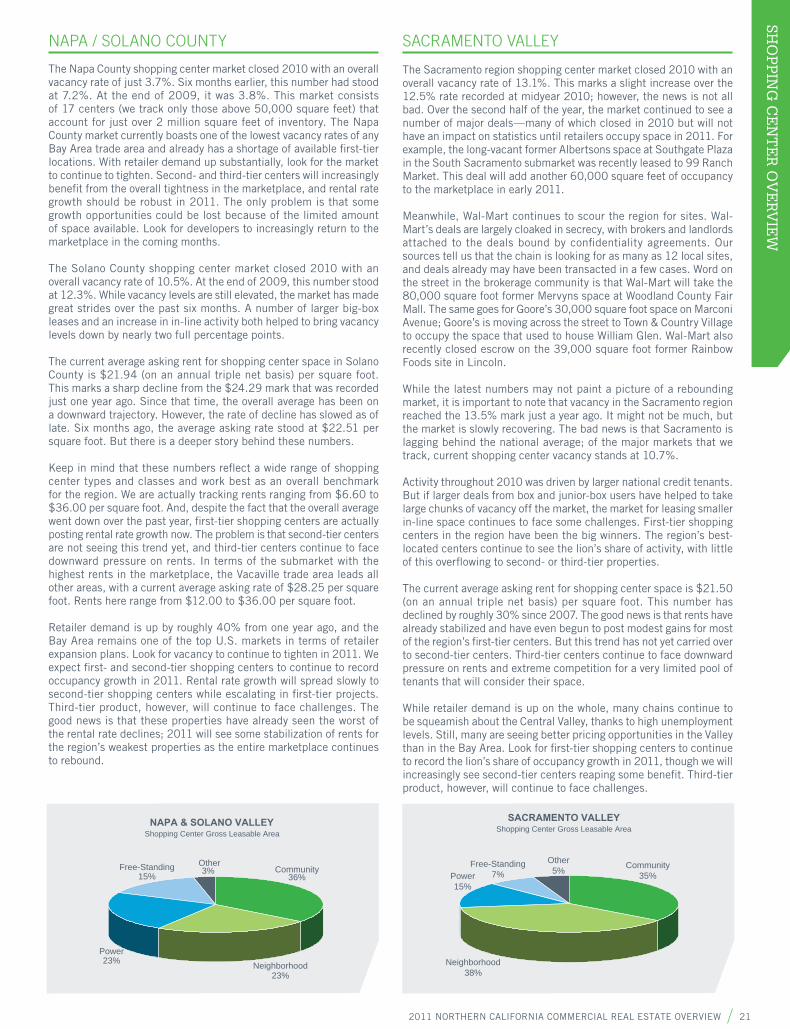
2011 NORTHERN CALIFORNIA COMMERCIAL REAL ESTATE OVERVIEW 21
SHO
PP
ING
CE
NT
ER
OV
ER
VIE
W
The Sacramento region shopping center market closed 2010 with an overall vacancy rate of 13.1%. This marks a slight increase over the 12.5% rate recorded at midyear 2010; however, the news is not all bad. Over the second half of the year, the market continued to see a number of major deals—many of which closed in 2010 but will not have an impact on statistics until retailers occupy space in 2011. For example, the long-vacant former Albertsons space at Southgate Plaza in the South Sacramento submarket was recently leased to 99 Ranch Market. This deal will add another 60,000 square feet of occupancy to the marketplace in early 2011.
Meanwhile, Wal-Mart continues to scour the region for sites. Wal-Mart’s deals are largely cloaked in secrecy, with brokers and landlords attached to the deals bound by confi dentiality agreements. Our sources tell us that the chain is looking for as many as 12 local sites, and deals already may have been transacted in a few cases. Word on the street in the brokerage community is that Wal-Mart will take the 80,000 square foot former Mervyns space at Woodland County Fair Mall. The same goes for Goore’s 30,000 square foot space on Marconi Avenue; Goore’s is moving across the street to Town & Country Village to occupy the space that used to house William Glen. Wal-Mart also recently closed escrow on the 39,000 square foot former Rainbow Foods site in Lincoln.
While the latest numbers may not paint a picture of a rebounding market, it is important to note that vacancy in the Sacramento region reached the 13.5% mark just a year ago. It might not be much, but the market is slowly recovering. The bad news is that Sacramento is lagging behind the national average; of the major markets that we track, current shopping center vacancy stands at 10.7%.
Activity throughout 2010 was driven by larger national credit tenants. But if larger deals from box and junior-box users have helped to take large chunks of vacancy off the market, the market for leasing smaller in-line space continues to face some challenges. First-tier shopping centers in the region have been the big winners. The region’s best-located centers continue to see the lion’s share of activity, with little of this overfl owing to second- or third-tier properties.
The current average asking rent for shopping center space is $21.50 (on an annual triple net basis) per square foot. This number has declined by roughly 30% since 2007. The good news is that rents have already stabilized and have even begun to post modest gains for most of the region’s fi rst-tier centers. But this trend has not yet carried over to second-tier centers. Third-tier centers continue to face downward pressure on rents and extreme competition for a very limited pool of tenants that will consider their space.
While retailer demand is up on the whole, many chains continue to be squeamish about the Central Valley, thanks to high unemployment levels. Still, many are seeing better pricing opportunities in the Valley than in the Bay Area. Look for fi rst-tier shopping centers to continue to record the lion’s share of occupancy growth in 2011, though we will increasingly see second-tier centers reaping some benefi t. Third-tier product, however, will continue to face challenges.
NAPA / SOLANO COUNTY SACRAMENTO VALLEY
The Napa County shopping center market closed 2010 with an overall vacancy rate of just 3.7%. Six months earlier, this number had stood at 7.2%. At the end of 2009, it was 3.8%. This market consists of 17 centers (we track only those above 50,000 square feet) that account for just over 2 million square feet of inventory. The Napa County market currently boasts one of the lowest vacancy rates of any Bay Area trade area and already has a shortage of available fi rst-tier locations. With retailer demand up substantially, look for the market to continue to tighten. Second- and third-tier centers will increasingly benefi t from the overall tightness in the marketplace, and rental rate growth should be robust in 2011. The only problem is that some growth opportunities could be lost because of the limited amount of space available. Look for developers to increasingly return to the marketplace in the coming months.
The Solano County shopping center market closed 2010 with an overall vacancy rate of 10.5%. At the end of 2009, this number stood at 12.3%. While vacancy levels are still elevated, the market has made great strides over the past six months. A number of larger big-box leases and an increase in in-line activity both helped to bring vacancy levels down by nearly two full percentage points.
The current average asking rent for shopping center space in Solano County is $21.94 (on an annual triple net basis) per square foot. This marks a sharp decline from the $24.29 mark that was recorded just one year ago. Since that time, the overall average has been on a downward trajectory. However, the rate of decline has slowed as of late. Six months ago, the average asking rate stood at $22.51 per square foot. But there is a deeper story behind these numbers.
Keep in mind that these numbers refl ect a wide range of shopping center types and classes and work best as an overall benchmark for the region. We are actually tracking rents ranging from $6.60 to $36.00 per square foot. And, despite the fact that the overall average went down over the past year, fi rst-tier shopping centers are actually posting rental rate growth now. The problem is that second-tier centers are not seeing this trend yet, and third-tier centers continue to face downward pressure on rents. In terms of the submarket with the highest rents in the marketplace, the Vacaville trade area leads all other areas, with a current average asking rate of $28.25 per square foot. Rents here range from $12.00 to $36.00 per square foot.
Retailer demand is up by roughly 40% from one year ago, and the Bay Area remains one of the top U.S. markets in terms of retailer expansion plans. Look for vacancy to continue to tighten in 2011. We expect fi rst- and second-tier shopping centers to continue to record occupancy growth in 2011. Rental rate growth will spread slowly to second-tier shopping centers while escalating in fi rst-tier projects. Third-tier product, however, will continue to face challenges. The good news is that these properties have already seen the worst of the rental rate declines; 2011 will see some stabilization of rents for the region’s weakest properties as the entire marketplace continues to rebound.
SACRAMENTO VALLEYShopping Center Gross Leasable Area
Neighborhood38%
Other5% Community
35%Free-Standing
7%Power15%
NAPA & SOLANO VALLEYShopping Center Gross Leasable Area
Neighborhood23%
Other3% Community
36%Free-Standing
15%
Power23%
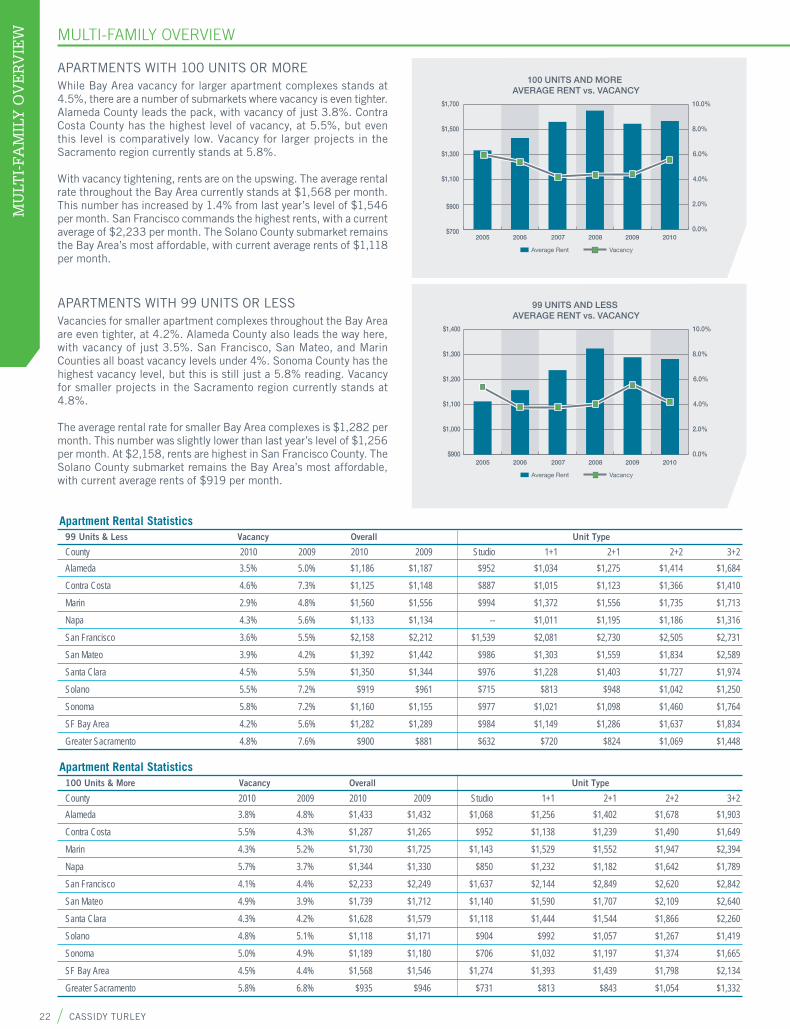
22 CASSIDY TURLEY
MU
LTI-
FAM
ILY
OV
ER
VIE
WMULTI FAMILY OVERVIEW
$900
$1,000
$1,100
$1,200
$1,300
$1,400
0.0%
2.0%
4.0%
6.0%
8.0%
10.0%
99 UNITS AND LESS AVERAGE RENT vs. VACANCY
Average Rent Vacancy
2005 2006 2007 2008 2009 2010
$700
$900
$1,100
$1,300
$1,500
$1,700
0.0%
2.0%
4.0%
6.0%
8.0%
10.0%
100 UNITS AND MORE AVERAGE RENT vs. VACANCY
Average Rent Vacancy
2005 2006 2007 2008 2009 2010
APARTMENTS WITH 100 UNITS OR MOREWhile Bay Area vacancy for larger apartment complexes stands at 4.5%, there are a number of submarkets where vacancy is even tighter. Alameda County leads the pack, with vacancy of just 3.8%. Contra Costa County has the highest level of vacancy, at 5.5%, but even this level is comparatively low. Vacancy for larger projects in the Sacramento region currently stands at 5.8%.
With vacancy tightening, rents are on the upswing. The average rental rate throughout the Bay Area currently stands at $1,568 per month. This number has increased by 1.4% from last year’s level of $1,546 per month. San Francisco commands the highest rents, with a current average of $2,233 per month. The Solano County submarket remains the Bay Area’s most affordable, with current average rents of $1,118 per month.
APARTMENTS WITH 99 UNITS OR LESSVacancies for smaller apartment complexes throughout the Bay Area are even tighter, at 4.2%. Alameda County also leads the way here, with vacancy of just 3.5%. San Francisco, San Mateo, and Marin Counties all boast vacancy levels under 4%. Sonoma County has the highest vacancy level, but this is still just a 5.8% reading. Vacancy for smaller projects in the Sacramento region currently stands at 4.8%.
The average rental rate for smaller Bay Area complexes is $1,282 per month. This number was slightly lower than last year’s level of $1,256 per month. At $2,158, rents are highest in San Francisco County. The Solano County submarket remains the Bay Area’s most affordable, with current average rents of $919 per month.
Apartment Rental Statistics99 Units & Less Vacancy Overall Unit Type
County 2010 2009 2010 2009 Studio 1+1 2+1 2+2 3+2Alameda 3.5% 5.0% $1,186 $1,187 $952 $1,034 $1,275 $1,414 $1,684Contra Costa 4.6% 7.3% $1,125 $1,148 $887 $1,015 $1,123 $1,366 $1,410Marin 2.9% 4.8% $1,560 $1,556 $994 $1,372 $1,556 $1,735 $1,713Napa 4.3% 5.6% $1,133 $1,134 -- $1,011 $1,195 $1,186 $1,316San Francisco 3.6% 5.5% $2,158 $2,212 $1,539 $2,081 $2,730 $2,505 $2,731San Mateo 3.9% 4.2% $1,392 $1,442 $986 $1,303 $1,559 $1,834 $2,589Santa Clara 4.5% 5.5% $1,350 $1,344 $976 $1,228 $1,403 $1,727 $1,974Solano 5.5% 7.2% $919 $961 $715 $813 $948 $1,042 $1,250Sonoma 5.8% 7.2% $1,160 $1,155 $977 $1,021 $1,098 $1,460 $1,764SF Bay Area 4.2% 5.6% $1,282 $1,289 $984 $1,149 $1,286 $1,637 $1,834Greater Sacramento 4.8% 7.6% $900 $881 $632 $720 $824 $1,069 $1,448
Apartment Rental Statistics100 Units & More Vacancy Overall Unit Type
County 2010 2009 2010 2009 Studio 1+1 2+1 2+2 3+2Alameda 3.8% 4.8% $1,433 $1,432 $1,068 $1,256 $1,402 $1,678 $1,903Contra Costa 5.5% 4.3% $1,287 $1,265 $952 $1,138 $1,239 $1,490 $1,649Marin 4.3% 5.2% $1,730 $1,725 $1,143 $1,529 $1,552 $1,947 $2,394Napa 5.7% 3.7% $1,344 $1,330 $850 $1,232 $1,182 $1,642 $1,789San Francisco 4.1% 4.4% $2,233 $2,249 $1,637 $2,144 $2,849 $2,620 $2,842San Mateo 4.9% 3.9% $1,739 $1,712 $1,140 $1,590 $1,707 $2,109 $2,640Santa Clara 4.3% 4.2% $1,628 $1,579 $1,118 $1,444 $1,544 $1,866 $2,260Solano 4.8% 5.1% $1,118 $1,171 $904 $992 $1,057 $1,267 $1,419Sonoma 5.0% 4.9% $1,189 $1,180 $706 $1,032 $1,197 $1,374 $1,665SF Bay Area 4.5% 4.4% $1,568 $1,546 $1,274 $1,393 $1,439 $1,798 $2,134Greater Sacramento 5.8% 6.8% $935 $946 $731 $813 $843 $1,054 $1,332
MULTI-FAMILY OVERVIEW
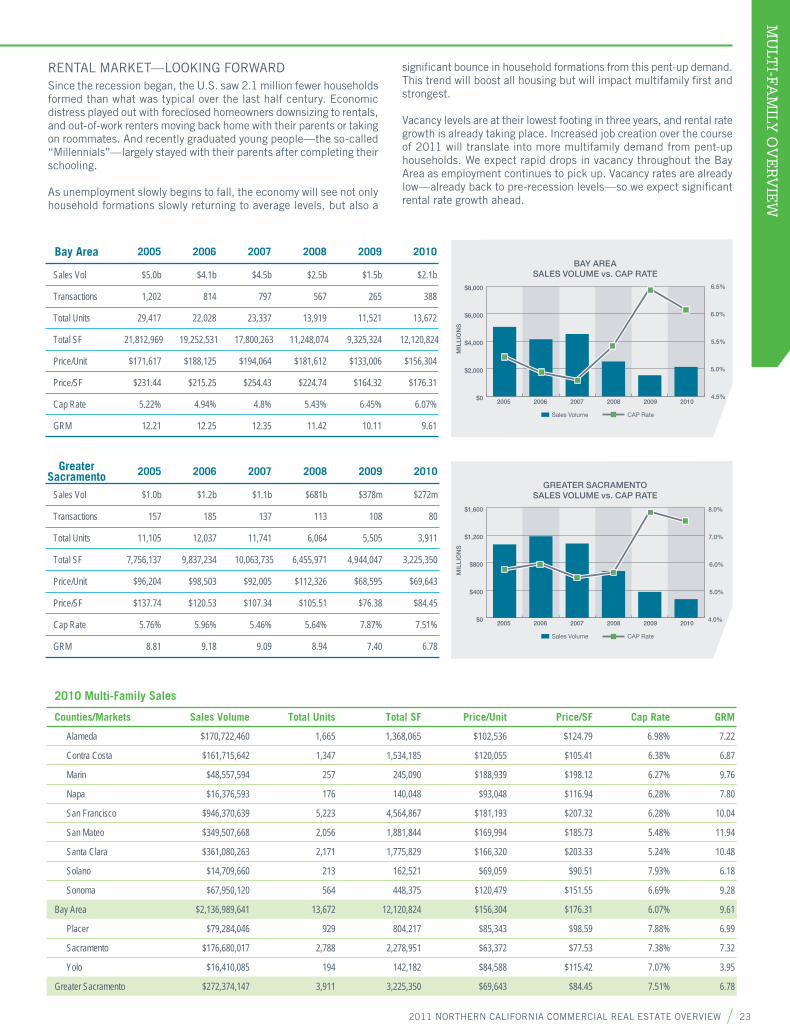
2011 NORTHERN CALIFORNIA COMMERCIAL REAL ESTATE OVERVIEW 23
MU
LTI-FA
MILY
OV
ER
VIE
W
Bay Area 2005 2006 2007 2008 2009 2010
Sales Vol $5.0b $4.1b $4.5b $2.5b $1.5b $2.1b
Transactions 1,202 814 797 567 265 388
Total Units 29,417 22,028 23,337 13,919 11,521 13,672
Total SF 21,812,969 19,252,531 17,800,263 11,248,074 9,325,324 12,120,824
Price/Unit $171,617 $188,125 $194,064 $181,612 $133,006 $156,304
Price/SF $231.44 $215.25 $254.43 $224.74 $164.32 $176.31
Cap Rate 5.22% 4.94% 4.8% 5.43% 6.45% 6.07%
GRM 12.21 12.25 12.35 11.42 10.11 9.61
Greater Sacramento 2005 2006 2007 2008 2009 2010
Sales Vol $1.0b $1.2b $1.1b $681b $378m $272m
Transactions 157 185 137 113 108 80
Total Units 11,105 12,037 11,741 6,064 5,505 3,911
Total SF 7,756,137 9,837,234 10,063,735 6,455,971 4,944,047 3,225,350
Price/Unit $96,204 $98,503 $92,005 $112,326 $68,595 $69,643
Price/SF $137.74 $120.53 $107.34 $105.51 $76.38 $84.45
Cap Rate 5.76% 5.96% 5.46% 5.64% 7.87% 7.51%
GRM 8.81 9.18 9.09 8.94 7.40 6.78
2010 Multi-Family Sales
Counties/Markets Sales Volume Total Units Total SF Price/Unit Price/SF Cap Rate GRM
Alameda $170,722,460 1,665 1,368,065 $102,536 $124.79 6.98% 7.22
Contra Costa $161,715,642 1,347 1,534,185 $120,055 $105.41 6.38% 6.87
Marin $48,557,594 257 245,090 $188,939 $198.12 6.27% 9.76
Napa $16,376,593 176 140,048 $93,048 $116.94 6.28% 7.80
San Francisco $946,370,639 5,223 4,564,867 $181,193 $207.32 6.28% 10.04
San Mateo $349,507,668 2,056 1,881,844 $169,994 $185.73 5.48% 11.94
Santa Clara $361,080,263 2,171 1,775,829 $166,320 $203.33 5.24% 10.48
Solano $14,709,660 213 162,521 $69,059 $90.51 7.93% 6.18
Sonoma $67,950,120 564 448,375 $120,479 $151.55 6.69% 9.28
Bay Area $2,136,989,641 13,672 12,120,824 $156,304 $176.31 6.07% 9.61
Placer $79,284,046 929 804,217 $85,343 $98.59 7.88% 6.99
Sacramento $176,680,017 2,788 2,278,951 $63,372 $77.53 7.38% 7.32
Yolo $16,410,085 194 142,182 $84,588 $115.42 7.07% 3.95
Greater Sacramento $272,374,147 3,911 3,225,350 $69,643 $84.45 7.51% 6.78
$0
$2,000
$4,000
$6,000
$8,000
4.5%
5.0%
5.5%
6.0%
6.5%
BAY AREASALES VOLUME vs. CAP RATE
MIL
LIO
NS
2005 2006 2007 2008 2009 2010
Sales Volume CAP Rate
$0
$400
$800
$1,200
$1,600
4.0%
5.0%
6.0%
7.0%
8.0%
GREATER SACRAMENTOSALES VOLUME vs. CAP RATE
MIL
LIO
NS
2005 2006 2007 2008 2009 2010
Sales Volume CAP Rate
RENTAL MARKET—LOOKING FORWARDSince the recession began, the U.S. saw 2.1 million fewer households formed than what was typical over the last half century. Economic distress played out with foreclosed homeowners downsizing to rentals, and out-of-work renters moving back home with their parents or taking on roommates. And recently graduated young people—the so-called “Millennials”—largely stayed with their parents after completing their schooling.
As unemployment slowly begins to fall, the economy will see not only household formations slowly returning to average levels, but also a
signifi cant bounce in household formations from this pent-up demand. This trend will boost all housing but will impact multifamily fi rst and strongest.
Vacancy levels are at their lowest footing in three years, and rental rate growth is already taking place. Increased job creation over the course of 2011 will translate into more multifamily demand from pent-up households. We expect rapid drops in vacancy throughout the Bay Area as employment continues to pick up. Vacancy rates are already low—already back to pre-recession levels—so we expect signifi cant rental rate growth ahead.
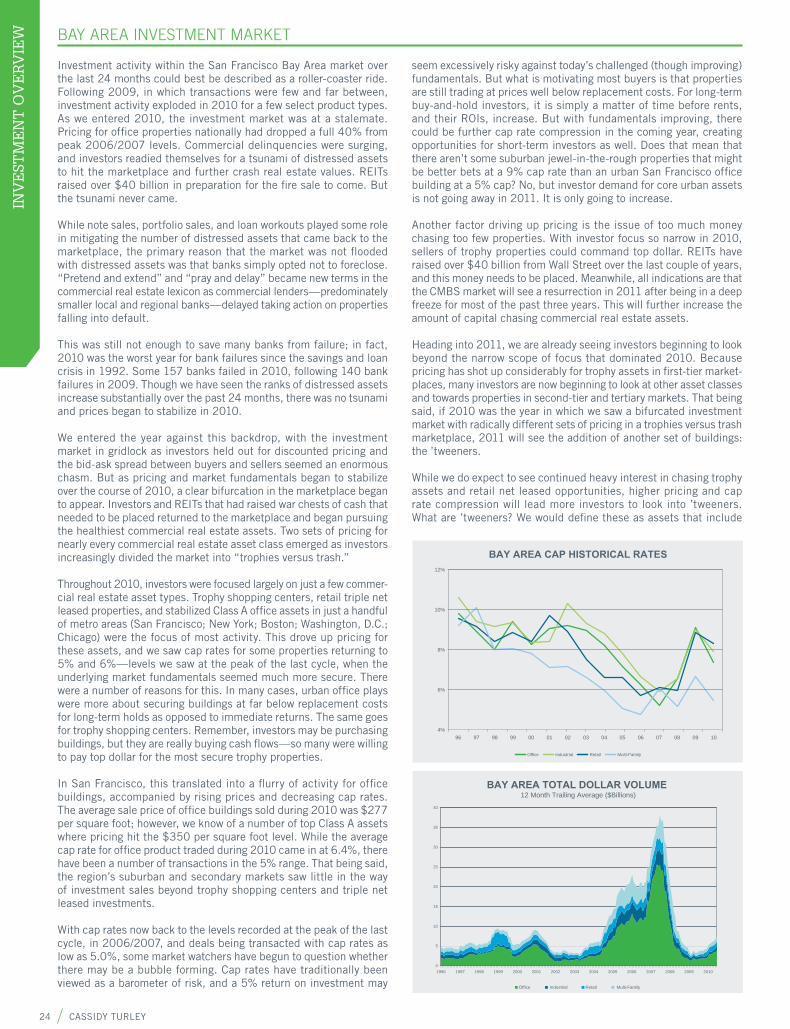
24 CASSIDY TURLEY
INV
EST
ME
NT
OV
ER
VIE
WINVESTMENT OVERVIEW
Investment activity within the San Francisco Bay Area market over the last 24 months could best be described as a roller-coaster ride. Following 2009, in which transactions were few and far between, investment activity exploded in 2010 for a few select product types. As we entered 2010, the investment market was at a stalemate. Pricing for offi ce properties nationally had dropped a full 40% from peak 2006/2007 levels. Commercial delinquencies were surging, and investors readied themselves for a tsunami of distressed assets to hit the marketplace and further crash real estate values. REITs raised over $40 billion in preparation for the fi re sale to come. But the tsunami never came.
While note sales, portfolio sales, and loan workouts played some role in mitigating the number of distressed assets that came back to the marketplace, the primary reason that the market was not fl ooded with distressed assets was that banks simply opted not to foreclose. “Pretend and extend” and “pray and delay” became new terms in the commercial real estate lexicon as commercial lenders—predominately smaller local and regional banks—delayed taking action on properties falling into default.
This was still not enough to save many banks from failure; in fact, 2010 was the worst year for bank failures since the savings and loan crisis in 1992. Some 157 banks failed in 2010, following 140 bank failures in 2009. Though we have seen the ranks of distressed assets increase substantially over the past 24 months, there was no tsunami and prices began to stabilize in 2010.
We entered the year against this backdrop, with the investment market in gridlock as investors held out for discounted pricing and the bid-ask spread between buyers and sellers seemed an enormous chasm. But as pricing and market fundamentals began to stabilize over the course of 2010, a clear bifurcation in the marketplace began to appear. Investors and REITs that had raised war chests of cash that needed to be placed returned to the marketplace and began pursuing the healthiest commercial real estate assets. Two sets of pricing for nearly every commercial real estate asset class emerged as investors increasingly divided the market into “trophies versus trash.”
Throughout 2010, investors were focused largely on just a few commer-cial real estate asset types. Trophy shopping centers, retail triple net leased properties, and stabilized Class A offi ce assets in just a handful of metro areas (San Francisco; New York; Boston; Washington, D.C.; Chicago) were the focus of most activity. This drove up pricing for these assets, and we saw cap rates for some properties returning to 5% and 6%—levels we saw at the peak of the last cycle, when the underlying market fundamentals seemed much more secure. There were a number of reasons for this. In many cases, urban offi ce plays were more about securing buildings at far below replacement costs for long-term holds as opposed to immediate returns. The same goes for trophy shopping centers. Remember, investors may be purchasing buildings, but they are really buying cash fl ows—so many were willing to pay top dollar for the most secure trophy properties.
In San Francisco, this translated into a fl urry of activity for offi ce buildings, accompanied by rising prices and decreasing cap rates. The average sale price of offi ce buildings sold during 2010 was $277 per square foot; however, we know of a number of top Class A assets where pricing hit the $350 per square foot level. While the average cap rate for offi ce product traded during 2010 came in at 6.4%, there have been a number of transactions in the 5% range. That being said, the region’s suburban and secondary markets saw little in the way of investment sales beyond trophy shopping centers and triple net leased investments.
With cap rates now back to the levels recorded at the peak of the last cycle, in 2006/2007, and deals being transacted with cap rates as low as 5.0%, some market watchers have begun to question whether there may be a bubble forming. Cap rates have traditionally been viewed as a barometer of risk, and a 5% return on investment may
seem excessively risky against today’s challenged (though improving) fundamentals. But what is motivating most buyers is that properties are still trading at prices well below replacement costs. For long-term buy-and-hold investors, it is simply a matter of time before rents, and their ROIs, increase. But with fundamentals improving, there could be further cap rate compression in the coming year, creating opportunities for short-term investors as well. Does that mean that there aren’t some suburban jewel-in-the-rough properties that might be better bets at a 9% cap rate than an urban San Francisco offi ce building at a 5% cap? No, but investor demand for core urban assets is not going away in 2011. It is only going to increase.
Another factor driving up pricing is the issue of too much money chasing too few properties. With investor focus so narrow in 2010, sellers of trophy properties could command top dollar. REITs have raised over $40 billion from Wall Street over the last couple of years, and this money needs to be placed. Meanwhile, all indications are that the CMBS market will see a resurrection in 2011 after being in a deep freeze for most of the past three years. This will further increase the amount of capital chasing commercial real estate assets.
Heading into 2011, we are already seeing investors beginning to look beyond the narrow scope of focus that dominated 2010. Because pricing has shot up considerably for trophy assets in fi rst-tier market-places, many investors are now beginning to look at other asset classes and towards properties in second-tier and tertiary markets. That being said, if 2010 was the year in which we saw a bifurcated investment market with radically different sets of pricing in a trophies versus trash marketplace, 2011 will see the addition of another set of buildings: the ’tweeners.
While we do expect to see continued heavy interest in chasing trophy assets and retail net leased opportunities, higher pricing and cap rate compression will lead more investors to look into ’tweeners. What are ’tweeners? We would defi ne these as assets that include
BAY AREA CAP HISTORICAL RATES
Office Industrial Retail Multi-Family
4%
6%
8%
10%
12%
96 97 98 99 00 01 02 03 04 05 06 07 08 09 10
BAY AREA TOTAL DOLLAR VOLUME 12 Month Trailing Average ($Billions)
Office Industrial Retail Multi-Family
0
5
10
15
20
25
30
35
40
1996 1997 1998 1999 2000 2001 2002 2003 2004 2005 2006 2007 2008 2009 2010
BAY AREA INVESTMENT MARKET
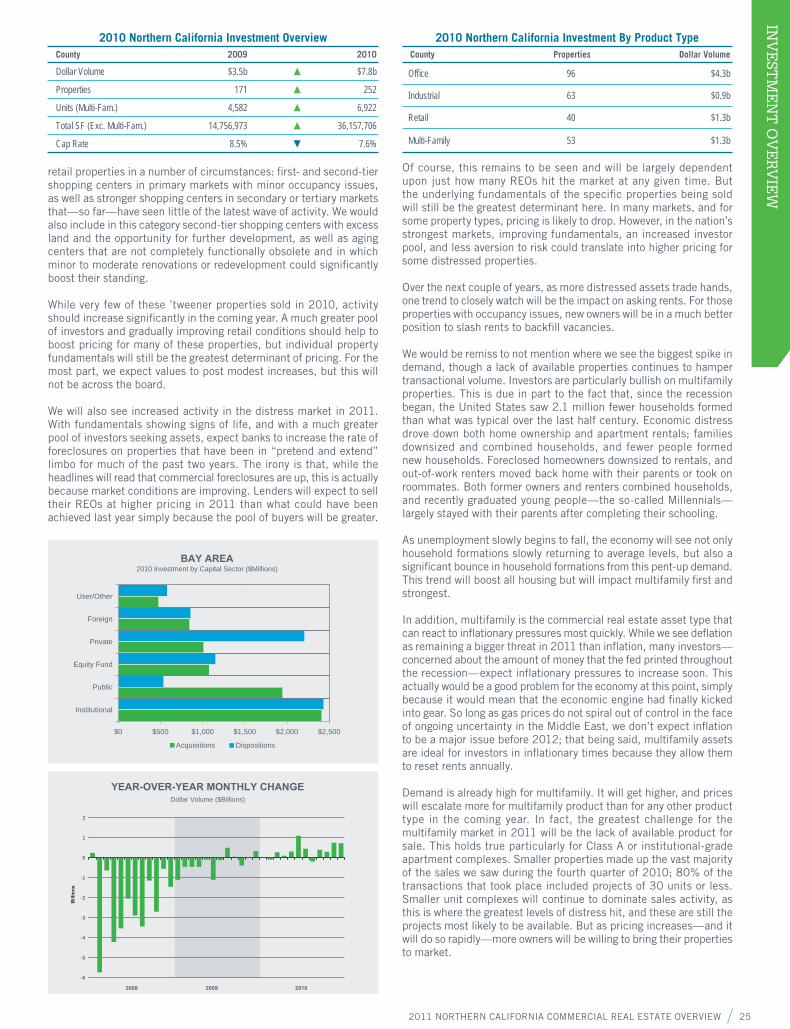
2011 NORTHERN CALIFORNIA COMMERCIAL REAL ESTATE OVERVIEW 25
INV
EST
ME
NT
OV
ER
VIE
W
retail properties in a number of circumstances: fi rst- and second-tier shopping centers in primary markets with minor occupancy issues, as well as stronger shopping centers in secondary or tertiary markets that—so far—have seen little of the latest wave of activity. We would also include in this category second-tier shopping centers with excess land and the opportunity for further development, as well as aging centers that are not completely functionally obsolete and in which minor to moderate renovations or redevelopment could signifi cantly boost their standing.
While very few of these ’tweener properties sold in 2010, activity should increase signifi cantly in the coming year. A much greater pool of investors and gradually improving retail conditions should help to boost pricing for many of these properties, but individual property fundamentals will still be the greatest determinant of pricing. For the most part, we expect values to post modest increases, but this will not be across the board.
We will also see increased activity in the distress market in 2011. With fundamentals showing signs of life, and with a much greater pool of investors seeking assets, expect banks to increase the rate of foreclosures on properties that have been in “pretend and extend” limbo for much of the past two years. The irony is that, while the headlines will read that commercial foreclosures are up, this is actually because market conditions are improving. Lenders will expect to sell their REOs at higher pricing in 2011 than what could have been achieved last year simply because the pool of buyers will be greater.
Of course, this remains to be seen and will be largely dependent upon just how many REOs hit the market at any given time. But the underlying fundamentals of the specifi c properties being sold will still be the greatest determinant here. In many markets, and for some property types, pricing is likely to drop. However, in the nation’s strongest markets, improving fundamentals, an increased investor pool, and less aversion to risk could translate into higher pricing for some distressed properties.
Over the next couple of years, as more distressed assets trade hands, one trend to closely watch will be the impact on asking rents. For those properties with occupancy issues, new owners will be in a much better position to slash rents to backfi ll vacancies.
We would be remiss to not mention where we see the biggest spike in demand, though a lack of available properties continues to hamper transactional volume. Investors are particularly bullish on multifamily properties. This is due in part to the fact that, since the recession began, the United States saw 2.1 million fewer households formed than what was typical over the last half century. Economic distress drove down both home ownership and apartment rentals; families downsized and combined households, and fewer people formed new households. Foreclosed homeowners downsized to rentals, and out-of-work renters moved back home with their parents or took on roommates. Both former owners and renters combined households, and recently graduated young people—the so-called Millennials—largely stayed with their parents after completing their schooling.
As unemployment slowly begins to fall, the economy will see not only household formations slowly returning to average levels, but also a signifi cant bounce in household formations from this pent-up demand. This trend will boost all housing but will impact multifamily fi rst and strongest.
In addition, multifamily is the commercial real estate asset type that can react to infl ationary pressures most quickly. While we see defl ation as remaining a bigger threat in 2011 than infl ation, many investors—concerned about the amount of money that the fed printed throughout the recession—expect infl ationary pressures to increase soon. This actually would be a good problem for the economy at this point, simply because it would mean that the economic engine had fi nally kicked into gear. So long as gas prices do not spiral out of control in the face of ongoing uncertainty in the Middle East, we don’t expect infl ation to be a major issue before 2012; that being said, multifamily assets are ideal for investors in infl ationary times because they allow them to reset rents annually.
Demand is already high for multifamily. It will get higher, and prices will escalate more for multifamily product than for any other product type in the coming year. In fact, the greatest challenge for the multifamily market in 2011 will be the lack of available product for sale. This holds true particularly for Class A or institutional-grade apartment complexes. Smaller properties made up the vast majority of the sales we saw during the fourth quarter of 2010; 80% of the transactions that took place included projects of 30 units or less. Smaller unit complexes will continue to dominate sales activity, as this is where the greatest levels of distress hit, and these are still the projects most likely to be available. But as pricing increases—and it will do so rapidly—more owners will be willing to bring their properties to market.
YEAR-OVER-YEAR MONTHLY CHANGEDollar Volume ($Billions)
-6
-5
-4
-3
-2
-1
0
1
2
010290028002
Bill
ions
BAY AREA2010 Investment by Capital Sector ($Millions)
Acquisitions Dispositions
$0 $500 $1,000 $1,500 $2,000 $2,500
Institutional
Public
Equity Fund
Private
Foreign
User/Other
2010 Northern California Investment By Product TypeCounty Properties Dollar Volume
Offi ce 96 $4.3b
Industrial 63 $0.9b
Retail 40 $1.3b
Multi-Family 53 $1.3b
2010 Northern California Investment OverviewCounty 2009 2010
Dollar Volume $3.5b ▲ $7.8b
Properties 171 ▲ 252
Units (Multi-Fam.) 4,582 ▲ 6,922
Total SF (Exc. Multi-Fam.) 14,756,973 ▲ 36,157,706
Cap Rate 8.5% ▼ 7.6%
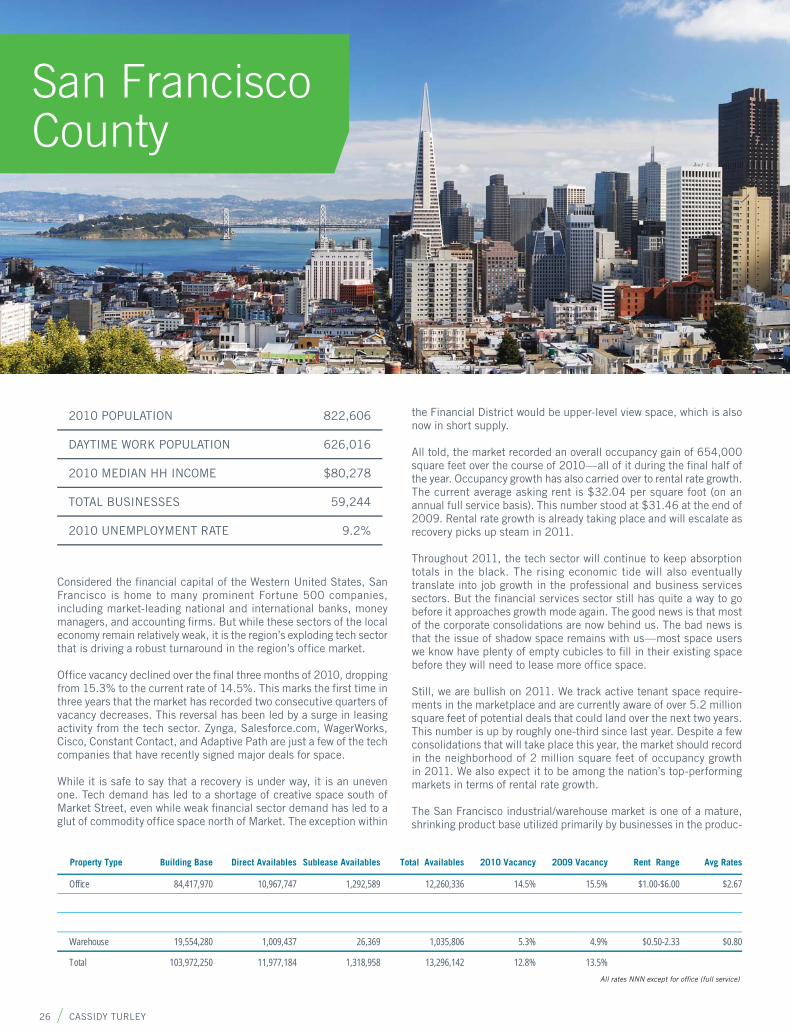
26 CASSIDY TURLEY
SAN
FR
AN
CIS
CO
CO
UN
TY
OV
ER
VIE
W SAN FRANCISCO COUNTY OVERVIEW
Considered the fi nancial capital of the Western United States, San Francisco is home to many prominent Fortune 500 companies, including market-leading national and international banks, money managers, and accounting fi rms. But while these sectors of the local economy remain relatively weak, it is the region’s exploding tech sector that is driving a robust turnaround in the region’s offi ce market.
Offi ce vacancy declined over the fi nal three months of 2010, dropping from 15.3% to the current rate of 14.5%. This marks the fi rst time in three years that the market has recorded two consecutive quarters of vacancy decreases. This reversal has been led by a surge in leasing activity from the tech sector. Zynga, Salesforce.com, WagerWorks, Cisco, Constant Contact, and Adaptive Path are just a few of the tech companies that have recently signed major deals for space.
While it is safe to say that a recovery is under way, it is an uneven one. Tech demand has led to a shortage of creative space south of Market Street, even while weak fi nancial sector demand has led to a glut of commodity offi ce space north of Market. The exception within
the Financial District would be upper-level view space, which is also now in short supply.
All told, the market recorded an overall occupancy gain of 654,000 square feet over the course of 2010—all of it during the fi nal half of the year. Occupancy growth has also carried over to rental rate growth. The current average asking rent is $32.04 per square foot (on an annual full service basis). This number stood at $31.46 at the end of 2009. Rental rate growth is already taking place and will escalate as recovery picks up steam in 2011.
Throughout 2011, the tech sector will continue to keep absorption totals in the black. The rising economic tide will also eventually translate into job growth in the professional and business services sectors. But the fi nancial services sector still has quite a way to go before it approaches growth mode again. The good news is that most of the corporate consolidations are now behind us. The bad news is that the issue of shadow space remains with us—most space users we know have plenty of empty cubicles to fi ll in their existing space before they will need to lease more offi ce space.
Still, we are bullish on 2011. We track active tenant space require-ments in the marketplace and are currently aware of over 5.2 million square feet of potential deals that could land over the next two years. This number is up by roughly one-third since last year. Despite a few consolidations that will take place this year, the market should record in the neighborhood of 2 million square feet of occupancy growth in 2011. We also expect it to be among the nation’s top-performing markets in terms of rental rate growth.
The San Francisco industrial/warehouse market is one of a mature, shrinking product base utilized primarily by businesses in the produc-
2010 POPULATION 822,606
DAYTIME WORK POPULATION 626,016
2010 MEDIAN HH INCOME $80,278
TOTAL BUSINESSES 59,244
2010 UNEMPLOYMENT RATE 9.2%
Property Type Building Base Direct Availables Sublease Availables Total Availables 2010 Vacancy 2009 Vacancy Rent Range Avg Rates
Offi ce 84,417,970 10,967,747 1,292,589 12,260,336 14.5% 15.5% $1.00-$6.00 $2.67
Warehouse 19,554,280 1,009,437 26,369 1,035,806 5.3% 4.9% $0.50-2.33 $0.80
Total 103,972,250 11,977,184 1,318,958 13,296,142 12.8% 13.5%
San Francisco County
All rates NNN except for offi ce (full service)

2011 NORTHERN CALIFORNIA COMMERCIAL REAL ESTATE OVERVIEW 27
SAN
FR
AN
CISC
O C
OU
NT
Y O
VE
RV
IEW
Geary Blvd
Van Ness
Great Hwy
Gold
en G
ate
Br.
POINTBONITA
LIGHTHOUSE
FISHERMAN'SWHARF
AT&T PARK
CANDLESTICK PARK
UNION SQUARE
JACKSON SQUARE/NORTH WATERFRONT
SOUTH BEACH/RINCON HILL
SOUTHFINANCIALDISTRICT
YERBA BUENA
MULTI-MEDIAGULCH
POTRERO HILL/MISSIONPacific
Ocean
Market
St
19th Ave
80
280
101
101
= Office Locations
NORTHFINANCIALDISTRICT
SAN FRANCISCOCOUNTY
2010 Major Sales
Address Size (SF) Type Price
3711 19th Ave 3,221 Units Multi-Family $592,000,000
333 Market St 657,115 Offi ce $333,000,000
575 Market St & 555 Market St 770,044 Offi ce $267,000,000
303 2nd St 731,972 Offi ce $237,000,000
1455 Market St 1,019,000 Offi ce $93,000,000
1890 Clay St 74 Units Multi-Family $25,500,000
3rd St @ King St 2 Acres Land $23,600,000
1 Nob Hill Cir 1.3 Acres Land $22,625,000
1 Ecker Pl 53 Units Multi-Family $14,000,000
45 Lansing St 0.3 Acres Land $12,500,000
2345 Filbert St 24 Units Multi-Family $7,350,000
201 Toland St 30,000 Industrial $5,850,000
1515 S Van Ness Ave 31,990 Industrial $4,250,000
2070 Newcomb Ave 17,000 Industrial $2,700,000
1495 Wallace St 20,000 Industrial $2,275,000
Notable Offi ce Lease Transactions in 2010
Address Tenant Transaction Type Qtr RSF
650 Townsend St Zynga Relocation Direct Q3 270,000
1 Market St Salesforce.com Renewal Direct Expansion Q2 226,292
425 Market St Morrison & Foerster, LLP. Renewal Direct Q2 220,000
355 Mission St Deloitte & Touche Relocation Direct Q2 166,435
303 2nd St Young & Rubican Renewal Direct Q1 97,000
225 Bush St Blue Shield of California Renewal Direct Q1 75,432
100 1st St Internal Revenue Service Relocation Direct Q2 72,736
123 Mission St Salesforce.com Relocation Direct Q3 71,000
475 Sansome St Yahoo Renewal Direct Q3 63,886
345 Spear St Google Relocation Direct Q3 63,817
tion, distribution, and repair sectors that need to be in San Francisco. Tenancy tends to be dominated by long-term owner-users. All of these factors help to keep vacancy low; the market closed 2010 with an overall vacancy rate of just 5.3%. Though comparatively low, this still refl ects an increase over the 4.9% vacancy rate that was posted at the end of 2009. As recently as 2007, the industrial vacancy rate was as low as 2.1%.
The same set of circumstances that help to keep vacancy levels low in this market also constrict demand. The reality is that there is little in the way of modern institutional-grade product available within the San Francisco industrial market. Demand within the industrial sector is currently being driven by distribution-related users who typically look to other Bay Area markets for the type of modern bulk warehouse facilities they need. This is refl ected in this trade area’s typically conservative absorption trends. Over the course of 2010, the market recorded 92,000 square feet of occupancy losses. This is a slight improvement over the 397,000 square feet of occupancy losses registered in 2009. However, the market also lost 163,000 square feet of occupancy in 2008. The last time the market closed the year with positive net absorption was in 2007, when a paltry 34,000 square feet of occupancy gains was recorded.
The good news is that activity was picking up at the close of 2010. Vacancy had peaked at 5.4% during the third quarter and is now stabilizing. The current average asking rent for industrial space in San Francisco is $0.80 per square foot (on a monthly triple net basis). That being said, we are tracking asking rents as high as $1.35 per square foot and as low as $0.45 per square foot. Despite the fact that market activity in 2010 was largely in negative territory, asking rents for industrial space in San Francisco have been slowly creeping up.
Look for industrial leasing in San Francisco to show modest improve-ment over the course of 2011. Following three consecutive years of occupancy losses, the market will record positive net absorption in 2011, but gains will likely be minimal. There has been no substantial new construction for over fi ve years. Nor will there be anytime soon. If anything, the only development trend that we see potentially impacting the industrial market over the next 24 to 36 months would likely be conversions of existing industrial buildings to other uses. Meanwhile, look for rents to stabilize in the coming year.
600 California St
Embarcadero Center
Kabuki Theater

28 CASSIDY TURLEY
SAN
TA
CL
AR
A C
OU
NT
Y O
VE
RV
IEW
SANTA CLARA COUNTY OVERVIEW
Santa Clara County, home to Silicon Valley, accounts for roughly 25% of the jobs in the Bay Area and boasts one of the highest median incomes in the country. It also continues to be ranked as one of the best places in the United States to live, work, and play—a factor that has played a huge role in the region’s continued tech dominance. Silicon Valley continues to be the center of tech innovation in the world, home not only to industry titans like Google and Apple but also to one of the highest concentrations of highly skilled workers in the world.
Economic recovery in 2011 is being led by a new breed of tech players—those active in cloud computing, smartphones, and social networking. The overwhelming majority of these companies are active in Silicon Valley and are already driving a strong resurgence in the commercial real estate market.
Vacancy for offi ce space currently stands at 17.2%. After peaking at 18.8% during the fi rst quarter of this year, the overriding trend throughout 2010 was one of decreasing vacancy. Deal activity was up considerably over 2009’s levels throughout the year and is expected
to increase heading into 2011. The Bay Area’s surging tech sector continues to drive recovery in the region. Meanwhile, a number of major campus moves by Apple, Google, and others will likely guarantee further growth ahead in the Silicon Valley market.
The Silicon Valley offi ce market closed the year with over 1.6 million square feet of occupancy growth. This marked a stark contrast to the 1.3 million square feet of negative net absorption that the market recorded in 2009 and the 1.7 million square feet of occupancy losses registered in 2008. Deal activity and user requirements are both up; we track active space requirements from users in the marketplace and are currently aware of as much as 7.8 million square feet of offi ce and R&D requirements that could potentially land in Silicon Valley over the next 24 months. This number is up roughly 30% from levels recorded one year ago.
The current average asking rent for offi ce space is $2.54 per square foot (on a monthly full service basis). This number stabilized over the second half of 2010. One year ago it stood at $2.65 per square foot. The good news for landlords is that with demand and leasing activity on the rise, the slide in rents is largely over. There have been a few projects and stronger submarkets where modest rental rate growth is already occurring, but for the overall market as a whole, look for this trend to play out later in 2011. With nearly 12.5 million square feet of available space to work through, the transition from a tenant’s marketplace to one that favors landlords will not take place overnight. That being said, however, tenants who are looking for the best deals will need to pull the trigger soon. The pendulum is beginning to swing back to favoring landlords, and by 2012 building owners should be in a much stronger position.
Vacancy for R&D product currently stands at 17.3%. Vacancy has remained in the 17% range since the second quarter of 2009. The
2010 POPULATION 1,793,200
DAYTIME WORK POPULATION 941,993
2010 MEDIAN HH INCOME $84,614
TOTAL BUSINESSES 76,557
2010 UNEMPLOYMENT RATE 11.7%
Property Type Building Base Direct Availables Sublease Availables Total Availables 2010 Vacancy 2009 Vacancy Rent Range Avg Rates
Offi ce 72,653,939 11,299,505 1,187,943 12,487,448 17.2% 18.8% $0.99-7.70 $2.54
R&D 132,560,825 19,518,850 3,349,000 22,867,850 17.3% 17.7% $0.29-3.95 $1.04
Mfg 53,399,726 3,644,376 415,389 4,059,765 7.6% 7.2% $0.14-1.60 $0.61
Whse 32,304,481 2,852,506 141,571 2,994,077 9.3% 8.6% $0.25-0.70 $0.44
Total 290,918,971 37,315,237 5,093,903 42,409,140 13.8% 15.0%All rates NNN except for offi ce (full service)
Santa Clara County

2011 NORTHERN CALIFORNIA COMMERCIAL REAL ESTATE OVERVIEW 29
SAN
TA
CL
AR
A C
OU
NT
Y O
VE
RV
IEW
401 EllisMountain View
market ended 2010 with total occupancy gains of just over 370,000 square feet—a vast improvement over 2009’s occupancy losses of a whopping 4.6 million square feet. The current average asking rent is $1.04 per square foot (on a monthly triple net basis). Rents remained stable at current levels throughout 2010.
Since 2008, new speculative R&D development has accounted for a very slim proportion of the total speculative construction, which has been dominated by offi ce classifi ed product. Though we expect vacancy to fi nally begin to tighten heading into 2011, it will take some time to work through the 22.9 million square feet of existing vacant space on the market. It will likely be late 2012 at the earliest before the market approaches equilibrium. Meanwhile, buildings continue to sell at below replacement costs. Until vacancy levels drop below the 15% range and the market records more traction in rents, few developers will want to risk development without major pre-leasing commitments in place. Look for build-to-suits and for owner-user campuses to dominate construction activity for at least the next two
years. The good news for landlords is that surging tech demand will result not only in vacancy stabilizing over the course of 2011, but in what we expect to be the most signifi cant levels of reduction since 2006.
Warehouse vacancy currently stands at 9.3%. One year ago this number stood at 8.6%. Two submarkets—largely Milpitas and also South San Jose—accounted for the lion’s share of occupancy losses. All told, the market recorded a negative net absorption of approxi-mately 228,000 square feet. This marked the third consecutive year in which the market ended in negative territory. Despite this, asking rents have remained virtually unchanged over the past year. The average asking rate for warehouse space currently stands at $0.44 per square foot (on a monthly triple net basis).
The good news is that user space requirements are up. We track active tenant requirements in the marketplace and are currently aware of as much as 4.1 million square feet of potential industrial
deals that could land over the next 24 months. This number is up by about 20% from this time last year. Logistics fi rms, food distributors and manufacturers, energy fi rms, tech companies, and automotive-related users account for the lion’s share of current industrial growth requirements. Looking ahead, we expect the market to return to positive territory in 2011, though we don’t expect growth to be robust. Some of the region’s stronger projects and submarkets may actually record rental rate growth in 2011.
The region’s offi ce and R&D markets will fare best in 2011, thanks to a resurgent tech market that is already driving deal activity. Both markets will see signifi cant reductions in vacancy levels and rental rate growth as positive absorption picks up. That being said, the local industrial warehouse and manufacturing markets will see stabilization and modest improvement as general economic fundamentals slowly improve. Due to the large occupancy losses incurred by all product types throughout the Great Recession, it will still be some time before the market reaches equilibrium between supply and demand. However, the pendulum is slowly beginning to swing back in favor of landlords. Tenants who were waiting for the bottom of the market to make moves now have a limited window.
Mt. Hamilton Rd
Tully Rd
Monterey Hwy
Almaden E
xpwy
Stevens Creek Blvd
Blossom Hill Rd
M
ontag
ue Expwy
Capital Expwy
880
280
17
880
680
237
87
82
Foothill Expwy
MORGAN HILL
GILROY152
MOUNTAIN VIEW
PALO ALTO
SUNNYVALE
MILPITAS
SAN JOSESANTA CLARA
CAMPBELL
SARATOGA
CUPERTINO
LOS GATOS
MOFFETT FIELD
SANTA CLARACOUNTY
= Office Locations
85
101
101
101
10080 N Wolfe RdCupertino
2010 Major Sales
Address Size (SF) Type Price
Wolfe Road @ Homestead Rd, Cupertino 98.2 Acres Land $420,000,000
410-430 Mary Ave, Sunnyvale 349,758 R&D $111,922,560
101 East San Fernando St, San Jose 323 Units Multi-Family $59,600,000
2565-2625 Walsh / 2880 Northwestern, Santa Clara 263,445 Data Center $55,000,000
383 Vista Roma Wy, San Jose 231 Units Multi-Family $54,000,000
373 River Oaks Cir, San Jose 226 Units Multi-Family $50,300,000
19000 Homestead Rd, Cupertino 105,000 R&D $44,000,000
2351 North First Street, San Jose 40.9 Acres Land $36,400,000
10495 De Anza Blvd, Cupertino 59,670 Offi ce $33,350,000
3412 Hillview Ave, Palo Alto 76,500 R&D $31,900,500
10200 De Anza Blvd, Cupertino 142,276 Offi ce $31,300,720
1600 Technology Dr, San Jose 193,977 Offi ce $30,350,000
510 Cottonwood Dr, Milpitas 180,086 R&D $24,131,524
725 Santa Clara St, San Jose 13.4 Acres Land $24,000,000
5755 Rossi Ln, Gilroy 120,665 Industrial $8,750,000
Sunnyvale City CenterSunnyvale
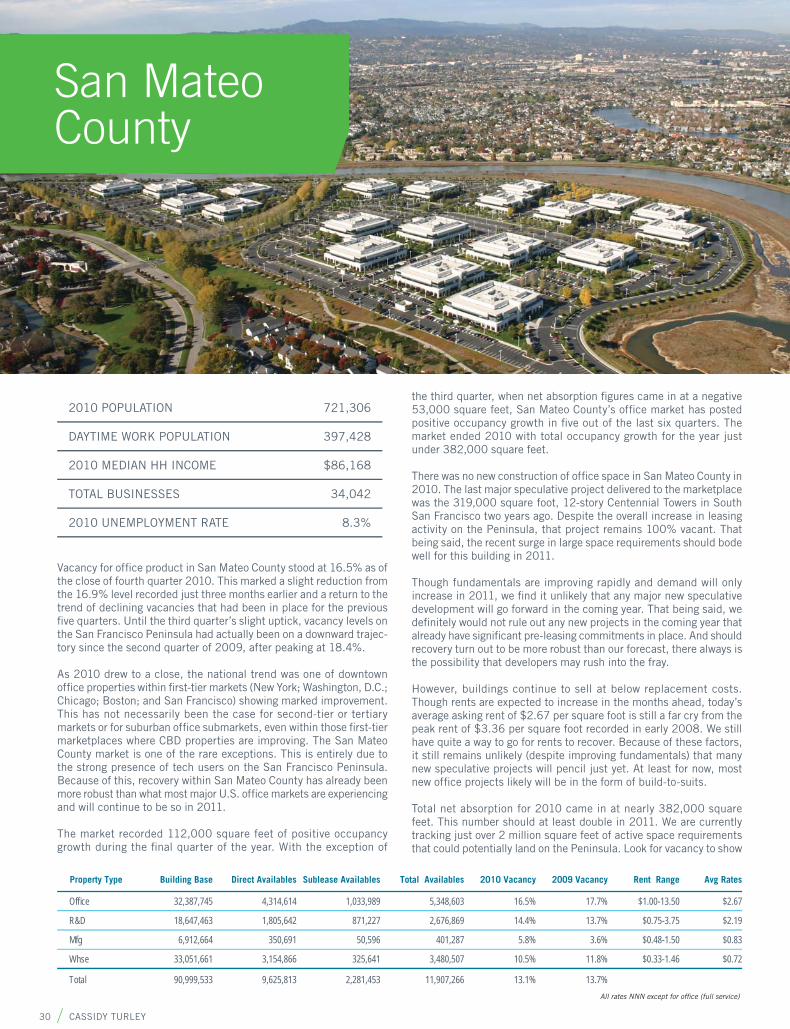
30 CASSIDY TURLEY
SAN
MA
TE
O C
OU
NT
Y O
VE
RV
IEW SAN MATEO COUNTY OVERVIEW
Vacancy for offi ce product in San Mateo County stood at 16.5% as of the close of fourth quarter 2010. This marked a slight reduction from the 16.9% level recorded just three months earlier and a return to the trend of declining vacancies that had been in place for the previous fi ve quarters. Until the third quarter’s slight uptick, vacancy levels on the San Francisco Peninsula had actually been on a downward trajec-tory since the second quarter of 2009, after peaking at 18.4%.
As 2010 drew to a close, the national trend was one of downtown offi ce properties within fi rst-tier markets (New York; Washington, D.C.; Chicago; Boston; and San Francisco) showing marked improvement. This has not necessarily been the case for second-tier or tertiary markets or for suburban offi ce submarkets, even within those fi rst-tier marketplaces where CBD properties are improving. The San Mateo County market is one of the rare exceptions. This is entirely due to the strong presence of tech users on the San Francisco Peninsula. Because of this, recovery within San Mateo County has already been more robust than what most major U.S. offi ce markets are experiencing and will continue to be so in 2011.
The market recorded 112,000 square feet of positive occupancy growth during the fi nal quarter of the year. With the exception of
the third quarter, when net absorption fi gures came in at a negative 53,000 square feet, San Mateo County’s offi ce market has posted positive occupancy growth in fi ve out of the last six quarters. The market ended 2010 with total occupancy growth for the year just under 382,000 square feet.
There was no new construction of offi ce space in San Mateo County in 2010. The last major speculative project delivered to the marketplace was the 319,000 square foot, 12-story Centennial Towers in South San Francisco two years ago. Despite the overall increase in leasing activity on the Peninsula, that project remains 100% vacant. That being said, the recent surge in large space requirements should bode well for this building in 2011.
Though fundamentals are improving rapidly and demand will only increase in 2011, we fi nd it unlikely that any major new speculative development will go forward in the coming year. That being said, we defi nitely would not rule out any new projects in the coming year that already have signifi cant pre-leasing commitments in place. And should recovery turn out to be more robust than our forecast, there always is the possibility that developers may rush into the fray.
However, buildings continue to sell at below replacement costs. Though rents are expected to increase in the months ahead, today’s average asking rent of $2.67 per square foot is still a far cry from the peak rent of $3.36 per square foot recorded in early 2008. We still have quite a way to go for rents to recover. Because of these factors, it still remains unlikely (despite improving fundamentals) that many new speculative projects will pencil just yet. At least for now, most new offi ce projects likely will be in the form of build-to-suits.
Total net absorption for 2010 came in at nearly 382,000 square feet. This number should at least double in 2011. We are currently tracking just over 2 million square feet of active space requirements that could potentially land on the Peninsula. Look for vacancy to show
2010 POPULATION 721,306
DAYTIME WORK POPULATION 397,428
2010 MEDIAN HH INCOME $86,168
TOTAL BUSINESSES 34,042
2010 UNEMPLOYMENT RATE 8.3%
Property Type Building Base Direct Availables Sublease Availables Total Availables 2010 Vacancy 2009 Vacancy Rent Range Avg Rates
Offi ce 32,387,745 4,314,614 1,033,989 5,348,603 16.5% 17.7% $1.00-13.50 $2.67
R&D 18,647,463 1,805,642 871,227 2,676,869 14.4% 13.7% $0.75-3.75 $2.19
Mfg 6,912,664 350,691 50,596 401,287 5.8% 3.6% $0.48-1.50 $0.83
Whse 33,051,661 3,154,866 325,641 3,480,507 10.5% 11.8% $0.33-1.46 $0.72
Total 90,999,533 9,625,813 2,281,453 11,907,266 13.1% 13.7%All rates NNN except for offi ce (full service)
San Mateo County
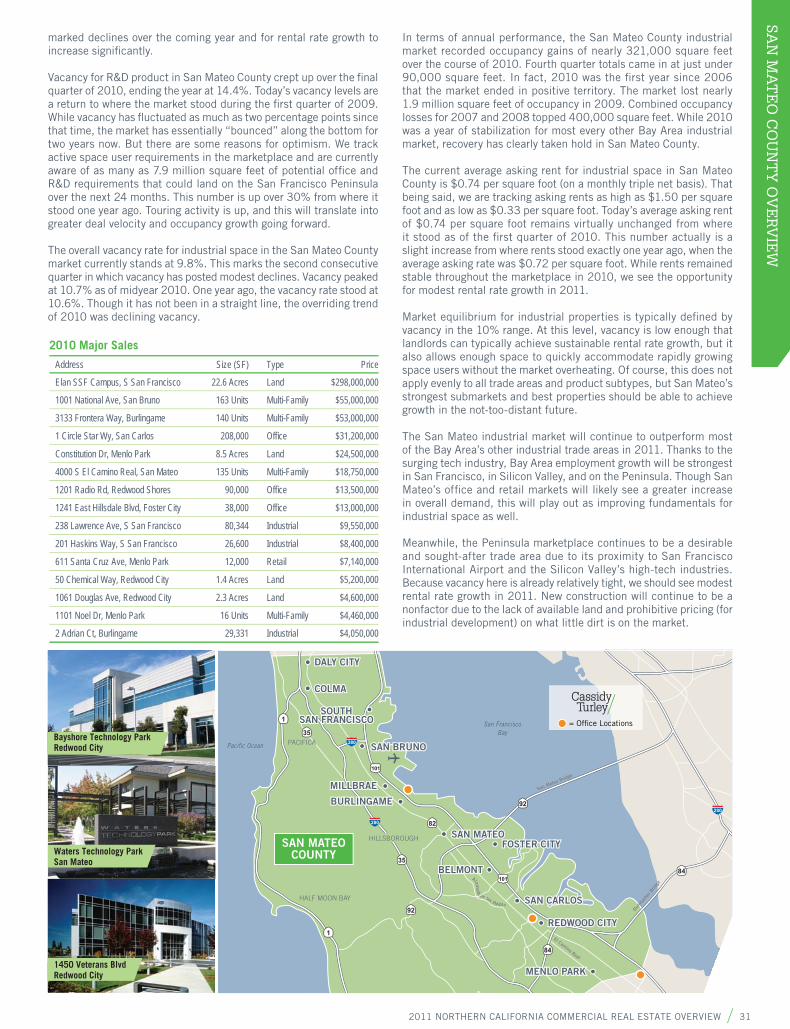
2011 NORTHERN CALIFORNIA COMMERCIAL REAL ESTATE OVERVIEW 31
SAN
MA
TE
O C
OU
NT
Y O
VE
RV
IEW
marked declines over the coming year and for rental rate growth to increase signifi cantly.
Vacancy for R&D product in San Mateo County crept up over the fi nal quarter of 2010, ending the year at 14.4%. Today’s vacancy levels are a return to where the market stood during the fi rst quarter of 2009. While vacancy has fl uctuated as much as two percentage points since that time, the market has essentially “bounced” along the bottom for two years now. But there are some reasons for optimism. We track active space user requirements in the marketplace and are currently aware of as many as 7.9 million square feet of potential offi ce and R&D requirements that could land on the San Francisco Peninsula over the next 24 months. This number is up over 30% from where it stood one year ago. Touring activity is up, and this will translate into greater deal velocity and occupancy growth going forward.
The overall vacancy rate for industrial space in the San Mateo County market currently stands at 9.8%. This marks the second consecutive quarter in which vacancy has posted modest declines. Vacancy peaked at 10.7% as of midyear 2010. One year ago, the vacancy rate stood at 10.6%. Though it has not been in a straight line, the overriding trend of 2010 was declining vacancy.
In terms of annual performance, the San Mateo County industrial market recorded occupancy gains of nearly 321,000 square feet over the course of 2010. Fourth quarter totals came in at just under 90,000 square feet. In fact, 2010 was the fi rst year since 2006 that the market ended in positive territory. The market lost nearly 1.9 million square feet of occupancy in 2009. Combined occupancy losses for 2007 and 2008 topped 400,000 square feet. While 2010 was a year of stabilization for most every other Bay Area industrial market, recovery has clearly taken hold in San Mateo County.
The current average asking rent for industrial space in San Mateo County is $0.74 per square foot (on a monthly triple net basis). That being said, we are tracking asking rents as high as $1.50 per square foot and as low as $0.33 per square foot. Today’s average asking rent of $0.74 per square foot remains virtually unchanged from where it stood as of the fi rst quarter of 2010. This number actually is a slight increase from where rents stood exactly one year ago, when the average asking rate was $0.72 per square foot. While rents remained stable throughout the marketplace in 2010, we see the opportunity for modest rental rate growth in 2011.
Market equilibrium for industrial properties is typically defi ned by vacancy in the 10% range. At this level, vacancy is low enough that landlords can typically achieve sustainable rental rate growth, but it also allows enough space to quickly accommodate rapidly growing space users without the market overheating. Of course, this does not apply evenly to all trade areas and product subtypes, but San Mateo’s strongest submarkets and best properties should be able to achieve growth in the not-too-distant future.
The San Mateo industrial market will continue to outperform most of the Bay Area’s other industrial trade areas in 2011. Thanks to the surging tech industry, Bay Area employment growth will be strongest in San Francisco, in Silicon Valley, and on the Peninsula. Though San Mateo’s offi ce and retail markets will likely see a greater increase in overall demand, this will play out as improving fundamentals for industrial space as well.
Meanwhile, the Peninsula marketplace continues to be a desirable and sought-after trade area due to its proximity to San Francisco International Airport and the Silicon Valley’s high-tech industries. Because vacancy here is already relatively tight, we should see modest rental rate growth in 2011. New construction will continue to be a nonfactor due to the lack of available land and prohibitive pricing (for industrial development) on what little dirt is on the market.
El Camino Real
Alamedo de las Pulgas
San FranciscoBay
Pacific Ocean
San Mateo Bridge
Dum
barto
n Br
idge
1
35
101
82
35
101
92
92
84
84
280
HALF MOON BAY
PACIFICA SAN BRUNO
MILLBRAE
BURLINGAME
HILLSBOROUGHFOSTER CITY
SOUTHSAN FRANCISCO
DALY CITY
COLMA
SAN MATEO
BELMONT
SAN CARLOS
MENLO PARK
REDWOOD CITY
SAN MATEOCOUNTY
= Office Locations
280
380
1
Waters Technology ParkSan Mateo
1450 Veterans BlvdRedwood City
2010 Major Sales
Address Size (SF) Type Price
Elan SSF Campus, S San Francisco 22.6 Acres Land $298,000,000
1001 National Ave, San Bruno 163 Units Multi-Family $55,000,000
3133 Frontera Way, Burlingame 140 Units Multi-Family $53,000,000
1 Circle Star Wy, San Carlos 208,000 Offi ce $31,200,000
Constitution Dr, Menlo Park 8.5 Acres Land $24,500,000
4000 S El Camino Real, San Mateo 135 Units Multi-Family $18,750,000
1201 Radio Rd, Redwood Shores 90,000 Offi ce $13,500,000
1241 East Hillsdale Blvd, Foster City 38,000 Offi ce $13,000,000
238 Lawrence Ave, S San Francisco 80,344 Industrial $9,550,000
201 Haskins Way, S San Francisco 26,600 Industrial $8,400,000
611 Santa Cruz Ave, Menlo Park 12,000 Retail $7,140,000
50 Chemical Way, Redwood City 1.4 Acres Land $5,200,000
1061 Douglas Ave, Redwood City 2.3 Acres Land $4,600,000
1101 Noel Dr, Menlo Park 16 Units Multi-Family $4,460,000
2 Adrian Ct, Burlingame 29,331 Industrial $4,050,000
Bayshore Technology ParkRedwood City
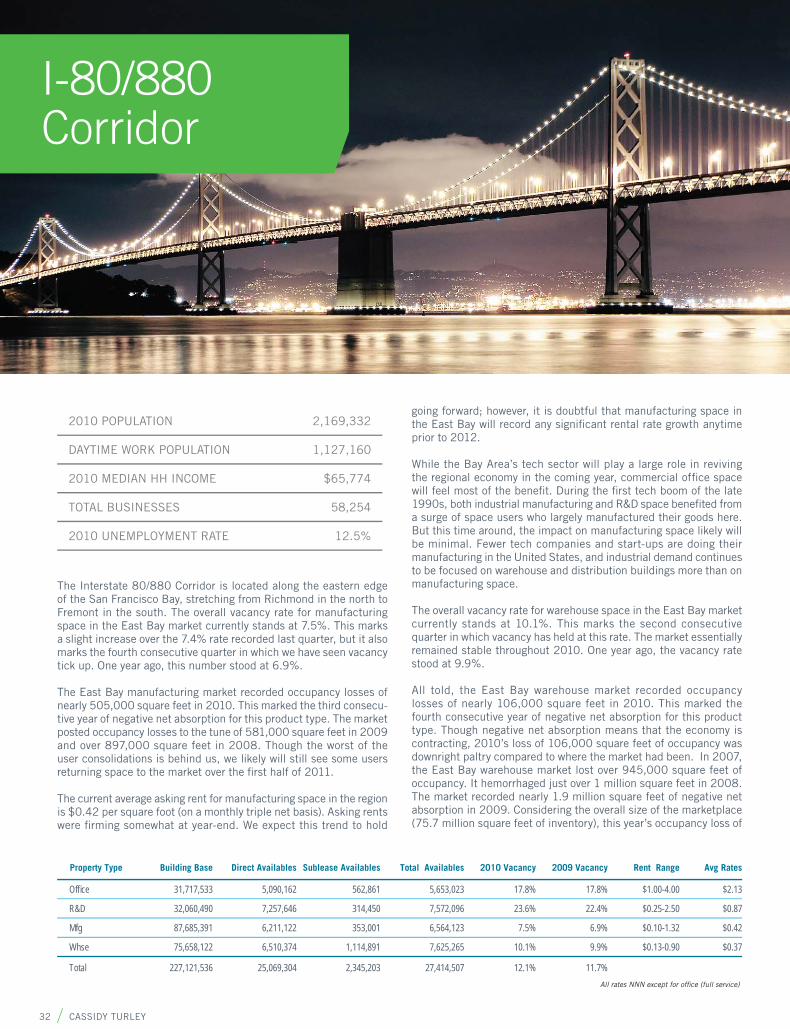
32 CASSIDY TURLEY
I-80
/880
CO
RR
IDO
R O
VE
RV
IEW I-80/880 CORRIDOR OVERVIEW
The Interstate 80/880 Corridor is located along the eastern edge of the San Francisco Bay, stretching from Richmond in the north to Fremont in the south. The overall vacancy rate for manufacturing space in the East Bay market currently stands at 7.5%. This marks a slight increase over the 7.4% rate recorded last quarter, but it also marks the fourth consecutive quarter in which we have seen vacancy tick up. One year ago, this number stood at 6.9%.
The East Bay manufacturing market recorded occupancy losses of nearly 505,000 square feet in 2010. This marked the third consecu-tive year of negative net absorption for this product type. The market posted occupancy losses to the tune of 581,000 square feet in 2009 and over 897,000 square feet in 2008. Though the worst of the user consolidations is behind us, we likely will still see some users returning space to the market over the fi rst half of 2011.
The current average asking rent for manufacturing space in the region is $0.42 per square foot (on a monthly triple net basis). Asking rents were fi rming somewhat at year-end. We expect this trend to hold
going forward; however, it is doubtful that manufacturing space in the East Bay will record any signifi cant rental rate growth anytime prior to 2012.
While the Bay Area’s tech sector will play a large role in reviving the regional economy in the coming year, commercial offi ce space will feel most of the benefi t. During the fi rst tech boom of the late 1990s, both industrial manufacturing and R&D space benefi ted from a surge of space users who largely manufactured their goods here. But this time around, the impact on manufacturing space likely will be minimal. Fewer tech companies and start-ups are doing their manufacturing in the United States, and industrial demand continues to be focused on warehouse and distribution buildings more than on manufacturing space.
The overall vacancy rate for warehouse space in the East Bay market currently stands at 10.1%. This marks the second consecutive quarter in which vacancy has held at this rate. The market essentially remained stable throughout 2010. One year ago, the vacancy rate stood at 9.9%.
All told, the East Bay warehouse market recorded occupancy losses of nearly 106,000 square feet in 2010. This marked the fourth consecutive year of negative net absorption for this product type. Though negative net absorption means that the economy is contracting, 2010’s loss of 106,000 square feet of occupancy was downright paltry compared to where the market had been. In 2007, the East Bay warehouse market lost over 945,000 square feet of occupancy. It hemorrhaged just over 1 million square feet in 2008. The market recorded nearly 1.9 million square feet of negative net absorption in 2009. Considering the overall size of the marketplace (75.7 million square feet of inventory), this year’s occupancy loss of
2010 POPULATION 2,169,332
DAYTIME WORK POPULATION 1,127,160
2010 MEDIAN HH INCOME $65,774
TOTAL BUSINESSES 58,254
2010 UNEMPLOYMENT RATE 12.5%
Property Type Building Base Direct Availables Sublease Availables Total Availables 2010 Vacancy 2009 Vacancy Rent Range Avg Rates
Offi ce 31,717,533 5,090,162 562,861 5,653,023 17.8% 17.8% $1.00-4.00 $2.13
R&D 32,060,490 7,257,646 314,450 7,572,096 23.6% 22.4% $0.25-2.50 $0.87
Mfg 87,685,391 6,211,122 353,001 6,564,123 7.5% 6.9% $0.10-1.32 $0.42
Whse 75,658,122 6,510,374 1,114,891 7,625,265 10.1% 9.9% $0.13-0.90 $0.37
Total 227,121,536 25,069,304 2,345,203 27,414,507 12.1% 11.7%All rates NNN except for offi ce (full service)
I-80/880 Corridor
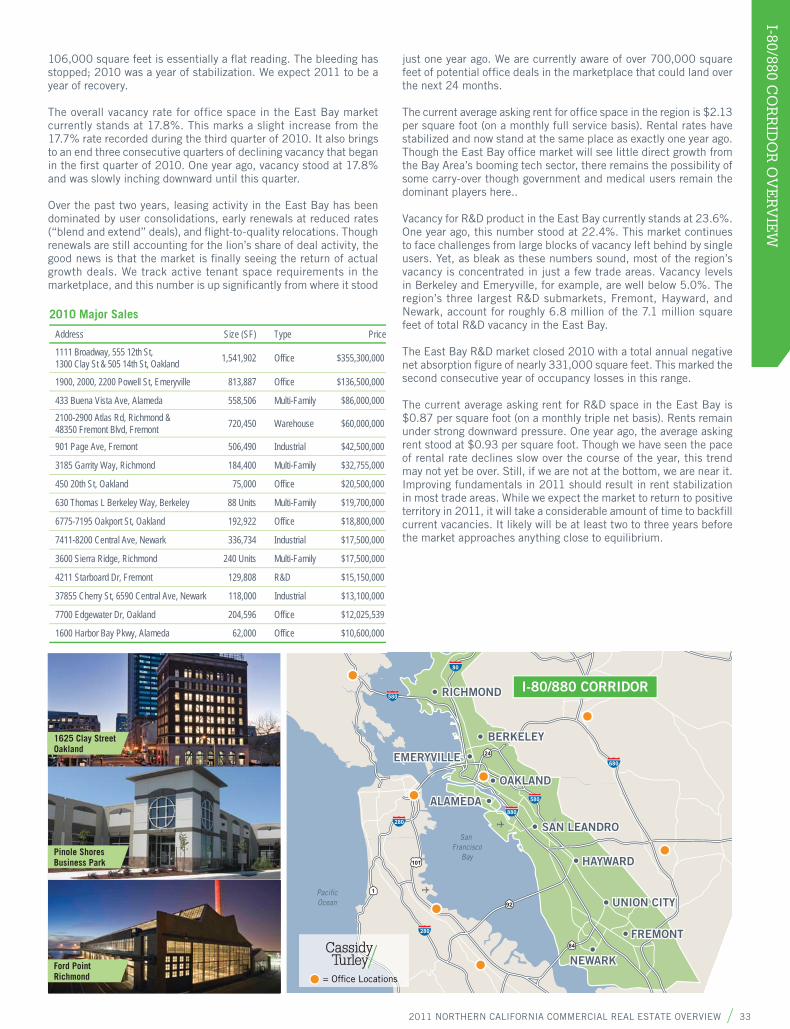
2011 NORTHERN CALIFORNIA COMMERCIAL REAL ESTATE OVERVIEW 33
I-80/880 CO
RR
IDO
R O
VE
RV
IEW
106,000 square feet is essentially a fl at reading. The bleeding has stopped; 2010 was a year of stabilization. We expect 2011 to be a year of recovery.
The overall vacancy rate for offi ce space in the East Bay market currently stands at 17.8%. This marks a slight increase from the 17.7% rate recorded during the third quarter of 2010. It also brings to an end three consecutive quarters of declining vacancy that began in the fi rst quarter of 2010. One year ago, vacancy stood at 17.8% and was slowly inching downward until this quarter.
Over the past two years, leasing activity in the East Bay has been dominated by user consolidations, early renewals at reduced rates (“blend and extend” deals), and fl ight-to-quality relocations. Though renewals are still accounting for the lion’s share of deal activity, the good news is that the market is fi nally seeing the return of actual growth deals. We track active tenant space requirements in the marketplace, and this number is up signifi cantly from where it stood
just one year ago. We are currently aware of over 700,000 square feet of potential offi ce deals in the marketplace that could land over the next 24 months.
The current average asking rent for offi ce space in the region is $2.13 per square foot (on a monthly full service basis). Rental rates have stabilized and now stand at the same place as exactly one year ago. Though the East Bay offi ce market will see little direct growth from the Bay Area’s booming tech sector, there remains the possibility of some carry-over though government and medical users remain the dominant players here..
Vacancy for R&D product in the East Bay currently stands at 23.6%. One year ago, this number stood at 22.4%. This market continues to face challenges from large blocks of vacancy left behind by single users. Yet, as bleak as these numbers sound, most of the region’s vacancy is concentrated in just a few trade areas. Vacancy levels in Berkeley and Emeryville, for example, are well below 5.0%. The region’s three largest R&D submarkets, Fremont, Hayward, and Newark, account for roughly 6.8 million of the 7.1 million square feet of total R&D vacancy in the East Bay.
The East Bay R&D market closed 2010 with a total annual negative net absorption fi gure of nearly 331,000 square feet. This marked the second consecutive year of occupancy losses in this range.
The current average asking rent for R&D space in the East Bay is $0.87 per square foot (on a monthly triple net basis). Rents remain under strong downward pressure. One year ago, the average asking rent stood at $0.93 per square foot. Though we have seen the pace of rental rate declines slow over the course of the year, this trend may not yet be over. Still, if we are not at the bottom, we are near it. Improving fundamentals in 2011 should result in rent stabilization in most trade areas. While we expect the market to return to positive territory in 2011, it will take a considerable amount of time to backfi ll current vacancies. It likely will be at least two to three years before the market approaches anything close to equilibrium.
PacificOcean
San Francisco
Bay
BERKELEY
EMERYVILLE
RICHMOND
OAKLAND
ALAMEDA
SAN LEANDRO
HAYWARD
UNION CITY
FREMONT
580
80
1
280
280880
680
580
101
NEWARK
I-80/880 CORRIDOR
92
84
24
= Office LocationsFord PointRichmond
Pinole Shores Business Park
1625 Clay Street Oakland
2010 Major Sales
Address Size (SF) Type Price
1111 Broadway, 555 12th St, 1300 Clay St & 505 14th St, Oakland 1,541,902 Offi ce $355,300,000
1900, 2000, 2200 Powell St, Emeryville 813,887 Offi ce $136,500,000
433 Buena Vista Ave, Alameda 558,506 Multi-Family $86,000,000 2100-2900 Atlas Rd, Richmond & 48350 Fremont Blvd, Fremont 720,450 Warehouse $60,000,000
901 Page Ave, Fremont 506,490 Industrial $42,500,000
3185 Garrity Way, Richmond 184,400 Multi-Family $32,755,000
450 20th St, Oakland 75,000 Offi ce $20,500,000
630 Thomas L Berkeley Way, Berkeley 88 Units Multi-Family $19,700,000
6775-7195 Oakport St, Oakland 192,922 Offi ce $18,800,000
7411-8200 Central Ave, Newark 336,734 Industrial $17,500,000
3600 Sierra Ridge, Richmond 240 Units Multi-Family $17,500,000
4211 Starboard Dr, Fremont 129,808 R&D $15,150,000
37855 Cherry St, 6590 Central Ave, Newark 118,000 Industrial $13,100,000
7700 Edgewater Dr, Oakland 204,596 Offi ce $12,025,539
1600 Harbor Bay Pkwy, Alameda 62,000 Offi ce $10,600,000
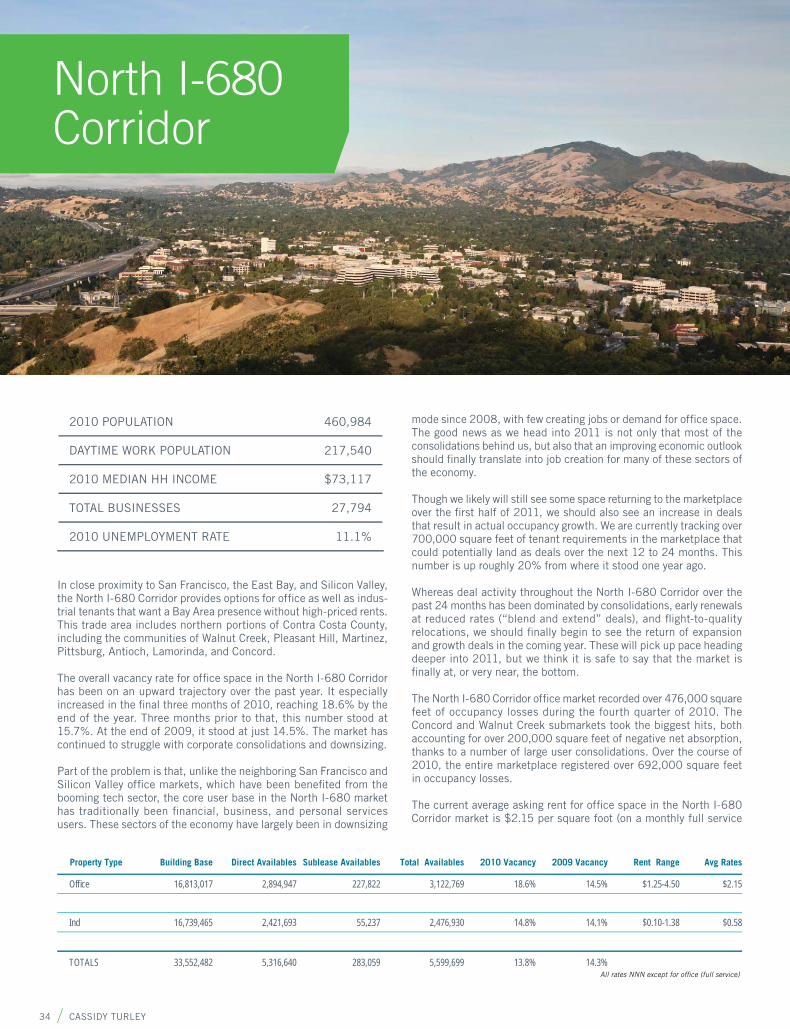
34 CASSIDY TURLEY
NO
RT
H I
-680
CO
RR
IDO
R O
VE
RV
IEW NORTH I-680 CORRIDOR OVERVIEW
In close proximity to San Francisco, the East Bay, and Silicon Valley, the North I-680 Corridor provides options for offi ce as well as indus-trial tenants that want a Bay Area presence without high-priced rents. This trade area includes northern portions of Contra Costa County, including the communities of Walnut Creek, Pleasant Hill, Martinez, Pittsburg, Antioch, Lamorinda, and Concord.
The overall vacancy rate for offi ce space in the North I-680 Corridor has been on an upward trajectory over the past year. It especially increased in the fi nal three months of 2010, reaching 18.6% by the end of the year. Three months prior to that, this number stood at 15.7%. At the end of 2009, it stood at just 14.5%. The market has continued to struggle with corporate consolidations and downsizing.
Part of the problem is that, unlike the neighboring San Francisco and Silicon Valley offi ce markets, which have been benefi ted from the booming tech sector, the core user base in the North I-680 market has traditionally been fi nancial, business, and personal services users. These sectors of the economy have largely been in downsizing
mode since 2008, with few creating jobs or demand for offi ce space. The good news as we head into 2011 is not only that most of the consolidations behind us, but also that an improving economic outlook should fi nally translate into job creation for many of these sectors of the economy.
Though we likely will still see some space returning to the marketplace over the fi rst half of 2011, we should also see an increase in deals that result in actual occupancy growth. We are currently tracking over 700,000 square feet of tenant requirements in the marketplace that could potentially land as deals over the next 12 to 24 months. This number is up roughly 20% from where it stood one year ago.
Whereas deal activity throughout the North I-680 Corridor over the past 24 months has been dominated by consolidations, early renewals at reduced rates (“blend and extend” deals), and fl ight-to-quality relocations, we should fi nally begin to see the return of expansion and growth deals in the coming year. These will pick up pace heading deeper into 2011, but we think it is safe to say that the market is fi nally at, or very near, the bottom.
The North I-680 Corridor offi ce market recorded over 476,000 square feet of occupancy losses during the fourth quarter of 2010. The Concord and Walnut Creek submarkets took the biggest hits, both accounting for over 200,000 square feet of negative net absorption, thanks to a number of large user consolidations. Over the course of 2010, the entire marketplace registered over 692,000 square feet in occupancy losses.
The current average asking rent for offi ce space in the North I-680 Corridor market is $2.15 per square foot (on a monthly full service
2010 POPULATION 460,984
DAYTIME WORK POPULATION 217,540
2010 MEDIAN HH INCOME $73,117
TOTAL BUSINESSES 27,794
2010 UNEMPLOYMENT RATE 11.1%
Property Type Building Base Direct Availables Sublease Availables Total Availables 2010 Vacancy 2009 Vacancy Rent Range Avg Rates
Offi ce 16,813,017 2,894,947 227,822 3,122,769 18.6% 14.5% $1.25-4.50 $2.15
Ind 16,739,465 2,421,693 55,237 2,476,930 14.8% 14.1% $0.10-1.38 $0.58
TOTALS 33,552,482 5,316,640 283,059 5,599,699 13.8% 14.3%All rates NNN except for offi ce (full service)
North I-680 Corridor

2011 NORTHERN CALIFORNIA COMMERCIAL REAL ESTATE OVERVIEW 35
NO
RT
H I-680 C
OR
RID
OR
OV
ER
VIE
Wbasis). Just last quarter, this number stood at $2.16. One year ago, the average asking rent was $2.26. Though we expect vacancy levels to begin to stabilize over the fi rst half of 2011, downward pressure will initially remain on rents. Look for rates to stabilize by the latter part of 2011. Rental rate growth, with a few exceptions in terms of some of the most desirable projects and within a few of the strongest trade areas, is not likely to occur anytime before 2012.
The market is at, or very near, bottom. Though the North I-680 Corridor offi ce market will see little direct growth from the Bay Area’s booming tech sector, a rising tide lifts all boats. Increased job creation heading into 2011 will also help boost demand above today’s levels in the coming year. Look for stabilization over the fi rst half of 2011, with recovery beginning to take hold by midyear. Still, with over 3.1 million square feet of vacant space to fi ll, it will take some time before the market approaches anything close to equilibrium.
The overall vacancy rate for industrial space in the North I-680 market dropped from 15.0%, as of the close of the third quarter, to today’s rate of 14.8%. This marked the second consecutive quarter of vacancy declines. Market vacancy peaked at midyear 2010 at 15.5%. During the fi nal three months of the year, the Pacheco, Concord, Walnut Creek, Antioch, and Pittsburg submarkets all recorded either fl at or declining vacancy. Only the Martinez submarket registered a slight increase in vacancy. The good news is that the market has stabilized. However, the bad news is that leasing activity remains slow by historical standards. While we do expect market fundamentals to continue to gradually improve with a better economy in 2011, we expect growth to be slow.
In terms of quarterly performance, the market recorded occupancy gains to the tune of just over 37,000 square feet of space during the fourth quarter. This followed third-quarter gains in excess of 82,000 square feet. However, net absorption had been in the red over the fi rst half of the year. Over the fi rst six months of 2010, the market had hemorrhaged over 230,000 square feet of occupancy. As a result, year-to-date totals for net absorption in the North I-680 Corridor remain in negative territory to the tune of 111,000 square feet.
While an annual net occupancy loss of over 100,000 square feet is nothing to write home about, the reality is that this marks a signifi cant improvement over where the market had been in the previous 30 months. This is especially the case since the market clearly turned a corner in the fi nal half of 2010. In 2009, the North I-680 Corridor recorded over 395,000 square feet of occupancy losses. Negative net absorption in 2008 exceeded 657,000 square feet. The market is stabilizing, and this trend should continue into the fi rst half of 2011. An improving overall economy should help boost occupancy growth totals by late in the year.
Deal activity throughout 2010 was focused largely on corporate consolidations, early renewals at reduced rental rates (blend and extend deals), and fl ight-to-quality relocations where tenants have
upgraded their space at lower rents. The good news is that most of the consolidations are behind us—their pace has drastically slowed since the fi rst half of 2010. While leasing activity continues to be dominated by renewals and relocations, we are beginning to see the return of actual tenant growth requirements. These will pick up as the economy improves heading deeper into 2011.
The current average asking rent for industrial space in the North I-680 Corridor market is $0.58 per square foot (on a monthly triple net basis). But while rents remained stable through the majority of 2010, it is unlikely that we will see much in the way of rental rate growth anytime soon. Improving economic fundamentals throughout the Bay Area are already playing out in San Francisco, San Mateo County, and Silicon Valley. The East Bay, unfortunately, may be the last to feel signifi cant improvement. Instead, the year ahead will be marked by very slow but stable growth.
The market will continue the trend of stabilization that began in the fi nal half of 2010. As mentioned above, though the North I-680 Corridor offi ce market will see little direct growth from the Bay Area, a rising tide lifts all boats. Increased job creation heading into 2011 will also help boost demand above today’s levels in the coming year. However, while we see improvement ahead, it is likely to be minimal at best; 2011 will be a year of slow but steady growth.
San Pablo Bay
PLEASANT HILL
CONCORD
580
680
680
80
24
MARTINEZPITTSBURG
ANTIOCH
WALNUT CREEK
NORTH I-680 CORRIDOR
300 Cutting Blvd Richmond
2010 Major Sales
Address Size (SF) Type Price
1459 Creekside Dr, Walnut Creek 316 Units Multi-Family $48,000,000
2300 Clayton Rd, Concord 358,589 Offi ce $42,700,000
1111 Civic Dr, Walnut Creek 65,900 Offi ce $13,400,000
3454 Hillcrest Ave, Antioch 39,400 Offi ce/Medical $6,400,000
1440-1480 Central Rd, Walnut Creek 2.2 Acres Land $6,350,000
2625 Shadelands Dr, Walnut Creek 60,000 Offi ce $6,041,500
1001 Galaxy Way, Concord 76,572 Offi ce $6,022,500
3713 Mt Diablo Blvd, Lafayette 46 Units Multi-Family $5,900,000
1515 Ygnacio Valley Rd, Walnut Creek 1.5 Acres Land $5,000,000
1666 Willow Pass Rd, Pittsburg 105,000 Warehouse $4,200,000
2320 Westcliffe Ln, Walnut Creek 22 Units Multi-Family $3,843,000
1250 Arroyo Way, Walnut Creek 12,420 Offi ce $3,000,000
1059 Detroit Ave, Concord 19,577 Industrial $2,925,000
2301 Stanwell Dr, Concord 15,040 Industrial $2,255,000
2930 Cloverdale Ave, Concord 73,136 Warehouse $2,050,000
4808 Sunrise Dr Martinez
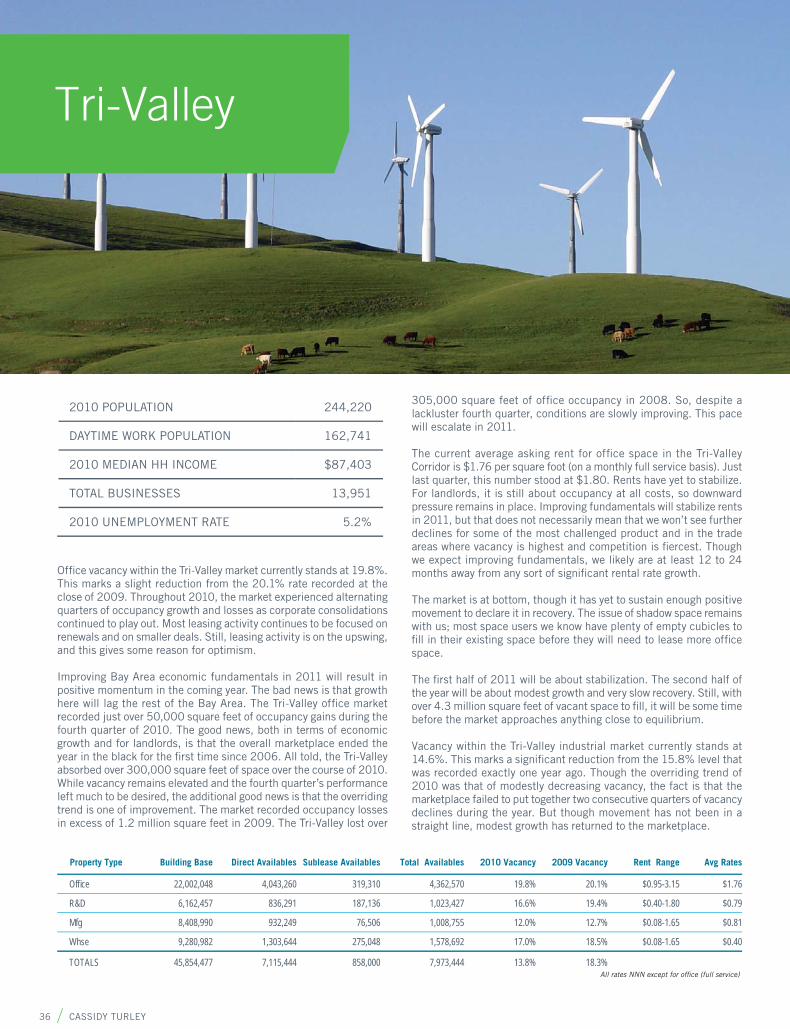
36 CASSIDY TURLEY
TR
I-V
AL
LE
Y O
VE
RV
IEW
TRI-VALLEY OVERVIEW
Offi ce vacancy within the Tri-Valley market currently stands at 19.8%. This marks a slight reduction from the 20.1% rate recorded at the close of 2009. Throughout 2010, the market experienced alternating quarters of occupancy growth and losses as corporate consolidations continued to play out. Most leasing activity continues to be focused on renewals and on smaller deals. Still, leasing activity is on the upswing, and this gives some reason for optimism.
Improving Bay Area economic fundamentals in 2011 will result in positive momentum in the coming year. The bad news is that growth here will lag the rest of the Bay Area. The Tri-Valley offi ce market recorded just over 50,000 square feet of occupancy gains during the fourth quarter of 2010. The good news, both in terms of economic growth and for landlords, is that the overall marketplace ended the year in the black for the fi rst time since 2006. All told, the Tri-Valley absorbed over 300,000 square feet of space over the course of 2010. While vacancy remains elevated and the fourth quarter’s performance left much to be desired, the additional good news is that the overriding trend is one of improvement. The market recorded occupancy losses in excess of 1.2 million square feet in 2009. The Tri-Valley lost over
305,000 square feet of offi ce occupancy in 2008. So, despite a lackluster fourth quarter, conditions are slowly improving. This pace will escalate in 2011.
The current average asking rent for offi ce space in the Tri-Valley Corridor is $1.76 per square foot (on a monthly full service basis). Just last quarter, this number stood at $1.80. Rents have yet to stabilize. For landlords, it is still about occupancy at all costs, so downward pressure remains in place. Improving fundamentals will stabilize rents in 2011, but that does not necessarily mean that we won’t see further declines for some of the most challenged product and in the trade areas where vacancy is highest and competition is fi ercest. Though we expect improving fundamentals, we likely are at least 12 to 24 months away from any sort of signifi cant rental rate growth.
The market is at bottom, though it has yet to sustain enough positive movement to declare it in recovery. The issue of shadow space remains with us; most space users we know have plenty of empty cubicles to fi ll in their existing space before they will need to lease more offi ce space.
The fi rst half of 2011 will be about stabilization. The second half of the year will be about modest growth and very slow recovery. Still, with over 4.3 million square feet of vacant space to fi ll, it will be some time before the market approaches anything close to equilibrium.
Vacancy within the Tri-Valley industrial market currently stands at 14.6%. This marks a signifi cant reduction from the 15.8% level that was recorded exactly one year ago. Though the overriding trend of 2010 was that of modestly decreasing vacancy, the fact is that the marketplace failed to put together two consecutive quarters of vacancy declines during the year. But though movement has not been in a straight line, modest growth has returned to the marketplace.
2010 POPULATION 244,220
DAYTIME WORK POPULATION 162,741
2010 MEDIAN HH INCOME $87,403
TOTAL BUSINESSES 13,951
2010 UNEMPLOYMENT RATE 5.2%
Property Type Building Base Direct Availables Sublease Availables Total Availables 2010 Vacancy 2009 Vacancy Rent Range Avg Rates
Offi ce 22,002,048 4,043,260 319,310 4,362,570 19.8% 20.1% $0.95-3.15 $1.76
R&D 6,162,457 836,291 187,136 1,023,427 16.6% 19.4% $0.40-1.80 $0.79
Mfg 8,408,990 932,249 76,506 1,008,755 12.0% 12.7% $0.08-1.65 $0.81
Whse 9,280,982 1,303,644 275,048 1,578,692 17.0% 18.5% $0.08-1.65 $0.40
TOTALS 45,854,477 7,115,444 858,000 7,973,444 13.8% 18.3%All rates NNN except for offi ce (full service)
Tri-Valley

2011 NORTHERN CALIFORNIA COMMERCIAL REAL ESTATE OVERVIEW 37
TR
I-VA
LL
EY
OV
ER
VIE
WIn terms of quarterly performance, the market recorded occupancy gains to the tune of 301,000 square feet during the fourth quarter of 2010. But the market lost nearly 463,000 square feet of occupancy during the third quarter of the year. Still, we end in positive territory for the year, to the tune of 61,000 square feet. While this refl ects only modest growth, it is a stark contrast to market performance over the past few years. The Tri-Valley industrial market recorded a negative net absorption of over 948,000 square feet in 2009. In 2008, the market lost nearly 526,000 square feet of occupancy. The last time that the market ended the year in the black was back in pre-recession 2007. So the good news is that, as challenging a year as 2010 was, we did see some improvement, albeit slight.
Average asking rents actually ticked up slightly over the fourth quarter from the $0.55 rate recorded three months earlier to today’s rate of $0.57. One year ago, the average asking rate was $0.59 per square foot. Rents have largely bottomed out. Looking forward, we see 2011 as a year that will initially be about rental rate stabilization. However, some of the region’s premier properties and stronger submarkets may see limited rental rate growth by year-end.
While improving Bay Area economic fundamentals will eventually result in positive momentum, the previously rock-solid industrial sector has been negatively impacted by a couple of factors. First, the global supply chain has become so effi cient and information-centric that when consumers stop buying, factories stop producing literally overnight. Second, thanks to the combination of just-in-time inventory strategies and the aforementioned tech trends, warehousing has largely become a month-to-month business with third-party logistics fi rms tying their lease commitments to those of their clients.
Looking forward, we expect industrial demand to pick up steam as we head deeper into 2011. The market recorded modest positive absorption throughout 2010. Those numbers will increase going forward, with the strongest growth likely over the second half of the year.
Vacancy within the Tri-Valley R&D market currently stands at 16.6%. One year ago, vacancy for R&D product stood at 19.4%. In terms of quarterly performance, the market recorded occupancy gains to the tune of 28,000 square feet during the fourth quarter. This brings year-to-date growth fi gures to over 178,000 square feet of space. In fact, 2010 is the fi rst year since 2007 that the market has ended the year in positive territory. R&D space recorded a negative net absorption of nearly 214,000 square feet in 2009. In 2008, the market recorded nearly 157,000 square feet of occupancy losses.
While the market clearly stabilized over the second half of 2010, it is much too soon to say that it is in recovery mode. However, improving economic fundamentals should translate into continued positive traction in 2011. The good news is that space user requirements are up. We track active tenant requirements in the marketplace and are currently aware of over 4.3 million square feet of potential industrial deals that could land in the Tri-Valley over the next 24 months. This number is up by about 20% from this time last year.
The current average asking rent for R&D space in the Tri-Valley market is $0.79 per square foot (on a monthly triple net basis). Rents remained stable at current levels over the second half of 2010. However, they have dropped precipitously since this time last year, when the average asking rent stood at $1.01 per square foot. That being
said, the market remains in stabilization mode, and downward pressure remains on rents. At least for the fi rst half of 2011, rents will likely remain fl at or could possibly register further modest decreases. Improving economic fundamentals will help to gradually increase demand over the course of the year. But growth will likely be modest at best. It may still be another couple of years before any sort of signifi cant rental rate growth is possible in the Tri-Valley R&D market.
84
680
680
580
580
TRI-VALLEYCORRIDOR
PLEASANTON
DUBLIN
SAN RAMON
LIVERMORE
= Office Locations
122 Linbergh Ave Livermore
4600 Norris Canyon San Ramon
2010 Major Sales
Address Size (SF) Type Price
1 Sybase, Dublin 405,000 Offi ce $146,202,000
5160 Hacienda Dr, Dublin 201,620 R&D $38,500,000
5643 Charlotte Way, Livermore 240 Units Multi-Family $33,250,000
Britannia Business Center, Pleasanton 276,405 Offi ce $24,000,000
6617 Dublin Blvd, Dublin 10.6 Acres Land $18,000,000
156 N Murrieta Blvd, Livermore 125 Units Multi-Family $16,700,000
4683 Chabot Dr, Pleasanton 53,503 Offi ce $10,710,000
5994 & 5976 W Las Positas Blvd, Pleasanton 105,044 Offi ce $9,600,000
W Jack London Blvd, Livermore 19.2 Acres Land $5,424,962
6383 Las Positas Rd, Livemore 106,700 Industrial $5,150,000
1200 Voyager St, Livermore 30,035 Warehouse $4,595,355
Hawk St, Livermore 116.8 Acres Land $4,500,000
7000 National Dr, Livermore 10,000 Industrial $4,326,177
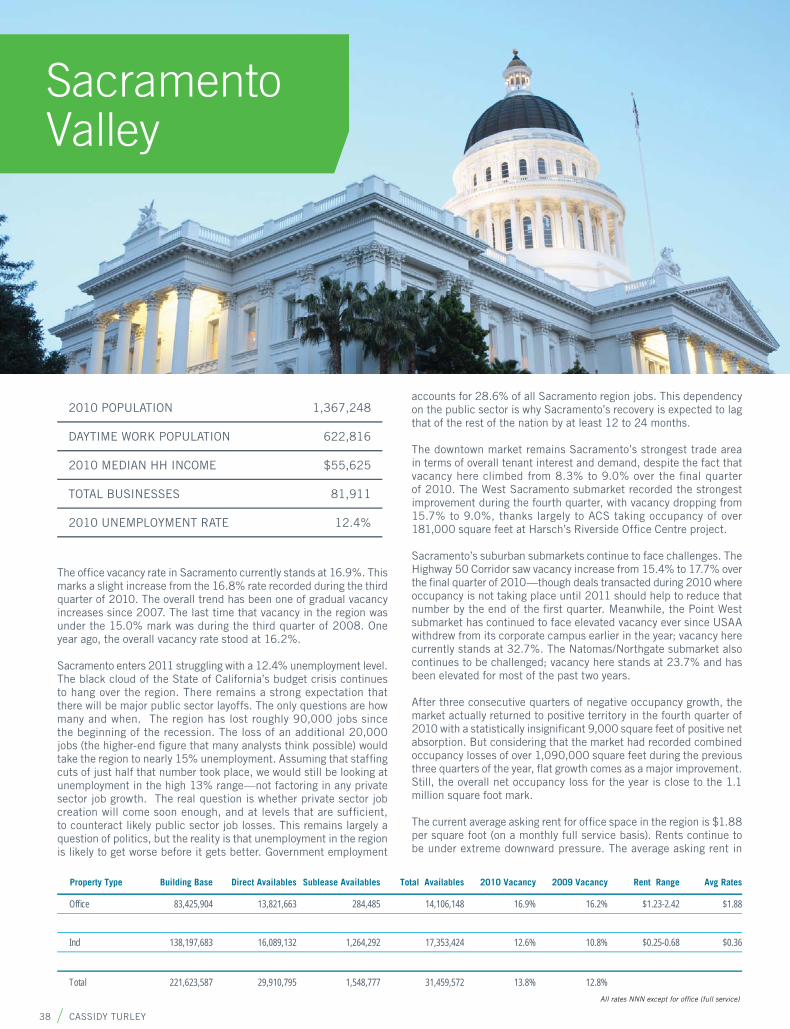
38 CASSIDY TURLEY
SAC
RA
ME
NT
O V
AL
LE
Y O
VE
RV
IEW
SACRAMENTO VALLEY OVERVIEW
Sacramento Valley
The offi ce vacancy rate in Sacramento currently stands at 16.9%. This marks a slight increase from the 16.8% rate recorded during the third quarter of 2010. The overall trend has been one of gradual vacancy increases since 2007. The last time that vacancy in the region was under the 15.0% mark was during the third quarter of 2008. One year ago, the overall vacancy rate stood at 16.2%.
Sacramento enters 2011 struggling with a 12.4% unemployment level. The black cloud of the State of California’s budget crisis continues to hang over the region. There remains a strong expectation that there will be major public sector layoffs. The only questions are how many and when. The region has lost roughly 90,000 jobs since the beginning of the recession. The loss of an additional 20,000 jobs (the higher-end fi gure that many analysts think possible) would take the region to nearly 15% unemployment. Assuming that staffi ng cuts of just half that number took place, we would still be looking at unemployment in the high 13% range—not factoring in any private sector job growth. The real question is whether private sector job creation will come soon enough, and at levels that are suffi cient, to counteract likely public sector job losses. This remains largely a question of politics, but the reality is that unemployment in the region is likely to get worse before it gets better. Government employment
accounts for 28.6% of all Sacramento region jobs. This dependency on the public sector is why Sacramento’s recovery is expected to lag that of the rest of the nation by at least 12 to 24 months.
The downtown market remains Sacramento’s strongest trade area in terms of overall tenant interest and demand, despite the fact that vacancy here climbed from 8.3% to 9.0% over the fi nal quarter of 2010. The West Sacramento submarket recorded the strongest improvement during the fourth quarter, with vacancy dropping from 15.7% to 9.0%, thanks largely to ACS taking occupancy of over 181,000 square feet at Harsch’s Riverside Offi ce Centre project.
Sacramento’s suburban submarkets continue to face challenges. The Highway 50 Corridor saw vacancy increase from 15.4% to 17.7% over the fi nal quarter of 2010—though deals transacted during 2010 where occupancy is not taking place until 2011 should help to reduce that number by the end of the fi rst quarter. Meanwhile, the Point West submarket has continued to face elevated vacancy ever since USAA withdrew from its corporate campus earlier in the year; vacancy here currently stands at 32.7%. The Natomas/Northgate submarket also continues to be challenged; vacancy here stands at 23.7% and has been elevated for most of the past two years.
After three consecutive quarters of negative occupancy growth, the market actually returned to positive territory in the fourth quarter of 2010 with a statistically insignifi cant 9,000 square feet of positive net absorption. But considering that the market had recorded combined occupancy losses of over 1,090,000 square feet during the previous three quarters of the year, fl at growth comes as a major improvement. Still, the overall net occupancy loss for the year is close to the 1.1 million square foot mark.
The current average asking rent for offi ce space in the region is $1.88 per square foot (on a monthly full service basis). Rents continue to be under extreme downward pressure. The average asking rent in
2010 POPULATION 1,367,248
DAYTIME WORK POPULATION 622,816
2010 MEDIAN HH INCOME $55,625
TOTAL BUSINESSES 81,911
2010 UNEMPLOYMENT RATE 12.4%
Property Type Building Base Direct Availables Sublease Availables Total Availables 2010 Vacancy 2009 Vacancy Rent Range Avg Rates
Offi ce 83,425,904 13,821,663 284,485 14,106,148 16.9% 16.2% $1.23-2.42 $1.88
Ind 138,197,683 16,089,132 1,264,292 17,353,424 12.6% 10.8% $0.25-0.68 $0.36
Total 221,623,587 29,910,795 1,548,777 31,459,572 13.8% 12.8%All rates NNN except for offi ce (full service)
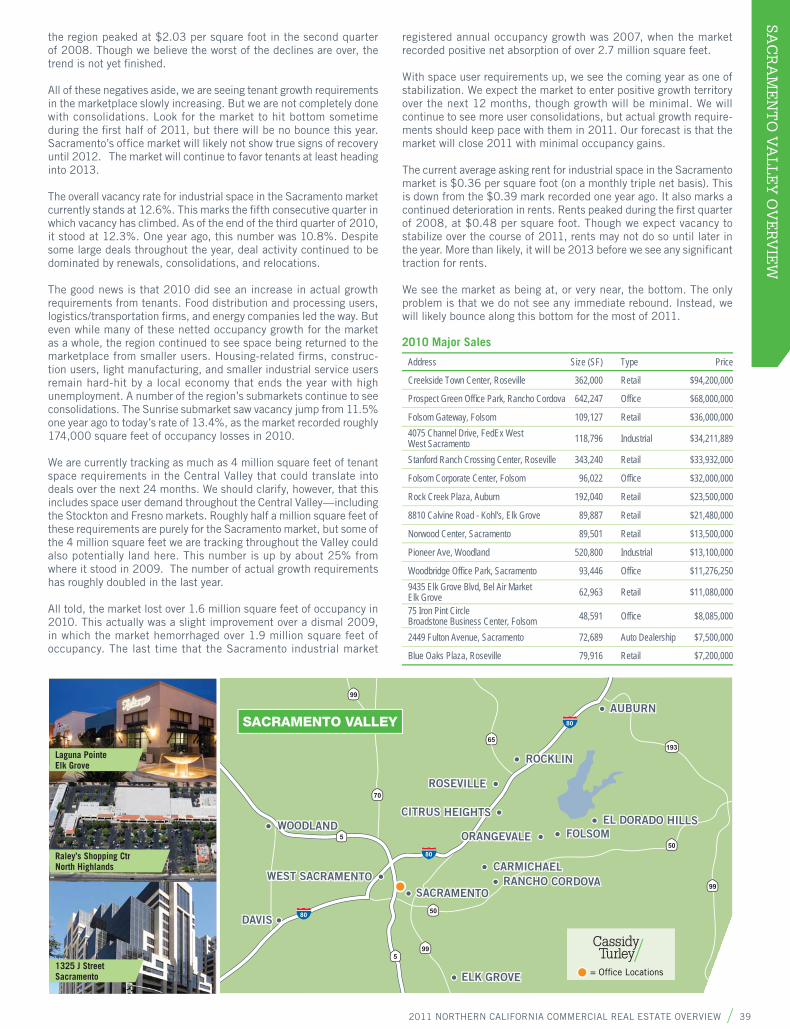
2011 NORTHERN CALIFORNIA COMMERCIAL REAL ESTATE OVERVIEW 39
SAC
RA
ME
NT
O V
AL
LE
Y O
VE
RV
IEW
the region peaked at $2.03 per square foot in the second quarter of 2008. Though we believe the worst of the declines are over, the trend is not yet fi nished.
All of these negatives aside, we are seeing tenant growth requirements in the marketplace slowly increasing. But we are not completely done with consolidations. Look for the market to hit bottom sometime during the fi rst half of 2011, but there will be no bounce this year. Sacramento’s offi ce market will likely not show true signs of recovery until 2012. The market will continue to favor tenants at least heading into 2013.
The overall vacancy rate for industrial space in the Sacramento market currently stands at 12.6%. This marks the fi fth consecutive quarter in which vacancy has climbed. As of the end of the third quarter of 2010, it stood at 12.3%. One year ago, this number was 10.8%. Despite some large deals throughout the year, deal activity continued to be dominated by renewals, consolidations, and relocations.
The good news is that 2010 did see an increase in actual growth requirements from tenants. Food distribution and processing users, logistics/transportation fi rms, and energy companies led the way. But even while many of these netted occupancy growth for the market as a whole, the region continued to see space being returned to the marketplace from smaller users. Housing-related fi rms, construc-tion users, light manufacturing, and smaller industrial service users remain hard-hit by a local economy that ends the year with high unemployment. A number of the region’s submarkets continue to see consolidations. The Sunrise submarket saw vacancy jump from 11.5% one year ago to today’s rate of 13.4%, as the market recorded roughly 174,000 square feet of occupancy losses in 2010.
We are currently tracking as much as 4 million square feet of tenant space requirements in the Central Valley that could translate into deals over the next 24 months. We should clarify, however, that this includes space user demand throughout the Central Valley—including the Stockton and Fresno markets. Roughly half a million square feet of these requirements are purely for the Sacramento market, but some of the 4 million square feet we are tracking throughout the Valley could also potentially land here. This number is up by about 25% from where it stood in 2009. The number of actual growth requirements has roughly doubled in the last year.
All told, the market lost over 1.6 million square feet of occupancy in 2010. This actually was a slight improvement over a dismal 2009, in which the market hemorrhaged over 1.9 million square feet of occupancy. The last time that the Sacramento industrial market
registered annual occupancy growth was 2007, when the market recorded positive net absorption of over 2.7 million square feet.
With space user requirements up, we see the coming year as one of stabilization. We expect the market to enter positive growth territory over the next 12 months, though growth will be minimal. We will continue to see more user consolidations, but actual growth require-ments should keep pace with them in 2011. Our forecast is that the market will close 2011 with minimal occupancy gains.
The current average asking rent for industrial space in the Sacramento market is $0.36 per square foot (on a monthly triple net basis). This is down from the $0.39 mark recorded one year ago. It also marks a continued deterioration in rents. Rents peaked during the fi rst quarter of 2008, at $0.48 per square foot. Though we expect vacancy to stabilize over the course of 2011, rents may not do so until later in the year. More than likely, it will be 2013 before we see any signifi cant traction for rents.
We see the market as being at, or very near, the bottom. The only problem is that we do not see any immediate rebound. Instead, we will likely bounce along this bottom for the most of 2011.
80
80
80
99
50
70
65193
99
50
ROCKLIN
ROSEVILLE
EL DORADO HILLSWOODLAND
DAVIS
SACRAMENTO
CITRUS HEIGHTS
FOLSOMORANGEVALE
RANCHO CORDOVA
AUBURN
WEST SACRAMENTOCARMICHAEL
ELK GROVE
SACRAMENTO VALLEY
5
599
= Office Locations
Laguna PointeElk Grove
Raley’s Shopping CtrNorth Highlands
2010 Major Sales
Address Size (SF) Type Price
Creekside Town Center, Roseville 362,000 Retail $94,200,000
Prospect Green Offi ce Park, Rancho Cordova 642,247 Offi ce $68,000,000
Folsom Gateway, Folsom 109,127 Retail $36,000,000 4075 Channel Drive, FedEx WestWest Sacramento 118,796 Industrial $34,211,889
Stanford Ranch Crossing Center, Roseville 343,240 Retail $33,932,000
Folsom Corporate Center, Folsom 96,022 Offi ce $32,000,000
Rock Creek Plaza, Auburn 192,040 Retail $23,500,000
8810 Calvine Road - Kohl's, Elk Grove 89,887 Retail $21,480,000
Norwood Center, Sacramento 89,501 Retail $13,500,000
Pioneer Ave, Woodland 520,800 Industrial $13,100,000
Woodbridge Offi ce Park, Sacramento 93,446 Offi ce $11,276,250 9435 Elk Grove Blvd, Bel Air MarketElk Grove 62,963 Retail $11,080,000
75 Iron Pint CircleBroadstone Business Center, Folsom 48,591 Offi ce $8,085,000
2449 Fulton Avenue, Sacramento 72,689 Auto Dealership $7,500,000
Blue Oaks Plaza, Roseville 79,916 Retail $7,200,000
1325 J StreetSacramento

40 CASSIDY TURLEY
MA
RIN
CO
UN
TY
OV
ER
VIE
WMARIN COUNTY OVERVIEW
Marin County, bordered by the San Francisco Bay, the Pacifi c Ocean, and the vineyards of the Sonoma Valley, is regarded as one of the most affl uent and beautiful regions in the world. Marin County is home to approximately 250,000 residents, with approximately 160,000 people employed throughout the area. The local offi ce market is dominated by smaller, service-oriented companies, though some of the larger local employers include Fireman’s Fund Insurance, Autodesk, and Fair Isaac.
Marin County offi ce vacancy currently stands at 20.5%. As 2009 came to a close, this number stood at 20.4%. Throughout 2010, the market experienced alternating quarters of occupancy growth and losses as consolidations have continued to play out. The market has yet to build sustainable positive momentum.
Central Marin (which includes the Corte Madera and Greenbrae/Larkspur submarkets) remains the strongest trade area in terms of vacancy, with a current rate of 11.2%. This is down from the 12.7% mark recorded last year. The Southern Marin trade area (which includes the Sausalito/Tiburon and Mill Valley submarkets) currently
has a vacancy rate of 13.8%, down from 14.1% at the close of 2009. The Northern Marin trade area (which includes the San Rafael and Novato submarkets) has the highest vacancy levels in the region with a current rate of 23.3%. This number actually increased over the course of 2010. Last year it stood at 22.8%.
Deal activity continues to be subdued and dominated by renewals and fl ight-to-quality relocations. Few deals above the 10,000 square foot mark were inked over the fi nal half of the year. Likewise, few deals resulted in actual occupancy growth. For example, of the top ten leases signed during the fourth quarter of this year, only two of these deals were for expanding space users. The remainder were renewals or relocations that resulted in no new occupancy growth.
There is cause for optimism in 2011. We track active tenant require-ments in the marketplace and are currently aware of just under 1 million square feet of potential deals that could land in the market over the next 12 to 24 months. This number is up by about 25% from the same time last year. Meanwhile, our brokers are already reporting increased touring activity. Bay Area economic fundamentals are already beginning to improve, and we expect positive momentum to build in 2011. Though these trends will most signifi cantly impact the San Francisco, San Mateo, and Silicon Valley marketplaces, the Bay Area’s secondary markets will also feel a boost. It is just that in the case of the North Bay, this impact will be delayed.
The Marin offi ce market recorded just over 127,000 square feet of occupancy gains during the fourth quarter of 2010. But fourth quarter gains were not enough to eradicate losses from earlier in the year. The market ended 2010 with a total negative net absorption of 14,000 square feet. In essence, 2010 was a fl at year. Still, this marks a signifi cant improvement over 2008 and 2009, in which the market respectively recorded 264,000 and 317,000 square feet of occupancy
2010 POPULATION 253,077
DAYTIME WORK POPULATION 123,501
2010 MEDIAN HH INCOME $87,237
TOTAL BUSINESSES 19,954
2010 UNEMPLOYMENT RATE 7.9%
Property Type Building Base Direct Availables Sublease Availables Total Availables 2010 Vacancy 2009 Vacancy Rent Range Avg Rates
Offi ce 9,691,213 1,615,484 375,713 1,991,197 20.5% 20.4% $0.99-4.75 $2.43
Total 9,691,213 1,615,484 375,713 1,991,197 13.8% 20.4%All rates NNN except for offi ce (full service)
Marin County
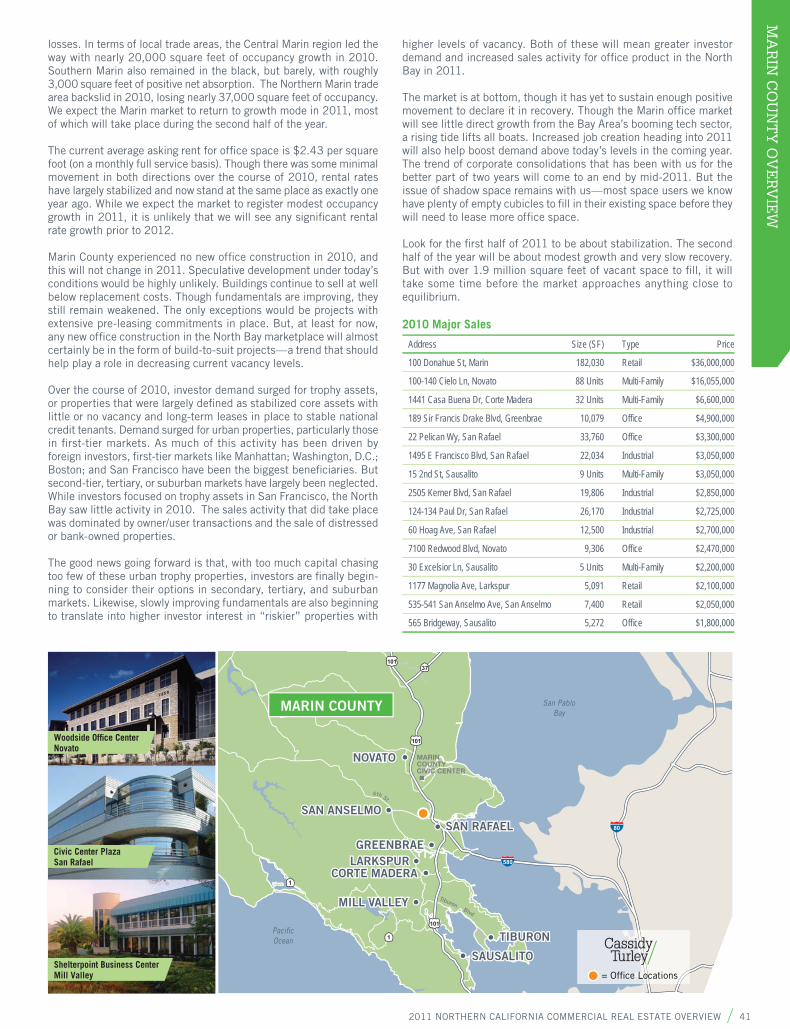
2011 NORTHERN CALIFORNIA COMMERCIAL REAL ESTATE OVERVIEW 41
MA
RIN
CO
UN
TY
OV
ER
VIE
W
Shelterpoint Business CenterMill Valley
Civic Center PlazaSan Rafael
losses. In terms of local trade areas, the Central Marin region led the way with nearly 20,000 square feet of occupancy growth in 2010. Southern Marin also remained in the black, but barely, with roughly 3,000 square feet of positive net absorption. The Northern Marin trade area backslid in 2010, losing nearly 37,000 square feet of occupancy. We expect the Marin market to return to growth mode in 2011, most of which will take place during the second half of the year.
The current average asking rent for offi ce space is $2.43 per square foot (on a monthly full service basis). Though there was some minimal movement in both directions over the course of 2010, rental rates have largely stabilized and now stand at the same place as exactly one year ago. While we expect the market to register modest occupancy growth in 2011, it is unlikely that we will see any signifi cant rental rate growth prior to 2012.
Marin County experienced no new offi ce construction in 2010, and this will not change in 2011. Speculative development under today’s conditions would be highly unlikely. Buildings continue to sell at well below replacement costs. Though fundamentals are improving, they still remain weakened. The only exceptions would be projects with extensive pre-leasing commitments in place. But, at least for now, any new offi ce construction in the North Bay marketplace will almost certainly be in the form of build-to-suit projects—a trend that should help play a role in decreasing current vacancy levels.
Over the course of 2010, investor demand surged for trophy assets, or properties that were largely defi ned as stabilized core assets with little or no vacancy and long-term leases in place to stable national credit tenants. Demand surged for urban properties, particularly those in fi rst-tier markets. As much of this activity has been driven by foreign investors, fi rst-tier markets like Manhattan; Washington, D.C.; Boston; and San Francisco have been the biggest benefi ciaries. But second-tier, tertiary, or suburban markets have largely been neglected. While investors focused on trophy assets in San Francisco, the North Bay saw little activity in 2010. The sales activity that did take place was dominated by owner/user transactions and the sale of distressed or bank-owned properties.
The good news going forward is that, with too much capital chasing too few of these urban trophy properties, investors are fi nally begin-ning to consider their options in secondary, tertiary, and suburban markets. Likewise, slowly improving fundamentals are also beginning to translate into higher investor interest in “riskier” properties with
higher levels of vacancy. Both of these will mean greater investor demand and increased sales activity for offi ce product in the North Bay in 2011.
The market is at bottom, though it has yet to sustain enough positive movement to declare it in recovery. Though the Marin offi ce market will see little direct growth from the Bay Area’s booming tech sector, a rising tide lifts all boats. Increased job creation heading into 2011 will also help boost demand above today’s levels in the coming year. The trend of corporate consolidations that has been with us for the better part of two years will come to an end by mid-2011. But the issue of shadow space remains with us—most space users we know have plenty of empty cubicles to fi ll in their existing space before they will need to lease more offi ce space.
Look for the fi rst half of 2011 to be about stabilization. The second half of the year will be about modest growth and very slow recovery. But with over 1.9 million square feet of vacant space to fi ll, it will take some time before the market approaches anything close to equilibrium.
4th St
Tiburon Blvd
MARINCOUNTYCIVIC CENTER
San PabloBay
PacificOcean
580
80
101
10137
101
1
1
SAN ANSELMO
NOVATO
CORTE MADERA
GREENBRAELARKSPUR
MILL VALLEY
TIBURON
SAUSALITO
SAN RAFAEL
MARIN COUNTY
= Office Locations
Woodside Offi ce CenterNovato
2010 Major Sales
Address Size (SF) Type Price
100 Donahue St, Marin 182,030 Retail $36,000,000
100-140 Cielo Ln, Novato 88 Units Multi-Family $16,055,000
1441 Casa Buena Dr, Corte Madera 32 Units Multi-Family $6,600,000
189 Sir Francis Drake Blvd, Greenbrae 10,079 Offi ce $4,900,000
22 Pelican Wy, San Rafael 33,760 Offi ce $3,300,000
1495 E Francisco Blvd, San Rafael 22,034 Industrial $3,050,000
15 2nd St, Sausalito 9 Units Multi-Family $3,050,000
2505 Kerner Blvd, San Rafael 19,806 Industrial $2,850,000
124-134 Paul Dr, San Rafael 26,170 Industrial $2,725,000
60 Hoag Ave, San Rafael 12,500 Industrial $2,700,000
7100 Redwood Blvd, Novato 9,306 Offi ce $2,470,000
30 Excelsior Ln, Sausalito 5 Units Multi-Family $2,200,000
1177 Magnolia Ave, Larkspur 5,091 Retail $2,100,000
535-541 San Anselmo Ave, San Anselmo 7,400 Retail $2,050,000
565 Bridgeway, Sausalito 5,272 Offi ce $1,800,000
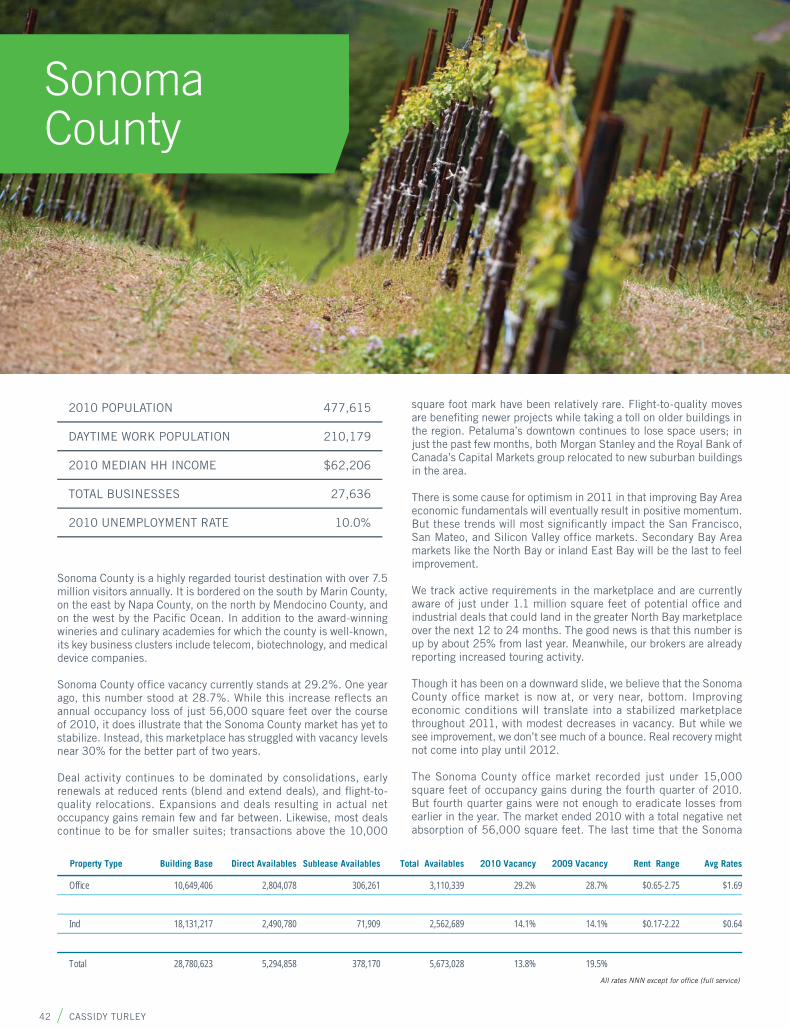
42 CASSIDY TURLEY
SON
OM
A C
OU
NT
Y O
VE
RV
IEW
SONOMA COUNTY OVERVIEW
Sonoma County is a highly regarded tourist destination with over 7.5 million visitors annually. It is bordered on the south by Marin County, on the east by Napa County, on the north by Mendocino County, and on the west by the Pacifi c Ocean. In addition to the award-winning wineries and culinary academies for which the county is well-known, its key business clusters include telecom, biotechnology, and medical device companies.
Sonoma County offi ce vacancy currently stands at 29.2%. One year ago, this number stood at 28.7%. While this increase refl ects an annual occupancy loss of just 56,000 square feet over the course of 2010, it does illustrate that the Sonoma County market has yet to stabilize. Instead, this marketplace has struggled with vacancy levels near 30% for the better part of two years.
Deal activity continues to be dominated by consolidations, early renewals at reduced rents (blend and extend deals), and fl ight-to-quality relocations. Expansions and deals resulting in actual net occupancy gains remain few and far between. Likewise, most deals continue to be for smaller suites; transactions above the 10,000
square foot mark have been relatively rare. Flight-to-quality moves are benefi ting newer projects while taking a toll on older buildings in the region. Petaluma’s downtown continues to lose space users; in just the past few months, both Morgan Stanley and the Royal Bank of Canada’s Capital Markets group relocated to new suburban buildings in the area.
There is some cause for optimism in 2011 in that improving Bay Area economic fundamentals will eventually result in positive momentum. But these trends will most signifi cantly impact the San Francisco, San Mateo, and Silicon Valley offi ce markets. Secondary Bay Area markets like the North Bay or inland East Bay will be the last to feel improvement.
We track active requirements in the marketplace and are currently aware of just under 1.1 million square feet of potential offi ce and industrial deals that could land in the greater North Bay marketplace over the next 12 to 24 months. The good news is that this number is up by about 25% from last year. Meanwhile, our brokers are already reporting increased touring activity.
Though it has been on a downward slide, we believe that the Sonoma County offi ce market is now at, or very near, bottom. Improving economic conditions will translate into a stabilized marketplace throughout 2011, with modest decreases in vacancy. But while we see improvement, we don’t see much of a bounce. Real recovery might not come into play until 2012.
The Sonoma County office market recorded just under 15,000 square feet of occupancy gains during the fourth quarter of 2010. But fourth quarter gains were not enough to eradicate losses from earlier in the year. The market ended 2010 with a total negative net absorption of 56,000 square feet. The last time that the Sonoma
2010 POPULATION 477,615
DAYTIME WORK POPULATION 210,179
2010 MEDIAN HH INCOME $62,206
TOTAL BUSINESSES 27,636
2010 UNEMPLOYMENT RATE 10.0%
Property Type Building Base Direct Availables Sublease Availables Total Availables 2010 Vacancy 2009 Vacancy Rent Range Avg Rates
Offi ce 10,649,406 2,804,078 306,261 3,110,339 29.2% 28.7% $0.65-2.75 $1.69
Ind 18,131,217 2,490,780 71,909 2,562,689 14.1% 14.1% $0.17-2.22 $0.64
Total 28,780,623 5,294,858 378,170 5,673,028 13.8% 19.5%All rates NNN except for offi ce (full service)
Sonoma County
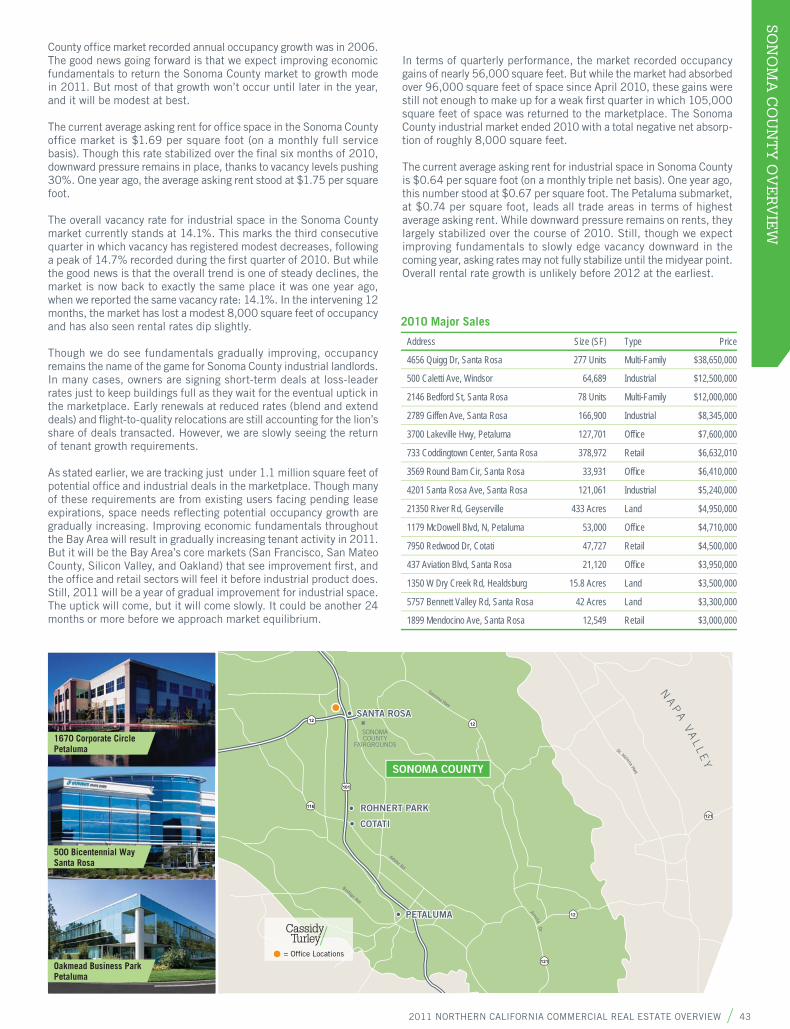
2011 NORTHERN CALIFORNIA COMMERCIAL REAL ESTATE OVERVIEW 43
SON
OM
A C
OU
NT
Y O
VE
RV
IEW
County offi ce market recorded annual occupancy growth was in 2006. The good news going forward is that we expect improving economic fundamentals to return the Sonoma County market to growth mode in 2011. But most of that growth won’t occur until later in the year, and it will be modest at best.
The current average asking rent for offi ce space in the Sonoma County offi ce market is $1.69 per square foot (on a monthly full service basis). Though this rate stabilized over the fi nal six months of 2010, downward pressure remains in place, thanks to vacancy levels pushing 30%. One year ago, the average asking rent stood at $1.75 per square foot.
The overall vacancy rate for industrial space in the Sonoma County market currently stands at 14.1%. This marks the third consecutive quarter in which vacancy has registered modest decreases, following a peak of 14.7% recorded during the fi rst quarter of 2010. But while the good news is that the overall trend is one of steady declines, the market is now back to exactly the same place it was one year ago, when we reported the same vacancy rate: 14.1%. In the intervening 12 months, the market has lost a modest 8,000 square feet of occupancy and has also seen rental rates dip slightly.
Though we do see fundamentals gradually improving, occupancy remains the name of the game for Sonoma County industrial landlords. In many cases, owners are signing short-term deals at loss-leader rates just to keep buildings full as they wait for the eventual uptick in the marketplace. Early renewals at reduced rates (blend and extend deals) and fl ight-to-quality relocations are still accounting for the lion’s share of deals transacted. However, we are slowly seeing the return of tenant growth requirements.
As stated earlier, we are tracking just under 1.1 million square feet of potential offi ce and industrial deals in the marketplace. Though many of these requirements are from existing users facing pending lease expirations, space needs refl ecting potential occupancy growth are gradually increasing. Improving economic fundamentals throughout the Bay Area will result in gradually increasing tenant activity in 2011. But it will be the Bay Area’s core markets (San Francisco, San Mateo County, Silicon Valley, and Oakland) that see improvement fi rst, and the offi ce and retail sectors will feel it before industrial product does. Still, 2011 will be a year of gradual improvement for industrial space. The uptick will come, but it will come slowly. It could be another 24 months or more before we approach market equilibrium.
In terms of quarterly performance, the market recorded occupancy gains of nearly 56,000 square feet. But while the market had absorbed over 96,000 square feet of space since April 2010, these gains were still not enough to make up for a weak fi rst quarter in which 105,000 square feet of space was returned to the marketplace. The Sonoma County industrial market ended 2010 with a total negative net absorp-tion of roughly 8,000 square feet.
The current average asking rent for industrial space in Sonoma County is $0.64 per square foot (on a monthly triple net basis). One year ago, this number stood at $0.67 per square foot. The Petaluma submarket, at $0.74 per square foot, leads all trade areas in terms of highest average asking rent. While downward pressure remains on rents, they largely stabilized over the course of 2010. Still, though we expect improving fundamentals to slowly edge vacancy downward in the coming year, asking rates may not fully stabilize until the midyear point. Overall rental rate growth is unlikely before 2012 at the earliest.
NA
PA
VA
LL
EY
Sonoma Hwy
St. Helena Hwy
Adobe Rd
Bodega Ave
Arnold Dr
101
116
1212
121
12
121
SANTA ROSA
ROHNERT PARK
COTATI
PETALUMA
SONOMACOUNTY
FAIRGROUNDS
SONOMA COUNTY
= Office Locations
500 Bicentennial Way Santa Rosa
2010 Major Sales
Address Size (SF) Type Price
4656 Quigg Dr, Santa Rosa 277 Units Multi-Family $38,650,000
500 Caletti Ave, Windsor 64,689 Industrial $12,500,000
2146 Bedford St, Santa Rosa 78 Units Multi-Family $12,000,000
2789 Giffen Ave, Santa Rosa 166,900 Industrial $8,345,000
3700 Lakeville Hwy, Petaluma 127,701 Offi ce $7,600,000
733 Coddingtown Center, Santa Rosa 378,972 Retail $6,632,010
3569 Round Barn Cir, Santa Rosa 33,931 Offi ce $6,410,000
4201 Santa Rosa Ave, Santa Rosa 121,061 Industrial $5,240,000
21350 River Rd, Geyserville 433 Acres Land $4,950,000
1179 McDowell Blvd, N, Petaluma 53,000 Offi ce $4,710,000
7950 Redwood Dr, Cotati 47,727 Retail $4,500,000
437 Aviation Blvd, Santa Rosa 21,120 Offi ce $3,950,000
1350 W Dry Creek Rd, Healdsburg 15.8 Acres Land $3,500,000
5757 Bennett Valley Rd, Santa Rosa 42 Acres Land $3,300,000
1899 Mendocino Ave, Santa Rosa 12,549 Retail $3,000,000
Oakmead Business ParkPetaluma
1670 Corporate CirclePetaluma
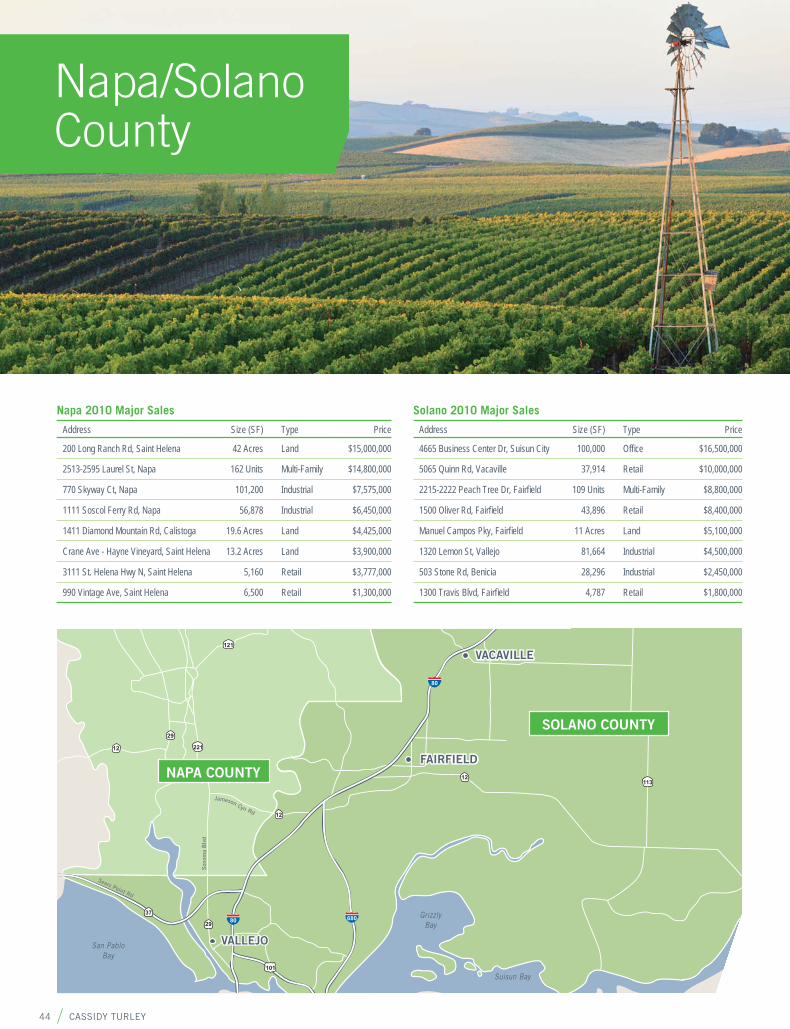
44 CASSIDY TURLEY
NA
PA/S
OL
AN
O C
OU
NT
Y O
VE
RV
IEW NAPA/SOLANO COUNTY OVERVIEW
Napa 2010 Major Sales
Address Size (SF) Type Price
200 Long Ranch Rd, Saint Helena 42 Acres Land $15,000,000
2513-2595 Laurel St, Napa 162 Units Multi-Family $14,800,000
770 Skyway Ct, Napa 101,200 Industrial $7,575,000
1111 Soscol Ferry Rd, Napa 56,878 Industrial $6,450,000
1411 Diamond Mountain Rd, Calistoga 19.6 Acres Land $4,425,000
Crane Ave - Hayne Vineyard, Saint Helena 13.2 Acres Land $3,900,000
3111 St. Helena Hwy N, Saint Helena 5,160 Retail $3,777,000
990 Vintage Ave, Saint Helena 6,500 Retail $1,300,000
Solano 2010 Major Sales
Address Size (SF) Type Price
4665 Business Center Dr, Suisun City 100,000 Offi ce $16,500,000
5065 Quinn Rd, Vacaville 37,914 Retail $10,000,000
2215-2222 Peach Tree Dr, Fairfi eld 109 Units Multi-Family $8,800,000
1500 Oliver Rd, Fairfi eld 43,896 Retail $8,400,000
Manuel Campos Pky, Fairfi eld 11 Acres Land $5,100,000
1320 Lemon St, Vallejo 81,664 Industrial $4,500,000
503 Stone Rd, Benicia 28,296 Industrial $2,450,000
1300 Travis Blvd, Fairfi eld 4,787 Retail $1,800,000
Jameson Cyn Rd
GrizzlyBay
Suisun Bay
San PabloBay
Sono
ma
Blv
d
Sears Point Rd
68080
101
29
37
12
12
12
29
221
121
80
113
VACAVILLE
FAIRFIELD
VALLEJO
NAPA COUNTY
SOLANO COUNTY
Napa/Solano County
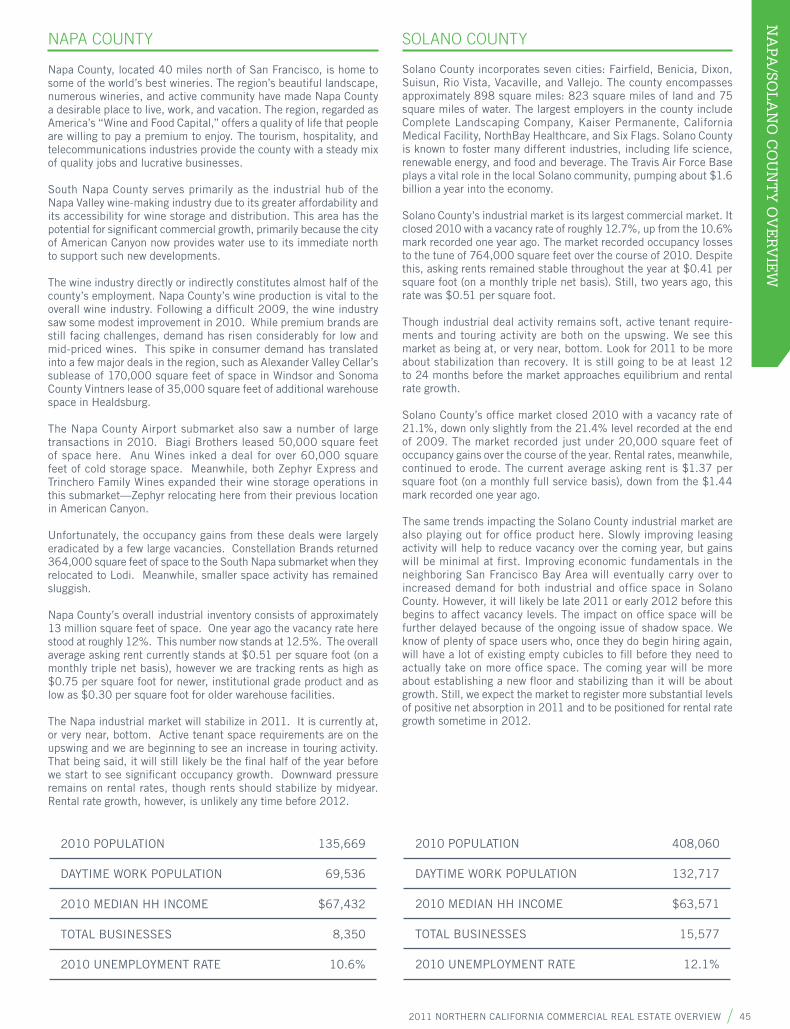
2011 NORTHERN CALIFORNIA COMMERCIAL REAL ESTATE OVERVIEW 45
NA
PA/SO
LA
NO
CO
UN
TY
OV
ER
VIE
W
Napa County, located 40 miles north of San Francisco, is home to some of the world’s best wineries. The region’s beautiful landscape, numerous wineries, and active community have made Napa County a desirable place to live, work, and vacation. The region, regarded as America’s “Wine and Food Capital,” offers a quality of life that people are willing to pay a premium to enjoy. The tourism, hospitality, and telecommunications industries provide the county with a steady mix of quality jobs and lucrative businesses.
South Napa County serves primarily as the industrial hub of the Napa Valley wine-making industry due to its greater affordability and its accessibility for wine storage and distribution. This area has the potential for signifi cant commercial growth, primarily because the city of American Canyon now provides water use to its immediate north to support such new developments.
The wine industry directly or indirectly constitutes almost half of the county’s employment. Napa County’s wine production is vital to the overall wine industry. Following a diffi cult 2009, the wine industry saw some modest improvement in 2010. While premium brands are still facing challenges, demand has risen considerably for low and mid-priced wines. This spike in consumer demand has translated into a few major deals in the region, such as Alexander Valley Cellar’s sublease of 170,000 square feet of space in Windsor and Sonoma County Vintners lease of 35,000 square feet of additional warehouse space in Healdsburg.
The Napa County Airport submarket also saw a number of large transactions in 2010. Biagi Brothers leased 50,000 square feet of space here. Anu Wines inked a deal for over 60,000 square feet of cold storage space. Meanwhile, both Zephyr Express and Trinchero Family Wines expanded their wine storage operations in this submarket—Zephyr relocating here from their previous location in American Canyon.
Unfortunately, the occupancy gains from these deals were largely eradicated by a few large vacancies. Constellation Brands returned 364,000 square feet of space to the South Napa submarket when they relocated to Lodi. Meanwhile, smaller space activity has remained sluggish.
Napa County’s overall industrial inventory consists of approximately 13 million square feet of space. One year ago the vacancy rate here stood at roughly 12%. This number now stands at 12.5%. The overall average asking rent currently stands at $0.51 per square foot (on a monthly triple net basis), however we are tracking rents as high as $0.75 per square foot for newer, institutional grade product and as low as $0.30 per square foot for older warehouse facilities.
The Napa industrial market will stabilize in 2011. It is currently at, or very near, bottom. Active tenant space requirements are on the upswing and we are beginning to see an increase in touring activity. That being said, it will still likely be the fi nal half of the year before we start to see signifi cant occupancy growth. Downward pressure remains on rental rates, though rents should stabilize by midyear. Rental rate growth, however, is unlikely any time before 2012.
Solano County incorporates seven cities: Fairfi eld, Benicia, Dixon, Suisun, Rio Vista, Vacaville, and Vallejo. The county encompasses approximately 898 square miles: 823 square miles of land and 75 square miles of water. The largest employers in the county include Complete Landscaping Company, Kaiser Permanente, California Medical Facility, NorthBay Healthcare, and Six Flags. Solano County is known to foster many different industries, including life science, renewable energy, and food and beverage. The Travis Air Force Base plays a vital role in the local Solano community, pumping about $1.6 billion a year into the economy.
Solano County’s industrial market is its largest commercial market. It closed 2010 with a vacancy rate of roughly 12.7%, up from the 10.6% mark recorded one year ago. The market recorded occupancy losses to the tune of 764,000 square feet over the course of 2010. Despite this, asking rents remained stable throughout the year at $0.41 per square foot (on a monthly triple net basis). Still, two years ago, this rate was $0.51 per square foot.
Though industrial deal activity remains soft, active tenant require-ments and touring activity are both on the upswing. We see this market as being at, or very near, bottom. Look for 2011 to be more about stabilization than recovery. It is still going to be at least 12 to 24 months before the market approaches equilibrium and rental rate growth.
Solano County’s offi ce market closed 2010 with a vacancy rate of 21.1%, down only slightly from the 21.4% level recorded at the end of 2009. The market recorded just under 20,000 square feet of occupancy gains over the course of the year. Rental rates, meanwhile, continued to erode. The current average asking rent is $1.37 per square foot (on a monthly full service basis), down from the $1.44 mark recorded one year ago.
The same trends impacting the Solano County industrial market are also playing out for offi ce product here. Slowly improving leasing activity will help to reduce vacancy over the coming year, but gains will be minimal at fi rst. Improving economic fundamentals in the neighboring San Francisco Bay Area will eventually carry over to increased demand for both industrial and offi ce space in Solano County. However, it will likely be late 2011 or early 2012 before this begins to affect vacancy levels. The impact on offi ce space will be further delayed because of the ongoing issue of shadow space. We know of plenty of space users who, once they do begin hiring again, will have a lot of existing empty cubicles to fi ll before they need to actually take on more offi ce space. The coming year will be more about establishing a new fl oor and stabilizing than it will be about growth. Still, we expect the market to register more substantial levels of positive net absorption in 2011 and to be positioned for rental rate growth sometime in 2012.
NAPA COUNTY SOLANO COUNTY
2010 POPULATION 135,669
DAYTIME WORK POPULATION 69,536
2010 MEDIAN HH INCOME $67,432
TOTAL BUSINESSES 8,350
2010 UNEMPLOYMENT RATE 10.6%
2010 POPULATION 408,060
DAYTIME WORK POPULATION 132,717
2010 MEDIAN HH INCOME $63,571
TOTAL BUSINESSES 15,577
2010 UNEMPLOYMENT RATE 12.1%
46 CASSIDY TURLEY
SAN
TA
CR
UZ
CO
UN
TY
OV
ER
VIE
WSANTA CRUZ COUNTY OVERVIEWSAN MATEO COUNTY OVERVIEWSAN FRANCISCO COUNTY OVERVIEW
Santa Cruz County is the second-smallest county in California by area. It is connected to Silicon Valley via Highway 17. The local economy is still largely dependent on tourism and agriculture but is becoming more diversifi ed, with businesses in the high-tech, software, and educational industries. The recession has had a severe impact on Santa Cruz County, as closures and downsizing by companies have resulted in signifi cant job loss (and vacancies). Unemployment remains problematic—it stood at 13.8% as 2010 came to a close.
Vacancy for offi ce space within the Santa Cruz County market currently stands at 12.3%. After peaking at 13.1% in the fi rst quarter of 2010, vacancy has slowly been inching downward. However, not all markets have been equally impacted by this trend. While vacancy has been on a downward trajectory in the Mid-County and Watsonville submarkets (the region’s two smallest trade areas), it actually has been on the upswing in the Santa Cruz and Scotts Valley submarkets. These two trade areas account for roughly 60% of the region’s offi ce inventory but now account for more than 80% of the vacancy. The good news is
that it appears that the worst of corporate closures and consolidations is behind us. The bad news is that demand for offi ce space remains relatively weak and is rebounding at a snail’s pace.
Deal activity continues to be focused on relocations and fl ight-to-quality moves in which tenants are taking advantage of opportunities to upgrade their space at lower rents. “Blend and extend” deals—where tenants are signing short-term renewals at reduced rents—also continue to take place, though this trend has already largely played out. The improving economy will see the fi nancial, business, and personal services sectors hiring more as we head into 2011, and the good news is that the worst of corporate consolidations is behind us. But many of these space users are already dealing with the issue of shadow space and have plenty of empty cubicles in their existing offi ce suites that they will need to fi ll before they are in the market to lease additional space.
Though the number of active space requirements in the marketplace is up from levels we recorded just one year ago, few of them represent true growth requirements. Relocations and fl ight-to-quality deals will likely continue to dominate leasing activity at least through the fi rst half of 2011. We are aware of a couple of larger requirements in the 15,000 square foot range, but for the most part, nearly all of the active space needs currently being shopped in the marketplace are for suites of 4,000 square feet or less. This, of course, is typical for the Santa Cruz market, which has always been dominated by smaller space users.
The Santa Cruz County offi ce market recorded just over 7,000 square feet of occupancy growth during the fi nal quarter of the year. Following a weak fi rst quarter in which the market recorded occupancy losses
2010 POPULATION 259,428
DAYTIME WORK POPULATION 116,256
2010 MEDIAN HH INCOME $69,840
TOTAL BUSINESSES 15,386
2010 UNEMPLOYMENT RATE 12.6%
Property Type Building Base Direct Availables Sublease Availables Total Availables 2010 Vacancy 2009 Vacancy Rent Range Avg Rates
Offi ce/R&D 7,421,445 792,405 116,860 909,265 12.3% 12.8% $1.15-3.30 $1.79
Ind 10,922,150 456,909 101,392 558,301 5.1% 5.3% $0.25-1.35 $0.73
Total 18,343,595 1,249,314 218,252 1,467,566 8.0% 8.3%
Santa Cruz County
All rates NNN except for offi ce (full service)
Santa Cruz County
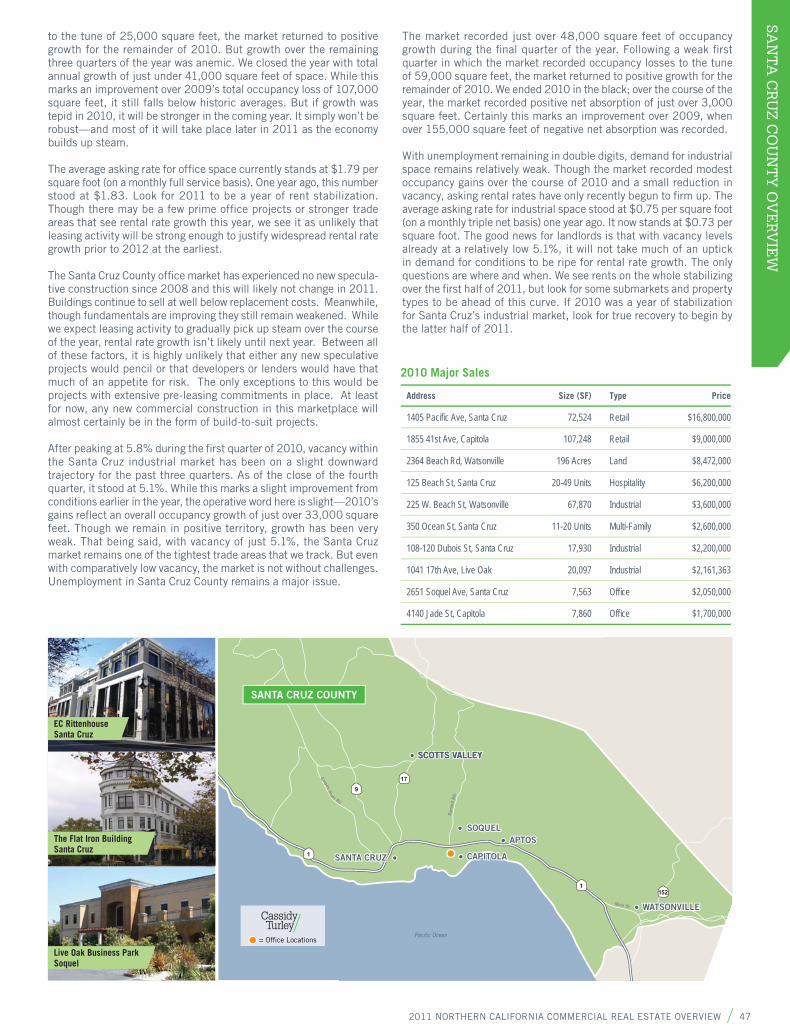
2011 NORTHERN CALIFORNIA COMMERCIAL REAL ESTATE OVERVIEW 47
SAN
TA
CR
UZ
CO
UN
TY
OV
ER
VIE
Wto the tune of 25,000 square feet, the market returned to positive growth for the remainder of 2010. But growth over the remaining three quarters of the year was anemic. We closed the year with total annual growth of just under 41,000 square feet of space. While this marks an improvement over 2009’s total occupancy loss of 107,000 square feet, it still falls below historic averages. But if growth was tepid in 2010, it will be stronger in the coming year. It simply won’t be robust—and most of it will take place later in 2011 as the economy builds up steam.
The average asking rate for offi ce space currently stands at $1.79 per square foot (on a monthly full service basis). One year ago, this number stood at $1.83. Look for 2011 to be a year of rent stabilization. Though there may be a few prime offi ce projects or stronger trade areas that see rental rate growth this year, we see it as unlikely that leasing activity will be strong enough to justify widespread rental rate growth prior to 2012 at the earliest.
The Santa Cruz County offi ce market has experienced no new specula-tive construction since 2008 and this will likely not change in 2011. Buildings continue to sell at well below replacement costs. Meanwhile, though fundamentals are improving they still remain weakened. While we expect leasing activity to gradually pick up steam over the course of the year, rental rate growth isn’t likely until next year. Between all of these factors, it is highly unlikely that either any new speculative projects would pencil or that developers or lenders would have that much of an appetite for risk. The only exceptions to this would be projects with extensive pre-leasing commitments in place. At least for now, any new commercial construction in this marketplace will almost certainly be in the form of build-to-suit projects.
After peaking at 5.8% during the fi rst quarter of 2010, vacancy within the Santa Cruz industrial market has been on a slight downward trajectory for the past three quarters. As of the close of the fourth quarter, it stood at 5.1%. While this marks a slight improvement from conditions earlier in the year, the operative word here is slight—2010’s gains refl ect an overall occupancy growth of just over 33,000 square feet. Though we remain in positive territory, growth has been very weak. That being said, with vacancy of just 5.1%, the Santa Cruz market remains one of the tightest trade areas that we track. But even with comparatively low vacancy, the market is not without challenges. Unemployment in Santa Cruz County remains a major issue.
The market recorded just over 48,000 square feet of occupancy growth during the fi nal quarter of the year. Following a weak fi rst quarter in which the market recorded occupancy losses to the tune of 59,000 square feet, the market returned to positive growth for the remainder of 2010. We ended 2010 in the black; over the course of the year, the market recorded positive net absorption of just over 3,000 square feet. Certainly this marks an improvement over 2009, when over 155,000 square feet of negative net absorption was recorded.
With unemployment remaining in double digits, demand for industrial space remains relatively weak. Though the market recorded modest occupancy gains over the course of 2010 and a small reduction in vacancy, asking rental rates have only recently begun to fi rm up. The average asking rate for industrial space stood at $0.75 per square foot (on a monthly triple net basis) one year ago. It now stands at $0.73 per square foot. The good news for landlords is that with vacancy levels already at a relatively low 5.1%, it will not take much of an uptick in demand for conditions to be ripe for rental rate growth. The only questions are where and when. We see rents on the whole stabilizing over the fi rst half of 2011, but look for some submarkets and property types to be ahead of this curve. If 2010 was a year of stabilization for Santa Cruz’s industrial market, look for true recovery to begin by the latter half of 2011.
Main St
Sum
mit
Rd.
Empire G
rade Rd
Pacific Ocean
1
1152
SCOTTS VALLEYSCOTTS VALLEY
SOQUEL
CAPITOLA
APTOS
WATSONVILLE
SANTA CRUZ
179
SANTA CRUZ COUNTY
= Office Locations
Live Oak Business ParkSoquel
EC Rittenhouse Santa Cruz
2010 Major Sales
Address Size (SF) Type Price
1405 Pacifi c Ave, Santa Cruz 72,524 Retail $16,800,000
1855 41st Ave, Capitola 107,248 Retail $9,000,000
2364 Beach Rd, Watsonville 196 Acres Land $8,472,000
125 Beach St, Santa Cruz 20-49 Units Hospitality $6,200,000
225 W. Beach St, Watsonville 67,870 Industrial $3,600,000
350 Ocean St, Santa Cruz 11-20 Units Multi-Family $2,600,000
108-120 Dubois St, Santa Cruz 17,930 Industrial $2,200,000
1041 17th Ave, Live Oak 20,097 Industrial $2,161,363
2651 Soquel Ave, Santa Cruz 7,563 Offi ce $2,050,000
4140 Jade St, Capitola 7,860 Offi ce $1,700,000
The Flat Iron BuildingSanta Cruz
48 CASSIDY TURLEY
MO
NT
ER
EY
CO
UN
TY
OV
ER
VIE
W MONTEREY COUNTY OVERVIEW
Vacancy for offi ce space within the Monterey County market currently stands at 9.7%, up slightly from the 9.6% mark that was recorded at the close of the third quarter. Though it was not in a straight trajectory, vacancy trended upward throughout 2010. Vacancy stood at 9.1% at this time last year. Not all submarkets have been equally impacted by this trend. Vacancy has actually been inching downward in the Monterey and Sand City/Seaside/Marina submarkets. Meanwhile, vacancy increases have been minimal within the South County and Salinas/Castroville submarkets. The big loser in 2010 was the Carmel/Pacifi c Grove trade area, which saw vacancy climb from 8.9% to 17.1% over the 12 months.
There is some cause for optimism in 2011, in that improving Bay Area economic fundamentals will eventually result in positive momentum. But these trends will most signifi cantly impact the San Francisco, San Mateo, and Silicon Valley offi ce markets. Secondary Bay Area markets like Monterey will be the last to feel improvement. And, as much of this improvement initially will be driven by the booming tech sector—which traditionally has had little presence in Monterey County—don’t expect
a huge jump in demand for offi ce space anytime soon. But demand for offi ce space in the Monterey County market will increase in 2011. The gradually improving economy will see the fi nancial, business, and personal services sectors pick up hiring, though this trend may not play out until the second half of the year. The good news is that it appears that the worst of corporate closures and consolidations is behind us. The bad news is that demand for offi ce space remains relatively weak and is rebounding at a snail’s pace. Look for 2011 to largely be a year of stabilization for the marketplace, though we do expect occupancy growth by year-end to be in positive territory.
The Monterey County offi ce market recorded just under 19,000 square feet of occupancy losses during the fi nal quarter of the year. We closed the year with total annual occupancy losses of roughly 62,000 square feet. Deal activity continues to be focused on reloca-tions and fl ight-to-quality moves, where tenants are taking advantage of opportunities to upgrade their space at lower rents. “Blend and extend” deals—where tenants are signing short-term renewals at reduced rents—also continue to take place, though this trend has already largely played out.
There is good news in that the number of active space requirements in the marketplace is up from levels we recorded just one year ago. But few of these represent true growth requirements. Relocations and renewals will likely continue to dominate leasing activity, at least over the fi rst half of 2011. One of the problems that the market faces is that of shadow space. Even when job growth returns, many space users will have plenty of empty cubicles in their existing offi ce suites that they will need to fi ll before they are in the market again to lease additional space. Still, we do see growth requirements on the upswing heading deeper into 2011.
2010 POPULATION 414,900
DAYTIME WORK POPULATION 179,487
2010 MEDIAN HH INCOME $56,401
TOTAL BUSINESSES 17,604
2010 UNEMPLOYMENT RATE 16.4%
Property Type Building Base Direct Availables Sublease Availables Total Availables 2010 Vacancy 2009 Vacancy Rent Range Avg Rates
Offi ce 8,463,452 691,934 132,932 824,866 9.7% 9.1% $0.56-3.86 $1.93
Ind 20,752,372 1,228,229 9,900 1,238,129 6.0% 8.1% $0.25-1.35 $0.45
Total 29,215,824 1,920,163 142,832 2,062,995 7.1% 8.2%All rates NNN except for offi ce (full service)
Monterey County

2011 NORTHERN CALIFORNIA COMMERCIAL REAL ESTATE OVERVIEW 49
MO
NT
ER
EY
CO
UN
TY
OV
ER
VIE
W
The average asking rate for offi ce space currently stands at $1.93 per square foot (on a monthly full service basis), though we are tracking asking rents as low as $0.56 and as high as $3.86 per square foot. One year ago, this number stood at $1.96. The trend over the second half of 2010 was one of slightly declining vacancies. We cannot rule out the possibility that there will be further declines over the fi rst half of 2011, but rents are at or near bottom and should stabilize by the midyear mark. Overall rental rate growth (though there certainly may be a few exceptions in terms of the best-quality assets or strongest trade areas) will not take place before next year at the earliest.
Look for 2011 to be a year of stabilization and slow growth for the Monterey County offi ce market. Absorption should return to positive territory in 2011, but we don’t expect anything close to robust growth. While all indications are that hiring will pick up substantially in the coming year, this will likely translate into more retail/leisure jobs in Monterey County. This will not directly impact demand for offi ce space, but a rising tide lifts all boats. The problem is that it will take awhile for this to begin to translate into offi ce demand, which will continue to be hampered by shadow space. Even when hiring begins again, companies will be fi lling existing empty cubicles for quite some time before they will be in need of additional offi ce space.
Vacancy within the Monterey County industrial market was on a downward trajectory throughout 2010. As of the close of the fourth quarter, it stood at 6.0%. This marked the sixth consecutive quarter of vacancy declines. One year ago, this rate stood at 8.1%. Vacancy peaked during the second quarter of 2009 at 8.3%.
The Salinas/Castroville submarket accounted for most of the posi-tive traction of 2010, with over 387,000 square feet of occupancy growth during the year. Food-related users, energy providers, and transportation/logistics fi rms remain the most active segments of the marketplace, so it is only natural that industrial product here—with close proximity to agriculture—has been the strongest sector of the marketplace.
Normally, market equilibrium for industrial properties would be defi ned by vacancy levels in the 10% range. In typical marketplaces, a vacancy level of 10% would allow space users to expand, while still keeping vacancy levels low enough for sustainable rental rate growth. Of course, Monterey County’s industrial market is not a typical marketplace. With just 20.7 million square feet of product, it is one of Northern California’s smallest industrial markets. That being said, despite relatively low vacancy and a strong year in terms of occupancy growth, rents remain fl at.
The Monterey County industrial market recorded just over 156,000 square feet of occupancy growth during the fi nal quarter of the year. The market turned in a strong performance in 2010, with three out of four quarters logging more than 100,000 square feet of positive growth. While these numbers would not be as substantial in one of Northern California’s larger trade areas, an annual occupancy growth total of over 438,000 square feet is nothing to sneeze at.
The current average asking rent for industrial space in Monterey County is $0.45 per square foot (on a monthly triple net basis). This number has held fi rm since the fi rst quarter of 2010, but one year ago it stood at $0.47 per square foot. The Monterey submarket leads all trade areas in terms of the highest average asking rent, at $0.84 per square foot. The Salinas/Castroville submarket, with an average asking rent of $0.46 per square foot, is the region’s most affordable trade area.
Of course, we should point out that these markets are dominated by completely different industrial product types. The smaller Monterey and Sand City/Seaside/Marina submarkets are more urbanized and have a greater proportion of smaller, industrial service-related build-
ings. Salinas/Castroville accounts for roughly 75% of the County’s inventory and has a much higher percentage of larger industrial buildings geared for distribution or food processing uses, and larger spaces typically lease at cheaper rates. Though we did not see rental rate growth in 2010, look for incremental increases heading into 2011 as leasing activity picks up.
Monterey Bay
1
Reservation Rd
Old S
tage Rd
Monterey Rd 10168
1
1
183
156
SALINAS
CASTROVILLE
MARINA
SAND CITYSEASIDE
MONTEREY
CARMEL
PACIFICGROVE
MONTEREY COUNTY
= Office Locations
2010 Major Sales
Address Size (SF) Type Price
950 Sanborn Rd, Salinas 312,200 Industrial $14,120,000
11200-11220 Comm. Pkwy, Castroville 32,792 Industrial $4,750,000
40 Ryan Ct, Monterey 18,740 Offi ce $4,000,000
501 S El Camino Real, Salinas 25,890 Industrial $4,000,000
300 Cannery Row, Monterey 14,100 Industrial $3,800,000
2835 David Ave, Pacifi c Grove 44 Units Multi-Family $3,495,000
905 Playa Ave, Sand City 27,575 Retail $3,050,000
222 Auto Center Cir, Salinas 7 Acres Retail $2,800,000
101 Wilson Rd, Monterey 13,788 Offi ce $2,350,000
2020 Del Monte Ave, Monterey 17,037 Retail $2,125,000
1513 Fremont Blvd, Seaside 5,111 Offi ce $1,900,000
41 E. Alisal St, Salinas 10,601 Retail $1,350,000
845 Lighthouse Ave, Pacifi c Grove 7 Units Multi-Family $1,200,000
1325 N. Main St, Salinas 1.5 Acres Land $1,050,000
509 Hartnell St, Monterey 4,131 Offi ce $1,025,000
Moffett Street Commercial Center Monterey
1 Lower Ragsdale DrMonterey

50 CASSIDY TURLEY
AD
DE
ND
UM
- C
ITY
BY
CIT
Y D
AT
AADDENDUM - CITY BY CITY DATAIndustrial - City Submarket Data
Total Industrial (Warehouse & Manufacturing) Vacancy Average Asking Rate NNN
City | Submarket Building Base Sublease Direct Net Abs (2010) Const WHSE MFG All Types WHSE MFG All Types
East BayRichmond 11,704,561 170,059 1,410,971 -189,750 0 16.1% 11.4% 13.5% $0.35 $0.39 $0.37 Berkeley 6,669,018 0 300,675 -20,750 0 4.4% 4.6% 4.5% $0.58 $0.58 $0.58 Emeryville 2,665,395 0 237,888 -34,678 0 13.7% 3.8% 8.9% $0.53 $0.65 $0.55 Oakland 38,045,006 349,471 1,938,828 -224,616 0 5.4% 6.3% 6.0% $0.40 $0.32 $0.34 San Leandro 27,761,714 83,907 1,716,735 74,015 0 5.4% 7.6% 6.5% $0.36 $0.36 $0.36 Hayward 37,450,357 737,785 3,610,903 -738,753 0 15.2% 7.7% 11.6% $0.36 $0.41 $0.38 Union City 12,993,158 61,470 1,351,172 386,143 0 12.6% 8.0% 10.9% $0.34 $0.38 $0.35 Newark 8,366,005 54,000 816,889 256,217 0 6.7% 13.7% 10.4% $0.32 $0.65 $0.55 Fremont 17,687,849 11,200 1,337,435 -409,107 0 9.5% 6.1% 7.6% $0.40 $0.53 $0.46 Monterey CountyMonterey 582,569 0 9,400 12,820 0 N/A N/A 1.6% N/A N/A $0.84 Sand City/Seaside/Marina 1,181,304 0 71,105 13,538 0 N/A N/A 6.0% N/A N/A $0.80 Salinas/Castroville 15,348,079 9,900 767,724 387,855 0 N/A N/A 5.1% N/A N/A $0.46 South County 3,640,420 0 380,000 3,600 0 N/A N/A 10.4% N/A N/A $0.35 North I-680 CorridorMartinez 1,217,605 8,490 149,345 -16,960 0 N/A N/A 13.0% N/A N/A $0.82 Pacheco 501,724 0 19,875 10,602 0 N/A N/A 4.0% N/A N/A $0.62 Concord 7,587,591 46,747 998,259 -254,581 0 N/A N/A 13.8% N/A N/A $0.86 Walnut Creek 874,249 0 0 10,500 0 N/A N/A 0.0% N/A N/A $1.00 Pittsburg 2,932,393 0 362,844 30,356 0 N/A N/A 12.4% N/A N/A $0.41 Antioch 3,625,903 0 891,370 109,345 0 N/A N/A 24.6% N/A N/A $0.27 Sacramento ValleyDowntown Sacramento 2,638,475 0 142,046 -33,920 0 N/A N/A 5.4% N/A N/A $0.48 East Sacramento 526,882 3,400 0 25,750 0 N/A N/A 0.6% N/A N/A $0.49 Elk Grove/Laguna 4,939,510 77,280 803,850 15,671 0 N/A N/A 17.8% N/A N/A $0.39 McClellan 15,016,782 716,255 1,546,873 44,736 0 N/A N/A 15.1% N/A N/A $0.33 Natomas/Northgate 11,751,787 162,850 1,597,205 185,034 0 N/A N/A 15.0% N/A N/A $0.34 Northeast Sacramento 5,118,655 103,332 423,776 57,232 0 N/A N/A 10.3% N/A N/A $0.33 Power Inn 24,843,760 0 2,791,232 291,507 0 N/A N/A 11.2% N/A N/A $0.33 Richards 4,485,988 0 542,611 45,700 0 N/A N/A 12.1% N/A N/A $0.32 South Sacramento 3,709,794 0 183,161 15,750 0 N/A N/A 4.9% N/A N/A $0.46 Auburn/New Castle 2,014,656 0 97,054 37,500 0 N/A N/A 4.8% N/A N/A $0.53 Folsom/El Dorado Hills 2,101,334 0 151,415 7,100 0 N/A N/A 7.2% N/A N/A $0.68 Roseville/Rocklin 15,462,345 32,465 2,355,801 86,249 21,000 N/A N/A 15.4% N/A N/A $0.46 Mather 3,881,875 11,120 870,448 20,745 0 N/A N/A 22.7% N/A N/A $0.37 Sunrise 9,222,194 64,010 1,175,108 129,868 0 N/A N/A 13.4% N/A N/A $0.42 Davis/Woodland 16,233,747 0 2,699,253 195,751 0 N/A N/A 16.6% N/A N/A $0.25 West Sacramento 16,249,899 93,580 1,009,299 176,723 0 N/A N/A 6.8% N/A N/A $0.37 San Francisco CountyMission/SoMa 5,074,574 0 157,996 -119,412 0 N/A N/A 3.1% N/A N/A $1.15 3rd Street Corridor/Potrero Hill 9,974,015 17,169 509,833 -277,370 0 N/A N/A 5.3% N/A N/A $0.82 Bayview 4,505,691 9,200 341,608 304,640 0 N/A N/A 7.8% N/A N/A $0.60 Santa Cruz CountyScotts Valley 960,149 0 41,800 46,132 18,450 N/A N/A 4.4% N/A N/A $0.79 Santa Cruz 2,922,258 0 213,843 42,637 0 N/A N/A 7.3% N/A N/A $0.82 Watsonville 5,632,634 101,392 145,677 -73,219 0 N/A N/A 4.4% N/A N/A $0.55 Mid-County 1,407,109 0 55,589 17,476 0 N/A N/A 4.0% N/A N/A $1.06 Santa Clara CountyPalo Alto 1,016,503 5,500 24,701 20,199 0 N/A 3.0% 3.0% N/A $0.99 $0.99 Mountain View 3,028,301 10,200 83,420 39,106 0 N/A 3.1% 3.1% N/A $0.83 $0.83 Campbell 1,523,265 0 35,742 12,278 0 N/A 2.3% 2.3% N/A $0.93 $0.93 Sunnyvale 6,755,419 11,923 453,120 -39,627 0 6.6% 7.0% 6.9% $0.51 $0.66 $0.62
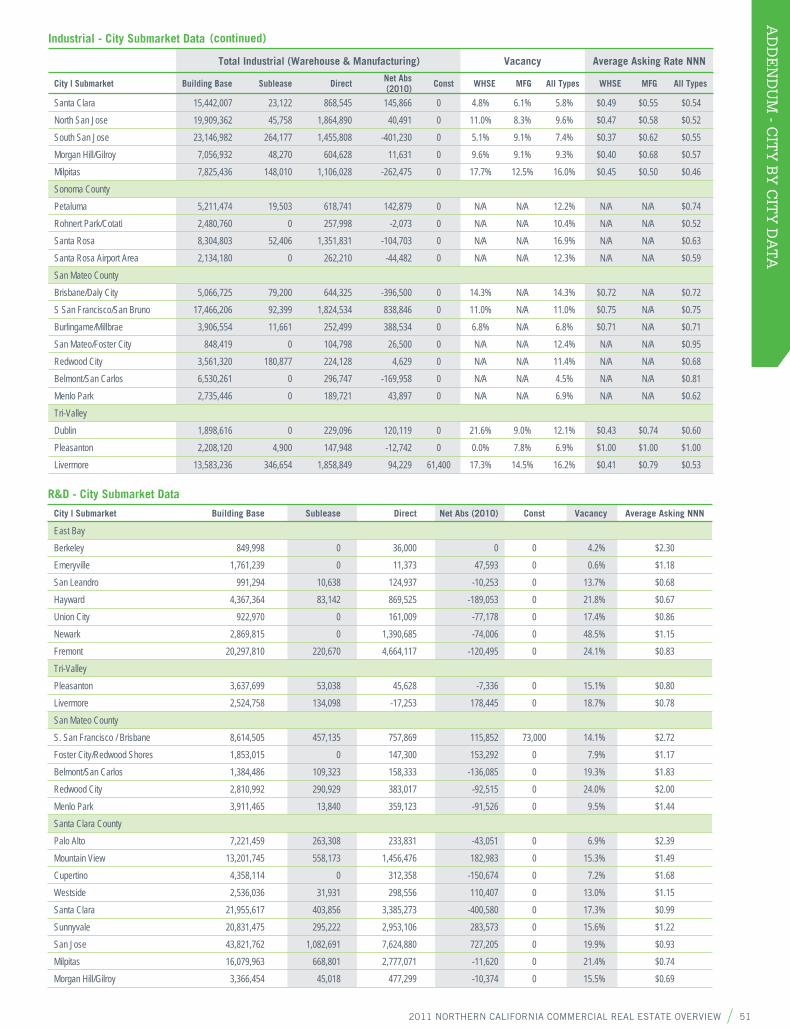
2011 NORTHERN CALIFORNIA COMMERCIAL REAL ESTATE OVERVIEW 51
AD
DE
ND
UM
- CIT
Y B
Y C
ITY
DA
TA
Industrial - City Submarket Data
Total Industrial (Warehouse & Manufacturing) Vacancy Average Asking Rate NNN
City | Submarket Building Base Sublease Direct Net Abs (2010) Const WHSE MFG All Types WHSE MFG All Types
Santa Clara 15,442,007 23,122 868,545 145,866 0 4.8% 6.1% 5.8% $0.49 $0.55 $0.54 North San Jose 19,909,362 45,758 1,864,890 40,491 0 11.0% 8.3% 9.6% $0.47 $0.58 $0.52 South San Jose 23,146,982 264,177 1,455,808 -401,230 0 5.1% 9.1% 7.4% $0.37 $0.62 $0.55 Morgan Hill/Gilroy 7,056,932 48,270 604,628 11,631 0 9.6% 9.1% 9.3% $0.40 $0.68 $0.57 Milpitas 7,825,436 148,010 1,106,028 -262,475 0 17.7% 12.5% 16.0% $0.45 $0.50 $0.46 Sonoma CountyPetaluma 5,211,474 19,503 618,741 142,879 0 N/A N/A 12.2% N/A N/A $0.74 Rohnert Park/Cotati 2,480,760 0 257,998 -2,073 0 N/A N/A 10.4% N/A N/A $0.52 Santa Rosa 8,304,803 52,406 1,351,831 -104,703 0 N/A N/A 16.9% N/A N/A $0.63 Santa Rosa Airport Area 2,134,180 0 262,210 -44,482 0 N/A N/A 12.3% N/A N/A $0.59 San Mateo CountyBrisbane/Daly City 5,066,725 79,200 644,325 -396,500 0 14.3% N/A 14.3% $0.72 N/A $0.72 S San Francisco/San Bruno 17,466,206 92,399 1,824,534 838,846 0 11.0% N/A 11.0% $0.75 N/A $0.75 Burlingame/Millbrae 3,906,554 11,661 252,499 388,534 0 6.8% N/A 6.8% $0.71 N/A $0.71 San Mateo/Foster City 848,419 0 104,798 26,500 0 N/A N/A 12.4% N/A N/A $0.95 Redwood City 3,561,320 180,877 224,128 4,629 0 N/A N/A 11.4% N/A N/A $0.68 Belmont/San Carlos 6,530,261 0 296,747 -169,958 0 N/A N/A 4.5% N/A N/A $0.81 Menlo Park 2,735,446 0 189,721 43,897 0 N/A N/A 6.9% N/A N/A $0.62 Tri-ValleyDublin 1,898,616 0 229,096 120,119 0 21.6% 9.0% 12.1% $0.43 $0.74 $0.60 Pleasanton 2,208,120 4,900 147,948 -12,742 0 0.0% 7.8% 6.9% $1.00 $1.00 $1.00 Livermore 13,583,236 346,654 1,858,849 94,229 61,400 17.3% 14.5% 16.2% $0.41 $0.79 $0.53
R&D - City Submarket Data
City | Submarket Building Base Sublease Direct Net Abs (2010) Const Vacancy Average Asking NNN
East BayBerkeley 849,998 0 36,000 0 0 4.2% $2.30 Emeryville 1,761,239 0 11,373 47,593 0 0.6% $1.18 San Leandro 991,294 10,638 124,937 -10,253 0 13.7% $0.68 Hayward 4,367,364 83,142 869,525 -189,053 0 21.8% $0.67 Union City 922,970 0 161,009 -77,178 0 17.4% $0.86 Newark 2,869,815 0 1,390,685 -74,006 0 48.5% $1.15 Fremont 20,297,810 220,670 4,664,117 -120,495 0 24.1% $0.83 Tri-ValleyPleasanton 3,637,699 53,038 45,628 -7,336 0 15.1% $0.80 Livermore 2,524,758 134,098 -17,253 178,445 0 18.7% $0.78 San Mateo CountyS. San Francisco / Brisbane 8,614,505 457,135 757,869 115,852 73,000 14.1% $2.72 Foster City/Redwood Shores 1,853,015 0 147,300 153,292 0 7.9% $1.17 Belmont/San Carlos 1,384,486 109,323 158,333 -136,085 0 19.3% $1.83 Redwood City 2,810,992 290,929 383,017 -92,515 0 24.0% $2.00 Menlo Park 3,911,465 13,840 359,123 -91,526 0 9.5% $1.44 Santa Clara CountyPalo Alto 7,221,459 263,308 233,831 -43,051 0 6.9% $2.39 Mountain View 13,201,745 558,173 1,456,476 182,983 0 15.3% $1.49 Cupertino 4,358,114 0 312,358 -150,674 0 7.2% $1.68 Westside 2,536,036 31,931 298,556 110,407 0 13.0% $1.15 Santa Clara 21,955,617 403,856 3,385,273 -400,580 0 17.3% $0.99 Sunnyvale 20,831,475 295,222 2,953,106 283,573 0 15.6% $1.22 San Jose 43,821,762 1,082,691 7,624,880 727,205 0 19.9% $0.93 Milpitas 16,079,963 668,801 2,777,071 -11,620 0 21.4% $0.74 Morgan Hill/Gilroy 3,366,454 45,018 477,299 -10,374 0 15.5% $0.69
(continued)
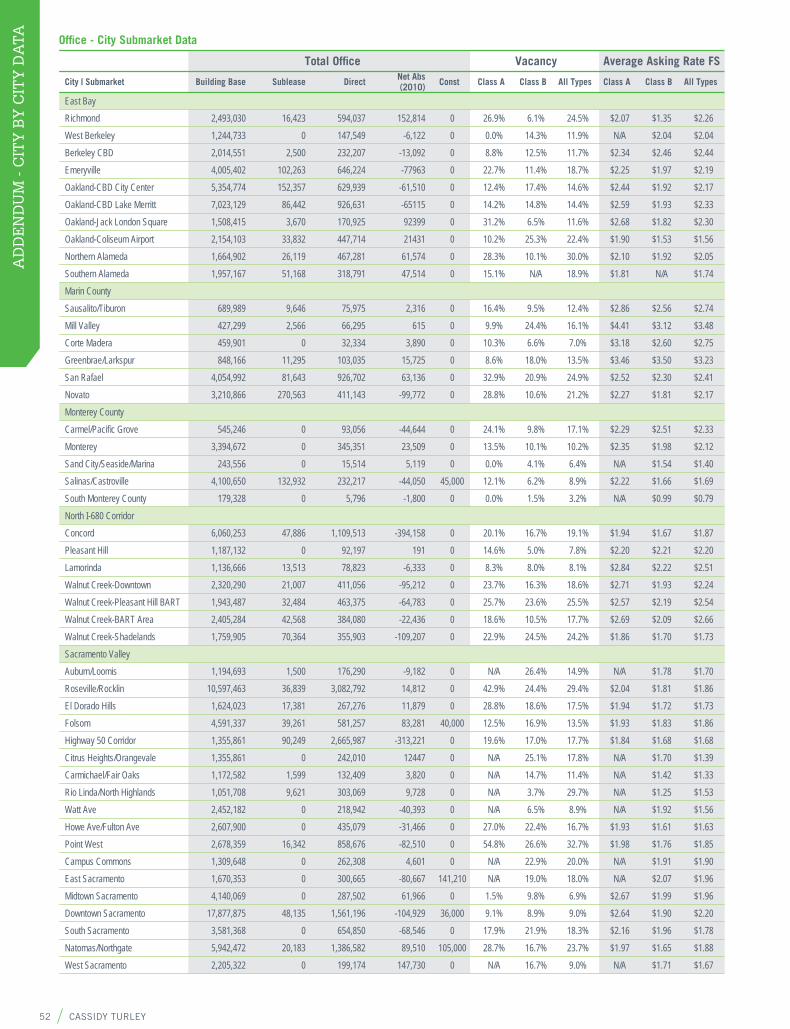
52 CASSIDY TURLEY
AD
DE
ND
UM
- C
ITY
BY
CIT
Y D
AT
A ADDENDUM - CITY BY CITY DATAOffi ce - City Submarket Data
Total Offi ce Vacancy Average Asking Rate FS
City | Submarket Building Base Sublease Direct Net Abs (2010) Const Class A Class B All Types Class A Class B All Types
East BayRichmond 2,493,030 16,423 594,037 152,814 0 26.9% 6.1% 24.5% $2.07 $1.35 $2.26 West Berkeley 1,244,733 0 147,549 -6,122 0 0.0% 14.3% 11.9% N/A $2.04 $2.04 Berkeley CBD 2,014,551 2,500 232,207 -13,092 0 8.8% 12.5% 11.7% $2.34 $2.46 $2.44 Emeryville 4,005,402 102,263 646,224 -77963 0 22.7% 11.4% 18.7% $2.25 $1.97 $2.19 Oakland-CBD City Center 5,354,774 152,357 629,939 -61,510 0 12.4% 17.4% 14.6% $2.44 $1.92 $2.17 Oakland-CBD Lake Merritt 7,023,129 86,442 926,631 -65115 0 14.2% 14.8% 14.4% $2.59 $1.93 $2.33 Oakland-Jack London Square 1,508,415 3,670 170,925 92399 0 31.2% 6.5% 11.6% $2.68 $1.82 $2.30 Oakland-Coliseum Airport 2,154,103 33,832 447,714 21431 0 10.2% 25.3% 22.4% $1.90 $1.53 $1.56 Northern Alameda 1,664,902 26,119 467,281 61,574 0 28.3% 10.1% 30.0% $2.10 $1.92 $2.05 Southern Alameda 1,957,167 51,168 318,791 47,514 0 15.1% N/A 18.9% $1.81 N/A $1.74 Marin CountySausalito/Tiburon 689,989 9,646 75,975 2,316 0 16.4% 9.5% 12.4% $2.86 $2.56 $2.74 Mill Valley 427,299 2,566 66,295 615 0 9.9% 24.4% 16.1% $4.41 $3.12 $3.48 Corte Madera 459,901 0 32,334 3,890 0 10.3% 6.6% 7.0% $3.18 $2.60 $2.75 Greenbrae/Larkspur 848,166 11,295 103,035 15,725 0 8.6% 18.0% 13.5% $3.46 $3.50 $3.23 San Rafael 4,054,992 81,643 926,702 63,136 0 32.9% 20.9% 24.9% $2.52 $2.30 $2.41 Novato 3,210,866 270,563 411,143 -99,772 0 28.8% 10.6% 21.2% $2.27 $1.81 $2.17 Monterey CountyCarmel/Pacifi c Grove 545,246 0 93,056 -44,644 0 24.1% 9.8% 17.1% $2.29 $2.51 $2.33 Monterey 3,394,672 0 345,351 23,509 0 13.5% 10.1% 10.2% $2.35 $1.98 $2.12 Sand City/Seaside/Marina 243,556 0 15,514 5,119 0 0.0% 4.1% 6.4% N/A $1.54 $1.40 Salinas/Castroville 4,100,650 132,932 232,217 -44,050 45,000 12.1% 6.2% 8.9% $2.22 $1.66 $1.69 South Monterey County 179,328 0 5,796 -1,800 0 0.0% 1.5% 3.2% N/A $0.99 $0.79 North I-680 CorridorConcord 6,060,253 47,886 1,109,513 -394,158 0 20.1% 16.7% 19.1% $1.94 $1.67 $1.87 Pleasant Hill 1,187,132 0 92,197 191 0 14.6% 5.0% 7.8% $2.20 $2.21 $2.20 Lamorinda 1,136,666 13,513 78,823 -6,333 0 8.3% 8.0% 8.1% $2.84 $2.22 $2.51 Walnut Creek-Downtown 2,320,290 21,007 411,056 -95,212 0 23.7% 16.3% 18.6% $2.71 $1.93 $2.24 Walnut Creek-Pleasant Hill BART 1,943,487 32,484 463,375 -64,783 0 25.7% 23.6% 25.5% $2.57 $2.19 $2.54 Walnut Creek-BART Area 2,405,284 42,568 384,080 -22,436 0 18.6% 10.5% 17.7% $2.69 $2.09 $2.66 Walnut Creek-Shadelands 1,759,905 70,364 355,903 -109,207 0 22.9% 24.5% 24.2% $1.86 $1.70 $1.73 Sacramento ValleyAuburn/Loomis 1,194,693 1,500 176,290 -9,182 0 N/A 26.4% 14.9% N/A $1.78 $1.70 Roseville/Rocklin 10,597,463 36,839 3,082,792 14,812 0 42.9% 24.4% 29.4% $2.04 $1.81 $1.86 El Dorado Hills 1,624,023 17,381 267,276 11,879 0 28.8% 18.6% 17.5% $1.94 $1.72 $1.73 Folsom 4,591,337 39,261 581,257 83,281 40,000 12.5% 16.9% 13.5% $1.93 $1.83 $1.86 Highway 50 Corridor 1,355,861 90,249 2,665,987 -313,221 0 19.6% 17.0% 17.7% $1.84 $1.68 $1.68 Citrus Heights/Orangevale 1,355,861 0 242,010 12447 0 N/A 25.1% 17.8% N/A $1.70 $1.39 Carmichael/Fair Oaks 1,172,582 1,599 132,409 3,820 0 N/A 14.7% 11.4% N/A $1.42 $1.33 Rio Linda/North Highlands 1,051,708 9,621 303,069 9,728 0 N/A 3.7% 29.7% N/A $1.25 $1.53 Watt Ave 2,452,182 0 218,942 -40,393 0 N/A 6.5% 8.9% N/A $1.92 $1.56 Howe Ave/Fulton Ave 2,607,900 0 435,079 -31,466 0 27.0% 22.4% 16.7% $1.93 $1.61 $1.63 Point West 2,678,359 16,342 858,676 -82,510 0 54.8% 26.6% 32.7% $1.98 $1.76 $1.85 Campus Commons 1,309,648 0 262,308 4,601 0 N/A 22.9% 20.0% N/A $1.91 $1.90 East Sacramento 1,670,353 0 300,665 -80,667 141,210 N/A 19.0% 18.0% N/A $2.07 $1.96 Midtown Sacramento 4,140,069 0 287,502 61,966 0 1.5% 9.8% 6.9% $2.67 $1.99 $1.96 Downtown Sacramento 17,877,875 48,135 1,561,196 -104,929 36,000 9.1% 8.9% 9.0% $2.64 $1.90 $2.20 South Sacramento 3,581,368 0 654,850 -68,546 0 17.9% 21.9% 18.3% $2.16 $1.96 $1.78 Natomas/Northgate 5,942,472 20,183 1,386,582 89,510 105,000 28.7% 16.7% 23.7% $1.97 $1.65 $1.88 West Sacramento 2,205,322 0 199,174 147,730 0 N/A 16.7% 9.0% N/A $1.71 $1.67
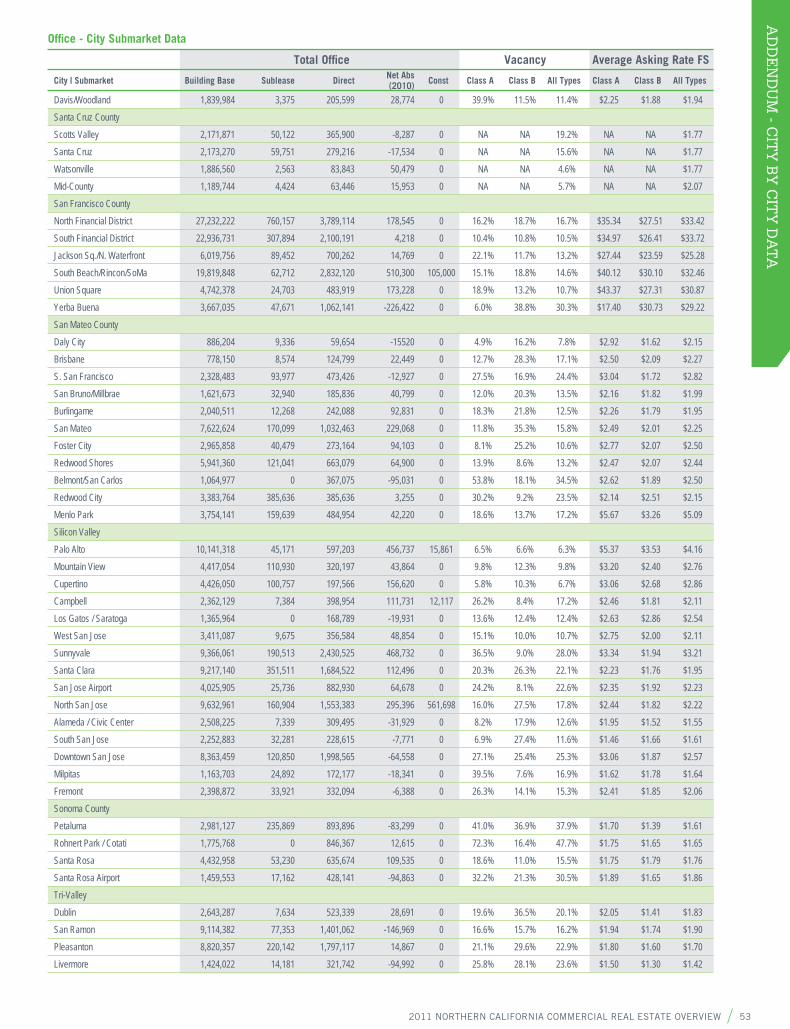
2011 NORTHERN CALIFORNIA COMMERCIAL REAL ESTATE OVERVIEW 53
AD
DE
ND
UM
- CIT
Y B
Y C
ITY
DA
TA
Offi ce - City Submarket Data
Total Offi ce Vacancy Average Asking Rate FS
City | Submarket Building Base Sublease Direct Net Abs (2010) Const Class A Class B All Types Class A Class B All Types
Davis/Woodland 1,839,984 3,375 205,599 28,774 0 39.9% 11.5% 11.4% $2.25 $1.88 $1.94 Santa Cruz CountyScotts Valley 2,171,871 50,122 365,900 -8,287 0 NA NA 19.2% NA NA $1.77 Santa Cruz 2,173,270 59,751 279,216 -17,534 0 NA NA 15.6% NA NA $1.77 Watsonville 1,886,560 2,563 83,843 50,479 0 NA NA 4.6% NA NA $1.77 Mid-County 1,189,744 4,424 63,446 15,953 0 NA NA 5.7% NA NA $2.07 San Francisco CountyNorth Financial District 27,232,222 760,157 3,789,114 178,545 0 16.2% 18.7% 16.7% $35.34 $27.51 $33.42 South Financial District 22,936,731 307,894 2,100,191 4,218 0 10.4% 10.8% 10.5% $34.97 $26.41 $33.72 Jackson Sq./N. Waterfront 6,019,756 89,452 700,262 14,769 0 22.1% 11.7% 13.2% $27.44 $23.59 $25.28 South Beach/Rincon/SoMa 19,819,848 62,712 2,832,120 510,300 105,000 15.1% 18.8% 14.6% $40.12 $30.10 $32.46 Union Square 4,742,378 24,703 483,919 173,228 0 18.9% 13.2% 10.7% $43.37 $27.31 $30.87 Yerba Buena 3,667,035 47,671 1,062,141 -226,422 0 6.0% 38.8% 30.3% $17.40 $30.73 $29.22 San Mateo CountyDaly City 886,204 9,336 59,654 -15520 0 4.9% 16.2% 7.8% $2.92 $1.62 $2.15 Brisbane 778,150 8,574 124,799 22,449 0 12.7% 28.3% 17.1% $2.50 $2.09 $2.27 S. San Francisco 2,328,483 93,977 473,426 -12,927 0 27.5% 16.9% 24.4% $3.04 $1.72 $2.82 San Bruno/Millbrae 1,621,673 32,940 185,836 40,799 0 12.0% 20.3% 13.5% $2.16 $1.82 $1.99 Burlingame 2,040,511 12,268 242,088 92,831 0 18.3% 21.8% 12.5% $2.26 $1.79 $1.95 San Mateo 7,622,624 170,099 1,032,463 229,068 0 11.8% 35.3% 15.8% $2.49 $2.01 $2.25 Foster City 2,965,858 40,479 273,164 94,103 0 8.1% 25.2% 10.6% $2.77 $2.07 $2.50 Redwood Shores 5,941,360 121,041 663,079 64,900 0 13.9% 8.6% 13.2% $2.47 $2.07 $2.44 Belmont/San Carlos 1,064,977 0 367,075 -95,031 0 53.8% 18.1% 34.5% $2.62 $1.89 $2.50 Redwood City 3,383,764 385,636 385,636 3,255 0 30.2% 9.2% 23.5% $2.14 $2.51 $2.15 Menlo Park 3,754,141 159,639 484,954 42,220 0 18.6% 13.7% 17.2% $5.67 $3.26 $5.09 Silicon ValleyPalo Alto 10,141,318 45,171 597,203 456,737 15,861 6.5% 6.6% 6.3% $5.37 $3.53 $4.16 Mountain View 4,417,054 110,930 320,197 43,864 0 9.8% 12.3% 9.8% $3.20 $2.40 $2.76 Cupertino 4,426,050 100,757 197,566 156,620 0 5.8% 10.3% 6.7% $3.06 $2.68 $2.86 Campbell 2,362,129 7,384 398,954 111,731 12,117 26.2% 8.4% 17.2% $2.46 $1.81 $2.11 Los Gatos / Saratoga 1,365,964 0 168,789 -19,931 0 13.6% 12.4% 12.4% $2.63 $2.86 $2.54 West San Jose 3,411,087 9,675 356,584 48,854 0 15.1% 10.0% 10.7% $2.75 $2.00 $2.11 Sunnyvale 9,366,061 190,513 2,430,525 468,732 0 36.5% 9.0% 28.0% $3.34 $1.94 $3.21 Santa Clara 9,217,140 351,511 1,684,522 112,496 0 20.3% 26.3% 22.1% $2.23 $1.76 $1.95 San Jose Airport 4,025,905 25,736 882,930 64,678 0 24.2% 8.1% 22.6% $2.35 $1.92 $2.23 North San Jose 9,632,961 160,904 1,553,383 295,396 561,698 16.0% 27.5% 17.8% $2.44 $1.82 $2.22 Alameda / Civic Center 2,508,225 7,339 309,495 -31,929 0 8.2% 17.9% 12.6% $1.95 $1.52 $1.55 South San Jose 2,252,883 32,281 228,615 -7,771 0 6.9% 27.4% 11.6% $1.46 $1.66 $1.61 Downtown San Jose 8,363,459 120,850 1,998,565 -64,558 0 27.1% 25.4% 25.3% $3.06 $1.87 $2.57 Milpitas 1,163,703 24,892 172,177 -18,341 0 39.5% 7.6% 16.9% $1.62 $1.78 $1.64 Fremont 2,398,872 33,921 332,094 -6,388 0 26.3% 14.1% 15.3% $2.41 $1.85 $2.06 Sonoma CountyPetaluma 2,981,127 235,869 893,896 -83,299 0 41.0% 36.9% 37.9% $1.70 $1.39 $1.61 Rohnert Park / Cotati 1,775,768 0 846,367 12,615 0 72.3% 16.4% 47.7% $1.75 $1.65 $1.65 Santa Rosa 4,432,958 53,230 635,674 109,535 0 18.6% 11.0% 15.5% $1.75 $1.79 $1.76 Santa Rosa Airport 1,459,553 17,162 428,141 -94,863 0 32.2% 21.3% 30.5% $1.89 $1.65 $1.86 Tri-ValleyDublin 2,643,287 7,634 523,339 28,691 0 19.6% 36.5% 20.1% $2.05 $1.41 $1.83 San Ramon 9,114,382 77,353 1,401,062 -146,969 0 16.6% 15.7% 16.2% $1.94 $1.74 $1.90 Pleasanton 8,820,357 220,142 1,797,117 14,867 0 21.1% 29.6% 22.9% $1.80 $1.60 $1.70 Livermore 1,424,022 14,181 321,742 -94,992 0 25.8% 28.1% 23.6% $1.50 $1.30 $1.42
54 CASSIDY TURLEY
CR
ED
ITS
& T
ER
MS CREDITS & TERMS
Offi ceIncludes Class A, Class B, Class C, and suburban garden offi ce buildings over 10,000 square feet. Class A product is steel and concrete construction, built after 1980, quality tenants, excellent amenities, and premium rents. Class B product is built after 1960, fair to good fi nishes, and wide range of tenants.
R&DModern fl ex buildings with some space dedicated to research and/or product development. Buildings usually have parking greater than 3.5/1000, clear height less than 18', 1-2 stories, and three sides of glass.
Industrial (IND)Buildings used for warehouse, light manufacturing and R&D purposes that meet those building’s specifi cations.
Manufacturing (MFG)Manufacturing buildings generally have a parking ratio less than 3/1000, clear height less than 18', dock or grade-level doors, 6-15% offi ce buildout, and one side of glass.
Warehouse (WHSE)Warehouse buildings generally have a parking ratio less than 2/1000, clear height greater than 18', multiple dock and/or grade-level doors, limited offi ce buildout, and a limited amount of glass.
Retail Shopping CenterA planned group of connected retail stores, usually with an attached parking area, specially developed on a parcel of private property and managed by a single organization.
Building Base Total market inventory of buildings generally over 10,000 square feet.
Gross Leaseable Area (GLA)Total fl oor space available for retail sales, usually in square feet.
Total Availables All space being marketed for lease, direct or sublease, available within 90 days. This may include availabilities with pending leases.
Vacancy Available square footage divided by total square footage of inventory.
Net Absorption Change in occupied square footage from period to period.
Gross Absorption Total lease or user purchase activity in a period.
Rent Range Range in asking rates at the end of 2010. Unless otherwise noted, offi ce rents are quoted as monthly full service rates; R&D, mfg, and whse are quoted as NNN monthly rates.
Avg. Rent RateThe weighted average (by square footage) of quoted rents at the end of 2010.
N/A Indicates information was not applicable or not available at press time.
Demographics Data provided by MapInfo Anysite.
Largest EmployersData provided by InfoUSA.
Managing EditorMark BollozosVP Research & Marketing
CREDITS
TERMS
Market Research Staff Joshua Deale, Daniel Thompson, Laef Barnes, Mindy Bazlen, Todd Campbell, Stephanie Curtis, Jessica Hickman, Tricia Kirsch, James Masuda, Erica Ryan, Jan Yaegar
EditorGarrick BrownNorthern California Research Director
Market AnalyticsKonrad KnutsenDirector of Research
Julie LeikerMarket Research Director Silicon Valley
Design & ProductionKrissy DailyArt Director
Art & Graphics StaffAdriana Fracchia, James Molgaard, Amrita Biswas, Arelis Cruz, Liz Dreessen, Kimberly Joe

2011 NORTHERN CALIFORNIA COMMERCIAL REAL ESTATE OVERVIEW 55
CR
ED
ITS &
TE
RM
S
www.ctbt.com
New Silicon Valley Offi ce Coming September 2011
300 Santana RowSuite 500San Jose, CA 95128
Burlingame1350 Bayshore HighwaySuite 900Burlingame, CA 94010Tel 650-347-3700Fax 650-347-4307
Capitola2121 41st AvenueSuite 204Capitola, CA 95010Tel 831-476-8000Fax 831-479-4387
Monterey1 Lower Ragsdale DriveBldg 1, Suite 100Monterey, CA 93940Tel 831-375-8000Fax 831-647-2116
Oakland555 12th StreetSuite 1400Oakland, CA 94607Tel 510-465-8000Fax 510-465-1350
Palo Alto1950 University AvenueSuite 220East Palo Alto, CA 94303Tel 650-852-1200Fax 650-856-1098
Pleasanton5000 Hopyard RoadSuite 205Pleasanton, CA 94588Tel 925-621-3840Fax 925-621-3841
Redwood City900 Veterans BlvdSuite 240Redwood City, CA 94063Tel 650-852-1200Fax 650-780-9137
Sacramento520 Capitol Mall5th FloorSacramento, CA 95814Tel 916-375-1500Fax 916-376-8840
Salinas328-B Main StreetSalinas, CA 93901Tel 831-449-8000Fax 831-769-0314
San Francisco201 California StreetSuite 800San Francisco, CA 94111Tel 415-781-8100Fax 415-956-3381
San Jose1650 Technology DriveSuite 600San Jose, CA 95110Tel 408-436-8000Fax 408-436-3699
San Rafael781 Lincoln AvenueSuite 100San Rafael, CA 94901Tel 415-485-0500Fax 415-485-1341
Santa Clara475 El Camino RealSuite 100Santa Clara, CA 95050Tel 408-615-3400Fax 408-615-3444
Santa Rosa200 Fourth StreetSuite 200Santa Rosa, CA 95401Tel 707-360-1300Fax 707-360-1350
Terranomics1350 Bayshore HighwaySuite 900Burlingame, CA 94010Tel 650-348-2400Fax 650-347-4307
Walnut Creek1333 N. California Blvd.Suite 580Walnut Creek, CA 94596Tel 925-627-2880Fax 925-627-2899