2011 Hong Kong Air Quality Review - Clean Air Network · 2011 Hong Kong Air Quality Review January...
17
2011 Hong Kong Air Quality Review January 2012 Yuling Jia
Transcript of 2011 Hong Kong Air Quality Review - Clean Air Network · 2011 Hong Kong Air Quality Review January...

2011 Hong Kong Air QualityReview
January 2012
Yuling Jia
Highlight
2011 recorded the 3rd worst visibility in HK’s history (p.1-2) 2011 roadside NO2 concentrations set a record high in history, likely resulting inmore respiratory disease and deaths (p.2-3) 2011 PM2.5 levels were more than 3 times worse than WHO guidelines (p.4-5) 2011 ozone concentrations ranked the 3rd worst in history (p.5) Estimated overall air pollution health cost – 906 deaths, an increase of >100people from last year (p.7) Is the proposed Air Quality Objectives (AQOs) a solution? (p.8-10) What are the recommendations? (p.11)
Overview - Visibility and the Trend of Air PollutionVisibility in Hong Kong has deteriorated significantly over the past two decades,and is continuing the trend of degradation for the year of 2011. Days of reducedvisibility in 2011 with visibility below 8 km in the absence of fog, mist, orprecipitation totaled 58 days, ranking the third worst in HK’s history.Loss of visibility is a direct indicator of air pollution, attributed from increase inthe concentration of PM2.5 and photochemical pollutants that increase thescattering of light. Loss of visibility is found to be linked with increase in non-accidental mortality and other air pollution-related health effects. The continuingloss of visibility in 2011 demonstrated that, despite of various pollution emissionreduction efforts, the overall air quality in HK has continued to deteriorate.

Hours of reduced visibility recorded at Hong Kong Observatory (1968-2011)
Source: Hong Kong Observatory (criteria: visibility below 8 kilometers when there is no fog, mist,or precipitation)2011 Air Quality by Pollutants
Nitrogen Dioxide (NO2)– the continuing challenge
NO2 concentrations have stayed steady at general monitoring stations, but everincreasing at roadsides; 2011 roadside NO2 concentrations set a record high in Hong Kong’s history (123µg/m3)
2011 Visibility – 3rd worst in HK’s history

Source: EDPAccording to the 2011 China Statistical Yearbook, HK’s urban NO2 concentrationsranked the second last among the other 31 major Chinese cities (see table below),worse than Beijing, Shanghai, and our neighboring city Guangzhou.2010 NO2 ranking2010 NO2
ranking City
2010 NO2
ranking(cont'ed) City
1 Hai Kou 17 Tian Jin2 Tai Yuan 17 Xi An3 La Sha 19 Zhen Zhou4 Xi Ning 19 Nan Jing4 Yin Chuan 19 Kun Ming6 Gui Yang 19 Chang Sha6 Ji Nan 23 Nan Zhou8 Nan Ning 23 Ha Er Bin8 He Fei 25 Shang Hai
10 Fu Zhou 26 Cheng Du11 Hu He Hao Te 27 Guang Zhou12 Shen Yang 28 Hang Zhou13 Chong Qing 29 Wu Han14 Shi Jia Zhuang 29 Bei Jing
0204060801001201401996 1997 1998 1999 2000 2001 2002 2003 2004 2005 2006 2007 2008 2009 2010 2011
ug/m
3
NO2
General Roadside
123µg/m3WorstinhistoryNO2healthimpacts:-significantinflammationoftherespiratorysystems;-reducedlunggrowthandfunction;-lowerresistancetorespiratoryinfectionssuchasinfluenza;-death;

15 Nan Chang 31 Hong Kong16 Chang Chun 32 Wu Lu Mu QiSource: China Statistical Yearbook 2011
PM10 & PM2.5 – the biggest health threat
Annual PM10 concentrations remained relatively constant at general monitoringstations and slowly decreased at roadside stations; Annual PM2.5 concentrations decreased from 2005 but started increasing againsince 2009; 2011 PM10 and PM2.5 concentrations were more than 2 times and 3 times highercompared to the WHO annual guidelines
0
10
20
30
40
50
60
70
80
90
100
1996
1997
1998
1999
2000
2001
2002
2003
2004
2005
2006
2007
2008
2009
2010
2011
ug/m
3
PM10
General Roadside
ProposedAQO
WHOAnnualGuideline

Source: EDP(Note: 2011 PM2.5 data only available from Jan to Nov)PM2.5 pose even greater health threat than PM10 because of their small size(approximately 1/30th the average width of human hair) which allows PM2.5 tolodge deeply into our lungs, and because they are made up of things that are moretoxic (like heavy metals and cancer causing organic compounds). A recent healthimpact assessment study (Xie et al., 2011, Water Air Soil Pollution) estimated that:- For short-term exposure, the annual number of avoidable deaths would be110~370 in HK if the PM2.5 daily concentrations were reduced to below WHO 24-hr guideline value;- For long-term exposure, the annual number of avoidable deaths would be5000~13,000 in HK if the PM2.5 annual concentrations were reduced to belowWHO annual guideline value, and the average lifespan of residents would prolong1~2.8 years.
0102030405060
1996 1997 1998 1999 2000 2001 2002 2003 2004 2005 2006 2007 2008 2009 2010 2011
ug/m
3
PM2.5
General RoadsideWHOAnnualGuideline
ProposedAQO
PM10&PM2.5
healthimpacts:-respiratoryandcardiovasculardiseasesanddeaths;-cancer;-prematurebirthsandincreasedinfantmortality;-manymore;

Ozone (O3) – the alarming pollutant
Ozone levels have continuously increased from 1996; 2011 ozone concentrations ranked the 3rd highest in history (41 µg/m3)
Source: EDP
Sulphur Dioxide (SO2)
SO2 concentrations have fluctuated but gradually decreased since 1996; In 2010 and 2011, SO2 levels at general stations were slightly worse compared toroadside stations.
05101520253035404550
1996 1997 1998 1999 2000 2001 2002 2003 2004 2005 2006 2007 2008 2009 2010 2011
ug/m
3
O3
General
3rdworstinhistory Ozonehealthimpacts:-significantirritationoftheeyes,nasalpassagesandlungswithbreathingproblems;-asthmaticattacks;-reducedlungfunctionandcauseotherlungdiseases;

Source: EDPInfluence of Regional Air PollutionA research report released in 2007 by the Hong Kong University of Science andTechnology and Civic Exchange showed that local sources are the primaryinfluence on Hong Kong’s air quality for 53% of the time, compared to 36% of thetime for regional sources. Has the influence of regional air pollution increased forthe past few years and led to the uprising of pollution such as NO2 and O3? To fullyanswer this question, sophisticated modeling is needed. However, a quick andrough estimate could be gained by looking at the annual variation of pollutionlevels at Tap Mun – an EPD monitoring station representative of the regionalbackground. As shown in the figure below, the annual average concentrations ofvarious pollutants have had little variation from 1998 to 2011, which indicatesthat the regional contribution to Hong Kong’s air pollution has remained relativelyconstant, in other words, the increasing trend of NO2 and O3 has come more fromlocal sources.
05101520253035
1996 1997 1998 1999 2000 2001 2002 2003 2004 2005 2006 2007 2008 2009 2010 2011
ug/m
3
SO2
General Roadside
SO2healthimpacts:-inflametherespiratorysystem;-affectthefunctioningofthelungs;-aggravateasthmaandchronicbronchitis;-increaseriskofcardiacdiseaseandmortality;

Source: EDPOverall Air Pollution Health CostHedley Index estimated that 2011 air pollution has led to 906 premature deaths,2048 million dollar loss, 68667 hospital beds, 6.68 million doctor visits, and 856asthma hospitalization. The death toll due to air pollution has increased morethan 100 people from last year.Estimates of Health Cost by Hedley Index
2010 2011Premature Deaths 792 906Dollar Cost (million HKD) 1809 2048Hospital Bed Days 60327 68667Doctor Visits (million) 5.92 6.68Asthma Hospitalization 756 856
0
10
20
30
40
50
60
70
80
90
1998 1999 2000 2001 2002 2003 2004 2005 2006 2007 2008 2009 2010 2011
ug/m
3
Tap Mun (Regional Monitoring Site)
SO2 NO2 O3 PM10

AQO Exceedance – Is the proposed AQO a solution?
Observation #1:The numbers of exceedance for 24-hr SO2 are almost exactly the same under thecurrent AQO and the proposed AQO, despite the fact that the proposed AQO (125µg/m3) seems considerably more stringent compared to the current AQO (350µg/m3).Indication:The proposed AQO for 24-hr SO2 does not set the bar high enough and make littledifference compared to the current AQO in regulating current SO2 levels. The WHOInterim Target 2 (IT-2) is well within the achievable range.# of exceedance for 24-hr SO2
Under CurrentAQO
(350 µg/m3)
UnderProposed AQO
(125 µg/m3)
Under WHOInterim Target-
2 (50 µg/m3)
Under WHOGuideline
(20 µg/m3)Central/Western 0 0 1 55Eastern 0 0 0 17Kwai Chung 0 0 22 151Kwun Tong 0 0 0 33Sha Tin 0 0 0 64Sham Shui Po 0 1 12 94Tai Po 0 0 0 6Tap Mun 0 0 0 20Tsuen Wan 0 0 2 108Tung Chung 0 0 1 52Yuen Long 0 0 0 43Causeway Bay (Roadside) 0 0 0 34Central (Roadside) 0 0 1 64Mong Kok (Roadside) 0 0 3 50
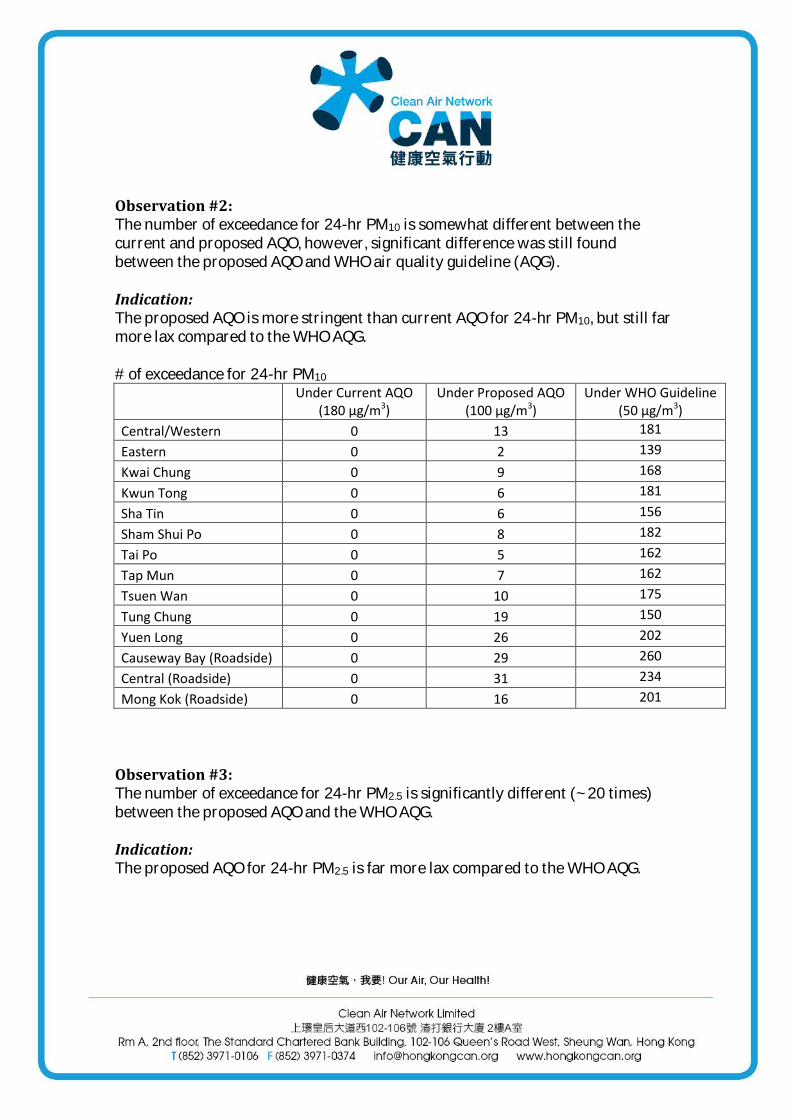
Observation #2:The number of exceedance for 24-hr PM10 is somewhat different between thecurrent and proposed AQO, however, significant difference was still foundbetween the proposed AQO and WHO air quality guideline (AQG).Indication:The proposed AQO is more stringent than current AQO for 24-hr PM10, but still farmore lax compared to the WHO AQG.# of exceedance for 24-hr PM10
Under Current AQO(180 µg/m3)
Under Proposed AQO(100 µg/m3)
Under WHO Guideline(50 µg/m3)
Central/Western 0 13 181Eastern 0 2 139Kwai Chung 0 9 168Kwun Tong 0 6 181Sha Tin 0 6 156Sham Shui Po 0 8 182Tai Po 0 5 162Tap Mun 0 7 162Tsuen Wan 0 10 175Tung Chung 0 19 150Yuen Long 0 26 202Causeway Bay (Roadside) 0 29 260Central (Roadside) 0 31 234Mong Kok (Roadside) 0 16 201
Observation #3:The number of exceedance for 24-hr PM2.5 is significantly different (~20 times)between the proposed AQO and the WHO AQG.Indication:The proposed AQO for 24-hr PM2.5 is far more lax compared to the WHO AQG.
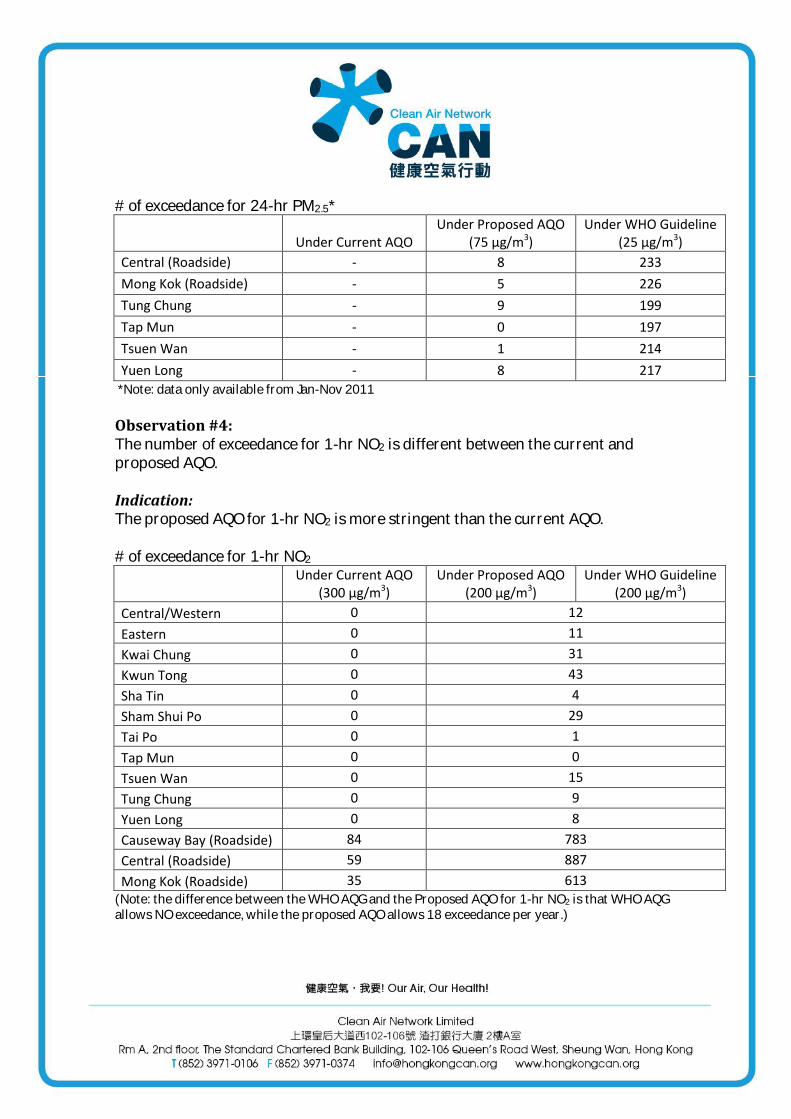
# of exceedance for 24-hr PM2.5*Under Current AQO
Under Proposed AQO(75 µg/m3)
Under WHO Guideline(25 µg/m3)
Central (Roadside) - 8 233Mong Kok (Roadside) - 5 226Tung Chung - 9 199Tap Mun - 0 197Tsuen Wan - 1 214Yuen Long - 8 217*Note: data only available from Jan-Nov 2011
Observation #4:The number of exceedance for 1-hr NO2 is different between the current andproposed AQO.Indication:The proposed AQO for 1-hr NO2 is more stringent than the current AQO.# of exceedance for 1-hr NO2
Under Current AQO(300 µg/m3)
Under Proposed AQO(200 µg/m3)
Under WHO Guideline(200 µg/m3)
Central/Western 0 12Eastern 0 11Kwai Chung 0 31Kwun Tong 0 43Sha Tin 0 4Sham Shui Po 0 29Tai Po 0 1Tap Mun 0 0Tsuen Wan 0 15Tung Chung 0 9Yuen Long 0 8Causeway Bay (Roadside) 84 783Central (Roadside) 59 887Mong Kok (Roadside) 35 613(Note: the difference between the WHO AQG and the Proposed AQO for 1-hr NO2 is that WHO AQGallows NO exceedance, while the proposed AQO allows 18 exceedance per year.)
Conclusions:
The proposed AQO is considered lax based on the current air pollution levels inHong Kong and compared to the WHO guidelines, and makes insignificantdifference compared to the current AQO in regulating the current air pollution; Neither the current nor the new AQOs will significantly improve protection ofpublic health from air pollution
Recommendations
Hong Kong needs more stringent AQOs and a timetable for execution. AQOs should be reviewed by law every 5 years, not by the willingness of EPD. Abatement of roadside emissions by early replacement of commercial dieselvehicles (mainly old trucks and buses), e.g. providing scrapping incentives andoptimizing the current subsidy scheme. Set up low emissions asap as mentioned in 2010's policy address and extendzones to other polluting districts like Tsuen Wan, Kwun Tong and Sham Shui Po. Create a special unit under both the Department of Health and EnvironmentBureau to address environmental health. Include assessment of pollution contribution from local vs. regional sources inEPD’s annual air quality report. Joint effort with the PRD administration to improve regional air quality.
Summary
2011 was the 3rd worst year in HK’s history in terms of visibility, indicating thecontinuing deterioration of the overall air quality; 2011 roadside NO2 concentration set a record high in HK’s history; 2011 PM10 and PM2.5 levels were more than 2 times and 3 times higher than WHOannual guidelines; 2011 ozone concentrations ranked the 3rd worst in HK’s history; 906 pre-mature deaths were estimated to have resulted from air pollution in2011, an increase of more than 100 people from 2010; Annual variation of pollution levels at the regional monitoring station Tap Munindicated that the regional contribution to Hong Kong’s air pollution has remainedrelatively constant throughout the past decade;
The proposed AQO is considered lax based on the current air pollution levels inHong Kong and compared to the WHO guidelines, and makes insignificantdifference compared to the current AQO in regulating the current air pollution; More stringent AQO and joint effort with the regional administration are neededto improve air quality and better protect public health in HK.
Acknowledgement
- Hong Kong Environmental Protection Department- Environmental Health Research group School of Public health at University ofHong Kong- Civic Exchange- Prof. Anthony Hedley

Appendix
More about PM2.5 in HKStudies have indicated that PM2.5 pose even greater health threat compared toPM10 because of their small size (approximately 1/30th the average width ofhuman hair) which allows PM2.5 to lodge deeply into our lungs, and because theyare made up of things that are more toxic (like heavy metals and cancer causingorganic compounds).HK currently has no PM2.5 standards. In the proposed Air Quality Objectives(AQO), the annual and 24-hr PM2.5 standards are set at 35 µg/m3 and 75 µg/m3,respectively, significantly backwards compared to the WHO annual and 24-hrPM2.5 guidelines of 10 µg/m3 and 25 µg/m3. HK’s proposed PM2.5 AQO are morelax compared to other major Asian countries (see table below), backwards evencompared to developing countries such as Pakistan and Bangladesh.Comparison of PM2.5 standards in different Asia countriesPM2.5 (annual) µg/m3 PM2.5 (24-hr) µg/m3
WHO Guideline 10 25HK (proposed) 35 75Singapore 15 35Japan 15 35Taiwan (2012) 15 35Bangladesh 15 65Sri Lanka 25 50India 40 60Mongolia 25 50Pakistan (current) 25 40Pakistan (2012) 15 35The HK EPD has been monitoring PM2.5 at five stations (Tung Chung, Tap Mun,Tsuen Wan, Yuen Long and Central-roadside) since 2005, although the data is notopen to the public. In 2011, EPD has gradually worked on extending the PM2.5continuous measurement network, and till November this year, all 14 monitoringstations have been equipped with PM2.5 samplers.
2011 Major Air Quality Improvement PolicyIn general, the government is rolling out quite a few initiatives to reduceemissions from the transport sector, which should be applauded, although amajority of them are still at the trial stage. The actual control measures that havebeen implemented in 2011 were mainly incentive schemes carried over fromprevious years to replace dirty old vehicles on road and reduce power plantemissions.Initiatives:Pilot Green Transport Fund setupHybrid bus trialPreparation for a trial to retrofit Euro II and Euro III buses with SCR devicesPreparation for pilot low-emission zonesMotor Vehicle Idling Ordinance (in effect Dec 2011)Proposal of roadside remote sensing techniques to strengthen emission controlImplementation:One-off grant scheme for pre-Euro and Euro I diesel commercial vehiclereplacement (continued from previous years)First Registration Tax incentives for environment-friendly private cars (continuedfrom previous years)One-off grant scheme for Euro II diesel commercial vehicle replacement(continued from previous years)Continuing imposition of emission caps for the power sector

Source: EPDPlot courtesy of the Environmental Health Research group at the School of Publichealth, University of Hong Kong