2011 Henry Ford Health System Award Application...
62
H ENRY F ORD H EALTH S YSTEM Detroit, Michigan 2011 Malcolm Baldrige National Quality Award Application
Transcript of 2011 Henry Ford Health System Award Application...
HENRY FORDHEALTH SYSTEM
Detroit, Michigan
2011 Malcolm Baldrige National Quality Award Application
Table of ConTenTs
Glossary of Terms and Abbreviations
Organizational ProfileP.1 Organization Description .......................................................................................................................................i
P.2 Organizational Situation ......................................................................................................................................iv
Category 1: Leadership1.1 Senior Leadership .................................................................................................................................................1
1.2 Governance and Societal Responsibilities ...........................................................................................................3
Category 2: Strategic Planning2.1 Strategy Development ..........................................................................................................................................6
2.2 Strategy Implementation ......................................................................................................................................9
Category 3: Customer Focus3.1 Voice of the Customer ........................................................................................................................................10
3.2 Customer Engagement .......................................................................................................................................12
Category 4: Measurement, Analysis, and Knowledge Management4.1 Measurement, Analysis, and Improvement of Organizational Performance ......................................................15
4.2 Management of Information, Knowledge, and Information Technology ...........................................................17
Category 5: Workforce Focus5.1 Workforce Environment .....................................................................................................................................19
5.2 Workforce Engagement ......................................................................................................................................21
Category 6: Operations Focus6.1 Work Systems .....................................................................................................................................................25
6.2 Work Processes ...................................................................................................................................................28
Category 7: Results7.1 Health Care and Process Outcomes....................................................................................................................30
7.2 Customer-Focused Outcomes .............................................................................................................................38
7.3 Workforce-Focused Outcomes ...........................................................................................................................41
7.4 Leadership and Governance Outcomes ..............................................................................................................44
7.5 Financial and Market Outcomes.........................................................................................................................48
Glossary of Terms and abbreviaTions
5 Million Lives Campaign IHI-sponsored national initiative to protect patients from harm; 5M refers to goal—eliminate 5M harm events nation-wide100K Lives Campaign IHI-sponsored national initiative to reduce mortality through implementation of evidence-based practices in hospital care
a
A&CC Audit and Compliance Committee of the BOT ACC American College of CardiologyACGME Accreditation Council for Graduate Medical Education—Responsible for the accreditation of U.S. post-MD medical training programs; accomplished through a peer review process and based upon established standards and guidelinesAction Plan Collection of specific actions, resources, responsibilities, and timelines that respond to short- or long-term strategic initiatives. ADLI Approach, deployment, learning, integrationAHA American Hospital AssociationAHRQ Agency for Healthcare Research and QualityAIP Annual Incentive PlanALA Advanced Leadership Academy. 18 month formal Leadership development program/cohort for individuals selected by SL as potential successors to Performance Council. Allopathic Medical training that leads to a Doctor of Medicine degree (M.D.)AMA American Medical AssociationAmbulatory Services provided on an outpatient basisAME Annual mandatory educationAMGA American Medical Group AssociationAMI Acute Myocardial Infarction (heart attack)AOA American Osteopathic Association—National accrediting body for osteopathic health care organizationsAOHPH Association of Occupational Health Professionals in HealthcareAOS Available on siteAPM Action Plan MonitorAugmentation Helping labor progress by doing something to stimulate contractions.BAA Business Associate Agreement—Requirement in the vendor policy for all vendors to follow all HIPAA guidelinesBBP/OPIM Blood-borne Pathogen/Other Potentially Infectious MaterialBCBSM Blue Cross and Blue Shield of MichiganBCN Blue Care NetworkBHS Behavioral Health ServicesBOB Book of BusinessBOG Board of GovernorsBOT Board of TrusteesBU Business Unit
Bundle Set of separate but interdependent clinical processes or practices that together drive a desired outcome
C
CA CancerCABG Coronary Artery Bypass GraftCAHPS Consumer Assessment of Healthcare Providers and Systems—Member satisfaction survey used by HAPCAP College of American PathologistsCapitated A payment mechanism by which a health plan gives the provider a set fee per member per month (PMPM) regardless of treatment required. Care Coordination Approaches in the process of care to ensure patients’ needs are met and hand offs between care givers and settings are error freeCARF Commission on Accreditation of Rehabilitation FacilitiesCarePlus Classic Original version of the EMR and associated data repository of patients’ medical recordsCBC Complete blood countCC Community Care—Market segment which includes community-based and in-home servicesCCs core competenciesCCS Community Care ServicesCDC Center for Disease ControlCDS Corporate Data Store—A secured, comprehensive data warehouse which includes information from various clinical, revenue cycle, and business systems CE Customer EngagementCenters of Excellence Programs certified as Centers of Excellence by external agenciesCEO Chief Executive OfficerCEU Clinical Education Units—Education required by nurses and other Allied health professionals to maintain licensure and certificationCESC Customer Engagement Steering CommitteeChampion (Safety, Engagement, etc.) Internal consultants to individual BUs. For example, engagement champions focus on employee engagement and retention initiatives. They develop and recommend department, BU and System-wide initiatives based on Engagement Survey data to drive improved engagement scores and decreased turnover as well as create tools and resources for managers to help them build and sustain a highly engaged workforce environment. Safety Champions perform a similar role focused on safety.CHAP Community Health Accreditation ProgramCHASS Community Health and Social Services Clinic (Federally Qualified Health Centers)CHNA Community Health Needs AssessmentCHP Community Health ProgramsCHRO Chief Human Resource OfficerCIO Chief Information Officer
CISC Care Innovation Steering Committee—A cross-System team focusing on innovations in prevention and chronic disease management Clinical job function Allied health, behavioral health, clinical support, nursing, physician, researchCME Continuing Medical Education—Education required by physicians and other clinicians to maintain licensureCMO Chief Medical OfficerCMS Centers for Medicare and Medicaid Services—Federal agency responsible for the administration of Medicare/Medicaid CNEC Corporate Nurse Executive CouncilThe Code Code of Conduct—Expectations for ethical and moral behavior COI Conflict of InterestCommunity Care Patient segment for all CCS services CON Certificate of need—State laws and programs to restrain health care facility costs and allow coordinated planning of new services and constructionCOO Chief Operating OfficerCore Measures Standardized, or “core,” quality performance measures reported by The Joint Commission (TJC) accredited hospitals, aligned with measures required by CMS, and endorsed by NQF; viewed as integral to improving the quality of care provided to hospital patients and bringing value to stakeholders by focusing on evidence-based care processes for AMI, HF, pneumonia, and surgical infection preventionCOS Culture of SafetyCPM Customer Potential Management—HFHS’s customer relationship management vendor’s databaseCPNG Care Plus Next Generation—significantly enhanced EMR implemented in 2011CPOE Computerized Physician/Provider Order Entry CPT Community Pillar TeamCQO Chief Quality OfficerCrimson Physician performance improvement software from the Health Care Advisory BoardCRM Customer relationship management—patient preference databaseCrucial Conversations HFHSU class offered to leaders to improve retention and enhance conflict management CSCM Catastrophic Senior Case ManagementCSR Customer Service RepresentativeCTO Combined Time Off—vacation, sick and personal timeCV Cardiovascular
d
Days Cash on Hand Measures the number of days that operating expenditures are covered by cash balances DME Durable medical equipmentDNV DNV Healthcare—a hospital accrediting agency. DR Disaster recoveryDVT Deep Vein Thrombosis—blood clot
DVT Protocols Approaches to minimize risk of potentially fatal blood clots
e
EA Environmental assessmentEAG Employee Advisory GroupEAP Employee Assistance ProgramEC Executive Cabinet ED Emergency DepartmentEDS Electronic Data Systems EEOC Equal Employment Opportunity CommissionEHS Employee Health ServicesEMR Electronic Medical Recorde-Nancy Direct email access system to the HFHS CEOEOS Employee Opinion SurveyEPA Environmental Protection AgencyePrescribe/ePrescribing Software that allows creation and distribution of prescriptions electronically e-Visits Structured online clinical interviews between patients and their physicians; physicians to make clinical judgments and recommend next steps/treatments
f
FCR First Call ResolutionFMEA Failure Modes and Effects Analysis—Structured method to identify, prioritize, and address potential failures in high-risk processes with the aim of preventing themFQHC Federally Qualified Health Center
G
Gallup Q12 An evidence-based survey tool of 12 questions most highly correlated with employee satisfaction and organizational productivity Gantz Wiley Employee Opinion Survey vendor used by HFHS prior to 2008Governance Institute conducts research studies, tracks healthcare industry trends, and showcases governance practices of leading health care boards across the country.
H
HAP Health Alliance PlanHarm Any unintended physical injury resulting from or contributed to by medical care (including the absence of indicated medical treatment) that requires additional monitoring, treatment or hospitalization, or that results in death. Such injury is considered harm whether or not it is considered preventable, resulted from a medical error, or occurred within a hospital.HCAB Healthcare Advisory Board—Research organization which provides industry data and literatureHbA1c Glycosylated hemoglobin, measured in a blood test commonly used to assess blood sugar control in diabetic patients HCAHPS Hospital Consumer Assessment of Healthcare Providers and Systems—CMS’s national inpatient satisfaction survey
HE Health EngagementHEART Hear, Empathize, Apologize, Respond, and Thank—HFHS’s service recovery modelHEDIS Health Employer Data and Information Set—Tools used by U.S. health plans to measure performance on care and service; widely accepted as measures for ambulatory care Henry HFHS’s intranetHF Heart FailureHFH Henry Ford HospitalHFHS Henry Ford Health SystemHFHS-employed physicians Physicians employed by HFHS on contract for specific clinical or administrative servicesHFHSU Henry Ford Health System University HFKH Henry Ford Kingswood HospitalHFLS Henry Ford Leadership SystemHFMC Henry Ford Medical Center(s) Fairlane (FRL) Sterling Heights (SH) West Bloomfield (WB)HFMG Henry Ford Medical GroupHFMG physicians Members of the HFMG multi-specialty, salaried group practice, one of HFHS’s BUsHFMH or HFMH-CT Henry Ford Macomb HospitalHFMH-WC Henry Ford Macomb Hospital-Warren CampusHFPN Henry Ford Physician NetworkHFWBH Henry Ford West Bloomfield HospitalHFWH Henry Ford Wyandotte HospitalHFWH-CHS Henry Ford Wyandotte Hospital-Center for Health Services (ambulatory site)HHC Home Health CareHICS Hospital Incident Command System HIHCP HAP In-Home Care ProgramHIPAA Health Insurance Portability and Accountability ActHR Human Resources HR Business Partner BU HR Professional whose primary job function is to work closely with leadership to analyze data and drive strategy. The role aligns HR work with BU and system strategy. HR and business data are key drivers, focusing efforts in areas such as workforce planning, retention and engagement. HRA Health Risk Assessment HRET Human Resources Executive TeamHRIC Human Resources Investment Center Hyperlipidemia Hyperlipidemia is a condition where there is an elevation of lipids, or fats, in the blood. This could be due to an increase in triglycerides, cholesterol, or both. Untreated hyperlipidemia may lead to heart disease.
i
ICU Intensive Care UnitIDP Individual Development Plan IHI Institute for Healthcare Improvement—Not-for-profit organization leading global health care improvementiMDSoft Software tool for tracking patient care in intensive care units
Induction Induction of labor: involves using artificial means to assist the mother in delivering her babyINR International Normalized Ratio—Blood test to assess the effect of oral anticoagulation therapy Integrated system management models and structures that allow for coordination of care experience for patients and their families and teamwork among care givers and employeesIOM Institute of MedicineIP InpatientIPA Independent Practice AssociationIRB Institutional Review Board—Approves, monitors, and reviews biomedical and behavioral research involving humans with the aim to protect the rights and welfare of the research subjectsIT Information TechnologyITDR IT disaster recoveryIVR Interactive Voice Response
J
JIT Just-in-timeJust Culture “Just Culture” policy and training is a best practice, standardized approach to manage employee behaviors toward open communication (“speak up”), safety, and high performance.
K
Keystone project State collaborative on patient safety, nationally recognized for excellenceKirkpatrick Four levels of training results including:
Reaction of student—what they thought and felt about the training; Learning—the resulting increase in knowledge or ca-pacity; Behavior—extent of behavior and capability improve-ment and implementation/application; and Results—the effects on the business or environment resulting from the trainee’s performance
KW Knowledge Wall
l
LA Leadership Academy. Year-long development program/cohort for individuals identified through Talent Review process as potential successors to LEAP. Focus is on Pillars and strategic objectives Lasting Impressions Service Excellence framework adopted by all HFHS BUs Lean Improvement methodology focused on eliminating waste and reducing cycle timeLEAP Leadership Execution and Planning TeamLeapfrog Group Voluntary employer membership program to recognize and reward big leaps in health care safety, quality, and customer value LOS Length of Stay—The number of days a patient stays in an inpatient facility; often used as a measure of efficiency and effectiveness
1.
2.
3.
4.
LT Long term
m
Market Measurement Vendor used by HAP to conduct telephone surveys of patients about their satisfaction with HAP physicians and networks MC Metrics CommitteeMDCH Michigan Department of Community HealthMEC Medical Executive CommitteeMHA Michigan Health and Hospital AssociationMI MichiganMIOSHA Michigan Occupational Safety and Health AdministrationMI-STAAR MI State Action on Avoidable RehospitalizationsModel for Improvement HFHS approach to process design and improvement based in PDCA Morbidity Rate Measures the incidence rate or prevalence of a disease or medical conditionMortality Rate Measures the number of deaths in a given populationMQC Michigan Quality Council—Michigan’s Baldrige-based award program. Their Leadership Award is the highest honor given MFI Model for ImprovementM/S or Med/Surg Medical/Surgical—Refers to patients admitted for medical and/or surgical careMTM Medication Therapy ManagementMVV Mission, Vision, Values MyHealth Consumer Health Portal
n
NCQA National Committee on Quality Assurance—Not-for-profit organization dedicated to improving health plan quality through accreditation, certification, and recognitionNDNQI National Database of Nursing Quality IndicatorsNHSC No Harm Steering CommitteeNHSN National Health Safety Network (formerly NNIS)NIH National Institutes of HealthNIMS National Incident Management SystemNLA New Leaders Academy. Formal leadership development program/cohort for all new leaders based on promotion/hire. 40 hours classroom and 20 hours online training in the first 6 months. Focus is on HFHS Leadership Competencies.Non-clinical job functions Admin. support, business, facility/security/support services, information technology, leadership/management, vision centerNQF National Quality Forum—non-profit organization to develop and implement a national strategy for health care quality measurement and reportingNRC National Research CorporationNSQIP National Surgical Quality Improvement Program, a national collaborative focusing on reducing surgical mortality and complications
o
OASIS Outcomes and Assessment Information Set—National database of quality indicators for home health careOB ObstetricsOMB Circular A133 Office of Management and Budget audit of federal research awardsOP OutpatientOPR Organizational Performance ReviewOR Operating RoomOSHA Occupational Safety and Health AdministrationOsteopathic Medical training that leads to a Doctor of Osteopathy degree (D.O.)OWD Office of Workforce Diversity
P
PC Performance Council PCP Primary Care Physician/ProviderPCTC Patient Centered Team CarePerformance Measures Metric used to quantify performance Performance Targets Short- and long-term goals based on projected performance PDCA Plan Do Check Act (improvement cycle); HFHS adds a “debrief” step (PDCAd)PG Press Ganey: Supplier of patient and physician satisfaction surveys, research, and improvement tools PI Performance ImprovementPillars, The pillars The 7 pillar strategic framework PLI Physician Leadership InstitutePMP Performance Management ProcessPN PneumoniaPost-Acute AmbulatoryPremier Membership organization of not-for-profit health care organizations; serves as HFHS’s Group Purchasing Organization Press Ganey (PG) Supplier of patient and physician satisfaction surveys, research, and improvement tools Private-Practice Physicians Independent physicians who have practice privileges at HFHS community hospitals
Q
QA Quality AssuranceQuality Expo Annual week-long improvement project exhibit and live team presentations
r
RadicaLogic (RL) On-line patient/stakeholder risk and feedback reporting and tracking system R&E Research & EducationRevenue Cycle Systems Inpatient and outpatient registration, scheduling, real-time eligibility verification, charge capture, and billing systems
s
SC System Communications
SCIP Surgical care improvement programSCM Supply Chain ManagementSE Service ExcellenceSEM (SE MI or SE) Southeast Michigan—Includes the three counties of HFHS’s primary service area (Wayne, Oakland, and Macomb) as well as Livingston, Washtenaw, St. Clair, and Monroe countiesSentinel Event Defined by the Joint Commission (TJC) as any unanticipated event in a healthcare setting resulting in death or serious physical or psychological injury to a patient or patients, not related to the natural course of the patient’s illness.SESF System Employee Safety ForumSg2 Health care membership organization, providing clinical and technology research and consultingSHC Self-Health CoachSI Strategic Initiative—A project designed to achieve our strategic objectives and related goals/targets Six Clinic Group Group of large, employed physician practices across the U.S. who share research and process improvements—HFHS is a memberSix Sigma Improvement methodology and an associated set of tools to reduce variability and eliminate defectsSL Senior Leadership SMART Specific, measurable, attainable, relevant, time-boundSO Strategic Objective—Projected future state of the organization resulting from implementation of strategic initiatives SPP Strategic Planning Process SQF System Quality Forum—The Quality/Safety Pillar TeamST Short termStrategic Advantage A significant aspect of the operation that is done exceedingly well. Advantages that we have that make it easier to succeed.Strategic Challenge A weakness or inadequacy in a major activity or resource that reduces the organization’s ability to achieve its strategic objectives. Factor that makes it harder to succeed.SWOT Strengths, Weaknesses, Opportunities, and Threats System The Henry Ford Health System
System Integration Linking services together to provide coordinated experiences for patients System Net Income Operating gain including investments for the whole SystemSystem Operating Net Income Operating gain (does not include investments) for the whole System
T
TAT Turn-around-timeTB TuberculosisTeam Member Standards The Team Member Standards of Excellence (P.1a(2)) which apply to all employed staff and leadersTHFE The Henry Ford Experience Thomson Reuters An international company specializing in information and decision support tools for healthcare TJC The Joint Commission—National accrediting body for many different types of health care organizationsTrainees Those in physician training programs at HFHS at all levels, including students, residents, and fellows.Tri-county Area Wayne, Oakland, and Macomb counties in SEMTS Talent Selection
U
UAT User-acceptance testing
v
VAP Ventilator Associated PneumoniaVATs Value Analysis Teams—Teams of operational leaders who work with Supply Chain Management to address supply costs through standardization and innovation VOC Voice of the CustomerVodcast Video communication available to all workforce members via Henry
W
WHO World Health OrganizationWPM Work Process MeasuresWSU Wayne State University

�
Preface: OrganizatiOnal PrOfile
P.1 Organizational DescriptionA century ago, pioneer automaker Henry Ford recognized the need for health care for the growing city of Detroit. He brought to health care the same drive that made him a visionary leader in transportation. He committed to building Henry Ford Hospi-tal (HFH) in the heart of Detroit, staffed with employed physi-cians (later the Henry Ford Medical Group (HFMG)), to serve the average person. He encouraged research and professional education, creating a tradition of innovation and learning that continues today.
Our history is one of overcoming great obstacles while never wavering in our commitment to our community. With financial losses due to unreimbursed care, and suburban patients unwill-ing to go downtown, HFH and HFMG could have left Detroit for the suburbs. Instead, we committed to Detroit by creating partnerships with the city and adding ambulatory centers in the suburbs. Today, although Detroit faces one of the worst econo-mies in the U.S. with nearly half its children living in poverty, Henry Ford Health System (HFHS) remains committed to De-troit while serving all Southeast Michigan (SEM), over 4.7M residents in 2010.
Fragmented, high-cost service delivery is a well-known failing of U.S. health care, yet HFHS has long focused on integrating services. Early leaders recognized that patients and families need services linked together to ensure coordinated, high-qual-ity, safe, personal care. From HFH’s opening in 1915, we in-tegrated inpatient (IP) and outpatient (OP) departments under one innovative management structure. As we grew, we contin-ued to lead the industry in spreading and advancing models to integrate care delivery. We were early adopters of electronic medical records (EMR), an essential tool for coordinating care. To integrate financing and delivery, we added a health insur-ance plan (Health Alliance Plan, HAP) that encourages low-cost and high-quality care. Today, HFHS is one of the nation’s leading comprehensive, integrated health systems, with a full spectrum of services.
HFHS supports research and education to ensure discovery and delivery of state-of-the-art care, contribute to the well-being of our communities, attract talent, and through innovation and knowledge sharing, set an example of leadership for the health care industry. We rank in the top 6% of institutions granted funding by the National Institutes of Health (NIH). Integration of patient care with research, education, community health, and insurance offers significant competitive advantages. HFHS has received numerous awards and recognitions for contributions to SEM and the U.S. that exemplify the ongoing Ford tradi-tions of innovation, excellence, and learning (Fig.7.4-2).
P.1a(1) Service Offerings. HFHS is a not-for-profit integrated health care delivery and insurance system (Fig. P.1-1). We of-fer services across the care continuum through nine business units (BUs) with a diverse network of facilities (Fig. P.1-2). Our key customer groups and associated health care service delivery mechanisms include:
Patients. Service is delivered through direct collaboration with our clinicians and multi-disciplinary teams, hospital stays, ambulatory and home visits, and educational programs. Our online interactions with patients include e-visits, results reporting through health information portals, and online ap-pointment scheduling and prescription renewals (3.2a(2)). Community. Service is delivered through interactions in our facilities, our Web site, print media, and educational TV, and programs at community locations, often delivered jointly with partners or collaborators. We contribute to community health care service delivery through community leadership, collaborative arrangements, and funding, especially for the un- and under-insured (1.2c(1,2), Figs. 7.5-4, 7.4-8).Purchasers. Service is delivered through HAP’s health in-surance products for individuals and employers, which of-fer coverage for health-promotion and disease-management
•
•
•
F�g. P.1-1: HFHS Integrated System
Continuum of Care Provides state-of-the-art, coordinated services throughout
the System and into the Community HFH Community Hospitals Ambulatory Centers
Community Care Services (CCS) Community Health Programs (CHP)*HFMG Physicians, HFHS Employed Physicians, Private Practice Physicians
Health Alliance Plan (HAP)Encourages value and innovation
Research & Education (R&E)* Provides focus on innovation, trains 1/3 of MDs in MI, attracts talent
Basic science, population and clinical research Healthcare provider training
Key
Ele
men
ts o
f Sys
tem
*Community Health Programs and Research & Education are cross-business unit programs managed through the Community and R&E Pillar infrastructure
F�g. P.1-2: HFHS BUs, Serv�ces, and Del�very Mechan�smsBUSINESS UNIT* %
REV %
EMPL SERVICES
Henry Ford Hosp�tal (HFH) (802 beds) 18 25
Same as community hospitals (below) plus level 1 trauma, certified centers of excellence in Oncology, Transplant, Trauma, and Stroke
Henry Ford Macomb Hosp�tal (HFMH) (349 beds) 8 12 Community hospitals provide
acute IP and hospital-based OP services, including emergency, ambulatory surgery, and diagnostic services plus both on- and off-site employed practice OP services, behavioral health services (at many), prevention, and wellness
Henry Ford Macomb Hosp�tal─Warren Campus (HFMH-WC) (203 beds)
2 4
Henry Ford Wyandotte Hosp�tal (HFWH) (379 beds) 6 10
Henry Ford West Bloomf�eld Hosp�tal (HFWBH) (191 beds)
4 7
Henry Ford Med�cal Group (HFMG) 41 specialties, 30 ambulatory centers
15 21
Preventive care, primary care, specialty care, senior care management, four centers of excellence
Behav�oral Health Serv�ces (BHS) (150 beds; 7 clinics─ behavioral health only)
1 2
Comprehensive psychiatric and psychological services for adults and children, including psychiatric hospital and IP/OP addiction medicine
Commun�ty Care Serv�ces (CCS) 6 10
Dialysis; in-home, nursing home, and hospice care; retail services to support care across all life stages and health levels
Health All�ance Plan (HAP) 39 4 Insurance products, including HMO, PPO, consumer-driven health plans
*Relative importance is indicated by net % revenue and % employees. Though not technically a BU, Corporate Services accounts for 4% of employees and, where appropriate, is represented in data segmented by BU.
��
services, delivered in our facilities, the workplace, online, by telephone, and in print media.
P.1a(2) Vision and Values. We are driven by a passion for excellence and a pervasive “can-do” spirit. Our culture, char-acterized by our focus on clinical excellence, community com-mitment, System integration, and efficient business practices, aligns to and supports our mission, vision, and values (MVV, Fig. P.1-3), which set the direction for the System and serve as the basis for strategic planning and management of operations (1.1a(1), 2.1a(1)). Our culture pulls together our wide range of resources and services to create what we call The Henry Ford Experience (THFE).
Our values drive the decision making and personal behavior of leaders and the workforce (1.1a(2)). To reinforce living our values, senior leaders developed the HFHS Team Member Standards, which pertain to everyone in the workforce: Dis-play a positive attitude; Take ownership and be accountable; Respond in a timely manner; Commit to team members; Be courteous and practice established etiquette; Respect patient privacy; Foster and support innovation; and Honor and re-spect diversity. Our core competencies (CCs) are fundamental contributors to our success in fulfilling our mission and differ-entiating HFHS in our marketplace (Fig. P.1-4).
Among many examples, the following illustrate how we le-verage our CCs to achieve the excellence that enables us to dramatically improve human lives:
Aligned with our top priority of reducing harm (1.1a(3)), HFH served as one of the first “mentor” hospitals and contributing inventor in a national harm reduction campaign. The HFHS No Harm Campaign model was recently tapped to contribute to the new Health & Human Services Partnering for Patient Safety campaign. (Innovation, Collaboration/partnering)HFMG physicians performed the first robotic removal of a cancerous prostate gland in the U.S., an innovation that revolutionized prostate cancer treatment globally; today five surgical specialties have expanded into the robotics field, and HFMG is recognized for its widespread expertise in mini-mally invasive surgery. (Innovation, Care coordination) HFHS opened HFWBH in 2009, an innovative hospital with a wellness focus, designed with substantial input from
•
•
•
patients, families, the community, and caregivers. (Innova-tion, Care coordination, Collaboration/partnering)
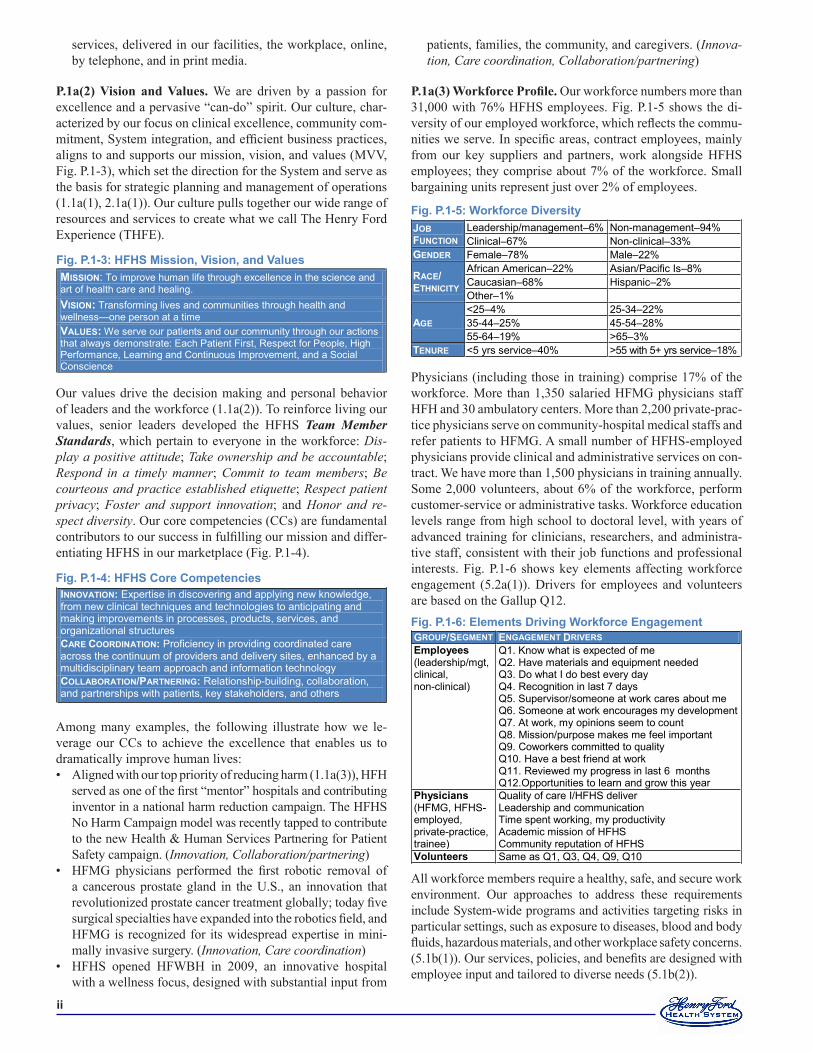
P.1a(3) Workforce Profile. Our workforce numbers more than 31,000 with 76% HFHS employees. Fig. P.1-5 shows the di-versity of our employed workforce, which reflects the commu-nities we serve. In specific areas, contract employees, mainly from our key suppliers and partners, work alongside HFHS employees; they comprise about 7% of the workforce. Small bargaining units represent just over 2% of employees.
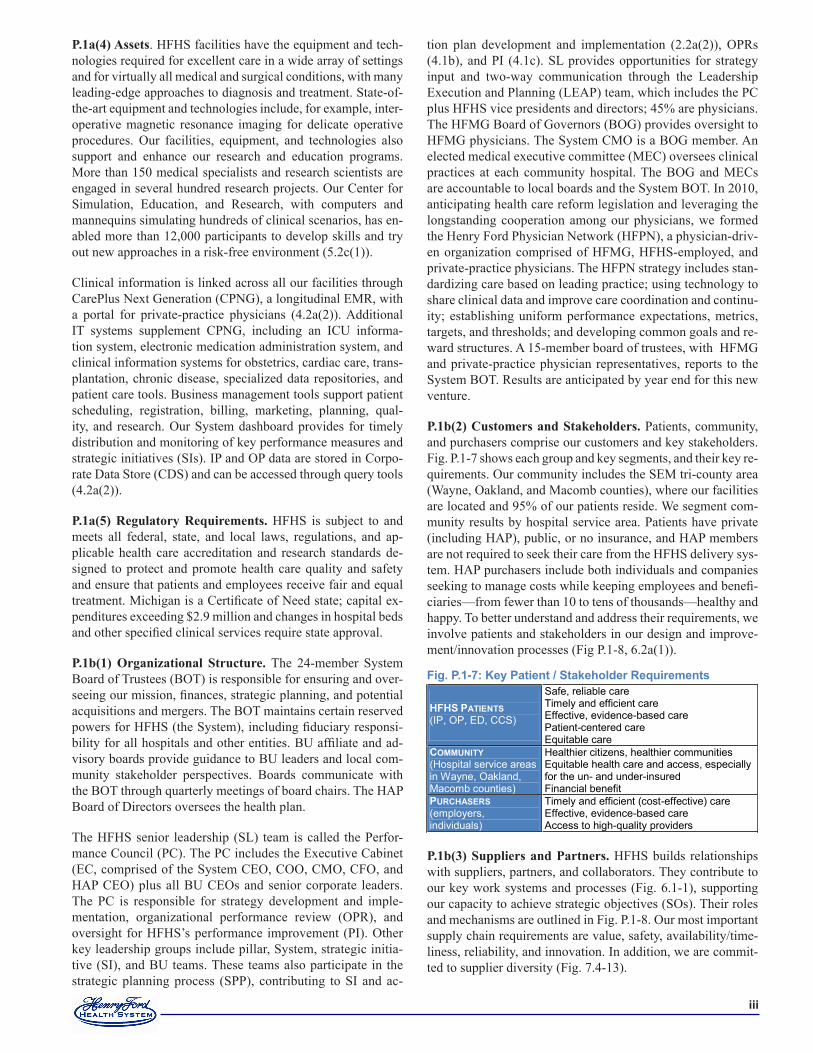
Physicians (including those in training) comprise 17% of the workforce. More than 1,350 salaried HFMG physicians staff HFH and 30 ambulatory centers. More than 2,200 private-prac-tice physicians serve on community-hospital medical staffs and refer patients to HFMG. A small number of HFHS-employed physicians provide clinical and administrative services on con-tract. We have more than 1,500 physicians in training annually. Some 2,000 volunteers, about 6% of the workforce, perform customer-service or administrative tasks. Workforce education levels range from high school to doctoral level, with years of advanced training for clinicians, researchers, and administra-tive staff, consistent with their job functions and professional interests. Fig. P.1-6 shows key elements affecting workforce engagement (5.2a(1)). Drivers for employees and volunteers are based on the Gallup Q12.
All workforce members require a healthy, safe, and secure work environment. Our approaches to address these requirements include System-wide programs and activities targeting risks in particular settings, such as exposure to diseases, blood and body fluids, hazardous materials, and other workplace safety concerns. (5.1b(1)). Our services, policies, and benefits are designed with employee input and tailored to diverse needs (5.1b(2)).
F�g. P.1-3: HFHS M�ss�on, V�s�on, and Values MISSION: To improve human life through excellence in the science and art of health care and healing. VISION: Transforming lives and communities through health and wellness—one person at a time VALUES: We serve our patients and our community through our actions that always demonstrate: Each Patient First, Respect for People, High Performance, Learning and Continuous Improvement, and a Social Conscience
INNOVATION: Expertise in discovering and applying new knowledge, from new clinical techniques and technologies to anticipating and making improvements in processes, products, services, and organizational structures CARE COORDINATION: Proficiency in providing coordinated care across the continuum of providers and delivery sites, enhanced by a multidisciplinary team approach and information technology COLLABORATION/PARTNERING: Relationship-building, collaboration, and partnerships with patients, key stakeholders, and others
F�g. P.1-4: HFHS Core Competenc�es
F�g. P.1-5: Workforce D�vers�tyJOB FUNCTION
Leadership/management–6% Non-management–94% Clinical–67% Non-clinical–33%
GENDER Female–78% Male–22%
RACE/ ETHNICITY
African American–22% Asian/Pacific Is–8% Caucasian–68% Hispanic–2% Other–1%
AGE <25–4% 25-34–22% 35-44–25% 45-54–28% 55-64–19% >65–3%
TENURE <5 yrs service–40% >55 with 5+ yrs service–18%
GROUP/SEGMENT ENGAGEMENT DRIVERS Employees (leadership/mgt, clinical, non-clinical)
Q1. Know what is expected of me Q2. Have materials and equipment needed Q3. Do what I do best every day Q4. Recognition in last 7 days Q5. Supervisor/someone at work cares about me Q6. Someone at work encourages my development Q7. At work, my opinions seem to count Q8. Mission/purpose makes me feel important Q9. Coworkers committed to quality Q10. Have a best friend at work Q11. Reviewed my progress in last 6 months Q12.Opportunities to learn and grow this year
Phys�c�ans (HFMG, HFHS-employed, private-practice, trainee)
Quality of care I/HFHS deliver Leadership and communication Time spent working, my productivity Academic mission of HFHS Community reputation of HFHS
Volunteers Same as Q1, Q3, Q4, Q9, Q10
F�g. P.1-6: Elements Dr�v�ng Workforce Engagement
���
P.1a(4) Assets. HFHS facilities have the equipment and tech-nologies required for excellent care in a wide array of settings and for virtually all medical and surgical conditions, with many leading-edge approaches to diagnosis and treatment. State-of-the-art equipment and technologies include, for example, inter-operative magnetic resonance imaging for delicate operative procedures. Our facilities, equipment, and technologies also support and enhance our research and education programs. More than 150 medical specialists and research scientists are engaged in several hundred research projects. Our Center for Simulation, Education, and Research, with computers and mannequins simulating hundreds of clinical scenarios, has en-abled more than 12,000 participants to develop skills and try out new approaches in a risk-free environment (5.2c(1)).
Clinical information is linked across all our facilities through CarePlus Next Generation (CPNG), a longitudinal EMR, with a portal for private-practice physicians (4.2a(2)). Additional IT systems supplement CPNG, including an ICU informa-tion system, electronic medication administration system, and clinical information systems for obstetrics, cardiac care, trans-plantation, chronic disease, specialized data repositories, and patient care tools. Business management tools support patient scheduling, registration, billing, marketing, planning, qual-ity, and research. Our System dashboard provides for timely distribution and monitoring of key performance measures and strategic initiatives (SIs). IP and OP data are stored in Corpo-rate Data Store (CDS) and can be accessed through query tools (4.2a(2)).
P.1a(5) Regulatory Requirements. HFHS is subject to and meets all federal, state, and local laws, regulations, and ap-plicable health care accreditation and research standards de-signed to protect and promote health care quality and safety and ensure that patients and employees receive fair and equal treatment. Michigan is a Certificate of Need state; capital ex-penditures exceeding $2.9 million and changes in hospital beds and other specified clinical services require state approval.
P.1b(1) Organizational Structure. The 24-member System Board of Trustees (BOT) is responsible for ensuring and over-seeing our mission, finances, strategic planning, and potential acquisitions and mergers. The BOT maintains certain reserved powers for HFHS (the System), including fiduciary responsi-bility for all hospitals and other entities. BU affiliate and ad-visory boards provide guidance to BU leaders and local com-munity stakeholder perspectives. Boards communicate with the BOT through quarterly meetings of board chairs. The HAP Board of Directors oversees the health plan.
The HFHS senior leadership (SL) team is called the Perfor-mance Council (PC). The PC includes the Executive Cabinet (EC, comprised of the System CEO, COO, CMO, CFO, and HAP CEO) plus all BU CEOs and senior corporate leaders. The PC is responsible for strategy development and imple-mentation, organizational performance review (OPR), and oversight for HFHS’s performance improvement (PI). Other key leadership groups include pillar, System, strategic initia-tive (SI), and BU teams. These teams also participate in the strategic planning process (SPP), contributing to SI and ac-
tion plan development and implementation (2.2a(2)), OPRs (4.1b), and PI (4.1c). SL provides opportunities for strategy input and two-way communication through the Leadership Execution and Planning (LEAP) team, which includes the PC plus HFHS vice presidents and directors; 45% are physicians. The HFMG Board of Governors (BOG) provides oversight to HFMG physicians. The System CMO is a BOG member. An elected medical executive committee (MEC) oversees clinical practices at each community hospital. The BOG and MECs are accountable to local boards and the System BOT. In 2010, anticipating health care reform legislation and leveraging the longstanding cooperation among our physicians, we formed the Henry Ford Physician Network (HFPN), a physician-driv-en organization comprised of HFMG, HFHS-employed, and private-practice physicians. The HFPN strategy includes stan-dardizing care based on leading practice; using technology to share clinical data and improve care coordination and continu-ity; establishing uniform performance expectations, metrics, targets, and thresholds; and developing common goals and re-ward structures. A 15-member board of trustees, with HFMG and private-practice physician representatives, reports to the System BOT. Results are anticipated by year end for this new venture.
P.1b(2) Customers and Stakeholders. Patients, community, and purchasers comprise our customers and key stakeholders. Fig. P.1-7 shows each group and key segments, and their key re-quirements. Our community includes the SEM tri-county area (Wayne, Oakland, and Macomb counties), where our facilities are located and 95% of our patients reside. We segment com-munity results by hospital service area. Patients have private (including HAP), public, or no insurance, and HAP members are not required to seek their care from the HFHS delivery sys-tem. HAP purchasers include both individuals and companies seeking to manage costs while keeping employees and benefi-ciaries—from fewer than 10 to tens of thousands—healthy and happy. To better understand and address their requirements, we involve patients and stakeholders in our design and improve-ment/innovation processes (Fig P.1-8, 6.2a(1)).
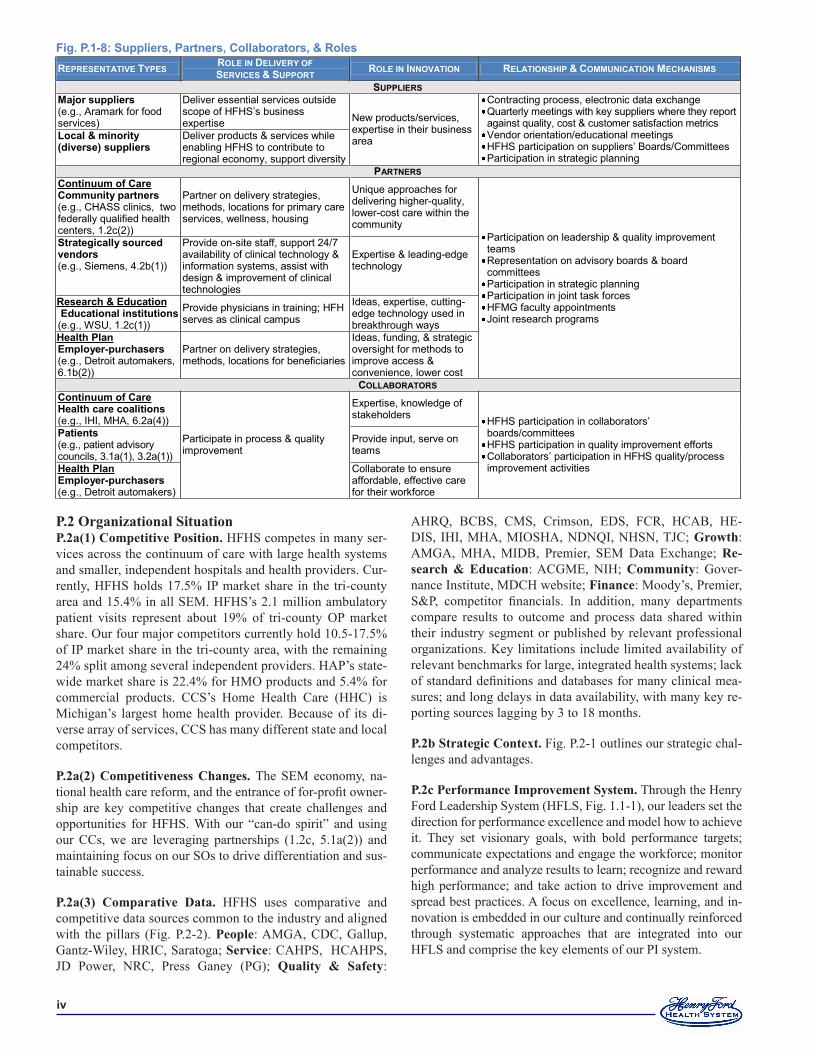
P.1b(3) Suppliers and Partners. HFHS builds relationships with suppliers, partners, and collaborators. They contribute to our key work systems and processes (Fig. 6.1-1), supporting our capacity to achieve strategic objectives (SOs). Their roles and mechanisms are outlined in Fig. P.1-8. Our most important supply chain requirements are value, safety, availability/time-liness, reliability, and innovation. In addition, we are commit-ted to supplier diversity (Fig. 7.4-13).
HFHS PATIENTS (IP, OP, ED, CCS)
Safe, reliable care Timely and efficient care Effective, evidence-based care Patient-centered care Equitable care
COMMUNITY (Hospital service areas in Wayne, Oakland, Macomb counties)
Healthier citizens, healthier communities Equitable health care and access, especially for the un- and under-insured Financial benefit
PURCHASERS (employers, individuals)
Timely and efficient (cost-effective) care Effective, evidence-based care Access to high-quality providers
F�g. P.1-7: Key Pat�ent / Stakeholder Requ�rements
�v
P.2 Organizational SituationP.2a(1) Competitive Position. HFHS competes in many ser-vices across the continuum of care with large health systems and smaller, independent hospitals and health providers. Cur-rently, HFHS holds 17.5% IP market share in the tri-county area and 15.4% in all SEM. HFHS’s 2.1 million ambulatory patient visits represent about 19% of tri-county OP market share. Our four major competitors currently hold 10.5-17.5% of IP market share in the tri-county area, with the remaining 24% split among several independent providers. HAP’s state-wide market share is 22.4% for HMO products and 5.4% for commercial products. CCS’s Home Health Care (HHC) is Michigan’s largest home health provider. Because of its di-verse array of services, CCS has many different state and local competitors.
P.2a(2) Competitiveness Changes. The SEM economy, na-tional health care reform, and the entrance of for-profit owner-ship are key competitive changes that create challenges and opportunities for HFHS. With our “can-do spirit” and using our CCs, we are leveraging partnerships (1.2c, 5.1a(2)) and maintaining focus on our SOs to drive differentiation and sus-tainable success.
P.2a(3) Comparative Data. HFHS uses comparative and competitive data sources common to the industry and aligned with the pillars (Fig. P.2-2). People: AMGA, CDC, Gallup, Gantz-Wiley, HRIC, Saratoga; Service: CAHPS, HCAHPS, JD Power, NRC, Press Ganey (PG); Quality & Safety:
AHRQ, BCBS, CMS, Crimson, EDS, FCR, HCAB, HE-DIS, IHI, MHA, MIOSHA, NDNQI, NHSN, TJC; Growth: AMGA, MHA, MIDB, Premier, SEM Data Exchange; Re-search & Education: ACGME, NIH; Community: Gover-nance Institute, MDCH website; Finance: Moody’s, Premier, S&P, competitor financials. In addition, many departments compare results to outcome and process data shared within their industry segment or published by relevant professional organizations. Key limitations include limited availability of relevant benchmarks for large, integrated health systems; lack of standard definitions and databases for many clinical mea-sures; and long delays in data availability, with many key re-porting sources lagging by 3 to 18 months.
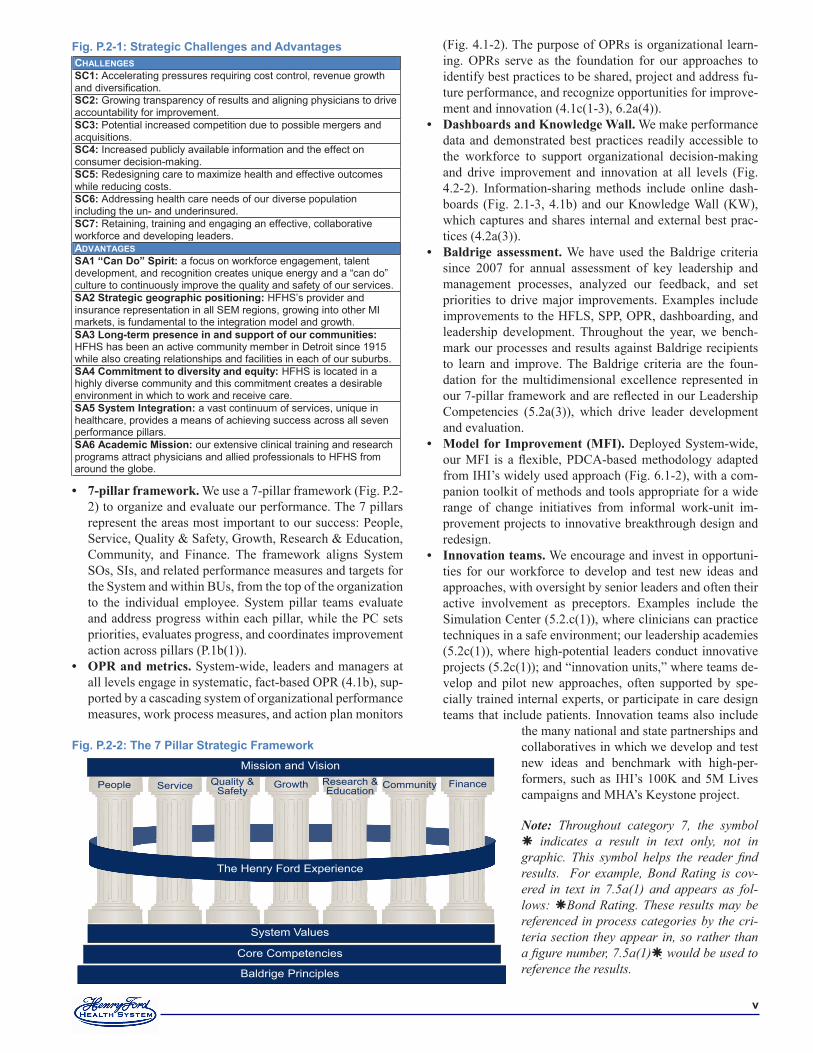
P.2b Strategic Context. Fig. P.2-1 outlines our strategic chal-lenges and advantages.
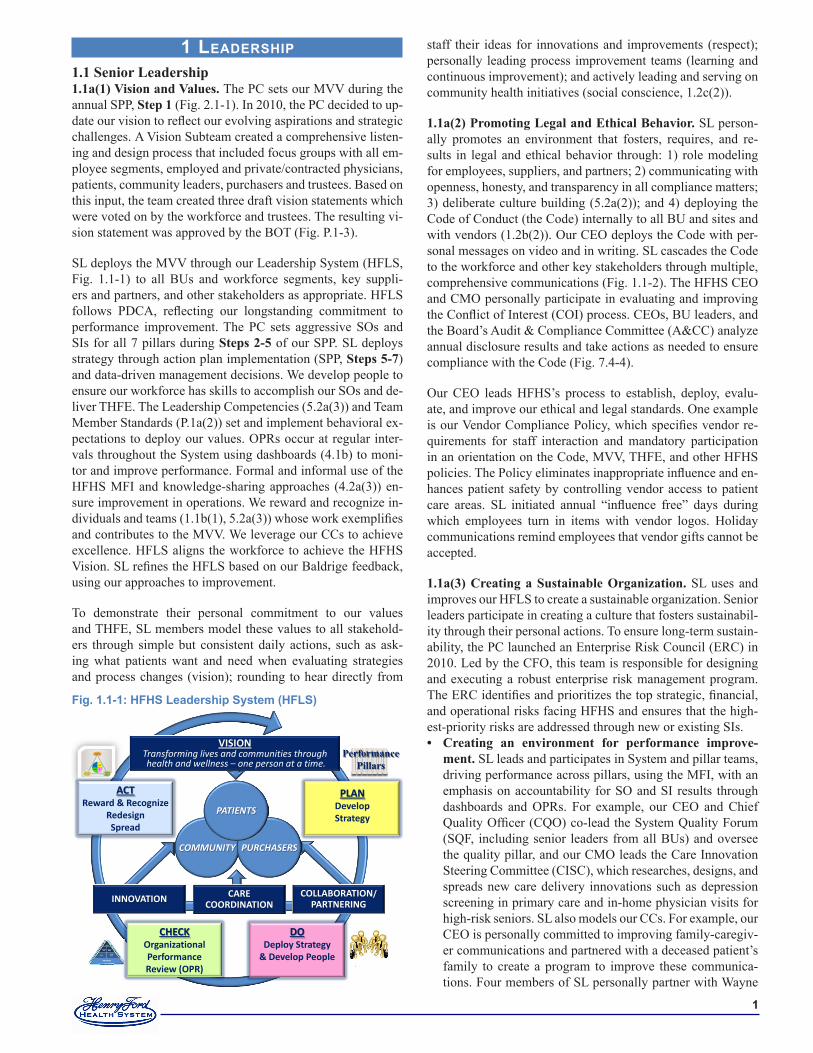
P.2c Performance Improvement System. Through the Henry Ford Leadership System (HFLS, Fig. 1.1-1), our leaders set the direction for performance excellence and model how to achieve it. They set visionary goals, with bold performance targets; communicate expectations and engage the workforce; monitor performance and analyze results to learn; recognize and reward high performance; and take action to drive improvement and spread best practices. A focus on excellence, learning, and in-novation is embedded in our culture and continually reinforced through systematic approaches that are integrated into our HFLS and comprise the key elements of our PI system.
F�g. P.1-8: Suppl�ers, Partners, Collaborators, & RolesREPRESENTATIVE TYPES ROLE IN DELIVERY OF
SERVICES & SUPPORT ROLE IN INNOVATION RELATIONSHIP & COMMUNICATION MECHANISMS
SUPPLIERS Major suppl�ers (e.g., Aramark for food services)
Deliver essential services outside scope of HFHS’s business expertise New products/services,
expertise in their business area
Contracting process, electronic data exchange Quarterly meetings with key suppliers where they report against quality, cost & customer satisfaction metrics Vendor orientation/educational meetings HFHS participation on suppliers’ Boards/Committees Participation in strategic planning
Local & m�nor�ty (d�verse) suppl�ers
Deliver products & services while enabling HFHS to contribute to regional economy, support diversity
PARTNERS Cont�nuum of Care Commun�ty partners (e.g., CHASS clinics, two federally qualified health centers, 1.2c(2))
Partner on delivery strategies, methods, locations for primary care services, wellness, housing
Unique approaches for delivering higher-quality, lower-cost care within the community
Participation on leadership & quality improvement teams Representation on advisory boards & board committees Participation in strategic planning Participation in joint task forces HFMG faculty appointments Joint research programs
Strateg�cally sourced vendors (e.g., Siemens, 4.2b(1))
Provide on-site staff, support 24/7 availability of clinical technology & information systems, assist with design & improvement of clinical technologies
Expertise & leading-edge technology
Research & Educat�on Educat�onal �nst�tut�ons (e.g., WSU, 1.2c(1))
Provide physicians in training; HFH serves as clinical campus
Ideas, expertise, cutting-edge technology used in breakthrough ways
Health Plan Employer-purchasers (e.g., Detroit automakers, 6.1b(2))
Partner on delivery strategies, methods, locations for beneficiaries
Ideas, funding, & strategic oversight for methods to improve access & convenience, lower cost
COLLABORATORS Cont�nuum of Care Health care coal�t�ons (e.g., IHI, MHA, 6.2a(4))
Participate in process & quality improvement
Expertise, knowledge of stakeholders HFHS participation in collaborators’
boards/committees HFHS participation in quality improvement efforts Collaborators’ participation in HFHS quality/process improvement activities
Pat�ents (e.g., patient advisory councils, 3.1a(1), 3.2a(1))
Provide input, serve on teams
Health Plan Employer-purchasers (e.g., Detroit automakers)
Collaborate to ensure affordable, effective care for their workforce
v
7-pillar framework. We use a 7-pillar framework (Fig. P.2-2) to organize and evaluate our performance. The 7 pillars represent the areas most important to our success: People, Service, Quality & Safety, Growth, Research & Education, Community, and Finance. The framework aligns System SOs, SIs, and related performance measures and targets for the System and within BUs, from the top of the organization to the individual employee. System pillar teams evaluate and address progress within each pillar, while the PC sets priorities, evaluates progress, and coordinates improvement action across pillars (P.1b(1)).OPR and metrics. System-wide, leaders and managers at all levels engage in systematic, fact-based OPR (4.1b), sup-ported by a cascading system of organizational performance measures, work process measures, and action plan monitors
•
•
(Fig. 4.1-2). The purpose of OPRs is organizational learn-ing. OPRs serve as the foundation for our approaches to identify best practices to be shared, project and address fu-ture performance, and recognize opportunities for improve-ment and innovation (4.1c(1-3), 6.2a(4)). Dashboards and Knowledge Wall. We make performance data and demonstrated best practices readily accessible to the workforce to support organizational decision-making and drive improvement and innovation at all levels (Fig. 4.2-2). Information-sharing methods include online dash-boards (Fig. 2.1-3, 4.1b) and our Knowledge Wall (KW), which captures and shares internal and external best prac-tices (4.2a(3)). Baldrige assessment. We have used the Baldrige criteria since 2007 for annual assessment of key leadership and management processes, analyzed our feedback, and set priorities to drive major improvements. Examples include improvements to the HFLS, SPP, OPR, dashboarding, and leadership development. Throughout the year, we bench-mark our processes and results against Baldrige recipients to learn and improve. The Baldrige criteria are the foun-dation for the multidimensional excellence represented in our 7-pillar framework and are reflected in our Leadership Competencies (5.2a(3)), which drive leader development and evaluation. Model for Improvement (MFI). Deployed System-wide, our MFI is a flexible, PDCA-based methodology adapted from IHI’s widely used approach (Fig. 6.1-2), with a com-panion toolkit of methods and tools appropriate for a wide range of change initiatives from informal work-unit im-provement projects to innovative breakthrough design and redesign. Innovation teams. We encourage and invest in opportuni-ties for our workforce to develop and test new ideas and approaches, with oversight by senior leaders and often their active involvement as preceptors. Examples include the Simulation Center (5.2.c(1)), where clinicians can practice techniques in a safe environment; our leadership academies (5.2c(1)), where high-potential leaders conduct innovative projects (5.2c(1)); and “innovation units,” where teams de-velop and pilot new approaches, often supported by spe-cially trained internal experts, or participate in care design teams that include patients. Innovation teams also include
the many national and state partnerships and collaboratives in which we develop and test new ideas and benchmark with high-per-formers, such as IHI’s 100K and 5M Lives campaigns and MHA’s Keystone project.
Note: Throughout category 7, the symbol indicates a result in text only, not in graphic. This symbol helps the reader find results. For example, Bond Rating is cov-ered in text in 7.5a(1) and appears as fol-lows: Bond Rating. These results may be referenced in process categories by the cri-teria section they appear in, so rather than a figure number, 7.5a(1) would be used to reference the results.
•
•
•
•
F�g. P.2-2: The 7 P�llar Strateg�c Framework
Baldrige Principles
Core Competencies
Mission and Vision
People Service Quality & Safety
Growth Research & Education Community Finance
The Henry Ford Experience
System Values
F�g. P.2-1: Strateg�c Challenges and AdvantagesCHALLENGES SC1: Accelerating pressures requiring cost control, revenue growth and diversification. SC2: Growing transparency of results and aligning physicians to drive accountability for improvement. SC3: Potential increased competition due to possible mergers and acquisitions. SC4: Increased publicly available information and the effect on consumer decision-making. SC5: Redesigning care to maximize health and effective outcomes while reducing costs. SC6: Addressing health care needs of our diverse population including the un- and underinsured. SC7: Retaining, training and engaging an effective, collaborative workforce and developing leaders. ADVANTAGES SA1 “Can Do” Spirit: a focus on workforce engagement, talent development, and recognition creates unique energy and a “can do” culture to continuously improve the quality and safety of our services. SA2 Strateg�c geograph�c pos�t�on�ng: HFHS’s provider and insurance representation in all SEM regions, growing into other MI markets, is fundamental to the integration model and growth. SA3 Long-term presence �n and support of our commun�t�es: HFHS has been an active community member in Detroit since 1915 while also creating relationships and facilities in each of our suburbs. SA4 Comm�tment to d�vers�ty and equ�ty: HFHS is located in a highly diverse community and this commitment creates a desirable environment in which to work and receive care. SA5 System Integrat�on: a vast continuum of services, unique in healthcare, provides a means of achieving success across all seven performance pillars. SA6 Academ�c M�ss�on: our extensive clinical training and research programs attract physicians and allied professionals to HFHS from around the globe.
�
1 Leadership
1.1 Senior Leadership1.1a(1) Vision and Values. The PC sets our MVV during the annual SPP, Step 1 (Fig. 2.1-1). In 2010, the PC decided to up-date our vision to reflect our evolving aspirations and strategic challenges. A Vision Subteam created a comprehensive listen-ing and design process that included focus groups with all em-ployee segments, employed and private/contracted physicians, patients, community leaders, purchasers and trustees. Based on this input, the team created three draft vision statements which were voted on by the workforce and trustees. The resulting vi-sion statement was approved by the BOT (Fig. P.1-3).
SL deploys the MVV through our Leadership System (HFLS, Fig. 1.1-1) to all BUs and workforce segments, key suppli-ers and partners, and other stakeholders as appropriate. HFLS follows PDCA, reflecting our longstanding commitment to performance improvement. The PC sets aggressive SOs and SIs for all 7 pillars during Steps 2-5 of our SPP. SL deploys strategy through action plan implementation (SPP, Steps 5-7) and data-driven management decisions. We develop people to ensure our workforce has skills to accomplish our SOs and de-liver THFE. The Leadership Competencies (5.2a(3)) and Team Member Standards (P.1a(2)) set and implement behavioral ex-pectations to deploy our values. OPRs occur at regular inter-vals throughout the System using dashboards (4.1b) to moni-tor and improve performance. Formal and informal use of the HFHS MFI and knowledge-sharing approaches (4.2a(3)) en-sure improvement in operations. We reward and recognize in-dividuals and teams (1.1b(1), 5.2a(3)) whose work exemplifies and contributes to the MVV. We leverage our CCs to achieve excellence. HFLS aligns the workforce to achieve the HFHS Vision. SL refines the HFLS based on our Baldrige feedback, using our approaches to improvement.
To demonstrate their personal commitment to our values and THFE, SL members model these values to all stakehold-ers through simple but consistent daily actions, such as ask-ing what patients want and need when evaluating strategies and process changes (vision); rounding to hear directly from
staff their ideas for innovations and improvements (respect); personally leading process improvement teams (learning and continuous improvement); and actively leading and serving on community health initiatives (social conscience, 1.2c(2)).
1.1a(2) Promoting Legal and Ethical Behavior. SL person-ally promotes an environment that fosters, requires, and re-sults in legal and ethical behavior through: 1) role modeling for employees, suppliers, and partners; 2) communicating with openness, honesty, and transparency in all compliance matters; 3) deliberate culture building (5.2a(2)); and 4) deploying the Code of Conduct (the Code) internally to all BU and sites and with vendors (1.2b(2)). Our CEO deploys the Code with per-sonal messages on video and in writing. SL cascades the Code to the workforce and other key stakeholders through multiple, comprehensive communications (Fig. 1.1-2). The HFHS CEO and CMO personally participate in evaluating and improving the Conflict of Interest (COI) process. CEOs, BU leaders, and the Board’s Audit & Compliance Committee (A&CC) analyze annual disclosure results and take actions as needed to ensure compliance with the Code (Fig. 7.4-4).
Our CEO leads HFHS’s process to establish, deploy, evalu-ate, and improve our ethical and legal standards. One example is our Vendor Compliance Policy, which specifies vendor re-quirements for staff interaction and mandatory participation in an orientation on the Code, MVV, THFE, and other HFHS policies. The Policy eliminates inappropriate influence and en-hances patient safety by controlling vendor access to patient care areas. SL initiated annual “influence free” days during which employees turn in items with vendor logos. Holiday communications remind employees that vendor gifts cannot be accepted.
1.1a(3) Creating a Sustainable Organization. SL uses and improves our HFLS to create a sustainable organization. Senior leaders participate in creating a culture that fosters sustainabil-ity through their personal actions. To ensure long-term sustain-ability, the PC launched an Enterprise Risk Council (ERC) in 2010. Led by the CFO, this team is responsible for designing and executing a robust enterprise risk management program. The ERC identifies and prioritizes the top strategic, financial, and operational risks facing HFHS and ensures that the high-est-priority risks are addressed through new or existing SIs.
Creating an environment for performance improve-ment. SL leads and participates in System and pillar teams, driving performance across pillars, using the MFI, with an emphasis on accountability for SO and SI results through dashboards and OPRs. For example, our CEO and Chief Quality Officer (CQO) co-lead the System Quality Forum (SQF, including senior leaders from all BUs) and oversee the quality pillar, and our CMO leads the Care Innovation Steering Committee (CISC), which researches, designs, and spreads new care delivery innovations such as depression screening in primary care and in-home physician visits for high-risk seniors. SL also models our CCs. For example, our CEO is personally committed to improving family-caregiv-er communications and partnered with a deceased patient’s family to create a program to improve these communica-tions. Four members of SL personally partner with Wayne
•Performance
Pillars
PLANDevelop Strategy
DODeploy Strategy
& Develop People
ACTReward & Recognize
Redesign Spread
INNOVATION CARECOORDINATION
COLLABORATION/PARTNERING
COMMUNITY PURCHASERS
PATIENTS
VISIONTransforming lives and communities throughhealth and wellness – one person at a time.
CHECKOrganizational Performance Review (OPR)
Fig. �.�-�: HFHS Leadership System (HFLS)
�
State University (WSU) on an Innovation Institute. At our newest hospital HFWBH, we built a demonstration kitchen to engage our community in cooking and eating healthier. To ensure performance leadership, SL volunteers to lead na-tional, state, and local initiatives to create innovations. This practice allows early adoption of practices, personal leader-ship skill development, and reinforces our CCs. SL ensures agility by exercising their personal skills for customer lis-tening, improvement and innovation. For example, the CCS CEO visits our pharmacy partners, interviews customers about their service experience, and uses this information in CCS efforts to improve patient experiences (Fig. 7.2-14). Workforce culture. SL regularly rounds on all shifts at hos-pitals and OP sites to gather feedback from front-line staff. SL demonstrates its commitment by taking prompt action on issues and by providing two-way communication, such as e-Nancy, for all workforce segments. SL demonstrates the importance of service by: framing, modeling and teach-ing THFE; hiring service experts outside health care (the HFWBH hospital CEO and HFHS VP of service are former Ritz Carlton executives); driving rigor around review and improvement of patient evaluations and measures; patient rounding; personal interactions with patients and families; and patient and community involvement in process design teams and HFHS boards and committees.Organizational and workforce learning. SL models the importance of personal and organizational learning. They receive the first training for high priority SIs and partici-pate in teaching others. SL actively participates in learning organizations, such as the IHI, Sg2, AMGA, the Six Clinic Group, and Healthcare Advisory Board (HCAB). SL leads and participates in organizational learning from OPRs at PC, pillar teams, and BU teams, and oversees cascading OPRs throughout the organization.Enhance SL leadership skills. SL participates in numer-ous developmental opportunities including membership in professional organizations and think tanks, hosting of and attendance at national symposiums and events featuring ex-perts inside and outside health care, and visits with compa-nies recognized for best practices. SL personally leads the Baldrige process, and several are trained examiners.Succession planning, leader development. We have sys-tematic approaches to succession planning and leader de-velopment (5.2c(1), 5.2c(3)). The succession planning pro-cess begins with SL identifying individual successors for the top 13 leaders in three categories: ready now, ready in two years, and ready within five years. Identified high-po-tential leaders work with the Chief Human Resource Offi-cer (CHRO) to create individual development plans (IDPs) to assist them in reaching the next level. SL selects an ad-ditional talent pool of 50 individuals who participate in the Advanced Leadership Academy (ALA) to prepare for other leadership positions. PC members discuss progress and de-velopment of potential successors during annual SL Talent Review sessions (Fig. 5.2-2). SL also participates in staff development and identifies potential leaders to participate in learning programs. SL conducts training, teaching many sessions at our leadership academies and HFHS University courses (HFHSU, 5.2c(1)).
•
•
•
•
Patient safety culture. Our BOT has defined harm reduc-tion as the System’s top priority. AHRQ research suggests only 44% of patient harm is actually avoidable, yet our No Harm Campaign (6.1b(2)) aims for an aggressive 50% re-duction from 2008 to 2013. Creating a culture of safety is the first of four elements in this critical SI. SL sets specific culture of safety goals during the annual SPP, and oversees comprehensive patient safety education and communica-tion for all staff. The Culture of Safety action plan includes promoting and measuring employees’ willingness to speak up about actual or potential safety problems. To accelerate improvement, SL initiated The Speak Up, Speak Out pro-gram. SL personally participates in sentinel event analyses, risk trend reviews, and emerging patient safety regulation and industry trends research to maintain performance lead-ership. SL members hold board and committee leadership positions for the MHA’s Patient Safety Organization and Quality & Accountability Committee, Advisory Commit-tees of The Joint Commission (TJC), and other patient safety organizations.
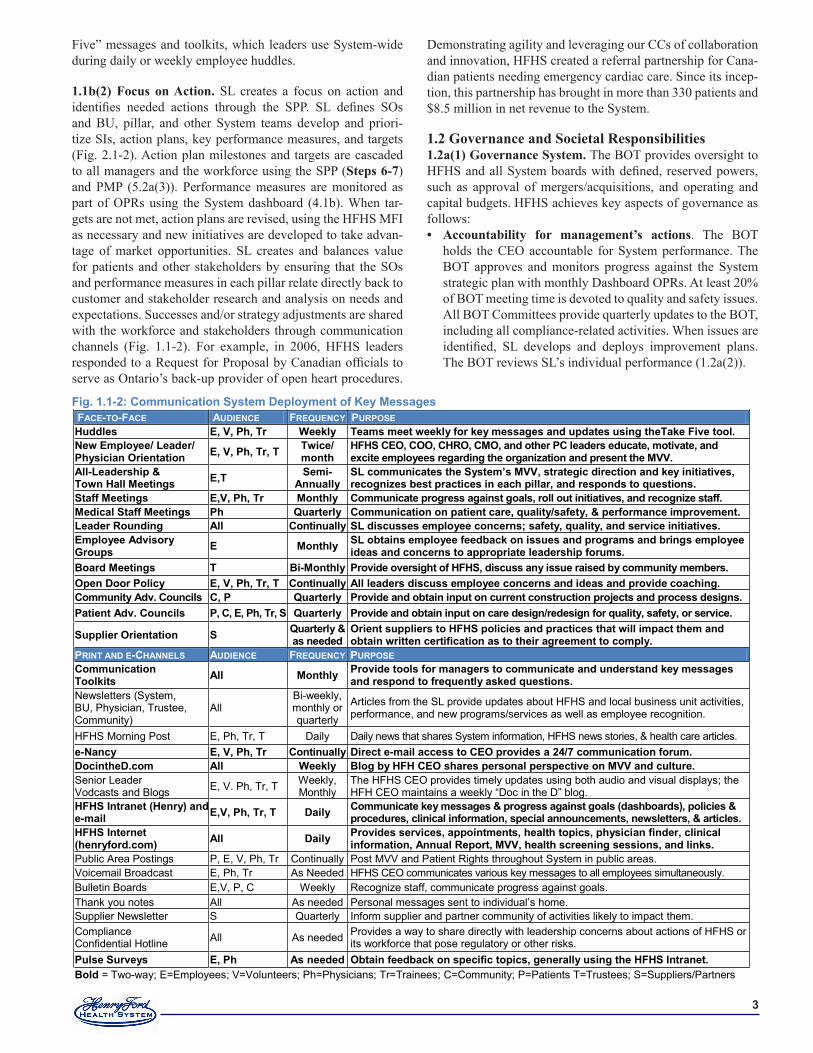
1.1b(1) Communication. To communicate with and engage the entire workforce, the CEO meets with the System Commu-nications (SC) team monthly to evaluate, design and improve communication and engagement approaches of the HFHS Communication System (Fig. 1.1-2) to ensure:
Two-way exchange. SL uses comprehensive tactics such as face-to-face, print and email communication, as well as social media such as vodcasts and blogs, to encourage frank exchange throughout the organization.Key decisions. SL communicates key decisions and re-inforces the MVV, SOs, SIs, performance measures, and achievements and recognition. SL embeds communication in the action plans of every SI. To ensure integrated de-ployment, the SC team uses a Communicators’ Roundtable comprised of BU chief communication officers to plan and execute communications. Consistent messages are integrat-ed into communications to all key workforce segments in all BUs. SL engages the entire workforce in the deployment of Health Engagement (5.1b(1)); messaging was developed and tested through the HFHS MFI and then rolled out to employees. Role in recognition. Leadership Competencies (1.2a(2)) and the annual Performance Management Process (PMP, 5.2a(3)) set the expectation for routine recognition of em-ployees, as measured by the Employee Engagement Survey and leader 360° feedback. SL and all leaders recognize em-ployees through methods ranging from personal thank-you notes to award presentations honoring employees and teams. Every BU has recognition programs to reward teams or in-dividuals for behaviors that support the MVV and THFE. SL honors top performers with “Focus on People” awards presented at the annual BOT caucus. Quarterly, SL recog-nizes role model managers nominated by their employees with the “Shadow of the Leader” award.
We evaluate and improve SC annually. For example, when the 2008 evaluation identified the need to improve the effective-ness of sharing HFHS messages, SL led development of “Take
•
•
•
•
�
Five” messages and toolkits, which leaders use System-wide during daily or weekly employee huddles.
1.1b(2) Focus on Action. SL creates a focus on action and identifies needed actions through the SPP. SL defines SOs and BU, pillar, and other System teams develop and priori-tize SIs, action plans, key performance measures, and targets (Fig. 2.1-2). Action plan milestones and targets are cascaded to all managers and the workforce using the SPP (Steps 6-7) and PMP (5.2a(3)). Performance measures are monitored as part of OPRs using the System dashboard (4.1b). When tar-gets are not met, action plans are revised, using the HFHS MFI as necessary and new initiatives are developed to take advan-tage of market opportunities. SL creates and balances value for patients and other stakeholders by ensuring that the SOs and performance measures in each pillar relate directly back to customer and stakeholder research and analysis on needs and expectations. Successes and/or strategy adjustments are shared with the workforce and stakeholders through communication channels (Fig. 1.1-2). For example, in 2006, HFHS leaders responded to a Request for Proposal by Canadian officials to serve as Ontario’s back-up provider of open heart procedures.
Demonstrating agility and leveraging our CCs of collaboration and innovation, HFHS created a referral partnership for Cana-dian patients needing emergency cardiac care. Since its incep-tion, this partnership has brought in more than 330 patients and $8.5 million in net revenue to the System.
1.2 Governance and Societal Responsibilities1.2a(1) Governance System. The BOT provides oversight to HFHS and all System boards with defined, reserved powers, such as approval of mergers/acquisitions, and operating and capital budgets. HFHS achieves key aspects of governance as follows:
Accountability for management’s actions. The BOT holds the CEO accountable for System performance. The BOT approves and monitors progress against the System strategic plan with monthly Dashboard OPRs. At least 20% of BOT meeting time is devoted to quality and safety issues. All BOT Committees provide quarterly updates to the BOT, including all compliance-related activities. When issues are identified, SL develops and deploys improvement plans. The BOT reviews SL’s individual performance (1.2a(2)).
•
Fig. �.�-�: Communication System Deployment of Key MessagesFACE-TO-FACE AUDIENCE FREQUENCY PURPOSE Huddles E, V, Ph, Tr Weekly Teams meet weekly for key messages and updates using theTake Five tool. New Employee/ Leader/ Physician Orientation E, V, Ph, Tr, T Twice/
month HFHS CEO, COO, CHRO, CMO, and other PC leaders educate, motivate, and excite employees regarding the organization and present the MVV.
All-Leadership & Town Hall Meetings E,T Semi-
Annually SL communicates the System’s MVV, strategic direction and key initiatives, recognizes best practices in each pillar, and responds to questions.
Staff Meetings E,V, Ph, Tr Monthly Communicate progress against goals, roll out initiatives, and recognize staff. Medical Staff Meetings Ph Quarterly Communication on patient care, quality/safety, & performance improvement. Leader Rounding All Continually SL discusses employee concerns; safety, quality, and service initiatives. Employee Advisory Groups E Monthly SL obtains employee feedback on issues and programs and brings employee
ideas and concerns to appropriate leadership forums. Board Meetings T Bi-Monthly Provide oversight of HFHS, discuss any issue raised by community members. Open Door Policy E, V, Ph, Tr, T Continually All leaders discuss employee concerns and ideas and provide coaching. Community Adv. Councils C, P Quarterly Provide and obtain input on current construction projects and process designs. Patient Adv. Councils P, C, E, Ph, Tr, S Quarterly Provide and obtain input on care design/redesign for quality, safety, or service.
Supplier Orientation S Quarterly & as needed
Orient suppliers to HFHS policies and practices that will impact them and obtain written certification as to their agreement to comply.
PRINT AND E-CHANNELS AUDIENCE FREQUENCY PURPOSE Communication Toolkits All Monthly Provide tools for managers to communicate and understand key messages
and respond to frequently asked questions. Newsletters (System, BU, Physician, Trustee, Community)
All Bi-weekly, monthly or quarterly
Articles from the SL provide updates about HFHS and local business unit activities, performance, and new programs/services as well as employee recognition.
HFHS Morning Post E, Ph, Tr, T Daily Daily news that shares System information, HFHS news stories, & health care articles. e-Nancy E, V, Ph, Tr Continually Direct e-mail access to CEO provides a ��/� communication forum. DocintheD.com All Weekly Blog by HFH CEO shares personal perspective on MVV and culture. Senior Leader Vodcasts and Blogs E, V. Ph, Tr, T Weekly,
Monthly The HFHS CEO provides timely updates using both audio and visual displays; the HFH CEO maintains a weekly “Doc in the D” blog.
HFHS Intranet (Henry) and e-mail E,V, Ph, Tr, T Daily Communicate key messages & progress against goals (dashboards), policies &
procedures, clinical information, special announcements, newsletters, & articles. HFHS Internet (henryford.com) All Daily Provides services, appointments, health topics, physician finder, clinical
information, Annual Report, MVV, health screening sessions, and links. Public Area Postings P, E, V, Ph, Tr Continually Post MVV and Patient Rights throughout System in public areas. Voicemail Broadcast E, Ph, Tr As Needed HFHS CEO communicates various key messages to all employees simultaneously. Bulletin Boards E,V, P, C Weekly Recognize staff, communicate progress against goals. Thank you notes All As needed Personal messages sent to individual’s home. Supplier Newsletter S Quarterly Inform supplier and partner community of activities likely to impact them. Compliance Confidential Hotline All As needed Provides a way to share directly with leadership concerns about actions of HFHS or
its workforce that pose regulatory or other risks. Pulse Surveys E, Ph As needed Obtain feedback on specific topics, generally using the HFHS Intranet. Bold = Two-way; E=Employees; V=Volunteers; Ph=Physicians; Tr=Trainees; C=Community; P=Patients T=Trustees; S=Suppliers/Partners
�
Fiscal accountability. The Finance, A&CC, Investment, and Compensation Committees review plans, budgets, and status of operations, investments, and compensation. These Committee Chairs regularly update the BOT. Transparency in operations. All governance meetings in-clude a full status report by pillar and Dashboard review. Trustees receive regular communications with System ac-tivities, market and competitive information, and health care environment news. The BOT actively participates in the SPP. Federal tax filings, SL compensation, and commu-nity benefit information are shared with the BOT annually. The COI Policy requires all trustees to sign a statement re-garding potential business or personal conflicts (Fig. 7.4-4), and the BOT A&CC and Executive Committees address any material disclosures. Independence of internal and external audits. The VP of Audit & Compliance reports to A&CC for all strategic matters and to the HFHS President and COO for daily op-erations. He meets regularly with the A&CC in executive sessions, and the A&CC Chair meets with A&C staff an-nually. A&CC appoints external auditors who conduct an-nual independent audits. A&CC receives all external audit reports. Protection of stakeholder interests. Stakeholder repre-sentation on boards, the Code, and our Just Culture set the foundation for protecting all stakeholder interests. The BOT Nominating & Governance Committee reviews the com-position of all boards to ensure members possess required skill sets and reflect each BU’s community, culture, and de-mographics. The BOT Public Responsibility & Advocacy Committee provides stakeholder representation.
1.2a(2) Performance Evaluation. HFHS formally evaluates and improves SL effectiveness as individuals and as a team. All employees are evaluated based on the Team Member Stan-dards, and HFHS leaders are evaluated based on the Leader-ship Competencies, which use the Baldrige categories to frame HFHS leadership expectations (5.2a(3)). The BOT reviews the HFHS CEO annually based on her behaviors, Leadership Competencies, PMP goal results, and qualitative feedback from key stakeholders. PMP goals are linked to the pillars and incor-porate HFHS’ performance and comparisons to data on simi-larly sized non-profit and for-profit health care organizations. SL members, including physicians, are evaluated by their di-rect supervisor using the PMP. Each receives formal mid-year and annual reviews, including review of 360° feedback and performance on the competencies, BU or departmental goals, and individual goals. Compensation is set based on these re-views, the scope of the individual’s roles and responsibilities, and independent market data, which is reviewed and approved by the BOT Compensation Committee. Senior leaders use their reviews to establish individual IDPs for the coming year. The combined review results are analyzed to assess effectiveness of our HFLS and identify needed improvements. One example is addition of courses for all leaders on setting specific, measur-able, attainable, relevant, time-bound (SMART) goals.
The BOT and all boards complete a biennial self-evaluation. They use Governance Institute data for comparison and cre-ate work plans to improve the lowest scoring elements (Fig.
•
•
•
•
7.4-3). This evaluation resulted in 2006 governance restruc-turing, including streamlining membership, formal charges for key committees, and agenda planning meetings to ensure more trustee input. The BOT Nominating and Governance Com-mittee incorporates reviews of each BOT member during the annual nominating process. All Quality Committee members and new trustees receive an educational DVD on their role in quality and patient safety; in 2011 this and other educational programs are being expanded to all Boards and committees members based on favorable BOT feedback. Our approach to BOT education is recognized by IHI as a best practice in health care.
1.2b(1) Legal Behavior, Regulatory Behavior, and Accredi-tation. HFHS proactively identifies, assesses and addresses po-tential/perceived adverse societal, legal, regulatory and environ-mental impacts from its services and operations (Fig. 1.2-1):
HFHS has an integrated compliance structure across all BUs to address issues related to legal and regulatory re-quirements. The VP of A&C serves as the Chief Compli-ance Officer and leads the HFHS Compliance Committee, which meets monthly and consists of BU Compliance leads and other subject matter experts. Each BU has its own Com-pliance Team with dual reporting to the BU CEO and the VP of A&C. Annually, the Committee conducts risk assess-ments and develops integrated work plans in the areas of greatest potential risk, providing key input to the ERC. The committee reports quarterly to the A&CC and annually to the BOT. The Committee designs, oversees delivery of, and evaluates workforce Compliance education (all key seg-ments, BUs); updates the Code; and oversees the indepen-dent, anonymous Compliance hotline and whistleblower protection policies.Quality & Safety teams operate at each BU, monitoring all activities with the potential for having an adverse impact on patient care. This includes risks associated with equipment, new services, or operational changes. Incidents with the potential for patient litigation are identified and monitored jointly with a centralized risk management team. This team monitors trends in regulations and ensures the workforce is appropriately educated, advising HFHSU on required con-tent for annual mandatory education.Research Administration and the Institutional Review Board (IRB) and Institutional Animal Rights Committee oversee potential risks from research. Research Adminis-tration oversees all research projects and the integration of evidence-based research into patient care protocols. The IRB reviews all research protocols involving human sub-jects, ensuring that research is not impacted by conflicts of interest and that all relative risks and potential concerns are reflected in participant consent agreements.HFHS incorporates the voice of the customer into design of new and ongoing services and operations. The BOT membership ensures that key stakeholders are represented in the governance function of every BU. HFHS conducts bi-annual community health needs assessments (CHNAs) to identify the most critical needs and ensure community benefit initiatives address these areas. Supply Chain Man-agement proactively considers the impact of services and supplies on society.
•
•
•
•
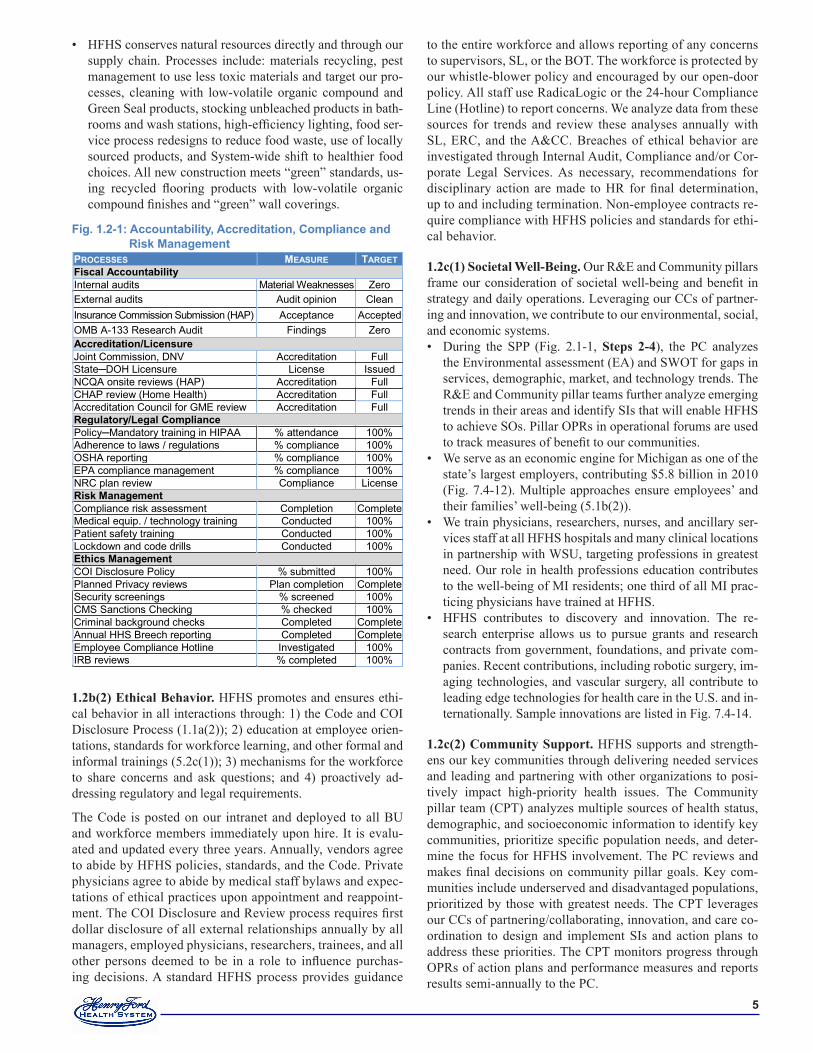
�
HFHS conserves natural resources directly and through our supply chain. Processes include: materials recycling, pest management to use less toxic materials and target our pro-cesses, cleaning with low-volatile organic compound and Green Seal products, stocking unbleached products in bath-rooms and wash stations, high-efficiency lighting, food ser-vice process redesigns to reduce food waste, use of locally sourced products, and System-wide shift to healthier food choices. All new construction meets “green” standards, us-ing recycled flooring products with low-volatile organic compound finishes and “green” wall coverings.
1.2b(2) Ethical Behavior. HFHS promotes and ensures ethi-cal behavior in all interactions through: 1) the Code and COI Disclosure Process (1.1a(2)); 2) education at employee orien-tations, standards for workforce learning, and other formal and informal trainings (5.2c(1)); 3) mechanisms for the workforce to share concerns and ask questions; and 4) proactively ad-dressing regulatory and legal requirements.
The Code is posted on our intranet and deployed to all BU and workforce members immediately upon hire. It is evalu-ated and updated every three years. Annually, vendors agree to abide by HFHS policies, standards, and the Code. Private physicians agree to abide by medical staff bylaws and expec-tations of ethical practices upon appointment and reappoint-ment. The COI Disclosure and Review process requires first dollar disclosure of all external relationships annually by all managers, employed physicians, researchers, trainees, and all other persons deemed to be in a role to influence purchas-ing decisions. A standard HFHS process provides guidance
• to the entire workforce and allows reporting of any concerns to supervisors, SL, or the BOT. The workforce is protected by our whistle-blower policy and encouraged by our open-door policy. All staff use RadicaLogic or the 24-hour Compliance Line (Hotline) to report concerns. We analyze data from these sources for trends and review these analyses annually with SL, ERC, and the A&CC. Breaches of ethical behavior are investigated through Internal Audit, Compliance and/or Cor-porate Legal Services. As necessary, recommendations for disciplinary action are made to HR for final determination, up to and including termination. Non-employee contracts re-quire compliance with HFHS policies and standards for ethi-cal behavior.
1.2c(1) Societal Well-Being. Our R&E and Community pillars frame our consideration of societal well-being and benefit in strategy and daily operations. Leveraging our CCs of partner-ing and innovation, we contribute to our environmental, social, and economic systems.
During the SPP (Fig. 2.1-1, Steps 2-4), the PC analyzes the Environmental assessment (EA) and SWOT for gaps in services, demographic, market, and technology trends. The R&E and Community pillar teams further analyze emerging trends in their areas and identify SIs that will enable HFHS to achieve SOs. Pillar OPRs in operational forums are used to track measures of benefit to our communities. We serve as an economic engine for Michigan as one of the state’s largest employers, contributing $5.8 billion in 2010 (Fig. 7.4-12). Multiple approaches ensure employees’ and their families’ well-being (5.1b(2)). We train physicians, researchers, nurses, and ancillary ser-vices staff at all HFHS hospitals and many clinical locations in partnership with WSU, targeting professions in greatest need. Our role in health professions education contributes to the well-being of MI residents; one third of all MI prac-ticing physicians have trained at HFHS.HFHS contributes to discovery and innovation. The re-search enterprise allows us to pursue grants and research contracts from government, foundations, and private com-panies. Recent contributions, including robotic surgery, im-aging technologies, and vascular surgery, all contribute to leading edge technologies for health care in the U.S. and in-ternationally. Sample innovations are listed in Fig. 7.4-14.
1.2c(2) Community Support. HFHS supports and strength-ens our key communities through delivering needed services and leading and partnering with other organizations to posi-tively impact high-priority health issues. The Community pillar team (CPT) analyzes multiple sources of health status, demographic, and socioeconomic information to identify key communities, prioritize specific population needs, and deter-mine the focus for HFHS involvement. The PC reviews and makes final decisions on community pillar goals. Key com-munities include underserved and disadvantaged populations, prioritized by those with greatest needs. The CPT leverages our CCs of partnering/collaborating, innovation, and care co-ordination to design and implement SIs and action plans to address these priorities. The CPT monitors progress through OPRs of action plans and performance measures and reports results semi-annually to the PC.
•
•
•
•
Fig. �.�-�: Accountability, Accreditation, Compliance and Risk Management
PROCESSES MEASURE TARGET Fiscal Accountability Internal audits Material Weaknesses Zero External audits Audit opinion Clean Insurance Commission Submission (HAP) Acceptance Accepted OMB A-133 Research Audit Findings Zero Accreditation/Licensure Joint Commission, DNV Accreditation Full State─DOH Licensure License Issued NCQA onsite reviews (HAP) Accreditation Full CHAP review (Home Health) Accreditation Full Accreditation Council for GME review Accreditation Full Regulatory/Legal Compliance Policy─Mandatory training in HIPAA % attendance 100% Adherence to laws / regulations % compliance 100% OSHA reporting % compliance 100% EPA compliance management % compliance 100% NRC plan review Compliance License Risk Management Compliance risk assessment Completion Complete Medical equip. / technology training Conducted 100% Patient safety training Conducted 100% Lockdown and code drills Conducted 100% Ethics Management COI Disclosure Policy % submitted 100% Planned Privacy reviews Plan completion Complete Security screenings % screened 100% CMS Sanctions Checking % checked 100% Criminal background checks Completed Complete Annual HHS Breech reporting Completed Complete Employee Compliance Hotline Investigated 100% IRB reviews % completed 100%
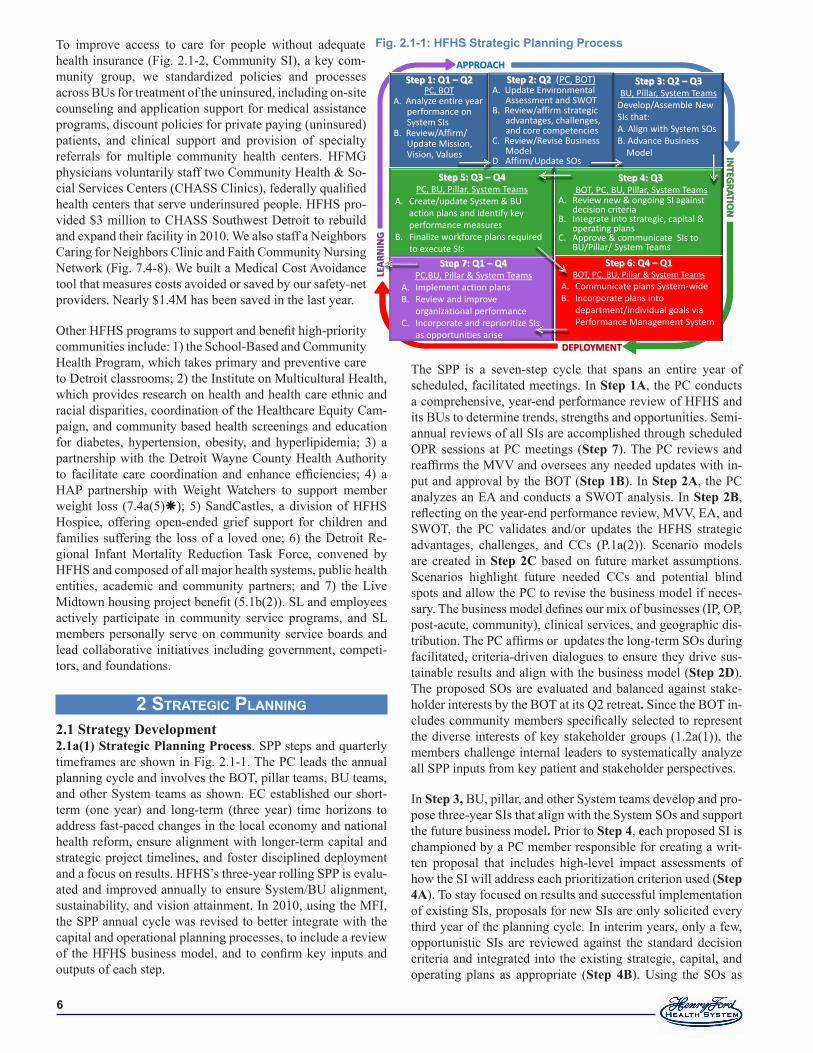
�
To improve access to care for people without adequate health insurance (Fig. 2.1-2, Community SI), a key com-munity group, we standardized policies and processes across BUs for treatment of the uninsured, including on-site counseling and application support for medical assistance programs, discount policies for private paying (uninsured) patients, and clinical support and provision of specialty referrals for multiple community health centers. HFMG physicians voluntarily staff two Community Health & So-cial Services Centers (CHASS Clinics), federally qualified health centers that serve underinsured people. HFHS pro-vided $3 million to CHASS Southwest Detroit to rebuild and expand their facility in 2010. We also staff a Neighbors Caring for Neighbors Clinic and Faith Community Nursing Network (Fig. 7.4-8). We built a Medical Cost Avoidance tool that measures costs avoided or saved by our safety-net providers. Nearly $1.4M has been saved in the last year.
Other HFHS programs to support and benefit high-priority communities include: 1) the School-Based and Community Health Program, which takes primary and preventive care to Detroit classrooms; 2) the Institute on Multicultural Health, which provides research on health and health care ethnic and racial disparities, coordination of the Healthcare Equity Cam-paign, and community based health screenings and education for diabetes, hypertension, obesity, and hyperlipidemia; 3) a partnership with the Detroit Wayne County Health Authority to facilitate care coordination and enhance efficiencies; 4) a HAP partnership with Weight Watchers to support member weight loss (7.4a(5)); 5) SandCastles, a division of HFHS Hospice, offering open-ended grief support for children and families suffering the loss of a loved one; 6) the Detroit Re-gional Infant Mortality Reduction Task Force, convened by HFHS and composed of all major health systems, public health entities, academic and community partners; and 7) the Live Midtown housing project benefit (5.1b(2)). SL and employees actively participate in community service programs, and SL members personally serve on community service boards and lead collaborative initiatives including government, competi-tors, and foundations.
2 strategic pLanning 2.1 Strategy Development2.1a(1) Strategic Planning Process. SPP steps and quarterly timeframes are shown in Fig. 2.1-1. The PC leads the annual planning cycle and involves the BOT, pillar teams, BU teams, and other System teams as shown. EC established our short-term (one year) and long-term (three year) time horizons to address fast-paced changes in the local economy and national health reform, ensure alignment with longer-term capital and strategic project timelines, and foster disciplined deployment and a focus on results. HFHS’s three-year rolling SPP is evalu-ated and improved annually to ensure System/BU alignment, sustainability, and vision attainment. In 2010, using the MFI, the SPP annual cycle was revised to better integrate with the capital and operational planning processes, to include a review of the HFHS business model, and to confirm key inputs and outputs of each step.
The SPP is a seven-step cycle that spans an entire year of scheduled, facilitated meetings. In Step 1A, the PC conducts a comprehensive, year-end performance review of HFHS and its BUs to determine trends, strengths and opportunities. Semi-annual reviews of all SIs are accomplished through scheduled OPR sessions at PC meetings (Step 7). The PC reviews and reaffirms the MVV and oversees any needed updates with in-put and approval by the BOT (Step 1B). In Step 2A, the PC analyzes an EA and conducts a SWOT analysis. In Step 2B, reflecting on the year-end performance review, MVV, EA, and SWOT, the PC validates and/or updates the HFHS strategic advantages, challenges, and CCs (P.1a(2)). Scenario models are created in Step 2C based on future market assumptions. Scenarios highlight future needed CCs and potential blind spots and allow the PC to revise the business model if neces-sary. The business model defines our mix of businesses (IP, OP, post-acute, community), clinical services, and geographic dis-tribution. The PC affirms or updates the long-term SOs during facilitated, criteria-driven dialogues to ensure they drive sus-tainable results and align with the business model (Step 2D). The proposed SOs are evaluated and balanced against stake-holder interests by the BOT at its Q2 retreat. Since the BOT in-cludes community members specifically selected to represent the diverse interests of key stakeholder groups (1.2a(1)), the members challenge internal leaders to systematically analyze all SPP inputs from key patient and stakeholder perspectives.
In Step 3, BU, pillar, and other System teams develop and pro-pose three-year SIs that align with the System SOs and support the future business model. Prior to Step 4, each proposed SI is championed by a PC member responsible for creating a writ-ten proposal that includes high-level impact assessments of how the SI will address each prioritization criterion used (Step 4A). To stay focused on results and successful implementation of existing SIs, proposals for new SIs are only solicited every third year of the planning cycle. In interim years, only a few, opportunistic SIs are reviewed against the standard decision criteria and integrated into the existing strategic, capital, and operating plans as appropriate (Step 4B). Using the SOs as
Fig. �.�-�: HFHS Strategic Planning Process
Step 3: Q2 – Q3 BU, Pillar, System Teams
Develop/Assemble New SIs that: A. Align with System SOs B. Advance Business Model
Step 1: Q1 – Q2 PC, BOT
A. Analyze entire year performance on System SIs B. Review/Affirm/ Update Mission, Vision, Values
Step 2: Q2 (PC, BOT) A. Update Environmental Assessment and SWOT B. Review/affirm strategic advantages, challenges, and core competencies C. Review/Revise Business Model D. Affirm/Update SOs
APPROACH
INTEG
RATION
DEPLOYMENT
LEA
RNIN
G
Step 5: Q3 – Q4 PC, BU, Pillar, System Teams
A. Create/update System & BU action plans and identify key performance measures
B. Finalize workforce plans required to execute SIs
Step 7: Q1 – Q4 PC,BU, Pillar & System Teams
A. Implement action plans B. Review and improve
organizational performance C. Incorporate and reprioritize SIs
as opportunities arise
Step 4: Q3 BOT, PC, BU, Pillar, System Teams
A. Review new & ongoing SI against decision criteria
B. Integrate into strategic, capital & operating plans
C. Approve & communicate SIs to BU/Pillar/ System Teams
Step 6: Q4 – Q1 BOT, PC, BU, Pillar & System Teams
A. Communicate plans System-wide B. Incorporate plans into
department/individual goals via Performance Management System
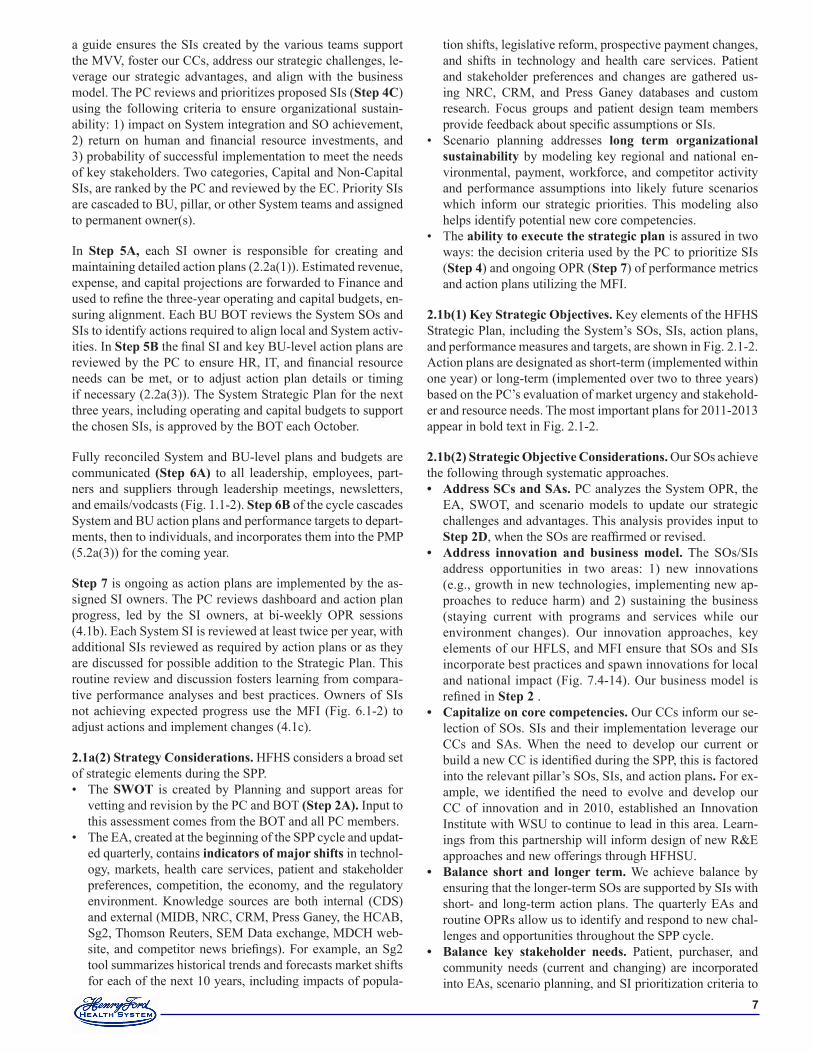
�
a guide ensures the SIs created by the various teams support the MVV, foster our CCs, address our strategic challenges, le-verage our strategic advantages, and align with the business model. The PC reviews and prioritizes proposed SIs (Step 4C) using the following criteria to ensure organizational sustain-ability: 1) impact on System integration and SO achievement, 2) return on human and financial resource investments, and 3) probability of successful implementation to meet the needs of key stakeholders. Two categories, Capital and Non-Capital SIs, are ranked by the PC and reviewed by the EC. Priority SIs are cascaded to BU, pillar, or other System teams and assigned to permanent owner(s).
In Step 5A, each SI owner is responsible for creating and maintaining detailed action plans (2.2a(1)). Estimated revenue, expense, and capital projections are forwarded to Finance and used to refine the three-year operating and capital budgets, en-suring alignment. Each BU BOT reviews the System SOs and SIs to identify actions required to align local and System activ-ities. In Step 5B the final SI and key BU-level action plans are reviewed by the PC to ensure HR, IT, and financial resource needs can be met, or to adjust action plan details or timing if necessary (2.2a(3)). The System Strategic Plan for the next three years, including operating and capital budgets to support the chosen SIs, is approved by the BOT each October.
Fully reconciled System and BU-level plans and budgets are communicated (Step 6A) to all leadership, employees, part-ners and suppliers through leadership meetings, newsletters, and emails/vodcasts (Fig. 1.1-2). Step 6B of the cycle cascades System and BU action plans and performance targets to depart-ments, then to individuals, and incorporates them into the PMP (5.2a(3)) for the coming year.
Step 7 is ongoing as action plans are implemented by the as-signed SI owners. The PC reviews dashboard and action plan progress, led by the SI owners, at bi-weekly OPR sessions (4.1b). Each System SI is reviewed at least twice per year, with additional SIs reviewed as required by action plans or as they are discussed for possible addition to the Strategic Plan. This routine review and discussion fosters learning from compara-tive performance analyses and best practices. Owners of SIs not achieving expected progress use the MFI (Fig. 6.1-2) to adjust actions and implement changes (4.1c).
2.1a(2) Strategy Considerations. HFHS considers a broad set of strategic elements during the SPP.
The SWOT is created by Planning and support areas for vetting and revision by the PC and BOT (Step 2A). Input to this assessment comes from the BOT and all PC members.The EA, created at the beginning of the SPP cycle and updat-ed quarterly, contains indicators of major shifts in technol-ogy, markets, health care services, patient and stakeholder preferences, competition, the economy, and the regulatory environment. Knowledge sources are both internal (CDS) and external (MIDB, NRC, CRM, Press Ganey, the HCAB, Sg2, Thomson Reuters, SEM Data exchange, MDCH web-site, and competitor news briefings). For example, an Sg2 tool summarizes historical trends and forecasts market shifts for each of the next 10 years, including impacts of popula-
•
•
tion shifts, legislative reform, prospective payment changes, and shifts in technology and health care services. Patient and stakeholder preferences and changes are gathered us-ing NRC, CRM, and Press Ganey databases and custom research. Focus groups and patient design team members provide feedback about specific assumptions or SIs.Scenario planning addresses long term organizational sustainability by modeling key regional and national en-vironmental, payment, workforce, and competitor activity and performance assumptions into likely future scenarios which inform our strategic priorities. This modeling also helps identify potential new core competencies.The ability to execute the strategic plan is assured in two ways: the decision criteria used by the PC to prioritize SIs (Step 4) and ongoing OPR (Step 7) of performance metrics and action plans utilizing the MFI.
2.1b(1) Key Strategic Objectives. Key elements of the HFHS Strategic Plan, including the System’s SOs, SIs, action plans, and performance measures and targets, are shown in Fig. 2.1-2. Action plans are designated as short-term (implemented within one year) or long-term (implemented over two to three years) based on the PC’s evaluation of market urgency and stakehold-er and resource needs. The most important plans for 2011-2013 appear in bold text in Fig. 2.1-2.
2.1b(2) Strategic Objective Considerations. Our SOs achieve the following through systematic approaches.
Address SCs and SAs. PC analyzes the System OPR, the EA, SWOT, and scenario models to update our strategic challenges and advantages. This analysis provides input to Step 2D, when the SOs are reaffirmed or revised.Address innovation and business model. The SOs/SIs address opportunities in two areas: 1) new innovations (e.g., growth in new technologies, implementing new ap-proaches to reduce harm) and 2) sustaining the business (staying current with programs and services while our environment changes). Our innovation approaches, key elements of our HFLS, and MFI ensure that SOs and SIs incorporate best practices and spawn innovations for local and national impact (Fig. 7.4-14). Our business model is refined in Step 2 .Capitalize on core competencies. Our CCs inform our se-lection of SOs. SIs and their implementation leverage our CCs and SAs. When the need to develop our current or build a new CC is identified during the SPP, this is factored into the relevant pillar’s SOs, SIs, and action plans. For ex-ample, we identified the need to evolve and develop our CC of innovation and in 2010, established an Innovation Institute with WSU to continue to lead in this area. Learn-ings from this partnership will inform design of new R&E approaches and new offerings through HFHSU.Balance short and longer term. We achieve balance by ensuring that the longer-term SOs are supported by SIs with short- and long-term action plans. The quarterly EAs and routine OPRs allow us to identify and respond to new chal-lenges and opportunities throughout the SPP cycle. Balance key stakeholder needs. Patient, purchaser, and community needs (current and changing) are incorporated into EAs, scenario planning, and SI prioritization criteria to
•
•
•
•
•
•
•
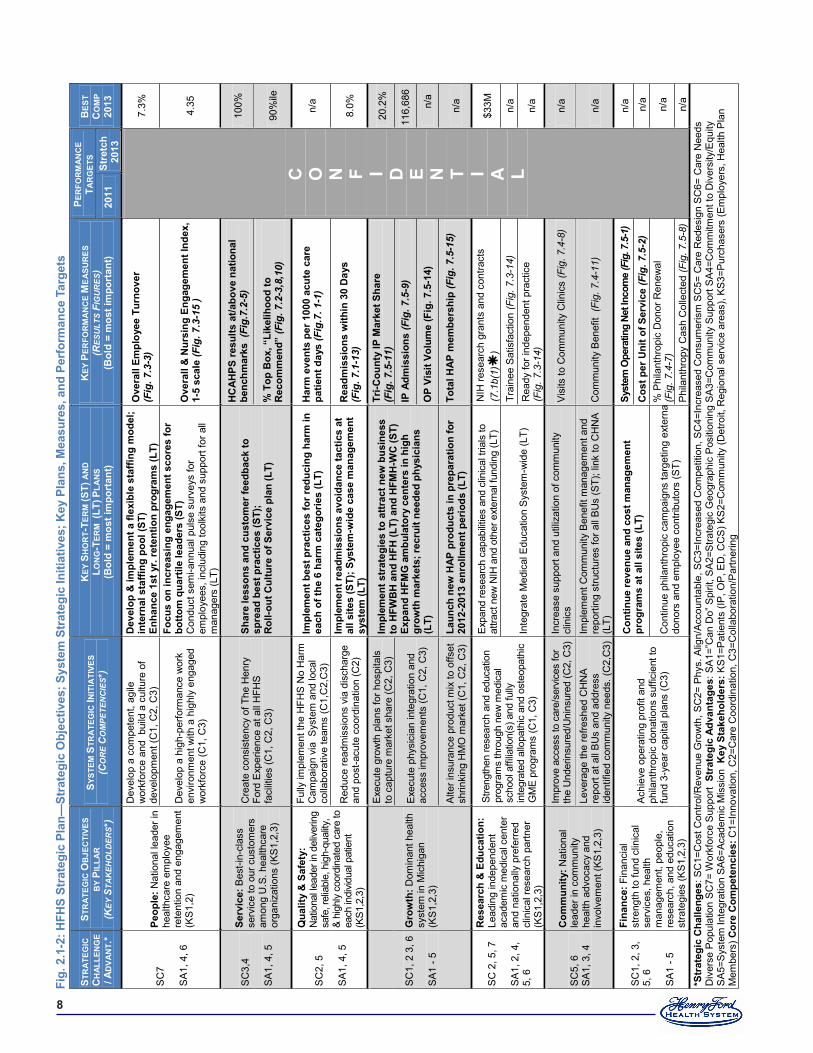
�
Fig.
�.�
-�: H
FHS
Stra
tegi
c Pl
an—
Stra
tegi
c O
bjec
tives
; Sys
tem
Str
ateg
ic In
itiat
ives
; Key
Pla
ns, M
easu
res,
and
Per
form
ance
Tar
gets
STR
ATE
GIC
C
HAL
LEN
GE
/ AD
VAN
T.*
STR
ATE
GIC
OB
JEC
TIVE
S
BY
PILL
AR
(K
EY S
TAK
EHO
LDER
S*)
SYST
EM S
TRA
TEG
IC IN
ITIA
TIVE
S (C
OR
E C
OM
PETE
NC
IES*
) K
EY S
HO
RT-
TER
M (S
T) A
ND
LO
NG
-TER
M (
LT) P
LAN
S (B
old
= m
ost i
mpo
rtan
t)
KEY
PER
FOR
MA
NC
E M
EASU
RES
(R
ESU
LTS
FIG
UR
ES)
(Bol
d =
mos
t im
port
ant)
PER
FOR
MAN
CE
TAR
GET
S B
EST
CO
MP
�0��
�0
��
Stre
tch
�0��
SC
7 S
A1,
4, 6
Peop
le: N
atio
nal l
eade
r in
heal
thca
re e
mpl
oyee
re
tent
ion
and
enga
gem
ent
(KS
1,2)
Dev
elop
a c
ompe
tent
, agi
le
wor
kfor
ce a
nd b
uild
a c
ultu
re o
f de
velo
pmen
t (C
1, C
2, C
3)
Dev
elop
& im
plem
ent a
flex
ible
sta
ffing
mod
el;
inte
rnal
sta
ffing
poo
l (ST
) En
hanc
e �s
t yr.
rete
ntio
n pr
ogra
ms
(LT)
O
vera
ll Em
ploy
ee T
urno
ver
(Fig
. 7.3
-3)
C
O
N F I D E N T I A L
7.3%
Dev
elop
a h
igh-
perfo
rman
ce w
ork
envi
ronm
ent w
ith a
hig
hly
enga
ged
wor
kfor
ce (C
1, C
3)
Focu
s on
incr
easi
ng e
ngag
emen
t sco
res
for
botto
m q
uart
ile le
ader
s (S
T)
Con
duct
sem
i-ann
ual p
ulse
sur
veys
for
empl
oyee
s, in
clud
ing
tool
kits
and
sup
port
for a
ll m
anag
ers
(LT)
Ove
rall
& N
ursi
ng E
ngag
emen
t Ind
ex,
�-�
scal
e (F
ig. 7
.3-1
5 )
4.35
SC
3,4
SA
1, 4
, 5
Serv
ice:
Bes
t-in-
clas
s se
rvic
e to
our
cus
tom
ers
amon
g U
.S. h
ealth
care
or
gani
zatio
ns (K
S1,
2,3)
Cre
ate
cons
iste
ncy
of T
he H
enry
Fo
rd E
xper
ienc
e at
all
HFH
S fa
cilit
ies
(C1,
C2,
C3)
Shar
e le
sson
s an
d cu
stom
er fe
edba
ck to
sp
read
bes
t pra
ctic
es (S
T);
Rol
l-out
Cul
ture
of S
ervi
ce p
lan
(LT)
HC
AHPS
resu
lts a
t/abo
ve n
atio
nal
benc
hmar
ks (
Fig.
7.2-
5)
100%
% T
op B
ox, “
Like
lihoo
d to
R
ecom
men
d” (F
ig. 7
.2-3
,8,1
0)
90%
ile
SC
2, 5
S
A1,
4, 5
Qua
lity
& S
afet
y:
Nat
iona
l lead
er in
del
iver
ing
safe
, rel
iabl
e, h
igh-
qual
ity,
& hi
ghly
coo
rdin
ated
car
e to
ea
ch in
divid
ual p
atie
nt
(KS1
,2,3
)
Fully
impl
emen
t the
HFH
S N
o H
arm
C
ampa
ign
via
Sys
tem
and
loca
l co
llabo
rativ
e te
ams
(C1,
C2,
C3)
Impl
emen
t bes
t pra
ctic
es fo
r red
ucin
g ha
rm in
ea
ch o
f the
� h
arm
cat
egor
ies
(LT)
H
arm
eve
nts
per �
000
acut
e ca
re
patie
nt d
ays
(Fig
.7. 1
-1)
n/a
Red
uce
read
mis
sion
s vi
a di
scha
rge
and
post
-acu
te c
oord
inat
ion
(C2)
Impl
emen
t rea
dmis
sion
s av
oida
nce
tact
ics
at
all s
ites
(ST)
; Sys
tem
-wid
e ca
se m
anag
emen
t sy
stem
(LT)
R
eadm
issi
ons
with
in �
0 D
ays
(F
ig. 7
.1-1
3)
8.0%
SC
1, 2
3, 6
S
A1
- 5
Gro
wth
: Dom
inan
t hea
lth
syst
em in
Mic
higa
n (K
S1,
2,3)
Exe
cute
gro
wth
pla
ns fo
r hos
pita
ls
to c
aptu
re m
arke
t sha
re (C
2, C
3)
Impl
emen
t str
ateg
ies
to a
ttrac
t new
bus
ines
s to
HFW
BH
and
HFH
(LT)
and
HFM
H-W
C (S
T)
Expa
nd H
FMG
am
bula
tory
cen
ters
in h
igh
grow
th m
arke
ts; r
ecru
it ne
eded
phy
sici
ans
(LT)
Tri-C
ount
y IP
Mar
ket S
hare
(F
ig. 7
.5-1
1)
20.2
%
Exe
cute
phy
sici
an in
tegr
atio
n an
d ac
cess
impr
ovem
ents
(C1,
C2,
C3)
IP A
dmis
sion
s (F
ig. 7
.5-9
) 11
6,68
6
OP
Visi
t Vol
ume
(Fig
. �.�
-��)
n/
a
Alte
r ins
uran
ce p
rodu
ct m
ix to
offs
et
shrin
king
HM
O m
arke
t (C
1, C
2, C
3)
Laun
ch n
ew H
AP p
rodu
cts
in p
repa
ratio
n fo
r �0
��-�
0��
enro
llmen
t per
iods
(LT)
To
tal H
AP m
embe
rshi
p (F
ig. 7
.5-1
5)
n/
a
SC
2, 5
, 7
SA
1, 2
, 4,
5, 6
Res
earc
h &
Edu
catio
n:
Lead
ing
inde
pend
ent
acad
emic
med
ical
cen
ter
and
natio
nally
pre
ferre
d cl
inic
al re
sear
ch p
artn
er
(KS
1,2,
3)
Stre
ngth
en re
sear
ch a
nd e
duca
tion
prog
ram
s th
roug
h ne
w m
edic
al
scho
ol a
ffilia
tion(
s) a
nd fu
lly
inte
grat
ed a
llopa
thic
and
ost
eopa
thic
G
ME
prog
ram
s (C
1, C
3)
Expa
nd re
sear
ch c
apab
ilitie
s an
d cl
inic
al tr
ials
to
attra
ct n
ew N
IH a
nd o
ther
ext
erna
l fun
ding
(LT)
N
IH re
sear
ch g
rant
s an
d co
ntra
cts
(7.1
b(1)
) $3
3M
Inte
grat
e M
edic
al E
duca
tion
Sys
tem
-wid
e (L
T)
Trai
nee
Sat
isfa
ctio
n (F
ig. 7
.3-1
4)
n/a
Rea
dy fo
r ind
epen
dent
pra
ctic
e
(Fig
. 7.3
-14)
n/
a
SC
5, 6
S
A1,
3, 4
Com
mun
ity: N
atio
nal
lead
er in
com
mun
ity
heal
th a
dvoc
acy
and
invo
lvem
ent (
KS1,
2,3)
Impr
ove
acce
ss to
car
e/se
rvic
es fo
r th
e U
nder
insu
red/
Uni
nsur
ed (C
2, C
3)
Incr
ease
sup
port
and
utili
zatio
n of
com
mun
ity
clin
ics
V
isits
to C
omm
unity
Clin
ics
(Fig
. 7.4
-8)
n/a
Leve
rage
the
refre
shed
CH
NA
repo
rt at
all
BU
s an
d ad
dres
s id
entif
ied
com
mun
ity n
eeds
. (C
2,C
3)
Impl
emen
t Com
mun
ity B
enef
it m
anag
emen
t and
re
porti
ng s
truct
ures
for a
ll B
Us
(ST)
; lin
k to
CH
NA
(LT)
C
omm
unity
Ben
efit
(Fig
. 7.4
-11)
n/
a
SC
1, 2
, 3,
5, 6
S
A1
- 5
Fina
nce:
Fin
anci
al
stre
ngth
to fu
nd c
linic
al
serv
ices
, hea
lth
man
agem
ent,
peop
le,
rese
arch
, and
edu
catio
n st
rate
gies
(KS
1,2,
3)
Ach
ieve
ope
ratin
g pr
ofit
and
phila
nthr
opic
don
atio
ns s
uffic
ient
to
fund
3-y
ear c
apita
l pla
ns (C
3)
Con
tinue
reve
nue
and
cost
man
agem
ent
prog
ram
s at
all
site
s (L
T)
Syst
em O
pera
ting
Net I
ncom
e (F
ig. 7
.5-1
) n/
a
Cos
t per
Uni
t of S
ervi
ce (F
ig. 7
.5-2
) n/
a
Con
tinue
phi
lant
hrop
ic c
ampa
igns
targ
etin
g ex
tern
al
dono
rs a
nd e
mpl
oyee
con
tribu
tors
(ST)
% P
hila
nthr
opic
Don
or R
enew
al
(Fig
. 7.4
-7)
n/a
Phi
lant
hrop
y C
ash
Col
lect
ed (F
ig. 7
.5-8
) n/
a *S
trat
egic
Cha
lleng
es: S
C1=
Cos
t Con
trol/R
even
ue G
row
th, S
C2=
Phy
s. A
lign/
Acco
unta
ble,
SC
3=In
crea
sed
Com
petit
ion,
SC
4=In
crea
sed
Con
sum
eris
m S
C5=
Car
e R
edes
ign
SC
6= C
are
Nee
ds
Div
erse
Pop
ulat
ion
SC
7= W
orkf
orce
Sup
port
Str
ateg
ic A
dvan
tage
s: S
A1=
”Can
Do”
Spi
rit, S
A2=
Stra
tegi
c G
eogr
aphi
c P
ositi
onin
g S
A3=
Com
mun
ity S
uppo
rt S
A4=
Com
mitm
ent t
o D
iver
sity
/Equ
ity
SA
5=S
yste
m In
tegr
atio
n SA
6=Ac
adem
ic M
issi
on K
ey S
take
hold
ers:
KS
1=P
atie
nts
(IP, O
P, E
D, C
CS
) KS
2=C
omm
unity
(Det
roit,
Reg
iona
l ser
vice
are
as),
KS3=
Pur
chas
ers
(Em
ploy
ers,
Hea
lth P
lan
Mem
bers
) Cor
e C
ompe
tenc
ies:
C1=
Inno
vatio
n, C
2=C
are
Coo
rdin
atio
n, C
3=C
olla
bora
tion/
Par
tner
ing
�
address SOs. These assessments identify shifts among stake-holder groups, such as purchasers needing new wellness-fo-cused insurance products to offer their employees.Adapt to sudden shifts. By re-evaluating our SOs/SIs an-nually, and through routine OPRs, PC can respond/adapt to both evolving and sudden shifts in our environment.
2.2 Strategy Implementation2.2a(1) Action Plan Development. Each SI owner creates a detailed action plan for initiative implementation using a stan-dard format (Step 5A-B) that includes specific tactics, perfor-mance measures for OPRs and Action Plan Monitors (4.1a(1)), and owners responsible for each tactic to drive accountability. Pillar or other System teams oversee implementation, moni-tor progress, make midcourse corrections, and report summary progress to the PC at least semi-annually. Our SOs plus key SIs, short- and long- term action plans, and performance mea-sures are shown in Fig. 2.1-2. Key planned changes addressed in our on-site, detailed action plans include: rolling out CPNG for enhanced clinical communications and information shar-ing (4.2a(2)), integrating clinical services through a new Henry Ford Physician Network (HFPN), and expanding collabora-tion on education, innovation, and research with WSU. Our integrated System (SA5), CCs, and “can do spirit” (SA1) help to keep us agile in adapting to health care reform and market changes (SC1, 2, 5; P.2b). Over the last five years, we have made significant investments in our SOs, SIs, and infrastruc-ture, made possible by our strategic and financial successes (7.5a(1, 2)).
2.2a(2) Action Plan Implementation. Action plans are de-ployed through SPP Steps 6-7 using several mechanisms in-cluding: 1) our communications system (1.1a(2), SPP Step 6A); 2) incorporating plans into department and individual goals through the Performance Management System (SPP Step 6B); and 3) implementing action plans (Step 7A), and 4) System-wide dashboards and OPRs (4.1b, SPP Step 7B-C). A standard action plan format and the System dashboard ensure teams use a systematic approach. The PC reviews System and BU SI plans as they are initiated and again throughout the year during OPRs. Once reviewed, aligned, and approved, new SI action plans are communicated and deployed System-wide to work units, sup-pliers, and partners (Fig. 1.1-2). The PC reviews progress and identifies needed changes or improvements, and assigns spe-cific accountability for changes in plans. Changes to plans le-verage the MFI, ensuring alignment and the use of past learning to redesign the plan over time. Each team draws on our CCs to design and execute action plans. Our disciplined action plan implementation is a key element of our HFLS.
The System dashboard is updated monthly and available on Henry and the BOT website (4.1b). Action plans and dash-boards are also used to convey progress to those suppliers, partners, and collaborators involved in particular SIs. Each team’s review of tactical status and performance outcomes en-sures that barriers to progress are revealed and addressed and key outcomes to action plans can be achieved and sustained. The successful processes are hardwired using the PDCA cycle in the MFI and shared System-wide through use of the KW (4.2a(3)) and other communication methods.
•
2.2a(3) Resource Allocation. To ensure that financial, IT, and human resources are available to support the accomplishment of our action plans, the PC coordinates its detailed action plan-ning to coincide with the annual capital and operating budget-ing process in Steps 4B and 5B. Proposed SIs and action plans undergo impact analyses, including capital and other resource requirements (Steps 5A-B) and implementation risks, and the criteria used to prioritize SIs also consider impact on financial and human resources and availability of capital and operating funds. Capital and operating requirements for the selected SIs are included in the budget process. Human resource needs are aggregated across all action plans and reviewed by the Human Resources Executive Team (HRET) to ensure the people and skills necessary to deploy action plans are available. HRET summarizes key gaps in human resource capacity (5.2a(1)), and the PC reconciles all resource needs during Step 5B.
2.2a(4) Workforce Plans. Our key human resource SIs and plans are listed in Fig. 2.1-2 (additional People plans are avail-able on site (AOS)) and incorporated into the People SO of the strategic plan. HRET works with all BU leaders to identify human resource plans, including potential future changes in key workforce segments (P.1a(3)), to ensure each BU has the capacity to achieve all its SOs with BU-level action plans and performance targets. Key human resource plans for 2011-2013 focus on the SIs of workforce planning, retention, and engage-ment and include implementing new flexible staffing models, retention approaches, and engagement toolkits to create a com-petent and agile workforce.
2.2a(5) Performance Measures. Key performance measures are shown in bold text in Fig. 2.1-2. Action plan progress is assessed using dashboard organizational performance mea-sures and action plan monitors (4.1b). The System dashboard includes key System level performance measures associated with SIs. The performance measures and targets for specific plans are created to align with the System SOs (4.1a(1)). For example, the 2011 Quality/Safety performance target of 12.2% readmissions within 30 days aligns with the SI to reduce read-missions via discharge and post-acute coordination, which in turn supports the SO to be a national leader in delivering safe, highly-coordinated care.
2.2a(6) Action Plan Modification. The PC conducts bi-weekly meetings to review SI and BU action plans and per-formance measures to determine if adjustments are required (Step 7). SI owners not achieving performance targets use the MFI to modify action plans. Changes to the market, such as new employers, businesses closing or downsizing, competitor moves (new facilities, new service offerings), new technology opportunities (e.g. health care stimulus dollars for CPNG), or legislative/regulatory changes are discussed throughout the year by the PC. Scenario models inform PC members of po-tential short- and long-term impacts of market and economic changes. Urgent issues requiring a more immediate response than the bi-weekly PC meetings are resolved by the EC. Any required follow-up, including new or revised SIs or action plans, is assigned to a specific owner for review at a future PC meeting.
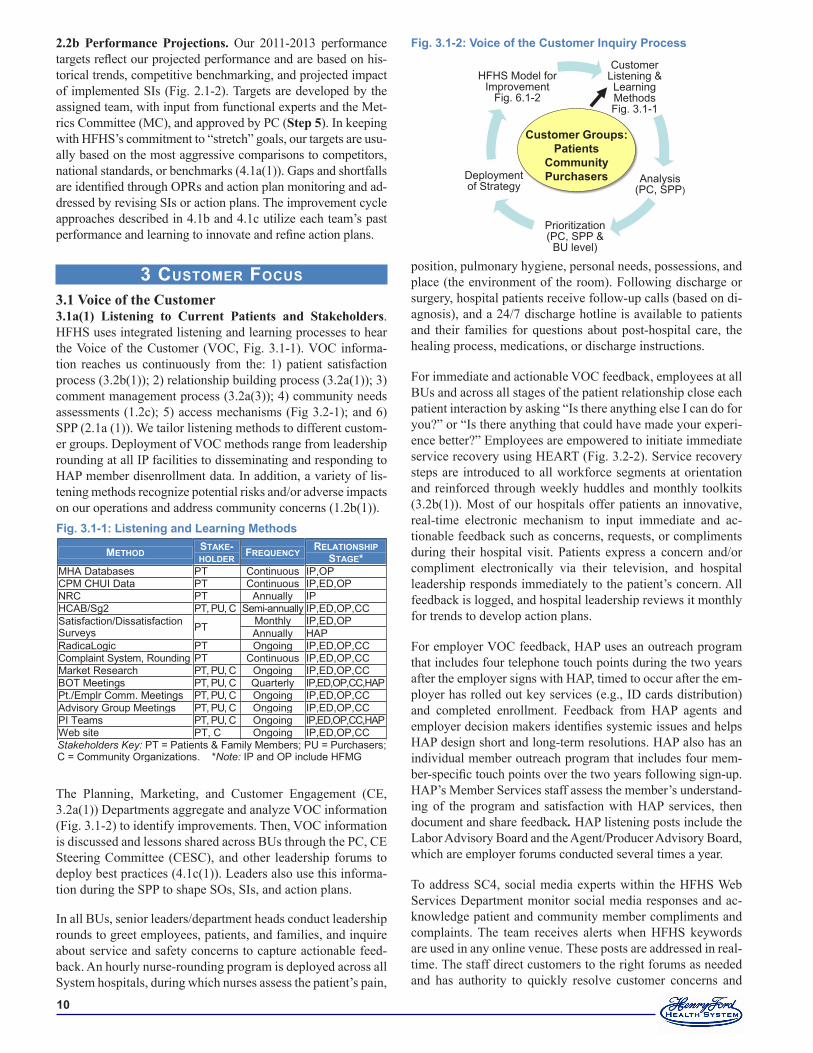
�0
3 customer Focus 3.1 Voice of the Customer3.1a(1) Listening to Current Patients and Stakeholders. HFHS uses integrated listening and learning processes to hear the Voice of the Customer (VOC, Fig. 3.1-1). VOC informa-tion reaches us continuously from the: 1) patient satisfaction process (3.2b(1)); 2) relationship building process (3.2a(1)); 3) comment management process (3.2a(3)); 4) community needs assessments (1.2c); 5) access mechanisms (Fig 3.2-1); and 6) SPP (2.1a (1)). We tailor listening methods to different custom-er groups. Deployment of VOC methods range from leadership rounding at all IP facilities to disseminating and responding to HAP member disenrollment data. In addition, a variety of lis-tening methods recognize potential risks and/or adverse impacts on our operations and address community concerns (1.2b(1)).
The Planning, Marketing, and Customer Engagement (CE, 3.2a(1)) Departments aggregate and analyze VOC information (Fig. 3.1-2) to identify improvements. Then, VOC information is discussed and lessons shared across BUs through the PC, CE Steering Committee (CESC), and other leadership forums to deploy best practices (4.1c(1)). Leaders also use this informa-tion during the SPP to shape SOs, SIs, and action plans.
In all BUs, senior leaders/department heads conduct leadership rounds to greet employees, patients, and families, and inquire about service and safety concerns to capture actionable feed-back. An hourly nurse-rounding program is deployed across all System hospitals, during which nurses assess the patient’s pain,
position, pulmonary hygiene, personal needs, possessions, and place (the environment of the room). Following discharge or surgery, hospital patients receive follow-up calls (based on di-agnosis), and a 24/7 discharge hotline is available to patients and their families for questions about post-hospital care, the healing process, medications, or discharge instructions.
For immediate and actionable VOC feedback, employees at all BUs and across all stages of the patient relationship close each patient interaction by asking “Is there anything else I can do for you?” or “Is there anything that could have made your experi-ence better?” Employees are empowered to initiate immediate service recovery using HEART (Fig. 3.2-2). Service recovery steps are introduced to all workforce segments at orientation and reinforced through weekly huddles and monthly toolkits (3.2b(1)). Most of our hospitals offer patients an innovative, real-time electronic mechanism to input immediate and ac-tionable feedback such as concerns, requests, or compliments during their hospital visit. Patients express a concern and/or compliment electronically via their television, and hospital leadership responds immediately to the patient’s concern. All feedback is logged, and hospital leadership reviews it monthly for trends to develop action plans.
For employer VOC feedback, HAP uses an outreach program that includes four telephone touch points during the two years after the employer signs with HAP, timed to occur after the em-ployer has rolled out key services (e.g., ID cards distribution) and completed enrollment. Feedback from HAP agents and employer decision makers identifies systemic issues and helps HAP design short and long-term resolutions. HAP also has an individual member outreach program that includes four mem-ber-specific touch points over the two years following sign-up. HAP’s Member Services staff assess the member’s understand-ing of the program and satisfaction with HAP services, then document and share feedback. HAP listening posts include the Labor Advisory Board and the Agent/Producer Advisory Board, which are employer forums conducted several times a year.
To address SC4, social media experts within the HFHS Web Services Department monitor social media responses and ac-knowledge patient and community member compliments and complaints. The team receives alerts when HFHS keywords are used in any online venue. These posts are addressed in real-time. The staff direct customers to the right forums as needed and has authority to quickly resolve customer concerns and
METHOD STAKE- HOLDER FREQUENCY RELATIONSHIP
STAGE* MHA Databases PT Continuous IP,OP CPM CHUI Data PT Continuous IP,ED,OP NRC PT Annually IP HCAB/Sg2 PT, PU, C Semi-annually IP,ED,OP,CC Satisfaction/Dissatisfaction Surveys PT Monthly IP,ED,OP
Annually HAP RadicaLogic PT Ongoing IP,ED,OP,CC Complaint System, Rounding PT Continuous IP,ED,OP,CC Market Research PT, PU, C Ongoing IP,ED,OP,CC BOT Meetings PT, PU, C Quarterly IP,ED,OP,CC,HAP Pt./Emplr Comm. Meetings PT, PU, C Ongoing IP,ED,OP,CC Advisory Group Meetings PT, PU, C Ongoing IP,ED,OP,CC PI Teams PT, PU, C Ongoing IP,ED,OP,CC,HAP Web site PT, C Ongoing IP,ED,OP,CC Stakeholders Key: PT = Patients & Family Members; PU = Purchasers; C = Community Organizations. *Note: IP and OP include HFMG
Fig. �.�-�: Listening and Learning Methods
CustomerListening & LearningMethodsFig. 3.1-1
Analysis(PC, SPP)
Prioritization(PC, SPP &
BU level)
Deploymentof Strategy
HFHS Model forImprovement
Fig. 6.1-2
Customer Groups:Patients
CommunityPurchasers
Fig. �.�-�: Voice of the Customer Inquiry Process2.2b Performance Projections. Our 2011-2013 performance targets reflect our projected performance and are based on his-torical trends, competitive benchmarking, and projected impact of implemented SIs (Fig. 2.1-2). Targets are developed by the assigned team, with input from functional experts and the Met-rics Committee (MC), and approved by PC (Step 5). In keeping with HFHS’s commitment to “stretch” goals, our targets are usu-ally based on the most aggressive comparisons to competitors, national standards, or benchmarks (4.1a(1)). Gaps and shortfalls are identified through OPRs and action plan monitoring and ad-dressed by revising SIs or action plans. The improvement cycle approaches described in 4.1b and 4.1c utilize each team’s past performance and learning to innovate and refine action plans.
��
complaints. HFHS has begun using Google Alerts and Google Trends to listen and learn from current, potential, and competi-tors’ patients. The social media staff uses these tools to follow trends and provide insights into broad patterns for the HFHS SE Leaders, along with the summarized complaint data from RadicaLogic (3.2b(2)).
3.1a(2) Listening to Potential Patients and Stakeholders. HFHS employs formal and informal methods for obtaining actionable feedback from competitors’ customers, former pa-tients, and community members. Formally, HFHS monitors:
Patient referrals from physicians via our concierge pro-gramHealth care trends and behaviors through the NRC survey process (Fig. 7.2-1) that includes listening insights from former and potential customers and competitors’ customersHFHS’s competitor database, which provides demographic and market information by service and geographyHAP member transfers to another network. We monitor the net increase or decrease in members from one independent practice association (IPA) to another.
Informally, the Marketing and PR Departments review infor-mation from local media, competitor websites, advertisements, and press releases. We also obtain feedback on our services through discussions with trustees, partners, and community collaborators. All these data are analyzed by demographic and service line segments. Environmental updates are prepared by Planning, Marketing, HAP Planning, and strategic sup-plier/partners (Fig. P.1-8) throughout the year. These updates are discussed at PC and other leadership venues. The Planning Department also completes an annual EA that includes new health care issues, local community economic and political conditions, competitor tactics within the region, and projected impacts on HFHS. The PC reviews these analyses and com-petitive data in Step 2 of the SPP to provide input into our SOs as well as throughout the year during routine OPRs.
3.1b(1) Satisfaction and Engagement. In early 2011 SL creat-ed new organizational infrastructure around the Service Pillar to focus on customer engagement. Three System leaders now own the entire continuum for the CE Department. This new structure is accountable for creating a System-wide approach to service, leading to a consistent experience for all HFHS customers. This structure includes two new process improvement managers, on-going leadership by the SE BU leaders, and SE Champions at the departmental and unit level.
Determining satisfaction and engagement. PG surveys are used for patient satisfaction measurement across all BUs, ex-cept for highly specialized services such as medical equipment and optical sales, which use surveys that allow for feedback on those specific services (results on site). Questions on the IP, OP, ED and Community Care satisfaction surveys are tailored to the stage of the relationship. SE Leaders benchmark the data by sur-vey type to national and local peer groups. In 2008, “likelihood to recommend” was added as an engagement and loyalty metric to the System dashboard (4.1a(1)), and specific improvement goals were developed around this measure. In 2009, HFHS
•
•
•
•
added “top box” (the % of five ratings on a scale of 1-5) for the “likelihood to recommend” metric to the System dashboard.
Satisfaction/engagement surveys are mailed to patients’ homes within two weeks of an encounter or discharge and returned directly to Press Ganey (PG). Department leaders have next-day access to data through PG’s InfoEdge system, allowing rapid identification of process improvement opportunities. InfoEdge also contains analysis tools that identify top opportu-nities and key drivers of patient satisfaction that can be drilled down to unit level performance. Educational courses (5.2c(1)) presented by Quality/Safety staff and SE leaders help manag-ers interpret data and design and implement action plans. Sys-tem-wide satisfaction and engagement results and priorities for improvement are summarized monthly by the CE Department and shared with PC (3.2a(4)). PG creates quarterly reports for SL showing cross-BU results in each survey area (IP, ED, etc.) compared to benchmarks. Reports are posted on the Intranet for employees to view. The PC also reviews PG results across BUs each month as part of OPRs (4.1b). Leaders overseeing vendor contracts review survey data with suppliers and part-ners to identify improvements. Depending on the initiative, satisfaction and engagement results are shared with collabora-tors and partners, such as Patient Advisory Groups, automotive benefit executives, MHA, and IHI. PG patient survey results are also available on henryford.com for patients, families, po-tential patients, and the community.
HAP uses multiple approaches to determine member satisfac-tion, including the annual subscriber survey (Fig. 7.2-17), a primary care access survey, call center spot surveys, and health plan specific surveys such as CAHPS (Fig. 7.2-16) for each of its insurance products. Comparisons are made to national, local, and competitor health plans. HAP’s Quality Department and senior leaders assess trends, then implement and track im-provement plans.
3.1b(2) Satisfaction Relative to Competitors. Obtaining and using comparative information. We obtain and use comparative information on patients, families, and com-munities in two distinct ways: 1) market research and patient, family, and community focus groups, and 2) customer surveys through PG, HCAHPS and CAHPS, which provide satisfac-tion and engagement comparisons to hospitals and health plans in SEM, MI, and the U.S.
Market research & focus groups. Listening methods (Fig. 3.1-1) are supplemented with patient and community focus groups, mystery shopping, and other research to ensure initiatives and designs meet stakeholder needs. BUs use focus groups to as-sess satisfaction with competitors, identify new service oppor-tunities, and drive improvement. Market research tools such as NRC and Market Measurement compare the satisfaction and health system preferences of both current and prospective cus-tomers (Fig. 7.2-1).
Customer surveys. PG provides national and local level comparisons and practices of high-performing organizations (3.1b(1)). HCAHPS is a standard, publicly reported survey instrument and data collection method for measuring patients’
��
perspectives on hospital care (Fig. 7.2-5). CAHPS surveys are used to rank health plans relative to each other (Fig. 7.2-16). Both HCAHPS and CAHPS surveys allow us to compare our performance to our competitors by name, and all three surveys allow us to identify specific issues and improve services. Each of these data sources is used to evaluate process performance and set priorities for improvement through the SPP (Fig. 2.1-1, Step 4), OPR process (4.1b), analysis of daily operations (6.2b(1)), Baldrige-based assessments, and all components of our integrated performance improvement system (P.2c, 6.2b(4)).
3.1b(3) Dissatisfaction. All methods for gathering, analyzing, and reporting patient and member satisfaction and engagement data also serve to measure dissatisfaction (3.1b(1)). Quantita-tive data come in the form of low scores, and qualitative data are derived from complaints and comments, focus groups, websites, social media and through verbal or telephone com-ments logged in RadicaLogic’s complaint management system (Fig. 3.2-3, Steps 2-3). Complaint information from dissatis-faction comments in surveys is also shared with IT, food ser-vice, housekeeping, and other partners to increase patient satis-faction and evaluate partner performance (3.1b(1)). Complaint reports are generated at the BU and System levels and shared with SE Leaders monthly to identify common themes. When appropriate, work teams are created to develop improvement plans. These are reviewed for progress by the CESC.
A mystery shopping program is conducted at HFMG sites to assess our Customer Service Representatives (CSRs). We receive the results within 48 hours and share them with the management of the clinic where the shop occurred. Common themes are shared at monthly CSR forums to improve perfor-mance. Leadership at these sites developed key greeting ex-pectations for CSRs at the front desk and used an audit tool to monitor the PG item “Courtesy of registration staff.”
3.2 Customer Engagement3.2a(1) Health Care Service Offerings. During Step 3 of the SPP, the PC draws on research (including shifts in technology, health markets, and patient preferences) and recommendations from BU and other System teams on emerging best practices to identify opportunities for innovative service offerings. Priori-tized initiatives are translated into action plans and assigned to teams for implementation. Key inputs to this process include in-formation received through listening posts (Fig. 3.1-1) and from health care research partners. For example, the CISC continu-ally researches and deploys new approaches to coordinate and customize care based on the patient’s specific needs and prefer-ences (6.2b(2)). Other innovations implemented by the CISC in-clude deployment of Patient Centered Team Care (PCTC), and e-care opportunities such as e-visits, e-scheduling, e-prescrib-ing, and the MyHealth portal (3.2a(2)). E-prescribing initially started as an innovation with the auto industry, was extended throughout HAP, and is now a practice industry-wide that has significant impact not only within HFHS, but nationally.
The PC, BUs, and Marketing use the VOC inquiry process (Fig. 3.1-2) to identify new or improved service offerings to attract new patients. Consumer Research and Listening is used
to assess the extent to which current service offerings meet or exceed prospective patients/stakeholders’ needs, including those of competitors’ customers. BU-tailored approaches, such as focus groups, are used by Marketing to provide greater in-sight and to identify and prioritize opportunities for expanding relationships with new or existing patients/stakeholders.
Trends gathered by Planning and Marketing Departments on health care utilization, customer listening and learning. and pa-tient preferences guide determination of key patient and stake-holder requirements (Fig. P.1-7). During the SPP and OPRs (2.1a(1) and 4.1b), the BU, pillar, and SI teams and PC discuss these data to identify differences across market segments and stages of patients’ relationship with us. This routine review en-ables the teams to design processes that respond to changing customer needs (6.2a(1)). Patients, community members (in-cluding potential patients), and other stakeholders also partici-pate on design teams to provide input. This ensures we design health care services that respond to changing patient expecta-tions, as well as attract new patients. For example, before HF-WBH patient rooms were built, more than 2,000 people – med-ical staff, patients, families and community members – toured prototype patient rooms to evaluate the facilities (such as room configurations, furniture, and equipment). More than 70 design changes were made based on extensive feedback. The same feedback was incorporated into renovations at HFH in 2009.
A Meds to Beds program was established in 2004 to improve patient satisfaction and medication compliance at one of our dialysis centers. Since then, pharmacy services have been ex-panded to provide bedside/chairside delivery to our dialysis centers, oncology patients, EDs, and IP discharges at HFH and HFWBH and to school-based health clinics. We continue to further deploy personal delivery across the System.
HFMG’s PCTC, modeled after Advanced Medical Home re-search, was created and then spread across HFMG centers to better manage care of patients with chronic diseases. PCTC puts responsibility for important aspects of self-care and moni-toring in patients’ hands, along with the tools and support they need from physicians and case managers to define and imple-ment individualized care plans. The PCTC model ensures that transitions between providers, departments, and health care settings are respectful, coordinated, and efficient.
3.2a(2) Patient and Stakeholder Support. SL uses the SPP (2.1a(1)), OPRs (4.1b), and the MFI (Fig. 6.1-2) to design and improve key mechanisms to support use of health care services. Our customer listening methods (Fig. 3.1-1) are supplemented with community focus groups and other research to ensure our initiatives and designs meet patient and stakeholder needs (3.2a(1)). We know from primary care market research that key customer requirements (Fig. P.1-7), regardless of the customer’s age, gender, or geographic location, include being seen within 24 hours of getting sick, so improving access to physician appoint-ments remains a priority for HFMG. Key support requirements are communicated and deployed to all staff through employee orientation, annual education, and internal communications, and to specific groups as needed through training and partner meet-
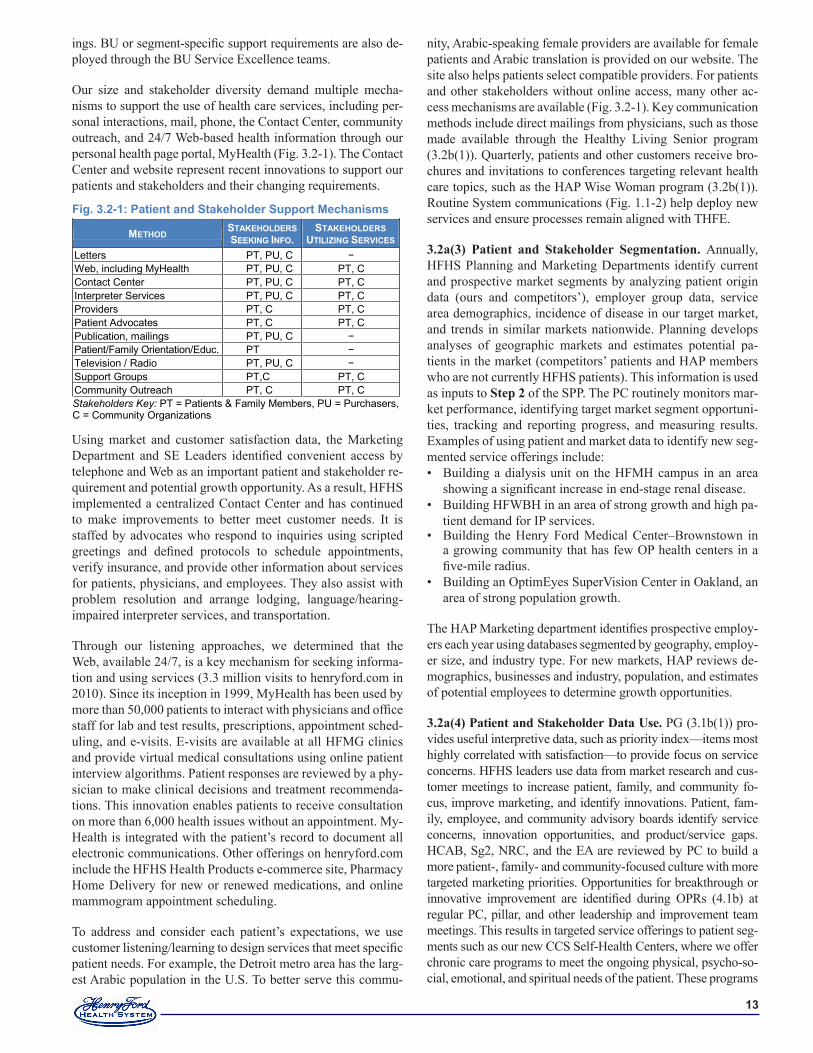
��
ings. BU or segment-specific support requirements are also de-ployed through the BU Service Excellence teams.
Our size and stakeholder diversity demand multiple mecha-nisms to support the use of health care services, including per-sonal interactions, mail, phone, the Contact Center, community outreach, and 24/7 Web-based health information through our personal health page portal, MyHealth (Fig. 3.2-1). The Contact Center and website represent recent innovations to support our patients and stakeholders and their changing requirements.
Using market and customer satisfaction data, the Marketing Department and SE Leaders identified convenient access by telephone and Web as an important patient and stakeholder re-quirement and potential growth opportunity. As a result, HFHS implemented a centralized Contact Center and has continued to make improvements to better meet customer needs. It is staffed by advocates who respond to inquiries using scripted greetings and defined protocols to schedule appointments, verify insurance, and provide other information about services for patients, physicians, and employees. They also assist with problem resolution and arrange lodging, language/hearing- impaired interpreter services, and transportation.
Through our listening approaches, we determined that the Web, available 24/7, is a key mechanism for seeking informa-tion and using services (3.3 million visits to henryford.com in 2010). Since its inception in 1999, MyHealth has been used by more than 50,000 patients to interact with physicians and office staff for lab and test results, prescriptions, appointment sched-uling, and e-visits. E-visits are available at all HFMG clinics and provide virtual medical consultations using online patient interview algorithms. Patient responses are reviewed by a phy-sician to make clinical decisions and treatment recommenda-tions. This innovation enables patients to receive consultation on more than 6,000 health issues without an appointment. My-Health is integrated with the patient’s record to document all electronic communications. Other offerings on henryford.com include the HFHS Health Products e-commerce site, Pharmacy Home Delivery for new or renewed medications, and online mammogram appointment scheduling.
To address and consider each patient’s expectations, we use customer listening/learning to design services that meet specific patient needs. For example, the Detroit metro area has the larg-est Arabic population in the U.S. To better serve this commu-
nity, Arabic-speaking female providers are available for female patients and Arabic translation is provided on our website. The site also helps patients select compatible providers. For patients and other stakeholders without online access, many other ac-cess mechanisms are available (Fig. 3.2-1). Key communication methods include direct mailings from physicians, such as those made available through the Healthy Living Senior program (3.2b(1)). Quarterly, patients and other customers receive bro-chures and invitations to conferences targeting relevant health care topics, such as the HAP Wise Woman program (3.2b(1)). Routine System communications (Fig. 1.1-2) help deploy new services and ensure processes remain aligned with THFE.
3.2a(3) Patient and Stakeholder Segmentation. Annually, HFHS Planning and Marketing Departments identify current and prospective market segments by analyzing patient origin data (ours and competitors’), employer group data, service area demographics, incidence of disease in our target market, and trends in similar markets nationwide. Planning develops analyses of geographic markets and estimates potential pa-tients in the market (competitors’ patients and HAP members who are not currently HFHS patients). This information is used as inputs to Step 2 of the SPP. The PC routinely monitors mar-ket performance, identifying target market segment opportuni-ties, tracking and reporting progress, and measuring results. Examples of using patient and market data to identify new seg-mented service offerings include:
Building a dialysis unit on the HFMH campus in an area showing a significant increase in end-stage renal disease. Building HFWBH in an area of strong growth and high pa-tient demand for IP services.Building the Henry Ford Medical Center–Brownstown in a growing community that has few OP health centers in a five-mile radius.Building an OptimEyes SuperVision Center in Oakland, an area of strong population growth.
The HAP Marketing department identifies prospective employ-ers each year using databases segmented by geography, employ-er size, and industry type. For new markets, HAP reviews de-mographics, businesses and industry, population, and estimates of potential employees to determine growth opportunities.
3.2a(4) Patient and Stakeholder Data Use. PG (3.1b(1)) pro-vides useful interpretive data, such as priority index—items most highly correlated with satisfaction—to provide focus on service concerns. HFHS leaders use data from market research and cus-tomer meetings to increase patient, family, and community fo-cus, improve marketing, and identify innovations. Patient, fam-ily, employee, and community advisory boards identify service concerns, innovation opportunities, and product/service gaps. HCAB, Sg2, NRC, and the EA are reviewed by PC to build a more patient-, family- and community-focused culture with more targeted marketing priorities. Opportunities for breakthrough or innovative improvement are identified during OPRs (4.1b) at regular PC, pillar, and other leadership and improvement team meetings. This results in targeted service offerings to patient seg-ments such as our new CCS Self-Health Centers, where we offer chronic care programs to meet the ongoing physical, psycho-so-cial, emotional, and spiritual needs of the patient. These programs
•
•
•
•
METHOD STAKEHOLDERS SEEKING INFO.
STAKEHOLDERS UTILIZING SERVICES
Letters PT, PU, C − Web, including MyHealth PT, PU, C PT, C Contact Center PT, PU, C PT, C Interpreter Services PT, PU, C PT, C Providers PT, C PT, C Patient Advocates PT, C PT, C Publication, mailings PT, PU, C − Patient/Family Orientation/Educ. PT − Television / Radio PT, PU, C − Support Groups PT,C PT, C Community Outreach PT, C PT, C Stakeholders Key: PT = Patients & Family Members, PU = Purchasers, C = Community Organizations
Fig. �.�-�: Patient and Stakeholder Support Mechanisms
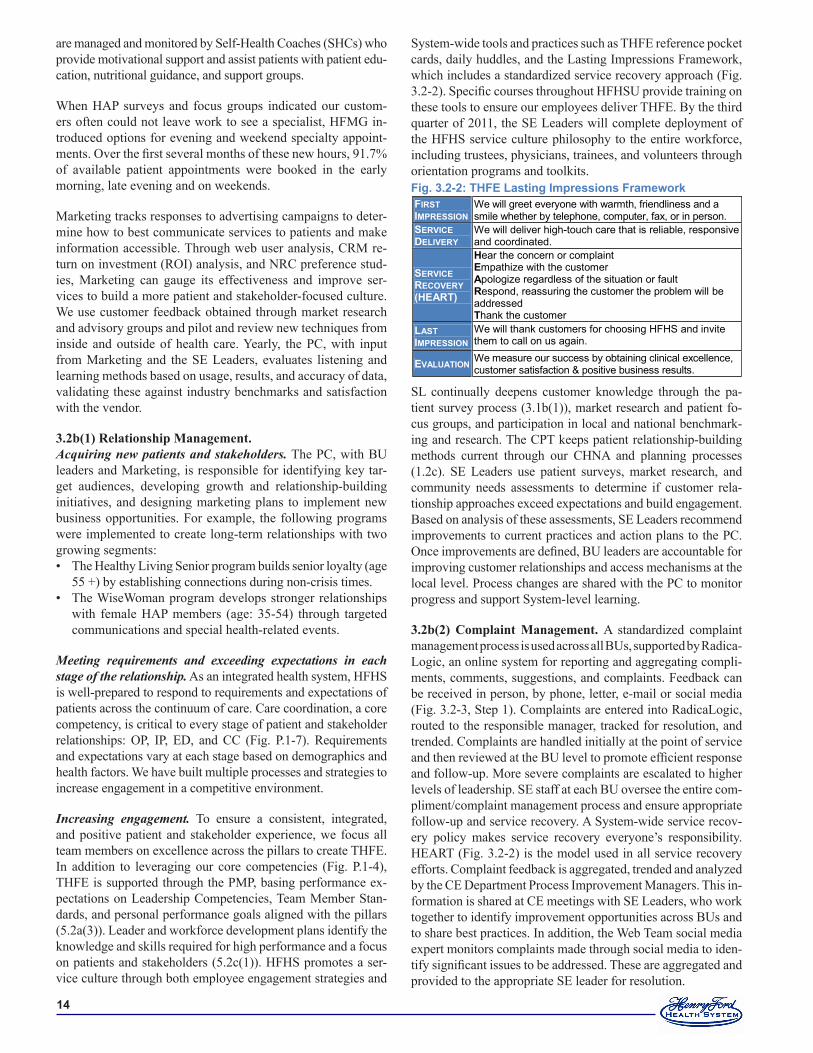
��
are managed and monitored by Self-Health Coaches (SHCs) who provide motivational support and assist patients with patient edu-cation, nutritional guidance, and support groups.
When HAP surveys and focus groups indicated our custom-ers often could not leave work to see a specialist, HFMG in-troduced options for evening and weekend specialty appoint-ments. Over the first several months of these new hours, 91.7% of available patient appointments were booked in the early morning, late evening and on weekends.
Marketing tracks responses to advertising campaigns to deter-mine how to best communicate services to patients and make information accessible. Through web user analysis, CRM re-turn on investment (ROI) analysis, and NRC preference stud-ies, Marketing can gauge its effectiveness and improve ser-vices to build a more patient and stakeholder-focused culture. We use customer feedback obtained through market research and advisory groups and pilot and review new techniques from inside and outside of health care. Yearly, the PC, with input from Marketing and the SE Leaders, evaluates listening and learning methods based on usage, results, and accuracy of data, validating these against industry benchmarks and satisfaction with the vendor.
3.2b(1) Relationship Management. Acquiring new patients and stakeholders. The PC, with BU leaders and Marketing, is responsible for identifying key tar-get audiences, developing growth and relationship-building initiatives, and designing marketing plans to implement new business opportunities. For example, the following programs were implemented to create long-term relationships with two growing segments:
The Healthy Living Senior program builds senior loyalty (age 55 +) by establishing connections during non-crisis times. The WiseWoman program develops stronger relationships with female HAP members (age: 35-54) through targeted communications and special health-related events.
Meeting requirements and exceeding expectations in each stage of the relationship. As an integrated health system, HFHS is well-prepared to respond to requirements and expectations of patients across the continuum of care. Care coordination, a core competency, is critical to every stage of patient and stakeholder relationships: OP, IP, ED, and CC (Fig. P.1-7). Requirements and expectations vary at each stage based on demographics and health factors. We have built multiple processes and strategies to increase engagement in a competitive environment.
Increasing engagement. To ensure a consistent, integrated, and positive patient and stakeholder experience, we focus all team members on excellence across the pillars to create THFE. In addition to leveraging our core competencies (Fig. P.1-4), THFE is supported through the PMP, basing performance ex-pectations on Leadership Competencies, Team Member Stan-dards, and personal performance goals aligned with the pillars (5.2a(3)). Leader and workforce development plans identify the knowledge and skills required for high performance and a focus on patients and stakeholders (5.2c(1)). HFHS promotes a ser-vice culture through both employee engagement strategies and
•
•
System-wide tools and practices such as THFE reference pocket cards, daily huddles, and the Lasting Impressions Framework, which includes a standardized service recovery approach (Fig. 3.2-2). Specific courses throughout HFHSU provide training on these tools to ensure our employees deliver THFE. By the third quarter of 2011, the SE Leaders will complete deployment of the HFHS service culture philosophy to the entire workforce, including trustees, physicians, trainees, and volunteers through orientation programs and toolkits.
SL continually deepens customer knowledge through the pa-tient survey process (3.1b(1)), market research and patient fo-cus groups, and participation in local and national benchmark-ing and research. The CPT keeps patient relationship-building methods current through our CHNA and planning processes (1.2c). SE Leaders use patient surveys, market research, and community needs assessments to determine if customer rela-tionship approaches exceed expectations and build engagement. Based on analysis of these assessments, SE Leaders recommend improvements to current practices and action plans to the PC. Once improvements are defined, BU leaders are accountable for improving customer relationships and access mechanisms at the local level. Process changes are shared with the PC to monitor progress and support System-level learning.
3.2b(2) Complaint Management. A standardized complaint management process is used across all BUs, supported by Radica-Logic, an online system for reporting and aggregating compli-ments, comments, suggestions, and complaints. Feedback can be received in person, by phone, letter, e-mail or social media (Fig. 3.2-3, Step 1). Complaints are entered into RadicaLogic, routed to the responsible manager, tracked for resolution, and trended. Complaints are handled initially at the point of service and then reviewed at the BU level to promote efficient response and follow-up. More severe complaints are escalated to higher levels of leadership. SE staff at each BU oversee the entire com-pliment/complaint management process and ensure appropriate follow-up and service recovery. A System-wide service recov-ery policy makes service recovery everyone’s responsibility. HEART (Fig. 3.2-2) is the model used in all service recovery efforts. Complaint feedback is aggregated, trended and analyzed by the CE Department Process Improvement Managers. This in-formation is shared at CE meetings with SE Leaders, who work together to identify improvement opportunities across BUs and to share best practices. In addition, the Web Team social media expert monitors complaints made through social media to iden-tify significant issues to be addressed. These are aggregated and provided to the appropriate SE leader for resolution.
FIRST IMPRESSION
We will greet everyone with warmth, friendliness and a smile whether by telephone, computer, fax, or in person.
SERVICE DELIVERY
We will deliver high-touch care that is reliable, responsive and coordinated.
SERVICE RECOVERY (HEART)
Hear the concern or complaint Empathize with the customer Apologize regardless of the situation or fault Respond, reassuring the customer the problem will be addressed Thank the customer
LAST IMPRESSION
We will thank customers for choosing HFHS and invite them to call on us again.
EVALUATION We measure our success by obtaining clinical excellence, customer satisfaction & positive business results.
Fig. �.�-�: THFE Lasting Impressions Framework
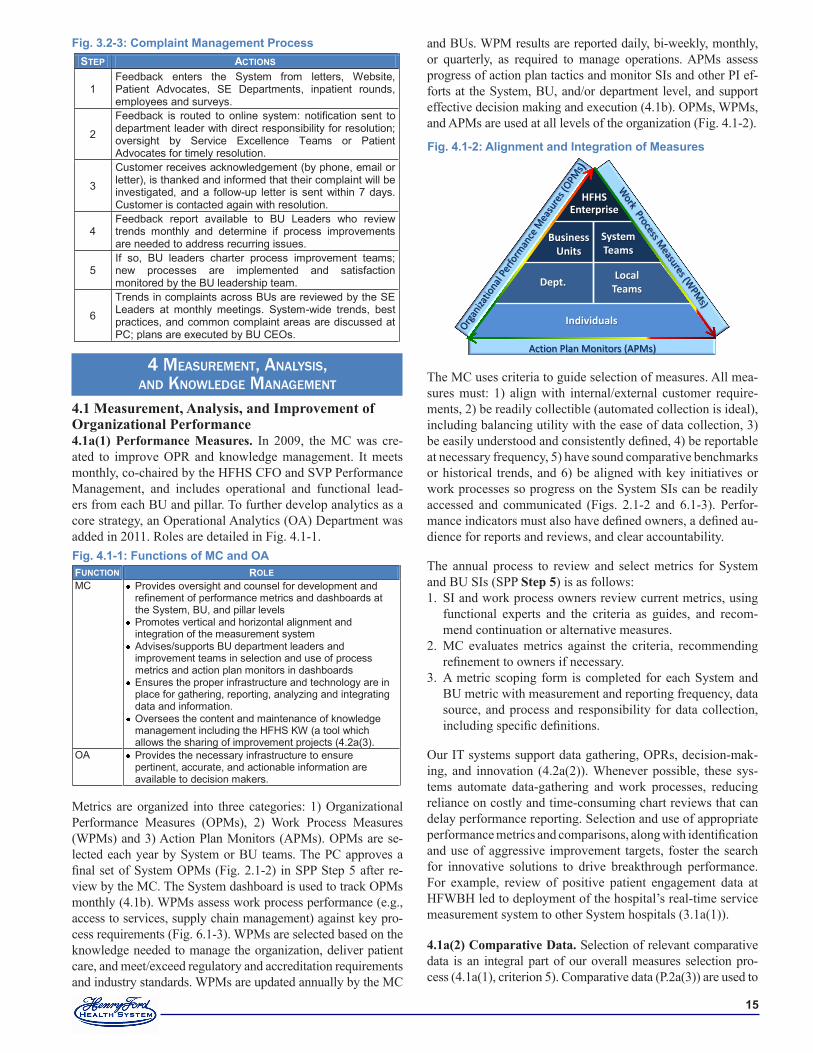
��
4 MeasureMent, analysis, and Knowledge ManageMent
4.1 Measurement, Analysis, and Improvement of Organizational Performance4.1a(1) Performance Measures. In 2009, the MC was cre-ated to improve OPR and knowledge management. It meets monthly, co-chaired by the HFHS CFO and SVP Performance Management, and includes operational and functional lead-ers from each BU and pillar. To further develop analytics as a core strategy, an Operational Analytics (OA) Department was added in 2011. Roles are detailed in Fig. 4.1-1.
Metrics are organized into three categories: 1) Organizational Performance Measures (OPMs), 2) Work Process Measures (WPMs) and 3) Action Plan Monitors (APMs). OPMs are se-lected each year by System or BU teams. The PC approves a final set of System OPMs (Fig. 2.1-2) in SPP Step 5 after re-view by the MC. The System dashboard is used to track OPMs monthly (4.1b). WPMs assess work process performance (e.g., access to services, supply chain management) against key pro-cess requirements (Fig. 6.1-3). WPMs are selected based on the knowledge needed to manage the organization, deliver patient care, and meet/exceed regulatory and accreditation requirements and industry standards. WPMs are updated annually by the MC
and BUs. WPM results are reported daily, bi-weekly, monthly, or quarterly, as required to manage operations. APMs assess progress of action plan tactics and monitor SIs and other PI ef-forts at the System, BU, and/or department level, and support effective decision making and execution (4.1b). OPMs, WPMs, and APMs are used at all levels of the organization (Fig. 4.1-2).
The MC uses criteria to guide selection of measures. All mea-sures must: 1) align with internal/external customer require-ments, 2) be readily collectible (automated collection is ideal), including balancing utility with the ease of data collection, 3) be easily understood and consistently defined, 4) be reportable at necessary frequency, 5) have sound comparative benchmarks or historical trends, and 6) be aligned with key initiatives or work processes so progress on the System SIs can be readily accessed and communicated (Figs. 2.1-2 and 6.1-3). Perfor-mance indicators must also have defined owners, a defined au-dience for reports and reviews, and clear accountability.
The annual process to review and select metrics for System and BU SIs (SPP Step 5) is as follows:
SI and work process owners review current metrics, using functional experts and the criteria as guides, and recom-mend continuation or alternative measures. MC evaluates metrics against the criteria, recommending refinement to owners if necessary. A metric scoping form is completed for each System and BU metric with measurement and reporting frequency, data source, and process and responsibility for data collection, including specific definitions.
Our IT systems support data gathering, OPRs, decision-mak-ing, and innovation (4.2a(2)). Whenever possible, these sys-tems automate data-gathering and work processes, reducing reliance on costly and time-consuming chart reviews that can delay performance reporting. Selection and use of appropriate performance metrics and comparisons, along with identification and use of aggressive improvement targets, foster the search for innovative solutions to drive breakthrough performance. For example, review of positive patient engagement data at HFWBH led to deployment of the hospital’s real-time service measurement system to other System hospitals (3.1a(1)).
4.1a(2) Comparative Data. Selection of relevant comparative data is an integral part of our overall measures selection pro-cess (4.1a(1), criterion 5). Comparative data (P.2a(3)) are used to
1.
2.
3.
FUNCTION ROLE MC Provides oversight and counsel for development and
refinement of performance metrics and dashboards at the System, BU, and pillar levels
Promotes vertical and horizontal alignment and integration of the measurement system
Advises/supports BU department leaders and improvement teams in selection and use of process metrics and action plan monitors in dashboards
Ensures the proper infrastructure and technology are in place for gathering, reporting, analyzing and integrating data and information.
Oversees the content and maintenance of knowledge management including the HFHS KW (a tool which allows the sharing of improvement projects (4.2a(3).
OA Provides the necessary infrastructure to ensure pertinent, accurate, and actionable information are available to decision makers.
Fig. �.�-�: Functions of MC and OA
Fig. �.�-�: Alignment and Integration of Measures
Action Plan Monitors (APMs)
HFHSEnterprise
Individuals
Dept.Local
Teams
Business Units
System Teams
Fig. �.�-�: Complaint Management ProcessSTEP ACTIONS
1 Feedback enters the System from letters, Website, Patient Advocates, SE Departments, inpatient rounds, employees and surveys.
2
Feedback is routed to online system: notification sent to department leader with direct responsibility for resolution; oversight by Service Excellence Teams or Patient Advocates for timely resolution.
3
Customer receives acknowledgement (by phone, email or letter), is thanked and informed that their complaint will be investigated, and a follow-up letter is sent within 7 days. Customer is contacted again with resolution.
4 Feedback report available to BU Leaders who review trends monthly and determine if process improvements are needed to address recurring issues.
5 If so, BU leaders charter process improvement teams; new processes are implemented and satisfaction monitored by the BU leadership team.
6
Trends in complaints across BUs are reviewed by the SE Leaders at monthly meetings. System-wide trends, best practices, and common complaint areas are discussed at PC; plans are executed by BU CEOs.
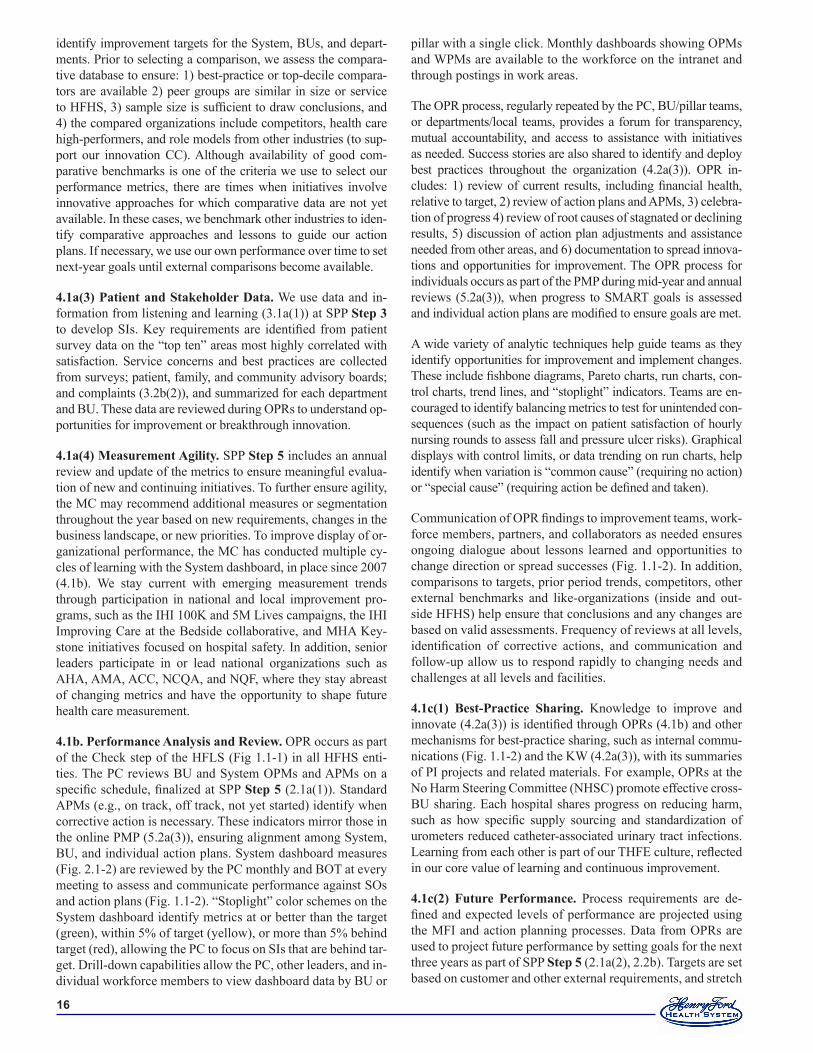
��
identify improvement targets for the System, BUs, and depart-ments. Prior to selecting a comparison, we assess the compara-tive database to ensure: 1) best-practice or top-decile compara-tors are available 2) peer groups are similar in size or service to HFHS, 3) sample size is sufficient to draw conclusions, and 4) the compared organizations include competitors, health care high-performers, and role models from other industries (to sup-port our innovation CC). Although availability of good com-parative benchmarks is one of the criteria we use to select our performance metrics, there are times when initiatives involve innovative approaches for which comparative data are not yet available. In these cases, we benchmark other industries to iden-tify comparative approaches and lessons to guide our action plans. If necessary, we use our own performance over time to set next-year goals until external comparisons become available.
4.1a(3) Patient and Stakeholder Data. We use data and in-formation from listening and learning (3.1a(1)) at SPP Step 3 to develop SIs. Key requirements are identified from patient survey data on the “top ten” areas most highly correlated with satisfaction. Service concerns and best practices are collected from surveys; patient, family, and community advisory boards; and complaints (3.2b(2)), and summarized for each department and BU. These data are reviewed during OPRs to understand op-portunities for improvement or breakthrough innovation.
4.1a(4) Measurement Agility. SPP Step 5 includes an annual review and update of the metrics to ensure meaningful evalua-tion of new and continuing initiatives. To further ensure agility, the MC may recommend additional measures or segmentation throughout the year based on new requirements, changes in the business landscape, or new priorities. To improve display of or-ganizational performance, the MC has conducted multiple cy-cles of learning with the System dashboard, in place since 2007 (4.1b). We stay current with emerging measurement trends through participation in national and local improvement pro-grams, such as the IHI 100K and 5M Lives campaigns, the IHI Improving Care at the Bedside collaborative, and MHA Key-stone initiatives focused on hospital safety. In addition, senior leaders participate in or lead national organizations such as AHA, AMA, ACC, NCQA, and NQF, where they stay abreast of changing metrics and have the opportunity to shape future health care measurement.
4.1b. Performance Analysis and Review. OPR occurs as part of the Check step of the HFLS (Fig 1.1-1) in all HFHS enti-ties. The PC reviews BU and System OPMs and APMs on a specific schedule, finalized at SPP Step 5 (2.1a(1)). Standard APMs (e.g., on track, off track, not yet started) identify when corrective action is necessary. These indicators mirror those in the online PMP (5.2a(3)), ensuring alignment among System, BU, and individual action plans. System dashboard measures (Fig. 2.1-2) are reviewed by the PC monthly and BOT at every meeting to assess and communicate performance against SOs and action plans (Fig. 1.1-2). “Stoplight” color schemes on the System dashboard identify metrics at or better than the target (green), within 5% of target (yellow), or more than 5% behind target (red), allowing the PC to focus on SIs that are behind tar-get. Drill-down capabilities allow the PC, other leaders, and in-dividual workforce members to view dashboard data by BU or
pillar with a single click. Monthly dashboards showing OPMs and WPMs are available to the workforce on the intranet and through postings in work areas.
The OPR process, regularly repeated by the PC, BU/pillar teams, or departments/local teams, provides a forum for transparency, mutual accountability, and access to assistance with initiatives as needed. Success stories are also shared to identify and deploy best practices throughout the organization (4.2a(3)). OPR in-cludes: 1) review of current results, including financial health, relative to target, 2) review of action plans and APMs, 3) celebra-tion of progress 4) review of root causes of stagnated or declining results, 5) discussion of action plan adjustments and assistance needed from other areas, and 6) documentation to spread innova-tions and opportunities for improvement. The OPR process for individuals occurs as part of the PMP during mid-year and annual reviews (5.2a(3)), when progress to SMART goals is assessed and individual action plans are modified to ensure goals are met.
A wide variety of analytic techniques help guide teams as they identify opportunities for improvement and implement changes. These include fishbone diagrams, Pareto charts, run charts, con-trol charts, trend lines, and “stoplight” indicators. Teams are en-couraged to identify balancing metrics to test for unintended con-sequences (such as the impact on patient satisfaction of hourly nursing rounds to assess fall and pressure ulcer risks). Graphical displays with control limits, or data trending on run charts, help identify when variation is “common cause” (requiring no action) or “special cause” (requiring action be defined and taken).
Communication of OPR findings to improvement teams, work-force members, partners, and collaborators as needed ensures ongoing dialogue about lessons learned and opportunities to change direction or spread successes (Fig. 1.1-2). In addition, comparisons to targets, prior period trends, competitors, other external benchmarks and like-organizations (inside and out-side HFHS) help ensure that conclusions and any changes are based on valid assessments. Frequency of reviews at all levels, identification of corrective actions, and communication and follow-up allow us to respond rapidly to changing needs and challenges at all levels and facilities.
4.1c(1) Best-Practice Sharing. Knowledge to improve and innovate (4.2a(3)) is identified through OPRs (4.1b) and other mechanisms for best-practice sharing, such as internal commu-nications (Fig. 1.1-2) and the KW (4.2a(3)), with its summaries of PI projects and related materials. For example, OPRs at the No Harm Steering Committee (NHSC) promote effective cross-BU sharing. Each hospital shares progress on reducing harm, such as how specific supply sourcing and standardization of urometers reduced catheter-associated urinary tract infections. Learning from each other is part of our THFE culture, reflected in our core value of learning and continuous improvement.
4.1c(2) Future Performance. Process requirements are de-fined and expected levels of performance are projected using the MFI and action planning processes. Data from OPRs are used to project future performance by setting goals for the next three years as part of SPP Step 5 (2.1a(2), 2.2b). Targets are set based on customer and other external requirements, and stretch
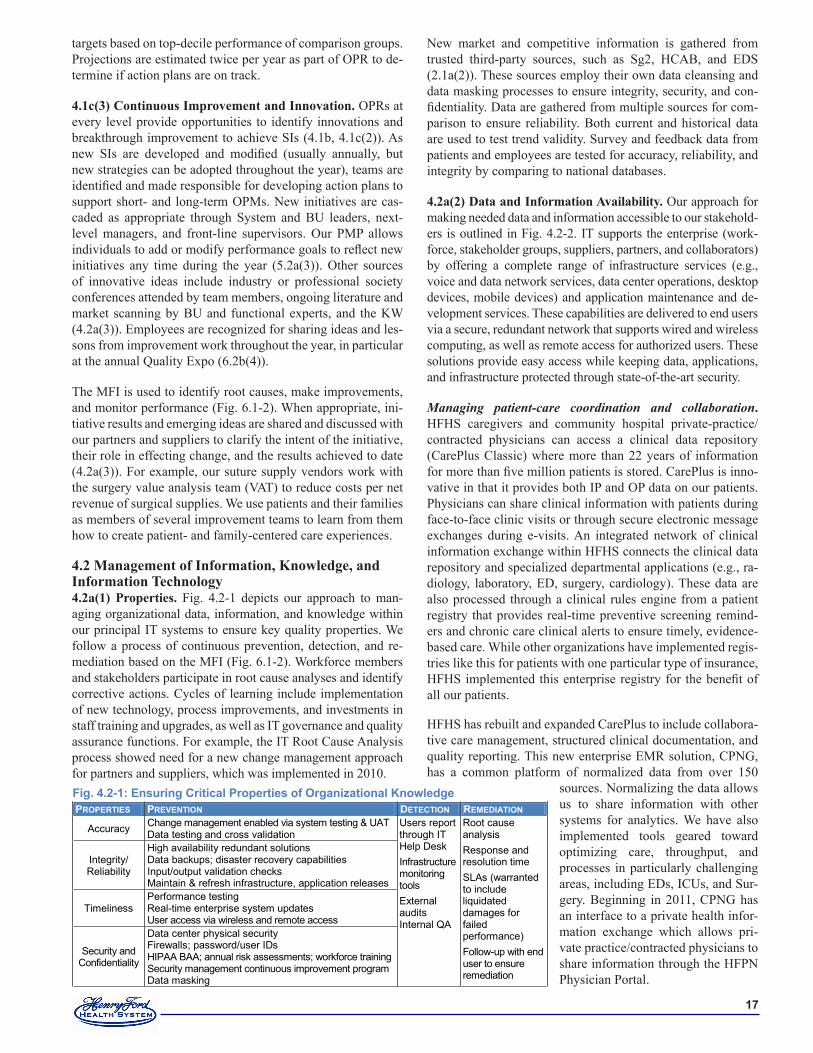
��
targets based on top-decile performance of comparison groups. Projections are estimated twice per year as part of OPR to de-termine if action plans are on track.
4.1c(3) Continuous Improvement and Innovation. OPRs at every level provide opportunities to identify innovations and breakthrough improvement to achieve SIs (4.1b, 4.1c(2)). As new SIs are developed and modified (usually annually, but new strategies can be adopted throughout the year), teams are identified and made responsible for developing action plans to support short- and long-term OPMs. New initiatives are cas-caded as appropriate through System and BU leaders, next-level managers, and front-line supervisors. Our PMP allows individuals to add or modify performance goals to reflect new initiatives any time during the year (5.2a(3)). Other sources of innovative ideas include industry or professional society conferences attended by team members, ongoing literature and market scanning by BU and functional experts, and the KW (4.2a(3)). Employees are recognized for sharing ideas and les-sons from improvement work throughout the year, in particular at the annual Quality Expo (6.2b(4)).
The MFI is used to identify root causes, make improvements, and monitor performance (Fig. 6.1-2). When appropriate, ini-tiative results and emerging ideas are shared and discussed with our partners and suppliers to clarify the intent of the initiative, their role in effecting change, and the results achieved to date (4.2a(3)). For example, our suture supply vendors work with the surgery value analysis team (VAT) to reduce costs per net revenue of surgical supplies. We use patients and their families as members of several improvement teams to learn from them how to create patient- and family-centered care experiences.
4.2 Management of Information, Knowledge, and Information Technology4.2a(1) Properties. Fig. 4.2-1 depicts our approach to man-aging organizational data, information, and knowledge within our principal IT systems to ensure key quality properties. We follow a process of continuous prevention, detection, and re-mediation based on the MFI (Fig. 6.1-2). Workforce members and stakeholders participate in root cause analyses and identify corrective actions. Cycles of learning include implementation of new technology, process improvements, and investments in staff training and upgrades, as well as IT governance and quality assurance functions. For example, the IT Root Cause Analysis process showed need for a new change management approach for partners and suppliers, which was implemented in 2010.
New market and competitive information is gathered from trusted third-party sources, such as Sg2, HCAB, and EDS (2.1a(2)). These sources employ their own data cleansing and data masking processes to ensure integrity, security, and con-fidentiality. Data are gathered from multiple sources for com-parison to ensure reliability. Both current and historical data are used to test trend validity. Survey and feedback data from patients and employees are tested for accuracy, reliability, and integrity by comparing to national databases.
4.2a(2) Data and Information Availability. Our approach for making needed data and information accessible to our stakehold-ers is outlined in Fig. 4.2-2. IT supports the enterprise (work-force, stakeholder groups, suppliers, partners, and collaborators) by offering a complete range of infrastructure services (e.g., voice and data network services, data center operations, desktop devices, mobile devices) and application maintenance and de-velopment services. These capabilities are delivered to end users via a secure, redundant network that supports wired and wireless computing, as well as remote access for authorized users. These solutions provide easy access while keeping data, applications, and infrastructure protected through state-of-the-art security.
Managing patient-care coordination and collaboration. HFHS caregivers and community hospital private-practice/contracted physicians can access a clinical data repository (CarePlus Classic) where more than 22 years of information for more than five million patients is stored. CarePlus is inno-vative in that it provides both IP and OP data on our patients. Physicians can share clinical information with patients during face-to-face clinic visits or through secure electronic message exchanges during e-visits. An integrated network of clinical information exchange within HFHS connects the clinical data repository and specialized departmental applications (e.g., ra-diology, laboratory, ED, surgery, cardiology). These data are also processed through a clinical rules engine from a patient registry that provides real-time preventive screening remind-ers and chronic care clinical alerts to ensure timely, evidence-based care. While other organizations have implemented regis-tries like this for patients with one particular type of insurance, HFHS implemented this enterprise registry for the benefit of all our patients.
HFHS has rebuilt and expanded CarePlus to include collabora-tive care management, structured clinical documentation, and quality reporting. This new enterprise EMR solution, CPNG, has a common platform of normalized data from over 150
sources. Normalizing the data allows us to share information with other systems for analytics. We have also implemented tools geared toward optimizing care, throughput, and processes in particularly challenging areas, including EDs, ICUs, and Sur-gery. Beginning in 2011, CPNG has an interface to a private health infor-mation exchange which allows pri-vate practice/contracted physicians to share information through the HFPN Physician Portal.
Fig. �.�-�: Ensuring Critical Properties of Organizational KnowledgePROPERTIES PREVENTION DETECTION REMEDIATION
Accuracy Change management enabled via system testing & UAT Data testing and cross validation
Users report through IT Help Desk Infrastructure monitoring tools External audits Internal QA
Root cause analysis Response and resolution time SLAs (warranted to include liquidated damages for failed performance) Follow-up with end user to ensure remediation
Integrity/ Reliability
High availability redundant solutions Data backups; disaster recovery capabilities Input/output validation checks Maintain & refresh infrastructure, application releases
Timeliness Performance testing Real-time enterprise system updates User access via wireless and remote access
Security and Confidentiality
Data center physical security Firewalls; password/user IDs HIPAA BAA; annual risk assessments; workforce training Security management continuous improvement program Data masking
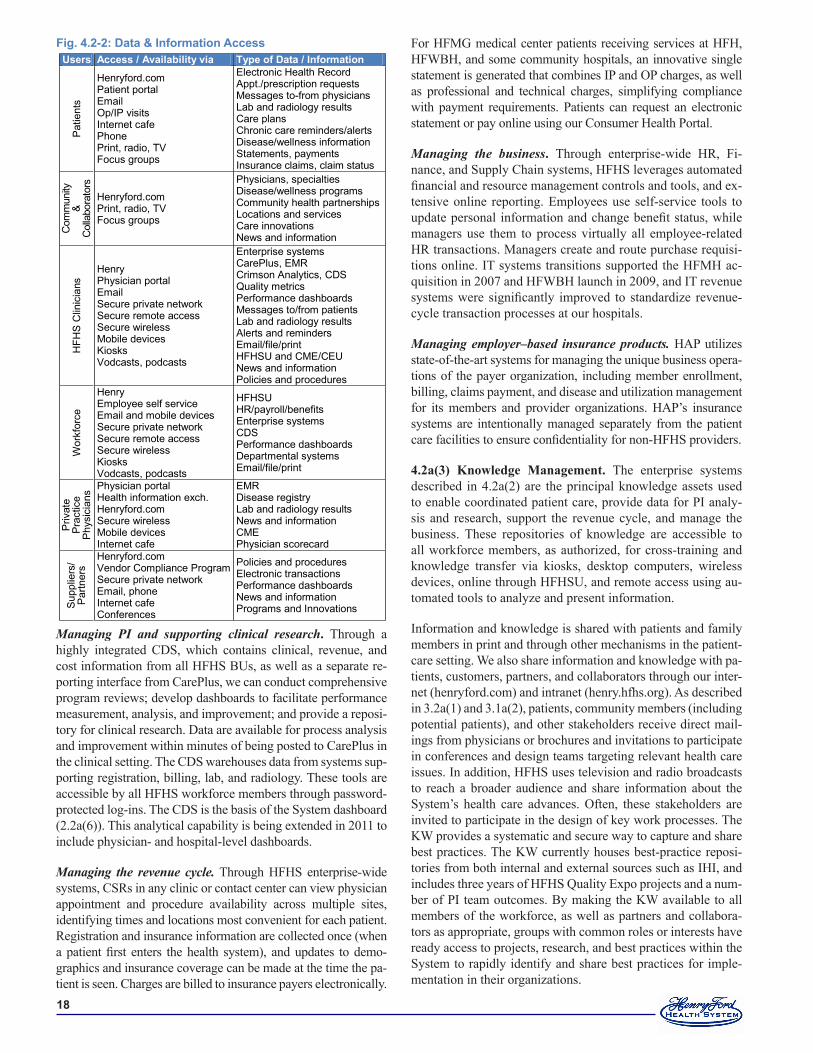
��
Managing PI and supporting clinical research. Through a highly integrated CDS, which contains clinical, revenue, and cost information from all HFHS BUs, as well as a separate re-porting interface from CarePlus, we can conduct comprehensive program reviews; develop dashboards to facilitate performance measurement, analysis, and improvement; and provide a reposi-tory for clinical research. Data are available for process analysis and improvement within minutes of being posted to CarePlus in the clinical setting. The CDS warehouses data from systems sup-porting registration, billing, lab, and radiology. These tools are accessible by all HFHS workforce members through password-protected log-ins. The CDS is the basis of the System dashboard (2.2a(6)). This analytical capability is being extended in 2011 to include physician- and hospital-level dashboards.
Managing the revenue cycle. Through HFHS enterprise-wide systems, CSRs in any clinic or contact center can view physician appointment and procedure availability across multiple sites, identifying times and locations most convenient for each patient. Registration and insurance information are collected once (when a patient first enters the health system), and updates to demo-graphics and insurance coverage can be made at the time the pa-tient is seen. Charges are billed to insurance payers electronically.
For HFMG medical center patients receiving services at HFH, HFWBH, and some community hospitals, an innovative single statement is generated that combines IP and OP charges, as well as professional and technical charges, simplifying compliance with payment requirements. Patients can request an electronic statement or pay online using our Consumer Health Portal.
Managing the business. Through enterprise-wide HR, Fi-nance, and Supply Chain systems, HFHS leverages automated financial and resource management controls and tools, and ex-tensive online reporting. Employees use self-service tools to update personal information and change benefit status, while managers use them to process virtually all employee-related HR transactions. Managers create and route purchase requisi-tions online. IT systems transitions supported the HFMH ac-quisition in 2007 and HFWBH launch in 2009, and IT revenue systems were significantly improved to standardize revenue-cycle transaction processes at our hospitals.
Managing employer–based insurance products. HAP utilizes state-of-the-art systems for managing the unique business opera-tions of the payer organization, including member enrollment, billing, claims payment, and disease and utilization management for its members and provider organizations. HAP’s insurance systems are intentionally managed separately from the patient care facilities to ensure confidentiality for non-HFHS providers.
4.2a(3) Knowledge Management. The enterprise systems described in 4.2a(2) are the principal knowledge assets used to enable coordinated patient care, provide data for PI analy-sis and research, support the revenue cycle, and manage the business. These repositories of knowledge are accessible to all workforce members, as authorized, for cross-training and knowledge transfer via kiosks, desktop computers, wireless devices, online through HFHSU, and remote access using au-tomated tools to analyze and present information.
Information and knowledge is shared with patients and family members in print and through other mechanisms in the patient-care setting. We also share information and knowledge with pa-tients, customers, partners, and collaborators through our inter-net (henryford.com) and intranet (henry.hfhs.org). As described in 3.2a(1) and 3.1a(2), patients, community members (including potential patients), and other stakeholders receive direct mail-ings from physicians or brochures and invitations to participate in conferences and design teams targeting relevant health care issues. In addition, HFHS uses television and radio broadcasts to reach a broader audience and share information about the System’s health care advances. Often, these stakeholders are invited to participate in the design of key work processes. The KW provides a systematic and secure way to capture and share best practices. The KW currently houses best-practice reposi-tories from both internal and external sources such as IHI, and includes three years of HFHS Quality Expo projects and a num-ber of PI team outcomes. By making the KW available to all members of the workforce, as well as partners and collabora-tors as appropriate, groups with common roles or interests have ready access to projects, research, and best practices within the System to rapidly identify and share best practices for imple-mentation in their organizations.
Users Access / Availability via Type of Data / Information P
atie
nts
Henryford.com Patient portal Email Op/IP visits Internet cafe Phone Print, radio, TV Focus groups
Electronic Health Record Appt./prescription requests Messages to-from physicians Lab and radiology results Care plans Chronic care reminders/alerts Disease/wellness information Statements, payments Insurance claims, claim status
Com
mun
ity
&
Col
labo
rato
rs
Henryford.com Print, radio, TV Focus groups
Physicians, specialties Disease/wellness programs Community health partnerships Locations and services Care innovations News and information
HFH
S C
linic
ians
Henry Physician portal Email Secure private network Secure remote access Secure wireless Mobile devices Kiosks Vodcasts, podcasts
Enterprise systems CarePlus, EMR Crimson Analytics, CDS Quality metrics Performance dashboards Messages to/from patients Lab and radiology results Alerts and reminders Email/file/print HFHSU and CME/CEU News and information Policies and procedures
Wor
kfor
ce
Henry Employee self service Email and mobile devices Secure private network Secure remote access Secure wireless Kiosks Vodcasts, podcasts
HFHSU HR/payroll/benefits Enterprise systems CDS Performance dashboards Departmental systems Email/file/print
Priv
ate
Pra
ctic
e P
hysi
cian
s Physician portal Health information exch. Henryford.com Secure wireless Mobile devices Internet cafe
EMR Disease registry Lab and radiology results News and information CME Physician scorecard
Sup
plie
rs/
Par
tner
s
Henryford.com Vendor Compliance Program Secure private network Email, phone Internet cafe Conferences
Policies and procedures Electronic transactions Performance dashboards News and information Programs and Innovations
Fig. �.�-�: Data & Information Access
��
Knowledge Management includes information to accomplish work, such as policies, procedures, and job specific training; improve and innovate once an opportunity is identified through the OPR; and address changing organizational needs as part of Step 2 of the SPP (2.1a(1)). Under the direction of the PC, and in response to OPR findings, pillar and other System teams are formed with cross-organizational representation to innovate and improve key processes or work systems (6.2b(4)).
4.2b(1) Hardware and Software Properties.Infrastructure. To protect, secure, and ensure the reliability of HFHS information and knowledge, we deploy proven tech-nologies supported by a trained technology team.
The data center physical plant and the computer room tech-nologies are protected by intelligent key card access, sign-in/sign-out procedures, and video monitoring.Firewalls, intrusion detection tools, email monitoring and filtering capabilities, and automatic security patches for servers and desktops protect against cyber attacks.Data encryption secures sensitive outbound information, such as email with electronic patient information.Automated alert systems and monitoring tools notify techni-cal support personnel if a database, application, network, or server exceeds performance thresholds.
Reliable telephone communications for patients, employees, suppliers, and partners are enabled by a three-tiered network. Voice circuits and software provide service to multiple contact centers using interactive voice response (IVR) and skills-based routing tools. Siemens, our infrastructure services provider, serves as the custodian of our environment through a long-term partnership agreement. Through comprehensive service-level agreements (SLAs), Siemens is contractually committed to 99.99% system availability and prompt IT Help Desk response and resolution (Fig. 7.1-41). HFHS IT and business managers review operational performance results regularly with the Chief Information Officer (CIO), who reports concerns to the PC.
Applications. All HFHS IT systems are either purchased commercial products licensed through a competitive procure-ment process or applications designed and developed by our IT application partner, CSC. IT employs extensive user col-laboration to define requirements. Users evaluate alternatives, configure vendor products, and assist in the design, build, and implementation of in-house solutions. To ensure user-friendli-ness, IT utilizes various user groups such as Patient Advisory Groups and the eHealth Steering Committee and the Clinical Systems Steering Committee (physicians and other caregiv-ers) to gather feedback regarding ease-of-use, reliability and integrity. CPNG includes an innovative “Feedback Button” to provide immediate feedback at the point of patient care. The applications development team analyzes this feedback to in-corporate system improvements. In addition, IT oversees sys-tematic user-acceptance testing (UAT) when implementing system improvements and new releases. Users interact with the system to evaluate functionality and usability before the “go-live” decision is made. Intensive end-user training, business process re-engineering, “go-live” support, and rapid problem call resolution by the IT Help Desk are incorporated into each installation.
•
•
•
•
5 WorkForce Focus5.1 Workforce Environment5.1a(1) Capability and Capacity. HFHS assesses workforce capacity and capability during the SPP, OPRs of workforce metrics, and annual PMP and development planning process-es (Fig. 5.2-4). During the SPP, the PC reviews HR’s analysis (expected growth, vacancy rates, turnover, future competency forecasting, training needs, staffing ratios and quality indica-tors) (Fig. 2.1-1, Steps 1-2). This drives People pillar SOs, SIs, and action plans (Steps 2-6). Each month, the PC, BU lead-ers, and HRET review System and HR dashboards as part of OPRs (4.1b). Requests for new positions are evaluated by BU leadership teams against budget requirements, staffing ratios, and business plans, including growth and expansion SIs. Action plans address skill shortages, existing competencies and gaps, succession planning, pipeline development, diversity needs, and onboarding to improve retention (Figs. 7.3-2 – 7.3-4). Physi-cian capacity analyses incorporate current and projected patient volumes, new clinical service needs, and quality measures. In 2009, HRET created a pilot workforce plan for System Pathol-ogy and Lab, forecasting 10-year needs. Based on key learn-ings, HRET is applying a new workforce planning strategy and guidelines to other critical areas. We are also piloting a staffing model to move HFHS to a more flexible blend of fixed and vari-able human capital resources, easily adapted to changing staff-ing needs. Talent Selection Specialists (TSSs) and HR Business Partners (BPs) work with System and BU teams on staffing and capacity changes. In 2010, based on Baldrige feedback, HFHS implemented a System-wide process to track volunteer demo-graphics, time, activities, and assignment trends.
4.2b(2) Emergency Availability. The IT disaster recovery (ITDR) program is part of HFHS’s overall emergency readi-ness program (6.1c). It ensures rapid recovery of all critical systems. We employ both local recovery capabilities and a remote warm site through a third-party vendor. A number of progressive improvements have been implemented, such as our three-tier redundant network with geographically sepa-rated hubs. This prevents the network from crashing if one or the other site is disabled, further ensuring data integrity and prompt system recovery. Major upgrades to backup and recov-ery technologies were completed in 2009.
The design of CPNG includes a unique high availability/ failover architecture to ensure this critical tool is available and accessible 24/7 for both IP and OP care. IT ensures constant readiness and the effectiveness of ITDR capabilities by testing at least annu-ally. Business continuity capabilities are tested throughout the year during scheduled system downtime. Numerous process im-provements identified through testing have been implemented: enhanced Incident Response Management process and proce-dure, updated “call-trees” for IT and the user community, valida-tion of recovery plans for over 200 non-critical business systems, and end-user participation in system recovery. A new ITDR test scorecard monitors DR capability and helps identify improve-ment opportunities. Finally, in response to pandemic concerns in 2009 and 2010, a comprehensive pandemic preparation effort was coordinated with the System’s Hospital Incident Command System (HICS) program (6.1c). Following each incident, results were evaluated to identify and implement improvements.
�0
5.1a(2) New Workforce Members. In 2010, based on results and feedback from applicants and hiring managers, we en-hanced recruitment, hiring, placement, and retention approach-es System-wide. On-site TSSs partner with hiring managers to understand local requirements and cultural needs, and ensure right person/right job/right time. We also assess quality-of-hire and new-hire satisfaction (AOS).
Recruiting, hiring. HFHS uses traditional and non-traditional methods and sources to attract talent: college recruiting, intern-ships, volunteers, on-site job fairs, student career days, employee referral bonuses, job boards, social media and networking sites, niche organizations, optimized search engine capabilities, and a national online presence. We use interactive recruiting tools and automated job marketing to target potential employees. Referral sources include employees, volunteers, physicians, and patients. Our applicant tracking system has separate portals for key work-force segments. Managers receive status reports for each open-ing, and senior leaders receive monthly summary data (System, BU) on open positions, days to fill, and vacancy rates (includ-ing physicians) (Figs. 7.3-1 and 7.3-2). To recruit HFMG physi-cians, we solicit referrals and use online campaigns, announce-ments within physician communities, and presence at relevant conferences. Volunteers are recruited through internal referrals or community relationships; interviewed, selected, and oriented using System-wide processes; then placed after mandatory train-ing based on skills, desired schedule, and BU need.
Retaining. We promote retention System-wide through behav-ioral-based interviewing, consistent placement and onboard-ing processes, and ongoing reinforcement of our vision and culture, THFE, performance expectations, and robust reward structures. Supported by HR, managers review results of Gal-lup surveys (5.2b(1)), exit interviews, and focus groups to for-mulate and execute department-specific action plans to reduce turnover (Figs. 7.3-3 and 7.3-4). Career development oppor-tunities, such as HFHSU and the leadership academies, build employee skills and incorporate mentoring relationships that further promote retention (5.2c(1,4)).
Ensuring diversity. To ensure the workforce reflects our com-munities, we develop diverse candidate pools from employee referrals, community outreach, and organizational partner-ships. In areas of under-representation, Talent Selection Team (TST) and Office of Workforce Diversity (OWD) collaborate on outreach to community organizations, local churches, and online diversity job boards. HFHS actively promotes health care careers through a community consortium with the Detroit Work-force Development Department, Henry Ford Community Col-lege (HFCC), and other innovative partnerships:
Hire Detroit: With community development organizations, source entry-level talent for jobs with competitive pay and benefits.Henry Ford Early College: With local schools and HFCC, prepare students for health care professions (1.2c(1)).Professional Development Program: For entry-level em-ployees wishing to advance to professional positions.Annual Diversity Celebration: Link HFHS and community partners to celebrate diversity, promote health care careers, and grow diverse feeder pools.
•
•
•
•
5.1a(3) Work Accomplishment.We organize work around fundamental processes on which we overlay key leadership structures, such as the PC, pillar teams, and LEAP, creating a cross-functional, collaborative culture. Continual focus on THFE enables us to accomplish our work (Fig. 6.1-1) and address challenges by implement-ing System and BU action plans (2.2a(1,2)) and the PMP (5.2a(3)). We capitalize on our CCs of innovation and collaboration by aligning and cascading goals through the PMP. We capitalize on our CC of care coordination to reinforce our focus on delivering exceptional care to each patient; by setting bold goals (6.1b(2)) and sharing best practices (4.2a(3)), we exceed performance expectations routinely. We use our learning academies and other HFHSU offer-ings to build team-based skills (5.2c(1)) and empower the workforce to leverage our capabilities in ways that exceed performance expectations and differentiate us from com-petitors (3.1b(1,2)). We address our strategic challenges through organizational performance and dashboard reviews (4.1b) and deploy multi-disciplinary teams to address and accomplish action plans.
5.1a(4) Workforce Change Management. Prior to opening HFWBH, we redesigned our recruitment, orientation, and com-munications processes to ensure System capacity and capability needs were met as we staffed the new facility and encouraged existing employees to consider redeployment options. With Lean tools, we reduced HFWBH time-to-fill, dramatically im-proving vacancy rates, a best practice adopted System-wide (Fig. 7.3-2). We prepare our workforce for changing capabil-ity and capacity needs by conducting regular gap analyses and designing training for workforce segments with the greatest need. When faced with the need for workforce reduction, HR and managers partner on placement solutions that leverage our size and integration to redeploy talent internally. We conduct adverse impact analyses and match deployed individuals to po-sitions that are specifically suited to their qualifications and tal-ents. We assist displaced employees with resume development, interview techniques, and career counseling. A displaced em-ployee who leaves HFHS receives a generous severance, may be recalled for up to one year, and if rehired within two years, re-acquires prior seniority. We prepared for and managed pe-riods of rapid workforce growth at HFWBH and HFWH by conducting workforce planning sessions with HR, finance, and department leaders. These strategies reduced agency staff use (Fig. 7.3-2) and established new best practices for System de-ployment as we continue to grow.
5.1b(1) Workplace Environment. Fig. 5.1-1 shows key mea-sures and targets for workplace health, safety, and security.
Workforce health. All workforce members undergo pre-place-ment health screening that creates a baseline for annual health status monitoring by Employee Health Services (EHS). System-wide policies and processes address TB exposure, immunizations, and respiratory fit testing (Fig. 7.3-5). HFHS partners with HAP to offer Health Engagement (HE), a health benefits approach that ties employees’ clinical results and healthy behaviors to lower premiums. Participants meet with a primary care physician
•
•
•
•
•
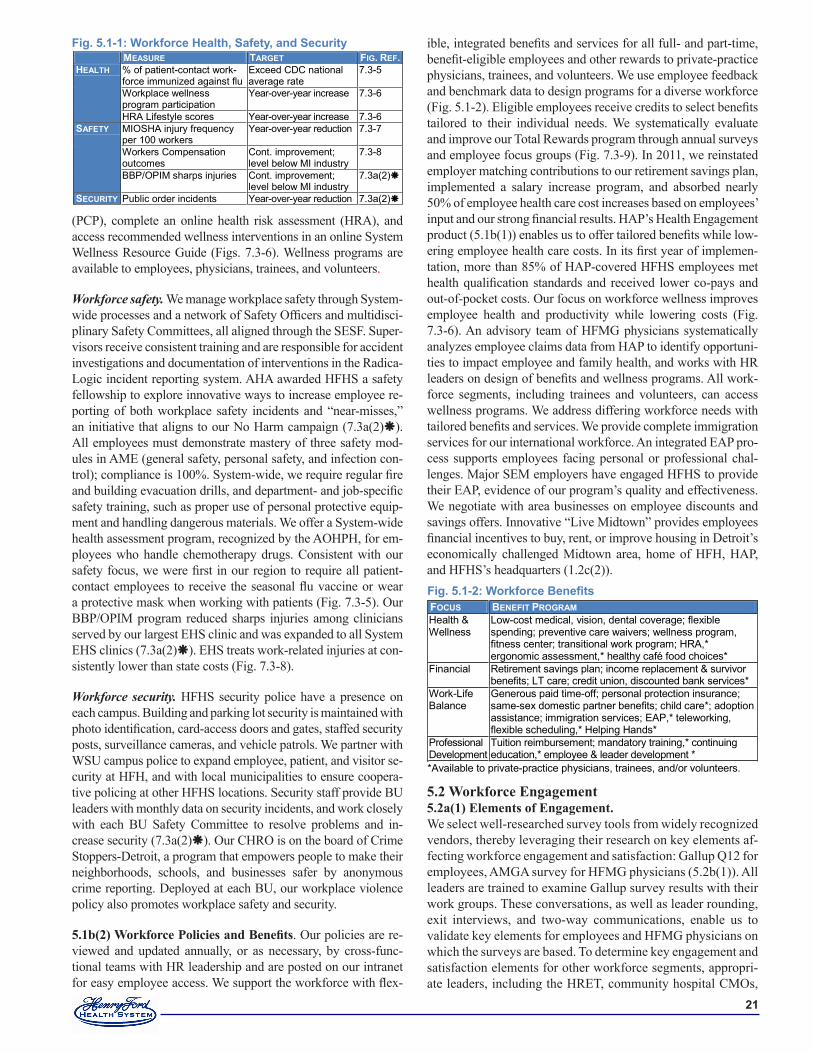
��
(PCP), complete an online health risk assessment (HRA), and access recommended wellness interventions in an online System Wellness Resource Guide (Figs. 7.3-6). Wellness programs are available to employees, physicians, trainees, and volunteers.
Workforce safety. We manage workplace safety through System-wide processes and a network of Safety Officers and multidisci-plinary Safety Committees, all aligned through the SESF. Super-visors receive consistent training and are responsible for accident investigations and documentation of interventions in the Radica-Logic incident reporting system. AHA awarded HFHS a safety fellowship to explore innovative ways to increase employee re-porting of both workplace safety incidents and “near-misses,” an initiative that aligns to our No Harm campaign (7.3a(2)). All employees must demonstrate mastery of three safety mod-ules in AME (general safety, personal safety, and infection con-trol); compliance is 100%. System-wide, we require regular fire and building evacuation drills, and department- and job-specific safety training, such as proper use of personal protective equip-ment and handling dangerous materials. We offer a System-wide health assessment program, recognized by the AOHPH, for em-ployees who handle chemotherapy drugs. Consistent with our safety focus, we were first in our region to require all patient-contact employees to receive the seasonal flu vaccine or wear a protective mask when working with patients (Fig. 7.3-5). Our BBP/OPIM program reduced sharps injuries among clinicians served by our largest EHS clinic and was expanded to all System EHS clinics (7.3a(2)). EHS treats work-related injuries at con-sistently lower than state costs (Fig. 7.3-8).
Workforce security. HFHS security police have a presence on each campus. Building and parking lot security is maintained with photo identification, card-access doors and gates, staffed security posts, surveillance cameras, and vehicle patrols. We partner with WSU campus police to expand employee, patient, and visitor se-curity at HFH, and with local municipalities to ensure coopera-tive policing at other HFHS locations. Security staff provide BU leaders with monthly data on security incidents, and work closely with each BU Safety Committee to resolve problems and in-crease security (7.3a(2)). Our CHRO is on the board of Crime Stoppers-Detroit, a program that empowers people to make their neighborhoods, schools, and businesses safer by anonymous crime reporting. Deployed at each BU, our workplace violence policy also promotes workplace safety and security.
5.1b(2) Workforce Policies and Benefits. Our policies are re-viewed and updated annually, or as necessary, by cross-func-tional teams with HR leadership and are posted on our intranet for easy employee access. We support the workforce with flex-
ible, integrated benefits and services for all full- and part-time, benefit-eligible employees and other rewards to private-practice physicians, trainees, and volunteers. We use employee feedback and benchmark data to design programs for a diverse workforce (Fig. 5.1-2). Eligible employees receive credits to select benefits tailored to their individual needs. We systematically evaluate and improve our Total Rewards program through annual surveys and employee focus groups (Fig. 7.3-9). In 2011, we reinstated employer matching contributions to our retirement savings plan, implemented a salary increase program, and absorbed nearly 50% of employee health care cost increases based on employees’ input and our strong financial results. HAP’s Health Engagement product (5.1b(1)) enables us to offer tailored benefits while low-ering employee health care costs. In its first year of implemen-tation, more than 85% of HAP-covered HFHS employees met health qualification standards and received lower co-pays and out-of-pocket costs. Our focus on workforce wellness improves employee health and productivity while lowering costs (Fig. 7.3-6). An advisory team of HFMG physicians systematically analyzes employee claims data from HAP to identify opportuni-ties to impact employee and family health, and works with HR leaders on design of benefits and wellness programs. All work-force segments, including trainees and volunteers, can access wellness programs. We address differing workforce needs with tailored benefits and services. We provide complete immigration services for our international workforce. An integrated EAP pro-cess supports employees facing personal or professional chal-lenges. Major SEM employers have engaged HFHS to provide their EAP, evidence of our program’s quality and effectiveness. We negotiate with area businesses on employee discounts and savings offers. Innovative “Live Midtown” provides employees financial incentives to buy, rent, or improve housing in Detroit’s economically challenged Midtown area, home of HFH, HAP, and HFHS’s headquarters (1.2c(2)).
5.2 Workforce Engagement 5.2a(1) Elements of Engagement.We select well-researched survey tools from widely recognized vendors, thereby leveraging their research on key elements af-fecting workforce engagement and satisfaction: Gallup Q12 for employees, AMGA survey for HFMG physicians (5.2b(1)). All leaders are trained to examine Gallup survey results with their work groups. These conversations, as well as leader rounding, exit interviews, and two-way communications, enable us to validate key elements for employees and HFMG physicians on which the surveys are based. To determine key engagement and satisfaction elements for other workforce segments, appropri-ate leaders, including the HRET, community hospital CMOs,
MEASURE TARGET FIG. REF. HEALTH % of patient-contact work-
force immunized against flu Exceed CDC national average rate
7.3-5
Workplace wellness program participation
Year-over-year increase 7.3-6
HRA Lifestyle scores Year-over-year increase 7.3-6 SAFETY MIOSHA injury frequency
per 100 workers Year-over-year reduction 7.3-7
Workers Compensation outcomes
Cont. improvement; level below MI industry
7.3-8
BBP/OPIM sharps injuries Cont. improvement; level below MI industry
7.3a(2)
SECURITY Public order incidents Year-over-year reduction 7.3a(2)
Fig. �.�-�: Workforce Health, Safety, and Security
Fig. 5.1-2: Workforce BenefitsFOCUS BENEFIT PROGRAM Health & Wellness
Low-cost medical, vision, dental coverage; flexible spending; preventive care waivers; wellness program, fitness center; transitional work program; HRA,* ergonomic assessment,* healthy café food choices*
Financial Retirement savings plan; income replacement & survivor benefits; LT care; credit union, discounted bank services*
Work-Life Balance
Generous paid time-off; personal protection insurance; same-sex domestic partner benefits; child care*; adoption assistance; immigration services; EAP,* teleworking, flexible scheduling,* Helping Hands*
Professional Development
Tuition reimbursement; mandatory training,* continuing education,* employee & leader development *
*Available to private-practice physicians, trainees, and/or volunteers.
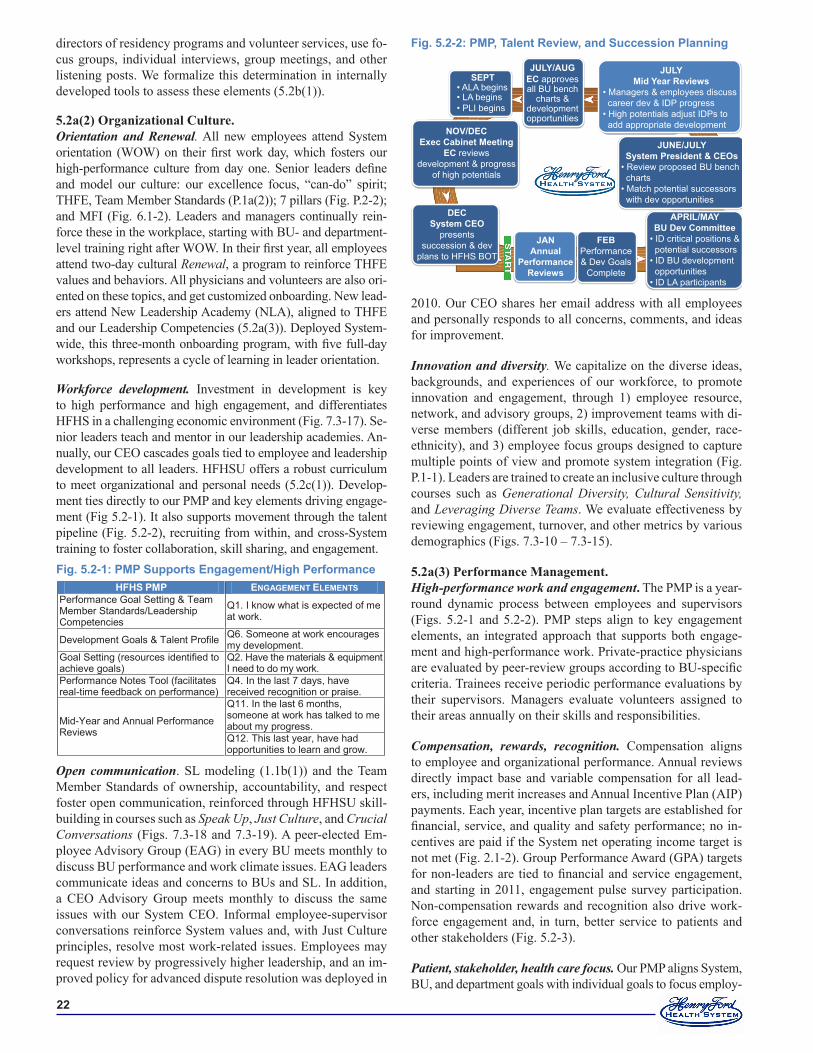
��
directors of residency programs and volunteer services, use fo-cus groups, individual interviews, group meetings, and other listening posts. We formalize this determination in internally developed tools to assess these elements (5.2b(1)).
5.2a(2) Organizational Culture.Orientation and Renewal. All new employees attend System orientation (WOW) on their first work day, which fosters our high-performance culture from day one. Senior leaders define and model our culture: our excellence focus, “can-do” spirit; THFE, Team Member Standards (P.1a(2)); 7 pillars (Fig. P.2-2); and MFI (Fig. 6.1-2). Leaders and managers continually rein-force these in the workplace, starting with BU- and department-level training right after WOW. In their first year, all employees attend two-day cultural Renewal, a program to reinforce THFE values and behaviors. All physicians and volunteers are also ori-ented on these topics, and get customized onboarding. New lead-ers attend New Leadership Academy (NLA), aligned to THFE and our Leadership Competencies (5.2a(3)). Deployed System-wide, this three-month onboarding program, with five full-day workshops, represents a cycle of learning in leader orientation.
Workforce development. Investment in development is key to high performance and high engagement, and differentiates HFHS in a challenging economic environment (Fig. 7.3-17). Se-nior leaders teach and mentor in our leadership academies. An-nually, our CEO cascades goals tied to employee and leadership development to all leaders. HFHSU offers a robust curriculum to meet organizational and personal needs (5.2c(1)). Develop-ment ties directly to our PMP and key elements driving engage-ment (Fig 5.2-1). It also supports movement through the talent pipeline (Fig. 5.2-2), recruiting from within, and cross-System training to foster collaboration, skill sharing, and engagement.
Open communication. SL modeling (1.1b(1)) and the Team Member Standards of ownership, accountability, and respect foster open communication, reinforced through HFHSU skill-building in courses such as Speak Up, Just Culture, and Crucial Conversations (Figs. 7.3-18 and 7.3-19). A peer-elected Em-ployee Advisory Group (EAG) in every BU meets monthly to discuss BU performance and work climate issues. EAG leaders communicate ideas and concerns to BUs and SL. In addition, a CEO Advisory Group meets monthly to discuss the same issues with our System CEO. Informal employee-supervisor conversations reinforce System values and, with Just Culture principles, resolve most work-related issues. Employees may request review by progressively higher leadership, and an im-proved policy for advanced dispute resolution was deployed in
2010. Our CEO shares her email address with all employees and personally responds to all concerns, comments, and ideas for improvement.
Innovation and diversity. We capitalize on the diverse ideas, backgrounds, and experiences of our workforce, to promote innovation and engagement, through 1) employee resource, network, and advisory groups, 2) improvement teams with di-verse members (different job skills, education, gender, race-ethnicity), and 3) employee focus groups designed to capture multiple points of view and promote system integration (Fig. P.1-1). Leaders are trained to create an inclusive culture through courses such as Generational Diversity, Cultural Sensitivity, and Leveraging Diverse Teams. We evaluate effectiveness by reviewing engagement, turnover, and other metrics by various demographics (Figs. 7.3-10 – 7.3-15).
5.2a(3) Performance Management. High-performance work and engagement. The PMP is a year-round dynamic process between employees and supervisors (Figs. 5.2-1 and 5.2-2). PMP steps align to key engagement elements, an integrated approach that supports both engage-ment and high-performance work. Private-practice physicians are evaluated by peer-review groups according to BU-specific criteria. Trainees receive periodic performance evaluations by their supervisors. Managers evaluate volunteers assigned to their areas annually on their skills and responsibilities.
Compensation, rewards, recognition. Compensation aligns to employee and organizational performance. Annual reviews directly impact base and variable compensation for all lead-ers, including merit increases and Annual Incentive Plan (AIP) payments. Each year, incentive plan targets are established for financial, service, and quality and safety performance; no in-centives are paid if the System net operating income target is not met (Fig. 2.1-2). Group Performance Award (GPA) targets for non-leaders are tied to financial and service engagement, and starting in 2011, engagement pulse survey participation. Non-compensation rewards and recognition also drive work-force engagement and, in turn, better service to patients and other stakeholders (Fig. 5.2-3).
Patient, stakeholder, health care focus. Our PMP aligns System, BU, and department goals with individual goals to focus employ-
HFHS PMP ENGAGEMENT ELEMENTS Performance Goal Setting & Team Member Standards/Leadership Competencies
Q1. I know what is expected of me at work.
Development Goals & Talent Profile Q6. Someone at work encourages my development.
Goal Setting (resources identified to achieve goals)
Q2. Have the materials & equipment I need to do my work.
Performance Notes Tool (facilitates real-time feedback on performance)
Q4. In the last 7 days, have received recognition or praise.
Mid-Year and Annual Performance Reviews
Q11. In the last 6 months, someone at work has talked to me about my progress. Q12. This last year, have had opportunities to learn and grow.
Fig. �.�-�: PMP Supports Engagement/High Performance
SEPT• ALA begins• LA begins• PLI begins
JULY/AUGEC approves all BU bench
charts &development opportunities
JULYMid Year Reviews
• Managers & employees discusscareer dev & IDP progress
• High potentials adjust IDPs to add appropriate development
NOV/DECExec Cabinet Meeting
EC reviews development & progress
of high potentials
DECSystem CEO
presents succession & dev
plans to HFHS BOT
JUNE/JULYSystem President & CEOs
• Review proposed BU benchcharts
• Match potential successorswith dev opportunities
APRIL/MAYBU Dev Committee
• ID critical positions &potential successors
• ID BU developmentopportunities
• ID LA participants
JANAnnual
Performance Reviews
FEBPerformance & Dev Goals
Complete
Fig. �.�-�: PMP, Talent Review, and Succession Planning
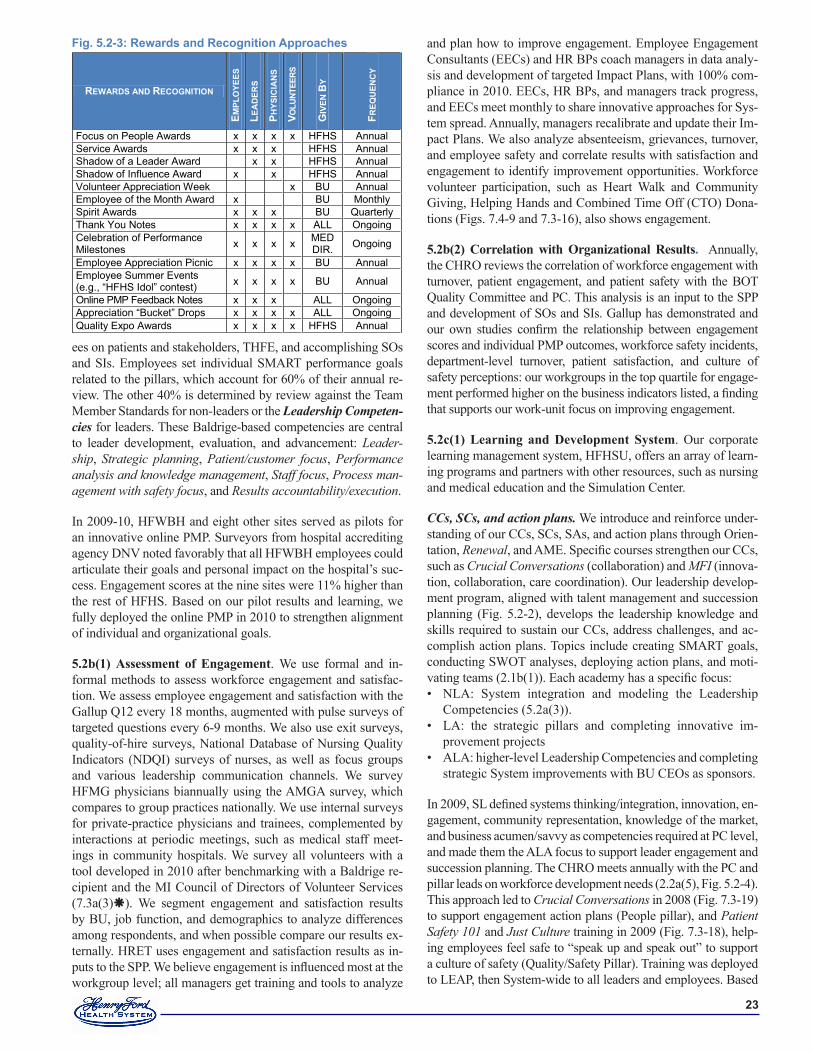
��
ees on patients and stakeholders, THFE, and accomplishing SOs and SIs. Employees set individual SMART performance goals related to the pillars, which account for 60% of their annual re-view. The other 40% is determined by review against the Team Member Standards for non-leaders or the Leadership Competen-cies for leaders. These Baldrige-based competencies are central to leader development, evaluation, and advancement: Leader-ship, Strategic planning, Patient/customer focus, Performance analysis and knowledge management, Staff focus, Process man-agement with safety focus, and Results accountability/execution.
In 2009-10, HFWBH and eight other sites served as pilots for an innovative online PMP. Surveyors from hospital accrediting agency DNV noted favorably that all HFWBH employees could articulate their goals and personal impact on the hospital’s suc-cess. Engagement scores at the nine sites were 11% higher than the rest of HFHS. Based on our pilot results and learning, we fully deployed the online PMP in 2010 to strengthen alignment of individual and organizational goals.
5.2b(1) Assessment of Engagement. We use formal and in-formal methods to assess workforce engagement and satisfac-tion. We assess employee engagement and satisfaction with the Gallup Q12 every 18 months, augmented with pulse surveys of targeted questions every 6-9 months. We also use exit surveys, quality-of-hire surveys, National Database of Nursing Quality Indicators (NDQI) surveys of nurses, as well as focus groups and various leadership communication channels. We survey HFMG physicians biannually using the AMGA survey, which compares to group practices nationally. We use internal surveys for private-practice physicians and trainees, complemented by interactions at periodic meetings, such as medical staff meet-ings in community hospitals. We survey all volunteers with a tool developed in 2010 after benchmarking with a Baldrige re-cipient and the MI Council of Directors of Volunteer Services (7.3a(3)). We segment engagement and satisfaction results by BU, job function, and demographics to analyze differences among respondents, and when possible compare our results ex-ternally. HRET uses engagement and satisfaction results as in-puts to the SPP. We believe engagement is influenced most at the workgroup level; all managers get training and tools to analyze
and plan how to improve engagement. Employee Engagement Consultants (EECs) and HR BPs coach managers in data analy-sis and development of targeted Impact Plans, with 100% com-pliance in 2010. EECs, HR BPs, and managers track progress, and EECs meet monthly to share innovative approaches for Sys-tem spread. Annually, managers recalibrate and update their Im-pact Plans. We also analyze absenteeism, grievances, turnover, and employee safety and correlate results with satisfaction and engagement to identify improvement opportunities. Workforce volunteer participation, such as Heart Walk and Community Giving, Helping Hands and Combined Time Off (CTO) Dona-tions (Figs. 7.4-9 and 7.3-16), also shows engagement.
5.2b(2) Correlation with Organizational Results. Annually, the CHRO reviews the correlation of workforce engagement with turnover, patient engagement, and patient safety with the BOT Quality Committee and PC. This analysis is an input to the SPP and development of SOs and SIs. Gallup has demonstrated and our own studies confirm the relationship between engagement scores and individual PMP outcomes, workforce safety incidents, department-level turnover, patient satisfaction, and culture of safety perceptions: our workgroups in the top quartile for engage-ment performed higher on the business indicators listed, a finding that supports our work-unit focus on improving engagement.
5.2c(1) Learning and Development System. Our corporate learning management system, HFHSU, offers an array of learn-ing programs and partners with other resources, such as nursing and medical education and the Simulation Center.
CCs, SCs, and action plans. We introduce and reinforce under-standing of our CCs, SCs, SAs, and action plans through Orien-tation, Renewal, and AME. Specific courses strengthen our CCs, such as Crucial Conversations (collaboration) and MFI (innova-tion, collaboration, care coordination). Our leadership develop-ment program, aligned with talent management and succession planning (Fig. 5.2-2), develops the leadership knowledge and skills required to sustain our CCs, address challenges, and ac-complish action plans. Topics include creating SMART goals, conducting SWOT analyses, deploying action plans, and moti-vating teams (2.1b(1)). Each academy has a specific focus:
NLA: System integration and modeling the Leadership Competencies (5.2a(3)). LA: the strategic pillars and completing innovative im-provement projectsALA: higher-level Leadership Competencies and completing strategic System improvements with BU CEOs as sponsors.
In 2009, SL defined systems thinking/integration, innovation, en-gagement, community representation, knowledge of the market, and business acumen/savvy as competencies required at PC level, and made them the ALA focus to support leader engagement and succession planning. The CHRO meets annually with the PC and pillar leads on workforce development needs (2.2a(5), Fig. 5.2-4). This approach led to Crucial Conversations in 2008 (Fig. 7.3-19) to support engagement action plans (People pillar), and Patient Safety 101 and Just Culture training in 2009 (Fig. 7.3-18), help-ing employees feel safe to “speak up and speak out” to support a culture of safety (Quality/Safety Pillar). Training was deployed to LEAP, then System-wide to all leaders and employees. Based
•
•
•
REWARDS AND RECOGNITION
EMPL
OYE
ES
LEA
DER
S
PHYS
ICIA
NS
VOLU
NTEE
RS
GIV
EN B
Y
FREQ
UEN
CY
Focus on People Awards x x x x HFHS Annual Service Awards x x x HFHS Annual Shadow of a Leader Award x x HFHS Annual Shadow of Influence Award x x HFHS Annual Volunteer Appreciation Week x BU Annual Employee of the Month Award x BU Monthly Spirit Awards x x x BU Quarterly Thank You Notes x x x x ALL Ongoing Celebration of Performance Milestones x x x x MED
DIR. Ongoing
Employee Appreciation Picnic x x x x BU Annual Employee Summer Events (e.g., “HFHS Idol” contest) x x x x BU Annual
Online PMP Feedback Notes x x x ALL Ongoing Appreciation “Bucket” Drops x x x x ALL Ongoing Quality Expo Awards x x x x HFHS Annual
Fig. �.�-�: Rewards and Recognition Approaches
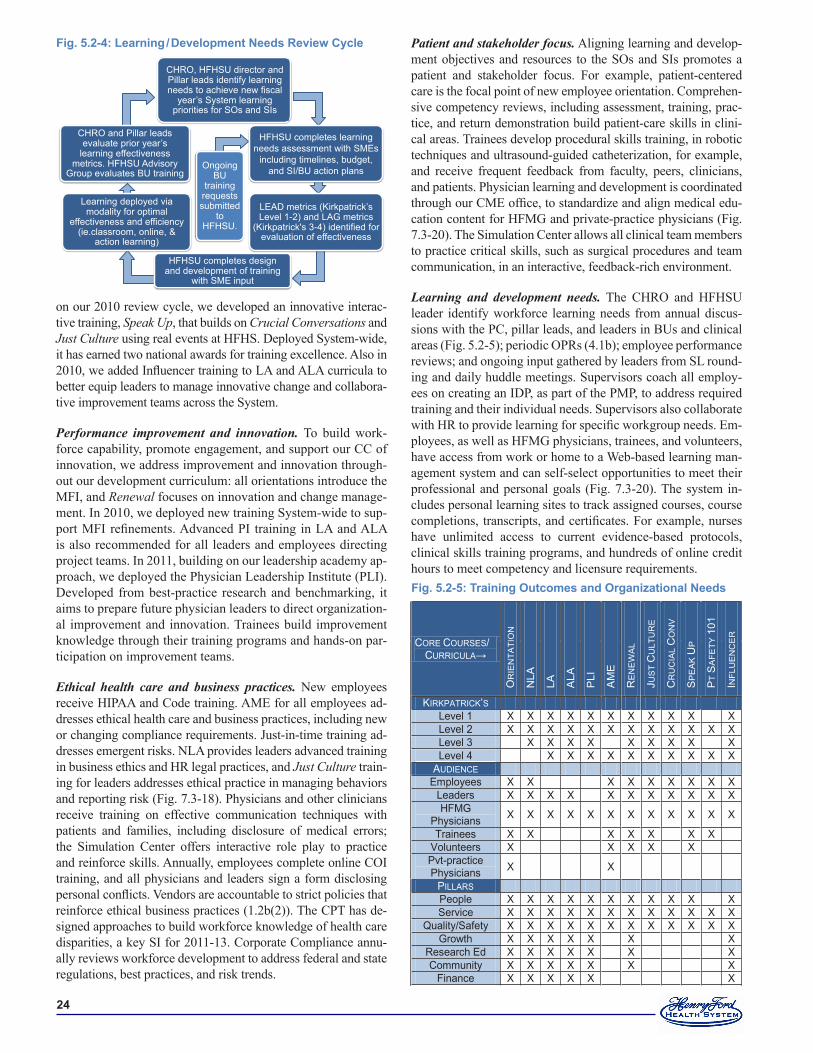
��
on our 2010 review cycle, we developed an innovative interac-tive training, Speak Up, that builds on Crucial Conversations and Just Culture using real events at HFHS. Deployed System-wide, it has earned two national awards for training excellence. Also in 2010, we added Influencer training to LA and ALA curricula to better equip leaders to manage innovative change and collabora-tive improvement teams across the System.
Performance improvement and innovation. To build work-force capability, promote engagement, and support our CC of innovation, we address improvement and innovation through-out our development curriculum: all orientations introduce the MFI, and Renewal focuses on innovation and change manage-ment. In 2010, we deployed new training System-wide to sup-port MFI refinements. Advanced PI training in LA and ALA is also recommended for all leaders and employees directing project teams. In 2011, building on our leadership academy ap-proach, we deployed the Physician Leadership Institute (PLI). Developed from best-practice research and benchmarking, it aims to prepare future physician leaders to direct organization-al improvement and innovation. Trainees build improvement knowledge through their training programs and hands-on par-ticipation on improvement teams.
Ethical health care and business practices. New employees receive HIPAA and Code training. AME for all employees ad-dresses ethical health care and business practices, including new or changing compliance requirements. Just-in-time training ad-dresses emergent risks. NLA provides leaders advanced training in business ethics and HR legal practices, and Just Culture train-ing for leaders addresses ethical practice in managing behaviors and reporting risk (Fig. 7.3-18). Physicians and other clinicians receive training on effective communication techniques with patients and families, including disclosure of medical errors; the Simulation Center offers interactive role play to practice and reinforce skills. Annually, employees complete online COI training, and all physicians and leaders sign a form disclosing personal conflicts. Vendors are accountable to strict policies that reinforce ethical business practices (1.2b(2)). The CPT has de-signed approaches to build workforce knowledge of health care disparities, a key SI for 2011-13. Corporate Compliance annu-ally reviews workforce development to address federal and state regulations, best practices, and risk trends.
Patient and stakeholder focus. Aligning learning and develop-ment objectives and resources to the SOs and SIs promotes a patient and stakeholder focus. For example, patient-centered care is the focal point of new employee orientation. Comprehen-sive competency reviews, including assessment, training, prac-tice, and return demonstration build patient-care skills in clini-cal areas. Trainees develop procedural skills training, in robotic techniques and ultrasound-guided catheterization, for example, and receive frequent feedback from faculty, peers, clinicians, and patients. Physician learning and development is coordinated through our CME office, to standardize and align medical edu-cation content for HFMG and private-practice physicians (Fig. 7.3-20). The Simulation Center allows all clinical team members to practice critical skills, such as surgical procedures and team communication, in an interactive, feedback-rich environment.
Learning and development needs. The CHRO and HFHSU leader identify workforce learning needs from annual discus-sions with the PC, pillar leads, and leaders in BUs and clinical areas (Fig. 5.2-5); periodic OPRs (4.1b); employee performance reviews; and ongoing input gathered by leaders from SL round-ing and daily huddle meetings. Supervisors coach all employ-ees on creating an IDP, as part of the PMP, to address required training and their individual needs. Supervisors also collaborate with HR to provide learning for specific workgroup needs. Em-ployees, as well as HFMG physicians, trainees, and volunteers, have access from work or home to a Web-based learning man-agement system and can self-select opportunities to meet their professional and personal goals (Fig. 7.3-20). The system in-cludes personal learning sites to track assigned courses, course completions, transcripts, and certificates. For example, nurses have unlimited access to current evidence-based protocols, clinical skills training programs, and hundreds of online credit hours to meet competency and licensure requirements.
CORE COURSES/ CURRICULA→
OR
IEN
TATI
ON
NLA
LA
ALA
PLI
AM
E
RE
NE
WA
L
JUS
T C
ULT
UR
E
CR
UC
IAL
CO
NV
SP
EA
K U
P
PT
SA
FETY
101
INFL
UE
NC
ER
KIRKPATRICK’S Level 1 X X X X X X X X X X X Level 2 X X X X X X X X X X X X Level 3 X X X X X X X X X Level 4 X X X X X X X X X X
AUDIENCE Employees X X X X X X X X X
Leaders X X X X X X X X X X X HFMG
Physicians X X X X X X X X X X X X
Trainees X X X X X X X Volunteers X X X X X Pvt-practice Physicians X X
PILLARS People X X X X X X X X X X X Service X X X X X X X X X X X X
Quality/Safety X X X X X X X X X X X X Growth X X X X X X X
Research Ed X X X X X X X Community X X X X X X X
Finance X X X X X X
Fig. �.�-�: Training Outcomes and Organizational Needs
CHRO and Pillar leads evaluate prior year’s
learning effectiveness metrics. HFHSU Advisory
Group evaluates BU training
CHRO, HFHSU director and Pillar leads identify learning needs to achieve new fiscal
year’s System learning priorities for SOs and SIs
LEAD metrics (Kirkpatrick’s Level 1-2) and LAG metrics
(Kirkpatrick's 3-4) identified for evaluation of effectiveness
HFHSU completes design and development of training
with SME input
Learning deployed via modality for optimal
effectiveness and efficiency (ie.classroom, online, &
action learning)
Ongoing BU
training requests submitted
to HFHSU.
HFHSU completes learning needs assessment with SMEs
including timelines, budget, and SI/BU action plans
Fig. �.�-�: Learning / Development Needs Review Cycle
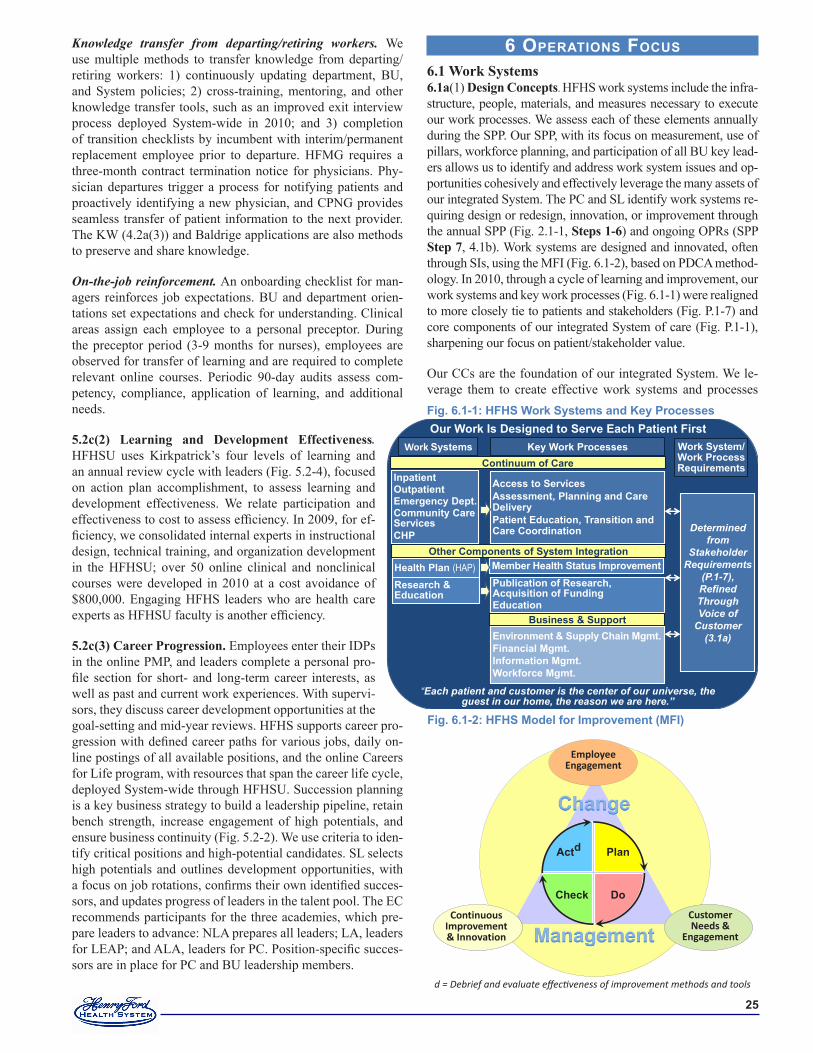
��
Knowledge transfer from departing/retiring workers. We use multiple methods to transfer knowledge from departing/ retiring workers: 1) continuously updating department, BU, and System policies; 2) cross-training, mentoring, and other knowledge transfer tools, such as an improved exit interview process deployed System-wide in 2010; and 3) completion of transition checklists by incumbent with interim/permanent replacement employee prior to departure. HFMG requires a three-month contract termination notice for physicians. Phy-sician departures trigger a process for notifying patients and proactively identifying a new physician, and CPNG provides seamless transfer of patient information to the next provider. The KW (4.2a(3)) and Baldrige applications are also methods to preserve and share knowledge.
On-the-job reinforcement. An onboarding checklist for man-agers reinforces job expectations. BU and department orien-tations set expectations and check for understanding. Clinical areas assign each employee to a personal preceptor. During the preceptor period (3-9 months for nurses), employees are observed for transfer of learning and are required to complete relevant online courses. Periodic 90-day audits assess com-petency, compliance, application of learning, and additional needs.
5.2c(2) Learning and Development Effectiveness. HFHSU uses Kirkpatrick’s four levels of learning and an annual review cycle with leaders (Fig. 5.2-4), focused on action plan accomplishment, to assess learning and development effectiveness. We relate participation and effectiveness to cost to assess efficiency. In 2009, for ef-ficiency, we consolidated internal experts in instructional design, technical training, and organization development in the HFHSU; over 50 online clinical and nonclinical courses were developed in 2010 at a cost avoidance of $800,000. Engaging HFHS leaders who are health care experts as HFHSU faculty is another efficiency.
5.2c(3) Career Progression. Employees enter their IDPs in the online PMP, and leaders complete a personal pro-file section for short- and long-term career interests, as well as past and current work experiences. With supervi-sors, they discuss career development opportunities at the goal-setting and mid-year reviews. HFHS supports career pro-gression with defined career paths for various jobs, daily on-line postings of all available positions, and the online Careers for Life program, with resources that span the career life cycle, deployed System-wide through HFHSU. Succession planning is a key business strategy to build a leadership pipeline, retain bench strength, increase engagement of high potentials, and ensure business continuity (Fig. 5.2-2). We use criteria to iden-tify critical positions and high-potential candidates. SL selects high potentials and outlines development opportunities, with a focus on job rotations, confirms their own identified succes-sors, and updates progress of leaders in the talent pool. The EC recommends participants for the three academies, which pre-pare leaders to advance: NLA prepares all leaders; LA, leaders for LEAP; and ALA, leaders for PC. Position-specific succes-sors are in place for PC and BU leadership members.
6 operations Focus 6.1 Work Systems6.1a(1) Design Concepts. HFHS work systems include the infra-structure, people, materials, and measures necessary to execute our work processes. We assess each of these elements annually during the SPP. Our SPP, with its focus on measurement, use of pillars, workforce planning, and participation of all BU key lead-ers allows us to identify and address work system issues and op-portunities cohesively and effectively leverage the many assets of our integrated System. The PC and SL identify work systems re-quiring design or redesign, innovation, or improvement through the annual SPP (Fig. 2.1-1, Steps 1-6) and ongoing OPRs (SPP Step 7, 4.1b). Work systems are designed and innovated, often through SIs, using the MFI (Fig. 6.1-2), based on PDCA method-ology. In 2010, through a cycle of learning and improvement, our work systems and key work processes (Fig. 6.1-1) were realigned to more closely tie to patients and stakeholders (Fig. P.1-7) and core components of our integrated System of care (Fig. P.1-1), sharpening our focus on patient/stakeholder value.
Our CCs are the foundation of our integrated System. We le-verage them to create effective work systems and processes Fig. �.�-�: HFHS Work Systems and Key Processes
InpatientOutpatientEmergency Dept.Community CareServicesCHP
Health Plan (HAP)Research & Education
Work Systems Key Work Processes
Access to ServicesAssessment, Planning and Care DeliveryPatient Education, Transition and Care Coordination
Member Health Status ImprovementPublication of Research, Acquisition of FundingEducation
Environment & Supply Chain Mgmt.Financial Mgmt.Information Mgmt.Workforce Mgmt.
Continuum of Care
Other Components of System Integration
Business & Support
Determined from
Stakeholder Requirements
(P.1-7), Refined ThroughVoice of
Customer (3.1a)
Our Work Is Designed to Serve Each Patient First
“Each patient and customer is the center of our universe, the guest in our home, the reason we are here.”
Work System/ Work Process Requirements
d = Debrief and evaluate effectiveness of improvement methods and tools
Fig. �.�-�: HFHS Model for Improvement (MFI)
Customer Needs &
Engagement
Plan
DoCheck
Actd
EmployeeEngagement
Continuous Improvement & Innovation
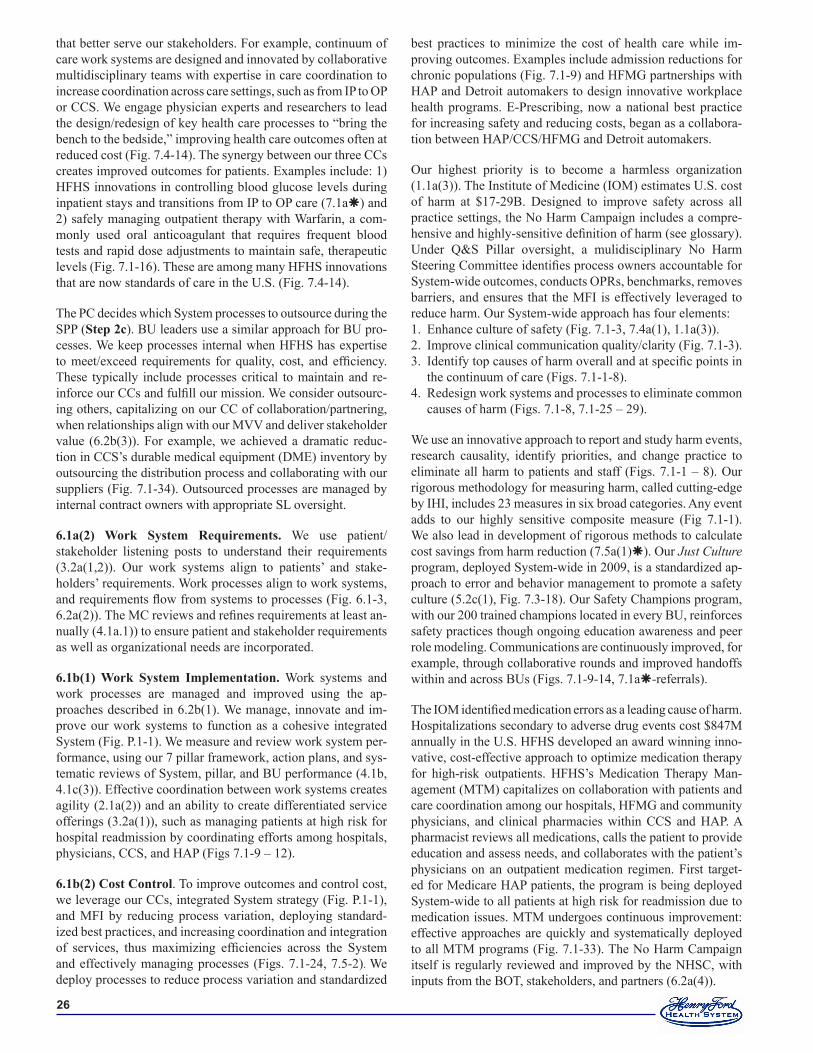
��
that better serve our stakeholders. For example, continuum of care work systems are designed and innovated by collaborative multidisciplinary teams with expertise in care coordination to increase coordination across care settings, such as from IP to OP or CCS. We engage physician experts and researchers to lead the design/redesign of key health care processes to “bring the bench to the bedside,” improving health care outcomes often at reduced cost (Fig. 7.4-14). The synergy between our three CCs creates improved outcomes for patients. Examples include: 1) HFHS innovations in controlling blood glucose levels during inpatient stays and transitions from IP to OP care (7.1a) and 2) safely managing outpatient therapy with Warfarin, a com-monly used oral anticoagulant that requires frequent blood tests and rapid dose adjustments to maintain safe, therapeutic levels (Fig. 7.1-16). These are among many HFHS innovations that are now standards of care in the U.S. (Fig. 7.4-14).
The PC decides which System processes to outsource during the SPP (Step 2c). BU leaders use a similar approach for BU pro-cesses. We keep processes internal when HFHS has expertise to meet/exceed requirements for quality, cost, and efficiency. These typically include processes critical to maintain and re-inforce our CCs and fulfill our mission. We consider outsourc-ing others, capitalizing on our CC of collaboration/partnering, when relationships align with our MVV and deliver stakeholder value (6.2b(3)). For example, we achieved a dramatic reduc-tion in CCS’s durable medical equipment (DME) inventory by outsourcing the distribution process and collaborating with our suppliers (Fig. 7.1-34). Outsourced processes are managed by internal contract owners with appropriate SL oversight.
6.1a(2) Work System Requirements. We use patient/ stakeholder listening posts to understand their requirements (3.2a(1,2)). Our work systems align to patients’ and stake-holders’ requirements. Work processes align to work systems, and requirements flow from systems to processes (Fig. 6.1-3, 6.2a(2)). The MC reviews and refines requirements at least an-nually (4.1a.1)) to ensure patient and stakeholder requirements as well as organizational needs are incorporated.
6.1b(1) Work System Implementation. Work systems and work processes are managed and improved using the ap-proaches described in 6.2b(1). We manage, innovate and im-prove our work systems to function as a cohesive integrated System (Fig. P.1-1). We measure and review work system per-formance, using our 7 pillar framework, action plans, and sys-tematic reviews of System, pillar, and BU performance (4.1b, 4.1c(3)). Effective coordination between work systems creates agility (2.1a(2)) and an ability to create differentiated service offerings (3.2a(1)), such as managing patients at high risk for hospital readmission by coordinating efforts among hospitals, physicians, CCS, and HAP (Figs 7.1-9 – 12).
6.1b(2) Cost Control. To improve outcomes and control cost, we leverage our CCs, integrated System strategy (Fig. P.1-1), and MFI by reducing process variation, deploying standard-ized best practices, and increasing coordination and integration of services, thus maximizing efficiencies across the System and effectively managing processes (Figs. 7.1-24, 7.5-2). We deploy processes to reduce process variation and standardized
best practices to minimize the cost of health care while im-proving outcomes. Examples include admission reductions for chronic populations (Fig. 7.1-9) and HFMG partnerships with HAP and Detroit automakers to design innovative workplace health programs. E-Prescribing, now a national best practice for increasing safety and reducing costs, began as a collabora-tion between HAP/CCS/HFMG and Detroit automakers.
Our highest priority is to become a harmless organization (1.1a(3)). The Institute of Medicine (IOM) estimates U.S. cost of harm at $17-29B. Designed to improve safety across all practice settings, the No Harm Campaign includes a compre-hensive and highly-sensitive definition of harm (see glossary). Under Q&S Pillar oversight, a mulidisciplinary No Harm Steering Committee identifies process owners accountable for System-wide outcomes, conducts OPRs, benchmarks, removes barriers, and ensures that the MFI is effectively leveraged to reduce harm. Our System-wide approach has four elements:
Enhance culture of safety (Fig. 7.1-3, 7.4a(1), 1.1a(3)).Improve clinical communication quality/clarity (Fig. 7.1-3).Identify top causes of harm overall and at specific points in the continuum of care (Figs. 7.1-1-8).Redesign work systems and processes to eliminate common causes of harm (Figs. 7.1-8, 7.1-25 – 29).
We use an innovative approach to report and study harm events, research causality, identify priorities, and change practice to eliminate all harm to patients and staff (Figs. 7.1-1 – 8). Our rigorous methodology for measuring harm, called cutting-edge by IHI, includes 23 measures in six broad categories. Any event adds to our highly sensitive composite measure (Fig 7.1-1). We also lead in development of rigorous methods to calculate cost savings from harm reduction (7.5a(1)). Our Just Culture program, deployed System-wide in 2009, is a standardized ap-proach to error and behavior management to promote a safety culture (5.2c(1), Fig. 7.3-18). Our Safety Champions program, with our 200 trained champions located in every BU, reinforces safety practices though ongoing education awareness and peer role modeling. Communications are continuously improved, for example, through collaborative rounds and improved handoffs within and across BUs (Figs. 7.1-9-14, 7.1a-referrals).
The IOM identified medication errors as a leading cause of harm. Hospitalizations secondary to adverse drug events cost $847M annually in the U.S. HFHS developed an award winning inno-vative, cost-effective approach to optimize medication therapy for high-risk outpatients. HFHS’s Medication Therapy Man-agement (MTM) capitalizes on collaboration with patients and care coordination among our hospitals, HFMG and community physicians, and clinical pharmacies within CCS and HAP. A pharmacist reviews all medications, calls the patient to provide education and assess needs, and collaborates with the patient’s physicians on an outpatient medication regimen. First target-ed for Medicare HAP patients, the program is being deployed System-wide to all patients at high risk for readmission due to medication issues. MTM undergoes continuous improvement: effective approaches are quickly and systematically deployed to all MTM programs (Fig. 7.1-33). The No Harm Campaign itself is regularly reviewed and improved by the NHSC, with inputs from the BOT, stakeholders, and partners (6.2a(4)).
1.2.3.
4.
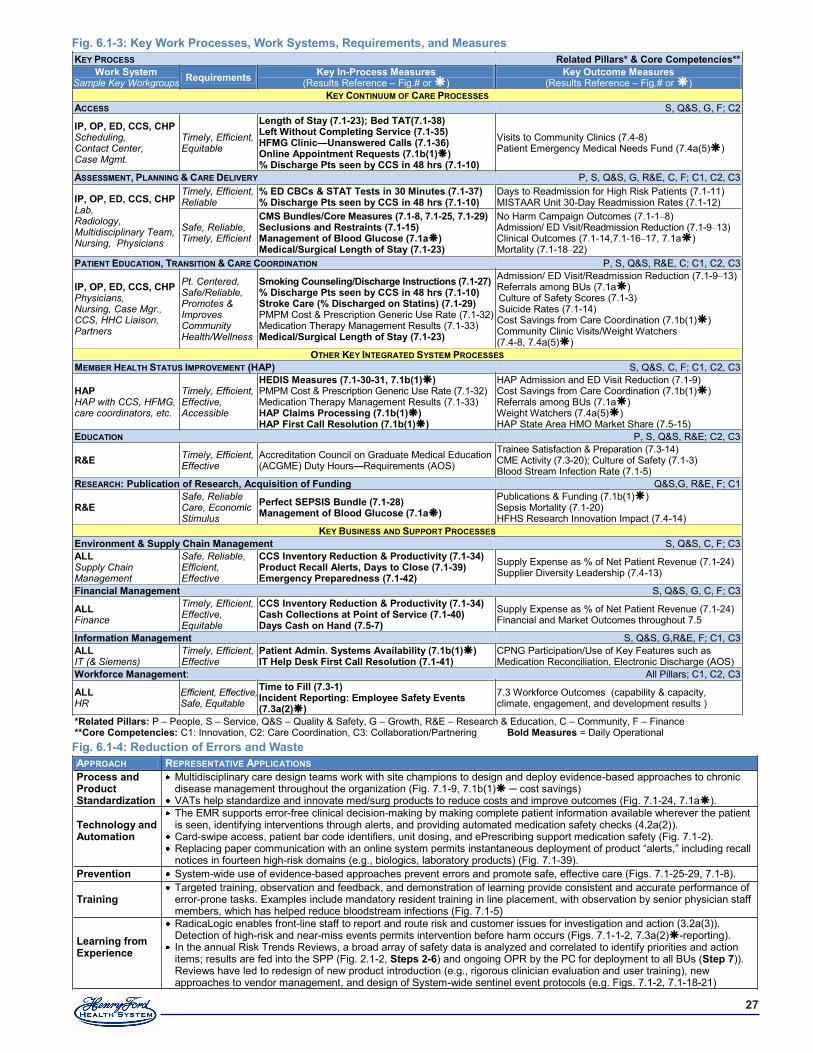
��
Fig. �.�-�: Key Work Processes, Work Systems, Requirements, and MeasuresKEY PROCESS Related Pillars* & Core Competencies**
Work System Sample Key Workgroups Requirements Key In-Process Measures
(Results Reference – Fig.# or ) Key Outcome Measures
(Results Reference – Fig.# or ) KEY CONTINUUM OF CARE PROCESSES
ACCESS S, Q&S, G, F; C2
IP, OP, ED, CCS, CHP Scheduling, Contact Center, Case Mgmt.
Timely, Efficient, Equitable
Length of Stay (�.�-��); Bed TAT(�.�-��) Left Without Completing Service (�.�-��) HFMG Clinic—Unanswered Calls (�.�-��) Online Appointment Requests (�.�b(�)) % Discharge Pts seen by CCS in �� hrs (�.�-�0)
Visits to Community Clinics (7.4-8) Patient Emergency Medical Needs Fund (7.4a(5))
ASSESSMENT, PLANNING & CARE DELIVERY P, S, Q&S, G, R&E, C, F; C1, C2, C3
IP, OP, ED, CCS, CHP Lab, Radiology, Multidisciplinary Team, Nursing, Physicians
Timely, Efficient, Reliable
% ED CBCs & STAT Tests in �0 Minutes (�.�-��) % Discharge Pts seen by CCS in �� hrs (�.�-�0)
Days to Readmission for High Risk Patients (7.1-11) MISTAAR Unit 30-Day Readmission Rates (7.1-12)
Safe, Reliable, Timely, Efficient
CMS Bundles/Core Measures (�.�-�, �.�-��, �.�-��) Seclusions and Restraints (�.�-��) Management of Blood Glucose (�.�a) Medical/Surgical Length of Stay (�.�-��)
No Harm Campaign Outcomes (7.1-1–8) Admission/ ED Visit/Readmission Reduction (7.1-9–13) Clinical Outcomes (7.1-14,7.1-16–17, 7.1a) Mortality (7.1-18–22)
PATIENT EDUCATION, TRANSITION & CARE COORDINATION P, S, Q&S, R&E, C; C1, C2, C3
IP, OP, ED, CCS, CHP Physicians, Nursing, Case Mgr., CCS, HHC Liaison, Partners
Pt. Centered, Safe/Reliable, Promotes & Improves Community Health/Wellness
Smoking Counseling/Discharge Instructions (�.�-��) % Discharge Pts seen by CCS in �� hrs (�.�-�0) Stroke Care (% Discharged on Statins) (�.�-��) PMPM Cost & Prescription Generic Use Rate (7.1-32) Medication Therapy Management Results (7.1-33) Medical/Surgical Length of Stay (�.�-��)
Admission/ ED Visit/Readmission Reduction (7.1-9–13) Referrals among BUs (7.1a) Culture of Safety Scores (7.1-3) Suicide Rates (7.1-14) Cost Savings from Care Coordination (7.1b(1)) Community Clinic Visits/Weight Watchers (7.4-8, 7.4a(5))
OTHER KEY INTEGRATED SYSTEM PROCESSES MEMBER HEALTH STATUS IMPROVEMENT (HAP) S, Q&S, C, F; C1, C2, C3
HAP HAP with CCS, HFMG, care coordinators, etc.
Timely, Efficient, Effective, Accessible
HEDIS Measures (�.�-�0-��, �.�b(�)) PMPM Cost & Prescription Generic Use Rate (7.1-32) Medication Therapy Management Results (7.1-33) HAP Claims Processing (�.�b(�)) HAP First Call Resolution (�.�b(�))
HAP Admission and ED Visit Reduction (7.1-9) Cost Savings from Care Coordination (7.1b(1)) Referrals among BUs (7.1a) Weight Watchers (7.4a(5)) HAP State Area HMO Market Share (7.5-15)
EDUCATION P, S, Q&S, R&E; C2, C3
R&E Timely, Efficient, Effective
Accreditation Council on Graduate Medical Education (ACGME) Duty Hours—Requirements (AOS)
Trainee Satisfaction & Preparation (7.3-14) CME Activity (7.3-20); Culture of Safety (7.1-3) Blood Stream Infection Rate (7.1-5)
RESEARCH: Publication of Research, Acquisition of Funding Q&S,G, R&E, F; C1
R&E Safe, Reliable Care, Economic Stimulus
Perfect SEPSIS Bundle (�.�-��) Management of Blood Glucose (�.�a)
Publications & Funding (7.1b(1)) Sepsis Mortality (7.1-20) HFHS Research Innovation Impact (7.4-14)
KEY BUSINESS AND SUPPORT PROCESSES Environment & Supply Chain Management S, Q&S, C, F; C3 ALL Supply Chain Management
Safe, Reliable, Efficient, Effective
CCS Inventory Reduction & Productivity (�.�-��) Product Recall Alerts, Days to Close (�.�-��) Emergency Preparedness (�.�-��)
Supply Expense as % of Net Patient Revenue (7.1-24) Supplier Diversity Leadership (7.4-13)
Financial Management S, Q&S, G, C, F; C3
ALL Finance
Timely, Efficient, Effective, Equitable
CCS Inventory Reduction & Productivity (�.�-��) Cash Collections at Point of Service (�.�-�0) Days Cash on Hand (�.�-�)
Supply Expense as % of Net Patient Revenue (7.1-24) Financial and Market Outcomes throughout 7.5
Information Management S, Q&S, G,R&E, F; C1, C3 ALL IT (& Siemens)
Timely, Efficient, Effective
Patient Admin. Systems Availability (�.�b(�)) IT Help Desk First Call Resolution (�.�-��)
CPNG Participation/Use of Key Features such as Medication Reconciliation, Electronic Discharge (AOS)
Workforce Management: All Pillars; C1, C2, C3
ALL HR
Efficient, Effective, Safe, Equitable
Time to Fill (�.�-�) Incident Reporting: Employee Safety Events (�.�a(�))
7.3 Workforce Outcomes (capability & capacity, climate, engagement, and development results )
*Related Pillars: P – People, S – Service, Q&S – Quality & Safety, G – Growth, R&E – Research & Education, C – Community, F – Finance **Core Competencies: C1: Innovation, C2: Care Coordination, C3: Collaboration/Partnering Bold Measures = Daily Operational Fig. �.�-�: Reduction of Errors and Waste APPROACH REPRESENTATIVE APPLICATIONS Process and Product Standardization
Multidisciplinary care design teams work with site champions to design and deploy evidence-based approaches to chronic disease management throughout the organization (Fig. 7.1-9, 7.1b(1) ─ cost savings)
VATs help standardize and innovate med/surg products to reduce costs and improve outcomes (Fig. 7.1-24, 7.1a).
Technology and Automation
The EMR supports error-free clinical decision-making by making complete patient information available wherever the patient is seen, identifying interventions through alerts, and providing automated medication safety checks (4.2a(2)).
Card-swipe access, patient bar code identifiers, unit dosing, and ePrescribing support medication safety (Fig. 7.1-2). Replacing paper communication with an online system permits instantaneous deployment of product “alerts,” including recall notices in fourteen high-risk domains (e.g., biologics, laboratory products) (Fig. 7.1-39).
Prevention System-wide use of evidence-based approaches prevent errors and promote safe, effective care (Figs. 7.1-25-29, 7.1-8).
Training Targeted training, observation and feedback, and demonstration of learning provide consistent and accurate performance of error-prone tasks. Examples include mandatory resident training in line placement, with observation by senior physician staff members, which has helped reduce bloodstream infections (Fig. 7.1-5)
Learning from Experience
RadicaLogic enables front-line staff to report and route risk and customer issues for investigation and action (3.2a(3)). Detection of high-risk and near-miss events permits intervention before harm occurs (Figs. 7.1-1-2, 7.3a(2)-reporting).
In the annual Risk Trends Reviews, a broad array of safety data is analyzed and correlated to identify priorities and action items; results are fed into the SPP (Fig. 2.1-2, Steps �-�) and ongoing OPR by the PC for deployment to all BUs (Step �)). Reviews have led to redesign of new product introduction (e.g., rigorous clinician evaluation and user training), new approaches to vendor management, and design of System-wide sentinel event protocols (e.g. Figs. 7.1-2, 7.1-18-21)
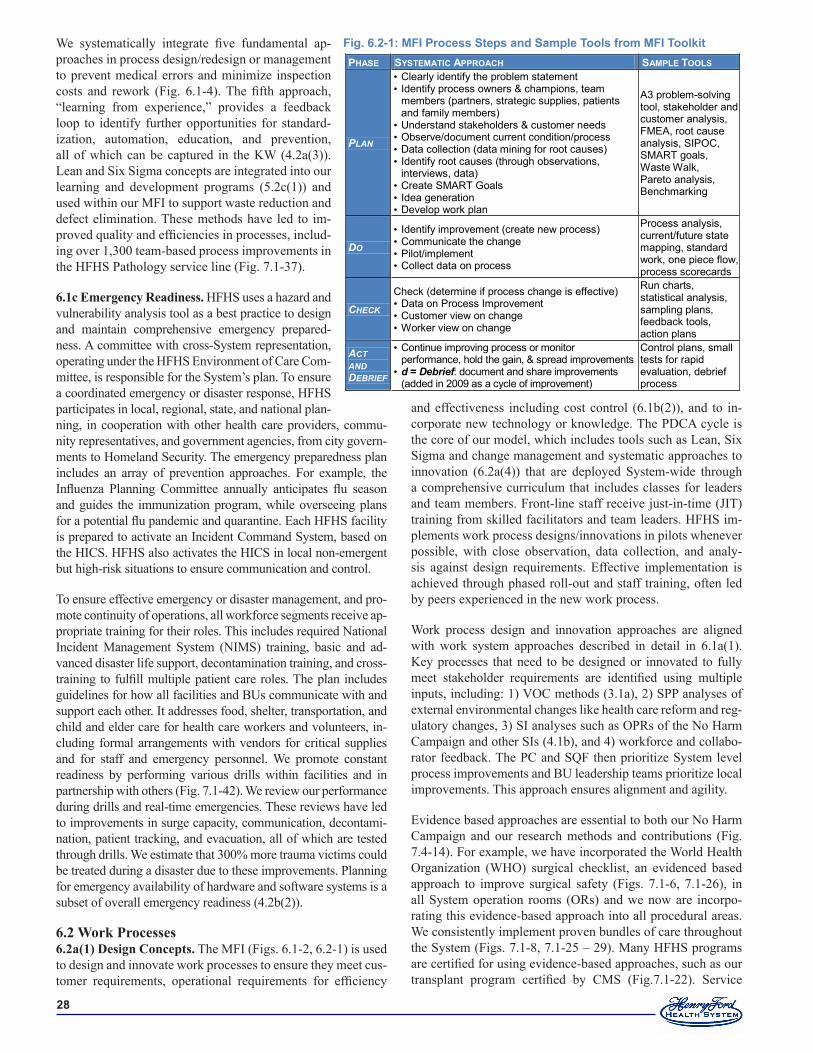
��
We systematically integrate five fundamental ap-proaches in process design/redesign or management to prevent medical errors and minimize inspection costs and rework (Fig. 6.1-4). The fifth approach, “learning from experience,” provides a feedback loop to identify further opportunities for standard-ization, automation, education, and prevention, all of which can be captured in the KW (4.2a(3)). Lean and Six Sigma concepts are integrated into our learning and development programs (5.2c(1)) and used within our MFI to support waste reduction and defect elimination. These methods have led to im-proved quality and efficiencies in processes, includ-ing over 1,300 team-based process improvements in the HFHS Pathology service line (Fig. 7.1-37).
6.1c Emergency Readiness. HFHS uses a hazard and vulnerability analysis tool as a best practice to design and maintain comprehensive emergency prepared-ness. A committee with cross-System representation, operating under the HFHS Environment of Care Com-mittee, is responsible for the System’s plan. To ensure a coordinated emergency or disaster response, HFHS participates in local, regional, state, and national plan-ning, in cooperation with other health care providers, commu-nity representatives, and government agencies, from city govern-ments to Homeland Security. The emergency preparedness plan includes an array of prevention approaches. For example, the Influenza Planning Committee annually anticipates flu season and guides the immunization program, while overseeing plans for a potential flu pandemic and quarantine. Each HFHS facility is prepared to activate an Incident Command System, based on the HICS. HFHS also activates the HICS in local non-emergent but high-risk situations to ensure communication and control.
To ensure effective emergency or disaster management, and pro-mote continuity of operations, all workforce segments receive ap-propriate training for their roles. This includes required National Incident Management System (NIMS) training, basic and ad-vanced disaster life support, decontamination training, and cross-training to fulfill multiple patient care roles. The plan includes guidelines for how all facilities and BUs communicate with and support each other. It addresses food, shelter, transportation, and child and elder care for health care workers and volunteers, in-cluding formal arrangements with vendors for critical supplies and for staff and emergency personnel. We promote constant readiness by performing various drills within facilities and in partnership with others (Fig. 7.1-42). We review our performance during drills and real-time emergencies. These reviews have led to improvements in surge capacity, communication, decontami-nation, patient tracking, and evacuation, all of which are tested through drills. We estimate that 300% more trauma victims could be treated during a disaster due to these improvements. Planning for emergency availability of hardware and software systems is a subset of overall emergency readiness (4.2b(2)).
6.2 Work Processes6.2a(1) Design Concepts. The MFI (Figs. 6.1-2, 6.2-1) is used to design and innovate work processes to ensure they meet cus-tomer requirements, operational requirements for efficiency
and effectiveness including cost control (6.1b(2)), and to in-corporate new technology or knowledge. The PDCA cycle is the core of our model, which includes tools such as Lean, Six Sigma and change management and systematic approaches to innovation (6.2a(4)) that are deployed System-wide through a comprehensive curriculum that includes classes for leaders and team members. Front-line staff receive just-in-time (JIT) training from skilled facilitators and team leaders. HFHS im-plements work process designs/innovations in pilots whenever possible, with close observation, data collection, and analy-sis against design requirements. Effective implementation is achieved through phased roll-out and staff training, often led by peers experienced in the new work process.
Work process design and innovation approaches are aligned with work system approaches described in detail in 6.1a(1). Key processes that need to be designed or innovated to fully meet stakeholder requirements are identified using multiple inputs, including: 1) VOC methods (3.1a), 2) SPP analyses of external environmental changes like health care reform and reg-ulatory changes, 3) SI analyses such as OPRs of the No Harm Campaign and other SIs (4.1b), and 4) workforce and collabo-rator feedback. The PC and SQF then prioritize System level process improvements and BU leadership teams prioritize local improvements. This approach ensures alignment and agility.
Evidence based approaches are essential to both our No Harm Campaign and our research methods and contributions (Fig. 7.4-14). For example, we have incorporated the World Health Organization (WHO) surgical checklist, an evidenced based approach to improve surgical safety (Figs. 7.1-6, 7.1-26), in all System operation rooms (ORs) and we now are incorpo-rating this evidence-based approach into all procedural areas. We consistently implement proven bundles of care throughout the System (Figs. 7.1-8, 7.1-25 – 29). Many HFHS programs are certified for using evidence-based approaches, such as our transplant program certified by CMS (Fig.7.1-22). Service
PHASE SYSTEMATIC APPROACH SAMPLE TOOLS
PLAN
• Clearly identify the problem statement • Identify process owners & champions, team
members (partners, strategic supplies, patients and family members)
• Understand stakeholders & customer needs • Observe/document current condition/process • Data collection (data mining for root causes) • Identify root causes (through observations,
interviews, data) • Create SMART Goals • Idea generation • Develop work plan
A3 problem-solving tool, stakeholder and customer analysis, FMEA, root cause analysis, SIPOC, SMART goals, Waste Walk, Pareto analysis, Benchmarking
DO • Identify improvement (create new process) • Communicate the change • Pilot/implement • Collect data on process
Process analysis, current/future state mapping, standard work, one piece flow, process scorecards
CHECK
Check (determine if process change is effective) • Data on Process Improvement • Customer view on change • Worker view on change
Run charts, statistical analysis, sampling plans, feedback tools, action plans
ACT AND DEBRIEF
• Continue improving process or monitor performance, hold the gain, & spread improvements
• d = Debrief: document and share improvements (added in 2009 as a cycle of improvement)
Control plans, small tests for rapid evaluation, debrief process
Fig. �.�-�: MFI Process Steps and Sample Tools from MFI Toolkit
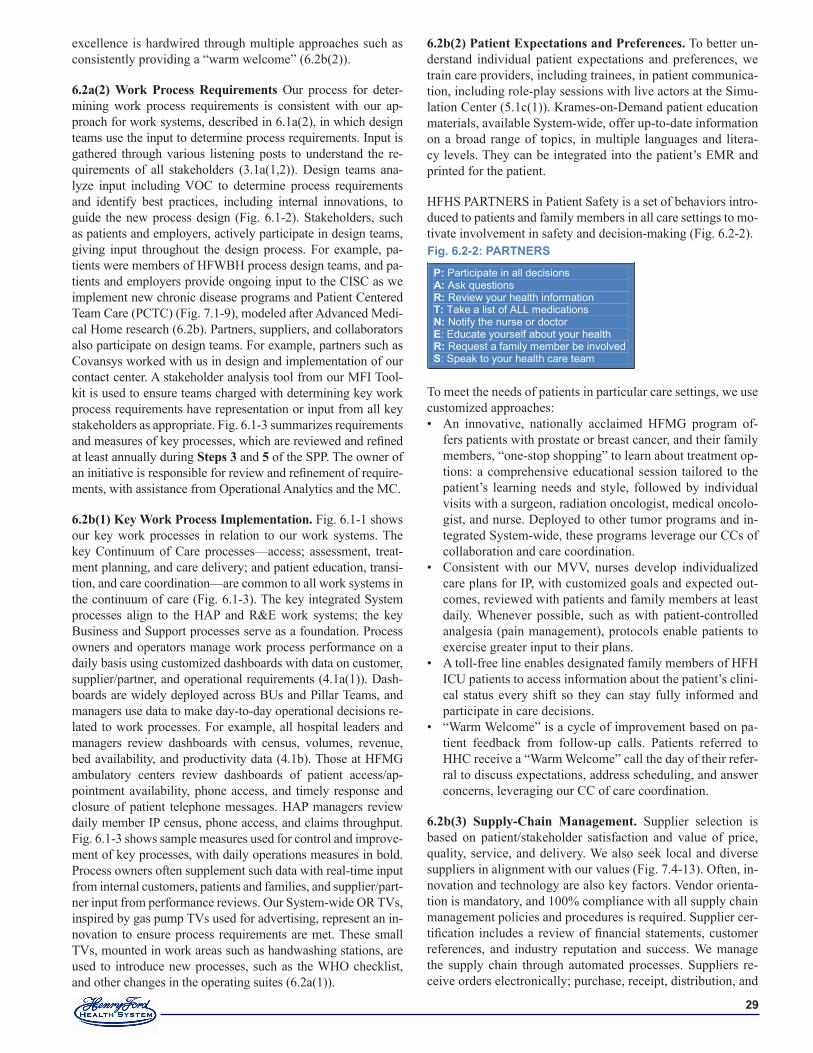
��
excellence is hardwired through multiple approaches such as consistently providing a “warm welcome” (6.2b(2)).
6.2a(2) Work Process Requirements Our process for deter-mining work process requirements is consistent with our ap-proach for work systems, described in 6.1a(2), in which design teams use the input to determine process requirements. Input is gathered through various listening posts to understand the re-quirements of all stakeholders (3.1a(1,2)). Design teams ana-lyze input including VOC to determine process requirements and identify best practices, including internal innovations, to guide the new process design (Fig. 6.1-2). Stakeholders, such as patients and employers, actively participate in design teams, giving input throughout the design process. For example, pa-tients were members of HFWBH process design teams, and pa-tients and employers provide ongoing input to the CISC as we implement new chronic disease programs and Patient Centered Team Care (PCTC) (Fig. 7.1-9), modeled after Advanced Medi-cal Home research (6.2b). Partners, suppliers, and collaborators also participate on design teams. For example, partners such as Covansys worked with us in design and implementation of our contact center. A stakeholder analysis tool from our MFI Tool-kit is used to ensure teams charged with determining key work process requirements have representation or input from all key stakeholders as appropriate. Fig. 6.1-3 summarizes requirements and measures of key processes, which are reviewed and refined at least annually during Steps 3 and 5 of the SPP. The owner of an initiative is responsible for review and refinement of require-ments, with assistance from Operational Analytics and the MC.
6.2b(1) Key Work Process Implementation. Fig. 6.1-1 shows our key work processes in relation to our work systems. The key Continuum of Care processes—access; assessment, treat-ment planning, and care delivery; and patient education, transi-tion, and care coordination—are common to all work systems in the continuum of care (Fig. 6.1-3). The key integrated System processes align to the HAP and R&E work systems; the key Business and Support processes serve as a foundation. Process owners and operators manage work process performance on a daily basis using customized dashboards with data on customer, supplier/partner, and operational requirements (4.1a(1)). Dash-boards are widely deployed across BUs and Pillar Teams, and managers use data to make day-to-day operational decisions re-lated to work processes. For example, all hospital leaders and managers review dashboards with census, volumes, revenue, bed availability, and productivity data (4.1b). Those at HFMG ambulatory centers review dashboards of patient access/ap-pointment availability, phone access, and timely response and closure of patient telephone messages. HAP managers review daily member IP census, phone access, and claims throughput. Fig. 6.1-3 shows sample measures used for control and improve-ment of key processes, with daily operations measures in bold. Process owners often supplement such data with real-time input from internal customers, patients and families, and supplier/part-ner input from performance reviews. Our System-wide OR TVs, inspired by gas pump TVs used for advertising, represent an in-novation to ensure process requirements are met. These small TVs, mounted in work areas such as handwashing stations, are used to introduce new processes, such as the WHO checklist, and other changes in the operating suites (6.2a(1)).
6.2b(2) Patient Expectations and Preferences. To better un-derstand individual patient expectations and preferences, we train care providers, including trainees, in patient communica-tion, including role-play sessions with live actors at the Simu-lation Center (5.1c(1)). Krames-on-Demand patient education materials, available System-wide, offer up-to-date information on a broad range of topics, in multiple languages and litera-cy levels. They can be integrated into the patient’s EMR and printed for the patient.
HFHS PARTNERS in Patient Safety is a set of behaviors intro-duced to patients and family members in all care settings to mo-tivate involvement in safety and decision-making (Fig. 6.2-2).
To meet the needs of patients in particular care settings, we use customized approaches:
An innovative, nationally acclaimed HFMG program of-fers patients with prostate or breast cancer, and their family members, “one-stop shopping” to learn about treatment op-tions: a comprehensive educational session tailored to the patient’s learning needs and style, followed by individual visits with a surgeon, radiation oncologist, medical oncolo-gist, and nurse. Deployed to other tumor programs and in-tegrated System-wide, these programs leverage our CCs of collaboration and care coordination.Consistent with our MVV, nurses develop individualized care plans for IP, with customized goals and expected out-comes, reviewed with patients and family members at least daily. Whenever possible, such as with patient-controlled analgesia (pain management), protocols enable patients to exercise greater input to their plans.A toll-free line enables designated family members of HFH ICU patients to access information about the patient’s clini-cal status every shift so they can stay fully informed and participate in care decisions.“Warm Welcome” is a cycle of improvement based on pa-tient feedback from follow-up calls. Patients referred to HHC receive a “Warm Welcome” call the day of their refer-ral to discuss expectations, address scheduling, and answer concerns, leveraging our CC of care coordination.
6.2b(3) Supply-Chain Management. Supplier selection is based on patient/stakeholder satisfaction and value of price, quality, service, and delivery. We also seek local and diverse suppliers in alignment with our values (Fig. 7.4-13). Often, in-novation and technology are also key factors. Vendor orienta-tion is mandatory, and 100% compliance with all supply chain management policies and procedures is required. Supplier cer-tification includes a review of financial statements, customer references, and industry reputation and success. We manage the supply chain through automated processes. Suppliers re-ceive orders electronically; purchase, receipt, distribution, and
•
•
•
•
Fig. �.�-�: PARTNERS
P: Participate in all decisions A: Ask questions R: Review your health information T: Take a list of ALL medications N: Notify the nurse or doctor E: Educate yourself about your health R: Request a family member be involved S: Speak to your health care team
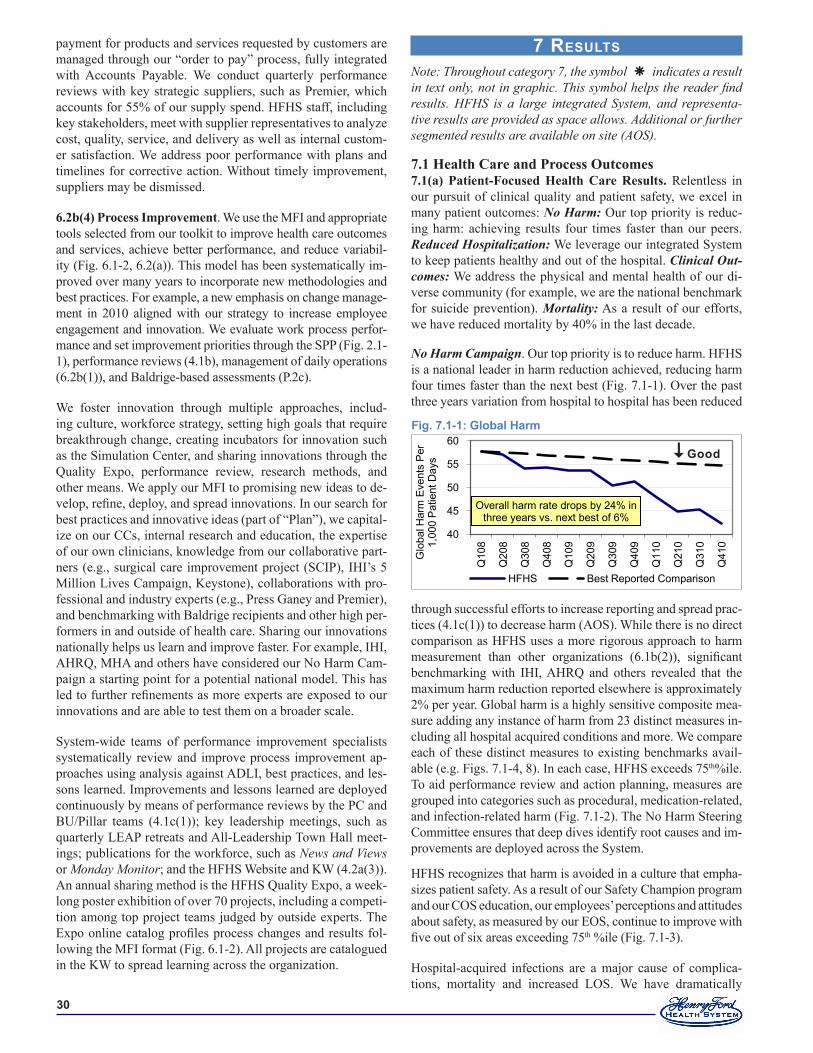
�0
7 resuLts Note: Throughout category 7, the symbol indicates a result in text only, not in graphic. This symbol helps the reader find results. HFHS is a large integrated System, and representa-tive results are provided as space allows. Additional or further segmented results are available on site (AOS).
7.1 Health Care and Process Outcomes7.1(a) Patient-Focused Health Care Results. Relentless in our pursuit of clinical quality and patient safety, we excel in many patient outcomes: No Harm: Our top priority is reduc-ing harm: achieving results four times faster than our peers. Reduced Hospitalization: We leverage our integrated System to keep patients healthy and out of the hospital. Clinical Out-comes: We address the physical and mental health of our di-verse community (for example, we are the national benchmark for suicide prevention). Mortality: As a result of our efforts, we have reduced mortality by 40% in the last decade.
No Harm Campaign. Our top priority is to reduce harm. HFHS is a national leader in harm reduction achieved, reducing harm four times faster than the next best (Fig. 7.1-1). Over the past three years variation from hospital to hospital has been reduced
through successful efforts to increase reporting and spread prac-tices (4.1c(1)) to decrease harm (AOS). While there is no direct comparison as HFHS uses a more rigorous approach to harm measurement than other organizations (6.1b(2)), significant benchmarking with IHI, AHRQ and others revealed that the maximum harm reduction reported elsewhere is approximately 2% per year. Global harm is a highly sensitive composite mea-sure adding any instance of harm from 23 distinct measures in-cluding all hospital acquired conditions and more. We compare each of these distinct measures to existing benchmarks avail-able (e.g. Figs. 7.1-4, 8). In each case, HFHS exceeds 75th%ile. To aid performance review and action planning, measures are grouped into categories such as procedural, medication-related, and infection-related harm (Fig. 7.1-2). The No Harm Steering Committee ensures that deep dives identify root causes and im-provements are deployed across the System.
HFHS recognizes that harm is avoided in a culture that empha-sizes patient safety. As a result of our Safety Champion program and our COS education, our employees’ perceptions and attitudes about safety, as measured by our EOS, continue to improve with five out of six areas exceeding 75th %ile (Fig. 7.1-3).
Hospital-acquired infections are a major cause of complica-tions, mortality and increased LOS. We have dramatically
payment for products and services requested by customers are managed through our “order to pay” process, fully integrated with Accounts Payable. We conduct quarterly performance reviews with key strategic suppliers, such as Premier, which accounts for 55% of our supply spend. HFHS staff, including key stakeholders, meet with supplier representatives to analyze cost, quality, service, and delivery as well as internal custom-er satisfaction. We address poor performance with plans and timelines for corrective action. Without timely improvement, suppliers may be dismissed.
6.2b(4) Process Improvement. We use the MFI and appropriate tools selected from our toolkit to improve health care outcomes and services, achieve better performance, and reduce variabil-ity (Fig. 6.1-2, 6.2(a)). This model has been systematically im-proved over many years to incorporate new methodologies and best practices. For example, a new emphasis on change manage-ment in 2010 aligned with our strategy to increase employee engagement and innovation. We evaluate work process perfor-mance and set improvement priorities through the SPP (Fig. 2.1-1), performance reviews (4.1b), management of daily operations (6.2b(1)), and Baldrige-based assessments (P.2c).
We foster innovation through multiple approaches, includ-ing culture, workforce strategy, setting high goals that require breakthrough change, creating incubators for innovation such as the Simulation Center, and sharing innovations through the Quality Expo, performance review, research methods, and other means. We apply our MFI to promising new ideas to de-velop, refine, deploy, and spread innovations. In our search for best practices and innovative ideas (part of “Plan”), we capital-ize on our CCs, internal research and education, the expertise of our own clinicians, knowledge from our collaborative part-ners (e.g., surgical care improvement project (SCIP), IHI’s 5 Million Lives Campaign, Keystone), collaborations with pro-fessional and industry experts (e.g., Press Ganey and Premier), and benchmarking with Baldrige recipients and other high per-formers in and outside of health care. Sharing our innovations nationally helps us learn and improve faster. For example, IHI, AHRQ, MHA and others have considered our No Harm Cam-paign a starting point for a potential national model. This has led to further refinements as more experts are exposed to our innovations and are able to test them on a broader scale.
System-wide teams of performance improvement specialists systematically review and improve process improvement ap-proaches using analysis against ADLI, best practices, and les-sons learned. Improvements and lessons learned are deployed continuously by means of performance reviews by the PC and BU/Pillar teams (4.1c(1)); key leadership meetings, such as quarterly LEAP retreats and All-Leadership Town Hall meet-ings; publications for the workforce, such as News and Views or Monday Monitor; and the HFHS Website and KW (4.2a(3)). An annual sharing method is the HFHS Quality Expo, a week-long poster exhibition of over 70 projects, including a competi-tion among top project teams judged by outside experts. The Expo online catalog profiles process changes and results fol-lowing the MFI format (Fig. 6.1-2). All projects are catalogued in the KW to spread learning across the organization.
40
45
50
55
60
Q10
8
Q20
8
Q30
8
Q40
8
Q10
9
Q20
9
Q30
9
Q40
9
Q11
0
Q21
0
Q31
0
Q41
0
Glo
bal H
arm
Eve
nts
Per
1,
000
Pat
ient
Day
s
HFHS Best Reported Comparison
Overall harm rate drops by 24% in three years vs. next best of 6%
Fig. �.�-�: Global Harm
Good
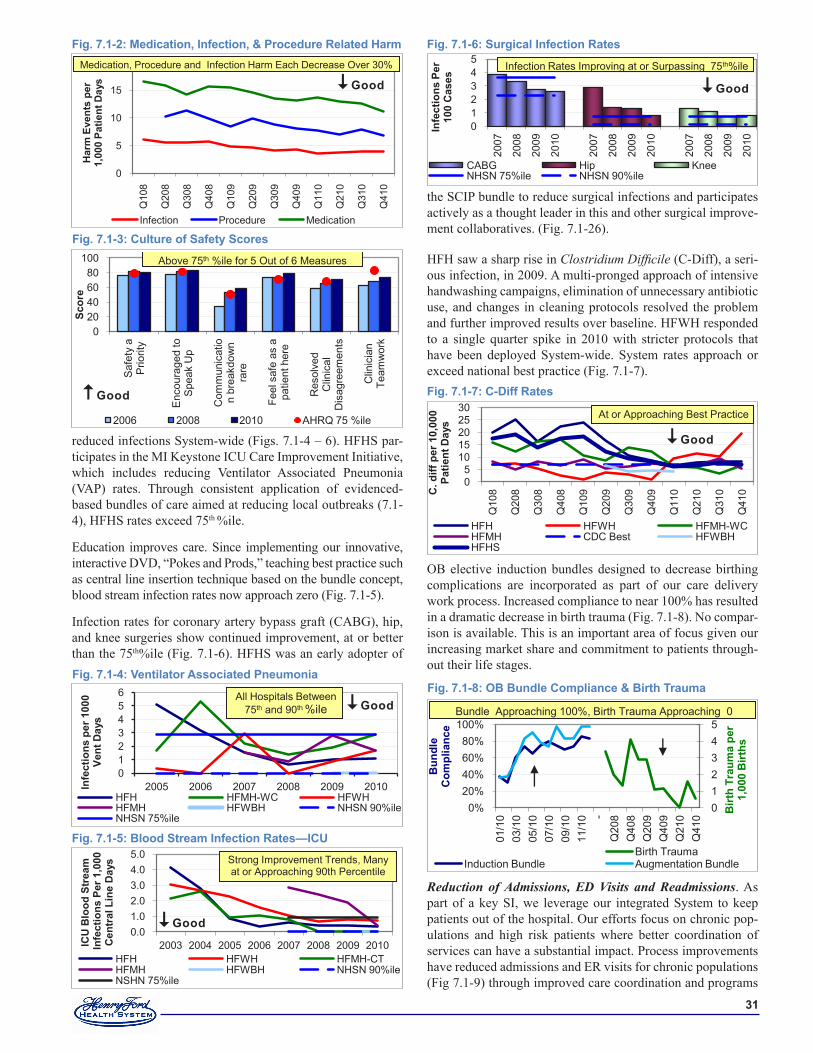
��
reduced infections System-wide (Figs. 7.1-4 – 6). HFHS par-ticipates in the MI Keystone ICU Care Improvement Initiative, which includes reducing Ventilator Associated Pneumonia (VAP) rates. Through consistent application of evidenced-based bundles of care aimed at reducing local outbreaks (7.1-4), HFHS rates exceed 75th %ile.
Education improves care. Since implementing our innovative, interactive DVD, “Pokes and Prods,” teaching best practice such as central line insertion technique based on the bundle concept, blood stream infection rates now approach zero (Fig. 7.1-5).
Infection rates for coronary artery bypass graft (CABG), hip, and knee surgeries show continued improvement, at or better than the 75th%ile (Fig. 7.1-6). HFHS was an early adopter of
the SCIP bundle to reduce surgical infections and participates actively as a thought leader in this and other surgical improve-ment collaboratives. (Fig. 7.1-26).
HFH saw a sharp rise in Clostridium Difficile (C-Diff), a seri-ous infection, in 2009. A multi-pronged approach of intensive handwashing campaigns, elimination of unnecessary antibiotic use, and changes in cleaning protocols resolved the problem and further improved results over baseline. HFWH responded to a single quarter spike in 2010 with stricter protocols that have been deployed System-wide. System rates approach or exceed national best practice (Fig. 7.1-7).
OB elective induction bundles designed to decrease birthing complications are incorporated as part of our care delivery work process. Increased compliance to near 100% has resulted in a dramatic decrease in birth trauma (Fig. 7.1-8). No compar-ison is available. This is an important area of focus given our increasing market share and commitment to patients through-out their life stages.
Reduction of Admissions, ED Visits and Readmissions. As part of a key SI, we leverage our integrated System to keep patients out of the hospital. Our efforts focus on chronic pop-ulations and high risk patients where better coordination of services can have a substantial impact. Process improvements have reduced admissions and ER visits for chronic populations (Fig 7.1-9) through improved care coordination and programs
Fig. �.�-�: Ventilator Associated Pneumonia
0123456
2005 2006 2007 2008 2009 2010Infe
ctio
ns p
er �
000
Vent
Day
s
HFH HFMH-WC HFWHHFMH HFWBH NHSN 90%ileNHSN 75%ile
All Hospitals Between 75th and 90th %ile Good
0
5
10
15
20
Q10
8
Q20
8
Q30
8
Q40
8
Q10
9
Q20
9
Q30
9
Q40
9
Q11
0
Q21
0
Q31
0
Q41
0
Har
m E
vent
s pe
r 1,
000
Patie
nt D
ays
Infection Procedure Medication
Medication, Procedure and Infection Harm Each Decrease Over 30%Medication, Procedure and Infection Harm Each Decrease Over 30%
Fig. �.�-�: Medication, Infection, & Procedure Related Harm
Good
020406080
100
Saf
ety
a P
riorit
y
Enc
oura
ged
to
Spe
ak U
p
Com
mun
icat
ion
brea
kdow
n ra
re
Feel
saf
e as
a
patie
nt h
ere
Res
olve
d C
linic
al
Dis
agre
emen
ts
Clin
icia
n Te
amw
ork
Scor
e
2006 2008 2010 AHRQ 75 %ile
Above 75th %ile for 5 Out of 6 Measures
Good
Fig. �.�-�: Culture of Safety Scores
Fig. �.�-�: Blood Stream Infection Rates—ICU
0.01.02.03.04.05.0
2003 2004 2005 2006 2007 2008 2009 2010ICU
Blo
od S
trea
mIn
fect
ions
Per
�,0
00
Cen
tral
Lin
e D
ays
HFH HFWH HFMH-CTHFMH HFWBH NHSN 90%ileNSHN 75%ile
Strong Improvement Trends, Many at or Approaching 90th Percentile
Good
Fig. �.�-�: Surgical Infection Rates
012345
2007
2008
2009
2010
2007
2008
2009
2010
2007
2008
2009
2010
Infe
ctio
ns P
er
�00
Cas
es
CABG Hip KneeNHSN 75%ile NHSN 90%ile
Infection Rates Improving at or Surpassing 75th%ile
Good
Fig. �.�-�: C-Diff Rates
05
1015202530
Q10
8
Q20
8
Q30
8
Q40
8
Q10
9
Q20
9
Q30
9
Q40
9
Q11
0
Q21
0
Q31
0
Q41
0C. d
iff p
er �
0,00
0 Pa
tient
Day
s
HFH HFWH HFMH-WCHFMH CDC Best HFWBHHFHS
At or Approaching Best Practice
Good
0%20%40%60%80%
100%
01/1
003
/10
05/1
007
/10
09/1
011
/10 -
Q20
8Q
408
Q20
9Q
409
Q21
0Q
410
012345
Bun
dle
Com
plia
nce
Birt
h Tr
aum
a pe
r �,
000
Birt
hs
Infant Birth Trauma Birth TraumaInduction Bundle Augmentation Bundle
Bundle Approaching 100%, Birth Trauma Approaching 0
Fig. �.�-�: OB Bundle Compliance & Birth Trauma
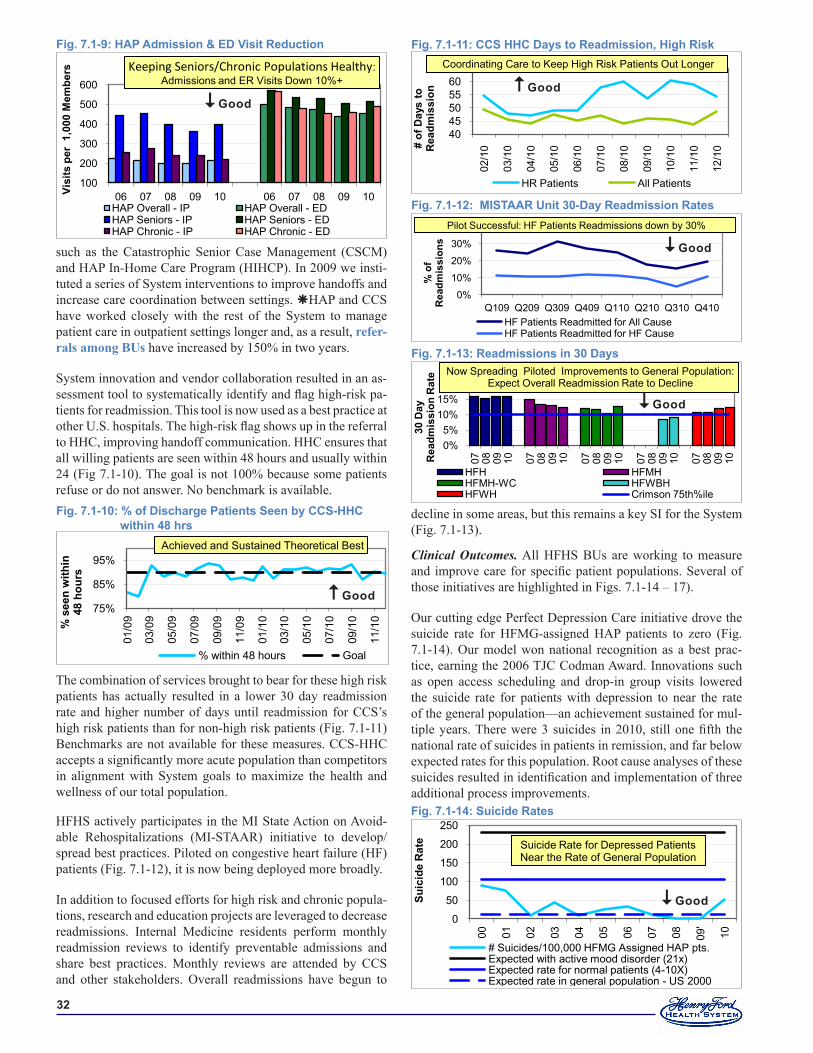
��
such as the Catastrophic Senior Case Management (CSCM) and HAP In-Home Care Program (HIHCP). In 2009 we insti-tuted a series of System interventions to improve handoffs and increase care coordination between settings. HAP and CCS have worked closely with the rest of the System to manage patient care in outpatient settings longer and, as a result, refer-rals among BUs have increased by 150% in two years.
System innovation and vendor collaboration resulted in an as-sessment tool to systematically identify and flag high-risk pa-tients for readmission. This tool is now used as a best practice at other U.S. hospitals. The high-risk flag shows up in the referral to HHC, improving handoff communication. HHC ensures that all willing patients are seen within 48 hours and usually within 24 (Fig 7.1-10). The goal is not 100% because some patients refuse or do not answer. No benchmark is available.
The combination of services brought to bear for these high risk patients has actually resulted in a lower 30 day readmission rate and higher number of days until readmission for CCS’s high risk patients than for non-high risk patients (Fig. 7.1-11) Benchmarks are not available for these measures. CCS-HHC accepts a significantly more acute population than competitors in alignment with System goals to maximize the health and wellness of our total population.
HFHS actively participates in the MI State Action on Avoid-able Rehospitalizations (MI-STAAR) initiative to develop/spread best practices. Piloted on congestive heart failure (HF) patients (Fig. 7.1-12), it is now being deployed more broadly.
In addition to focused efforts for high risk and chronic popula-tions, research and education projects are leveraged to decrease readmissions. Internal Medicine residents perform monthly readmission reviews to identify preventable admissions and share best practices. Monthly reviews are attended by CCS and other stakeholders. Overall readmissions have begun to
decline in some areas, but this remains a key SI for the System (Fig. 7.1-13).
Clinical Outcomes. All HFHS BUs are working to measure and improve care for specific patient populations. Several of those initiatives are highlighted in Figs. 7.1-14 – 17).
Our cutting edge Perfect Depression Care initiative drove the suicide rate for HFMG-assigned HAP patients to zero (Fig. 7.1-14). Our model won national recognition as a best prac-tice, earning the 2006 TJC Codman Award. Innovations such as open access scheduling and drop-in group visits lowered the suicide rate for patients with depression to near the rate of the general population—an achievement sustained for mul-tiple years. There were 3 suicides in 2010, still one fifth the national rate of suicides in patients in remission, and far below expected rates for this population. Root cause analyses of these suicides resulted in identification and implementation of three additional process improvements.
Fig. �.�-��: CCS HHC Days to Readmission, High Risk
404550556065
02/1
0
03/1
0
04/1
0
05/1
0
06/1
0
07/1
0
08/1
0
09/1
0
10/1
0
11/1
0
12/1
0# of
Day
s to
R
eadm
issi
on
HR Patients All Patients
Coordinating Care to Keep High Risk Patients Out Longer
Good
Fig. �.�-��: MISTAAR Unit �0-Day Readmission Rates
0%
10%
20%
30%
40%
Q109 Q209 Q309 Q409 Q110 Q210 Q310 Q410
% o
fR
eadm
issi
ons
HF Patients Readmitted for All CauseHF Patients Readmitted for HF Cause
Pilot Successful: HF Patients Readmissions down by 30%
Good
Fig. �.�-��: Readmissions in �0 Days
0%5%
10%15%
07 08 09 10 07 08 09 10 07 08 09 10 07 08 09 10 07 08 09 10
�0 D
ay
Rea
dmis
sion
Rat
e
HFH HFMHHFMH-WC HFWBHHFWH Crimson 75th%ile
Now Spreading Piloted Improvements to General Population: Expect Overall Readmission Rate to Decline
Good
Fig. �.�-��: Suicide Rates
0
50
100
150
200
250
00 01 02 03 04 05 06 07 08 09'
10
Suic
ide
Rat
e
# Suicides/100,000 HFMG Assigned HAP pts.Expected with active mood disorder (21x)Expected rate for normal patients (4-10X)Expected rate in general population - US 2000
Suicide Rate for Depressed Patients Near the Rate of General Population
Good
Fig. �.�-�: HAP Admission & ED Visit Reduction
100
200
300
400
500
600
06 07 08 09 10 06 07 08 09 10Visi
ts p
er �
,000
Mem
bers
HAP Overall - IP HAP Overall - EDHAP Seniors - IP HAP Seniors - EDHAP Chronic - IP HAP Chronic - ED
Keeping Seniors/Chronic Populations Healthy: Admissions and ER Visits Down 10%+
Good
Fig. �.�-�0: % of Discharge Patients Seen by CCS-HHC within �� hrs
75%
85%
95%
01/0
9
03/0
9
05/0
9
07/0
9
09/0
9
11/0
9
01/1
0
03/1
0
05/1
0
07/1
0
09/1
0
11/1
0% s
een
with
in
�� h
ours
% within 48 hours Goal
Achieved and Sustained Theoretical Best
Good
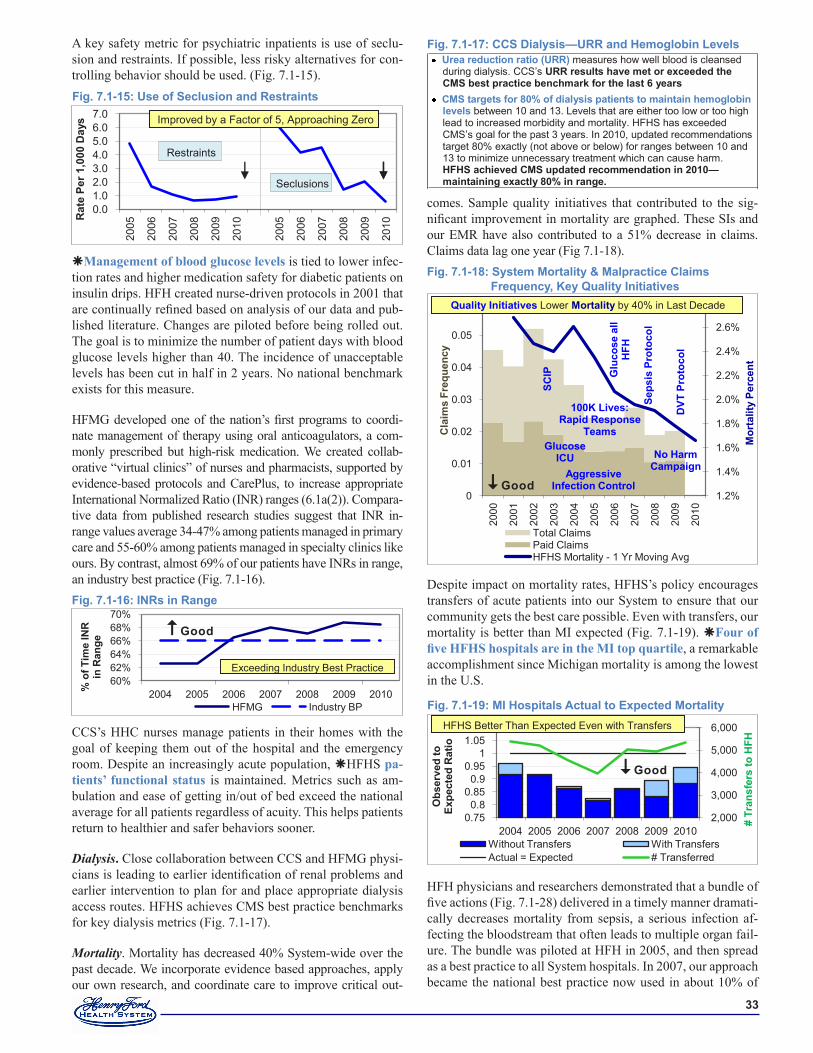
��
A key safety metric for psychiatric inpatients is use of seclu-sion and restraints. If possible, less risky alternatives for con-trolling behavior should be used. (Fig. 7.1-15).
Management of blood glucose levels is tied to lower infec-tion rates and higher medication safety for diabetic patients on insulin drips. HFH created nurse-driven protocols in 2001 that are continually refined based on analysis of our data and pub-lished literature. Changes are piloted before being rolled out. The goal is to minimize the number of patient days with blood glucose levels higher than 40. The incidence of unacceptable levels has been cut in half in 2 years. No national benchmark exists for this measure.
HFMG developed one of the nation’s first programs to coordi-nate management of therapy using oral anticoagulators, a com-monly prescribed but high-risk medication. We created collab-orative “virtual clinics” of nurses and pharmacists, supported by evidence-based protocols and CarePlus, to increase appropriate International Normalized Ratio (INR) ranges (6.1a(2)). Compara-tive data from published research studies suggest that INR in-range values average 34-47% among patients managed in primary care and 55-60% among patients managed in specialty clinics like ours. By contrast, almost 69% of our patients have INRs in range, an industry best practice (Fig. 7.1-16).
CCS’s HHC nurses manage patients in their homes with the goal of keeping them out of the hospital and the emergency room. Despite an increasingly acute population, HFHS pa-tients’ functional status is maintained. Metrics such as am-bulation and ease of getting in/out of bed exceed the national average for all patients regardless of acuity. This helps patients return to healthier and safer behaviors sooner.
Dialysis. Close collaboration between CCS and HFMG physi-cians is leading to earlier identification of renal problems and earlier intervention to plan for and place appropriate dialysis access routes. HFHS achieves CMS best practice benchmarks for key dialysis metrics (Fig. 7.1-17).
Mortality. Mortality has decreased 40% System-wide over the past decade. We incorporate evidence based approaches, apply our own research, and coordinate care to improve critical out-
comes. Sample quality initiatives that contributed to the sig-nificant improvement in mortality are graphed. These SIs and our EMR have also contributed to a 51% decrease in claims. Claims data lag one year (Fig 7.1-18).
Despite impact on mortality rates, HFHS’s policy encourages transfers of acute patients into our System to ensure that our community gets the best care possible. Even with transfers, our mortality is better than MI expected (Fig. 7.1-19). Four of five HFHS hospitals are in the MI top quartile, a remarkable accomplishment since Michigan mortality is among the lowest in the U.S.
HFH physicians and researchers demonstrated that a bundle of five actions (Fig. 7.1-28) delivered in a timely manner dramati-cally decreases mortality from sepsis, a serious infection af-fecting the bloodstream that often leads to multiple organ fail-ure. The bundle was piloted at HFH in 2005, and then spread as a best practice to all System hospitals. In 2007, our approach became the national best practice now used in about 10% of
0.01.02.03.04.05.06.07.0
2005
2006
2007
2008
2009
2010
2005
2006
2007
2008
2009
2010
Rat
e Pe
r �,0
00 D
ays
Seclusions
Restraints
Improved by a Factor of 5, Approaching Zero
Fig. �.�-��: Use of Seclusion and Restraints
Fig. �.�-��: INRs in Range
60%62%64%66%68%70%
2004 2005 2006 2007 2008 2009 2010% o
f Tim
e IN
R
in R
ange
HFMG Industry BP
Exceeding Industry Best Practice
Good
Fig. �.�-��: System Mortality & Malpractice Claims Frequency, Key Quality Initiatives
1.2%
1.4%
1.6%
1.8%
2.0%
2.2%
2.4%
2.6%
2.8%
0
0.01
0.02
0.03
0.04
0.05
0.06
2000
2001
2002
2003
2004
2005
2006
2007
2008
2009
2010
Mor
talit
y Pe
rcen
t
Cla
ims
Freq
uenc
y
Total ClaimsPaid ClaimsHFHS Mortality - 1 Yr Moving Avg
Quality Initiatives Lower Mortality by 40% in Last Decade
SCIP
Glucose ICU
100K Lives: Rapid Response
Teams
Aggressive Infection Control
Glu
cose
all
HFH
Seps
isPr
otoc
ol
DVT
Pro
toco
l
No HarmCampaign
Good
Urea reduction ratio (URR) measures how well blood is cleansed during dialysis. CCS’s URR results have met or exceeded the CMS best practice benchmark for the last � years
CMS targets for �0% of dialysis patients to maintain hemoglobin levels between 10 and 13. Levels that are either too low or too high lead to increased morbidity and mortality. HFHS has exceeded CMS’s goal for the past 3 years. In 2010, updated recommendations target 80% exactly (not above or below) for ranges between 10 and 13 to minimize unnecessary treatment which can cause harm. HFHS achieved CMS updated recommendation in �0�0—maintaining exactly �0% in range.
Fig. �.�-��: CCS Dialysis—URR and Hemoglobin Levels
2,000
3,000
4,000
5,000
6,000
0.750.8
0.850.9
0.951
1.051.1
2004 2005 2006 2007 2008 2009 2010
# Tr
ansf
ers
to H
FH
Obs
erve
d to
Ex
pect
ed R
atio
Without Transfers With TransfersActual = Expected # Transferred
HFHS Better Than Expected Even with Transfers
Fig. �.�-��: MI Hospitals Actual to Expected Mortality
Good
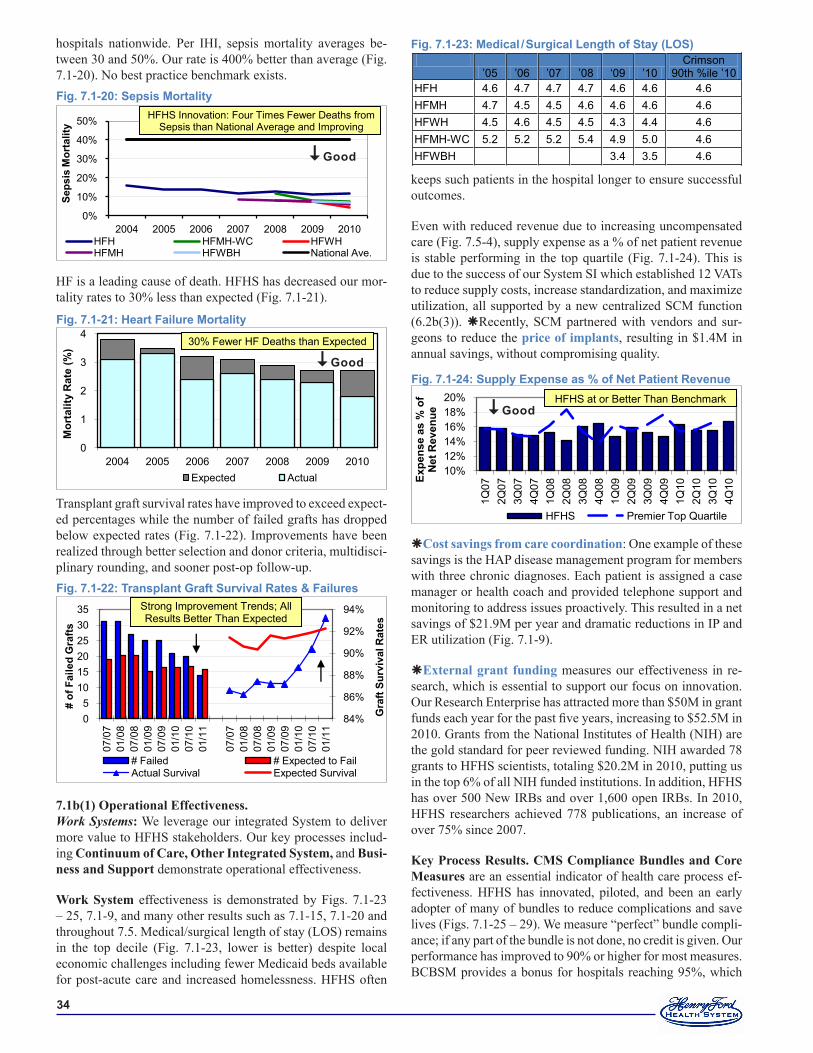
��
hospitals nationwide. Per IHI, sepsis mortality averages be-tween 30 and 50%. Our rate is 400% better than average (Fig. 7.1-20). No best practice benchmark exists.
HF is a leading cause of death. HFHS has decreased our mor-tality rates to 30% less than expected (Fig. 7.1-21).
Transplant graft survival rates have improved to exceed expect-ed percentages while the number of failed grafts has dropped below expected rates (Fig. 7.1-22). Improvements have been realized through better selection and donor criteria, multidisci-plinary rounding, and sooner post-op follow-up.
7.1b(1) Operational Effectiveness.Work Systems: We leverage our integrated System to deliver more value to HFHS stakeholders. Our key processes includ-ing Continuum of Care, Other Integrated System, and Busi-ness and Support demonstrate operational effectiveness.
Work System effectiveness is demonstrated by Figs. 7.1-23 – 25, 7.1-9, and many other results such as 7.1-15, 7.1-20 and throughout 7.5. Medical/surgical length of stay (LOS) remains in the top decile (Fig. 7.1-23, lower is better) despite local economic challenges including fewer Medicaid beds available for post-acute care and increased homelessness. HFHS often
keeps such patients in the hospital longer to ensure successful outcomes.
Even with reduced revenue due to increasing uncompensated care (Fig. 7.5-4), supply expense as a % of net patient revenue is stable performing in the top quartile (Fig. 7.1-24). This is due to the success of our System SI which established 12 VATs to reduce supply costs, increase standardization, and maximize utilization, all supported by a new centralized SCM function (6.2b(3)). Recently, SCM partnered with vendors and sur-geons to reduce the price of implants, resulting in $1.4M in annual savings, without compromising quality.
Cost savings from care coordination: One example of these savings is the HAP disease management program for members with three chronic diagnoses. Each patient is assigned a case manager or health coach and provided telephone support and monitoring to address issues proactively. This resulted in a net savings of $21.9M per year and dramatic reductions in IP and ER utilization (Fig. 7.1-9).
External grant funding measures our effectiveness in re-search, which is essential to support our focus on innovation. Our Research Enterprise has attracted more than $50M in grant funds each year for the past five years, increasing to $52.5M in 2010. Grants from the National Institutes of Health (NIH) are the gold standard for peer reviewed funding. NIH awarded 78 grants to HFHS scientists, totaling $20.2M in 2010, putting us in the top 6% of all NIH funded institutions. In addition, HFHS has over 500 New IRBs and over 1,600 open IRBs. In 2010, HFHS researchers achieved 778 publications, an increase of over 75% since 2007.
Key Process Results. CMS Compliance Bundles and Core Measures are an essential indicator of health care process ef-fectiveness. HFHS has innovated, piloted, and been an early adopter of many of bundles to reduce complications and save lives (Figs. 7.1-25 – 29). We measure “perfect” bundle compli-ance; if any part of the bundle is not done, no credit is given. Our performance has improved to 90% or higher for most measures. BCBSM provides a bonus for hospitals reaching 95%, which
’05 ’06 ’07 ’08 ‘09 ’10
Crimson 90th %ile ’10
HFH 4.6 4.7 4.7 4.7 4.6 4.6 4.6 HFMH 4.7 4.5 4.5 4.6 4.6 4.6 4.6 HFWH 4.5 4.6 4.5 4.5 4.3 4.4 4.6 HFMH-WC 5.2 5.2 5.2 5.4 4.9 5.0 4.6 HFWBH 3.4 3.5 4.6
Fig. �.�-��: Medical / Surgical Length of Stay (LOS)
10%12%14%16%18%20%
1Q07
2Q07
3Q07
4Q07
1Q08
2Q08
3Q08
4Q08
1Q09
2Q09
3Q09
4Q09
1Q10
2Q10
3Q10
4Q10
Expe
nse
as %
of
Net
Rev
enue
HFHS Premier Top Quartile
HFHS at or Better Than Benchmark
Fig. �.�-��: Supply Expense as % of Net Patient Revenue
Good
0%
10%
20%
30%
40%
50%
2004 2005 2006 2007 2008 2009 2010
Seps
is M
orta
lity
HFH HFMH-WC HFWHHFMH HFWBH National Ave.
HFHS Innovation: Four Times Fewer Deaths fromSepsis than National Average and Improving
Fig. �.�-�0: Sepsis Mortality
Good
0
1
2
3
4
2004 2005 2006 2007 2008 2009 2010
Mor
talit
y R
ate
(%)
Expected Actual
30% Fewer HF Deaths than Expected
Fig. �.�-��: Heart Failure Mortality
Good
84%
86%
88%
90%
92%
94%
05
101520253035
07/0
701
/08
07/0
801
/09
07/0
901
/10
07/1
001
/11
07/0
701
/08
07/0
801
/09
07/0
901
/10
07/1
001
/11
Gra
ft Su
rviv
al R
ates
# of
Fai
led
Gra
fts
# Failed # Expected to FailActual Survival Expected Survival
Strong Improvement Trends; All Results Better Than Expected
Fig. �.�-��: Transplant Graft Survival Rates & Failures
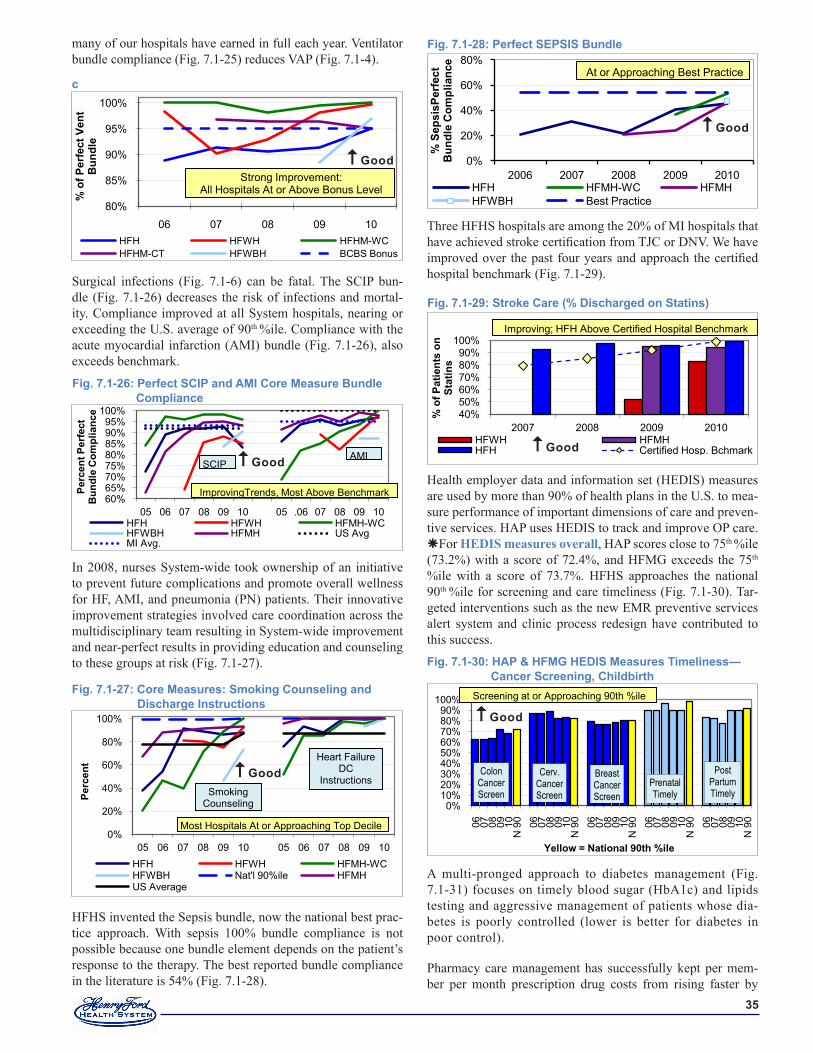
��
many of our hospitals have earned in full each year. Ventilator bundle compliance (Fig. 7.1-25) reduces VAP (Fig. 7.1-4).
Surgical infections (Fig. 7.1-6) can be fatal. The SCIP bun-dle (Fig. 7.1-26) decreases the risk of infections and mortal-ity. Compliance improved at all System hospitals, nearing or exceeding the U.S. average of 90th %ile. Compliance with the acute myocardial infarction (AMI) bundle (Fig. 7.1-26), also exceeds benchmark.
In 2008, nurses System-wide took ownership of an initiative to prevent future complications and promote overall wellness for HF, AMI, and pneumonia (PN) patients. Their innovative improvement strategies involved care coordination across the multidisciplinary team resulting in System-wide improvement and near-perfect results in providing education and counseling to these groups at risk (Fig. 7.1-27).
HFHS invented the Sepsis bundle, now the national best prac-tice approach. With sepsis 100% bundle compliance is not possible because one bundle element depends on the patient’s response to the therapy. The best reported bundle compliance in the literature is 54% (Fig. 7.1-28).
80%
85%
90%
95%
100%
06 07 08 09 10
% o
f Per
fect
Ven
t B
undl
e
HFH HFWH HFHM-WCHFHM-CT HFWBH BCBS Bonus
Strong Improvement: All Hospitals At or Above Bonus Level
c
Good
60%65%70%75%80%85%90%95%
100%
05 06 07 08 09 10 05 .06 07 08 09 10
Perc
ent P
erfe
ct
Bun
dle
Com
plia
nce
HFH HFWH HFMH-WCHFWBH HFMH US AvgMI Avg.
ImprovingTrends, Most Above Benchmark
SCIPAMI
Fig. �.�-��: Perfect SCIP and AMI Core Measure Bundle Compliance
Good
Three HFHS hospitals are among the 20% of MI hospitals that have achieved stroke certification from TJC or DNV. We have improved over the past four years and approach the certified hospital benchmark (Fig. 7.1-29).
Health employer data and information set (HEDIS) measures are used by more than 90% of health plans in the U.S. to mea-sure performance of important dimensions of care and preven-tive services. HAP uses HEDIS to track and improve OP care. For HEDIS measures overall, HAP scores close to 75th %ile (73.2%) with a score of 72.4%, and HFMG exceeds the 75th
%ile with a score of 73.7%. HFHS approaches the national 90th %ile for screening and care timeliness (Fig. 7.1-30). Tar-geted interventions such as the new EMR preventive services alert system and clinic process redesign have contributed to this success.
A multi-pronged approach to diabetes management (Fig. 7.1-31) focuses on timely blood sugar (HbA1c) and lipids testing and aggressive management of patients whose dia-betes is poorly controlled (lower is better for diabetes in poor control).
Pharmacy care management has successfully kept per mem-ber per month prescription drug costs from rising faster by
Fig. �.�-��: Core Measures: Smoking Counseling and Discharge Instructions
0%
20%
40%
60%
80%
100%
05 06 07 08 09 10 05 06 07 08 09 10
Perc
ent
HFH HFWH HFMH-WCHFWBH Nat'l 90%ile HFMHUS Average
Most Hospitals At or Approaching Top Decile
Smoking Counseling
Heart Failure DC
InstructionsGood
Fig. �.�-�0: HAP & HFMG HEDIS Measures Timeliness—Cancer Screening, Childbirth
0%10%20%30%40%50%60%70%80%90%
100%
06 07 08 09 10N
90 06 07 08 09 10
N 9
0 06 07 08 09 10N
90 06 07 08 09 10
N 9
0 06 07 08 09 10N
90
Yellow = National �0th %ile
ColonCancerScreen
Cerv.CancerScreen
BreastCancerScreen
Prenatal Timely
Post Partum Timely
Screening at or Approaching 90th %ile
Good
0%
20%
40%
60%
80%
2006 2007 2008 2009 2010
% S
epsi
sPer
fect
B
undl
e C
ompl
ianc
e
HFH HFMH-WC HFMHHFWBH Best Practice
At or Approaching Best Practice
Fig. �.�-��: Perfect SEPSIS Bundle
Good
Fig. �.�-��: Stroke Care (% Discharged on Statins)
40%50%60%70%80%90%
100%
2007 2008 2009 2010%
of P
atie
nts
on
Stat
ins
HFWH HFMHHFH Certified Hosp. Bchmark
Improving; HFH Above Certified Hospital Benchmark
Good
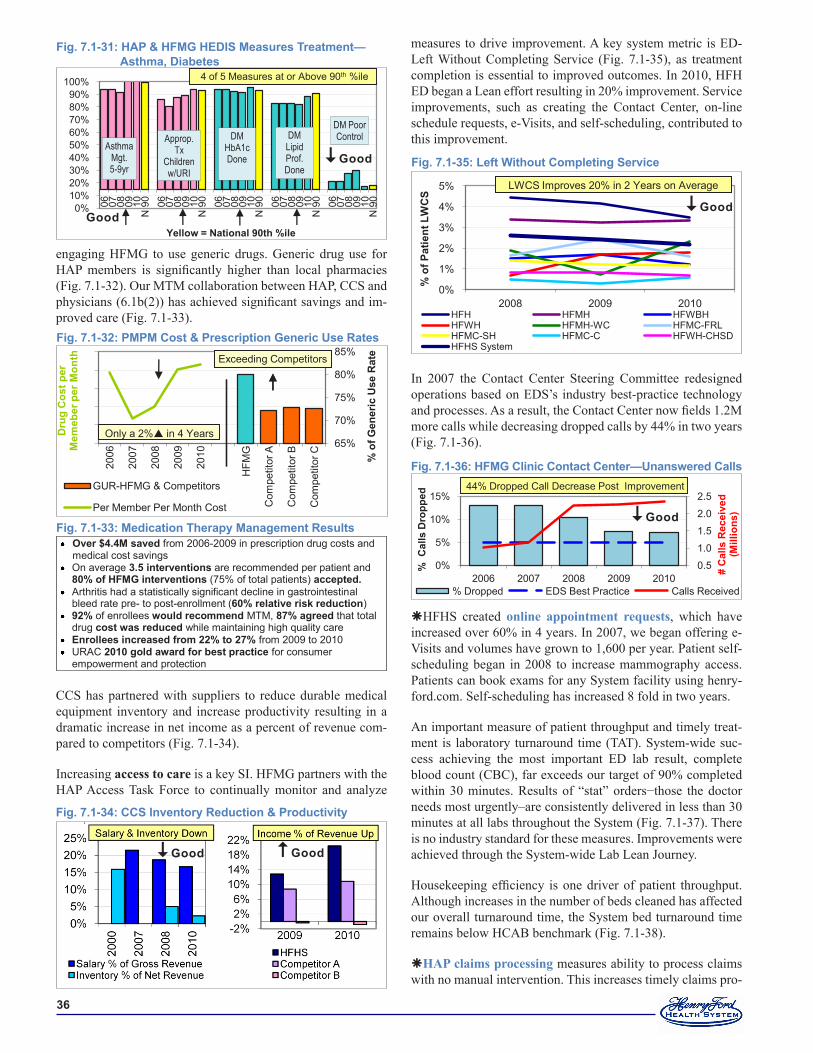
��
engaging HFMG to use generic drugs. Generic drug use for HAP members is significantly higher than local pharmacies (Fig. 7.1-32). Our MTM collaboration between HAP, CCS and physicians (6.1b(2)) has achieved significant savings and im-proved care (Fig. 7.1-33).
CCS has partnered with suppliers to reduce durable medical equipment inventory and increase productivity resulting in a dramatic increase in net income as a percent of revenue com-pared to competitors (Fig. 7.1-34).
Increasing access to care is a key SI. HFMG partners with the HAP Access Task Force to continually monitor and analyze
measures to drive improvement. A key system metric is ED-Left Without Completing Service (Fig. 7.1-35), as treatment completion is essential to improved outcomes. In 2010, HFH ED began a Lean effort resulting in 20% improvement. Service improvements, such as creating the Contact Center, on-line schedule requests, e-Visits, and self-scheduling, contributed to this improvement.
In 2007 the Contact Center Steering Committee redesigned operations based on EDS’s industry best-practice technology and processes. As a result, the Contact Center now fields 1.2M more calls while decreasing dropped calls by 44% in two years (Fig. 7.1-36).
HFHS created online appointment requests, which have increased over 60% in 4 years. In 2007, we began offering e-Visits and volumes have grown to 1,600 per year. Patient self-scheduling began in 2008 to increase mammography access. Patients can book exams for any System facility using henry-ford.com. Self-scheduling has increased 8 fold in two years.
An important measure of patient throughput and timely treat-ment is laboratory turnaround time (TAT). System-wide suc-cess achieving the most important ED lab result, complete blood count (CBC), far exceeds our target of 90% completed within 30 minutes. Results of “stat” orders−those the doctor needs most urgently–are consistently delivered in less than 30 minutes at all labs throughout the System (Fig. 7.1-37). There is no industry standard for these measures. Improvements were achieved through the System-wide Lab Lean Journey.
Housekeeping efficiency is one driver of patient throughput. Although increases in the number of beds cleaned has affected our overall turnaround time, the System bed turnaround time remains below HCAB benchmark (Fig. 7.1-38).
HAP claims processing measures ability to process claims with no manual intervention. This increases timely claims pro-
0%
1%
2%
3%
4%
5%
2008 2009 2010
% o
f Pat
ient
LW
CS
HFH HFMH HFWBHHFWH HFMH-WC HFMC-FRLHFMC-SH HFMC-C HFWH-CHSDHFHS System
LWCS Improves 20% in 2 Years on Average
Fig. �.�-��: Left Without Completing Service
Good
0.5
1.0
1.5
2.0
2.5
0%
5%
10%
15%
2006 2007 2008 2009 2010
# C
alls
Rec
eive
d(M
illio
ns)
% C
alls
Dro
pped
% Dropped EDS Best Practice Calls Received
44% Dropped Call Decrease Post Improvement
Fig. �.�-��: HFMG Clinic Contact Center—Unanswered Calls
Good
Fig. �.�-��: CCS Inventory Reduction & Productivity
Good Good
Fig. �.�-��: HAP & HFMG HEDIS Measures Treatment—Asthma, Diabetes
0%10%20%30%40%50%60%70%80%90%
100%
06 07 08 09 10N
90 06 07 08 09 10
N 9
0 06 07 08 09 10N
90 06 07 08 09 10
N 9
0 06 07 08 09 10N
90
Yellow = National �0th %ile
AsthmaMgt.5-9yr
Approp. Tx
Children w/URI
DMHbA1cDone
DM Poor ControlDM
LipidProf.Done
4 of 5 Measures at or Above 90th %ile
Good
Good
Over $�.�M saved from 2006-2009 in prescription drug costs and medical cost savings
On average �.� interventions are recommended per patient and �0% of HFMG interventions (75% of total patients) accepted.
Arthritis had a statistically significant decline in gastrointestinal bleed rate pre- to post-enrollment (�0% relative risk reduction)
��% of enrollees would recommend MTM, ��% agreed that total drug cost was reduced while maintaining high quality care
Enrollees increased from ��% to ��% from 2009 to 2010 URAC �0�0 gold award for best practice for consumer
empowerment and protection
Fig. �.�-��: Medication Therapy Management Results
Fig. �.�-��: PMPM Cost & Prescription Generic Use Rates
65%
70%
75%
80%
85%
$40
$42
$44
$46
$48
$50
2006
2007
2008
2009
2010
HFM
G
Com
petit
or A
Com
petit
or B
Com
petit
or C
% o
f Gen
eric
Use
Rat
e
Dru
g C
ost p
er
Mem
eber
per
Mon
th
GUR-HFMG & Competitors
Per Member Per Month Cost
Exceeding Competitors
Only a 2% in 4 Years
Exceeding Competitors
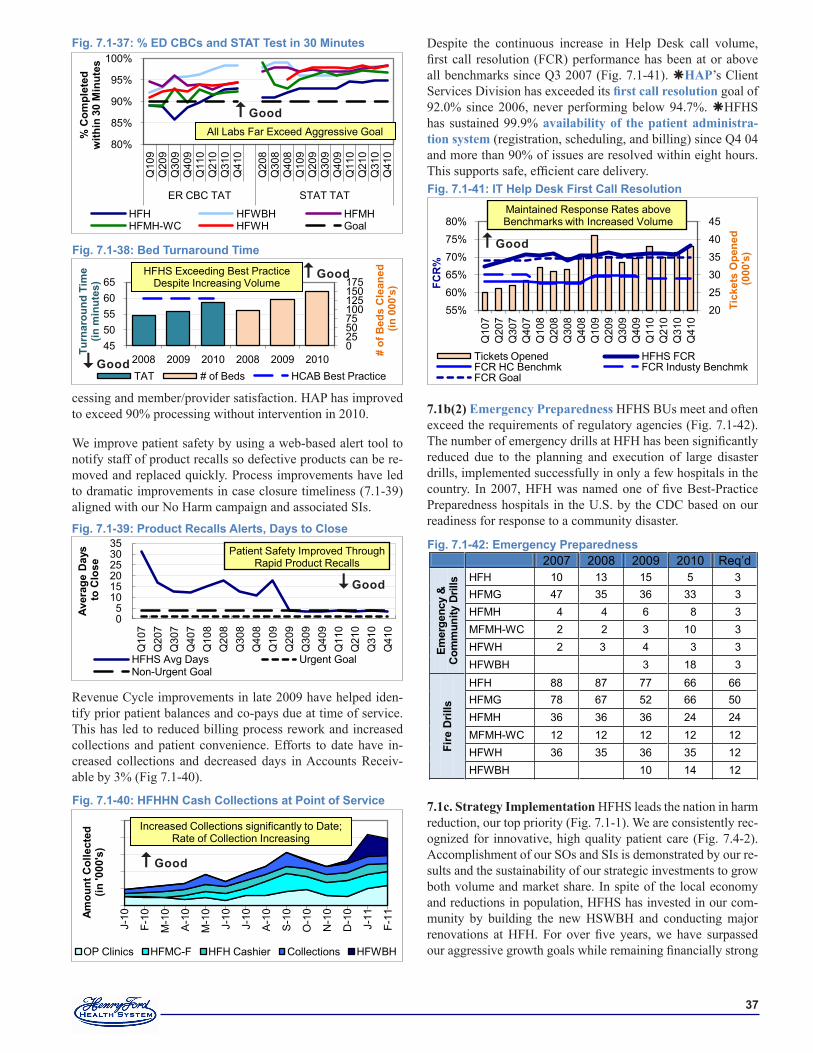
��
cessing and member/provider satisfaction. HAP has improved to exceed 90% processing without intervention in 2010.
We improve patient safety by using a web-based alert tool to notify staff of product recalls so defective products can be re-moved and replaced quickly. Process improvements have led to dramatic improvements in case closure timeliness (7.1-39) aligned with our No Harm campaign and associated SIs.
Revenue Cycle improvements in late 2009 have helped iden-tify prior patient balances and co-pays due at time of service. This has led to reduced billing process rework and increased collections and patient convenience. Efforts to date have in-creased collections and decreased days in Accounts Receiv-able by 3% (Fig 7.1-40).
Despite the continuous increase in Help Desk call volume, first call resolution (FCR) performance has been at or above all benchmarks since Q3 2007 (Fig. 7.1-41). HAP’s Client Services Division has exceeded its first call resolution goal of 92.0% since 2006, never performing below 94.7%. HFHS has sustained 99.9% availability of the patient administra-tion system (registration, scheduling, and billing) since Q4 04 and more than 90% of issues are resolved within eight hours. This supports safe, efficient care delivery.
7.1b(2) Emergency Preparedness HFHS BUs meet and often exceed the requirements of regulatory agencies (Fig. 7.1-42). The number of emergency drills at HFH has been significantly reduced due to the planning and execution of large disaster drills, implemented successfully in only a few hospitals in the country. In 2007, HFH was named one of five Best-Practice Preparedness hospitals in the U.S. by the CDC based on our readiness for response to a community disaster.
7.1c. Strategy Implementation HFHS leads the nation in harm reduction, our top priority (Fig. 7.1-1). We are consistently rec-ognized for innovative, high quality patient care (Fig. 7.4-2). Accomplishment of our SOs and SIs is demonstrated by our re-sults and the sustainability of our strategic investments to grow both volume and market share. In spite of the local economy and reductions in population, HFHS has invested in our com-munity by building the new HSWBH and conducting major renovations at HFH. For over five years, we have surpassed our aggressive growth goals while remaining financially strong
05
101520253035
Q10
7Q
207
Q30
7Q
407
Q10
8Q
208
Q30
8Q
408
Q10
9Q
209
Q30
9Q
409
Q11
0Q
210
Q31
0Q
410
Aver
age
Day
sto
Clo
se
HFHS Avg Days Urgent GoalNon-Urgent Goal
Patient Safety Improved Through Rapid Product Recalls
Fig. �.�-��: Product Recalls Alerts, Days to Close
Good
Fig. �.�-�0: HFHHN Cash Collections at Point of Service
$0 $200 $400 $600 $800
$1,000
J-10
F-10
M-1
0
A-1
0
M-1
0
J-10
J-10
A-1
0
S-1
0
O-1
0
N-1
0
D-1
0
J-11
F-11
Amou
nt C
olle
cted
(in
'000
's)
OP Clinics HFMC-F HFH Cashier Collections HFWBH
Increased Collections significantly to Date; Rate of Collection Increasing
Good
2007 2008 2009 2010 Req’d
Emer
genc
y &
C
omm
unity
Dril
ls HFH 10 13 15 5 3
HFMG 47 35 36 33 3 HFMH 4 4 6 8 3 MFMH-WC 2 2 3 10 3 HFWH 2 3 4 3 3 HFWBH 3 18 3
Fire
Dril
ls
HFH 88 87 77 66 66 HFMG 78 67 52 66 50 HFMH 36 36 36 24 24 MFMH-WC 12 12 12 12 12 HFWH 36 35 36 35 12 HFWBH 10 14 12
Fig. �.�-��: Emergency Preparedness
55%60%65%70%75%80%
202530354045
Q10
7Q
207
Q30
7Q
407
Q10
8Q
208
Q30
8Q
408
Q10
9Q
209
Q30
9Q
409
Q11
0Q
210
Q31
0Q
410
FCR
%
Tick
ets
Ope
ned
(000
's)
Tickets Opened HFHS FCRFCR HC Benchmk FCR Industy BenchmkFCR Goal
Maintained Response Rates above Benchmarks with Increased Volume
Fig. �.�-��: IT Help Desk First Call Resolution
Good
80%
85%
90%
95%
100%
Q10
9Q
209
Q30
9Q
409
Q11
0Q
210
Q31
0Q
410
Q20
8Q
308
Q40
8Q
109
Q20
9Q
309
Q40
9Q
110
Q21
0Q
310
Q41
0
ER CBC TAT STAT TAT
% C
ompl
eted
w
ithin
�0
Min
utes
HFH HFWBH HFMHHFMH-WC HFWH Goal
All Labs Far Exceed Aggressive Goal
Fig. �.�-��: % ED CBCs and STAT Test in �0 Minutes
Good
0255075100125150175
4550556065
2008 2009 2010 2008 2009 2010
# of
Bed
s C
lean
ed(in
000
's)
Turn
arou
nd T
ime
(in m
inut
es)
TAT # of Beds HCAB Best Practice
HFHS Exceeding Best Practice Despite Increasing Volume
Fig. �.�-��: Bed Turnaround Time
Good
Good
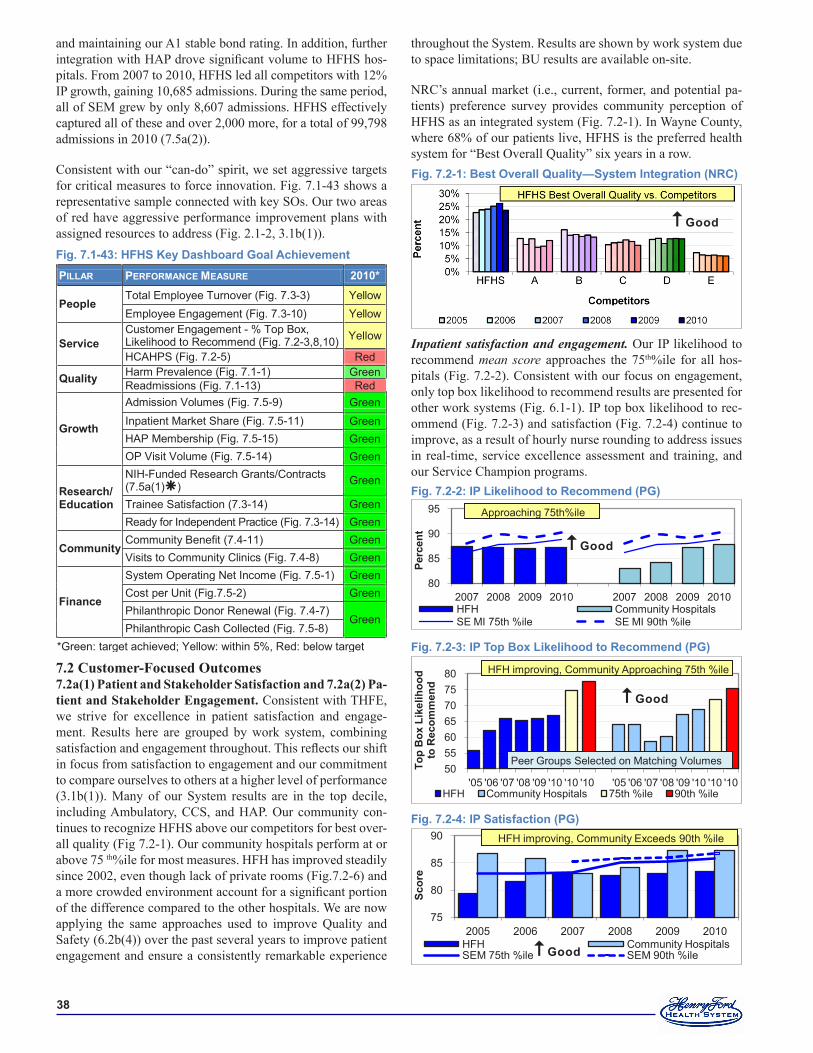
��
and maintaining our A1 stable bond rating. In addition, further integration with HAP drove significant volume to HFHS hos-pitals. From 2007 to 2010, HFHS led all competitors with 12% IP growth, gaining 10,685 admissions. During the same period, all of SEM grew by only 8,607 admissions. HFHS effectively captured all of these and over 2,000 more, for a total of 99,798 admissions in 2010 (7.5a(2)).
Consistent with our “can-do” spirit, we set aggressive targets for critical measures to force innovation. Fig. 7.1-43 shows a representative sample connected with key SOs. Our two areas of red have aggressive performance improvement plans with assigned resources to address (Fig. 2.1-2, 3.1b(1)).
7.2 Customer-Focused Outcomes7.2a(1) Patient and Stakeholder Satisfaction and 7.2a(2) Pa-tient and Stakeholder Engagement. Consistent with THFE, we strive for excellence in patient satisfaction and engage-ment. Results here are grouped by work system, combining satisfaction and engagement throughout. This reflects our shift in focus from satisfaction to engagement and our commitment to compare ourselves to others at a higher level of performance (3.1b(1)). Many of our System results are in the top decile, including Ambulatory, CCS, and HAP. Our community con-tinues to recognize HFHS above our competitors for best over-all quality (Fig 7.2-1). Our community hospitals perform at or above 75 th%ile for most measures. HFH has improved steadily since 2002, even though lack of private rooms (Fig.7.2-6) and a more crowded environment account for a significant portion of the difference compared to the other hospitals. We are now applying the same approaches used to improve Quality and Safety (6.2b(4)) over the past several years to improve patient engagement and ensure a consistently remarkable experience
throughout the System. Results are shown by work system due to space limitations; BU results are available on-site.
NRC’s annual market (i.e., current, former, and potential pa-tients) preference survey provides community perception of HFHS as an integrated system (Fig. 7.2-1). In Wayne County, where 68% of our patients live, HFHS is the preferred health system for “Best Overall Quality” six years in a row.
Inpatient satisfaction and engagement. Our IP likelihood to recommend mean score approaches the 75th%ile for all hos-pitals (Fig. 7.2-2). Consistent with our focus on engagement, only top box likelihood to recommend results are presented for other work systems (Fig. 6.1-1). IP top box likelihood to rec-ommend (Fig. 7.2-3) and satisfaction (Fig. 7.2-4) continue to improve, as a result of hourly nurse rounding to address issues in real-time, service excellence assessment and training, and our Service Champion programs.
PILLAR PERFORMANCE MEASURE �0�0*
People Total Employee Turnover (Fig. 7.3-3) Yellow Employee Engagement (Fig. 7.3-10) Yellow
Service Customer Engagement - % Top Box, Likelihood to Recommend (Fig. 7.2-3,8,10) Yellow
HCAHPS (Fig. 7.2-5) Red
Quality Harm Prevalence (Fig. 7.1-1) Green Readmissions (Fig. 7.1-13) Red
Growth
Admission Volumes (Fig. 7.5-9) Green Inpatient Market Share (Fig. 7.5-11) Green HAP Membership (Fig. 7.5-15) Green OP Visit Volume (Fig. 7.5-14) Green
Research/ Education
NIH-Funded Research Grants/Contracts (7.5a(1)) Green
Trainee Satisfaction (7.3-14) Green Ready for Independent Practice (Fig. 7.3-14) Green
Community Community Benefit (7.4-11) Green Visits to Community Clinics (Fig. 7.4-8) Green
Finance
System Operating Net Income (Fig. 7.5-1) Green Cost per Unit (Fig.7.5-2) Green Philanthropic Donor Renewal (Fig. 7.4-7)
Green Philanthropic Cash Collected (Fig. 7.5-8)
*Green: target achieved; Yellow: within 5%, Red: below target
Fig. �.�-��: HFHS Key Dashboard Goal Achievement
Fig. �.�-�: IP Likelihood to Recommend (PG)
80
85
90
95
2007 2008 2009 2010 2007 2008 2009 2010
Perc
ent
HFH Community HospitalsSE MI 75th %ile SE MI 90th %ile
Approaching 75th%ile
Good
Fig. �.�-�: IP Top Box Likelihood to Recommend (PG)
50556065707580
'05 '06 '07 '08 '09 '10 '10 '10 '05 '06 '07 '08 '09 '10 '10 '10
Top
Box
Lik
elih
ood
to R
ecom
men
d
HFH Community Hospitals 75th %ile 90th %ile
HFH improving, Community Approaching 75th%ile
Peer Groups Selected on Matching Volumes
HFH improving, Community Approaching 75th %ile
Good
Fig. �.�-�: IP Satisfaction (PG)
75
80
85
90
2005 2006 2007 2008 2009 2010
Scor
e
HFH Community HospitalsSEM 75th %ile SEM 90th %ile
HFH improving, Community Exceeds 90th %ile
Good
Fig. �.�-�: Best Overall Quality—System Integration (NRC)
Good
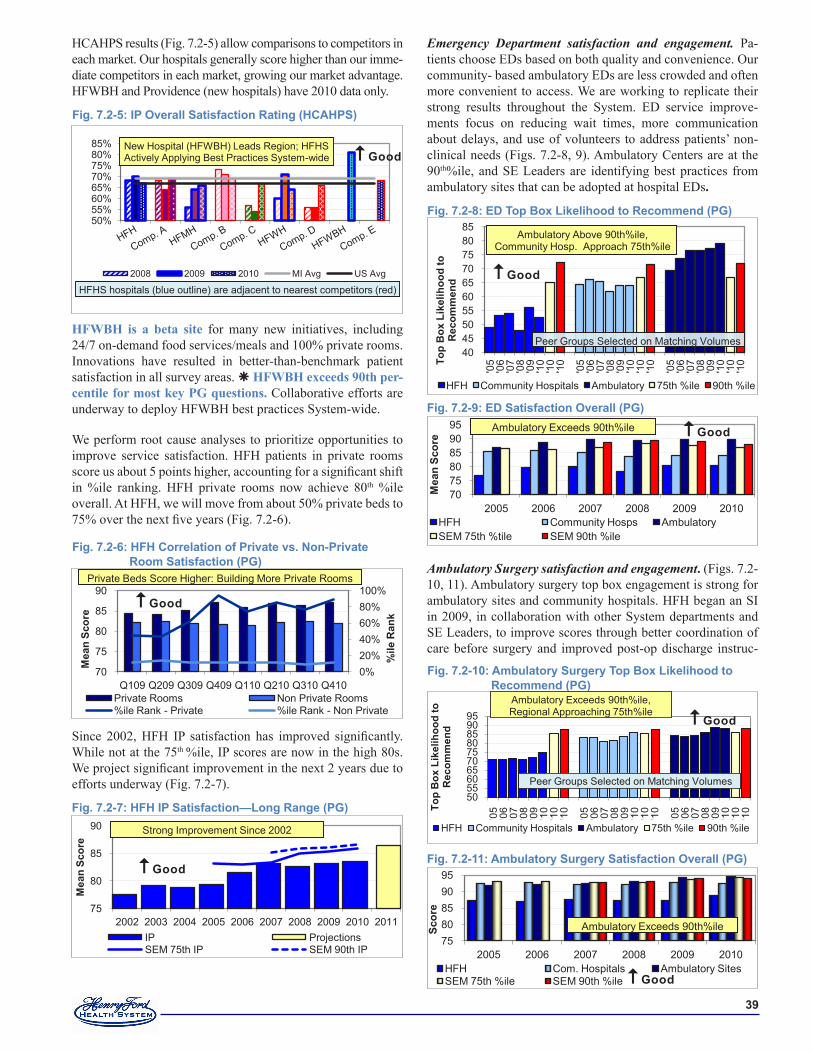
��
HCAHPS results (Fig. 7.2-5) allow comparisons to competitors in each market. Our hospitals generally score higher than our imme-diate competitors in each market, growing our market advantage. HFWBH and Providence (new hospitals) have 2010 data only.
HFWBH is a beta site for many new initiatives, including 24/7 on-demand food services/meals and 100% private rooms. Innovations have resulted in better-than-benchmark patient satisfaction in all survey areas. HFWBH exceeds 90th per-centile for most key PG questions. Collaborative efforts are underway to deploy HFWBH best practices System-wide.
We perform root cause analyses to prioritize opportunities to improve service satisfaction. HFH patients in private rooms score us about 5 points higher, accounting for a significant shift in %ile ranking. HFH private rooms now achieve 80th %ile overall. At HFH, we will move from about 50% private beds to 75% over the next five years (Fig. 7.2-6).
Since 2002, HFH IP satisfaction has improved significantly. While not at the 75th %ile, IP scores are now in the high 80s. We project significant improvement in the next 2 years due to efforts underway (Fig. 7.2-7).
Emergency Department satisfaction and engagement. Pa-tients choose EDs based on both quality and convenience. Our community- based ambulatory EDs are less crowded and often more convenient to access. We are working to replicate their strong results throughout the System. ED service improve-ments focus on reducing wait times, more communication about delays, and use of volunteers to address patients’ non-clinical needs (Figs. 7.2-8, 9). Ambulatory Centers are at the 90th%ile, and SE Leaders are identifying best practices from ambulatory sites that can be adopted at hospital EDs.
Ambulatory Surgery satisfaction and engagement. (Figs. 7.2-10, 11). Ambulatory surgery top box engagement is strong for ambulatory sites and community hospitals. HFH began an SI in 2009, in collaboration with other System departments and SE Leaders, to improve scores through better coordination of care before surgery and improved post-op discharge instruc-
Fig. �.�-�: HFH Correlation of Private vs. Non-Private Room Satisfaction (PG)
0%20%40%60%80%100%
70
75
80
85
90
Q109 Q209 Q309 Q409 Q110 Q210 Q310 Q410
%ile
Ran
k
Mea
n Sc
ore
Private Rooms Non Private Rooms%ile Rank - Private %ile Rank - Non Private
Private Beds Score Higher: Building More Private Rooms
Good
Fig. �.�-�: HFH IP Satisfaction—Long Range (PG)
75
80
85
90
2002 2003 2004 2005 2006 2007 2008 2009 2010 2011
Mea
n Sc
ore
IP ProjectionsSEM 75th IP SEM 90th IP
Strong Improvement Since 2002
Good
Fig. �.�-�: ED Satisfaction Overall (PG)
707580859095
2005 2006 2007 2008 2009 2010
Mea
n Sc
ore
HFH Community Hosps AmbulatorySEM 75th %tile SEM 90th %ile
Ambulatory Exceeds 90th%ile Good
Fig. �.�-�: ED Top Box Likelihood to Recommend (PG)
40455055606570758085
'05
'06
'07
'08
'09
'10
'10
'10
'05
'06
'07
'08
'09
'10
'10
'10
'05
'06
'07
'08
'09
'10
'10
'10To
p B
ox L
ikel
ihoo
d to
R
ecom
men
d
HFH Community Hospitals Ambulatory 75th %ile 90th %ile
Peer Groups Selected on Matching Volumes
Ambulatory Above 90th%ile, Community Hosp. Approach 75th%ile
Good
Fig. �.�-��: Ambulatory Surgery Satisfaction Overall (PG)
7580859095
2005 2006 2007 2008 2009 2010
Scor
e
HFH Com. Hospitals Ambulatory SitesSEM 75th %ile SEM 90th %ile
Ambulatory Exceeds 90th%ile
Good
Fig. �.�-�0: Ambulatory Surgery Top Box Likelihood to Recommend (PG)
50556065707580859095
'05
'06
'07
'08
'09
'10
'10
'10
'05
'06
'07
'08
'09
'10
'10
'10
'05
'06
'07
'08
'09
'10
'10
'10To
p B
ox L
ikel
ihoo
d to
R
ecom
men
d
HFH Community Hospitals Ambulatory 75th %ile 90th %ile
Peer Groups Selected on Matching Volumes
Ambulatory Exceeds 90th%ile, Regional Approaching 75th%ile Good
Fig. �.�-�: IP Overall Satisfaction Rating (HCAHPS)
50% 55% 60% 65% 70% 75% 80% 85%
2008 2009 2010 MI Avg US Avg
HFHS hospitals (blue outline) are adjacent to nearest competitors (red)
New Hospital (HFWBH) Leads Region; HFHS Actively Applying Best Practices System-wide Good
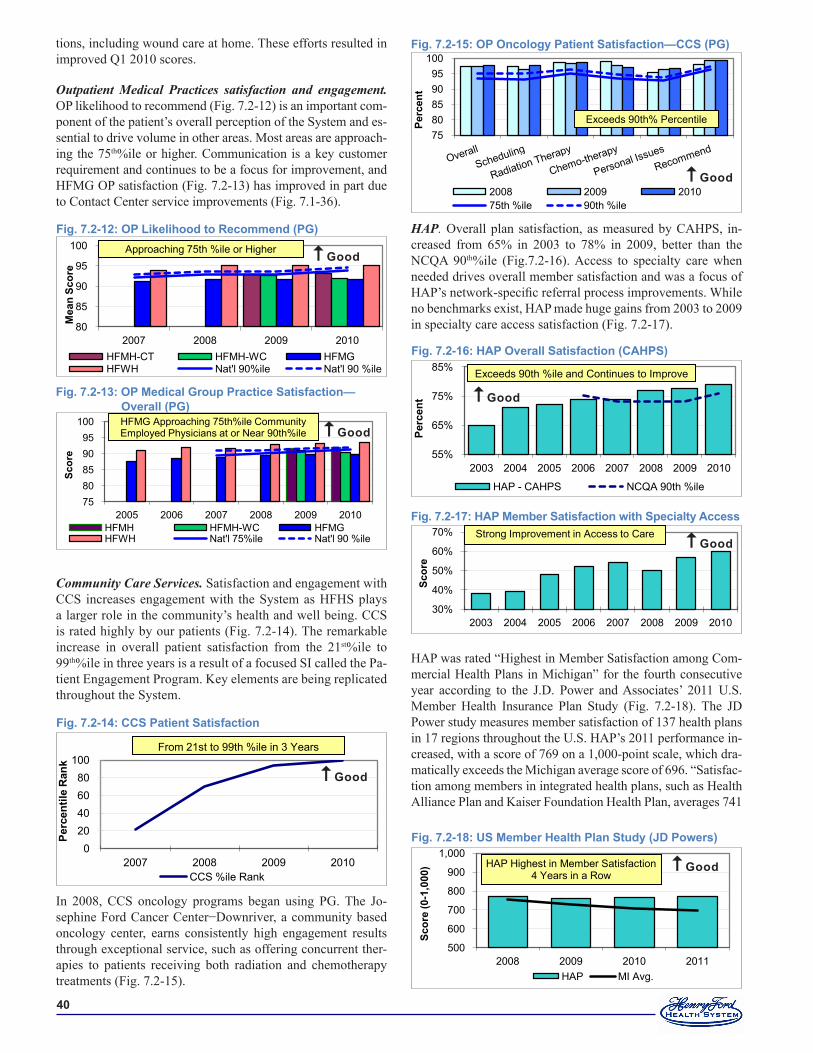
�0
tions, including wound care at home. These efforts resulted in improved Q1 2010 scores.
Outpatient Medical Practices satisfaction and engagement. OP likelihood to recommend (Fig. 7.2-12) is an important com-ponent of the patient’s overall perception of the System and es-sential to drive volume in other areas. Most areas are approach-ing the 75th%ile or higher. Communication is a key customer requirement and continues to be a focus for improvement, and HFMG OP satisfaction (Fig. 7.2-13) has improved in part due to Contact Center service improvements (Fig. 7.1-36).
Community Care Services. Satisfaction and engagement with CCS increases engagement with the System as HFHS plays a larger role in the community’s health and well being. CCS is rated highly by our patients (Fig. 7.2-14). The remarkable increase in overall patient satisfaction from the 21st%ile to 99th%ile in three years is a result of a focused SI called the Pa-tient Engagement Program. Key elements are being replicated throughout the System.
In 2008, CCS oncology programs began using PG. The Jo-sephine Ford Cancer Center−Downriver, a community based oncology center, earns consistently high engagement results through exceptional service, such as offering concurrent ther-apies to patients receiving both radiation and chemotherapy treatments (Fig. 7.2-15).
Fig. �.�-��: CCS Patient Satisfaction
020406080
100
2007 2008 2009 2010
Perc
entil
e R
ank
CCS %ile Rank
From 21st to 99th %ile in 3 Years
Good
HAP. Overall plan satisfaction, as measured by CAHPS, in-creased from 65% in 2003 to 78% in 2009, better than the NCQA 90th%ile (Fig.7.2-16). Access to specialty care when needed drives overall member satisfaction and was a focus of HAP’s network-specific referral process improvements. While no benchmarks exist, HAP made huge gains from 2003 to 2009 in specialty care access satisfaction (Fig. 7.2-17).
HAP was rated “Highest in Member Satisfaction among Com-mercial Health Plans in Michigan” for the fourth consecutive year according to the J.D. Power and Associates’ 2011 U.S. Member Health Insurance Plan Study (Fig. 7.2-18). The JD Power study measures member satisfaction of 137 health plans in 17 regions throughout the U.S. HAP’s 2011 performance in-creased, with a score of 769 on a 1,000-point scale, which dra-matically exceeds the Michigan average score of 696. “Satisfac-tion among members in integrated health plans, such as Health Alliance Plan and Kaiser Foundation Health Plan, averages 741
Fig. �.�-��: US Member Health Plan Study (JD Powers)
500
600
700
800
900
1,000
2008 2009 2010 2011
Scor
e (0
-�,0
00)
HAP MI Avg.
HAP Highest in Member Satisfaction 4 Years in a Row
Good
Fig. �.�-��: HAP Overall Satisfaction (CAHPS)
55%
65%
75%
85%
2003 2004 2005 2006 2007 2008 2009 2010
Perc
ent
HAP - CAHPS NCQA 90th %ile
Exceeds 90th %ile and Continues to Improve
Good
Fig. �.�-��: HAP Member Satisfaction with Specialty Access
30%
40%
50%
60%
70%
2003 2004 2005 2006 2007 2008 2009 2010
Scor
e
Strong Improvement in Access to Care Good
Fig. �.�-��: OP Medical Group Practice Satisfaction— Overall (PG)
7580859095
100
2005 2006 2007 2008 2009 2010
Scor
e
HFMH HFMH-WC HFMGHFWH Nat'l 75%ile Nat'l 90 %ile
HFMG Approaching 75th%ile Community Employed Physicians at or Near 90th%ile Good
Fig. �.�-��: OP Likelihood to Recommend (PG)
80
85
90
95
100
2007 2008 2009 2010
Mea
n Sc
ore
HFMH-CT HFMH-WC HFMGHFWH Nat'l 90%ile Nat'l 90 %ile
Approaching 75th %ile or Higher Good
Fig. �.�-��: OP Oncology Patient Satisfaction—CCS (PG)
7580859095
100
Perc
ent
2008 2009 201075th %ile 90th %ile
Exceeds 90th% Percentile
Good
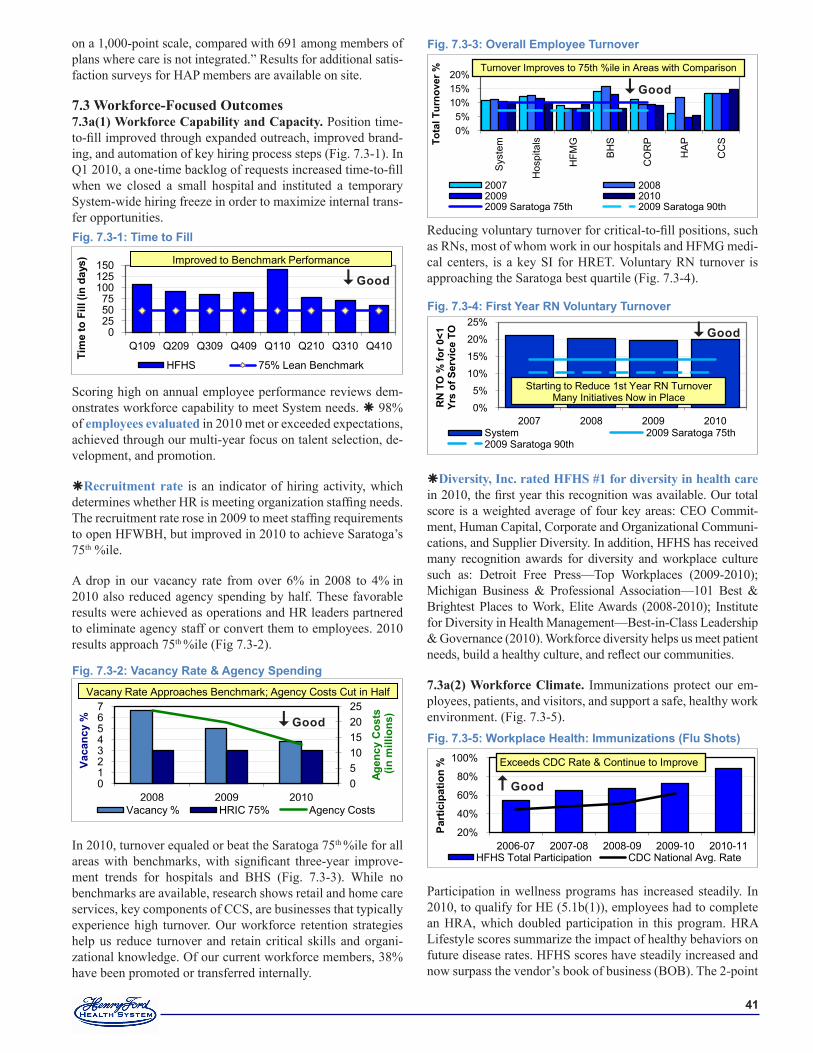
��
on a 1,000-point scale, compared with 691 among members of plans where care is not integrated.” Results for additional satis-faction surveys for HAP members are available on site.
7.3 Workforce-Focused Outcomes7.3a(1) Workforce Capability and Capacity. Position time-to-fill improved through expanded outreach, improved brand-ing, and automation of key hiring process steps (Fig. 7.3-1). In Q1 2010, a one-time backlog of requests increased time-to-fill when we closed a small hospital and instituted a temporary System-wide hiring freeze in order to maximize internal trans-fer opportunities.
Scoring high on annual employee performance reviews dem-onstrates workforce capability to meet System needs. 98% of employees evaluated in 2010 met or exceeded expectations, achieved through our multi-year focus on talent selection, de-velopment, and promotion.
Recruitment rate is an indicator of hiring activity, which determines whether HR is meeting organization staffing needs. The recruitment rate rose in 2009 to meet staffing requirements to open HFWBH, but improved in 2010 to achieve Saratoga’s 75th %ile.
A drop in our vacancy rate from over 6% in 2008 to 4% in 2010 also reduced agency spending by half. These favorable results were achieved as operations and HR leaders partnered to eliminate agency staff or convert them to employees. 2010 results approach 75th %ile (Fig 7.3-2).
In 2010, turnover equaled or beat the Saratoga 75th %ile for all areas with benchmarks, with significant three-year improve-ment trends for hospitals and BHS (Fig. 7.3-3). While no benchmarks are available, research shows retail and home care services, key components of CCS, are businesses that typically experience high turnover. Our workforce retention strategies help us reduce turnover and retain critical skills and organi-zational knowledge. Of our current workforce members, 38% have been promoted or transferred internally.
Reducing voluntary turnover for critical-to-fill positions, such as RNs, most of whom work in our hospitals and HFMG medi-cal centers, is a key SI for HRET. Voluntary RN turnover is approaching the Saratoga best quartile (Fig. 7.3-4).
Diversity, Inc. rated HFHS #1 for diversity in health care in 2010, the first year this recognition was available. Our total score is a weighted average of four key areas: CEO Commit-ment, Human Capital, Corporate and Organizational Communi-cations, and Supplier Diversity. In addition, HFHS has received many recognition awards for diversity and workplace culture such as: Detroit Free Press—Top Workplaces (2009-2010); Michigan Business & Professional Association—101 Best & Brightest Places to Work, Elite Awards (2008-2010); Institute for Diversity in Health Management—Best-in-Class Leadership & Governance (2010). Workforce diversity helps us meet patient needs, build a healthy culture, and reflect our communities.
7.3a(2) Workforce Climate. Immunizations protect our em-ployees, patients, and visitors, and support a safe, healthy work environment. (Fig. 7.3-5).
Participation in wellness programs has increased steadily. In 2010, to qualify for HE (5.1b(1)), employees had to complete an HRA, which doubled participation in this program. HRA Lifestyle scores summarize the impact of healthy behaviors on future disease rates. HFHS scores have steadily increased and now surpass the vendor’s book of business (BOB). The 2-point
Fig. �.�-�: Time to Fill
0255075
100125150
Q109 Q209 Q309 Q409 Q110 Q210 Q310 Q410
HFHS 75% Lean Benchmark
Improved to Benchmark Performance
Tim
e to
Fill
(in
days
)
Good
Fig. �.�-�: Vacancy Rate & Agency Spending
0510152025
01234567
2008 2009 2010
Agen
cy C
osts
(in m
illio
ns)
Vaca
ncy
%
Vacancy % HRIC 75% Agency Costs
Vacany Rate Approaches Benchmark; Agency Costs Cut in Half
Good
Fig. �.�-�: Overall Employee Turnover
0%5%
10%15%20%
Sys
tem
Hos
pita
ls
HFM
G
BH
S
CO
RP
HA
P
CC
STota
l Tur
nove
r %
2007 20082009 20102009 Saratoga 75th 2009 Saratoga 90th
Turnover Improves to 75th %ile in Areas with Comparison
Good
Fig. �.�-�: First Year RN Voluntary Turnover
0%
5%
10%
15%
20%
25%
2007 2008 2009 2010
RN
TO
% fo
r 0<�
Yr
s of
Ser
vice
TO
System 2009 Saratoga 75th2009 Saratoga 90th
Starting to Reduce 1st Year RN TurnoverMany Initiatives Now in Place
Good
Fig. �.�-�: Workplace Health: Immunizations (Flu Shots)
20%
40%
60%
80%
100%
2006-07 2007-08 2008-09 2009-10 2010-11
Part
icip
atio
n %
HFHS Total Participation CDC National Avg. Rate
Exceeds CDC Rate & Continue to Improve
Good
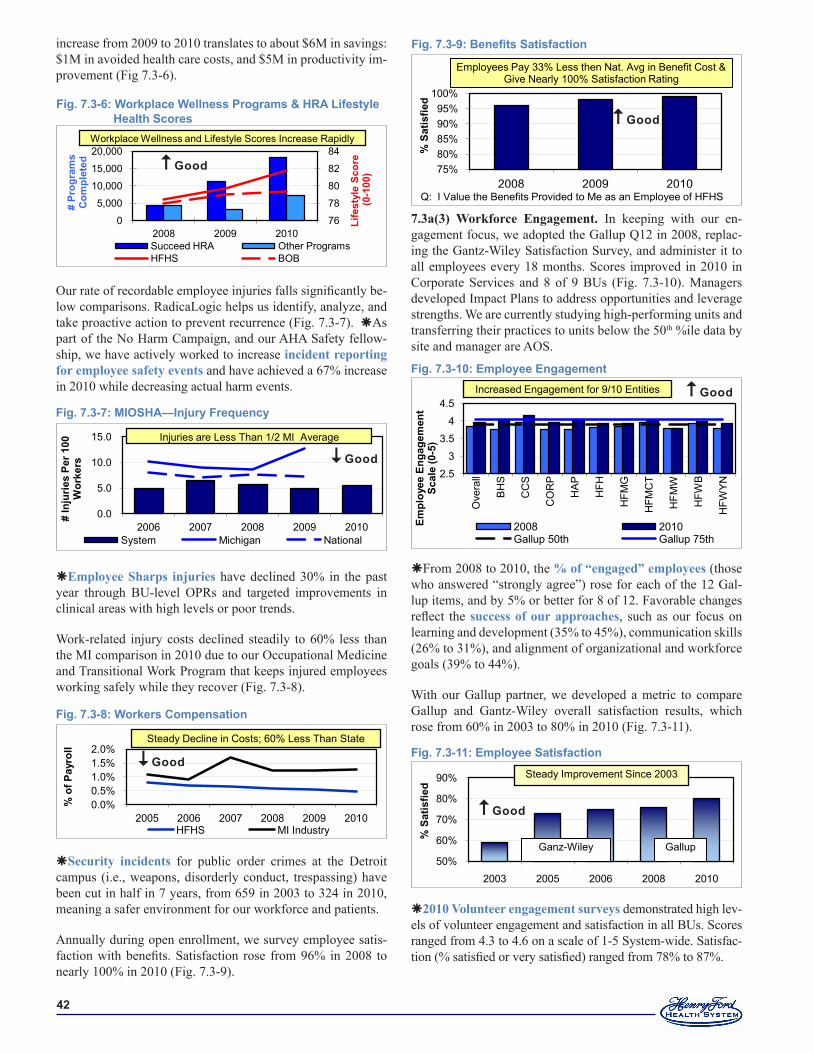
��
increase from 2009 to 2010 translates to about $6M in savings: $1M in avoided health care costs, and $5M in productivity im-provement (Fig 7.3-6).
Our rate of recordable employee injuries falls significantly be-low comparisons. RadicaLogic helps us identify, analyze, and take proactive action to prevent recurrence (Fig. 7.3-7). As part of the No Harm Campaign, and our AHA Safety fellow-ship, we have actively worked to increase incident reporting for employee safety events and have achieved a 67% increase in 2010 while decreasing actual harm events.
Employee Sharps injuries have declined 30% in the past year through BU-level OPRs and targeted improvements in clinical areas with high levels or poor trends.
Work-related injury costs declined steadily to 60% less than the MI comparison in 2010 due to our Occupational Medicine and Transitional Work Program that keeps injured employees working safely while they recover (Fig. 7.3-8).
Security incidents for public order crimes at the Detroit campus (i.e., weapons, disorderly conduct, trespassing) have been cut in half in 7 years, from 659 in 2003 to 324 in 2010, meaning a safer environment for our workforce and patients.
Annually during open enrollment, we survey employee satis-faction with benefits. Satisfaction rose from 96% in 2008 to nearly 100% in 2010 (Fig. 7.3-9).
Fig. �.�-�: Workers Compensation
0.0%0.5%1.0%1.5%2.0%
2005 2006 2007 2008 2009 2010
% o
f Pay
roll
HFHS MI Industry
Steady Decline in Costs; 60% Less Than State
Good
7.3a(3) Workforce Engagement. In keeping with our en-gagement focus, we adopted the Gallup Q12 in 2008, replac-ing the Gantz-Wiley Satisfaction Survey, and administer it to all employees every 18 months. Scores improved in 2010 in Corporate Services and 8 of 9 BUs (Fig. 7.3-10). Managers developed Impact Plans to address opportunities and leverage strengths. We are currently studying high-performing units and transferring their practices to units below the 50th %ile data by site and manager are AOS.
From 2008 to 2010, the % of “engaged” employees (those who answered “strongly agree”) rose for each of the 12 Gal-lup items, and by 5% or better for 8 of 12. Favorable changes reflect the success of our approaches, such as our focus on learning and development (35% to 45%), communication skills (26% to 31%), and alignment of organizational and workforce goals (39% to 44%).
With our Gallup partner, we developed a metric to compare Gallup and Gantz-Wiley overall satisfaction results, which rose from 60% in 2003 to 80% in 2010 (Fig. 7.3-11).
2010 Volunteer engagement surveys demonstrated high lev-els of volunteer engagement and satisfaction in all BUs. Scores ranged from 4.3 to 4.6 on a scale of 1-5 System-wide. Satisfac-tion (% satisfied or very satisfied) ranged from 78% to 87%.
Fig. �.�-��: Employee Satisfaction
50%
60%
70%
80%
90%
2003 2005 2006 2008 2010
% S
atis
fied
Ganz-Wiley Gallup
Steady Improvement Since 2003
Good
Fig. �.�-�0: Employee Engagement
2.5
3
3.5
4
4.5
Ove
rall
BH
S
CC
S
CO
RP
HA
P
HFH
HFM
G
HFM
CT
HFM
W
HFW
B
HFW
YN
Empl
oyee
Eng
agem
ent
Scal
e (0
-�)
2008 2010 Gallup 50th Gallup 75th
Increased Engagement for 9/10 Entities GoodFig. �.�-�: MIOSHA—Injury Frequency
0.0
5.0
10.0
15.0
2006 2007 2008 2009 2010
# In
jurie
s Pe
r �00
W
orke
rs
System Michigan National
Injuries are Less Than 1/2 MI Average
Good
Fig. �.�-�: Workplace Wellness Programs & HRA Lifestyle Health Scores
76
78
80
82
84
0
5,000
10,000
15,000
20,000
2008 2009 2010
Life
styl
e Sc
ore
(0-�
00)
# Pr
ogra
ms
Com
plet
ed
Succeed HRA Other ProgramsHFHS BOB
Workplace Wellness and Lifestyle Scores Increase Rapidly
Good
Fig. 7.3-9: Benefits Satisfaction
75%80%85%90%95%
100%
2008 2009 2010
% S
atis
fied
Employees Pay 33% Less then Nat. Avg in Benefit Cost &Give Nearly 100% Satisfaction Rating
Q: I Value the Benefits Provided to Me as an Employee of HFHS
Good
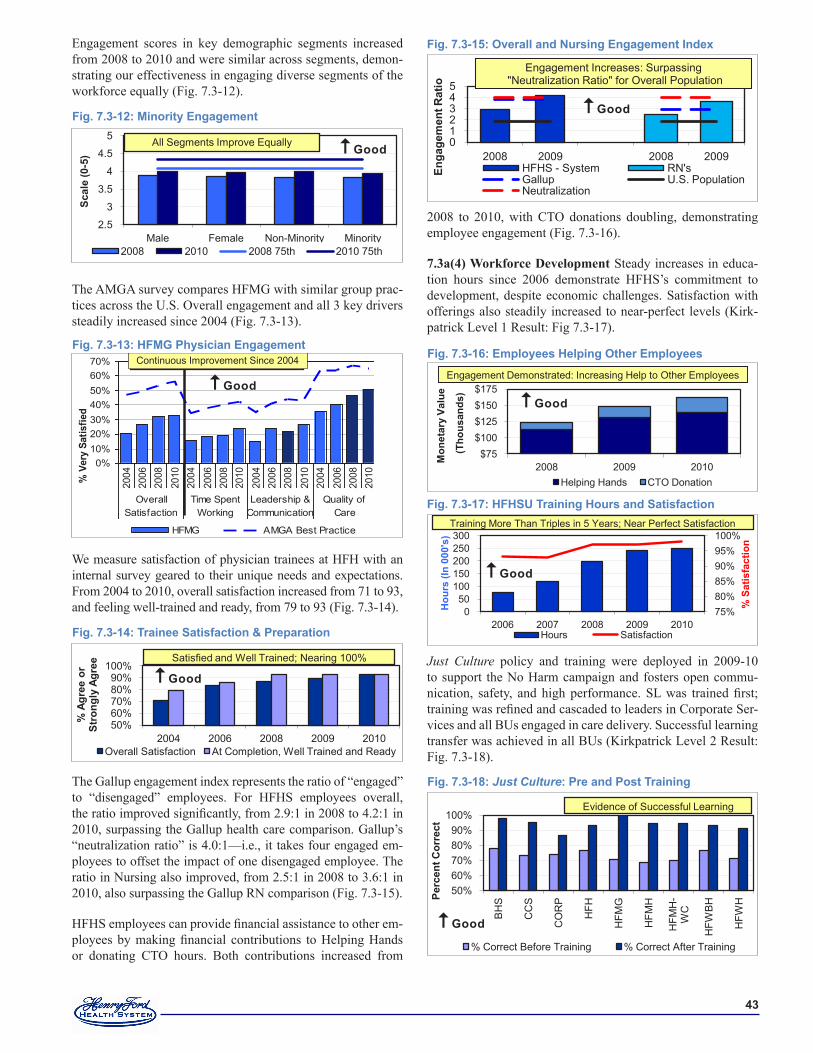
��
Engagement scores in key demographic segments increased from 2008 to 2010 and were similar across segments, demon-strating our effectiveness in engaging diverse segments of the workforce equally (Fig. 7.3-12).
The AMGA survey compares HFMG with similar group prac-tices across the U.S. Overall engagement and all 3 key drivers steadily increased since 2004 (Fig. 7.3-13).
We measure satisfaction of physician trainees at HFH with an internal survey geared to their unique needs and expectations. From 2004 to 2010, overall satisfaction increased from 71 to 93, and feeling well-trained and ready, from 79 to 93 (Fig. 7.3-14).
The Gallup engagement index represents the ratio of “engaged” to “disengaged” employees. For HFHS employees overall, the ratio improved significantly, from 2.9:1 in 2008 to 4.2:1 in 2010, surpassing the Gallup health care comparison. Gallup’s “neutralization ratio” is 4.0:1—i.e., it takes four engaged em-ployees to offset the impact of one disengaged employee. The ratio in Nursing also improved, from 2.5:1 in 2008 to 3.6:1 in 2010, also surpassing the Gallup RN comparison (Fig. 7.3-15).
HFHS employees can provide financial assistance to other em-ployees by making financial contributions to Helping Hands or donating CTO hours. Both contributions increased from
2008 to 2010, with CTO donations doubling, demonstrating employee engagement (Fig. 7.3-16).
7.3a(4) Workforce Development Steady increases in educa-tion hours since 2006 demonstrate HFHS’s commitment to development, despite economic challenges. Satisfaction with offerings also steadily increased to near-perfect levels (Kirk-patrick Level 1 Result: Fig 7.3-17).
Just Culture policy and training were deployed in 2009-10 to support the No Harm campaign and fosters open commu-nication, safety, and high performance. SL was trained first; training was refined and cascaded to leaders in Corporate Ser-vices and all BUs engaged in care delivery. Successful learning transfer was achieved in all BUs (Kirkpatrick Level 2 Result: Fig. 7.3-18).
Fig. �.�-��: Employees Helping Other Employees
$75$100$125$150$175
2008 2009 2010
Mon
etar
y Va
lue
(Tho
usan
ds)
Helping Hands CTO Donation
Engagement Demonstrated: Increasing Help to Other Employees
Good
Fig. �.�-��: HFHSU Training Hours and Satisfaction
75%80%85%90%95%100%
050
100150200250300
2006 2007 2008 2009 2010
% S
atis
fact
ion
Hou
rs (I
n 00
0's)
Hours Satisfaction
Training More Than Triples in 5 Years; Near Perfect Satisfaction
Good
Fig. �.�-��: Just Culture: Pre and Post Training
50%60%70%80%90%
100%
BH
S
CC
S
CO
RP
HFH
HFM
G
HFM
H
HFM
H-
WC
HFW
BH
HFW
HPerc
ent C
orre
ct
% Correct Before Training % Correct After Training
Evidence of Successful Learning
Good
Fig. �.�-��: Trainee Satisfaction & Preparation
50%60%70%80%90%
100%
2004 2006 2008 2009 2010
% A
gree
or
Stro
ngly
Agr
ee
Overall Satisfaction At Completion, Well Trained and Ready
Satisfied and Well Trained; Nearing 100%
Good
Fig. �.�-��: HFMG Physician Engagement
0%10%20%30%40%50%60%70%
2004
2006
2008
2010
2004
2006
2008
2010
2004
2006
2008
2010
2004
2006
2008
2010
OverallSatisfaction
Time SpentWorking
Leadership &Communication
Quality ofCare
% V
ery
Satis
fied
HFMG AMGA Best Practice
Continuous Imporvement Since 2004Continuous Improvement Since 2004
Good
Fig. �.�-��: Minority Engagement
2.5
3
3.5
4
4.5
5
Male Female Non-Minority Minority
Scal
e (0
-�)
2008 2010 2008 75th 2010 75th
All Segments Improve Equally Good
Fig. �.�-��: Overall and Nursing Engagement Index
012345
2008 2009 2008 2009
Enga
gem
ent R
atio
HFHS - System RN'sGallup U.S. PopulationNeutralization
Engagement Increases: Surpassing"Neutralization Ratio" for Overall Population
Good
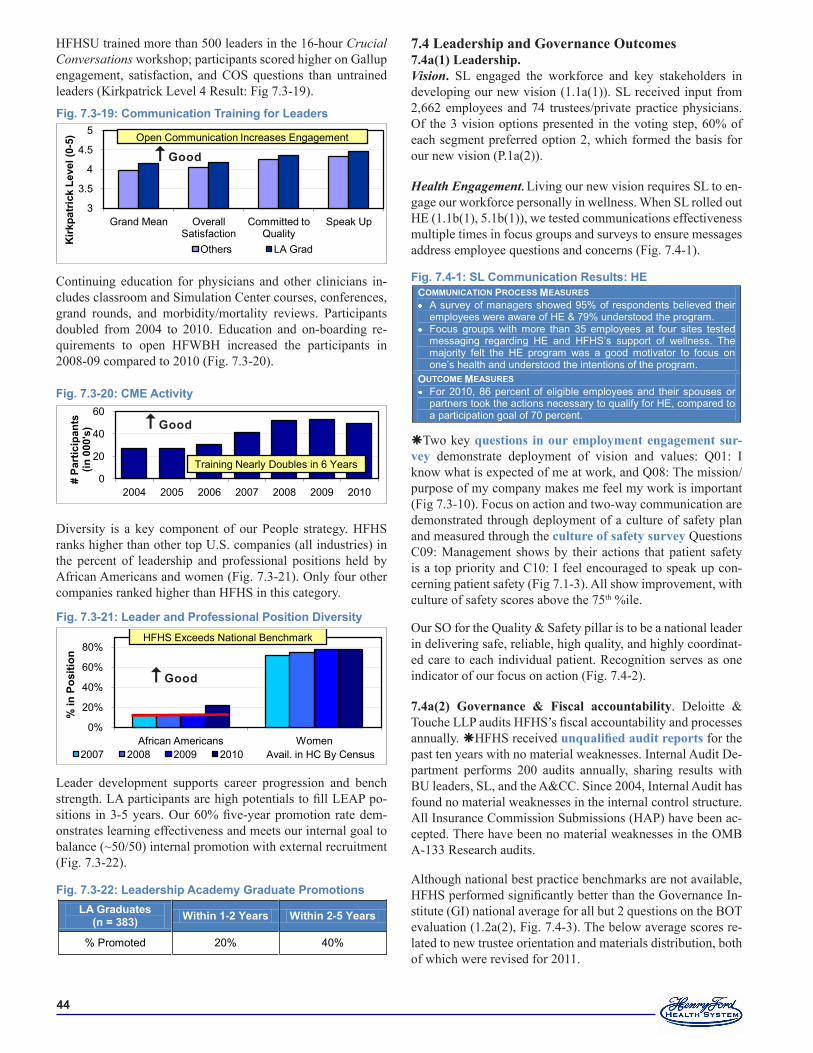
��
HFHSU trained more than 500 leaders in the 16-hour Crucial Conversations workshop; participants scored higher on Gallup engagement, satisfaction, and COS questions than untrained leaders (Kirkpatrick Level 4 Result: Fig 7.3-19).
Continuing education for physicians and other clinicians in-cludes classroom and Simulation Center courses, conferences, grand rounds, and morbidity/mortality reviews. Participants doubled from 2004 to 2010. Education and on-boarding re-quirements to open HFWBH increased the participants in 2008-09 compared to 2010 (Fig. 7.3-20).
Diversity is a key component of our People strategy. HFHS ranks higher than other top U.S. companies (all industries) in the percent of leadership and professional positions held by African Americans and women (Fig. 7.3-21). Only four other companies ranked higher than HFHS in this category.
Leader development supports career progression and bench strength. LA participants are high potentials to fill LEAP po-sitions in 3-5 years. Our 60% five-year promotion rate dem-onstrates learning effectiveness and meets our internal goal to balance (~50/50) internal promotion with external recruitment (Fig. 7.3-22).
Fig. �.�-��: Leadership Academy Graduate PromotionsLA Graduates
(n = ���) Within �-� Years Within �-� Years
% Promoted 20% 40%
Fig. �.�-��: Leader and Professional Position Diversity
0%
20%
40%
60%
80%
African Americans Women
% in
Pos
ition
2007 2008 2009 2010 Avail. in HC By Census
HFHS Exceeds National Benchmark
Good
Fig. �.�-�0: CME Activity
0
20
40
60
2004 2005 2006 2007 2008 2009 2010
# Pa
rtic
ipan
ts
(in 0
00's
)
Training Nearly Doubles in 6 Years
Good
7.4 Leadership and Governance Outcomes7.4a(1) Leadership. Vision. SL engaged the workforce and key stakeholders in developing our new vision (1.1a(1)). SL received input from 2,662 employees and 74 trustees/private practice physicians. Of the 3 vision options presented in the voting step, 60% of each segment preferred option 2, which formed the basis for our new vision (P.1a(2)).
Health Engagement. Living our new vision requires SL to en-gage our workforce personally in wellness. When SL rolled out HE (1.1b(1), 5.1b(1)), we tested communications effectiveness multiple times in focus groups and surveys to ensure messages address employee questions and concerns (Fig. 7.4-1).
Two key questions in our employment engagement sur-vey demonstrate deployment of vision and values: Q01: I know what is expected of me at work, and Q08: The mission/purpose of my company makes me feel my work is important (Fig 7.3-10). Focus on action and two-way communication are demonstrated through deployment of a culture of safety plan and measured through the culture of safety survey Questions C09: Management shows by their actions that patient safety is a top priority and C10: I feel encouraged to speak up con-cerning patient safety (Fig 7.1-3). All show improvement, with culture of safety scores above the 75th %ile.
Our SO for the Quality & Safety pillar is to be a national leader in delivering safe, reliable, high quality, and highly coordinat-ed care to each individual patient. Recognition serves as one indicator of our focus on action (Fig. 7.4-2).
7.4a(2) Governance & Fiscal accountability. Deloitte & Touche LLP audits HFHS’s fiscal accountability and processes annually. HFHS received unqualified audit reports for the past ten years with no material weaknesses. Internal Audit De-partment performs 200 audits annually, sharing results with BU leaders, SL, and the A&CC. Since 2004, Internal Audit has found no material weaknesses in the internal control structure. All Insurance Commission Submissions (HAP) have been ac-cepted. There have been no material weaknesses in the OMB A-133 Research audits.
Although national best practice benchmarks are not available, HFHS performed significantly better than the Governance In-stitute (GI) national average for all but 2 questions on the BOT evaluation (1.2a(2), Fig. 7.4-3). The below average scores re-lated to new trustee orientation and materials distribution, both of which were revised for 2011.
Fig. �.�-�: SL Communication Results: HECOMMUNICATION PROCESS MEASURES A survey of managers showed 95% of respondents believed their
employees were aware of HE & 79% understood the program. Focus groups with more than 35 employees at four sites tested
messaging regarding HE and HFHS’s support of wellness. The majority felt the HE program was a good motivator to focus on one’s health and understood the intentions of the program.
OUTCOME MEASURES For 2010, 86 percent of eligible employees and their spouses or
partners took the actions necessary to qualify for HE, compared to a participation goal of 70 percent.
Fig. �.�-��: Communication Training for Leaders
3
3.5
4
4.5
5
Grand Mean Overall Satisfaction
Committed to Quality
Speak Up
Others LA Grad
Open Communication Increases Engagement
Kirk
patr
ick
Leve
l(0-
�)
Good
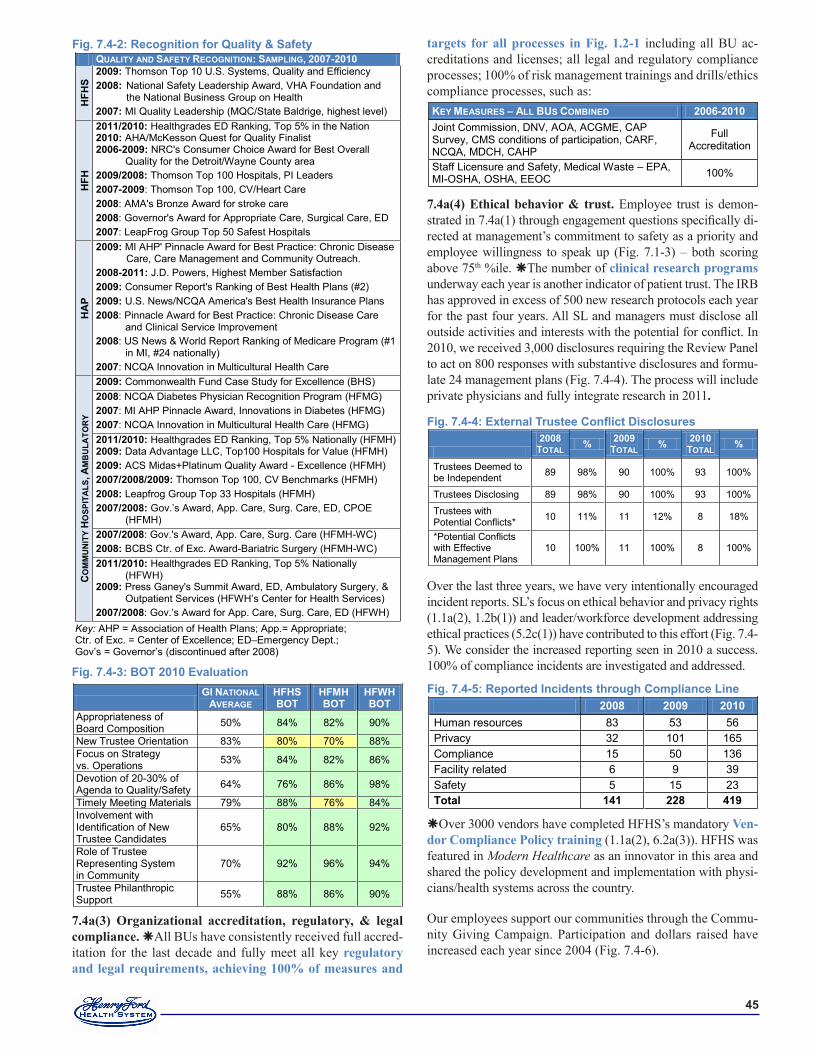
��
7.4a(3) Organizational accreditation, regulatory, & legal compliance. All BUs have consistently received full accred-itation for the last decade and fully meet all key regulatory and legal requirements, achieving 100% of measures and
targets for all processes in Fig. 1.2-1 including all BU ac-creditations and licenses; all legal and regulatory compliance processes; 100% of risk management trainings and drills/ethics compliance processes, such as:
7.4a(4) Ethical behavior & trust. Employee trust is demon-strated in 7.4a(1) through engagement questions specifically di-rected at management’s commitment to safety as a priority and employee willingness to speak up (Fig. 7.1-3) – both scoring above 75th %ile. The number of clinical research programs underway each year is another indicator of patient trust. The IRB has approved in excess of 500 new research protocols each year for the past four years. All SL and managers must disclose all outside activities and interests with the potential for conflict. In 2010, we received 3,000 disclosures requiring the Review Panel to act on 800 responses with substantive disclosures and formu-late 24 management plans (Fig. 7.4-4). The process will include private physicians and fully integrate research in 2011.
Over the last three years, we have very intentionally encouraged incident reports. SL’s focus on ethical behavior and privacy rights (1.1a(2), 1.2b(1)) and leader/workforce development addressing ethical practices (5.2c(1)) have contributed to this effort (Fig. 7.4-5). We consider the increased reporting seen in 2010 a success. 100% of compliance incidents are investigated and addressed.
Over 3000 vendors have completed HFHS’s mandatory Ven-dor Compliance Policy training (1.1a(2), 6.2a(3)). HFHS was featured in Modern Healthcare as an innovator in this area and shared the policy development and implementation with physi-cians/health systems across the country.
Our employees support our communities through the Commu-nity Giving Campaign. Participation and dollars raised have increased each year since 2004 (Fig. 7.4-6).
Fig. 7.4-4: External Trustee Conflict Disclosures
�00�
TOTAL % �00� TOTAL % �0�0
TOTAL %
Trustees Deemed to be Independent 89 98% 90 100% 93 100%
Trustees Disclosing 89 98% 90 100% 93 100%
Trustees with Potential Conflicts* 10 11% 11 12% 8 18%
*Potential Conflicts with Effective Management Plans
10 100% 11 100% 8 100%
KEY MEASURES – ALL BUS COMBINED �00�-�0�0 Joint Commission, DNV, AOA, ACGME, CAP Survey, CMS conditions of participation, CARF, NCQA, MDCH, CAHP
Full Accreditation
Staff Licensure and Safety, Medical Waste – EPA, MI-OSHA, OSHA, EEOC 100%
Fig. �.�-�: BOT �0�0 Evaluation
GI NATIONAL AVERAGE
HFHS BOT
HFMH BOT
HFWH BOT
Appropriateness of Board Composition 50% 84% 82% 90%
New Trustee Orientation 83% 80% 70% 88% Focus on Strategy vs. Operations 53% 84% 82% 86%
Devotion of 20-30% of Agenda to Quality/Safety 64% 76% 86% 98%
Timely Meeting Materials 79% 88% 76% 84% Involvement with Identification of New Trustee Candidates
65% 80% 88% 92%
Role of Trustee Representing System in Community
70% 92% 96% 94%
Trustee Philanthropic Support 55% 88% 86% 90%
Fig. �.�-�: Recognition for Quality & Safety QUALITY AND SAFETY RECOGNITION: SAMPLING, �00�-�0�0
HFH
S �00�: Thomson Top 10 U.S. Systems, Quality and Efficiency �00�: National Safety Leadership Award, VHA Foundation and
the National Business Group on Health �00�: MI Quality Leadership (MQC/State Baldrige, highest level)
HFH
�0��/�0�0: Healthgrades ED Ranking, Top 5% in the Nation �0�0: AHA/McKesson Quest for Quality Finalist �00�-�00�: NRC's Consumer Choice Award for Best Overall
Quality for the Detroit/Wayne County area �00�/�00�: Thomson Top 100 Hospitals, PI Leaders �00�-�00�: Thomson Top 100, CV/Heart Care �00�: AMA's Bronze Award for stroke care �00�: Governor's Award for Appropriate Care, Surgical Care, ED �00�: LeapFrog Group Top 50 Safest Hospitals
HA
P
�00�: MI AHP' Pinnacle Award for Best Practice: Chronic Disease Care, Care Management and Community Outreach.
�00�-�0��: J.D. Powers, Highest Member Satisfaction �00�: Consumer Report's Ranking of Best Health Plans (#2) �00�: U.S. News/NCQA America's Best Health Insurance Plans �00�: Pinnacle Award for Best Practice: Chronic Disease Care
and Clinical Service Improvement �00�: US News & World Report Ranking of Medicare Program (#1
in MI, #24 nationally) �00�: NCQA Innovation in Multicultural Health Care
CO
MM
UN
ITY
HO
SPIT
ALS
, AM
BU
LATO
RY
�00�: Commonwealth Fund Case Study for Excellence (BHS) �00�: NCQA Diabetes Physician Recognition Program (HFMG) �00�: MI AHP Pinnacle Award, Innovations in Diabetes (HFMG) �00�: NCQA Innovation in Multicultural Health Care (HFMG) �0��/�0�0: Healthgrades ED Ranking, Top 5% Nationally (HFMH) �00�: Data Advantage LLC, Top100 Hospitals for Value (HFMH) �00�: ACS Midas+Platinum Quality Award - Excellence (HFMH) �00�/�00�/�00�: Thomson Top 100, CV Benchmarks (HFMH) �00�: Leapfrog Group Top 33 Hospitals (HFMH) �00�/�00�: Gov.’s Award, App. Care, Surg. Care, ED, CPOE
(HFMH) �00�/�00�: Gov.'s Award, App. Care, Surg. Care (HFMH-WC) �00�: BCBS Ctr. of Exc. Award-Bariatric Surgery (HFMH-WC) �0��/�0�0: Healthgrades ED Ranking, Top 5% Nationally
(HFWH) �00�: Press Ganey's Summit Award, ED, Ambulatory Surgery, &
Outpatient Services (HFWH’s Center for Health Services) �00�/�00�: Gov.’s Award for App. Care, Surg. Care, ED (HFWH)
Key: AHP = Association of Health Plans; App.= Appropriate; Ctr. of Exc. = Center of Excellence; ED–Emergency Dept.; Gov’s = Governor’s (discontinued after 2008)
Fig. �.�-�: Reported Incidents through Compliance Line �00� �00� �0�0 Human resources 83 53 56 Privacy 32 101 165 Compliance 15 50 136 Facility related 6 9 39 Safety 5 15 23 Total ��� ��� ���
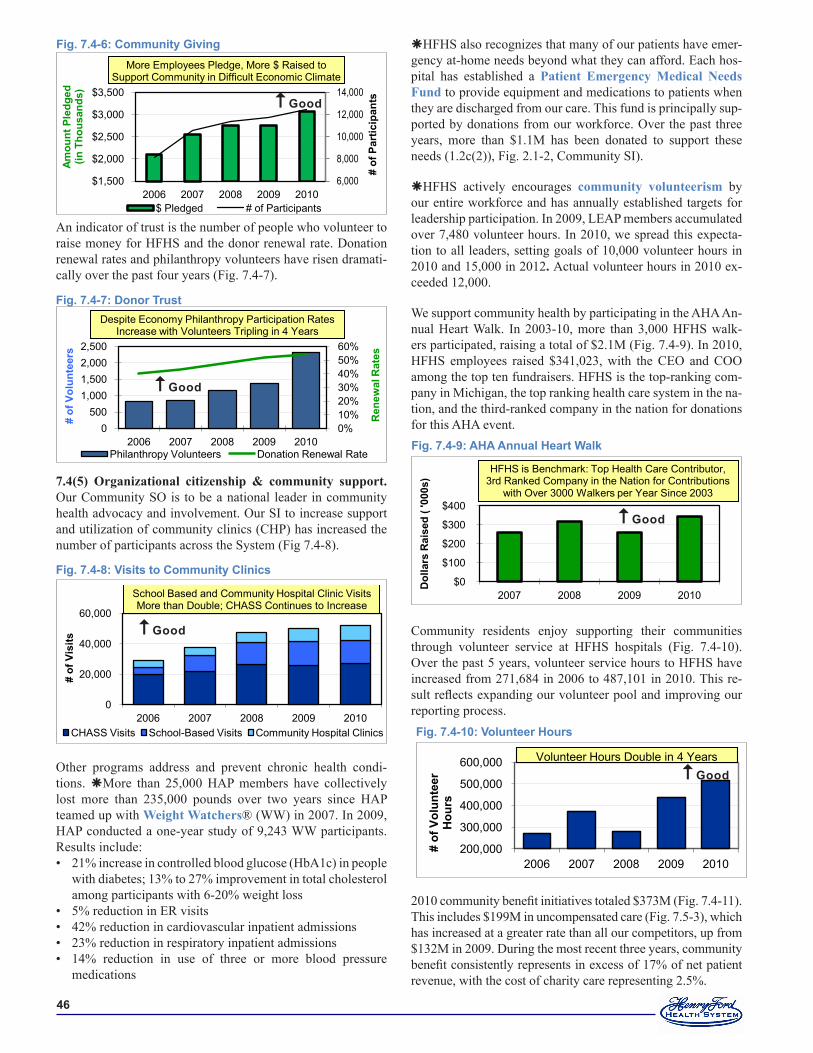
��
An indicator of trust is the number of people who volunteer to raise money for HFHS and the donor renewal rate. Donation renewal rates and philanthropy volunteers have risen dramati-cally over the past four years (Fig. 7.4-7).
7.4(5) Organizational citizenship & community support. Our Community SO is to be a national leader in community health advocacy and involvement. Our SI to increase support and utilization of community clinics (CHP) has increased the number of participants across the System (Fig 7.4-8).
Other programs address and prevent chronic health condi-tions. More than 25,000 HAP members have collectively lost more than 235,000 pounds over two years since HAP teamed up with Weight Watchers® (WW) in 2007. In 2009, HAP conducted a one-year study of 9,243 WW participants. Results include:
21% increase in controlled blood glucose (HbA1c) in people with diabetes; 13% to 27% improvement in total cholesterol among participants with 6-20% weight loss 5% reduction in ER visits 42% reduction in cardiovascular inpatient admissions 23% reduction in respiratory inpatient admissions 14% reduction in use of three or more blood pressure medications
•
••••
HFHS also recognizes that many of our patients have emer-gency at-home needs beyond what they can afford. Each hos-pital has established a Patient Emergency Medical Needs Fund to provide equipment and medications to patients when they are discharged from our care. This fund is principally sup-ported by donations from our workforce. Over the past three years, more than $1.1M has been donated to support these needs (1.2c(2)), Fig. 2.1-2, Community SI).
HFHS actively encourages community volunteerism by our entire workforce and has annually established targets for leadership participation. In 2009, LEAP members accumulated over 7,480 volunteer hours. In 2010, we spread this expecta-tion to all leaders, setting goals of 10,000 volunteer hours in 2010 and 15,000 in 2012. Actual volunteer hours in 2010 ex-ceeded 12,000.
We support community health by participating in the AHA An-nual Heart Walk. In 2003-10, more than 3,000 HFHS walk-ers participated, raising a total of $2.1M (Fig. 7.4-9). In 2010, HFHS employees raised $341,023, with the CEO and COO among the top ten fundraisers. HFHS is the top-ranking com-pany in Michigan, the top ranking health care system in the na-tion, and the third-ranked company in the nation for donations for this AHA event.
Community residents enjoy supporting their communities through volunteer service at HFHS hospitals (Fig. 7.4-10). Over the past 5 years, volunteer service hours to HFHS have increased from 271,684 in 2006 to 487,101 in 2010. This re-sult reflects expanding our volunteer pool and improving our reporting process.
2010 community benefit initiatives totaled $373M (Fig. 7.4-11). This includes $199M in uncompensated care (Fig. 7.5-3), which has increased at a greater rate than all our competitors, up from $132M in 2009. During the most recent three years, community benefit consistently represents in excess of 17% of net patient revenue, with the cost of charity care representing 2.5%.
Fig. �.�-�: Visits to Community Clinics
0
20,000
40,000
60,000
2006 2007 2008 2009 2010
# of
Vis
its
CHASS Visits School-Based Visits Community Hospital Clinics
School Based and Community Hospital Clinic Visits More than Double; CHASS Continues to Increase
Good
Fig. �.�-�: AHA Annual Heart Walk
$0
$100
$200
$300
$400
2007 2008 2009 2010
Dol
lars
Rai
sed
( '00
0s) HW DonationsHFHS is Benchmark: Top Health Care Contributor,
3rd Ranked Company in the Nation for Contributions with Over 3000 Walkers per Year Since 2003
Good
Fig. �.�-�0: Volunteer Hours
200,000
300,000
400,000
500,000
600,000
2006 2007 2008 2009 2010
# of
Vol
unte
er
Hou
rs
Volunteer Hours Double in 4 YearsGood
Fig. �.�-�: Donor Trust
0%10%20%30%40%50%60%
0500
1,0001,5002,0002,500
2006 2007 2008 2009 2010
Ren
ewal
Rat
es
# of
Vol
unte
ers
Philanthropy Volunteers Donation Renewal Rate
Despite Economy Philanthropy Participation Rates Increase with Volunteers Tripling in 4 Years
Good
Fig. �.�-�: Community Giving
6,000
8,000
10,000
12,000
14,000
$1,500
$2,000
$2,500
$3,000
$3,500
2006 2007 2008 2009 2010
# of
Par
ticip
ants
$ Pledged # of Participants
More Employees Pledge, More $ Raised to Support Community in Difficult Economic Climate
Amou
nt P
ledg
ed
(in T
hous
ands
)
Good
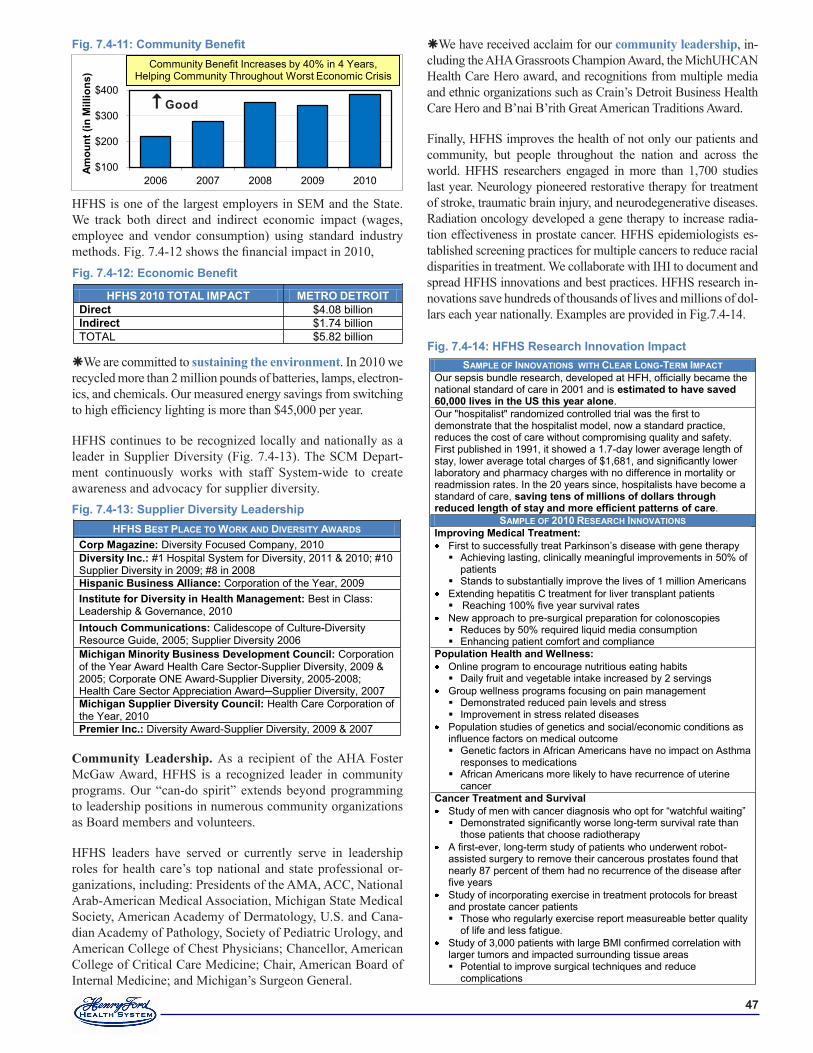
��
HFHS is one of the largest employers in SEM and the State. We track both direct and indirect economic impact (wages, employee and vendor consumption) using standard industry methods. Fig. 7.4-12 shows the financial impact in 2010,
We are committed to sustaining the environment. In 2010 we recycled more than 2 million pounds of batteries, lamps, electron-ics, and chemicals. Our measured energy savings from switching to high efficiency lighting is more than $45,000 per year.
HFHS continues to be recognized locally and nationally as a leader in Supplier Diversity (Fig. 7.4-13). The SCM Depart-ment continuously works with staff System-wide to create awareness and advocacy for supplier diversity.
Community Leadership. As a recipient of the AHA Foster McGaw Award, HFHS is a recognized leader in community programs. Our “can-do spirit” extends beyond programming to leadership positions in numerous community organizations as Board members and volunteers.
HFHS leaders have served or currently serve in leadership roles for health care’s top national and state professional or-ganizations, including: Presidents of the AMA, ACC, National Arab-American Medical Association, Michigan State Medical Society, American Academy of Dermatology, U.S. and Cana-dian Academy of Pathology, Society of Pediatric Urology, and American College of Chest Physicians; Chancellor, American College of Critical Care Medicine; Chair, American Board of Internal Medicine; and Michigan’s Surgeon General.
We have received acclaim for our community leadership, in-cluding the AHA Grassroots Champion Award, the MichUHCAN Health Care Hero award, and recognitions from multiple media and ethnic organizations such as Crain’s Detroit Business Health Care Hero and B’nai B’rith Great American Traditions Award.
Finally, HFHS improves the health of not only our patients and community, but people throughout the nation and across the world. HFHS researchers engaged in more than 1,700 studies last year. Neurology pioneered restorative therapy for treatment of stroke, traumatic brain injury, and neurodegenerative diseases. Radiation oncology developed a gene therapy to increase radia-tion effectiveness in prostate cancer. HFHS epidemiologists es-tablished screening practices for multiple cancers to reduce racial disparities in treatment. We collaborate with IHI to document and spread HFHS innovations and best practices. HFHS research in-novations save hundreds of thousands of lives and millions of dol-lars each year nationally. Examples are provided in Fig.7.4-14.
Fig. �.�-��: Supplier Diversity LeadershipHFHS BEST PLACE TO WORK AND DIVERSITY AWARDS
Corp Magazine: Diversity Focused Company, 2010 Diversity Inc.: #1 Hospital System for Diversity, 2011 & 2010; #10 Supplier Diversity in 2009; #8 in 2008 Hispanic Business Alliance: Corporation of the Year, 2009 Institute for Diversity in Health Management: Best in Class: Leadership & Governance, 2010 Intouch Communications: Calidescope of Culture-Diversity Resource Guide, 2005; Supplier Diversity 2006 Michigan Minority Business Development Council: Corporation of the Year Award Health Care Sector-Supplier Diversity, 2009 & 2005; Corporate ONE Award-Supplier Diversity, 2005-2008; Health Care Sector Appreciation Award─Supplier Diversity, 2007 Michigan Supplier Diversity Council: Health Care Corporation of the Year, 2010 Premier Inc.: Diversity Award-Supplier Diversity, 2009 & 2007
Fig. 7.4-11: Community Benefit
$100
$200
$300
$400
2006 2007 2008 2009 2010
Amou
nt (i
n M
illio
ns)
Community Benefit Increases by 40% in 4 Years, Helping Community Throughout Worst Economic Crisis
Good
Fig. 7.4-12: Economic Benefit
HFHS �0�0 TOTAL IMPACT METRO DETROIT Direct $4.08 billion Indirect $1.74 billion TOTAL $5.82 billion
Fig. �.�-��: HFHS Research Innovation ImpactSAMPLE OF INNOVATIONS WITH CLEAR LONG-TERM IMPACT
Our sepsis bundle research, developed at HFH, officially became the national standard of care in 2001 and is estimated to have saved �0,000 lives in the US this year alone. Our "hospitalist" randomized controlled trial was the first to demonstrate that the hospitalist model, now a standard practice, reduces the cost of care without compromising quality and safety. First published in 1991, it showed a 1.7-day lower average length of stay, lower average total charges of $1,681, and significantly lower laboratory and pharmacy charges with no difference in mortality or readmission rates. In the 20 years since, hospitalists have become a standard of care, saving tens of millions of dollars through reduced length of stay and more efficient patterns of care.
SAMPLE OF �0�0 RESEARCH INNOVATIONS Improving Medical Treatment: First to successfully treat Parkinson’s disease with gene therapy Achieving lasting, clinically meaningful improvements in 50% of
patients Stands to substantially improve the lives of 1 million Americans
Extending hepatitis C treatment for liver transplant patients Reaching 100% five year survival rates
New approach to pre-surgical preparation for colonoscopies Reduces by 50% required liquid media consumption Enhancing patient comfort and compliance
Population Health and Wellness: Online program to encourage nutritious eating habits Daily fruit and vegetable intake increased by 2 servings
Group wellness programs focusing on pain management Demonstrated reduced pain levels and stress Improvement in stress related diseases
Population studies of genetics and social/economic conditions as influence factors on medical outcome Genetic factors in African Americans have no impact on Asthma
responses to medications African Americans more likely to have recurrence of uterine
cancer Cancer Treatment and Survival Study of men with cancer diagnosis who opt for “watchful waiting” Demonstrated significantly worse long-term survival rate than
those patients that choose radiotherapy A first-ever, long-term study of patients who underwent robot-
assisted surgery to remove their cancerous prostates found that nearly 87 percent of them had no recurrence of the disease after five years
Study of incorporating exercise in treatment protocols for breast and prostate cancer patients Those who regularly exercise report measureable better quality
of life and less fatigue. Study of 3,000 patients with large BMI confirmed correlation with
larger tumors and impacted surrounding tissue areas Potential to improve surgical techniques and reduce
complications
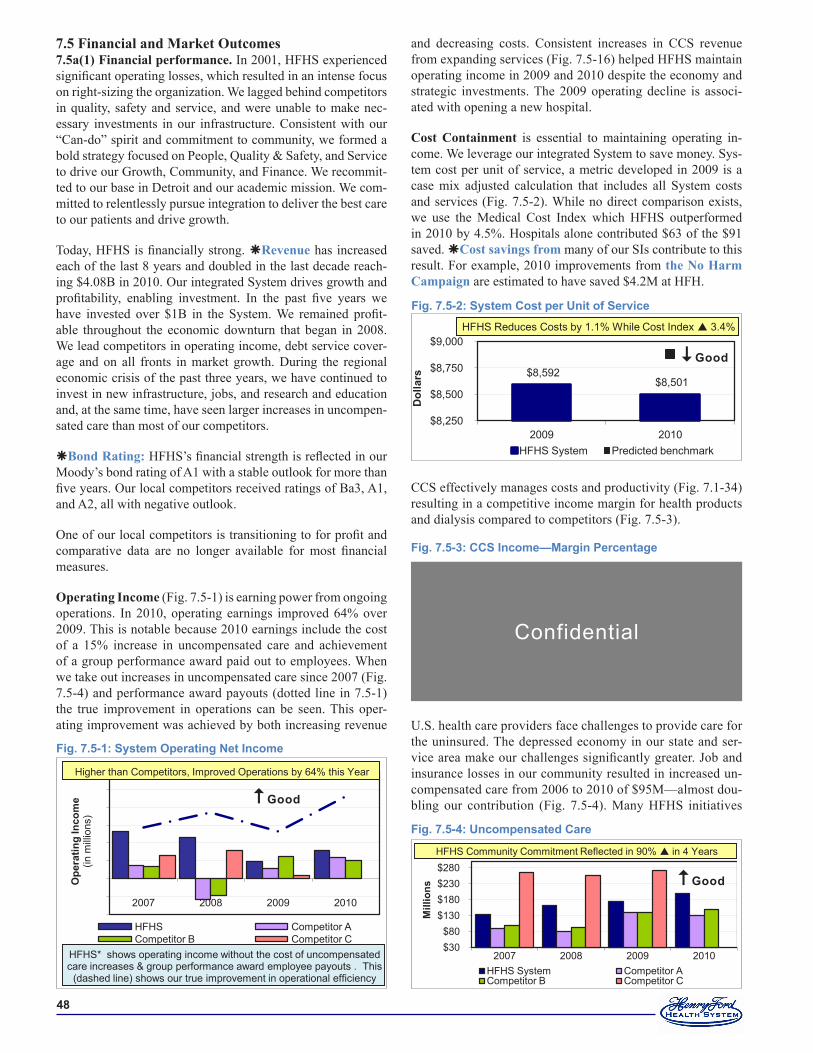
��
7.5 Financial and Market Outcomes7.5a(1) Financial performance. In 2001, HFHS experienced significant operating losses, which resulted in an intense focus on right-sizing the organization. We lagged behind competitors in quality, safety and service, and were unable to make nec-essary investments in our infrastructure. Consistent with our “Can-do” spirit and commitment to community, we formed a bold strategy focused on People, Quality & Safety, and Service to drive our Growth, Community, and Finance. We recommit-ted to our base in Detroit and our academic mission. We com-mitted to relentlessly pursue integration to deliver the best care to our patients and drive growth.
Today, HFHS is financially strong. Revenue has increased each of the last 8 years and doubled in the last decade reach-ing $4.08B in 2010. Our integrated System drives growth and profitability, enabling investment. In the past five years we have invested over $1B in the System. We remained profit-able throughout the economic downturn that began in 2008. We lead competitors in operating income, debt service cover-age and on all fronts in market growth. During the regional economic crisis of the past three years, we have continued to invest in new infrastructure, jobs, and research and education and, at the same time, have seen larger increases in uncompen-sated care than most of our competitors.
Bond Rating: HFHS’s financial strength is reflected in our Moody’s bond rating of A1 with a stable outlook for more than five years. Our local competitors received ratings of Ba3, A1, and A2, all with negative outlook.
One of our local competitors is transitioning to for profit and comparative data are no longer available for most financial measures.
Operating Income (Fig. 7.5-1) is earning power from ongoing operations. In 2010, operating earnings improved 64% over 2009. This is notable because 2010 earnings include the cost of a 15% increase in uncompensated care and achievement of a group performance award paid out to employees. When we take out increases in uncompensated care since 2007 (Fig. 7.5-4) and performance award payouts (dotted line in 7.5-1) the true improvement in operations can be seen. This oper-ating improvement was achieved by both increasing revenue
and decreasing costs. Consistent increases in CCS revenue from expanding services (Fig. 7.5-16) helped HFHS maintain operating income in 2009 and 2010 despite the economy and strategic investments. The 2009 operating decline is associ-ated with opening a new hospital.
Cost Containment is essential to maintaining operating in-come. We leverage our integrated System to save money. Sys-tem cost per unit of service, a metric developed in 2009 is a case mix adjusted calculation that includes all System costs and services (Fig. 7.5-2). While no direct comparison exists, we use the Medical Cost Index which HFHS outperformed in 2010 by 4.5%. Hospitals alone contributed $63 of the $91 saved. Cost savings from many of our SIs contribute to this result. For example, 2010 improvements from the No Harm Campaign are estimated to have saved $4.2M at HFH.
CCS effectively manages costs and productivity (Fig. 7.1-34) resulting in a competitive income margin for health products and dialysis compared to competitors (Fig. 7.5-3).
U.S. health care providers face challenges to provide care for the uninsured. The depressed economy in our state and ser-vice area make our challenges significantly greater. Job and insurance losses in our community resulted in increased un-compensated care from 2006 to 2010 of $95M—almost dou-bling our contribution (Fig. 7.5-4). Many HFHS initiatives
Fig. �.�-�: System Cost per Unit of Service
$8,592 $8,501
$8,250
$8,500
$8,750
$9,000
2009 2010D
olla
rs
HFHS System Predicted benchmark
HFHS Reduces Costs by 1.1% While Cost Index 3.4%
Good
Fig. �.�-�: Uncompensated Care
$30 $80
$130 $180 $230 $280
2007 2008 2009 2010
Mill
ions
HFHS System Competitor A Competitor B Competitor C
HFHS Community Commitment Reflected in 90% in 4 Years
Good
Fig. �.�-�: System Operating Net Income
-$50
-$25
$0
$25
$50
$75
$100
$125
$150
2007 2008 2009 2010
Ope
ratin
g In
com
e
(in m
illio
ns)
HFHS Competitor A Competitor B Competitor C
Higher than Competitors, Improved Operations by 64% this Year
HFHS* shows operating income without the cost of uncompensated care increases & group performance award employee payouts . This
(dashed line) shows our true improvement in operational efficiency
Good
Fig. �.�-�: CCS Income—Margin Percentage
Confidential
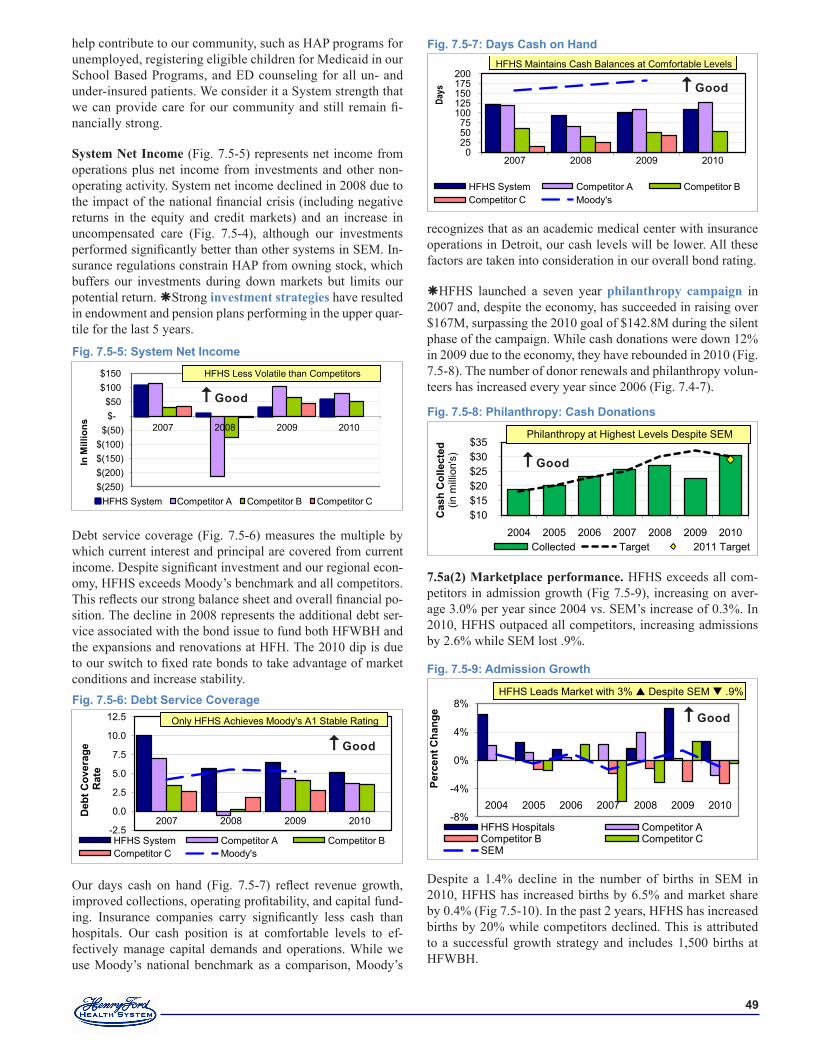
��
help contribute to our community, such as HAP programs for unemployed, registering eligible children for Medicaid in our School Based Programs, and ED counseling for all un- and under-insured patients. We consider it a System strength that we can provide care for our community and still remain fi-nancially strong.
System Net Income (Fig. 7.5-5) represents net income from operations plus net income from investments and other non-operating activity. System net income declined in 2008 due to the impact of the national financial crisis (including negative returns in the equity and credit markets) and an increase in uncompensated care (Fig. 7.5-4), although our investments performed significantly better than other systems in SEM. In-surance regulations constrain HAP from owning stock, which buffers our investments during down markets but limits our potential return. Strong investment strategies have resulted in endowment and pension plans performing in the upper quar-tile for the last 5 years.
Debt service coverage (Fig. 7.5-6) measures the multiple by which current interest and principal are covered from current income. Despite significant investment and our regional econ-omy, HFHS exceeds Moody’s benchmark and all competitors. This reflects our strong balance sheet and overall financial po-sition. The decline in 2008 represents the additional debt ser-vice associated with the bond issue to fund both HFWBH and the expansions and renovations at HFH. The 2010 dip is due to our switch to fixed rate bonds to take advantage of market conditions and increase stability.
Our days cash on hand (Fig. 7.5-7) reflect revenue growth, improved collections, operating profitability, and capital fund-ing. Insurance companies carry significantly less cash than hospitals. Our cash position is at comfortable levels to ef-fectively manage capital demands and operations. While we use Moody’s national benchmark as a comparison, Moody’s
Fig. �.�-�: System Net Income
$(250) $(200) $(150) $(100)
$(50) $- $50
$100 $150
2007 2008 2009 2010
In M
illio
ns
HFHS System Competitor A Competitor B Competitor C
HFHS Less Volatile than Competitors
Good
recognizes that as an academic medical center with insurance operations in Detroit, our cash levels will be lower. All these factors are taken into consideration in our overall bond rating.
HFHS launched a seven year philanthropy campaign in 2007 and, despite the economy, has succeeded in raising over $167M, surpassing the 2010 goal of $142.8M during the silent phase of the campaign. While cash donations were down 12% in 2009 due to the economy, they have rebounded in 2010 (Fig. 7.5-8). The number of donor renewals and philanthropy volun-teers has increased every year since 2006 (Fig. 7.4-7).
7.5a(2) Marketplace performance. HFHS exceeds all com-petitors in admission growth (Fig 7.5-9), increasing on aver-age 3.0% per year since 2004 vs. SEM’s increase of 0.3%. In 2010, HFHS outpaced all competitors, increasing admissions by 2.6% while SEM lost .9%.
Despite a 1.4% decline in the number of births in SEM in 2010, HFHS has increased births by 6.5% and market share by 0.4% (Fig 7.5-10). In the past 2 years, HFHS has increased births by 20% while competitors declined. This is attributed to a successful growth strategy and includes 1,500 births at HFWBH.
Fig. �.�-�: Admission Growth
-8%
-4%
0%
4%
8%
2004 2005 2006 2007 2008 2009 2010
Perc
ent C
hang
e
HFHS Hospitals Competitor A Competitor B Competitor C SEM
HFHS Leads Market with 3% Despite SEM .9%
Good
Fig. �.�-�: Philanthropy: Cash Donations
$10 $15 $20 $25 $30 $35
2004 2005 2006 2007 2008 2009 2010
Cas
h C
olle
cted
(in m
illio
n's)
Collected Target 2011 Target
Philanthropy at Highest Levels Despite SEM
Good
Fig. �.�-�: Debt Service Coverage
-2.5
0.0
2.5
5.0
7.5
10.0
12.5
2007 2008 2009 2010
Deb
t Cov
erag
e R
ate
HFHS System Competitor A Competitor B Competitor C Moody's
Only HFHS Achieves Moody's A1 Stable Rating
Good
Fig. �.�-�: Days Cash on Hand
0 25 50 75
100 125 150 175 200
2007 2008 2009 2010
Day
s
HFHS System Competitor A Competitor B Competitor C Moody's
HFHS Maintains Cash Balances at Comfortable Levels
Good
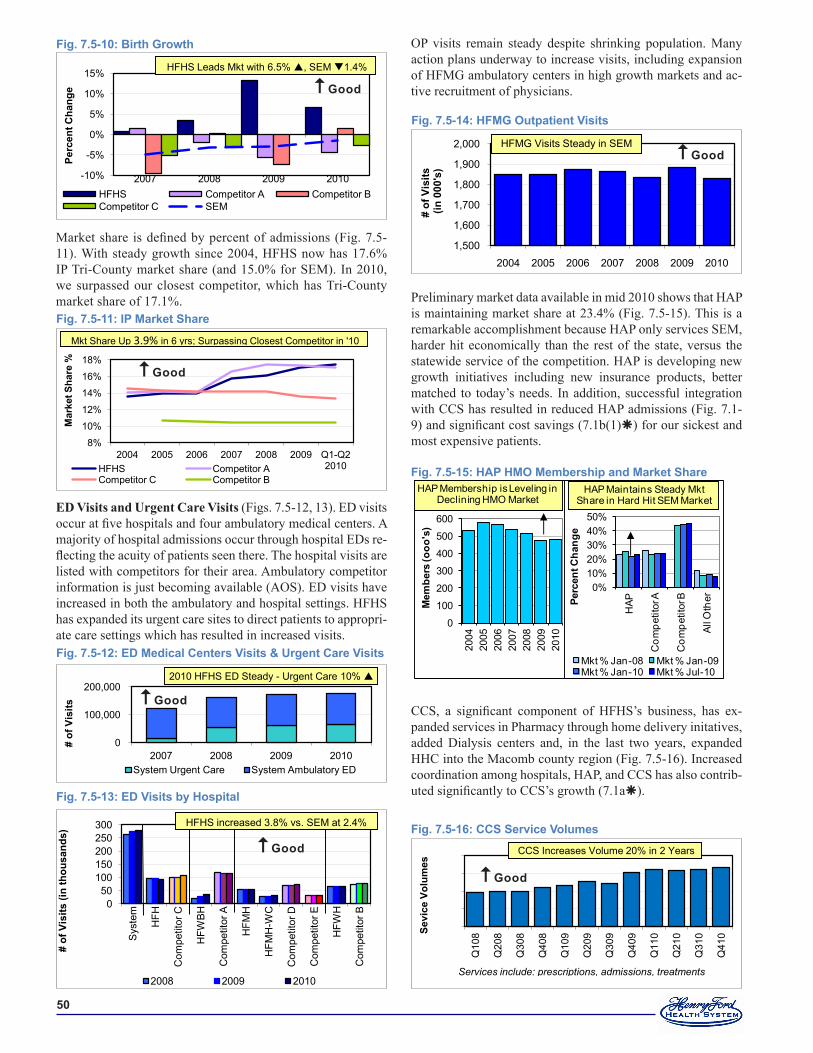
�0
Market share is defined by percent of admissions (Fig. 7.5-11). With steady growth since 2004, HFHS now has 17.6% IP Tri-County market share (and 15.0% for SEM). In 2010, we surpassed our closest competitor, which has Tri-County market share of 17.1%.
ED Visits and Urgent Care Visits (Figs. 7.5-12, 13). ED visits occur at five hospitals and four ambulatory medical centers. A majority of hospital admissions occur through hospital EDs re-flecting the acuity of patients seen there. The hospital visits are listed with competitors for their area. Ambulatory competitor information is just becoming available (AOS). ED visits have increased in both the ambulatory and hospital settings. HFHS has expanded its urgent care sites to direct patients to appropri-ate care settings which has resulted in increased visits.
Fig. �.�-��: ED Visits by Hospital
0 50
100 150 200 250 300
Sys
tem
HFH
Com
petit
or C
HFW
BH
Com
petit
or A
HFM
H
HFM
H-W
C
Com
petit
or D
Com
petit
or E
HFW
H
Com
petit
or B
# of
Vis
its (i
n th
ousa
nds)
2008 2009 2010
HFHS increased 3.8% vs. SEM at 2.4%
Good
Fig. �.�-��: ED Medical Centers Visits & Urgent Care Visits
0
100,000
200,000
2007 2008 2009 2010
# of
Vis
its
System Urgent Care System Ambulatory ED
2010 HFHS ED Steady - Urgent Care 10%
Good
OP visits remain steady despite shrinking population. Many action plans underway to increase visits, including expansion of HFMG ambulatory centers in high growth markets and ac-tive recruitment of physicians.
Preliminary market data available in mid 2010 shows that HAP is maintaining market share at 23.4% (Fig. 7.5-15). This is a remarkable accomplishment because HAP only services SEM, harder hit economically than the rest of the state, versus the statewide service of the competition. HAP is developing new growth initiatives including new insurance products, better matched to today’s needs. In addition, successful integration with CCS has resulted in reduced HAP admissions (Fig. 7.1-9) and significant cost savings (7.1b(1)) for our sickest and most expensive patients.
CCS, a significant component of HFHS’s business, has ex-panded services in Pharmacy through home delivery initatives, added Dialysis centers and, in the last two years, expanded HHC into the Macomb county region (Fig. 7.5-16). Increased coordination among hospitals, HAP, and CCS has also contrib-uted significantly to CCS’s growth (7.1a).
Fig. �.�-��: HFMG Outpatient Visits
1,500
1,600
1,700
1,800
1,900
2,000
2004 2005 2006 2007 2008 2009 2010
# of
Vis
its(in
000
's)
HFMG Visits Steady in SEMGood
Fig. �.�-��: HAP HMO Membership and Market Share
0
100
200
300
400
500
600
2004
2005
2006
2007
2008
2009
2010
Mem
bers
(ooo
's)
HAP Membership is Leveling in Declining HMO Market
0%10%20%30%40%50%
HAP
Com
petit
or A
Com
petit
or B
All O
therPe
rcen
t Cha
nge
Mkt % Jan-08 Mkt % Jan-09Mkt % Jan-10 Mkt % Jul-10
HAP Maintains Steady Mkt Share in Hard Hit SEM Market
Fig. �.�-��: CCS Service Volumes
200,000
250,000
300,000
350,000
400,000
Q10
8
Q20
8
Q30
8
Q40
8
Q10
9
Q20
9
Q30
9
Q40
9
Q11
0
Q21
0
Q31
0
Q41
0 Sevi
ce V
olum
es CCS Increases Volume 20% in 2 Years
Services include: prescriptions, admissions, treatments
Good
Fig. �.�-��: IP Market Share
8%
10%
12%
14%
16%
18%
2004 2005 2006 2007 2008 2009 Q1-Q2 2010
Mar
ket S
hare
%
HFHS Competitor A Competitor C Competitor B
Mkt Share Up 3.9% in 6 yrs; Surpassing Closest Competitor in '10
Good
Fig. �.�-�0: Birth Growth
-10%
-5%
0%
5%
10%
15%
2007 2008 2009 2010
Perc
ent C
hang
e
HFHS Competitor A Competitor B Competitor C SEM
HFHS Leads Mkt with 6.5% , SEM 1.4%
Good