2011 Half Year Results - lafargeholcim.com · More comprehensive information about Lafarge may be...
49
Granulats et Béton - Afrique du Sud, stade Moses Mabhida 2011 Half Year Results Jean-Jacques Gauthier 2011 Half Year Results Jean-Jacques Gauthier July 28, 2011 July 28, 2011
Transcript of 2011 Half Year Results - lafargeholcim.com · More comprehensive information about Lafarge may be...

Gra
nula
ts e
t B
éto
n -
Afr
ique d
u S
ud,
sta
de M
oses M
abhid
a
2011 Half Year ResultsJean-Jacques Gauthier
2011 Half Year ResultsJean-Jacques Gauthier
July 28, 2011July 28, 2011

2
Disclaimer
This document may contain forward-looking statements. Such forward-looking statements do not constitute forecasts regarding the Company’s results or any other performance indicator, but rather trends or targets, as the case may be. These statements are by their nature subject to risks and uncertainties, many of which are outside our control, including, but not limited to the risks described in the Company’s annual report available on its Internet website (www.lafarge.com). These statements do not reflect future performance of the Company, which may materially differ. The Company does not undertake to provide updates of these statements.
More comprehensive information about Lafarge may be obtained on its Internet website (www.lafarge.com).
This document does not constitute an offer to sell, or a solicitation of an offer to buy Lafarge shares.
3
Highlights
� Sales increased on a like for like basis in all product lines for
both Q2 and first-half
� Strong volume growth in Q2 and first-half
� Strength continued in emerging markets and Northern Europe
� Adverse weather impacted volumes in North America
� Cement prices moved progressively higher from Q4 2010 to
Q2 2011, but slightly down compared to first-half last year.
� Cost inflation and foreign exchange lowered overall results
and are expected to impact earnings growth for the full year
� On-going cost reduction achieved €50M of structural cost
savings for the quarter and €100M year-to-date
� Announced project to sell European and South American
Gypsum operations for €1Bn while maintaining a 20% stake
� On track to achieve at least €2 billion debt reduction

4
Divestment Proceeds of €1.8 Billion Secured
� €700M of the €750M divestments target for 2011
� Sale of assets in Southeast United States
� Sale of Australian Gypsum operations
� Several other small deals
� €200M cash coming in from deals closed in 2010
� €100M received in the first-half
� Remaining in the third quarter
� €850M net proceeds from the project to sell the Gypsum
European and South American assets
4

5
Key Figures
(1) Net income attributable to the owners of the parent company
-16%
-13%
2%
lfl
-15%
-10%
3%
lfl
15.9%18.8%11.6%13.9%Operating Margin
159
1.01
289
702
971
4,416
2011
14,260
(163)
0.91
260
926
1,485
7,973
2011
-6%
nm
-34%
-34%
-14%
-10%
3%
Variation
15,160
491
1.37
393
1,072
1,650
7,712
2010
6 Months 2nd Quarter
Net debt
-72%577Free cash flow
-12%1.15Earnings per share (in €)
-12%329Net income Group share (1)
-16%836Current Operating Income
-14%1,134EBITDA
-4,436Sales
Variation2010€m
Bré
sil,
cim
ente
rie,
usin
e d
’Arc
os
CementCement

7
Cement HighlightsVolume Growth Supported by Emerging Markets Earnings Impacted by Higher Cost Inflation and Exchange Rates
� Overall, volumes increased 6% like for like in Q2, driven by emerging markets where a 9% to 12% volume growth was
experienced in each individual region.
� Prices continued to increase progressively versus Q4 2010
levels, but are still below comparable 2010 average prices.
� Current operating income decrease impacted by higher cost
inflation and foreign currency fluctuations.
-14%
-9%
3%
5%
lfl
-13%
-10%
3%
6%
lfl
-14%
-13%
-
9%
Variation
-13%
-10%
3%
8%
Variation
1,025
1,408
4,963
65.4
2010
6 Months
891
1,273
5,134
70.6
2011
€m
2nd Quarter
621726Current Operating Income
804923EBITDA
2,8342,826Sales (1)
39.536.4Volumes
20112010MT
Operating margin
20.7%
6 months,2010
6 months,
2011
17.4%
(1) Before elimination of inter divisional sales

8
Cement highlights
-4%-13%221255-5%-12%416472
2%11%4944-6%17%9178Latin America
-25%-29%81114-37%-38%124200Asia
Middle East and Africa
7%11%93848%9%7367Central and Eastern Europe
-33%-24%3242nmnm(31)(15)North America
187
726
2010
2nd Quarter
145
621
2011
-27%
-13%
lfl
-22%
-14%
Variation
-2%
-13%
Variation
-8%
-14%
lfl
223
1,025
2010
6 Months
218
891
2011
Current Op Income (€m)
Western Europe
By geographical zone
� Despite strong cost cutting achievements, Western Europe earnings were impacted by significant
increases in variable costs and the difficult economic environment in Greece and Spain.
� North American earnings were impacted by lower volumes in Q2 due to adverse weather and
higher cost inflation which could not be offset by pricing.
� Central and Eastern Europe earnings grew, supported by good market conditions in Russia and
Poland, positive pricing overall in a cost inflationary context.
� MEA was supported by volume improvements in the key markets of Algeria and Nigeria, but cost
inflation and adverse foreign exchange lowered earnings.
� In LATAM, higher sales and cost cutting measures successfully offset cost inflation.
� In Asia, significant volume increases observed in most markets only partially mitigated strong cost
inflation and the impact of the slowdown in infrastructure projects in the Philippines.

9
1 2 3 4 5 6
Cement highlightsFocus on prices - Q2 2011 price levels versus 2010 levels
-
+2%Latin America
+4%Asia
Middle East and Africa
+3%Central and Eastern Europe
+1%North America
-
+1.5%
Variation
Cement Division
Western Europe
Variation vs. Q4 2010
levels
Q1 Q2 Q3 Q4 Q1 Q22010 2011
Grey Cement – Price evolution

Cim
ent
-G
ranula
ts e
t B
éto
n -
Bré
sil,
centr
e a
dm
inis
tratif gouvern
em
enta
l de l'é
tat
de M
inas G
era
is Aggregates & ConcreteAggregates & Concrete

11
Aggregates & Concrete HighlightsPrice Gains and Cost-Cutting Partially Mitigate Cost Inflation
(1) Before elimination of inter divisional sales
-25%
-7%
4%
lfl
-18%
-13%
1%
lflVariation20112010Variation20112010€m
-8%
-11%
-2%
23
152
2,321
6 Months
29
144
2,401
26%
-5%
3%
2nd Quarter
8795Current Operating Income
143161EBITDA
1,3751,403Sales (1)
Operating margin
1.0%
6 months,2010
6 months,
2011
1.2%
� Sales growth declined in Q2, with positive trends in France and Central and Eastern Europe mitigated
by the impact of adverse weather on North America
construction activity.
� Prices were well-oriented overall.
� Cost containment measures and price improvement
only partially offset higher transportation costs.
� Ready-Mix sales of Value Added Products improved
at comparable scope and significantly contributed to
earnings.

Plä
tre-
Afr
ique d
u S
ud,
imm
euble
de
Johan
nesb
urg
GypsumGypsum

13
Gypsum HighlightsSales Growth Supports Earnings
(1) Before elimination of inter divisional sales
Operating margin
4.7%
6 months,2010
6 months,2011
5.4%
� Volumes improved 5% in Q2, driven by an improvement in construction market activity.
� Current Operating Income stable for Q2 and up YTD, as higher volumes and price improvement help compensate for higher cost inflation.
17%
5%
5%
5%
lfl
-5%
-6%
4%
5%
lfl
34
76
725
344
2010
6 Months
41
81
762
361
2011
21%
7%
5%
5%
Variation
€m
2nd Quarter
-4%2324Current Operating Income
-7%4245EBITDA
2%387381Sales (1)
5%185176Volumes
Variation20112010Mm²

Gra
nula
ts e
t B
éto
n -
Bré
sil,
Musée d
'Art
Conte
mpora
in Net IncomeNet Income

15
Net Income
(1) Including the gain on the disposal of Cimpor shares for €160m (2) Net income attributable to the owners of the parent company
393(1)
(116)
(157)
(13)
(283)(1)
(110)
1,072
2010
6 Months
260
(92)
(113)
(1)
(410)
(50)
926
2011
329
(66)
(156)
(16)
(200)
(69)
836
2010
2nd Quarter
289
(57)
(110)
2
(225)
(23)
702
2011
Income taxes
Non-controlling interests
Net income Group Share (2)
Income from associates
Finance costs, net
Other income (expenses)
Current Operating Income
€m
Gra
nula
ts e
t B
éto
n -
Bré
sil,
Musée d
'Art
Conte
mpora
in
Cash Flow and DebtHighlights
Cash Flow and DebtHighlights

17
Cash Flow
15,160
13,795
(1,365)
(210)
13
(1,007)
(53)
(102)
(6)
(602)
105
491
950
(343)
(116)
2010
6 Months
14,260
13,993
(267)
(141)
4
354
(29)
59
(514)
(457)
106
(163)
664
(697)
(130)
2011
14,26015,160Net debt at period end
14,24014,582Net debt at the beginning of period
(20)(578)Net debt reduction (increase)
(115)
2
74
(21)
(6)
(190)
6
(658)
(53)
(66)
Dividends
Equity issuance (repurchase)
Currency fluctuation impact
Change in fair value
Others
46383Cash flow after investments
(208)
95
(263)
69
Development investments (1)
Divestments (2)
436
(200)
(77)
706
(58)
(71)
Cash flow from operations
Change in working capital
Sustaining capex
2nd Quarter
159577Free cash flow
20112010€m
(1) Including debt acquired and the acquisitions of ownership interests with no gain of control.In H1 2011, the acquisitions of ownership interests with no gain of control represented €51m, excluding a €51 million put, already recorded as debt, that was exercised in the first quarter
(2) Including debt disposed of

18
Balanced Debt Maturity Schedule
� Average maturity of gross debt is 4 years and 6 months
(1) Excluding puts on shares and derivatives instruments: €0.3bn
0
200
400
600
800
1 000
1 200
1 400
1 600
1 800
2 000
2011 2012 2013 2014 2015 2016 2017 2018 2019 After
2019
Lafarge SA Commercial paper & ST borrowings Lafarge SA Bonds & other MLT instruments
Subsidiaries debt instruments Orascom acquisition facility (drawings)
Securitization programs Drawings on MT committed credit lines
at June 30, 2011 (€m) (1)
19
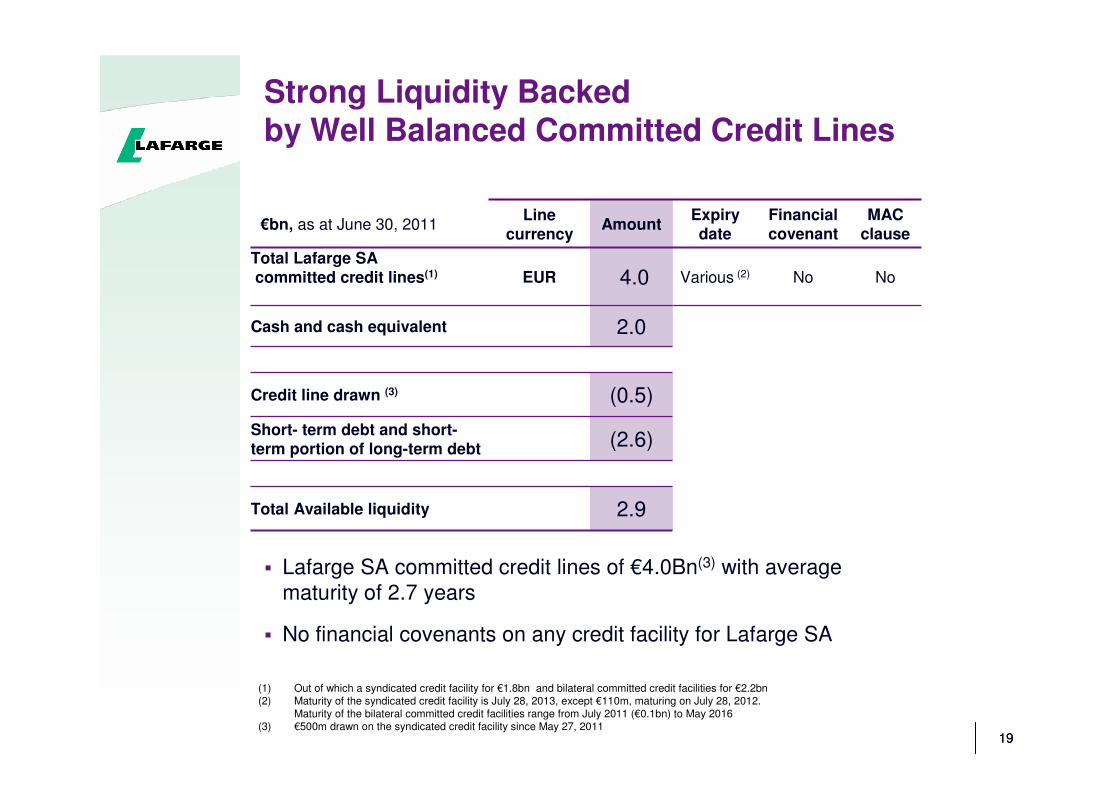
2.9Total Available liquidity
(2.6)Short- term debt and short-term portion of long-term debt
(0.5)Credit line drawn (3)
€bn, as at June 30, 2011Line
currencyAmount
Expiry date
Financial covenant
MAC clause
Total Lafarge SAcommitted credit lines(1) EUR 4.0 Various (2) No No
Cash and cash equivalent 2.0
Strong Liquidity Backed by Well Balanced Committed Credit Lines
� Lafarge SA committed credit lines of €4.0Bn(3) with average
maturity of 2.7 years
� No financial covenants on any credit facility for Lafarge SA
19
(1) Out of which a syndicated credit facility for €1.8bn and bilateral committed credit facilities for €2.2bn(2) Maturity of the syndicated credit facility is July 28, 2013, except €110m, maturing on July 28, 2012.
Maturity of the bilateral committed credit facilities range from July 2011 (€0.1bn) to May 2016(3) €500m drawn on the syndicated credit facility since May 27, 2011

Gra
nula
ts e
t B
éto
n -
Afr
ique d
u S
ud,
sta
de M
oses M
abhid
a
Outlook 2011Outlook 2011
2121
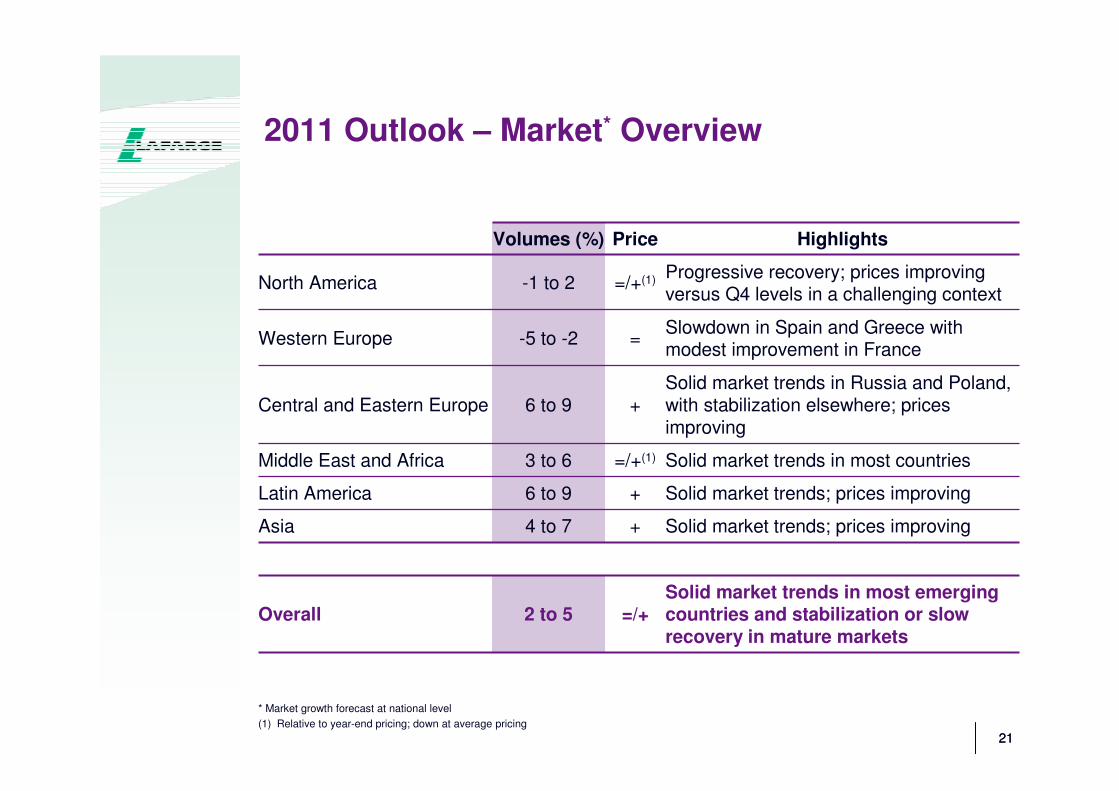
2011 Outlook – Market* Overview
Volumes (%) Price Highlights
North America -1 to 2 =/+(1) Progressive recovery; prices improving versus Q4 levels in a challenging context
Western Europe -5 to -2 =Slowdown in Spain and Greece with modest improvement in France
Central and Eastern Europe 6 to 9 +Solid market trends in Russia and Poland, with stabilization elsewhere; prices improving
Middle East and Africa 3 to 6 =/+(1) Solid market trends in most countries
Latin America 6 to 9 + Solid market trends; prices improving
Asia 4 to 7 + Solid market trends; prices improving
Overall 2 to 5 =/+Solid market trends in most emerging countries and stabilization or slow recovery in mature markets
* Market growth forecast at national level
(1) Relative to year-end pricing; down at average pricing

2222
2011 Outlook – Other Elements
� +10% energy cost increase (+1.3 euro per tonne)
� Structural cost reduction of a further €200 m in 2011
� Cost of debt (gross): 6.0%
� Tax rate: 26% (1)
� Capital expenditures:
- Sustaining: ~ €0.5 Bn
- Development: ~ €0.7 Bn
(1) Impacted by country mix

Gra
nula
ts e
t B
éto
n -
Afr
ique d
u S
ud,
sta
de M
oses M
abhid
a
ConclusionConclusion

Gra
nula
ts e
t B
éto
n -
Afr
ique d
u S
ud,
sta
de M
oses M
abhid
a
I. Other InformationI. Other Information
Outlook 2011 – Market OverviewOutlook 2011 – Market Overview

2525
2011 Outlook – Market (1) overviewCement
Market Volumes
(%)
North America
United States
Canada
-1 to 2
-1 to 2
-1 to 2
Western Europe
France
United Kingdom
Spain
Greece
-5 to -2
3 to 6
0 to 3
-15 to -12
-30 to -25
Central and Eastern Europe
Poland
Romania
Russia (1)
Serbia
6 to 9
12 to 15
-3 to 0
8 to 11
0 to 3
Latin AmericaBrazilHondurasEcuador
6 to 96 to 97 to 104 to 7
(1) Market growth forecast at national level except for China, India and Russia for which only relevant markets are considered
Market Volumes
(%)
Middle East and AfricaAlgeriaEgyptIraqJordanKenyaMoroccoNigeria South AfricaSyria
3 to 65 to 8
-5 to -210 to 13-6 to -37 to 101 to 4
8 to 110 to 33 to 6
AsiaChina (1)
India (1)
IndonesiaMalaysiaPhilippinesSouth Korea
4 to 76 to 95 to 86 to 96 to 9-2 to 2 -6 to -3
Overall 2 to 5

2626
2011 Outlook – Market overviewAggregates & Concrete – Gypsum
� Aggregates and Concrete
� Mature markets: subdued volume growth in North America with
contrasted trends in Western Europe.
� Emerging markets: volume growth in most countries.
� Price improvement expected for both Pure Aggregates and Ready-Mix
concrete in a challenging context.
� Gypsum
� Volume and price improvement.

Bré
sil,
cim
ente
rie,
usin
e d
’Arc
os
II. Other InformationII. Other Information
Cement – Regional informationCement – Regional information

28
Cement: YTD Like for Like Sales Variance (1)
21.9%38.3%0.4%
45.0%4.3%
6.1%-0.3%-1.0%34.8%-0.9%
15.8%38.6%1.4%
10.2%5.2%
Central and Eastern EuropePoland RomaniaRussiaSerbia
-2.2%-0.5%(4)-1.7%(3)North America
2.7%19.5%-5.4%11.0%12.8%
-18.0%-0.6%
-3.7%-3.8%-6.9%0.2%
10.5%-8.3%-4.7%
6.4%23.3%1.5%
10.8%2.3%
-9.7%4.1%
AsiaChinaIndiaIndonesiaMalaysiaPhilippinesSouth Korea
4.1%28.0%
-15.3%7.0%
-29.7%1.1%
-1.2%18.6%1.0%
-0.2%(5)
2.7%-7.9%-0.8%-2.9%2.6%0.6%
-2.0%4.1%
4.3%25.3%-7.4%7.8%
-26.8%-1.5%-1.8%20.6%-3.1%
Middle East and AfricaAlgeriaEgyptIraqJordanKenyaMoroccoNigeriaSouth Africa
11.2%9.3%
17.0%
3.6%3.7%2.8%
7.6%5.6%
14.2%
Latin AmericaBrazilEcuador
Activity variation
vs. 2010Other effects (2)Volume effect
Cement – Analysis by Region and in Major Markets
as at June 30, 2011
-2.1%3.9%9.6%
-10.6%-34.1%
-1.2%-0.3%0.6%
-2.9%-3.1%
-0.9%4.2%9.0%
-7.7%-31.0%
Western EuropeFranceUnited KingdomSpainGreece
3.4%-1.2%4.6%Cement domestic markets
(1) Variance on like for like sales on domestic markets before elimination of sales between Divisions(2) Other effects: including price effects, product and customer mix effects(3) Volumes in the United States: -2.9%; in Canada: 1.7%(4) Out of which Pure price in the United States: -4.3%; in Canada: -0.6%(5) Out of which Pure price effect: -1.9%, and other effects: 1.7%

29
Cement: North America
(1) By destination
(2) Before elimination of inter divisional sales
� After a 6% increase in volumes in Q1, volumes were lower in Q2 due to poor weather and a subdued economic recovery for construction activity.
� Prices were lower than H1 2010 due to declines that occurred in the second half of 2010 in the United States, but incrementally higher versus Q4 2010. Solid prices in Canada.
� Tight cost control partly offset significant cost inflation.
-33%
-21%
-6%
-5%
lfl
nm
-42%
-2%
-2%
lfl
(15)
53
570
5.8
2010
6 Months
(31)
31
539
5.7
2011
nm
-42%
-5%
-2%
Variation
€m
2nd Quarter
-24%3242Current Operating Income
-21%6278EBITDA
-12%339385Sales (2)
-5%3.73.9Volumes (1)
Variation20112010MT

30
Cement: Western Europe
-27%
-23%
-8%
-8%
lfl
-8%
-6%
-2%
-1%
lfl
223
297
968
10.3
2010
6 Months
218
278
945
10.1
2011
-2%
-6%
-2%
-1%
Variation
€m
2nd Quarter
-22%145187Current Operating Income
-24%171224EBITDA
-8%513560Sales (2)
-8%5.56.0Volumes (1)
Variation20112010MT
6 months,2010
6 months,2011
(1) By destination
(2) Before elimination of inter divisional sales
(3) In accordance with IFRS 5, we have ceased to depreciate assets that should contribute to the joint-venture with
Tarmac UK from March 1st, 2011. Impact of 14 million euros YTD.
Operating margin
23.0% 23.1%
� Positive market trends continued in the UK and in France, although French volumes were impacted by labor disruptions in June.
� A difficult economic environment lowered sales in Greece and Spain.
� In a cost inflationary environment, margins were at 23.1% YTD, supported by tight cost control, the additional benefit of carbon credit sales and the lower depreciation charge in the UK(3).

31
Cement: Central And Eastern Europe
7%
7%
20%
13%
lfl
8%
6%
22%
16%
lfl
67
91
312
4.7
2010
6 Months
73
98
390
5.5
2011
9%
8%
25%
17%
Variation
€m
2nd Quarter
11%9384Current Operating Income
9%10596EBITDA
22%275225Sales (2)
15%3.83.4Volumes (1)
Variation20112010MT
6 months,2010
6 months,2011
(1) By destination
(2) Before elimination of inter divisional sales
Operating margin
21.5%18.7%
� Volumes bolstered by improving market trends in Poland and Russia.
� Price gains overall, notably in Russia, largely mitigating the rise in input costs.
� Current operating income improved 8% like for like as higher sales and cost cutting measures successfully offset cost inflation.

32
Cement: Middle East and Africa
-4%
-2%
6%
9%
lfl
-5%
-4%
2%
4%
lfl
472
605
1,780
20.1
2010
6 Months
416
554
1,794
22.2
2011
-12%
-8%
1%
10%
Variation
€m
2nd Quarter
-13%221255Current Operating
Income
-11%289323EBITDA
1%936930Sales (2)
17%11.910.2Volumes (1)
Variation20112010MT
6 months,2010
6 months,
2011
(1) By destination
(2) Before elimination of inter divisional sales
Operating margin
26.5% 23.2%
� Strong volumes growth in Q2, driven by solid market trends overall and improved plant performance (Nigeria and Algeria); Egypt returned to positive volumes.
� Prices were overall stable versus Q4 2010, but slightly lower than H1 2010.
� Higher costs and adverse foreign exchange offset the benefit of the higher volumes.

33
Cement: Latin America
2%
2%
13%
10%
lfl
-6%
-4%
11%
8%
lfl
78
92
298
3.6
2010
6 Months
91
112
427
5.0
2011
17%
22%
43%
39%
Variation
€m
2nd Quarter
11%4944Current Operating Income
16%5951EBITDA
36%220162Sales (2)
44%2.61.8Volumes (1)
Variation20112010MT
6 months,2010
6 months,2011
(1) By destination
(2) Before elimination of inter divisional sales
Operating margin
26.2%
21.3%
� Positive market trends in the region and new capacities in Brazil drove the significant increase in volumes.
� Prices continued to be well oriented.
� Higher sales and strict cost control offset the significant impact of higher variable costs.

34
Cement: Asia
-25%
-16%
6%
9%
lfl
-37%
-25%
2%
6%
lfl
200
270
1,035
20.9
2010
6 Months
124
200
1,039
22.1
2011
-38%
-26%
-
6%
Variation
€m
2nd Quarter
-29%81114Current Operating
Income
-22%118151EBITDA
-2%551564Sales (2)
8%12.011.1Volumes (1)
Variation20112010MT
6 months,
20106 months,
2011
(1) By destination
(2) Before elimination of inter divisional sales
Operating margin
19.3%
11.9%
� Volumes were up 9% in the second quarter, bolstered by solid market trends in China, Indonesia, Malaysia and India, while delayed governmental projects continued to lower volumes in the Philippines.
� Overall, situation for prices improved sequentially from Q1 2011, but earnings were still impacted by cost inflation and lower average prices versus H1 2010.

Cim
ent
-G
ranula
ts e
t B
éto
n -
Bré
sil,
centr
e a
dm
inis
tratif gouvern
em
enta
l de l'é
tat
de M
inas G
era
is III. Other informationIII. Other information
Aggregates & Concrete Division by Product Line and Geographical zone
Aggregates & Concrete Division by Product Line and Geographical zone

36
Pure Aggregates
� Volumes decreased 6% like for like in the second quarter, with lower volumes in North America and in the UK, while France was stable.
� Prices were well oriented overall, with price gains in most of our regions.
� Higher sales and continuous tight cost control only partially offset significant cost inflation.
(1) Before elimination of inter divisional sales
-13%
-10%
1%
-6%
lfl
-13%
-7%
5%
-1%
lfl
-3%
-9%
-1%
-5%
Variation
17%
-5%
6%
-1%
Variation
35
110
916
86.9
2010
6 Months
41
105
970
86.1
2011
€m
2nd Quarter
6769Current Operating Income
98108EBITDA
569577Sales (1)
51.454.3Volumes
20112010MT

37
Ready-Mix Concrete
(1) Before elimination of inter divisional sales
-45%
-24%
-
-3%
lfl
nm
-10%
3%
-
lfl
-41%
-21%
-2%
-
Variation
nm
-9%
2%
2%
Variation
3
46
1,366
16.5
2010
6 Months
0
42
1,397
16.8
2011
€m
2nd Quarter
1322Current Operating
Income
3443EBITDA
762781Sales (1)
9.29.2Volumes
20112010Mm3
� Volumes declined 3% like for like in the second quarter, with improving volumes in France and in the United States partially offsetting lower volumes in Greece and Spain.
� Prices were robust in most our regions.
� Price increases and tight cost control only partially offset higher distribution costs.

38
YTD Sales at June 30, 2011Like for Like Sales Variance Analysis by Region and in Major Markets
2.7%13.0%
6.7%1.4%
-6.8%
16.8%
2.5%1.3%
4.2%-1.5%
2.3%
8.7%
0.2%11.7%
2.5%2.9%
-9.1%
8.1%
Ready-mix ConcreteFrance
United KingdomNorth America
South Africa
India
Activity variation vs. 2010
Other effects*Volume effectAggregates & Concrete
5.3%9.0%
3.9%
-0.7%
-16.6%
6.3%2.4%
-0.1%
3.4%
3.4%
-1.0%6.6%
4.0%
-4.1%
-20.0%
Pure AggregatesFrance
United Kingdom
North America
South Africa
* Other effects: including price effects, product and customer mix effects

39
Aggregates & Concrete: Additional Information by Geographical Zone
(1) By destination
(2) Before elimination of inter divisional sales by origin
-25%
3%
5%
4%
-
-1%
Var like f/ like
38
(39)24
23
1,366599
342425
916408
373
135
2,321
16.56.53.1
6.9
86.931.4
40.6
14.9
2010
6 Months
47
(33)15
29
1,397617
341439
970431
361
178
2,401
16.86.53.2
7.1
86.131.0
38.5
16.6
2011
Current Operating Income (millions of €)
-762320
207235
781332
217232
Of which Ready-mix TotalWestern Europe
North AmericaOther countries
-18%8795Total Aggregates & Concrete
2nd Quarter
Var like f/ like
20112010
Volumes (1)
-6%51.416.1
25.7
9.6
54.317.6
28.1
8.6
Pure Aggregates (millions of tonnes)Of which Western Europe
North America
Other countries
-3%9.23.42.0
3.8
9.23.62.0
3.6
Ready-mix (millions of m3)
Of which Western EuropeNorth America
Other countries
Sales (2) (millions of €)
1%569228
238
103
577233
262
82
Of which Pure Aggregates TotalWestern Europe
North America
Other countries
1%1,3751,403Total Aggregates & Concrete
34
4013
41
3717
Of which Western Europe
North AmericaOther countries
Plä
tre-
Afr
ique d
u S
ud,
imm
euble
de
Johan
nesb
urg
IV. Other informationIV. Other information
Gypsum division
by Geographical zone
Gypsum division
by Geographical zone
41
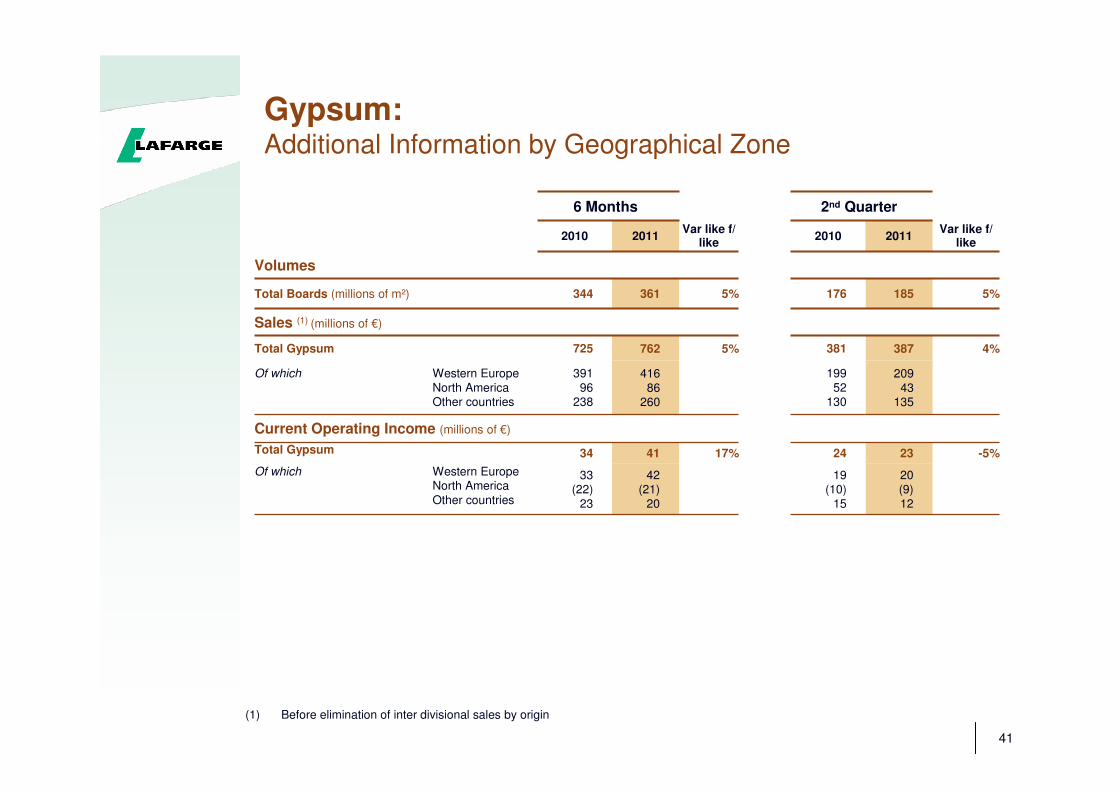
Gypsum: Additional Information by Geographical Zone
(1) Before elimination of inter divisional sales by origin
17%
5%
5%
Var like f/ like
33(22)
23
34
391
96238
725
344
2010
6 Months
42(21)
20
41
416
86260
762
361
2011
Current Operating Income (millions of €)
-5%2324Total Gypsum
2nd Quarter
Var like f/ like
20112010
Volumes
5%185176Total Boards (millions of m²)
Sales (1) (millions of €)
209
43135
199
52130
Of which Western Europe
North AmericaOther countries
4%387381Total Gypsum
20(9)
12
19(10)
15
Of which Western EuropeNorth America
Other countries

Gra
nula
ts e
t B
éto
n -
Bré
sil,
Musée d
'Art
Conte
mpora
in V. Other InformationV. Other Information
Income statementIncome statement

43
Other Income (Expenses)
(110)
(26)
(49)
(80)
45
2010
6 Months
(50)
(34)
(16)
(25)
25
2011
(23)(5)Others
2nd Quarter
(23)(69)Total
(7)(30)Restructuring
(13)(59)Impairment of assets
2025Net gains (losses) on disposals
20112010€m

44
Finance Costs and average interest rate
AverageSpot
34%
66%
€17.0 Bn
December 31, 2010
3.1%
6.7%
5.5%
Interest rate
5.3% 5.6%5.8%€16.0 BnTotal gross debt (2)
Interest rateAverage interest rate
36%
64%
June 30, 2011
3.4%
7.1%
Spot Average
Of which: Fixed rate
Floating rate
(1) Including gain on disposal of Cimpor for €160 million(2) Excluding puts: € 0.3 Bn as at June 30, 2011 and December 31, 2010
(283)
123 (1)
(34)
(372)
2010
6 Months
(410)
(33)
42
(419)
2011
2nd Quarter
(225)(200)Total
(20)7Others
8(13)Foreign exchange
(213)(194)Financial charges on net debt
20112010€m
Gra
nula
ts e
t B
éto
n -
Bré
sil,
Musée d
'Art
Conte
mpora
in VI. Other InformationVI. Other Information
Statement of Financial Position (1) & Cash Flow StatementStatement of Financial Position (1) & Cash Flow Statement
(1) Former Balance sheet

46
Statement of Financial position
1,360-Net assets held for sale (1)
€mDec.
31, 2010
June
30, 2011
Capital Employed
Out of which:
Goodwill
Prop, plant & equip.
Working Capital
Other
33,762
14,327
17,912
440
1,083
31,122
13,027
16,161
917
1,017
Financial assets 863 743
Total 34,625 33,225
€mDec.
31, 2010
June
30, 2011
Equity
Out of which:
Shareholders’ equity
Non controlling
interests
18,224
16,144
2,080
16,827
14,999
1,828
Net debt 13,993 14,260
Provisions 2,408 2,138
Total 34,625 33,225
(1) Following the announcement of the agreement between Lafarge and Anglo American plc to combine their cement, aggregates, ready-mixed concrete, and asphalt & contracting businesses in the United Kingdom, and in accordance with IFRS 5, Lafarge UK ‘s assets and liabilities that will contribute to this joint venture have been grouped since February 18, 2011 in the consolidated statement of financial position on the lines “ Assets held for sale ” and “ Liabilities directly associated with assets held for sale”, respectively. The completion of this transaction is conditional upon regulatory approvals.

47
Investments and Divestments
105
718
52
550
116
2010
6 Months
106
587
89
368
130
2011
2nd Quarter
285334Capital expenditure
173233Development capital expenditures
3530Acquisitions (1)
20112010€m
9569Divestments (2)
7771Sustaining capital expenditures
(1) Including debt acquired and the acquisitions of ownership interests with no gain of control.In H1 2011, the acquisitions of ownership interests with no gain of control represented €51m, excluding a €51 million put, already recorded as debt, that was exercised in the first quarter
(2) Including debt disposed of

48
CNY
€bn 0.4
3%
CAD
€bn 0.2
1%
USD
€bn 4.0
25%
EUR
€bn 9.5
59%
GBP
€bn 0.7
4%
Other
€bn 1.2
8%
Gross Debt (1) by Currency and by Source of Financing as at June 30, 2011
Split by currency
(1) Excluding puts & derivatives : €0.3 bn
Split by source of financing
Commercial
paper
1%
€bn 0.1
Notes /
Private
placements
4%
€bn 0.7
Debentures
65%
€bn 10.3
Banks and
others
30%
€bn 4.9
Total Gross Debt (1): € 16.0Bn

4949
Key definitions
Volumes Volumes are shown by destination
Sales by DivisionSales by Division are disclosed by origin, and before elimination of inter divisional sales
EBITDACurrent Operating Income before depreciation and amortization on tangible and intangible assets
Current Operating IncomeOperating Income before “capital gains, impairment, restructuring and other”
Operating margin Current Operating Income / Sales
Free Cash FlowNet operating cash generated by operations less sustaining capital expenditures
Like for Like variationLike for Like variation corresponds to the variation at constant scope and exchange rates
Strict Working Capital Trade receivables plus inventories less trade payables
Strict Working Capital in days sales
Strict Working Capital end of N * 90 daysSales of the last quarter