2011 Five-Year Maintenance Plan - Caltrans
16
California Department of Transportation 2011 Five-Year Maintenance Plan January 31, 2011
Transcript of 2011 Five-Year Maintenance Plan - Caltrans
California Department of Transportation
2011 Five-Year Maintenance Plan
January 31 2011
2011 Five-Year Maintenance Plan
CONTENTS
REQUIREMENTS OF STREETS AND HIGHWAYS CODE SECTION 1646 iii
EXECUTIVE SUMMARY iv
1HE MAINTENANCE PROGRAM 1
Pavement Maintenance 3 Bridge Maintenance 4 DrainageCulvert Maintenance 5 Maintenance Pro grain Budget Model 6
ANALYSIS OF ALTERNATIVE LEVELS OF MAINTENANCE INVESTMENT 8
Level ofInvestment -Baseline Funding 8 Level of Investment 2-Reduce Backlog (Ten Years) 9 Level ofInvestment 3-Eliminate Backlog (Five Years) 10
RECOMMENDATION ON LEVEL OF INVESTMENT 11
APPENDIX STREETS AND HIGHWAYS CODE SECTION 1646 12
ii
2011 Five-YearMaintenance Plan
REQUIREMENTS OF STREETS AND HIGHWAYS CODE SECTION 1646
Streets and Highways Code section 1646 requires the California Department of Transportation (Caltrans) to prepare a five-year maintenance plan that addresses the maintenance needs ofthe State Highway System Section l646 also requires Caltrans to attempt to balance the resources between the ten-year rehabilitation plan and the five-year maintenance plan
Section l646 requires the five-year maintenance plan to include the following
bull Only maintenance activities that~ ifthe activities were not performed could result in increased State Highway Operation and Protection Program (SHOPP) costs in the future
bull Strategies specific activities and funding to reduce or prevent backlog over the five years ofthe maintenance plan
bull Specific goals and quantifiable accomplishments
bull Cost control and efficiency strategies
bull Cost estimates for the five years of the maintenance plan
bull SHOPP cost avoidance from implementation of the maintenance plan
bull A budget model in line with the requirements ofthis legislation
The full text of section 1646 is appended
iii
liJtltlalwmiddot
2011 Five-Year Maintenance Plan
EXECUTIVE SUMMARY
The 20 II Five-Year Maintenance Plan (20 ll Maintenance Plan) as required by statute addresses the maintenance needs of the State Highway System for maintenance activities that if the activities were not performed could result in increased SHOPP costs in the future Caltrans accomplished the pavement objectives ofthe 2009 Maintenance Plan but could not keep up with the pace ofincreased bridge and culvert needs because ofan increased repair backlog caused by an aging infrastructure
The State Highway System includes approximately 50000 lane miles ofpavement Cal trans met the goal for pavement maintenance to repair 2 700 lane miles annually The 2009 Maintenance Plan was accomplished by reducing the backlog by 25 percent from 594 I lane miles in fiscal year (FY) 2008-2009 to 4463 lane miles in FY 2010-2011 aided by an increased authorization of$57 million in American Reinvestment and Recovery Act ftmding
The State bridge inventory includes approximately 12900 bridges and the 2009 Maintenance Plan identified an annual goal for bridge maintenance to reduce the bridge backlog to 10 percent of the total inventory or approximately 1290 bridges Unfortunately the actual backlogged bridge maintenance contract work had lagged the projections estimated in the 2009 Maintenance Plan by approximately I 2 percent because ofa higher than expected increase in bridge repair needs outpacing the contract work performed However the Bridge Program recorded a 30 percent reduction in new SHOPP recommendations from historic levels
The State Highway System includes an estimated 205000 culverts and the 2009 Maintenance Plan had an annual goal to repair 174 culverts and perform 14000 culvert assessments Because of several external factors such as higher than expected repair needs furlough impacts the State Budget impasse and deficit and extreme difficulty in assessing various culvert locations Caltrans was unable to meet the 2009 Maintenance Plan culvert goals However based on a two-year average Caltrans was able to accomplish 95 percent ofthe annual culvert repairs and 61 percent ofthe annual culvert assessments identified in the 2009 Maintenance Plan
The 2011 Maintenance Plan is reltommending Caltrans funding level remain Wlchanged at $4121 million a year for pavement bridge and drainage major maintenance Overall recent decreasing material and energy costs and a declining California economy have increased the nwnber ofbidders for department work thereby increasing the purchasing power ofresources currently needed to deliver the pavement bridge and drainage contracts It is expected that this trend will continue over the next few years which should result in more preventive maintenance work being accomplished The maintenance strategies identified in this 2011 Maintenance Plan will not reduce current SHOPP needs for pavement bridges and drainage culverts However the 20ll Maintenance Plan identifies specific strategies that will slow increases in the SHOPP by delaying the need for rehabilitation reconstruction or replacement Preventive maintenance services will be provided by a combination ofcontract services and work done by State forces
iv
2011 FivbullYear Maintenance Plan
THE MAINTENANCE PROGRAM
Section 6 ofSenate Bill1098 Chapter 212 Statutes of2004 amended Streets and Highways Code section 1646 In 2005 the Governor and the Legislature approved the inaugural Maintenance Plan for Caltrans as a means ofensuring the reliability ofCalifornias State Highway System by completing critically needed preventive maintenance work The 2005 Maintenance Plan included baseline funding of$148 million beginning in July 2006 for preventive maintenance work associated with pavement bridges and drainage systems on the more than 50000 lane miles of the State Highway System The governing administration and the Legislature subsequently augmented the Maintenance Program by $138 millio~ ofwhich $128 million was redirected from the SHOPP and $10 million from the approval ofa Budget Change Proposal in FY 2006-2007 This additional funding brought the level of investment to a total of $286 million for the 2005 Maintenance Plan
The 2007 Maintenance Plan recommended an additional increase of$1471 million As a result SHOPP funding was redirected in FY 2007-2008 to augment the Maintenance Program by $85 million for pavement and $411 million for bridges consistent with the recommendation This funding was specifically directed to preventive maintenance-type work bringing the total annual investment of the 2007 Maintenance Plan to $4121 million The 2009 Maintenance Plan did not recommend an increase in funding from the 2007 Maintenance Plan however a total of$57 million ofAmerican Recovery and Reinvestment Act one-time funding was authorized from FY 2008-2009 through FY 2009-2010
Currently the baseline annual funding is $234 million for pavement maintenance $1551 million for bridge maintenance and $23 million for drainage maintenance By sustaining the current funding level for pavement and structures the backlog will continue to be reduced over the next ten to thirteen years as planned Until the inventory is more complete and a large percentage of the needed rehabilitation work is identified no additional funding for preventive drainage work will be requested It is expected that the SHOPP cost avoidance benefit will continue for bridges but at a slower rate The total cost avoidance benefit estimate for the five years ofthe 2011 Maintenance Plan is $206 billion
Preventive maintenance is the most cost-effective means ofprotecting the States infrastructure investment The 20 11 Maintenance Plan prevents the deterioration and extends the life ofpavement bridge and drainage culvert inventory that is in fair or good condition As shown in Table 1 the average cost for a SHOPP roadway rehabilitation project to treat one lane mile ofminor pavement damage in FY 2008--2009 was $402000 a decrease in the average cost reported in the 2009 Maintenance Plan The average cost ofpavement maintenance was $67000 a lane mile Thus preventive maintenance results in a cost-benefit ratio ofabout 61 greater than the least cost category ofSHOPP projects Similarly the benefit ratio for bridge maintenance is 121 ($720000 for minor damage rehabilitation versus $60000 for preventive maintenance) and 51 for drainage maintenance ($115000 for minor damage rehabilitation versus $27000 for preventive maintenance) Table 1 lists these cost-benefit ratios and the following chart displays the preventive maintenance cost effectiveness
1
2011 Fiv~Year Maintenance Plan
Table 1
COST-BENEFIT OF PREVENTIVE MAINTENANCE
FY 2008-2009 Capital
Construction Costs Ooly
Cost of
Rehabilitation in Dollars
Cost of Preventive
Maintenance in Dollars
Unit of
Measure Cost-Benefit
Ratio
Pavement 402000 67000 Lane mile 61 Bridge 720000 60000 Bridge 121 Drainage ll5000 27000 Culvert 51
Cost Effectiveness Chart
Good
Failed
Ptlaw SHOPf Behablllalonaoendlng PavementS$ ~ Bridge $12 ~ Ortlnage S6 ~
___ Pmttnnt Thicblr ~ys ($402CJ001afle nlle)r--____ lldlluF1x joints and bearings ($72000MJridge)
----w---=---- IDinUIMinorrepairs to cuhlerts ($115000CMrt)
DtlawSHOPP BICOIIttuttion orRtolaccDIDI oRtodlng Pavement $13 ~ Drtlnage $28 ~ Bridge $100 -
PawlllftMapr~ ($904000tlnetrie -------- ldIAIgtMajor bridge rellaliltation ($6Mnlridge)
~Rellatiltalion lile to faiklre ($S5000fllatolert)
~---------------------------------------
2
2011 Five-YearMaintenance Plan
PAVEMENT MAINTENANCE
The State Highway System includes approximately 50000 Jane miles ofpavement with a replacement value ofmore than $12 trillion Approximately 12988 lane miles (26 percent) of the State Highway System have surpassed their service life of ten years and are in need of major rehabilitation
At the beginning ofFY 2008 2009 Caltrans reported a backlog of5941 lane miles of pavement maintenance At the beginning ofFY 2010-2011 the backlog was reduced to 4463 lane miles Caltrans was able to achieve a 25 percent reduction in backlogged lane miles from FY 2008-2009 to FY 2010-2011 With current funding levels the estimated backlog should continue to be reduced The 2011 Maintenance Plan will reduce the backlog oflane miles to 772 by FY 2020 2021 Cal transs long-tenn goal is to reduce the backlog oflane miles to approximately 1 percent of the total pavement inventory or 500 lane miles The 500 lane miles are the annual recurring distress ofthe pavement network
The 2009 Maintenance Plan established a pavement maintenance goal of 2 700 lane miles to be delivered each year Because ofdecreases in project construction costs and the increased number of bidders for each project Caltrans has been able to meet the goals of the 2009 Maintenance Plan
In FY 2008middot 2009 and FY 2009middot 20I 0 funds were increased by a total of$57 million from the one-time American Recovery and Reinvestment Act funding This additional federal funding allowed Caltrans to deliver 3539lane miles in FY 2008-2009 and 3446 lane miles in FY 2009-2010
In this current construction-bidding environment and at the current funding level of $234 million Caltrans is projecting 2700 lane miles to be treated annually in FY 2010-2011 and for the next few years
Currently Caltrans is incorporating the latest technology for data collection One technology is ground-penetrating radar which provides a snapshot ofthe layers underneath the pavement surface and will provide pavement structure inventory data including the thickness of the pavement layers for the entire State Highway System Another innovation is the automated pavement condition survey vehicle that will travel at highway speeds and collect pavement distress data at the pavement surface using lasers
In late 2010 a pavement management system contract will purchase commercial off-the-shelf software called PaveM This software will support a strong pavement management system to forecast pavement needs and detennine service life In addition Caltrans will continue to develop specifications for new products and applications that reduce costs and improve pavement perfonnance
3
2011 Five-Year Maintenance Plan
BRIDGE MAINTENANCE
Caltranss structural assets include more than 12t900 State highway bridges Caltrans objective is to manage the bridge inventory safely and economically to limit operational restrictions and prevent sudden closure or collapse Major structural rehabilitation caused by lack ofpreventive maintenance is more costly than preventive maintenance and has the potential to cause significant long-term disruptions to mobility
Bridge maintenance needs are identified during regularly scheduled bridge inspections mandated by federal regulations Bridge maintenance needs fall into two general categories State forces and major maintenance contract work Bridge needs identified for maintenance bridge crews or major maintenance contracts are considered backlogged two years after the recommendation is made by the inspector Maintenance bridge crew needs have increased slightly over the past five years on work for smaller repairs that require immediate attention and other minor maintenance work Maintenance bridge crew needs are approximately $15 million to $1 7 million ofthe backlog Bridge maintenance needs that are larger in size or complexity are packaged together into major maintenance contracts that are awarded to construction companies to perform
At the beginning ofFY 2008-2009 Caltrans reported 2713 bridges with backlogged major maintenance contract needs Caltrans treated 805 bridges during FY 2008--2009 and 874 bridges during FY 2009-2010 At the begiruring ofFY 2010-2011 the number ofbridges with backlogged major maintenance contract needs was 2575 approximately 20 percent ofthe inventory Caltranss goal is to reduce the number ofbridges with backlogged major maintenance contract needs to approximately I 0 percent ofthe inventory or 1 290 bridges
The recent backlogged major maintenance contract needs are trending downward However the backlogged major maintenance contract needs are lagging projections estimated in the 2009 Maintenance Plan by approximately 12 percent
The 2011 Maintenance Plan identifies more than $441 million in backlogged major maintenance contract needs for bridges which equates to approximately 97 percent ofall bridge maintenance needs
The rate ofbacklog reduction is a function ofproject delivery on the positive side and the rate of new backlog needs being identified on the negative side Since the 2005 Maintenance Plan the average number ofnew bridges becoming backlogged annually has increased by 21 percent The increased rate ofneeds is attributable to the general aging of the entire bridge network in California The increase in needs identification has been partially offset by decreases in project construction costs and the increased number of bidders for each project At the current construction authorization levels it is expected to take approximately thirteen years to achieve the desired backlog levels Caltrans is optimistic that the projected reductions identified in the 20 II Maintenance Plan will be realized
4
2011 Five-Year Maintenance Plan
The timely preventive maintenance made possible by authorized funding in previous maintenance plans has begun to slow the progression of bridges requiring major rehabilitation in the SHOPP
For FY 2008 2009 the Bridge Program recorded a 30 percent reduction in new SHOPP recommendations from historic levels This decrease in SHOPP recommendations is a welcome trend and demonstrates that SHOPP cost avoidance objectives in previous plans are being realized
Caltrans is pursuing numerous activities to maximize efficiencies and control the costs of bridge maintenance Among these are the uses of new materials that last longer and are easier to apply such as epoxy paints polyester concretes corrosion-resistant rebar and design details In addition Caltrans is implementing policies to ensure that new projects are constructed with cost-effective and easily maintainable elements as well as reviewing the activities ofother state Departments ofTransportation on an ongoing basis to ensure that the best business practices are employed in California
DRAINAGECULVERT MAINTENANCE
The State Highway System includes an estimated 205000 culverts These culverts drain the States highways serving as conduits for streams drainage channels and other waterways to flow under the highways Culvert damage or failure can seriously damage the roadway create the need for extensive repairs and threaten the mobility and safety of the traveling public The 2009 Maintenance Plan provided for continuation ofa proactive inspection program to identify damaged or failed culverts Management procedures have been developed to measure the health ofdrainage systems prioritize potential culvert projects based on condition cost and traveler delay and track accomplishments and delivery schedules for maintenance work
At the beginning ofFY 2008-2009 an estimated 9614 culverts with backlogged preventive maintenance needs were identified During FY 2008-2009 178 culverts were repaired under the Culvert Inspection Program In FY 2009-2010 the target repair of 174 culverts was projected with an estimated assessment rate of 14000 culverts A total of 156 culverts were repaired and more than 6000 culverts were assessed in FY 2009-201 0 The drop in assessment rate is attributed to several factors including limited resource availability due to the State Furlough Program and reductions in the travel expense budget to conduct site visits for several months due to the State Budget impasse At the beginning ofFY 2010-2011 the culvert backlog requiring preventive repairs was estimated to be 13185 and it was projected 174 culverts would need repair
About 36 percent ofapproximately 58000 culverts assessed to date require some form of maintenance With an increase of 12 percent from the previous year the corrective maintenance category at 23 percent is the fastest growing segment of the culvert inventory Based on the target rate of 14000 assessments a year and the estimated 23 percent of assessed culvert inventory requiring preventive work an additional 3220 culverts are estimated to be identified for corrective maintenance work each year Assuming a 23 percent rate of inventory requiring
5
2011 Five-Year Maintenance Plan
preventive work remains consistent for the entire inventory of205000 culverts an additional investment of$119 million will provide sufficient funds to reduce the inventory by 3314 culverts a year over a ten-year period An additional investment of$244 million will provide sufficient funds to reduce the same amotmt ofbacklog in a five-year period by 6628 culverts a year Culvert repair and replacement projects typically require multiyear environmental mitigation documents In addition right-of-way clearance must be obtained prior to entering private property These right-of-way activities require long lead times that typically include the purchase ofeasements andor titles in fees
Approximately 28 percent of the total State drainage system has been inspected to date Until the inventory is more complete and a large percentage ofrequired rehabilitation work is identified no additional funding for preventive drainage work will be requested The 2011 Maintenance Plan is recommending a funding level of$23 million annually to inspect assess and address culvert preventive maintenance and repairs This funding level slightly reduces the rate of backlog increase but in no way eliminates it Preventive maintenance for culverts is perfonned by a combination ofState forces and major maintenance contract work
The Culvert Inspection Program will continue to improve understanding ofthe circumstances leading to culvert failure and that knowledge will potentially lead to changes in design specifications construction methods and materials for improved culvert performance
Management procedures have been developed to measure the health ofdrainage systems prioritize potential culvert projects based on condition cost and traveler delay (measured both by traffic volume and detour length) and track accomplishments and delivery schedules of maintenance work In addition the use ofgeographic information systems technology will assist in reevaluating watersheds to ensure that culverts are meeting current design standards and will improve workforce expertise and the ability for quick response to emergencies involving culverts
MAINTENANCE PROGRAM BUDGET MODEL
The Maintenance Program budget model was developed to enhance budget management capabilities on an annual basis The performance-based model uses a combination ofhistorical expenditures Level ofService (LOS) performance measures and inventory data to project future resource needs with performance-level expectations for the entire State Highway System While the budget model does include all resources the model is used primarily to detennine a perfonnance-based budget for field maintenance activities
Historically the budget model grouped Caltrans twelve districts into sets of comparable units (using geographic population and traffic volume characteristics) Current versions ofthe model have shifted the focus from a district-level analysis to a route-level analysis by grouping all routes based on traffic volumes and geographic locations By creating a route-level analysis tool the budget model provides detailed comparative analysis for detennining relationships between performance and resource needs for each highway inventory unit which creates standardized allocation and efficiency rates for each route
6
lllttrJvulbull
2011 FlvbullYear Maintenance Plan
The budget model is used
bull To measure the direct relation between funding and LOS and the effects ofchanges to either
bull To measure an efficiency curve at the State route level for statewide comparisons
bull To measure a standardized allocation process for inventory items at a State route level for life-cycle cost and asset management practices
bull To assist decision-makers in detennining the best course ofaction relative to budgetary and performance issues
bull To predict funding needs based on project delivery actions and decisions
7
2011 Five-Year Maintenance Plan
ANALYSIS OF ALTERNATIVE LEVELS OF MAINTENANCE INVESTMENT
LEVEL OF INVESTMENT 1-BASELINE FUNDING
The current baseline annuaJ funding level is $4121 million as shown in Table 2 At the beginning ofFY 2008-2009 the backlog was 5941 pavement lane miles 2675 bridges and 9614 culverts It was estimated that the backlog would be reduced to 4463 lane miles by the beginning ofFY 2010-2011 and 2541 bridges by the beginning ofFY 2009-2010 The pavement backlog in FY 2020--2021 is estimated to be 772 lane miles with the current funding The extent of the drainage backlog as shown is projected until the inventory is more complete and a large percentage of the needed rehabilitation work is identified
Table2
LEVEL OF INVESTMENT l~URRENT BASELINE FUNDING
AnnuaiPYs
Annual Cost in Million Dollars
Annaal Accomplishments
Average Annual
Change in Backlog
Future SHOPPCost
Avoidance in Million
Dollars
Pavement 287 2340 2 700 lane miles 4091ane-mile decrease
1404
Bridge2 361 1551 689 bridges 92 decrease 1564 Drainage3 188 230 174 culverts
14000 inspections 3220 increase
115
Total 836 4121 - -shy 3083
1 Pavement costs include personal services and major maintename contracts Tbe current support funding is approximately 287 PYs (personnel years) and $30 million a year Annual costs include $204 million in major maintenance contracts
2 Bridge saructural resources include $925 mHlion in major maintenance contracts $583 miJiion and 361 PYs in personal services and operating expenses in support ofcontract delivery and $43 million in Architectural and Engineering contracts (PYEs )
3 Drainage costs include S125 million and 1345 PYs in State forces for maintenance and associated equipment and materials $7 million and I 55 PYs in major maintenance contract dollars and support and $35 million and 38 PYs for the Culvert Inspection Program
8
2011 Five-Year Maintenance Plan
LEVEL OF INVESTMENT 2--REDUCE BACKLOG (TEN YEARS)
As shown in Table 3 with an additional $2089 million added in FY 2012-2013 to increase the annual funding level to $621 million the backlog ofmaintenance needs will be reduced for pavement and bridges while reducing the known drainage backlog to zero at the end of the ten years This increase in investment of$86 million for pavement and $39 million for bridges will reduce the pavement baeldog annually by 604 lane miles and the bridge backlog by 126 bridges The pavement backlog in FY2020-2021 is estimated to be 56llane miles close to the 1 percent goal of the Pavement Program The increase in investment of$119 million for drainage will reduce the culvert backlog by 3314 culverts a year
Table 3
LEVEL OF INVESTMENT 2-REDUCE BACKLOG (TEN YEARS)
Aoaual PYs
Annual Cost in Million Dollars
Annual Accomplishments
Average Annual
Change in Backlog
Future SHOPPCost
Avoidaolaquo in Million Dollars
Pavement1 375 320 3900 lane miles 604 lane-mile decrease
1920
Bridge2 361 159 723 bridges 126 decrease 1641 Drainage3 452 142 3314 culverts
14000 inspections 3314 decrease
710
Total 1188 621 -shy --shy 4271
1Pavement costs include persooaJ services and major maintenance contracts The proposed support funding is approximately 37 PYs and $40 million a year Annual costs include $280 million in major maintenance contracts
2 Bridge costs include State forces for maintenance and associated equipment and materials inspection contract dollars and support Increased resources are shown as persoiUlel year equivalents (PYEs) and are not included in the PYs Funding includes $964 million in major maintenance contracts S583 million and 361 PYs in support costs and $43 million in Architectural and Engineering contracts (PYEs)
3 Drainage costs includes $125 million and 1345 PYs in State forces for maintenance and associated equipment and materials $126 million and 2795 PYs for major maintenance contract dollars and support and $35 million and 38 PYs fur the Culvert Inspection Program
9
2011 Five-Year Maintenance Plan
LEVEL OF INVESTMENT 3-EUMINATE BACKLOG (FIVE YEARS)
As shown in Table 4 with an additional $5159 million added to increase annual maintenance funding to more than $928 million all existing backlog ofmaintenance work will be eliminated over a five-year period Future SHOPP needs wilJ be significantly less than under either ofthe previously identified levels ofinvestment When funds are available starting in FY2012-20I3 the backlog ofpavement and bridge projects wiJl be reduced to zero after five years The pavement bacldog in FY2015-20l6 is estimated to be 510 lane miles with the increased funding effectively eliminating the pavement backlog (at that point annual maintenance funding could be decreased) At the projected rate of 14000 inspections a year there still will be 63000 culverts remaining in the inventory to be inspected at the end ofthe five years with an estimated 3220 culverts still needing repair work each year
Table 4
LEVEL OF INVESTMENT 3-ELIMINATE BACKLOG (FIVE YEARS)
Annual PVs
AaaaaiCost in Million
Dollars Annual
Accomplishments
Average Annual
Decrease in Backlog
Future SBOPPCost
Avoidance in Million
Dollars
Pavernent1 536 460 5600 lane miles 655 lane-mile decrease
2736
Bridge2 361 201 amp49 bridges 252 decrease 1928
Drainage3 731 267 6628 culverts 14000 inspections
6628 decrease
1335
Total 1628 928 -shy --shy 5999
1 Pavement costs include personal services and major maintenance contracts The proposed support funding is approximately 536 PYs and $60 million a year Annual costs include $400 million in major maintenance contracts
2 Bridge costs include State repair crews material$ equipment rental contract dollars and support Increased resources are shown as PYEs and are not included in the PYs Funding includes $ J201 million in major maintenance contracts $583 million and 361 PYs in support costs and $226 million inArchitectw-al and Engineering contracts (PYEs)
3 Drainage costs include $125 million and 1345 PYs in State forces for maintenance and associated equipment and materials $251 million and 5 585 PYs for major maintenance contract dollars and support and $35 million and 38 PYs for the Culvert lnspection Program
10
2011 Five-Year Maintenance Plan
RECOMMENDATION ON LEVEL OF INVESTMENT
In approving the 20 II Maintenance Plan the Governor and the Legislature recognize the importance ofcompleting critically needed maintenance work to the States infrastructure thus protecting Californias Wlique quality of life and ensuring its economic competitiveness in the global marketplace Overall recent decreases in material and energy costs and a declining California economy have increased the number ofbidders for department work thereby increasing the purchasing power ofcurrently identified resources needed to deliver the 2009 Maintenance Plan It is expected that this trend will continue over the next few years
Therefore Caltrans recommends continuing the Level oflnvestment l with no additional resources requested at this time The total cost estimate for the five years of the 2011 Maintenance Plan is $206 billion
The best use oftransportation resources demands a balanced mix ofpreventive maintenance and rehabilitation or replacement This balance is consistent and supports the principles ofGo California to ensure the wise investment ofexisting funding with a vision of improving mobility and safety
11
2011 Five-Year Maintenance Plan
APPENDIX
STREETS AND HIGHWAYS CODE SECTION 1646
1646(a) The department shall prepare a IO~year state rehabilitation plan for the rehabilitation and reconstruction or the combination thereof by the State Highway Operation and Protection Program ofall state highways and bridges owned by the state The plan shall identify all rehabilitation needs for the 10-year period beginning on July I 1998 and ending on June 30 2008 and shall include a schedule ofimprovements to complete all needed rehabilitation during the life of the plan not later than June 30 2008 The plan shall be updated every two years beginning in 2000 The plan shall include specific milestones and quantifiable accomplishments such as miles ofhighways to be repaved and number of bridges to be retrofitted The plan shall contain strategies to control cost and improve the efficiency of the program and include a cost estimate for at least the first five years of the program
(b) The department shall prepare a five-year maintenance plan that addresses the maintenance needs of the state highway system The plan shall be updated every two years concurrent with the rehabilitation plan described in subdivision (a) The maintenance plan shall include only maintenance activities that ifthe activities were not performed could result in increased State Highway Operation and Protection Program costs in the future These activities may include roadway structural and drainage maintenance The maintenance plan shall identify any existing backlog in these maintenance activities and shall recommend a strategy specific activities and an associated funding level to reduce or prevent any backlog during the plans five-year period The maintenance plan shall include specific goals and quantifiable accomplishments such as lane-miles ofhighway to be repaved and the number ofbridge decks to be sealed The maintenance plan shall contain strategies to control cost and improve the efficiency of these maintenance activities and include a cost estimate for the five years ofthe plan
(c) The rehabilitation plan and the maintenance plan shall attempt to balance resowces between State Highway Operation and Protection Program activities and maintenance activities in order to achieve identified milestones and goals at the lowest possible long-term total cost If the maintenance plan recommends increases in maintenance spending it shall identify projected future State Highway Operation and Protection Program costs that would be avoided by increasing maintenance spending The departments maintenance division shall develop a budget model that allows it to achieve the requirements ofthis subdivision
(d) The rehabilitation plan shall be submitted to the commission for review and comments not later than January 31 ofeach odd-numbered year and shall be transmitted to the Governor and the Legislature not later than May I ofeach odd-numbered year The maintenance plan shall be transmitted to the Governor the Legislature and the commission not later than January 31 ofeach odd-numbered year
(e) The rehabilitation plan and the maintenance plan shall be the basis for the departments budget request and for the adoption of fund estimates pursuant to Section 163
12

2011 Five-Year Maintenance Plan
CONTENTS
REQUIREMENTS OF STREETS AND HIGHWAYS CODE SECTION 1646 iii
EXECUTIVE SUMMARY iv
1HE MAINTENANCE PROGRAM 1
Pavement Maintenance 3 Bridge Maintenance 4 DrainageCulvert Maintenance 5 Maintenance Pro grain Budget Model 6
ANALYSIS OF ALTERNATIVE LEVELS OF MAINTENANCE INVESTMENT 8
Level ofInvestment -Baseline Funding 8 Level of Investment 2-Reduce Backlog (Ten Years) 9 Level ofInvestment 3-Eliminate Backlog (Five Years) 10
RECOMMENDATION ON LEVEL OF INVESTMENT 11
APPENDIX STREETS AND HIGHWAYS CODE SECTION 1646 12
ii
2011 Five-YearMaintenance Plan
REQUIREMENTS OF STREETS AND HIGHWAYS CODE SECTION 1646
Streets and Highways Code section 1646 requires the California Department of Transportation (Caltrans) to prepare a five-year maintenance plan that addresses the maintenance needs ofthe State Highway System Section l646 also requires Caltrans to attempt to balance the resources between the ten-year rehabilitation plan and the five-year maintenance plan
Section l646 requires the five-year maintenance plan to include the following
bull Only maintenance activities that~ ifthe activities were not performed could result in increased State Highway Operation and Protection Program (SHOPP) costs in the future
bull Strategies specific activities and funding to reduce or prevent backlog over the five years ofthe maintenance plan
bull Specific goals and quantifiable accomplishments
bull Cost control and efficiency strategies
bull Cost estimates for the five years of the maintenance plan
bull SHOPP cost avoidance from implementation of the maintenance plan
bull A budget model in line with the requirements ofthis legislation
The full text of section 1646 is appended
iii
liJtltlalwmiddot
2011 Five-Year Maintenance Plan
EXECUTIVE SUMMARY
The 20 II Five-Year Maintenance Plan (20 ll Maintenance Plan) as required by statute addresses the maintenance needs of the State Highway System for maintenance activities that if the activities were not performed could result in increased SHOPP costs in the future Caltrans accomplished the pavement objectives ofthe 2009 Maintenance Plan but could not keep up with the pace ofincreased bridge and culvert needs because ofan increased repair backlog caused by an aging infrastructure
The State Highway System includes approximately 50000 lane miles ofpavement Cal trans met the goal for pavement maintenance to repair 2 700 lane miles annually The 2009 Maintenance Plan was accomplished by reducing the backlog by 25 percent from 594 I lane miles in fiscal year (FY) 2008-2009 to 4463 lane miles in FY 2010-2011 aided by an increased authorization of$57 million in American Reinvestment and Recovery Act ftmding
The State bridge inventory includes approximately 12900 bridges and the 2009 Maintenance Plan identified an annual goal for bridge maintenance to reduce the bridge backlog to 10 percent of the total inventory or approximately 1290 bridges Unfortunately the actual backlogged bridge maintenance contract work had lagged the projections estimated in the 2009 Maintenance Plan by approximately I 2 percent because ofa higher than expected increase in bridge repair needs outpacing the contract work performed However the Bridge Program recorded a 30 percent reduction in new SHOPP recommendations from historic levels
The State Highway System includes an estimated 205000 culverts and the 2009 Maintenance Plan had an annual goal to repair 174 culverts and perform 14000 culvert assessments Because of several external factors such as higher than expected repair needs furlough impacts the State Budget impasse and deficit and extreme difficulty in assessing various culvert locations Caltrans was unable to meet the 2009 Maintenance Plan culvert goals However based on a two-year average Caltrans was able to accomplish 95 percent ofthe annual culvert repairs and 61 percent ofthe annual culvert assessments identified in the 2009 Maintenance Plan
The 2011 Maintenance Plan is reltommending Caltrans funding level remain Wlchanged at $4121 million a year for pavement bridge and drainage major maintenance Overall recent decreasing material and energy costs and a declining California economy have increased the nwnber ofbidders for department work thereby increasing the purchasing power ofresources currently needed to deliver the pavement bridge and drainage contracts It is expected that this trend will continue over the next few years which should result in more preventive maintenance work being accomplished The maintenance strategies identified in this 2011 Maintenance Plan will not reduce current SHOPP needs for pavement bridges and drainage culverts However the 20ll Maintenance Plan identifies specific strategies that will slow increases in the SHOPP by delaying the need for rehabilitation reconstruction or replacement Preventive maintenance services will be provided by a combination ofcontract services and work done by State forces
iv
2011 FivbullYear Maintenance Plan
THE MAINTENANCE PROGRAM
Section 6 ofSenate Bill1098 Chapter 212 Statutes of2004 amended Streets and Highways Code section 1646 In 2005 the Governor and the Legislature approved the inaugural Maintenance Plan for Caltrans as a means ofensuring the reliability ofCalifornias State Highway System by completing critically needed preventive maintenance work The 2005 Maintenance Plan included baseline funding of$148 million beginning in July 2006 for preventive maintenance work associated with pavement bridges and drainage systems on the more than 50000 lane miles of the State Highway System The governing administration and the Legislature subsequently augmented the Maintenance Program by $138 millio~ ofwhich $128 million was redirected from the SHOPP and $10 million from the approval ofa Budget Change Proposal in FY 2006-2007 This additional funding brought the level of investment to a total of $286 million for the 2005 Maintenance Plan
The 2007 Maintenance Plan recommended an additional increase of$1471 million As a result SHOPP funding was redirected in FY 2007-2008 to augment the Maintenance Program by $85 million for pavement and $411 million for bridges consistent with the recommendation This funding was specifically directed to preventive maintenance-type work bringing the total annual investment of the 2007 Maintenance Plan to $4121 million The 2009 Maintenance Plan did not recommend an increase in funding from the 2007 Maintenance Plan however a total of$57 million ofAmerican Recovery and Reinvestment Act one-time funding was authorized from FY 2008-2009 through FY 2009-2010
Currently the baseline annual funding is $234 million for pavement maintenance $1551 million for bridge maintenance and $23 million for drainage maintenance By sustaining the current funding level for pavement and structures the backlog will continue to be reduced over the next ten to thirteen years as planned Until the inventory is more complete and a large percentage of the needed rehabilitation work is identified no additional funding for preventive drainage work will be requested It is expected that the SHOPP cost avoidance benefit will continue for bridges but at a slower rate The total cost avoidance benefit estimate for the five years ofthe 2011 Maintenance Plan is $206 billion
Preventive maintenance is the most cost-effective means ofprotecting the States infrastructure investment The 20 11 Maintenance Plan prevents the deterioration and extends the life ofpavement bridge and drainage culvert inventory that is in fair or good condition As shown in Table 1 the average cost for a SHOPP roadway rehabilitation project to treat one lane mile ofminor pavement damage in FY 2008--2009 was $402000 a decrease in the average cost reported in the 2009 Maintenance Plan The average cost ofpavement maintenance was $67000 a lane mile Thus preventive maintenance results in a cost-benefit ratio ofabout 61 greater than the least cost category ofSHOPP projects Similarly the benefit ratio for bridge maintenance is 121 ($720000 for minor damage rehabilitation versus $60000 for preventive maintenance) and 51 for drainage maintenance ($115000 for minor damage rehabilitation versus $27000 for preventive maintenance) Table 1 lists these cost-benefit ratios and the following chart displays the preventive maintenance cost effectiveness
1
2011 Fiv~Year Maintenance Plan
Table 1
COST-BENEFIT OF PREVENTIVE MAINTENANCE
FY 2008-2009 Capital
Construction Costs Ooly
Cost of
Rehabilitation in Dollars
Cost of Preventive
Maintenance in Dollars
Unit of
Measure Cost-Benefit
Ratio
Pavement 402000 67000 Lane mile 61 Bridge 720000 60000 Bridge 121 Drainage ll5000 27000 Culvert 51
Cost Effectiveness Chart
Good
Failed
Ptlaw SHOPf Behablllalonaoendlng PavementS$ ~ Bridge $12 ~ Ortlnage S6 ~
___ Pmttnnt Thicblr ~ys ($402CJ001afle nlle)r--____ lldlluF1x joints and bearings ($72000MJridge)
----w---=---- IDinUIMinorrepairs to cuhlerts ($115000CMrt)
DtlawSHOPP BICOIIttuttion orRtolaccDIDI oRtodlng Pavement $13 ~ Drtlnage $28 ~ Bridge $100 -
PawlllftMapr~ ($904000tlnetrie -------- ldIAIgtMajor bridge rellaliltation ($6Mnlridge)
~Rellatiltalion lile to faiklre ($S5000fllatolert)
~---------------------------------------
2
2011 Five-YearMaintenance Plan
PAVEMENT MAINTENANCE
The State Highway System includes approximately 50000 Jane miles ofpavement with a replacement value ofmore than $12 trillion Approximately 12988 lane miles (26 percent) of the State Highway System have surpassed their service life of ten years and are in need of major rehabilitation
At the beginning ofFY 2008 2009 Caltrans reported a backlog of5941 lane miles of pavement maintenance At the beginning ofFY 2010-2011 the backlog was reduced to 4463 lane miles Caltrans was able to achieve a 25 percent reduction in backlogged lane miles from FY 2008-2009 to FY 2010-2011 With current funding levels the estimated backlog should continue to be reduced The 2011 Maintenance Plan will reduce the backlog oflane miles to 772 by FY 2020 2021 Cal transs long-tenn goal is to reduce the backlog oflane miles to approximately 1 percent of the total pavement inventory or 500 lane miles The 500 lane miles are the annual recurring distress ofthe pavement network
The 2009 Maintenance Plan established a pavement maintenance goal of 2 700 lane miles to be delivered each year Because ofdecreases in project construction costs and the increased number of bidders for each project Caltrans has been able to meet the goals of the 2009 Maintenance Plan
In FY 2008middot 2009 and FY 2009middot 20I 0 funds were increased by a total of$57 million from the one-time American Recovery and Reinvestment Act funding This additional federal funding allowed Caltrans to deliver 3539lane miles in FY 2008-2009 and 3446 lane miles in FY 2009-2010
In this current construction-bidding environment and at the current funding level of $234 million Caltrans is projecting 2700 lane miles to be treated annually in FY 2010-2011 and for the next few years
Currently Caltrans is incorporating the latest technology for data collection One technology is ground-penetrating radar which provides a snapshot ofthe layers underneath the pavement surface and will provide pavement structure inventory data including the thickness of the pavement layers for the entire State Highway System Another innovation is the automated pavement condition survey vehicle that will travel at highway speeds and collect pavement distress data at the pavement surface using lasers
In late 2010 a pavement management system contract will purchase commercial off-the-shelf software called PaveM This software will support a strong pavement management system to forecast pavement needs and detennine service life In addition Caltrans will continue to develop specifications for new products and applications that reduce costs and improve pavement perfonnance
3
2011 Five-Year Maintenance Plan
BRIDGE MAINTENANCE
Caltranss structural assets include more than 12t900 State highway bridges Caltrans objective is to manage the bridge inventory safely and economically to limit operational restrictions and prevent sudden closure or collapse Major structural rehabilitation caused by lack ofpreventive maintenance is more costly than preventive maintenance and has the potential to cause significant long-term disruptions to mobility
Bridge maintenance needs are identified during regularly scheduled bridge inspections mandated by federal regulations Bridge maintenance needs fall into two general categories State forces and major maintenance contract work Bridge needs identified for maintenance bridge crews or major maintenance contracts are considered backlogged two years after the recommendation is made by the inspector Maintenance bridge crew needs have increased slightly over the past five years on work for smaller repairs that require immediate attention and other minor maintenance work Maintenance bridge crew needs are approximately $15 million to $1 7 million ofthe backlog Bridge maintenance needs that are larger in size or complexity are packaged together into major maintenance contracts that are awarded to construction companies to perform
At the beginning ofFY 2008-2009 Caltrans reported 2713 bridges with backlogged major maintenance contract needs Caltrans treated 805 bridges during FY 2008--2009 and 874 bridges during FY 2009-2010 At the begiruring ofFY 2010-2011 the number ofbridges with backlogged major maintenance contract needs was 2575 approximately 20 percent ofthe inventory Caltranss goal is to reduce the number ofbridges with backlogged major maintenance contract needs to approximately I 0 percent ofthe inventory or 1 290 bridges
The recent backlogged major maintenance contract needs are trending downward However the backlogged major maintenance contract needs are lagging projections estimated in the 2009 Maintenance Plan by approximately 12 percent
The 2011 Maintenance Plan identifies more than $441 million in backlogged major maintenance contract needs for bridges which equates to approximately 97 percent ofall bridge maintenance needs
The rate ofbacklog reduction is a function ofproject delivery on the positive side and the rate of new backlog needs being identified on the negative side Since the 2005 Maintenance Plan the average number ofnew bridges becoming backlogged annually has increased by 21 percent The increased rate ofneeds is attributable to the general aging of the entire bridge network in California The increase in needs identification has been partially offset by decreases in project construction costs and the increased number of bidders for each project At the current construction authorization levels it is expected to take approximately thirteen years to achieve the desired backlog levels Caltrans is optimistic that the projected reductions identified in the 20 II Maintenance Plan will be realized
4
2011 Five-Year Maintenance Plan
The timely preventive maintenance made possible by authorized funding in previous maintenance plans has begun to slow the progression of bridges requiring major rehabilitation in the SHOPP
For FY 2008 2009 the Bridge Program recorded a 30 percent reduction in new SHOPP recommendations from historic levels This decrease in SHOPP recommendations is a welcome trend and demonstrates that SHOPP cost avoidance objectives in previous plans are being realized
Caltrans is pursuing numerous activities to maximize efficiencies and control the costs of bridge maintenance Among these are the uses of new materials that last longer and are easier to apply such as epoxy paints polyester concretes corrosion-resistant rebar and design details In addition Caltrans is implementing policies to ensure that new projects are constructed with cost-effective and easily maintainable elements as well as reviewing the activities ofother state Departments ofTransportation on an ongoing basis to ensure that the best business practices are employed in California
DRAINAGECULVERT MAINTENANCE
The State Highway System includes an estimated 205000 culverts These culverts drain the States highways serving as conduits for streams drainage channels and other waterways to flow under the highways Culvert damage or failure can seriously damage the roadway create the need for extensive repairs and threaten the mobility and safety of the traveling public The 2009 Maintenance Plan provided for continuation ofa proactive inspection program to identify damaged or failed culverts Management procedures have been developed to measure the health ofdrainage systems prioritize potential culvert projects based on condition cost and traveler delay and track accomplishments and delivery schedules for maintenance work
At the beginning ofFY 2008-2009 an estimated 9614 culverts with backlogged preventive maintenance needs were identified During FY 2008-2009 178 culverts were repaired under the Culvert Inspection Program In FY 2009-2010 the target repair of 174 culverts was projected with an estimated assessment rate of 14000 culverts A total of 156 culverts were repaired and more than 6000 culverts were assessed in FY 2009-201 0 The drop in assessment rate is attributed to several factors including limited resource availability due to the State Furlough Program and reductions in the travel expense budget to conduct site visits for several months due to the State Budget impasse At the beginning ofFY 2010-2011 the culvert backlog requiring preventive repairs was estimated to be 13185 and it was projected 174 culverts would need repair
About 36 percent ofapproximately 58000 culverts assessed to date require some form of maintenance With an increase of 12 percent from the previous year the corrective maintenance category at 23 percent is the fastest growing segment of the culvert inventory Based on the target rate of 14000 assessments a year and the estimated 23 percent of assessed culvert inventory requiring preventive work an additional 3220 culverts are estimated to be identified for corrective maintenance work each year Assuming a 23 percent rate of inventory requiring
5
2011 Five-Year Maintenance Plan
preventive work remains consistent for the entire inventory of205000 culverts an additional investment of$119 million will provide sufficient funds to reduce the inventory by 3314 culverts a year over a ten-year period An additional investment of$244 million will provide sufficient funds to reduce the same amotmt ofbacklog in a five-year period by 6628 culverts a year Culvert repair and replacement projects typically require multiyear environmental mitigation documents In addition right-of-way clearance must be obtained prior to entering private property These right-of-way activities require long lead times that typically include the purchase ofeasements andor titles in fees
Approximately 28 percent of the total State drainage system has been inspected to date Until the inventory is more complete and a large percentage ofrequired rehabilitation work is identified no additional funding for preventive drainage work will be requested The 2011 Maintenance Plan is recommending a funding level of$23 million annually to inspect assess and address culvert preventive maintenance and repairs This funding level slightly reduces the rate of backlog increase but in no way eliminates it Preventive maintenance for culverts is perfonned by a combination ofState forces and major maintenance contract work
The Culvert Inspection Program will continue to improve understanding ofthe circumstances leading to culvert failure and that knowledge will potentially lead to changes in design specifications construction methods and materials for improved culvert performance
Management procedures have been developed to measure the health ofdrainage systems prioritize potential culvert projects based on condition cost and traveler delay (measured both by traffic volume and detour length) and track accomplishments and delivery schedules of maintenance work In addition the use ofgeographic information systems technology will assist in reevaluating watersheds to ensure that culverts are meeting current design standards and will improve workforce expertise and the ability for quick response to emergencies involving culverts
MAINTENANCE PROGRAM BUDGET MODEL
The Maintenance Program budget model was developed to enhance budget management capabilities on an annual basis The performance-based model uses a combination ofhistorical expenditures Level ofService (LOS) performance measures and inventory data to project future resource needs with performance-level expectations for the entire State Highway System While the budget model does include all resources the model is used primarily to detennine a perfonnance-based budget for field maintenance activities
Historically the budget model grouped Caltrans twelve districts into sets of comparable units (using geographic population and traffic volume characteristics) Current versions ofthe model have shifted the focus from a district-level analysis to a route-level analysis by grouping all routes based on traffic volumes and geographic locations By creating a route-level analysis tool the budget model provides detailed comparative analysis for detennining relationships between performance and resource needs for each highway inventory unit which creates standardized allocation and efficiency rates for each route
6
lllttrJvulbull
2011 FlvbullYear Maintenance Plan
The budget model is used
bull To measure the direct relation between funding and LOS and the effects ofchanges to either
bull To measure an efficiency curve at the State route level for statewide comparisons
bull To measure a standardized allocation process for inventory items at a State route level for life-cycle cost and asset management practices
bull To assist decision-makers in detennining the best course ofaction relative to budgetary and performance issues
bull To predict funding needs based on project delivery actions and decisions
7
2011 Five-Year Maintenance Plan
ANALYSIS OF ALTERNATIVE LEVELS OF MAINTENANCE INVESTMENT
LEVEL OF INVESTMENT 1-BASELINE FUNDING
The current baseline annuaJ funding level is $4121 million as shown in Table 2 At the beginning ofFY 2008-2009 the backlog was 5941 pavement lane miles 2675 bridges and 9614 culverts It was estimated that the backlog would be reduced to 4463 lane miles by the beginning ofFY 2010-2011 and 2541 bridges by the beginning ofFY 2009-2010 The pavement backlog in FY 2020--2021 is estimated to be 772 lane miles with the current funding The extent of the drainage backlog as shown is projected until the inventory is more complete and a large percentage of the needed rehabilitation work is identified
Table2
LEVEL OF INVESTMENT l~URRENT BASELINE FUNDING
AnnuaiPYs
Annual Cost in Million Dollars
Annaal Accomplishments
Average Annual
Change in Backlog
Future SHOPPCost
Avoidance in Million
Dollars
Pavement 287 2340 2 700 lane miles 4091ane-mile decrease
1404
Bridge2 361 1551 689 bridges 92 decrease 1564 Drainage3 188 230 174 culverts
14000 inspections 3220 increase
115
Total 836 4121 - -shy 3083
1 Pavement costs include personal services and major maintename contracts Tbe current support funding is approximately 287 PYs (personnel years) and $30 million a year Annual costs include $204 million in major maintenance contracts
2 Bridge saructural resources include $925 mHlion in major maintenance contracts $583 miJiion and 361 PYs in personal services and operating expenses in support ofcontract delivery and $43 million in Architectural and Engineering contracts (PYEs )
3 Drainage costs include S125 million and 1345 PYs in State forces for maintenance and associated equipment and materials $7 million and I 55 PYs in major maintenance contract dollars and support and $35 million and 38 PYs for the Culvert Inspection Program
8
2011 Five-Year Maintenance Plan
LEVEL OF INVESTMENT 2--REDUCE BACKLOG (TEN YEARS)
As shown in Table 3 with an additional $2089 million added in FY 2012-2013 to increase the annual funding level to $621 million the backlog ofmaintenance needs will be reduced for pavement and bridges while reducing the known drainage backlog to zero at the end of the ten years This increase in investment of$86 million for pavement and $39 million for bridges will reduce the pavement baeldog annually by 604 lane miles and the bridge backlog by 126 bridges The pavement backlog in FY2020-2021 is estimated to be 56llane miles close to the 1 percent goal of the Pavement Program The increase in investment of$119 million for drainage will reduce the culvert backlog by 3314 culverts a year
Table 3
LEVEL OF INVESTMENT 2-REDUCE BACKLOG (TEN YEARS)
Aoaual PYs
Annual Cost in Million Dollars
Annual Accomplishments
Average Annual
Change in Backlog
Future SHOPPCost
Avoidaolaquo in Million Dollars
Pavement1 375 320 3900 lane miles 604 lane-mile decrease
1920
Bridge2 361 159 723 bridges 126 decrease 1641 Drainage3 452 142 3314 culverts
14000 inspections 3314 decrease
710
Total 1188 621 -shy --shy 4271
1Pavement costs include persooaJ services and major maintenance contracts The proposed support funding is approximately 37 PYs and $40 million a year Annual costs include $280 million in major maintenance contracts
2 Bridge costs include State forces for maintenance and associated equipment and materials inspection contract dollars and support Increased resources are shown as persoiUlel year equivalents (PYEs) and are not included in the PYs Funding includes $964 million in major maintenance contracts S583 million and 361 PYs in support costs and $43 million in Architectural and Engineering contracts (PYEs)
3 Drainage costs includes $125 million and 1345 PYs in State forces for maintenance and associated equipment and materials $126 million and 2795 PYs for major maintenance contract dollars and support and $35 million and 38 PYs fur the Culvert Inspection Program
9
2011 Five-Year Maintenance Plan
LEVEL OF INVESTMENT 3-EUMINATE BACKLOG (FIVE YEARS)
As shown in Table 4 with an additional $5159 million added to increase annual maintenance funding to more than $928 million all existing backlog ofmaintenance work will be eliminated over a five-year period Future SHOPP needs wilJ be significantly less than under either ofthe previously identified levels ofinvestment When funds are available starting in FY2012-20I3 the backlog ofpavement and bridge projects wiJl be reduced to zero after five years The pavement bacldog in FY2015-20l6 is estimated to be 510 lane miles with the increased funding effectively eliminating the pavement backlog (at that point annual maintenance funding could be decreased) At the projected rate of 14000 inspections a year there still will be 63000 culverts remaining in the inventory to be inspected at the end ofthe five years with an estimated 3220 culverts still needing repair work each year
Table 4
LEVEL OF INVESTMENT 3-ELIMINATE BACKLOG (FIVE YEARS)
Annual PVs
AaaaaiCost in Million
Dollars Annual
Accomplishments
Average Annual
Decrease in Backlog
Future SBOPPCost
Avoidance in Million
Dollars
Pavernent1 536 460 5600 lane miles 655 lane-mile decrease
2736
Bridge2 361 201 amp49 bridges 252 decrease 1928
Drainage3 731 267 6628 culverts 14000 inspections
6628 decrease
1335
Total 1628 928 -shy --shy 5999
1 Pavement costs include personal services and major maintenance contracts The proposed support funding is approximately 536 PYs and $60 million a year Annual costs include $400 million in major maintenance contracts
2 Bridge costs include State repair crews material$ equipment rental contract dollars and support Increased resources are shown as PYEs and are not included in the PYs Funding includes $ J201 million in major maintenance contracts $583 million and 361 PYs in support costs and $226 million inArchitectw-al and Engineering contracts (PYEs)
3 Drainage costs include $125 million and 1345 PYs in State forces for maintenance and associated equipment and materials $251 million and 5 585 PYs for major maintenance contract dollars and support and $35 million and 38 PYs for the Culvert lnspection Program
10
2011 Five-Year Maintenance Plan
RECOMMENDATION ON LEVEL OF INVESTMENT
In approving the 20 II Maintenance Plan the Governor and the Legislature recognize the importance ofcompleting critically needed maintenance work to the States infrastructure thus protecting Californias Wlique quality of life and ensuring its economic competitiveness in the global marketplace Overall recent decreases in material and energy costs and a declining California economy have increased the number ofbidders for department work thereby increasing the purchasing power ofcurrently identified resources needed to deliver the 2009 Maintenance Plan It is expected that this trend will continue over the next few years
Therefore Caltrans recommends continuing the Level oflnvestment l with no additional resources requested at this time The total cost estimate for the five years of the 2011 Maintenance Plan is $206 billion
The best use oftransportation resources demands a balanced mix ofpreventive maintenance and rehabilitation or replacement This balance is consistent and supports the principles ofGo California to ensure the wise investment ofexisting funding with a vision of improving mobility and safety
11
2011 Five-Year Maintenance Plan
APPENDIX
STREETS AND HIGHWAYS CODE SECTION 1646
1646(a) The department shall prepare a IO~year state rehabilitation plan for the rehabilitation and reconstruction or the combination thereof by the State Highway Operation and Protection Program ofall state highways and bridges owned by the state The plan shall identify all rehabilitation needs for the 10-year period beginning on July I 1998 and ending on June 30 2008 and shall include a schedule ofimprovements to complete all needed rehabilitation during the life of the plan not later than June 30 2008 The plan shall be updated every two years beginning in 2000 The plan shall include specific milestones and quantifiable accomplishments such as miles ofhighways to be repaved and number of bridges to be retrofitted The plan shall contain strategies to control cost and improve the efficiency of the program and include a cost estimate for at least the first five years of the program
(b) The department shall prepare a five-year maintenance plan that addresses the maintenance needs of the state highway system The plan shall be updated every two years concurrent with the rehabilitation plan described in subdivision (a) The maintenance plan shall include only maintenance activities that ifthe activities were not performed could result in increased State Highway Operation and Protection Program costs in the future These activities may include roadway structural and drainage maintenance The maintenance plan shall identify any existing backlog in these maintenance activities and shall recommend a strategy specific activities and an associated funding level to reduce or prevent any backlog during the plans five-year period The maintenance plan shall include specific goals and quantifiable accomplishments such as lane-miles ofhighway to be repaved and the number ofbridge decks to be sealed The maintenance plan shall contain strategies to control cost and improve the efficiency of these maintenance activities and include a cost estimate for the five years ofthe plan
(c) The rehabilitation plan and the maintenance plan shall attempt to balance resowces between State Highway Operation and Protection Program activities and maintenance activities in order to achieve identified milestones and goals at the lowest possible long-term total cost If the maintenance plan recommends increases in maintenance spending it shall identify projected future State Highway Operation and Protection Program costs that would be avoided by increasing maintenance spending The departments maintenance division shall develop a budget model that allows it to achieve the requirements ofthis subdivision
(d) The rehabilitation plan shall be submitted to the commission for review and comments not later than January 31 ofeach odd-numbered year and shall be transmitted to the Governor and the Legislature not later than May I ofeach odd-numbered year The maintenance plan shall be transmitted to the Governor the Legislature and the commission not later than January 31 ofeach odd-numbered year
(e) The rehabilitation plan and the maintenance plan shall be the basis for the departments budget request and for the adoption of fund estimates pursuant to Section 163
12
2011 Five-YearMaintenance Plan
REQUIREMENTS OF STREETS AND HIGHWAYS CODE SECTION 1646
Streets and Highways Code section 1646 requires the California Department of Transportation (Caltrans) to prepare a five-year maintenance plan that addresses the maintenance needs ofthe State Highway System Section l646 also requires Caltrans to attempt to balance the resources between the ten-year rehabilitation plan and the five-year maintenance plan
Section l646 requires the five-year maintenance plan to include the following
bull Only maintenance activities that~ ifthe activities were not performed could result in increased State Highway Operation and Protection Program (SHOPP) costs in the future
bull Strategies specific activities and funding to reduce or prevent backlog over the five years ofthe maintenance plan
bull Specific goals and quantifiable accomplishments
bull Cost control and efficiency strategies
bull Cost estimates for the five years of the maintenance plan
bull SHOPP cost avoidance from implementation of the maintenance plan
bull A budget model in line with the requirements ofthis legislation
The full text of section 1646 is appended
iii
liJtltlalwmiddot
2011 Five-Year Maintenance Plan
EXECUTIVE SUMMARY
The 20 II Five-Year Maintenance Plan (20 ll Maintenance Plan) as required by statute addresses the maintenance needs of the State Highway System for maintenance activities that if the activities were not performed could result in increased SHOPP costs in the future Caltrans accomplished the pavement objectives ofthe 2009 Maintenance Plan but could not keep up with the pace ofincreased bridge and culvert needs because ofan increased repair backlog caused by an aging infrastructure
The State Highway System includes approximately 50000 lane miles ofpavement Cal trans met the goal for pavement maintenance to repair 2 700 lane miles annually The 2009 Maintenance Plan was accomplished by reducing the backlog by 25 percent from 594 I lane miles in fiscal year (FY) 2008-2009 to 4463 lane miles in FY 2010-2011 aided by an increased authorization of$57 million in American Reinvestment and Recovery Act ftmding
The State bridge inventory includes approximately 12900 bridges and the 2009 Maintenance Plan identified an annual goal for bridge maintenance to reduce the bridge backlog to 10 percent of the total inventory or approximately 1290 bridges Unfortunately the actual backlogged bridge maintenance contract work had lagged the projections estimated in the 2009 Maintenance Plan by approximately I 2 percent because ofa higher than expected increase in bridge repair needs outpacing the contract work performed However the Bridge Program recorded a 30 percent reduction in new SHOPP recommendations from historic levels
The State Highway System includes an estimated 205000 culverts and the 2009 Maintenance Plan had an annual goal to repair 174 culverts and perform 14000 culvert assessments Because of several external factors such as higher than expected repair needs furlough impacts the State Budget impasse and deficit and extreme difficulty in assessing various culvert locations Caltrans was unable to meet the 2009 Maintenance Plan culvert goals However based on a two-year average Caltrans was able to accomplish 95 percent ofthe annual culvert repairs and 61 percent ofthe annual culvert assessments identified in the 2009 Maintenance Plan
The 2011 Maintenance Plan is reltommending Caltrans funding level remain Wlchanged at $4121 million a year for pavement bridge and drainage major maintenance Overall recent decreasing material and energy costs and a declining California economy have increased the nwnber ofbidders for department work thereby increasing the purchasing power ofresources currently needed to deliver the pavement bridge and drainage contracts It is expected that this trend will continue over the next few years which should result in more preventive maintenance work being accomplished The maintenance strategies identified in this 2011 Maintenance Plan will not reduce current SHOPP needs for pavement bridges and drainage culverts However the 20ll Maintenance Plan identifies specific strategies that will slow increases in the SHOPP by delaying the need for rehabilitation reconstruction or replacement Preventive maintenance services will be provided by a combination ofcontract services and work done by State forces
iv
2011 FivbullYear Maintenance Plan
THE MAINTENANCE PROGRAM
Section 6 ofSenate Bill1098 Chapter 212 Statutes of2004 amended Streets and Highways Code section 1646 In 2005 the Governor and the Legislature approved the inaugural Maintenance Plan for Caltrans as a means ofensuring the reliability ofCalifornias State Highway System by completing critically needed preventive maintenance work The 2005 Maintenance Plan included baseline funding of$148 million beginning in July 2006 for preventive maintenance work associated with pavement bridges and drainage systems on the more than 50000 lane miles of the State Highway System The governing administration and the Legislature subsequently augmented the Maintenance Program by $138 millio~ ofwhich $128 million was redirected from the SHOPP and $10 million from the approval ofa Budget Change Proposal in FY 2006-2007 This additional funding brought the level of investment to a total of $286 million for the 2005 Maintenance Plan
The 2007 Maintenance Plan recommended an additional increase of$1471 million As a result SHOPP funding was redirected in FY 2007-2008 to augment the Maintenance Program by $85 million for pavement and $411 million for bridges consistent with the recommendation This funding was specifically directed to preventive maintenance-type work bringing the total annual investment of the 2007 Maintenance Plan to $4121 million The 2009 Maintenance Plan did not recommend an increase in funding from the 2007 Maintenance Plan however a total of$57 million ofAmerican Recovery and Reinvestment Act one-time funding was authorized from FY 2008-2009 through FY 2009-2010
Currently the baseline annual funding is $234 million for pavement maintenance $1551 million for bridge maintenance and $23 million for drainage maintenance By sustaining the current funding level for pavement and structures the backlog will continue to be reduced over the next ten to thirteen years as planned Until the inventory is more complete and a large percentage of the needed rehabilitation work is identified no additional funding for preventive drainage work will be requested It is expected that the SHOPP cost avoidance benefit will continue for bridges but at a slower rate The total cost avoidance benefit estimate for the five years ofthe 2011 Maintenance Plan is $206 billion
Preventive maintenance is the most cost-effective means ofprotecting the States infrastructure investment The 20 11 Maintenance Plan prevents the deterioration and extends the life ofpavement bridge and drainage culvert inventory that is in fair or good condition As shown in Table 1 the average cost for a SHOPP roadway rehabilitation project to treat one lane mile ofminor pavement damage in FY 2008--2009 was $402000 a decrease in the average cost reported in the 2009 Maintenance Plan The average cost ofpavement maintenance was $67000 a lane mile Thus preventive maintenance results in a cost-benefit ratio ofabout 61 greater than the least cost category ofSHOPP projects Similarly the benefit ratio for bridge maintenance is 121 ($720000 for minor damage rehabilitation versus $60000 for preventive maintenance) and 51 for drainage maintenance ($115000 for minor damage rehabilitation versus $27000 for preventive maintenance) Table 1 lists these cost-benefit ratios and the following chart displays the preventive maintenance cost effectiveness
1
2011 Fiv~Year Maintenance Plan
Table 1
COST-BENEFIT OF PREVENTIVE MAINTENANCE
FY 2008-2009 Capital
Construction Costs Ooly
Cost of
Rehabilitation in Dollars
Cost of Preventive
Maintenance in Dollars
Unit of
Measure Cost-Benefit
Ratio
Pavement 402000 67000 Lane mile 61 Bridge 720000 60000 Bridge 121 Drainage ll5000 27000 Culvert 51
Cost Effectiveness Chart
Good
Failed
Ptlaw SHOPf Behablllalonaoendlng PavementS$ ~ Bridge $12 ~ Ortlnage S6 ~
___ Pmttnnt Thicblr ~ys ($402CJ001afle nlle)r--____ lldlluF1x joints and bearings ($72000MJridge)
----w---=---- IDinUIMinorrepairs to cuhlerts ($115000CMrt)
DtlawSHOPP BICOIIttuttion orRtolaccDIDI oRtodlng Pavement $13 ~ Drtlnage $28 ~ Bridge $100 -
PawlllftMapr~ ($904000tlnetrie -------- ldIAIgtMajor bridge rellaliltation ($6Mnlridge)
~Rellatiltalion lile to faiklre ($S5000fllatolert)
~---------------------------------------
2
2011 Five-YearMaintenance Plan
PAVEMENT MAINTENANCE
The State Highway System includes approximately 50000 Jane miles ofpavement with a replacement value ofmore than $12 trillion Approximately 12988 lane miles (26 percent) of the State Highway System have surpassed their service life of ten years and are in need of major rehabilitation
At the beginning ofFY 2008 2009 Caltrans reported a backlog of5941 lane miles of pavement maintenance At the beginning ofFY 2010-2011 the backlog was reduced to 4463 lane miles Caltrans was able to achieve a 25 percent reduction in backlogged lane miles from FY 2008-2009 to FY 2010-2011 With current funding levels the estimated backlog should continue to be reduced The 2011 Maintenance Plan will reduce the backlog oflane miles to 772 by FY 2020 2021 Cal transs long-tenn goal is to reduce the backlog oflane miles to approximately 1 percent of the total pavement inventory or 500 lane miles The 500 lane miles are the annual recurring distress ofthe pavement network
The 2009 Maintenance Plan established a pavement maintenance goal of 2 700 lane miles to be delivered each year Because ofdecreases in project construction costs and the increased number of bidders for each project Caltrans has been able to meet the goals of the 2009 Maintenance Plan
In FY 2008middot 2009 and FY 2009middot 20I 0 funds were increased by a total of$57 million from the one-time American Recovery and Reinvestment Act funding This additional federal funding allowed Caltrans to deliver 3539lane miles in FY 2008-2009 and 3446 lane miles in FY 2009-2010
In this current construction-bidding environment and at the current funding level of $234 million Caltrans is projecting 2700 lane miles to be treated annually in FY 2010-2011 and for the next few years
Currently Caltrans is incorporating the latest technology for data collection One technology is ground-penetrating radar which provides a snapshot ofthe layers underneath the pavement surface and will provide pavement structure inventory data including the thickness of the pavement layers for the entire State Highway System Another innovation is the automated pavement condition survey vehicle that will travel at highway speeds and collect pavement distress data at the pavement surface using lasers
In late 2010 a pavement management system contract will purchase commercial off-the-shelf software called PaveM This software will support a strong pavement management system to forecast pavement needs and detennine service life In addition Caltrans will continue to develop specifications for new products and applications that reduce costs and improve pavement perfonnance
3
2011 Five-Year Maintenance Plan
BRIDGE MAINTENANCE
Caltranss structural assets include more than 12t900 State highway bridges Caltrans objective is to manage the bridge inventory safely and economically to limit operational restrictions and prevent sudden closure or collapse Major structural rehabilitation caused by lack ofpreventive maintenance is more costly than preventive maintenance and has the potential to cause significant long-term disruptions to mobility
Bridge maintenance needs are identified during regularly scheduled bridge inspections mandated by federal regulations Bridge maintenance needs fall into two general categories State forces and major maintenance contract work Bridge needs identified for maintenance bridge crews or major maintenance contracts are considered backlogged two years after the recommendation is made by the inspector Maintenance bridge crew needs have increased slightly over the past five years on work for smaller repairs that require immediate attention and other minor maintenance work Maintenance bridge crew needs are approximately $15 million to $1 7 million ofthe backlog Bridge maintenance needs that are larger in size or complexity are packaged together into major maintenance contracts that are awarded to construction companies to perform
At the beginning ofFY 2008-2009 Caltrans reported 2713 bridges with backlogged major maintenance contract needs Caltrans treated 805 bridges during FY 2008--2009 and 874 bridges during FY 2009-2010 At the begiruring ofFY 2010-2011 the number ofbridges with backlogged major maintenance contract needs was 2575 approximately 20 percent ofthe inventory Caltranss goal is to reduce the number ofbridges with backlogged major maintenance contract needs to approximately I 0 percent ofthe inventory or 1 290 bridges
The recent backlogged major maintenance contract needs are trending downward However the backlogged major maintenance contract needs are lagging projections estimated in the 2009 Maintenance Plan by approximately 12 percent
The 2011 Maintenance Plan identifies more than $441 million in backlogged major maintenance contract needs for bridges which equates to approximately 97 percent ofall bridge maintenance needs
The rate ofbacklog reduction is a function ofproject delivery on the positive side and the rate of new backlog needs being identified on the negative side Since the 2005 Maintenance Plan the average number ofnew bridges becoming backlogged annually has increased by 21 percent The increased rate ofneeds is attributable to the general aging of the entire bridge network in California The increase in needs identification has been partially offset by decreases in project construction costs and the increased number of bidders for each project At the current construction authorization levels it is expected to take approximately thirteen years to achieve the desired backlog levels Caltrans is optimistic that the projected reductions identified in the 20 II Maintenance Plan will be realized
4
2011 Five-Year Maintenance Plan
The timely preventive maintenance made possible by authorized funding in previous maintenance plans has begun to slow the progression of bridges requiring major rehabilitation in the SHOPP
For FY 2008 2009 the Bridge Program recorded a 30 percent reduction in new SHOPP recommendations from historic levels This decrease in SHOPP recommendations is a welcome trend and demonstrates that SHOPP cost avoidance objectives in previous plans are being realized
Caltrans is pursuing numerous activities to maximize efficiencies and control the costs of bridge maintenance Among these are the uses of new materials that last longer and are easier to apply such as epoxy paints polyester concretes corrosion-resistant rebar and design details In addition Caltrans is implementing policies to ensure that new projects are constructed with cost-effective and easily maintainable elements as well as reviewing the activities ofother state Departments ofTransportation on an ongoing basis to ensure that the best business practices are employed in California
DRAINAGECULVERT MAINTENANCE
The State Highway System includes an estimated 205000 culverts These culverts drain the States highways serving as conduits for streams drainage channels and other waterways to flow under the highways Culvert damage or failure can seriously damage the roadway create the need for extensive repairs and threaten the mobility and safety of the traveling public The 2009 Maintenance Plan provided for continuation ofa proactive inspection program to identify damaged or failed culverts Management procedures have been developed to measure the health ofdrainage systems prioritize potential culvert projects based on condition cost and traveler delay and track accomplishments and delivery schedules for maintenance work
At the beginning ofFY 2008-2009 an estimated 9614 culverts with backlogged preventive maintenance needs were identified During FY 2008-2009 178 culverts were repaired under the Culvert Inspection Program In FY 2009-2010 the target repair of 174 culverts was projected with an estimated assessment rate of 14000 culverts A total of 156 culverts were repaired and more than 6000 culverts were assessed in FY 2009-201 0 The drop in assessment rate is attributed to several factors including limited resource availability due to the State Furlough Program and reductions in the travel expense budget to conduct site visits for several months due to the State Budget impasse At the beginning ofFY 2010-2011 the culvert backlog requiring preventive repairs was estimated to be 13185 and it was projected 174 culverts would need repair
About 36 percent ofapproximately 58000 culverts assessed to date require some form of maintenance With an increase of 12 percent from the previous year the corrective maintenance category at 23 percent is the fastest growing segment of the culvert inventory Based on the target rate of 14000 assessments a year and the estimated 23 percent of assessed culvert inventory requiring preventive work an additional 3220 culverts are estimated to be identified for corrective maintenance work each year Assuming a 23 percent rate of inventory requiring
5
2011 Five-Year Maintenance Plan
preventive work remains consistent for the entire inventory of205000 culverts an additional investment of$119 million will provide sufficient funds to reduce the inventory by 3314 culverts a year over a ten-year period An additional investment of$244 million will provide sufficient funds to reduce the same amotmt ofbacklog in a five-year period by 6628 culverts a year Culvert repair and replacement projects typically require multiyear environmental mitigation documents In addition right-of-way clearance must be obtained prior to entering private property These right-of-way activities require long lead times that typically include the purchase ofeasements andor titles in fees
Approximately 28 percent of the total State drainage system has been inspected to date Until the inventory is more complete and a large percentage ofrequired rehabilitation work is identified no additional funding for preventive drainage work will be requested The 2011 Maintenance Plan is recommending a funding level of$23 million annually to inspect assess and address culvert preventive maintenance and repairs This funding level slightly reduces the rate of backlog increase but in no way eliminates it Preventive maintenance for culverts is perfonned by a combination ofState forces and major maintenance contract work
The Culvert Inspection Program will continue to improve understanding ofthe circumstances leading to culvert failure and that knowledge will potentially lead to changes in design specifications construction methods and materials for improved culvert performance
Management procedures have been developed to measure the health ofdrainage systems prioritize potential culvert projects based on condition cost and traveler delay (measured both by traffic volume and detour length) and track accomplishments and delivery schedules of maintenance work In addition the use ofgeographic information systems technology will assist in reevaluating watersheds to ensure that culverts are meeting current design standards and will improve workforce expertise and the ability for quick response to emergencies involving culverts
MAINTENANCE PROGRAM BUDGET MODEL
The Maintenance Program budget model was developed to enhance budget management capabilities on an annual basis The performance-based model uses a combination ofhistorical expenditures Level ofService (LOS) performance measures and inventory data to project future resource needs with performance-level expectations for the entire State Highway System While the budget model does include all resources the model is used primarily to detennine a perfonnance-based budget for field maintenance activities
Historically the budget model grouped Caltrans twelve districts into sets of comparable units (using geographic population and traffic volume characteristics) Current versions ofthe model have shifted the focus from a district-level analysis to a route-level analysis by grouping all routes based on traffic volumes and geographic locations By creating a route-level analysis tool the budget model provides detailed comparative analysis for detennining relationships between performance and resource needs for each highway inventory unit which creates standardized allocation and efficiency rates for each route
6
lllttrJvulbull
2011 FlvbullYear Maintenance Plan
The budget model is used
bull To measure the direct relation between funding and LOS and the effects ofchanges to either
bull To measure an efficiency curve at the State route level for statewide comparisons
bull To measure a standardized allocation process for inventory items at a State route level for life-cycle cost and asset management practices
bull To assist decision-makers in detennining the best course ofaction relative to budgetary and performance issues
bull To predict funding needs based on project delivery actions and decisions
7
2011 Five-Year Maintenance Plan
ANALYSIS OF ALTERNATIVE LEVELS OF MAINTENANCE INVESTMENT
LEVEL OF INVESTMENT 1-BASELINE FUNDING
The current baseline annuaJ funding level is $4121 million as shown in Table 2 At the beginning ofFY 2008-2009 the backlog was 5941 pavement lane miles 2675 bridges and 9614 culverts It was estimated that the backlog would be reduced to 4463 lane miles by the beginning ofFY 2010-2011 and 2541 bridges by the beginning ofFY 2009-2010 The pavement backlog in FY 2020--2021 is estimated to be 772 lane miles with the current funding The extent of the drainage backlog as shown is projected until the inventory is more complete and a large percentage of the needed rehabilitation work is identified
Table2
LEVEL OF INVESTMENT l~URRENT BASELINE FUNDING
AnnuaiPYs
Annual Cost in Million Dollars
Annaal Accomplishments
Average Annual
Change in Backlog
Future SHOPPCost
Avoidance in Million
Dollars
Pavement 287 2340 2 700 lane miles 4091ane-mile decrease
1404
Bridge2 361 1551 689 bridges 92 decrease 1564 Drainage3 188 230 174 culverts
14000 inspections 3220 increase
115
Total 836 4121 - -shy 3083
1 Pavement costs include personal services and major maintename contracts Tbe current support funding is approximately 287 PYs (personnel years) and $30 million a year Annual costs include $204 million in major maintenance contracts
2 Bridge saructural resources include $925 mHlion in major maintenance contracts $583 miJiion and 361 PYs in personal services and operating expenses in support ofcontract delivery and $43 million in Architectural and Engineering contracts (PYEs )
3 Drainage costs include S125 million and 1345 PYs in State forces for maintenance and associated equipment and materials $7 million and I 55 PYs in major maintenance contract dollars and support and $35 million and 38 PYs for the Culvert Inspection Program
8
2011 Five-Year Maintenance Plan
LEVEL OF INVESTMENT 2--REDUCE BACKLOG (TEN YEARS)
As shown in Table 3 with an additional $2089 million added in FY 2012-2013 to increase the annual funding level to $621 million the backlog ofmaintenance needs will be reduced for pavement and bridges while reducing the known drainage backlog to zero at the end of the ten years This increase in investment of$86 million for pavement and $39 million for bridges will reduce the pavement baeldog annually by 604 lane miles and the bridge backlog by 126 bridges The pavement backlog in FY2020-2021 is estimated to be 56llane miles close to the 1 percent goal of the Pavement Program The increase in investment of$119 million for drainage will reduce the culvert backlog by 3314 culverts a year
Table 3
LEVEL OF INVESTMENT 2-REDUCE BACKLOG (TEN YEARS)
Aoaual PYs
Annual Cost in Million Dollars
Annual Accomplishments
Average Annual
Change in Backlog
Future SHOPPCost
Avoidaolaquo in Million Dollars
Pavement1 375 320 3900 lane miles 604 lane-mile decrease
1920
Bridge2 361 159 723 bridges 126 decrease 1641 Drainage3 452 142 3314 culverts
14000 inspections 3314 decrease
710
Total 1188 621 -shy --shy 4271
1Pavement costs include persooaJ services and major maintenance contracts The proposed support funding is approximately 37 PYs and $40 million a year Annual costs include $280 million in major maintenance contracts
2 Bridge costs include State forces for maintenance and associated equipment and materials inspection contract dollars and support Increased resources are shown as persoiUlel year equivalents (PYEs) and are not included in the PYs Funding includes $964 million in major maintenance contracts S583 million and 361 PYs in support costs and $43 million in Architectural and Engineering contracts (PYEs)
3 Drainage costs includes $125 million and 1345 PYs in State forces for maintenance and associated equipment and materials $126 million and 2795 PYs for major maintenance contract dollars and support and $35 million and 38 PYs fur the Culvert Inspection Program
9
2011 Five-Year Maintenance Plan
LEVEL OF INVESTMENT 3-EUMINATE BACKLOG (FIVE YEARS)
As shown in Table 4 with an additional $5159 million added to increase annual maintenance funding to more than $928 million all existing backlog ofmaintenance work will be eliminated over a five-year period Future SHOPP needs wilJ be significantly less than under either ofthe previously identified levels ofinvestment When funds are available starting in FY2012-20I3 the backlog ofpavement and bridge projects wiJl be reduced to zero after five years The pavement bacldog in FY2015-20l6 is estimated to be 510 lane miles with the increased funding effectively eliminating the pavement backlog (at that point annual maintenance funding could be decreased) At the projected rate of 14000 inspections a year there still will be 63000 culverts remaining in the inventory to be inspected at the end ofthe five years with an estimated 3220 culverts still needing repair work each year
Table 4
LEVEL OF INVESTMENT 3-ELIMINATE BACKLOG (FIVE YEARS)
Annual PVs
AaaaaiCost in Million
Dollars Annual
Accomplishments
Average Annual
Decrease in Backlog
Future SBOPPCost
Avoidance in Million
Dollars
Pavernent1 536 460 5600 lane miles 655 lane-mile decrease
2736
Bridge2 361 201 amp49 bridges 252 decrease 1928
Drainage3 731 267 6628 culverts 14000 inspections
6628 decrease
1335
Total 1628 928 -shy --shy 5999
1 Pavement costs include personal services and major maintenance contracts The proposed support funding is approximately 536 PYs and $60 million a year Annual costs include $400 million in major maintenance contracts
2 Bridge costs include State repair crews material$ equipment rental contract dollars and support Increased resources are shown as PYEs and are not included in the PYs Funding includes $ J201 million in major maintenance contracts $583 million and 361 PYs in support costs and $226 million inArchitectw-al and Engineering contracts (PYEs)
3 Drainage costs include $125 million and 1345 PYs in State forces for maintenance and associated equipment and materials $251 million and 5 585 PYs for major maintenance contract dollars and support and $35 million and 38 PYs for the Culvert lnspection Program
10
2011 Five-Year Maintenance Plan
RECOMMENDATION ON LEVEL OF INVESTMENT
In approving the 20 II Maintenance Plan the Governor and the Legislature recognize the importance ofcompleting critically needed maintenance work to the States infrastructure thus protecting Californias Wlique quality of life and ensuring its economic competitiveness in the global marketplace Overall recent decreases in material and energy costs and a declining California economy have increased the number ofbidders for department work thereby increasing the purchasing power ofcurrently identified resources needed to deliver the 2009 Maintenance Plan It is expected that this trend will continue over the next few years
Therefore Caltrans recommends continuing the Level oflnvestment l with no additional resources requested at this time The total cost estimate for the five years of the 2011 Maintenance Plan is $206 billion
The best use oftransportation resources demands a balanced mix ofpreventive maintenance and rehabilitation or replacement This balance is consistent and supports the principles ofGo California to ensure the wise investment ofexisting funding with a vision of improving mobility and safety
11
2011 Five-Year Maintenance Plan
APPENDIX
STREETS AND HIGHWAYS CODE SECTION 1646
1646(a) The department shall prepare a IO~year state rehabilitation plan for the rehabilitation and reconstruction or the combination thereof by the State Highway Operation and Protection Program ofall state highways and bridges owned by the state The plan shall identify all rehabilitation needs for the 10-year period beginning on July I 1998 and ending on June 30 2008 and shall include a schedule ofimprovements to complete all needed rehabilitation during the life of the plan not later than June 30 2008 The plan shall be updated every two years beginning in 2000 The plan shall include specific milestones and quantifiable accomplishments such as miles ofhighways to be repaved and number of bridges to be retrofitted The plan shall contain strategies to control cost and improve the efficiency of the program and include a cost estimate for at least the first five years of the program
(b) The department shall prepare a five-year maintenance plan that addresses the maintenance needs of the state highway system The plan shall be updated every two years concurrent with the rehabilitation plan described in subdivision (a) The maintenance plan shall include only maintenance activities that ifthe activities were not performed could result in increased State Highway Operation and Protection Program costs in the future These activities may include roadway structural and drainage maintenance The maintenance plan shall identify any existing backlog in these maintenance activities and shall recommend a strategy specific activities and an associated funding level to reduce or prevent any backlog during the plans five-year period The maintenance plan shall include specific goals and quantifiable accomplishments such as lane-miles ofhighway to be repaved and the number ofbridge decks to be sealed The maintenance plan shall contain strategies to control cost and improve the efficiency of these maintenance activities and include a cost estimate for the five years ofthe plan
(c) The rehabilitation plan and the maintenance plan shall attempt to balance resowces between State Highway Operation and Protection Program activities and maintenance activities in order to achieve identified milestones and goals at the lowest possible long-term total cost If the maintenance plan recommends increases in maintenance spending it shall identify projected future State Highway Operation and Protection Program costs that would be avoided by increasing maintenance spending The departments maintenance division shall develop a budget model that allows it to achieve the requirements ofthis subdivision
(d) The rehabilitation plan shall be submitted to the commission for review and comments not later than January 31 ofeach odd-numbered year and shall be transmitted to the Governor and the Legislature not later than May I ofeach odd-numbered year The maintenance plan shall be transmitted to the Governor the Legislature and the commission not later than January 31 ofeach odd-numbered year
(e) The rehabilitation plan and the maintenance plan shall be the basis for the departments budget request and for the adoption of fund estimates pursuant to Section 163
12
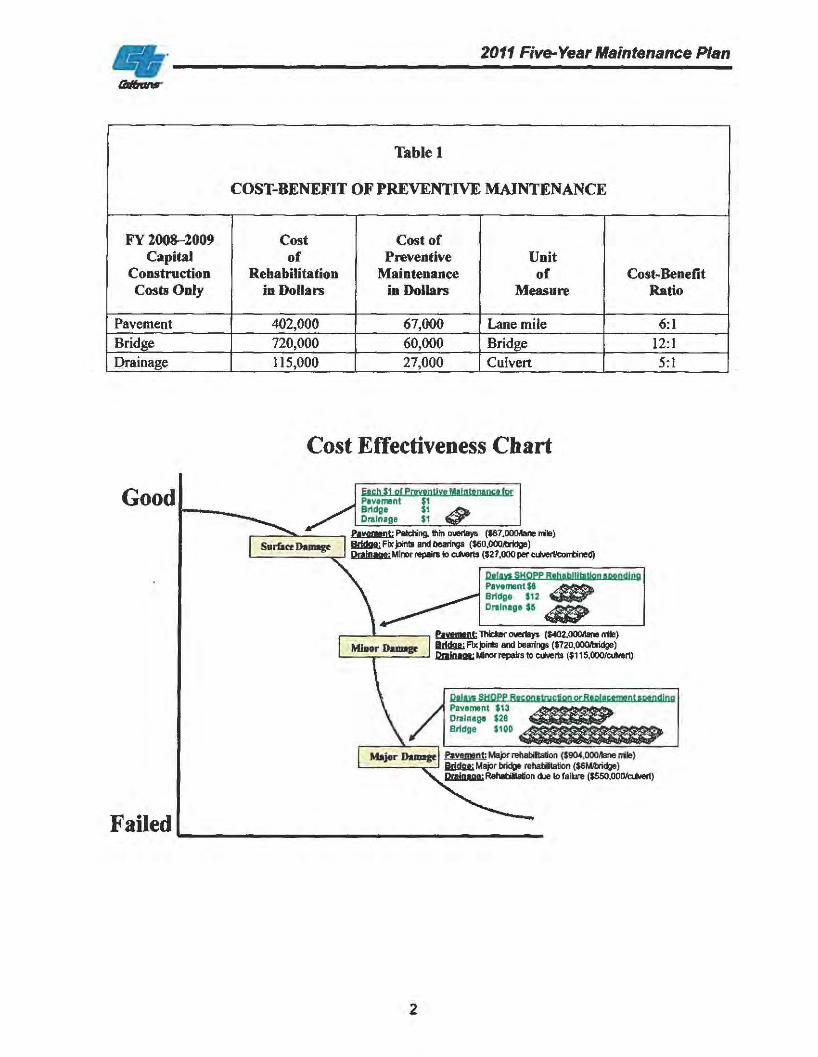

2011 Five-Year Maintenance Plan
The timely preventive maintenance made possible by authorized funding in previous maintenance plans has begun to slow the progression of bridges requiring major rehabilitation in the SHOPP
For FY 2008 2009 the Bridge Program recorded a 30 percent reduction in new SHOPP recommendations from historic levels This decrease in SHOPP recommendations is a welcome trend and demonstrates that SHOPP cost avoidance objectives in previous plans are being realized
Caltrans is pursuing numerous activities to maximize efficiencies and control the costs of bridge maintenance Among these are the uses of new materials that last longer and are easier to apply such as epoxy paints polyester concretes corrosion-resistant rebar and design details In addition Caltrans is implementing policies to ensure that new projects are constructed with cost-effective and easily maintainable elements as well as reviewing the activities ofother state Departments ofTransportation on an ongoing basis to ensure that the best business practices are employed in California
DRAINAGECULVERT MAINTENANCE
The State Highway System includes an estimated 205000 culverts These culverts drain the States highways serving as conduits for streams drainage channels and other waterways to flow under the highways Culvert damage or failure can seriously damage the roadway create the need for extensive repairs and threaten the mobility and safety of the traveling public The 2009 Maintenance Plan provided for continuation ofa proactive inspection program to identify damaged or failed culverts Management procedures have been developed to measure the health ofdrainage systems prioritize potential culvert projects based on condition cost and traveler delay and track accomplishments and delivery schedules for maintenance work
At the beginning ofFY 2008-2009 an estimated 9614 culverts with backlogged preventive maintenance needs were identified During FY 2008-2009 178 culverts were repaired under the Culvert Inspection Program In FY 2009-2010 the target repair of 174 culverts was projected with an estimated assessment rate of 14000 culverts A total of 156 culverts were repaired and more than 6000 culverts were assessed in FY 2009-201 0 The drop in assessment rate is attributed to several factors including limited resource availability due to the State Furlough Program and reductions in the travel expense budget to conduct site visits for several months due to the State Budget impasse At the beginning ofFY 2010-2011 the culvert backlog requiring preventive repairs was estimated to be 13185 and it was projected 174 culverts would need repair
About 36 percent ofapproximately 58000 culverts assessed to date require some form of maintenance With an increase of 12 percent from the previous year the corrective maintenance category at 23 percent is the fastest growing segment of the culvert inventory Based on the target rate of 14000 assessments a year and the estimated 23 percent of assessed culvert inventory requiring preventive work an additional 3220 culverts are estimated to be identified for corrective maintenance work each year Assuming a 23 percent rate of inventory requiring
5
2011 Five-Year Maintenance Plan
preventive work remains consistent for the entire inventory of205000 culverts an additional investment of$119 million will provide sufficient funds to reduce the inventory by 3314 culverts a year over a ten-year period An additional investment of$244 million will provide sufficient funds to reduce the same amotmt ofbacklog in a five-year period by 6628 culverts a year Culvert repair and replacement projects typically require multiyear environmental mitigation documents In addition right-of-way clearance must be obtained prior to entering private property These right-of-way activities require long lead times that typically include the purchase ofeasements andor titles in fees
Approximately 28 percent of the total State drainage system has been inspected to date Until the inventory is more complete and a large percentage ofrequired rehabilitation work is identified no additional funding for preventive drainage work will be requested The 2011 Maintenance Plan is recommending a funding level of$23 million annually to inspect assess and address culvert preventive maintenance and repairs This funding level slightly reduces the rate of backlog increase but in no way eliminates it Preventive maintenance for culverts is perfonned by a combination ofState forces and major maintenance contract work
The Culvert Inspection Program will continue to improve understanding ofthe circumstances leading to culvert failure and that knowledge will potentially lead to changes in design specifications construction methods and materials for improved culvert performance
Management procedures have been developed to measure the health ofdrainage systems prioritize potential culvert projects based on condition cost and traveler delay (measured both by traffic volume and detour length) and track accomplishments and delivery schedules of maintenance work In addition the use ofgeographic information systems technology will assist in reevaluating watersheds to ensure that culverts are meeting current design standards and will improve workforce expertise and the ability for quick response to emergencies involving culverts
MAINTENANCE PROGRAM BUDGET MODEL
The Maintenance Program budget model was developed to enhance budget management capabilities on an annual basis The performance-based model uses a combination ofhistorical expenditures Level ofService (LOS) performance measures and inventory data to project future resource needs with performance-level expectations for the entire State Highway System While the budget model does include all resources the model is used primarily to detennine a perfonnance-based budget for field maintenance activities
Historically the budget model grouped Caltrans twelve districts into sets of comparable units (using geographic population and traffic volume characteristics) Current versions ofthe model have shifted the focus from a district-level analysis to a route-level analysis by grouping all routes based on traffic volumes and geographic locations By creating a route-level analysis tool the budget model provides detailed comparative analysis for detennining relationships between performance and resource needs for each highway inventory unit which creates standardized allocation and efficiency rates for each route
6
lllttrJvulbull
2011 FlvbullYear Maintenance Plan
The budget model is used
bull To measure the direct relation between funding and LOS and the effects ofchanges to either
bull To measure an efficiency curve at the State route level for statewide comparisons
bull To measure a standardized allocation process for inventory items at a State route level for life-cycle cost and asset management practices
bull To assist decision-makers in detennining the best course ofaction relative to budgetary and performance issues
bull To predict funding needs based on project delivery actions and decisions
7
2011 Five-Year Maintenance Plan
ANALYSIS OF ALTERNATIVE LEVELS OF MAINTENANCE INVESTMENT
LEVEL OF INVESTMENT 1-BASELINE FUNDING
The current baseline annuaJ funding level is $4121 million as shown in Table 2 At the beginning ofFY 2008-2009 the backlog was 5941 pavement lane miles 2675 bridges and 9614 culverts It was estimated that the backlog would be reduced to 4463 lane miles by the beginning ofFY 2010-2011 and 2541 bridges by the beginning ofFY 2009-2010 The pavement backlog in FY 2020--2021 is estimated to be 772 lane miles with the current funding The extent of the drainage backlog as shown is projected until the inventory is more complete and a large percentage of the needed rehabilitation work is identified
Table2
LEVEL OF INVESTMENT l~URRENT BASELINE FUNDING
AnnuaiPYs
Annual Cost in Million Dollars
Annaal Accomplishments
Average Annual
Change in Backlog
Future SHOPPCost
Avoidance in Million
Dollars
Pavement 287 2340 2 700 lane miles 4091ane-mile decrease
1404
Bridge2 361 1551 689 bridges 92 decrease 1564 Drainage3 188 230 174 culverts
14000 inspections 3220 increase
115
Total 836 4121 - -shy 3083
1 Pavement costs include personal services and major maintename contracts Tbe current support funding is approximately 287 PYs (personnel years) and $30 million a year Annual costs include $204 million in major maintenance contracts
2 Bridge saructural resources include $925 mHlion in major maintenance contracts $583 miJiion and 361 PYs in personal services and operating expenses in support ofcontract delivery and $43 million in Architectural and Engineering contracts (PYEs )
3 Drainage costs include S125 million and 1345 PYs in State forces for maintenance and associated equipment and materials $7 million and I 55 PYs in major maintenance contract dollars and support and $35 million and 38 PYs for the Culvert Inspection Program
8
2011 Five-Year Maintenance Plan
LEVEL OF INVESTMENT 2--REDUCE BACKLOG (TEN YEARS)
As shown in Table 3 with an additional $2089 million added in FY 2012-2013 to increase the annual funding level to $621 million the backlog ofmaintenance needs will be reduced for pavement and bridges while reducing the known drainage backlog to zero at the end of the ten years This increase in investment of$86 million for pavement and $39 million for bridges will reduce the pavement baeldog annually by 604 lane miles and the bridge backlog by 126 bridges The pavement backlog in FY2020-2021 is estimated to be 56llane miles close to the 1 percent goal of the Pavement Program The increase in investment of$119 million for drainage will reduce the culvert backlog by 3314 culverts a year
Table 3
LEVEL OF INVESTMENT 2-REDUCE BACKLOG (TEN YEARS)
Aoaual PYs
Annual Cost in Million Dollars
Annual Accomplishments
Average Annual
Change in Backlog
Future SHOPPCost
Avoidaolaquo in Million Dollars
Pavement1 375 320 3900 lane miles 604 lane-mile decrease
1920
Bridge2 361 159 723 bridges 126 decrease 1641 Drainage3 452 142 3314 culverts
14000 inspections 3314 decrease
710
Total 1188 621 -shy --shy 4271
1Pavement costs include persooaJ services and major maintenance contracts The proposed support funding is approximately 37 PYs and $40 million a year Annual costs include $280 million in major maintenance contracts
2 Bridge costs include State forces for maintenance and associated equipment and materials inspection contract dollars and support Increased resources are shown as persoiUlel year equivalents (PYEs) and are not included in the PYs Funding includes $964 million in major maintenance contracts S583 million and 361 PYs in support costs and $43 million in Architectural and Engineering contracts (PYEs)
3 Drainage costs includes $125 million and 1345 PYs in State forces for maintenance and associated equipment and materials $126 million and 2795 PYs for major maintenance contract dollars and support and $35 million and 38 PYs fur the Culvert Inspection Program
9
2011 Five-Year Maintenance Plan
LEVEL OF INVESTMENT 3-EUMINATE BACKLOG (FIVE YEARS)
As shown in Table 4 with an additional $5159 million added to increase annual maintenance funding to more than $928 million all existing backlog ofmaintenance work will be eliminated over a five-year period Future SHOPP needs wilJ be significantly less than under either ofthe previously identified levels ofinvestment When funds are available starting in FY2012-20I3 the backlog ofpavement and bridge projects wiJl be reduced to zero after five years The pavement bacldog in FY2015-20l6 is estimated to be 510 lane miles with the increased funding effectively eliminating the pavement backlog (at that point annual maintenance funding could be decreased) At the projected rate of 14000 inspections a year there still will be 63000 culverts remaining in the inventory to be inspected at the end ofthe five years with an estimated 3220 culverts still needing repair work each year
Table 4
LEVEL OF INVESTMENT 3-ELIMINATE BACKLOG (FIVE YEARS)
Annual PVs
AaaaaiCost in Million
Dollars Annual
Accomplishments
Average Annual
Decrease in Backlog
Future SBOPPCost
Avoidance in Million
Dollars
Pavernent1 536 460 5600 lane miles 655 lane-mile decrease
2736
Bridge2 361 201 amp49 bridges 252 decrease 1928
Drainage3 731 267 6628 culverts 14000 inspections
6628 decrease
1335
Total 1628 928 -shy --shy 5999
1 Pavement costs include personal services and major maintenance contracts The proposed support funding is approximately 536 PYs and $60 million a year Annual costs include $400 million in major maintenance contracts
2 Bridge costs include State repair crews material$ equipment rental contract dollars and support Increased resources are shown as PYEs and are not included in the PYs Funding includes $ J201 million in major maintenance contracts $583 million and 361 PYs in support costs and $226 million inArchitectw-al and Engineering contracts (PYEs)
3 Drainage costs include $125 million and 1345 PYs in State forces for maintenance and associated equipment and materials $251 million and 5 585 PYs for major maintenance contract dollars and support and $35 million and 38 PYs for the Culvert lnspection Program
10
2011 Five-Year Maintenance Plan
RECOMMENDATION ON LEVEL OF INVESTMENT
In approving the 20 II Maintenance Plan the Governor and the Legislature recognize the importance ofcompleting critically needed maintenance work to the States infrastructure thus protecting Californias Wlique quality of life and ensuring its economic competitiveness in the global marketplace Overall recent decreases in material and energy costs and a declining California economy have increased the number ofbidders for department work thereby increasing the purchasing power ofcurrently identified resources needed to deliver the 2009 Maintenance Plan It is expected that this trend will continue over the next few years
Therefore Caltrans recommends continuing the Level oflnvestment l with no additional resources requested at this time The total cost estimate for the five years of the 2011 Maintenance Plan is $206 billion
The best use oftransportation resources demands a balanced mix ofpreventive maintenance and rehabilitation or replacement This balance is consistent and supports the principles ofGo California to ensure the wise investment ofexisting funding with a vision of improving mobility and safety
11
2011 Five-Year Maintenance Plan
APPENDIX
STREETS AND HIGHWAYS CODE SECTION 1646
1646(a) The department shall prepare a IO~year state rehabilitation plan for the rehabilitation and reconstruction or the combination thereof by the State Highway Operation and Protection Program ofall state highways and bridges owned by the state The plan shall identify all rehabilitation needs for the 10-year period beginning on July I 1998 and ending on June 30 2008 and shall include a schedule ofimprovements to complete all needed rehabilitation during the life of the plan not later than June 30 2008 The plan shall be updated every two years beginning in 2000 The plan shall include specific milestones and quantifiable accomplishments such as miles ofhighways to be repaved and number of bridges to be retrofitted The plan shall contain strategies to control cost and improve the efficiency of the program and include a cost estimate for at least the first five years of the program
(b) The department shall prepare a five-year maintenance plan that addresses the maintenance needs of the state highway system The plan shall be updated every two years concurrent with the rehabilitation plan described in subdivision (a) The maintenance plan shall include only maintenance activities that ifthe activities were not performed could result in increased State Highway Operation and Protection Program costs in the future These activities may include roadway structural and drainage maintenance The maintenance plan shall identify any existing backlog in these maintenance activities and shall recommend a strategy specific activities and an associated funding level to reduce or prevent any backlog during the plans five-year period The maintenance plan shall include specific goals and quantifiable accomplishments such as lane-miles ofhighway to be repaved and the number ofbridge decks to be sealed The maintenance plan shall contain strategies to control cost and improve the efficiency of these maintenance activities and include a cost estimate for the five years ofthe plan
(c) The rehabilitation plan and the maintenance plan shall attempt to balance resowces between State Highway Operation and Protection Program activities and maintenance activities in order to achieve identified milestones and goals at the lowest possible long-term total cost If the maintenance plan recommends increases in maintenance spending it shall identify projected future State Highway Operation and Protection Program costs that would be avoided by increasing maintenance spending The departments maintenance division shall develop a budget model that allows it to achieve the requirements ofthis subdivision
(d) The rehabilitation plan shall be submitted to the commission for review and comments not later than January 31 ofeach odd-numbered year and shall be transmitted to the Governor and the Legislature not later than May I ofeach odd-numbered year The maintenance plan shall be transmitted to the Governor the Legislature and the commission not later than January 31 ofeach odd-numbered year
(e) The rehabilitation plan and the maintenance plan shall be the basis for the departments budget request and for the adoption of fund estimates pursuant to Section 163
12
2011 Five-Year Maintenance Plan
preventive work remains consistent for the entire inventory of205000 culverts an additional investment of$119 million will provide sufficient funds to reduce the inventory by 3314 culverts a year over a ten-year period An additional investment of$244 million will provide sufficient funds to reduce the same amotmt ofbacklog in a five-year period by 6628 culverts a year Culvert repair and replacement projects typically require multiyear environmental mitigation documents In addition right-of-way clearance must be obtained prior to entering private property These right-of-way activities require long lead times that typically include the purchase ofeasements andor titles in fees
Approximately 28 percent of the total State drainage system has been inspected to date Until the inventory is more complete and a large percentage ofrequired rehabilitation work is identified no additional funding for preventive drainage work will be requested The 2011 Maintenance Plan is recommending a funding level of$23 million annually to inspect assess and address culvert preventive maintenance and repairs This funding level slightly reduces the rate of backlog increase but in no way eliminates it Preventive maintenance for culverts is perfonned by a combination ofState forces and major maintenance contract work
The Culvert Inspection Program will continue to improve understanding ofthe circumstances leading to culvert failure and that knowledge will potentially lead to changes in design specifications construction methods and materials for improved culvert performance
Management procedures have been developed to measure the health ofdrainage systems prioritize potential culvert projects based on condition cost and traveler delay (measured both by traffic volume and detour length) and track accomplishments and delivery schedules of maintenance work In addition the use ofgeographic information systems technology will assist in reevaluating watersheds to ensure that culverts are meeting current design standards and will improve workforce expertise and the ability for quick response to emergencies involving culverts
MAINTENANCE PROGRAM BUDGET MODEL
The Maintenance Program budget model was developed to enhance budget management capabilities on an annual basis The performance-based model uses a combination ofhistorical expenditures Level ofService (LOS) performance measures and inventory data to project future resource needs with performance-level expectations for the entire State Highway System While the budget model does include all resources the model is used primarily to detennine a perfonnance-based budget for field maintenance activities
Historically the budget model grouped Caltrans twelve districts into sets of comparable units (using geographic population and traffic volume characteristics) Current versions ofthe model have shifted the focus from a district-level analysis to a route-level analysis by grouping all routes based on traffic volumes and geographic locations By creating a route-level analysis tool the budget model provides detailed comparative analysis for detennining relationships between performance and resource needs for each highway inventory unit which creates standardized allocation and efficiency rates for each route
6
lllttrJvulbull
2011 FlvbullYear Maintenance Plan
The budget model is used
bull To measure the direct relation between funding and LOS and the effects ofchanges to either
bull To measure an efficiency curve at the State route level for statewide comparisons
bull To measure a standardized allocation process for inventory items at a State route level for life-cycle cost and asset management practices
bull To assist decision-makers in detennining the best course ofaction relative to budgetary and performance issues
bull To predict funding needs based on project delivery actions and decisions
7
2011 Five-Year Maintenance Plan
ANALYSIS OF ALTERNATIVE LEVELS OF MAINTENANCE INVESTMENT
LEVEL OF INVESTMENT 1-BASELINE FUNDING
The current baseline annuaJ funding level is $4121 million as shown in Table 2 At the beginning ofFY 2008-2009 the backlog was 5941 pavement lane miles 2675 bridges and 9614 culverts It was estimated that the backlog would be reduced to 4463 lane miles by the beginning ofFY 2010-2011 and 2541 bridges by the beginning ofFY 2009-2010 The pavement backlog in FY 2020--2021 is estimated to be 772 lane miles with the current funding The extent of the drainage backlog as shown is projected until the inventory is more complete and a large percentage of the needed rehabilitation work is identified
Table2
LEVEL OF INVESTMENT l~URRENT BASELINE FUNDING
AnnuaiPYs
Annual Cost in Million Dollars
Annaal Accomplishments
Average Annual
Change in Backlog
Future SHOPPCost
Avoidance in Million
Dollars
Pavement 287 2340 2 700 lane miles 4091ane-mile decrease
1404
Bridge2 361 1551 689 bridges 92 decrease 1564 Drainage3 188 230 174 culverts
14000 inspections 3220 increase
115
Total 836 4121 - -shy 3083
1 Pavement costs include personal services and major maintename contracts Tbe current support funding is approximately 287 PYs (personnel years) and $30 million a year Annual costs include $204 million in major maintenance contracts
2 Bridge saructural resources include $925 mHlion in major maintenance contracts $583 miJiion and 361 PYs in personal services and operating expenses in support ofcontract delivery and $43 million in Architectural and Engineering contracts (PYEs )
3 Drainage costs include S125 million and 1345 PYs in State forces for maintenance and associated equipment and materials $7 million and I 55 PYs in major maintenance contract dollars and support and $35 million and 38 PYs for the Culvert Inspection Program
8
2011 Five-Year Maintenance Plan
LEVEL OF INVESTMENT 2--REDUCE BACKLOG (TEN YEARS)
As shown in Table 3 with an additional $2089 million added in FY 2012-2013 to increase the annual funding level to $621 million the backlog ofmaintenance needs will be reduced for pavement and bridges while reducing the known drainage backlog to zero at the end of the ten years This increase in investment of$86 million for pavement and $39 million for bridges will reduce the pavement baeldog annually by 604 lane miles and the bridge backlog by 126 bridges The pavement backlog in FY2020-2021 is estimated to be 56llane miles close to the 1 percent goal of the Pavement Program The increase in investment of$119 million for drainage will reduce the culvert backlog by 3314 culverts a year
Table 3
LEVEL OF INVESTMENT 2-REDUCE BACKLOG (TEN YEARS)
Aoaual PYs
Annual Cost in Million Dollars
Annual Accomplishments
Average Annual
Change in Backlog
Future SHOPPCost
Avoidaolaquo in Million Dollars
Pavement1 375 320 3900 lane miles 604 lane-mile decrease
1920
Bridge2 361 159 723 bridges 126 decrease 1641 Drainage3 452 142 3314 culverts
14000 inspections 3314 decrease
710
Total 1188 621 -shy --shy 4271
1Pavement costs include persooaJ services and major maintenance contracts The proposed support funding is approximately 37 PYs and $40 million a year Annual costs include $280 million in major maintenance contracts
2 Bridge costs include State forces for maintenance and associated equipment and materials inspection contract dollars and support Increased resources are shown as persoiUlel year equivalents (PYEs) and are not included in the PYs Funding includes $964 million in major maintenance contracts S583 million and 361 PYs in support costs and $43 million in Architectural and Engineering contracts (PYEs)
3 Drainage costs includes $125 million and 1345 PYs in State forces for maintenance and associated equipment and materials $126 million and 2795 PYs for major maintenance contract dollars and support and $35 million and 38 PYs fur the Culvert Inspection Program
9
2011 Five-Year Maintenance Plan
LEVEL OF INVESTMENT 3-EUMINATE BACKLOG (FIVE YEARS)
As shown in Table 4 with an additional $5159 million added to increase annual maintenance funding to more than $928 million all existing backlog ofmaintenance work will be eliminated over a five-year period Future SHOPP needs wilJ be significantly less than under either ofthe previously identified levels ofinvestment When funds are available starting in FY2012-20I3 the backlog ofpavement and bridge projects wiJl be reduced to zero after five years The pavement bacldog in FY2015-20l6 is estimated to be 510 lane miles with the increased funding effectively eliminating the pavement backlog (at that point annual maintenance funding could be decreased) At the projected rate of 14000 inspections a year there still will be 63000 culverts remaining in the inventory to be inspected at the end ofthe five years with an estimated 3220 culverts still needing repair work each year
Table 4
LEVEL OF INVESTMENT 3-ELIMINATE BACKLOG (FIVE YEARS)
Annual PVs
AaaaaiCost in Million
Dollars Annual
Accomplishments
Average Annual
Decrease in Backlog
Future SBOPPCost
Avoidance in Million
Dollars
Pavernent1 536 460 5600 lane miles 655 lane-mile decrease
2736
Bridge2 361 201 amp49 bridges 252 decrease 1928
Drainage3 731 267 6628 culverts 14000 inspections
6628 decrease
1335
Total 1628 928 -shy --shy 5999
1 Pavement costs include personal services and major maintenance contracts The proposed support funding is approximately 536 PYs and $60 million a year Annual costs include $400 million in major maintenance contracts
2 Bridge costs include State repair crews material$ equipment rental contract dollars and support Increased resources are shown as PYEs and are not included in the PYs Funding includes $ J201 million in major maintenance contracts $583 million and 361 PYs in support costs and $226 million inArchitectw-al and Engineering contracts (PYEs)
3 Drainage costs include $125 million and 1345 PYs in State forces for maintenance and associated equipment and materials $251 million and 5 585 PYs for major maintenance contract dollars and support and $35 million and 38 PYs for the Culvert lnspection Program
10
2011 Five-Year Maintenance Plan
RECOMMENDATION ON LEVEL OF INVESTMENT
In approving the 20 II Maintenance Plan the Governor and the Legislature recognize the importance ofcompleting critically needed maintenance work to the States infrastructure thus protecting Californias Wlique quality of life and ensuring its economic competitiveness in the global marketplace Overall recent decreases in material and energy costs and a declining California economy have increased the number ofbidders for department work thereby increasing the purchasing power ofcurrently identified resources needed to deliver the 2009 Maintenance Plan It is expected that this trend will continue over the next few years
Therefore Caltrans recommends continuing the Level oflnvestment l with no additional resources requested at this time The total cost estimate for the five years of the 2011 Maintenance Plan is $206 billion
The best use oftransportation resources demands a balanced mix ofpreventive maintenance and rehabilitation or replacement This balance is consistent and supports the principles ofGo California to ensure the wise investment ofexisting funding with a vision of improving mobility and safety
11
2011 Five-Year Maintenance Plan
APPENDIX
STREETS AND HIGHWAYS CODE SECTION 1646
1646(a) The department shall prepare a IO~year state rehabilitation plan for the rehabilitation and reconstruction or the combination thereof by the State Highway Operation and Protection Program ofall state highways and bridges owned by the state The plan shall identify all rehabilitation needs for the 10-year period beginning on July I 1998 and ending on June 30 2008 and shall include a schedule ofimprovements to complete all needed rehabilitation during the life of the plan not later than June 30 2008 The plan shall be updated every two years beginning in 2000 The plan shall include specific milestones and quantifiable accomplishments such as miles ofhighways to be repaved and number of bridges to be retrofitted The plan shall contain strategies to control cost and improve the efficiency of the program and include a cost estimate for at least the first five years of the program
(b) The department shall prepare a five-year maintenance plan that addresses the maintenance needs of the state highway system The plan shall be updated every two years concurrent with the rehabilitation plan described in subdivision (a) The maintenance plan shall include only maintenance activities that ifthe activities were not performed could result in increased State Highway Operation and Protection Program costs in the future These activities may include roadway structural and drainage maintenance The maintenance plan shall identify any existing backlog in these maintenance activities and shall recommend a strategy specific activities and an associated funding level to reduce or prevent any backlog during the plans five-year period The maintenance plan shall include specific goals and quantifiable accomplishments such as lane-miles ofhighway to be repaved and the number ofbridge decks to be sealed The maintenance plan shall contain strategies to control cost and improve the efficiency of these maintenance activities and include a cost estimate for the five years ofthe plan
(c) The rehabilitation plan and the maintenance plan shall attempt to balance resowces between State Highway Operation and Protection Program activities and maintenance activities in order to achieve identified milestones and goals at the lowest possible long-term total cost If the maintenance plan recommends increases in maintenance spending it shall identify projected future State Highway Operation and Protection Program costs that would be avoided by increasing maintenance spending The departments maintenance division shall develop a budget model that allows it to achieve the requirements ofthis subdivision
(d) The rehabilitation plan shall be submitted to the commission for review and comments not later than January 31 ofeach odd-numbered year and shall be transmitted to the Governor and the Legislature not later than May I ofeach odd-numbered year The maintenance plan shall be transmitted to the Governor the Legislature and the commission not later than January 31 ofeach odd-numbered year
(e) The rehabilitation plan and the maintenance plan shall be the basis for the departments budget request and for the adoption of fund estimates pursuant to Section 163
12

2011 Five-Year Maintenance Plan
LEVEL OF INVESTMENT 2--REDUCE BACKLOG (TEN YEARS)
As shown in Table 3 with an additional $2089 million added in FY 2012-2013 to increase the annual funding level to $621 million the backlog ofmaintenance needs will be reduced for pavement and bridges while reducing the known drainage backlog to zero at the end of the ten years This increase in investment of$86 million for pavement and $39 million for bridges will reduce the pavement baeldog annually by 604 lane miles and the bridge backlog by 126 bridges The pavement backlog in FY2020-2021 is estimated to be 56llane miles close to the 1 percent goal of the Pavement Program The increase in investment of$119 million for drainage will reduce the culvert backlog by 3314 culverts a year
Table 3
LEVEL OF INVESTMENT 2-REDUCE BACKLOG (TEN YEARS)
Aoaual PYs
Annual Cost in Million Dollars
Annual Accomplishments
Average Annual
Change in Backlog
Future SHOPPCost
Avoidaolaquo in Million Dollars
Pavement1 375 320 3900 lane miles 604 lane-mile decrease
1920
Bridge2 361 159 723 bridges 126 decrease 1641 Drainage3 452 142 3314 culverts
14000 inspections 3314 decrease
710
Total 1188 621 -shy --shy 4271
1Pavement costs include persooaJ services and major maintenance contracts The proposed support funding is approximately 37 PYs and $40 million a year Annual costs include $280 million in major maintenance contracts
2 Bridge costs include State forces for maintenance and associated equipment and materials inspection contract dollars and support Increased resources are shown as persoiUlel year equivalents (PYEs) and are not included in the PYs Funding includes $964 million in major maintenance contracts S583 million and 361 PYs in support costs and $43 million in Architectural and Engineering contracts (PYEs)
3 Drainage costs includes $125 million and 1345 PYs in State forces for maintenance and associated equipment and materials $126 million and 2795 PYs for major maintenance contract dollars and support and $35 million and 38 PYs fur the Culvert Inspection Program
9
2011 Five-Year Maintenance Plan
LEVEL OF INVESTMENT 3-EUMINATE BACKLOG (FIVE YEARS)
As shown in Table 4 with an additional $5159 million added to increase annual maintenance funding to more than $928 million all existing backlog ofmaintenance work will be eliminated over a five-year period Future SHOPP needs wilJ be significantly less than under either ofthe previously identified levels ofinvestment When funds are available starting in FY2012-20I3 the backlog ofpavement and bridge projects wiJl be reduced to zero after five years The pavement bacldog in FY2015-20l6 is estimated to be 510 lane miles with the increased funding effectively eliminating the pavement backlog (at that point annual maintenance funding could be decreased) At the projected rate of 14000 inspections a year there still will be 63000 culverts remaining in the inventory to be inspected at the end ofthe five years with an estimated 3220 culverts still needing repair work each year
Table 4
LEVEL OF INVESTMENT 3-ELIMINATE BACKLOG (FIVE YEARS)
Annual PVs
AaaaaiCost in Million
Dollars Annual
Accomplishments
Average Annual
Decrease in Backlog
Future SBOPPCost
Avoidance in Million
Dollars
Pavernent1 536 460 5600 lane miles 655 lane-mile decrease
2736
Bridge2 361 201 amp49 bridges 252 decrease 1928
Drainage3 731 267 6628 culverts 14000 inspections
6628 decrease
1335
Total 1628 928 -shy --shy 5999
1 Pavement costs include personal services and major maintenance contracts The proposed support funding is approximately 536 PYs and $60 million a year Annual costs include $400 million in major maintenance contracts
2 Bridge costs include State repair crews material$ equipment rental contract dollars and support Increased resources are shown as PYEs and are not included in the PYs Funding includes $ J201 million in major maintenance contracts $583 million and 361 PYs in support costs and $226 million inArchitectw-al and Engineering contracts (PYEs)
3 Drainage costs include $125 million and 1345 PYs in State forces for maintenance and associated equipment and materials $251 million and 5 585 PYs for major maintenance contract dollars and support and $35 million and 38 PYs for the Culvert lnspection Program
10
2011 Five-Year Maintenance Plan
RECOMMENDATION ON LEVEL OF INVESTMENT
In approving the 20 II Maintenance Plan the Governor and the Legislature recognize the importance ofcompleting critically needed maintenance work to the States infrastructure thus protecting Californias Wlique quality of life and ensuring its economic competitiveness in the global marketplace Overall recent decreases in material and energy costs and a declining California economy have increased the number ofbidders for department work thereby increasing the purchasing power ofcurrently identified resources needed to deliver the 2009 Maintenance Plan It is expected that this trend will continue over the next few years
Therefore Caltrans recommends continuing the Level oflnvestment l with no additional resources requested at this time The total cost estimate for the five years of the 2011 Maintenance Plan is $206 billion
The best use oftransportation resources demands a balanced mix ofpreventive maintenance and rehabilitation or replacement This balance is consistent and supports the principles ofGo California to ensure the wise investment ofexisting funding with a vision of improving mobility and safety
11
2011 Five-Year Maintenance Plan
APPENDIX
STREETS AND HIGHWAYS CODE SECTION 1646
1646(a) The department shall prepare a IO~year state rehabilitation plan for the rehabilitation and reconstruction or the combination thereof by the State Highway Operation and Protection Program ofall state highways and bridges owned by the state The plan shall identify all rehabilitation needs for the 10-year period beginning on July I 1998 and ending on June 30 2008 and shall include a schedule ofimprovements to complete all needed rehabilitation during the life of the plan not later than June 30 2008 The plan shall be updated every two years beginning in 2000 The plan shall include specific milestones and quantifiable accomplishments such as miles ofhighways to be repaved and number of bridges to be retrofitted The plan shall contain strategies to control cost and improve the efficiency of the program and include a cost estimate for at least the first five years of the program
(b) The department shall prepare a five-year maintenance plan that addresses the maintenance needs of the state highway system The plan shall be updated every two years concurrent with the rehabilitation plan described in subdivision (a) The maintenance plan shall include only maintenance activities that ifthe activities were not performed could result in increased State Highway Operation and Protection Program costs in the future These activities may include roadway structural and drainage maintenance The maintenance plan shall identify any existing backlog in these maintenance activities and shall recommend a strategy specific activities and an associated funding level to reduce or prevent any backlog during the plans five-year period The maintenance plan shall include specific goals and quantifiable accomplishments such as lane-miles ofhighway to be repaved and the number ofbridge decks to be sealed The maintenance plan shall contain strategies to control cost and improve the efficiency of these maintenance activities and include a cost estimate for the five years ofthe plan
(c) The rehabilitation plan and the maintenance plan shall attempt to balance resowces between State Highway Operation and Protection Program activities and maintenance activities in order to achieve identified milestones and goals at the lowest possible long-term total cost If the maintenance plan recommends increases in maintenance spending it shall identify projected future State Highway Operation and Protection Program costs that would be avoided by increasing maintenance spending The departments maintenance division shall develop a budget model that allows it to achieve the requirements ofthis subdivision
(d) The rehabilitation plan shall be submitted to the commission for review and comments not later than January 31 ofeach odd-numbered year and shall be transmitted to the Governor and the Legislature not later than May I ofeach odd-numbered year The maintenance plan shall be transmitted to the Governor the Legislature and the commission not later than January 31 ofeach odd-numbered year
(e) The rehabilitation plan and the maintenance plan shall be the basis for the departments budget request and for the adoption of fund estimates pursuant to Section 163
12
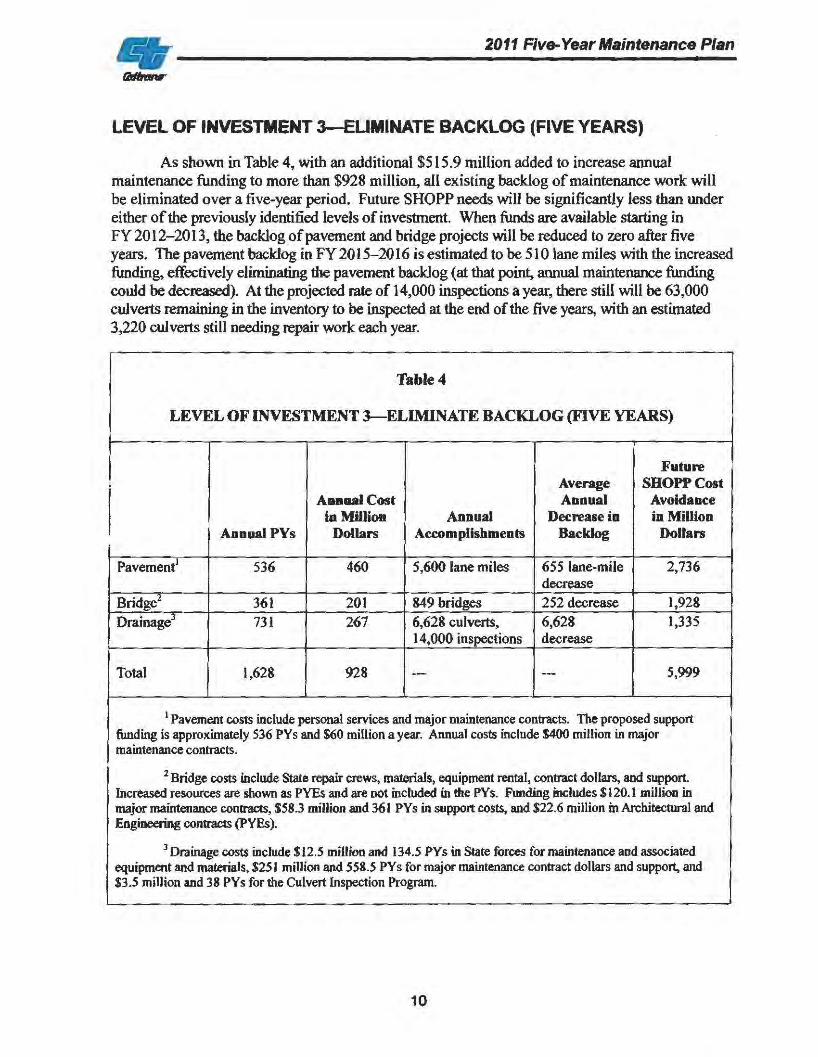
2011 Five-Year Maintenance Plan
APPENDIX
STREETS AND HIGHWAYS CODE SECTION 1646
1646(a) The department shall prepare a IO~year state rehabilitation plan for the rehabilitation and reconstruction or the combination thereof by the State Highway Operation and Protection Program ofall state highways and bridges owned by the state The plan shall identify all rehabilitation needs for the 10-year period beginning on July I 1998 and ending on June 30 2008 and shall include a schedule ofimprovements to complete all needed rehabilitation during the life of the plan not later than June 30 2008 The plan shall be updated every two years beginning in 2000 The plan shall include specific milestones and quantifiable accomplishments such as miles ofhighways to be repaved and number of bridges to be retrofitted The plan shall contain strategies to control cost and improve the efficiency of the program and include a cost estimate for at least the first five years of the program
(b) The department shall prepare a five-year maintenance plan that addresses the maintenance needs of the state highway system The plan shall be updated every two years concurrent with the rehabilitation plan described in subdivision (a) The maintenance plan shall include only maintenance activities that ifthe activities were not performed could result in increased State Highway Operation and Protection Program costs in the future These activities may include roadway structural and drainage maintenance The maintenance plan shall identify any existing backlog in these maintenance activities and shall recommend a strategy specific activities and an associated funding level to reduce or prevent any backlog during the plans five-year period The maintenance plan shall include specific goals and quantifiable accomplishments such as lane-miles ofhighway to be repaved and the number ofbridge decks to be sealed The maintenance plan shall contain strategies to control cost and improve the efficiency of these maintenance activities and include a cost estimate for the five years ofthe plan
(c) The rehabilitation plan and the maintenance plan shall attempt to balance resowces between State Highway Operation and Protection Program activities and maintenance activities in order to achieve identified milestones and goals at the lowest possible long-term total cost If the maintenance plan recommends increases in maintenance spending it shall identify projected future State Highway Operation and Protection Program costs that would be avoided by increasing maintenance spending The departments maintenance division shall develop a budget model that allows it to achieve the requirements ofthis subdivision
(d) The rehabilitation plan shall be submitted to the commission for review and comments not later than January 31 ofeach odd-numbered year and shall be transmitted to the Governor and the Legislature not later than May I ofeach odd-numbered year The maintenance plan shall be transmitted to the Governor the Legislature and the commission not later than January 31 ofeach odd-numbered year
(e) The rehabilitation plan and the maintenance plan shall be the basis for the departments budget request and for the adoption of fund estimates pursuant to Section 163
12