2011 Employee Benefits Survey Report - Washington · Employee Benefits Survey Report. December...
40
Medical benefits Health-insurance costs Premium coverage Retirement plans Paid leave 2012 EMPLOYEE BENEFITS SURVEY REPORT Washington State Employment Security Department Labor Market and Economic Analysis December 2012
Transcript of 2011 Employee Benefits Survey Report - Washington · Employee Benefits Survey Report. December...
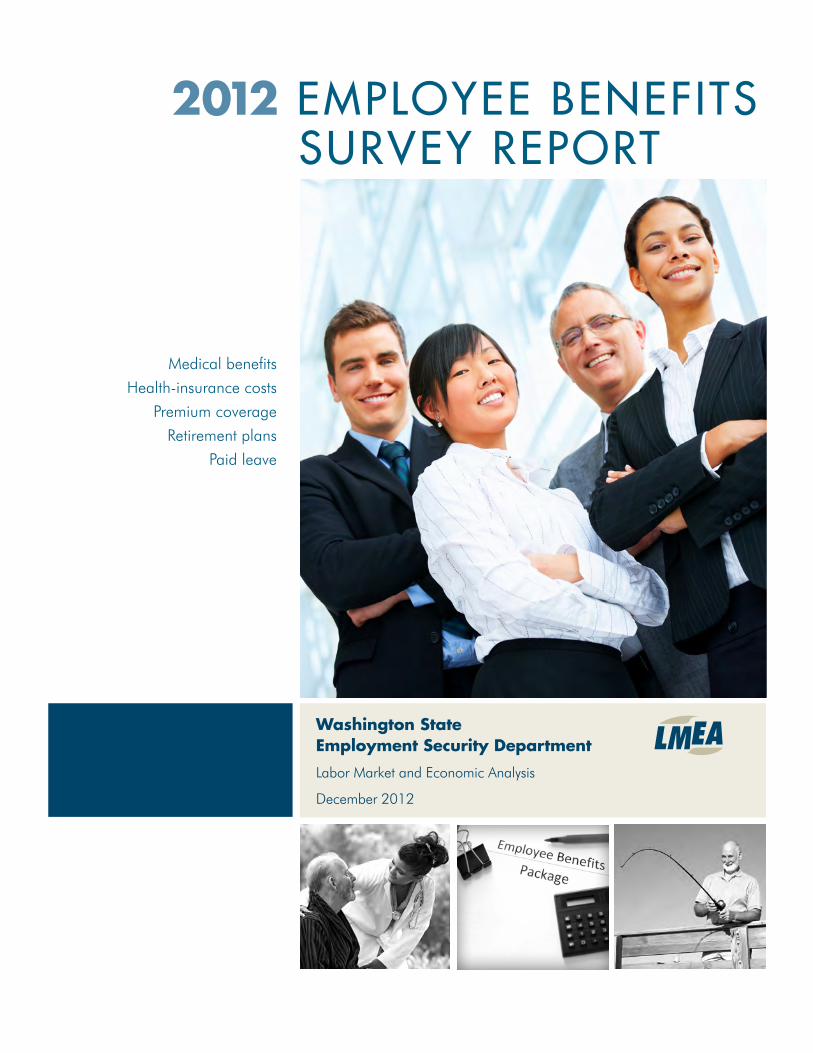
Medical benefits
Health-insurance costs
Premium coverage
Retirement plans
Paid leave
2012 EMPLOYEE BENEFITSSURVEY REPORT
Washington State Employment Security Department
Labor Market and Economic Analysis
December 2012

Washington State Employment Security DepartmentPaul Trause, commissioner
Labor Market and Economic Analysis Jami Mills, economic analystEstimates by Alexander Roubinchtein, economic analystSurvey and data collection supervised by Isabelle Hoczek, survey supervisor
For more information, alternative formats or additional reports, call the Employment Security Department Labor Market Information Center at 800-215-1617.
The Employment Security Department is an equal-opportunity employer and provider of programs and services. Auxiliary aids and services are available upon request to people with disabilities.
Washington Relay Service: 800-833-6384.
‘Employee Group’ Photo by ©Yuri Arcurs/Dreamstime.com‘Nurse and patient’ Photo by ©mandygodbehear/Canstockphoto.com‘Employee Benefits’ Photo by ©TomSchmucker/Dreamstime.com‘Retired Fisherman’ Photo by ©Lisa F. Young/Dreamstime.com
Employee Benefits Survey Report
December 2012
LM-12-0308

2012 Employee Benefits Survey ReportEmployment Security Department
Contents
About the employee benefits survey ........................................................................................................ 1
Changes to the survey .............................................................................................................................. 1
Executive summary ...................................................................................................................................... 3
Key findings .............................................................................................................................................. 3
Health insurance ................................................................................................................................. 3
Retirement plans ................................................................................................................................. 4
Paid leave ............................................................................................................................................ 4
Results of the 2012 employee benefits survey ........................................................................................ 5
Firms and employment ............................................................................................................................. 6
By firm size.......................................................................................................................................... 6
By industry .......................................................................................................................................... 7 Health insurance ....................................................................................................................................... 8
Health-insurance premiums ................................................................................................................ 12
Coverage change ................................................................................................................................. 13
Retirement plans ....................................................................................................................................... 14
Paid leave .................................................................................................................................................. 15
Appendices .................................................................................................................................................... 19

2012 Employee Benefits Survey ReportEmployment Security Department
December 2012

December 2012Page 1
2012 Employee Benefits Survey ReportEmployment Security Department
About the employee benefits survey
Every year, the Employment Security Department (ESD) surveys Washington employers to collect information about the benefits they offer employees. In 2012, ESD conducted a survey of 16,000 Washington employers. This survey collected information on the health insurance, retirement and paid-leave benefits that employers offer full-time and part-time employees.
The sample was drawn from the universe of employers that have employees covered by unemployment insurance and, except for the education and healthcare industries, are not government entities; public administration industries and private household employers were also excluded. This report provides results on employee benefits by firm size and in the appendices, by industry.
Changes to the surveyThe Employment Security Department has conducted the employee benefits survey since 2003. Beginning this year, improvements were made in the sampling, estimations approach and questions asked of employers. These changes resulted in improved reporting on Washington’s employment conditions, but do inhibit comparisons to previous years’ results.
Although respondents were encouraged to complete the survey by answering all questions, there were instances where partial responses were reported and recorded. This created a different number of responses per question, resulting in different total responses by question. Results were estimated as a percentage of all the responses received for each question.
This report presents results from the employee benefits survey conducted July through August 2012. See Appendix 2 for more information about the survey and how it was conducted.

December 2012Page 2
2012 Employee Benefits Survey ReportEmployment Security Department

December 2012Page 3
2012 Employee Benefits Survey ReportEmployment Security Department
Executive summaryFringe benefits are an important part of how employees are compensated. Information about employee benefits is useful to job seekers, employers and policy-makers. The 2012 employee benefits survey collected information about benefits (health insurance, retirement and paid leave) offered to full- and part-time workers employed by private-sector employers and public-sector education and healthcare employers. The population of firms represented accounted for more than 139,400 firms and more than 2.5 million employees.
A total of 16,000 employers were surveyed, with a response rate of 57 percent. Due to improvements in the survey questionnaire, estimations cannot be compared to previous years’ results.
Key findingsDetailed results of the survey are published in the appendices at the end of this report, along with a brief methodology and a copy of the survey form. The percent of firms that offered benefits to full-time employees far exceeded the percentage of firms that offered benefits to part-time employees. In addition, the percentage of full-time employees was larger than the percentage of part-time employees who worked for firms offering benefits.
Health insurance• More than half (55.5 percent) of employers offered health
insurance to their full-time employees, but just 12.1 percent of employers offered health insurance to part-time employees.
• More than 89 percent of full-time employees worked for a company that offered health insurance, compared to 35 percent of part-time employees who worked for a company that offered health insurance.
• Overall, 94.7 percent of full-time employees who worked for companies that offered health insurance were eligible to receive benefits; and 72.3 percent of part-time employees were eligible.
• Of all eligible employees who worked for companies that offered health insurance, those with full-time status were more likely to enroll in health insurance when compared to part-time employees (83.5 and 63.6 percent, respectively).
• Total monthly health-insurance premiums averaged $517 for all enrolled employees. Firms paid an estimated 84.7 percent of premiums for full-time employees, compared to 75.4 percent for part-time employees.

December 2012Page 4
2012 Employee Benefits Survey ReportEmployment Security Department
• Most firms reported no change in coverage offered to their employees over the year (90.9 percent). Only 6 percent of firms reported a change in coverage offered to employees. Even fewer firms started or stopped coverage offered to employees (1.8 and 1.6 percent, respectively).
Retirement plans• The percent of employers (37.2 percent) that offered defined-
contribution plans to their full-time employees was more than twice the percent of employers (15.4 percent) that offered defined-contribution plans to their part-time employees.
• Just 2.8 percent of employers offered defined-benefit plans to full-time employees, and only 1.4 percent of employers offered these plans to part-time employees.
• More than three-quarters (75.9 percent) of full-time employees worked for a firm that offered a defined-contribution retirement plan, and 18.2 percent worked for a firm that offered a defined-benefit plan.
• Fewer than half (43.6 percent) of part-time employees worked for a firm that offered a defined-contribution retirement plan, and 19.9 percent worked for a firm that offered a defined-benefit plan.
Paid leaveWashington state employers were asked whether they offered each of four different types of paid leave: undesignated (or paid time off), sick, vacation and holiday. The 2012 survey found that undesignated and holiday leave were most commonly offered to both full- and part-time employees.
• Nearly two-thirds of firms offered undesignated or holiday leave to full-time employees (63.5 and 65.1 percent, respectively). Undesignated and holiday leave were most common for part-time employees as well; almost one-quarter of firms offered undesignated (24.8 percent) or holiday leave (22.1 percent) to part-time employees.
• Of employees who worked for a firm that offered paid leave, undesignated leave was most common for both full- and part-time employees (85.5 and 39.8 percent, respectively).

December 2012Page 5
2012 Employee Benefits Survey ReportEmployment Security Department
This employee benefits survey gathered information on the health insurance, retirement and paid-leave benefits offered to full- and part-time employees.
2012 employee benefits survey resultsThe percent of firms that offered benefits to full-time employees far exceeded the percentage of firms that offered benefits to part-time employees (Figure 1). More than half of all firms offered health insurance or paid holiday and undesignated leave to their full-time employees. The greatest percentage of firms that offered benefits to part-time employees was the one-quarter that offered paid undesignated leave.
Figure 1. Percentage of firms that offered benefitsWashington state, 2012Source: Employment Security Department/LMEA
The percentage of firms that offered benefits to full-time employees far exceeded the percent of firms that offered benefits to part-time employees.
Figure 2 shows the percentage of employees who worked for firms that offered benefits. A far greater percentage of full-time, than part-time, employees worked for such firms. Nearly 89 percent of full-time employees worked for a firm that offered health insurance. It was most common for part-time employees to work for firms that offered a defined-contribution retirement plan (43.6 percent).
Full-time employees, for the most part, were more likely to work for firms that offered benefits than part-time employees. The only benefit that bucked the trend was defined-benefit retirement plans; nearly 20 percent of part-time employees (compared to 18.2 percent of full-time employees) worked for firms that offered defined-benefit retirement plans.
0% 10% 20% 30% 40% 50% 60% 70% 80% 90% 100%
Paid undesignated leave
Paid holiday leave
Paid vacation leave
Paid sick leave
Retirement (defined benefit)
Retirement (defined contribution)
Health insurance
Percent of firms
Bene
fits o
ffere
d
Firms that offered benefits to full-time employees
Firms that offered benefits to part-time employees

December 2012Page 6
2012 Employee Benefits Survey ReportEmployment Security Department
Health insurance is the benefit most
commonly offered to full-time employees.
0% 20% 40% 60% 80% 100%
Paid undesignated leave
Paid holiday leave
Paid vacation leave
Paid sick leave
Retirement (defined benefit)
Retirement (defined contribution)
Health insurance
Percent of employees
Bene
fits
Full-time employees who worked for firms that offered benefitsPart-time employees who worked for firms that offered benefits
Figure 2. Percentage of full- and part-time employees who worked for firms that offered benefitsWashington state, 2012Source: Employment Security Department/LMEA
Full-time employees were more likely to work for a firm that offered benefits except for defined-contribution retirement plans.
Firms and employmentExamining the distribution of Washington’s employers and employees by size of firm and industry gives context to the benefits information in this report. This report provides results on employee benefits by firm size, and, in the appendices, by industry.
By firm sizeLooking at the employer universe from which the survey sample was pulled, the majority of employers had fewer than 10 employees, but more employees worked for larger firms (Figure 3). Of private-sector employers and public-sector education and healthcare employers, covered by the unemployment-insurance system in the third quarter of 2011, 77.5 percent of firms employed fewer than 10 employees, but accounted for only 13 percent of all employment. The opposite is true for firms that employed 500 or more employees. While making up a very small portion of total firms (0.4 percent), they accounted for 37 percent of employment.

December 2012Page 7
2012 Employee Benefits Survey ReportEmployment Security Department
The majority of employers had fewer than 10 employees, but more employees worked for larger firms.
Figure 3. Statewide distribution of firms and employment, by firm sizeWashington state, third quarter 2011Source: Employment Security Department/LMEA; U.S. Bureau of Labor Statistics, Quarterly Census of Employment and Wages
While the majority of employers had fewer than 10 employees, more employees worked for firms with 100 or more employees.
By industryLooking at the employer universe from which the survey sample was pulled, three industry sectors accounted for more than one-third of firms in the state. These were construction (12.5 percent), professional, scientific and technical services (12 percent) and healthcare and social assistance (10 percent). Retail trade and accommodation and food services also made up large percentages of firms across the state.
Three industry sectors also accounted for more than one-third of employment (Figure 4). Healthcare and social assistance had the largest share (14.1 percent), followed by retail trade (12.7 percent) and manufacturing (10.7 percent).
0% 10% 20% 30% 40% 50% 60% 70% 80%
Fewer than 10
10 to 24
25 to 49
50 to 99
100 to 499
500 or more
Percent
Firm
size
by n
umbe
r of e
mlo
yees
Distribution of firms
Distribution of employment

December 2012Page 8
2012 Employee Benefits Survey ReportEmployment Security Department
Figure 4. Statewide distribution of firms and employment, by industryWashington state, third quarter 2011Source: Employment Security Department/LMEA; U.S. Bureau of Labor Statistics, Quarterly Census of Employment and Wages
NAICS Industry title Percent of all firms Percent of employment
11 Agriculture, forestry, fishing and hunting 4.4% 3.1%
21 Mining 0.1% 0.1%
22 Utilities 0.2% 0.3%
23 Construction 12.5% 5.0%
31-33 Manufacturing 4.6% 10.7%
42 Wholesale trade 8.4% 4.8%
44-45 Retail trade 9.5% 12.7%
48-49 Transportation and warehousing 2.6% 2.9%
51 Information 1.6% 4.0%
52 Finance and insurance 3.6% 3.6%
53 Real estate and rental and leasing 4.1% 1.7%
54 Professional, scientific and technical services 12.0% 6.3%
55 Management of companies and enterprises 0.1% 0.2%
56 Administrative and support and waste management 6.2% 6.1%
61 Educational services 1.9% 10.4%
62 Healthcare and social assistance 10.0% 14.1%
71 Arts, entertainment and recreation 1.6% 1.8%
72 Accommodation and food services 9.0% 9.0%
81 Other services (except public administration) 7.6% 3.1% Although construction (12.5 percent) accounted for the largest share of firms in Washington state, the largest share of employment was in healthcare and social assistance (14.1 percent).
Health insuranceMore detailed questions were asked about health insurance than other benefits. As with the other types of benefits in the survey, whether or not a firm offered benefits was affected by the size of the employer and whether an employee worked full time or part time (Figure 5). Overall, firms were more than four times as likely to offer health insurance to full-time employees (55.5 percent) as they were to part-time employees (12.1 percent).

December 2012Page 9
2012 Employee Benefits Survey ReportEmployment Security Department
In 2012, about 56 percent of full-time employees and 12 percent of part-time employees worked for a company that offered health-insurance benefits.
Figure 5. Percentage of firms that offered health insurance, by firm sizeWashington state, 2012Source: Employment Security Department/LMEA
Firms were more than four times as likely to offer health insurance to full-time employees (55.5 percent) as they were to part-time employees (12.1 percent).
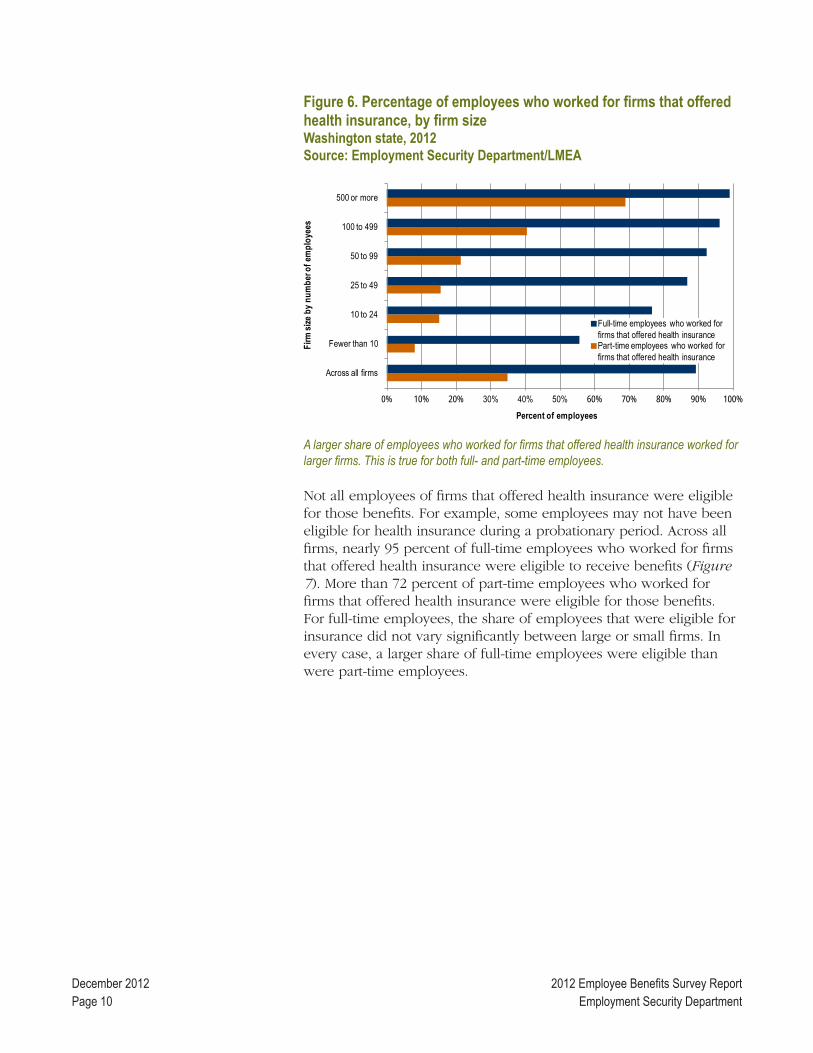
A larger share of employees who worked for firms that offered health insurance worked for larger firms. This was true for both full- and part-time employees. Of full-time employees who worked for firms that employed 500 or more people, more than 98 percent of those employees were working for a company that offered health insurance, compared to 55.6 percent in firms that employed fewer than 10 (Figure 6). A similar pattern was reported for part-time employees. Almost 69 percent of part-time employees, in firms that employed 500 or more, worked for firms that offered health insurance, compared to 8 percent in firms that employed fewer than 10.
0% 10% 20% 30% 40% 50% 60% 70% 80% 90% 100%
Across all firms
Fewer than 10
10 to 24
25 to 49
50 to 99
100 to 499
500 or more
Percent of firms
Firm
size
by n
umbe
r of e
mpl
oyee
s
Firms that offered health insurance to full-time employeesFirms that offered health insurance to part-time employees
December 2012Page 10
2012 Employee Benefits Survey ReportEmployment Security Department
Figure 6. Percentage of employees who worked for firms that offered health insurance, by firm sizeWashington state, 2012Source: Employment Security Department/LMEA
A larger share of employees who worked for firms that offered health insurance worked for larger firms. This is true for both full- and part-time employees.
Not all employees of firms that offered health insurance were eligible for those benefits. For example, some employees may not have been eligible for health insurance during a probationary period. Across all firms, nearly 95 percent of full-time employees who worked for firms that offered health insurance were eligible to receive benefits (Figure 7). More than 72 percent of part-time employees who worked for firms that offered health insurance were eligible for those benefits. For full-time employees, the share of employees that were eligible for insurance did not vary significantly between large or small firms. In every case, a larger share of full-time employees were eligible than were part-time employees.
0% 10% 20% 30% 40% 50% 60% 70% 80% 90% 100%
Across all firms
Fewer than 10
10 to 24
25 to 49
50 to 99
100 to 499
500 or more
Percent of employees
Firm
size
by n
umbe
r of e
mpl
oyee
sFull-time employees who worked for firms that offered health insurancePart-time employees who worked for firms that offered health insurance

December 2012Page 11
2012 Employee Benefits Survey ReportEmployment Security Department
Figure 7. Percentage of employees eligible for health insurance at firms that offered health insurance, by firm sizeWashington state, 2012Source: Employment Security Department/LMEA
Across all firms, 94.7 percent of full-time employees who worked for companies that offered health insurance were eligible to receive benefits; and 72.3 percent of part-time employees were eligible.
Of those employees eligible for health insurance, not all choose to enroll. For example, employees may have chosen not to enroll if they were covered under a spouse’s health insurance. Figure 8 details the percentages of employees enrolled in health insurance. Larger shares of eligible full-time employees were enrolled in health insurance than were part-time employees. Across all firms, 83.5 percent of eligible full-time employees were enrolled in health insurance, compared to 63.6 percent of part-time employees.
0% 10% 20% 30% 40% 50% 60% 70% 80% 90% 100%
Across all firms
Fewer than 10
10 to 24
25 to 49
50 to 99
100 to 499
500 or more
Percent of employees
Firm
size
by n
umbe
r of e
mpl
oyee
s
Full-time employees eligble for health insurance Part-time employees eligble for health insurance

December 2012Page 12
2012 Employee Benefits Survey ReportEmployment Security Department
Monthly health-insurance premiums for enrolled
employees averaged $517 in 2012.
Figure 8. Percentage of eligible employees enrolled in health insurance, by firm sizeWashington state, 2012Source: Employment Security Department/LMEA
Across all firms, 83.5 percent of eligible full-time employees were enrolled in health insurance, compared to 63.6 percent of part-time employees.
Health-insurance premiumsThis year’s survey asked about the average premium paid per employee and the percent employers paid toward that cost. Across all firms, monthly health-insurance premiums averaged $517 in 2012 (Figure 9). Premiums were highest in firms with 500 or more employees ($590), compared to firms with 50 to 99 employees ($450).
Firms with fewer than 10 employees paid the highest share of monthly premiums for their full-time employees (88.3 percent) compared to larger firms with 500 or more employees who paid a lesser share (83 percent).
Firms with fewer than 10 employees also paid the highest share of monthly premiums for their part-time employees (77.6 percent), while firms with 10 to 24 employees paid a lesser share (70.9 percent).
Data on health-insurance costs by industry are in Appendix 7.
0% 10% 20% 30% 40% 50% 60% 70% 80% 90% 100%
Across all firms
Fewer than 10
10 to 24
25 to 49
50 to 99
100 to 499
500 or more
Percent of employees
Firm
size
by n
umbe
r of e
mpl
oyee
s
Full-time employees Part-time employees

December 2012Page 13
2012 Employee Benefits Survey ReportEmployment Security Department
Figure 9. Total monthly health-insurance premium and employer-paid share for enrolled employees, by firm sizeWashington state, 2012Source: Employment Security Department/LMEA
Firm sizeMonthly health
insurance-premium
Percent of premium covered for full-time employees
Percent of premium covered for part-time employees
Fewer than 10 $475 88.3% 83.3%
10 to 24 $482 86.8% 70.9%
25 to 49 $452 84.1% 82.9%
50 to 99 $450 83.9% 75.6%
100 to 499 $501 84.4% 74.6%
500 or more $590 83.0% 74.8%
Across all firms $517 84.7% 75.4% Firms with 500 or more employees paid the highest premiums ($590) but contributed a lesser share for full-time employees (83 percent) than smaller firms contributed.
Coverage changeFirms were also asked if they started, reduced or stopped offering health insurance to their employees in the last year (Figure 10). Most firms reported no change in coverage offered to their employees over the year (90.9 percent). Only 6 percent of firms reported a change in coverage offered to employees. Even fewer firms started or stopped coverage offered to employees (1.8 and 1.6 percent, respectively).
Figure 10. Changes to health-insurance coverage, by firm sizeWashington state, 2012Source: Employment Security Department/LMEA
Firm sizeCoverage
startsCoverage reduced
Coverage stops
Coverage the same
500 or more 7.7% 7.3% 3.3% 86.6%
100 to 499 3.1% 6.6% 0.8% 90.2%
50 to 99 3.1% 9.4% *N/A 87.5%
25 to 49 2.3% 10.2% 1.2% 86.7%
10 to 24 1.4% 9.2% 1.5% 88.2%
Fewer than 10 1.6% 4.9% 1.6% 92.0%
Across all firms 1.8% 6.0% 1.6% 90.9% Note: These categories are not exclusive and, therefore, will not add to 100 percent.*Only results, which passed publication standards (based on number of responses and confidence intervals), are reported. See Appendix 2 for more details about these standards.
More than 90 percent of firms reported no change in coverage over the year. Only 6 percent of firms reported a change in coverage offered to employees. Even fewer firms started or stopped coverage offered to employees (1.8 and 1.6 percent, respectively).

December 2012Page 14
2012 Employee Benefits Survey ReportEmployment Security Department
Firms were more likely to offer defined-benefit
plans to full-time employees than to
part-time employees.
Retirement plansThe survey asked employers whether they offered defined-contribution plans, defined-benefit plans or none at all to their full- and part-time employees.
Defined-contribution plans are more common. These plans guarantee a predetermined employer contribution to a retirement account. Examples include target-benefit and money-purchase pensions, profit sharing, 401(k) plans and stock-bonus plans. In 2012, 37.2 percent of firms offered defined-contribution plans to full-time employees (Figure 11), and 15.4 percent of firms offered these plans to part-time employees. Defined-benefit plans are less common. These plans guarantee a predetermined retirement benefit at retirement. Examples include defined-benefit pensions and cash-balance pension plans. The 2012 survey found that firms were also more likely to offer defined-benefit plans to full-time employees (2.8 percent) than to part-time employees (1.4 percent).
The survey found the majority of retirement offerings were defined-contribution plans, regardless of whether the worker was in full- or part-time status.
Figure 11. Percentage of firms that offered retirement plans, by firm sizeWashington state, 2012Source: Employment Security Department/LMEA
Firms that offered retirement plans to full-time employees
Firms that offered retirement plans to part-time employees
Firm size by number of employees
Definedcontribution
Definedbenefit
Not offered
Definedcontribution
Definedbenefit
Not offered
Fewer than 10 29.8% 1.8% 69.8% 9.8% 0.4% 90.1%
10 to 24 44.8% 3.2% 54.4% 18.6% 1.7% 81.0%
25 to 49 60.0% 4.5% 39.2% 31.8% 2.6% 67.9%
50 to 99 73.9% 7.0% 24.7% 44.1% 5.2% 54.7%
100 to 499 83.9% 12.6% 14.2% 59.8% 10.6% 38.4%
500 or more 89.6% 36.7% 6.6% 74.4% 37.2% 21.1%
Across all firms 37.2% 2.8% 62.2% 15.4% 1.4% 84.3%
Note: These categories are not exclusive and, therefore, will not add to 100 percent.
The majority of firms offered defined-contribution plans, regardless of whether the worker was in full- or part-time status.

December 2012Page 15
2012 Employee Benefits Survey ReportEmployment Security Department
For the most part, full-time employees were more likely to work for firms that offered benefits than part-time employees. More than three-quarters of full-time employees worked for firms that offered defined-contribution plans, compared to 43.6 percent of part-time employees (Figure 12). The single benefit to stray away from this trend was defined-benefit retirement plans; nearly 20 percent of part-time employees (compared to 18.2 percent of part-time employees) worked for firms that offered defined-benefit retirement plans.
Figure 12. Percentage of employees who worked for firms that offered retirement plans, by firm sizeWashington state, 2012Source: Employment Security Department/LMEA
Firm size by number of employees
Full-time employees who worked for firms that offered retirement plans
Part-time employees who worked for firms that offered retirement plans
Definedcontribution
Definedbenefit
Not offered
Definedcontribution
Definedbenefit
Not offered
Fewer than 10 48.8% 1.8% 50.9% 9.2% 0.3% 90.7%
10 to 24 56.1% 9.6% 41.7% 17.0% 8.2% 81.0%
25 to 49 71.4% 5.4% 27.6% 26.3% 1.7% 73.6%
50 to 99 82.4% 5.5% 16.9% 33.3% 5.6% 65.6%
100 to 499 90.3% 13.3% 7.9% 60.7% 16.2% 37.3%
500 or more 89.4% 43.5% 6.1% 79.8% 51.1% 15.6%
Across all firms 75.9% 18.2% 21.9% 43.6% 19.9% 54.3%
Note: These categories are not exclusive and, therefore, will not add to 100 percent.
Full-time employees, for the most part, were more likely to work for firms that offered benefits than part-time employees. The only benefit that bucked the trend was defined-benefit retirement plans; nearly 20 percent of part-time employees (compared to 18.2 percent of part-time employees) worked for firms that offered defined-benefit retirement plans.
Data on retirement plans by industry are in Appendices 8 and 9.
Paid leaveEmployers were asked about paid leave offered to employees, with response options of undesignated (or paid time off), sick, vacation and holiday leave.
These categories are not exclusive, and some firms offered multiple types of paid leave.
Firms were more likely to offer paid leave to full-time employees than part-time employees (Figure 13), staying consistent with the overall trend of this report. Undesignated and holiday leave were the most common types of paid leave offered to full- and part-time

December 2012Page 16
2012 Employee Benefits Survey ReportEmployment Security Department
employees, across all firms. Firms with 50 or more employees were most likely to offer undesignated leave to full-time employees; however, smaller firms with 49 or fewer employees were most likely to offer holiday leave to full-time employees. Undesignated leave was the most common type of paid leave offered to part-time employees, regardless of firm size. Sick leave was least offered among paid-leave types and among all firm sizes.
Figure 13. Percentage of firms that offered paid leave, by firm sizeWashington state, 2012Source: Employment Security Department/LMEA
Note: These categories are not exclusive and, therefore, will not add to 100 percent.
Undesignated and holiday leave were the most common type of paid leave offered to full- and part-time employees, across all firms.
Among both full- and part-time employees who worked for firms that offered paid leave, undesignated leave (paid time off) was most commonly offered, 85.5 and 39.8 percent in that order (Figure 14). Holiday pay was next most commonly offered; about 78 percent of full-time employees worked for firms that offered paid holiday and nearly 37 percent of part-time employees.
Firm size by number of employees
Firms that offered paid leave to full-time employees Firms that offered paid leave to part-time employees
Undesignated Sick leave Vacation Holiday Undesignated Sick leave Vacation Holiday
Fewer than 10 60.1% 24.3% 42.3% 61.5% 22.0% 8.2% 13.6% 19.8%
10 to 24 66.0% 27.2% 44.1% 69.9% 27.3% 10.8% 14.6% 24.9%
25 to 49 73.9% 34.0% 48.6% 77.2% 29.9% 13.5% 17.9% 29.3%
50 to 99 82.9% 35.8% 56.5% 80.2% 33.5% 16.4% 24.2% 23.4%
100 to 499 87.7% 50.3% 67.0% 81.2% 50.5% 31.4% 39.6% 40.4%
500 or more 91.2% 57.2% 80.2% 87.0% 67.5% 42.7% 62.6% 58.1%
Across all firms 63.5% 26.6% 44.2% 65.1% 24.8% 10.0% 15.4% 22.1%

December 2012Page 17
2012 Employee Benefits Survey ReportEmployment Security Department
Figure 14. Percentage of employees who worked for firms that offered paid leave, by firm sizeWashington state, 2012Source: Employment Security Department/LMEA
Note: These categories are not exclusive and, therefore, will not add to 100 percent.
Between both full- and part-time employees who worked for firms that offered paid leave, undesignated leave (paid time off) was most commonly offered.
Firm size by number of employees
Full-time employees who worked for firms that offered paid leave Part-time employees who worked for firms that offered paid leave
Undesignated Sick leave Vacation Holiday Undesignated Sick leave Vacation Holiday
Fewer than 10 70.6% 35.0% 45.1% 63.9% 19.6% 7.7% 11.8% 18.1%
10 to 24 75.6% 34.1% 51.1% 76.2% 24.6% 14.1% 17.0% 26.1%
25 to 49 83.0% 40.9% 54.0% 80.2% 22.3% 11.3% 11.7% 24.1%
50 to 99 84.7% 34.1% 52.7% 77.7% 23.8% 11.2% 21.2% 19.1%
100 to 499 90.0% 54.3% 67.3% 79.9% 46.0% 30.9% 41.1% 39.5%
500 or more 95.7% 70.3% 80.7% 83.5% 67.0% 45.6% 70.6% 61.8%
Across all firms 85.5% 49.8% 62.7% 77.5% 39.8% 24.7% 36.3% 36.9%

December 2012Page 18
2012 Employee Benefits Survey ReportEmployment Security Department

December 2012Page 19
2012 Employee Benefits Survey ReportEmployment Security Department
AppendicesAppendix 1. Industry definitionsWe define and sort establishments into industries based on the North American Industry Classification System (NAICS). The U.S. Bureau of Labor Statistics, other federal agencies and most state employment agencies also use NAICS for industry-based research and reporting.
The table below lists the 20 major industry classifications and descriptions. To learn more, visit the U.S. Bureau of Labor Statistics NAICS website at www.bls.gov/bls/naics.htm.
Figure A-1: Industry definitionsSource: U.S. Bureau of Labor Statistics
NAICS Industry title Industry definitions
11 Agriculture, forestry, fishing and hunting Firms engaged in growing crops, raising animals, harvesting timber, harvesting fish and other animals from farms, ranches or the animals' natural habitat.
21 Mining Firms that extract naturally-occurring mineral solids, liquid minerals and gases.
22 Utilities Firms engaged in generating, transmitting, and/or distributing electricity, gas, steam and water, and removing sewage through a permanent infrastructure.
23 Construction Firms engaged in erecting buildings and other structures; heavy construction other than buildings; and alterations, reconstruction, installation, and maintenance and repairs.
31-33 Manufacturing Firms engaged in the mechanical, physical or chemical transformation of material, substances or components into new products.
41-43 Wholesale trade Firms engaged in selling or arranging for the purchase of sale of goods for resale; capital or durable nonconsumer goods; and raw and intermediate materials and supplies used in productions, and providing services incidental to the sale of merchandise.
44-46 Retail trade Firms engaged in retailing merchandise generally in small quantities to the general public and providing services incidental to the sale of the merchandise.
48-49 Transportation and warehousing Firms that provide transportation of passengers and cargo, warehousing and storing goods, scenic and sightseeing transportation, and supporting these activities.
51 Information Firms engaged in distributing information and cultural products, providing the means to transmit or distribute these products as data or communications and processing data.
52 Finance and insurance Firms engaged in the creation, liquidation or change in ownership of financial assets (financial transactions) and/or facilitating financial transaction.
53 Real estate and rental and leasing Firms engaged in renting, leasing or otherwise allowing the use of tangible or intangible assets (except copyrighted works), and providing related services.
54 Professional, scientific and technical services Firms specializing in performing professional, scientific and technical services for the operations of other organizations.
55 Management of companies and enterprises Firms who hold securities of companies and enterprises, for the purpose of owning controlling interest or influencing their management decision, or administering, overseeing and managing other establishments of the same company or enterprise and normally undertaking the strategic or organizational planning and decision making of the company or enterprise.
56 Administrative and support and waste management and remediation services
Firms performing routine support activities for the day-to-day operation of other organizations.
61 Educational services Firms providing instruction and training in a wide variety of subjects.
62 Healthcare and social assistance Firms providing healthcare and social assistance for individuals.
71 Arts, entertainment and recreation Firms engaged in the operation of providing services to meet varied cultural, entertainment and recreational interests of their patrons.
Online appendices

December 2012Page 20
2012 Employee Benefits Survey ReportEmployment Security Department
NAICS Industry title Industry definitions
72 Accommodation and food services Firms providing customers with lodging and/or preparing meals, snacks and beverages for immediate consumption.
81 Other services (except public administration) Firms providing services not specifically provided for elsewhere in the classification system including repairs, religious activities, grant making, advocacy, laundry, personal care, healthcare and other personal services.
92* Public administration Federal, state and local government agencies that administer, oversee and manage public programs and have executive, legislative or judicial authority over other institutions in a given area.
*Public administration was excluded from the employer universe from which the survey sample was drawn and for which estimates are provided in this report.

December 2012Page 21
2012 Employee Benefits Survey ReportEmployment Security Department
Appendix 2. Survey methodology and response rateApproachThe Employment Security Department surveys Washington employers each summer to collect information about the benefits offered to their employees. This survey collected information on the health insurance, retirement and paid leave benefits that employers offered full- and part-time employees.
The sample was drawn from the universe of employers that had employees covered by unemployment insurance and, except for the education and healthcare industries, were not government entities; public administration and private households were also excluded.
Surveys were collected by mail and phone in July through September 2012.
Sample design The employee benefits survey sample was a non-stratified sample, using Probability Proportionate to Size (PPS) without replacement.1
Initial weights were defined as inverse probabilities of selection. The base for this sample is the Enhanced Quarterly Unemployment Insurance (EQUI) file for the third quarter 2011, with the sample drawn by establishment account. The EQUI contains all employers and employment covered by the unemployment-insurance system for Washington state. From the EQUI file, private households and public administration industry establishments were removed and firms with multiple locations and establishments were counted as a single firm under its primary account, creating the sample that was used for this survey. Establishments that fell under government ownership, except in the case of public-sector education and healthcare, were also excluded from the sample. From this sample, establishments were selected to be contacted. The total employment referenced in this report is the employment of the sample universe. To account for missing values (non-responses and invalid responses) we assumed (based on results from the non-response survey) that for each class size, missing values had the same statistical distribution as primary sample units (PSU) with valid responses. Based on this assumption, primary weights were adjusted for missing values and the final weights used for estimations were calculated.
1This method is more complex than selection with replacement, but provides the ability to produce estimations that are more accurate. Under the PPS method of sample selection, for each stratum, the relative size of each sampling unit must not exceed (1/SAMPSIZE). CERTSIZE was used to avoid such error and to identify certainty selections, which have selection probabilities equal to 1. The certainty size was calculated to be 115. To avoid extreme weights for small units, MINSIZE was used; when a size value is less than the MINSIZE value, the size value is adjusted upward to equal the MINSIZE value. The MINSIZE used was 7.
December 2012Page 22
2012 Employee Benefits Survey ReportEmployment Security Department
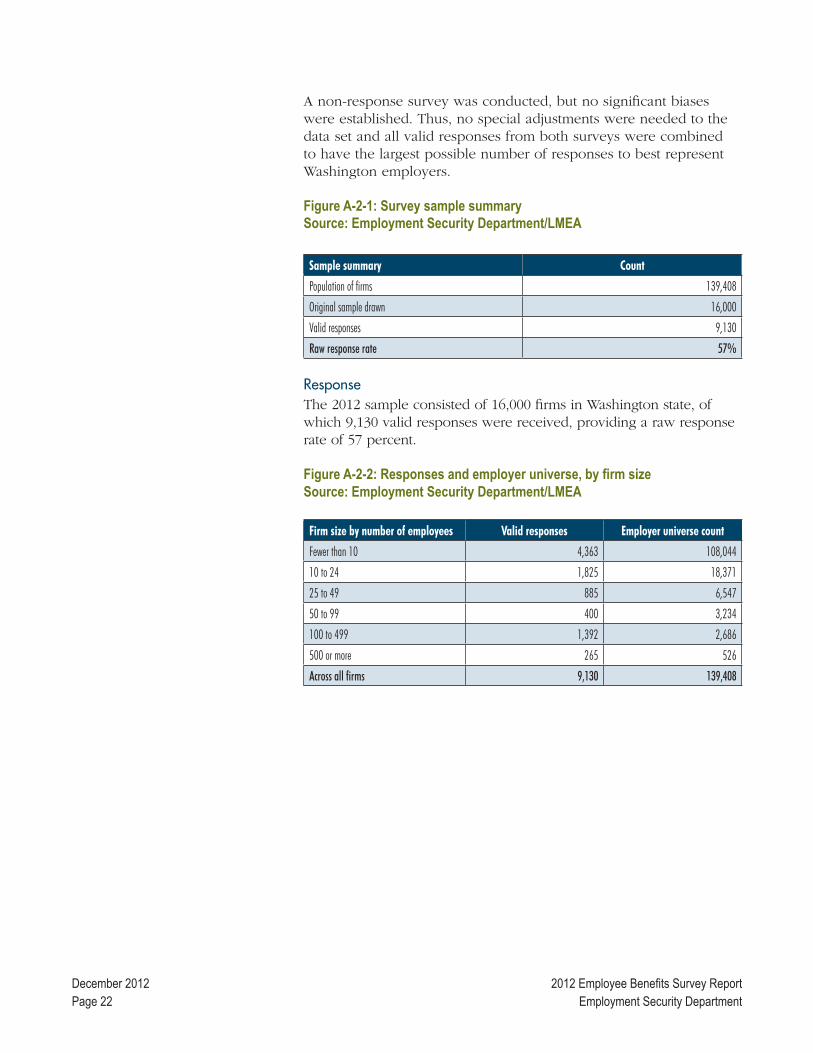
A non-response survey was conducted, but no significant biases were established. Thus, no special adjustments were needed to the data set and all valid responses from both surveys were combined to have the largest possible number of responses to best represent Washington employers.
Figure A-2-1: Survey sample summarySource: Employment Security Department/LMEA
Sample summary Count
Population of firms 139,408
Original sample drawn 16,000
Valid responses 9,130
Raw response rate 57% Response The 2012 sample consisted of 16,000 firms in Washington state, of which 9,130 valid responses were received, providing a raw response rate of 57 percent.
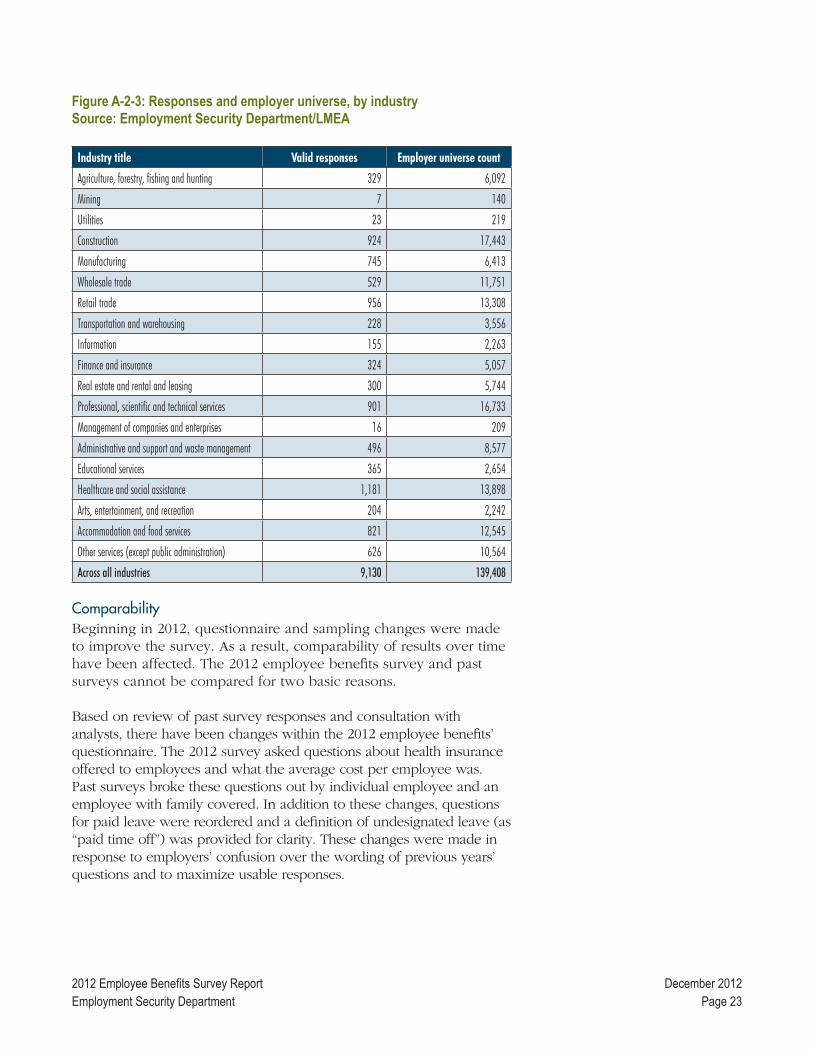
Figure A-2-2: Responses and employer universe, by firm sizeSource: Employment Security Department/LMEA
Firm size by number of employees Valid responses Employer universe count
Fewer than 10 4,363 108,044
10 to 24 1,825 18,371
25 to 49 885 6,547
50 to 99 400 3,234
100 to 499 1,392 2,686
500 or more 265 526
Across all firms 9,130 139,408
December 2012Page 23
2012 Employee Benefits Survey ReportEmployment Security Department
Figure A-2-3: Responses and employer universe, by industrySource: Employment Security Department/LMEA
Industry title Valid responses Employer universe count
Agriculture, forestry, fishing and hunting 329 6,092
Mining 7 140
Utilities 23 219
Construction 924 17,443
Manufacturing 745 6,413
Wholesale trade 529 11,751
Retail trade 956 13,308
Transportation and warehousing 228 3,556
Information 155 2,263
Finance and insurance 324 5,057
Real estate and rental and leasing 300 5,744
Professional, scientific and technical services 901 16,733
Management of companies and enterprises 16 209
Administrative and support and waste management 496 8,577
Educational services 365 2,654
Healthcare and social assistance 1,181 13,898
Arts, entertainment, and recreation 204 2,242
Accommodation and food services 821 12,545
Other services (except public administration) 626 10,564
Across all industries 9,130 139,408 Comparability Beginning in 2012, questionnaire and sampling changes were made to improve the survey. As a result, comparability of results over time have been affected. The 2012 employee benefits survey and past surveys cannot be compared for two basic reasons.
Based on review of past survey responses and consultation with analysts, there have been changes within the 2012 employee benefits’ questionnaire. The 2012 survey asked questions about health insurance offered to employees and what the average cost per employee was. Past surveys broke these questions out by individual employee and an employee with family covered. In addition to these changes, questions for paid leave were reordered and a definition of undesignated leave (as “paid time off”) was provided for clarity. These changes were made in response to employers’ confusion over the wording of previous years’ questions and to maximize usable responses.
December 2012Page 24
2012 Employee Benefits Survey ReportEmployment Security Department
The 2012 survey sample was not stratified; past surveys were stratified by industry. Adjustments for non-responses were based on employer size, rather than on industries (which was the case in previous surveys). As a result of these changes, overall estimations were improved, and results by individual industry sectors were still possible in most cases.
These improvements and enhancements have affected the comparability of results over time. However, these changes were necessary to improve responses and enhance and maintain the quality and integrity of the results.
EstimatesIn order for an estimate to appear in this report and appendices, it has passed three criteria:
1. The number of respondents in that cell must be at least four;
2. The coefficient of variation must be less than 50 percent; and
3. The lower bound of the confidence level must be greater than zero.
The publishable cells for the different estimated variables are different due to differences in number of responses and variances.
December 2012Page 25
2012 Employee Benefits Survey ReportEmployment Security Department
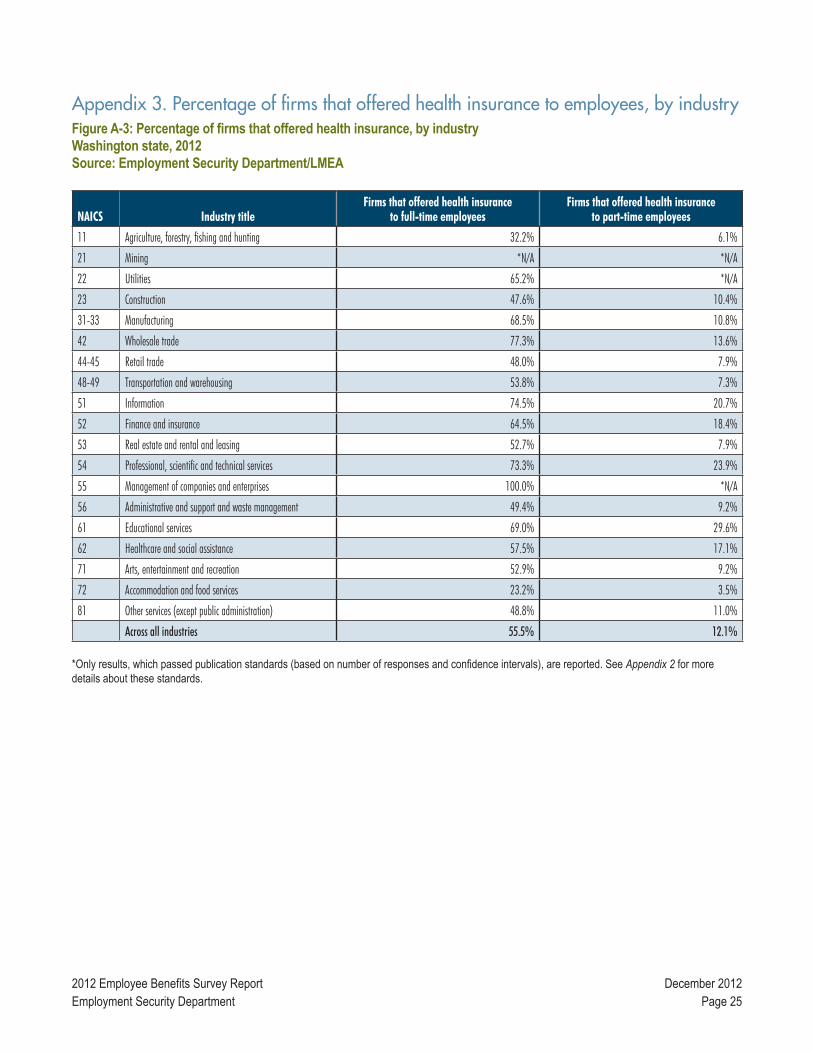
Appendix 3. Percentage of firms that offered health insurance to employees, by industryFigure A-3: Percentage of firms that offered health insurance, by industryWashington state, 2012Source: Employment Security Department/LMEA
NAICS Industry titleFirms that offered health insurance
to full-time employeesFirms that offered health insurance
to part-time employees
11 Agriculture, forestry, fishing and hunting 32.2% 6.1%
21 Mining *N/A *N/A
22 Utilities 65.2% *N/A
23 Construction 47.6% 10.4%
31-33 Manufacturing 68.5% 10.8%
42 Wholesale trade 77.3% 13.6%
44-45 Retail trade 48.0% 7.9%
48-49 Transportation and warehousing 53.8% 7.3%
51 Information 74.5% 20.7%
52 Finance and insurance 64.5% 18.4%
53 Real estate and rental and leasing 52.7% 7.9%
54 Professional, scientific and technical services 73.3% 23.9%
55 Management of companies and enterprises 100.0% *N/A
56 Administrative and support and waste management 49.4% 9.2%
61 Educational services 69.0% 29.6%
62 Healthcare and social assistance 57.5% 17.1%
71 Arts, entertainment and recreation 52.9% 9.2%
72 Accommodation and food services 23.2% 3.5%
81 Other services (except public administration) 48.8% 11.0%
Across all industries 55.5% 12.1% *Only results, which passed publication standards (based on number of responses and confidence intervals), are reported. See Appendix 2 for more details about these standards.

December 2012Page 26
2012 Employee Benefits Survey ReportEmployment Security Department
Appendix 4. Percentage of employees who worked for firms that offered health insurance, by industryFigure A-4: Percentage of employees who worked for firms that offered health insurance, by industrySource: Employment Security Department/LMEA
NAICS Industry titleFull-time employees who worked
for firms that offered health insurancePart-time employees who worked
for firms that offered health insurance
11 Agriculture, forestry, fishing and hunting 69.8% 7.1%
21 Mining 100.0% *N/A
22 Utilities 99.3% *N/A
23 Construction 74.4% 12.8%
31-33 Manufacturing 95.1% 19.3%
42 Wholesale trade 92.6% 16.2%
44-45 Retail trade 87.2% 35.1%
48-49 Transportation and warehousing 80.4% 9.7%
51 Information 95.6% 29.5%
52 Finance and insurance 92.3% 49.6%
53 Real estate and rental and leasing 78.4% 5.7%
54 Professional, scientific and technical services 93.3% 28.4%
55 Management of companies and enterprises 100.0% *N/A
56 Administrative and support and waste management 77.5% 7.6%
61 Educational services 99.3% 83.2%
62 Healthcare and social assistance 93.3% 45.2%
71 Arts, entertainment and recreation 77.7% 5.9%
72 Accommodation and food services 56.8% 10.6%
81 Other services (except public administration) 75.2% 10.2%
Across all industries 88.7% 34.9% *Only results, which passed publication standards (based on number of responses and confidence intervals), are reported. See Appendix 2 for more details about these standards.

December 2012Page 27
2012 Employee Benefits Survey ReportEmployment Security Department
Appendix 5. Percentage of employees eligible for health insurance, by industry Figure A-5: Percentage of employees eligible for health insurance, by industrySource: Employment Security Department/LMEA
NAICS Industry titleFull-time employees
eligible for health insurancePart-time employees
eligible for health insurance
11 Agriculture, forestry, fishing and hunting 53.3% 76.7%
21 Mining 95.6% *N/A
22 Utilities 100.0% *N/A
23 Construction 87.4% 92.8%
31-33 Manufacturing 97.1% 69.2%
42 Wholesale trade 95.1% 60.7%
44-45 Retail trade 96.7% 94.2%
48-49 Transportation and warehousing 94.4% 87.2%
51 Information 99.6% 50.2%
52 Finance and insurance 99.7% 95.1%
53 Real estate and rental and leasing 95.6% 92.5%
54 Professional, scientific and technical services 98.7% 91.5%
55 Management of companies and enterprises 99.4% *N/A
56 Administrative and support and waste management 92.5% 91.8%
61 Educational services 94.7% 62.2%
62 Healthcare and social assistance 97.7% 76.8%
71 Arts, entertainment and recreation 93.8% 56.6%
72 Accommodation and food services 78.3% 73.8%
81 Other services (except public administration) 95.5% 60.7%
Across all industries 94.7% 72.3% *Only results, which passed publication standards (based on number of responses and confidence intervals), are reported. See Appendix 2 for more details about these standards.

December 2012Page 28
2012 Employee Benefits Survey ReportEmployment Security Department
Appendix 6. Percentage of employees enrolled in health insurance, by industryFigure A-6: Percentage of employees enrolled in health insurance, by industrySource: Employment Security Department/LMEA
NAICS Industry titleFull-time employees
enrolled in health insurancePart-time employees
enrolled in health insurance
11 Agriculture, forestry, fishing and hunting 73.1% 68.5%
21 Mining 79.2% *N/A
22 Utilities 95.6% *N/A
23 Construction 86.2% 82.0%
31-33 Manufacturing 86.0% 60.5%
42 Wholesale trade 85.9% 48.4%
44-45 Retail trade 81.0% 58.1%
48-49 Transportation and warehousing 77.0% 18.7%
51 Information 90.2% 55.3%
52 Finance and insurance 91.5% 71.4%
53 Real estate and rental and leasing 83.9% 70.2%
54 Professional, scientific and technical services 87.5% 66.6%
55 Management of companies and enterprises 89.0% *N/A
56 Administrative and support and waste management 77.3% 43.5%
61 Educational services 81.4% 67.2%
62 Healthcare and social assistance 82.8% 66.9%
71 Arts, entertainment and recreation 76.2% 45.5%
72 Accommodation and food services 61.9% 28.6%
81 Other services (except public administration) 84.3% 50.8%
Across all industries 83.5% 63.6% *Only results, which passed publication standards (based on number of responses and confidence intervals), are reported. See Appendix 2 for more details about these standards.

December 2012Page 29
2012 Employee Benefits Survey ReportEmployment Security Department
Appendix 7. Health-insurance costs and premium coverage in 2012, by industryFigure A-7: Health-insurance costs and premium coverage in 2012, by industrySource: Employment Security Department/LMEA
NAICS Industry titleMonthly
health-insurance premiumPercent of premium covered
for full-time employeesPercent of premium covered
for part-time employees
11 Agriculture, forestry, fishing and hunting $418 81.1% 73.2%
21 Mining $726 90.4% *N/A
22 Utilities *N/A 89.5% *N/A
23 Construction $456 88.6% 89.5%
31-33 Manufacturing $433 81.8% 89.7%
42 Wholesale trade $437 82.3% 86.8%
44-45 Retail trade $466 83.1% 68.1%
48-49 Transportation and warehousing $517 83.8% 66.9%
51 Information $367 85.6% 80.7%
52 Finance and insurance $558 92.4% 81.9%
53 Real estate and rental and leasing $459 87.0% 80.2%
54 Professional, scientific and technical services $544 88.8% 86.8%
55 Management of companies and enterprises $753 88.8% *N/A
56 Administrative and support and waste management $406 81.4% 67.3%
61 Educational services $703 81.3% 73.4%
62 Healthcare and social assistance $502 87.4% 77.4%
71 Arts, entertainment and recreation $346 79.5% 82.2%
72 Accommodation and food services $370 71.8% 77.8%
81 Other services (except public administration) $468 87.9% 79.3%
Across all industries $517 84.7% 75.4% *Only results, which passed publication standards (based on number of responses and confidence intervals), are reported. See Appendix 2 for more details about these standards.

December 2012Page 30
2012 Employee Benefits Survey ReportEmployment Security Department
Appendix 8 Percentage of firms that offered retirement plans, by industry Figure A-8: Percentage of firms that offered retirement plans, by industrySource: Employment Security Department/LMEA
Firms that offered retirement plans to full-time employees
Firms that offered retirement plans to part-time employees
NAICS Industry titleDefined
contributionDefined benefit
Notoffered
Defined contribution
Defined benefit
Notoffered
11 Agriculture, forestry, fishing and hunting 13.4% 1.7% 86.0% 7.8% N/A 92.2%
21 Mining 81.8% *N/A *N/A *N/A *N/A *N/A
22 Utilities 61.9% 28.1% 38.1% *N/A *N/A 97.5%
23 Construction 28.8% 2.2% 70.4% 9.2% 1.6% 90.1%
31-33 Manufacturing 46.3% 3.4% 53.0% 17.9% 0.4% 82.1%
42 Wholesale trade 57.7% 3.2% 42.3% 22.7% *N/A 77.2%
44-45 Retail trade 28.6% 1.3% 71.1% 9.4% 0.8% 90.2%
48-49 Transportation and warehousing 36.6% 2.1% 63.4% 11.0% *N/A 89.0%
51 Information 53.8% 1.3% 46.2% 32.0% *N/A 68.0%
52 Finance and insurance 49.3% 2.9% 50.1% 28.7% 1.5% 71.3%
53 Real estate and rental and leasing 25.3% 1.1% 74.7% 9.0% *N/A 90.4%
54 Professional, scientific and technical services 53.0% 2.2% 46.4% 28.9% 1.4% 71.1%
55 Management of companies and enterprises 65.0% *N/A 35.0% 40.0% *N/A 60.0%
56 Administrative and support and waste management 32.5% 1.0% 67.1% 11.7% *N/A 88.3%
61 Educational services 51.5% 27.4% 42.4% 29.6% 19.0% 65.9%
62 Healthcare and social assistance 49.4% 3.5% 50.0% 27.3% 1.6% 72.5%
71 Arts, entertainment and recreation 27.2% 3.0% 72.4% 10.3% *N/A 89.7%
72 Accommodation and food services 7.0% *N/A 93.0% 3.1% *N/A 96.9%
81 Other services (except public administration) 27.0% 3.7% 72.2% 9.4% 0.5% 90.6%
Across all industries 37.2% 2.8% 62.2% 15.4% 1.4% 84.3% *Only results, which passed publication standards (based on number of responses and confidence intervals), are reported. See Appendix 2 for more details about these standards.

December 2012Page 31
2012 Employee Benefits Survey ReportEmployment Security Department
Appendix 9. Percentage of employees who worked for firms that offered retirement plans, by industryFigure A-9: Percentage of employees who worked for firms that offered retirement plans, by industrySource: Employment Security Department/LMEA
Full-time employees who worked for firms that offered retirement plans
Part-time employees who workedfor firms that offered retirement plans
NAICS Industry titleDefined
contributionDefined benefit
Notoffered
Defined contribution
Defined benefit
Notoffered
11 Agriculture, forestry, fishing and hunting 55.0% 8.2% 43.8% 15.8% *N/A 84.2%
21 Mining 97.0% 8.3% 3.0% *N/A *N/A *N/A
22 Utilities 98.2% 94.1% 1.8% *N/A *N/A 57.5%
23 Construction 61.1% 3.3% 37.9% 18.4% *N/A 81.2%
31-33 Manufacturing 84.6% 9.7% 14.0% 30.0% *N/A 70.0%
42 Wholesale trade 80.5% 2.9% 19.2% 30.7% *N/A 67.6%
44-45 Retail trade 73.2% 8.7% 24.0% 45.2% *N/A 52.2%
48-49 Transportation and warehousing 66.7% 4.4% 33.3% 0.0% *N/A 62.0%
51 Information 90.2% 3.7% 9.8% 53.0% *N/A 47.0%
52 Finance and insurance 86.4% 8.4% 13.4% 60.0% *N/A 40.0%
53 Real estate and rental and leasing 53.1% 3.4% 46.9% 16.8% *N/A 83.0%
54 Professional, scientific and technical services 82.7% 5.5% 17.0% 50.4% *N/A 49.3%
55 Management of companies and enterprises 93.9% *N/A 6.1% *N/A *N/A *N/A
56 Administrative and support and waste management 60.5% 1.6% 38.9% 14.7% *N/A 85.3%
61 Educational services 85.9% 73.7% 4.4% 77.4% 77.4% 14.0%
62 Healthcare and social assistance 83.3% 13.3% 16.2% 60.7% 9.4% 38.8%
71 Arts, entertainment and recreation 60.3% 7.7% 39.5% 39.5% *N/A 60.6%
72 Accommodation and food services 26.5% *N/A 73.5% 11.3% *N/A 88.7%
81 Other services (except public administration) 54.8% 6.3% 44.6% 25.9% *N/A 74.1%
Across all industries 75.9% 18.2% 21.9% 43.6% 19.9% 54.3% *Only results, which passed publication standards (based on number of responses and confidence intervals), are reported. See Appendix 2 for more details about these standards.

December 2012Page 32
2012 Employee Benefits Survey ReportEmployment Security Department
Appendix 10. Percentage of firms that offered paid leave, by industryFigure A-10: Percentage of firms that offered paid leave, by industrySource: Employment Security Department/LMEA
Firms that offered paid leaveto full-time employees
Firms that offered paid leaveto part-time employees
NAICS Industry title Undesignated Sick leave Vacation Holiday Undesignated Sick leave Vacation Holiday
11 Agriculture, forestry, fishing and hunting 36.9% 15.6% 25.6% 42.0% 12.3% 3.0% 5.6% 10.1%
21 Mining 59.4% *N/A 48.9% 68.9% *N/A *N/A *N/A *N/A
22 Utilities 86.7% *N/A 87.1% 87.0% *N/A *N/A *N/A *N/A
23 Construction 46.9% 13.6% 24.7% 49.4% 15.7% 4.1% 6.4% 12.1%
31-33 Manufacturing 78.3% 24.9% 38.0% 78.1% 30.9% 11.2% 11.5% 20.2%
42 Wholesale trade 82.7% 42.3% 66.4% 77.4% 37.2% 13.3% 22.1% 28.4%
44-45 Retail trade 56.2% 17.1% 34.6% 64.3% 18.3% 7.0% 10.3% 19.2%
48-49 Transportation and warehousing 59.2% 23.7% 37.5% 66.4% 17.4% 5.1% 8.0% 17.5%
51 Information 84.9% 47.7% 61.7% 76.5% 36.5% 28.1% 29.2% 40.0%
52 Finance and insurance 83.6% 47.6% 67.0% 78.3% 47.6% 27.3% 31.1% 40.3%
53 Real estate and rental and leasing 70.7% 35.5% 59.2% 71.4% 27.0% 14.1% 21.3% 23.8%
54 Professional scientific, and technical services 78.8% 39.1% 61.6% 72.7% 30.9% 15.5% 20.6% 26.4%
55 Management of companies and enterprises 90.2% 58.8% 73.3% 94.1% *N/A *N/A *N/A *N/A
56 Administrative and support and waste management 60.5% 23.8% 37.9% 60.4% 22.6% 7.5% 12.2% 18.9%
61 Educational services 77.2% 51.4% 74.9% 72.4% 35.1% 20.9% 36.5% 25.5%
62 Healthcare and social assistance 74.6% 30.3% 53.1% 73.8% 42.7% 17.4% 28.4% 39.2%
71 Arts, entertainment and recreation 52.3% 25.9% 42.4% 57.0% 15.8% 5.0% 11.8% 14.4%
72 Accommodation and food services 17.1% 9.1% 17.0% 37.1% 4.9% 2.0% 3.6% 9.9%
81 Other services (except public administration) 62.9% 18.9% 38.7% 66.3% 25.6% 5.9% 14.6% 22.4%
Across all industries 63.5% 26.6% 44.2% 65.1% 24.8% 10.0% 15.4% 22.1% *Only results, which passed publication standards (based on number of responses and confidence intervals), are reported. See Appendix 2 for more details about these standards.

December 2012Page 33
2012 Employee Benefits Survey ReportEmployment Security Department
Appendix 11. Percentage of employees who worked for firms that offered paid leave, by industryFigure A-11: Percentage of employees who worked for firms that offered paid leave, by industrySource: Employment Security Department/LMEA
Full-time employeeswho worked for firms that offered paid leave
Part-time employeeswho worked for firms that offered paid leave
NAICS Industry title Undesignated Sick leave Vacation Holiday Undesignated Sick leave Vacation Holiday
11 Agriculture, forestry, fishing and hunting 61.6% 26.8% 46.7% 69.6% 13.3% 1.0% 0.8% 7.6%
21 Mining 85.7% *N/A 53.3% 94.8% *N/A *N/A *N/A *N/A
22 Utilities 99.8% 79.4% 69.1% 68.8% 47.1% *N/A *N/A *N/A
23 Construction 68.7% 26.2% 35.0% 64.2% 15.8% 3.1% 6.6% 16.2%
31-33 Manufacturing 91.6% 40.1% 49.4% 79.8% 30.0% 8.7% 16.0% 19.9%
42 Wholesale trade 91.4% 44.2% 70.5% 81.7% 33.7% 18.1% 19.8% 23.1%
44-45 Retail trade 84.3% 38.8% 43.8% 77.0% 49.2% 18.1% 33.4% 48.4%
48-49 Transportation and warehousing 79.8% 40.7% 53.1% 81.1% 17.5% 7.0% 6.6% 17.6%
51 Information 95.7% 67.9% 76.5% 82.9% 32.5% 19.1% 25.9% 37.8%
52 Finance and insurance 93.9% 68.3% 65.7% 66.2% 60.0% 31.5% 53.7% 59.8%
53 Real estate and rental and leasing 78.9% 40.9% 65.1% 72.3% 24.5% 10.2% 19.0% 21.9%
54 Professional, scientific and technical services 88.9% 58.2% 68.2% 70.9% 35.0% 19.8% 27.5% 30.3%
55 Management of companies and enterprises 97.0% 73.8% 56.0% 72.0% *N/A *N/A *N/A *N/A
56 Administrative and support and waste management 81.9% 37.2% 49.7% 74.4% 23.9% 5.4% 9.4% 18.4%
61 Educational services 99.3% 74.5% 99.2% 98.2% 69.0% 53.1% 82.7% 56.1%
62 Healthcare and social assistance 87.3% 61.5% 70.3% 73.3% 58.7% 42.8% 52.0% 55.0%
71 Arts, entertainment and recreation 59.2% 35.7% 54.3% 71.1% 19.0% 12.3% 16.2% 20.8%
72 Accommodation and food services 42.9% 26.1% 37.5% 57.7% 7.6% 5.2% 8.2% 16.8%
81 Other services (except public administration) 78.2% 26.9% 51.1% 81.9% 29.0% 6.1% 19.5% 27.4%
Across all industries 85.5% 49.8% 62.7% 77.5% 39.8% 24.7% 36.3% 36.9%
*Only results, which passed publication standards (based on number of responses and confidence intervals), are reported. See Appendix 2 for more details about these standards.

December 2012Page 34
2012 Employee Benefits Survey ReportEmployment Security Department
Appendix 12. Coverage changesFigure A-12: Percentage of firms with coverage changes, by industrySource: Employment Security Department/LMEA
NAICS Industry title Coverage starts Coverage reduced Coverage stops Coverage the same
11 Agriculture, forestry, fishing and hunting *N/A 6.2% *N/A 92.0%
21 Mining *N/A *N/A *N/A 97.6%
22 Utilities *N/A *N/A *N/A 97.7%
23 Construction 1.8% 6.3% 2.0% 90.1%
31-33 Manufacturing 1.6% 9.0% 1.8% 87.8%
42 Wholesale trade 2.0% 5.8% 1.2% 90.9%
44-45 Retail trade *N/A *N/A *N/A *N/A
48-49 Transportation and warehousing *N/A 6.9% *N/A 91.0%
51 Information *N/A 9.7% *N/A 86.8%
52 Finance and insurance 1.9% 3.9% *N/A 94.2%
53 Real estate and rental and leasing *N/A 6.0% *N/A 91.9%
54 Professional, scientific and technical services 2.4% 6.6% 1.7% 89.3%
55 Management of companies and enterprises *N/A *N/A *N/A 89.1%
56 Administrative and support and waste management 2.3% 4.2% 1.8% 92.2%
61 Educational services 5.3% 4.1% *N/A 90.2%
62 Healthcare and social assistance 2.1% 8.2% 2.2% 87.9%
71 Arts, entertainment and recreation *N/A 5.3% *N/A 91.8%
72 Accommodation and food services 1.4% 2.3% 1.0% 95.5%
81 Other services (except public administration) 1.2% 5.5% 1.3% 92.4%
Across all industries 1.8% 6.0% 1.6% 90.9% *Only results, which passed publication standards (based on number of responses and confidence intervals), are reported. See Appendix 2 for more details about these standards.

December 2012Page 35
2012 Employee Benefits Survey ReportEmployment Security Department
Appendix 13. Survey form
2012 WASHINGTON EMPLOYEE BENEFITS SURVEY 1ABOUT THE SURVEY
Please direct this survey to your Employee Benefits Manager or Human Resources Department. Your response to this survey will help give Washington’s businesses, job seekers and employment counselors a valuable tool for navigating in today’s job market. Information in this survey is confidential and will not be provided to any other entity; it is used for our research purposes only. Summary results from the last survey are available at https://fortress.wa.gov/esd/employmentdata/reports-publications/occupational-reports/employee-benefits-report.
RESPONDING TO THE SURVEY
Choose the option that works best for you:
1) Return the survey in the enclosed postage-paid envelope.2) Fax both sides to 360-407-4510.3) Complete over the phone at 855-222-4383. 4) Email the completed form to [email protected].
Please respond within 15 days. Responding promptly reduces follow-up costs.
PLEASE REPORT FOR EMPLOYEES ONLY IN WASHINGTON STATEHow many employees do you currently have at this location?
Number of employees who are full-time:
Number of employees who are part-time:
CONTACT PERSON
Name:
Title:
Telephone:
Date:
Please continue with sections:
1 Health Insurance 2 Retirement and 3 Paid Leave
THANK YOU FOR PARTICIPATING!
CONTACT US FOR INFORMATIONWashington State Employment Security DepartmentLabor Market and Economic Analysis P.O. Box 9046 Olympia, WA 98507-9046Phone: 855-222-4383, Fax: 360-407-4510Email: [email protected]
The Employment Security Department is an equal-opportunity employer and provider of programs and services. Auxiliary aids and services are available upon request to people with disabilities. Please Turn Over Washington Relay Service: 800-833-6384LM-12-0269
Washington State Employment Security DepartmentLabor Market and Economic Analysis

December 2012Page 36
2012 Employee Benefits Survey ReportEmployment Security Department
PART 1: HEALTH INSURANCE
Cost Monthly or Yearly
$ ___________ q q
Full-Time % Part-Time %
PART 3: PAID LEAVE
2012 WASHINGTON EMPLOYEE BENEFITS SURVEY 2
Does your organization offer the following retirement plans to any employees?
Defined contribution plans include target-benefit, profit sharing, IRA and 401(k) plans.
Defined benefit plans provide a guaranteed benefit amount upon retirement.
Toll free at 855-222-4383; Fax: 360-407-4510; or Email: [email protected]
Does your organization offer the following leave to any employees?
Sick Leave
Vacation Leave
Holidays
Undesignated Leave (paid time off)
CHANGES IN COVERAGE (Check all boxes that apply):
Has your company made any of the following changes to the medical coverage offered in the last year?
Full-Time Employees
Yes q No q
Employees
Employees
Started Offering qReduced Coverage qStopped Offering qStayed the Same q
INSURANCE COSTS (Average total premium = employee paid + employer paid)
How much is the average premium paid per employee?
For the majority of employees, what percent does the employer pay toward the cost of premium?
Full-Time Employees
Yes q No q
Yes q No q
Part-Time Employees
Yes q No q
Yes q No q
Part-Time Employees
Yes q No q
Employees
Employees
FOR EMPLOYEES
Does your organization offer medical insurance to any employees?
How many employees are offered medical insurance?
Of the employees offered medical insurance, how many are enrolled?
PART 2: RETIREMENT
Full-Time Employees
Yes q No q
Yes q No q
Yes q No q
Yes q No q
Part-Time Employees
Yes q No q
Yes q No q
Yes q No q
Yes q No q