
2011 - Charting international labor comparisons
49
U.S. Department of Labor • Bureau of Labor Statistics 2011 EDITION
-
Upload
richard-han -
Category
Career
-
view
250 -
download
0
Transcript of 2011 - Charting international labor comparisons

U.S. Depar tment of Labor • Bureau of Labor Stat ist ics
2 0 1 1 E D I T I O N
u.s. bureau of labor statistiCs | www.bls.gov august 2011 | Charting international labor Comparisons iii
2 0 1 1 E D I T I O NCharting International Labor ComparisonsU.S. Department of Labor Hilda L. Solis, Secretary
U.S. Bureau of Labor Statistics Keith Hall, Commissioner
August 2011

iv Charting international labor Comparisons | august 2011 u.s. bureau of labor statistiCs | www.bls.gov
With ever-expanding global markets,
international labor statistics have assumed
a greater role in assessing the relative
performance of individual economies and
in influencing both national and international policy
decisions. However, direct comparisons of statistics
across countries can be misleading, because
concepts and definitions often differ. To improve
the comparability of international labor statistics,
the Bureau of Labor Statistics (BLS) International
Labor Comparisons (ILC) program adjusts data to a
common conceptual framework.
The BLS 2011 edition of Charting International Labor Comparisons features 2009 data, as well as trends
over time, for the main indicators published by ILC:
gross domestic product, labor force, manufacturing
prefaCe
hourly compensation costs and productivity, and
consumer prices. To increase country and indicator
coverage, data from other organizations also are
included. (Notes are provided at the end of each
section to detail sources used and to furnish helpful
definitions.)
This edition of Charting International Labor Comparisons updates the previous edition, with
a revised set of countries and indicators. Country
coverage varies by chart and is based primarily
on data available from the ILC program. In recent
years, ILC has improved its coverage of emerging
economies; as a result, country coverage for many
indicators has been expanded.
For the latest ILC key indicators by country, see
Country at a Glance.
Contact ILCDivision of International Labor Comparisons
www.bls.gov/ilc | [email protected] | (202) 691-5654
For the latest updates, we invite you to join our email notification service by sending "subscribe" to [email protected].

u.s. bureau of labor statistiCs | www.bls.gov august 2011 | Charting international labor Comparisons v
this edition of Charting International Labor Comparisons was prepared by the BLS
International Labor Comparisons (ILC) program,
under the coordination of Elizabeth Crofoot
and the overall guidance of Marie-Claire Sodergren
and Chris Sparks. ILC team members are: Amy
Bixler, Aaron Cobet, Rich Esposito, Jacob Kirchmer,
Christopher Morris, Bradley Nicholson, and Andrew
Petajan. Cover art and layout design were created by
Bruce Boyd, and editorial services were provided by
Monica R. Gabor, both of the Office of Publications
and Special Studies.
aCknowledgments

vi Charting international labor Comparisons | august 2011 u.s. bureau of labor statistiCs | www.bls.gov
Contentspage
Preface ...................................................................................................................................................................................iv
Acknowledgments .................................................................................................................................................................v
Section 1 Gross Domestic ProductChart 1.1 Gross domestic product, selected countries, in U.S. dollars, 2009 ........................................................ 9
Chart 1.2 Share of world gross domestic product, selected economies, 1990–2009 ........................................ 10
Chart 1.3 Manufacturing output as a percent of gross domestic product, selected economies, 1970–2009 .................................................................................................................................................11
Chart 1.4 Gross domestic product per capita and per employed person, selected countries, in U.S. dollars, 2009 ..................................................................................................................................12
Notes Sources and definitions ............................................................................................................................13
Section 2 Labor MarketChart 2.1 Labor force size, gender composition, and participation rates, selected countries, 2009 .................. 15
Chart 2.2 Labor force participation rates by sex, selected countries, 2009 ..........................................................16
Chart 2.3 Labor force participation rates by age, selected countries, 2009 .........................................................17
Chart 2.4 Working-age population by labor force status, selected countries, in percent, 2009 ......................... 18
Chart 2.5 Employment-population ratios, selected countries, 2007 and 2009 ....................................................19
Chart 2.6 Employment growth, selected countries, average annual rates, 2000–2007 and 2007–2009 ..........................................................................................................................................20
Chart 2.7 Part-time employment rates by sex, selected countries, 2009 .............................................................21
Chart 2.8 Share of employment by sector, selected countries, 2009 ...................................................................22
Chart 2.9 Unemployment rates, selected countries, 2000–2009 ..........................................................................23
Chart 2.10 Unemployment rates by age, selected countries, 2009 ........................................................................24
Chart 2.11 Unemployment rates by education, selected countries, 2008 .............................................................25
Chart 2.12 Various measures of labor underutilization, selected countries, 2009 ................................................. 26
Chart 2.13 UR6: A broad rate of labor underutilization, selected countries, 2007 and 2009 ................................ 27
Notes Sources and definitions ............................................................................................................................28
Section 3 Competitiveness in ManufacturingChart 3.1 Hourly compensation costs in manufacturing, selected countries, in U.S. dollars, 2009 ................... 31

u.s. bureau of labor statistiCs | www.bls.gov august 2011 | Charting international labor Comparisons vii
Contentspage
Chart 3.2 Hourly compensation costs in manufacturing, selected countries and regions, in U.S. dollars, 2009 ..................................................................................................................................32
Chart 3.3 Hourly compensation costs in manufacturing and exchange rates, selected countries, annual percent change, 2008–2009 ........................................................................................................33
Chart 3.4 Growth in manufacturing hourly compensation costs, selected countries, average annual rates, 2000–2007 and 2007–2009 .................................................................................34
Chart 3.5 Hourly compensation costs in manufacturing, selected countries and regions, annual percent changes, 2004–2009 ......................................................................................................35
Chart 3.6 Components of hourly compensation costs in manufacturing, selected countries, in percent, 2009 ........................................................................................................................................36
Chart 3.7 Manufacturing productivity growth, selected countries, average annual rates, 2000–2007 and 2007–2009 ......................................................................................................................37
Chart 3.8 Manufacturing output growth, selected countries, average annual rates, 2000–2007 and 2007–2009 ......................................................................................................................38
Chart 3.9 Growth in manufacturing hours worked, selected countries, average annual rates, 2000–2007 and 2007–2009 ......................................................................................................................39
Chart 3.10 Growth in manufacturing unit labor costs in national currency, selected countries, average annual rates, 2000–2007 and 2007–2009 .................................................................................40
Chart 3.11 Growth in manufacturing unit labor costs in U.S. dollars, selected countries, average annual rates, 2000–2007 and 2007–2009 .................................................................................41
Chart 3.12 Gap between productivity and real hourly compensation in manufacturing, selected countries, 1970–2009 ................................................................................................................42
Notes Sources and definitions ............................................................................................................................43
Section 4 Consumer PricesChart 4.1 Measures of consumer price inflation, selected countries, average annual percent changes, 2007–2009 .................................................................................................................................................45
Chart 4.2 Harmonized indexes of consumer prices, selected countries, average annual percent changes, 2000–2007 and 2007–2009 ......................................................................................................................46
Chart 4.3 Manufacturing compensation and consumer price indexes, selected countries, average annual growth rates, 2007–2009 ...............................................................................................47
Chart 4.4 Price of a basket of goods that costs one dollar in the United States, selected countries, 2009 ..........................................................................................................................48
Notes Sources and definitions ............................................................................................................................49

8 Charting international labor Comparisons | august 2011 u.s. bureau of labor statistiCs | www.bls.gov
1
gross domestic product (GDP) is a
measure of a country’s economic
output. GDP per capita and GDP
per employed person are related
indicators that provide a general picture of
a country’s well being. GDP per capita is
an indicator of overall wealth in a country,
and GDP per employed person is a general
indicator of productivity.
Gross DomesticProduct
seCtion

u.s. bureau of labor statistiCs | www.bls.gov august 2011 | Charting international labor Comparisons 9
Gross domestic product (GDP) was over 14 trillion dollars in the United States and exceeded 3 trillion dollars in only three other countries: China, Japan, and India.
in addition to China
and india, other large
emerging economies,
such as brazil and
mexico, were among the
10 largest countries in
terms of gdp.
the gdp of the united
states was roughly 5
times larger than that
of germany, 10 times
larger than that of the
republic of korea, and 50
times larger than that of
norway.
1.1Char
tGross domestic product, selected countries, in U.S. dollars, 2009
united states
China
Japan
india
germany
united kingdom
france
brazil
italy
mexico
spain
korea, republic of
Canada
australia
poland
netherlands
argentina
belgium
sweden
switzerland
greece
philippines
austria
norway
Czech republic
portugal
singapore
israel
denmark
hungary
finland
ireland
new Zealand
slovakia
estonia
Trillions of 2009 U.S. dollars
0 1 2 3 4 5 6 7 8 9 10 11 12 13 14 15
NOTE: gdp is converted to u.s. dollars using purchasing power parities (ppp). see section notes.
SOURCES: bureau of labor statistics and the world bank

10 Charting international labor Comparisons | august 2011 u.s. bureau of labor statistiCs | www.bls.gov
China’s share of world gross domestic product (GDP) increased steadily during the past two decades, from approximately 5 percent in 1990 to 16 percent in 2009. By 2000, China’s GDP had surpassed Japan’s.
as a percent of world
gdp, the united states,
europe, and Japan each
declined slightly over the
last two decades, due
largely to China’s growth.
the rest of the world’s
share of world gdp
decreased during the
1990s but grew steadily
from 2000 to 2009.
1.2Char
t Share of world gross domestic product,selected economies, 1990–2009
100
90
80
70
60
50
40
30
20
10
0
Percent
Rest of world
Europe
United States
China
Japan
1990 1992 1994 1996 1998 2000 2002 2004 2006 2008
SOURCE: the Conference board

u.s. bureau of labor statistiCs | www.bls.gov august 2011 | Charting international labor Comparisons 11
Over the period, the manufacturing sector’s share of gross domestic product (GDP) declined at about the same rate in Japan, the European Union, and the United States.
u.s. manufacturing
made up 11 percent of
gdp in 2009, compared
with 23 percent of gdp in
1970.
manufacturing output
as a share of gdp was
about one-third in both
China and Japan in 1970.
the share decreased
overall in Japan but rose
and fell in China before
returning to 1970 levels in
2009.
1.3Char
tManufacturing output as a percent of gross domestic product, selected economies, 1970–2009
45
40
35
30
25
20
15
10
5
0
Percent
China
Japan
European Union
United States
1970 1973 1976 1979 1982 1985 1988 1991 1994 1997 2000 2003 2006 2009
SOURCES: bureau of labor statistics and the world bank
12 Charting international labor Comparisons | august 2011 u.s. bureau of labor statistiCs | www.bls.gov
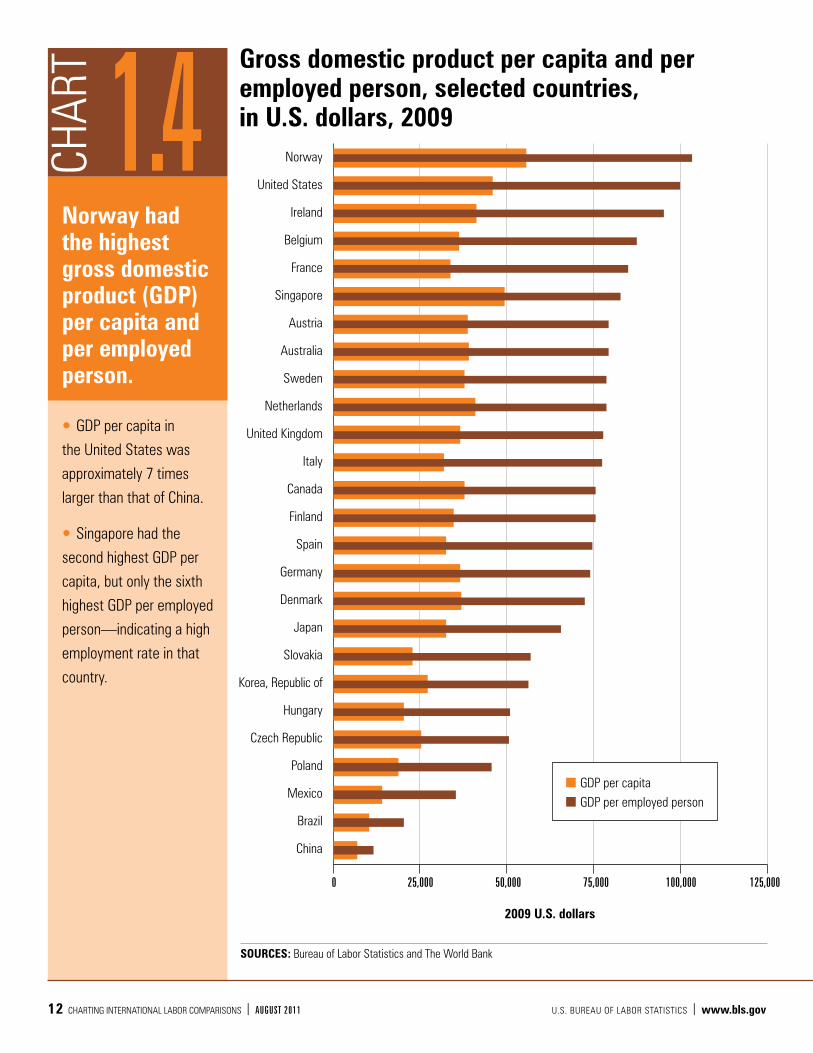
Norway had the highest gross domestic product (GDP) per capita and per employed person.
gdp per capita in
the united states was
approximately 7 times
larger than that of China.
singapore had the
second highest gdp per
capita, but only the sixth
highest gdp per employed
person—indicating a high
employment rate in that
country.
1.4Char
t Gross domestic product per capita and per employed person, selected countries, in U.S. dollars, 2009
norway
united states
ireland
belgium
france
singapore
austria
australia
sweden
netherlands
united kingdom
italy
Canada
finland
spain
germany
denmark
Japan
slovakia
korea, republic of
hungary
Czech republic
poland
mexico
brazil
China
gdp per capita gdp per employed person
0 25,000 50,000 75,000 100,000 125,000
SOURCES: bureau of labor statistics and the world bank
2009 U.S. dollars
u.s. bureau of labor statistiCs | www.bls.gov august 2011 | Charting international labor Comparisons 13
Section 1 NotesSection 1 gross domestiC produCt
SourcesData for most countries are based on the BLS report
International Comparisons of GDP per Capita and per
Hour, 1960–2009. Data for the remaining countries
and all purchasing power parities (PPP) are based on
data in the World Bank database World Development
Indicators. A country or region’s share of world gross
domestic product (GDP) is based on data in The
Conference Board Total Economy Database.
Each country prepares GDP measures in accordance
with national accounts principles. To make
international comparisons of levels of GDP, GDP
per capita, and GDP per employed person, it is
necessary to express GDP in a common currency
unit. BLS converts GDP from national currency units
to U.S. dollars through the use of PPP.
In this section, Europe includes 20 countries:
Austria, Belgium, Cyprus, Denmark, Finland, France,
Germany, Greece, Iceland, Ireland, Italy, Luxembourg,
Malta, Netherlands, Norway, Portugal, Spain,
Sweden, Switzerland, and the United Kingdom.
DefinitionsGross domestic product (GDP) is the market value of
all goods and services produced in a country. GDP
per capita is GDP divided by population and is a
rough measure of a country’s overall wealth. GDP
per employed person is GDP divided by the number
of employed persons and is a rough measure of a
country’s productivity. Purchasing power parities (PPP)
are currency conversion rates that allow output
in different currency units to be expressed in a
common unit of value. A PPP is the ratio between
the number of units of a country’s currency and
the number of U.S. dollars required to purchase an
equivalent basket of goods and services within each
respective country.

14 Charting international labor Comparisons | august 2011 u.s. bureau of labor statistiCs | www.bls.gov
2
Labor force statistics, such as employment
and unemployment, are key indicators
of the functioning of labor markets
both within and across countries.
Labor force levels and participation rates
provide information on the supply of labor
in an economy. Employment focuses on
the extent to which people are engaged
in productive labor market activities,
while measures of labor underutilization,
including unemployment, provide
information on an economy’s unused or
underused labor supply.
LaborMarket
seCtion

u.s. bureau of labor statistiCs | www.bls.gov august 2011 | Charting international labor Comparisons 15
China and India had the largest workforces, although China had the highest labor force participation rate, while India had the lowest.
women made up less
than half of the labor
force in all countries
and europe, with india
having, by far, the lowest
proportion of women in
the labor market.
2.1Char
tLabor force size, gender composition, and participation rates, selected countries, 2009Women's share of the labor force (percent)
Canada
0 55 60 65 70 75 80
Total labor force participation rate (percent)
NOTE: each bubble represents the size of the labor force for that country. europe includes 21 countries. see section notes.
SOURCES: bureau of labor statistics and international labour office
50
45
40
35
30
25
20
0
Europe
India
China
Brazil
Australia
Argentina
Korea, Republic ofJapan
Philippines
Mexico
UnitedStates
16 Charting international labor Comparisons | august 2011 u.s. bureau of labor statistiCs | www.bls.gov
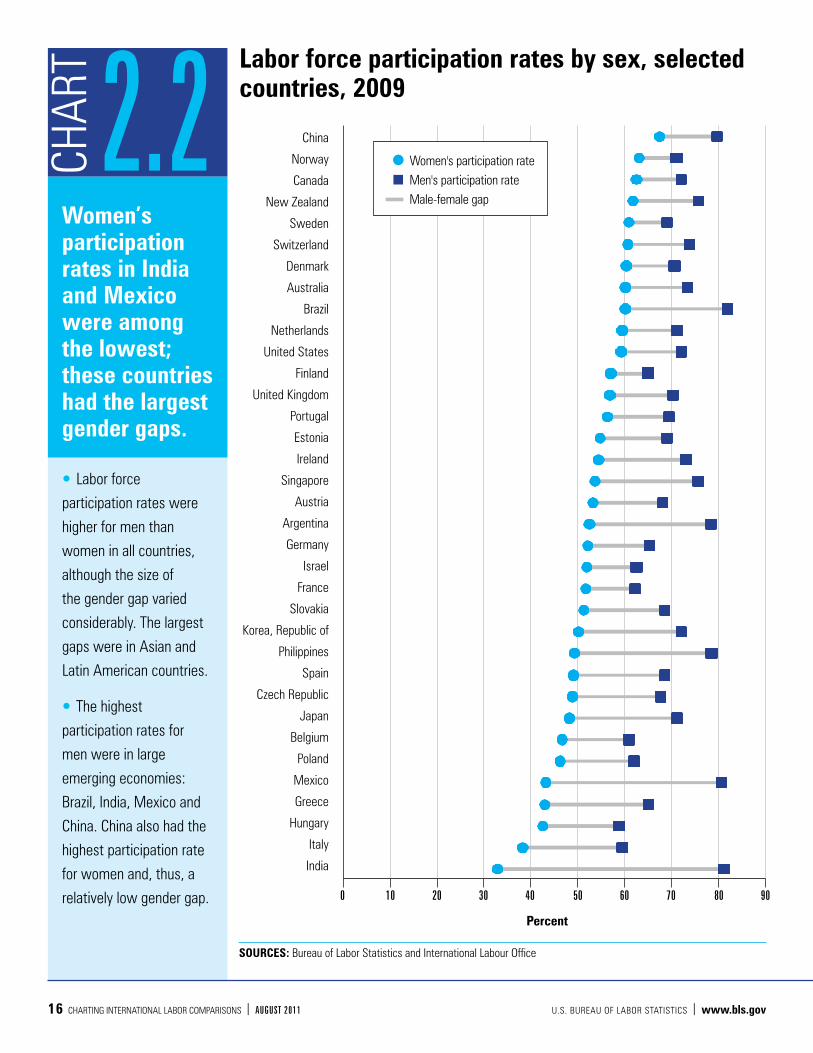
Women’s participation rates in India and Mexico were among the lowest; these countries had the largest gender gaps.
labor force
participation rates were
higher for men than
women in all countries,
although the size of
the gender gap varied
considerably. the largest
gaps were in asian and
latin american countries.
the highest
participation rates for
men were in large
emerging economies:
brazil, india, mexico and
China. China also had the
highest participation rate
for women and, thus, a
relatively low gender gap.
2.2Char
t Labor force participation rates by sex, selected countries, 2009
China
norway
Canada
new Zealand
sweden
switzerland
denmark
australia
brazil
netherlands
united states
finland
united kingdom
portugal
estonia
ireland
singapore
austria
argentina
germany
israel
france
slovakia
korea, republic of
philippines
spain
Czech republic
Japan
belgium
poland
mexico
greece
hungary
italy
india
0 10 20 30 40 50 60 70 80 90
SOURCES: bureau of labor statistics and international labour office
Percent
women's participation rate men's participation rate
— male-female gap

u.s. bureau of labor statistiCs | www.bls.gov august 2011 | Charting international labor Comparisons 17
Participation rates were highest for persons ages 25 to 54 in all countries and lowest for those ages 65 and older in all countries except the Republic of Korea.
in argentina and the philippines, more than one-third of persons ages 65 and older were still in the labor force. in contrast, many european countries had rates below 5 percent for this age group.
participation rates among youth varied most across countries. the netherlands and australia had the highest participation rates (above 70 percent) while hungary, the republic of korea, and greece had the lowest rates (under 30 percent).
2.3Char
tLabor force participation rates by age, selected countries, 2009
india
mexico
korea, republic of
philippines
israel
italy
hungary
argentina
brazil
poland
ireland
greece
united states
australia
Japan
spain
singapore
united kingdom
new Zealand
belgium
Canada
norway
Czech republic
austria
estonia
finland
germany
portugal
slovakia
france
netherlands
denmark
switzerland
sweden
China
0 10 20 30 40 50 60 70 80 90 100
SOURCE: international labour office
Percent
15–24
25–54
55–64
65 and older

18 Charting international labor Comparisons | august 2011 u.s. bureau of labor statistiCs | www.bls.gov
The working-age population is composed of those in the labor force—the employed and the unemployed—and those not in the labor force.
italy was the only
country with less than
half of its working-age
population engaged in the
labor force.
although spain had
average labor force
participation, this
masks its relatively low
employment rate and high
unemployment. estonia,
ireland, and slovakia
also had relatively low
employment but high
unemployment.
2.4Char
t Working-age population by labor force status, selected countries, in percent, 2009
China
brazil
new Zealand
Canada
norway
switzerland
australia
denmark
united states
netherlands
argentina
sweden
singapore
philippines
ireland
united kingdom
portugal
mexico
estonia
korea, republic of
finland
austria
slovakia
Japan
spain
germany
Czech republic
india
israel
france
poland
greece
belgium
hungary
italy
0 20 40 60 80 100
SOURCES: bureau of labor statistics and international labour office
Percent
employed unemployed not in the labor force
u.s. bureau of labor statistiCs | www.bls.gov august 2011 | Charting international labor Comparisons 19
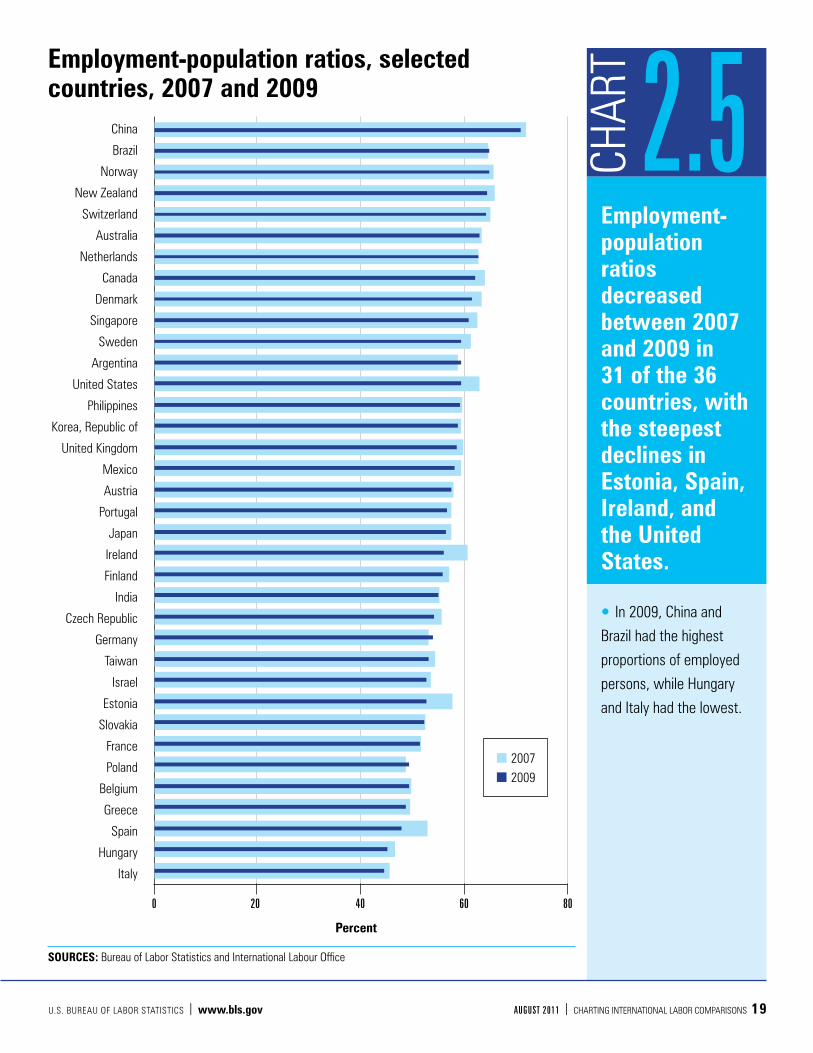
Employment-population ratios decreased between 2007 and 2009 in 31 of the 36 countries, with the steepest declines in Estonia, Spain, Ireland, and the United States.
in 2009, China and
brazil had the highest
proportions of employed
persons, while hungary
and italy had the lowest.
2.5Char
tEmployment-population ratios, selected countries, 2007 and 2009
China
brazil
norway
new Zealand
switzerland
australia
netherlands
Canada
denmark
singapore
sweden
argentina
united states
philippines
korea, republic of
united kingdom
mexico
austria
portugal
Japan
ireland
finland
india
Czech republic
germany
taiwan
israel
estonia
slovakia
france
poland
belgium
greece
spain
hungary
italy
0 20 40 60 80
SOURCES: bureau of labor statistics and international labour office
Percent
2007 2009

20 Charting international labor Comparisons | august 2011 u.s. bureau of labor statistiCs | www.bls.gov
Employment grew from 2000 to 2007 in all countries except for Japan but decreased in almost half of the countries from 2007 to 2009.
between 2007 and
2009, the sharpest
declines in employment
were in estonia and spain,
followed by ireland and
the united states.
the largest gains in
employment between
2007 and 2009 were in
three asian countries:
singapore, the philippines,
and india. singapore
and india were 2 of 3
countries (germany was
the third) that had more
employment growth
during 2007–2009 than
during 2000–2007.
2.6Char
t Employment growth, selected countries, average annual rates, 2000–2007 and 2007–2009
estonia
spain
ireland
united states
hungary
denmark
Japan
Czech republic
finland
greece
portugal
sweden
united kingdom
italy
taiwan, China
switzerland
Canada
new Zealand
belgium
france
austria
slovakia
China
korea, republic of
norway
netherlands
mexico
germany
poland
israel
brazil
australia
argentina
india
philippines
singapore
–5 –3 –1 0 1 3 5
SOURCES: bureau of labor statistics and international labour office
Percent
2000–2007 2007–2009

u.s. bureau of labor statistiCs | www.bls.gov august 2011 | Charting international labor Comparisons 21
The part-time employment rate for women was roughly 2 to 5 times higher than the men’s rate in most countries.
the largest difference between men and women’s part-time employment rates was in the netherlands, although it had the highest rate for both men (17.0 percent) and women (59.9 percent).
part-time employment was least common for both men and women in three eastern european countries: slovakia, hungary, and the Czech republic.
2.7Char
tPart-time employment rates by sex, selected countries, 2009
netherlands
switzerland
united kingdom
australia
germany
ireland
new Zealand
Japan
austria
belgium
italy
norway
Canada
denmark
france
spain
sweden
united states
finland
korea, republic of
greece
poland
estonia
Czech republic
hungary
slovakia
0 10 20 30 40 50 60 70
SOURCE: organisation for economic Co-operation and development
Percent
men women
22 Charting international labor Comparisons | august 2011 u.s. bureau of labor statistiCs | www.bls.gov
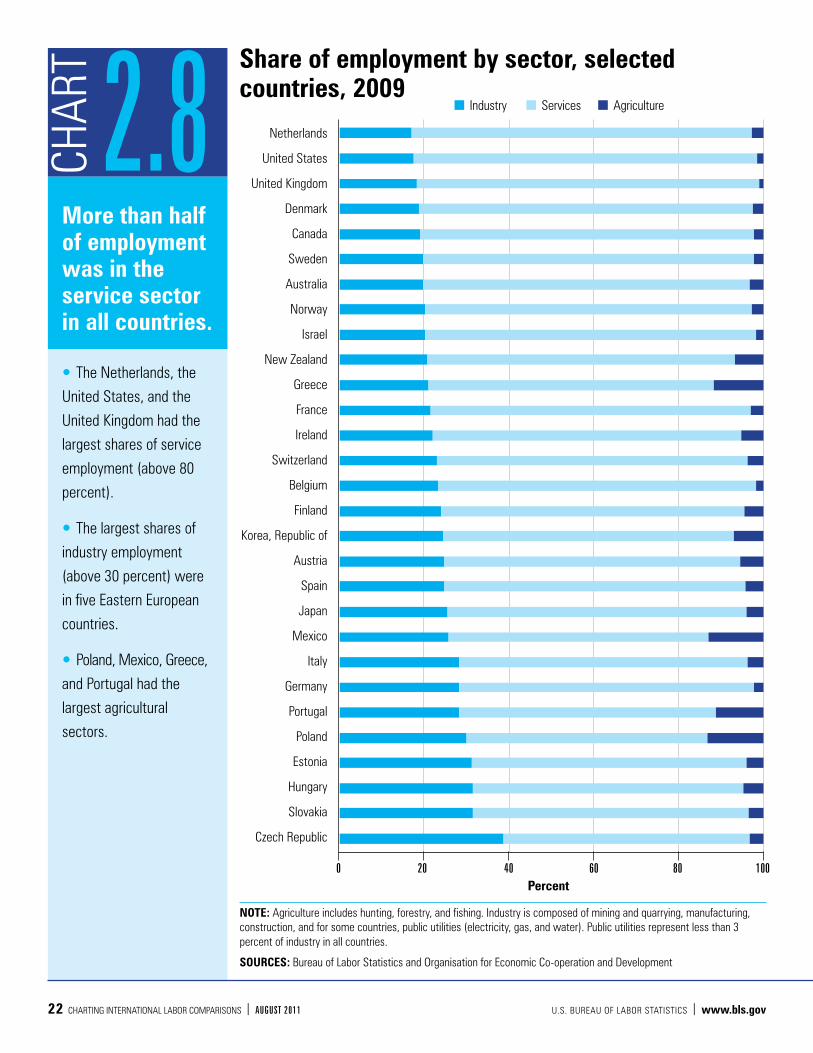
More than half of employment was in the service sector in all countries.
the netherlands, the
united states, and the
united kingdom had the
largest shares of service
employment (above 80
percent).
the largest shares of
industry employment
(above 30 percent) were
in five eastern european
countries.
poland, mexico, greece,
and portugal had the
largest agricultural
sectors.
2.8Char
t Share of employment by sector, selected countries, 2009
netherlands
united states
united kingdom
denmark
Canada
sweden
australia
norway
israel
new Zealand
greece
france
ireland
switzerland
belgium
finland
korea, republic of
austria
spain
Japan
mexico
italy
germany
portugal
poland
estonia
hungary
slovakia
Czech republic
0 20 40 60 80 100Percent
NOTE: agriculture includes hunting, forestry, and fishing. industry is composed of mining and quarrying, manufacturing, construction, and for some countries, public utilities (electricity, gas, and water). public utilities represent less than 3 percent of industry in all countries.
SOURCES: bureau of labor statistics and organisation for economic Co-operation and development
industry services agriculture

u.s. bureau of labor statistiCs | www.bls.gov august 2011 | Charting international labor Comparisons 23
In 2009, Spain had, by far, the highest unemployment rate, and Norway had the lowest.
unemployment rates
were higher in 2009
than 2000 in a majority
of countries, due in
part to the effects of
the global recession at
the end of the decade.
unemployment rates
increased in 11 countries
between 2007 and
2008, and in all countries
between 2008 and 2009.
poland recorded the
highest unemployment
rate of the period (20.0
percent in 2002), and
switzerland had the
lowest (2.2 percent in
2001).
2.9Char
tUnemployment rates, selected countries, 2000–2009
SOURCES: bureau of labor statistics and organisation for economic Co-operation and development
00 01 02 03 04 05 06 07 08 09
Percent
united states
Mexico
Canada
North America20
15
10
5
0
00 01 02 03 04 05 06 07 08 09
Poland
slovakia
Estonia
Czech Republic
Hungary
Percent Eastern Europe20
15
10
5
0
00 01 02 03 04 05 06 07 08 09
Percent
New Zealand
Korea, Republic of Japan
australia
Asia and Oceania20
15
10
5
0
Percent
00 01 02 03 04 05 06 07 08 09
germany Ireland
France
austria
united Kingdom
switzerland
Western Europe20
15
10
5
0 00 01 02 03 04 05 06 07 08 09
Finland
sweden
Denmark
NorwayNetherlands
Percent Northern Europe20
15
10
5
0
00 01 02 03 04 05 06 07 08 09
spain
greece
Portugal
Italy
Percent Southern Europe20
15
10
5
0

24 Charting international labor Comparisons | august 2011 u.s. bureau of labor statistiCs | www.bls.gov
Unemployment rates for teenagers and young adults are generally higher than those for adults, partly due to young people’s greater vulnerability to economic downturns and lack of experience.
slovakia had the largest
difference between rates
for teenagers and adults,
and germany had the
smallest.
only switzerland had a
higher unemployment rate
for young adults than for
teenagers.
2.10Char
t Unemployment rates by age, selected countries, 2009
switzerland
Japan
netherlands
germany
norway
austria
korea, republic of
denmark
israel
australia
Canada
new Zealand
united states
united kingdom
portugal
poland
belgium
finland
france
greece
Czech republic
sweden
ireland
italy
hungary
estonia
slovakia
spain
0 10 20 30 40 50 60
Percent
NOTE: 2008 for israel. ages 16 to 19 instead of 15 to 19 for Canada, france, norway, spain, sweden, the united kingdom, and the united states.
SOURCES: bureau of labor statistics and organisation for economic Co-operation and development
teenagers (15-19) Young adults (20-24) adults (25 and older)

u.s. bureau of labor statistiCs | www.bls.gov august 2011 | Charting international labor Comparisons 25
In 23 out of 30 countries, college graduates had the lowest unemployment rates, followed by high school graduates; high school dropouts had the highest rates.
College graduates
had the highest
unemployment rate only
in mexico.
the unemployment
rate gap between high
school dropouts and high
school graduates was
generally larger than the
gap between college
graduates and high school
graduates, reflecting the
value of a high school
education in seeking
employment.
2.11Char
tUnemployment rates by education, selected countries, 2008
norway
netherlands
denmark
new Zealand
australia
mexico
switzerland
austria
korea, republic of
Czech republic
united kingdom
sweden
Japan
italy
ireland
estonia
united states
finland
Canada
france
belgium
israel
brazil
poland
hungary
portugal
greece
germany
slovakia
spain
0 5 10 15 20 25 30 35 40
Percent
NOTE: data refer to persons ages 25 to 64. data for less than high school are not available for Japan.
SOURCE: organisation for economic Co-operation and development
less than high school high school or trade school College or university

26 Charting international labor Comparisons | august 2011 u.s. bureau of labor statistiCs | www.bls.gov
Long-term unemployment (UR1) was most prevalent in Slovakia and Spain.
ur1 is the most
restrictive rate of labor
underutilization and
consists only of the subset
of the unemployed who
were unemployed for at
least 1 year. ur3 is the
official unemployment
rate and the most widely
recognized. the broadest
rate, ur6, includes
the unemployed, the
marginally attached, and
persons who are employed
but who worked fewer
hours than they would
like (i.e., the time-related
underemployed).
spain had the highest
ur3 and ur6. although
australia had the second
highest ur6, its ur3 was
relatively low.
2.12Char
t Various measures of labor underutilization, selected countries, 2009
norway
netherlands
austria
Japan
australia
denmark
new Zealand
Czech republic
Canada
united kingdom
germany
belgium
italy
poland
finland
sweden
france
united states
greece
portugal
hungary
ireland
slovakia
spain
0 5 10 15 20 25 30
Percent
NOTE: long term is defined as 1 year or longer. ur6 includes the unemployed, the marginally attached, and the time-related underemployed. see section notes.
SOURCES: bureau of labor statistics and organisation for economic Co-operation and development
ur1 (long-term unemployment rate) ur3 (unemployment rate) ur6 (broad rate of labor underutilization)

u.s. bureau of labor statistiCs | www.bls.gov august 2011 | Charting international labor Comparisons 27
2.13Char
t
During the global recession, UR6 increased between 2007 and 2009 in all countries, except for Poland. The largest increases were in Spain, the United States, and Ireland.
ur6 is a broader measure
of labor underutilization
than the unemployment
rate because it includes
the marginally attached
and those who are
employed but who worked
fewer hours than they
would like (i.e., time-
related underemployed).
this broader measure
is popular during times
of recession, when
unemployment and other
types of labor market
difficulty are on the rise.
UR6: A broad rate of labor underutilization, selected countries, 2007 and 2009
netherlands
norway
Czech republic
austria
denmark
Japan
belgium
united kingdom
poland
ireland
new Zealand
greece
portugal
germany
Canada
slovakia
hungary
finland
france
united states
sweden
italy
australia
spain
0 5 10 15 20 25 30
Percent
NOTE: ur6 includes the unemployed, the marginally attached, and the time-related underemployed. see section notes.
SOURCE: organisation for economic Co-operation and development
2007 2009

28 Charting international labor Comparisons | august 2011 u.s. bureau of labor statistiCs | www.bls.gov
SourcesData for 10 countries for most indicators are based
on the BLS report International Comparisons of
Annual Labor Force Statistics, Adjusted to U.S.
Concepts, 10 Countries, 1970-2010. To facilitate
international comparisons, foreign-country data are
adjusted to U.S. concepts. Data for the remaining
countries and some indicators in their entirety—
labor force participation rates by age, part-time
employment rates, unemployment rates by
education and measures of underutilization—are
based on data from the International Labour Office
(ILO) or the Organisation for Economic Co-operation
and Development (OECD).
Labor force participation rates, employment-
population ratios, and employment growth are
supplemented with data from the ILO database Key
Indicators of the Labour Market (KILM). The KILM
harmonizes data using econometric models to
account for differences in national data and scope of
coverage, collection and tabulation methodologies,
and other country-specific factors, such as military
service requirements. Although some differences
remain between the KILM and ILC series, they do
not materially affect comparisons across countries.
Part-time employment rates, employment by
sector, unemployment rates, and measures of
underutilization are supplemented with data
from the OECD database OECD.Stat. The OECD
generally uses labor force surveys and captures
labor force statistics according to ILO guidelines,
which facilitate cross-country comparisons, because
these guidelines create a common conceptual
framework for countries. However, except for total
unemployment rates, the OECD does not adjust
data for differences that remain across countries in
coverage and definitions that can affect international
comparisons. See Labor Force Statistics in OECD
Countries: Sources, Coverage and Definitions. For
total unemployment rates, the OECD series used
is the “harmonized unemployment rates” (HURs),
which are adjusted to conform to the ILO guidelines
in countries where deviations occur. For a full
discussion of comparability issues, see the BLS
article, “International unemployment rates: how
comparable are they?”
Using multiple sources for an indicator to extend
country coverage can introduce additional
comparability issues, since each organization
employs different methods for harmonizing data,
if adjustments are made at all. Users should use
caution when making international comparisons
using the actual values underlying these charts
and are encouraged to review the methodological
documents associated with each source.
In this section, Europe includes 21 countries:
Austria, Belgium, Czech Republic, Denmark, Estonia,
Finland, France, Germany, Greece, Hungary, Ireland,
Italy, the Netherlands, Norway, Poland, Portugal,
Slovakia, Spain, Sweden, Switzerland, and the United
Kingdom.
DefinitionsLabor Labor market data are on a civilian basis (i.e.,
members of the Armed Forces are not included).
The labor force participation rate is the labor force as
a percent of the working-age population; it is an
overall indicator of the level of labor market activity.
The labor force is the sum of the employed plus the
unemployed; it provides an indication of the size
of the labor supply. The working-age population is
Section 1 NotesSection 2 labor market

u.s. bureau of labor statistiCs | www.bls.gov august 2011 | Charting international labor Comparisons 29
the population ages 15 or 16 and older. (Lower age
limits vary by country. See source documents.)
The employed are persons who, during the
reference week, did work for at least 1 hour as
paid employees, worked in their own business,
profession, or on their own farm, or as unpaid
workers in an enterprise operated by a family
member (at least 1 hour according to the ILO
guidelines but at least 15 hours according to U.S.
concepts). Definitions of the employed vary by
country. See source documents. The employment-
population ratio is employment as a percent of the
working-age population. Part-time employment refers
to employed persons who usually work less than 30
hours per week in their main job; in some countries,
“actual” rather than “usual” hours are used. The part-
time employment rate is the share of employment that
is part time and is also referred to as the incidence
of part-time employment.
The unemployed are persons without work, actively
seeking employment and currently available to
start work. Definitions of the unemployed vary by
country; see source documents. The unemployment
rate is unemployment as a percent of the labor
force; it is the most widely used measure of an
economy’s unused labor supply. Persons marginally
attached to the labor force are those who did not
look for work in the past 4 weeks, but who wish to
work, are available to work and, in some countries,
have looked for work sometime in the past 12
months. Discouraged workers are the subset of the
marginally attached who are not currently searching
for a job because they believe none are available.
The time-related underemployed are either: (1) full-time
workers working less than a full week (less than
35 hours in the United States) during the survey
reference week for economic reasons or (2) part-time
workers who want but cannot find full-time work.
For unemployment rates by education, the levels of
educational attainment accord with the International
Standard Classification for Education (ISCED) in its
current version, known as ISCED 1997. Less than high
school corresponds to “less than upper secondary
education” and includes ISCED levels 0-3C. High
school or trade school corresponds to “upper
secondary and post-secondary education” and
includes levels 3-4. College or university corresponds
to “tertiary non-university and university” and
includes levels 5-6.

30 Charting international labor Comparisons | august 2011 u.s. bureau of labor statistiCs | www.bls.gov
3
t hree indicators of international competitiveness
in the manufactured goods sector are: hourly
compensation costs, labor productivity, and unit
labor costs.
Hourly compensation measures employers’ average
hourly labor costs in the manufacturing sector.
Labor productivity (output per hour worked) measures
how effectively hours worked are converted into output.
Unit labor costs measure the cost of labor compensation
expended to produce one unit of output. Increases in
labor productivity indicate that a country’s workers are
becoming more efficient, while declines in unit labor
cost indicate that an economy is becoming more cost
competitive.
seCtion
Competitivenessin Manufacturing

u.s. bureau of labor statistiCs | www.bls.gov august 2011 | Charting international labor Comparisons 31
The 12 countries with the highest manufacturing hourly compensation costs were all in Europe, followed by Australia and the United States.
Costs in norway were
1.6 times the u.s. level
and roughly 50 times
costs in China.
labor costs in China
and india have been
growing faster than those
in the united states in
recent years, but were
still less than 4 percent of
the u.s. level.
3.1Char
tHourly compensation costs in manufacturing, selected countries, in U.S. dollars, 2009
China
india
philippines
mexico
poland
taiwan
brazil
hungary
estonia
argentina
Czech republic
slovakia
portugal
korea, republic of
new Zealand
singapore
israel
greece
spain
Canada
Japan
united kingdom
united states
australia
italy
ireland
sweden
france
netherlands
finland
switzerland
germany
austria
belgium
denmark
norway
0 10 20 30 40 50 60
U.S. dollars
NOTE: data for China and india refer to 2007 and are not directly comparable with each other or with data for other countries. see section notes.
SOURCE: bureau of labor statistics

32 Charting international labor Comparisons | august 2011 u.s. bureau of labor statistiCs | www.bls.gov
Costs in Northern Europe were, on average, $12 higher than those in the United States, while costs in Latin America were $28 lower than the U.S. level.
eastern european
countries, on average,
had the lowest hourly
compensation costs
within europe, at $36
below the northern
european level.
Costs in China were
only 5 percent of costs in
other asian countries.
3.2Char
t Hourly compensation costs in manufacturing, selected countries and regions, in U.S. dollars, 2009
China
india
latin america (3)
eastern europe (5)
asia (5)
southern europe (4)
united states
western europe (8)
northern europe (4)
0 10 20 30 40 50
U.S. dollars
NOTE: number in parenthesis refers to the number of countries in the regional grouping. data for China and india refer to 2007 and are not directly comparable with each other or with data for other countries. see section notes.
SOURCE: bureau of labor statistics
u.s. bureau of labor statistiCs | www.bls.gov august 2011 | Charting international labor Comparisons 33
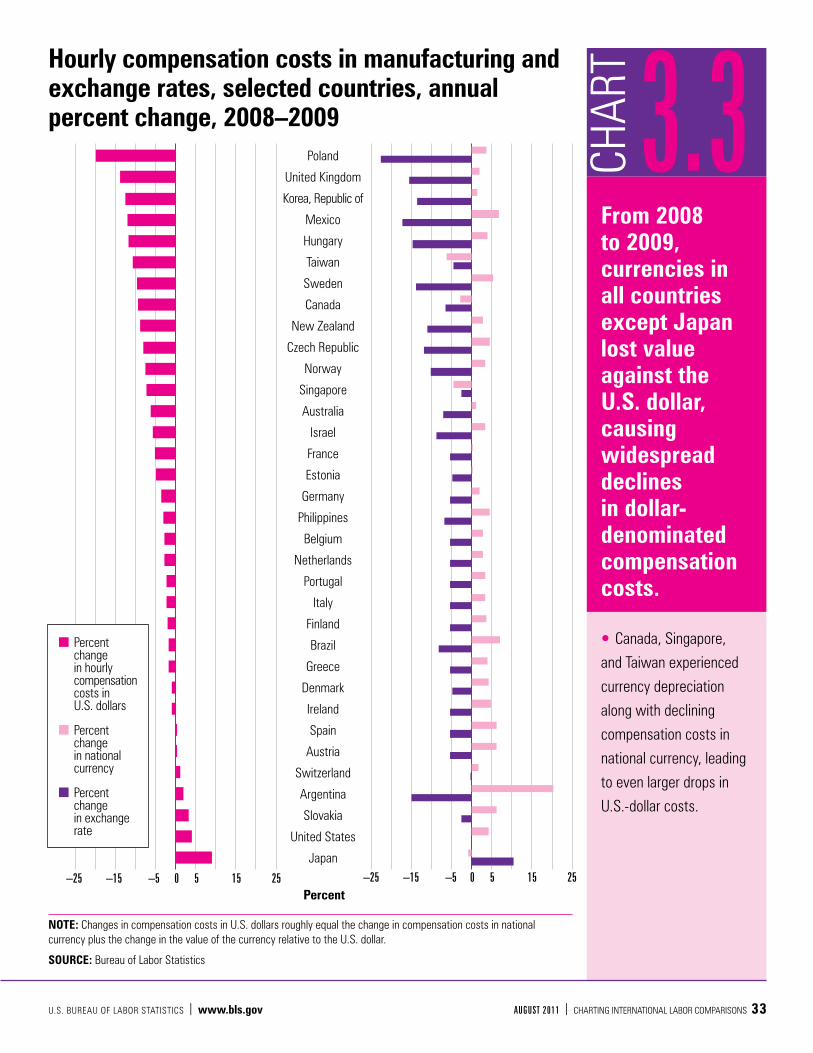
From 2008 to 2009, currencies in all countries except Japan lost value against the U.S. dollar, causing widespread declines in dollar-denominated compensation costs.
Canada, singapore,
and taiwan experienced
currency depreciation
along with declining
compensation costs in
national currency, leading
to even larger drops in
u.s.-dollar costs.
3.3Char
tHourly compensation costs in manufacturing and exchange rates, selected countries, annual percent change, 2008–2009
poland
united kingdom
korea, republic of
mexico
hungary
taiwan
sweden
Canada
new Zealand
Czech republic
norway
singapore
australia
israel
france
estonia
germany
philippines
belgium
netherlands
portugal
italy
finland
brazil
greece
denmark
ireland
spain
austria
switzerland
argentina
slovakia
united states
Japan
–25 –15 –5 0 5 15 25 –25 –15 –5 0 5 15 25Percent
NOTE: Changes in compensation costs in u.s. dollars roughly equal the change in compensation costs in national currency plus the change in the value of the currency relative to the u.s. dollar.
SOURCE: bureau of labor statistics
percent change in hourly compensation costs in u.s. dollars
percent change in national currency
percent change in exchange rate

34 Charting international labor Comparisons | august 2011 u.s. bureau of labor statistiCs | www.bls.gov
Most countries experienced higher growth in compensation costs, on average, over the first 7 years of the last decade than they did over the last 2 years.
the republic of korea,
argentina, estonia,
hungary, and taiwan had
the largest differences
in compensation cost
growth across the two
periods.
in Canada and taiwan,
compensation costs
declined in the latter
period, a trend that is
rarely seen.
3.4Char
t
taiwan
Canada
korea, republic of
Japan
france
switzerland
germany
united kingdom
united states
greece
italy
denmark
sweden
new Zealand
belgium
portugal
australia
singapore
netherlands
norway
finland
Czech republic
hungary
ireland
israel
spain
austria
philippines
mexico
poland
estonia
slovakia
brazil
argentina
–5 0 5 10 15 20 25
Percent
NOTE: growth rates are based on national currency-denominated compensation costs.
SOURCE: bureau of labor statistics
Growth in manufacturing hourly compensation costs, selected countries, average annual rates, 2000–2007 and 2007–2009
2000–2007 2007–2009

u.s. bureau of labor statistiCs | www.bls.gov august 2011 | Charting international labor Comparisons 35
Manufacturing compensation costs in China grew the fastest, while costs in the rest of Asia and Western Europe grew at the slowest pace.
eastern europe and
latin america also
saw rapid increases
in compensation,
although cost growth in
eastern europe slowed
substantially from 2008 to
2009.
asia experienced
a slight decline in
compensation costs
between 2008 and 2009,
a trend not shared with
other regions of the world.
3.5Char
t
asia (5)
western europe (8)
united states
northern europe (4)
southern europe (4)
latin america (3)
eastern europe (5)
india
China
–10 0 10 20 30
Percent
Hourly compensation costs in manufacturing,selected countries and regions, annual percent changes, 2004–2009
2004–20052005–20062006–20072007–20082008–2009
2004–20052005–20062006–20072007–20082008–2009
2004–20052005–20062006–20072007–20082008–2009
2004–20052005–20062006–20072007–20082008–2009
2004–20052005–20062006–20072007–20082008–2009
2004–20052005–20062006–20072007–20082008–2009
2004–20052005–20062006–20072007–20082008–2009
2004–20052005–20062006–2007
2004–20052005–20062006–20072007–2008
NOTE: percent changes are based on national currency-denominated compensation costs. number in parenthesis refers to the number of countries in the regional grouping. see section notes. the latest available data for China and india refer to 2007–2008 and 2006–2007, respectively.
SOURCE: bureau of labor statistics

36 Charting international labor Comparisons | august 2011 u.s. bureau of labor statistiCs | www.bls.gov
Total benefits (social insurance and directly paid benefits) surpassed 40 percent of compensation costs in 15 of 34 countries.
total benefits as a
percentage of total costs
were highest in belgium,
at 49 percent of costs,
and lowest in new
Zealand, at 17 percent.
the ratio of benefits to
total costs in the united
states was 31 percent.
for manufacturers
in brazil, sweden,
and france, social
insurance costs made up
approximately 33 percent
of total compensation
costs in 2009. insurance
in new Zealand, however,
accounted for only 3
percent of total costs.
3.6Char
t Components of hourly compensation costs in manufacturing, selected countries, in percent, 2009
new Zealand
philippines
denmark
singapore
taiwan
switzerland
ireland
poland
israel
argentina
korea, republic of
Japan
norway
portugal
Canada
australia
united kingdom
finland
germany
netherlands
united states
austria
hungary
spain
estonia
mexico
Czech republic
greece
slovakia
belgium
italy
france
sweden
brazil 0 20 40 60 80 100
Percent
NOTE: for mexico, norway, the republic of korea and taiwan, pay for time worked and directly paid benefits are combined into total direct pay. see section notes.
SOURCE: bureau of labor statistics
social insurance directly paid benefits pay for time worked (wages and salaries) total direct pay

u.s. bureau of labor statistiCs | www.bls.gov august 2011 | Charting international labor Comparisons 37
Although manufacturing productivity (output per hour) grew for all countries from 2000 to 2007, productivity fell sharply in many countries from 2007 to 2009.
Japan, sweden,
germany, and singapore
experienced the largest
productivity declines
between 2007 and 2009.
israel was the only
country that had faster
productivity growth during
2007 to 2009 than during
2000 to 2007.
3.7Char
tManufacturing productivity growth, selected countries, average annual rates, 2000–2007 and 2007–2009
Japan
sweden
germany
singapore
italy
france
finland
estonia
netherlands
hungary
austria
united kingdom
spain
slovakia
Canada
denmark
australia
norway
belgium
korea, republic of
Czech republic
taiwan
united states
israel
–10 –5 0 5 10 15Percent
SOURCES: bureau of labor statistics and organisation for economic Co-operation and development
2000–2007 2007–2009

38 Charting international labor Comparisons | august 2011 u.s. bureau of labor statistiCs | www.bls.gov
When output is growing faster than hours worked, productivity (output per hour) rises.
output declined
between 2007 and 2009
in all countries except
the republic of korea and
israel, driving declines
in manufacturing labor
productivity for most
countries during the
period.
in contrast to the
2007 to 2009 period,
output increased in most
countries from 2000 to
2007.
3.8Char
t Manufacturing output growth, selected countries, average annual rates, 2000–2007 and 2007–2009
estonia
Japan
sweden
finland
italy
germany
Canada
spain
hungary
slovakia
united kingdom
france
austria
netherlands
united states
belgium
denmark
singapore
Czech republic
taiwan
norway
australia
israel
korea, republic of
–20 –10 0 10 20
Percent
SOURCES: bureau of labor statistics and organisation for economic Co-operation and development
2000–2007 2007–2009
u.s. bureau of labor statistiCs | www.bls.gov august 2011 | Charting international labor Comparisons 39
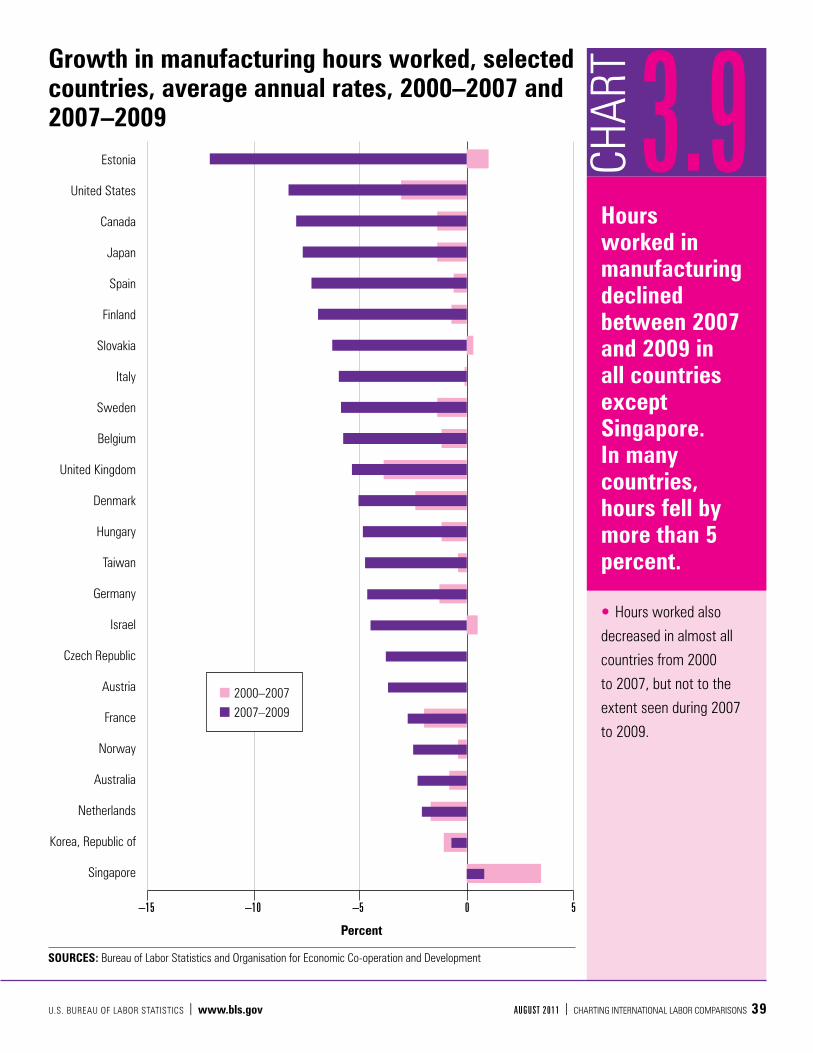
Hours worked in manufacturing declined between 2007 and 2009 in all countries except Singapore. In many countries, hours fell by more than 5 percent.
hours worked also
decreased in almost all
countries from 2000
to 2007, but not to the
extent seen during 2007
to 2009.
3.9Char
tGrowth in manufacturing hours worked, selected countries, average annual rates, 2000–2007 and 2007–2009
estonia
united states
Canada
Japan
spain
finland
slovakia
italy
sweden
belgium
united kingdom
denmark
hungary
taiwan
germany
israel
Czech republic
austria
france
norway
australia
netherlands
korea, republic of
singapore
–15 –10 –5 0 5
Percent
SOURCES: bureau of labor statistics and organisation for economic Co-operation and development
2000–2007 2007–2009

40 Charting international labor Comparisons | august 2011 u.s. bureau of labor statistiCs | www.bls.gov
Manufacturing unit labor costs (compensation per unit of output) in national currency grew between 2007 and 2009 in all countries except Taiwan and Slovakia. Italy, Estonia, and Sweden experienced the largest growth.
only Canada and israel
had faster unit labor cost
growth during 2000 to
2007 than during 2007 to
2009.
3.10Char
t Growth in manufacturing unit labor costs in national currency, selected countries, average annual rates, 2000–2007 and 2007–2009
taiwan
slovakia
israel
Czech republic
united states
Canada
denmark
korea, republic of
singapore
belgium
united kingdom
australia
norway
spain
hungary
Japan
france
netherlands
austria
finland
germany
sweden
estonia
italy
–5 0 5 10
Percent
SOURCES: bureau of labor statistics and organisation for economic Co-operation and development
2000–2007 2007–2009

u.s. bureau of labor statistiCs | www.bls.gov august 2011 | Charting international labor Comparisons 41
To gauge international competitiveness, unit labor costs (compensation per unit of output) can be converted to U.S. dollars. Competitiveness increases as unit labor costs decrease.
growth in manufacturing
unit labor costs converted
to u.s. dollars was faster
from 2007 to 2009 than
the growth between
2000 and 2007 in most
countries. Japan and
slovakia had the sharpest
increases in unit labor
costs.
3.11Char
tGrowth in manufacturing unit labor costs in U.S. dollars, selected countries, average annual rates, 2000–2007 and 2007–2009korea, republic of
united kingdom
taiwan
Canada
hungary
united states
norway
australia
sweden
israel
denmark
Czech republic
belgium
singapore
spain
france
austria
netherlands
finland
germany
estonia
italy
slovakia
Japan
–15 –5 5 15 25
Percent
SOURCES: bureau of labor statistics and organisation for economic Co-operation and development
2000–2007 2007–2009

42 Charting international labor Comparisons | august 2011 u.s. bureau of labor statistiCs | www.bls.gov
70 80 90 00 09 70 80 90 00 09 70 80 90 00 09
70 80 90 00 09 70 80 90 00 09 70 80 90 00 09
In most countries, the growth of productivity outpaced the growth of real hourly compensation in manufacturing throughout much of the period from 1970 to 2009, creating a compensation-productivity gap.
by 2009, the gap was
largest in the united
states, finland, and
sweden. the gap was
smallest in germany,
denmark, and italy.
3.12Char
t Gap between productivity and real hourly compensation in manufacturing, selected countries, 1970–2009
70 80 90 00 09 70 80 90 00 09 70 80 90 00 09
70 80 90 00 09 70 80 90 00 09 70 80 90 00 09
SOURCE: bureau of labor statistics
Natural logarithm of indexes
Year
Natural logarithm of indexes
Netherlands
Canada
Denmark
Finland
Japan
United Kingdom
Germany
Sweden
Belgium
France
Italy
United States7.0
6.5
6.0
5.5
5.0
4.5
7.0
6.5
6.0
5.5
5.0
4.5
7.0
6.5
6.0
5.5
5.0
4.5
7.0
6.5
6.0
5.5
5.0
4.5
7.0
6.5
6.0
5.5
5.0
4.5
7.0
6.5
6.0
5.5
5.0
4.5
7.0
6.5
6.0
5.5
5.0
4.5
7.0
6.5
6.0
5.5
5.0
4.5
— productivity — real hourly compensation

u.s. bureau of labor statistiCs | www.bls.gov august 2011 | Charting international labor Comparisons 43
SourcesHourly compensation costs measure employers’
average hourly labor costs in the manufacturing
sector. Average costs refer to all employees, are
based on national establishment surveys, and are
prepared for level comparisons. To permit meaningful
level comparisons of employer labor costs across
countries, earnings data from national surveys are
adjusted to the BLS concept of hourly compensation.
Data for all countries are based on the BLS news
release International Comparisons of Hourly Compensation Costs in Manufacturing, 2009 and
the related time series tables. Also, see the technical
notes and country notes associated with this release.
Due to various data gaps and methodological issues,
compensation costs for China and India are not
directly comparable with each other or with data for
other countries.
Average compensation costs for selected regions are
calculated by weighting each country’s compensation
cost value by its relative importance to U.S. trade.
The weights are calculated using the dollar value of
U.S. trade (exports plus imports) in manufactured
commodities with each country in 2007. Latin America
refers to Argentina, Brazil, and Mexico; Western
Europe to Austria, Belgium, France, Germany,
Ireland, the Netherlands, Switzerland, and the United
Kingdom; Northern Europe to Denmark, Finland,
Norway, and Sweden; Southern Europe to Greece,
Italy, Portugal, and Spain; Eastern Europe to the Czech
Republic, Estonia, Hungary, Poland, and Slovakia; and
Asia to Japan, the Republic of Korea, the Philippines,
Singapore, and Taiwan.
Data on productivity, output, hours, and unit
labor costs refer to all employed persons in the
manufacturing sector, are based on national accounts,
Section 1 NotesSection 3and are prepared for trend (rather than level)
comparisons. Data for most countries are based on
the BLS news release International Comparisons of Manufacturing Productivity and Unit Labor Cost Trends and the related time series tables. Also, see
the technical notes associated with the news release.
Data for the remaining countries are based on data
from the Organisation for Economic Co-operation
and Development (OECD) database OECD.Stat.
DefinitionsHourly compensation (labor cost) is the average cost
to employers of using one hour of labor in the
manufacturing sector. Compensation includes (1) pay
for time worked, (2) directly paid benefits, and (3)
employer social insurance expenditures and labor-
related taxes. Pay for time worked refers to wages
and salaries for time actually worked, including basic
wages, overtime pay, shift and holiday premiums,
and regular bonuses. Directly paid benefits primarily
include pay for vacations and other leave, irregular
bonuses, and pay in kind. Social insurance expenditures
are employer contributions to social benefit funds
on behalf of workers, such as for unemployment
insurance, workers’ compensation, health insurance,
and pension funds. Labor-related taxes are taxes on
payrolls or employment, net of subsidies. Total hourly
direct pay includes all payments made directly to the
worker consisting of pay for time worked and directly
paid benefits.
Productivity is real output per hour worked. Output is
defined as real value added. Hours refer to the hours
worked by all persons engaged in the manufacturing
process. Unit labor costs are nominal compensation
costs divided by real value-added output. Unit labor
cost can be expressed in national currency and in
U.S. dollars.
Competitiveness in manufaCturing

44 Charting international labor Comparisons | august 2011 u.s. bureau of labor statistiCs | www.bls.gov
4
Consumer price indexes (CPI) and
harmonized indexes of consumer
prices (HICP) measure the change
over time in the prices paid by
consumers for a fixed selection, or
market basket, of goods and services.
Price indexes are used primarily to adjust
income payments for changes in the cost
of living and to compute inflation-adjusted
measures of other economic series.
ConsumerPrices
seCtion

u.s. bureau of labor statistiCs | www.bls.gov august 2011 | Charting international labor Comparisons 45
4.1Char
t
The two inflation rates were identical in 8 countries, and the difference between the two rates was greater than half a percentage point in just 5 of the 23 countries.
ireland was the only
country showing opposite
trends between the
two inflation rates, and
the largest difference
between the two rates
was in the united
kingdom. the differing
trends reflect differences
in the market basket
that is covered by the
hiCp and Cpi for these
countries.
Measures of consumer price inflation, selected countries, average annual percent changes, 2007–2009
Japan
ireland
switzerland
portugal
germany
france
netherlands
united states
austria
spain
italy
belgium
denmark
slovakia
sweden
finland
greece
united kingdom
norway
Czech republic
poland
hungary
estonia
–1 0 1 2 3 4 5 6Percent
NOTE: hiCp and Cpi are two measures of consumer price changes. hiCp are adjusted for comparability across countries, whereas Cpi are not adjusted. values for Japan are zero, indicating no change.
SOURCES: bureau of labor statistics, eurostat, and organisation for economic Co-operation and development
Consumer price index (Cpi) harmonized index of consumer prices (hiCp)

46 Charting international labor Comparisons | august 2011 u.s. bureau of labor statistiCs | www.bls.gov
Harmonized indexes of consumer prices (HICP) are an internationally comparable measure of consumer price inflation.
for a majority of
countries—particularly
slovakia, ireland, and
portugal—inflation was
slower during the 2007
to 2009 period, when
economies worldwide
experienced recessionary
pressures.
eastern european
countries generally
had the highest rates
of inflation during both
periods, while prices
changed the least in
Japan.
4.2Char
t Harmonized indexes of consumer prices, selected countries, average annual percent changes, 2000–2007 and 2007–2009
Japan
ireland
portugal
germany
france
netherlands
austria
united states
spain
italy
belgium
denmark
slovakia
sweden
finland
greece
norway
united kingdom
Czech republic
poland
hungary
estonia
–1 0 1 2 3 4 5 6 7
Percent
NOTE: 2007–2009 value for Japan is zero, indicating no change.
SOURCES: bureau of labor statistics and eurostat
2000–2007 2007–2009
u.s. bureau of labor statistiCs | www.bls.gov august 2011 | Charting international labor Comparisons 47
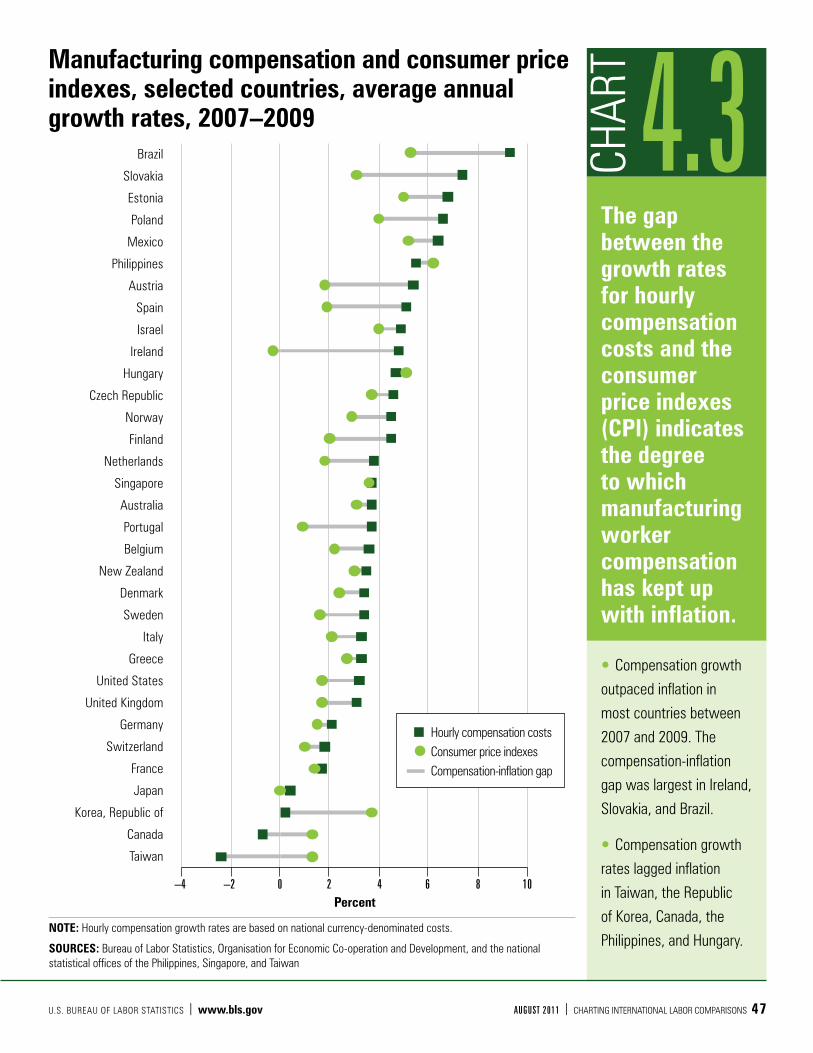
The gap between the growth rates for hourly compensation costs and the consumer price indexes (CPI) indicates the degree to which manufacturing worker compensation has kept up with inflation.
Compensation growth
outpaced inflation in
most countries between
2007 and 2009. the
compensation-inflation
gap was largest in ireland,
slovakia, and brazil.
Compensation growth
rates lagged inflation
in taiwan, the republic
of korea, Canada, the
philippines, and hungary.
4.3Char
tManufacturing compensation and consumer price indexes, selected countries, average annual growth rates, 2007–2009
brazil
slovakia
estonia
poland
mexico
philippines
austria
spain
israel
ireland
hungary
Czech republic
norway
finland
netherlands
singapore
australia
portugal
belgium
new Zealand
denmark
sweden
italy
greece
united states
united kingdom
germany
switzerland
france
Japan
korea, republic of
Canada
taiwan
–4 –2 0 2 4 6 8 10Percent
NOTE: hourly compensation growth rates are based on national currency-denominated costs.
SOURCES: bureau of labor statistics, organisation for economic Co-operation and development, and the national statistical offices of the philippines, singapore, and taiwan
hourly compensation costs Consumer price indexes
— Compensation-inflation gap

48 Charting international labor Comparisons | august 2011 u.s. bureau of labor statistiCs | www.bls.gov
Low prices relative to the United States were found in Southern and Eastern Europe, Latin America, and East Asia. The cheapest basket of goods was in China.
the price of foreign
goods and services
compared with their price
in the united states is
known as the relative price.
a value higher (lower) than
1 indicates that prices in
a particular country are
higher (lower) than prices
in the united states.
Countries with high
relative prices included
countries in northern and
western europe, as well
as Japan, Canada, and
australia.
4.4Char
t Price of a basket of goods that costs one dollar in the United States, selected countries, 2009
denmark
norway
finland
ireland
france
Japan
belgium
austria
netherlands
australia
sweden
germany
italy
Canada
united states
greece
spain
united kingdom
portugal
singapore
estonia
Czech republic
slovakia
hungary
korea, republic of
poland
mexico
brazil
China
0.0 0.1 0.2 0.3 0.4 0.5 0.6 0.7 0.8 0.9 1.0 1.1 1.2 1.3 1.4 1.5
U.S. dollars
SOURCES: bureau of labor statistics, international monetary fund, u.s. federal reserve, organisation for economic Co-operation and development, and the world bank
u.s. bureau of labor statistiCs | www.bls.gov august 2011 | Charting international labor Comparisons 49
SourcesConsumer price indexes (CPI) and harmonized
indexes of consumer prices (HICP) for most
countries are from the BLS report International Indexes of Consumer Prices 18 countries and areas, 1996-2009. Data for the remaining countries are
based on data from the Organisation for Economic
Co-operation and Development (OECD) database
OECD.Stat, the European Commission database
Eurostat, and national statistical offices (for the
Philippines, Singapore, and Taiwan).
Each country produces its own consumer price index
using unique methods and concepts. For this reason,
CPI data are not fully comparable across countries.
Differences exist mainly in population coverage,
frequency of market basket weight changes, and
treatment of homeowner costs.
The HICP is an internationally comparable measure
of consumer price inflation. The HICP is the
standard price index that European Union member
states must produce for comparisons across
countries. HICP data for the United States are an
experimental BLS series. Although the HICP series
for the United States broadly follows the European
Union definitions, some differences remain in
the frequency of market basket weight changes,
aggregation methods, and quality adjustments.
Relative prices for most countries are from the BLS
report International Comparisons of GDP per Capita and per Hour, 1960–2009. Data for the remaining
countries are based on PPP from OECD.Stat and
the World Bank database World Development
Indicators, and on market exchange rates from the
U.S. Federal Reserve, the International Monetary
Fund’s International Financial Statistics publication,
and OECD.Stat.
Section 1 NotesSection 4The relationship between purchasing power parities
(PPP) and market exchange rates can be used to
estimate comparative, or relative, prices of goods
and services in different countries. Relative prices
are calculated by dividing PPP by market exchange
rates. The resulting values indicate the domestic
price, expressed in U.S. dollars, of a basket of goods
that would cost exactly one dollar in the United
States. Consequently, values less than 1 indicate that
prices in that country are relatively low, compared
with the United States. Values greater than 1 indicate
that prices in a particular country are relatively high,
compared with the United States.
DefinitionsCompensation costs refer to average hourly
compensation costs for all employees in
manufacturing. (See section 3 Notes.) Consumer price
indexes (CPI) are a measure of the average change
over time in the prices paid by consumers for a
market basket of consumer goods and services. CPI
and annual percent changes are based on national
CPI as published by each country. They have not
been adjusted for comparability. Harmonized indexes
of consumer prices (HICP) are an internationally
comparable measure of consumer price inflation
based on European Union definitions. The index
represents urban and rural households in each
country and excludes the component for owner-
occupied housing costs. Purchasing power parities
(PPP) are currency conversion rates that allow output
in different currency units to be expressed in a
common unit of value. A PPP is the ratio between
the number of units of a country’s currency and
the number of U.S. dollars required to purchase an
equivalent market basket of goods and services
within each respective country.
Consumer priCes

U.S. BUREAU OF LABOR STATISTICSPostal Square Building, Room 2850
2 Massachusetts Avenue, NE.Washington, DC 20212-0001