2011 american%20fitness%20index report final
122
Actively Moving America to Better Health Health and Community Fitness Status of the 50 Largest Metropolitan Areas 2011
-
Upload
brendan-kearney -
Category
Documents
-
view
214 -
download
1
description
http://walkboston.org/sites/default/files/2011_American%20Fitness%20Index_report_final.pdf
Transcript of 2011 american%20fitness%20index report final

Actively Moving America to Better Health
Health and Community Fitness Status of the 50 Largest Metropolitan Areas
2011

This report is supported by a grant from the WellPoint Foundation. The opinions expressed in this report are those of the authors and do not necessarily reflect the views of the WellPoint Foundation.
ACSM AMeriCAn FitneSS index™ AdviSory BoArd
ACKnoWLedGeMentS
Chair: Walter R. Thompson, Ph.D., FACSM (Georgia State University)
Vice-Chair: Barbara E. Ainsworth, Ph.D., M.P.H., FACSM (Arizona State University)
Steven N. Blair, P.E.D., FACSM (University of South Carolina)
Jacqueline Epping, M.Ed. (U.S. Centers for Disease Control and Prevention)
John M. Jakicic, Ph.D., FACSM (University of Pittsburgh)
Liz Joy, M.D., M.P.H., FACSM (University of Utah School of Medicine/ Intermountain Healthcare)
NiCole Keith, Ph.D., FACSM (Indiana University)
Roseann M. Lyle, Ph.D., FACSM (Purdue University)
Melinda M. Manore, Ph.D., R.D., FACSM (Oregon State University)
Kenneth E. Powell, M.D., M.P.H., FACSM (Epidemiologic and Public Health Consultant) Angela Smith, M.D., FACSM (Children’s Hospital of Philadelphia)
Stella Lucia Volpe, Ph.D., R.D., FACSM (Drexel University)
Wes Wong, M.D., M.M.M. (Anthem Blue Cross Blue Shield-WellPoint)
report AuthorS
Brenda E. Chamness, M.S., MCHESAmerican Fitness Index Program OfficerAmerican College of Sports Medicine
Terrell W. Zollinger, Dr.P.H., M.S.P.H.Professor, Indiana University School of MedicineAssociate Director, Bowen Research Center
Carolyn M. Muegge, M.S., M.P.H.Research Manager, Bowen Research CenterIndiana University School of Medicine Walter R. Thompson, Ph.D., FACSMRegents Professor, Georgia State UniversityChair, ACSM American Fitness Index™ Advisory Board
Barbara E. Ainsworth, Ph.D., M.P.H., FACSMProfessor, Arizona State UniversityVice-Chair, ACSM American Fitness Index™ Advisory Board Jessica M. Coffing, M.P.H.Project Coordinator, Bowen Research CenterIndiana University School of Medicine Cynthia K. Lewis, M.P.H.Project Coordinator, Bowen Research CenterIndiana University School of Medicine
ACSM AMeriCAn FitneSS index™ reSeArCh teAM
Terrell W. Zollinger, Dr.P.H., M.S.P.H.Professor, Indiana University School of Medicine Associate Director, Bowen Research Center
Carolyn M. Muegge, M.S., M.P.H.Research Manager, Bowen Research CenterIndiana University School of Medicine
Jessica M. Coffing, M.P.H.Project Coordinator, Bowen Research CenterIndiana University School of Medicine Cynthia K. Lewis, M.P.H.Project Coordinator, Bowen Research CenterIndiana University School of Medicine
AMeriCAn CoLLeGe oF SportS MediCine StAFF
James R. WhiteheadExecutive Vice President
Jane G. SeniorAssistant Executive Vice President
Brenda E. Chamness, M.S., MCHESAmerican Fitness Index Program Officer
Questions and comments on the report should be directed to the American College of Sports Medicine at [email protected].
Report design by Kern Graphic Design, Indianapolis, Indiana (www.kerngraphicdesign.com).

ACSM AMeriCAn FitneSS index™heALth And CoMMunity FitneSS StAtuSoF the 50 LArGeSt MetropoLitAn AreAS
2011 edition

4
tABLe oF ContentSExecutive Summary .......................................................................................................................7 Background and Need for Action................................................................................................9 ACSM American Fitness Index™ Program.................................................................................10
ACSM American Fitness Index™ Program Components...................................................10Implementation........................................................................................................................10ACSM American Fitness Index™ Advisory Board................................................................11ACSM American Fitness Index™ Guiding Principles for Healthy Communities..............11
Methodology..................................................................................................................................12
Why Choose MSAs over Cities?..............................................................................................12How Were the Indicators Selected for the Data Index?....................................................12What Data Sources Were Used to Create the Data Index?..............................................12How Was the Data Index Built?..............................................................................................13How Should the Scores and Ranks Be Interpreted..............................................................14How Were the Strengths/Advantages and Opportunities/Challenges Determined?..14What Limitations of this Project Need to be Considered?.................................................14How Did We Move from Pilot Version to First Full Version?..................................................14My AFI: AFI Community Application Tool.............................................................................14References..................................................................................................................................15
Metropolitan Area Snapshots
Atlanta, GA.............................................................................................................................16Austin, TX..................................................................................................................................18Baltimore, MD..........................................................................................................................20Birmingham, AL.......................................................................................................................22Boston, MA...............................................................................................................................24Buffalo, NY................................................................................................................................26Charlotte, NC..........................................................................................................................28Chicago, IL..............................................................................................................................30Cincinnati, OH.........................................................................................................................32Cleveland, OH........................................................................................................................34Columbus, OH.........................................................................................................................36Dallas, TX..................................................................................................................................38Denver, CO..............................................................................................................................40Detroit, MI................................................................................................................................42Hartford, CT..............................................................................................................................44Houston, TX..............................................................................................................................46Indianapolis, IN........................................................................................................................48

5
Metropolitan Area Snapshots (continued)Jacksonville, FL.............................................................................................................................50Kansas City, MO-KS......................................................................................................................52Las Vegas, NV ..............................................................................................................................54Los Angeles, CA...........................................................................................................................56Louisville, KY...................................................................................................................................58Memphis, TN..................................................................................................................................60Miami, FL........................................................................................................................................62Milwaukee, WI..............................................................................................................................64Minneapolis-St. Paul, MN ............................................................................................................66Nashville, TN..................................................................................................................................68New Orleans, LA...........................................................................................................................70New York, NY.................................................................................................................................72Oklahoma City, OK......................................................................................................................74Orlando, FL...................................................................................................................................76Philadelphia, PA............................................................................................................................78Phoenix, AZ....................................................................................................................................80Pittsburgh, PA................................................................................................................................82Portland, OR..................................................................................................................................84Providence, RI...............................................................................................................................86Raleigh, NC...................................................................................................................................88Richmond, VA...............................................................................................................................90Riverside, CA.................................................................................................................................92Sacramento, CA..........................................................................................................................94Saint Louis, MO-IL..........................................................................................................................96Salt Lake City, UT...........................................................................................................................98San Antonio, TX..........................................................................................................................100San Diego, CA............................................................................................................................102San Francisco, CA......................................................................................................................104San Jose, CA...............................................................................................................................106Seattle, WA..................................................................................................................................108Tampa, FL...................................................................................................................................110Virginia Beach, VA.....................................................................................................................112Washington, DC.........................................................................................................................114
Appendix A – Data Sources............................................................................................................116 Appendix B – Members of the Expert Panel.................................................................................118
Appendix C – My AFI Community Application Tool Instructions................................................120Appendix C – My AFI Data Template.............................................................................................121

6
May 2011
Dear friends and colleagues,
Before you is the 2011 ACSM American Fitness Index™ (AFI) data report. As the founding sponsor of AFI, the WellPoint Foundation is proud to be a continuing sponsor of this healthy lifestyle measurement and improvement endeavor.
Developed by some of the leading sports medicine professionals and exercise scientists in the country, AFI’s scientific, data-driven report provides a unique measure of health, fitness and quality of life in America’s 50 most populous metropolitan areas.
My hope is that this report will be a valuable tool in evaluating the state of health and fitness in your community, help recognize and celebrate areas of success, and bring focus to areas that need attention and improvement.
Our involvement with ACSM and the AFI program illustrates our commitment to enhancing health improvement efforts across the country and allows us to be a stronger community partner in the states we serve. Each year, WellPoint Inc., its Foundation and my fellow associates donate nearly $22.5 million to help meet health and economic development needs of communities across the nation.
Nevertheless, we understand that improving the health and fitness of Americans is an effort that requires localized strategies, action and support. This report represents an extension of our hand to help make your community a healthy, fit and happy place.
In addition to the information provided in this report, I encourage you to visit AmericanFitnessIndex.org and WellPointFoundation.org for tools and resources on inciting positive change in the health and wellness of your hometown.
Thank you in advance for your interest and support!
Respectfully,
Wesley B. Wong, M.D., M.M.M.Regional Vice President, Medical DirectorAnthem Blue Cross and Blue ShieldAnthem National Accounts & Commercial Business

7
exeCutive SuMMAryWith support and funding from the WellPoint Foundation, the American College of Sports Medicine (ACSM) launched the ACSM American Fitness IndexTM (AFI) program in 2008 to help communities identify opportunities to improve the health of their residents and expand community assets to better support active, healthy lifestyles. The AFI reflects a composite of preventive health behaviors, levels of chronic disease conditions, health care access, as well as community resources and policies that support physical activity. In addition, demographic diversity, economic diversity and violent crime levels are included for each metropolitan area to illustrate the unique attributes of each city. Communities with the highest AFI scores are considered to have strong community fitness, a concept analogous to individuals having strong personal fitness. The AFI was developed to assist communities in their efforts to improve the quality of life and well-being of their residents. The 50 largest metropolitan areas in the United States, as defined by the U.S. Office of Management and Budget using data from the U.S. Census Annual Estimates of Population, were included in this 2011 data report for the AFI program. Metropolitan Statistical Areas (MSAs) were chosen as the unit of measurement because they represent the group of counties comprising the urban areas where residents live, work and access community resources.
The AFI program is unique for several reasons: • Cities are defined by MSAs; • Personal health indicators, as well as community and environmental indicators, are included in the
data report; • Data come from reputable sources, and scientific methodologies are used to increase validity
and reliability;• Unique areas of strength and opportunities for improvement are included for each MSA to help guide
community action;• Materials, resources and connections to health promotion partners are provided by the AFI program to
help cities improve their indicators; and,• Local, state and national health promotion partners form a network to support collaborative
program efforts.
The first step in creating the report for the AFI program involved developing a strategy to identify, gather, analyze and present MSA-level data on population, health and built environment. Data were identified, assessed and scored by a national expert panel for inclusion into an index to compare each MSA’s attributes with the overall U.S. values and with the other large metropolitan areas. Based on the comparisons, strengths/advantages and opportunities/challenges for each MSA were noted.
There was great diversity in community fitness levels among the 50 MSAs. Cities that ranked near the top of the index have several strengths that support healthy living and few challenges that hinder it. The opposite is true for cities near the bottom of the index. All cities are commended for their strengths and encouraged to focus future efforts on their areas of opportunity to achieve healthy, active living.

8
1234567891011121314151617181920212223242526272829303132333435363738394041424344454647484950
Minneapolis, MNWashington, DC
Boston, MAPortland, ORDenver, CO
San Francisco, CAHartford, CTSeattle, WA
Virginia Beach, VASacramento, CA
San Jose, CARichmond, VASan Diego, CACincinnati, OH
Salt Lake City, UTAustin-Round Rock, TX
Pittsburgh, PAAtlanta, GA
Providence, RIBaltimore, MDMilwaukee, WI
Kansas City, MOBuffalo, NYRaleigh, NC
Cleveland, OHSaint Louis, MOPhiladelphia, PA
Chicago, ILOrlando, FL
New York, NYJacksonville, FL
Phoenix, AZSan Antonio, TXNew Orleans, LA
Miami, FLCharlotte, NCNashville, TN
Columbus, OHDallas, TXTampa, FL
Los Angeles, CAHouston, TX
Las Vegas, NVRiverside, CA
Indianapolis, INDetroit, MI
Birmingham, ALMemphis, TNLouisville, KY
Oklahoma City, OK
77.276.869.167.767.666.8*66.8*66.565.865.365.264.263.360.359.857.855.555.255.153.751.851.550.250.049.649.3*49.3*48.948.648.346.745.345.043.943.142.3*42.3*42.241.340.439.138.337.836.834.433.833.632.929.024.6
Rank Metropolitan Area SCORE
*The scores shown have been rounded to the nearest tenth of a point, resulting in some apparent ties. The rankings are based on the full calculated score values, which were not equal.
This 2011 edition report presents updated rankings from the first three full-edition reports released in 2008, 2009 and 2010. The long-range vision for the AFI program is to provide annual updates to the rankings, so cities can monitor their progress in improving their health and active living fitness indicators.

9
BACKGround And need For ACtionphySiCAL ACtivity For ALL!Being physically active is one of the most important ways adults and children can maintain and improve their overall health.1-5 For adults, regular exercise can prevent premature death, heart disease, stroke, high blood pressure, type 2 diabetes, breast cancer, colon cancer and the risk of falls. For children and adolescents, regular physical activity can decrease body fat and improve bone health, cardiorespiratory fitness and muscular strength. Physical activity also is associated with a decreased risk of depression in adults and the reduction of depression symptoms in young people.2-5
Emerging public health information suggests that to reach the U.S. Centers for Disease Control and Preven-tion’s goal to improve health and fitness, prevent disease and disability, and enhance quality of life for all Americans through physical activity, we must create a culture that integrates physical activity into our daily lives.1 The ACSM American Fitness Index™ (AFI) program developed a valid and reliable measure of health and community fitness at a metropolitan level to:
• Provide community leaders with information to understand the personal, community, societal and environmental influences on physical activity and healthy eating;
• Develop strategies to promote physical activity at multiple levels of influence; and• Take action through local community mobilization with the AFI Community Action Guide, health
promotion partners and other best practices.6
While the AFI data report provides detailed information for cities at the MSA level, the “My AFI” community application tool integrates the components of the AFI program into a health promotion approach that can be applied at the local level for any community. Using this tool, leaders can understand the individual, societal and behavioral factors related to physical activity in their community and implement culturally focused activities that are meaningful to their residents.
Overall, the goal of the AFI program is to help improve the health of the nation by promoting active lifestyles through local programming and developing a sustainable, healthy community culture. To accomplish this goal, community leaders and health planners need to be aware of their community’s health status and behaviors; key indicators, such as obesity and chronic disease rates and number of health care providers, related to physical inactivity; built environment and resources; and policies that support a healthy community. The AFI program is specifically designed to provide this data and other valuable assistance to cities to further their efforts to improve the health and quality of life of residents, promote healthier lifestyles and encourage community resource development to support physical activity.

10
ACSM AMeriCAn FitneSS index™ proGrAM With support and funding from the WellPoint Foundation (www.wellpointfoundation.org), the AFI program was created to develop a valid and reliable measure of the health and community fitness at the metropolitan level in the United States, to provide valuable resources that help communities focus their programming efforts and to assist communities in developing collaborative activities and partnerships with other organizations that contribute to health promotion. Using the AFI data report, communities will be able to assess factors contributing to the health status of their residents. Additionally, as communities implement targeted programs to improve health status and environmental resources, they will be able to measure their progress using the relevant AFI elements.
ACSM AMeriCAn FitneSS index™ proGrAM CoMponentSThe AFI program improves the health, fitness and quality of life of citizens through three key components:
• Data: Collect, aggregate and report metropolitan-level data related to healthy lifestyles, health outcomes and community resources that support a physically active society. Disseminate the AFI data report to give an accurate snapshot of the health status and contributing factors in major metropolitan areas across the nation.
• Resources: Serve as a resource for promoting and integrating research, education and practical applications of sports medicine and exercise science to maintain and enhance physical performance, fitness, health and quality of life.
• Health Promotion Partners: Help communities connect and partner with existing organizations and local, state and national programs on physical activity and healthy lifestyles initiatives.
iMpLeMentAtionThis fourth full-edition data report for the AFI program focuses on data collection and analysis for the 50 largest metropolitan areas in the United States. The program’s data report shows the result of identifying, collecting, analyzing, weighing and aggregating relevant data at the metropolitan level.
The metropolitan areas in this report represent the 50 largest Metropolitan Statistical Areas (MSAs) defined by the U.S. Office of Management and Budget using data from the U.S. Census Annual Estimates of Population. They are the cities and surrounding metropolitan areas of:
• Atlanta-Sandy Springs-Marietta, GA • Austin-Round Rock, TX • Baltimore-Towson, MD • Birmingham-Hoover, AL • Boston-Cambridge-Quincy, MA-NH • Buffalo-Niagara Falls, NY • Charlotte-Gastonia-Concord, NC-SC • Chicago-Naperville-Joliet, IL-IN-WI • Cincinnati-Middletown, OH-KY-IN • Cleveland-Elyria-Mentor, OH • Columbus, OH • Dallas-Fort Worth-Arlington, TX • Denver-Aurora, CO • Detroit-Warren-Livonia, MI • Hartford-West Hartford-East Hartford, CT • Houston-Sugar Land-Baytown, TX • Indianapolis-Carmel-Metro Area • Jacksonville, FL • Kansas City, MO-KS • Las Vegas-Paradise, NV • Los Angeles-Long Beach-Santa Ana, CA • Louisville/Jefferson County, KY-IN • Memphis, TN-MS-AR • Miami-Fort Lauderdale-Pompano Beach, FL • Milwaukee-Waukesha-West Allis, WI • Minneapolis-St. Paul-Bloomington, MN-WI
• Nashville-Davidson-Murfreesboro-Franklin, TN • New Orleans-Metairie-Kenner, LA• New York-Northern New Jersey-
Long Island, NY-NJ-PA• Oklahoma City, OK • Orlando-Kissimmee, FL • Philadelphia-Camden-Wilmington, PA-NJ-DE-MD • Phoenix-Mesa-Scottsdale, AZ • Pittsburgh, PA • Portland-Vancouver-Beaverton, OR-WA • Providence-New Bedford-Fall River, RI-MA • Raleigh-Cary, NC • Richmond, VA • Riverside-San Bernardino-Ontario, CA • Sacramento-Arden-Arcade-Roseville, CA • Saint Louis, MO-IL • Salt Lake City, UT • San Antonio, TX • San Diego-Carlsbad-San Marcos, CA • San Francisco-Oakland-Fremont, CA • San Jose-Sunnyvale-Santa Clara, CA • Seattle-Tacoma-Bellevue, WA • Tampa-St. Petersburg-Clearwater, FL • Virginia Beach-Norfolk-Newport News, VA-NC • Washington-Arlington-Alexandria, DC-VA-MD-WV

11
ACSM AMeriCAn FitneSS index™ AdviSory BoArd
The AFI program would not be possible without direction from the knowledgeable volunteers who make up the AFI Advisory Board. The AFI Advisory Board comprises experts with a vested interest in the fields of health and physical activity who volunteer their time to support the mission of the AFI program.
The AFI Advisory Board was created in 2007 to assist in the development of the AFI program and continues to offer guidance on the integrity of the program. Members of the AFI Advisory Board assure the AFI data report and overall program adhere to the ACSM Guiding Principles for Healthy Communities and the goals of the AFI program by:
• translating the science to practice;• actively participating in strategic planning for the program;• critically reviewing all program documentation and collateral materials; and• providing expert guidance and feedback to communities.
ACSM greatly appreciates the contributions of our AFI Advisory Board members:• Chair: Walter R. Thompson, Ph.D., FACSM (Georgia State University)• Vice-Chair: Barbara E. Ainsworth, Ph.D., FACSM (Arizona State University)• Steven N. Blair, P.E.D., FACSM (University of South Carolina)• Jacqueline Epping, M.Ed. (U.S. Centers for Disease Control and Prevention)• John M. Jakicic, Ph.D., FACSM (University of Pittsburgh)• Liz Joy, M.D., M.P.H., FACSM (University of Utah School of Medicine/Intermountain Healthcare)• NiCole Keith, Ph.D., FACSM (Indiana University)• Roseann M. Lyle, Ph.D., FACSM (Purdue University)• Melinda M. Manore, Ph.D., R.D., FACSM (Oregon State University)• Kenneth E. Powell, M.D., M.P.H., FACSM (Epidemiologic and Public Health Consultant)• Angela Smith, M.D., FACSM (Children’s Hospital of Philadelphia)• Stella Lucia Volpe, Ph.D., R.D., FACSM (Drexel University)• Wes Wong, M.D., M.M.M. (Anthem Blue Cross Blue Shield-WellPoint)
ACSM AMeriCAn FitneSS index™ GuidinG prinCipLeS For heALthy CoMMunitieS
• Overall health improvement in U.S. cities requires a focus on the prevention of behavioral-linked diseases by effectively addressing the underlying unhealthy behaviors and community factors.
• The rise in chronic diseases attributable to physical inactivity and unhealthy diets are a “clear and present danger” to our health and health care systems, our cities, our nation and our future.
• All cities in the U.S., irrespective of size and current health status, can make significant advances in improving the health of their people through simple, affordable, effective steps.
• There is a need for even more synergy and collaboration to assist U.S. cities in actively making the moves toward better health.
The AFI program will contribute to the Guiding Principles for Healthy Communities by creating effective partnerships and alliances at the national and local levels; by providing tools, strategies and expertise to cities and communities desiring to improve the health of their residents; and by supporting practices and policies that have proven effective.

12
MethodoLoGy Scientific evidence, expert opinion and statistical methodologies were employed to select, weigh and combine the elements used in the AFI data report.
Why ChooSe MSAs over CitieS?Defining a “city” by its city limits overlooks the interaction between the core of the city and the surrounding suburban areas. Residents outside the city limits have access to fitness-related resources in their suburban area as well as the city core; likewise, the residents within the city limits may access resources in the surrounding areas. Thus, the metropolitan area, including both the city core and the surrounding suburban areas, act as a unit to support the wellness efforts of residents of the area. Consequently, the MSA data were used where possible in constructing the AFI. It is understood that various parts of the central city and surrounding suburban area may have very different demographic and health behavior characteristics, as well as access to community-level resources to support physical activity. Currently, the nationally available data needed to measure these characteristics and resources are not available to allow comparisons of all of the smaller geographical levels in the MSAs. However, it would be possible for communities within the MSA to collect local data using the measurements and strategy outlined in this report to identify opportunities and to monitor improvements occurring as a result of their initiatives.
hoW Were the indiCAtorS SeLeCted For the dAtA index?Elements included in the data index must have met the following criteria to be included:• Be related to the level of health status and/or physical activity for a community; • Have recently been measured and reported by a reputable agency or organization in the
metropolitan area; • Be available to the public;• Be measured routinely and provided in a timely fashion; and• Be modifiable through community effort (for example, smoking rate is included, climate is not).
WhAt dAtA SourCeS Were uSed to CreAte the dAtA index?Publicly available data sources from federal reports and past studies provided the information used in this version of the data index. The largest single data source for the personal health indicators was the Selected Metropolitan/Micropolitan Area Risk Trends Behavioral Risk Factor Surveillance System (SMART BRFSS). Through an annual survey, conducted by the Center for City Park Excellence, the Trust for Public Land provided many of the community/environmental indicators, and the U.S. Census American Community Survey was the source for most of the MSA descriptions. The U.S. Department of Agriculture; State Report Cards (School Health Policies and Programs Study by the CDC); the Health Resources and Services Administration’s (HRSA) Area Resource File; and the Federal Bureau of Investigation’s (FBI) Uniform Crime Reporting Program also provided data used in the MSA description and index. In all cases, the most recently available data (typically 2009) were used. The data index elements and their data sources are shown in Appendix A.

13
hoW WAS the dAtA index BuiLt?
Potential elements for the AFI data index were scored for relevance by a panel of 26 health and physical activity experts in 2008 (listed in Appendix B). Two Delphi method–type rounds of scoring were used to reach consensus on whether each item should be included in the data index and the weight it should carry in the calculations.
The Delphi method began with a draft list of elements or measures to include in the index. An expert panel was selected (listed in Appendix B), and a questionnaire was mailed to them for their input on the list of elements. Each participant was asked to score the elements on a scale from 0 to 3 (0 = not appropriate for the index; 1 = should be in the index, but of minor importance; 2 = should be in the index and is of moderate importance; 3 = should be in the index and is of high importance) independently and return their scoring sheet for analysis and preparation for the second round. The panel members also were asked to add measures they thought should be in the index.
The responses from the first round were summarized into a feedback version of the list and resent to the same panelists for a second round of scoring. Consensus was obtained for some elements during the first round, so the panelists were not asked to rate them during the second round. The list of measures used for the second round showed the panelists’ scores from the first round. The panelists were asked to score the elements on the same scale again after they saw how their colleagues had scored each element on the first round and send their responses back for analysis. After the second round, a consensus was obtained for all elements. A final summary report was provided to the expert panel members for their final feedback.
A weight of 1 was assigned to those elements that were considered to be of little importance; 2 for those items considered to be of moderate importance; and 3 to those elements considered of high importance to include in the data index. From this process, 30 currently available indicators were identified and weighted for the index and 17 description variables were selected. The description elements were not included in the data index calculation, but were shown for cities to use for comparison purposes. Each item was first ranked (worse value = 1) and then multiplied by the weight assigned by consensus of the expert panel. The weighted ranks were then summed by indicator group to create scores for the personal health indicators and community/environmental indicators. Finally, the MSA scores were standardized to a scale with the upper limit of 100 by dividing the MSA score by the maximum possible value and multiplying by 100.
The following formula summarizes the scoring process:
n MSA Scorek = ((∑ rki wki)/MSA Scoremax)*100
i=1
r = MSA rank on indicatorw = weight assigned to indicatork = indicator groupn = 14 for personal health indicators and 16 for community/environmental indicatorsMSA Scoremax = hypothetical score if an MSA ranked best on each of the elements
The individual weights also were averaged for both indicator groups to create the total score. Both the indicator group scores and the total scores for the 50 cities were then ranked (best = 1) as shown on the Metropolitan Area Snapshots.

14
hoW ShouLd the SCoreS And rAnKS Be interpreted? It is important to consider both the score and rank for each city. While the ranking lists the MSAs from the highest score to the lowest score, the scores for many cities are very similar, indicating that there is relatively little difference among them. For example, the score for Portland was 67.7 while the score for Denver was 67.6. While Portland was ranked higher than Denver, they are actually very similar across all of the indicators; thus, there is little difference in the community wellness levels of the two MSAs. Also, while one city carried the highest rank (Minneapolis, MN) and another carried the lowest rank (Oklahoma City, OK), this does not necessarily mean that the highest ranked city has excellent values across all indicators and the lowest ranked city has the lowest values on all the indicators. The ranking merely indicates that, relative to each other, some cities scored better than others.
hoW Were the StrenGthS/AdvAntAGeS And opportunitieS/ChALLenGeS deterMined? Areas of strengths/advantages and opportunities/challenges of the MSAs were listed to assist communities in identifying potential areas where those communities might focus their efforts, using approaches adopted by those cities that have strengths in the same area. This process involved comparing the descriptive and data index elements of the MSA to the average of the other MSAs. Those with values higher than the MSA average by ten percent or more were considered strengths/advantages. Those with values lower than the MSA average by ten percent or more were listed as opportunities/challenges.
WhAt LiMitAtionS oF thiS projeCt need to Be ConSidered? The items used for the personal health indicators were based on self-reported responses to the Behavioral Risk Factor Surveillance Survey and are subject to the well-known limitations of self-reported data. Since this limitation applies to all metropolitan areas included in this report, the biases should be similar across all areas, so the relative differences should be valid. As per advice provided on the FBI Uniform Crime Reporting Program Web site, violent crime rates were not compared to U.S. values or averages of all MSAs. As indicated on the FBI Web site, data on violent crimes may not be compa-rable across all metropolitan areas because of differences in law enforcement policies and practices from area to area. The Trust for Public Land community/environmental indicators only includes city-level data, not data for the complete MSA. Consequently, most of the community/environmental indicators shown on the MSA tables are for the main city in the MSA and do not include resources in the rest of the MSA.
hoW did We Move FroM piLot verSion to FirSt FuLL verSion?The first full version of the AFI data report was based on the strategies used in the pilot phase, released in May 2008. This version incorporated the many valuable suggestions and comments ACSM received after the pilot phase was released. Further comments and suggestion are welcomed for this version as well. Please send your questions, comments and suggestions about the ACSM American Fitness IndexTM data report or overall program to [email protected].
My AFi: AFi CoMMunity AppLiCAtion tooLMy AFI is the community application tool of the ACSM American Fitness Index™ program. My AFI integrates the components of the ACSM American Fitness Index™ into a health promotion approach that can be applied to just about any community. Using the My AFI Data Template (Appendix C), stakeholders can gain an understanding of the individual and societal behaviors related to physical activity in their own community.
The firststep in the process is to complete the My AFI Data Template for your community using the data sources listed in Appendix A of the 2011 data report, where available. Document your community’s population characteristics, health behaviors, chronic health problems, health care and built environment attributes in the first column, titled “My AFI,” of the My AFI Data Template. Although some of the data may not be available for your community, complete the My AFI Data Template as thoroughly as possible.

15
The second step is to identify your community’s physical activity-related strengths/advantages and opportunities/challenges. If your community’s health indicators for health behaviors, chronic health problems, health care and built environment attributes are better by ten percent or more compared to the MSA average, this characteristic is a strength/advantage for your community. If the indicator is worse by ten percent or more, this measure is an opportunity/challenge. For an example, refer to the My AFI Instructions in Appendix C. The indicators marked with an asterisk (*) in the Population Characteristics section of the My AFI Data Template are not modifiable but provide a description of your community’s population.
You may use the data you have available to better understand your community’s physical activity level and health status and to help guide your strategic planning activities. Now that you have collected and evaluated your community’s information, remember to celebrate your community’s successes and keep in mind that any work on an opportunity/challenge moves your community toward improved health and quality of life. Consult the AFI Community Action Guide or the AFI Web site (www.americanfitnessindex.org) for tools and resources to focus local health promotion efforts.
reFerenCeS1. National Physical Activity Plan. (May 2010). Retrieved from
http://www.physicalactivityplan.org/NationalPhysicalActivityPlan.pdf
2. Centers for Disease Control and Prevention (2010, Dec 29). Physical Activity. Retrieved from http://www.cdc.gov/physicalactivity/
3. American College of Sports Medicine. (2007). About ACSM. Retrieved from http://www.acsm.org/am/template.cfm?section=about_acsm
4. U.S. Department of Health and Human Services, Healthy People 2020. (n.d.). Physical Activity. Retrieved from http://www.healthypeople.gov/2020/topicsobjectives2020/overview.aspx?topicid=33
5. U.S. Department of Health and Human Services, Office of Disease Prevention and Health Promotion. Physical activity guidelines advisory committee report, 2008. Washington:HHS, 2008.
6. Sallis, J. F., Cervero, R. B., Ascher, W., Henderson, K. A., Kraft, M. K., & Kerr, J. (2006). An ecological approach to creating active living communities. AnnualReviewofPublicHealth, 27, 297-322. doi: 10.1146/annurev.publhealth.27.021405.102100

AtLAntA, GA(Atlanta–Sandy Springs–Marietta, GA MSA)
CountieS Barrow, Bartow, Butts, Carroll, Cherokee, Clayton, Cobb, Coweta, Dawson, DeKalb, Douglas, Fayette, Forsyth, Fulton, Gwinnett, Haralson, Heard, Henry, Jasper, Lamar, Meriwether, Newton, Paulding, Pickens, Pike, Rockdale, Spalding, Walton
Atlanta MSA
deSCription oF AtLAntA–SAndy SprinGS–MAriettA, GA MSA
opportunitieS/ChALLenGeS
StrenGthS/AdvAntAGeS
16
• Lower percent currently smoking• Lower percent of days when physical health
was not good during the past 30 days• Lower percent of days when mental health
was not good during the past 30 days • Lower percent with asthma• Lower percent with angina or coronary
heart disease
• Lower death rate for diabetes• More golf courses per capita• More park units per capita• More recreation centers per capita• More swimming pools per capita• More tennis courts per capita
Population
Percent less than 18 years old
Percent 18 to 64 years old
Percent 65 years old and older
Percent male
Percent high school graduate or higher
Percent White
Percent Black or African American
Percent Asian
Percent Other Race
Percent Hispanic/Latino
Percent unemployed
Median household income
Percent of households below poverty level
Violent crime rate/100,000*
Percent with disability
307,006,550
24.3%
62.8%
12.9%
49.3%
85.3%
74.8%
12.4%
4.5%
8.3%
15.8%
9.9%
$50,221
10.5%
429.4
12.0%
5,475,213
27.0%
64.4%
8.6%
49.4%
86.9%
57.8%
31.5%
4.3%
6.3%
10.0%
11.6%
$55,464
10.3%
439.7
9.2%
3,325,885
24.6%
63.6%
11.8%
49.2%
86.7%
72.3%
15.0%
5.1%
7.6%
15.1%
9.8%
$55,331
9.5%
11.0%
• Higher percent unemployed• Lower percent of city land area as parkland• Fewer acres of parkland per capita• Fewer farmers’ markets per capita• Lower percent using public transportation to work• Lower percent bicycling or walking to work• Fewer ball diamonds per capita
• Fewer dog parks per capita• Fewer park playgrounds per capita• Lower level of state requirement for Physical
Education classes• Lower number of primary health care providers
per capita
*Due to differences in jurisdictional definitions and reporting, the FBI recommends that these rates not be compared across areas
ranking: total Score = 55.2; rank = 18
1,123,804 – 19,069,796
20.2% – 29.4%
60.5% – 66.9%
7.9% – 17.2%
48.1% – 51.1%
77.6% – 92.5%
49.8% – 88.6%
1.7% – 44.5%
1.2% – 30.2%
1.9% – 24.5%
1.2% – 53.4%
6.4% – 16.3%
$43,633 – $85,168
4.9% – 15.1%
7.4% – 14.5%
U.S. Value MSA Average MSA Range

17
ACSM AMeriCAn FitneSS indextM CoMponentS
Community/environmental indicators – Score = 46.4; rank = 32
Health Behaviors Percent any physical activity or exercise in the last 30 days Percent physically active at least moderatelyPercent eating 5+ servings of fruits/vegetables per dayPercent currently smoking
Chronic Health ProblemsPercent obesePercent in excellent or very good healthAny days when physical health was not good during
the past 30 daysAny days when mental health was not good during
the past 30 daysPercent with asthmaPercent with angina or coronary heart diseasePercent with diabetesDeath rate/100,000 for cardiovascular diseaseDeath rate/100,000 for diabetes
Health Care
Percent with health insurance
77.8%46.2%25.9%14.6%
25.1%57.0%29.9%
27.6%
6.5%2.5%7.9%196.115.2
82.3%
76.2%51.0%23.4%17.9%
26.9%56.0%35.5%
33.7%
8.8%3.8%8.3%206.722.5
85.6%
77.2%48.7%24.4%17.0%
25.9%56.8%35.3%
34.4%
8.3%3.6%8.3%201.021.9
86.3%
Built EnvironmentParkland as percent of city land areaAcres of parkland/1,000Farmers’ markets/1,000,000Percent using public transportation to workPercent bicycling or walking to work
Recreational FacilitiesBall diamonds/10,000Dog parks/10,000Park playgrounds/10,000Golf courses/100,000Park units/10,000Recreation centers/20,000Swimming pools/100,000Tennis courts/10,000
Park-related expenditures per capita
Level of state requirement for Physical Education classes**
Number of primary health care providers per 100,000
4.6%7.23.5
3.7%1.6%
1.50.42.01.16.61.34.13.3
$101
2
68.9
2.5% – 25.3%2.3 – 94.11.0 – 41.0
0.4% – 30.5%1.2% – 6.7%
0.3 – 5.70.0 – 5.70.9 – 4.80.0 – 5.0
1.2 – 10.90.1 – 2.60.6 – 9.20.8 – 6.9
$12.0 – $259.0
0 – 3
46.8 – 133.7
(note: most of these data were available only for the main city in the MSA)
**3 = required at three levels: high school, middle school and elementary school; 2= required at two levels; 1= required at only one level
personal health indicators – Score = 64.7; rank = 16
70.4% – 85.9%36.4% – 58.1%15.8% – 30.0%8.8% – 25.3%
18.1% – 34.3%46.4% – 66.6%29.5% – 40.3%
23.8% – 41.9%
4.5% – 11.9%2.4% – 5.6%5.4% – 11.6%131.7 – 268.6
9.9 – 31.4
77.3% – 94.4%
Atlanta MSA U.S. Value MSA Average MSA Range
Atlanta MSA Average Range of all Cities
10.6%18.914.84.3%2.8%
2.00.92.31.04.21.13.12.1
$101.5
2.5
93.2

opportunitieS/ChALLenGeS
StrenGthS/AdvAntAGeS
18
Population
Percent less than 18 years old
Percent 18 to 64 years old
Percent 65 years old and older
Percent male
Percent high school graduate or higher
Percent White
Percent Black or African American
Percent Asian
Percent Other Race
Percent Hispanic/Latino
Percent unemployed
Median household income
Percent of households below poverty level
Violent crime rate/100,000*
Percent with disability
*Due to differences in jurisdictional definitions and reporting, the FBI recommends that these rates not be compared across areas
U.S. Value MSA Average MSA RangeAustin MSA
deSCription oF AuStin-round roCK, tx MSA
1,123,804 – 19,069,796
20.2% – 29.4%
60.5% – 66.9%
7.9% – 17.2%
48.1% – 51.1%
77.6% – 92.5%
49.8% – 88.6%
1.7% – 44.5%
1.2% – 30.2%
1.9% – 24.5%
1.2% – 53.4%
6.4% – 16.3%
$43,633 – $85,168
4.9% – 15.1%
7.4% – 14.5%
3,325,885
24.6%
63.6%
11.8%
49.2%
86.7%
72.3%
15.0%
5.1%
7.6%
15.1%
9.8%
$55,331
9.5%
11.0%
307,006,550
24.3%
62.8%
12.9%
49.3%
85.3%
74.8%
12.4%
4.5%
8.3%
15.8%
9.9%
$50,221
10.5%
429.4
12.0%
1,705,075
25.2%
66.9%
7.9%
51.0%
86.6%
73.7%
7.5%
4.5%
14.3%
30.7%
8.1%
$56,218
9.5%
356.1
9.5%
• Higher percent of days when mental health was not good during the past 30 days
• Higher percent with angina or coronary heart disease
• Fewer farmers’ markets per capita• Lower percent using public transportation to work• Lower percent bicycling or walking to work• Fewer ball diamonds per capita
• Fewer park playgrounds per capita• Fewer golf courses per capita• Fewer park units per capita• Fewer recreation centers per capita• Fewer tennis courts per capita• Lower park-related expenditures per capita• Lower number of primary health care providers
per capita
• Lower percent unemployed• Higher percent physically active at
least moderately• Higher percentage eating 5+ servings of
fruits/vegetables per day• Lower percent currently smoking• Lower percent with asthma• Lower percent with diabetes
• Lower death rate for cardiovascular disease• Lower death rate for diabetes• Higher percent of city land area as parkland• More acres of parkland per capita• More dog parks per capita• More swimming pools per capita• Higher level of state requirement for Physical
Education classes
ranking: total Score = 57.8; rank = 16
AuStin, tx(Austin-Round Rock, TX MSA)
CountieS Bastrop, Caldwell, Hays, Travis, Williamson

19
ACSM AMeriCAn FitneSS indextM CoMponentS
Health Behaviors Percent any physical activity or exercise in the last 30 days Percent physically active at least moderatelyPercent eating 5+ servings of fruits/vegetables per dayPercent currently smoking
Chronic Health ProblemsPercent obesePercent in excellent or very good healthAny days when physical health was not good during
the past 30 daysAny days when mental health was not good during
the past 30 daysPercent with asthmaPercent with angina or coronary heart diseasePercent with diabetesDeath rate/100,000 for cardiovascular diseaseDeath rate/100,000 for diabetes
Health Care
Percent with health insurance
76.2%51.0%23.4%17.9%
26.9%56.0%35.5%
33.7%
8.8%3.8%8.3%206.722.5
85.6%
77.2%48.7%24.4%17.0%
25.9%56.8%35.3%
34.4%
8.3%3.6%8.3%201.021.9
86.3%
Built EnvironmentParkland as percent of city land areaAcres of parkland/1,000Farmers’ markets/1,000,000Percent using public transportation to workPercent bicycling or walking to work
Recreational FacilitiesBall diamonds/10,000Dog parks/10,000Park playgrounds/10,000Golf courses/100,000Park units/10,000Recreation centers/20,000Swimming pools/100,000Tennis courts/10,000
Park-related expenditures per capita
Level of state requirement for Physical Education classes**
Number of primary health care providers per 100,000
2.5% – 25.3%2.3 – 94.11.0 – 41.0
0.4% – 30.5%1.2% – 6.7%
0.3 – 5.70.0 – 5.70.9 – 4.80.0 – 5.0
1.2 – 10.90.1 – 2.60.6 – 9.20.8 – 6.9
$12.0 – $259.0
0 – 3
46.8 – 133.7
(note: most of these data were available only for the main city in the MSA)
**3 = required at three levels: high school, middle school and elementary school; 2= required at two levels; 1= required at only one level
70.4% – 85.9%36.4% – 58.1%15.8% – 30.0%8.8% – 25.3%
18.1% – 34.3%46.4% – 66.6%29.5% – 40.3%
23.8% – 41.9%
4.5% – 11.9%2.4% – 5.6%5.4% – 11.6%131.7 – 268.6
9.9 – 31.4
77.3% – 94.4%
U.S. Value MSA Average MSA Range
MSA Average Range of all Cities
10.6%18.914.84.3%2.8%
2.00.92.31.04.21.13.12.1
$101.5
2.5
93.2
16.7%35.411.72.8%2.5%
0.81.62.00.73.10.64.51.4
$69
3
72.4
Community/environmental indicators – Score = 51.3; rank = 26
Austin
81.8%56.8%27.7%14.2%
26.6%59.0%34.6%
39.1%
7.3%4.3%5.8%166.116.8
83.4%
Austin MSA
personal health indicators – Score = 64.8; rank = 15
opportunitieS/ChALLenGeS
StrenGthS/AdvAntAGeS
20
Population
Percent less than 18 years old
Percent 18 to 64 years old
Percent 65 years old and older
Percent male
Percent high school graduate or higher
Percent White
Percent Black or African American
Percent Asian
Percent Other Race
Percent Hispanic/Latino
Percent unemployed
Median household income
Percent of households below poverty level
Violent crime rate/100,000*
Percent with disability
307,006,550
24.3%
62.8%
12.9%
49.3%
85.3%
74.8%
12.4%
4.5%
8.3%
15.8%
9.9%
$50,221
10.5%
429.4
12.0%
3,325,885
24.6%
63.6%
11.8%
49.2%
86.7%
72.3%
15.0%
5.1%
7.6%
15.1%
9.8%
$55,331
9.5%
11.0%
*Due to differences in jurisdictional definitions and reporting, the FBI recommends that these rates not be compared across areas
1,123,804 – 19,069,796
20.2% – 29.4%
60.5% – 66.9%
7.9% – 17.2%
48.1% – 51.1%
77.6% – 92.5%
49.8% – 88.6%
1.7% – 44.5%
1.2% – 30.2%
1.9% – 24.5%
1.2% – 53.4%
6.4% – 16.3%
$43,633 – $85,168
4.9% – 15.1%
7.4% – 14.5%
U.S. Value MSA Average MSA Range
2,690,886
23.1%
64.3%
12.5%
48.2%
88.1%
64.0%
28.4%
3.9%
3.7%
3.7%
7.9%
$65,392
6.8%
722.4
10.9%
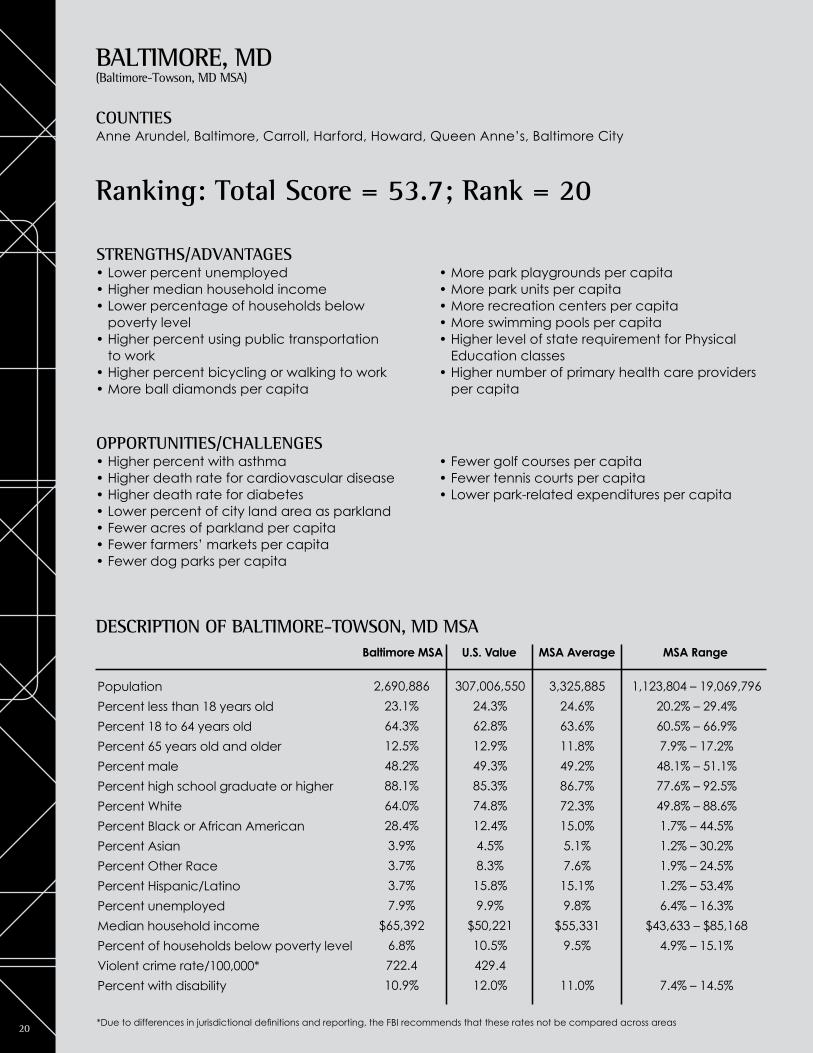
deSCription oF BALtiMore-toWSon, Md MSABaltimore MSA
• Higher percent with asthma• Higher death rate for cardiovascular disease• Higher death rate for diabetes• Lower percent of city land area as parkland• Fewer acres of parkland per capita• Fewer farmers’ markets per capita• Fewer dog parks per capita
• Fewer golf courses per capita• Fewer tennis courts per capita• Lower park-related expenditures per capita
• Lower percent unemployed• Higher median household income• Lower percentage of households below
poverty level• Higher percent using public transportation
to work• Higher percent bicycling or walking to work• More ball diamonds per capita
• More park playgrounds per capita• More park units per capita• More recreation centers per capita• More swimming pools per capita• Higher level of state requirement for Physical
Education classes• Higher number of primary health care providers
per capita
ranking: total Score = 53.7; rank = 20
BALtiMore, Md (Baltimore-Towson, MD MSA)
CountieS Anne Arundel, Baltimore, Carroll, Harford, Howard, Queen Anne’s, Baltimore City

21
ACSM AMeriCAn FitneSS indextM CoMponentS
Health Behaviors Percent any physical activity or exercise in the last 30 days Percent physically active at least moderatelyPercent eating 5+ servings of fruits/vegetables per dayPercent currently smoking
Chronic Health ProblemsPercent obesePercent in excellent or very good healthAny days when physical health was not good during
the past 30 daysAny days when mental health was not good during
the past 30 daysPercent with asthmaPercent with angina or coronary heart diseasePercent with diabetesDeath rate/100,000 for cardiovascular diseaseDeath rate/100,000 for diabetes
Health Care
Percent with health insurance
76.2%51.0%23.4%17.9%
26.9%56.0%35.5%
33.7%
8.8%3.8%8.3%206.722.5
85.6%
77.2%48.7%24.4%17.0%
25.9%56.8%35.3%
34.4%
8.3%3.6%8.3%201.021.9
86.3%
Built EnvironmentParkland as percent of city land areaAcres of parkland/1,000Farmers’ markets/1,000,000Percent using public transportation to workPercent bicycling or walking to work
Recreational FacilitiesBall diamonds/10,000Dog parks/10,000Park playgrounds/10,000Golf courses/100,000Park units/10,000Recreation centers/20,000Swimming pools/100,000Tennis courts/10,000
Park-related expenditures per capita
Level of state requirement for Physical Education classes**
Number of primary health care providers per 100,000
2.5% – 25.3%2.3 – 94.11.0 – 41.0
0.4% – 30.5%1.2% – 6.7%
0.3 – 5.70.0 – 5.70.9 – 4.80.0 – 5.0
1.2 – 10.90.1 – 2.60.6 – 9.20.8 – 6.9
$12.0 – $259.0
0 – 3
46.8 – 133.7
(note: most of these data were available only for the main city in the MSA)
**3 = required at three levels: high school, middle school and elementary school; 2= required at two levels; 1= required at only one level
70.4% – 85.9%36.4% – 58.1%15.8% – 30.0%8.8% – 25.3%
18.1% – 34.3%46.4% – 66.6%29.5% – 40.3%
23.8% – 41.9%
4.5% – 11.9%2.4% – 5.6%5.4% – 11.6%131.7 – 268.6
9.9 – 31.4
77.3% – 94.4%
U.S. Value MSA Average MSA Range
MSA Average Range of all Cities
10.6%18.914.84.3%2.8%
2.00.92.31.04.21.13.12.1
$101.5
2.5
93.2
Baltimore
personal health indicators – Score = 45.4; rank = 29 Baltimore MSA
Community/environmental indicators – Score = 61.3; rank = 11
75.5%48.8%26.7%17.1%
26.9%58.0%37.8%
35.2%
10.6%3.7%8.8%228.224.6
89.4%
9.5%7.75.2
6.2%3.2%
3.20.23.10.86.61.43.51.7
$68
3
125.3

StrenGthS/AdvAntAGeS
22
Population
Percent less than 18 years old
Percent 18 to 64 years old
Percent 65 years old and older
Percent male
Percent high school graduate or higher
Percent White
Percent Black or African American
Percent Asian
Percent Other Race
Percent Hispanic/Latino
Percent unemployed
Median household income
Percent of households below poverty level
Violent crime rate/100,000*
Percent with disability
307,006,550
24.3%
62.8%
12.9%
49.3%
85.3%
74.8%
12.4%
4.5%
8.3%
15.8%
9.9%
$50,221
10.5%
429.4
12.0%
3,325,885
24.6%
63.6%
11.8%
49.2%
86.7%
72.3%
15.0%
5.1%
7.6%
15.1%
9.8%
$55,331
9.5%
11.0%
*Due to differences in jurisdictional definitions and reporting, the FBI recommends that these rates not be compared across areas
1,123,804 – 19,069,796
20.2% – 29.4%
60.5% – 66.9%
7.9% – 17.2%
48.1% – 51.1%
77.6% – 92.5%
49.8% – 88.6%
1.7% – 44.5%
1.2% – 30.2%
1.9% – 24.5%
1.2% – 53.4%
6.4% – 16.3%
$43,633 – $85,168
4.9% – 15.1%
7.4% – 14.5%
U.S. Value MSA Average MSA Range
opportunitieS/ChALLenGeS
1,131,070
24.1%
62.9%
13.0%
48.3%
85.7%
68.1%
28.0%
1.2%
2.7%
3.7%
9.9%
$44,868
10.5%
534.6
14.5%
Birmingham MSA
deSCription oF BirMinGhAM-hoover, AL MSA
• Lower median household income• Higher percentage of households below
poverty level• Lower percent physically active at
least moderately• Lower percentage eating 5+ servings of
fruits/vegetables per day• Higher percent currently smoking• Higher percent obese• Lower percent in excellent or very good health• Higher percent with angina or coronary
heart disease
• Higher percent with diabetes• Higher death rate for cardiovascular disease• Lower percent of city land area as parkland• Fewer acres of parkland per capita• Lower percent using public transportation
to work• Lower percent bicycling or walking to work• Fewer ball diamonds per capita• Fewer dog parks per capita• Fewer golf courses per capita• Fewer tennis courts per capita• Lower park-related expenditures per capita
• More farmers’ markets per capita• More park playgrounds per capita• More park units per capita• More recreation centers per capita• More swimming pools per capita
• Higher level of state requirement for Physical Education classes
• Higher number of primary health care providers per capita
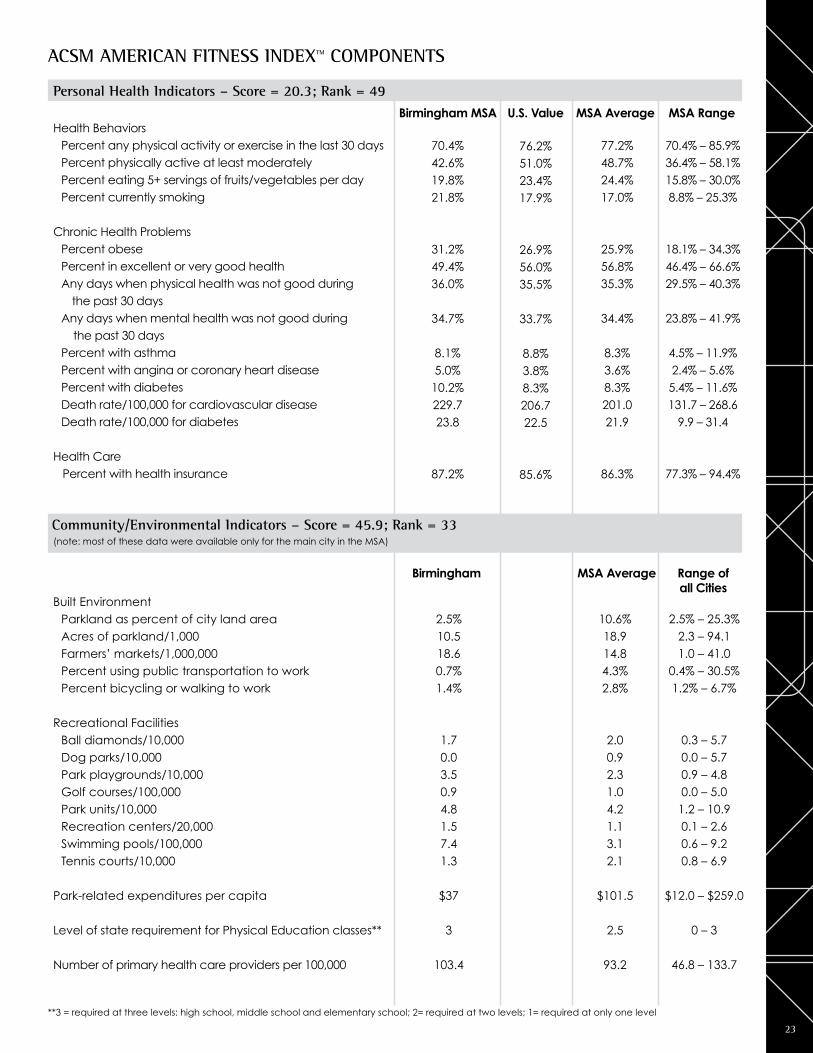
ranking: total Score = 33.6 rank = 47
BirMinGhAM, AL(Birmingham-Hoover, AL MSA)
CountieS Bibb, Blount, Chilton, Jefferson, St. Clair, Shelby, Walker
23
ACSM AMeriCAn FitneSS indextM CoMponentS
Built EnvironmentParkland as percent of city land areaAcres of parkland/1,000Farmers’ markets/1,000,000Percent using public transportation to workPercent bicycling or walking to work
Recreational FacilitiesBall diamonds/10,000Dog parks/10,000Park playgrounds/10,000Golf courses/100,000Park units/10,000Recreation centers/20,000Swimming pools/100,000Tennis courts/10,000
Park-related expenditures per capita
Level of state requirement for Physical Education classes**
Number of primary health care providers per 100,000
(note: most of these data were available only for the main city in the MSA)
**3 = required at three levels: high school, middle school and elementary school; 2= required at two levels; 1= required at only one level
10.6%18.914.84.3%2.8%
2.00.92.31.04.21.13.12.1
$101.5
2.5
93.2
2.5% – 25.3%2.3 – 94.11.0 – 41.0
0.4% – 30.5%1.2% – 6.7%
0.3 – 5.70.0 – 5.70.9 – 4.80.0 – 5.0
1.2 – 10.90.1 – 2.60.6 – 9.20.8 – 6.9
$12.0 – $259.0
0 – 3
46.8 – 133.7
Range of all Cities
MSA Average
U.S. Value MSA Average MSA Range
76.2%51.0%23.4%17.9%
26.9%56.0%35.5%
33.7%
8.8%3.8%8.3%206.722.5
85.6%
77.2%48.7%24.4%17.0%
25.9%56.8%35.3%
34.4%
8.3%3.6%8.3%201.021.9
86.3%
70.4% – 85.9%36.4% – 58.1%15.8% – 30.0%8.8% – 25.3%
18.1% – 34.3%46.4% – 66.6%29.5% – 40.3%
23.8% – 41.9%
4.5% – 11.9%2.4% – 5.6%5.4% – 11.6%131.7 – 268.6
9.9 – 31.4
77.3% – 94.4%
Health Behaviors Percent any physical activity or exercise in the last 30 days Percent physically active at least moderatelyPercent eating 5+ servings of fruits/vegetables per dayPercent currently smoking
Chronic Health ProblemsPercent obesePercent in excellent or very good healthAny days when physical health was not good during
the past 30 daysAny days when mental health was not good during
the past 30 daysPercent with asthmaPercent with angina or coronary heart diseasePercent with diabetesDeath rate/100,000 for cardiovascular diseaseDeath rate/100,000 for diabetes
Health Care
Percent with health insurance
Birmingham MSA
personal health indicators – Score = 20.3; rank = 49
Community/environmental indicators – Score = 45.9; rank = 33
70.4%42.6%19.8%21.8%
31.2%49.4%36.0%
34.7%
8.1%5.0%
10.2%229.723.8
87.2%
Birmingham
2.5%10.518.60.7%1.4%
1.70.03.50.94.81.57.41.3
$37
3
103.4

24
Population
Percent less than 18 years old
Percent 18 to 64 years old
Percent 65 years old and older
Percent male
Percent high school graduate or higher
Percent White
Percent Black or African American
Percent Asian
Percent Other Race
Percent Hispanic/Latino
Percent unemployed
Median household income
Percent of households below poverty level
Violent crime rate/100,000*
Percent with disability
307,006,550
24.3%
62.8%
12.9%
49.3%
85.3%
74.8%
12.4%
4.5%
8.3%
15.8%
9.9%
$50,221
10.5%
429.4
12.0%
3,325,885
24.6%
63.6%
11.8%
49.2%
86.7%
72.3%
15.0%
5.1%
7.6%
15.1%
9.8%
$55,331
9.5%
11.0%
*Due to differences in jurisdictional definitions and reporting, the FBI recommends that these rates not be compared across areas
1,123,804 – 19,069,796
20.2% – 29.4%
60.5% – 66.9%
7.9% – 17.2%
48.1% – 51.1%
77.6% – 92.5%
49.8% – 88.6%
1.7% – 44.5%
1.2% – 30.2%
1.9% – 24.5%
1.2% – 53.4%
6.4% – 16.3%
$43,633 – $85,168
4.9% – 15.1%
7.4% – 14.5%
U.S. Value MSA Average MSA Range
StrenGthS/AdvAntAGeS
opportunitieS/ChALLenGeS
deSCription oF BoSton-CAMBridGe-QuinCy, MA-nh MSABoston MSA
4,588,680
21.7%
65.5%
12.9%
48.7%
90.6%
80.7%
7.0%
6.0%
6.3%
8.3%
8.6%
$69,334
6.0%
400.2
10.2%
• Higher percent with asthma• Fewer acres of parkland per capita• Fewer dog parks per capita
• Fewer golf courses per capita• Fewer swimming pools per capita• Fewer tennis courts per capita
• Lower percent unemployed• Higher median household income• Lower percentage of households below
poverty level• Lower percent currently smoking• Lower percent obese• Lower death rate for cardiovascular disease• Lower death rate for diabetes• Higher percent of city land area as parkland• More farmers’ markets per capita• Higher percent using public transportation
to work
• Higher percent bicycling or walking to work• More ball diamonds per capita• More park playgrounds per capita• More park units per capita• More recreation centers per capita• Higher park related expenditures per capita• Higher level of state requirement for Physical
Education classes• Higher number of primary health care providers
per capita
ranking: total Score = 69.1; rank = 3
BoSton, MA(Boston-Cambridge-Quincy, MA-NH MSA)
CountieS Norfolk MA, Plymouth MA, Suffolk MA, Middlesex MA, Essex MA, Rockingham NH, Strafford NH

25
ACSM AMeriCAn FitneSS indextM CoMponentS
Health Behaviors Percent any physical activity or exercise in the last 30 days Percent physically active at least moderatelyPercent eating 5+ servings of fruits/vegetables per dayPercent currently smoking
Chronic Health ProblemsPercent obesePercent in excellent or very good healthAny days when physical health was not good during
the past 30 daysAny days when mental health was not good during
the past 30 daysPercent with asthmaPercent with angina or coronary heart diseasePercent with diabetesDeath rate/100,000 for cardiovascular diseaseDeath rate/100,000 for diabetes
Health Care
Percent with health insurance
76.2%51.0%23.4%17.9%
26.9%56.0%35.5%
33.7%
8.8%3.8%8.3%206.722.5
85.6%
77.2%48.7%24.4%17.0%
25.9%56.8%35.3%
34.4%
8.3%3.6%8.3%201.021.9
86.3%
Built EnvironmentParkland as percent of city land areaAcres of parkland/1,000Farmers’ markets/1,000,000Percent using public transportation to workPercent bicycling or walking to work
Recreational FacilitiesBall diamonds/10,000Dog parks/10,000Park playgrounds/10,000Golf courses/100,000Park units/10,000Recreation centers/20,000Swimming pools/100,000Tennis courts/10,000
Park-related expenditures per capita
Level of state requirement for Physical Education classes**
Number of primary health care providers per 100,000
2.5% – 25.3%2.3 – 94.11.0 – 41.0
0.4% – 30.5%1.2% – 6.7%
0.3 – 5.70.0 – 5.70.9 – 4.80.0 – 5.0
1.2 – 10.90.1 – 2.60.6 – 9.20.8 – 6.9
$12.0 – $259.0
0 – 3
46.8 – 133.7
(note: most of these data were available only for the main city in the MSA)
**3 = required at three levels: high school, middle school and elementary school; 2= required at two levels; 1= required at only one level
70.4% – 85.9%36.4% – 58.1%15.8% – 30.0%8.8% – 25.3%
18.1% – 34.3%46.4% – 66.6%29.5% – 40.3%
23.8% – 41.9%
4.5% – 11.9%2.4% – 5.6%5.4% – 11.6%131.7 – 268.6
9.9 – 31.4
77.3% – 94.4%
U.S. Value MSA Average MSA Range
MSA Average Range of all Cities
10.6%18.914.84.3%2.8%
2.00.92.31.04.21.13.12.1
$101.5
2.5
93.2
Boston
Boston MSA
personal health indicators – Score = 71.7; rank = 8
Community/environmental indicators – Score = 66.7; rank = 7
80.2%47.5%25.4%14.2%
21.1%62.0%35.0%
33.5%
10.8%3.5%7.6%171.816.5
94.4%
15.8%7.9
27.512.2%6.2%
2.40.53.60.35.91.31.91.6
$112
3
133.7

26
Population
Percent less than 18 years old
Percent 18 to 64 years old
Percent 65 years old and older
Percent male
Percent high school graduate or higher
Percent White
Percent Black or African American
Percent Asian
Percent Other Race
Percent Hispanic/Latino
Percent unemployed
Median household income
Percent of households below poverty level
Violent crime rate/100,000*
Percent with disability
307,006,550
24.3%
62.8%
12.9%
49.3%
85.3%
74.8%
12.4%
4.5%
8.3%
15.8%
9.9%
$50,221
10.5%
429.4
12.0%
3,325,885
24.6%
63.6%
11.8%
49.2%
86.7%
72.3%
15.0%
5.1%
7.6%
15.1%
9.8%
$55,331
9.5%
11.0%
*Due to differences in jurisdictional definitions and reporting, the FBI recommends that these rates not be compared across areas
1,123,804 – 19,069,796
20.2% – 29.4%
60.5% – 66.9%
7.9% – 17.2%
48.1% – 51.1%
77.6% – 92.5%
49.8% – 88.6%
1.7% – 44.5%
1.2% – 30.2%
1.9% – 24.5%
1.2% – 53.4%
6.4% – 16.3%
$43,633 – $85,168
4.9% – 15.1%
7.4% – 14.5%
U.S. Value MSA Average MSA Range
StrenGthS/AdvAntAGeS
opportunitieS/ChALLenGeS
1,123,804
21.5%
62.7%
15.8%
48.3%
88.8%
82.9%
12.1%
1.9%
3.1%
3.6%
9.4%
$45,811
10.9%
514.6
13.3%
deSCription oF BuFFALo-niAGArA FALLS, ny MSABuffalo MSA
• Lower median household income• Higher percentage of households below
poverty level• Higher percent with asthma• Higher percent with angina or coronary
heart disease• Higher death rate for cardiovascular disease• Lower percent of city land area as parkland
• Fewer acres of parkland per capita• Lower percent using public transportation
to work• Fewer dog parks per capita• Fewer recreation centers per capita• Fewer tennis courts per capita• Lower park-related expenditures per capita
• Higher percentage eating 5+ servings of fruits/vegetables per day
• More farmers’ markets per capita• Higher percent bicycling or walking to work• More ball diamonds per capita
• More golf course per capita• More park units per capita• More swimming pools per capita• Higher level of state requirement for Physical
Education classes
ranking: total Score = 50.2; rank = 23
BuFFALo, ny(Buffalo-Niagara Falls, NY MSA)
CountieS Erie, Niagara

27
ACSM AMeriCAn FitneSS indextM CoMponentS
Health Behaviors Percent any physical activity or exercise in the last 30 days Percent physically active at least moderatelyPercent eating 5+ servings of fruits/vegetables per dayPercent currently smoking
Chronic Health ProblemsPercent obesePercent in excellent or very good healthAny days when physical health was not good during
the past 30 daysAny days when mental health was not good during
the past 30 daysPercent with asthmaPercent with angina or coronary heart diseasePercent with diabetesDeath rate/100,000 for cardiovascular diseaseDeath rate/100,000 for diabetes
Health Care
Percent with health insurance
76.2%51.0%23.4%17.9%
26.9%56.0%35.5%
33.7%
8.8%3.8%8.3%206.722.5
85.6%
77.2%48.7%24.4%17.0%
25.9%56.8%35.3%
34.4%
8.3%3.6%8.3%201.021.9
86.3%
Built EnvironmentParkland as percent of city land areaAcres of parkland/1,000Farmers’ markets/1,000,000Percent using public transportation to workPercent bicycling or walking to work
Recreational FacilitiesBall diamonds/10,000Dog parks/10,000Park playgrounds/10,000Golf courses/100,000Park units/10,000Recreation centers/20,000Swimming pools/100,000Tennis courts/10,000
Park-related expenditures per capita
Level of state requirement for Physical Education classes**
Number of primary health care providers per 100,000
2.5% – 25.3%2.3 – 94.11.0 – 41.0
0.4% – 30.5%1.2% – 6.7%
0.3 – 5.70.0 – 5.70.9 – 4.80.0 – 5.0
1.2 – 10.90.1 – 2.60.6 – 9.20.8 – 6.9
$12.0 – $259.0
0 – 3
46.8 – 133.7
(note: most of these data were available only for the main city in the MSA)
**3 = required at three levels: high school, middle school and elementary school; 2= required at two levels; 1= required at only one level
70.4% – 85.9%36.4% – 58.1%15.8% – 30.0%8.8% – 25.3%
18.1% – 34.3%46.4% – 66.6%29.5% – 40.3%
23.8% – 41.9%
4.5% – 11.9%2.4% – 5.6%5.4% – 11.6%131.7 – 268.6
9.9 – 31.4
77.3% – 94.4%
U.S. Value MSA Average MSA Range
MSA Average Range of all Cities
10.6%18.914.84.3%2.8%
2.00.92.31.04.21.13.12.1
$101.5
2.5
93.2
personal health indicators – Score = 44.8; rank = 30.5 Buffalo MSA
Community/environmental indicators – Score = 55.2; rank = 19
74.3%45.0%28.6%17.3%
26.2%57.7%37.0%
35.6%
9.4%4.2%8.1%234.220.4
91.1%
Buffalo
8.3%8.0
17.83.6%3.5%
3.00.42.31.57.80.53.71.6
$12
3
99.6

28
Population
Percent less than 18 years old
Percent 18 to 64 years old
Percent 65 years old and older
Percent male
Percent high school graduate or higher
Percent White
Percent Black or African American
Percent Asian
Percent Other Race
Percent Hispanic/Latino
Percent unemployed
Median household income
Percent of households below poverty level
Violent crime rate/100,000*
Percent with disability
307,006,550
24.3%
62.8%
12.9%
49.3%
85.3%
74.8%
12.4%
4.5%
8.3%
15.8%
9.9%
$50,221
10.5%
429.4
12.0%
3,325,885
24.6%
63.6%
11.8%
49.2%
86.7%
72.3%
15.0%
5.1%
7.6%
15.1%
9.8%
$55,331
9.5%
11.0%
*Due to differences in jurisdictional definitions and reporting, the FBI recommends that these rates not be compared across areas
1,123,804 – 19,069,796
20.2% – 29.4%
60.5% – 66.9%
7.9% – 17.2%
48.1% – 51.1%
77.6% – 92.5%
49.8% – 88.6%
1.7% – 44.5%
1.2% – 30.2%
1.9% – 24.5%
1.2% – 53.4%
6.4% – 16.3%
$43,633 – $85,168
4.9% – 15.1%
7.4% – 14.5%
U.S. Value MSA Average MSA Range
1,745,524
26.3%
63.8%
9.9%
49.0%
86.7%
68.8%
22.7%
2.8%
5.6%
9.2%
11.1%
$51,267
10.2%
528.2
9.6%
Charlotte MSA
deSCription oF ChArLotte-GAStoniA-ConCord, nC-SC MSA
• Higher percent unemployed• Lower percentage eating 5+ servings of
fruits/vegetables per day • Higher percent currently smoking• Lower percent of city land area as parkland• Fewer farmers’ markets per capita• Lower percent using public transportation
to work• Lower percent bicycling or walking to work• Fewer ball diamonds per capita• Fewer dog parks per capita
• Fewer park playgrounds per capita• Fewer golf courses per capita• Fewer park units per capita• Fewer recreation centers per capita• Fewer swimming pools per capita• Fewer tennis courts per capita• Lower park-related expenditures per capita• Lower number of primary health care providers
per capita
opportunitieS/ChALLenGeS
StrenGthS/AdvAntAGeS• Lower percent of days when physical health
was not good during the past 30 days• Lower percent with asthma
• More acres of parkland per capita• Higher level of state requirement for Physical
Education classes
ranking: total Score = 42.3; rank = 36
ChArLotte, nC(Charlotte-Gastonia-Concord, NC-SC MSA)
CountieS Anson NC, Cabarrus NC, Gaston NC, Mecklenburg NC, Union NC, York SC

29
ACSM AMeriCAn FitneSS indextM CoMponentS
76.2%51.0%23.4%17.9%
26.9%56.0%35.5%
33.7%
8.8%3.8%8.3%206.722.5
85.6%
77.2%48.7%24.4%17.0%
25.9%56.8%35.3%
34.4%
8.3%3.6%8.3%201.021.9
86.3%
Built EnvironmentParkland as percent of city land areaAcres of parkland/1,000Farmers’ markets/1,000,000Percent using public transportation to workPercent bicycling or walking to work
Recreational FacilitiesBall diamonds/10,000Dog parks/10,000Park playgrounds/10,000Golf courses/100,000Park units/10,000Recreation centers/20,000Swimming pools/100,000Tennis courts/10,000
Park-related expenditures per capita
Level of state requirement for Physical Education classes**
Number of primary health care providers per 100,000
2.5% – 25.3%2.3 – 94.11.0 – 41.0
0.4% – 30.5%1.2% – 6.7%
0.3 – 5.70.0 – 5.70.9 – 4.80.0 – 5.0
1.2 – 10.90.1 – 2.60.6 – 9.20.8 – 6.9
$12.0 – $259.0
0 – 3
46.8 – 133.7
(note: most of these data were available only for the main city in the MSA)
**3 = required at three levels: high school, middle school and elementary school; 2= required at two levels; 1= required at only one level
70.4% – 85.9%36.4% – 58.1%15.8% – 30.0%8.8% – 25.3%
18.1% – 34.3%46.4% – 66.6%29.5% – 40.3%
23.8% – 41.9%
4.5% – 11.9%2.4% – 5.6%5.4% – 11.6%131.7 – 268.6
9.9 – 31.4
77.3% – 94.4%
U.S. Value MSA Average MSA Range
MSA Average Range of all Cities
10.6%18.914.84.3%2.8%
2.00.92.31.04.21.13.12.1
$101.5
2.5
93.2
Health Behaviors Percent any physical activity or exercise in the last 30 days Percent physically active at least moderatelyPercent eating 5+ servings of fruits/vegetables per dayPercent currently smoking
Chronic Health ProblemsPercent obesePercent in excellent or very good healthAny days when physical health was not good during
the past 30 daysAny days when mental health was not good during
the past 30 daysPercent with asthmaPercent with angina or coronary heart diseasePercent with diabetesDeath rate/100,000 for cardiovascular diseaseDeath rate/100,000 for diabetes
Health Care
Percent with health insurance
5.7%21.812.01.9%1.7%
0.80.61.30.62.60.70.61.5
$75
3
81.2
Charlotte
Community/environmental indicators – Score = 35.9; rank = 42
77.8%48.2%20.7%18.9%
26.3%53.6%30.2%
33.5%
7.1%3.5%7.9%188.920.5
85.0%
Charlotte MSA
personal health indicators – Score = 49.3; rank = 24

30
Population
Percent less than 18 years old
Percent 18 to 64 years old
Percent 65 years old and older
Percent male
Percent high school graduate or higher
Percent White
Percent Black or African American
Percent Asian
Percent Other Race
Percent Hispanic/Latino
Percent unemployed
Median household income
Percent of households below poverty level
Violent crime rate/100,000*
Percent with disability
307,006,550
24.3%
62.8%
12.9%
49.3%
85.3%
74.8%
12.4%
4.5%
8.3%
15.8%
9.9%
$50,221
10.5%
429.4
12.0%
3,325,885
24.6%
63.6%
11.8%
49.2%
86.7%
72.3%
15.0%
5.1%
7.6%
15.1%
9.8%
$55,331
9.5%
11.0%
1,123,804 – 19,069,796
20.2% – 29.4%
60.5% – 66.9%
7.9% – 17.2%
48.1% – 51.1%
77.6% – 92.5%
49.8% – 88.6%
1.7% – 44.5%
1.2% – 30.2%
1.9% – 24.5%
1.2% – 53.4%
6.4% – 16.3%
$43,633 – $85,168
4.9% – 15.1%
7.4% – 14.5%
U.S. Value MSA Average MSA Range
*Due to differences in jurisdictional definitions and reporting, the FBI recommends that these rates not be compared across areas
‡This measure was not available.
9,580,567
25.4%
63.4%
11.2%
49.2%
85.9%
66.2%
17.6%
5.4%
10.8%
19.9%
11.3%
$58,729
9.6%
N/A‡
9.3%
Chicago MSA
deSCription oF ChiCAGo-nAperviLLe-joLiet, iL-in-Wi MSA
• Higher percent unemployed• Higher percent of days when physical health
was not good during the past 30 days• Higher percent of days when mental health
was not good during the past 30 days• Higher percent with asthma
• Lower percent of city land area as parkland• Fewer acres of parkland per capita• Fewer dog parks per capita• Fewer park playgrounds per capita• Fewer golf courses per capita• Fewer park units per capita
opportunitieS/ChALLenGeS
StrenGthS/AdvAntAGeS• Lower percent with angina or coronary
heart disease• More farmers’ markets per capita• Higher percent using public transportation
to work• Higher percent bicycling or walking to work
• More recreation centers per capita• Higher park-related expenditures per capita• Higher level of state requirement for Physical
Education classes• Higher number of primary health care providers
per capita
ranking: total Score = 48.9; rank = 28
ChiCAGo, iL(Chicago-Naperville-Joliet, IL-IN-WI MSA)
CountieS Cook IL, DeKalb IL, DuPage IL, Grundy IL, Kane IL, Kendall IL, Lake IL, McHenry IL, Will IL, Jasper IN, Lake IN, Newton IN, Porter IN, Kenosha WI

31
ACSM AMeriCAn FitneSS indextM CoMponentS
Health Behaviors Percent any physical activity or exercise in the last 30 days Percent physically active at least moderatelyPercent eating 5+ servings of fruits/vegetables per dayPercent currently smoking
Chronic Health ProblemsPercent obesePercent in excellent or very good healthAny days when physical health was not good during
the past 30 daysAny days when mental health was not good during
the past 30 daysPercent with asthmaPercent with angina or coronary heart diseasePercent with diabetesDeath rate/100,000 for cardiovascular diseaseDeath rate/100,000 for diabetes
Health Care
Percent with health insurance
77.2%48.7%24.4%17.0%
25.9%56.8%35.3%
34.4%
8.3%3.6%8.3%201.021.9
86.3%
Built EnvironmentParkland as percent of city land areaAcres of parkland/1,000Farmers’ markets/1,000,000Percent using public transportation to workPercent bicycling or walking to work
Recreational FacilitiesBall diamonds/10,000Dog parks/10,000Park playgrounds/10,000Golf courses/100,000Park units/10,000Recreation centers/20,000Swimming pools/100,000Tennis courts/10,000
Park-related expenditures per capita
Level of state requirement for Physical Education classes**
Number of primary health care providers per 100,000
2.5% – 25.3%2.3 – 94.11.0 – 41.0
0.4% – 30.5%1.2% – 6.7%
0.3 – 5.70.0 – 5.70.9 – 4.80.0 – 5.0
1.2 – 10.90.1 – 2.60.6 – 9.20.8 – 6.9
$12.0 – $259.0
0 – 3
46.8 – 133.7
(note: most of these data were available only for the main city in the MSA)
**3 = required at three levels: high school, middle school and elementary school; 2= required at two levels; 1= required at only one level
70.4% – 85.9%36.4% – 58.1%15.8% – 30.0%8.8% – 25.3%
18.1% – 34.3%46.4% – 66.6%29.5% – 40.3%
23.8% – 41.9%
4.5% – 11.9%2.4% – 5.6%5.4% – 11.6%131.7 – 268.6
9.9 – 31.4
77.3% – 94.4%
U.S. Value MSA Average MSA Range
MSA Average Range of all Cities
10.6%18.914.84.3%2.8%
2.00.92.31.04.21.13.12.1
$101.5
2.5
93.2
76.2%51.0%23.4%17.9%
26.9%56.0%35.5%
33.7%
8.8%3.8%8.3%206.722.5
85.6%
personal health indicators – Score = 42.8; rank = 34 Chicago MSA
Community/environmental indicators – Score = 54.5; rank = 21
77.0%47.9%22.5%16.3%
26.7%55.6%40.3%
38.7%
9.2%3.1%7.7%208.222.1
85.1%
Chicago
8.2%4.2
17.711.5%3.7%
1.90.41.80.42.01.83.02.2
$124
3
106.1
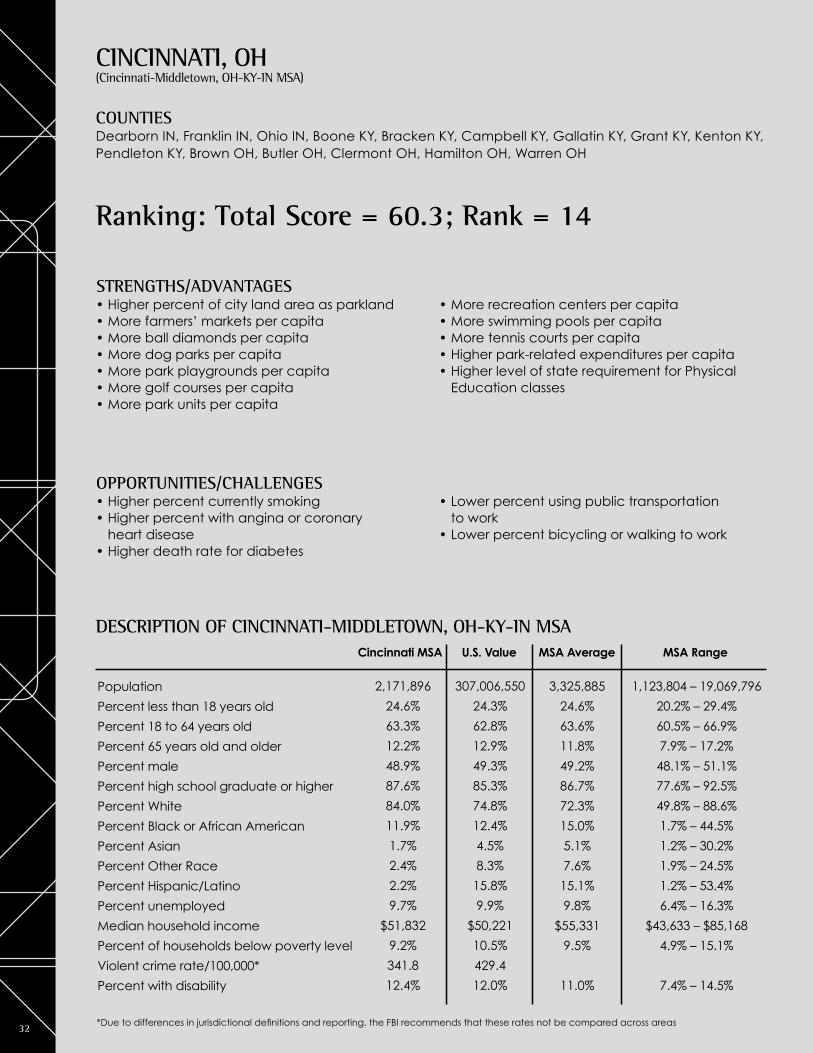
32
Population
Percent less than 18 years old
Percent 18 to 64 years old
Percent 65 years old and older
Percent male
Percent high school graduate or higher
Percent White
Percent Black or African American
Percent Asian
Percent Other Race
Percent Hispanic/Latino
Percent unemployed
Median household income
Percent of households below poverty level
Violent crime rate/100,000*
Percent with disability
307,006,550
24.3%
62.8%
12.9%
49.3%
85.3%
74.8%
12.4%
4.5%
8.3%
15.8%
9.9%
$50,221
10.5%
429.4
12.0%
3,325,885
24.6%
63.6%
11.8%
49.2%
86.7%
72.3%
15.0%
5.1%
7.6%
15.1%
9.8%
$55,331
9.5%
11.0%
*Due to differences in jurisdictional definitions and reporting, the FBI recommends that these rates not be compared across areas
1,123,804 – 19,069,796
20.2% – 29.4%
60.5% – 66.9%
7.9% – 17.2%
48.1% – 51.1%
77.6% – 92.5%
49.8% – 88.6%
1.7% – 44.5%
1.2% – 30.2%
1.9% – 24.5%
1.2% – 53.4%
6.4% – 16.3%
$43,633 – $85,168
4.9% – 15.1%
7.4% – 14.5%
U.S. Value MSA Average MSA Range
2,171,896
24.6%
63.3%
12.2%
48.9%
87.6%
84.0%
11.9%
1.7%
2.4%
2.2%
9.7%
$51,832
9.2%
341.8
12.4%
Cincinnati MSA
deSCription oF CinCinnAti-MiddLetoWn, oh-Ky-in MSA
• Higher percent currently smoking• Higher percent with angina or coronary
heart disease• Higher death rate for diabetes
• Lower percent using public transportation to work
• Lower percent bicycling or walking to work
opportunitieS/ChALLenGeS
• Higher percent of city land area as parkland• More farmers’ markets per capita• More ball diamonds per capita• More dog parks per capita• More park playgrounds per capita• More golf courses per capita• More park units per capita
• More recreation centers per capita• More swimming pools per capita• More tennis courts per capita• Higher park-related expenditures per capita• Higher level of state requirement for Physical
Education classes
StrenGthS/AdvAntAGeS
ranking: total Score = 60.3; rank = 14
CinCinnAti, oh(Cincinnati-Middletown, OH-KY-IN MSA)
CountieS Dearborn IN, Franklin IN, Ohio IN, Boone KY, Bracken KY, Campbell KY, Gallatin KY, Grant KY, Kenton KY, Pendleton KY, Brown OH, Butler OH, Clermont OH, Hamilton OH, Warren OH
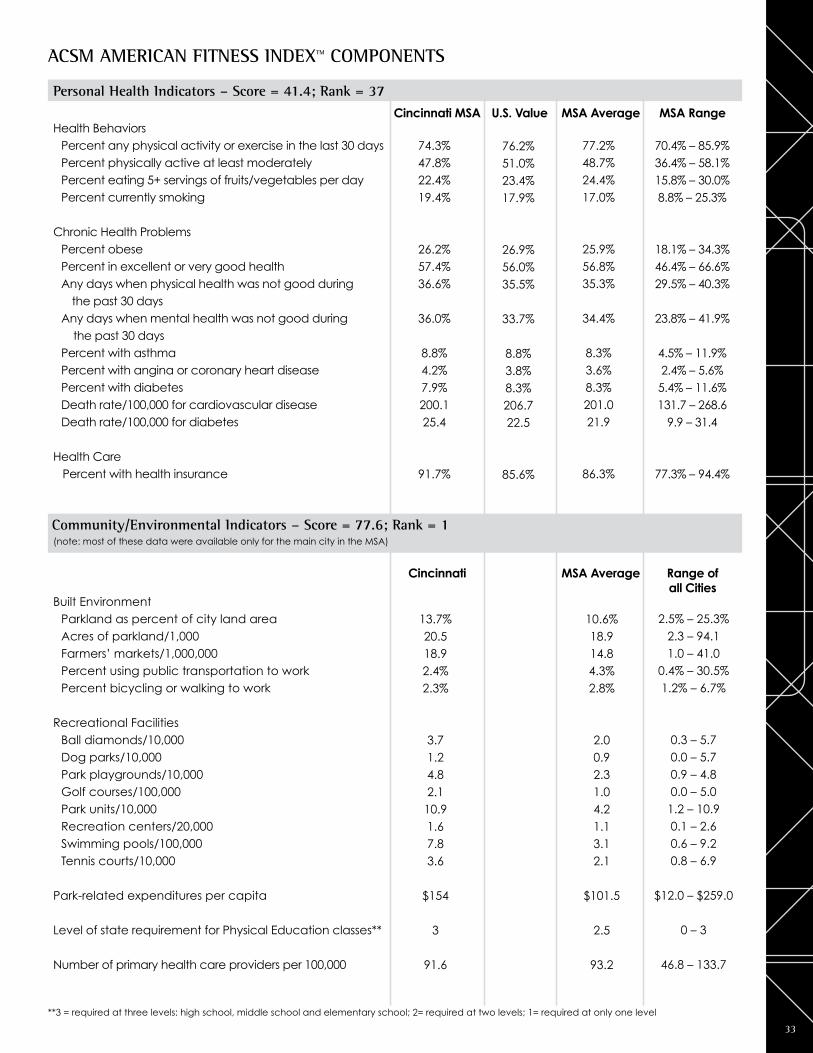
33
ACSM AMeriCAn FitneSS indextM CoMponentS
Health Behaviors Percent any physical activity or exercise in the last 30 days Percent physically active at least moderatelyPercent eating 5+ servings of fruits/vegetables per dayPercent currently smoking
Chronic Health ProblemsPercent obesePercent in excellent or very good healthAny days when physical health was not good during
the past 30 daysAny days when mental health was not good during
the past 30 daysPercent with asthmaPercent with angina or coronary heart diseasePercent with diabetesDeath rate/100,000 for cardiovascular diseaseDeath rate/100,000 for diabetes
Health Care
Percent with health insurance
77.2%48.7%24.4%17.0%
25.9%56.8%35.3%
34.4%
8.3%3.6%8.3%201.021.9
86.3%
Built EnvironmentParkland as percent of city land areaAcres of parkland/1,000Farmers’ markets/1,000,000Percent using public transportation to workPercent bicycling or walking to work
Recreational FacilitiesBall diamonds/10,000Dog parks/10,000Park playgrounds/10,000Golf courses/100,000Park units/10,000Recreation centers/20,000Swimming pools/100,000Tennis courts/10,000
Park-related expenditures per capita
Level of state requirement for Physical Education classes**
Number of primary health care providers per 100,000
2.5% – 25.3%2.3 – 94.11.0 – 41.0
0.4% – 30.5%1.2% – 6.7%
0.3 – 5.70.0 – 5.70.9 – 4.80.0 – 5.0
1.2 – 10.90.1 – 2.60.6 – 9.20.8 – 6.9
$12.0 – $259.0
0 – 3
46.8 – 133.7
(note: most of these data were available only for the main city in the MSA)
**3 = required at three levels: high school, middle school and elementary school; 2= required at two levels; 1= required at only one level
70.4% – 85.9%36.4% – 58.1%15.8% – 30.0%8.8% – 25.3%
18.1% – 34.3%46.4% – 66.6%29.5% – 40.3%
23.8% – 41.9%
4.5% – 11.9%2.4% – 5.6%5.4% – 11.6%131.7 – 268.6
9.9 – 31.4
77.3% – 94.4%
MSA Average MSA Range
MSA Average Range of all Cities
10.6%18.914.84.3%2.8%
2.00.92.31.04.21.13.12.1
$101.5
2.5
93.2
76.2%51.0%23.4%17.9%
26.9%56.0%35.5%
33.7%
8.8%3.8%8.3%206.722.5
85.6%
U.S. Value
personal health indicators – Score = 41.4; rank = 37 Cincinnati MSA
74.3%47.8%22.4%19.4%
26.2%57.4%36.6%
36.0%
8.8%4.2%7.9%200.125.4
91.7%
Community/environmental indicators – Score = 77.6; rank = 1
Cincinnati
13.7%20.518.92.4%2.3%
3.71.24.82.1
10.91.67.83.6
$154
3
91.6

34
Population
Percent less than 18 years old
Percent 18 to 64 years old
Percent 65 years old and older
Percent male
Percent high school graduate or higher
Percent White
Percent Black or African American
Percent Asian
Percent Other Race
Percent Hispanic/Latino
Percent unemployed
Median household income
Percent of households below poverty level
Violent crime rate/100,000*
Percent with disability
307,006,550
24.3%
62.8%
12.9%
49.3%
85.3%
74.8%
12.4%
4.5%
8.3%
15.8%
9.9%
$50,221
10.5%
429.4
12.0%
3,325,885
24.6%
63.6%
11.8%
49.2%
86.7%
72.3%
15.0%
5.1%
7.6%
15.1%
9.8%
$55,331
9.5%
11.0%
*Due to differences in jurisdictional definitions and reporting, the FBI recommends that these rates not be compared across areas
1,123,804 – 19,069,796
20.2% – 29.4%
60.5% – 66.9%
7.9% – 17.2%
48.1% – 51.1%
77.6% – 92.5%
49.8% – 88.6%
1.7% – 44.5%
1.2% – 30.2%
1.9% – 24.5%
1.2% – 53.4%
6.4% – 16.3%
$43,633 – $85,168
4.9% – 15.1%
7.4% – 14.5%
U.S. Value MSA Average MSA Range
2,091,286
23.3%
61.8%
14.9%
48.1%
87.7%
75.8%
19.6%
1.9%
2.7%
4.5%
12.0%
$45,395
11.1%
428.7
13.8%
deSCription oF CLeveLAnd-eLyriA-Mentor, oh MSACleveland MSA
• Higher percent unemployed• Lower median household income• Higher percentage of households below
poverty level• Higher percent obese• Higher percent with asthma• Higher percent with diabetes• Higher death rate for cardiovascular disease
• Lower percent of city land area as parkland• Fewer acres of parkland per capita• Lower percent using public transportation
to work• Lower percent bicycling or walking to work• Fewer dog parks per capita• Lower park-related expenditures per capita
opportunitieS/ChALLenGeS
StrenGthS/AdvAntAGeS• More farmers’ markets per capita• More ball diamonds per capita• More park playgrounds per capita• More golf courses per capita• More swimming pools per capita
• More tennis courts per capita• Higher level of state requirement for Physical
Education classes• Higher number of primary health care providers
per capita
ranking: total Score = 49.6; rank = 25
CLeveLAnd, oh(Cleveland-Elyria-Mentor, OH MSA)
CountieS Cuyahoga, Geauga, Lake, Lorain, Medina

35
ACSM AMeriCAn FitneSS indextM CoMponentS
Health Behaviors Percent any physical activity or exercise in the last 30 days Percent physically active at least moderatelyPercent eating 5+ servings of fruits/vegetables per dayPercent currently smoking
Chronic Health ProblemsPercent obesePercent in excellent or very good healthAny days when physical health was not good during
the past 30 daysAny days when mental health was not good during
the past 30 daysPercent with asthmaPercent with angina or coronary heart diseasePercent with diabetesDeath rate/100,000 for cardiovascular diseaseDeath rate/100,000 for diabetes
Health Care
Percent with health insurance
76.2%51.0%23.4%17.9%
26.9%56.0%35.5%
33.7%
8.8%3.8%8.3%206.722.5
85.6%
77.2%48.7%24.4%17.0%
25.9%56.8%35.3%
34.4%
8.3%3.6%8.3%201.021.9
86.3%
Built EnvironmentParkland as percent of city land areaAcres of parkland/1,000Farmers’ markets/1,000,000Percent using public transportation to workPercent bicycling or walking to work
Recreational FacilitiesBall diamonds/10,000Dog parks/10,000Park playgrounds/10,000Golf courses/100,000Park units/10,000Recreation centers/20,000Swimming pools/100,000Tennis courts/10,000
Park-related expenditures per capita
Level of state requirement for Physical Education classes**
Number of primary health care providers per 100,000
2.5% – 25.3%2.3 – 94.11.0 – 41.0
0.4% – 30.5%1.2% – 6.7%
0.3 – 5.70.0 – 5.70.9 – 4.80.0 – 5.0
1.2 – 10.90.1 – 2.60.6 – 9.20.8 – 6.9
$12.0 – $259.0
0 – 3
46.8 – 133.7
(note: most of these data were available only for the main city in the MSA)
**3 = required at three levels: high school, middle school and elementary school; 2= required at two levels; 1= required at only one level
70.4% – 85.9%36.4% – 58.1%15.8% – 30.0%8.8% – 25.3%
18.1% – 34.3%46.4% – 66.6%29.5% – 40.3%
23.8% – 41.9%
4.5% – 11.9%2.4% – 5.6%5.4% – 11.6%131.7 – 268.6
9.9 – 31.4
77.3% – 94.4%
U.S. Value MSA Average MSA Range
MSA Average Range of all Cities
10.6%18.914.84.3%2.8%
2.00.92.31.04.21.13.12.1
$101.5
2.5
93.2
Cleveland MSA
personal health indicators – Score = 39.8; rank = 39
76.6%51.2%22.5%16.5%
29.0%58.5%36.2%
36.2%
11.9%3.8%
10.5%234.123.5
90.4%
Community/environmental indicators – Score = 58.6; rank = 15
Cleveland
6.3%7.2
19.63.8%2.5%
3.20.22.71.23.81.09.22.6
$75
3
118.8

36
Population
Percent less than 18 years old
Percent 18 to 64 years old
Percent 65 years old and older
Percent male
Percent high school graduate or higher
Percent White
Percent Black or African American
Percent Asian
Percent Other Race
Percent Hispanic/Latino
Percent unemployed
Median household income
Percent of households below poverty level
Violent crime rate/100,000*
Percent with disability
307,006,550
24.3%
62.8%
12.9%
49.3%
85.3%
74.8%
12.4%
4.5%
8.3%
15.8%
9.9%
$50,221
10.5%
429.4
12.0%
3,325,885
24.6%
63.6%
11.8%
49.2%
86.7%
72.3%
15.0%
5.1%
7.6%
15.1%
9.8%
$55,331
9.5%
11.0%
*Due to differences in jurisdictional definitions and reporting, the FBI recommends that these rates not be compared across areas
1,123,804 – 19,069,796
20.2% – 29.4%
60.5% – 66.9%
7.9% – 17.2%
48.1% – 51.1%
77.6% – 92.5%
49.8% – 88.6%
1.7% – 44.5%
1.2% – 30.2%
1.9% – 24.5%
1.2% – 53.4%
6.4% – 16.3%
$43,633 – $85,168
4.9% – 15.1%
7.4% – 14.5%
U.S. Value MSA Average MSA Range
1,801,848
24.6%
64.9%
10.6%
49.3%
89.8%
79.9%
13.8%
3.0%
3.2%
3.3%
8.6%
$50,773
11.3%
370.4
11.1%
Columbus MSA
deSCription oF CoLuMBuS, oh MSA
opportunitieS/ChALLenGeS• Higher percentage of households below
poverty level• Higher percent currently smoking• Higher percent obese• Higher percent with diabetes• Higher death rate for diabetes• Lower percent of city land area as parkland• Fewer acres of parkland per capita• Lower percent using public transportation
to work
• Fewer ball diamonds per capita• Fewer dog parks per capita• Fewer park playgrounds per capita• Fewer golf courses per capita• Fewer recreation centers per capita• Fewer swimming pools per capita• Lower park-related expenditures per capita
StrenGthS/AdvAntAGeS• Lower percent unemployed• Lower percent with asthma• Lower percent with angina or coronary
heart disease
• More farmers’ markets per capita• More park units per capita• Higher level of state requirement for Physical
Education classes
ranking: total Score = 42.2; rank = 38
CoLuMBuS, oh(Columbus, OH MSA)
CountieS Delaware, Fairfield, Franklin, Licking, Madison, Morrow, Pickaway, Union

37
ACSM AMeriCAn FitneSS indextM CoMponentS
Health Behaviors Percent any physical activity or exercise in the last 30 days Percent physically active at least moderatelyPercent eating 5+ servings of fruits/vegetables per dayPercent currently smoking
Chronic Health ProblemsPercent obesePercent in excellent or very good healthAny days when physical health was not good during
the past 30 daysAny days when mental health was not good during
the past 30 daysPercent with asthmaPercent with angina or coronary heart diseasePercent with diabetesDeath rate/100,000 for cardiovascular diseaseDeath rate/100,000 for diabetes
Health Care
Percent with health insurance
77.2%48.7%24.4%17.0%
25.9%56.8%35.3%
34.4%
8.3%3.6%8.3%201.021.9
86.3%
Built EnvironmentParkland as percent of city land areaAcres of parkland/1,000Farmers’ markets/1,000,000Percent using public transportation to workPercent bicycling or walking to work
Recreational FacilitiesBall diamonds/10,000Dog parks/10,000Park playgrounds/10,000Golf courses/100,000Park units/10,000Recreation centers/20,000Swimming pools/100,000Tennis courts/10,000
Park-related expenditures per capita
Level of state requirement for Physical Education classes**
Number of primary health care providers per 100,000
2.5% – 25.3%2.3 – 94.11.0 – 41.0
0.4% – 30.5%1.2% – 6.7%
0.3 – 5.70.0 – 5.70.9 – 4.80.0 – 5.0
1.2 – 10.90.1 – 2.60.6 – 9.20.8 – 6.9
$12.0 – $259.0
0 – 3
46.8 – 133.7
(note: most of these data were available only for the main city in the MSA)
**3 = required at three levels: high school, middle school and elementary school; 2= required at two levels; 1= required at only one level
70.4% – 85.9%36.4% – 58.1%15.8% – 30.0%8.8% – 25.3%
18.1% – 34.3%46.4% – 66.6%29.5% – 40.3%
23.8% – 41.9%
4.5% – 11.9%2.4% – 5.6%5.4% – 11.6%131.7 – 268.6
9.9 – 31.4
77.3% – 94.4%
MSA Average MSA Range
MSA Average Range of all Cities
10.6%18.914.84.3%2.8%
2.00.92.31.04.21.13.12.1
$101.5
2.5
93.2
U.S. Value
76.2%51.0%23.4%17.9%
26.9%56.0%35.5%
33.7%
8.8%3.8%8.3%206.722.5
85.6%
personal health indicators – Score = 37.6; rank = 40Columbus MSA
75.6%48.1%23.1%20.1%
28.9%55.4%36.4%
37.1%
6.8%3.2%
10.5%206.625.6
87.9%
Community/environmental indicators – Score = 46.5; rank = 31
Columbus
8.3%14.820.51.4%2.6%
1.20.31.90.95.20.71.31.9
$65
3
102.5

38
Population
Percent less than 18 years old
Percent 18 to 64 years old
Percent 65 years old and older
Percent male
Percent high school graduate or higher
Percent White
Percent Black or African American
Percent Asian
Percent Other Race
Percent Hispanic/Latino
Percent unemployed
Median household income
Percent of households below poverty level
Violent crime rate/100,000*
Percent with disability
307,006,550
24.3%
62.8%
12.9%
49.3%
85.3%
74.8%
12.4%
4.5%
8.3%
15.8%
9.9%
$50,221
10.5%
429.4
12.0%
3,325,885
24.6%
63.6%
11.8%
49.2%
86.7%
72.3%
15.0%
5.1%
7.6%
15.1%
9.8%
$55,331
9.5%
11.0%
*Due to differences in jurisdictional definitions and reporting, the FBI recommends that these rates not be compared across areas
1,123,804 – 19,069,796
20.2% – 29.4%
60.5% – 66.9%
7.9% – 17.2%
48.1% – 51.1%
77.6% – 92.5%
49.8% – 88.6%
1.7% – 44.5%
1.2% – 30.2%
1.9% – 24.5%
1.2% – 53.4%
6.4% – 16.3%
$43,633 – $85,168
4.9% – 15.1%
7.4% – 14.5%
U.S. Value MSA Average MSA Range
6,447,615
28.0%
63.4%
8.6%
50.3%
81.9%
68.3%
14.0%
4.9%
12.8%
28.0%
8.8%
$54,539
10.9%
410.8
9.2%
Dallas MSA
deSCription oF dALLAS-Fort Worth-ArLinGton, tx MSA
• Higher percentage of households below poverty level
• Fewer farmers’ markets per capita• Lower percent using public transportation
to work• Lower percent bicycling or walking to work• Fewer ball diamonds per capita• Fewer dog parks per capita
• Fewer park playgrounds per capita• Fewer golf courses per capita• Fewer park units per capita• Fewer recreation centers per capita• Fewer swimming pools per capita• Lower number of primary health care providers
per capita
opportunitieS/ChALLenGeS
• Lower percent unemployed• Lower percent with asthma• Lower percent with angina or coronary
heart disease• Higher percent of city land area as parkland
• More acres of parkland per capita• Higher park-related expenditures per capita • Higher level of state requirement for Physical
Education classes
StrenGthS/AdvAntAGeS
ranking: total Score = 41.3; rank = 39
dALLAS, tx(ADallas-Fort Worth-Arlington, TX MSA)
CountieS Collin, Dallas, Delta, Denton, Ellis, Hunt, Kaufman, Rockwall, Johnson, Parker, Tarrant, Wise

39
ACSM AMeriCAn FitneSS indextM CoMponentS
Health Behaviors Percent any physical activity or exercise in the last 30 days Percent physically active at least moderatelyPercent eating 5+ servings of fruits/vegetables per dayPercent currently smoking
Chronic Health ProblemsPercent obesePercent in excellent or very good healthAny days when physical health was not good during
the past 30 daysAny days when mental health was not good during
the past 30 daysPercent with asthmaPercent with angina or coronary heart diseasePercent with diabetesDeath rate/100,000 for cardiovascular diseaseDeath rate/100,000 for diabetes
Health Care
Percent with health insurance
76.2%51.0%23.4%17.9%
26.9%56.0%35.5%
33.7%
8.8%3.8%8.3%206.722.5
85.6%
77.2%48.7%24.4%17.0%
25.9%56.8%35.3%
34.4%
8.3%3.6%8.3%201.021.9
86.3%
Built EnvironmentParkland as percent of city land areaAcres of parkland/1,000Farmers’ markets/1,000,000Percent using public transportation to workPercent bicycling or walking to work
Recreational FacilitiesBall diamonds/10,000Dog parks/10,000Park playgrounds/10,000Golf courses/100,000Park units/10,000Recreation centers/20,000Swimming pools/100,000Tennis courts/10,000
Park-related expenditures per capita
Level of state requirement for Physical Education classes**
Number of primary health care providers per 100,000
2.5% – 25.3%2.3 – 94.11.0 – 41.0
0.4% – 30.5%1.2% – 6.7%
0.3 – 5.70.0 – 5.70.9 – 4.80.0 – 5.0
1.2 – 10.90.1 – 2.60.6 – 9.20.8 – 6.9
$12.0 – $259.0
0 – 3
46.8 – 133.7
(note: most of these data were available only for the main city in the MSA)
**3 = required at three levels: high school, middle school and elementary school; 2= required at two levels; 1= required at only one level
70.4% – 85.9%36.4% – 58.1%15.8% – 30.0%8.8% – 25.3%
18.1% – 34.3%46.4% – 66.6%29.5% – 40.3%
23.8% – 41.9%
4.5% – 11.9%2.4% – 5.6%5.4% – 11.6%131.7 – 268.6
9.9 – 31.4
77.3% – 94.4%
U.S. Value MSA Average MSA Range
MSA Average Range of all Cities
10.6%18.914.84.3%2.8%
2.00.92.31.04.21.13.12.1
$101.5
2.5
93.2
13.4%23.03.1
1.5%1.5%
0.30.21.40.52.90.71.82.0
$113
3
68.4
Dallas
Community/environmental indicators – Score = 36.9; rank = 40
77.6%44.7%22.7%17.2%
24.6%54.6%35.2%
34.9%
5.9%2.7%8.8%204.421.5
78.5%
Dallas MSA
personal health indicators – Score = 46.1; rank = 27

40
Population
Percent less than 18 years old
Percent 18 to 64 years old
Percent 65 years old and older
Percent male
Percent high school graduate or higher
Percent White
Percent Black or African American
Percent Asian
Percent Other Race
Percent Hispanic/Latino
Percent unemployed
Median household income
Percent of households below poverty level
Violent crime rate/100,000*
Percent with disability
307,006,550
24.3%
62.8%
12.9%
49.3%
85.3%
74.8%
12.4%
4.5%
8.3%
15.8%
9.9%
$50,221
10.5%
429.4
12.0%
3,325,885
24.6%
63.6%
11.8%
49.2%
86.7%
72.3%
15.0%
5.1%
7.6%
15.1%
9.8%
$55,331
9.5%
11.0%
*Due to differences in jurisdictional definitions and reporting, the FBI recommends that these rates not be compared across areas
1,123,804 – 19,069,796
20.2% – 29.4%
60.5% – 66.9%
7.9% – 17.2%
48.1% – 51.1%
77.6% – 92.5%
49.8% – 88.6%
1.7% – 44.5%
1.2% – 30.2%
1.9% – 24.5%
1.2% – 53.4%
6.4% – 16.3%
$43,633 – $85,168
4.9% – 15.1%
7.4% – 14.5%
U.S. Value MSA Average MSA Range
2,552,195
25.1%
64.9%
10.0%
50.1%
88.8%
81.7%
5.5%
3.4%
9.4%
22.3%
8.7%
$59,007
8.7%
346.9
8.9%
Denver MSA
deSCription oF denver-AurorA, Co MSA
opportunitieS/ChALLenGeS• Lower percent of city land area as parkland• Fewer acres of parkland per capita• Lower level of state requirement for Physical
Education classes
StrenGthS/AdvAntAGeS• Lower percent unemployed• Higher percent physically active at
least moderately• Lower percent obese• Lower percent with angina or coronary
heart disease• Lower percent with diabetes • Lower death rate for cardiovascular disease
• Lower death rate for diabetes• More ball diamonds per capita• More dog parks per capita• More golf courses per capita• More park units per capita• More swimming pools per capita• More tennis courts per capita• Higher park-related expenditures per capita
ranking: total Score = 67.6; rank = 5
denver, Co(Denver-Aurora, CO MSA)
CountieS Adams, Arapahoe, Broomfield, Clear Creek, Denver, Douglas, Elbert, Gilpin, Jefferson, Park

41
ACSM AMeriCAn FitneSS indextM CoMponentS
Health Behaviors Percent any physical activity or exercise in the last 30 days Percent physically active at least moderatelyPercent eating 5+ servings of fruits/vegetables per dayPercent currently smoking
Chronic Health ProblemsPercent obesePercent in excellent or very good healthAny days when physical health was not good during
the past 30 daysAny days when mental health was not good during
the past 30 daysPercent with asthmaPercent with angina or coronary heart diseasePercent with diabetesDeath rate/100,000 for cardiovascular diseaseDeath rate/100,000 for diabetes
Health Care
Percent with health insurance
76.2%51.0%23.4%17.9%
26.9%56.0%35.5%
33.7%
8.8%3.8%8.3%206.722.5
85.6%
77.2%48.7%24.4%17.0%
25.9%56.8%35.3%
34.4%
8.3%3.6%8.3%201.021.9
86.3%
Built EnvironmentParkland as percent of city land areaAcres of parkland/1,000Farmers’ markets/1,000,000Percent using public transportation to workPercent bicycling or walking to work
Recreational FacilitiesBall diamonds/10,000Dog parks/10,000Park playgrounds/10,000Golf courses/100,000Park units/10,000Recreation centers/20,000Swimming pools/100,000Tennis courts/10,000
Park-related expenditures per capita
Level of state requirement for Physical Education classes**
Number of primary health care providers per 100,000
2.5% – 25.3%2.3 – 94.11.0 – 41.0
0.4% – 30.5%1.2% – 6.7%
0.3 – 5.70.0 – 5.70.9 – 4.80.0 – 5.0
1.2 – 10.90.1 – 2.60.6 – 9.20.8 – 6.9
$12.0 – $259.0
0 – 3
46.8 – 133.7
(note: most of these data were available only for the main city in the MSA)
**3 = required at three levels: high school, middle school and elementary school; 2= required at two levels; 1= required at only one level
70.4% – 85.9%36.4% – 58.1%15.8% – 30.0%8.8% – 25.3%
18.1% – 34.3%46.4% – 66.6%29.5% – 40.3%
23.8% – 41.9%
4.5% – 11.9%2.4% – 5.6%5.4% – 11.6%131.7 – 268.6
9.9 – 31.4
77.3% – 94.4%
U.S. Value MSA Average MSA Range
MSA Average Range of all Cities
10.6%18.914.84.3%2.8%
2.00.92.31.04.21.13.12.1
$101.5
2.5
93.2
personal health indicators – Score = 78.0; rank = 4 Denver MSA
Community/environmental indicators – Score = 58.0; rank = 16
83.3%55.8%24.3%16.4%
18.8%61.7%34.2%
35.0%
8.1%2.6%5.4%160.015.9
86.2%
Denver
6.0%9.9
15.34.6%2.9%
2.21.02.41.25.91.06.72.4
$119
0
94.5

42
Population
Percent less than 18 years old
Percent 18 to 64 years old
Percent 65 years old and older
Percent male
Percent high school graduate or higher
Percent White
Percent Black or African American
Percent Asian
Percent Other Race
Percent Hispanic/Latino
Percent unemployed
Median household income
Percent of households below poverty level
Violent crime rate/100,000*
Percent with disability
307,006,550
24.3%
62.8%
12.9%
49.3%
85.3%
74.8%
12.4%
4.5%
8.3%
15.8%
9.9%
$50,221
10.5%
429.4
12.0%
3,325,885
24.6%
63.6%
11.8%
49.2%
86.7%
72.3%
15.0%
5.1%
7.6%
15.1%
9.8%
$55,331
9.5%
11.0%
*Due to differences in jurisdictional definitions and reporting, the FBI recommends that these rates not be compared across areas
1,123,804 – 19,069,796
20.2% – 29.4%
60.5% – 66.9%
7.9% – 17.2%
48.1% – 51.1%
77.6% – 92.5%
49.8% – 88.6%
1.7% – 44.5%
1.2% – 30.2%
1.9% – 24.5%
1.2% – 53.4%
6.4% – 16.3%
$43,633 – $85,168
4.9% – 15.1%
7.4% – 14.5%
U.S. Value MSA Average MSA Range
detroit, Mi(Detroit-Warren-Livonia, MI MSA)
CountieS Wayne, Lapeer, Livingston, Macomb, Oakland, St. Clair
ranking: total Score = 33.8; rank = 46
StrenGthS/AdvAntAGeS• More ball diamonds per capita• More park playgrounds per capita• Higher number of primary health care providers
per capita
opportunitieS/ChALLenGeS• Higher percent unemployed• Lower median household income• Higher percentage of households below
poverty level • Higher percent with asthma• Higher death rate for cardiovascular disease• Higher death rate for diabetes• Lower percent of city land area as parkland• Fewer acres of parkland per capita• Lower percent using public transportation
to work
• Lower percent bicycling or walking to work• Fewer dog parks per capita• Fewer golf courses per capita• Fewer recreation centers per capita• Fewer swimming pools per capita• Fewer tennis courts per capita• Lower park-related expenditures per capita• Lower level of state requirement for Physical
Education classes
deSCription oF detroit-WArren-LivoniA, Mi MSADetroit MSA
4,403,437
24.2%
63.0%
12.8%
48.8%
86.9%
70.9%
22.8%
3.3%
3.0%
3.8%
16.3%
$48,535
12.0%
656.8
13.7%

43
ACSM AMeriCAn FitneSS indextM CoMponentS
Health Behaviors Percent any physical activity or exercise in the last 30 days Percent physically active at least moderatelyPercent eating 5+ servings of fruits/vegetables per dayPercent currently smoking
Chronic Health ProblemsPercent obesePercent in excellent or very good healthAny days when physical health was not good during
the past 30 daysAny days when mental health was not good during
the past 30 daysPercent with asthmaPercent with angina or coronary heart diseasePercent with diabetesDeath rate/100,000 for cardiovascular diseaseDeath rate/100,000 for diabetes
Health Care
Percent with health insurance
76.2%51.0%23.4%17.9%
26.9%56.0%35.5%
33.7%
8.8%3.8%8.3%206.722.5
85.6%
77.2%48.7%24.4%17.0%
25.9%56.8%35.3%
34.4%
8.3%3.6%8.3%201.021.9
86.3%
Built EnvironmentParkland as percent of city land areaAcres of parkland/1,000Farmers’ markets/1,000,000Percent using public transportation to workPercent bicycling or walking to work
Recreational FacilitiesBall diamonds/10,000Dog parks/10,000Park playgrounds/10,000Golf courses/100,000Park units/10,000Recreation centers/20,000Swimming pools/100,000Tennis courts/10,000
Park-related expenditures per capita
Level of state requirement for Physical Education classes**
Number of primary health care providers per 100,000
2.5% – 25.3%2.3 – 94.11.0 – 41.0
0.4% – 30.5%1.2% – 6.7%
0.3 – 5.70.0 – 5.70.9 – 4.80.0 – 5.0
1.2 – 10.90.1 – 2.60.6 – 9.20.8 – 6.9
$12.0 – $259.0
0 – 3
46.8 – 133.7
(note: most of these data were available only for the main city in the MSA)
**3 = required at three levels: high school, middle school and elementary school; 2= required at two levels; 1= required at only one level
70.4% – 85.9%36.4% – 58.1%15.8% – 30.0%8.8% – 25.3%
18.1% – 34.3%46.4% – 66.6%29.5% – 40.3%
23.8% – 41.9%
4.5% – 11.9%2.4% – 5.6%5.4% – 11.6%131.7 – 268.6
9.9 – 31.4
77.3% – 94.4%
U.S. Value MSA Average MSA Range
MSA Average Range of all Cities
10.6%18.914.84.3%2.8%
2.00.92.31.04.21.13.12.1
$101.5
2.5
93.2
6.7%6.5
16.11.6%2.0%
2.40.03.40.54.30.31.01.3
$26
0
106.6
Detroit
Community/environmental indicators – Score = 32.1; rank = 49
76.5%46.7%23.3%18.4%
28.3%54.5%35.1%
37.1%
9.6%3.7%8.8%268.627.5
86.6%
Detroit MSA
personal health indicators – Score = 35.7; rank = 42

44
Population
Percent less than 18 years old
Percent 18 to 64 years old
Percent 65 years old and older
Percent male
Percent high school graduate or higher
Percent White
Percent Black or African American
Percent Asian
Percent Other Race
Percent Hispanic/Latino
Percent unemployed
Median household income
Percent of households below poverty level
Violent crime rate/100,000*
Percent with disability
307,006,550
24.3%
62.8%
12.9%
49.3%
85.3%
74.8%
12.4%
4.5%
8.3%
15.8%
9.9%
$50,221
10.5%
429.4
12.0%
3,325,885
24.6%
63.6%
11.8%
49.2%
86.7%
72.3%
15.0%
5.1%
7.6%
15.1%
9.8%
$55,331
9.5%
11.0%
*Due to differences in jurisdictional definitions and reporting, the FBI recommends that these rates not be compared across areas
1,123,804 – 19,069,796
20.2% – 29.4%
60.5% – 66.9%
7.9% – 17.2%
48.1% – 51.1%
77.6% – 92.5%
49.8% – 88.6%
1.7% – 44.5%
1.2% – 30.2%
1.9% – 24.5%
1.2% – 53.4%
6.4% – 16.3%
$43,633 – $85,168
4.9% – 15.1%
7.4% – 14.5%
U.S. Value MSA Average MSA Range
1,195,998
22.3%
63.6%
14.1%
48.8%
88.9%
78.1%
10.6%
3.5%
7.8%
11.6%
8.4%
$65,698
6.6%
294.3
10.2%
Hartford MSA
deSCription oF hArtFord-WeSt hArtFord-eASt hArtFord, Ct MSA
• Higher percent with asthma• Higher percent with angina or coronary
heart disease• Lower percent using public transportation
to work
• Lower percent bicycling or walking to work• Fewer dog parks per capita• Lower park-related expenditures per capita
opportunitieS/ChALLenGeS
StrenGthS/AdvAntAGeS• Lower percent unemployed• Higher median household income• Lower percentage of households below
poverty level• Higher percent physically active at
least moderately• Higher percentage eating 5+ servings of
fruits/vegetables per day• Lower percent obese• Higher percent in excellent or very good health• Lower percent with diabetes
• Lower death rate for diabetes• Higher percent of city land area as parkland• More farmers’ markets per capita• More ball diamonds per capita• More golf courses per capita• More recreation centers per capita• More swimming pools per capita• Higher level of state requirement for Physical
Education classes• Higher number of primary health care providers
per capita
ranking: total Score = 66.8; rank = 7
hArtFord, Ct(Hartford-West Hartford-East Hartford, CT MSA)
CountieS Hartford, Middlesex, Tolland

45
ACSM AMeriCAn FitneSS indextM CoMponentS
Health Behaviors Percent any physical activity or exercise in the last 30 days Percent physically active at least moderatelyPercent eating 5+ servings of fruits/vegetables per dayPercent currently smoking
Chronic Health ProblemsPercent obesePercent in excellent or very good healthAny days when physical health was not good during
the past 30 daysAny days when mental health was not good during
the past 30 daysPercent with asthmaPercent with angina or coronary heart diseasePercent with diabetesDeath rate/100,000 for cardiovascular diseaseDeath rate/100,000 for diabetes
Health Care
Percent with health insurance
76.2%51.0%23.4%17.9%
26.9%56.0%35.5%
33.7%
8.8%3.8%8.3%206.722.5
85.6%
77.2%48.7%24.4%17.0%
25.9%56.8%35.3%
34.4%
8.3%3.6%8.3%201.021.9
86.3%
Built EnvironmentParkland as percent of city land areaAcres of parkland/1,000Farmers’ markets/1,000,000Percent using public transportation to workPercent bicycling or walking to work
Recreational FacilitiesBall diamonds/10,000Dog parks/10,000Park playgrounds/10,000Golf courses/100,000Park units/10,000Recreation centers/20,000Swimming pools/100,000Tennis courts/10,000
Park-related expenditures per capita
Level of state requirement for Physical Education classes**
Number of primary health care providers per 100,000
2.5% – 25.3%2.3 – 94.11.0 – 41.0
0.4% – 30.5%1.2% – 6.7%
0.3 – 5.70.0 – 5.70.9 – 4.80.0 – 5.0
1.2 – 10.90.1 – 2.60.6 – 9.20.8 – 6.9
$12.0 – $259.0
0 – 3
46.8 – 133.7
(note: most of these data were available only for the main city in the MSA)
**3 = required at three levels: high school, middle school and elementary school; 2= required at two levels; 1= required at only one level
70.4% – 85.9%36.4% – 58.1%15.8% – 30.0%8.8% – 25.3%
18.1% – 34.3%46.4% – 66.6%29.5% – 40.3%
23.8% – 41.9%
4.5% – 11.9%2.4% – 5.6%5.4% – 11.6%131.7 – 268.6
9.9 – 31.4
77.3% – 94.4%
U.S. Value MSA Average MSA Range
MSA Average Range of all Cities
10.6%18.914.84.3%2.8%
2.00.92.31.04.21.13.12.1
$101.5
2.5
93.2
personal health indicators – Score = 73.3; rank = 6 Hartford MSA
79.3%55.5%29.7%15.4%
21.6%62.6%37.0%
33.6%
9.1%4.0%6.2%191.216.6
91.9%
Community/environmental indicators – Score = 60.8; rank = 12
Hartford
20.8%18.241.02.8%2.4%
2.60.02.21.64.31.84.82.0
$17
3
104.4

46
Population
Percent less than 18 years old
Percent 18 to 64 years old
Percent 65 years old and older
Percent male
Percent high school graduate or higher
Percent White
Percent Black or African American
Percent Asian
Percent Other Race
Percent Hispanic/Latino
Percent unemployed
Median household income
Percent of households below poverty level
Violent crime rate/100,000*
Percent with disability
307,006,550
24.3%
62.8%
12.9%
49.3%
85.3%
74.8%
12.4%
4.5%
8.3%
15.8%
9.9%
$50,221
10.5%
429.4
12.0%
3,325,885
24.6%
63.6%
11.8%
49.2%
86.7%
72.3%
15.0%
5.1%
7.6%
15.1%
9.8%
$55,331
9.5%
11.0%
*Due to differences in jurisdictional definitions and reporting, the FBI recommends that these rates not be compared across areas
1,123,804 – 19,069,796
20.2% – 29.4%
60.5% – 66.9%
7.9% – 17.2%
48.1% – 51.1%
77.6% – 92.5%
49.8% – 88.6%
1.7% – 44.5%
1.2% – 30.2%
1.9% – 24.5%
1.2% – 53.4%
6.4% – 16.3%
$43,633 – $85,168
4.9% – 15.1%
7.4% – 14.5%
U.S. Value MSA Average MSA Range
houSton, tx(Houston-Sugar Land-Baytown, TX MSA)
CountieS Austin, Brazoria, Chambers, Fort Bend, Galveston, Harris, Liberty, Montgomery, San Jacinto, Waller
ranking: total Score = 38.3; rank = 42
StrenGthS/AdvAntAGeS• Lower percent unemployed• Lower percent with asthma• Lower percent with angina or coronary
heart disease
• Higher percent of city land area as parkland• More acres of parkland per capita• Higher level of state requirement for Physical
Education classes
opportunitieS/ChALLenGeS• Higher percentage of households below
poverty level• Lower percent with health insurance• Fewer farmers’ markets per capita• Lower percent using public transportation
to work • Lower percent bicycling or walking to work• Fewer ball diamonds per capita• Fewer dog parks per capita• Fewer park playgrounds per capita
• Fewer golf courses per capita• Fewer park units per capita• Fewer recreation centers per capita• Fewer swimming pools per capita• Fewer tennis courts per capita• Lower park-related expenditures per capita• Lower number of primary health care providers
per capita
deSCription oF houSton-SuGAr LAnd-BAytoWn, tx MSAHouston MSA
5,867,489
28.5%
63.0%
8.5%
50.1%
80.0%
67.6%
16.8%
6.1%
9.5%
34.4%
7.6%
$54,146
12.2%
706.8
9.0%

47
ACSM AMeriCAn FitneSS indextM CoMponentS
Health Behaviors Percent any physical activity or exercise in the last 30 days Percent physically active at least moderatelyPercent eating 5+ servings of fruits/vegetables per dayPercent currently smoking
Chronic Health ProblemsPercent obesePercent in excellent or very good healthAny days when physical health was not good during
the past 30 daysAny days when mental health was not good during
the past 30 daysPercent with asthmaPercent with angina or coronary heart diseasePercent with diabetesDeath rate/100,000 for cardiovascular diseaseDeath rate/100,000 for diabetes
Health Care
Percent with health insurance
76.2%51.0%23.4%17.9%
26.9%56.0%35.5%
33.7%
8.8%3.8%8.3%206.722.5
85.6%
77.2%48.7%24.4%17.0%
25.9%56.8%35.3%
34.4%
8.3%3.6%8.3%201.021.9
86.3%
Built EnvironmentParkland as percent of city land areaAcres of parkland/1,000Farmers’ markets/1,000,000Percent using public transportation to workPercent bicycling or walking to work
Recreational FacilitiesBall diamonds/10,000Dog parks/10,000Park playgrounds/10,000Golf courses/100,000Park units/10,000Recreation centers/20,000Swimming pools/100,000Tennis courts/10,000
Park-related expenditures per capita
Level of state requirement for Physical Education classes**
Number of primary health care providers per 100,000
2.5% – 25.3%2.3 – 94.11.0 – 41.0
0.4% – 30.5%1.2% – 6.7%
0.3 – 5.70.0 – 5.70.9 – 4.80.0 – 5.0
1.2 – 10.90.1 – 2.60.6 – 9.20.8 – 6.9
$12.0 – $259.0
0 – 3
46.8 – 133.7
(note: most of these data were available only for the main city in the MSA)
**3 = required at three levels: high school, middle school and elementary school; 2= required at two levels; 1= required at only one level
70.4% – 85.9%36.4% – 58.1%15.8% – 30.0%8.8% – 25.3%
18.1% – 34.3%46.4% – 66.6%29.5% – 40.3%
23.8% – 41.9%
4.5% – 11.9%2.4% – 5.6%5.4% – 11.6%131.7 – 268.6
9.9 – 31.4
77.3% – 94.4%
U.S. Value MSA Average MSA Range
MSA Average Range of all Cities
10.6%18.914.84.3%2.8%
2.00.92.31.04.21.13.12.1
$101.5
2.5
93.2
Houston
13.7%22.61.0
2.2%1.8%
1.10.51.20.41.90.61.91.0
$36
3
75.1
Community/environmental indicators – Score = 32.4; rank = 47
74.2%46.3%22.4%17.1%
27.3%54.6%34.7%
33.8%
6.2%2.9%7.8%209.121.9
77.6%
Houston MSA
personal health indicators – Score = 44.7; rank = 32

48
Population
Percent less than 18 years old
Percent 18 to 64 years old
Percent 65 years old and older
Percent male
Percent high school graduate or higher
Percent White
Percent Black or African American
Percent Asian
Percent Other Race
Percent Hispanic/Latino
Percent unemployed
Median household income
Percent of households below poverty level
Violent crime rate/100,000*
Percent with disability
*Due to differences in jurisdictional definitions and reporting, the FBI recommends that these rates not be compared across areas
U.S. Value MSA RangeMSA Average
307,006,550
24.3%
62.8%
12.9%
49.3%
85.3%
74.8%
12.4%
4.5%
8.3%
15.8%
9.9%
$50,221
10.5%
429.4
12.0%
3,325,885
24.6%
63.6%
11.8%
49.2%
86.7%
72.3%
15.0%
5.1%
7.6%
15.1%
9.8%
$55,331
9.5%
11.0%
1,123,804 – 19,069,796
20.2% – 29.4%
60.5% – 66.9%
7.9% – 17.2%
48.1% – 51.1%
77.6% – 92.5%
49.8% – 88.6%
1.7% – 44.5%
1.2% – 30.2%
1.9% – 24.5%
1.2% – 53.4%
6.4% – 16.3%
$43,633 – $85,168
4.9% – 15.1%
7.4% – 14.5%
indiAnApoLiS, in(Indianapolis-Carmel, IN MSA)
CountieS Boone, Brown, Hamilton, Hancock, Hendricks, Johnson, Marion, Morgan, Putnam, Shelby
ranking: total Score = 34.4; rank = 45
StrenGthS/AdvAntAGeS• Lower death rate for diabetes• More golf courses per capita• Higher level of state requirement for Physical
Education classes• Higher number of primary health care providers
per capita
opportunitieS/ChALLenGeS• Higher percentage of households below
poverty level • Higher percent currently smoking• Lower percent in excellent or very good health• Higher percent with asthma• Higher percent with angina or coronary
heart disease• Higher death rate for cardiovascular disease• Lower percent of city land area as parkland• Fewer acres of parkland per capita
• Lower percent using public transportation to work
• Lower percent bicycling or walking to work• Fewer ball diamonds per capita• Fewer dog parks per capita• Fewer park playgrounds per capita• Fewer park units per capita• Fewer recreation centers per capita• Fewer tennis courts per capita• Lower park-related expenditures per capita
deSCription oF indiAnApoLiS-CArMeL, in MSAIndianapolis MSA
1,743,658
26.0%
63.1%
10.9%
49.1%
87.6%
79.6%
14.4%
2.0%
4.1%
5.1%
9.9%
$50,410
10.6%
627.9
11.2%

49
ACSM AMeriCAn FitneSS indextM CoMponentS
Health Behaviors Percent any physical activity or exercise in the last 30 days Percent physically active at least moderatelyPercent eating 5+ servings of fruits/vegetables per dayPercent currently smoking
Chronic Health ProblemsPercent obesePercent in excellent or very good healthAny days when physical health was not good during
the past 30 daysAny days when mental health was not good during
the past 30 daysPercent with asthmaPercent with angina or coronary heart diseasePercent with diabetesDeath rate/100,000 for cardiovascular diseaseDeath rate/100,000 for diabetes
Health Care
Percent with health insurance
Built EnvironmentParkland as percent of city land areaAcres of parkland/1,000Farmers’ markets/1,000,000Percent using public transportation to workPercent bicycling or walking to work
Recreational FacilitiesBall diamonds/10,000Dog parks/10,000Park playgrounds/10,000Golf courses/100,000Park units/10,000Recreation centers/20,000Swimming pools/100,000Tennis courts/10,000
Park-related expenditures per capita
Level of state requirement for Physical Education classes**
Number of primary health care providers per 100,000
(note: most of these data were available only for the main city in the MSA)
**3 = required at three levels: high school, middle school and elementary school; 2= required at two levels; 1= required at only one level
MSA Average
10.6%18.914.84.3%2.8%
2.00.92.31.04.21.13.12.1
$101.5
2.5
93.2
Range of all Cities
2.5% – 25.3%2.3 – 94.11.0 – 41.0
0.4% – 30.5%1.2% – 6.7%
0.3 – 5.70.0 – 5.70.9 – 4.80.0 – 5.0
1.2 – 10.90.1 – 2.60.6 – 9.20.8 – 6.9
$12.0 – $259.0
0 – 3
46.8 – 133.7
76.2%51.0%23.4%17.9%
26.9%56.0%35.5%
33.7%
8.8%3.8%8.3%206.722.5
85.6%
77.2%48.7%24.4%17.0%
25.9%56.8%35.3%
34.4%
8.3%3.6%8.3%201.021.9
86.3%
70.4% – 85.9%36.4% – 58.1%15.8% – 30.0%8.8% – 25.3%
18.1% – 34.3%46.4% – 66.6%29.5% – 40.3%
23.8% – 41.9%
4.5% – 11.9%2.4% – 5.6%5.4% – 11.6%131.7 – 268.6
9.9 – 31.4
77.3% – 94.4%
U.S. Value MSA Average MSA Range
4.8%13.914.31.0%1.9%
0.70.41.61.62.60.62.81.5
$43
3
104.5
Indianapolis
Community/environmental indicators – Score = 37.8; rank = 39
73.6%48.4%22.4%21.5%
28.2%50.8%35.0%
34.4%
9.5%4.1%8.4%224.519.5
83.9%
Indianapolis MSA
personal health indicators – Score = 30.7; rank = 44

50
Population
Percent less than 18 years old
Percent 18 to 64 years old
Percent 65 years old and older
Percent male
Percent high school graduate or higher
Percent White
Percent Black or African American
Percent Asian
Percent Other Race
Percent Hispanic/Latino
Percent unemployed
Median household income
Percent of households below poverty level
Violent crime rate/100,000*
Percent with disability
*Due to differences in jurisdictional definitions and reporting, the FBI recommends that these rates not be compared across areas
MSA RangeMSA AverageU.S. Value
307,006,550
24.3%
62.8%
12.9%
49.3%
85.3%
74.8%
12.4%
4.5%
8.3%
15.8%
9.9%
$50,221
10.5%
429.4
12.0%
3,325,885
24.6%
63.6%
11.8%
49.2%
86.7%
72.3%
15.0%
5.1%
7.6%
15.1%
9.8%
$55,331
9.5%
11.0%
1,123,804 – 19,069,796
20.2% – 29.4%
60.5% – 66.9%
7.9% – 17.2%
48.1% – 51.1%
77.6% – 92.5%
49.8% – 88.6%
1.7% – 44.5%
1.2% – 30.2%
1.9% – 24.5%
1.2% – 53.4%
6.4% – 16.3%
$43,633 – $85,168
4.9% – 15.1%
7.4% – 14.5%
jACKSonviLLe, FL(Jacksonville, FL MSA)
CountieS Baker, Clay, Duval, Nassau, St. Johns
ranking: total Score = 46.7; rank = 31
StrenGthS/AdvAntAGeS• Lower percent of days when mental health
was not good during the past 30 days• More acres of parkland per capita• More ball diamonds per capita
• More park playgrounds per capita• More park units per capita• More recreation centers per capita• More swimming pools per capita
opportunitieS/ChALLenGeS
• Higher percentage of households below poverty level
• Lower percentage eating 5+ servings of fruits/vegetables per day
• Higher percent currently smoking• Higher percent with asthma• Higher percent with angina or coronary
heart disease• Higher percent with diabetes• Higher death rate for cardiovascular disease• Higher death rate for diabetes
• Lower percent of city land area as parkland• Fewer farmers’ markets per capita• Lower percent using public transportation
to work• Lower percent bicycling or walking to work• Fewer dog parks per capita• Fewer golf courses per capita• Lower park-related expenditures per capita• Lower level of state requirement for Physical
Education classes
deSCription oF jACKSonviLLe, FL MSAJacksonville MSA
1,328,144
24.4%
63.7%
11.9%
48.8%
88.2%
71.1%
22.0%
3.3%
3.6%
6.2%
10.3%
$50,010
10.6%
695.7
12.0%

51
ACSM AMeriCAn FitneSS indextM CoMponentS
Health Behaviors Percent any physical activity or exercise in the last 30 days Percent physically active at least moderatelyPercent eating 5+ servings of fruits/vegetables per dayPercent currently smoking
Chronic Health ProblemsPercent obesePercent in excellent or very good healthAny days when physical health was not good during
the past 30 daysAny days when mental health was not good during
the past 30 daysPercent with asthmaPercent with angina or coronary heart diseasePercent with diabetesDeath rate/100,000 for cardiovascular diseaseDeath rate/100,000 for diabetes
Health Care
Percent with health insurance
Built EnvironmentParkland as percent of city land areaAcres of parkland/1,000Farmers’ markets/1,000,000Percent using public transportation to workPercent bicycling or walking to work
Recreational FacilitiesBall diamonds/10,000Dog parks/10,000Park playgrounds/10,000Golf courses/100,000Park units/10,000Recreation centers/20,000Swimming pools/100,000Tennis courts/10,000
Park-related expenditures per capita
Level of state requirement for Physical Education classes**
Number of primary health care providers per 100,000
(note: most of these data were available only for the main city in the MSA)
**3 = required at three levels: high school, middle school and elementary school; 2= required at two levels; 1= required at only one level
Range of all Cities
2.5% – 25.3%2.3 – 94.11.0 – 41.0
0.4% – 30.5%1.2% – 6.7%
0.3 – 5.70.0 – 5.70.9 – 4.80.0 – 5.0
1.2 – 10.90.1 – 2.60.6 – 9.20.8 – 6.9
$12.0 – $259.0
0 – 3
46.8 – 133.7
MSA Average
10.6%18.914.84.3%2.8%
2.00.92.31.04.21.13.12.1
$101.5
2.5
93.2
U.S. Value MSA Average MSA Range
76.2%51.0%23.4%17.9%
26.9%56.0%35.5%
33.7%
8.8%3.8%8.3%206.722.5
85.6%
77.2%48.7%24.4%17.0%
25.9%56.8%35.3%
34.4%
8.3%3.6%8.3%201.021.9
86.3%
70.4% – 85.9%36.4% – 58.1%15.8% – 30.0%8.8% – 25.3%
18.1% – 34.3%46.4% – 66.6%29.5% – 40.3%
23.8% – 41.9%
4.5% – 11.9%2.4% – 5.6%5.4% – 11.6%131.7 – 268.6
9.9 – 31.4
77.3% – 94.4%
8.6%57.29.0
1.2%2.2%
3.50.13.50.55.11.34.52.0
$35
1
89.7
Jacksonville
Community/environmental indicators – Score = 51.1; rank = 28
75.7%49.2%20.5%21.3%
24.8%59.2%32.6%
29.1%
9.3%4.4%
10.0%224.729.3
84.8%
Jacksonville MSA
personal health indicators – Score = 42.0; rank = 36

52
Population
Percent less than 18 years old
Percent 18 to 64 years old
Percent 65 years old and older
Percent male
Percent high school graduate or higher
Percent White
Percent Black or African American
Percent Asian
Percent Other Race
Percent Hispanic/Latino
Percent unemployed
Median household income
Percent of households below poverty level
Violent crime rate/100,000*
Percent with disability
*Due to differences in jurisdictional definitions and reporting, the FBI recommends that these rates not be compared across areas
1,123,804 – 19,069,796
20.2% – 29.4%
60.5% – 66.9%
7.9% – 17.2%
48.1% – 51.1%
77.6% – 92.5%
49.8% – 88.6%
1.7% – 44.5%
1.2% – 30.2%
1.9% – 24.5%
1.2% – 53.4%
6.4% – 16.3%
$43,633 – $85,168
4.9% – 15.1%
7.4% – 14.5%
MSA Average MSA Range
3,325,885
24.6%
63.6%
11.8%
49.2%
86.7%
72.3%
15.0%
5.1%
7.6%
15.1%
9.8%
$55,331
9.5%
11.0%
U.S. Value
307,006,550
24.3%
62.8%
12.9%
49.3%
85.3%
74.8%
12.4%
4.5%
8.3%
15.8%
9.9%
$50,221
10.5%
429.4
12.0%
2,067,585
25.3%
63.0%
11.7%
49.1%
90.0%
80.9%
11.6%
2.1%
5.4%
7.5%
8.2%
$54,521
7.9%
535.9
11.8%
Kansas City MSA
deSCription oF KAnSAS City, Mo-KS MSA
• Lower percentage eating 5+ servings of fruits/vegetables per day
• Higher percent currently smoking• Lower percent of city land area as parkland• Lower percent using public transportation
to work
• Lower percent bicycling or walking to work• Fewer dog parks per capita• Fewer recreation centers per capita• Fewer swimming pools per capita
opportunitieS/ChALLenGeS
StrenGthS/AdvAntAGeS• Lower percent unemployed• Lower percentage of households below
poverty level• More acres of parkland per capita• More farmers’ markets per capita• More ball diamonds per capita
• More golf courses per capita• More park units per capita• Higher park-related expenditures per capita• Higher level of state requirement for Physical
Education classes
ranking: total Score = 51.5; rank = 22
KAnSAS City, Mo(Kansas City, MO-KS MSA)
CountieS Franklin, KS, Johnson, KS, Leavenworth, KS, Linn, KS, Miami, KS, Wyandotte, KS, Bates, MO, Caldwell, MO, Cass, MO, Clay, MO, Clinton, MO, Jackson, MO, Lafayette, MO, Platte, MO, Ray, MO
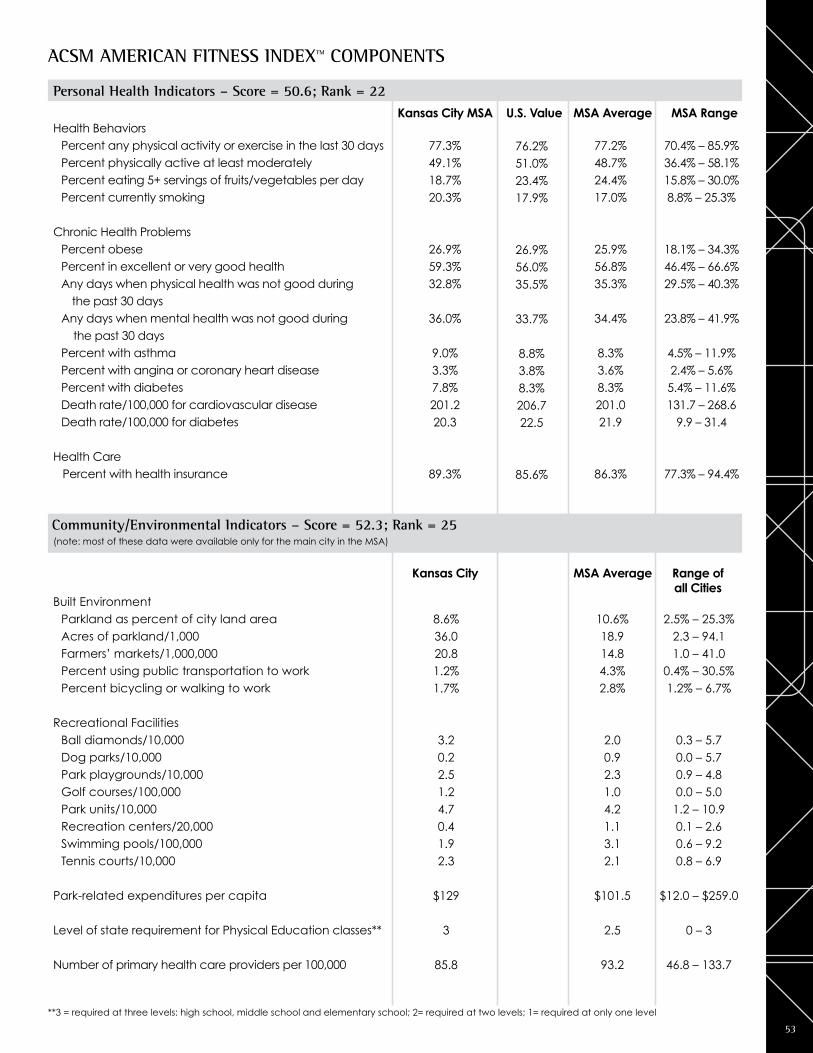
53
ACSM AMeriCAn FitneSS indextM CoMponentS
Health Behaviors Percent any physical activity or exercise in the last 30 days Percent physically active at least moderatelyPercent eating 5+ servings of fruits/vegetables per dayPercent currently smoking
Chronic Health ProblemsPercent obesePercent in excellent or very good healthAny days when physical health was not good during
the past 30 daysAny days when mental health was not good during
the past 30 daysPercent with asthmaPercent with angina or coronary heart diseasePercent with diabetesDeath rate/100,000 for cardiovascular diseaseDeath rate/100,000 for diabetes
Health Care
Percent with health insurance
Built EnvironmentParkland as percent of city land areaAcres of parkland/1,000Farmers’ markets/1,000,000Percent using public transportation to workPercent bicycling or walking to work
Recreational FacilitiesBall diamonds/10,000Dog parks/10,000Park playgrounds/10,000Golf courses/100,000Park units/10,000Recreation centers/20,000Swimming pools/100,000Tennis courts/10,000
Park-related expenditures per capita
Level of state requirement for Physical Education classes**
Number of primary health care providers per 100,000
(note: most of these data were available only for the main city in the MSA)
**3 = required at three levels: high school, middle school and elementary school; 2= required at two levels; 1= required at only one level
10.6%18.914.84.3%2.8%
2.00.92.31.04.21.13.12.1
$101.5
2.5
93.2
MSA Average Range of all Cities
2.5% – 25.3%2.3 – 94.11.0 – 41.0
0.4% – 30.5%1.2% – 6.7%
0.3 – 5.70.0 – 5.70.9 – 4.80.0 – 5.0
1.2 – 10.90.1 – 2.60.6 – 9.20.8 – 6.9
$12.0 – $259.0
0 – 3
46.8 – 133.7
70.4% – 85.9%36.4% – 58.1%15.8% – 30.0%8.8% – 25.3%
18.1% – 34.3%46.4% – 66.6%29.5% – 40.3%
23.8% – 41.9%
4.5% – 11.9%2.4% – 5.6%5.4% – 11.6%131.7 – 268.6
9.9 – 31.4
77.3% – 94.4%
U.S. Value MSA Average MSA Range
77.2%48.7%24.4%17.0%
25.9%56.8%35.3%
34.4%
8.3%3.6%8.3%201.021.9
86.3%
76.2%51.0%23.4%17.9%
26.9%56.0%35.5%
33.7%
8.8%3.8%8.3%206.722.5
85.6%
personal health indicators – Score = 50.6; rank = 22 Kansas City MSA
77.3%49.1%18.7%20.3%
26.9%59.3%32.8%
36.0%
9.0%3.3%7.8%201.220.3
89.3%
Community/environmental indicators – Score = 52.3; rank = 25
Kansas City
8.6%36.020.81.2%1.7%
3.20.22.51.24.70.41.92.3
$129
3
85.8

54
Population
Percent less than 18 years old
Percent 18 to 64 years old
Percent 65 years old and older
Percent male
Percent high school graduate or higher
Percent White
Percent Black or African American
Percent Asian
Percent Other Race
Percent Hispanic/Latino
Percent unemployed
Median household income
Percent of households below poverty level
Violent crime rate/100,000*
Percent with disability
307,006,550
24.3%
62.8%
12.9%
49.3%
85.3%
74.8%
12.4%
4.5%
8.3%
15.8%
9.9%
$50,221
10.5%
429.4
12.0%
3,325,885
24.6%
63.6%
11.8%
49.2%
86.7%
72.3%
15.0%
5.1%
7.6%
15.1%
9.8%
$55,331
9.5%
11.0%
*Due to differences in jurisdictional definitions and reporting, the FBI recommends that these rates not be compared across areas
1,123,804 – 19,069,796
20.2% – 29.4%
60.5% – 66.9%
7.9% – 17.2%
48.1% – 51.1%
77.6% – 92.5%
49.8% – 88.6%
1.7% – 44.5%
1.2% – 30.2%
1.9% – 24.5%
1.2% – 53.4%
6.4% – 16.3%
$43,633 – $85,168
4.9% – 15.1%
7.4% – 14.5%
U.S. Value MSA Average MSA Range
1,902,834
26.3%
62.9%
10.7%
50.9%
83.0%
73.0%
9.9%
7.7%
9.4%
29.3%
12.1%
$53,505
9.2%
810.9
9.5%
Las Vegas MSA
deSCription oF LAS veGAS-pArAdiSe, nv MSA
• Higher percent unemployed• Higher percent currently smoking• Higher percent with asthma• Lower percent of city land area as parkland• Fewer acres of parkland per capita• Fewer farmers’ markets per capita• Lower percent using public transportation
to work• Lower percent bicycling or walking to work• Fewer ball diamonds per capita
• Fewer park playgrounds per capita• Fewer golf courses per capita• Fewer park units per capita• Fewer swimming pools per capita• Fewer tennis courts per capita• Lower level of state requirement for Physical
Education classes• Lower number of primary health care providers
per capita
opportunitieS/ChALLenGeS
StrenGthS/AdvAntAGeS• Lower death rate for diabetes• More dog parks per capita• More recreation centers per capita• Higher park-related expenditures per capita
ranking: total Score = 37.8; rank = 43
LAS veGAS, nv(Las Vegas-Paradise, NV MSA)
CountieS Clark

55
ACSM AMeriCAn FitneSS indextM CoMponentS
Health Behaviors Percent any physical activity or exercise in the last 30 days Percent physically active at least moderatelyPercent eating 5+ servings of fruits/vegetables per dayPercent currently smoking
Chronic Health ProblemsPercent obesePercent in excellent or very good healthAny days when physical health was not good during
the past 30 daysAny days when mental health was not good during
the past 30 daysPercent with asthmaPercent with angina or coronary heart diseasePercent with diabetesDeath rate/100,000 for cardiovascular diseaseDeath rate/100,000 for diabetes
Health Care
Percent with health insurance
Built EnvironmentParkland as percent of city land areaAcres of parkland/1,000Farmers’ markets/1,000,000Percent using public transportation to workPercent bicycling or walking to work
Recreational FacilitiesBall diamonds/10,000Dog parks/10,000Park playgrounds/10,000Golf courses/100,000Park units/10,000Recreation centers/20,000Swimming pools/100,000Tennis courts/10,000
Park-related expenditures per capita
Level of state requirement for Physical Education classes**
Number of primary health care providers per 100,000
(note: most of these data were available only for the main city in the MSA)
**3 = required at three levels: high school, middle school and elementary school; 2= required at two levels; 1= required at only one level
MSA Average
10.6%18.914.84.3%2.8%
2.00.92.31.04.21.13.12.1
$101.5
2.5
93.2
Range of all Cities
2.5% – 25.3%2.3 – 94.11.0 – 41.0
0.4% – 30.5%1.2% – 6.7%
0.3 – 5.70.0 – 5.70.9 – 4.80.0 – 5.0
1.2 – 10.90.1 – 2.60.6 – 9.20.8 – 6.9
$12.0 – $259.0
0 – 3
46.8 – 133.7
76.2%51.0%23.4%17.9%
26.9%56.0%35.5%
33.7%
8.8%3.8%8.3%206.722.5
85.6%
77.2%48.7%24.4%17.0%
25.9%56.8%35.3%
34.4%
8.3%3.6%8.3%201.021.9
86.3%
MSA Range
70.4% – 85.9%36.4% – 58.1%15.8% – 30.0%8.8% – 25.3%
18.1% – 34.3%46.4% – 66.6%29.5% – 40.3%
23.8% – 41.9%
4.5% – 11.9%2.4% – 5.6%5.4% – 11.6%131.7 – 268.6
9.9 – 31.4
77.3% – 94.4%
U.S. Value MSA Average
4.2%5.54.2
3.2%2.1%
0.94.12.00.71.21.52.11.2
$206
2
64.4
Las Vegas
Community/environmental indicators – Score = 39.4; rank = 38
personal health indicators – Score = 36.1; rank = 41 Las Vegas MSA
73.6%49.1%23.9%22.3%
27.9%54.2%34.2%
36.7%
9.2%3.7%8.1%215.59.9
79.9%

56
Population
Percent less than 18 years old
Percent 18 to 64 years old
Percent 65 years old and older
Percent male
Percent high school graduate or higher
Percent White
Percent Black or African American
Percent Asian
Percent Other Race
Percent Hispanic/Latino
Percent unemployed
Median household income
Percent of households below poverty level
Violent crime rate/100,000*
Percent with disability
*Due to differences in jurisdictional definitions and reporting, the FBI recommends that these rates not be compared across areas
1,123,804 – 19,069,796
20.2% – 29.4%
60.5% – 66.9%
7.9% – 17.2%
48.1% – 51.1%
77.6% – 92.5%
49.8% – 88.6%
1.7% – 44.5%
1.2% – 30.2%
1.9% – 24.5%
1.2% – 53.4%
6.4% – 16.3%
$43,633 – $85,168
4.9% – 15.1%
7.4% – 14.5%
MSA RangeMSA AverageU.S. Value
307,006,550
24.3%
62.8%
12.9%
49.3%
85.3%
74.8%
12.4%
4.5%
8.3%
15.8%
9.9%
$50,221
10.5%
429.4
12.0%
3,325,885
24.6%
63.6%
11.8%
49.2%
86.7%
72.3%
15.0%
5.1%
7.6%
15.1%
9.8%
$55,331
9.5%
11.0%
LoS AnGeLeS, CA(Los Angeles-Long Beach-Santa Ana, CA MSA)
CountieS Los Angeles, Orange
ranking: total Score = 39.1; rank = 41
StrenGthS/AdvAntAGeS• Lower percent currently smoking• Lower percent with asthma• Lower percent with angina or coronary
heart disease• Higher percent using public transportation
to work
• Higher percent bicycling or walking to work• Higher level of state requirement for Physical
Education classes
opportunitieS/ChALLenGeS• Lower percent graduated from high school
or higher• Higher percentage of households below
poverty level• Lower percent physically active at
least moderately• Lower percent in excellent or very good health• Higher percent of days when mental health was
not good during the past 30 days• Higher percent with diabetes• Lower percent of city land area as parkland
• Fewer acres of parkland per capita• Fewer farmers’ markets per capita• Fewer ball diamonds per capita• Fewer dog parks per capita• Fewer park playgrounds per capita• Fewer golf courses per capita• Fewer park units per capita• Fewer swimming pools per capita• Fewer tennis courts per capita• Lower park-related expenditures per capita
deSCription oF LoS AnGeLeS-LonG BeACh-SAntA AnA, CA MSALos Angeles MSA
12,874,797
25.3%
63.9%
10.8%
49.7%
77.6%
54.6%
7.0%
13.9%
24.5%
44.8%
10.5%
$58,525
11.5%
482.7
8.8%
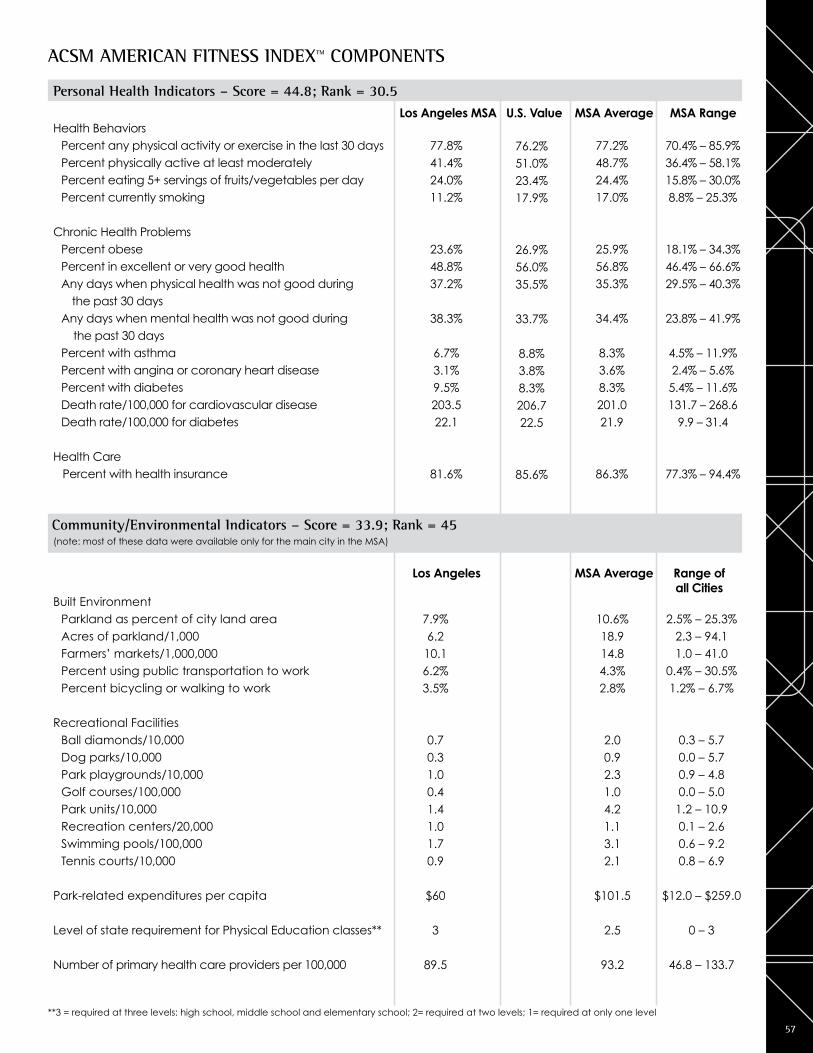
57
ACSM AMeriCAn FitneSS indextM CoMponentS
Health Behaviors Percent any physical activity or exercise in the last 30 days Percent physically active at least moderatelyPercent eating 5+ servings of fruits/vegetables per dayPercent currently smoking
Chronic Health ProblemsPercent obesePercent in excellent or very good healthAny days when physical health was not good during
the past 30 daysAny days when mental health was not good during
the past 30 daysPercent with asthmaPercent with angina or coronary heart diseasePercent with diabetesDeath rate/100,000 for cardiovascular diseaseDeath rate/100,000 for diabetes
Health Care
Percent with health insurance
Built EnvironmentParkland as percent of city land areaAcres of parkland/1,000Farmers’ markets/1,000,000Percent using public transportation to workPercent bicycling or walking to work
Recreational FacilitiesBall diamonds/10,000Dog parks/10,000Park playgrounds/10,000Golf courses/100,000Park units/10,000Recreation centers/20,000Swimming pools/100,000Tennis courts/10,000
Park-related expenditures per capita
Level of state requirement for Physical Education classes**
Number of primary health care providers per 100,000
(note: most of these data were available only for the main city in the MSA)
**3 = required at three levels: high school, middle school and elementary school; 2= required at two levels; 1= required at only one level
10.6%18.914.84.3%2.8%
2.00.92.31.04.21.13.12.1
$101.5
2.5
93.2
2.5% – 25.3%2.3 – 94.11.0 – 41.0
0.4% – 30.5%1.2% – 6.7%
0.3 – 5.70.0 – 5.70.9 – 4.80.0 – 5.0
1.2 – 10.90.1 – 2.60.6 – 9.20.8 – 6.9
$12.0 – $259.0
0 – 3
46.8 – 133.7
Range of all Cities
MSA Average
U.S. Value
76.2%51.0%23.4%17.9%
26.9%56.0%35.5%
33.7%
8.8%3.8%8.3%206.722.5
85.6%
MSA Average
77.2%48.7%24.4%17.0%
25.9%56.8%35.3%
34.4%
8.3%3.6%8.3%201.021.9
86.3%
MSA Range
70.4% – 85.9%36.4% – 58.1%15.8% – 30.0%8.8% – 25.3%
18.1% – 34.3%46.4% – 66.6%29.5% – 40.3%
23.8% – 41.9%
4.5% – 11.9%2.4% – 5.6%5.4% – 11.6%131.7 – 268.6
9.9 – 31.4
77.3% – 94.4%
personal health indicators – Score = 44.8; rank = 30.5 Los Angeles MSA
Community/environmental indicators – Score = 33.9; rank = 45
77.8%41.4%24.0%11.2%
23.6%48.8%37.2%
38.3%
6.7%3.1%9.5%203.522.1
81.6%
Los Angeles
7.9%6.2
10.16.2%3.5%
0.70.31.00.41.41.01.70.9
$60
3
89.5

58
Population
Percent less than 18 years old
Percent 18 to 64 years old
Percent 65 years old and older
Percent male
Percent high school graduate or higher
Percent White
Percent Black or African American
Percent Asian
Percent Other Race
Percent Hispanic/Latino
Percent unemployed
Median household income
Percent of households below poverty level
Violent crime rate/100,000*
Percent with disability
307,006,550
24.3%
62.8%
12.9%
49.3%
85.3%
74.8%
12.4%
4.5%
8.3%
15.8%
9.9%
$50,221
10.5%
429.4
12.0%
3,325,885
24.6%
63.6%
11.8%
49.2%
86.7%
72.3%
15.0%
5.1%
7.6%
15.1%
9.8%
$55,331
9.5%
11.0%
*Due to differences in jurisdictional definitions and reporting, the FBI recommends that these rates not be compared across areas
1,123,804 – 19,069,796
20.2% – 29.4%
60.5% – 66.9%
7.9% – 17.2%
48.1% – 51.1%
77.6% – 92.5%
49.8% – 88.6%
1.7% – 44.5%
1.2% – 30.2%
1.9% – 24.5%
1.2% – 53.4%
6.4% – 16.3%
$43,633 – $85,168
4.9% – 15.1%
7.4% – 14.5%
U.S. Value MSA Average MSA Range
LouiSviLLe, Ky(Louisville/Jefferson County, KY-IN MSA)
CountieS Clark IN, Floyd IN, Harrison IN, Washington IN, Bullitt KY, Henry KY, Jefferson KY, Meade KY, Nelson KY, Oldham KY, Shelby KY, Spencer KY, Trimble KY
ranking: total Score = 29.0; rank = 49 StrenGthS/AdvAntAGeS• More acres of parkland per capita• More farmers’ markets per capita
• More golf courses per capita• More tennis courts per capita
opportunitieS/ChALLenGeS• Lower median household income• Higher percentage of households below
poverty level• Higher percent currently smoking• Higher percent obese• Higher percent of days when physical health
was not good during the past 30 days• Higher percent of days when mental health
was not good during the past 30 days• Higher percent with asthma• Higher percent with angina or coronary
heart disease• Higher percent with diabetes• Higher death rate for diabetes
• Lower percent of city land area as parkland • Lower percent using public transportation
to work• Lower percent bicycling or walking to work• Fewer ball diamonds per capita• Fewer dog parks per capita• Fewer park playgrounds per capita• Fewer park units per capita• Fewer recreation centers per capita• Fewer swimming pools per capita• Lower park-related expenditures per capita• Lower level of state requirement for Physical
Education classes
deSCription oF LouiSviLLe/jeFFerSon County, Ky-in MSALouisville MSA
1,258,577
23.9%
63.4%
12.7%
48.8%
86.8%
82.5%
13.0%
1.3%
3.2%
3.2%
10.1%
$46,786
11.2%
370.4
14.3%

59
ACSM AMeriCAn FitneSS indextM CoMponentS
Health Behaviors Percent any physical activity or exercise in the last 30 days Percent physically active at least moderatelyPercent eating 5+ servings of fruits/vegetables per dayPercent currently smoking
Chronic Health ProblemsPercent obesePercent in excellent or very good healthAny days when physical health was not good during
the past 30 daysAny days when mental health was not good during
the past 30 daysPercent with asthmaPercent with angina or coronary heart diseasePercent with diabetesDeath rate/100,000 for cardiovascular diseaseDeath rate/100,000 for diabetes
Health Care
Percent with health insurance
76.2%51.0%23.4%17.9%
26.9%56.0%35.5%
33.7%
8.8%3.8%8.3%206.722.5
85.6%
77.2%48.7%24.4%17.0%
25.9%56.8%35.3%
34.4%
8.3%3.6%8.3%201.021.9
86.3%
Built EnvironmentParkland as percent of city land areaAcres of parkland/1,000Farmers’ markets/1,000,000Percent using public transportation to workPercent bicycling or walking to work
Recreational FacilitiesBall diamonds/10,000Dog parks/10,000Park playgrounds/10,000Golf courses/100,000Park units/10,000Recreation centers/20,000Swimming pools/100,000Tennis courts/10,000
Park-related expenditures per capita
Level of state requirement for Physical Education classes**
Number of primary health care providers per 100,000
2.5% – 25.3%2.3 – 94.11.0 – 41.0
0.4% – 30.5%1.2% – 6.7%
0.3 – 5.70.0 – 5.70.9 – 4.80.0 – 5.0
1.2 – 10.90.1 – 2.60.6 – 9.20.8 – 6.9
$12.0 – $259.0
0 – 3
46.8 – 133.7
(note: most of these data were available only for the main city in the MSA)
**3 = required at three levels: high school, middle school and elementary school; 2= required at two levels; 1= required at only one level
70.4% – 85.9%36.4% – 58.1%15.8% – 30.0%8.8% – 25.3%
18.1% – 34.3%46.4% – 66.6%29.5% – 40.3%
23.8% – 41.9%
4.5% – 11.9%2.4% – 5.6%5.4% – 11.6%131.7 – 268.6
9.9 – 31.4
77.3% – 94.4%
U.S. Value MSA Average MSA Range
MSA Average Range of all Cities
10.6%18.914.84.3%2.8%
2.00.92.31.04.21.13.12.1
$101.5
2.5
93.2
Louisville MSA
72.6%46.4%24.6%25.3%
33.8%51.2%39.2%
37.9%
9.7%4.8%
11.6%211.328.9
88.1%
Louisville
6.5%22.331.82.4%1.9%
1.20.41.71.31.80.51.52.5
$42
1
88.1
Community/environmental indicators – Score = 36.7; rank = 41
personal health indicators – Score = 20.6; rank = 48

60
Population
Percent less than 18 years old
Percent 18 to 64 years old
Percent 65 years old and older
Percent male
Percent high school graduate or higher
Percent White
Percent Black or African American
Percent Asian
Percent Other Race
Percent Hispanic/Latino
Percent unemployed
Median household income
Percent of households below poverty level
Violent crime rate/100,000*
Percent with disability
307,006,550
24.3%
62.8%
12.9%
49.3%
85.3%
74.8%
12.4%
4.5%
8.3%
15.8%
9.9%
$50,221
10.5%
429.4
12.0%
3,325,885
24.6%
63.6%
11.8%
49.2%
86.7%
72.3%
15.0%
5.1%
7.6%
15.1%
9.8%
$55,331
9.5%
11.0%
*Due to differences in jurisdictional definitions and reporting, the FBI recommends that these rates not be compared across areas
1,123,804 – 19,069,796
20.2% – 29.4%
60.5% – 66.9%
7.9% – 17.2%
48.1% – 51.1%
77.6% – 92.5%
49.8% – 88.6%
1.7% – 44.5%
1.2% – 30.2%
1.9% – 24.5%
1.2% – 53.4%
6.4% – 16.3%
$43,633 – $85,168
4.9% – 15.1%
7.4% – 14.5%
U.S. Value MSA Average MSA Range
MeMphiS, tn(Memphis, TN-MS-AR MSA)
CountieS Crittenden AR, DeSoto MS, Marshall MS, Tate MS, Tunica MS, Fayette TN, Shelby TN, Tipton TN
ranking: total Score = 32.9; rank = 48 StrenGthS/AdvAntAGeS• Lower percent of days when mental health
was not good during the past 30 days • Lower percent with asthma
• More golf courses per capita• Higher level of state requirement for Physical
Education classes
opportunitieS/ChALLenGeS• Higher percent unemployed• Lower median household income • Higher percentage of households below
poverty level• Lower percent physically active at
least moderately• Lower percent eating 5+ servings of
fruits/ vegetables per day• Higher percent obese• Higher percent with diabetes• Higher death rate for cardiovascular disease• Higher death rate for diabetes• Lower percent of city land area as parkland • Fewer acres of parkland per capita• Fewer farmers’ markets per capita
• Lower percent using public transportation to work
• Lower percent bicycling or walking to work• Fewer ball diamonds per capita• Fewer dog parks per capita• Fewer park playgrounds per capita• Fewer park units per capita• Fewer recreation centers per capita• Fewer swimming pools per capita• Fewer tennis courts per capita• Lower park-related expenditures per capita• Lower number of primary health care providers
per capita
deSCription oF MeMphiS, tn-MS-Ar MSAMemphis MSA
1,304,926
27.2%
62.3%
10.5%
48.1%
83.8%
49.8%
44.5%
1.7%
4.0%
4.5%
11.8%
$43,633
15.1%
1,146.9
12.6%

61
ACSM AMeriCAn FitneSS indextM CoMponentS
Health Behaviors Percent any physical activity or exercise in the last 30 days Percent physically active at least moderatelyPercent eating 5+ servings of fruits/vegetables per dayPercent currently smoking
Chronic Health ProblemsPercent obesePercent in excellent or very good healthAny days when physical health was not good during
the past 30 daysAny days when mental health was not good during
the past 30 daysPercent with asthmaPercent with angina or coronary heart diseasePercent with diabetesDeath rate/100,000 for cardiovascular diseaseDeath rate/100,000 for diabetes
Health Care
Percent with health insurance
76.2%51.0%23.4%17.9%
26.9%56.0%35.5%
33.7%
8.8%3.8%8.3%206.722.5
85.6%
77.2%48.7%24.4%17.0%
25.9%56.8%35.3%
34.4%
8.3%3.6%8.3%201.021.9
86.3%
Built EnvironmentParkland as percent of city land areaAcres of parkland/1,000Farmers’ markets/1,000,000Percent using public transportation to workPercent bicycling or walking to work
Recreational FacilitiesBall diamonds/10,000Dog parks/10,000Park playgrounds/10,000Golf courses/100,000Park units/10,000Recreation centers/20,000Swimming pools/100,000Tennis courts/10,000
Park-related expenditures per capita
Level of state requirement for Physical Education classes**
Number of primary health care providers per 100,000
2.5% – 25.3%2.3 – 94.11.0 – 41.0
0.4% – 30.5%1.2% – 6.7%
0.3 – 5.70.0 – 5.70.9 – 4.80.0 – 5.0
1.2 – 10.90.1 – 2.60.6 – 9.20.8 – 6.9
$12.0 – $259.0
0 – 3
46.8 – 133.7
(note: most of these data were available only for the main city in the MSA)
**3 = required at three levels: high school, middle school and elementary school; 2= required at two levels; 1= required at only one level
70.4% – 85.9%36.4% – 58.1%15.8% – 30.0%8.8% – 25.3%
18.1% – 34.3%46.4% – 66.6%29.5% – 40.3%
23.8% – 41.9%
4.5% – 11.9%2.4% – 5.6%5.4% – 11.6%131.7 – 268.6
9.9 – 31.4
77.3% – 94.4%
U.S. Value MSA Average MSA Range
MSA Average Range of all Cities
10.6%18.914.84.3%2.8%
2.00.92.31.04.21.13.12.1
$101.5
2.5
93.2
personal health indicators – Score = 31.0; rank = 43 Memphis MSA
70.4%38.4%20.3%18.4%
34.3%57.3%34.4%
23.8%
7.0%3.7%
11.0%263.631.4
84.0%
Community/environmental indicators – Score = 34.6; rank = 43
Memphis
5.1%13.610.71.5%1.3%
1.70.11.71.32.90.92.71.2
$34
3
79.9

62
Population
Percent less than 18 years old
Percent 18 to 64 years old
Percent 65 years old and older
Percent male
Percent high school graduate or higher
Percent White
Percent Black or African American
Percent Asian
Percent Other Race
Percent Hispanic/Latino
Percent unemployed
Median household income
Percent of households below poverty level
Violent crime rate/100,000*
Percent with disability
307,006,550
24.3%
62.8%
12.9%
49.3%
85.3%
74.8%
12.4%
4.5%
8.3%
15.8%
9.9%
$50,221
10.5%
429.4
12.0%
3,325,885
24.6%
63.6%
11.8%
49.2%
86.7%
72.3%
15.0%
5.1%
7.6%
15.1%
9.8%
$55,331
9.5%
11.0%
*Due to differences in jurisdictional definitions and reporting, the FBI recommends that these rates not be compared across areas
1,123,804 – 19,069,796
20.2% – 29.4%
60.5% – 66.9%
7.9% – 17.2%
48.1% – 51.1%
77.6% – 92.5%
49.8% – 88.6%
1.7% – 44.5%
1.2% – 30.2%
1.9% – 24.5%
1.2% – 53.4%
6.4% – 16.3%
$43,633 – $85,168
4.9% – 15.1%
7.4% – 14.5%
U.S. Value MSA Average MSA Range
MiAMi, FL(Miami-Fort Lauderdale-Pompano Beach, FL MSA)
CountieS Broward, Miami-Dade, Palm
ranking: total Score = 43.1; rank = 35
StrenGthS/AdvAntAGeS• Lower percent currently smoking• Lower percent of days when mental health
was not good during the past 30 days • Lower percent with asthma
• Lower death rate for cardiovascular disease• Lower death rate for diabetes • More recreation centers per capita• More swimming pools per capita
opportunitieS/ChALLenGeS• Higher percent unemployed• Lower median household income• Higher percentage of households below
poverty level• Lower percent physically active at
least moderately• Higher percent with diabetes• Lower percent of city land area as parkland • Fewer acres of parkland per capita• Fewer farmers’ markets per capita• Lower percent using public transportation
to work
• Lower percent bicycling or walking to work• Fewer ball diamonds per capita• Fewer dog parks per capita• Fewer park playgrounds per capita• Fewer golf courses per capita• Fewer park units per capita• Fewer tennis courts per capita• Lower park-related expenditures per capita• Lower level of state requirement for Physical
Education classes• Lower number of primary health care providers
per capita
deSCription oF MiAMi-Fort LAuderdALe-poMpAno BeACh, FL MSAMiami MSA
5,547,051
22.6%
61.5%
15.9%
48.8%
82.5%
71.7%
20.4%
2.3%
5.6%
40.3%
11.7%
$45,946
11.5%
679.9
11.1%

63
ACSM AMeriCAn FitneSS indextM CoMponentS
Health Behaviors Percent any physical activity or exercise in the last 30 days Percent physically active at least moderatelyPercent eating 5+ servings of fruits/vegetables per dayPercent currently smoking
Chronic Health ProblemsPercent obesePercent in excellent or very good healthAny days when physical health was not good during
the past 30 daysAny days when mental health was not good during
the past 30 daysPercent with asthmaPercent with angina or coronary heart diseasePercent with diabetesDeath rate/100,000 for cardiovascular diseaseDeath rate/100,000 for diabetes
Health Care
Percent with health insurance
76.2%51.0%23.4%17.9%
26.9%56.0%35.5%
33.7%
8.8%3.8%8.3%206.722.5
85.6%
77.2%48.7%24.4%17.0%
25.9%56.8%35.3%
34.4%
8.3%3.6%8.3%201.021.9
86.3%
Built EnvironmentParkland as percent of city land areaAcres of parkland/1,000Farmers’ markets/1,000,000Percent using public transportation to workPercent bicycling or walking to work
Recreational FacilitiesBall diamonds/10,000Dog parks/10,000Park playgrounds/10,000Golf courses/100,000Park units/10,000Recreation centers/20,000Swimming pools/100,000Tennis courts/10,000
Park-related expenditures per capita
Level of state requirement for Physical Education classes**
Number of primary health care providers per 100,000
2.5% – 25.3%2.3 – 94.11.0 – 41.0
0.4% – 30.5%1.2% – 6.7%
0.3 – 5.70.0 – 5.70.9 – 4.80.0 – 5.0
1.2 – 10.90.1 – 2.60.6 – 9.20.8 – 6.9
$12.0 – $259.0
0 – 3
46.8 – 133.7
(note: most of these data were available only for the main city in the MSA)
**3 = required at three levels: high school, middle school and elementary school; 2= required at two levels; 1= required at only one level
70.4% – 85.9%36.4% – 58.1%15.8% – 30.0%8.8% – 25.3%
18.1% – 34.3%46.4% – 66.6%29.5% – 40.3%
23.8% – 41.9%
4.5% – 11.9%2.4% – 5.6%5.4% – 11.6%131.7 – 268.6
9.9 – 31.4
77.3% – 94.4%
U.S. Value MSA Average MSA Range
MSA Average Range of all Cities
10.6%18.914.84.3%2.8%
2.00.92.31.04.21.13.12.1
$101.5
2.5
93.2
personal health indicators – Score = 54.8; rank = 21 Miami MSA
79.4%36.4%24.8%11.2%
23.8%55.6%35.8%
30.6%
5.6%3.7%
10.7%175.018.5
84.1%
Community/environmental indicators – Score = 32.3; rank = 48
Miami
4.2%2.34.3
3.5%2.4%
0.60.71.40.22.91.53.61.3
$74
1
46.8

64
Population
Percent less than 18 years old
Percent 18 to 64 years old
Percent 65 years old and older
Percent male
Percent high school graduate or higher
Percent White
Percent Black or African American
Percent Asian
Percent Other Race
Percent Hispanic/Latino
Percent unemployed
Median household income
Percent of households below poverty level
Violent crime rate/100,000*
Percent with disability
*Due to differences in jurisdictional definitions and reporting, the FBI recommends that these rates not be compared across areas
MSA Range
1,123,804 – 19,069,796
20.2% – 29.4%
60.5% – 66.9%
7.9% – 17.2%
48.1% – 51.1%
77.6% – 92.5%
49.8% – 88.6%
1.7% – 44.5%
1.2% – 30.2%
1.9% – 24.5%
1.2% – 53.4%
6.4% – 16.3%
$43,633 – $85,168
4.9% – 15.1%
7.4% – 14.5%
MSA Average
3,325,885
24.6%
63.6%
11.8%
49.2%
86.7%
72.3%
15.0%
5.1%
7.6%
15.1%
9.8%
$55,331
9.5%
11.0%
U.S. Value
307,006,550
24.3%
62.8%
12.9%
49.3%
85.3%
74.8%
12.4%
4.5%
8.3%
15.8%
9.9%
$50,221
10.5%
429.4
12.0%
1,559,667
24.5%
63.0%
12.5%
48.8%
88.8%
77.1%
16.2%
2.7%
4.0%
8.7%
9.2%
$52,024
10.2%
494.2
11.1%
Milwaukee MSA
deSCription oF MiLWAuKee-WAuKeShA-WeSt ALLiS, Wi MSA
• Higher percent currently smoking• Fewer acres of parkland per capita• Lower percent using public transportation
to work• Fewer ball diamonds per capita• Fewer dog parks per capita
• Fewer park playgrounds per capita• Fewer park units per capita• Fewer recreation centers per capita• Fewer swimming pools per capita• Fewer tennis courts per capita• Lower park-related expenditures per capita
opportunitieS/ChALLenGeS
StrenGthS/AdvAntAGeS• Lower percent with asthma• Lower death rate for diabetes• More farmers’ markets per capita• Higher percent bicycling or walking to work• More golf courses per capita
• Higher level of state requirement for Physical Education classes
• Higher number of primary health care providers per capita
ranking: total Score = 51.8; rank = 21
MiLWAuKee, Wi(Milwaukee-Waukesha-West Allis, WI MSA)
CountieS Milwaukee, Ozaukee, Washington, Waukesha

65
ACSM AMeriCAn FitneSS indextM CoMponentS
Health Behaviors Percent any physical activity or exercise in the last 30 days Percent physically active at least moderatelyPercent eating 5+ servings of fruits/vegetables per dayPercent currently smoking
Chronic Health ProblemsPercent obesePercent in excellent or very good healthAny days when physical health was not good during
the past 30 daysAny days when mental health was not good during
the past 30 daysPercent with asthmaPercent with angina or coronary heart diseasePercent with diabetesDeath rate/100,000 for cardiovascular diseaseDeath rate/100,000 for diabetes
Health Care
Percent with health insurance
Built EnvironmentParkland as percent of city land areaAcres of parkland/1,000Farmers’ markets/1,000,000Percent using public transportation to workPercent bicycling or walking to work
Recreational FacilitiesBall diamonds/10,000Dog parks/10,000Park playgrounds/10,000Golf courses/100,000Park units/10,000Recreation centers/20,000Swimming pools/100,000Tennis courts/10,000
Park-related expenditures per capita
Level of state requirement for Physical Education classes**
Number of primary health care providers per 100,000
(note: most of these data were available only for the main city in the MSA)
**3 = required at three levels: high school, middle school and elementary school; 2= required at two levels; 1= required at only one level
10.6%18.914.84.3%2.8%
2.00.92.31.04.21.13.12.1
$101.5
2.5
93.2
Range of all Cities
2.5% – 25.3%2.3 – 94.11.0 – 41.0
0.4% – 30.5%1.2% – 6.7%
0.3 – 5.70.0 – 5.70.9 – 4.80.0 – 5.0
1.2 – 10.90.1 – 2.60.6 – 9.20.8 – 6.9
$12.0 – $259.0
0 – 3
46.8 – 133.7
MSA Average
U.S. Value
76.2%51.0%23.4%17.9%
26.9%56.0%35.5%
33.7%
8.8%3.8%8.3%206.722.5
85.6%
MSA Average
77.2%48.7%24.4%17.0%
25.9%56.8%35.3%
34.4%
8.3%3.6%8.3%201.021.9
86.3%
MSA Range
70.4% – 85.9%36.4% – 58.1%15.8% – 30.0%8.8% – 25.3%
18.1% – 34.3%46.4% – 66.6%29.5% – 40.3%
23.8% – 41.9%
4.5% – 11.9%2.4% – 5.6%5.4% – 11.6%131.7 – 268.6
9.9 – 31.4
77.3% – 94.4%
personal health indicators – Score = 61.0; rank = 17 Milwaukee MSA
79.3%53.0%22.9%18.9%
24.3%58.9%35.0%
33.5%
7.5%3.9%8.0%198.118.4
91.0%
Community/environmental indicators – Score = 43.3; rank = 34
Milwaukee
9.7%15.822.43.7%3.3%
1.30.41.21.61.60.31.40.9
$59
3
109.1

66
Population
Percent less than 18 years old
Percent 18 to 64 years old
Percent 65 years old and older
Percent male
Percent high school graduate or higher
Percent White
Percent Black or African American
Percent Asian
Percent Other Race
Percent Hispanic/Latino
Percent unemployed
Median household income
Percent of households below poverty level
Violent crime rate/100,000*
Percent with disability
*Due to differences in jurisdictional definitions and reporting, the FBI recommends that these rates not be compared across areas
MSA RangeU.S. Value
307,006,550
24.3%
62.8%
12.9%
49.3%
85.3%
74.8%
12.4%
4.5%
8.3%
15.8%
9.9%
$50,221
10.5%
429.4
12.0%
3,325,885
24.6%
63.6%
11.8%
49.2%
86.7%
72.3%
15.0%
5.1%
7.6%
15.1%
9.8%
$55,331
9.5%
11.0%
MSA Average
1,123,804 – 19,069,796
20.2% – 29.4%
60.5% – 66.9%
7.9% – 17.2%
48.1% – 51.1%
77.6% – 92.5%
49.8% – 88.6%
1.7% – 44.5%
1.2% – 30.2%
1.9% – 24.5%
1.2% – 53.4%
6.4% – 16.3%
$43,633 – $85,168
4.9% – 15.1%
7.4% – 14.5%
3,269,814
24.7%
64.9%
10.5%
49.7%
92.5%
83.7%
6.4%
5.3%
4.6%
4.9%
8.4%
$63,114
6.3%
N/A‡
8.7%
Minneapolis MSA
deSCription oF MinneApoLiS-St. pAuL-BLooMinGton, Mn-Wi MSA
• Fewer acres of parkland per capita• Fewer swimming pools per capita
opportunitieS/ChALLenGeS
• Lower percent unemployed• Higher median household income• Lower percentage of households below
poverty level• Higher percent of any physical activity or
exercise in the last 30 days• Higher percent physically active at
least moderately• Lower percent currently smoking• Higher percent in excellent or very good health• Lower percent with asthma• Lower percent with angina or coronary
heart disease• Lower percent with diabetes• Lower death rate for cardiovascular disease• Lower death rate for diabetes
• Higher percent of city land area as parkland• More farmers’ markets per capita• Higher percent using public transportation
to work• Higher percent bicycling or walking to work• More ball diamonds per capita• More dog parks per capita• More park playgrounds per capita• More golf courses per capita• More park units per capita• More recreation centers per capita• More tennis courts per capita• Higher park-related expenditures per capita• Higher level of state requirement for Physical
Education classes
StrenGthS/AdvAntAGeS
ranking: total Score = 77.2; rank = 1
MinneApoLiS, Mn(Minneapolis-St. Paul-Bloomington, MN-WI MSA)
CountieS Anoka MN, Carver MN, Chisago MN, Dakota MN, Hennepin MN, Isanti MN, Ramsey MN, Scott MN, Sherburne MN, Washington MN, Wright MN, Pierce WI, St. Croix WI
‡This measure was not available.

67
ACSM AMeriCAn FitneSS indextM CoMponentS
Built EnvironmentParkland as percent of city land areaAcres of parkland/1,000Farmers’ markets/1,000,000Percent using public transportation to workPercent bicycling or walking to work
Recreational FacilitiesBall diamonds/10,000Dog parks/10,000Park playgrounds/10,000Golf courses/100,000Park units/10,000Recreation centers/20,000Swimming pools/100,000Tennis courts/10,000
Park-related expenditures per capita
Level of state requirement for Physical Education classes**
Number of primary health care providers per 100,000
(note: most of these data were available only for the main city in the MSA)
**3 = required at three levels: high school, middle school and elementary school; 2= required at two levels; 1= required at only one level
MSA Average
10.6%18.914.84.3%2.8%
2.00.92.31.04.21.13.12.1
$101.5
2.5
93.2
Range of all Cities
2.5% – 25.3%2.3 – 94.11.0 – 41.0
0.4% – 30.5%1.2% – 6.7%
0.3 – 5.70.0 – 5.70.9 – 4.80.0 – 5.0
1.2 – 10.90.1 – 2.60.6 – 9.20.8 – 6.9
$12.0 – $259.0
0 – 3
46.8 – 133.7
Health Behaviors Percent any physical activity or exercise in the last 30 days Percent physically active at least moderatelyPercent eating 5+ servings of fruits/vegetables per dayPercent currently smoking
Chronic Health ProblemsPercent obesePercent in excellent or very good healthAny days when physical health was not good during
the past 30 daysAny days when mental health was not good during
the past 30 daysPercent with asthmaPercent with angina or coronary heart diseasePercent with diabetesDeath rate/100,000 for cardiovascular diseaseDeath rate/100,000 for diabetes
Health Care
Percent with health insurance
U.S. Value
76.2%51.0%23.4%17.9%
26.9%56.0%35.5%
33.7%
8.8%3.8%8.3%206.722.5
85.6%
MSA Average
77.2%48.7%24.4%17.0%
25.9%56.8%35.3%
34.4%
8.3%3.6%8.3%201.021.9
86.3%
70.4% – 85.9%36.4% – 58.1%15.8% – 30.0%8.8% – 25.3%
18.1% – 34.3%46.4% – 66.6%29.5% – 40.3%
23.8% – 41.9%
4.5% – 11.9%2.4% – 5.6%5.4% – 11.6%131.7 – 268.6
9.9 – 31.4
77.3% – 94.4%
MSA Range
personal health indicators – Score = 79.7 rank = 2Minneapolis MSA
Community/environmental indicators – Score = 74.9; rank = 2
85.9%54.5%22.5%15.3%
23.8%66.6%35.0%
34.3%
7.5%2.7%5.6%131.718.5
92.9%
Minneapolis
16.7%15.324.54.7%3.1%
5.11.32.81.85.02.61.04.7
$203
3
99.3

68
Population
Percent less than 18 years old
Percent 18 to 64 years old
Percent 65 years old and older
Percent male
Percent high school graduate or higher
Percent White
Percent Black or African American
Percent Asian
Percent Other Race
Percent Hispanic/Latino
Percent unemployed
Median household income
Percent of households below poverty level
Violent crime rate/100,000*
Percent with disability
307,006,550
24.3%
62.8%
12.9%
49.3%
85.3%
74.8%
12.4%
4.5%
8.3%
15.8%
9.9%
$50,221
10.5%
429.4
12.0%
3,325,885
24.6%
63.6%
11.8%
49.2%
86.7%
72.3%
15.0%
5.1%
7.6%
15.1%
9.8%
$55,331
9.5%
11.0%
*Due to differences in jurisdictional definitions and reporting, the FBI recommends that these rates not be compared across areas
1,123,804 – 19,069,796
20.2% – 29.4%
60.5% – 66.9%
7.9% – 17.2%
48.1% – 51.1%
77.6% – 92.5%
49.8% – 88.6%
1.7% – 44.5%
1.2% – 30.2%
1.9% – 24.5%
1.2% – 53.4%
6.4% – 16.3%
$43,633 – $85,168
4.9% – 15.1%
7.4% – 14.5%
U.S. Value MSA Average MSA Range
1,582,264
24.4%
64.8%
10.7%
49.2%
86.9%
78.9%
15.3%
2.2%
3.6%
6.0%
9.4%
$51,066
9.5%
659.4
11.1%
Nashville MSA
deSCription oF nAShviLLe-dAvidSon-MurFreeSBoro-FrAnKLin, tn MSA
• Lower percent physically active at least moderately
• Higher percent currently smoking• Higher percent with angina or coronary
heart disease• Higher death rate for cardiovascular disease• Higher death rate for diabetes• Lower percent of city land area as parkland• Fewer farmers’ markets per capita
• Lower percent using public transportation to work
• Lower percent bicycling or walking to work• Fewer ball diamonds per capita• Fewer dog parks per capita• Fewer park playgrounds per capita• Fewer park units per capita• Fewer recreation centers per capita• Fewer swimming pools per capita
opportunitieS/ChALLenGeS
• Higher percentage eating 5+ servings of fruits/vegetables per day
• Lower percent of days when mental health was not good during the past 30 days
• Lower percent with asthma
• Lower percent with diabetes• More golf courses per capita• More tennis courts per capita• Higher level of state requirement for Physical
Education classes
StrenGthS/AdvAntAGeS
ranking: total Score = 42.3; rank = 37
nAShviLLe, tn(Nashville-Davidson-Murfreesboro-Franklin, TN MSA)
CountieS Cannon, Cheatham, Davidson, Dickson, Hickman, Macon, Robertson, Rutherford, Smith, Sumner, Trousdale, Williamson, Wilson

69
ACSM AMeriCAn FitneSS indextM CoMponentS
Health Behaviors Percent any physical activity or exercise in the last 30 days Percent physically active at least moderatelyPercent eating 5+ servings of fruits/vegetables per dayPercent currently smoking
Chronic Health ProblemsPercent obesePercent in excellent or very good healthAny days when physical health was not good during
the past 30 daysAny days when mental health was not good during
the past 30 daysPercent with asthmaPercent with angina or coronary heart diseasePercent with diabetesDeath rate/100,000 for cardiovascular diseaseDeath rate/100,000 for diabetes
Health Care
Percent with health insurance
77.2%48.7%24.4%17.0%
25.9%56.8%35.3%
34.4%
8.3%3.6%8.3%201.021.9
86.3%
Built EnvironmentParkland as percent of city land areaAcres of parkland/1,000Farmers’ markets/1,000,000Percent using public transportation to workPercent bicycling or walking to work
Recreational FacilitiesBall diamonds/10,000Dog parks/10,000Park playgrounds/10,000Golf courses/100,000Park units/10,000Recreation centers/20,000Swimming pools/100,000Tennis courts/10,000
Park-related expenditures per capita
Level of state requirement for Physical Education classes**
Number of primary health care providers per 100,000
2.5% – 25.3%2.3 – 94.11.0 – 41.0
0.4% – 30.5%1.2% – 6.7%
0.3 – 5.70.0 – 5.70.9 – 4.80.0 – 5.0
1.2 – 10.90.1 – 2.60.6 – 9.20.8 – 6.9
$12.0 – $259.0
0 – 3
46.8 – 133.7
(note: most of these data were available only for the main city in the MSA)
**3 = required at three levels: high school, middle school and elementary school; 2= required at two levels; 1= required at only one level
70.4% – 85.9%36.4% – 58.1%15.8% – 30.0%8.8% – 25.3%
18.1% – 34.3%46.4% – 66.6%29.5% – 40.3%
23.8% – 41.9%
4.5% – 11.9%2.4% – 5.6%5.4% – 11.6%131.7 – 268.6
9.9 – 31.4
77.3% – 94.4%
MSA Average MSA Range
MSA Average Range of all Cities
10.6%18.914.84.3%2.8%
2.00.92.31.04.21.13.12.1
$101.5
2.5
93.2
76.2%51.0%23.4%17.9%
26.9%56.0%35.5%
33.7%
8.8%3.8%8.3%206.722.5
85.6%
U.S. Value
personal health indicators – Score = 42.5; rank = 35 Nashville MSA
Community/environmental indicators – Score = 42.0; rank = 36
72.0%40.2%27.7%21.8%
27.1%57.2%36.9%
27.3%
6.5%4.1%6.5%227.124.8
84.7%
Nashville
3.4%18.18.8
1.2%1.2%
1.50.51.91.21.90.92.52.9
$93
3
90.0

70
Population
Percent less than 18 years old
Percent 18 to 64 years old
Percent 65 years old and older
Percent male
Percent high school graduate or higher
Percent White
Percent Black or African American
Percent Asian
Percent Other Race
Percent Hispanic/Latino
Percent unemployed
Median household income
Percent of households below poverty level
Violent crime rate/100,000*
Percent with disability
*Due to differences in jurisdictional definitions and reporting, the FBI recommends that these rates not be compared across areas
1,123,804 – 19,069,796
20.2% – 29.4%
60.5% – 66.9%
7.9% – 17.2%
48.1% – 51.1%
77.6% – 92.5%
49.8% – 88.6%
1.7% – 44.5%
1.2% – 30.2%
1.9% – 24.5%
1.2% – 53.4%
6.4% – 16.3%
$43,633 – $85,168
4.9% – 15.1%
7.4% – 14.5%
MSA RangeU.S. Value MSA Average
3,325,885
24.6%
63.6%
11.8%
49.2%
86.7%
72.3%
15.0%
5.1%
7.6%
15.1%
9.8%
$55,331
9.5%
11.0%
307,006,550
24.3%
62.8%
12.9%
49.3%
85.3%
74.8%
12.4%
4.5%
8.3%
15.8%
9.9%
$50,221
10.5%
429.4
12.0%
1,189,981
23.7%
64.0%
12.3%
48.1%
84.7%
58.7%
34.8%
2.8%
3.7%
6.6%
9.1%
$46,219
11.6%
547.7
13.3%
New Orleans MSA
deSCription oF neW orLeAnS-MetAirie-Kenner, LA MSA
• Lower median household income• Higher percentage of households below
poverty level• Lower percentage eating 5+ servings of
fruits/vegetables per day• Higher percent currently smoking• Higher percent obese• Lower percent in excellent or very good health• Higher percent with angina or coronary
heart disease
• Higher percent with diabetes• Higher death rate for diabetes• Fewer farmers’ markets per capita• Lower percent using public transportation
to work• Few ball diamonds per capita• Fewer dog parks per capita• Fewer recreation centers per capita• Fewer tennis courts per capita
opportunitieS/ChALLenGeS
• Lower percent with asthma• Higher percent of city land area as parkland• More acres of parkland per capita• Higher percent bicycling or walking to work• More park playgrounds per capita• More golf courses per capita
• More park units per capita• More swimming pools per capita• Higher park-related expenditures per capita• Higher level of state requirement for Physical
Education classes
StrenGthS/AdvAntAGeS
ranking: total Score = 43.9; rank = 34
neW orLeAnS, LA (New Orleans-Metairie-Kenner, LA MSA)
CountieS Jefferson, Orleans, Plaquemines, St. Bernard, St. Charles, St. John the Baptist, St. Tammany

71
ACSM AMeriCAn FitneSS indextM CoMponentS
Health Behaviors Percent any physical activity or exercise in the last 30 days Percent physically active at least moderatelyPercent eating 5+ servings of fruits/vegetables per dayPercent currently smoking
Chronic Health ProblemsPercent obesePercent in excellent or very good healthAny days when physical health was not good during
the past 30 daysAny days when mental health was not good during
the past 30 daysPercent with asthmaPercent with angina or coronary heart diseasePercent with diabetesDeath rate/100,000 for cardiovascular diseaseDeath rate/100,000 for diabetes
Health Care
Percent with health insurance
Built EnvironmentParkland as percent of city land areaAcres of parkland/1,000Farmers’ markets/1,000,000Percent using public transportation to workPercent bicycling or walking to work
Recreational FacilitiesBall diamonds/10,000Dog parks/10,000Park playgrounds/10,000Golf courses/100,000Park units/10,000Recreation centers/20,000Swimming pools/100,000Tennis courts/10,000
Park-related expenditures per capita
Level of state requirement for Physical Education classes**
Number of primary health care providers per 100,000
(note: most of these data were available only for the main city in the MSA)
**3 = required at three levels: high school, middle school and elementary school; 2= required at two levels; 1= required at only one level
10.6%18.914.84.3%2.8%
2.00.92.31.04.21.13.12.1
$101.5
2.5
93.2
MSA Average Range of all Cities
2.5% – 25.3%2.3 – 94.11.0 – 41.0
0.4% – 30.5%1.2% – 6.7%
0.3 – 5.70.0 – 5.70.9 – 4.80.0 – 5.0
1.2 – 10.90.1 – 2.60.6 – 9.20.8 – 6.9
$12.0 – $259.0
0 – 3
46.8 – 133.7
U.S. Value
76.2%51.0%23.4%17.9%
26.9%56.0%35.5%
33.7%
8.8%3.8%8.3%206.722.5
85.6%
MSA Average
77.2%48.7%24.4%17.0%
25.9%56.8%35.3%
34.4%
8.3%3.6%8.3%201.021.9
86.3%
MSA Range
70.4% – 85.9%36.4% – 58.1%15.8% – 30.0%8.8% – 25.3%
18.1% – 34.3%46.4% – 66.6%29.5% – 40.3%
23.8% – 41.9%
4.5% – 11.9%2.4% – 5.6%5.4% – 11.6%131.7 – 268.6
9.9 – 31.4
77.3% – 94.4%
personal health indicators – Score = 22.0; rank = 47 New Orleans MSA
Community/environmental indicators – Score = 64.1; rank = 9
72.4%44.3%19.3%20.6%
28.8%49.9%38.5%
34.1%
4.7%5.6%9.7%218.129.7
83.9%
New Orleans
25.3%94.18.4
2.7%3.5%
0.30.33.01.96.30.33.51.6
$205
3
98.8

72
Population
Percent less than 18 years old
Percent 18 to 64 years old
Percent 65 years old and older
Percent male
Percent high school graduate or higher
Percent White
Percent Black or African American
Percent Asian
Percent Other Race
Percent Hispanic/Latino
Percent unemployed
Median household income
Percent of households below poverty level
Violent crime rate/100,000*
Percent with disability
307,006,550
24.3%
62.8%
12.9%
49.3%
85.3%
74.8%
12.4%
4.5%
8.3%
15.8%
9.9%
$50,221
10.5%
429.4
12.0%
3,325,885
24.6%
63.6%
11.8%
49.2%
86.7%
72.3%
15.0%
5.1%
7.6%
15.1%
9.8%
$55,331
9.5%
11.0%
*Due to differences in jurisdictional definitions and reporting, the FBI recommends that these rates not be compared across areas
1,123,804 – 19,069,796
20.2% – 29.4%
60.5% – 66.9%
7.9% – 17.2%
48.1% – 51.1%
77.6% – 92.5%
49.8% – 88.6%
1.7% – 44.5%
1.2% – 30.2%
1.9% – 24.5%
1.2% – 53.4%
6.4% – 16.3%
$43,633 – $85,168
4.9% – 15.1%
7.4% – 14.5%
U.S. Value MSA Average MSA Range
19,069,796
23.2%
63.8%
13.0%
48.5%
84.3%
61.3%
17.7%
9.5%
11.5%
21.8%
9.3%
$62,887
10.0%
381.9
9.9%
New York MSA
deSCription oF neW yorK-northern neW jerSey-LonG iSLAnd, ny-nj-pA MSA
• Lower percent physically active at least moderately
• Higher death rate for cardiovascular disease• Fewer acres of parkland per capita• Fewer farmers’ markets per capita• Fewer ball diamonds per capita
• Fewer park playgrounds per capita• Fewer golf courses per capita• Fewer recreation centers per capita• Fewer swimming pools per capita• Fewer tennis courts per capita
opportunitieS/ChALLenGeS
• Higher median household income• Lower percent obese• Lower death rate for diabetes• Higher percent of city land area as parkland • Higher percent using public transportation
to work• Higher percent bicycling or walking to work
• More dog parks per capita• More park units per capita• Higher park-related expenditures per capita• Higher level of state requirement for Physical
Education classes• Higher number of primary health care providers
per capita
StrenGthS/AdvAntAGeS
ranking: total Score = 48.3; rank = 30
neW yorK, ny(New York-Northern New Jersey-Long Island, NY-NJ-PA MSA)
CountieS Middlesex NJ, Monmouth NJ, Ocean NJ, Somerset NJ, Essex NJ, Hunterdon NJ, Morris NJ, Sussex NJ, Union NJ, Bergen NJ, Hudson NJ, Passaic NJ, Nassau NY, Suffolk NY, Bronx NY, Kings NY, New York NY, Putnam NY, Queens NY, Richmond NY, Rockland NY, Westchester NY, Pike PA

73
ACSM AMeriCAn FitneSS indextM CoMponentS
Health Behaviors Percent any physical activity or exercise in the last 30 days Percent physically active at least moderatelyPercent eating 5+ servings of fruits/vegetables per dayPercent currently smoking
Chronic Health ProblemsPercent obesePercent in excellent or very good healthAny days when physical health was not good during
the past 30 daysAny days when mental health was not good during
the past 30 daysPercent with asthmaPercent with angina or coronary heart diseasePercent with diabetesDeath rate/100,000 for cardiovascular diseaseDeath rate/100,000 for diabetes
Health Care
Percent with health insurance
76.2%51.0%23.4%17.9%
26.9%56.0%35.5%
33.7%
8.8%3.8%8.3%206.722.5
85.6%
77.2%48.7%24.4%17.0%
25.9%56.8%35.3%
34.4%
8.3%3.6%8.3%201.021.9
86.3%
Built EnvironmentParkland as percent of city land areaAcres of parkland/1,000Farmers’ markets/1,000,000Percent using public transportation to workPercent bicycling or walking to work
Recreational FacilitiesBall diamonds/10,000Dog parks/10,000Park playgrounds/10,000Golf courses/100,000Park units/10,000Recreation centers/20,000Swimming pools/100,000Tennis courts/10,000
Park-related expenditures per capita
Level of state requirement for Physical Education classes**
Number of primary health care providers per 100,000
2.5% – 25.3%2.3 – 94.11.0 – 41.0
0.4% – 30.5%1.2% – 6.7%
0.3 – 5.70.0 – 5.70.9 – 4.80.0 – 5.0
1.2 – 10.90.1 – 2.60.6 – 9.20.8 – 6.9
$12.0 – $259.0
0 – 3
46.8 – 133.7
(note: most of these data were available only for the main city in the MSA)
**3 = required at three levels: high school, middle school and elementary school; 2= required at two levels; 1= required at only one level
70.4% – 85.9%36.4% – 58.1%15.8% – 30.0%8.8% – 25.3%
18.1% – 34.3%46.4% – 66.6%29.5% – 40.3%
23.8% – 41.9%
4.5% – 11.9%2.4% – 5.6%5.4% – 11.6%131.7 – 268.6
9.9 – 31.4
77.3% – 94.4%
U.S. Value MSA Average MSA Range
MSA Average Range of all Cities
10.6%18.914.84.3%2.8%
2.00.92.31.04.21.13.12.1
$101.5
2.5
93.2
personal health indicators – Score = 47.0; rank = 26 New York MSA
Community/environmental indicators – Score = 49.5; rank = 30
72.9%43.2%24.9%15.4%
21.3%54.1%35.5%
33.2%
8.2%3.6%8.9%234.519.0
86.2%
New York
19.5%4.5
12.630.5%6.7%
0.91.61.20.25.00.10.90.9
$157
3
128.7

74
Population
Percent less than 18 years old
Percent 18 to 64 years old
Percent 65 years old and older
Percent male
Percent high school graduate or higher
Percent White
Percent Black or African American
Percent Asian
Percent Other Race
Percent Hispanic/Latino
Percent unemployed
Median household income
Percent of households below poverty level
Violent crime rate/100,000*
Percent with disability
*Due to differences in jurisdictional definitions and reporting, the FBI recommends that these rates not be compared across areas
U.S. Value
307,006,550
24.3%
62.8%
12.9%
49.3%
85.3%
74.8%
12.4%
4.5%
8.3%
15.8%
9.9%
$50,221
10.5%
429.4
12.0%
MSA Average
3,325,885
24.6%
63.6%
11.8%
49.2%
86.7%
72.3%
15.0%
5.1%
7.6%
15.1%
9.8%
$55,331
9.5%
11.0%
MSA Range
1,123,804 – 19,069,796
20.2% – 29.4%
60.5% – 66.9%
7.9% – 17.2%
48.1% – 51.1%
77.6% – 92.5%
49.8% – 88.6%
1.7% – 44.5%
1.2% – 30.2%
1.9% – 24.5%
1.2% – 53.4%
6.4% – 16.3%
$43,633 – $85,168
4.9% – 15.1%
7.4% – 14.5%
1,227,278
24.9%
63.1%
11.9%
49.2%
87.2%
75.2%
10.1%
2.7%
12.0%
10.1%
6.4%
$45,109
11.2%
N/A‡
13.6%
Oklahoma City MSA
deSCription oF oKLAhoMA City, oK MSA
• Lower median household income• Higher percentage of households below
poverty level• Lower percentage eating 5+ servings of
fruits/vegetables per day • Higher percent currently smoking• Higher percent obese• Higher percent with asthma• Higher percent with angina or coronary
heart disease• Higher percent with diabetes• Higher death rate for cardiovascular disease• Higher death rate for diabetes• Lower percent of city land area as parkland• Fewer farmers’ markets per capita
• Lower percent using public transportation to work
• Lower percent bicycling or walking to work• Fewer ball diamonds per capita• Fewer dog parks per capita• Fewer golf courses per capita• Fewer park units per capita• Fewer recreation centers per capita• Fewer swimming pools per capita• Fewer tennis courts per capita• Lower park-related expenditures per capita• Lower level of state requirement for Physical
Education classes• Lower number of primary health care providers
per capita
opportunitieS/ChALLenGeS
• Lower percent unemployed• More acres of parkland per capita
StrenGthS/AdvAntAGeS
ranking: total Score = 24.6; rank = 50
oKLAhoMA City, oK(Oklahoma City, OK MSA)
CountieS Canadian, Cleveland, Grady, Lincoln, Logan, McClain, Oklahoma
‡This measure was not available.

75
ACSM AMeriCAn FitneSS indextM CoMponentS
Health Behaviors Percent any physical activity or exercise in the last 30 days Percent physically active at least moderatelyPercent eating 5+ servings of fruits/vegetables per dayPercent currently smoking
Chronic Health ProblemsPercent obesePercent in excellent or very good healthAny days when physical health was not good during
the past 30 daysAny days when mental health was not good during
the past 30 daysPercent with asthmaPercent with angina or coronary heart diseasePercent with diabetesDeath rate/100,000 for cardiovascular diseaseDeath rate/100,000 for diabetes
Health Care
Percent with health insurance
Built EnvironmentParkland as percent of city land areaAcres of parkland/1,000Farmers’ markets/1,000,000Percent using public transportation to workPercent bicycling or walking to work
Recreational FacilitiesBall diamonds/10,000Dog parks/10,000Park playgrounds/10,000Golf courses/100,000Park units/10,000Recreation centers/20,000Swimming pools/100,000Tennis courts/10,000
Park-related expenditures per capita
Level of state requirement for Physical Education classes**
Number of primary health care providers per 100,000
(note: most of these data were available only for the main city in the MSA)
**3 = required at three levels: high school, middle school and elementary school; 2= required at two levels; 1= required at only one level
MSA Average
10.6%18.914.84.3%2.8%
2.00.92.31.04.21.13.12.1
$101.5
2.5
93.2
Range of all Cities
2.5% – 25.3%2.3 – 94.11.0 – 41.0
0.4% – 30.5%1.2% – 6.7%
0.3 – 5.70.0 – 5.70.9 – 4.80.0 – 5.0
1.2 – 10.90.1 – 2.60.6 – 9.20.8 – 6.9
$12.0 – $259.0
0 – 3
46.8 – 133.7
U.S. Value
76.2%51.0%23.4%17.9%
26.9%56.0%35.5%
33.7%
8.8%3.8%8.3%206.722.5
85.6%
MSA Average
77.2%48.7%24.4%17.0%
25.9%56.8%35.3%
34.4%
8.3%3.6%8.3%201.021.9
86.3%
MSA Range
70.4% – 85.9%36.4% – 58.1%15.8% – 30.0%8.8% – 25.3%
18.1% – 34.3%46.4% – 66.6%29.5% – 40.3%
23.8% – 41.9%
4.5% – 11.9%2.4% – 5.6%5.4% – 11.6%131.7 – 268.6
9.9 – 31.4
77.3% – 94.4%
Oklahoma City MSA
personal health indicators – Score = 15.6; rank = 50
Community/environmental indicators – Score = 32.9; rank = 46
70.4%46.2%15.8%22.8%
28.6%52.1%35.3%
35.8%
10.0%5.0%
10.1%237.026.9
79.7%
Oklahoma City
5.6%39.611.40.4%1.9%
0.40.22.20.92.70.81.81.4
$58
0
79.8

76
Population
Percent less than 18 years old
Percent 18 to 64 years old
Percent 65 years old and older
Percent male
Percent high school graduate or higher
Percent White
Percent Black or African American
Percent Asian
Percent Other Race
Percent Hispanic/Latino
Percent unemployed
Median household income
Percent of households below poverty level
Violent crime rate/100,000*
Percent with disability
307,006,550
24.3%
62.8%
12.9%
49.3%
85.3%
74.8%
12.4%
4.5%
8.3%
15.8%
9.9%
$50,221
10.5%
429.4
12.0%
3,325,885
24.6%
63.6%
11.8%
49.2%
86.7%
72.3%
15.0%
5.1%
7.6%
15.1%
9.8%
$55,331
9.5%
11.0%
*Due to differences in jurisdictional definitions and reporting, the FBI recommends that these rates not be compared across areas
1,123,804 – 19,069,796
20.2% – 29.4%
60.5% – 66.9%
7.9% – 17.2%
48.1% – 51.1%
77.6% – 92.5%
49.8% – 88.6%
1.7% – 44.5%
1.2% – 30.2%
1.9% – 24.5%
1.2% – 53.4%
6.4% – 16.3%
$43,633 – $85,168
4.9% – 15.1%
7.4% – 14.5%
U.S. Value MSA Average MSA Range
2,082,421
23.8%
62.8%
13.4%
49.5%
87.4%
73.6%
15.3%
3.8%
7.3%
23.8%
12.6%
$46,946
9.8%
682.8
11.3%
Orlando MSA
deSCription oF orLAndo-KiSSiMMee, FL MSA
• Higher percent unemployed• Lower median household income• Higher percent with diabetes• Lower percent of city land area as parkland• Fewer acres of parkland per capita• Fewer farmers’ markets per capita• Lower percent using public transportation
to work
• Lower percent bicycling or walking to work• Fewer ball diamonds per capita• Fewer dog parks per capita• Fewer golf courses per capita• Lower level of state requirement for Physical
Education classes• Lower number of primary health care providers
per capita
opportunitieS/ChALLenGeS
• Lower percent currently smoking• Lower percent of days when physical health
was not good during the past 30 days• Lower percent of days when mental health
was not good during the past 30 days
• Lower percent with asthma• Lower death rate for cardiovascular disease• More park units per capita• More recreation centers per capita• More swimming pools per capita
StrenGthS/AdvAntAGeS
ranking: total Score = 48.6; rank = 29
orLAndo, FL(Orlando-Kissimmee, FL MSA)
CountieS Lake, Orange, Osceola, Seminole

77
ACSM AMeriCAn FitneSS indextM CoMponentS
Health Behaviors Percent any physical activity or exercise in the last 30 days Percent physically active at least moderatelyPercent eating 5+ servings of fruits/vegetables per dayPercent currently smoking
Chronic Health ProblemsPercent obesePercent in excellent or very good healthAny days when physical health was not good during
the past 30 daysAny days when mental health was not good during
the past 30 daysPercent with asthmaPercent with angina or coronary heart diseasePercent with diabetesDeath rate/100,000 for cardiovascular diseaseDeath rate/100,000 for diabetes
Health Care
Percent with health insurance
76.2%51.0%23.4%17.9%
26.9%56.0%35.5%
33.7%
8.8%3.8%8.3%206.722.5
85.6%
77.2%48.7%24.4%17.0%
25.9%56.8%35.3%
34.4%
8.3%3.6%8.3%201.021.9
86.3%
Built EnvironmentParkland as percent of city land areaAcres of parkland/1,000Farmers’ markets/1,000,000Percent using public transportation to workPercent bicycling or walking to work
Recreational FacilitiesBall diamonds/10,000Dog parks/10,000Park playgrounds/10,000Golf courses/100,000Park units/10,000Recreation centers/20,000Swimming pools/100,000Tennis courts/10,000
Park-related expenditures per capita
Level of state requirement for Physical Education classes**
Number of primary health care providers per 100,000
2.5% – 25.3%2.3 – 94.11.0 – 41.0
0.4% – 30.5%1.2% – 6.7%
0.3 – 5.70.0 – 5.70.9 – 4.80.0 – 5.0
1.2 – 10.90.1 – 2.60.6 – 9.20.8 – 6.9
$12.0 – $259.0
0 – 3
46.8 – 133.7
(note: most of these data were available only for the main city in the MSA)
**3 = required at three levels: high school, middle school and elementary school; 2= required at two levels; 1= required at only one level
70.4% – 85.9%36.4% – 58.1%15.8% – 30.0%8.8% – 25.3%
18.1% – 34.3%46.4% – 66.6%29.5% – 40.3%
23.8% – 41.9%
4.5% – 11.9%2.4% – 5.6%5.4% – 11.6%131.7 – 268.6
9.9 – 31.4
77.3% – 94.4%
U.S. Value MSA Average MSA Range
MSA Average Range of all Cities
10.6%18.914.84.3%2.8%
2.00.92.31.04.21.13.12.1
$101.5
2.5
93.2
personal health indicators – Score = 56.5; rank = 20 Orlando MSA
76.0%46.2%26.6%14.3%
24.7%56.6%29.9%
24.1%
6.0%3.5%9.9%163.020.1
79.3%
Community/environmental indicators – Score = 41.4; rank = 37
Orlando
4.9%12.85.3
1.8%1.4%
1.70.02.10.45.01.84.81.9
$107
1
76.5

78
Population
Percent less than 18 years old
Percent 18 to 64 years old
Percent 65 years old and older
Percent male
Percent high school graduate or higher
Percent White
Percent Black or African American
Percent Asian
Percent Other Race
Percent Hispanic/Latino
Percent unemployed
Median household income
Percent of households below poverty level
Violent crime rate/100,000*
Percent with disability
*Due to differences in jurisdictional definitions and reporting, the FBI recommends that these rates not be compared across areas
U.S. Value
307,006,550
24.3%
62.8%
12.9%
49.3%
85.3%
74.8%
12.4%
4.5%
8.3%
15.8%
9.9%
$50,221
10.5%
429.4
12.0%
MSA Average
3,325,885
24.6%
63.6%
11.8%
49.2%
86.7%
72.3%
15.0%
5.1%
7.6%
15.1%
9.8%
$55,331
9.5%
11.0%
MSA Range
1,123,804 – 19,069,796
20.2% – 29.4%
60.5% – 66.9%
7.9% – 17.2%
48.1% – 51.1%
77.6% – 92.5%
49.8% – 88.6%
1.7% – 44.5%
1.2% – 30.2%
1.9% – 24.5%
1.2% – 53.4%
6.4% – 16.3%
$43,633 – $85,168
4.9% – 15.1%
7.4% – 14.5%
phiLAdeLphiA, pA(Philadelphia-Camden-Wilmington, PA-NJ-DE-MD MSA)
CountieS Burlington NJ, Camden NJ, Gloucester NJ, Salem NJ, Bucks PA, Chester PA, Delaware PA, Montgomery PA, Philadelphia PA, New Castle DE, Cecil MD
ranking: total Score = 49.3; rank = 27
StrenGthS/AdvAntAGeS• Lower percentage of households below
poverty level• Higher percent of city land area as parkland • Higher percent using public transportation
to work• Higher percent bicycling or walking to work• More ball diamonds per capita
• More recreation centers per capita• More swimming pools per capita• Higher level of state requirement for Physical
Education classes• Higher number of primary health care providers
per capita
opportunitieS/ChALLenGeS• Higher percent currently smoking• Higher percent with asthma• Fewer acres of parkland per capita• Fewer dog parks per capita
• Fewer park playgrounds per capita• Fewer golf courses per capita• Fewer park units per capita• Lower park-related expenditures per capita
deSCription oF phiLAdeLphiA-CAMden-WiLMinGton, pA-nj-de-Md MSAPhiladelphia MSA
5,968,252
23.4%
63.3%
13.3%
48.4%
88.2%
70.4%
20.5%
4.5%
4.6%
7.1%
9.9%
$60,065
8.4%
575.6
12.0%

79
ACSM AMeriCAn FitneSS indextM CoMponentS
Health Behaviors Percent any physical activity or exercise in the last 30 days Percent physically active at least moderatelyPercent eating 5+ servings of fruits/vegetables per dayPercent currently smoking
Chronic Health ProblemsPercent obesePercent in excellent or very good healthAny days when physical health was not good during
the past 30 daysAny days when mental health was not good during
the past 30 daysPercent with asthmaPercent with angina or coronary heart diseasePercent with diabetesDeath rate/100,000 for cardiovascular diseaseDeath rate/100,000 for diabetes
Health Care
Percent with health insurance
Built EnvironmentParkland as percent of city land areaAcres of parkland/1,000Farmers’ markets/1,000,000Percent using public transportation to workPercent bicycling or walking to work
Recreational FacilitiesBall diamonds/10,000Dog parks/10,000Park playgrounds/10,000Golf courses/100,000Park units/10,000Recreation centers/20,000Swimming pools/100,000Tennis courts/10,000
Park-related expenditures per capita
Level of state requirement for Physical Education classes**
Number of primary health care providers per 100,000
(note: most of these data were available only for the main city in the MSA)
**3 = required at three levels: high school, middle school and elementary school; 2= required at two levels; 1= required at only one level
Range of all Cities
2.5% – 25.3%2.3 – 94.11.0 – 41.0
0.4% – 30.5%1.2% – 6.7%
0.3 – 5.70.0 – 5.70.9 – 4.80.0 – 5.0
1.2 – 10.90.1 – 2.60.6 – 9.20.8 – 6.9
$12.0 – $259.0
0 – 3
46.8 – 133.7
10.6%18.914.84.3%2.8%
2.00.92.31.04.21.13.12.1
$101.5
2.5
93.2
MSA Average
U.S. Value
76.2%51.0%23.4%17.9%
26.9%56.0%35.5%
33.7%
8.8%3.8%8.3%206.722.5
85.6%
MSA Average
77.2%48.7%24.4%17.0%
25.9%56.8%35.3%
34.4%
8.3%3.6%8.3%201.021.9
86.3%
MSA Range
70.4% – 85.9%36.4% – 58.1%15.8% – 30.0%8.8% – 25.3%
18.1% – 34.3%46.4% – 66.6%29.5% – 40.3%
23.8% – 41.9%
4.5% – 11.9%2.4% – 5.6%5.4% – 11.6%131.7 – 268.6
9.9 – 31.4
77.3% – 94.4%
personal health indicators – Score = 42.9; rank = 33 Philadelphia MSA
75.6%43.9%24.9%19.3%
25.3%55.5%36.2%
34.0%
10.1%3.8%8.5%213.220.3
90.8%
Community/environmental indicators – Score = 55.1; rank = 20
Philadelphia
12.6%7.1
13.49.3%4.5%
2.70.31.60.42.02.15.51.9
$65
3
120.3

80
Population
Percent less than 18 years old
Percent 18 to 64 years old
Percent 65 years old and older
Percent male
Percent high school graduate or higher
Percent White
Percent Black or African American
Percent Asian
Percent Other Race
Percent Hispanic/Latino
Percent unemployed
Median household income
Percent of households below poverty level
Violent crime rate/100,000*
Percent with disability
307,006,550
24.3%
62.8%
12.9%
49.3%
85.3%
74.8%
12.4%
4.5%
8.3%
15.8%
9.9%
$50,221
10.5%
429.4
12.0%
3,325,885
24.6%
63.6%
11.8%
49.2%
86.7%
72.3%
15.0%
5.1%
7.6%
15.1%
9.8%
$55,331
9.5%
11.0%
*Due to differences in jurisdictional definitions and reporting, the FBI recommends that these rates not be compared across areas
1,123,804 – 19,069,796
20.2% – 29.4%
60.5% – 66.9%
7.9% – 17.2%
48.1% – 51.1%
77.6% – 92.5%
49.8% – 88.6%
1.7% – 44.5%
1.2% – 30.2%
1.9% – 24.5%
1.2% – 53.4%
6.4% – 16.3%
$43,633 – $85,168
4.9% – 15.1%
7.4% – 14.5%
U.S. Value MSA Average MSA Range
4,364,094
27.2%
61.4%
11.4%
50.6%
84.6%
81.5%
4.5%
3.0%
10.9%
31.7%
10.3%
$52,796
10.7%
393.7
9.8%
Phoenix MSA
deSCription oF phoenix-MeSA-SCottSdALe, AZ MSA
• Higher percentage of households below poverty level
• Higher percent with asthma• Fewer farmers’ markets per capita• Lower percent using public transportation
to work• Fewer ball diamonds per capita• Fewer dog parks per capita• Fewer park playgrounds per capita
• Fewer golf courses per capita• Fewer park units per capita• Fewer recreation centers per capita• Fewer swimming pools per capita• Fewer tennis courts per capita• Lower level of state requirement for Physical
Education classes• Lower number of primary health care providers
per capita
opportunitieS/ChALLenGeS
• Lower percent currently smoking• Lower percent with angina or coronary
heart disease• Lower death rate for cardiovascular disease
• Lower death rate for diabetes• Higher percent of city land area as parkland• More acres of parkland per capita• Higher park-related expenditures per capita
StrenGthS/AdvAntAGeS
ranking: total Score = 45.3; rank = 32
phoenix, AZ(Phoenix-Mesa-Scottsdale, AZ MSA)
CountieS Maricopa, Pinal
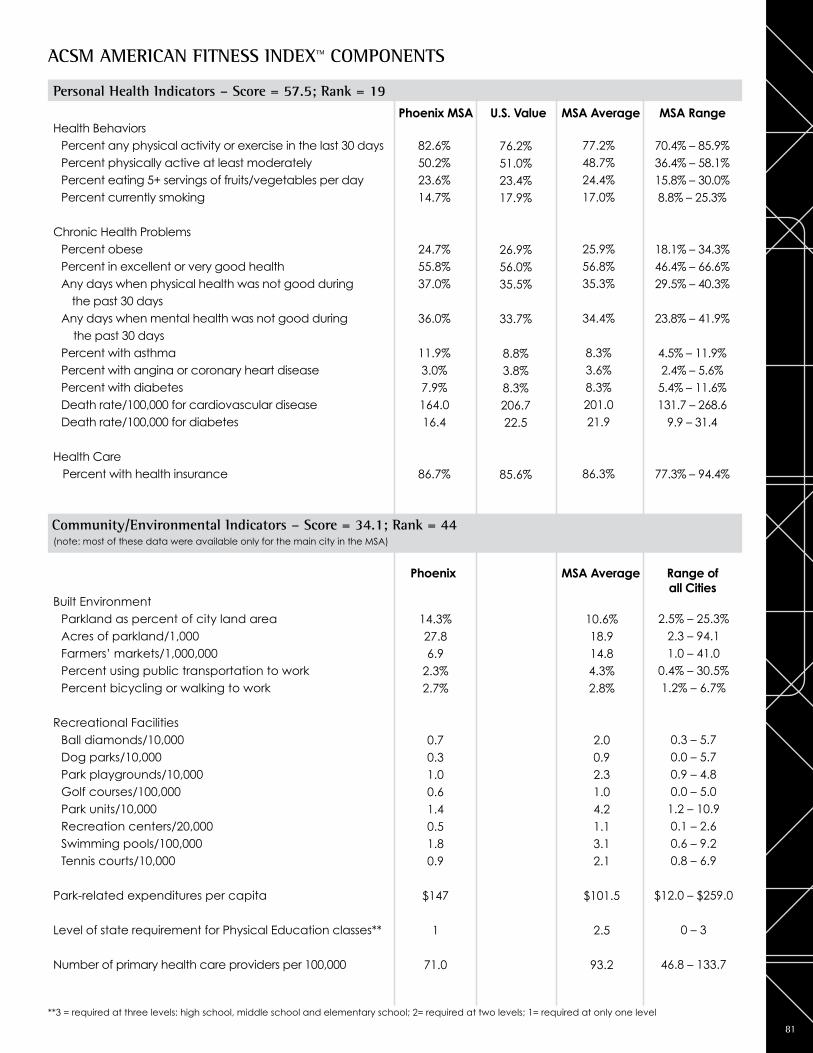
81
ACSM AMeriCAn FitneSS indextM CoMponentS
Health Behaviors Percent any physical activity or exercise in the last 30 days Percent physically active at least moderatelyPercent eating 5+ servings of fruits/vegetables per dayPercent currently smoking
Chronic Health ProblemsPercent obesePercent in excellent or very good healthAny days when physical health was not good during
the past 30 daysAny days when mental health was not good during
the past 30 daysPercent with asthmaPercent with angina or coronary heart diseasePercent with diabetesDeath rate/100,000 for cardiovascular diseaseDeath rate/100,000 for diabetes
Health Care
Percent with health insurance
76.2%51.0%23.4%17.9%
26.9%56.0%35.5%
33.7%
8.8%3.8%8.3%206.722.5
85.6%
77.2%48.7%24.4%17.0%
25.9%56.8%35.3%
34.4%
8.3%3.6%8.3%201.021.9
86.3%
Built EnvironmentParkland as percent of city land areaAcres of parkland/1,000Farmers’ markets/1,000,000Percent using public transportation to workPercent bicycling or walking to work
Recreational FacilitiesBall diamonds/10,000Dog parks/10,000Park playgrounds/10,000Golf courses/100,000Park units/10,000Recreation centers/20,000Swimming pools/100,000Tennis courts/10,000
Park-related expenditures per capita
Level of state requirement for Physical Education classes**
Number of primary health care providers per 100,000
2.5% – 25.3%2.3 – 94.11.0 – 41.0
0.4% – 30.5%1.2% – 6.7%
0.3 – 5.70.0 – 5.70.9 – 4.80.0 – 5.0
1.2 – 10.90.1 – 2.60.6 – 9.20.8 – 6.9
$12.0 – $259.0
0 – 3
46.8 – 133.7
(note: most of these data were available only for the main city in the MSA)
**3 = required at three levels: high school, middle school and elementary school; 2= required at two levels; 1= required at only one level
70.4% – 85.9%36.4% – 58.1%15.8% – 30.0%8.8% – 25.3%
18.1% – 34.3%46.4% – 66.6%29.5% – 40.3%
23.8% – 41.9%
4.5% – 11.9%2.4% – 5.6%5.4% – 11.6%131.7 – 268.6
9.9 – 31.4
77.3% – 94.4%
U.S. Value MSA Average MSA Range
MSA Average Range of all Cities
10.6%18.914.84.3%2.8%
2.00.92.31.04.21.13.12.1
$101.5
2.5
93.2
personal health indicators – Score = 57.5; rank = 19 Phoenix MSA
82.6%50.2%23.6%14.7%
24.7%55.8%37.0%
36.0%
11.9%3.0%7.9%164.016.4
86.7%
Community/environmental indicators – Score = 34.1; rank = 44
Phoenix
14.3%27.86.9
2.3%2.7%
0.70.31.00.61.40.51.80.9
$147
1
71.0

82
Population
Percent less than 18 years old
Percent 18 to 64 years old
Percent 65 years old and older
Percent male
Percent high school graduate or higher
Percent White
Percent Black or African American
Percent Asian
Percent Other Race
Percent Hispanic/Latino
Percent unemployed
Median household income
Percent of households below poverty level
Violent crime rate/100,000*
Percent with disability
307,006,550
24.3%
62.8%
12.9%
49.3%
85.3%
74.8%
12.4%
4.5%
8.3%
15.8%
9.9%
$50,221
10.5%
429.4
12.0%
3,325,885
24.6%
63.6%
11.8%
49.2%
86.7%
72.3%
15.0%
5.1%
7.6%
15.1%
9.8%
$55,331
9.5%
11.0%
*Due to differences in jurisdictional definitions and reporting, the FBI recommends that these rates not be compared across areas
1,123,804 – 19,069,796
20.2% – 29.4%
60.5% – 66.9%
7.9% – 17.2%
48.1% – 51.1%
77.6% – 92.5%
49.8% – 88.6%
1.7% – 44.5%
1.2% – 30.2%
1.9% – 24.5%
1.2% – 53.4%
6.4% – 16.3%
$43,633 – $85,168
4.9% – 15.1%
7.4% – 14.5%
U.S. Value MSA Average MSA Range
pittSBurGh, pA(Pittsburgh, PA MSA)
CountieS Allegheny, Armstrong, Beaver, Butler, Fayette, Washington, Westmoreland
ranking: total Score = 55.5; rank = 17
StrenGthS/AdvAntAGeS• Lower percent unemployed• Higher percent using public transportation
to work• Higher percent bicycling or walking to work• More ball diamonds per capita• More dog parks per capita• More park playgrounds per capita• More park units per capita
• More recreation centers per capita• More swimming pools per capita• More tennis courts per capita• Higher level of state requirement for Physical
Education classes• Higher number of primary health care providers
per capita
opportunitieS/ChALLenGeS• Lower median household income• Higher percent with angina or coronary heart
disease• Higher percent with diabetes• Higher death rate for cardiovascular disease
• Lower percent of city land area as parkland• Fewer acres of parkland per capita• Fewer golf courses per capita• Lower park-related expenditures per capita
deSCription oF pittSBurGh, pA MSAPittsburgh MSA
2,354,957
20.2%
62.5%
17.2%
48.2%
91.0%
88.6%
7.9%
1.5%
1.9%
1.2%
8.3%
$46,349
8.8%
342.9
14.0%

83
ACSM AMeriCAn FitneSS indextM CoMponentS
Health Behaviors Percent any physical activity or exercise in the last 30 days Percent physically active at least moderatelyPercent eating 5+ servings of fruits/vegetables per dayPercent currently smoking
Chronic Health ProblemsPercent obesePercent in excellent or very good healthAny days when physical health was not good during
the past 30 daysAny days when mental health was not good during
the past 30 daysPercent with asthmaPercent with angina or coronary heart diseasePercent with diabetesDeath rate/100,000 for cardiovascular diseaseDeath rate/100,000 for diabetes
Health Care
Percent with health insurance
77.2%48.7%24.4%17.0%
25.9%56.8%35.3%
34.4%
8.3%3.6%8.3%201.021.9
86.3%
Built EnvironmentParkland as percent of city land areaAcres of parkland/1,000Farmers’ markets/1,000,000Percent using public transportation to workPercent bicycling or walking to work
Recreational FacilitiesBall diamonds/10,000Dog parks/10,000Park playgrounds/10,000Golf courses/100,000Park units/10,000Recreation centers/20,000Swimming pools/100,000Tennis courts/10,000
Park-related expenditures per capita
Level of state requirement for Physical Education classes**
Number of primary health care providers per 100,000
2.5% – 25.3%2.3 – 94.11.0 – 41.0
0.4% – 30.5%1.2% – 6.7%
0.3 – 5.70.0 – 5.70.9 – 4.80.0 – 5.0
1.2 – 10.90.1 – 2.60.6 – 9.20.8 – 6.9
$12.0 – $259.0
0 – 3
46.8 – 133.7
(note: most of these data were available only for the main city in the MSA)
**3 = required at three levels: high school, middle school and elementary school; 2= required at two levels; 1= required at only one level
70.4% – 85.9%36.4% – 58.1%15.8% – 30.0%8.8% – 25.3%
18.1% – 34.3%46.4% – 66.6%29.5% – 40.3%
23.8% – 41.9%
4.5% – 11.9%2.4% – 5.6%5.4% – 11.6%131.7 – 268.6
9.9 – 31.4
77.3% – 94.4%
MSA Average MSA Range
MSA Average Range of all Cities
10.6%18.914.84.3%2.8%
2.00.92.31.04.21.13.12.1
$101.5
2.5
93.2
U.S. Value
76.2%51.0%23.4%17.9%
26.9%56.0%35.5%
33.7%
8.8%3.8%8.3%206.722.5
85.6%
personal health indicators – Score = 39.9; rank = 38 Pittsburgh MSA
74.6%52.4%24.3%18.5%
28.2%54.3%36.7%
34.4%
8.9%5.3%9.5%222.122.4
90.5%
Community/environmental indicators – Score = 69.9; rank = 4
Pittsburgh
8.8%10.114.95.8%3.9%
4.11.04.20.35.51.56.12.9
$88
3
108.7

84
Population
Percent less than 18 years old
Percent 18 to 64 years old
Percent 65 years old and older
Percent male
Percent high school graduate or higher
Percent White
Percent Black or African American
Percent Asian
Percent Other Race
Percent Hispanic/Latino
Percent unemployed
Median household income
Percent of households below poverty level
Violent crime rate/100,000*
Percent with disability
307,006,550
24.3%
62.8%
12.9%
49.3%
85.3%
74.8%
12.4%
4.5%
8.3%
15.8%
9.9%
$50,221
10.5%
429.4
12.0%
3,325,885
24.6%
63.6%
11.8%
49.2%
86.7%
72.3%
15.0%
5.1%
7.6%
15.1%
9.8%
$55,331
9.5%
11.0%
*Due to differences in jurisdictional definitions and reporting, the FBI recommends that these rates not be compared across areas
1,123,804 – 19,069,796
20.2% – 29.4%
60.5% – 66.9%
7.9% – 17.2%
48.1% – 51.1%
77.6% – 92.5%
49.8% – 88.6%
1.7% – 44.5%
1.2% – 30.2%
1.9% – 24.5%
1.2% – 53.4%
6.4% – 16.3%
$43,633 – $85,168
4.9% – 15.1%
7.4% – 14.5%
MSA Average MSA RangeU.S. Value
2,241,841
23.8%
65.3%
10.9%
49.8%
90.1%
82.8%
2.7%
5.4%
9.1%
10.6%
11.6%
$55,521
8.4%
268.5
10.9%
Portland MSA
deSCription oF portLAnd-vAnCouver-BeAverton, or MSA
• Higher percent unemployed• Higher percent with asthma• Higher death rate for diabetes• Fewer park playgrounds per capita
• Fewer recreation centers per capita• Fewer swimming pools per capita• Lower level of state requirement for Physical
Education classes
opportunitieS/ChALLenGeS
StrenGthS/AdvAntAGeS• Lower percentage of households below
poverty level• Higher percent physically active at
least moderately• Lower percent with angina or coronary
heart disease• Lower percent with diabetes• Lower death rate for cardiovascular disease• Higher percent of city land area as parkland• More acres of parkland per capita• More farmers’ markets per capita
• Higher percent using public transportation to work
• Higher percent bicycling or walking to work• More ball diamonds per capita• More dog parks per capita• More golf courses per capita• More park units per capita• Higher park-related expenditures per capita• Higher number of primary health care providers
per capita
ranking: total Score = 67.7; rank = 4
portLAnd, or(Portland-Vancouver-Beaverton, OR-WA MSA)
CountieS Clackamas OR, Columbia OR, Multnomah OR, Washington OR, Yamhill OR, Clark WA, Skamania WA

85
ACSM AMeriCAn FitneSS indextM CoMponentS
Health Behaviors Percent any physical activity or exercise in the last 30 days Percent physically active at least moderatelyPercent eating 5+ servings of fruits/vegetables per dayPercent currently smoking
Chronic Health ProblemsPercent obesePercent in excellent or very good healthAny days when physical health was not good during
the past 30 daysAny days when mental health was not good during
the past 30 daysPercent with asthmaPercent with angina or coronary heart diseasePercent with diabetesDeath rate/100,000 for cardiovascular diseaseDeath rate/100,000 for diabetes
Health Care
Percent with health insurance
76.2%51.0%23.4%17.9%
26.9%56.0%35.5%
33.7%
8.8%3.8%8.3%206.722.5
85.6%
77.2%48.7%24.4%17.0%
25.9%56.8%35.3%
34.4%
8.3%3.6%8.3%201.021.9
86.3%
Built EnvironmentParkland as percent of city land areaAcres of parkland/1,000Farmers’ markets/1,000,000Percent using public transportation to workPercent bicycling or walking to work
Recreational FacilitiesBall diamonds/10,000Dog parks/10,000Park playgrounds/10,000Golf courses/100,000Park units/10,000Recreation centers/20,000Swimming pools/100,000Tennis courts/10,000
Park-related expenditures per capita
Level of state requirement for Physical Education classes**
Number of primary health care providers per 100,000
2.5% – 25.3%2.3 – 94.11.0 – 41.0
0.4% – 30.5%1.2% – 6.7%
0.3 – 5.70.0 – 5.70.9 – 4.80.0 – 5.0
1.2 – 10.90.1 – 2.60.6 – 9.20.8 – 6.9
$12.0 – $259.0
0 – 3
46.8 – 133.7
(note: most of these data were available only for the main city in the MSA)
**3 = required at three levels: high school, middle school and elementary school; 2= required at two levels; 1= required at only one level
70.4% – 85.9%36.4% – 58.1%15.8% – 30.0%8.8% – 25.3%
18.1% – 34.3%46.4% – 66.6%29.5% – 40.3%
23.8% – 41.9%
4.5% – 11.9%2.4% – 5.6%5.4% – 11.6%131.7 – 268.6
9.9 – 31.4
77.3% – 94.4%
U.S. Value MSA Average MSA Range
MSA Average Range of all Cities
10.6%18.914.84.3%2.8%
2.00.92.31.04.21.13.12.1
$101.5
2.5
93.2
15.7%24.224.16.1%5.3%
5.75.71.91.35.40.62.52.1
$157
1
105.9
Portland
Community/environmental indicators – Score = 68.7; rank = 5
83.2%54.7%24.2%15.9%
24.0%62.1%36.3%
34.7%
9.7%2.9%6.7%174.127.3
85.8%
Portland MSA
personal health indicators – Score = 66.7; rank = 12

86
Population
Percent less than 18 years old
Percent 18 to 64 years old
Percent 65 years old and older
Percent male
Percent high school graduate or higher
Percent White
Percent Black or African American
Percent Asian
Percent Other Race
Percent Hispanic/Latino
Percent unemployed
Median household income
Percent of households below poverty level
Violent crime rate/100,000*
Percent with disability
307,006,550
24.3%
62.8%
12.9%
49.3%
85.3%
74.8%
12.4%
4.5%
8.3%
15.8%
9.9%
$50,221
10.5%
429.4
12.0%
3,325,885
24.6%
63.6%
11.8%
49.2%
86.7%
72.3%
15.0%
5.1%
7.6%
15.1%
9.8%
$55,331
9.5%
11.0%
*Due to differences in jurisdictional definitions and reporting, the FBI recommends that these rates not be compared across areas
1,123,804 – 19,069,796
20.2% – 29.4%
60.5% – 66.9%
7.9% – 17.2%
48.1% – 51.1%
77.6% – 92.5%
49.8% – 88.6%
1.7% – 44.5%
1.2% – 30.2%
1.9% – 24.5%
1.2% – 53.4%
6.4% – 16.3%
$43,633 – $85,168
4.9% – 15.1%
7.4% – 14.5%
U.S. Value MSA Average MSA Range
1,600,642
21.8%
64.0%
14.2%
48.5%
83.3%
85.3%
5.0%
2.6%
7.0%
9.7%
10.3%
$54,202
8.4%
374.6
12.8%
Providence MSA
deSCription oF providenCe-neW BedFord-FALL river, ri-MA MSA
• Higher percent with asthma• Higher percent with angina or coronary
heart disease• Fewer acres of parkland per capita
• Lower percent using public transportation to work
• Fewer tennis courts per capita• Lower park-related expenditures per capita
opportunitieS/ChALLenGeS
• Lower percentage of households below poverty level
• Lower death rate for diabetes• More farmers’ markets per capita• Higher percent bicycling or walking to work• More ball diamonds per capita• More dog parks per capita
• More park playgrounds per capita• More golf courses per capita• More park units per capita• More swimming pools per capita• Higher level of state requirement for Physical
Education classes
StrenGthS/AdvAntAGeS
ranking: total Score = 55.1; rank = 19
providenCe, ri(Providence-New Bedford-Fall River, RI-MA MSA)
CountieS Bristol MA, Bristol RI, Kent RI, Newport RI, Providence RI, Washington RI

87
ACSM AMeriCAn FitneSS indextM CoMponentS
Health Behaviors Percent any physical activity or exercise in the last 30 days Percent physically active at least moderatelyPercent eating 5+ servings of fruits/vegetables per dayPercent currently smoking
Chronic Health ProblemsPercent obesePercent in excellent or very good healthAny days when physical health was not good during
the past 30 daysAny days when mental health was not good during
the past 30 daysPercent with asthmaPercent with angina or coronary heart diseasePercent with diabetesDeath rate/100,000 for cardiovascular diseaseDeath rate/100,000 for diabetes
Health Care
Percent with health insurance
Built EnvironmentParkland as percent of city land areaAcres of parkland/1,000Farmers’ markets/1,000,000Percent using public transportation to workPercent bicycling or walking to work
Recreational FacilitiesBall diamonds/10,000Dog parks/10,000Park playgrounds/10,000Golf courses/100,000Park units/10,000Recreation centers/20,000Swimming pools/100,000Tennis courts/10,000
Park-related expenditures per capita
Level of state requirement for Physical Education classes**
Number of primary health care providers per 100,000
2.5% – 25.3%2.3 – 94.11.0 – 41.0
0.4% – 30.5%1.2% – 6.7%
0.3 – 5.70.0 – 5.70.9 – 4.80.0 – 5.0
1.2 – 10.90.1 – 2.60.6 – 9.20.8 – 6.9
$12.0 – $259.0
0 – 3
46.8 – 133.7
(note: most of these data were available only for the main city in the MSA)
**3 = required at three levels: high school, middle school and elementary school; 2= required at two levels; 1= required at only one level
70.4% – 85.9%36.4% – 58.1%15.8% – 30.0%8.8% – 25.3%
18.1% – 34.3%46.4% – 66.6%29.5% – 40.3%
23.8% – 41.9%
4.5% – 11.9%2.4% – 5.6%5.4% – 11.6%131.7 – 268.6
9.9 – 31.4
77.3% – 94.4%
MSA Average Range of all Cities
10.6%18.914.84.3%2.8%
2.00.92.31.04.21.13.12.1
$101.5
2.5
93.2
U.S. Value
76.2%51.0%23.4%17.9%
26.9%56.0%35.5%
33.7%
8.8%3.8%8.3%206.722.5
85.6%
MSA Average
77.2%48.7%24.4%17.0%
25.9%56.8%35.3%
34.4%
8.3%3.6%8.3%201.021.9
86.3%
MSA Range
personal health indicators – Score = 49.7; rank = 23 Providence MSA
74.4%49.8%25.0%16.0%
25.0%56.9%36.0%
34.6%
11.0%4.1%8.1%216.318.2
90.3%
Community/environmental indicators – Score = 60.0; rank = 13
Providence
10.4%7.0
35.62.7%3.1%
2.22.33.21.26.51.23.51.3
$58
3
97.7

88
Population
Percent less than 18 years old
Percent 18 to 64 years old
Percent 65 years old and older
Percent male
Percent high school graduate or higher
Percent White
Percent Black or African American
Percent Asian
Percent Other Race
Percent Hispanic/Latino
Percent unemployed
Median household income
Percent of households below poverty level
Violent crime rate/100,000*
Percent with disability
307,006,550
24.3%
62.8%
12.9%
49.3%
85.3%
74.8%
12.4%
4.5%
8.3%
15.8%
9.9%
$50,221
10.5%
429.4
12.0%
3,325,885
24.6%
63.6%
11.8%
49.2%
86.7%
72.3%
15.0%
5.1%
7.6%
15.1%
9.8%
$55,331
9.5%
11.0%
*Due to differences in jurisdictional definitions and reporting, the FBI recommends that these rates not be compared across areas
1,123,804 – 19,069,796
20.2% – 29.4%
60.5% – 66.9%
7.9% – 17.2%
48.1% – 51.1%
77.6% – 92.5%
49.8% – 88.6%
1.7% – 44.5%
1.2% – 30.2%
1.9% – 24.5%
1.2% – 53.4%
6.4% – 16.3%
$43,633 – $85,168
4.9% – 15.1%
7.4% – 14.5%
U.S. Value MSA Average MSA Range
1,125,827
26.5%
64.9%
8.6%
49.5%
89.4%
70.8%
19.9%
3.8%
5.5%
9.3%
8.5%
$59,316
7.9%
278.2
8.2%
Raleigh MSA
deSCription oF rALeiGh-CAry, nC MSA
• Higher percent of days when mental health was not good during the past 30 days
• Fewer farmers’ markets per capita• Lower percent using public transportation
to work• Lower percent bicycling or walking to work
• Fewer ball diamonds per capita• Fewer dog parks per capita• Fewer golf courses per capita• Fewer swimming pools per capita • Lower number of primary health care providers
per capita
opportunitieS/ChALLenGeS
• Lower percent unemployed• Lower percentage of households below
poverty level• Lower percent with asthma• Lower percent with angina or coronary
heart disease• Lower percent with diabetes• Higher percent of city land area as parkland
• More acres of parkland per capita• More park units per capita• More recreation centers per capita• More tennis courts per capita• Higher park-related expenditures per capita• Higher level of state requirement for Physical
Education classes
StrenGthS/AdvAntAGeS
ranking: total Score = 50.0; rank = 24
rALeiGh, nC(Raleigh-Cary, NC MSA)
CountieS Franklin, Johnston, Wake

89
ACSM AMeriCAn FitneSS indextM CoMponentS
Health Behaviors Percent any physical activity or exercise in the last 30 days Percent physically active at least moderatelyPercent eating 5+ servings of fruits/vegetables per dayPercent currently smoking
Chronic Health ProblemsPercent obesePercent in excellent or very good healthAny days when physical health was not good during
the past 30 daysAny days when mental health was not good during
the past 30 daysPercent with asthmaPercent with angina or coronary heart diseasePercent with diabetesDeath rate/100,000 for cardiovascular diseaseDeath rate/100,000 for diabetes
Health Care
Percent with health insurance
76.2%51.0%23.4%17.9%
26.9%56.0%35.5%
33.7%
8.8%3.8%8.3%206.722.5
85.6%
77.2%48.7%24.4%17.0%
25.9%56.8%35.3%
34.4%
8.3%3.6%8.3%201.021.9
86.3%
Built EnvironmentParkland as percent of city land areaAcres of parkland/1,000Farmers’ markets/1,000,000Percent using public transportation to workPercent bicycling or walking to work
Recreational FacilitiesBall diamonds/10,000Dog parks/10,000Park playgrounds/10,000Golf courses/100,000Park units/10,000Recreation centers/20,000Swimming pools/100,000Tennis courts/10,000
Park-related expenditures per capita
Level of state requirement for Physical Education classes**
Number of primary health care providers per 100,000
2.5% – 25.3%2.3 – 94.11.0 – 41.0
0.4% – 30.5%1.2% – 6.7%
0.3 – 5.70.0 – 5.70.9 – 4.80.0 – 5.0
1.2 – 10.90.1 – 2.60.6 – 9.20.8 – 6.9
$12.0 – $259.0
0 – 3
46.8 – 133.7
(note: most of these data were available only for the main city in the MSA)
**3 = required at three levels: high school, middle school and elementary school; 2= required at two levels; 1= required at only one level
70.4% – 85.9%36.4% – 58.1%15.8% – 30.0%8.8% – 25.3%
18.1% – 34.3%46.4% – 66.6%29.5% – 40.3%
23.8% – 41.9%
4.5% – 11.9%2.4% – 5.6%5.4% – 11.6%131.7 – 268.6
9.9 – 31.4
77.3% – 94.4%
U.S. Value MSA Average MSA Range
MSA Average Range of all Cities
10.6%18.914.84.3%2.8%
2.00.92.31.04.21.13.12.1
$101.5
2.5
93.2
personal health indicators – Score = 45.8; rank = 28 Raleigh MSA
78.6%45.2%23.5%17.8%
26.4%54.1%35.9%
39.4%
7.4%3.0%6.1%195.623.1
81.8%
Community/environmental indicators – Score = 53.8; rank = 23
Raleigh
16.9%31.611.51.0%1.9%
1.50.82.20.04.91.52.02.9
$128
3
72.5

90
Population
Percent less than 18 years old
Percent 18 to 64 years old
Percent 65 years old and older
Percent male
Percent high school graduate or higher
Percent White
Percent Black or African American
Percent Asian
Percent Other Race
Percent Hispanic/Latino
Percent unemployed
Median household income
Percent of households below poverty level
Violent crime rate/100,000*
Percent with disability
307,006,550
24.3%
62.8%
12.9%
49.3%
85.3%
74.8%
12.4%
4.5%
8.3%
15.8%
9.9%
$50,221
10.5%
429.4
12.0%
3,325,885
24.6%
63.6%
11.8%
49.2%
86.7%
72.3%
15.0%
5.1%
7.6%
15.1%
9.8%
$55,331
9.5%
11.0%
*Due to differences in jurisdictional definitions and reporting, the FBI recommends that these rates not be compared across areas
1,123,804 – 19,069,796
20.2% – 29.4%
60.5% – 66.9%
7.9% – 17.2%
48.1% – 51.1%
77.6% – 92.5%
49.8% – 88.6%
1.7% – 44.5%
1.2% – 30.2%
1.9% – 24.5%
1.2% – 53.4%
6.4% – 16.3%
$43,633 – $85,168
4.9% – 15.1%
7.4% – 14.5%
U.S. Value MSA Average MSA Range
riChMond, vA(Richmond, VA MSA)
CountieS Amelia, Caroline, Charles City, Chesterfield, Cumberland, Dinwiddie, Goochland, Hanover, Henrico, King and Queen, King William, Louisa, New Kent, Powhatan, Prince George, Sussex, Colonial Heights City, Hopewell City, Petersburg City, Richmond City
ranking: total Score = 64.2; rank = 12StrenGthS/AdvAntAGeS• Lower percent unemployed• Lower percentage of households below
poverty level• Higher percent physically active at
least moderately• Higher percent eating 5+ servings of
fruits/vegetables per day• Lower percent of days when physical health
was not good during the past 30 days• Lower percent of days when mental health
was not good during the past 30 days• Lower percent with asthma
• Lower percent with angina or coronary heart disease
• Lower percent with diabetes• Lower death rate for diabetes• More ball diamonds per capita• More dog parks per capita• More park playgrounds per capita• More recreation centers per capita• More swimming pools per capita• More tennis courts per capita• Higher level of state requirement for Physical
Education classes
opportunitieS/ChALLenGeS• Higher percent currently smoking• Higher percent obese• Lower percent of city land area as parkland• Fewer acres of parkland per capita• Fewer farmers’ markets per capita• Lower percent using public transportation
to work
• Lower percent bicycling or walking to work• Fewer golf courses per capita• Fewer park units per capita• Lower park-related expenditures per capita
deSCription oF riChMond, vA MSARichmond MSA
1,238,187
23.6%
64.4%
12.0%
48.5%
85.4%
64.2%
29.6%
2.8%
3.4%
4.2%
8.7%
$55,609
7.8%
293.2
11.6%

91
ACSM AMeriCAn FitneSS indextM CoMponentS
Health Behaviors Percent any physical activity or exercise in the last 30 days Percent physically active at least moderatelyPercent eating 5+ servings of fruits/vegetables per dayPercent currently smoking
Chronic Health ProblemsPercent obesePercent in excellent or very good healthAny days when physical health was not good during
the past 30 daysAny days when mental health was not good during
the past 30 daysPercent with asthmaPercent with angina or coronary heart diseasePercent with diabetesDeath rate/100,000 for cardiovascular diseaseDeath rate/100,000 for diabetes
Health Care
Percent with health insurance
77.2%48.7%24.4%17.0%
25.9%56.8%35.3%
34.4%
8.3%3.6%8.3%201.021.9
86.3%
Built EnvironmentParkland as percent of city land areaAcres of parkland/1,000Farmers’ markets/1,000,000Percent using public transportation to workPercent bicycling or walking to work
Recreational FacilitiesBall diamonds/10,000Dog parks/10,000Park playgrounds/10,000Golf courses/100,000Park units/10,000Recreation centers/20,000Swimming pools/100,000Tennis courts/10,000
Park-related expenditures per capita
Level of state requirement for Physical Education classes**
Number of primary health care providers per 100,000
2.5% – 25.3%2.3 – 94.11.0 – 41.0
0.4% – 30.5%1.2% – 6.7%
0.3 – 5.70.0 – 5.70.9 – 4.80.0 – 5.0
1.2 – 10.90.1 – 2.60.6 – 9.20.8 – 6.9
$12.0 – $259.0
0 – 3
46.8 – 133.7
(note: most of these data were available only for the main city in the MSA)
**3 = required at three levels: high school, middle school and elementary school; 2= required at two levels; 1= required at only one level
70.4% – 85.9%36.4% – 58.1%15.8% – 30.0%8.8% – 25.3%
18.1% – 34.3%46.4% – 66.6%29.5% – 40.3%
23.8% – 41.9%
4.5% – 11.9%2.4% – 5.6%5.4% – 11.6%131.7 – 268.6
9.9 – 31.4
77.3% – 94.4%
MSA Average MSA Range
MSA Average Range of all Cities
10.6%18.914.84.3%2.8%
2.00.92.31.04.21.13.12.1
$101.5
2.5
93.2
U.S. Value
76.2%51.0%23.4%17.9%
26.9%56.0%35.5%
33.7%
8.8%3.8%8.3%206.722.5
85.6%
personal health indicators – Score = 72.5; rank = 7 Richmond MSA
79.0%56.5%29.0%19.2%
28.9%61.6%29.6%
26.6%
6.8%3.0%6.7%209.019.7
90.5%
Community/environmental indicators – Score = 56.6; rank = 18
Richmond
7.4%14.19.7
2.0%1.6%
2.81.03.00.53.32.54.56.9
$74
3
91.8

92
Population
Percent less than 18 years old
Percent 18 to 64 years old
Percent 65 years old and older
Percent male
Percent high school graduate or higher
Percent White
Percent Black or African American
Percent Asian
Percent Other Race
Percent Hispanic/Latino
Percent unemployed
Median household income
Percent of households below poverty level
Violent crime rate/100,000*
Percent with disability
307,006,550
24.3%
62.8%
12.9%
49.3%
85.3%
74.8%
12.4%
4.5%
8.3%
15.8%
9.9%
$50,221
10.5%
429.4
12.0%
3,325,885
24.6%
63.6%
11.8%
49.2%
86.7%
72.3%
15.0%
5.1%
7.6%
15.1%
9.8%
$55,331
9.5%
11.0%
*Due to differences in jurisdictional definitions and reporting, the FBI recommends that these rates not be compared across areas
1,123,804 – 19,069,796
20.2% – 29.4%
60.5% – 66.9%
7.9% – 17.2%
48.1% – 51.1%
77.6% – 92.5%
49.8% – 88.6%
1.7% – 44.5%
1.2% – 30.2%
1.9% – 24.5%
1.2% – 53.4%
6.4% – 16.3%
$43,633 – $85,168
4.9% – 15.1%
7.4% – 14.5%
U.S. Value MSA Average MSA Range
4,143,113
29.4%
60.5%
10.1%
50.1%
78.6%
64.8%
7.4%
5.8%
22.0%
46.3%
14.4%
$53,815
12.4%
413.9
10.7%
Riverside MSA
deSCription oF riverSide-SAn BernArdino-ontArio, CA MSA
• Higher percent unemployed• Higher percentage of households below
poverty level• Higher percent obese • Lower percent in excellent or very good health• Higher percent of days when physical health
was not good during the past 30 days• Higher percent of days when mental health
was not good during the past 30 days• Higher percent with diabetes• Higher death rate for cardiovascular disease• Higher death rate for diabetes• Lower percent with health insurance
• Fewer acres of parkland per capita• Fewer farmers’ markets per capita• Lower percent using public transportation
to work• Lower percent bicycling or walking to work• Fewer ball diamonds per capita• Fewer park playgrounds per capita• Fewer golf courses per capita• Fewer park units per capita• Fewer swimming pools per capita• Fewer tennis courts per capita• Fewer primary health care providers per capita
opportunitieS/ChALLenGeS
• More dog parks per capita• Higher level of state requirement for Physical
Education classes
StrenGthS/AdvAntAGeS
ranking: total Score = 36.8; rank = 44
riverSide, CA(Riverside-San Bernardino-Ontario, CA MSA)
CountieS Riverside, San Bernardino

93
ACSM AMeriCAn FitneSS indextM CoMponentS
Health Behaviors Percent any physical activity or exercise in the last 30 days Percent physically active at least moderatelyPercent eating 5+ servings of fruits/vegetables per dayPercent currently smoking
Chronic Health ProblemsPercent obesePercent in excellent or very good healthAny days when physical health was not good during
the past 30 daysAny days when mental health was not good during
the past 30 daysPercent with asthmaPercent with angina or coronary heart diseasePercent with diabetesDeath rate/100,000 for cardiovascular diseaseDeath rate/100,000 for diabetes
Health Care
Percent with health insurance
76.2%51.0%23.4%17.9%
26.9%56.0%35.5%
33.7%
8.8%3.8%8.3%206.722.5
85.6%
77.2%48.7%24.4%17.0%
25.9%56.8%35.3%
34.4%
8.3%3.6%8.3%201.021.9
86.3%
Built EnvironmentParkland as percent of city land areaAcres of parkland/1,000Farmers’ markets/1,000,000Percent using public transportation to workPercent bicycling or walking to work
Recreational FacilitiesBall diamonds/10,000Dog parks/10,000Park playgrounds/10,000Golf courses/100,000Park units/10,000Recreation centers/20,000Swimming pools/100,000Tennis courts/10,000
Park-related expenditures per capita
Level of state requirement for Physical Education classes**
Number of primary health care providers per 100,000
2.5% – 25.3%2.3 – 94.11.0 – 41.0
0.4% – 30.5%1.2% – 6.7%
0.3 – 5.70.0 – 5.70.9 – 4.80.0 – 5.0
1.2 – 10.90.1 – 2.60.6 – 9.20.8 – 6.9
$12.0 – $259.0
0 – 3
46.8 – 133.7
(note: most of these data were available only for the main city in the MSA)
**3 = required at three levels: high school, middle school and elementary school; 2= required at two levels; 1= required at only one level
70.4% – 85.9%36.4% – 58.1%15.8% – 30.0%8.8% – 25.3%
18.1% – 34.3%46.4% – 66.6%29.5% – 40.3%
23.8% – 41.9%
4.5% – 11.9%2.4% – 5.6%5.4% – 11.6%131.7 – 268.6
9.9 – 31.4
77.3% – 94.4%
U.S. Value MSA Average MSA Range
MSA Average Range of all Cities
10.6%18.914.84.3%2.8%
2.00.92.31.04.21.13.12.1
$101.5
2.5
93.2
personal health indicators – Score = 30.7; rank = 45 Riverside MSA
Community/environmental indicators – Score = 42.4; rank = 35
74.8%51.9%26.2%16.9%
31.3%46.4%40.1%
41.9%
7.9%3.8%9.6%228.127.2
77.3%
Riverside
9.6%16.26.8
1.8%2.3%
1.61.41.40.72.11.12.40.9
$96
3
53.5

StrenGthS/AdvAntAGeS
94
Population
Percent less than 18 years old
Percent 18 to 64 years old
Percent 65 years old and older
Percent male
Percent high school graduate or higher
Percent White
Percent Black or African American
Percent Asian
Percent Other Race
Percent Hispanic/Latino
Percent unemployed
Median household income
Percent of households below poverty level
Violent crime rate/100,000*
Percent with disability
*Due to differences in jurisdictional definitions and reporting, the FBI recommends that these rates not be compared across areas
U.S. Value
307,006,550
24.3%
62.8%
12.9%
49.3%
85.3%
74.8%
12.4%
4.5%
8.3%
15.8%
9.9%
$50,221
10.5%
429.4
12.0%
MSA Average
3,325,885
24.6%
63.6%
11.8%
49.2%
86.7%
72.3%
15.0%
5.1%
7.6%
15.1%
9.8%
$55,331
9.5%
11.0%
MSA Range
1,123,804 – 19,069,796
20.2% – 29.4%
60.5% – 66.9%
7.9% – 17.2%
48.1% – 51.1%
77.6% – 92.5%
49.8% – 88.6%
1.7% – 44.5%
1.2% – 30.2%
1.9% – 24.5%
1.2% – 53.4%
6.4% – 16.3%
$43,633 – $85,168
4.9% – 15.1%
7.4% – 14.5%
opportunitieS/ChALLenGeS
2,127,355
25.1%
63.0%
11.9%
49.3%
87.0%
68.0%
7.1%
11.3%
13.6%
19.3%
11.9%
$57,361
9.4%
508.5
12.2%
Sacramento MSA
deSCription oF SACrAMento-Arden ArCAde-roSeviLLe, CA MSA
• Higher percent unemployed• Higher percent with asthma• Lower percent of city land area as parkland• Fewer acres of parkland per capita
• Lower percent using public transportation to work
• Fewer swimming pools per capita• Fewer tennis courts per capita
• Higher percentage eating 5+ servings of fruits/vegetables per day
• Lower percent currently smoking• Lower death rate for diabetes• More farmers’ markets per capita• Higher percent bicycling or walking to work• More ball diamonds per capita
• More dog parks per capita• More park playgrounds per capita• More golf courses per capita• More park units per capita• Higher park-related expenditures per capita• Higher level of state requirement for Physical
Education classes
ranking: total Score = 65.3; rank = 10
SACrAMento, CA(Sacramento-Arden Arcade-Roseville, CA MSA)
CountieS El Dorado, Placer, Sacramento, Yolo
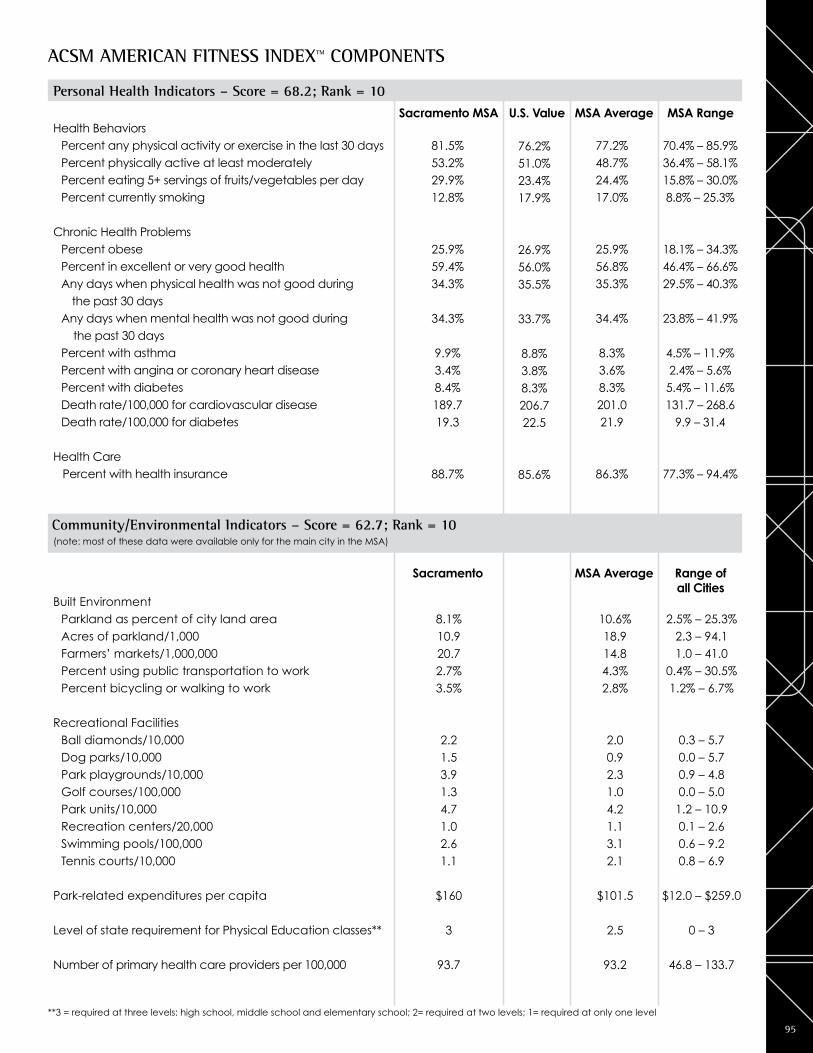
95
ACSM AMeriCAn FitneSS indextM CoMponentS
Health Behaviors Percent any physical activity or exercise in the last 30 days Percent physically active at least moderatelyPercent eating 5+ servings of fruits/vegetables per dayPercent currently smoking
Chronic Health ProblemsPercent obesePercent in excellent or very good healthAny days when physical health was not good during
the past 30 daysAny days when mental health was not good during
the past 30 daysPercent with asthmaPercent with angina or coronary heart diseasePercent with diabetesDeath rate/100,000 for cardiovascular diseaseDeath rate/100,000 for diabetes
Health Care
Percent with health insurance
Built EnvironmentParkland as percent of city land areaAcres of parkland/1,000Farmers’ markets/1,000,000Percent using public transportation to workPercent bicycling or walking to work
Recreational FacilitiesBall diamonds/10,000Dog parks/10,000Park playgrounds/10,000Golf courses/100,000Park units/10,000Recreation centers/20,000Swimming pools/100,000Tennis courts/10,000
Park-related expenditures per capita
Level of state requirement for Physical Education classes**
Number of primary health care providers per 100,000
(note: most of these data were available only for the main city in the MSA)
**3 = required at three levels: high school, middle school and elementary school; 2= required at two levels; 1= required at only one level
U.S. Value
76.2%51.0%23.4%17.9%
26.9%56.0%35.5%
33.7%
8.8%3.8%8.3%206.722.5
85.6%
MSA Average
77.2%48.7%24.4%17.0%
25.9%56.8%35.3%
34.4%
8.3%3.6%8.3%201.021.9
86.3%
MSA Average
10.6%18.914.84.3%2.8%
2.00.92.31.04.21.13.12.1
$101.5
2.5
93.2
2.5% – 25.3%2.3 – 94.11.0 – 41.0
0.4% – 30.5%1.2% – 6.7%
0.3 – 5.70.0 – 5.70.9 – 4.80.0 – 5.0
1.2 – 10.90.1 – 2.60.6 – 9.20.8 – 6.9
$12.0 – $259.0
0 – 3
46.8 – 133.7
Range of all Cities
MSA Range
70.4% – 85.9%36.4% – 58.1%15.8% – 30.0%8.8% – 25.3%
18.1% – 34.3%46.4% – 66.6%29.5% – 40.3%
23.8% – 41.9%
4.5% – 11.9%2.4% – 5.6%5.4% – 11.6%131.7 – 268.6
9.9 – 31.4
77.3% – 94.4%
personal health indicators – Score = 68.2; rank = 10 Sacramento MSA
Community/environmental indicators – Score = 62.7; rank = 10
81.5%53.2%29.9%12.8%
25.9%59.4%34.3%
34.3%
9.9%3.4%8.4%189.719.3
88.7%
Sacramento
8.1%10.920.72.7%3.5%
2.21.53.91.34.71.02.61.1
$160
3
93.7

96
Population
Percent less than 18 years old
Percent 18 to 64 years old
Percent 65 years old and older
Percent male
Percent high school graduate or higher
Percent White
Percent Black or African American
Percent Asian
Percent Other Race
Percent Hispanic/Latino
Percent unemployed
Median household income
Percent of households below poverty level
Violent crime rate/100,000*
Percent with disability
307,006,550
24.3%
62.8%
12.9%
49.3%
85.3%
74.8%
12.4%
4.5%
8.3%
15.8%
9.9%
$50,221
10.5%
429.4
12.0%
3,325,885
24.6%
63.6%
11.8%
49.2%
86.7%
72.3%
15.0%
5.1%
7.6%
15.1%
9.8%
$55,331
9.5%
11.0%
*Due to differences in jurisdictional definitions and reporting, the FBI recommends that these rates not be compared across areas
1,123,804 – 19,069,796
20.2% – 29.4%
60.5% – 66.9%
7.9% – 17.2%
48.1% – 51.1%
77.6% – 92.5%
49.8% – 88.6%
1.7% – 44.5%
1.2% – 30.2%
1.9% – 24.5%
1.2% – 53.4%
6.4% – 16.3%
$43,633 – $85,168
4.9% – 15.1%
7.4% – 14.5%
U.S. Value MSA Average MSA Range
2,828,990
23.9%
62.9%
13.1%
48.4%
88.7%
77.7%
17.9%
1.9%
2.5%
2.3%
9.5%
$51,691
9.7%
N/A‡
12.4%
Saint Louis MSA
deSCription oF SAint LouiS, Mo-iL MSA
• Lower percentage eating 5+ servings of fruits/vegetables per day
• Higher percent currently smoking• Higher death rate for cardiovascular disease• Lower percent of city land area as parkland• Fewer acres of parkland per capita
• Lower percent using public transportation to work
• Lower percent bicycling or walking to work• Fewer park playgrounds per capita• Fewer recreation centers per capita• Lower park-related expenditures per capita
opportunitieS/ChALLenGeS
• Lower percent with diabetes• More ball diamonds per capita• More dog parks per capita• More golf courses per capita
• More tennis courts per capita• Higher level of state requirement for Physical
Education classes
StrenGthS/AdvAntAGeS
ranking: total Score = 49.3; rank = 26
SAint LouiS, Mo (Saint Louis, MO-IL MSA)
CountieS Bond IL, Calhoun IL, Clinton IL, Jersey IL, Macoupin IL, Madison IL, Monroe IL, St. Clair IL, Crawford MO, Franklin MO, Jefferson MO, Lincoln MO, St. Charles MO, St. Louis MO, Warren MO, Washington MO, St. Louis City MO
‡This measure was not available.
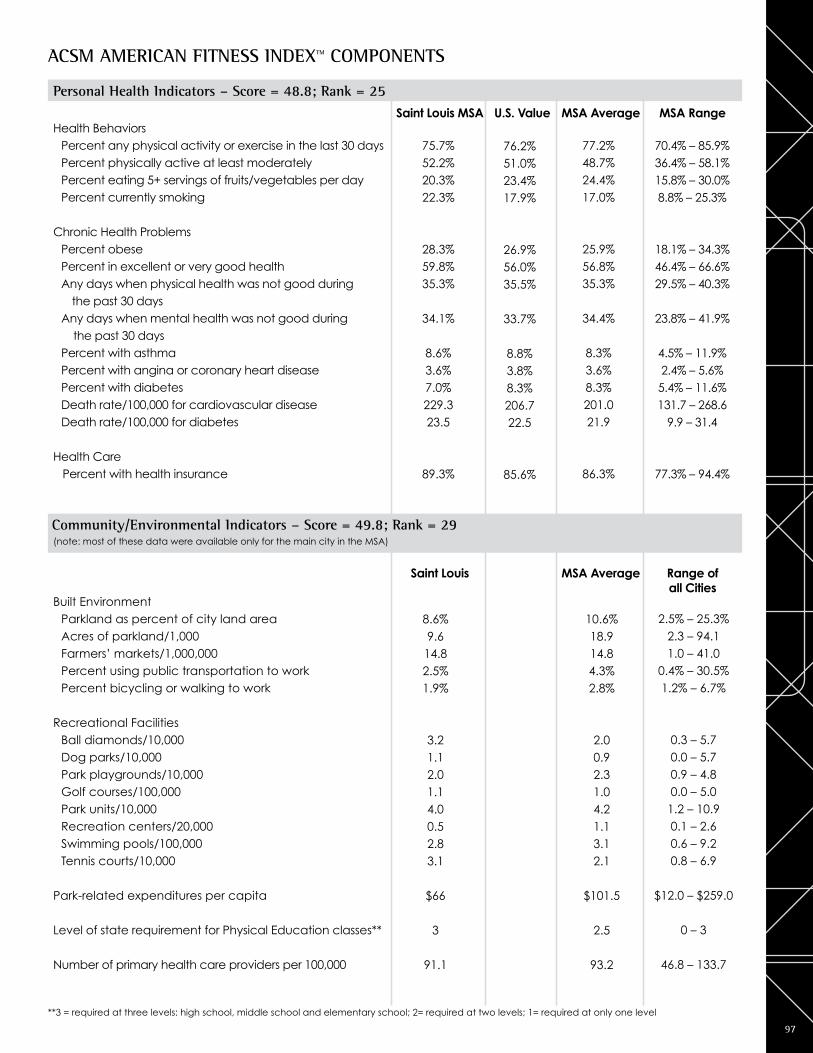
97
ACSM AMeriCAn FitneSS indextM CoMponentS
Health Behaviors Percent any physical activity or exercise in the last 30 days Percent physically active at least moderatelyPercent eating 5+ servings of fruits/vegetables per dayPercent currently smoking
Chronic Health ProblemsPercent obesePercent in excellent or very good healthAny days when physical health was not good during
the past 30 daysAny days when mental health was not good during
the past 30 daysPercent with asthmaPercent with angina or coronary heart diseasePercent with diabetesDeath rate/100,000 for cardiovascular diseaseDeath rate/100,000 for diabetes
Health Care
Percent with health insurance
77.2%48.7%24.4%17.0%
25.9%56.8%35.3%
34.4%
8.3%3.6%8.3%201.021.9
86.3%
Built EnvironmentParkland as percent of city land areaAcres of parkland/1,000Farmers’ markets/1,000,000Percent using public transportation to workPercent bicycling or walking to work
Recreational FacilitiesBall diamonds/10,000Dog parks/10,000Park playgrounds/10,000Golf courses/100,000Park units/10,000Recreation centers/20,000Swimming pools/100,000Tennis courts/10,000
Park-related expenditures per capita
Level of state requirement for Physical Education classes**
Number of primary health care providers per 100,000
2.5% – 25.3%2.3 – 94.11.0 – 41.0
0.4% – 30.5%1.2% – 6.7%
0.3 – 5.70.0 – 5.70.9 – 4.80.0 – 5.0
1.2 – 10.90.1 – 2.60.6 – 9.20.8 – 6.9
$12.0 – $259.0
0 – 3
46.8 – 133.7
(note: most of these data were available only for the main city in the MSA)
**3 = required at three levels: high school, middle school and elementary school; 2= required at two levels; 1= required at only one level
70.4% – 85.9%36.4% – 58.1%15.8% – 30.0%8.8% – 25.3%
18.1% – 34.3%46.4% – 66.6%29.5% – 40.3%
23.8% – 41.9%
4.5% – 11.9%2.4% – 5.6%5.4% – 11.6%131.7 – 268.6
9.9 – 31.4
77.3% – 94.4%
MSA Average MSA Range
MSA Average Range of all Cities
10.6%18.914.84.3%2.8%
2.00.92.31.04.21.13.12.1
$101.5
2.5
93.2
U.S. Value
76.2%51.0%23.4%17.9%
26.9%56.0%35.5%
33.7%
8.8%3.8%8.3%206.722.5
85.6%
personal health indicators – Score = 48.8; rank = 25 Saint Louis MSA
75.7%52.2%20.3%22.3%
28.3%59.8%35.3%
34.1%
8.6%3.6%7.0%229.323.5
89.3%
Community/environmental indicators – Score = 49.8; rank = 29
Saint Louis
8.6%9.6
14.82.5%1.9%
3.21.12.01.14.00.52.83.1
$66
3
91.1
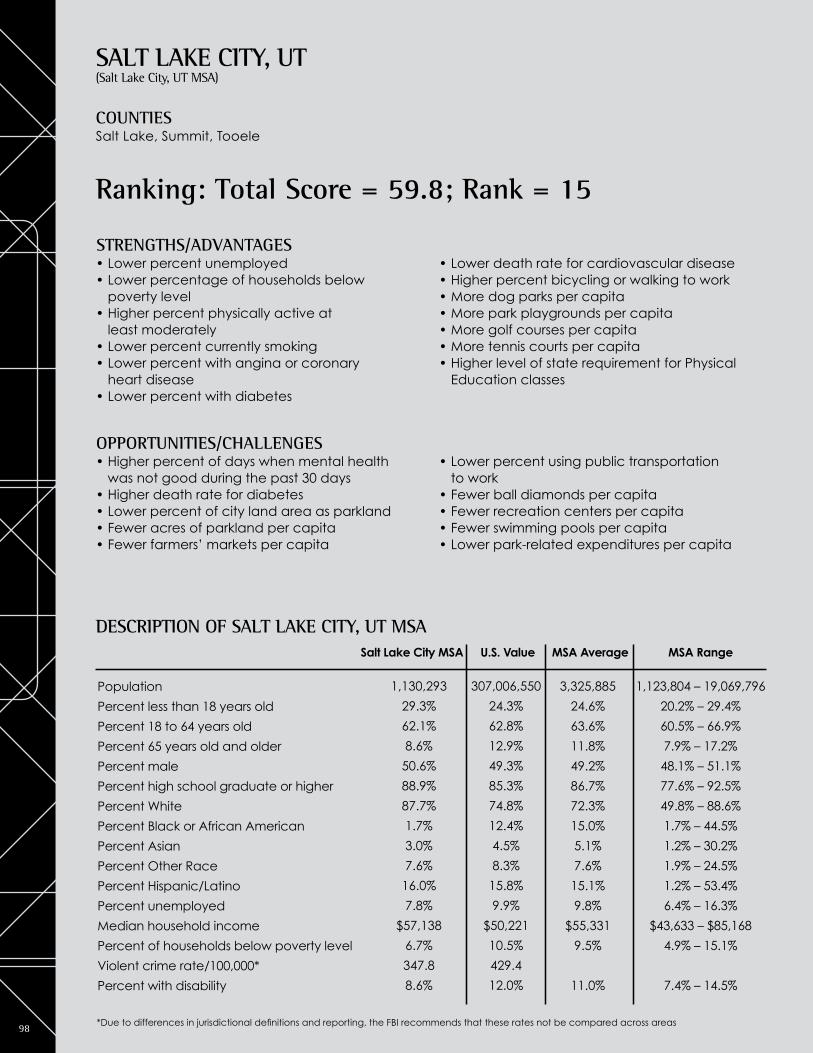
98
Population
Percent less than 18 years old
Percent 18 to 64 years old
Percent 65 years old and older
Percent male
Percent high school graduate or higher
Percent White
Percent Black or African American
Percent Asian
Percent Other Race
Percent Hispanic/Latino
Percent unemployed
Median household income
Percent of households below poverty level
Violent crime rate/100,000*
Percent with disability
*Due to differences in jurisdictional definitions and reporting, the FBI recommends that these rates not be compared across areas
U.S. Value
307,006,550
24.3%
62.8%
12.9%
49.3%
85.3%
74.8%
12.4%
4.5%
8.3%
15.8%
9.9%
$50,221
10.5%
429.4
12.0%
MSA Average
3,325,885
24.6%
63.6%
11.8%
49.2%
86.7%
72.3%
15.0%
5.1%
7.6%
15.1%
9.8%
$55,331
9.5%
11.0%
MSA Range
1,123,804 – 19,069,796
20.2% – 29.4%
60.5% – 66.9%
7.9% – 17.2%
48.1% – 51.1%
77.6% – 92.5%
49.8% – 88.6%
1.7% – 44.5%
1.2% – 30.2%
1.9% – 24.5%
1.2% – 53.4%
6.4% – 16.3%
$43,633 – $85,168
4.9% – 15.1%
7.4% – 14.5%
1,130,293
29.3%
62.1%
8.6%
50.6%
88.9%
87.7%
1.7%
3.0%
7.6%
16.0%
7.8%
$57,138
6.7%
347.8
8.6%
Salt Lake City MSA
deSCription oF SALt LAKe City, ut MSA
• Higher percent of days when mental health was not good during the past 30 days
• Higher death rate for diabetes• Lower percent of city land area as parkland• Fewer acres of parkland per capita• Fewer farmers’ markets per capita
• Lower percent using public transportation to work
• Fewer ball diamonds per capita• Fewer recreation centers per capita• Fewer swimming pools per capita• Lower park-related expenditures per capita
opportunitieS/ChALLenGeS
• Lower percent unemployed• Lower percentage of households below
poverty level• Higher percent physically active at
least moderately• Lower percent currently smoking• Lower percent with angina or coronary
heart disease• Lower percent with diabetes
• Lower death rate for cardiovascular disease• Higher percent bicycling or walking to work• More dog parks per capita• More park playgrounds per capita• More golf courses per capita• More tennis courts per capita• Higher level of state requirement for Physical
Education classes
StrenGthS/AdvAntAGeS
ranking: total Score = 59.8; rank = 15
SALt LAKe City, ut(Salt Lake City, UT MSA)
CountieS Salt Lake, Summit, Tooele

99
ACSM AMeriCAn FitneSS indextM CoMponentS
Health Behaviors Percent any physical activity or exercise in the last 30 days Percent physically active at least moderatelyPercent eating 5+ servings of fruits/vegetables per dayPercent currently smoking
Chronic Health ProblemsPercent obesePercent in excellent or very good healthAny days when physical health was not good during
the past 30 daysAny days when mental health was not good during
the past 30 daysPercent with asthmaPercent with angina or coronary heart diseasePercent with diabetesDeath rate/100,000 for cardiovascular diseaseDeath rate/100,000 for diabetes
Health Care
Percent with health insurance
Built EnvironmentParkland as percent of city land areaAcres of parkland/1,000Farmers’ markets/1,000,000Percent using public transportation to workPercent bicycling or walking to work
Recreational FacilitiesBall diamonds/10,000Dog parks/10,000Park playgrounds/10,000Golf courses/100,000Park units/10,000Recreation centers/20,000Swimming pools/100,000Tennis courts/10,000
Park-related expenditures per capita
Level of state requirement for Physical Education classes**
Number of primary health care providers per 100,000
(note: most of these data were available only for the main city in the MSA)
**3 = required at three levels: high school, middle school and elementary school; 2= required at two levels; 1= required at only one level
Range of all Cities
2.5% – 25.3%2.3 – 94.11.0 – 41.0
0.4% – 30.5%1.2% – 6.7%
0.3 – 5.70.0 – 5.70.9 – 4.80.0 – 5.0
1.2 – 10.90.1 – 2.60.6 – 9.20.8 – 6.9
$12.0 – $259.0
0 – 3
46.8 – 133.7
10.6%18.914.84.3%2.8%
2.00.92.31.04.21.13.12.1
$101.5
2.5
93.2
MSA Average
U.S. Value
76.2%51.0%23.4%17.9%
26.9%56.0%35.5%
33.7%
8.8%3.8%8.3%206.722.5
85.6%
77.2%48.7%24.4%17.0%
25.9%56.8%35.3%
34.4%
8.3%3.6%8.3%201.021.9
86.3%
MSA Average
70.4% – 85.9%36.4% – 58.1%15.8% – 30.0%8.8% – 25.3%
18.1% – 34.3%46.4% – 66.6%29.5% – 40.3%
23.8% – 41.9%
4.5% – 11.9%2.4% – 5.6%5.4% – 11.6%131.7 – 268.6
9.9 – 31.4
77.3% – 94.4%
MSA Range
personal health indicators – Score = 65.6; rank = 13 Salt Lake City MSA
80.9%57.7%23.2%11.4%
24.3%60.2%37.8%
39.5%
9.0%2.5%6.4%158.227.6
85.4%
Community/environmental indicators – Score = 54.4; rank = 22
Salt Lake City
3.1%12.19.7
3.0%3.1%
1.43.33.35.04.40.72.24.3
$45
3
85.7

100
Population
Percent less than 18 years old
Percent 18 to 64 years old
Percent 65 years old and older
Percent male
Percent high school graduate or higher
Percent White
Percent Black or African American
Percent Asian
Percent Other Race
Percent Hispanic/Latino
Percent unemployed
Median household income
Percent of households below poverty level
Violent crime rate/100,000*
Percent with disability
*Due to differences in jurisdictional definitions and reporting, the FBI recommends that these rates not be compared across areas
1,123,804 – 19,069,796
20.2% – 29.4%
60.5% – 66.9%
7.9% – 17.2%
48.1% – 51.1%
77.6% – 92.5%
49.8% – 88.6%
1.7% – 44.5%
1.2% – 30.2%
1.9% – 24.5%
1.2% – 53.4%
6.4% – 16.3%
$43,633 – $85,168
4.9% – 15.1%
7.4% – 14.5%
MSA RangeU.S. Value
307,006,550
24.3%
62.8%
12.9%
49.3%
85.3%
74.8%
12.4%
4.5%
8.3%
15.8%
9.9%
$50,221
10.5%
429.4
12.0%
MSA Average
3,325,885
24.6%
63.6%
11.8%
49.2%
86.7%
72.3%
15.0%
5.1%
7.6%
15.1%
9.8%
$55,331
9.5%
11.0%
2,072,128
27.5%
61.4%
11.0%
49.1%
81.5%
76.6%
6.4%
1.8%
15.2%
53.4%
7.8%
$47,955
12.6%
469.6
13.7%
San Antonio MSA
deSCription oF SAn Antonio, tx MSA
• Lower median household income• Higher percentage of households below
poverty level• Higher death rate for diabetes• Lower percent using public transportation
to work• Lower percent bicycling or walking to work• Fewer ball diamonds per capita• Fewer dog parks per capita
• Fewer park playgrounds per capita• Fewer golf courses per capita• Fewer park units per capita• Fewer recreation centers per capita• Fewer swimming pools per capita• Fewer tennis courts per capita• Lower park-related expenditures per capita• Lower number of primary health care providers
per capita
opportunitieS/ChALLenGeS
• Lower percent unemployed• Lower percent currently smoking• Lower percent with angina or coronary
heart disease
• Lower percent with diabetes• Higher level of state requirement for Physical
Education classes
StrenGthS/AdvAntAGeS
ranking: total Score = 45.0; rank = 33
SAn Antonio, tx(San Antonio, TX MSA)
CountieS Atascosa, Bandera, Bexar, Comal, Guadalupe, Kendall, Medina, Wilson

101
ACSM AMeriCAn FitneSS indextM CoMponentS
Health Behaviors Percent any physical activity or exercise in the last 30 days Percent physically active at least moderatelyPercent eating 5+ servings of fruits/vegetables per dayPercent currently smoking
Chronic Health ProblemsPercent obesePercent in excellent or very good healthAny days when physical health was not good during
the past 30 daysAny days when mental health was not good during
the past 30 daysPercent with asthmaPercent with angina or coronary heart diseasePercent with diabetesDeath rate/100,000 for cardiovascular diseaseDeath rate/100,000 for diabetes
Health Care
Percent with health insurance
Built EnvironmentParkland as percent of city land areaAcres of parkland/1,000Farmers’ markets/1,000,000Percent using public transportation to workPercent bicycling or walking to work
Recreational FacilitiesBall diamonds/10,000Dog parks/10,000Park playgrounds/10,000Golf courses/100,000Park units/10,000Recreation centers/20,000Swimming pools/100,000Tennis courts/10,000
Park-related expenditures per capita
Level of state requirement for Physical Education classes**
Number of primary health care providers per 100,000
(note: most of these data were available only for the main city in the MSA)
**3 = required at three levels: high school, middle school and elementary school; 2= required at two levels; 1= required at only one level
10.6%18.914.84.3%2.8%
2.00.92.31.04.21.13.12.1
$101.5
2.5
93.2
2.5% – 25.3%2.3 – 94.11.0 – 41.0
0.4% – 30.5%1.2% – 6.7%
0.3 – 5.70.0 – 5.70.9 – 4.80.0 – 5.0
1.2 – 10.90.1 – 2.60.6 – 9.20.8 – 6.9
$12.0 – $259.0
0 – 3
46.8 – 133.7
Range of all Cities
MSA Average
U.S. Value
76.2%51.0%23.4%17.9%
26.9%56.0%35.5%
33.7%
8.8%3.8%8.3%206.722.5
85.6%
MSA Average
77.2%48.7%24.4%17.0%
25.9%56.8%35.3%
34.4%
8.3%3.6%8.3%201.021.9
86.3%
MSA Range
70.4% – 85.9%36.4% – 58.1%15.8% – 30.0%8.8% – 25.3%
18.1% – 34.3%46.4% – 66.6%29.5% – 40.3%
23.8% – 41.9%
4.5% – 11.9%2.4% – 5.6%5.4% – 11.6%131.7 – 268.6
9.9 – 31.4
77.3% – 94.4%
personal health indicators – Score = 60.4; rank = 18 San Antonio MSA
75.0%50.3%24.4%14.0%
25.2%59.6%33.3%
32.9%
8.3%3.1%7.5%188.631.0
81.1%
Community/environmental indicators – Score = 30.7; rank = 50
San Antonio
10.7%20.715.02.3%2.2%
0.40.10.90.41.80.51.91.0
$52
3
79.7

102
Population
Percent less than 18 years old
Percent 18 to 64 years old
Percent 65 years old and older
Percent male
Percent high school graduate or higher
Percent White
Percent Black or African American
Percent Asian
Percent Other Race
Percent Hispanic/Latino
Percent unemployed
Median household income
Percent of households below poverty level
Violent crime rate/100,000*
Percent with disability
*Due to differences in jurisdictional definitions and reporting, the FBI recommends that these rates not be compared across areas
1,123,804 – 19,069,796
20.2% – 29.4%
60.5% – 66.9%
7.9% – 17.2%
48.1% – 51.1%
77.6% – 92.5%
49.8% – 88.6%
1.7% – 44.5%
1.2% – 30.2%
1.9% – 24.5%
1.2% – 53.4%
6.4% – 16.3%
$43,633 – $85,168
4.9% – 15.1%
7.4% – 14.5%
MSA RangeU.S. Value
307,006,550
24.3%
62.8%
12.9%
49.3%
85.3%
74.8%
12.4%
4.5%
8.3%
15.8%
9.9%
$50,221
10.5%
429.4
12.0%
MSA Average
3,325,885
24.6%
63.6%
11.8%
49.2%
86.7%
72.3%
15.0%
5.1%
7.6%
15.1%
9.8%
$55,331
9.5%
11.0%
SAn dieGo, CA(San Diego-Carlsbad-San Marcos, CA MSA)
CountieS San Diego
ranking: total Score = 63.3; rank = 13
StrenGthS/AdvAntAGeS• Lower percentage of households below
poverty level• Higher percent physically active at
least moderately• Higher percentage eating 5+ servings of
fruits/vegetables per day• Lower percent currently smoking• Lower percent obese• Lower percent with asthma• Lower percent with angina or coronary
heart disease
• Lower death rate for cardiovascular disease• Lower death rate for diabetes• Higher percent of city land area as parkland• More acres of parkland per capita• Higher percent bicycling or walking to work• More ball diamonds per capita• More dog parks per capita• Higher park-related expenditures per capita• Higher level of state requirement for Physical
Education classes
opportunitieS/ChALLenGeS• Higher percent of days when mental health • was not good during the past 30 days• Lower percent using public transportation
to work• Fewer park playgrounds per capita
• Fewer golf courses per capita• Fewer park units per capita• Fewer swimming pools per capita• Fewer tennis courts per capita
deSCription oF SAn dieGo-CArLSBAd-SAn MArCoS, CA MSASan Diego MSA
3,053,793
24.2%
64.4%
11.4%
50.2%
85.4%
73.9%
5.0%
10.3%
10.8%
31.3%
9.6%
$60,231
8.5%
424.3
9.4%

103
ACSM AMeriCAn FitneSS indextM CoMponentS
Health Behaviors Percent any physical activity or exercise in the last 30 days Percent physically active at least moderatelyPercent eating 5+ servings of fruits/vegetables per dayPercent currently smoking
Chronic Health ProblemsPercent obesePercent in excellent or very good healthAny days when physical health was not good during
the past 30 daysAny days when mental health was not good during
the past 30 daysPercent with asthmaPercent with angina or coronary heart diseasePercent with diabetesDeath rate/100,000 for cardiovascular diseaseDeath rate/100,000 for diabetes
Health Care
Percent with health insurance
Built EnvironmentParkland as percent of city land areaAcres of parkland/1,000Farmers’ markets/1,000,000Percent using public transportation to workPercent bicycling or walking to work
Recreational FacilitiesBall diamonds/10,000Dog parks/10,000Park playgrounds/10,000Golf courses/100,000Park units/10,000Recreation centers/20,000Swimming pools/100,000Tennis courts/10,000
Park-related expenditures per capita
Level of state requirement for Physical Education classes**
Number of primary health care providers per 100,000
(note: most of these data were available only for the main city in the MSA)
**3 = required at three levels: high school, middle school and elementary school; 2= required at two levels; 1= required at only one level
Range of all Cities
2.5% – 25.3%2.3 – 94.11.0 – 41.0
0.4% – 30.5%1.2% – 6.7%
0.3 – 5.70.0 – 5.70.9 – 4.80.0 – 5.0
1.2 – 10.90.1 – 2.60.6 – 9.20.8 – 6.9
$12.0 – $259.0
0 – 3
46.8 – 133.7
10.6%18.914.84.3%2.8%
2.00.92.31.04.21.13.12.1
$101.5
2.5
93.2
MSA Average
U.S. Value
76.2%51.0%23.4%17.9%
26.9%56.0%35.5%
33.7%
8.8%3.8%8.3%206.722.5
85.6%
MSA Average
77.2%48.7%24.4%17.0%
25.9%56.8%35.3%
34.4%
8.3%3.6%8.3%201.021.9
86.3%
MSA Range
70.4% – 85.9%36.4% – 58.1%15.8% – 30.0%8.8% – 25.3%
18.1% – 34.3%46.4% – 66.6%29.5% – 40.3%
23.8% – 41.9%
4.5% – 11.9%2.4% – 5.6%5.4% – 11.6%131.7 – 268.6
9.9 – 31.4
77.3% – 94.4%
22.7%36.116.03.1%3.4%
2.21.21.80.63.41.01.01.4
$120
3
87.3
San Diego
Community/environmental indicators – Score = 57.2; rank = 17
79.9%58.1%28.9%11.9%
21.6%58.4%35.2%
38.8%
7.1%2.6%8.2%174.318.6
83.4%
San Diego MSA
personal health indicators – Score = 69.9; rank = 9

104
Population
Percent less than 18 years old
Percent 18 to 64 years old
Percent 65 years old and older
Percent male
Percent high school graduate or higher
Percent White
Percent Black or African American
Percent Asian
Percent Other Race
Percent Hispanic/Latino
Percent unemployed
Median household income
Percent of households below poverty level
Violent crime rate/100,000*
Percent with disability
*Due to differences in jurisdictional definitions and reporting, the FBI recommends that these rates not be compared across areas
U.S. Value
307,006,550
24.3%
62.8%
12.9%
49.3%
85.3%
74.8%
12.4%
4.5%
8.3%
15.8%
9.9%
$50,221
10.5%
429.4
12.0%
MSA Average
3,325,885
24.6%
63.6%
11.8%
49.2%
86.7%
72.3%
15.0%
5.1%
7.6%
15.1%
9.8%
$55,331
9.5%
11.0%
MSA Range
1,123,804 – 19,069,796
20.2% – 29.4%
60.5% – 66.9%
7.9% – 17.2%
48.1% – 51.1%
77.6% – 92.5%
49.8% – 88.6%
1.7% – 44.5%
1.2% – 30.2%
1.9% – 24.5%
1.2% – 53.4%
6.4% – 16.3%
$43,633 – $85,168
4.9% – 15.1%
7.4% – 14.5%
4,317,853
21.6%
65.9%
12.5%
49.8%
86.9%
56.9%
8.4%
22.4%
12.4%
20.7%
9.8%
$73,825
6.5%
563.0
9.5%
San Francisco MSA
deSCription oF SAn FrAnCiSCo-oAKLAnd-FreMont, CA MSA
• Higher percent of days when mental health was not good during the past 30 days
• Fewer acres of parkland per capita• Fewer ball diamonds per capita• Fewer park playgrounds per capita
• Fewer golf courses per capita• Fewer park units per capita• Fewer recreation centers per capita• Fewer swimming pools per capita
opportunitieS/ChALLenGeS
StrenGthS/AdvAntAGeS• Higher median household income• Lower percentage of households below
poverty level• Lower percent currently smoking• Lower percent obese• Lower percent with angina or coronary
heart disease• Lower death rate for cardiovascular disease• Lower death rate for diabetes• Higher percent of city land area as parkland
• More farmers’ markets per capita• Higher percent using public transportation
to work• Higher percent bicycling or walking to work• More dog parks per capita• Higher park-related expenditures per capita• Higher level of state requirement for Physical
Education classes• Higher number of primary health care providers
per capita
ranking: total Score = 66.8; rank = 6
SAn FrAnCiSCo, CA(San Francisco-Oakland-Fremont, CA MSA)
CountieS Alameda, Contra Costa, Marin, San Francisco, San Mateo

105
ACSM AMeriCAn FitneSS indextM CoMponentS
Health Behaviors Percent any physical activity or exercise in the last 30 days Percent physically active at least moderatelyPercent eating 5+ servings of fruits/vegetables per dayPercent currently smoking
Chronic Health ProblemsPercent obesePercent in excellent or very good healthAny days when physical health was not good during
the past 30 daysAny days when mental health was not good during
the past 30 daysPercent with asthmaPercent with angina or coronary heart diseasePercent with diabetesDeath rate/100,000 for cardiovascular diseaseDeath rate/100,000 for diabetes
Health Care
Percent with health insurance
Built EnvironmentParkland as percent of city land areaAcres of parkland/1,000Farmers’ markets/1,000,000Percent using public transportation to workPercent bicycling or walking to work
Recreational FacilitiesBall diamonds/10,000Dog parks/10,000Park playgrounds/10,000Golf courses/100,000Park units/10,000Recreation centers/20,000Swimming pools/100,000Tennis courts/10,000
Park-related expenditures per capita
Level of state requirement for Physical Education classes**
Number of primary health care providers per 100,000
(note: most of these data were available only for the main city in the MSA)
**3 = required at three levels: high school, middle school and elementary school; 2= required at two levels; 1= required at only one level
10.6%18.914.84.3%2.8%
2.00.92.31.04.21.13.12.1
$101.5
2.5
93.2
MSA Average Range of all Cities
2.5% – 25.3%2.3 – 94.11.0 – 41.0
0.4% – 30.5%1.2% – 6.7%
0.3 – 5.70.0 – 5.70.9 – 4.80.0 – 5.0
1.2 – 10.90.1 – 2.60.6 – 9.20.8 – 6.9
$12.0 – $259.0
0 – 3
46.8 – 133.7
U.S. Value
76.2%51.0%23.4%17.9%
26.9%56.0%35.5%
33.7%
8.8%3.8%8.3%206.722.5
85.6%
77.2%48.7%24.4%17.0%
25.9%56.8%35.3%
34.4%
8.3%3.6%8.3%201.021.9
86.3%
MSA Average MSA Range
70.4% – 85.9%36.4% – 58.1%15.8% – 30.0%8.8% – 25.3%
18.1% – 34.3%46.4% – 66.6%29.5% – 40.3%
23.8% – 41.9%
4.5% – 11.9%2.4% – 5.6%5.4% – 11.6%131.7 – 268.6
9.9 – 31.4
77.3% – 94.4%
personal health indicators – Score = 75.0; rank = 5 San Francisco MSA
82.6%48.6%26.1%8.8%
18.1%59.5%34.8%
38.5%
8.7%2.4%8.1%159.416.8
89.6%
Community/environmental indicators – Score = 59.3; rank = 14
San Francisco
18.0%6.7
20.814.6%5.9%
0.93.31.80.92.80.71.12.1
$192.0
3
126.2

106
Population
Percent less than 18 years old
Percent 18 to 64 years old
Percent 65 years old and older
Percent male
Percent high school graduate or higher
Percent White
Percent Black or African American
Percent Asian
Percent Other Race
Percent Hispanic/Latino
Percent unemployed
Median household income
Percent of households below poverty level
Violent crime rate/100,000*
Percent with disability
307,006,550
24.3%
62.8%
12.9%
49.3%
85.3%
74.8%
12.4%
4.5%
8.3%
15.8%
9.9%
$50,221
10.5%
429.4
12.0%
3,325,885
24.6%
63.6%
11.8%
49.2%
86.7%
72.3%
15.0%
5.1%
7.6%
15.1%
9.8%
$55,331
9.5%
11.0%
*Due to differences in jurisdictional definitions and reporting, the FBI recommends that these rates not be compared across areas
1,123,804 – 19,069,796
20.2% – 29.4%
60.5% – 66.9%
7.9% – 17.2%
48.1% – 51.1%
77.6% – 92.5%
49.8% – 88.6%
1.7% – 44.5%
1.2% – 30.2%
1.9% – 24.5%
1.2% – 53.4%
6.4% – 16.3%
$43,633 – $85,168
4.9% – 15.1%
7.4% – 14.5%
U.S. Value MSA Average MSA Range
1,839,700
24.6%
64.5%
10.9%
51.1%
85.4%
51.2%
2.5%
30.2%
16.1%
27.1%
10.5%
$84,483
6.6%
288.6
7.4%
San Jose MSA
deSCription oF SAn joSe-SunnyvALe-SAntA CLArA, CA MSA
• Fewer acres of parkland per capita• Lower percent using public transportation
to work• Fewer ball diamonds per capita
• Fewer golf courses per capita• Fewer park units per capita• Fewer swimming pools per capita• Fewer tennis courts per capita
opportunitieS/ChALLenGeS
• Higher median household income• Lower percentage of households below
poverty level• Higher percentage eating 5+ servings of
fruits/vegetables per day • Lower percent currently smoking• Lower percent obese• Lower percent of days when physical health
was not good during the last 30 days• Lower percent with asthma
• Lower percent with angina or coronary heart disease
• Lower death rate for cardiovascular disease• Higher percent of city land area as parkland• Higher percent bicycling or walking to work• Higher park-related expenditures per capita• Higher level of state requirement for Physical
Education classes• Higher number of primary health care providers
per capita
StrenGthS/AdvAntAGeS
ranking: total Score = 65.2; rank = 11
SAn joSe, CA(San Jose-Sunnyvale-Santa Clara, CA MSA)
CountieS San Benito, Santa Clara

107
ACSM AMeriCAn FitneSS indextM CoMponentS
Health Behaviors Percent any physical activity or exercise in the last 30 days Percent physically active at least moderatelyPercent eating 5+ servings of fruits/vegetables per dayPercent currently smoking
Chronic Health ProblemsPercent obesePercent in excellent or very good healthAny days when physical health was not good during
the past 30 daysAny days when mental health was not good during
the past 30 daysPercent with asthmaPercent with angina or coronary heart diseasePercent with diabetesDeath rate/100,000 for cardiovascular diseaseDeath rate/100,000 for diabetes
Health Care
Percent with health insurance
76.2%51.0%23.4%17.9%
26.9%56.0%35.5%
33.7%
8.8%3.8%8.3%206.722.5
85.6%
77.2%48.7%24.4%17.0%
25.9%56.8%35.3%
34.4%
8.3%3.6%8.3%201.021.9
86.3%
Built EnvironmentParkland as percent of city land areaAcres of parkland/1,000Farmers’ markets/1,000,000Percent using public transportation to workPercent bicycling or walking to work
Recreational FacilitiesBall diamonds/10,000Dog parks/10,000Park playgrounds/10,000Golf courses/100,000Park units/10,000Recreation centers/20,000Swimming pools/100,000Tennis courts/10,000
Park-related expenditures per capita
Level of state requirement for Physical Education classes**
Number of primary health care providers per 100,000
2.5% – 25.3%2.3 – 94.11.0 – 41.0
0.4% – 30.5%1.2% – 6.7%
0.3 – 5.70.0 – 5.70.9 – 4.80.0 – 5.0
1.2 – 10.90.1 – 2.60.6 – 9.20.8 – 6.9
$12.0 – $259.0
0 – 3
46.8 – 133.7
(note: most of these data were available only for the main city in the MSA)
**3 = required at three levels: high school, middle school and elementary school; 2= required at two levels; 1= required at only one level
70.4% – 85.9%36.4% – 58.1%15.8% – 30.0%8.8% – 25.3%
18.1% – 34.3%46.4% – 66.6%29.5% – 40.3%
23.8% – 41.9%
4.5% – 11.9%2.4% – 5.6%5.4% – 11.6%131.7 – 268.6
9.9 – 31.4
77.3% – 94.4%
U.S. Value MSA Average MSA Range
MSA Average Range of all Cities
10.6%18.914.84.3%2.8%
2.00.92.31.04.21.13.12.1
$101.5
2.5
93.2
personal health indicators – Score = 78.5; rank = 3San Jose MSA
Community/environmental indicators – Score = 52.9; rank = 24
81.5%47.4%29.3%8.8%
20.8%58.3%29.5%
33.1%
4.5%2.7%8.9%146.622.6
91.9%
San Jose
14.3%16.914.73.1%3.6%
0.50.92.40.32.71.10.60.8
$147
3
111.3
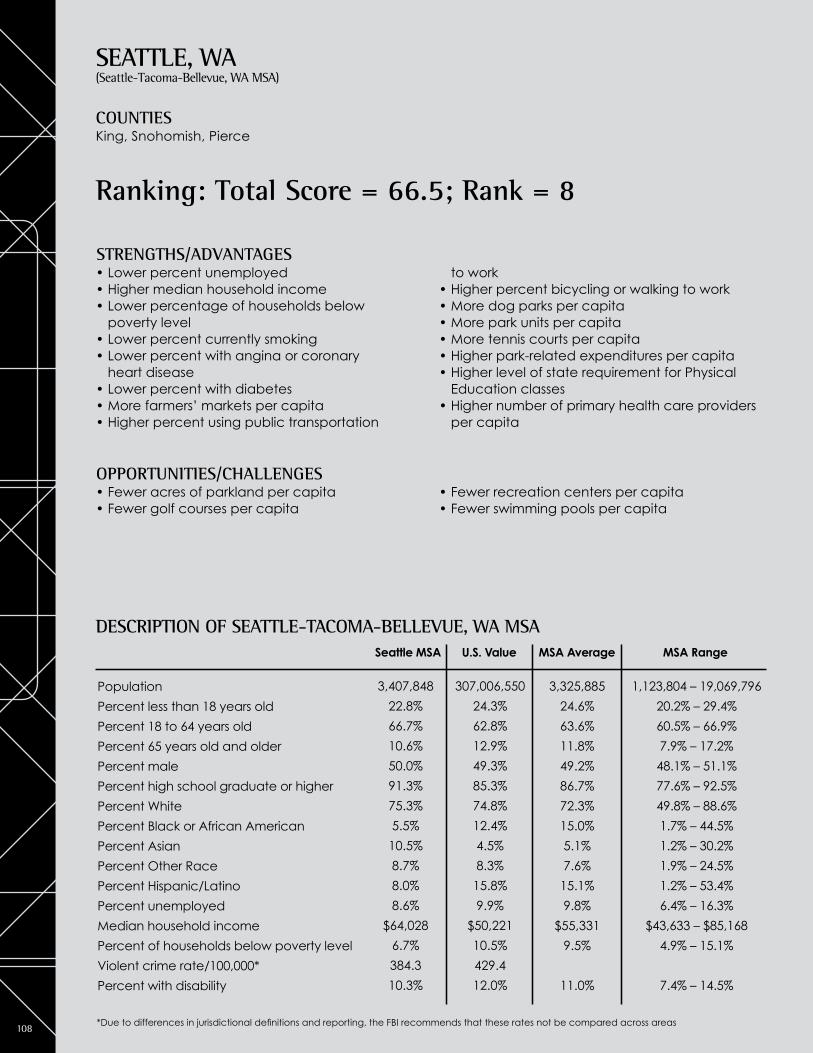
108
Population
Percent less than 18 years old
Percent 18 to 64 years old
Percent 65 years old and older
Percent male
Percent high school graduate or higher
Percent White
Percent Black or African American
Percent Asian
Percent Other Race
Percent Hispanic/Latino
Percent unemployed
Median household income
Percent of households below poverty level
Violent crime rate/100,000*
Percent with disability
307,006,550
24.3%
62.8%
12.9%
49.3%
85.3%
74.8%
12.4%
4.5%
8.3%
15.8%
9.9%
$50,221
10.5%
429.4
12.0%
3,325,885
24.6%
63.6%
11.8%
49.2%
86.7%
72.3%
15.0%
5.1%
7.6%
15.1%
9.8%
$55,331
9.5%
11.0%
*Due to differences in jurisdictional definitions and reporting, the FBI recommends that these rates not be compared across areas
1,123,804 – 19,069,796
20.2% – 29.4%
60.5% – 66.9%
7.9% – 17.2%
48.1% – 51.1%
77.6% – 92.5%
49.8% – 88.6%
1.7% – 44.5%
1.2% – 30.2%
1.9% – 24.5%
1.2% – 53.4%
6.4% – 16.3%
$43,633 – $85,168
4.9% – 15.1%
7.4% – 14.5%
U.S. Value MSA Average MSA Range
ranking: total Score = 66.5; rank = 8
StrenGthS/AdvAntAGeS• Lower percent unemployed• Higher median household income• Lower percentage of households below
poverty level• Lower percent currently smoking• Lower percent with angina or coronary
heart disease• Lower percent with diabetes• More farmers’ markets per capita• Higher percent using public transportation
to work• Higher percent bicycling or walking to work• More dog parks per capita• More park units per capita• More tennis courts per capita• Higher park-related expenditures per capita• Higher level of state requirement for Physical
Education classes• Higher number of primary health care providers
per capita
opportunitieS/ChALLenGeS• Fewer acres of parkland per capita• Fewer golf courses per capita
• Fewer recreation centers per capita• Fewer swimming pools per capita
deSCription oF SeAttLe-tACoMA-BeLLevue, WA MSA
3,407,848
22.8%
66.7%
10.6%
50.0%
91.3%
75.3%
5.5%
10.5%
8.7%
8.0%
8.6%
$64,028
6.7%
384.3
10.3%
Seattle MSA
SeAttLe, WA(Seattle-Tacoma-Bellevue, WA MSA)
CountieS King, Snohomish, Pierce

109
ACSM AMeriCAn FitneSS indextM CoMponentS
Health Behaviors Percent any physical activity or exercise in the last 30 days Percent physically active at least moderatelyPercent eating 5+ servings of fruits/vegetables per dayPercent currently smoking
Chronic Health ProblemsPercent obesePercent in excellent or very good healthAny days when physical health was not good during
the past 30 daysAny days when mental health was not good during
the past 30 daysPercent with asthmaPercent with angina or coronary heart diseasePercent with diabetesDeath rate/100,000 for cardiovascular diseaseDeath rate/100,000 for diabetes
Health Care
Percent with health insurance
76.2%51.0%23.4%17.9%
26.9%56.0%35.5%
33.7%
8.8%3.8%8.3%206.722.5
85.6%
77.2%48.7%24.4%17.0%
25.9%56.8%35.3%
34.4%
8.3%3.6%8.3%201.021.9
86.3%
Built EnvironmentParkland as percent of city land areaAcres of parkland/1,000Farmers’ markets/1,000,000Percent using public transportation to workPercent bicycling or walking to work
Recreational FacilitiesBall diamonds/10,000Dog parks/10,000Park playgrounds/10,000Golf courses/100,000Park units/10,000Recreation centers/20,000Swimming pools/100,000Tennis courts/10,000
Park-related expenditures per capita
Level of state requirement for Physical Education classes**
Number of primary health care providers per 100,000
2.5% – 25.3%2.3 – 94.11.0 – 41.0
0.4% – 30.5%1.2% – 6.7%
0.3 – 5.70.0 – 5.70.9 – 4.80.0 – 5.0
1.2 – 10.90.1 – 2.60.6 – 9.20.8 – 6.9
$12.0 – $259.0
0 – 3
46.8 – 133.7
(note: most of these data were available only for the main city in the MSA)
**3 = required at three levels: high school, middle school and elementary school; 2= required at two levels; 1= required at only one level
70.4% – 85.9%36.4% – 58.1%15.8% – 30.0%8.8% – 25.3%
18.1% – 34.3%46.4% – 66.6%29.5% – 40.3%
23.8% – 41.9%
4.5% – 11.9%2.4% – 5.6%5.4% – 11.6%131.7 – 268.6
9.9 – 31.4
77.3% – 94.4%
U.S. Value MSA Average MSA Range
MSA Average Range of all Cities
10.6%18.914.84.3%2.8%
2.00.92.31.04.21.13.12.1
$101.5
2.5
93.2
10.2%9.1
21.18.7%4.5%
1.91.82.20.87.20.91.72.8
$252
3
104.7
Seattle
Community/environmental indicators – Score = 67.5; rank = 6
81.8%50.3%26.3%13.3%
23.9%57.6%38.2%
35.8%
8.8%3.1%7.3%181.721.3
87.3%
Seattle MSA
personal health indicators – Score = 65.4; rank = 14

110
Population
Percent less than 18 years old
Percent 18 to 64 years old
Percent 65 years old and older
Percent male
Percent high school graduate or higher
Percent White
Percent Black or African American
Percent Asian
Percent Other Race
Percent Hispanic/Latino
Percent unemployed
Median household income
Percent of households below poverty level
Violent crime rate/100,000*
Percent with disability
307,006,550
24.3%
62.8%
12.9%
49.3%
85.3%
74.8%
12.4%
4.5%
8.3%
15.8%
9.9%
$50,221
10.5%
429.4
12.0%
3,325,885
24.6%
63.6%
11.8%
49.2%
86.7%
72.3%
15.0%
5.1%
7.6%
15.1%
9.8%
$55,331
9.5%
11.0%
*Due to differences in jurisdictional definitions and reporting, the FBI recommends that these rates not be compared across areas
1,123,804 – 19,069,796
20.2% – 29.4%
60.5% – 66.9%
7.9% – 17.2%
48.1% – 51.1%
77.6% – 92.5%
49.8% – 88.6%
1.7% – 44.5%
1.2% – 30.2%
1.9% – 24.5%
1.2% – 53.4%
6.4% – 16.3%
$43,633 – $85,168
4.9% – 15.1%
7.4% – 14.5%
U.S. Value MSA Average MSA Range
2,747,272
21.6%
61.2%
17.2%
48.7%
86.5%
81.3%
11.9%
2.9%
3.9%
15.1%
11.7%
$44,061
10.0%
588.9
13.3%
Tampa MSA
deSCription oF tAMpA-St. peterSBurG-CLeArWAter, FL MSA
• Higher percent unemployed• Lower median household income• Higher percent currently smoking• Higher percent obese• Higher percent of days when physical health
was not good during the past 30 days• Higher percent with angina or coronary
heart disease• Higher percent with diabetes• Higher death rate for diabetes
• Lower percent of city land area as parkland• Fewer acres of parkland per capita• Fewer farmers’ markets per capita• Lower percent using public transportation
to work• Lower percent bicycling or walking to work• Fewer golf courses per capita• Fewer tennis courts per capita• Lower level of state requirement for Physical
Education classes
opportunitieS/ChALLenGeS
StrenGthS/AdvAntAGeS• Lower percent with asthma• Lower death rate for cardiovascular disease• More ball diamonds per capita• More dog parks per capita
• More park units per capita• More recreation centers per capita• More swimming pools per capita• Higher park-related expenditures per capita
ranking: total Score = 40.4; rank = 40
tAMpA, FL(Tampa-St. Petersburg-Clearwater, FL MSA)
CountieS Hernando, Hillsborough, Pasco, Pinellas

111
ACSM AMeriCAn FitneSS indextM CoMponentS
Health Behaviors Percent any physical activity or exercise in the last 30 days Percent physically active at least moderatelyPercent eating 5+ servings of fruits/vegetables per dayPercent currently smoking
Chronic Health ProblemsPercent obesePercent in excellent or very good healthAny days when physical health was not good during
the past 30 daysAny days when mental health was not good during
the past 30 daysPercent with asthmaPercent with angina or coronary heart diseasePercent with diabetesDeath rate/100,000 for cardiovascular diseaseDeath rate/100,000 for diabetes
Health Care
Percent with health insurance
76.2%51.0%23.4%17.9%
26.9%56.0%35.5%
33.7%
8.8%3.8%8.3%206.722.5
85.6%
77.2%48.7%24.4%17.0%
25.9%56.8%35.3%
34.4%
8.3%3.6%8.3%201.021.9
86.3%
Built EnvironmentParkland as percent of city land areaAcres of parkland/1,000Farmers’ markets/1,000,000Percent using public transportation to workPercent bicycling or walking to work
Recreational FacilitiesBall diamonds/10,000Dog parks/10,000Park playgrounds/10,000Golf courses/100,000Park units/10,000Recreation centers/20,000Swimming pools/100,000Tennis courts/10,000
Park-related expenditures per capita
Level of state requirement for Physical Education classes**
Number of primary health care providers per 100,000
2.5% – 25.3%2.3 – 94.11.0 – 41.0
0.4% – 30.5%1.2% – 6.7%
0.3 – 5.70.0 – 5.70.9 – 4.80.0 – 5.0
1.2 – 10.90.1 – 2.60.6 – 9.20.8 – 6.9
$12.0 – $259.0
0 – 3
46.8 – 133.7
(note: most of these data were available only for the main city in the MSA)
**3 = required at three levels: high school, middle school and elementary school; 2= required at two levels; 1= required at only one level
70.4% – 85.9%36.4% – 58.1%15.8% – 30.0%8.8% – 25.3%
18.1% – 34.3%46.4% – 66.6%29.5% – 40.3%
23.8% – 41.9%
4.5% – 11.9%2.4% – 5.6%5.4% – 11.6%131.7 – 268.6
9.9 – 31.4
77.3% – 94.4%
U.S. Value MSA Average MSA Range
MSA Average Range of all Cities
10.6%18.914.84.3%2.8%
2.00.92.31.04.21.13.12.1
$101.5
2.5
93.2
personal health indicators – Score = 28.9; rank = 46Tampa MSA
74.7%45.4%24.7%21.3%
29.2%53.8%39.1%
32.8%
6.9%5.5%
10.9%179.724.8
82.9%
Community/environmental indicators – Score = 51.1; rank = 27
Tampa
4.7%9.97.3
1.4%2.1%
3.12.12.40.95.41.53.81.4
$120
1
87.1

112
Population
Percent less than 18 years old
Percent 18 to 64 years old
Percent 65 years old and older
Percent male
Percent high school graduate or higher
Percent White
Percent Black or African American
Percent Asian
Percent Other Race
Percent Hispanic/Latino
Percent unemployed
Median household income
Percent of households below poverty level
Violent crime rate/100,000*
Percent with disability
*Due to differences in jurisdictional definitions and reporting, the FBI recommends that these rates not be compared across areas
U.S. Value
307,006,550
24.3%
62.8%
12.9%
49.3%
85.3%
74.8%
12.4%
4.5%
8.3%
15.8%
9.9%
$50,221
10.5%
429.4
12.0%
3,325,885
24.6%
63.6%
11.8%
49.2%
86.7%
72.3%
15.0%
5.1%
7.6%
15.1%
9.8%
$55,331
9.5%
11.0%
MSA Average MSA Range
1,123,804 – 19,069,796
20.2% – 29.4%
60.5% – 66.9%
7.9% – 17.2%
48.1% – 51.1%
77.6% – 92.5%
49.8% – 88.6%
1.7% – 44.5%
1.2% – 30.2%
1.9% – 24.5%
1.2% – 53.4%
6.4% – 16.3%
$43,633 – $85,168
4.9% – 15.1%
7.4% – 14.5%
1,674,498
24.2%
64.3%
11.5%
48.9%
89.4%
61.3%
31.2%
3.2%
4.3%
4.5%
7.9%
$55,209
7.8%
N/A‡
10.5%
Virginia Beach MSA
deSCription oF virGiniA BeACh-norFoLK-neWport neWS, vA-nC MSA
• Higher percent currently smoking• Fewer farmers’ markets per capita• Lower percent using public transportation
to work
• Fewer dog parks per capita• Fewer recreation centers per capita• Fewer swimming pools per capita
opportunitieS/ChALLenGeS
• Lower percent unemployed• Lower percentage of households below
poverty level• Higher percentage eating 5+ servings of
fruits/vegetables per day• Lower percent with angina or coronary
heart disease• Higher percent of city land area and parkland• More acres of parkland per capita
• More ball diamonds per capita• More park playgrounds per capita• More golf courses per capita• More park units per capita• More tennis courts per capita• Higher park-related expenditures per capita• Higher level of state requirement for Physical
Education classes
StrenGthS/AdvAntAGeS
ranking: total Score = 65.8; rank = 9
virGiniA BeACh, vA(Virginia Beach-Norfolk-Newport News, VA-NC MSA)
CountieS Currituck NC, Gloucester VA, Isle of Wight VA, James City VA, Mathews VA, Surry VA, York VA, Chesapeake City VA, Hampton City VA, Newport News City VA, Norfolk City VA, Poquoson City VA, Portsmouth City VA, Suffolk City VA, Virginia Beach City VA, Williamsburg City VA
‡This measure was not available.

113
ACSM AMeriCAn FitneSS indextM CoMponentS
Built EnvironmentParkland as percent of city land areaAcres of parkland/1,000Farmers’ markets/1,000,000Percent using public transportation to workPercent bicycling or walking to work
Recreational FacilitiesBall diamonds/10,000Dog parks/10,000Park playgrounds/10,000Golf courses/100,000Park units/10,000Recreation centers/20,000Swimming pools/100,000Tennis courts/10,000
Park-related expenditures per capita
Level of state requirement for Physical Education classes**
Number of primary health care providers per 100,000
(note: most of these data were available only for the main city in the MSA)
**3 = required at three levels: high school, middle school and elementary school; 2= required at two levels; 1= required at only one level
Health Behaviors Percent any physical activity or exercise in the last 30 days Percent physically active at least moderatelyPercent eating 5+ servings of fruits/vegetables per dayPercent currently smoking
Chronic Health ProblemsPercent obesePercent in excellent or very good healthAny days when physical health was not good during
the past 30 daysAny days when mental health was not good during
the past 30 daysPercent with asthmaPercent with angina or coronary heart diseasePercent with diabetesDeath rate/100,000 for cardiovascular diseaseDeath rate/100,000 for diabetes
Health Care
Percent with health insurance
76.2%51.0%23.4%17.9%
26.9%56.0%35.5%
33.7%
8.8%3.8%8.3%206.722.5
85.6%
U.S. Value MSA Average
77.2%48.7%24.4%17.0%
25.9%56.8%35.3%
34.4%
8.3%3.6%8.3%201.021.9
86.3%
MSA Average
10.6%18.914.84.3%2.8%
2.00.92.31.04.21.13.12.1
$101.5
2.5
93.2
Range of all Cities
2.5% – 25.3%2.3 – 94.11.0 – 41.0
0.4% – 30.5%1.2% – 6.7%
0.3 – 5.70.0 – 5.70.9 – 4.80.0 – 5.0
1.2 – 10.90.1 – 2.60.6 – 9.20.8 – 6.9
$12.0 – $259.0
0 – 3
46.8 – 133.7
MSA Range
70.4% – 85.9%36.4% – 58.1%15.8% – 30.0%8.8% – 25.3%
18.1% – 34.3%46.4% – 66.6%29.5% – 40.3%
23.8% – 41.9%
4.5% – 11.9%2.4% – 5.6%5.4% – 11.6%131.7 – 268.6
9.9 – 31.4
77.3% – 94.4%
personal health indicators – Score = 67.1; rank = 11 Virginia Beach MSA
81.0%52.5%30.0%18.9%
24.1%58.7%32.1%
32.9%
8.8%3.2%8.3%208.821.9
88.5%
Community/environmental indicators – Score = 64.7; rank = 8
Virginia Beach
21.2%77.610.71.4%2.8%
3.20.54.81.26.90.31.43.7
$142
3
85.6

114
Population
Percent less than 18 years old
Percent 18 to 64 years old
Percent 65 years old and older
Percent male
Percent high school graduate or higher
Percent White
Percent Black or African American
Percent Asian
Percent Other Race
Percent Hispanic/Latino
Percent unemployed
Median household income
Percent of households below poverty level
Violent crime rate/100,000*
Percent with disability
307,006,550
24.3%
62.8%
12.9%
49.3%
85.3%
74.8%
12.4%
4.5%
8.3%
15.8%
9.9%
$50,221
10.5%
429.4
12.0%
3,325,885
24.6%
63.6%
11.8%
49.2%
86.7%
72.3%
15.0%
5.1%
7.6%
15.1%
9.8%
$55,331
9.5%
11.0%
*Due to differences in jurisdictional definitions and reporting, the FBI recommends that these rates not be compared across areas
1,123,804 – 19,069,796
20.2% – 29.4%
60.5% – 66.9%
7.9% – 17.2%
48.1% – 51.1%
77.6% – 92.5%
49.8% – 88.6%
1.7% – 44.5%
1.2% – 30.2%
1.9% – 24.5%
1.2% – 53.4%
6.4% – 16.3%
$43,633 – $85,168
4.9% – 15.1%
7.4% – 14.5%
U.S. Value MSA Average MSA RangeWashington MSA
5,476,241
24.4%
65.5%
10.0%
48.9%
90.0%
57.1%
26.0%
8.6%
8.3%
13.0%
7.3%
$85,168
4.9%
402.4
8.0%
deSCription oF WAShinGton-ArLinGton-ALexAndriA, dC-vA-Md-Wv MSA
• Fewer acres of parkland per capita• Fewer dog parks per capita
• Fewer park playgrounds per capita• Fewer golf courses per capita
opportunitieS/ChALLenGeS
• Lower percent unemployed• Higher median household income• Lower percentage of households below
poverty level• Higher percentage eating 5+ servings of
fruits/vegetables per day• Lower percent currently smoking• Lower percent obese• Higher percent in excellent or very good health• Lower percent with angina or coronary
heart disease• Lower percent with diabetes• Lower death rate for diabetes • Higher percent of city land area as parkland
• More farmers’ markets per capita• Higher percent using public transportation
to work• Higher percent bicycling or walking to work• More park units per capita• More recreation centers per capita• More swimming pools per capita• More tennis courts per capita• Higher park-related expenditures per capita• Higher level of state requirement for Physical
Education classes• Higher number of primary health care providers
per capita
StrenGthS/AdvAntAGeS
ranking: total Score = 76.8; rank = 2
WAShinGton, dC(Washington-Arlington-Alexandria, DC-VA-MD-WV MSA)
CountieS Frederick MD, Montgomery MD, District of Columbia DC, Calvert MD, Charles MD, Prince George’s MD, Arlington VA, Clarke VA, Fairfax VA, Fauquier VA, Loudoun VA, Prince William VA, Spotsylvania VA, Stafford VA, Warren VA, Alexandria City VA, Fairfax City VA, Falls Church City VA, Fredericksburg City VA, Manassas City VA, Manassas Park City VA, Jefferson WV

115
ACSM AMeriCAn FitneSS indextM CoMponentS
Health Behaviors Percent any physical activity or exercise in the last 30 days Percent physically active at least moderatelyPercent eating 5+ servings of fruits/vegetables per dayPercent currently smoking
Chronic Health ProblemsPercent obesePercent in excellent or very good healthAny days when physical health was not good during
the past 30 daysAny days when mental health was not good during
the past 30 daysPercent with asthmaPercent with angina or coronary heart diseasePercent with diabetesDeath rate/100,000 for cardiovascular diseaseDeath rate/100,000 for diabetes
Health Care
Percent with health insurance
Built EnvironmentParkland as percent of city land areaAcres of parkland/1,000Farmers’ markets/1,000,000Percent using public transportation to workPercent bicycling or walking to work
Recreational FacilitiesBall diamonds/10,000Dog parks/10,000Park playgrounds/10,000Golf courses/100,000Park units/10,000Recreation centers/20,000Swimming pools/100,000Tennis courts/10,000
Park-related expenditures per capita
Level of state requirement for Physical Education classes**
Number of primary health care providers per 100,000
(note: most of these data were available only for the main city in the MSA)
**3 = required at three levels: high school, middle school and elementary school; 2= required at two levels; 1= required at only one level
U.S. Value
76.2%51.0%23.4%17.9%
26.9%56.0%35.5%
33.7%
8.8%3.8%8.3%206.722.5
85.6%
MSA Average
10.6%18.914.84.3%2.8%
2.00.92.31.04.21.13.12.1
$101.5
2.5
93.2
MSA Average
77.2%48.7%24.4%17.0%
25.9%56.8%35.3%
34.4%
8.3%3.6%8.3%201.021.9
86.3%
2.5% – 25.3%2.3 – 94.11.0 – 41.0
0.4% – 30.5%1.2% – 6.7%
0.3 – 5.70.0 – 5.70.9 – 4.80.0 – 5.0
1.2 – 10.90.1 – 2.60.6 – 9.20.8 – 6.9
$12.0 – $259.0
0 – 3
46.8 – 133.7
Range of all Cities
70.4% – 85.9%36.4% – 58.1%15.8% – 30.0%8.8% – 25.3%
18.1% – 34.3%46.4% – 66.6%29.5% – 40.3%
23.8% – 41.9%
4.5% – 11.9%2.4% – 5.6%5.4% – 11.6%131.7 – 268.6
9.9 – 31.4
77.3% – 94.4%
MSA RangeWashington MSA
personal health indicators – Score = 81.3; rank = 1
Community/environmental indicators – Score = 72.6; rank = 3
81.6%48.4%27.5%13.6%
21.4%64.1%33.6%
32.7%
7.6%2.8%7.1%187.018.9
91.5%
Washington
19.4%12.918.6
14.1%3.8%
2.00.51.70.56.42.46.13.5
$259
3
105.2

116
Appendix A – dAtA SourCeS
variable data Source Web Site
http://www.census.gov/popest/estimates.html
http://factfinder.census.gov/servlet/DatasetMainPage Servlet?_program=PEP&_submenuId=&_lang=en&_ts=
http://factfinder.census.gov/servlet/DatasetMainPage Servlet?_program=ACS&_submenuId=&_lang=en&_ts=
http://factfinder.census.gov/servlet/DatasetMainPage Servlet?_program=ACS&_submenuId=&_lang=en&_ts=
http://factfinder.census.gov/servlet/DatasetMainPage Servlet?_program=ACS&_submenuId=&_lang=en&_ts=
http://factfinder.census.gov/servlet/DatasetMainPage Servlet?_program=ACS&_submenuId=&_lang=en&_ts=
http://factfinder.census.gov/servlet/DatasetMainPage Servlet?_program=ACS&_submenuId=&_lang=en&_ts=
http://factfinder.census.gov/servlet/DatasetMainPage Servlet?_program=ACS&_submenuId=&_lang=en&_ts=
http://factfinder.census.gov/servlet/DatasetMainPage Servlet?_program=ACS&_submenuId=&_lang=en&_ts=
http://www2.fbi.gov/ucr/cius2009/data/table_06.html
http://factfinder.census.gov/servlet/DatasetMainPage Servlet?_program=ACS&_submenuId=&_lang=en&_ts=
http://apps.nccd.cdc.gov/brfss-smart/SelMMSAPrev Data.asp
http://apps.nccd.cdc.gov/brfss-smart/SelMMSAPrev Data.asp
http://apps.nccd.cdc.gov/brfss-smart/SelMMSAPrev Data.asp
http://apps.nccd.cdc.gov/brfss-smart/SelMMSAPrev Data.asp
http://apps.nccd.cdc.gov/brfss-smart/SelMMSAPrev Data.asp
http://apps.nccd.cdc.gov/brfss-smart/SelMMSAPrev Data.asp
http://www.cdc.gov/brfss/technical_infodata/survey6
http://www.cdc.gov/brfss/technical_infodata/survey data/2009.htm
2009 US Census
2009 US Census
US Census – 2009 American Community Survey
US Census – 2009 American Community Survey
US Census – 2009 American Community Survey
US Census – 2009 American Community Survey
US Census – 2009 American Community Survey
US Census – 2009 American Community Survey
US Census – 2009 American Community Survey
FBI Uniform Crime Reporting Program 2009
US Census – 2009 American Community Survey
2009 SMART BRFSS – MSA Data
2009 SMART BRFSS – MSA Data
2009 SMART BRFSS – MSA Data
2009 SMART BRFSS – MSA Data
2009 SMART BRFSS – MSA Data
2009 SMART BRFSS – MSA Data
2009 BRFSS
2009 BRFSS
Population Estimate
Age Groups
Percent male
Percent high school graduate or higher
Percent in each race groups
Percent Hispanic/Latino
Percent unemployed
Median household income
Percent of households below poverty level
Violent crime rate/100,000
Percent with disability
Percent physically active or exercising in the last 30 days
Percent physically active at least moderately
Percent eating 5+ fruits/ vegetables per day
Percent currently smoking
Percent obese
Percent in excellent or very good health
Any days when physical health, was not good during the past 30 days
Any days when mental health, was not good during the past 30 days

117
Percent with asthma
Percent with angina or coronary heart disease
Percent with diabetes
Death rate/100,000 for cardiovascular disease
Death rate/100,000 for diabetes
Percent with health insurance
Parkland as a percent of MSA and area
Acres of parkland/1,000
Farmers’ markets/1,000,000
Percent using public transportation to work
Percent bicycling or walking to work
Ball diamonds/10,000
Dog parks/10,000
Park playgrounds/10,000
Golf courses/100,000
Park units/10,000
Recreation centers/20,000
Swimming pools/100,000
Tennis courts/10,000
Park-related expenditures per capita
Level of state requirement for Physical Education classes
Number of primary health care providers per 100,000
2009 SMART BRFSS – MSA Data
2009 SMART BRFSS – MSA Data
2009 SMART BRFSS – MSA Data
2007 CDC Wonder
2007 CDC Wonder
2009 SMART BRFSS – MSA Data
2010 City Park Facts – The Trust for Public Land
2010 City Park Facts – The Trust for Public Land
USDA Farmers Markets
US Census – 2009 American Community Survey
US Census – 2009 American Community Survey
2010 City Park Facts – The Trust for Public Land
2010 City Park Facts – The Trust for Public Land
2010 City Park Facts – The Trust for Public Land
2010 City Park Facts – The Trust for Public Land
2010 City Park Facts – The Trust for Public Land
2010 City Park Facts – The Trust for Public Land
2010 City Park Facts – The Trust for Public Land
2010 City Park Facts – The Trust for Public Land
2010 City Park Facts – The Trust for Public Land
2006 – School Health Policies and Programs Study
2009 HRSA Area Resource File
Appendix A – dAtA SourCeS
variable data Source Web Site
http://apps.nccd.cdc.gov/brfss-smart/SelMMSAPrevData.asp
http://apps.nccd.cdc.gov/brfss-smart/SelMMSAPrevData.asp
http://apps.nccd.cdc.gov/brfss-smart/SelMMSAPrevData.asp
http://wonder.cdc.gov
http://wonder.cdc.gov
http://apps.nccd.cdc.gov/brfss-smart/SelMMSAPrevData.asp
http://www.tpl.org/tier3_cd.cfm?content_item_id=20531&folder_id=3208
http://www.tpl.org/tier3_cd.cfm?content_item_id=20531&folder_id=3208
http://apps.ams.usda.gov/FarmersMarkets/
http://factfinder.census.gov/servlet/DatasetMainPage Servlet?_program=ACS&_submenuId=&_lang=en&_ts=
http://factfinder.census.gov/servlet/DatasetMainPage Servlet?_program=ACS&_submenuId=&_lang=en&_ts=
http://www.tpl.org/tier3_cd.cfm?content_item_id=20531&folder_id=3208
http://www.tpl.org/tier3_cd.cfm?content_item_id=20531&folder_id=3208
http://www.tpl.org/tier3_cd.cfm?content_item_id=20531&folder_id=3208
http://www.tpl.org/tier3_cd.cfm?content_item_id=20531&folder_id=3208
http://www.tpl.org/tier3_cd.cfm?content_item_id=20531&folder_id=3208
http://www.tpl.org/tier3_cd.cfm?content_item_id=20531&folder_id=3208
http://www.tpl.org/tier3_cd.cfm?content_item_id=20531&folder_id=3208
http://www.tpl.org/tier3_cd.cfm?content_item_id=20531&folder_id=3208
http://www.tpl.org/tier3_cd.cfm?content_item_id=20531&folder_id=3208
http://www.cdc.gov/HealthyYouth/shpps/2006/report-cards/index.htm
http://www.arfsys.com/ *Note: The Area Resource File must be purchased. This web site describes the database.

118
BarbaraE.Ainsworth,Ph.D.,MPH,FACSMArizona State UniversityMesa, Arizona
StevenN.Blair,P.E.D,FACSMUniversity of South CarolinaColumbia, South Carolina
JacquelineEpping,M.Ed.Centers for Disease Control and Prevention (CDC)Atlanta, Georgia
JohnM.Jakicic,Ph.D.,FACSMUniversity of PittsburghPittsburgh, Pennsylvania
NiColeKeith,Ph.D.,FACSMIndiana University Indianapolis, Indiana
RoseannM.Lyle,Ph.D.,FACSMPurdue UniversityWest Lafayette, Indiana
MelindaM.Manore,Ph.D.,R.D.,FACSMOregon State UniversityCorvallis, Oregon
KennethE.Powell,M.D.,M.P.H.,FACSMEpidemiologic and Public Health ConsultantAtlanta, Georgia
WalterR.Thompson,Ph.D.,FACSMGeorgia State UniversityAtlanta, Georgia
WesWong,M.D.,M.M.M.Anthem Blue Cross Blue Shield (WellPoint)Indianapolis, Indiana
StellaLuciaVolpe,Ph.D.,R.D.,FACSMDrexel UniversityPhiladelphia, Pennsylvania
AFi AdviSory BoArd MeMBerS:
Appendix B – MeMBerS oF the expert pAneL

119
AdditionAL MeMBerS For AFi expert pAneL:
Appendix B – MeMBerS oF the expert pAneL
RossAndersen,Ph.D.,FACSMMcGill UniversityMontreal, Quebec, Canada
LauraBrennanRamirez,Ph.D.,MPHTranstria LLCSt. Louis, Missouri
NatalieColabianchi,Ph.D.University of South CarolinaColumbia, South Carolina
KarenJ.Coleman,Ph.D.Southern California Permanente Medical GroupPasadena, California
KellyEvenson,Ph.D.,FACSMUniversity of North Carolina-Chapel HillChapel Hill, North Carolina
SandraHam,M.S.Centers for Disease Control and PreventionAtlanta, Georgia
ChristineHoehner,Ph.D.,M.S.P.H.Saint Louis UniversitySt. Louis, Missouri
LauraKettelKhan,Ph.D.Centers for Disease Control and Prevention (CDC)Atlanta, Georgia
HaroldW.(Bill)Kohl,Ph.D.,FACSMUniversity of TexasAustin, Texas
CarolineA.Macera,Ph.D.,FACSMSan Diego State UniversitySan Diego, California
RobertH.McNulty,J.D.Partners for Livable CommunitiesWashington, DC
MarciaG.Ory,Ph.D.,M.P.H.Texas A & M Health Science CenterCollege Station, Texas
NicoPronk,Ph.D.,FACSMHealthPartners Minneapolis, Minnesota
RobertSallis,M.D.,FACSMKaiser PermanenteRancho Cucamonga, California
PatriciaSharpe,Ph.D.,M.P.H.University of South CarolinaColumbia, South Carolina
DavidWilliams,Ph.D.Brown Medical School and the Miriam HospitalProvidence, Rhode Island

120
My AFI is the community application tool of the ACSM American Fitness Index™ (AFI) Program. My AFI integrates the components of the ACSM American Fitness Index™ into a health promotion approach that can be applied in just about any community. Using the My AFI Data Template in this section, stakeholders can gain an understanding of the individual and societal behaviors related to physical activity in their community.
My AFI Data
Step 1
Complete the My AFI Data Template for your community using the data sources listed in the Appendix A of the 2010 data report.
• The indicators on the My AFI Data Template highlighted with an asterisk (*) are not modifiable through community health programming, but help provide a description of your community’s population characteristics. This information is helpful when choosing the target audiences and strategies for implementing programs.
• All the data may not be available for your community. Given this limitation, populate the My AFI Data Template as completely as possible for your community.
Step 2
Determine the “Strengths/Advantages” and Opportunities/Challenges” of your community.
• The My AFI Data Template has six columns. The “My AFI” column (column 2) is the place on the template to document your My AFI Data collected in step 1. Columns 3-5 provide U.S. values, the MSA average value and the MSA Average +/- 10%. The sixth column, “Strength or Opportunity” provides space for you to determine if the characteristics are a strength or opportunity for your community.
• Compare My AFI Data to the MSA Average +/- 10% column (this is the exact methodology used in the data report).
• Those health indicator values that are better than the 10% or more compared to all MSAs would be considered a “Strength/Advantage” in your community. For example, 25.3% is the MSA average percent who consume 5+ servings of fruit or vegetables per day. If you found that 29% of the residents in your community reported eating 5+ servings of fruit and vegetables per day, that value is over the “MSA Average +/- 10%” range, than you would consider this a “Strength/Advantage” of your community.
• On the other hand, those health indicator values that are worse than 10% compared to all MSAs would be considered an “Opportunity/Challenge” for your community. For example, 17.8% is the MSA average percent who are currently smoking. If you found that 21% of the residents in your community report they were currently smoking, that value is over the “MSA Average +/- 10%” range, than you would consider this an “Opportunity/Challenge” for your community.
• Note that the built environment data were only available for the city, not the metropolitan area. Therefore, you would want to make sure you gathered data for your city and not the total of your community and the surrounding area equivalent to a metropolitan area.
Step 3
• Highlight the “Strengths/Advantages” of your community and celebrate the efforts of those who helped your community develop these good attributes.
• Consider what “Opportunities/Challenges,” if impacted, would improve the overall health, fitness, and quality of life of the residents of your community. These would be considered targets for implementing initiatives to improve these measures.
• Consult the AFI Community Action Guide to organize health promotion partners for action in your community (http://www.americanfitnessindex.org/guide.htm).
• Choose resources to help plan your programs.
Appendix C – My AFi CoMMunity AppLiCAtion tooL inStruCtionS

121
Population CharacteristicsPopulation* Percent less than 18 years old* Percent 18-64 years old* Percent 65 years old and older*Percent male*Percent high school graduate or higher Percent White* Percent Black or African American* Percent Asian*Percent Other Race* Percent Hispanic/Latino*Percent unemployedMedian household incomePercent of households below poverty levelViolent crime rate/100,000Percent with disability*
Health BehaviorsPercent any physical activity or exercise in the last 30 days Percent physically active at least moderatelyPercent eating 5+ servings of fruits/vegetables per dayPercent currently smoking
Chronic Health ProblemsPercent obesePercent in excellent or very good healthAny days when physical health was not good duringthe past 30 days
Any days when mental health was not good duringthe past 30 daysPercent with asthmaPercent with angina or coronary heart diseasePercent with diabetes
Death rate/100,000 for cardiovascular diseaseDeath rate/100,000 for diabetes
Health CarePercent with health insurance
Built EnvironmentParkland as percent of city land areaAcres of parkland/1,000 Farmers’ markets/1,000,000Percent using public transportation to workPercent bicycling or walking to work
Recreational FacilitiesBall diamonds/10,000Dog parks/10,000Park playgrounds/10,000Golf courses/100,000Park units/10,000Recreation centers/20,000 Swimming pools/100,000 Tennis courts/10,000 Park-related expenditures per capita Level of state requirement for Physical Education classes** Number of primary health care providers per 100,000
Appendix C – My AFi dAtA teMpLAte
307,006,55024.3%62.8%12.9%49.3%85.3%74.8%12.4%
4.5%8.3%
15.8%9.9%
$50,22110.5%429.412.0%
76.2%51.0%23.4%17.9%
26.9%56.0%
35.5%
33.7%8.8% 3.8%8.3%206.7 22.5
85.6%
3,325,88524.6%63.6%11.8%49.2%86.7%72.3%15.0%5.1%7.6%
15.1%9.8%
$55,3319.5%
11.0%
77.2%48.7% 24.4% 17.0%
25.9% 56.8%
35.3%
34.4%8.3%3.6%8.3% 201.021.9
86.3%
10.6%18.914.84.3%2.8%
2.00.92.3
1.04.21.13.12.1
$101.5 2.5
93.2
78.03% – 95.37%
8.82% – 10.78%$49,797.90 – $60,864.10
7.56% – 9.24%
8.55% – 10.45%
69.48% – 84.92%43.83% – 53.57%21.96% – 26.84%15.30% – 18.70%
23.31% – 28.49%51.12% – 62.48%
31.77% – 38.83%
30.96% – 37.84%7.47% – 9.13%3.24% – 3.96%7.47% – 9.13%
180.90 – 221.1019.71 – 24.09
77.67% – 94.93%
9.54% – 11.66%17.01 – 20.7913.32 – 16.283.87% – 4.73%2.52% – 3.08%
1.8 – 2.20.81 – 0.992.07 – 2.530.9 – 1.1
3.78 – 4.620.99 – 1.212.79 – 3.411.89 – 2.31
$91.35 – $111.652.25 – 2.75
83.88 – 102.52
CHARACTERISTICS MY AFI U.S. VALUEMSA
AVERAGEMSA AVERAGE
+/– 10%STRENGTH OR OPPORTUNITY
*These indicators are not modifiable through community health programming, but provide a description of the community.**3 = required at three levels: high school, middle school and elementary school; 2= required at two levels; 1= required at only one level