2011 ACCOMPLISHMENT REPORT - USDA APHIS ACCOMPLISHMENT REPORT. IMPORTED FIRE ANT SECTION . and . ......
80
2011 ACCOMPLISHMENT REPORT IMPORTED FIRE ANT SECTION and ANALYTICAL CHEMISTRY SECTION GULFPORT LABORATORY CENTER FOR PLANT HEALTH SCIENCE AND TECHNOLOGY PLANT PROTECTION AND QUARANTINE ANIMAL AND PLANT HEALTH INSPECTION STATION U.S. DEPARTMENT OF AGRICULTURE
Transcript of 2011 ACCOMPLISHMENT REPORT - USDA APHIS ACCOMPLISHMENT REPORT. IMPORTED FIRE ANT SECTION . and . ......

2011 ACCOMPLISHMENT REPORT
IMPORTED FIRE ANT SECTION
and
ANALYTICAL CHEMISTRY SECTION
GULFPORT LABORATORY
CENTER FOR PLANT HEALTH SCIENCE AND TECHNOLOGY
PLANT PROTECTION AND QUARANTINE
ANIMAL AND PLANT HEALTH INSPECTION STATION
U.S. DEPARTMENT OF AGRICULTURE

ii
IMPORTED FIRE ANT SECTION ANNE-MARIE CALLCOTT Supervisory Entomologist/Laboratory Director
CRAIG HINTON Biological Science Technician
LEE McANALLY Agriculturalist
XIKUI WEI Entomologist
ANALYTICAL CHEMISTRY SECTION
ROBERT D. SMITH Supervisory Chemist
GENE BOHANNON Physical Science Technician
TIM BOND Physical Science Technician
JAMES BRADLEY Laboratory Worker
MARY COLLINS Administrative Support Assistant
JOE DAWSON Physical Science Technician
MARIE DUBRA Physical Science Technician
BILL GUYTON Chemist
RICHARD KING Chemist
MARSHA LOWE Physical Science Technician
BARBARA MOFFETT Warehouse Clerk
LISA MOSSER Chemist
CONNIE RAMOS Chemist
BICH TRAN Chemist
iii
These reports were prepared for the information of the U.S. Department of Agriculture, Animal
and Plant Health Inspection Service personnel, and others interested in imported fire ant control
programs. Statements and observations may be based on preliminary or uncompleted
experiments; therefore, the data are not ready for publication or public distribution.
Results of insecticide trials are reported herein. Mention of trade names or proprietary products
does not constitute an endorsement or recommendation for use by the U.S. Department of
Agriculture.
Compiled and Edited by:
Anne-Marie A. Callcott
May 2013
(delayed due to laboratory closure and relocation in 2012)
Available online at the PPQ Imported Fire Ant website: http://www.aphis.usda.gov/plant_health/plant_pest_info/fireants/index.shtml

iv
The CPHST Gulfport Laboratory in Gulfport, MS, consists of two sections: the Analytical Chemistry section, and the Imported Fire Ant (IFA) section. The analytical chemistry section conducts routine sample analysis for detecting the presence of pesticide residues and toxic substances directly supporting ongoing APHIS Operational and Emergency programs including; Imported Fire Ant, Asian Longhorned Beetle, Boll Weevil, Grasshopper/Mormon Cricket, and Fruit Fly. In addition, the chemistry laboratory supports APHIS projects by providing chemistry based options for PPQ field operatives concerning the identification and detection of prohibited commodities, or the detection of invasive insect species. The IFA section develops methods and tools for the survey, detection, regulation, and control (both chemical and biological control) of the imported fire ant. Technology developed by the IFA section is utilized by PPQ, State Plant Regulatory Officials (SPROs), the nursery industry, chemical industry, farmers, homeowners, and other stakeholders.

v
TABLE OF CONTENTS PROJECT NO TITLE PAGE Lab Overview CPHST Laboratory Gulfport MS Overview 2011…………………….1 Gulfport Laboratory Closing Highlights……………………………….4 List of Projects/Publications for Gulfport Lab…………………………5
IMPORTED FIRE ANT SECTION
QUARANTINE TREATMENTS FOR FIELD GROWN NURSERY STOCK PROJECT NO TITLE PAGE A1F04 Alternative Drench Treatments for Balled-and-Burlapped Nursery Stock Used in the IFA Quarantine, Spring 2010 in Tennessee…….…………………………………………………….7 A1F04 Alternative Drench Treatments for Balled-and-Burlapped Nursery Stock Used in the IFA Quarantine, Spring and Fall 2011 In Tennessee…….…………………………………………………….11 A1F04 Alternative Drench Treatments for Balled-and-Burlapped Nursery Stock Used in the IFA Quarantine: Burlap Treatment to Kill Live Fire Ant Colonies Wrapped Inside Harvested Root
Balls, Gulfport MS Spring 2011………………………..…………….16 A1F04 Development of Alternative Immersion Treatments for Field Grown Nursery Stock – Individual Tree Drench Treatments
Using 5-Gallon Buckets in Tennessee Fall 2010 and Fall 2011……….20 A1F04 A New Tool for Fire Ant Control: Modified Infector that does Drench as Well as Injection for Quick Elimination of Individual Mounds………………………………………………….…25 A1F04 Development of Alternative Quarantine Treatments for Field Grown Nursery Stock – Broadcast Bait, Selective Mound Injection Plus Bifenthrin Spray, Mississippi Fall 2010……………………….…33

vi
QUARANTINE TREATMENTS FOR GRASS SOD PROJECT NO TITLE PAGE Umbrella Efficacy of New Candidates as Grass Sod Treatments; Mississippi, Spring 2011……….……………….……………………42
QUARANTINE TREATMENTS FOR GRASS SOD PROJECT NO TITLE PAGE Umbrella Development of IFA Quarantine Cold Temperature Techniques For Certifying Bulk Soil for Movement………………………………45
BIOLOGICAL CONTROL AND BIODIVERSITY PROJECT NO TITLE PAGE A1F01 Field Releases and Evaluations of Kneallhazia solenopsae In Harrison County, Southern Mississippi, 2009-2011………………56 A1F01 Biological Control of the Imported Fire Ant Using Phorid Flies: Cooperative Rearing and Release Project, 2011 (Pseudacteon tricuspis, P. curvatus, P. obtusus, P. cultellatus)……..63
MISCELLANEOUS
PROJECT NO TITLE PAGE 2011 Summary of Imported Fire Ant Samples Submitted to CPHST-Gulfport Laboratory for Chemical Analysis or Bulk Density Determination: Routine, Potential Violation and Blitz Samples…………………………………………………………69 Appendix I Protocol for Bioassay of Insecticide Treated Potting Media/Soil With Alate IFA Females………………………………………….…..72

1
CPHST Laboratory, Gulfport, MS Overview 2011
How We Support the Mission In 2011, the CPHST Gulfport Laboratory in Gulfport, MS, continued to support PPQ programs through the Analytical Chemistry section and the Imported Fire Ant (IFA) section. The chemistry section primarily processes APHIS wide pesticide treatment program samples and provides technical support in the form of methods development to address changing program needs. In addition to the routine work pesticide residue analysis work, the chemistry methods development staff continued to shift resources from routine methods adaptation work to more specialized work supporting the development and verification of lures used by PPQ programs and by CPHST scientists conducting projects. The IFA section develops methods and tools for the survey, detection, regulation, and control (both chemical and biological control) of the imported fire ant. Technology developed by the IFA section is utilized by PPQ, State Plant Regulatory Officials (SPROs), the nursery industry, chemical industry, farmers, homeowners and other stakeholders. The primary focus is on the development of quarantine treatment options for growers who move nursery stock and other regulated articles outside the federal quarantine area; currently focusing on grass sod and field grown nursery stock treatments. The lab also supports the rearing and distribution to states of phorid flies, a biological control agent of imported fire ant. In March 2011, PPQ management announced the anticipated closure of the Gulfport facility and subsequently the redirection and relocation of operations and staff. Therefore, 2011 was the final year of operational work out of the Gulfport facility. Much of the year was spent in preparation for the closing in 2012: planning for relocation of operations and staff and the outsourcing of other operational work. Details noted below. Major Project Accomplishments: Chemistry section:
• 721 APHIS routine program related samples analyzed, including environmental monitoring samples and lures along with ca. 173 associated quality control samples (Figure 1). This was a very light year for environmental monitoring samples, especially in the Grasshopper program which conducted fewer than normal treatments due to lower than expected pest numbers.
• All project work was redirected to the Miami Lab in 2011 and so those projects will be reported through that laboratory.
• In support of the ALB program, in-house method adaptations to program analytical methods were conducted to improve in-matrix recoveries.
• Significant work in support of PPQ program lures was accomplished through a cooperative agreement with Univ. of South Alabama (farm bill)
o Two new methods of analysis for PPQ program lures were developed: extraction, isolation and analytical process for the determination of multi-
component Brown Spruce Longhorn Beetle lure, extraction, concentration and analytical process for P.chalcographus lure.

2
o additionally, USA conducted lure QC sample analysis as well as synthesis of trimedlure active ingredient carbon-13 NMR spectral analysis verification of multiple samples
representing multiple lots of purchased three component Fruit fly lures (ammonium acetate, putracine-2HCL and trimethylamine-HCL) supporting lure purchase, quality control and contracting requirements
synthesis, and carbon-13 NMR spectral analysis verification (structural confirmation) of purity on 5.8 grams of pure trimedlure used for program wide reference material.
• Significant accomplishments in the second year of the Isotope Analysis for Fruits and Vegetables project, an interagency agreement with DHS-CBP Savannah lab (farm bill), to develop a model to determine the origins of mangoes included:
o Gathering of second season samples in Florida and Puerto Rico. Dominican Republic sampling was also conducted.
o Collect mango samples and conduct ICP/MS elemental analysis & profiles. o Evaluate second season sampling to ensure agricultural and environmental
influences did not adversely affect the model’s ability to distinctly identify a known growing region.
o Expand the statistical model to include the Dominican Republic growing region and evaluate mango sample data to ascertain if Dominican Republic grown mango is distinct from sources already in the model.
Figure 1. 2011 PPQ program related samples received for chemical analysis
0255075
100125150175200225250275300325350375400
Num
ber o
f sam
ples
Bollweevill Grasshopper IFA ALB Lures Qualitycontrols
Program
Imported Fire Ant Section:
• The APHIS-funded Imported Fire Ant Phorid Fly (Pseudacteon spp.) rearing and release program continued in 2011 with multiple releases of the third fly species, P. obtusus and the first releases of a fourth species, P. cultellatus. A publication on the establishment and spread success of the first 2 species, P. tricuspis and P. curvatus was published by J. Insect Science. Data shows that both species are established in more than 50% of the IFA quarantined area.

3
• Label changes on Onyx Pro® Insecticide (bifenthrin) were completed in 2011 to include an application rate effective on IFA in grass sod as a quarantine treatment. Anticipated completion of a new EA for IFA in 2012 will allow us to add this treatment to the Treatment Manual. This treatment will provide growers with a treatment that does not include chlorpyifos, which is hard to find due to growing EPA restrictions on its use.
• Development of a cold treatment for IFA in bulk soil was initiated in 2011 with a focus on contaminated soils destined for burial. Successes in small containers in a lab setting were moved into full sized refrigerated containers late in 2011 through a cooperative agreement with Univ. of Tennessee.

4
2011 Gulfport Laboratory Closing Highlights
• APHIS-PPQ will be closing the Gulfport Facility (MS) in 2012; anticipated mid-year • Existing PPQ state staff and services will remain in the local commuting area • Existing CPHST staff and services will be outsourced or relocated to other facilities • CPHST Staff to support outsourcing of routine residue analysis work and IFA work will
be moving to offices in Biloxi, MS • Analytical chemistry changes
o Routine pesticide residue analysis of environmental monitoring samples to support routine PPQ programs will be outsourced to USDA-AMS-National Science Laboratory in Gastonia NC at a pre-negotiated per sample cost, with CPHST staff overseeing and coordinating the program, acting as a liaison with PPQ-EDP-EC staff, as well as providing quality assurance reviews and audits – Robert Smith contact.
o Emergency pesticide residue analysis of environmental monitoring samples will be handled on a case by case basis by either AMS-NSL or CPHST Miami Lab, coordinated by CPHST and EDP-EC staff.
o Project work and staff to support CPHST and PPQ analytical chemistry needs will be relocated to CPHST Miami Lab
o PPQ-CPHST will NO LONGER provide analytical support for IFA soil samples Letter sent to all PPQ-SPHDs in impacted states to share with SPROs States may use their state pesticide lab or a neighboring state lab States may enter into an Agreement with USDA-AMS-National Science
Lab in Gastonia, NC to conduct the analyses for them • states MUST negotiate with AMS directly
states may contact CPHST for contact information for AMS-NSL or to discuss analytical methods for state labs
• Imported Fire Ant o All methods development work will be outsourced through cooperative and
interagency agreements and managed by a CPHST scientist – Anne-Marie Callcott contact.
o As soon as new contact information is available it will be distributed o Staff will be relocated to other CPHST/PPQ units

5
2011 List of Projects/Publications for Gulfport Lab The chemistry unit does not have traditional stand alone projects, but conducts work as requested in support of other CPHST labs and APHIS programs. Chemistry methods development projects:
• New Lure Methods development: extraction, instrumental analysis and/or emission rate studies under farm bill projects
o Redirected to Miami Lab July 2011 • Chlor-Tetracycline in insects for CPHST-Phoenix
o Redirected to Miami Lab July 2011 • Grasshopper program field spray mix studies & related methods development
o Redirected to Miami Lab July 2011 Farm Bill projects to support analytical chemistry (ADODR for both Robert Smith)
• Analytical Support for Traps and Lures – Cooperative Agreement with University of South Alabama (David Battiste, lead at USA).
• Isotope Analysis for Fruits and Vegetables – Interagency Agreement with DHS-CBP Savannah lab; collaborators include SITC (Camille Morris) for sampling.
IFA projects: Biological Control of Imported Fire Ants
• Biological Control of the Imported Fire Ant using Phorid Flies: Cooperative Rearing and Release Program
• Biological Control of the Imported Fire Ant: Monitoring of Field Releases of Thelohania solenopsae and Pseudacteon spp
Development of Quarantine Treatments for Imported Fire Ants
• Grass Sod and Bait Treatments for Control of Imported Fire Ants In house work and cooperative agreement with University of Arkansas
• Development of Quarantine Treatments for Field Grown/Balled-and-Burlapped (B&B) Nursery Stock
• New Treatments for Containerized Nursery Stock Farm Bill projects to support IFA (ADODR Anne-Marie Callcott)
• Rapid IFA Assay Kit – Interagency Agreement with ARS-CMAVE (Robert Vander Meer and Steven Valles, Lead Scientists)
o Development of rapid assay kit to identify IFA from other fire ants and to develop a species-specific IFA trap
2011 publications: Callcott A-M A, Porter SD, Weeks Jr. RD, Graham LC, Johnson SJ, Gilbert LE. 2011. Fire ant
decapitating fly cooperative release programs (1994-2008): Two Pseudacteon species, P. tricuspis and P. curvatus, rapidly expand across imported fire ant populations in the southeastern United States. Journal of Insect Science 11:19 available online: insectscience.org/11.1

6
Page left blank intentionally

7
CPHST PIC NO: A1F04 PROJECT TITLE: Alternative Drench Treatments for Balled-and-Burlapped Nursery Stock Used in the IFA Quarantine, Spring 2010 in Tennessee REPORT TYPE: Final (this report inadvertently left out of 2010 annual report) LEADER/PARTICIPANT(s): Xikui Wei, Anne-Marie Callcott, Craig Hinton, Lee McAnally;
Jason Oliver and Nadeer Youssef of Tennessee State University; Chris Ranger and Jim Moyseenko of USDA-ARS
INTRODUCTION:
APHIS is responsible for developing treatment methodologies for certification of regulated commodities, such as field grown balled-and-burlapped nursery stock (B&B), for compliance with the Federal Imported Fire Ant Quarantine (7CFR 301.81). Current treatments for field grown stock are inefficient and limited to a single insecticidal choice, chlorpyrifos. Furthermore, restrictions on this insecticide within recent years have lead to reduced production consequently limiting its availability to growers and making compliance difficult. Thus additional treatment methods, as well as additional approved insecticides, are needed to insure IFA-free movement of this commodity.
Current certification options for harvested B&B stock are immersion in a chlorpyrifos solution (dipping) or watering twice daily with a chlorpyrifos solution for three consecutive days (drenching). Likewise, the current treatment for Japanese beetle (Poppillia japonica Newman) in B&B requires dipping in chlorpyrifos. Since both imported fire ants (IFA) and Japanese beetle (JB) are a concern for the Tennessee field-grown nursery industry, the trials detailed in this report were conducted in cooperation with the Tennessee State University Nursery Research Center (TSU-NRC) with the goal of determining treatments useful against both pests. The JB testing portion of this trial was planned and conducted by TSU-NRC and the USDA-ARS Horticultural Insects Research Laboratory in Wooster, OH, and they report the details and results for that portion of these trials.
Standard IFA testing of chemical treatments for both dip and drench applications has been conducted through female alate bioassays on soil core samples from the treated root balls. Soil core bioassays for drenches conducted in 2002 and spring 2003 yielded erratic results over time and among replicates within treatments. Results from the same chemicals at equal or lower rates, when applied by immersion, were consistent, thus indicating insufficiency in application of the drench treatments. Doubling the volume of solution in drench application conducted in fall 2003 and spring 2004 failed to eliminate inconsistent results. The search for the cause of the inconsistency problem became narrower and has pointed to coverage and penetration of the drench solutions. During drenching, B&B normally rests on one side of the root ball throughout the three-day drench process. This was true for all drench treatments done before fall 2004. This drench

8
method possibly restricts treatment coverage on the resting side, while giving the surface of direct application a higher concentration of chemical and deeper penetration. The 2004 fall drench strongly suggested that rotating root balls during treatment, regardless of application frequency, improved the consistency of bioassay results and could potentially cut the number of days spent applying drenches from three down to one. Trials were repeated from spring 2005 to fall 2007 to examine whether changes in plant handling during application improve penetration and coverage and possibly allow reduction in the number of days required to complete a drench. Results of such trials can be found in our annual reports each year from 2005 to 2007. It is clear that rotating root balls during treatment application leads to a uniform coverage of the spray treatment and a consistently effective bioassay results. 2010 drench trials in TN again focused on examining some promising insecticides and plant handling methods for 12” root balls. Multiple insecticides and their combinations, application frequencies, and plant handling methods (rotating vs. non-rotating) were investigated. The fall 2010 drench results were reported in the 2010 annual report while the spring trial was inadvertently left out of that report and it thus reported here. MATERIALS AND METHODS:
In April 2010 TSU-NRC and USDA-ARS personnel completed drench applications on B&B plants with 12-inch diameter root balls at the TSU-NRC in Warren Co., TN. Treatments were applied at 0.82 gallons per treatment using a regular garden sprinkler can (Figs. 1&2). Solutions were applied twice daily (once in the morning and again in the afternoon) and between these applications the root balls were rotated or flipped to expose a different side to the direct application. This plant handling methods are described as 1F1. This method requires minimum chemical solution and days of application for drench treatments. The regime 2F2 was to apply one drench in the morning and another in the afternoon on one side of the root balls for the first day. The next day, flip the trees and drench two more times (morning and afternoon) for the other side of the root balls. The regime 6NF was not used in this trial but as the currently approved drench application method it requires applying drenches twice a day for 3 consecutive days without flipping the root balls. Each root ball received approximately 0.16 gallons of drench solution at each drenching totaling 0.33 gallons a day (so 1F1 = 0.33 gal solution & 2F2 = 0.66 gal). The amount used per drench application was based on the amount needed to achieve “the point of runoff” required in the IFA quarantine.
Fig.2. USDA ARS personnel applied drench treatment to 12” B&B rootballs
Fig.1. 12” rootballs grouped for drench treatment

9
Table 1. List of treatments for 12 inch drench trial in TN spring 2010
Product
Active Ingredient
Rate* lb ai/100 gal
H2O
Handling 1F1 2F2
Allectus Imidacloprid+bifenthrin 0.125+0.1 X X Allectus Imidacloprid+bifenthrin 0.25+0.2 X X Lorsban Chlorpyrifos 0.125 X X Onyx 23% Bifenthrin 0.0575 X Onyx 23% Bifenthrin 0.115 X Onyx 23% Bifenthrin 0.2 X Control -- X *all treatments applied true to listed rates without converting to 6NF first. After final treatment, the plants were maintained outdoors to weather naturally. Five replicate root balls were selected out of the 8 plants in each treatment group at 0.5, 1, 2, 4, and 6 months after final treatment for soil core sample collection. One soil core sample was taken from the mid-side area of each rootball at the initial bioassay day. On next sample day, we rotated the rootballs for a quarter turn (as shown in Fig 3) and took a soil core from the mid-side of the rootballs at the new location. We rotated the rootballs again for a quarter turn and took the third soil core from the mid-side area and so on. Soil samples were collected from within the first four inches of soil depth for testing against red IFA. The soil samples were frozen and sent to the CPHST Lab in Gulfport, MS where they were utilized in female alates bioassays. A single bioassay cup containing 10 female alates was utilized for each soil sample (replicate). Female alate mortality was recorded two times a week during the 14-day exposure period, and dead alates were removed from bioassay cups during these observations (Figs 4 & 5); (Appendix I – Standard Laboratory Bioassay).
Sample site
Rotate a ¼ turn for next sample site
Fig. 3. Soil core sample collection sites
Fig. 4. A tray of alates mortality bioassay cups.
Fig. 5. Orange circles indicate the locations of clusters of female alates within this bioassay cup.

10
RESULTS AND DISCUSSION: Drench trial spring 2010 Results are a bit less consistent than in previous trials. Only the high rates of Allectus (0.25 imidacloprid+0.2 bifenthrin) in both 1F1 and 2F2 provided 100% control throughout the 6 months of the trial. The lower rate of Allectus at 1F1 had a significant drop in efficacy at 4 months, but returned to 100% at 6 months, while the 2F2 treatment dropped slightly at 4 and 6 months to 98% and 96% control. Chlorpyrifos provided 1-2 months of 100% control at 1F1 and 2F2, respectively. The lowest bifenthrin rate of 0.0575 was very erratic and ineffective in this trial, while the higher rates of 0.115 and 0.2, both at 1F1 only, provided 100% control through 4 and 3 months, respectively, with some loss of efficacy thereafter. Overall, results in this trial were somewhat more erratic that previous trials and a summary of all drench trials will be completed to determine overall trends of these treatments. Fig. 6. IFA control achieved with soil samples treated with bifenthrin alone or in combination at 0.5, 1, 2 and 4 months after final drench application in TN spring 2010.

11
CPHST PIC NO: A1F04 PROJECT TITLE: Alternative Drench Treatments for Balled-and-Burlapped Nursery Stock Used in the IFA Quarantine, Spring and Fall 2011 in Tennessee REPORT TYPE: Final LEADER/PARTICIPANT(s): Xikui Wei, Anne-Marie Callcott, Craig Hinton;
Jason Oliver and Nadeer Youssef of Tennessee State University; Chris Ranger and Jim Moyseenko of USDA-ARS
INTRODUCTION:
APHIS is responsible for developing treatment methodologies for certification of regulated commodities, such as field grown balled-and-burlapped nursery stock (B&B), for compliance with the Federal Imported Fire Ant Quarantine (7CFR 301.81). Current treatments for field grown stock are inefficient and limited to a single insecticidal choice, chlorpyrifos. Furthermore, restrictions on this insecticide within recent years have lead to reduced production consequently limiting its availability to growers and making compliance difficult. Thus additional treatment methods, as well as additional approved insecticides, are needed to insure IFA-free movement of this commodity.
Current certification options for harvested B&B stock are immersion in a chlorpyrifos solution (dipping) or watering twice daily with a chlorpyrifos solution for three consecutive days (drenching). Likewise, the current treatment for Japanese beetle (Poppillia japonica Newman) in B&B requires dipping in chlorpyrifos. Since both imported fire ants (IFA) and Japanese beetle (JB) are a concern for the Tennessee field-grown nursery industry, the trials detailed in this report were conducted in cooperation with the Tennessee State University Nursery Research Center (TSU-NRC) with the goal of determining treatments useful against both pests. The JB testing portion of this trial was planned and conducted by TSU-NRC and the USDA-ARS Horticultural Insects Research Laboratory in Wooster, OH, and they report the details and results for that portion of these trials.
Standard IFA testing of chemical treatments for both dip and drench applications has been conducted through female alate bioassays on soil core samples from the treated root balls. Soil core bioassays for drenches conducted in 2002 and spring 2003 yielded erratic results over time and among replicates within treatments. Results from the same chemicals at equal or lower rates, when applied by immersion, were consistent, thus indicating insufficiency in application of the drench treatments. Doubling the volume of solution in drench application conducted in fall 2003 and spring 2004 failed to eliminate inconsistent results. The search for the cause of the inconsistency problem became narrower and has pointed to coverage and penetration of the drench solutions. During drenching, B&B normally rests on one side of the root ball throughout the three-day drench process. This was true for all drench treatments done before fall 2004. This drench

12
method possibly restricts treatment coverage on the resting side, while giving the surface of direct application a higher concentration of chemical and deeper penetration. The 2004 fall drench strongly suggested that rotating root balls during treatment, regardless of application frequency, improved the consistency of bioassay results and could potentially cut the number of days spent applying drenches from three down to one. Trials were repeated from spring 2005 to fall 2007 to examine whether changes in plant handling during application improve penetration and coverage and possibly allow reduction in the number of days required to complete a drench. Results of such trials can be found in our annual reports each year from 2005 to 2007. It is clear that rotating root balls during treatment application leads to a uniform coverage of the spray treatment and consistently effective bioassay results. 2011 drench trials in TN again focused on examining some promising insecticides and plant handling methods for 12” root balls. Multiple insecticides and their combinations, application frequencies, and plant handling methods (rotating) were investigated. MATERIALS AND METHODS:
In April 2011 and again in November 2011 TSU-NRC and USDA-ARS personnel completed drench applications on B&B plants with 12-inch diameter root balls at the TSU-NRC in Warren Co., TN. Treatments were applied at 0.82 gallons per treatment using a regular garden sprinkler can (Figs. 1 & 2). Solutions were applied twice daily (once in the morning and again in the afternoon) and between these applications the root balls were rotated or flipped to expose a different side to the direct application. This plant handling methods are described as 1F1. This method requires minimum chemical solution and days of application for drench treatments. The regime 2F2 was to apply one drench in the morning and another in the afternoon on one side of the root balls for the first day. The next day, flip the trees and drench two more times (morning and afternoon) for the other side of the root balls. The regime 6NF was not used in this trial but as the currently approved drench application method it requires applying drenches twice a day for 3 consecutive days without flipping the root balls. Each root ball received approximately 0.16 gallons of drench solution at each drenching totaling 0.33 gallons a day (so 1F1 = 0.33 gal solution & 2F2 = 0.66 gal). The amount used per drench application was based on the amount needed to achieve “the point of runoff” required in the IFA quarantine.
Fig.2. USDA ARS personnel applied drench treatment to 12” B&B rootballs
Fig.1. 12” rootballs grouped for drench treatment

13
Table 1. List of treatments for 12 inch root ball drench trial in TN spring 2011
Product
Active Ingredient
Rate* lb ai/100 gal
H2O
Handling 1F1 2F2
Allectus Imidacloprid+bifenthrin 0.125+0.1 X X Lorsban Chlorpyrifos 0.125 X X Onyx 23% Bifenthrin 0.0575 X Onyx 23% Bifenthrin 0.115 X Dazitol Capsaicin fumigant 24 oz/100 gal X Control -- X *all treatments applied true to listed rates without converting to 6NF first. Table 2. List of treatments for 12 inch root ball drench trials in TN fall 2011
Product
Active Ingredient
Rate* lb ai/100 gal
H2O
Handling 1F1 2F2
Allectus Imidacloprid+bifenthrin 0.0625+0.05 X Onyx 23% Bifenthrin 0.05 X Onyx 23% Bifenthrin 0.025 X Control -- X *all treatments applied true to listed rates without converting to 6NF first. After final treatment, the plants were maintained outdoors to weather naturally. Five replicate root balls were selected out of the 8 plants in each treatment group at 0.5, 1, 2, 4, and 6 months after final treatment for soil core sample collection. One soil core sample was taken from the mid-side area of each rootball at the initial bioassay day. On next sample day, we rotated the rootballs for a quarter turn (as shown in Fig 3) and took a soil core from the mid-side of the rootballs at the new location. We rotated the rootballs again for a quarter turn and took the third soil core from the mid-side area and so on. Soil samples were collected from within the first four inches of soil depth for testing against red IFA. The soil samples were frozen and sent to the CPHST Lab in Gulfport, MS where they were utilized in female alates bioassays. A single bioassay cup containing 10 female alates was utilized for each soil sample (replicate). Female alate mortality was recorded two times a week during the 14-day exposure period, and dead alates were removed from bioassay cups during these observations (Figs 4 & 5); (Appendix I – Standard Laboratory Bioassay).

14
RESULTS AND DISCUSSION: Drench trial spring 2011 Dazitol was actually tested in the fall 2010 as well as the spring 2011, but 2010 results were not reported in the 2010 report. In 2010 the product provided <10% control at 0.5, 1 and 2 months after treatment, and similar results were obtained at 0.5 and 1 month after treatment in the spring 2011 trial (Figure 6). This product will not be tested further. The bifenthrin 0.0575 rate continues to provide erratic results, while the 0.115 rate provided 100% control throughout the 6 month trial (Figure 6). Interestingly, the imidacloprid+bifenthrin product at 0.125 lb ai imidacloprid+0.1 lb ai bifenthrin at both 1F1 and 2F2 had slight decreases in efficacy at month 4 but returned to 100% control at the 6 month evaluation. Chlorpyrifos continues as expected with erratic results and limited longevity. Drench trial fall 2011 Rates of application were reduced and only 1F1 handling methods were tested in the fall of 2011 to assist in determining lowest valid rates of application. Of course 1F1 handling methods provide only ½ the active ingredient per root ball of 2F2 treatments. No treatment provided 100% consistent control throughout the trial indicating we are approaching or at the point of reduced and/or inconsistent control with these products (Figure 7). A summary of all B&B drench treatments will be provided in the 2012 annual report allowing us more focused testing and determination of any validation trials needed to move forward with approval of any treatments for inclusion in the federal IFA quarantine.
Sample site
Rotate a ¼ turn for next sample site
Fig. 3. Soil core sample collection sites
Fig. 4. A tray of alates mortality bioassay cups.
Fig. 5. Orange circles indicate the locations of clusters of female alates within this bioassay cup.

15
Fig. 6. IFA control achieved with soil samples treated with various insecticides at 0.5, 1, 2 and 4 months after final drench application in TN spring 2011.
Fig. 7. IFA control achieved with soil samples treated with various insecticides at 0.5, 1, 2 and 4 months after final drench application in TN fall 2011.

16
CPHST PIC NO: A1F04 PROJECT TITLE: Alternative Treatments for Balled-and-Burlapped Nursery Stock Used in the
IFA Quarantine: Burlap Treatment to Kill Live Fire Ant Colonies Wrapped inside Harvested Root Balls, Gulfport MS Spring 2011
REPORT TYPE: Final LEADER/PARTICIPANT(s): Xikui Wei, Anne-Marie Callcott, Craig Hinton & Lee McAnally INTRODUCTION: APHIS is responsible for developing treatment methodologies for certification of regulated commodities, such as field grown balled-and-burlapped nursery stock (B&B), for compliance with the Federal Imported Fire Ant Quarantine (7CFR 301.81). Current treatments for field grown stock are inefficient and limited to a single insecticidal choice, chlorpyrifos. Furthermore, restrictions on this insecticide within recent years have lead to reduced production consequently limiting its availability to growers and making compliance difficult. Thus additional treatment methods, as well as additional approved insecticides, are needed to ensure IFA-free movement of this commodity. Since 2008, treating burlap with bifenthrin (use of treated burlap to wrap rootballs or surface spray onto harvested rootballs) coupled with various in-field treatment methods of eliminating live ant in the rootball area has been found effective for fire ant quarantine treatment for in-field B&B nursery stock. However, this method consists of two-part treatments and simplifying the procedures was always desirable. One obvious simplification consideration was to eliminate the in-field individual tree treatment using only the burlap treating to achieve both killing live ants inside the rootballs and preventing infestation of newly mated fire ant queens. To evaluate the efficacy of this simplified method, it is necessary to use live ant colonies in the rootballs for the study. During the band trial in fall 2010 in Lucedale, MS, we observed that many fire ant colonies nested at the bases of nursery trees without showing any above ground mounds. They were mostly small colonies and many of them could not be visually detected without disturbing the ground surface. To investigate the research hypothesis of treating burlap with bifenthrin to kill live fire ant colonies inside rootballs, forty (40) of these trees with live fire ant colonies within the rootball area were machine harvested and then wrapped with either bifenthrin-treated burlap or plain burlap to be used in our whole rootball bioassay study reported here. The objective of this study was to determine if live fire ant colonies inside rootballs of trees could be killed by treating burlap with bifenthrin using either pre-treated burlap to wrap rootballs or surface spray of bifenthrin solution onto burlap of harvested rootballs. If the answer is yes, how long would it take to kill the fire ant colonies inside? To answer these questions, we conducted a whole rootball bioassay with live ant colonies wrapped inside rootballs of harvested trees.

17
MATERIALS AND METHODS: Trees with live ant colonies within each rootball were purchased from Deep South Nursery, Lucedale, George County; MS. Forty young trees of camellia (Camellia japonica) were machine harvested from the control plot of our band trial on March 23, 2011. In order to keep live fire ant colonies in each rootball, digging and wrapping were done such that there was as little disturbance as possible to the tree bases where fire ant nested. After trees were excavated by machine harvester, either bifenthrin-treated burlap or plain burlap was used to wrap the rootballs with live ant colonies inside. To do the pre-treatment of the burlap, 12 burlap liners (7.5 oz weight burlap) were soaked in bifenthrin solution (6 gal at 0.05 lb ai per 100 gal of water) for 24 hours. Then the fully soaked burlap liners were taken out to dry in the green house and they were ready to use after drying. For the rootballs wrapped with plain burlap, they were then sprayed with bifenthrin solution either at 0.05 or at 0.1 lb ai/100 gal of water using a pressurized garden pump sprayer. Ten rootballs were sprayed with 2 gal of bifenthrin solution at 0.05 lb ai per 100 gal (1.89 ml 23% Onyx Pro in 2 gal water) and another 10 rootballs were sprayed with 0.1 lb ai per 100 gal water (3.79 ml Onyx Pro in 2 gal water) bifenthrin solution. Using the garden pump sprayer, 2 gallons of spray solution was the right volume for treating 10 rootballs of 18 inch diameter, resulted a good coverage but no run-off problem. The treatments were conducted on March 25, 2011. Evaluation After final treatment, the plants were maintained outdoors to weather naturally and irrigation schedule was set up to closely simulate outdoors nursery storage conditions. Each treatment was divided into 2 groups of 5 plants each. Plants in one group were kept in 26” diameter by 7” deep (66 x 18 cm) plastic Plantainer™ pans (Mac Court, Denver, CO) which were painted on the inside surface with Fluon (AGC Chemicals Americas Inc., Bayonne, NJ) to prevent ant’s escape (Fig. 1). Containers also had a 2 cm diameter hole opened at the side wall near the bottom to drain rain or irrigation water which was covered with fine screen mesh to prevent fire ant escape. The other 5 plants were allowed to have direct contact with the ground to observe if the live fire ant colonies would stay or leave the plants during the trial. Two rootballs (one from each placement group) were split open at 0.5, 1, 2, 4, and 5 months post-treatment to determine if fire ant colonies inside were dead or alive.

18
Figure 1. Rootball placed in Plantainer™ pan painted with Fluon® on inside surface. RESULTS AND DISCUSSION:
i) Burlap pre-treated with bifenthrin wrapped over rootballs did not kill live ant colonies already inside the rootballs in a short period of time. Fire ant colonies could survive inside the wrapped rootballs for 4 months or longer (Table 1).
ii) Post-harvest spraying with bifenthrin solution (either 0.05 or 0.1 lb ai per 100 gallon of water) onto the burlap at a volume of 2 gallons every 10 rootballs of 18 inch diameter did not result in a speedy kill of the live ants inside. Some colonies could survive these treatments for as long as 6 months after treatment application (Table 1). Further drench trials with rootballs wrapped with live fire ant colonies inside is recommended to validate the post-harvest flip drench (such as 1F1, 2F2) trials conducted in the past years. This is because our flip drench trials used rootballs without live ant colony inside and only the soil samples collected from rootballs (mostly from the upper 4 inch depth of the rootball surface) were subjected to fire ant female alate bioassay to determine the effectiveness of the flip drench treatments. Results of the female alate bioassay may not be an accurate indication that the flip drench treatment would kill live ant colonies already nested inside the rootballs.
The findings from this study indicated that pre-harvest treatment to the base of trees to kill the ants in the rootball area using bucket drench, tree ring dripping, or other application methods is a necessary step to “clean” the rootballs before wrapping them up with pretreated burlap or spray bifenthrin onto the burlap wrap of the post-harvest rootballs. It is necessary to use rootballs with live fire ant colonies wrapped inside to do the flip drench study to verify the effectiveness of killing live ant that already nested inside the rootballs. Results of such study will validate drench research we conducted in the past years, especially the flip drench study such as 1F1, 2F2.

19
Table 1. Survival of fire ant colonies within root balls wrapped in burlap treated with bifenthrin at 0.05 or 0.1 lb ai per 100 gallon of water, fall 2011 Mississippi
*SO = spray on: bifenthrin solution (either 0.05 or 0.1 lb ai per 100 gallon of water) was sprayed on to the burlap wrap after the root balls were harvested. *IM = immerged: burlap was pre-treated with bifenthrin before being used to wrap the root balls. “+” = ants alive; “-” = ants dead (2 reps each evaluation period).
Treatment* 2WAT 4WAT 8WAT 16WAT 21WAT
SO 0.05 ++ ++ ++ +- +-
SO 0.10 ++ ++ ++ ++ --
IM 0.05 ++ ++ ++ ++ --
Control ++ ++ ++ ++ +-

20
CPHST PIC NO: A1F04 PROJECT TITLE: Development of Alternative Quarantine Treatment for Field Grown Nursery Stock – Individual Tree Drench Treatment Using 5-gallon Bucket in Tennessee Fall 2010
and Fall 2011 REPORT TYPE: Final LEADER/PARTICIPANT(s): Jason Oliver, Nadeer Youssef (Tennessee State University), Xikui Wei, Anne-Marie Callcott, David Oi (ARS-CMAVE), Chris Ranger, Mike Reding, and Jim Moyseenko (ARS-ATRU) INTRODUCTION APHIS is responsible for developing treatment methodologies for certification of regulated commodities, such as field grown balled-and-burlapped nursery stock, for compliance with the Federal Imported Fire Ant Quarantine (7CFR 301.81). Current treatments for field grown nursery stock, as described below, are not only inefficient but also come with environmental and human health problems. Thus additional treatment methods, as well as additional approved insecticides, are needed to ensure IFA-free movement of this commodity. The primary objective of a quarantine treatment for field grown nursery stock is to render the plants fire ant free. The currently available pre-harvest (in-field) treatment requires a broadcast of approved bait followed in 3-5 days by a broadcast application of granular chlorpyrifos. This treatment must extend 10 feet beyond the base of all plants to be certified. After a 30-day exposure period, plants are certified IFA free for 12 weeks. A second application of granular chlorpyrifos extends the certification period for an additional 12 weeks. The ten-foot radius requirement, due to row spacing, frequently includes plants and soil that otherwise need not be treated. Various drench methods such as tree ring chemigation, multiple bucket drench, or other in-field drench application, coupled with burlap treatment before or after harvest could provide a practical quarantine treatment option in addition to the currently available treatment methods such as post-harvest dip, drench, and pre-harvest (in-field) broadcast application of contact insecticides following approved bait broadcast. Tree-ring chemigation or other pre-harvest drench applications may penetrate the entire root ball with chemical solution to achieve results that are similar to the dip treatment, but do not require the use of heavy equipment or come with the problem of disposing a large volume of harmful chemical waste at the end of the treatment. Compared with post-harvest drench, the tree-ring or infield bucket method could reduce labor and chemical costs and with little or no run-off problem. Also, this method selectively treats the trees to be harvested, thus avoiding the unnecessary treatment to the entire field and eliminates the need to wait for a 30-day exposure period before harvesting. Bifenthrin treatment to burlap wrapping before or after harvest may kill newly-mated fire ant queens that land on the rootballs through contact.
21
The objective of this study was to evaluate an alternative quarantine treatment method that uses various drench methods for individual tree (in-field) treatment combined with bifenthrin treatment to the burlap wrapping before or after harvest. Specifically, we wanted to find out the effectiveness of infield 5-gal bucket drench treatment method and also at normal aging conditions how long the treated-burlap and root ball soil could kill IFA before losing quarantine level efficacy. Our overall goal was to develop an IFA quarantine treatment method for field grown B&B nursery stock that is effective, easy to do, economical, environmentally friendly, and endangers neither nursery workers nor trees during treatment application. MATERIALS AND METHODS: Fall 2010: Individual tree drench using 5-gal buckets was conducted in a nursery field with rows of redbud (Cercis canadensis L.; ~ 2 inch caliper) at Moore Nursery, McMinnville, TN on October 14, 2010. Trees included in the trial were selected with enough space in between so that drench solution from one treatment would not contaminate other nearby drenches. In areas of the field with sloping ground, a garden hoe was used to make furrows between trees outside of the treatment zone, just to ensure no chemical solution could run between trees. Three 5-gal buckets were placed close to the tree and equidistant from each other on three sides of each tree. Each bucket had three 1/16 inch diameter drain holes spaced 3 inches apart and ~ 1 inch above the base of the bucket. The center drain hole was pointed directly at the trunk of each experimental tree (Fig. 1 A&B). A water tank mounted on the bed of a pickup truck was used to carry water to the treatment field. Buckets were first filled half way full and insecticide added to the buckets and then additional water was added to bring it up to the full 5 gallon mark with each tree receiving 15 gallon drench (see Table 1 for treatment details). Four trees were used in each treatment. Treated trees were machine harvested on October 15, 2010 at 24 hours post-treatment with a CareTree Systems Model 501 tree spade (CareTree Systems, Columbus, OH). Root balls had top and bottom diameters of ~60 cm and 30 cm respectively, and a ball height of ~50 cm. Trees were placed in metal baskets lined with burlap and wrapped, pinned, twined on the top and crimped according to standard nursery practices by the nursery grower.Trees were transported to an open field site at the TSU Lab on October 16, 2010. Before treating the burlap, we determined that ~ 1 gallon of water was needed to wet the entire surface of the burlap on the control root balls. Control root balls only received water. At 1430 hours (~ 24 hours post-field-harvest), each treated root ball received 1 gallon of solution applied with a sprinkle can and mixed at a rate of 0.94 ml Onyx Pro per gallon of water (0.05 lb ai/100 gal of water). This same rate of bifenthrin solution was sprinkle drenched on all chemically treated trees regardless of what rates the trees had received at the previous bucket-drench in the field. One side of the root ball was treated with about half of the solution, then the root ball was rotated and the other side was treated with the remainder of the solution. During the drench process, care was taken to also treat the top part of the ball (where the tree exits) and the bottom part (opposite from the tree exit side). At the completion of the burlap treatment, root balls were rotated back to the original position and left undisturbed at that point. The trees were stored outdoors in full sunlight without straw, mulch or overwintering blankets, which is not a typical nursery practice, but did expose the chemical

22
treatments to more solar degradation. Trees were initially watered as needed during the fall until dormancy (i.e., moisture loss from transpiration ceased); then no additional watering was required due to frequent winter rains. Fig. 1. Pre-harvest in-field drench using 5-gallon buckets to trees to be harvest in a nursery. A: drench in plant rows. B: close look of drench application to a tree using 3 buckets Fall 2011: Trials in 2011 were also conducted at Moore Nursery using methods described above using rows of elms (Ulmus spp.; ~ 3 inch caliper). Individual tree drenches with 5-gal buckets were conducted on October 14, 2011. Unlike 2010, bucket drench solutions were first mixed in 5 gallon quantities in plastic containers and then poured into the buckets. Treatments are listed in Table 1. Treated trees were dug on October 15, 2011 (24 hours post-treatment) as previously described for 2010 test. After root balls were transported to the TSU Lab, the burlap and root ball received a 1 gallon sprinkle drench at the same rate as listed above. In both trials a surfactant was used to facilitate application. The product used in these trials was Suffusion®, a blend of three types of surfactants; wetter/Spreaders, penetrants and re-wetting Agents, specifically for use on growing media during plant production. Surfactant was added to the treatments at the B&B stock rate of 10-15 oz/80 gal water. Table 1. Treatment list for individual tree drench application at Moore Nursery, TN fall 2010 and fall 2011. Season Active
Ingredient Rate of Application (lb ai/100 gal water)
ml prod/gal
Gal finished soln/tree
Total ml product/tree
Fall 2010 Bifenthrin (Onyx Pro®)
0.05 0.946 15 14.2 0.025 0.473 15 7.1
Fall 2011 Bifenthrin (Onyx Pro®)
0.05 0.946 15 14.2 0.025 0.473 15 7.1 0.0125 0.237 15 3.56
A B

23
Bioassay method To evaluate the residual effect of bifenthrin-treated burlap over a 6-month aging period under outdoors conditions, a piece of burlap was cut from each of the root balls and sent to the Gulfport lab for efficacy evaluation (Fig. 2). The burlap piece was placed in a standard bioassay cup and covered with a clear square dish (Fig. 3). A few drops of water were added to moisten the burlap if needed. This method worked well for burlap evaluation in the laboratory. Soil samples were also collected from the surface (about 1 cm deep) of the root ball where the burlap was removed (Fig. 2) to determine if the soil that has direct contact with the treated burlap would also kill the ant as the burlap does. The bioassay method for the soil samples was the same as that for burlap pieces. Both burlap and soil samples were frozen and shipped to the Gulfport Lab for bioassay. To do the bioassay, ten field collected female alates were used for each burlap or soil sample taken from a root ball. Female alates were placed on top of burlap or soil in the bioassay cup and allowed free contact with the material to be tested (Fig. 3). Alates were not given food, but water was added to moisten the burlap or soil if they were not sufficiently moist. Mortality data were taken at 4, 7, 10 and 14 days after exposure. To determine the residual effect of bifenthrin-treated burlap over time, burlap and soil samples were taken at 1, 2, 3, 4, and 6 months to monitor the degradation process. RESULTS\ RESULTS: Both trials provided excellent control against IFA alate females through 4 months after treatments (Figs 4 & 5) in both the soil and burlap “substrates”. However, in the fall 2011 trial the 0.05 soil treatments showed a slight decrease in efficacy at 6 months, and the two lower rates showed more pronounced decreases. This decrease in soil treatment efficacy is similar to traditional B&B root ball dip and drench applications.
Fig. 3. Set up of burlap bioassay conducted in the lab.
Fig. 2. A piece of burlap was removed for bioassay; soil sample was also collected from where burlap was cut out (within yellow rectangle).

24
Fig. 4. Mortality of IFA alate females when exposed to burlap and soil from bucket drenched field grown nursery stock subsequently harvested and wrapped in burlap that was then sprinkle drenched with bifenthrin (after wrapping). Used 3 buckets and 15 gal finished drench per tree and 0.05 lb ai/100 gal water bifenthrin spray solution on burlap. Tennessee fall 2010 trial
Fig. 5. Mortality of IFA alate females when exposed to burlap and soil from bucket drenched field grown nursery stock subsequently harvested and wrapped in burlap that was then sprinkle drenched with bifenthrin (after wrapping). Used 3 buckets and 15 gal finished drench per tree and 0.05 lb ai/100 gal water bifenthrin spray solution on burlap. Tennessee fall 2011 trial

25
CPHST PIC NO: A1F04 PROJECT TITLE: A New Tool for Fire Ants Control: Modified Injector That Does Drench as Well as Injection for Quick Elimination of Individual Mounds TYPE REPORT: Final LEADER/PARTICIPANT(s): Xikui Wei, Lee McAnally, Craig Hinton & Anne-Marie Callcott INTRODUCTION: The primary objective of a quarantine treatment for field grown nursery stock is to render the plants fire ant free for compliance with the Federal Imported Fire Ant Quarantine (7CFR 301.81). Block or band trials with contact insecticides following a broadcast application of toxic fire ant bait as an alternative quarantine treatment method conducted in the past few years were not entirely successful because a few problematic colonies with large mounds always refused to die making it almost impossible to achieve the fire ant free condition sooner than 20 weeks after final treatment. To combat these die-hard mounds, individual mound treatment (IMT) through drench or injection with contact insecticide was incorporated into the broadcast bait plus band treatment resulting greatly improved treatment efficacy. However, the hardened crest of a mature mound in clay soil made drench solutions difficult to penetrate the mound and caused run-off problems. The injection with a soil injection probe had its own problems of ants escaping from the top of mounds during injection and relocating from the upper part of the injected mounds. Therefore, an ideal tool for an effective individual mound treatment would be one that could do both drenching the top of a fire ant mound as a drench wand does as well as injecting the inside of a mound like that of a regular soil injection probe. The advantage of a soil injection probe is its point specific delivery in the ground. It has the ability to deliver liquid to fire ant mound structure deep in the ground with efficiency. However, its capability is limited to just that. The soil injection probe by design can do only injection inside the mounds but cannot drench the top of mounds using the same tool. Problems for this include large numbers of ants readily escaping from the top while the mound is receiving injection treatment, and that the top portion of mounds usually does not receive injection liquid where queens may be present thus avoiding being killed by the injection treatment. It would solve this problem if the same tool could also be used to deliver liquid to the top of a fire ant mound, as a drench wand does, without shooting insecticide solution to other unwanted places or endangering the operator. Doing so, it could kill ants that escape while injection is in progress and therefore could stop ants moving away from mounds injected. To add this drench-like capacity to the soil injection probe, modification to the regular injector was necessary. Knowing the limitations associated with the soil injection probe, an injector modification project was started in 2010. The main purpose of the modification was to add the function of drenching to the soil injection probe. Therefore, when achieved, the injector could also deliver insecticide solution to cover the top of the mounds like other drench application, which kills ants that come

26
to contact with the solution even if they escape from the mounds being injected. The drench also kills ants that are in the upper portion of the mound which usually do not receive injection from a regular injector. MATERIALS AND METHODS Modification of the Soil Injection Probe A soil injection probe (B&G Versagun, Model 430) was purchased from a company called Univar in Indianapolis, IN. The injection rod used for the modification was a 40" x 5/8" stainless steel rod. A garden wand sprinkler-head (separately purchased from a local Lowes store) was also needed for the modification project. A circular hole that is slightly larger than the diameter of the injector pole was cut in the center of the perforated metal that forms the face the sprinkler-head (Figure 1). The injector rod was inserted into the sprinkler-head through the cutout so that the sprinkler-head can go up and down freely on the injector rod. Three semi-sphere metal beads were welded on the rod near the injector tip so that when the sprinkler-head goes down the pole it is held by the welded semi-sphere beads without going off the rod (Figure 3). When it comes to a stop position, the inner wall of the sprinkler-head blocks the pressurized liquid streams coming out in four directions from the injector pole and makes the liquid streams powerless and thus falling through the perforated bottom of the sprinkler-head (Figures 1 & 2). This way, the sprinkler-head changes the energized liquid streams to the sprinkled form that can be safely directed to the top of a fire ant mound (Figure 6). Since the sprinkler-head can go up freely on the rod, when the injector is inserted into the soil, the sprinkler-head rests at the level of ground surface allowing the injector tip to reach to any desired depths in the ground without causing any operational problems (Figures 7). A 20” long section of 1” PVC pipe connected to a 3” handle was inserted above the sprinkler-head so that it can be used to push down the sprinkler-head in the rare occasion that the sprinkler-head gets stuck on the rod without going fully down by itself to its rest point (Figures 4 & 5).
Figure 1. A sprinkler head was added near the tip of the injector rod to turn the pressurized liquid streams into sprinkled form by blocking the streams.

27
Figure 2. The sprinkler-head moves up freely allowing the injector tip goes into the ground, but it drops down to a fixed position on the pole when the injector tip is above the ground. Then it works like a garden wand being able to drench the top of the fire ant mound so that it can treat the entire mound inside and out killing the whole nest. The modification also makes the injector safer to use by preventing the pressurized chemical streams from accidentally shooting to the operator or to some unwanted places.

28
Figure 3. Semi-sphere beads were welded on the rod above the injector outlet holes to hold the sprinkler-head at the position where it can turn the pressurized liquid streams into sprinkled form.
Figure 4. Modified soil injection probe with PVC pipe handle in place.
Figure 5. Complete assembly of the modified injector.

29
Connection to the sprayer tank: A hydraulic pump (operated by automobile battery or a tractor PTO) is needed for the injector to function properly under optimum pressure. The modified injector was connected through a hose to a battery operated pump that siphoned chemical solution from the sprayer tank or from a 5-gallon bucket. Field trials Two field trials using the modified injectors were conducted in a nursery field at Deep South Nursery in Lucedale, George County, MS in summer and fall of 2010. The young camellia trees (Camellia japonica), mostly below 4 feet tall, were in rows of 12 ft apart and spaced at 4 ft intervals. Therefore, the field was pretty open with dense fire ant mounds (see Figure 6). Summer field trial: Injection treatments to individual mounds were conducted on June 16, 2010 with one gallon of treatment solution per mound (see Table 1 for chemicals and rates). For each treatment and untreated control, 12 active fire ant mounds were used. The modified injection probe was connected to the hose connector of the 3pt 50 gallon Fimco Sprayer powered by automobile battery. Calibration determined that it took 28 seconds to deliver one gallon of liquid with the setup of the modified injector. With some practice runs, we arrived at the following timing allocation to do the injection for each mound: of the 28 seconds, 10 seconds were to drench the top of a mound first; then 15 seconds were to inject the inside of the mound, and after pulling the injector tip out from the mound, the remaining 3 seconds were used to drench the top again to wet the ants that came out on top. Initial results were assessed one week after treatment with a poking stick to disturb the mounds followed by a 3WAT evaluation using a shovel to dig up the injected mounds. Fall field trial: Injection treatments in the fall trial were part of a band trial conducted in a nursery field in November 2010. The band trial consisted of a toxic fire ant bait broadcast followed by selected individual mounds treatment (injection), then followed by a band spray of contact insecticide. Injection treatments to individual mounds (only to those with above ground mound dimensions greater than 4” high and/or 8” wide) were conducted on November 8, 2010 (Figures 6 & 7) at 1 ml bifenthrin product (Onyx Pro 23.4%) in 1 gallon of water per mound, which is equivalent to a rate of 0.0528 lb ai/100 gallon water. For comparison, an unaltered regular injector was also used in this study. The regular soil injection probe could deliver chemical solution into inside of mounds only, but the modified injector could do both drenching the top of fire ant mounds and also injecting liquid into the inside of mounds. Injection probes were connected to the hose connector of the 3pt 50 gallon Fimco Sprayer powered by automobile battery. For the modified injector, it took 28 sec to deliver one gallon of liquid and we followed the same injection procedures as we did in the summer trial in which 10 seconds to drench the top, 15 seconds to inject, and the remaining 3 sec to drench the top again to wet the ants that came out on top. For the unaltered injector, calibration found that it took 33 sec to deliver 1 gallon of liquid with our setting and the entire 33 sec was used to deliver bifenthrin solution within the mound with multiple insertion points on a mound. After treatment completion, evaluations for IMT efficacy were conducted weekly for the first 8 consecutive weeks.

30
Figure 6. Using the modified soil injection probe as a drench wand to deliver solution to the top of a fire ant mound.
Figure 7. The modified soil injection probe does injection as usual and operates smoothly like a regular injector.
Figure 8. Fire ant mound drenched and injected using the modified soil injection probe.
Figure 9. Dead fire ant piles from the mound drenched and injected using the modified soil injection probe.
Figure 10. Fire ants escaping from mound injected with a regular soil injection probe.
Figure 11. Dead fire ant piles by the mound injected using the regular soil injection probe.

31
RESULTS Summer 2010 trial: All four treatments, two chemicals at two rates each, λ- cyhalothrin at 0.035 and 0.069 and bifenthrin at 0.01 and 0.02 lb ai per 100 gallons of water, were equally effective eliminating live fire ant colonies with injection using the modified injector. All 48 treated colonies were killed shortly after injection applications, generally within 24 hours of treatment. Evaluations at 1 and 3 weeks after treatment application showed clearly that they were all killed without surviving ants or sign of moving away from the treated mounds (Table 1). This result showed that the modified injector, which could conveniently do both drenching the top and injecting the inside of a fire ant mound, is an efficient tool for individual mound treatment with 100% efficacy in south MS soil type. It proved that the concept of drenching the top of a fire ant mound then injecting the inside was an appropriate method of eliminating a fire ant colony and the treatment application could be practically achieved with the use of this modified injector. Fall 2010 trial: Large fire ant colonies were 100% killed within 24 hrs of treatment application with 1 gallon bifenthrin solution at 0.0528 lb ai/100 gallon water using the modified injector (Table 2). All 83 large-sized active mounds treated with this tool were eliminated with no sign of escape, relocation, or reactivation of the dead mounds for the entire trial period (Figures 8 & 9). However, colonies with similar-sized mounds that were treated with a regular soil injection probe with the same volume and rate of bifenthrin solution did not die as quickly nor as completely; 6 injected mounds (out of 45 total mounds treated with the regular injector) were found alive at 1WAT and 3 injected mounds had live ants at 6 WAT, one of which had female alates at 6WAT (Table 2). Also, during the injection process with regular soil injection probe, ants were rushing out from the top of the mounds being injected (Fig 10) and relocation of ants from injection-treated mounds were observed in this trial (Fig 11). Table 1. Results of individual mound treatments with the modified injector in nursery field Lucedale, George County, Mississippi, June 2010
Treatment Rate (lb ai/100 gal) Volume
Live fire ant colonies (week after treatment)
0 1 3 Average
λ- cyhalothrin 0.035 1 gal/mound 12 0 0 0
λ- cyhalothrin 0.069 1 gal/mound 12 0 0 0
Bifenthrin 0.01 1 gal/mound 12 0 0 0
Bifenthrin 0.02 1 gal/mound 12 0 0 0
Untreated CK -- -- 12 11 12 12

32
Table 2. Results of individual mound treatments with bifenthrin using the regular and modified injectors, Lucedale, George County, Mississippi, November 2010
DISCUSSION With the addition of the drench functionality through innovative modification, the injector can work like a drench wand when the injector tip is above ground, as well as its regular injection capability when it is inserted into the ground. Therefore, this modified tool could drench the top of a fire ant mound with chemical solution and deliver liquid inside the mounds at various depths by inserting into the mound. Doing an IMT treatment in this manner, ants that escaped during the injection process or those stayed at the upper part of mounds where they did not receive injection could be killed through the contact with chemically saturated mound surface. The modified injector worked well both operationally and functionally. Matured colonies with large above-ground mounds were 100% killed through IMT with the use of this tool without the need to increase the volume or rate of the chemical solution. CONCLUSION Adding drench capability to the regular soil injection probe allows the modified injector to deliver liquid to the top of a fire ant mound as well as inject into the mound structure in the ground. With the added capability, the modified soil injection probe helps to achieve 100% fire ant control sooner by quickly eliminating the hard-to-kill matured fire ant mounds. ACKNOWLEDGMENT Special thanks to Kenneth Peterman for assistance with the welding job of the injector modification and appreciation to Lee McAnally and Craig Hinton for their assistance in the field demonstration and operation of the modified injector.
Treatment Tool Rate (lb ai/100 gal) Volume
Live colonies (week after treatment)
0 1 2 3 4 6 8 Modified injector 0.0528 1
gal/mound 83 0 0 0 0 0 0
Regular injector 0.0528 1
gal/mound 45 6 3 3 3 3 0
None Untreated CK -- 33 45 41 34 36 48 37

33
CPHST PIC NO: A1F04 PROJECT TITLE: Development of Alternative Quarantine Treatments for Field Grown Nursery Stock – Broadcast Bait, Selective Mound Injection plus Bifenthrin Spray,
Fall 2010 in MS TYPE REPORT: Final LEADER/PARTICIPANTS: Xikui Wei, Anne-Marie Callcott, Lee McAnally, and Craig Hinton INTRODUCTION: APHIS is responsible for developing treatment methodologies for certification of regulated commodities, such as field grown balled-and-burlapped nursery stock, for compliance with the Federal Imported Fire Ant Quarantine (7CFR 301.81). Current treatments for field grown nursery stock, as described below, are inefficient and limited to a single insecticide. Furthermore, restrictions on this insecticide, chlorpyrifos, within recent years have lead to reduced production consequently limiting its availability to growers. Thus additional treatment methods, as well as additional approved insecticides, are needed to insure IFA-free movement of this commodity. The primary objective of a quarantine treatment for field grown nursery stock is to render the plants fire ant free. The currently available pre-harvest (in-field) treatment requires a broadcast application of approved bait followed in 3-5 days by a broadcast application of granular chlorpyrifos. This treatment must extend 10 feet beyond the base of all plants to be certified. After a 30-day exposure period, plants are certified IFA free for 12 weeks. A second application of granular chlorpyrifos extends the certification period for an additional 12 weeks. The ten-foot radius requirement, due to row spacing, frequently includes plants and soil that otherwise need not be treated. Thus, trials of band-style treatments for large blocks of in-field B&B were initiated to focus on examining efficacy of products other than chlorpyrifos, reduction of treated diameter, and reduction of the exposure time required prior to plant movement. The first two band trials applied in the fall of 2001 and spring of 2002 tested five to six-foot wide bands of bifenthrin and deltamethrin. Both liquid and granular formulations showed promising results but demonstrated that in band treatments contact insecticide alone was not effective enough for use in the IFA quarantine. Subsequent band trials have included a broadcast application of bait 3-5 days prior to the contact insecticide application. The inclusion of bait in the treatment procedure has facilitated quarantine level control for several contact insecticides in these trials (see 2002-2006 IFA Annual Accomplishment Reports). Unfortunately, when the most promising bifenthrin rate was tested in TN, results were not as consistent or efficacious. Therefore, in 2007 it was decided to apply the insecticides in larger blocks rather than bands. Still, a few problematic large mounds always refused to die making it almost impossible to achieve fire ant free sooner than 20 weeks after final treatment in trials of the past few years in Tennessee. To combat these die-hard mounds, individual mound treatment through drench with contact insecticide was incorporated into the regular broadcast bait plus band treatment in the fall 2009

34
trial in TN. All mounds that were greater than either 4” high and/or 8” wide were marked and drenched with one gal of solution at the rate of 0.0389 lb ai/100 gal water (0.7368 ml Onyx Pro 23.4% product per gal). By drenching the larger mounds with bifenthrin solution, the 1 WAT evaluation were all down to only 1 active mound for the first time which was a greatly improved result from previous trials. However, drenching large mounds with a shower-head garden wand in clay soil was not without problems; the drench solution ran off the crest of the mounds and poking multiple holes on the top of mounds was adopted to solve this run-off problem. Evidently, injecting solution into the mounds was an easy choice and a soil injection probe was used for IMT in fall 2010 field trial in TN and it worked reasonably well. However, regular soil injection probe by design can do only injection inside the mounds but cannot drench the top of mounds using the same tool. Problems for this is that large number of ants readily escape from the top while the mound is receiving injection treatment and that the top portion of mounds usually does not receive injection liquid where queens may be present thus avoiding being killed by the injection. To resolve this problem, the injection tool, soil injection probe, was modified (by Xikui Wei) so that it can also deliver insecticide solution to cover the top of the mounds like other drench application, which kills ants that come to contact with the solution even if they escape from the mounds being injected. The drench also kills ants that are in the top portion of the mound which do not come to contact with the injection liquid of a regular injector (Figs 1 & 2). The objective of this study was to evaluate treatment efficacy in a production nursery in Mississippi of band treatment (toxic bait plus band application of contact insecticide) with the addition of individual injection treatment to large-sized mounds. In this trial, two different injection tools were used for comparison. MATERIALS AND METHODS: The trial was conducted in a nursery field planted with camellia (Camellia japonica) at Deep South Nursery, Lucedale, George County, MS. The young camellia trees (mostly below 4 feet tall) were planted in rows at 12 ft apart and spaced at 4 ft in between. Therefore, the field was pretty open with dense fire ant mounds (see Figs 1 & 7). All visible active fire ant mounds in all plots, large or small, were flagged before treatment application. Mounds that were larger than 4” high and/or 8” wide were marked for individual mound treatment (IMT) through injection with bifenthrin solution. Mounds that were smaller than these criteria were considered small and did not receive individual injection treatment. On November 1, 2010, hydramethylnon fire ant bait was applied at a rate of 1.5 lb/acre through the use of a shop built spreader mounted to a farm tractor. Control plots did not receive bait or any insecticide treatment. One plot that was designated as no-bait treatment (Treatment 2) received injection and band application of contact insecticide but did not receive bait broadcast (see Table 1). We had to wait for dew to dry before putting out bait on that day. At the time baiting, temp was 78F and ants were foraging actively. Ants were seen moving bait particles right after bait broadcasting.

35
Injection treatment to individual mounds (those marked as large) was conducted on November 8, 2010 (Figs 1 & 2) at the rate of 1 ml Onyx product (Onyx Pro 23.4%) per gal of water per mound, which is equivalent to a rate of 0.0528 lb ai/100 gal water. Two type of injectors were used in this study-- regular soil injection probe for delivering chemical solution into only inside of mounds, and a modified injector that could do both drenching the top of fire ant mounds and also injecting liquid into the inside of mounds. Injection probes were connected to the hose connector of the Fimco 3pt 50 gallon Sprayer powered by automobile battery. For the modified drench injector, it took 28 sec to deliver one gallon of liquid. Of the entire 28 seconds, 10 seconds were used to drench the top of a mound; then 15 seconds were used to inject the inside of the mound, and after pulling the injector tip out from the mound, the remaining 3 sec was used to drench the top again to wet the ants that came out on top. For the injection probe that does injection only, it took 33 sec to deliver 1 gal of liquid with our setting. The entire 33 sec was used to deliver bifenthrin solution inside the mound with multiple insertion points in a mound. Contact insecticide application occurred on November 9 & 10, 2010 (Figs. 7 & 8). Liquid treatments were applied using a Fimco 3pt 50 gallon Sprayer with sprayer boom equipped with 3 standard flat spray tips (8015-SS; TeeJet Corp.) to provide a 6 ft band spray for each tractor pass. The spray volume was equivalent to ca. 37 gal/A (at 0.20 lb bifenthrin ai /A) except for one plot that received higher volume of spray because of calibration mistake, resulting in an actual volume of 50 gal/A with 0.282 lb bifenthrin ai /A in that one treatment (Treatment 1 in Table 1). Since the tree rows in the test plots were 12 ft apart, 6 ft band spray on each side of a tree row supposedly should cover the entire plots without leaving any untreated gap between rows. However, since the sprayer boom was affixed to the rear end of the tank sprayer which was hooked up to the hitch of a pulling tractor, it was difficult, if not impossible, to consistently pull the sprayer in a straight line close enough to the trees while spraying due to the ground surface, preventing an even coverage of spray to the tree bases. As a result, some tree bases, where fire ant colonies concealed their nests under, did not receive coverage of the spray solution of contact insecticide (Fig 8). Active IFA colonies in each plot were recorded prior to bait application, as well as after contact insecticide application at 1, 2, 4, 5, 6, 8, and 12 weeks and every four weeks thereafter until the end of 6 months post treatment. Mounds were evaluated using multiple insertions of a plastic rod (5 mm in diameter) into the mound to agitate ants except for 6WAT when a shovel was used as an evaluation tool. Mounds were considered active if any workers appeared after disturbance. Table 1. Nursery in-field treatments consisting of toxic fire ant bait, individual mound injection and band spray of contact insecticide, Lucedale, George County, Mississippi fall 2010
Treatment no
Bait Injection Band Spray 1.5 lb bait/A
(Nov 1, 2010) 1 ml Onyx Pro/gal/mound
(Nov 8, 2010) 6’ band each side of tree row
(Nov 9&10, 2010) 1 Hydramethylnon Modified injector Bifenthrin 0.282 lb ai/A* 2 None Modified injector Bifenthrin 0.20 lb ai/A 3 Hydramethylnon Regular injector Bifenthrin 0.20 lb ai/A 4 Control (none) none None
* This plot received a higher rate of bifenthrin band spray at 0.282 lb ai/A because of a calibration mistake.

36
Fig 1. Using the modified Soil Injection Probe as a drench wand to deliver solution to the top of a fire ant
Fig 2. The modified Soil Injection Probe does injection as usual and operates smoothly like a regular injector.
Fig 3. Fire ant mound drenched and injected using the modified Soil Injection Probe.
Fig 4. Dead fire ant piles from the mound drenched and injected using the modified Soil Injection Probe.
Fig 5. Fire ants escaping from mound being injected with a regular Soil Injection Probe.
Fig 6. Dead fire ant piles by the mound injected using the regular Soil Injection Probe.

37
RESULTS: Large fire ant colonies were 100% killed within 24 hours of treatment application with 1 gal bifenthrin solution at 0.0528 lb ai/100 gal (1 ml Onyx product per gal) water using the modified drench injector. All 83 large-sized active mounds treated with this tool were eliminated overnight with no sign of ant escape, relocation, or reactivation of the dead mounds for the entire trial period (figs 3 & 4). However, similar sized mounds that were treated with regular soil injection probe with the same volume of bifenthrin solution and rate did not die as quickly nor as completely; 6 injected mounds (out of 45 total mounds treated) were found live at 1WAT and 3 mounds having live ants at 6 WAT, one of which had female alates at 6WAT (Fig 9). Also, during the injection process with regular soil injection probe, ants rushing out from the top of the mounds being injected (Fig 5) and relocation of ants from injection-treated mounds were observed in fall 2010 in TN (Jason Oliver, personal communications) and in this trial. One large fire ant mound that did not receive injection treatment (missed while treating) in the plot of Treatment 2 remained alive for the whole time; although it showed sign of weakening near the end of the trial but it never died off. However, all 42 other large colonies in that same plot which received modified injection treatment were eliminated overnight. This suggested that individual mound treatment to large colonies is very helpful to obtain a quick and effective control for large colonies in the treatment plots. This also mirrored what Dr. Jason Oliver had been seeing over the past several years in his band treatment trials in TN nurseries that large colonies were hard to kill with bait plus band treatment of contact insecticides and that they remained alive in treatment plots for a long period time. Since the individual mound treatment through injection was applied to large mounds only, the change in numbers of the small mounds in the treated plots resulted from the combined effect of the bait plus band treatment. Also, since Treatment 1 actually received a higher rate of bifenthrin band treatment than Treatment 2 and 3 (explained more detail bellow) and could not be used for comparison for bait effect, only Treatment 2 and Treatment 3 could be compared for the effect of
Fig 7. Band spray application with contact insecticide in progress.
Fig 8. Band treatment in progress— spray is away from tree rows leaving a strip along tree lines uncovered with spray.

38
toxic fire ant bait applications. Toxic fire ant bait (Amdro, applied at 1.50 lb/A) showed some effect on reducing the numbers of smaller non-injected colonies that were mostly not directly sprayed on with band treatment (Fig 10). Treatment 2 was a non-baited treatment and the number of small-sized colonies remained high for entire experimental period, averaging 23 live colonies on each post-treatment evaluation and the number was never lower than 10 active mounds at any post-treatment evaluation for that plot. The comparable baited plot, Treatment 3, had relatively fewer active small colonies during the course of the trial (averaging 12 live colonies for each post-treatment evaluation) and this was possibly the effect of fire ant bait treatment. But the live small colonies were never reduced to 0 in this plot. Obviously, 100% control was not achieved in this treatment even with the enhanced treatment protocol that consisted of toxic bait application followed by IMT (regular injection probe) followed by band application at 0.2 lb ai bifenthrin per acre. Higher bifenthrin rate (at around 0.3 lb ai/A, if legal to use) would also help in increasing efficacy. Treatment 1 and 3 were both treated with a combination of bait+IMT+band; the difference by design in these two treatments was to use different injectors to carry out the IMT application. However, because we made a mistake in sprayer calibration, Treatment 1 received a higher rate of bifenthrin during the band application resulting a 0.282 lb ai/A bifenthrin whereas Treatment 3 received a normal rate of 0.2 lb ai/A. Therefore, besides the difference in injectors used, which affected only the large mounds in these plots, we could also look at the effect from the difference in the bifenthrin rates used. It showed that higher rate of bifenthrin (0.282 lb ai/A) reduced the number of non-injected mounds in Treatment 1 quicker compared with that in Treatment 3 (Fig 10). Also, Treatment 1 was able to reach to 100% control for 3 months starting at 8 WAT but no other treatments were able to achieve a 100% control at any time during the entire experimental period. These results would certainly improve if a uniform coverage of band treatments to tree bases could be achieved. Figure 9. Change in numbers of large live IFA colonies after injection treatment with regular or modified soil injection probe. Fall Mississippi 2010 (* used regular injection probe)

39
Fig 10. Change in numbers of small live IFA colonies before and after toxic bait plus band treatment with contact insecticide, fall 2010 in Mississippi. (*used regular Soil Injection Probe). DISCUSSION: Band treatment conducted in TN nurseries from 2005 to 2009 revealed that large fire ant colonies were hard to kill with the treatment method of bait plus band application of contact insecticides, preventing the treated field plots from meeting the fire ant free quarantine requirement several months after treatment application or even for the entire experimental period. Beginning in fall 2009 in TN, individual mound treatment (IMT), as an extra measure for quick elimination of large-sized mounds through drench application, was included into the bait plus band treatment method. This enhanced treatment method (bait-IMT-band) was very close to achieving the initial objectives: getting a quick kill of large mounds and maintaining fire ant free for a long period of time. However, drenching the matured fire ant mounds built in clay soil was problematic because of the run-off from the mound’s harden crest and drench solution did not penetrate the mounds readily. It was decided then that injecting the chemical solution into the mounds was a better way to conduct IMT application. Based on this prior experience, we decided to do our bait plus band treatment with the aid of a modified injector to carry out the IMT application. The injector was modified such that it functions as a drench wand when the injector tip is above the ground in addition to its regular injection capability when it is inserted in the ground. This innovated tool could drench the top of fire ant mound with chemical solution and insert into the mound to deliver solution inside the mounds at various depths (Figs 1 & 2). With this way of doing IMT treatment, ants that escaped during injection process or those stayed at the upper part of mounds that did not receive injection solution could be killed through contact with chemically saturated mound surface. The modified injector worked well both operationally and functionally. Large mounds were 100% killed through IMT with the use of this tool. The fact that one large mound in

40
Treatment 2 that was missed while injection remained alive for the whole time indicated that band treatment without IMT was not enough for taking out large-sized mounds. This observation provided additional evidence to the major problem of band treatments discovered in TN in the past years. Therefore, adding IMT through injection could quickly eliminate large-sized mounds in the field treated with band application of contact insecticides, especially using the modified injection tool. In the case of this band trial, pre-treatment mound count did not produce an accurate number of fire ant colonies present in the plots because many later-uncovered colonies did not show any sign of a fire ant mound at the time of pre-treatment counting; they were hiding at the bases of trees without being seen and we missed detecting them all together. They were found later during the post-treatment evaluation processes with the use of a poking stick inserting into tree bases or using a shovel (at week 6 after treatment) to dig into the tree bases. At week 6 after treatment, a shovel was used to dig almost every tree base in the plots and found many small-sized active fire ant colonies that were not found before. There were more newly uncovered small colonies in the non-baited treatment plot (Treatment 2) than in the other 2 treated plots at 6 weeks after treatment. Spray coverage of contact insecticide is critical for the success of band treatment. Colonies were not easily killed when they were not directly spayed on even if the mounds were small in size. This may possibly be why band treatment trials in MS done before were effective when conducted in open grass land but not effective in nursery settings. To improve the efficacy of band treatment, the sprayer has to be modified so that it can directly spray with uniformity to the tree bases where fire ant colonies make their nests even though they may not be seen above ground. Overall, this trial was not a great success in achieving quarantine level of control through enhanced bait plus band treatment application in a production nursery field. The main reason for this was that small colonies were nesting inside the bases of trees and most of them were not directly sprayed with the contact insecticide during band treatment application. It was observed from this trial that many small colonies in the bases of trees did not show any above ground mounds. The ground surface did not give any hint that a live fire ant colony was underneath. The fact of “hiding” small fire ant colonies affected our treatment results in two ways: first, it made counting of live colonies in the plots (pre- and post-treatment) inaccurate since we usually rely on above ground mounds to tell the presence of a colony. Second, this also means the colonies were not very active in that particular time, which could be caused by unfavorable weather, such as prolonged drought, cold, or other factors. Being inactive could certainly affect the effectiveness of toxic bait treatment; no or very few foragers went out to collect the toxic bait during that short period of time while the bait remained fresh and attractive would aid to their colony safety. Furthermore, not being directly sprayed on with contact insecticide greatly reduced their chance of getting killed. When there were many colonies concealed in the bases of trees but uniform spray coverage to the tree bases with contact insecticide was not achieved, it would certainly affect the treatment results. These would be the main reasons why some small colonies survived the enhanced treatment method, a combination of toxic bait followed by IMT followed by band application of contact insecticides.

41
In a separate experiment that we conducted using rootballs with live ant colonies inside and the burlap wrap was treated with bifenthrin, a colony survived beyond 6 months without getting food from outside of the rootball, which was treated at 0.1 lb ai per 100 gal and placed above ground after treatment. This finding helps to explain why small colonies inside tree bases survived the bait and contact insecticide treatments. It may also suggest that fire ant colonies could even learn to avoid contact with deadly chemicals and manage to survive for a long period of time. If this is true, it would really complicate our interpretation on field treatment evaluations. This trial was the first band type of treatment conducted in production nursery field in Mississippi, which differed from the simulated band treatment trials conducted in Mississippi on airport grounds in the past few years. Previous band/block trials conducted in MS were carried out exclusively on open grass land such as on airport grounds or pasture, simulating nursery setting but without the presence of nursery tree rows. Treatment application on the open ground is different in that treatment coverage was uniform and complete. Also, evaluations for chemical efficacy were limited only to the inner areas of a treated plot excluding a surrounding treated buffer area with 1 to 10 linear feet. For example, at least 10 lineal feet of treated buffer from the edge of the treated block to the edge of evaluation area was normally used in the block type of treatment. For strip treatment, only the 2 feet strips on each side of the central line were counted if 3 feet on each side of the central line were sprayed, leaving 1 foot of treated buffer strip without being evaluated for efficacy. In the nursery production field treatment, however, it was very different from the open field application. Tree rows with different width in between become obstacle in treatment applications preventing spray solution reaching to tree bases for a uniform coverage, obviously leaving an untreated gap at tree bases where fire ants usually make their nests. Knowing the fact that there may be area at the tree bases not receiving adequate treatment coverage, however, we could not draw out a “buffer area” at the tree row side and only evaluate the treated area that was for sure covered by spray solution. We still have to count the live ant colonies at the tree bases even though we knew there might be a spray gap along the tree line. Therefore, the outcome was that there was no 100% control in any of the treatments in this trial except Treatment 1 for a period of 3 months. However, the results of this trial explain why similar band trials conducted in MS and TN had different results with MS treatment results better than that in TN, which was generally considered the effect of different soil types. CONCLUSIONS:
• Adding IMT to large fire ant mounds to the in-field treatment plan of bait plus band application of contact insecticides improves treatment effectiveness. If an injection tool that drenches and injection is used for the IMT, large mounds could be killed quickly and it helps to achieve 100% control sooner.
• Bifenthrin at around 0.3 lb ai/A, if legal to use, would increase efficacy on fire ant control for in-field treatment.
• Uniform coverage is important for contact insecticides to kill fire ants in band treatment. Therefore, good coverage to tree bases is critical for band treatment to be effective on fire ant control in production nurseries. It is necessary to use a sprayer that can direct spray solution to the tree bases.

42
CPHST PIC NO: Umbrella IFA Quarantine Treatments PROJECT TITLE: Efficacy of New Candidates as Grass Sod Treatments: Mississippi, Spring
2011 TYPE REPORT: Final LEADER/PARTICIPANTS: Anne-Marie Callcott, Lee McAnally, Craig Hinton and Xikui Wei INTRODUCTION: Currently there are two treatments available for sod growers to certify grass sod for movement outside the IFA regulated area: chlorpyrifos applied at 8 lb ai/acre (6 weeks certification after 48 hour exposure) and fipronil applied at a total of 0.025 lb ai/acre applied in two applications ca. 1 week apart (20 weeks certification after a 4 week exposure). In 2008, the only chlorpyrifos labeled product, Dow Dursban® 50W, discontinued the grass sod IFA quarantine rate of application and therefore only the fipronil product was available for growers. This product does require 2 applications and a 4 week exposure period, both of which are not cost effective for growers. MATERIALS AND METHODS: The test site for this trial in Mississippi was a working sod farm with fields in several south Mississippi counties. The test site for the spring 2011 trial were fields located in Pearl River Co, near the community of Henleyfield, MS. Plots were 0.52-acre square in size for all treatments (150’ x 150’). On plots receiving bait plus a contact insecticide, the bait was applied to 147’ x 150’ of the plot to accommodate the bait spreader we use. The contact insecticide application on the same plot was applied to the full 0.52 acre area. All plots contained a permanently marked ¼-acre circular efficacy plot in the center. This is the area that was evaluated for active IFA mounds. There were 3 plots per treatment and controls. Prior to treatment and at 1, 2, 3, and 4 weeks after treatment and bi-weekly or monthly thereafter, IFA populations in each efficacy plot was evaluated. Due to the weekly evaluations, we used a minimal disturbance method to evaluate the IFA populations. Instead of using a shovel to excavate each mound to determine worker numbers and presence or absence of brood, a stick/rod (ca. ¼-inch diameter and 3 ft. long) was used to “poke” each mound several times to disturb the workers. A rating was then given based on activity; 1= <100 workers, 2=100-1,000 workers, 3=1,000-10,000, 4=10,000-50,000, 5= >50,000 workers. All liquid treatments were applied using an electric diaphragm pump boom sprayer equipped with seven standard flat spray tips (8015-SS; TeeJet Corp.) to provide a 10’ band spray for each driving pass and the total spray volume equivalent to ca. 35 gal/acre. Granular contact insecticides were applied with a Herd GT-77 granular applicator mounted to a farm tractor. Fire ant bait was applied at a rate of 1.5 lb/acre through the use of a shop built spreader mounted to a farm tractor. Control plots were not treated with baits or contact insecticides. Trials were initiate

43
in April, 2011, with baits applied on April 8, 2011 and contacts applied on April 12-13, 2011. Treatments and rates are listed below. Spring Mississippi 2011 rates of application:
Trade Name Active Ingredient Rate of Application (lb ai/acre)
Date of last application
Amdro® plus Bifenthrin EC (Onyx® Pro)
Hydramethylnon plus bifenthrin
1.5 lb bait/acre plus 0.2 lb ai/acre (1 wk apart)
4/13/11
Amdro® plus Bifenthrin F (Talstar® Select)
Hydramethylnon plus bifenthrin
1.5 lb bait/acre plus 0.2 lb ai/acre (1 wk apart)
4/13/11
Amdro® plus Bifenthrin/Zeta G (Talstar® Xtra)
Hydramethylnon plus bifenthrin+ zetacypermethrin
1.5 lb bait/acre plus 0.2 bif + 0.05 zeta (1 wk apart)
4/12/11
Amdro® plus Aloft® GC SC
Hydramethylnon plus clothianidin+ bifenthrin
1.5 lb bait/acre plus 0.2 cloth + 0.1 bif (1 wk apart)
4/13/11
Bifenthrin/Zeta G (Talstar® Xtra)
bifenthrin+zeta cypermethrin
0.4 bif + 0.1 zeta 4/12/11
Aloft® GC SC clothianidin+ bifenthrin
0.4 cloth + 0.2 bif 4/13/11 Control Untreated --
RESULTS: All the bait + contact treatments reduced IFA colonies significantly compared to the controls (Figure 1). By 5 weeks, all of these treatments provided >95% control and maintained that control through 21 weeks, with light reinfestation noted at week 25. The contact only treatments were not as effective as the bait plus contact insecticide treatments (Figure 2). The granular bifenthrin/zetacypermethrin product was very slow acting, with efficacy never exceeding 80% and the addition of the zetacypermethrin did not appear to enhance the efficacy of the bifenthrin. The liquid clothianidin/bifenthrin product reached 100% control very slowly at 14 weeks and maintained that control through the end of the trial at 25 weeks. This slow activity has been seen in multiple trials.

44
Figure 1. Efficacy of bait + contact insecticide grass sod treatments in Mississippi in spring 2011.
Figure 2. Efficacy of contact insecticide grass sod treatments in Mississippi in spring 2011.
DISCUSSION: The use of a bait in conjunction with a contact insecticide is generally providing better control of IFA at lower rates of application in grass sod than contact insecticides alone. There will be a summary of grass sod trials from 2009-2011 produced for the 2011-2012 annual report.

45
PROJECT NUMBER: IFA Umbrella PROJECT TITLE: Development of IFA Quarantine Cold Temperature Techniques for Certifying Bulk Soil for Movement PROJECT TYPE: Final for Gulfport Lab LEADERS/PARTICIPANTS: Craig Hinton, Lee McAnally, Anne-Marie Callcott INTRODUCTION: The primary purpose of this project is to conduct preliminary investigations into the development of imported fire ant (IFA) treatments for use in certifying bulk soil for movement outside the federally regulated area. As a federally regulated item, under the Federal Imported Fire Ant Quarantine (7CFR 301.81), bulk soil must be treated in an approved manner prior to shipping outside the regulated area to prevent IFA from inadvertently being moved to a previously uninfested area. Currently, only heat treatment is approved for bulk soil, and is not a viable option for contaminated soils due to potential volatility of contaminants. Contaminated soils are shipped in a variety of containers, including, but not limited to, B-25 boxes, cubic yard boxes, and super sacks (Figure 1). Figure 1. Containers for contaminated soils. L to R: B-25 boxes, cubic yard box, super sacks.
MATERIALS AND METHODS: Initial trials were conducted in a home type 4-foot chest freezer (Frigidaire Electrolux Model LFFN15M5HWA; cools to ca. -15°C) to determine whether this was a feasible idea. Top soil/dirt (sandy soil from Gulfport, MS area) was placed in plastic bags to facilitate adding and removing dirt, placing of IFA test ants, and to keep the freezer clean. IFA workers with associated nest tumulus were placed in 4 oz. plastic cups with lids and placed at various levels in the freezer. A Hobo® U-12 Outdoor/Industrial Data Logger with 4 temperature probes attached (temperature range of -40°C to 100°C) was used to record temperature changes over time (15 minute intervals). Although the operating range of this device is -20°C to 70°C, we did destroy one

46
logger by placing them in the freezer. After that we used longer probes and kept the loggers themselves outside the freezer. Once the time interval to kill all IFA had been determined for the small chest freezer, we moved to a larger commercial portable freezer (Polar King® Walk-In Dual Temp 8x10 container leased from Polar Leasing Co. – actual internal size 7’3” wide x 9’2” long and 7’3” tall). The freezer had a refrigerator and a freezer setting. All trials were conducted on the freezer setting which maintained a cold temperature of between -15°C and -20°C (fluctuates as freezer cycles). Three trials were conducted using 3 30-gal plastic drums (28¼” tall, 18½” internal diameter) filled with dirt and three trials were conducted using 2 36-inch square corrugated boxes lined with plastic and filled with soil (Figure 2). The freezing and thawing of the dirt weakened the boxes so plywood frames were constructed to support the boxes. This may have insulated the boxes even more, but data showed minimal impact on the cooling trend over time after frames added. Figure 2. Drums and boxes used in 8X10 commercial freezer. (L to R)
In the 3 replicated trials using the drums, 6 cups of ants were placed at different levels in the soil, but close to the middle of the drum from side to side. Cups A & B were placed together 20” from the bottom of drum 1 with a temperature probe adjacent to the cups. Cup C was 20” from the bottom of drum 2 with no probe and cup D was 15” from the bottom of drum 2 with a probe. In drum 3, cup E was 22” from the bottom (Figure 3) and cup F was 10” from the bottom, both with probes. Ambient air was recorded by three probes during each trial using the drums. Figure 3. Cup E with temperature probe in drum.

47
In the 4 replicated trials using the 36-inch square boxes, 6 cups were again placed at different levels in the soil, but all close to the middle of the box from side to side. In box 1 (back of freezer), cup A was 18” from the bottom of the box, cup B at 24” from the bottom and cup C at 30” from the bottom. In box 2, cup D was 18” from the bottom, cup E at 24” and cup F at 30” from the bottom. Most cups had a temperature probe adjacent to them, depending on the number of working probes during the trials. If a probe malfunctioned, no data was collected for that cup. In our first test trial in the boxes, when trying to remove the frozen soil from the boxes with a small shovel/trowel to get to the cups and the end of the temperature probe we cut into the probe cable. Thus, in subsequent trials, we protected the cable on the temperature probe by running it through a section of pvc pipe (Figure 4). Also after the first test trial, we realized the freezing and thawing of the soil in the boxes weakened the box structure and the plywood frames were added at this time to all subsequent trials using the boxes. Figure 4. PVC pipe to protect temperature probe cable leading to cup in soil in large box; empty large box prior to filling with soil.
IFA used in all trials were field collected within a few days of each trial. Approximately 300-400 worker ants were placed in a 4-oz plastic vial/cup (Corning Snap Seal Vials No. 1730; low profile 110-ml or 120-ml). Dirt from the ants’ nest tumulus was added to the vial/cup, filled to within ¼-inch of the top of the cup (Figure 5). Cups were labeled and the position the cup placed in the drum or barrel, drum or barrel number, and temperature probe number recorded. Figure 5. 4-oz plastic vial with lid attached filled with IFA workers and nest tumulus (opened and closed).
Freezers and soil were at ambient air temperature (or as close as possible after thawing from the previous trial) prior to each trial. Freezer was turned on and allowed to run for 4-6 days and then turned off. Ants and temperature probes were removed as soon as possible. Ants were

48
maintained under room temperature conditions for up to 24 hours to determine mortality. Temperature data was downloaded through the BoxCar® software to an Excel® worksheet. Data could be plotted and manipulated in BoxCar®, but was easier to manipulate in Excel® for reporting purposes. RESULTS: We will not present all the data collected from the trials in the small chest since much of it was done in single replicates trying to determine the best test methods and time intervals for testing. What is presented are several trials conducted with the freezer completely full of soil with 5 cups of ants scattered throughout the soil and one temperature probe adjacent to three of the cups. Data in Figure 6 is the average of the 3 probes by the ant cups in each of 7 trials. Six of the 7 trials ran for 5 days, one ran for 4 days. Only in the 4-day trial did any ants survive. We did vary the freezer setting in several of these single trials (settings from 1-7; 7 being the coldest). Regardless of freezer setting all mean soil temperatures reached 0°C around the 48 hr time interval. There was then a period of 24-30 hours that the soil temperature did not change much, prior to a second significant decrease in mean temperatures. In the one trial that did not kill all the ants, the mean soil temperature was below -5°C for ca. 24 hours. In all other trials, the mean soil temperature was below -5°C for 36-48 hours. Figure 6. Mean temperature of 3 probes in chest freezer in each trial by date (date ants alive/dead freezer temperature setting)

49
Trials then moved to the 8’x10’ Polar King portable freezer. Three trials were conducted using 3 drums filled with soil. Cups with ants were placed as noted in the methods with temperature probes at 4 of the cup locations. The last trial on 8-1-11 was only run for 4 days simply due to bad timing. However, all the ants died in this shortened trial, as did all the ants in the two trials run for 5 days. In the second trial on 7-21-11, one data logger stopped working at 114 hours and so the data for those probes has been cut off on the graph at 114 hours (at the rise in temps), while the remaining probes continued for the full 120 hours. Those lost included the probes for 3 of the 4 cups (A/B, D, E) and one ambient air probe (4). Ambient air in these trials reached 0°C within 6 hours, -10°C within 12 hours, and fluctuated between -10°C and -20°C for the rest of the testing time period (Figure 7). In all 3 trials, soil adjacent to cup E (drum 3, 22” from bottom) required a much longer time period to reach 0°C and also had a longer time period of little change in temperature after reaching 0°C before decreasing rapidly to below -10°C. The mean temperature from each cup (Figure 8) shows that the soil adjacent to cups A/B, D and F rapidly decreased to 0°C within 18-24 hours after cooling started, and continued a somewhat linear trend down to -5°C within 30 hours and -15°C and below within 48 hours, where that temperature was maintained throughout the rest of the trial (120 hrs). Cup E, the closest to the top of drum 3 (22” from the bottom), was slower overall in temperature reduction (Figures 7 & 8). At 24 hours, the mean temperature approached 0°C, remaining within + or – 2 degrees of 0°C through 48 hours. There was then a dramatic decrease in temperature between 48 and 60 hours where the mean temperature reached -5°C within 54 hours, -14°C within 60 hours, and by 72 hours was similar to the mean temperature of the other cups. Therefore, even in the shortened 4-day (96 hours) trial, soil temperatures were below -5°C for a minimum of 42 hours.

50
Figure 7. Temperature trends in 3 trials conducted in the Polar King freezer using 3 plastic drums filled with soil. Cups of ants placed at various levels in different drums: Drum 1 - Cups A & B placed together 20” from the bottom; Drum 2 - Cup C 20” from the bottom (no probe) and Cup D 15” from bottom; Drum 3 - Cup E was 22” from bottom and Cup F 10” from bottom.

51
Figure 8. Mean temperature soil adjacent to IFA Cups over 3 trials in drums in the Polar King freezer. Depths of cups noted on legend.
Trials then moved on to using the 36-inch square corrugated boxes, similar to boxes used to move contaminated soils. We conducted one trial with only one data logger as a test trial at the same 5 day (120 hour) time interval as was successful with the drums (waiting for new logger to be delivered after freezing one – NOTE: do not put data logger in freezer). With only 3 working temperature probes, we chose to use one probe for ambient air and 2 probes adjacent to IFA cups. Five IFA cups were placed in either of the 2 boxes filled with soil at different levels. Only Cup E at 24” from the bottom of box 2 and Cup D and 18” from the bottom of box 2 had probes. Data is not presented here, but Cup B which was 24” from the bottom of box 1 had six worker ants survive. It required 72 to 84 hours for the temperature in the soil adjacent to the IFA cups to reach 0°C in this test trial and at 120 hours when the test was terminated, the temperature at cups D and E was ca. -5°C and -2°C, respectively. In this test trial, we also realized how difficult it was to retrieve the cups without damaging the temperature probes due to the volume of frozen soil. In the remaining trials we extended the time period to 6 days (144 hours) and used PVC pipe to protect the temperature leads. The plywood frames to support the boxes were also added after this test trial. A few additional problems with probes made our testing of the boxes inconsistent. The position of the cups in the boxes remained consistent throughout the trials, but the same cups did not get probes in each trial, resulting in 4 reps instead of 3. On 8/19/11, there were 2 ambient air probes and 5 cup probes (no Cup C); on 8/31/11, 9/13/11 and 9/27/11, there was 1 ambient air probe and 5 cup probes (no Cup E) giving us 3 similar replicates. All trials ran for 144 hours and in all trials, all the ants died.

52
Ambient air trends were similar to those in the trials with the drums, with temperatures reaching 0°C within 6 hours, -10°C within 12 to 18 hours and fluctuating between -10°C and -20°C for the rest of the testing time period (Figure 9). In the first 3 trials, all soil locations cooled in a similar pattern through the 0°C temperature range, but the soil adjacent to cup D remained around the 0°C temperature longer than the others. In the 4th trial, this pattern was still evident although not as prominent. In these trials using the boxes, the mean temperature from each (Figure 10) shows that the soil adjacent to cups C and F decreased to 0°C within 48 hours after cooling started, soil adjacent to cup B within 60 hours and soil adjacent to cups A and D within 72 hours. Soils adjacent to cups A, B, C and F dropped below -5°C between 84 and 96 hours, while soil adjacent to cup D required an average of 108 hours to drop below -5°C. Cups A and D were located 18” from the bottom of separate boxes, but cup D was in the box near the door and furthest from the freezer unit. Even with the worst case scenario of cup D, average soil temperatures in the 36x36” boxes were below -5°C for a minimum of 36 hours.

53
Figure 9. Temperature trends in 4 trials conducted in the Polar King freezer using 2 36x36” boxes filled with soil. Cups of ants placed at various levels in different drums: Box 1 - Cup A 18” from the bottom; Cup B 24” from the bottom; Cup C 30” from the bottom. Box 2 - Cup D 18” from the bottom; Cup E 24” from the bottom; Cup F at 30” from the bottom.

54
Figure 10. Mean temperature soil adjacent to IFA Cups over 3-4 trials in boxes in the Polar King freezer. Depths of cups noted on legend.
DISCUSSION: Preliminary data indicates the expected: the larger the individual soil mass (containers/drums/boxes), the longer it takes for the soil to achieve and maintain temperatures required to kill IFA. The tall cylindrical shape of the drums allowed more rapid cooling of the soil than either the chest freezer or the boxes (Figure 11). In all trials where ants died, the soil maintained temperatures below -5°C for a minimum of 36 hours. In the limited trials where a few ants survived soil temperatures were below -5°C for less than 24 hours. Figure 11. Average time ranges required to reach various temperatures within different freezer and container types.
Type freezer/soil container Hrs. to reach 0°C Hrs to reach -5°C
# hrs below -5°C for dead ants
Chest/filled with soil 48 72-80 36+ Commercial/drums 24-36 30-54 42+ Commercial/boxes 48-72 84-108 36+
As noted in all trials, ambient air temperature fluctuates as the cooling unit cycles. The location of the soil containers in the commercial Polar King unit appeared to impact the cooling time of the soil in the drums; soil adjacent to cups placed at the same level in different drums taking longer to

55
reach -5°C were located in drums closest to the door/furthest from the cooling unit. Soil adjacent to cups at similar depths in the drums in back of freezer nearest to the cooling unit was more consistent in temperature trends. This was not evident in the box soil containers in the Polar King unit, where temperature trends in soil adjacent to cups placed at the same soil level in different boxes was similar. We did not look at other variables that can change the time required for soil to cool to certain temperatures. Relative humidity and soil type are two variables that could have significant impact on cooling times. These variables need to be explored. One issue we had was that the starting temperatures in the Polar King freezer got lower as box trial progressed especially in soils (vs. ambient air). The soil in the boxes was not warming completely even with 5-7 day intervals between trials, certainly a product of the volume of soil in the boxes, and the fact that we could not easily remove the boxes from the freezer. In the real world, starting temperatures will vary based on time of year, location, etc. Therefore, it will probably be best to look at developing a procedure that is based on obtaining and maintaining a certain temperature for a certain period of time, rather than just a time frame based on the freezer’s cooling ability (ie, not x days at ambient air temp of ± -20°C, but rather all soil masses must reach -x°C and stay at or below that temperature for y hours). APHIS-PPQ is responsible for development of and approval of quarantine treatments for use by industry to comply with the Federal IFA Quarantine. Due to the closing of the APHIS-PPQ-Gulfport Laboratory in late 2011/early 2012, which traditionally developed regulatory treatments for items regulated by the Federal IFA Quarantine, methods development activities will be managed and overseen by APHIS-PPQ-CPHST staff, but conducted by other groups through agreements. Tennessee is on the leading edge of the IFA regulated area, and contaminated soils ship from that area into non-regulated areas, requiring case by case permitting of each load. City-State LLC, a company located in Knoxville, TN, routinely ships contaminated bulk soil out of the regulated area and is extremely interested in participating in treatment development. University of Tennessee is also located in Knoxville, TN, and has published articles on effects of freezing on imported fire ants. Therefore University of Tennessee has an interest in conducting cold treatment trials on IFA and experience to do so. Work at the University of Tennessee will move into bulk soil packaged similar to that of contaminated soils and into full sized refrigerated truck containers. Much of this bulk soil is packaged in super sacks, drums, lined corrugated boxes, or other types of containers, such as B-25s, which can be placed into containers for shipping, including refrigerated containers. Methods described in the Gulfport project will be modified in consultation with CPHST to fit the larger scale of the trial. If time allows, soil of two different moisture contents will be tested in as many container types as is practical.

56
PROJECT NO: A1F01 PROJECT TITLE: Field Releases and Evaluations of Kneallhazia solenopsae in Harrison County
Southern Mississippi, 2009 – 2011 TYPE REPORT: Final LEADER/PARTICIPANTS: Xikui Wei, Anne-Marie Callcott, Lee McAnally & Craig Hinton COOPERATOR: Dr. David Oi, USDA, ARS, CMAVE, Gainesville, FL INTRODUCTION The microsporidium Kneallhazia (=Thelohania) solenopsae (Microsporidia: Thelohaniidae) was discovered in Brazil in the red imported fire ant (Knell et al. 1977). Since that time, USDA, ARS, CMAVE personnel in Argentina also discovered the pathogen in the black imported fire ant in that country and determined that the pathogen does decrease colonies and colony vigor and therefore may be a good candidate for use as a biological control agent in the United States (Briano et al. 1995a, 1995b, 1996). In 1998, Gulfport lab initiated a trial releasing the microsporidium in Harrison and Hancock counties, MS, but these initial inoculation sites were lost or had poor results (see 1999 annual report for FA02G048). Releases were repeated in the fall of 1999 with continuous field evaluations conducted in the following several years (see annual reports 1999 - 2003). Even though progresses were made in getting infections to polygyne fire ant colonies in the field in our trials as well as in other states, there has not been success in infecting monogyne colonies in the field with K. solenopsae anywhere in the US. Therefore, we attempted three releases (2009 – 2010) to infect monogyne colonies with K. solenopsae in Harrison County in southern Mississippi. MATERIALS AND METHODS 2009 inoculation Because of our prior knowledge on possible monogyne social form, the site in Harrison County was selected for the inoculation trials. In June 2009, worker ant samples were collected from fire ant colonies in Harrison County Farm for social form determination and presence of K. solenopsae using PCR technology (Valles et al. 2002). Pre-inoculation samples were all negative for K. solenopsae presence and were monogyne except one colony (#23) that was polygyne. Colonies inside the fenced area (where we have Japanese boxwood trees planted) were generally small (population indices 7 & 8’s determined with the procedure described by Harlan et al. (1981) and modified by Lofgren and Williams (1982)) and those outside of fence were larger. Because of large amount of brood inocula available (field collected in Florida by ARS personnel prior to study) for inoculation, the colonies outside of the fence were used for inoculation. On the day of release (August 26, 2009), colonies were PI rated; workers samples were collected and new colonies were located and marked. Colonies were easy to find because grass in the plot was short at time of inoculation. Brood condition was good since it was separated from workers and held

57
overnight with 5% workers by weight of brood. Ten mounds (all outside of the fenced area) were introduced 4.35 – 9.50 g of infected brood by Dr. David Oi and his technician with the assistance of Gulfport staff (Table 1). Brood inocula were added to colonies by slightly opening mounds and pouring inocula inside and partially covering it with mound soil. Colonies were inoculated between 10 -11am when temperature was 87 °F with 70% RH. Inocula were taken inside the colonies within 10 minutes. Frozen crickets were distributed to some nest as supplemental food to help smaller colonies to grow. Tracking locations of colonies was carried out weekly. All mounds were given frozen crickets each time an evaluation was made in an effort to promote growth of the colony sizes. Eight weeks after inoculation, worker samples were collected from each colony for K. solenopsae spore examinations and this was repeated every month. Ants from each sample were ground in a tissue grinder and wet mount slides were made of the resulting slurry. The slides were studied under 400x magnification on a phase contrast microscope for presence of spores (Briano et al. 1995a ). Table 1. Colony size ratings and PCR results on social form and K. solenopsae presence of inoculated mounds at Harrison County Farm, Mississippi, August 2009
Colony # Social Ks –PCR PI rate Sexual Total brood (g)
Proportion Infected
Infected brood (g)
26 M Negative 10 N 19 0.5 9.5 25 M Negative 9 N 12.5 0.7 8.75 29 M Negative 9 N 17.5 0.5 8.75 15 M Negative 10 Y 20 0.4 8 23 P Negative 7 N 13 0.6 7.8 28 M Negative 9 Y 13 0.6 7.8 22 M Negative 9 N 16 0.4 6.4 30 M Negative 10 N 19 0.3 5.7 27 M Negative 8 N 17.5 0.3 5.25 24 M Negative 8 N 14.5 0.3 4.35
2010 re-inoculations Because the 2009 inoculation did not result in any K. solenopsae infected monogyne colonies, repeated releases were conducted in the summer of 2010. The brood infected with K. solenopsae was field collected and shipped from Florida by ARS personnel. The brood received in each colony was re-weighed after further separation of workers which remained in the colonies for taking care of the brood during the shipment. Since there was limited amount of infected brood available, 8 mounds (all outside of the fence) were used for inoculation and 11 for control. The infected brood from each colony was divided into two equal halves for inoculation to the field colonies on May 28, 2010 (Table 2). Brood inocula were added to colonies the same way as in June 2009 inoculation except that plastic disposable plates attached to flag wires were used to provide cool shades for the inocula so that the summer heat would not kill the brood before they were picked up by fire ant workers (Figs. 1&2).

58
All introduced brood was taken inside nests within 10 minutes. Repeated release using this same procedure was conducted again on August 20, 2010 to 6 colonies that did not get infected from previous (May 28, 2010) inoculation (Table 3). Tracking locations of nests and evaluations were carried out thereafter following the 2009 procedures. Alates trapping in summer 2011 Alate trap making: We redesigned the alate traps on the basis of those used by ARS and our own lab. A 20” wire basket (for wrapping root balls of nursery stock) was used as a frame of the trap. An aluminum cake making ring mold (Better Houseware, Long Island City, NY, 5 cup capacity 21.5 cm diameter) was attached to the bottom of the wire basket. To securely join them together, three holes were drilled at the side of the ring mold in an equal distance from each other. The wires that form the bottom of the basket were cut in the middle and the ends of cut wire were pushed through the holes and bended inside (Fig. 4). The bended ends inside of the mold were used as the resting supports for the clear plastic container (19.05 cm high x 20.2 cm in dia., Catalog #289C from Pioneer Plastics , North Dixon, KY) that was placed upside down sealing the ring mold opening (Figs 3&5). A piece of screen mesh lined the inside of the wire basket to complete the trap (Fig. 3). The redesigned traps have the advantages of easy to build and install. They lasted the entire season in the field maintaining good shape till the end. They can be stacked together for easy storage and transportation (Fig. 6).
Setup of alate traps: Six alate traps were set up (two for the control colonies, two for the inoculated but not infected and two for the infected colonies) on April 14, 2011 (Fig. 7). Automobile antifreeze was added to the ring mold pan for preservation of caught alates (Fig. 8). Traps were checked weekly for possible nuptial fly. Due to extreme dry weather conditions during the first several weeks after traps were set up, there were no flying activities and therefore traps were not regularly checked for some time until there was a heavy rain in the area which triggered the fly activities in the week of May 29, 2011. Several more flight events followed thereafter because of the favorable weather conditions during that time and the last collection of trapped alates was made on July 21, 2011.
Fig 1. Plate provided cool shade for the exposed inocula while waiting for worker ants to carry inside.
Fig 2. Shaded area near the plate was in great contrast with the un-shaded other area.

59
Fig. 3. A completed alate trap Fig. 4. Wire ends pushed through the holes on the side of the ring mold to make a secured join of the two items
Fig 5. Bended wire ends as resting supports for the alate collecting plastic container placed upside down
Fig 6. Alate traps stacked together for easy storage and transportation
Fig 7. Alate traps set up in the field Fig 8. Close-up of an alate trap set up in the field

60
Table 2. Colony size ratings and inocula information of inoculated colonies at Harrison County Farm, Mississippi, May 28, 2010
Inocula Receiving colony
Brood received % infected Final amount Colony # Rating
11.35 g of 70% infected
70 4.3 15 5
70 4.3 16 4
12.48 g of 60% infected
60 5.6 13 9
60 5.6 14 9
10.23 g of 40% infected
40 4.2 12 9
40 4.2 17 4
12.48 g of 30% infected
30 4.8 18 9
30 4.8 19 8 Table 3. Colony size ratings and inocula information of inoculated colonies at Harrison County Farm, Mississippi, August 20, 2010
*the two previously infected colonies (#14 and #19) were not inoculated this time. RESULTS No K. solenopsae spores were detected in the pretreatment samples and the first release conducted in August 2009 did not result in any infected monogyne colonies. Colony numbers were not changed throughout the season except that some of them moved around in the nearby area but were still allowed for location tracking. Two inoculated colonies (#14 & #19) were found infected with K. solenopsae after the re-inoculation conducted in May 2010 when 8 colonies were inoculated with the infected brood. Worker ant samples taken from these two infected colonies were found loaded with K. solenopsae spores every time an evaluation was
Inocula Receiving colony
Brood received % infected Amount Colony # Rating
15.1 g of 60% infected
60 5.6 12 9
60 5.4 13 9
13.1 g of 40% infected
40 4.8 15 8
40 4.8 17 9
12.25 g of 20% infected
20 5.3 18 3
20 5.4 20 7

61
made after the first detection of their infection. No spores were detected from any of the control colonies for the entire season.
The second re-inoculation to 6 monogyne colonies (excluding the two already infected) conducted in August 2010 did not result in any additional infected colonies, but the two previously infected colonies (#14 and #19) were found positive every time worker samples were taken for evaluation throughout the conclusion of the study in July 2011.
Alates were first found in traps on June 3, 2011 following a heavy rain in the area the week of May 22, 2011. Trapped alates were retrieved and numbers recorded. A few more flight events were noted during the season and total numbers of alates caught in each trap are shown in Table 4. It is obvious that the numbers of alates caught from the two infected colonies (186 total alates for #14 and 1122 total alates for #19) were greatly reduced compared with those caught from the not infected or not inoculated control colonies. Alates preserved in 95% alcohol were also shipped to Gainesville, FL for determination of K. solenopsae infection by ARS personnel. Based on the results of PCR analysis with 10 alates from each colony, K. solenopsae-infected alates were found at 30% in Colony #14 and 40% in Colony #19. The alates trapped from the rest of the colonies were all negative which coincided with the results of worker sample evaluations during the trial season.
Table 4. Alates captured in traps for the entire season in summer 2011, Harrison County, Mississippi
Colony Male (♂) Female (♀) Total (♂+♀)
# 9 (Not inoculated) 10 6725 6735
# 10 (Not inoculated) 1 5073 5074
# 12 (Not infected) 2158 878 3036
# 13 (Not infected) 8473 565 9038
# 14 (Infected) 0 1122 1122
# 19 (Infected) 6 180 186 DISCUSSION Results from this trial indicated that K. solenopsae could be introduced to monogyne colonies in the field environment and could be passed on to female alates from the infected colonies. To be a useful biological control agent, one of the properties of an ideal biological control agent is the ability to sustain itself in the field. The infected monogyne colonies from this trial remained infected for the entire season and beyond. Also, detection of spores in the caught female alates may suggest that the spores could be passed onto new colonies initiated by these infected queens. This first successful inoculation in the monogyne colonies in the field and the detection of spores in the caught female alates clearly demonstrated the ability of spreading the pathogen in the field environment. Also, the greatly reduced numbers of alates caught from the infected colonies

62
suggested that the present of the pathogen had already impacted the vigor of the infected colonies in the first year of infection. With the time advances, it is possible that greater impact on colony size and vigor could be seen in the later years, which, however, is beyond the data from this trial could suggest. It was previously believed that monogyne colonies could not be inoculated in the field possibly because monogyne field colonies did not accept the infected brood from outside colonies or because monogyne colonies were killed by the introduced infection therefore infected monogyne colonies could not survive a long enough time for this pathogen to be useful. Our results showed that the infected monogyne colonies could exist in the field for a long time and the pathogen could also spread through the infected female alates. REFERENCES CITED Briano, J., R. Patterson and H. Cordo. 1995a. Relationship between colony size of Solenopsis
richteri (Hymenoptera: Formicidae) in Argentina. J. Econ. Entomol. 88: 1233-1237. Briano, J.A., R.S. Patterson and H.A. Cordo. 1995b. Long-term studies of the black imported fire
ant (Hymenoptera: Formicidae) infected with a microsporidium. Environ. Entomol. 24: 1328-1332
Briano, J.A., R.S. Patterson, J.J. Becnel and H.A. Cordo. 1996. The black imported fire ant, Solenopsis richteri, infected with Thelohania solenopsae: intracolonial prevalence of infection and evidence for transovarial transmission. J. Invertebr. Pathol. 67:178-179.
Harlan, D. P., W. A. Banks, H. L. Collins, and C. E. Stringer. 1981. Large area tests of AC-217,300 bait for control of imported fire ants in Alabama, Louisiana, and Texas. Southwest. Entomol. 6: 150-157.
Knell, J.D., G.E. Allen and E.I. Hazard. 1977. Light and electron microscope study of Thelohania solenopsae n. Sp. (Microsporidae: Protozoa) in the red imported fire ant, Solenopsis invicta. J. INvertebr. Pathol. 29: 192-200.
Lofgren, C. S., and D. F. Williams. 1982. Avermectin B1a: Highly potent inhibitor of reproduction by queens of the red imported fire ant (Hymenoptera: Formicidae). J. Econ. Entomol. 75: 798-803.
Valles, S.M, D.H. Oi, O.P. Perera and D.F. Williams. 2002. Detection of Thelohania solenopsae (Mircosporidia: Thelohaniidae) in Solenopsis invicta (Hymenoptera: Formicidae) by multiplex PCR. J. Invertebr. Pathol. 81: 196-201.
63
CPHST PIC NO: A1F01 PROJECT TITLE: Biological Control of the Imported Fire Ant Using Phorid Flies: Cooperative
Rearing and Release Project, 2011 (Pseudacteon tricuspis, P. curvatus, P. obtusus and P. cultellatus)
TYPE REPORT: Interim Project Lead: Anne-Marie Callcott Cooperators: Sanford Porter (ARS CMAVE), George Schneider and staff at FL DPI, and State Departments of Agriculture and their designees SUMMARY: The phorid fly rearing and release project is a great success. Since 2002, two species of Pseudacteon sp. flies have been released at multiple sites in all imported fire ant quarantined states in the contiguous southeastern states and Puerto Rico (no releases in NM and only one species released in CA). Field releases with a third species. P. obtusus, began in 2008 and with a fourth species, P. cultellatus, in 2011. From 2002 through 2011 there have been 129 field releases in IFA quarantined states in the contiguous southeastern states and Puerto Rico (no releases in NM and only one species released in CA) and more than 1.4 million potential flies released or used in demonstration/research projects. Of these 129 releases, 67 were P. tricuspis, 42 were P. curvatus, 18 were P. obtusus, and 2 were P. cultellatus. Through APHIS releases, along with other federal and university releases, P. tricuspis is well established in the southern areas of the IFA regulated area covering about 50% of the IFA regulated area. To date, P. tricuspis is not known to be established in CA, OK or TN. The second species, P. curvatus, is well established in all southern IFA regulated states and PR, covering about 65% of the regulated area. P. curvatus has not been released in CA. Overwinter establishment of P. obtusus has been confirmed. A publication on the known U.S.-wide distribution of P. tricuspis and P. curvatus was published in 2011 (http://insectscience.org/11.19/) and contains a history of the APHIS program, other federal and state/university release programs, maps depicting distribution in 2008 and expected distribution in 2011, and a discussion of the future of new species releases. INTRODUCTION: In a USDA-APHIS survey, seven southern states ranked IFA as a top priority target organism for biological control. Most research on phorid flies has been under the direction of ARS in Gainesville, FL. Phorid flies (Pseudacteon spp.) from South America are promising biological control agents of IFA because they are relatively specific to IFA, are active throughout most of the year, and through suppression of fire ant activity, may allow native ants to compete with IFA for food and territory (Porter 1998). Potentially, there may be as many as 15 species or biotypes of the fly that will have an impact on IFA, and thus are candidates for rearing and release in the U.S. Phorid flies will not be a stand-alone biological control agent for IFA. A homeowner will not be able to release a few flies in their back yard and see a significant decrease in IFA mounds in

64
the yard. However, the flies will be an important tool in IFA management programs. It is anticipated that if several species of flies are established in the IFA infested area of the U.S. over the next 10 or more years, the added stress caused by these flies on the IFA colonies will allow native ants to compete better for food and territory. This fly-native ant-IFA interaction will hopefully allow homeowners, municipalities, and others, to make fewer chemical control product applications annually to suppress the IFA to acceptable tolerance levels, lessening the impact of the IFA on humans, livestock, wildlife and the environment. USDA, APHIS, PPQ began funding a cooperative project in 2001 to rear and release this potential biological control agent for imported fire ants. MATERIALS AND METHODS: Preliminary research and rearing techniques have been developed by USDA, ARS for four species, with others under development. ARS will continue to evaluate other phorid fly species for potential use in the U.S., and transfer rearing techniques to the rearing facility as the new species are ready for mass rearing. Mass rearing of flies is being conducted by the Florida Department of Agriculture, Dept. of Plant Industries (DPI), in Gainesville, FL. The CPHST biological technician position assigned to the rearing facility was transferred to the cooperative agreement when the position was vacated in early 2008. The position was refilled by one of the FL-DPI qualified and experienced technicians as a promotional opportunity. This position will continue to coordinate the shipment of phorid flies to field cooperators as well as assist in production duties and perform methods development experiments to improve rearing techniques or solve problems as needed. Rearing of these flies is extremely labor intensive, requiring 1-1.5 person(s) to maintain every 2 attack boxes. These flies cannot be reared on a special diet or medium but require live fire ants to complete their life cycle. An excellent pictorial and text description of the rearing technique is available online from the FL DPI at: http://www.freshfromflorida.com/pi/methods/fire-phorid.html. Very simply, imported fire ant workers and brood are placed in a pan (from which they cannot escape) within a large attack box where adult flies are allowed to emerge, mate and lay eggs within the worker ant. The parasitized worker ants are then maintained for ca. 40 days with food and water. As the immature fly develops, the larval stage migrates to the ant’s head capsule. The head capsule of the ant falls off and the larva then pupates within the head capsule. Head capsules are collected by hand and either prepared for shipping to the field for release or are used to maintain and/or increase production. Adult flies live only a few days and are very fragile, therefore it is impractical to ship adult flies. Release techniques for the first fly species, P. tricuspis, are also labor intensive for the releaser. Originally, approximately 5000-6000 parasitized worker ant head capsules were shipped to the cooperator for each release. In 2004, numbers of head capsules shipped per release were increased to ca. 10,000. The cooperator must place the head capsules in an enclosed emergence box and allow the adult flies to emerge daily over 10-14 days. Adult flies are then aspirated into vials, carried to the field and released over IFA mounds. The mounds are disturbed frequently for

65
2 hours to insure worker ants are available on the soil surface for the flies to attack. One “release” encompasses 10-14 days of daily fly collection and release over mounds. Release techniques for the second fly species, P. curvatus, are somewhat less labor intensive for the releaser, but more intensive for the production facility. Worker ants are field collected from marked mounds and sent to the Gainesville rearing facility. The worker ants are subjected to flies to become parasitized, and then returned to the collector to be re-introduced to their “home” mound to complete the fly’s lifecycle. Release techniques for the third and fourth fly species, P. obtusus and P. cultellatus, are utilizing a combination of the above techniques. This fly species parasitizing the largest of the worker ants, and many cooperators are having difficulty collecting enough large workers for a full release. Therefore, if the cooperator cannot collect enough large workers, fly pupae (ant heads) are shipped to the cooperator as in the P. tricuspis release technique, and upon release of the adult flies, allowing the flies to find the large workers in the field. This has decreased our average number of potential flies for each release. Monitoring the success of the fly releases was originally conducted at a minimum annually and involved returning to the original release site, disturbing several IFA mounds and visually looking for attacking phorid flies over a set period of time. If flies were found at the original release site, the cooperator moved a set distance away from the release site along the four cardinal positions and monitored for flies. Personnel continued moving away from the original release site until no flies were found. In 2007, changes to the monitoring protocols were developed due to the availability of a phorid fly trap and the number of releases that had occurred. Our primary focus changed from monitoring release sites and spread from individual sites to determining fly presence by species at the county level. The use of the trap has enabled personnel to monitor many sites in a very short period of time – place the trap and retrieve it 24 hours later. Instructions for making the traps and site selection for monitoring are sent to cooperators involved in the trap monitoring. Traps are usually sent to the Gulfport Lab for fly identification. RESULTS: Highlights of the APHIS project:
• APHIS funding initiated through CPHST-NBCI in 2001 and supported by PPQ-HQ, ER, WR, CPHST
• Cooperative agreement initiated with FL-DPI to conduct rearing in 2001 • 2001 –Pseudacteon tricuspis rearing initiated • 2002 – P. tricuspis releases begun • 2002 – P. curvatus rearing initiated • 2004 – P. curvatus releases begun • 2006 – P. obtusus rearing initiated • 2008 – P. obtusus releases begun • 2010 – P. cultellatus rearing initiated • 2011 – P. cultellatus releases begun

66
Rearing data: Rearing was initiated in 2001 for P. tricuspis, seeded by flies from the ARS-CMAVE facility. The number of rearing boxes in P. tricuspis production has increased from the initial 1-2 boxes in 2001 to a high of ca. 10-12 boxes in 2003. Rearing of P. tricuspis was at its peak in 2003 and 2004 with ca. 1.6 million flies being produced annually with production gradually decreased to allow increased production of the P. curvatus and P. obtusus flies. P. tricuspis will continue to be reared through 2011 in limited quantities with the aim to phase out production in 2011 and eliminate rearing of this species totally in 2012. P. curvatus rearing was initiated in late 2002, with the initial 1-2 boxes again seeded by flies from the ARS-CMAVE facility. Production of this species was at its peak in 2006 and 2007 with 7 boxes in production and has subsequently decreased as P. obtusus production increased. In 2006, the third species, P. obtusus, was brought into production. Production has gone well and the first releases of this species were conducted in 2008 and 18 releases to date. In 2010, rearing was initiated on the fourth species, P. cultellatus, with the first releases conducted in 2011. Except for 2009 when production levels were above 3,000,000, total fly production levels have remained fairly constant in the last several years (Table 1). Release data: While flies have been and will continue to be released by various research agencies, including ARS, in many states for research purposes, the goal of this project is to release flies in all federally quarantined states, and ultimately in all infested states. Releases are being coordinated through state plant regulatory officials, with a variety of state groups cooperating with the release and monitoring of the flies. Releases began in spring 2002. In most cases, the cooperator made the release at one site, however, in a few cases the cooperator split the release and released flies at more than one site. Also, there are several sites were multiple releases over several years have occurred. From 2002 through 2011 there have been multiple releases in each of 13 states and Puerto Rico, with a total of 129 field releases and more than 1.1 million potential flies released. Of these 129 releases, 67 were P. tricuspis, 42 were P. curvatus, 18 were P. obtusus, and 2 were P. cultellatus. (Table 1). The average number of potential flies per release is about 10,000 flies. In 2008, the changing economy had an impact on our cooperators’ abilities to conduct releases, and due to lack of resources in many states the number of overall releases in 2008 was less than in previous years. In 2009, we were able to increase our releases from 2008 and have maintained that level through 2010. In addition to field releases, the equivalent of 3 P. tricuspis shipments have gone to Louisiana to seed their own rearing facility, the equivalent of 2 releases have gone to New Mexico for research purposes, one P. curvatus release was abandoned due to site issues, and numerous small numbers of flies have been supplied to cooperators for research or educational purposes, such as state fair exhibits and field days. Louisiana completed its first release from LA-reared flies in 2005, conducted a few releases and then abandoned rearing flies in 2006-2007 and is now releasing APHIS reared flies only. Over 380,000 potential flies have been shipped for these varied uses. Success of the program was originally measured by successful overwintering of fly populations at release sites. However, resources do not allow all cooperators to conduct the intensive monitoring surveys needed to determine success at this level. Of the 56 releases conducted in

67
2002-2005, flies were found after a winter at 27 of these sites, a 48% success rate; 19 tricuspis sites (AL, AR, FL, GA, LA, MS, NC, PR, SC, TX) and 8 curvatus sites (FL, LA, NC, OK, SC, TX). In 2007 we also realized that we could no longer determine the true source of flies present in an area due to the large number of established and spreading fly populations and so the attempt to determine individual site establishment of flies was abandoned. Since 2007 the use of the phorid fly trap and a monitoring protocol for surveying for fly presence at the county level has provided a wealth of information regarding establishment and spread of the flies. Through APHIS releases, along with other federal and university groups which are also releasing flies, P. tricuspis is well established in the southern areas of the IFA regulated area (AL, FL, GA, LA, MS, TX and PR), and moderately established in AR, NC and SC. To date, P. tricuspis is not known to be established in CA, OK or TN. The second species, P. curvatus, is also well established in all southern IFA regulated states and PR (AL, AR, FL, GA, LA, MS, NC, OK, SC, TN, TX, and PR), and appears to be better suited to life in the U.S. than P. tricuspis. P. curvatus has not been released in CA. Overwinter establishment of P. obtusus has been confirmed, but overwintering for P. cultellatus has not yet been confirmed. A publication on the known U.S.-wide distribution of P. tricuspis and P. curvatus was published in 2011 (http://insectscience.org/11.19/) and contains a history of the APHIS program, other federal and state/university release programs, maps depicting distribution in 2008 and expected distribution in 2011, and a discussion of the future of new species releases. REFERENCES CITED: Porter, S.D. 1998. Biology and behavior of Pseudacteon decapitating flies (Diptera: Phoridae) that parasitize Solenopsis fire ants (Hymenoptera: Formicidae). Fla. Entomol. 81: 292-309.

68
Table 1. Production and field release numbers for IFA-phorid fly program. Does not include flies shipped for research and demonstration projects.
No. flies Approx. no. No. field Mean flies/ Species Year produced shipped* releases** release
tri,cur 2002† 950,063 58,750 12 4,895.83 tri,cur 2003 1,746,383 81,450 15 5,430.00 tri,cur 2004 2,280,039 128,602 12 10,716.83 tri,cur 2005 2,765,291 179,813 17 10,577.24 tri,cur,obt 2006†† 2,448,798 178,259 17 10,485.82 tri,cur,obt 2007†† 2,614,655 137,381 12 11,448.42 tri,cur,obt 2008 2,524,047 80,813 8 10,101.63 tri,cur,obt 2009 3,335,019 88,109 12 7,342.42 tri,cur,obt,cul 2010††† 2,571,357 76,221 12 6,351.75 tri,cur,obt,cul 2011 3,322,028 92,148 12 7,679.00 tri,cur,obt,cul 2012 Total 24,557,680 1,101,546 129 8,502.89
* approx. no. potential flies shipped for release ** does not include multiple shipments to LA for initiating their own rearing facility and NM for research
purposes, nor multiple shipments to cooperators for educational purposes or small research projects as flies were available *** shipped for all purposes, field release, initiate rearing, education, etc.
† only tricuspis shipped in 2002 †† only tricuspis and curvatus shipped in 2006 and 2007
††† only tricuspis, curvatus and obtusus shipped in 2010

69
2011 Summary of Imported Fire Ant Samples Submitted to CPHST-Gulfport Laboratory for Chemical Analysis or Bulk Density Determination:
Routine, Potential Violation and Blitz Samples Prior to 2006, IFA samples submitted to the CPHST-Gulfport Laboratory, Chemistry Section for determination of insecticide levels or bulk density probably numbered fewer than 100 samples per year, and were primarily samples collected in response to potential violation incidents. In 2007, the CPHST Gulfport Laboratory, Imported Fire Ant Section began actively encouraging state plant inspectors and through them, individual nurseries, to submit soil samples to insure appropriate amounts of insecticide were present to meet the goals of the IFA quarantine. Some states have their own laboratories conduct analyses, and others submit them to CPHST-Gulfport for analysis. In 2007, the CPHST-Gulfport Laboratory IFA Section began tracking these samples and reported here is a summary of the results of the samples submitted in 2011. Results are reported back to the requesting person, unless they are blitz or potential violation results. Those results are also reported to appropriate SPHD, RPM, and EDP. Program insecticides analyzed for include chlorpyrifos, bifenthrin, diazinon, tefluthrin and fipronil. Bifenthrin is the most requested analysis, followed by chlorpyrifos, with a few requesting fipronil. Diazinon can only be used in special circumstances under section 24c labeling, and tefluthrin is not available at this time as a nursery treatment. Fipronil is only used on grass sod, and is applied at levels below the level of detection of the instruments and method currently used (applied below theoretical 0.1 ppm). In 2010, levels of detection (LOD), levels of quantification (LOQ), and range of below quantifiable level (BQL), in ppm, were reported at the levels below:
LOD LOQ BQL Bifenthrin 0.9 3.0 0.9 – 3.0 Chlorpyrifos 0.5 1.67 0.5 – 1.67 Diazinon 0.5 1.67 0.5 – 1.67 Fipronil 0.5 1.67 0.5 – 1.67
Overview of sample numbers:
• 111 total samples submitted (chemistry unit counts 233 samples as explained below) o 96 nursery samples o 15 blitz samples from NC (blitzes in spring and fall) (these are counted as 2
samples each for the chemistry unit since the multiple analysis requires splitting the sample to move down 2 separate paths and therefore must be tracked separately)
• 0 samples from potential violations • 96 routine samples
o 14 samples requesting bulk density only o 33 samples requesting chemical analysis only o 49 samples requesting chemical analysis and bulk density (these are counted as 2
samples each for the chemistry unit since chemical analysis and bulk density move down separate paths and therefore must be tracked separately)

70
Results: • 15 blitz samples from NC
o 10 of 15 total samples (66.6%) had detectible levels of program insecticide(s) o All were containerized media
• 96 routine samples o 63 bulk density samples: range 161-691 lb/cu yd o 82 samples analyzed for 1 or more program insecticides
All container media 78 samples (95.1%) had detectible levels of program insecticide(s)
Percent of routine and blitz soil/media samples analyzed by USDA-APHIS-PPQ-CPHST Gulfport Lab with detectable levels of IFA program insecticides by year from 2007-2011.
0102030405060708090
100
Perc
ent s
ampl
es w
ith
dete
ctab
le le
vel o
f IFA
pr
ogra
m in
sect
icid
es
routine blitz
Type of sample
2007 2008 2009 2010 2011
CPHST is closing the Gulfport facility and redirection of the CPHST staff and activities will begin in early 2012. One service historically provided by the CPHST Gulfport Lab-Analytical Chemistry section (aka NMRAL or ANPCL) to the IFA program that will now be discontinued is the analysis of nursery soils to determine levels of program insecticides (pesticide residue) for quality control or compliance checks (blitzes), or of nursery soils to determine bulk density (for growers to use to determine amount of insecticide to use). Not all states submit samples to the CPHST Gulfport Lab; some use their state pesticide labs. From 2008-2011 (Oct 31, 2011), the states submitting the most IFA samples for one or more types of analysis were GA, SC, NC and MS and the majority were submitted by state staff.
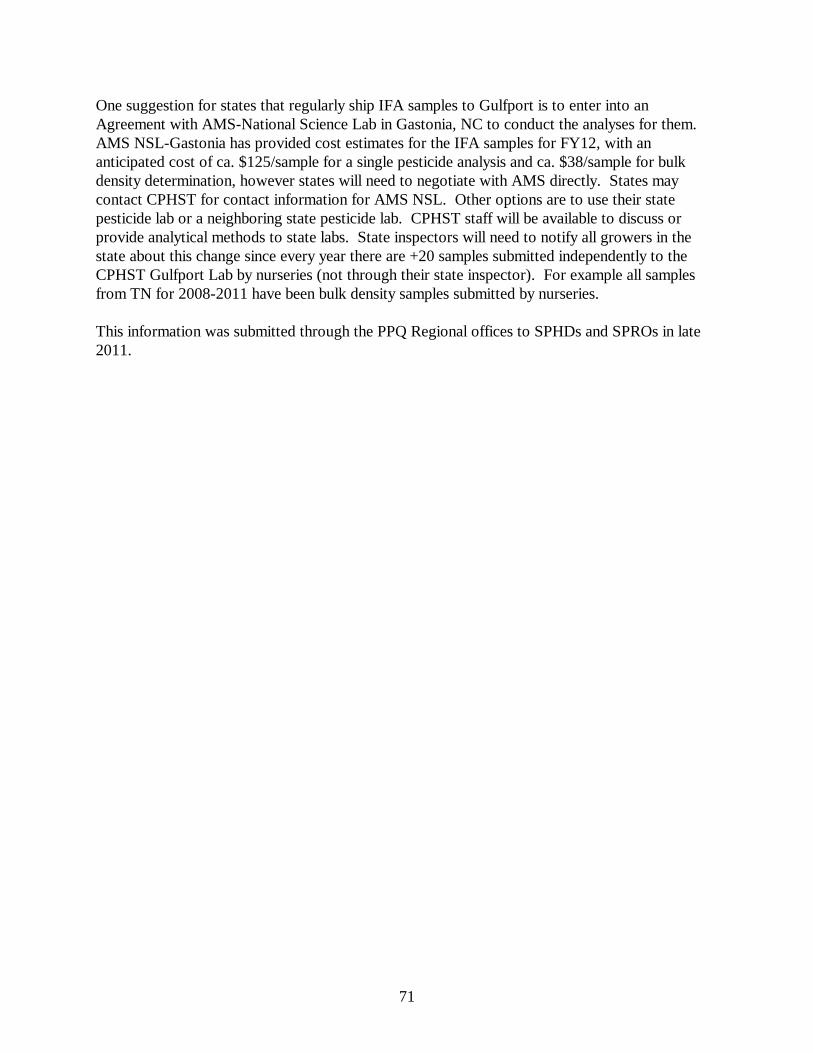
71
One suggestion for states that regularly ship IFA samples to Gulfport is to enter into an Agreement with AMS-National Science Lab in Gastonia, NC to conduct the analyses for them. AMS NSL-Gastonia has provided cost estimates for the IFA samples for FY12, with an anticipated cost of ca. $125/sample for a single pesticide analysis and ca. $38/sample for bulk density determination, however states will need to negotiate with AMS directly. States may contact CPHST for contact information for AMS NSL. Other options are to use their state pesticide lab or a neighboring state pesticide lab. CPHST staff will be available to discuss or provide analytical methods to state labs. State inspectors will need to notify all growers in the state about this change since every year there are +20 samples submitted independently to the CPHST Gulfport Lab by nurseries (not through their state inspector). For example all samples from TN for 2008-2011 have been bulk density samples submitted by nurseries. This information was submitted through the PPQ Regional offices to SPHDs and SPROs in late 2011.

72
APPENDIX I - LABORATORY BIOASSAY PROCEDURE
PROTOCOL FOR BIOASSAY OF INSECTICIDE TREATED POTTING MEDIA/SOIL WITH ALATE IFA FEMALES
Introduction: The development of quarantine treatments to prevent artificial spread of imported fire ants (IFA) in nursery stock requires the evaluation of candidate pesticides, dose rates, formulations, etc. The use of a laboratory bioassay procedure for these evaluations provides a rapid and inexpensive means of evaluating the numerous candidates tested each year. Various bioassay procedures have been devised over the years, but the procedure currently used by the USDA, APHIS Imported Fire Ant Laboratory in Gulfport, Mississippi, is described herein. This procedure is a slight modification of the test described by Banks et al., 1964 (J. Econ. Entomol. 57: 298-299). Collection of test insects: Field collected alate imported fire ant queens are used as the test insect. IFA colonies are opened with a spade and given a cursory examination for the presence of this life stage. Alate queens are seldom, if ever, present in all IFA colonies in a given area. Some colonies will contain only males, others may have few or no reproductive forms present, others may contain both males and queens, while some will contain only alate queens. Seasonal differences in the abundance of queens is quite evident; in the warmer months of the year 50% or more of the colonies in a given area may contain queens. However, in the cooler months, it is not uncommon to find that less that 10% of the colonies checked will contain an abundance of alate queens. Therefore, it is necessary to examine numerous colonies, selecting only those which contain large numbers of alate queens for collection. During winter, ants will often cluster near the surface of the mound facing the sun. Collection during midday on bright, sunny days is highly recommended for winter; whereas the cooler time of day is recommended for hot, dry days of summer. Once a colony (or colonies) has been selected for collection, the entire nest tumulus is shovelled into a 3-5 gallon pail. Pails should be given a liberal dusting with talcum powder on the interior sides to prevent the ants from climbing up the sides of the pail and escaping. Approximately 3-6" head room should be left to prevent escape. An effort should be made to collect as many ants as possible while minimizing the collection of adjacent soil which will contain few ants. Collected colonies are then transported to the laboratory for a 3-5 day acclimation period. The addition of food or water during this short acclimation period is not necessary. Alate queens are collected with forceps after placing a 1-2 liter aliquot of the nest tumulus in a shallow laboratory pan (Figure 1). Again, the use of talc on the sides of containers prevents escape while talced rubber gloves minimize the number of stings experienced by the collector. The forceps should be used to grasp the queens by the wings in order to prevent mechanical injury. An experienced collector can collect 200-300 queens per hour. It is generally advisable to place collected queens in a 500 cc beaker or other suitable vessel containing moist paper towels prior to being introduced into the test chamber. Test chambers: Test chambers are 2.5" x 2.5" plastic flower pots which have been equipped with a Labstone® bottom. Labstone is generally available through dental supply firms such as Nowak Dental Supplies, 8314 Parc Place, Chalmette, LA 70043 (800-654-7623). The labstone bottom

73
prevents the queens from escaping through the drain holes in the bottom of the pot and also serves as a wick to absorb moisture from an underlying bed of wet peat moss. Ants are susceptible to desiccation so humidity/moisture levels must be optimized. Pots should be soaked in water to moisten the labstone prior to placing potting media in the pots. The peat moss bed should be watered as needed to maintain a constant supply of moisture to the test chamber. Plastic petri dishes are inverted over the tops of the pots to prevent escape from the top of the test chambers (Figure 2). Prior to placing queens in the test chamber, 50 cc of treated potting media is placed in the bottom of each pot. Each test chamber with test media and queens is placed in a tray with a bed of wet peat moss (Figure 3). Due to possible pesticide contamination, test chambers are discarded after use. Replicates: Traditionally, each treatment to be evaluated is subdivided into 4 replicates; with one test chamber per replicate. Five alate queens are then introduced into each replicate. This protocol is generally used for evaluation of efficacy of insecticides used to treat containerized nursery stock. New testing of insecticides to treat balled-and-burlapped or field grown nursery stock has required the modification of the traditional replicated testing method for a variety of logistical and biological reasons. Therefore, each project/trial will define the exact queen numbers/test chamber and the number of test chambers per treatment. Test interval: All evaluations are based on a 7-14 day continuous exposure period. i.e., introduced queens remain in the test chambers for 7-14 days. At the end of the test time the contents of each chamber are expelled into a shallow laboratory pan and closely searched for the presence of live IFA alate queens. Mortality may also be evaluated daily or at other intervals defined by the specific workplan related to each individual project/trial. Recording of data: Results of each bioassay are entered on the appropriate data form. Conclusions regarding efficacy and residual activity of the candidate treatments are drawn from this raw data. Time estimates: The time required to conduct a bioassay will vary greatly, dependent upon a number of factors: 1) Availability of queens; supply is primarily influenced by season. More time will be
spent collecting queens in winter or during extreme droughts. 2) Number of treatments to be evaluated; e.g., if only a single treatment and an
untreated check are to be evaluated only 40 queens/month are needed. Conversely, a test involving 4 insecticides at 3 rates of application (12 treatments + untreated check) will require 260 queens monthly for the duration of the test.
Duration of the trial: A successful preplant incorporated treatment for nursery potting soil must provide a minimum of 12-18 months residual activity in order to conform with normal agronomic practices of the nursery industry. Since some plants may be held for longer periods of time prior to sale, a 24-36 month certification period (residual activity) would be ideal. Therefore, most

74
initial or preliminary trials with a given candidate treatment are scheduled for a minimum of 18 months. Balled-and-burlapped nursery stock treatments, as well as field grown stock treatments, vary in treatment certification periods from 2 weeks to 6 months. Thus the duration of these trials is generally a maximum of 6 months. Figure 1. Alate females being removed from Figure 2. Single test chamber with nest tumulus. test media and alate females with lid.
Figure 3. Set up of bioassay test procedure.