2011-2012 National Honey Bee Pests and Diseases Survey - APHIS
17
1 2011-2012 National Honey Bee Pests and Diseases Survey Report KAREN RENNICH 1 , JEFF PETTIS 3 , DENNIS VANENGELSDORP 1 , RACHEL BOZARTH 1 , HEATHER EVERSOLE 1 , KAREN ROCCASECCA 1 , MARGARET SMITH 1 , JENNIE STITZINGER 1 , MICHAEL ANDREE 4 , ROB SNYDER 4 , NATHAN RICE 3 , JAY EVANS 3 , VIC LEVI 3 , DAWN LOPEZ 3 , and ROBYN ROSE 2 1 University of Maryland, 2 USDA Animal and Plant Health Inspection Service, 3 USDA Agricultural Research Service, 4 University of California Cooperative Extension Executive summary The 2011 USDA Animal Plant and Health Inspection (APHIS) sponsored National Survey of Honey Bee Pests and Diseases was conducted in collaboration with the University of Maryland (UMD) and the USDA Agricultural Research Service (ARS) and with the cooperation of 34 states covering the timeframe from the spring of 2011 through the summer of 2012. This survey is in its third year and is the largest to date. The National Survey has expanded from a 3 state Pilot Survey in 2009 to a Limited National survey of 13 states in 2010. This expansion has allowed us to augment and extend the baseline pest and pathogen data collected from the previous 2 surveys. The primary focus of this survey was to verify the absence of exotic threats such as the parasitic mite, Tropilaelaps spp., Apis cerana, and Slow Paralysis Virus. Under current international trade agreements, the U.S. cannot deny import permits from other nations unless the exporting nation has a disease, parasite, or pest of honey bees that is not found in the U.S. Establishing the absence of threats to honey bee populations not thought to be present in the U.S. was the primary objective of this effort. With exotic species as the primary target, a secondary objective was set to make use of the sampling by determining existing levels of other honey bee diseases and parasites known to be present in the U.S. This was also performed in the previous two surveys. The survey results are used to gauge the overall health of colonies, to create a baseline disease level, and to facilitate interpretation of ongoing and future epidemiological studies. This baseline data, including historic data from research institutions such as the ARS Bee Research Laboratory (BRL) and other ongoing field sampling and management surveys, have been incorporated into a single database as part of the Bee Informed Partnership (www.beeinformed.org ), a 5 year grant funded by USDA NIFA (National Institute of Food and Agriculture). The 2011-2012 National Survey effort included collection of samples from 34 states: Alabama, Arkansas, California, Colorado, Delaware, Florida, Georgia, Hawaii, Idaho, Illinois, Indiana, Iowa, Louisiana, Maryland, Michigan, Minnesota, Montana, Nebraska, New York, New Mexico, New Hampshire, New Jersey, North Carolina, North Dakota, Ohio, Pennsylvania, South Carolina, South Dakota, Tennessee, Texas, Utah, Virginia, West Virginia and Wisconsin. A total of 875 samples representing 7,000 colonies are expected at the completion of this survey. To date, approximately 94% of the live bee samples (for virus analysis) have been collected and analyzed
Transcript of 2011-2012 National Honey Bee Pests and Diseases Survey - APHIS

1
2011-2012 National Honey Bee Pests and Diseases Survey Report
KAREN RENNICH1, JEFF PETTIS3, DENNIS VANENGELSDORP1, RACHEL BOZARTH1, HEATHER EVERSOLE1, KAREN ROCCASECCA1, MARGARET SMITH1, JENNIE STITZINGER1, MICHAEL ANDREE4, ROB SNYDER4, NATHAN RICE3, JAY EVANS3, VIC LEVI3, DAWN LOPEZ3, and ROBYN ROSE2
1University of Maryland, 2USDA Animal and Plant Health Inspection Service, 3USDA Agricultural
Research Service, 4University of California Cooperative Extension
Executive summary
The 2011 USDA Animal Plant and Health Inspection (APHIS) sponsored National Survey of Honey Bee Pests and Diseases was conducted in collaboration with the University of Maryland (UMD) and the USDA Agricultural Research Service (ARS) and with the cooperation of 34 states covering the timeframe from the spring of 2011 through the summer of 2012. This survey is in its third year and is the largest to date. The National Survey has expanded from a 3 state Pilot Survey in 2009 to a Limited National survey of 13 states in 2010. This expansion has allowed us to augment and extend the baseline pest and pathogen data collected from the previous 2 surveys. The primary focus of this survey was to verify the absence of exotic threats such as the parasitic mite, Tropilaelaps spp., Apis cerana, and Slow Paralysis Virus. Under current international trade agreements, the U.S. cannot deny import permits from other nations unless the exporting nation has a disease, parasite, or pest of honey bees that is not found in the U.S. Establishing the absence of threats to honey bee populations not thought to be present in the U.S. was the primary objective of this effort.
With exotic species as the primary target, a secondary objective was set to make use of the sampling by determining existing levels of other honey bee diseases and parasites known to be present in the U.S. This was also performed in the previous two surveys. The survey results are used to gauge the overall health of colonies, to create a baseline disease level, and to facilitate interpretation of ongoing and future epidemiological studies. This baseline data, including historic data from research institutions such as the ARS Bee Research Laboratory (BRL) and other ongoing field sampling and management surveys, have been incorporated into a single database as part of the Bee Informed Partnership (www.beeinformed.org), a 5 year grant funded by USDA NIFA (National Institute of Food and Agriculture). The 2011-2012 National Survey effort included collection of samples from 34 states: Alabama, Arkansas, California, Colorado, Delaware, Florida, Georgia, Hawaii, Idaho, Illinois, Indiana, Iowa, Louisiana, Maryland, Michigan, Minnesota, Montana, Nebraska, New York, New Mexico, New Hampshire, New Jersey, North Carolina, North Dakota, Ohio, Pennsylvania, South Carolina, South Dakota, Tennessee, Texas, Utah, Virginia, West Virginia and Wisconsin. A total of 875 samples representing 7,000 colonies are expected at the completion of this survey. To date, approximately 94% of the live bee samples (for virus analysis) have been collected and analyzed

2
and about 93% of the alcohol samples (for Varroa mite, Nosema and Tropilaelaps determination) have been delivered and processed. Also at this time, 80% of the reports to beekeepers and apiary inspectors have been distributed. A second full National Survey for 2012 was initiated early this summer with 32 participating states. Samples for this fourth survey have already begun to arrive.
The survey samples were analyzed for 10 known honey bee viruses, pests and pathogens. Slow Bee Paralysis Virus (SBPV), the only virus included in this year’s testing that is not currently found in the U.S., was examined in all samples and no detection was made. No diseases or parasites of bees not already known to exist in the country were discovered. Two common honey bee viruses, Deformed Wing Virus (DWV) and Black Queen Cell Virus (BQCV), were found in all 34 states. In this 2011 survey, 9 samples out of 673 tested positive for Nosema apis, or about 1.3% of the samples. This Nosema species was not detected in the previous survey years; however, this may be attributed to the development and implementation of a more sensitive primer used in the Polymerase Chain Reaction (PCR) detection this year. For the third year, we saw no evidence of Tropilaelaps mites. Since honey bee tracheal mites (Acarapis woodi) were not detected in samples in 2009 nor in 2010, samples were not analyzed for this mite this year. Honey bee tracheal mites are known to exist in the country and our failure to find them may be the result of our sampling procedure. Varroa mites continued to be observed in all states with the exception of the Hawaiian Islands of Maui, Kauai and Molokai.
New to the survey this year was a pilot pollen pesticide survey where a minimum of 3 grams of pollen was collected from brood frames that was tested for 174 known pesticides. The pollen was collected from the same composite 8 colonies undergoing the standard survey sampling and sent to the USDA Agricultural Marketing Service (AMS) in Gastonia, NC for analysis. This pilot pesticide survey focused on 11 states: Alabama, California, Colorado, Florida, Idaho, Indiana, New York, South Dakota, Tennessee, Texas and Wisconsin. We received 99 samples from these states and of the 174 possible pesticides, only 35 were detected. This pollen survey will be expanded and will include each participating state in the 2012 National Survey.
This survey was designed to be representative of the managed honey bees across the broad geography of the United States. The survey was open to any state wishing to participate and beekeeper participation was completely voluntary and the beekeeper did not have to be present or assist with the sampling. The results can be considered as representative of the pests and pathogens present in the U.S.
Introduction
This 34 state USDA survey of honey bee pests and pathogens began in 2011 and will be completed in late summer 2012. Variability from 1) the climates when samples can be collected from active brood areas in northern states and 2) the time frame the states received

3
their respective agreements, has caused a delay in the completion of the survey. We have received 94% of all samples required and it is anticipated that remainder will arrive in August 2012. Funding was provided by the USDA Animal and Plant Health Inspection Service (APHIS) and the survey was conducted in collaboration with the USDA Agricultural Research Service (ARS), and the University of Maryland (UMD). A total of 392 colonies to date were sampled from 49 apiaries in California (11 from migratory beekeepers who were in that state for pollination contracts and 38 from beekeepers originating from there). 25 samples incorporating 5,600 colonies were sampled from the following states: Alabama, Arkansas, Colorado, Florida, Georgia, Hawaii, Illinois, Indiana, Iowa, Louisiana, Maryland, Michigan, Minnesota, Montana, Nebraska, New York, New Jersey, North Carolina, North Dakota, Pennsylvania, South Carolina, South Dakota, Tennessee, Texas, Utah, Virginia, West Virginia and Wisconsin. Additional samples were and are still being received from Delaware, Idaho, New Mexico, New Hampshire and Ohio.
Survey Description
Survey kits were distributed to the participating states’ Department of Agriculture offices in June 2011. This late date did not allow for some states to complete sampling in 2011 and they had to resume in the spring of 2012. Based on this experience, the 2012 survey kits were shipped to the states by late April and early May 2012. Apiary inspectors and agents conducted an aggregate sampling from previously identified commercial, migratory, and sideliner beekeepers with at least 8 colonies per apiary. In most cases apiaries consisted of at least 10 colonies. A single aggregate sample was collected from 8 randomly selected colonies per apiary per operation (APHIS US Honey Bee Survey Sampling Protocol). In each state, apiaries were chosen on a case by case basis with an attempt to give as close to an equal representation of the entire state as possible. Ideally, a state was sectioned into 4 quadrants with apiaries randomly chosen within a quadrant. When possible, ten queen producers were sampled. Of the remaining sampled apiaries, 1/2 were from migratory operations (move out of the state and return prior to sampling) and 1/2 were from stationary operations (only move within the state or do not move at all). Additional apiaries occurring near ports or other areas that could be considered high risk were also considered for sampling (APHIS US Honey Bee Survey Project Plan). The pollen samples were collected (APHIS US Honey Bee Survey Pollen Sampling Protocol) concurrently and from the same colonies in the apiary being sampled for the disease and pest survey.
Four distinct collection methods were used to sample each apiary. The first sample was a collection of live adult bees composed of ¼ cup of bees (~ 150 bees) that were shaken off brood frames from each of the 8 sampled colonies. The live bees were deposited in a live bee shipping box containing a water source and hard sugar candy (fondant). This box was shipped the same day to the USDA/ARS in Beltsville, MD where it was immediately frozen at -80C until molecular testing could be performed. The molecular tests were performed with quantitative-PCR techniques, outlined by Dr. Jay Evans at the USDA/ARS Bee Research Laboratory, to look for molecular evidence of known viruses and other pests (2006 and Honey Bee PCR
4
Diagnostics). We have incorporated a new, high-performance chemistry in our molecular analysis this year that provides greater sensitivity, faster analysis times, and is more cost effective. The molecular tests were designed to detect the presence of the following:
1. Acute Bee Paralysis Virus (ABPV) 2. Deformed Wing Virus (DWV) 3. Israeli Acute Paralysis Virus (IAPV) 4. Chronic Bee Paralysis Virus (CBPV) 5. Black Queen Cell Virus (BQCV) 6. Slow Bee Paralysis Virus (SBPV) 7. Nosema ceranae 8. Nosema apis
The second sample of bees, consisting of ¼ cup of bees from each of the 8 sampled colonies, originated from the same brood frames as the live bee sample. These bees were put into a bottle of alcohol for preservation. This alcohol sample was shipped to USDA/BRL for visual and microscopic analysis by University of Maryland technicians to quantify the following:
1. Nosema spp. spores 2. Varroa Mite loads 3. Apis cerana The third sample was taken from anything dislodged from ‘bumping’ sampled brood frames over a collection pan. This technique was developed by Dr. Jeff Pettis and Dr. Dennis vanEngelsdorp and funded by APHIS as a quick and cost effective way to detect for the Tropilaelaps mite. The sample, also preserved in alcohol, included any mites, beetles and other hive debris filtered from bumping the brood frames. This sample was shipped to USDA/ARS Beltsville, MD and analyzed for the presence of the Tropilaelaps mite. Finally, the fourth sample, taken only by those states participating in the Pilot pesticide/pollen survey, collected a minimum of 3 grams of dry pollen (not bee bread) from the same colonies, preferably in the same brood area, from the other three samples described above. These samples were placed in a tube, labeled and sent to USDA/ARS Bee Research Laboratory where they were refrigerated until the entire assortment of samples could be analyzed at USDA/AMS.
All participating beekeepers, as well as State Apiarist/Inspectors, received a single report for each sample taken. This report, revised after last year, contains considerably more information than previous reports. It is usually sent within 6 months of collection and details the analysis results for Varroa mite load, Nosema load, all six viruses and the species identification of Nosema (N. apis or N. ceranae) and notes the presence or absence of A. cerana and Tropilaelaps spp. It also includes the national prevalence for viruses at the date of the report as well as specific beekeeper percentile rankings of Varroa mite load, Nosema spore load

5
and viral loads for the 2 most common viruses, Deformed Wing Virus (DWV) and Black Queen Cell Virus (BQCV).
Using the U.S. Postal Service, live bee shipments were made to USDA/ARS and percent survivability was tracked for all live bee shipments. The results of this analysis, previously proven to be a robust and suitable alternative for shipping bees on dry ice by the Pilot and Limited Survey, continued to work well. In some states, a small number of live bee samples were degraded, such that no molecular data could be obtained for these samples. Additionally, some live bee samples were lost in shipment. The lost live bee samples occurred in one sample from Hawaii, one from Pennsylvania and two from Montana.
Results
Pest Survey:
The results of all analyses can be found in the Appendix. From the 778 alcohol samples analyzed for Nosema via microscopy, 442 (56.7%) has detectable spore loads. An examination of 95% CI surrounding the prevalence of Nosema infected apiaries suggest that prevalence was highest in 2009 (Figure 1); however, caution should be used when interpreting this data as the sampling frame changed between years. Of the samples in 2011 that tested positive for Nosema, 86 samples (19.5%) exceeded the threshold thought to cause damage (> 1 million spores per bee). Samples testing positive for Nosema infection had a mean Nosema spore load of 564,000 spores per bee, (Figure 2). Figures 3 and 4 illustrate Nosema prevalence and Nosema spore load from all 3 years of the survey on a monthly basis. Any month having less than 3 data points was not included in the monthly calculations. Figure 3 shows the classic seasonal decline in Nosema detection in the late summer and early fall in conjunction with a decrease in detectable spore load in those same months (Figure 4). Nosema levels typically appeared highest in late fall and early spring months and spring 2011 samples showed higher loads than last year. Data on treatments were not taken this year so there is no indication which, if any, of these colonies were treated for Nosema. We hope to include a short management survey, in conjunction with the Bee Informed Partnership, this year to capture this relevant and critical data.
Varroa mite prevalence for 2011 is similar to that observed in 2010 (92.4%) and 2009 (87.1%) and indicates that almost 91.8% of all 781 alcohol samples had at least one Varroa mite (Figure 5). While prevalence did not change over the tree years of survey, the overall mite load in infested apiaries has increased steadily since 2009 (Figure 6). Again, caution should be used when interpreting this data as the 2009 sampling time frame was not the same as in subsequent years. While the economic threshold for Varroa mites is seasonally and regionally specific, generally an average load of over 3 mites per 100 bees is of concern. Worryingly in 2011, 62.9% of the samples that tested positive for Varroa (450 out of 716) exceeded the lower threshold for possible damage to a colony from Varroa.

6
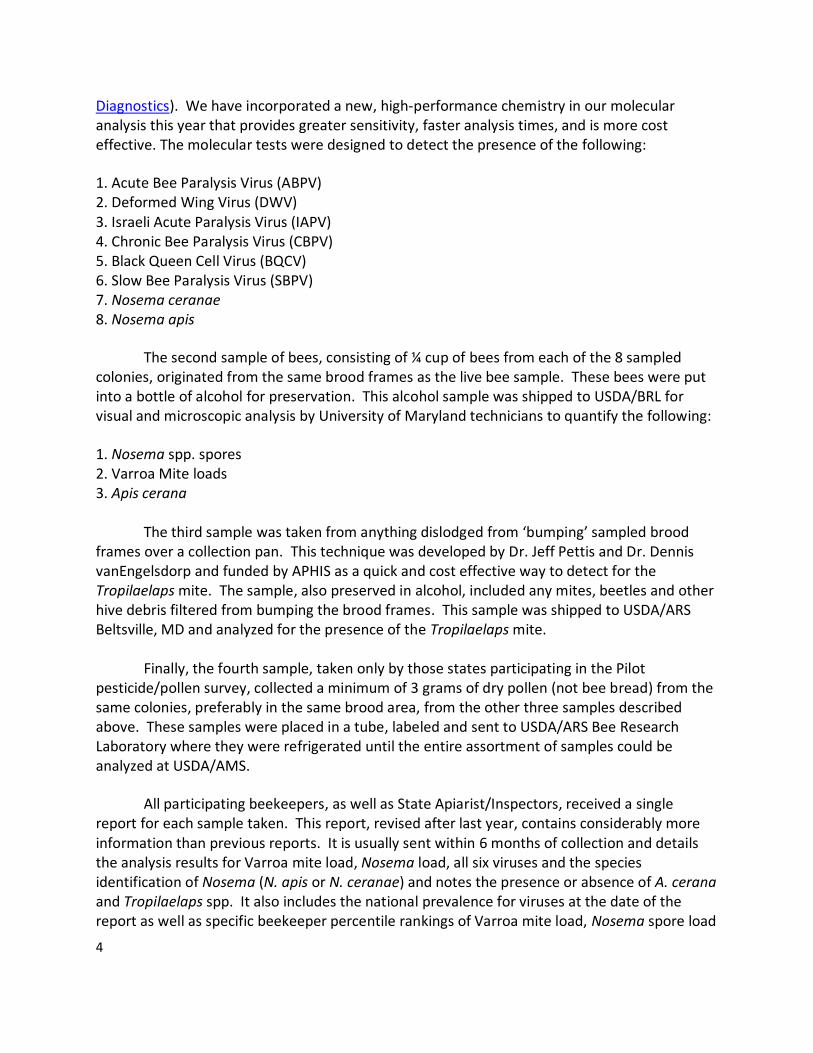
Figures 7 and 8 illustrate the dynamic nature of Varroa mite populations over the course of the year. Varroa mite levels were highest in the late summer and fall months and Figure 7 demonstrates 100% of the samples received in May 2012 had Varroa mites. Again, like Nosema, it is unknown whether the sampled apiaries treated for Varroa mites, but future surveys will attempt to gather that information.
Figures 9, 10, and 11 illustrate the viral prevalence profiles for the survey years 2009, 2010 and 2011 respectively. Four viruses were consistently tested for all 3 years and include Israeli Acute Paralysis Virus, Deformed Wing Virus, Acute Bee Paralysis Virus and Slow Bee Paralysis Virus (SBPV). The survey in 2009 reported the highest incidence of IAPV but 2010 saw the highest incidence of DWV and ABPV. In this survey year, DWV and BQCV, the two most ubiquitous viruses among honey bees, were detected in every state sampled.
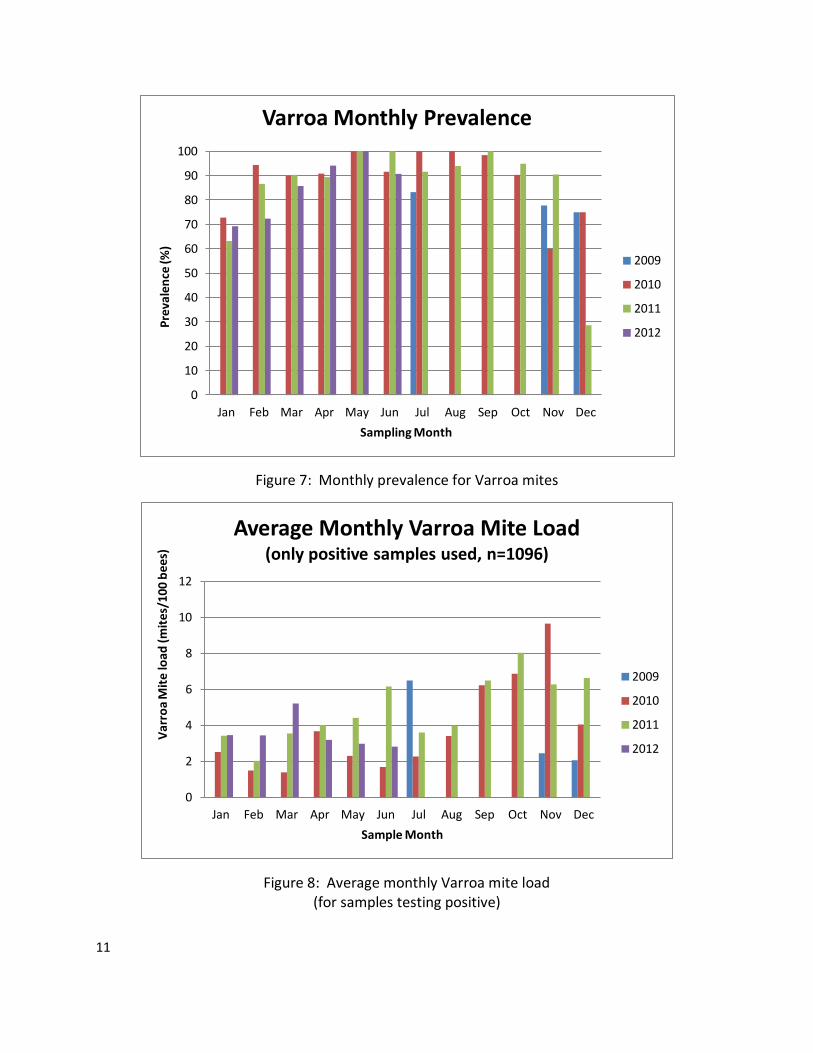
The monthly prevalence of four commonly found viruses (IAPV, DWV, ABPV and BQCV) is provided in Figures 12, 13, 14 and 15. IAPV (Figure 12) and ABPV (Figure 14) illustrate seasonality in these viruses. In contrast, DWV (Figure 13) and BQCV (Figure 15) exhibit a more constant presence with a slight peak for BQCV seen in the late spring/early summer months. No monthly prevalence graphs are provided for SBPV as this virus was not detected and the data set was very limited for CBPV. It is anticipated that 7 viruses will be tested for in 2012 and include ABPV, BQCV, CBPV, DWV, IAPV, SBPV, and Kashmir Bee Virus (KBV).
Finally, this study found no evidence of Tropilaelaps or Apis cerana. Visual analysis of samples collected in alcohol did not detect a presence of this exotic Apis species and A. mellifera sub-races.
The molecular techniques employed in this survey are based on analysis of the RNA extracted from each sample. Therefore, our molecular identification focuses on detection of actively reproducing Nosema (vegetative stage), not dormant (spore stage) Nosema. Subsequently, it is possible that the samples examined by microscopy had detectable levels of Nosema (spores) while the molecular analysis quantifies active infection. This accounts for the difference in the PCR and microscopic detection of Nosema in these samples (Figure 16).
It should also be noted that nine N. apis detections were made this year, representing 1.3% of the samples. This is the first year since survey inception that N. apis has been found. A newly designed, more sensitive primer was used this year to detect Nosema apis. This would explain the detections for N. apis this year and not in previous years. 49 of 669 samples (7.3%) tested positive for N. cerana, which still appears to have largely replaced N. apis in the European honey bee (Apis mellifera) after migrating from its original host, A. cerana.
Pesticide Survey:
A pilot survey of pesticides found in pollen sampled from hives was initiated this year to test the pollen sampling and shipping protocol. The pesticide survey included 11 states listed in

7
the summary and they collected the required pollen in addition to their concurrent colony sampling for live bees and alcohol samples. The most prevalent pesticides include Coumaphos and its metabolites (detected in 39.4% of the samples), Fluvalinate (detected in 38.4% of the samples), Thymol and 2, 4 Dimethylphenyl (a metabolite of Amitraz), both detected in 27.3% of the samples and Chlorpyrifos (detected in 20.2% of the samples). The full set of results, grouped by their classification as an insecticide, herbicide or fungicide, is given in Figure 17. The level of detection (LOD), or the minimum amount that can be reliably detected, the national prevalence (%) seen by this limited survey, the average level detected (parts per billion or ppb) and the range of detection (ppb) are provided for those samples that tested positive for that specific pesticide. If a pesticide was detected once, a single value is given for the range and it is marked with an asterisk. With the additional information of pollen collected concurrently with the live bee and Nosema and Varroa mite samples, it may be possible to correlate colony health to in hive pesticide residue and there are plans to do this with the 2012 survey. The 2012 state survey will include 10 samples from each of the 33 states.
Conclusions
The increased sample size this year allows for the expansion of our database of pests and pathogens and places the collected data into a temporal context. The 2011 National Survey was expanded to capture some states not previously sampled and the sampling season was lengthened with the inclusion of more southern states. This allowed us to greatly increase viral and pest data for the winter months as shown by the prevalence graphs for the more common viruses. Varroa mite loads were seen to increase over the 3 years of the survey and it is unknown what this cause may be but possible explanations include fewer beekeepers treating, mites becoming resistant to available treatments or an improved snapshot of the actual mite infestation across the country.
Results that will be monitored this year include Varroa mite loads to determine if the increasing trend continues and what, if any treatments, are being applied to the sampled colonies. Additional data will be collected on BQCV as not much is known about this very common and established virus. Observing the dynamics and possible seasonality between N. apis and N. ceranae, in conjunction with treatment data we hope to collect will also be core to the 2012 survey. By gathering yearly, sequential samples from a growing number of states, we may be able to see trends and patterns that relate to colony health. The survey does provide strong evidence that Tropilaelaps, Slow Paralysis Virus and Apis cerana are not present in the U.S.

8
Appendix
Figure 1: Nosema spp. prevalence over 3 years of survey (95% Confidence Intervals shown)
Figure 2: Nosema spp. spore load over 3 years of survey (95% Confidence Intervals shown)
0% 10% 20% 30% 40% 50% 60% 70% 80% 90%
100%
2009 2010 2011
Pre
vale
nce
(%)
Survey Year
Nosema spp. Prevalence (microscopy detection only)
0.00
0.20
0.40
0.60
0.80
1.00
1.20
2009 2010 2011
Ave
rage
no
sem
a sp
ore
load
(m
illio
ns
spo
res/
bee
)
Survey Year
Average Nosema spore load (only positive samples used, n=679)

9
Figure 3: Monthly prevalence for Nosma spp. (95% Confidence Intervals shown)
Figure 4: Average Monthly Nosema spore load (for samples testing positive by microscopic spore count)
(95% Confidence Intervals shown)
0
10
20
30
40
50
60
70
80
90
100
Jan Feb Mar Apr May Jun Jul Aug Sep Oct Nov Dec
Pre
vale
nce
(%
)
Sampling Month
Nosema Monthly Prevalence
2009
2010
2011
2012
0
0.5
1
1.5
2
2.5
3
Jan Feb Mar Apr May Jun Jul Aug Sep Oct Nov Dec
Ave
rage
No
sem
a Sp
ore
load
(
mill
ion
s sp
ore
s/b
ee)
Sample Month
Average Monthly Nosema Spore Load (only positive samples used, n=679)
2009
2010
2011
2012

10
Figure 5: Varroa mite prevalence over 3 years of survey (95% Confidence Intervals shown)
Figure 6: Average Varroa mite load over 3 years of survey (for samples testing positive)
(95% Confidence Intervals shown)
0%
10%
20%
30%
40%
50%
60%
70%
80%
90%
100%
2009 2010 2011
Pre
vale
nce
(%)
Survey Year
Varroa Mite Prevalence
0.00
1.00
2.00
3.00
4.00
5.00
6.00
7.00
2009 2010 2011
Ave
rage
Var
roa
Mit
e lo
ad (
mit
es/1
00 b
ees)
Survey Year
Average Varroa Mite Load (only positive samples used, n=1096)
11
Figure 7: Monthly prevalence for Varroa mites
Figure 8: Average monthly Varroa mite load (for samples testing positive)
0
10
20
30
40
50
60
70
80
90
100
Jan Feb Mar Apr May Jun Jul Aug Sep Oct Nov Dec
Pre
vale
nce
(%)
Sampling Month
Varroa Monthly Prevalence
2009
2010
2011
2012
0
2
4
6
8
10
12
Jan Feb Mar Apr May Jun Jul Aug Sep Oct Nov Dec
Var
roa
Mit
e lo
ad (
mit
es/1
00 b
ees)
Sample Month
Average Monthly Varroa Mite Load (only positive samples used, n=1096)
2009
2010
2011
2012

12
Figure 9: Virus prevalence for 2009 Pilot Survey (95% Confidence Intervals shown)
Figure 10: Virus prevalence for 2010 Limited National Survey (95% Confidence Intervals shown)
0%
10%
20%
30%
40%
50%
60%
70%
80%
90%
100%
IAPV DWV ABPV SBPV KBV CBPV
Pre
vale
nce
(%)
Virus
2009 Survey Virus Prevalence (n=87)
0%
10%
20%
30%
40%
50%
60%
70%
80%
90%
100%
IAPV DWV ABPV SBPV KBV
Pre
vale
nce
(%)
Virus
2010 Survey Virus Prevalence (n=336)

13
Figure 11: Virus prevalence for 2011 National Survey (95% Confidence Intervals shown)
Figure 12: Israeli Acute Paralysis Virus prevalence over 3 years of survey
0%
10%
20%
30%
40%
50%
60%
70%
80%
90%
100%
IAPV DWV ABPV SBPV CBPV BQCV
Pre
vale
nce
(%)
Virus
2011 Survey Virus Prevalence (n=768)
0
10
20
30
40
50
60
70
80
90
100
Jan Feb Mar Apr May Jun Jul Aug Sep Oct Nov Dec
Pre
vale
nce
(%)
Sample Month
Israeli Acute Paralysis Virus Monthly Prevalence
(n=1082)
2009
2010
2011
2012

14
Figure 13: Deformed Wing Virus prevalence over 3 years of survey
Figure 14: Acute Bee Paralysis Virus prevalence over 3 years of survey
0
10
20
30
40
50
60
70
80
90
100
Jan Feb Mar Apr May Jun Jul Aug Sep Oct Nov Dec
Pre
vale
nce
(%
)
Sample Month
Deformed Wing Virus Monthly Prevalence
(n=1205)
2009
2010
2011
2012
0
10
20
30
40
50
60
70
80
90
100
Jan Feb Mar Apr May Jun Jul Aug Sep Oct Nov Dec
Pre
vale
nce
(%)
Sample Month
Acute Bee Paralysis Virus Monthly Prevalence
(n=1087)
2009
2010
2011
2012
15
Figure 15: Black Queen Cell Virus prevalence, 2011/2012 only
Figure 16: Nosema prevalence by methodology
0 10 20 30 40 50 60 70 80 90
100
Jan Feb Mar Apr May Jun Jul Aug Sep Oct Nov Dec
Pre
vale
nce
(%)
Sample Month
Black Queen Cell Virus Monthly Prevalence
(n=699)
2011
2012
0
0.1
0.2
0.3
0.4
0.5
0.6
Nosema spp. (microscope) N. apis (PCR) N. ceranae (PCR)
Pre
vale
nce
(%)
Nosema detection by method
Nosema Prevalence by Methodology 2011 Survey

16
Pesticide LOD
(ppb)
Prevalence n=99 (%)
Average detection if positive for target (ppb)
Range (ppb) Description
Azoxystrobin 2 5.1 13.7 6.4-30.8 Fungicide
Carbendazim (MBC) 5 5.1 105.3 8.1-233 Fungicide
Cyprodinil 4 3.0 19.2 16-22.4 Fungicide
Fenbuconazole 2 2.0 205.0 74.9 - 335 Fungicide
Metalaxyl 2 1.0 37.9 37.9* Fungicide
Pyraclostrobin 15 1.0 56.5 56.5* Fungicide
THPI 50 6.1 2360.2 37.6 - 7060 Fungicide
Atrazine 6 1.0 51.3 51.3* Herbicide
Oxyfluorfen 1 2.0 3.1 1.7-4.4 Herbicide
Pendimethalin 6 5.1 23.2 5.1-43.1 Herbicide
Trifluralin 1 2.0 1.3 1-1.5 Herbicide
2,4 Dimethylphenyl formamide (DMPF)
4 27.3 100.6 10-573 Insecticide
Aldicarb sulfone 3 1.0 1.0 14.0* Insecticide
Aldicarb sulfoxide 20 1.0 35.9 35.9* Insecticide
Bifenthrin 1 8.1 4.2 1.2-11.4 Insecticide
Chlorpyrifos 1 20.2 6.5 1.1-21.4 Insecticide
Coumaphos 1 34.3 87.5 2-1110 Insecticide
Coumaphos oxon 1 5.1 14.4 6.2-23.5 Insecticide
Cyfluthrin 4 1.0 3.9 3.9* Insecticide
Cyhalothrin total 1 7.1 9.5 2.2-36.2 Insecticide
Cypermethrin 4 1.0 9.3 9.3* Insecticide
Dieldrin 10 1.0 12.4 12.4* Insecticide
Diflubenzuron 20 1.0 84.3 84.3* Insecticide
Endosulfan I 2 5.1 38.7 2.2 - 124 Insecticide
Endosulfan II 2 3.0 16.1 2.1-39.5 Insecticide
Endosulfan sulfate 2 3.0 19.6 1.6 - 50.4 Insecticide
Esfenvalerate 2 4.0 5.6 3.7-7.3 Insecticide
Fenpropathrin 1 6.1 43.2 20.7-93.6 Insecticide
Fenpyroximate 5 11.1 28.4 5.5 - 114 Insecticide
Fluvalinate 1 38.4 39.9 2.2-182 Insecticide
Imidacloprid 1 9.1 30.8 3.5-216 Insecticide
Permethrin total 10 1.0 20.0 20.0* Insecticide
Phosmet 10 1.0 785.0 785.0* Insecticide
Thiacloprid 1 2.0 187.6 49.1-326 Insecticide
Thymol 50 27.3 2271.8 37.5 - 39700 Insecticide
Figure 17: Pesticide analysis for 2011 survey (99 samples) (*denotes single detection only)

17
References
Evans J.D. (2006). Beepath: An ordered quantitative-PCR array for exploring honey bee immunity and disease, Journal of Invertebrate Pathology, 93 (2), pp. 135-139.