2011-12 - Swan River TrustI have pleasure in submitting the 23rd Annual Report on the operations of...
96
GOVERNMENT OF WESTERN AUSTRALIA 2011-12 Swan River Trust Annual Report Caring for the Swan Canning Riverpark
Transcript of 2011-12 - Swan River TrustI have pleasure in submitting the 23rd Annual Report on the operations of...

GOVERNMENT OFWESTERN AUSTRALIA
2011-12 Swan River TrustAnnual Report
Caring for the Swan Canning Riverpark

Welcome to the Swan River TrustWandju Wandju Nitja Derbal Yerrigan Beelier Mart Level 1, 20 Terrace RoadEast Perth WA 6004PO Box 6829East Perth WA 6892Phone: (08) 9278 0900Fax: (08) 9325 7149Email: [email protected]: www.swanrivertrust.wa.gov.auAfter hours 0419 192 845
Follow us on:
The River Guardians photography competition attracted hundreds of entries from local photographers keen to share what they love about the Swan Canning Riverpark. A selection of images from the 2010 and 2011 competitions are included in this annual report. Photo this page of children playing in the Swan Canning Riverpark courtesy of Patria Laksamana.
tBack Contents Forwardu

Swan River Trust Annual Report 2011-12 iii
Letter to the Minister for Environment
To the Hon Bill Marmion BE MBA MLA
Minister for Environment; Water
I have pleasure in submitting the 23rd Annual Report on the operations of the Swan River Trust for the period 1 July 2011 to 30 June 2012, in accordance with the Swan and Canning Rivers Management Act 2006 and Financial Management Act 2006.
Professor Michael PooleChairperson
31 August September 2012
Letter to the Minister for Environment tBack Contents Forwardu

Swan River Trust Annual Report 2011-12 iv
Chairperson’s report
On behalf of the Board of the Swan River Trust I am pleased to present this annual report as a concise insight into the key programs and projects which the Trust undertakes to help manage and protect the Swan Canning Riverpark. The Trust is a small agency managing a broad range of programs so coordinating our efforts in partnership with other agencies and community groups is paramount as we go forward. This underpins our ongoing pursuit of the River Protection Strategy as the shared blue-print for the long term management of the rivers.
The Trust has spent another busy year refining the draft Strategy, which was released for public comment at the end of 2011. At the time of reporting, the stakeholder review process was nearing completion. The engagement and commitment of the River Protection Strategy Advisory Committee and other partners is greatly appreciated.
As the draft Strategy illustrates, the Swan and Canning rivers are much more than a biological system which we maintain for ecological integrity. The Riverpark is also a social asset valued and used by the West Australian community and visitors. Increasingly, river managers worldwide are recognising these cultural perspectives and exploring ways to ensure we take account of both the social and ecological values that communities ascribe to waterways.
I believe the Trust has led the way in its work to develop an integrated monitoring, evaluation and reporting framework that includes measuring social wellbeing, community benefit and amenity targets. In this respect, a key Trust project is to develop a Useability Index for the Riverpark. The index is a leading edge tool to help provide objective assessment of the level of community benefit and amenity being afforded by the parks and reserves of the Riverpark. The Useability Index, supported by our annual visitor satisfaction survey, will provide valuable knowledge to the Trust, land owners and local councils regarding how well these parks and reserves deliver their intended use.
The Trust is constantly striving to make the rivers places people can enjoy and the Swan and Canning Riverpark Trails project best exemplifies this notion. The Trust is determinedly working with riverfront local government councils, the National Trust and South West Aboriginal Land and Sea Council to complete a living jigsaw that may ultimately set a world precedent in public access around a capital city river. The draft Swan Canning Riverpark Trails Masterplan was recently completed for stakeholder feedback. This year was also an exciting time for statutory planning in the Trust, where we have played an important environmental and planning role in some of the largest riverfront development projects proposed for Perth in over 100 years.
The past year also brought two events which show the vulnerability of the river to both chronic and acute pressures. The upper and middle Swan River suffered a series of fish kill events, in February and June. The events arose from a combination of low oxygen levels and the bloom and collapse of a particular algae species, Karlodinium veneficum. The events demonstrated the value of the Trust’s oxygenation program, which has received a high degree of attention in both the Swan and Canning rivers.
Chairperson’s report tBack Contents Forwardu

Swan River Trust Annual Report 2011-12 v
The Trust now has two oxygenation plants operating in each of the two rivers. During this year’s fish kill events, it was apparent that the plants at Caversham and Guildford provided critical areas of relief for wildlife from what would otherwise have been extremely low oxygen levels. The Trust has been fortunate to receive further State Government funding to increase the program’s capacity in the Canning River over the next two years.
That said, it is important to highlight that oxygenation in the rivers is the ‘last line of defence’ and must be complemented by the Trust’s broad suite of river management actions from catchment to coast. Examples of these actions in catchment management, working with the rural sector, suburban gardeners, local councils, drainage managers, foreshore managers, developers, schools, user groups and research bodies are presented in the pages that follow.
I would like to note one particular initiative which has entailed extensive consultation with the community. The draft Aquatic Use Management Framework, developed in partnership with the Department of Transport, was a major achievement for the Trust and provides a ‘blueprint’ for Perth’s recreational user groups who share our rivers.
As I noted above, the task of managing a complex system such as the Swan Canning Riverpark cannot be realised without support from many partners.
I would like to thank our colleagues in federal, state and local governments, in the tertiary institutions, industry and the community for their co-operation over the past year. The support received through community-based natural resource management and volunteer river care groups is invaluable to realise vital on-ground planting and restoration projects.
I take this opportunity to acknowledge the contributions of outgoing Board chairman Jim Freemantle and members Jan Star and Tony Evans who left the Trust during the year. Jim served as a member and then chairman of the Trust through a highly significant period of our agency’s growth and change and we owe him a debt of gratitude for his work.
We were very pleased to welcome new members Jason Berry, Lindsay Baxter and Barbara Watroba to the Trust Board in this past year. I also acknowledge our committed and professional staff who have delivered another year of hard work on behalf of our magnificent rivers while earning a final three berth in the coveted 2012 Australian Riverprize competition to be judged in October 2012.
Professor Michael PooleChairpersonSwan River Trust
Chairperson’s report tBack Contents Forwardu

Swan River Trust Annual Report 2011-12 vi
RiverView: 2011-12 by numbers$505,000 distributed to Natural Resource Management groups through sub-regional support and Swan River Trust and Alcoa Landcare Program funding - page 10
22 resident dolphins living in the Riverpark monitored by 405 trained Dolphin Watch volunteers - page 16
$3.2 million secured for Ellen Brook end-of-catchment nutrient stripping wetland treatment system - page 13
115 actions committed by the Trust and its partners to implement the River Protection Strategy - page 26
8 stakeholder forums attended by 143 people held around the Riverpark to develop the Swan Canning Riverpark Aquatic Use Management Framework - page 27
1,432 attendees at Trust-funded Great Gardens workshops - page 15
1,480 River Guardians members - page 16
6,033 students from 130 schools engaged in River Guardians schools education project - page 17
332 development applications assessed by the Trust’s Statutory Planning service - page 18
11 tonnes of general refuse removed from the Riverpark - page 23
$912,761 in Riverbank Grants funding distributed - page 24
tBack Contents Forwardu

Swan River Trust Annual Report 2011-12 1
Contents
Letter to the Minister for Environment .............................................................. iiiChairperson’s report ........................................................................................... ivRiverView: 2011-12 by numbers ......................................................................... viAgency overview .................................................................................................. 2
About the Swan River Trust ...............................................................................................2Management framework .....................................................................................................4Operational structure .........................................................................................................5Swan River Trust Board .....................................................................................................6
Significant issues and trends.............................................................................. 8Agency performance ............................................................................................ 9
Service 1: Environmental management ............................................................................9Service 2: Communication of environmental information ............................................15Service 3: Statutory assessment of development .........................................................18Service 4: Riverpark management ..................................................................................20Servicing the agency: Strategic programs .....................................................................26Servicing the agency: Business management ..............................................................28
Disclosures and legal compliance .................................................................... 33Independent auditor’s report ...........................................................................................33Board’s endorsement of key performance indicators ...................................................36Summary of key performance indicators .......................................................................37Key effectiveness performance indicators ....................................................................38Key efficiency performance indicators ...........................................................................47
Financial statements .......................................................................................... 48
tBack Forwardu
Swan River Trust Annual Report 2011-12 2
Agency overview
About the Swan River Trust
Our purposeTo work with others to protect the Swan Canning Riverpark and enhance its ecological and community benefits and amenity.
Our vision Our vision is a healthy river for all, forever, which is resilient to climate change, population and development pressures and is enjoyed, shared and nurtured.
Desired outcomesThe ecological health of the Swan Canning river system is protected and enhanced.The long-term community benefit of the Swan Canning river system is protected and enhanced.
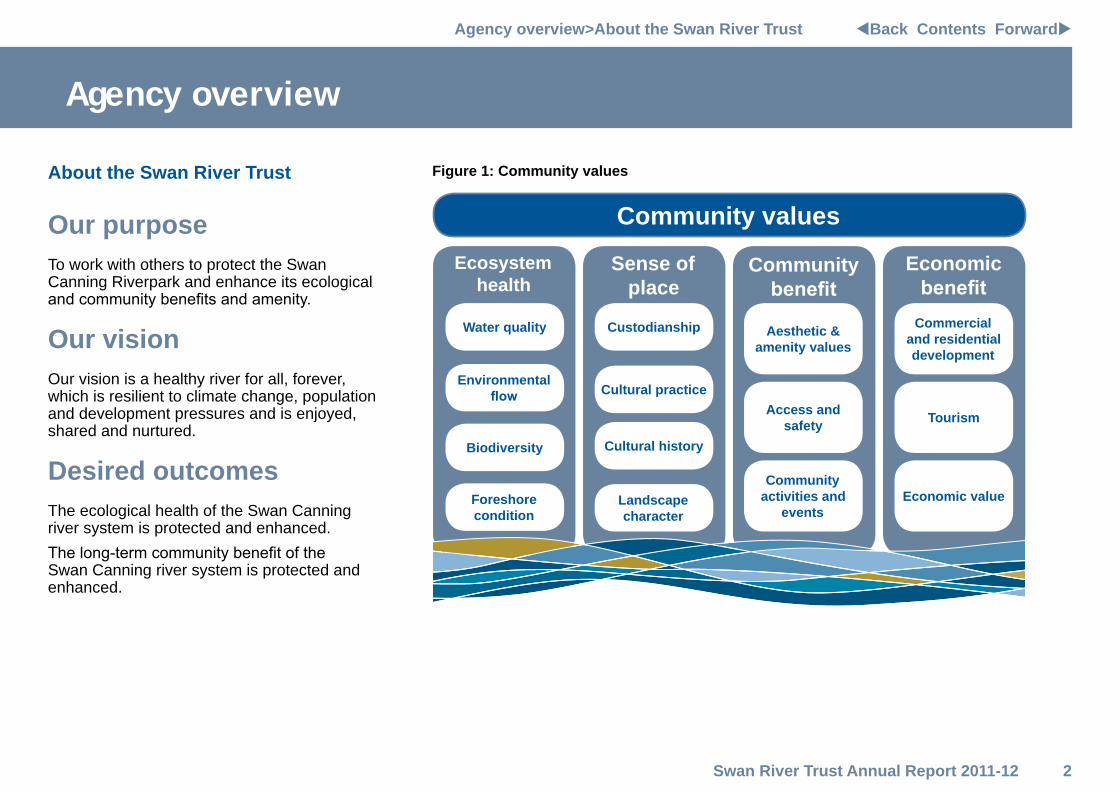
Figure 1: Community values
Community values
Sense of place
Custodianship
Cultural history
Cultural practice
Landscape character
Community benefit
Economic benefit
Commercial and residential development
Tourism
Economic value
Aesthetic & amenity values
Access and safety
Community activities and
events
Ecosystem health
Water quality
Environmental flow
Biodiversity
Foreshore condition
Agency overview>About the Swan River Trust tBack Contents Forwardu

Swan River Trust Annual Report 2011-12 3
How we functionThe Trust operates in accordance with the State Government goals. Its work delivers on the Social and Environmental Responsibility goal – ensuring that economic activity is managed in a socially and environmentally responsible manner for the long-term benefit of the state.The Trust was established in 1989 to protect, manage and provide appropriate planning for the Swan and Canning rivers and associated land. It operates under the Swan and Canning Rivers Management Act 2006 (the Act) and its functions are to:
• protect and enhance the ecological and community benefits and amenity of the Development Control Area (DCA) and to control activities and development in that area;
• protect and enhance the ecological and community benefits and amenity of the Riverpark;
• carry out works and provide facilities for the purposes of protecting and enhancing the ecological and community benefits and amenity of the Riverpark, establish targets for the ecological and community benefits and amenity of the Riverpark, and mechanisms for evaluating the achievement of those targets;
• coordinate and promote the development and implementation of strategic documents defined by the Act;
• coordinate and promote the activities of other bodies that have functions in relation to the catchment area, insofar as those functions may affect the Riverpark, including the implementation of any strategic documents applicable to the catchment area;
• monitor and report to the Minister on the state of the DCA and development on and adjoining the DCA;
• provide advice and assistance to planning authorities so that in relation to the Riverpark, proper provision is made in planning schemes for – the reservation of land for protection and future acquisition; river foreshores; the protection and public use of land and waters; and the protection of wildlife habitat;
• provide advice to the WAPC on state planning policies and planning scheme provisions relating to any matter within its functions, and publish other statements of policy relating to any matter within its functions;
• provide advice and promote public education on any matter within its functions;
• perform such functions as are delegated to it under any other written law;• otherwise undertake the administration and enforcement of the Act; and• perform any other functions vested in it by the Act or any other written law.
Agency overview>About the Swan River Trust tBack Contents Forwardu
Protecting and enhancing the community benefits and amenity of the Riverpark is a key function of the Trust.

Swan River Trust Annual Report 2011-12 4
Management framework
Business Plan2012-13
WaterEnvironmentHealthLocal GovernmentHeritageTransportRecreationPlanningTourismFisheriesAboriginal CommunityAgricultureEnergyEmergencyMiningTreasuryCatchment NGOsBusiness CommunityBroader Community
PAR
TNE
RS
PRO
GR
AM
DEL
IVER
y Environmental ManagementRiverpark ManagementStatutory AssessmentsCommunity EngagementStrategic ProgramsAgency Management
Swan River TrustStrategic Plan 2010-15
Swan and Canning Rivers Management Act 2006Values/targets
River Protection Strategy
Agency overview>Management framework tBack Contents Forwardu
Figure 2: Management framework

Swan River Trust Annual Report 2011-12 5
Minister for Environment; Water Hon Bill Marmion BE MBA MLA
Swan River Trust Board
General Manager Rod Hughes
Strategic ProgramsRoxane Shadbolt
Legislation and Policy
Statutory PlanningPaul Stephens
Land Use Planning
River System ManagementMark Cugley
Riverpark ManagementChris Mather
Riverpark Operations
Communications Mark Thornley
Business ManagementKaren Rogers
Administration
Community Engagement
Healthy Rivers Program
Coastal Catchments Initiative Riverbank Corporate and Media
Relations Business ServicesStrategic Planning Statutory Assessments
Executive Support
Operational structureExecutive management teamThe daily functions of the Trust are overseen by an executive management team, which is comprised of the General Manager and the branch managers.
Figure 3: Swan River Trust operational structure
Agency overview>Operational structure tBack Contents Forwardu

Swan River Trust Annual Report 2011-12 6
Swan River Trust Board
Prof Michael Poole, ChairpersonProf Poole holds a Bachelor of Science degree in agriculture from the University of Western Australia and is a Fellow of both the Academy of Technology Sciences and Engineering, and the Australian Institute of Agricultural Science and Technology. He has enjoyed a distinguished career in agriculture and environment. Prof Poole joined the Trust Board in May 2008, served as Deputy Chair from 20 June 2011 and was appointed as Chairperson in February 2012.
Mr Jim Freemantle, Chairperson (until February 2012)Mr Freemantle holds a Bachelor of Economics and Master of Administration from Monash University. He is a Fellow of the Australian Institute of Company Directors and a Senior Fellow of the Financial Services Institute of Australia. He previously held senior positions in banking and corporate consulting. Mr Freemantle retired in February 2012.
Mr Jason Berry, Deputy ChairpersonMr Berry is a partner in KPMG’s Private Enterprise Division, and oversees both the Migration Services and the Self Managed Superannuation practices in Western Australia. Jason has been a Partner for 11 years in both the Sydney and Perth offices of KPMG and is a Registered Company Auditor, Migration Agent and Tax Agent. During his professional career with KPMG, Jason has provided
a range of services to a substantial number of national and international clients. He joined the Trust Board in September 2011 and was appointed as Deputy Chair from February 2012.
Cr Dudley MaierCr Maier (City of Vincent) is the Western Australian Local Government Association nominee to the Board. He holds a Bachelor of Science degree from the Australian National University and has served as a committee member and community representative on a number of bodies including the Water Corporation Customer Advisory Council and Claise Brook Catchment Group. Cr Maier was appointed to the Trust Board in September 2007 and was reappointed for a term of three years from June 2011.
Ms Vanessa DaviesMs Davies has traditional links to the Wongai and Noongar people in Western Australia. She has comprehensive executive management experience in government relations, justice, employment and education, health, community and indigenous relations. In 2000, Ms Davies completed a postgraduate Masters Degree in Management and Leadership at Curtin University. Ms Davies was appointed to the Trust Board in December 2009.
Agency overview>Swan River Trust Board tBack Contents Forwardu
The Trust Board has eight members who meet monthly. The Board is appointed by the Minister for Environment; Water in accordance with the Act and brings together expertise in conservation, natural resource management, recreation, tourism, planning, development and matters of interest to rural and Noongar communities.

Swan River Trust Annual Report 2011-12 7
Mr Hamish BeckMr Beck is Managing Director of Beck Advisory, a property development advisory and asset management business. He is a board member of the Art Gallery of Western Australia, Chairman of the Art Gallery Foundation and a board member of the Architects Board of Western Australia. Mr Beck was appointed to the Trust Board in June 2011.
Ms Shelley Taylor-SmithMs Taylor-Smith is director and founder of Champion Mindset Consulting. She holds a Bachelor of Science in Physical Education from the University of Arkansas, USA and works as a motivational keynote speaker, performance coach, workshop facilitator and author. Following a distinguished international sporting career in marathon swimming (achieving seven-times Women’s World Marathon Swimming Champion) Shelley serves as a
committee member and advisor for a number of bodies including Federation Internationale de Natation, Swimming Australia Limited and Swimming WA. She is patron of the Esther Foundation, a women’s community and leadership program in Perth. She was appointed to the Trust Board in June 2011.
Ms Lindsay BaxterMs Baxter is Planning Director of Metropolitan South East in the Perth and Peel Planning Division of the Department of Planning. She holds a Bachelor of Arts (Urban and Regional Studies) from the Western Australian Institute of Technology and a Graduate Diploma in Arts (Recreation Studies) from Edith Cowan University. Ms Baxter was appointed to the Trust Board in January 2012.
Ms Barbara WatrobaMs Watroba is a Senior Associate in the Litigation and Regulatory team, DLA Piper Australia (formerly Phillips Fox). She has a LLB Honours degree (Macquarie University), MA Women’s Studies (Deakin University) and Bachelor of Environmental Design (UWA). Ms Watroba was appointed to the Trust Board in February 2012.
Ms Jan Star AM (until September 2011)Ms Star was a councillor with the Serpentine Jarrahdale Shire for 23 years (four years as President). She has worked in the areas of sustainability, water (drainage and law reform), climate change, biodiversity, land-use planning, environment, sustainable agriculture and regional development at local, state and national levels. She was appointed to the Trust Board in June 2008 and retired from the Board in September 2011.
Mr Tony Evans (until October 2011)Mr Evans is the former General Manager and Secretary of the Western Australian Planning Commission. He is a qualified accountant with a Bachelor of Business and Diploma in Education, and has extensive commercial and corporate governance experience in the property, resources, education and not-for-profit sectors. Mr Evans was appointed to the Trust Board in November 2009 and retired from the Board in October 2011.
Agency overview>Swan River Trust Board tBack Contents Forwardu

Swan River Trust Annual Report 2011-12 8
Significant issues and trends
Challenges• Population growth causing increased demand for riverside residential
and commercial development, increased waste and use of the river for competing recreational activities.
• Improving community understanding of problems facing the river and their responsibility in delivering solutions.
• The Swan River drains the large rural Avon Catchment contributing significantly to sedimentation, acidification and nutrient input.
• The Swan and Canning rivers also drain urban land with increasing residential and industrial use contributing to nutrient input, low oxygen levels and non-nutrient contamination.
• Understanding and protecting social and cultural significance of the Riverpark.
• The effects of climate change, including reduced rainfall, storm surges and stream flow and increased marine intrusion, increases the rivers’ vulnerability.
• Shoreline erosion, vegetation loss and ageing river walls continue to put additional pressure on the Riverpark’s ecological and community values.
Management approachThe Trust management approach to meet these challenges is to:
• provide a whole of system, intergenerational perspective to policy, planning and management;
• take an adaptive, risk-based approach to prioritise work programs;• adapt our strategies to meet emerging challenges and changing priorities;• base our management on sound science;• influence others to take up their responsibilities;• collaborate with others to increase return on investment;• monitor, evaluate and communicate our successes and failures;• use community expertise in problem solving; and• demonstrate innovative strategies.
Significant issues and trends tBack Contents Forwardu
The Swan Canning Riverpark provides a stunning backdrop to Perth. It also offers a unique recreational setting for residents and visitors and a vital habitat for native wildlife. Extremely low rainfall this year has focused pressures on the Swan Canning river system. This has reinforced the importance of the Trust’s role to manage and deliver strategic long term responses.

Swan River Trust Annual Report 2011-12 9
Agency performance
Service 1 Environmental managementThe environmental management services are delivered by the River System Management Branch to improve our understanding of the rivers’ function and health to inform management.
Healthy Rivers ProgramThe Healthy Rivers Action Plan (HRAP) was delivered for the fourth year utilising $1.195 million of the $3 million in funding provided by the Burswood Park Board for Trust management projects. A three-year review of the HRAP was conducted to clarify progress in achieving the responses in the six key action areas. The process identified that a number of responses had been achieved and the majority were progressing well towards completion. The third community report was released in November 2011.
Swan Canning Water Quality Improvement Plan (SCWQIP)SCWQIP implementation is being funded by the State Government through State NRM priority funding of $3.29 million and the Australian Government’s Caring for our Country Program funding of $2.5 million. Most of the funding will be provided to partner organisations to carry out priority activities. A Steering Committee, chaired by the Trust and comprising representatives from the Departments of Water, Environment and Conservation, Planning and Agriculture and Food WA, Water Corporation, Western Australian Local Government Association and Perth Region NRM has been established to oversee the plan’s implementation.
A trial to determine the effectiveness of several soil amendment products at reducing phosphorus leaching on sandy soils is underway. Each product will be trialled at different application rates and testing will be done on soil and water chemistry, plant productivity and radiology. The trial is located in Ellen Brook and will be run in partnership with Department of Agriculture and Food WA, ChemCentre, Department of Water and others. The project started in July 2011 and is expected to be completed in December 2012.
The Trust in partnership with Murdoch University is measuring the effectiveness of riparian best management practices (BMPs) in stopping nutrients entering waterways. The investigation will examine the effectiveness of fencing and riparian vegetation on sandy and duplex soils in the Ellen Brook catchment. This project is scheduled for completion in December 2012.
Details of other SCWQIP projects are provided in the following program updates.
Non-Nutrient Contaminant ProgramFollowing the completion of a broad three-year baseline study on non-nutrient contaminants in the Swan-Canning Estuary, the second phase of the Non-Nutrient Contaminant Program (NNCP) was initiated in 2009-10 and focused on areas of the Swan and Canning rivers that were considered a priority for further investigation. The toxicity of sediments on a range of estuarine organisms collected from two priority areas, Claisebrook and Bull Creek, was examined by the Department of Water (DOW) on behalf of the Trust. All reports from both Phase I and II of the NNCP are now publicly available online at www.swanrivertrust.wa.gov.au.
Phase III of the NNCP started in 2010-11 and continued throughout 2011-12. Five further studies are being conducted by DOW on behalf of the Trust which examine a broad range of non-nutrient contaminant issues, including further investigation in the Swan River adjacent to the site of the former East Perth Gasworks, investigations of organic contaminants throughout the Swan-Canning Estuary, investigations of the sediments and surface water adjacent to a disused waste disposal site on the Canning River and investigations of contaminants in the drainage networks discharging to both Claisebrook Cove and the Kent Street Weir pool.
The Drain Stencilling program, introduced in 2010-11 as part of the NNCP, is continuing to educate the community of the potential impacts of putting contaminants down local stormwater drains. Ways to improve and expand the program over coming years were examined in 2011-12.
Agency performance>Environmental management tBack Contents Forwardu

Swan River Trust Annual Report 2011-12 10
Figure 4: Swan Canning Catchment sub-regional support and Swan River Trust and Alcoa Landcare Program (SALP) funding
Helena
River
Swan
Riv
er
Canning
River
Avon River
EllenBrook
INDIAN
OCEAN
ARMADALE
PERTH
FREMANTLE
MUNDARING
MUCHEA
GINGIN
TOODYAY
Job Ref: GE05 SRT_AnnualReport_2009
NORTHSub-regional Support $64,222
SALP $11,436
TOTAL $75,658
NORTHSub-regional support $95,000
SALP $53,680
TOTAL $148,680
NORTH EASTSub-regional Support $90,000
SALP $48,104
TOTAL $138,104
NORTH EASTSub-regional support $110,000
SALP $79,039
TOTAL $189,039
SOUTHSub-regional Support $180,000
SALP $204,352
TOTAL $384,352
SOUTHSub-regional support $305,000
SALP $151,433
TOTAL $456,433
EASTSub-regional Support $90,000
SALP $214,407
TOTAL $304,407
EASTSub-regional support $95,000
SALP $55,848
TOTAL $150,848
Healthy Catchments ProgramThe program provides support to sub-regional natural resource management (NRM) groups in the Swan Region to coordinate community projects that reduce the amount of nutrients entering the Swan Canning river system. This year $505,000 was provided to sub-regional NRM groups.
Two of the state NRM funded Southern River living stream projects in the Southern River Catchment were completed. On Williams Road Main Drain an area of 2,830 m2 has been reconstructed to capture sediment and nutrients while 4,850 m2 was revegetated with 8,560 plants. The state NRM component of the Riverside Lane project enabled 15,000 m2
to be reconstructed. A number of schools and community groups assisted in completing these projects, providing almost 500 hours of volunteer time.
The Trust working with the South East Centre for Urban Landcare (SERCUL) and the Armadale Gosnells Landcare Group (AGLG) has begun the Canning River Pools project. The project aims to identify and protect upstream pools in the Canning River that provide critical habitat for aquatic organisms, such as native freshwater fish and crayfish. The area between the Canning Dam and Heritage Drive Bridge Crossing was completed this year.
Agency performance>Environmental management tBack Contents Forwardu

Swan River Trust Annual Report 2011-12 11
Local Water Quality Improvement PlansThe Trust continues to use the SCWQIP framework to develop and invest in Water Quality Improvement Plans (WQIPs) for priority catchments and those that do not meet long-term water quality goals as indicated by the SCWQIP predictive modelling. A review of water quality data and other criteria was examined to determine the next WQIP for development. Bull Creek Catchment was identified as a priority and WQIP development began in February 2012.Southern River Catchment WQIP identified sedimentation in the Southern and Wungong rivers as a significant issue resulting from poor practices during urban development. The Sediment and Erosion Project has undertaken a detailed investigation into planning, statutory and policy mechanisms for controlling and enforcing management of erosion and sedimentation during the subdivision, development and building stages. In partnership with the cities of Armadale and Gosnells an officer has been employed to review these mechanisms and determine which is most effective for application and enforcement for these local governments. A five month trial which worked with developers and the building industry to raise awareness of the issue and to assess effectiveness of the use of Local Laws has just finished. The final report will be completed later this year. The Bennett Brook WQIP provided extra funding to the annual Water Quality Monitoring Program enabling an increase in monitoring sites, frequency and parameters, providing a more comprehensive understanding of the issues and hot spots. A review of the compensating basins and drains in the catchment has been completed which has prioritised sites for future funding and revegetation works. Two compensation basins identified in the report have been revegetatedInvestment in the Canning Plain WQIP has started with the employment of an officer in partnership with the cities of Belmont and Canning. The officer has reviewed planning mechanisms pertaining to wastewater and stormwater management in light-industrial areas in the cities of Canning and Belmont. A number of recommendations have been developed and are being reviewed by local government officers and relevant stakeholders.
Swan River Trust and Alcoa Landcare Program (SALP)The Swan River Trust and Alcoa Landcare Program (previously known as the Swan Alcoa Landcare Program) is administered by Perth Region NRM on behalf of the Trust and Alcoa Australia Limited. The program provided $340,000 to implement 30 on-ground restoration projects throughout the Swan Canning Catchment. Of that, $295,624 was allocated to projects to achieve improved water quality outcomes. Since joining the program in 1999 the Trust has provided over $2.9 million to SALP and contributed a further $150,000 this year.
OxygenationThe Swan and Canning rivers typically experience low oxygen levels in summer and autumn. This is caused by the breakdown of organic matter and is recognised as a major cause of nutrient release from river sediments. This in turn causes loss of ecological function and increases the risk of fish deaths. The Trust now operates four oxygenation plants in the river system to combat these problems. The new oxygenation plant at Caversham was operational for the whole year in 2011-12. Testing of the area of influence of this plant showed it has the potential to provide oxygen across an 8 km stretch of river. When using this plant in conjunction with the existing oxygenation plant at Guildford, the Trust now has unprecedented capacity to maintain or improve oxygen conditions in response to rainfall events and algal blooms in the upper Swan River. A long dry summer coupled with very high tides saw the oxygenation plants on the Canning River operate over a longer period and in higher salinity water than typically experienced. This salt water took its toll on oxygenation equipment, which was originally designed to work in the freshwater environment of the Kent Street Weir pool. One pump had to be replaced due to corrosion, and significant components of both Canning River oxygenation systems will need to be replaced before the 2012/13 oxygenation season (typically September/October to May/June) can start. This will be done as part of the $3.4 million the State Government is providing to increase the capacity of the oxygenation program in the Canning River over the next two years.
Agency performance>Environmental management tBack Contents Forwardu

Swan River Trust Annual Report 2011-12 12
River ScienceThe Swan Canning Research and Innovation Program continues to build on the scientific knowledge underpinning the management of the Swan and Canning Rivers and works towards fulfilling research priorities identified under the Healthy Rivers Action Plan.
Many currently active research projects are focused on the development of indicators and approaches for monitoring ecosystem health and condition. This is in keeping with the Trust’s requirement for reporting on ecological health and the need to broaden approaches beyond water quality monitoring. To this effect, the Trust has continued to partner Murdoch University (Centre for Fish, Fisheries and Aquatic Ecosystems Research) in the development and validation of a Fish Community Index and trial of its application.
The Trust has also partnered with Department of Water to develop a seagrass assessment protocol which may be used as an indicator of estuarine condition, and will encompass a range of metrics describing the health of Halophila ovalis. Extensive monitoring took place this year with seagrass harvesting and measurement at a series of locations to understand the natural variability in a range of seagrass metrics. These metrics, collected at regular intervals will provide information on the sensitivity of seagrass to water quality, light and sediment dynamics as well as an understanding of natural seasonal changes.
In a separate project, innovative approaches to monitoring algae were explored through a partnership with Curtin University (Remote Sensing and Satellite Research Group). Researchers investigated the use of specialised boat-mounted equipment to measure light reflectance over large areas of the Swan Canning estuary and to relate the data to concentrations of chlorophyll, phytoplankton, tannins and suspended sediment. The approach is being trialled for its capacity to map algal biomass and classify algal type for use in rapid assessment.
Agency performance>Environmental management tBack Contents Forwardu
Case study - seagrass mapping projectA new seagrass monitoring project could hold the key to providing valuable data to scientists about the health of the Swan and Canning rivers.On 25 September 2011, Trust Senior Environmental Officer Jeff Cosgrove took Environment Minister Bill Marmion snorkelling in the waters off Point Walter in Bicton to examine seagrass and investigate its suitability as an indicator of estuarine health.“Halophila ovalis plays a number of important ecological roles in the Riverpark, including a food source for the black swan. Its growth is thought to be influenced by water quality,” Mr Marmion said. “Work is being carried out to determine whether seagrass could be used as an ongoing indicator of estuary condition, in the same way nitrogen and phosphorus are used to give us a picture of river health.”Extensive monitoring took place this year with seagrass harvesting and measurement at a series of locations to provide information on the sensitivity of seagrass to water quality, light and sediment dynamics as well as an understanding of natural seasonal changes.
Trust Senior Environmental Officer Jeff Cosgrove and Environment Minister Bill Marmion examine seagrass off Point Walter.

Swan River Trust Annual Report 2011-12 13
A census of the dolphin population in the Riverpark occurred this year as part of the Dolphin Health and Ecology project undertaken by Murdoch University researchers (Cetacean Research Unit). In part, this project is providing a new baseline on the dolphin population in the Riverpark since 2009. Results to date indicate that 22 dolphins are consistently observed in the estuary and are considered “resident” in the Riverpark. These include five dependent dolphin calves. The results of this research have been used to develop a revised FinBook, which provides a guide to identification for over 400 trained dolphin watchers and highlights the associations between Riverpark dolphins. This work, as well as that being conducted at Curtin University Centre for Marine Science and Technology, provides sound scientific support for the citizen science program – Dolphin Watch.
River science information transfer is an important priority and extensive effort has gone into revising the River Science pages on the Trust website this year. This helps better explain ecological issues facing the rivers and the Trust’s corresponding approaches to management. In addition, science was centre-stage this year when the Trust held its River Forum 2011: Sharing Knowledge – Use – Responsibility in November 2011. A diverse range of scientific topics were presented on the day including: dolphin health, nutrient farming, remote sensing techniques, management issues and mussel relocation strategies.
Drainage Nutrient Intervention Program (DNIP)Trust research priorities in relation to storm water have continued to be addressed through involvement in the Cities as Water Supply Catchment Program and more recently the Cooperative Research Centre for Water Sensitive Cities.
A pre-feasibility study of the Ellen Brook end-of-catchment nutrient stripping wetland treatment system was finalised, funding secured via the 2011-12 State Budget and procurement started. The $3.2 million project will see construction of the wetland treatment system in 2012-13.
Revegetation activities on the Anvil Way Compensation Basin Restoration and Living Stream Project were completed. Savings from this project allowed
for works to be undertaken to address functional issues at the Liege and Wharf Street Constructed Wetlands. Works at the Liege Street Wetland involved dredging and removal of sulfidic sediment, raising of sumpland levels, changes to the wetland outlet and revegetation. Works at the Wharf Street Wetland involved removal and replacement of subsurface flow wetland aggregate materials and replanting.
Investigations were undertaken to confirm potential contamination issues in the Eric Singleton Bird Sanctuary Wetland. These investigations were critical in confirming the feasibility of the project.
Monitoring, evaluation and maintenance continued at drainage Nutrient Intervention Program sites in the Canning Plain, Central Belmont and Ellen Brook Catchments.
Environmental flowsMany of the tributaries of the Swan and Canning rivers are dammed for the domestic water supply. The resulting changes to river flows are recognised as a disturbance to the environmental value of environments downstream of major dams. The Trust provides support to the Department of Water to investigate the environmental water requirements of these downstream environments and prescribes environmental water provisions (flow regimes) that maintain or restore ecological processes and protect their environmental value. The Trust has conducted fortnightly monitoring of the pools that become isolated in summer on the middle and lower Helena River, to measure the effects of water released by the Water Corporation from the Lower Helena Reservoir. Together with surveys of the fish and macroinvertebrate fauna, this data will assist the Department of Water to prescribe appropriate environmental water provisions for the Lower Helena River in the coming year.
Agency performance>Environmental management tBack Contents Forwardu

Swan River Trust Annual Report 2011-12 14
Figure 5: Swan Canning Riverpark sampling sites Environmental monitoringEach year, the Department of Water undertakes weekly monitoring of the Swan and Canning estuary on behalf of the Trust. Between 25 and 50 water samples (depending on the condition of the system) are collected from the estuary each week and are subjected to a range of water quality analyses including nutrients, temperature, salinity, chlorophyll-a (algae) and dissolved oxygen. Samples are collected across a range extending 1 km upstream of the Jane Brook confluence on the Swan River, to the top of the Kent Street Weir pool (near Ellison Drive) on the Canning River, and downstream to Fremantle.
In addition to the Swan Canning estuary sampling, the Trust provides both state and federal funding to the Department of Water to monitor water quality within all 31 sub-catchments that feed into the Swan and Canning system. Catchment data is collected fortnightly when there is water flowing in the system.
Data collected in the environmental monitoring program helps the Trust to target specific areas within the catchment that require particular responses to determine the effectiveness of the management actions we already have in place. It also allows the Trust to provide timely warnings about potentially hazardous conditions (such as harmful algal blooms) and improves the long-term understanding of the way the Swan Canning river system functions.
Agency performance>Environmental management tBack Contents Forwardu

Swan River Trust Annual Report 2011-12 15
Service 2 Communication of environmental informationThe Communications service enhances community social responsibility so that the public is motivated to help to look after the Riverpark. The service aims to foster a community that is committed to helping protect the Riverpark and who support the Trust in river management. The Trust runs environmental education and behaviour change programs to increase public understanding of the Swan and Canning rivers. This encourages the community to participate in improving Riverpark use, health, and custodianship while respecting cultural significance and sense of place.
Global social science research has proven that the community is more likely to become part of solving environmental problems when it understands the key issues and is empowered to play a role in applying the solutions. Effective communication of key river wise messages and community engagement are critical aspects of the Trust’s work.
Media and corporate relationsWhile the Trust maintains a steady flow of information through traditional media channels, its social networking strategy has significantly expanded and the agency continues to grow its YouTube, Facebook and Twitter presence.
Communications has focused on proactive media servicing and integrated marketing activities to help deliver clear and consistent key messages about the Trust’s services and brand. This has helped maximise media exposure and increase awareness of the River Guardians and Trust brands.
This year the Trust has formed important relationships with Scitech, Botanic Gardens and Parks Authority and WA Tourism to help deliver key RiverWise education messages through mobile media displays and special events at key public venues. Communications developed a community sponsorship agreement and proposal to help secure a corporate partner for the Trust’s Dolphin Watch program.
The Trust also assumed management of the Discover Your Rivers brand to help raise public awareness of key river issues and restoration projects via the Community Newspaper Group. WebsitesThe Trust’s website continued to expand its influence with a total of 31,954 unique visitors for the year. The River Science section was the most visited component of the website, followed by Statutory Planning.The program focused on integration across communications media. Trust media releases and articles were simultaneously posted on the website. Facebook, Twitter and Wikipedia referred 650 visits to the Trust website during the year. The Trust’s website and social media were consistently promoted in newsletters, media releases and feature articles.The River Guardians website was redesigned and launched in May 2012. The new website features a photo gallery, dolphin observation map and an online monitoring form with automatic field validation for the Dolphin Watch project. The River Guardians website’s improved navigation and mobile device compatibility has generated positive feedback and received 5,481 unique visitors during 2011-12.
Community engagementGreat Gardens WorkshopsThe Great Gardens Workshop program hosted 16 Trust-funded workshops attended by 1,432 people. The average attendance rate of 89 people per workshop is slightly up on the previous year’s average of 81 people per workshop. Participant surveys and a home audit program indicate 71.9 per cent of participants made positive behavioural change as a result of attending the autumn series of workshops (e.g. stopped fertilising, began planting native plants). The surveys revealed 51.7 per cent of attendees switched to the use of slow-release fertiliser and 16.7 per cent stopped using fertiliser completely. The Trust’s contract with Great Gardens to deliver sustainable gardening education workshops to the Swan Canning community has now been completed and the Trust is preparing a new Request for Tender.
Agency performance>Communication of environmental information tBack Contents Forwardu

Swan River Trust Annual Report 2011-12 16
External presentations This year Trust officers delivered 27 presentations to external stakeholders. These included universities, local government and volunteer groups, and community events. These presentations reached 1,425 people.
River GuardiansRiver Guardians now has 1480 members, an increase of 29 per cent on 2010-11 membership numbers. Over the past year, River Guardians has worked with 46 stakeholder groups and had an active presence at 19 environmental education events with a combined attendance total of over 10,000 people.
The program continues to provide RiverWise training and volunteering opportunities, and presentations from leading scientific and behaviour change experts addressing the key issues facing our rivers.
The River Guardians flagship project, Dolphin Watch, flourished in its third year. The project has doubled its volunteer base over the past 12 months and now has 405 trained volunteers (203 new people). The annual Dolphin Watch Day event held on 27 June 2012 was attended by the Minister for the Environment and over 100 Dolphin Watch volunteers. The popular event included the release of the second edition of FinBook and 2011-12 Dolphin Watch Annual Report which details the results from the third year of monitoring, and the presentation of awards for volunteers.
The inaugural RiverWise training series was delivered in September 2011 and involved 68 participants. Training consisted of four free half-day training sessions. Content included nutrient reduction across homes, gardens and riverside recreational activities, foreshore protection and habitat restoration activities that contribute to improving water quality across the catchment. All sessions were facilitated by a behavioural change expert. Evaluation of the inaugural series demonstrated that participants learnt how the river system operated and how they impacted upon it.
Agency performance>Communication of environmental information tBack Contents Forwardu
Case study - Dolphin WatchThis year marked the third anniversary of Dolphin Watch, the Trust’s citizen scientist program connecting Perth people to the Riverpark by training them as dolphin watchers. Volunteers help monitor and research the resident Indo Pacific bottlenose dolphin population, providing valuable information to Murdoch and Curtin university researchers. The number of trained volunteers has reached 405, with dolphin watchers recording information on dolphin behaviour and sightings that is assisting the researchers to create a picture of how dolphins use the Riverpark.This year the program celebrated many achievements, including the launch of a dolphin display at Scitech, a Name the Dolphin competition for a resident calf living with its mother in the Swan Canning Riverpark, four volunteer training sessions, and the release of a new edition of Finbook, an identification guide to dolphins in the Riverpark. Dolphin Watch volunteers also assisted the Department of Environment and Conservation and the Trust with reports and photographs of entangled dolphin calf Gizmo, helping to establish a pattern of movements of the young dolphin to assist DEC wildlife officers and Water Police to successfully disentangle him.
River Guardians Program Manager Marnie Giroud with Name the Dolphin Competition winner William Ross.

Swan River Trust Annual Report 2011-12 17
Phosphorus Awareness Project The Phosphorus Awareness Project (PAP) seeks to achieve a decrease in nutrient loads and algal blooms through changes in community and industry behaviour and practices. Delivering fertiliser and environmental education the group targets the wider community and achieved the following results in 2011-12:
• 187 school presentations to 5,200 school children • 25 school planting sessions• six Fertilise Wise Fertiliser Training sessions held for 86 turf managers• 27 community presentations and 21 displays at community events with
7,900 people addressed• seven drain stencilling sessions with volunteers, helping to stencil over
2,200 drains and deliver over 5,100 educational postcards/brochures to households.
The project also organised the annual Sounds of Science Community Fair, which attracted more than 1,000 people and completed the local government Annual Nutrient Survey.
River Guardians Schools Education Project The Trust’s Ribbons of Blue and River Rangers programs continue to be successfully delivered across the Swan Canning Catchment by the Trust’s Education Officer. The Ribbons of Blue program engaged 6,033 students from 130 schools. This is an increase from 4,794 students from 71 schools in 2010-11. To complement Ribbons of Blue learnings, the Trust also delivered five RiverWise Catchment Activity Days involving 11 schools and 545 students, three local governments and relevant local community groups. The events are also well supported by the South East Regional Centre of Urban Landcare (SERCUL) and the Department of Environment and Conservation’s Ribbons of Blue program.Catchment Activity Days teach students in Years 5-7 about the river ecosystem and how the public’s activities impact upon it. To ensure students receive maximum educational benefit, teachers attend a half-day professional learning workshop where curriculum materials are provided for pre and post-excursion activities. More than 230 teachers attended professional learning workshops run by the Trust’s Education Officer in 2011-12. The Trust Education Officer continues to work closely with the five primary schools currently involved in the final year of the two-year pilot River Rangers program. In June 2012, the State Government announced that the program would become permanent and by the end of 2015, 15 schools will be running the River Rangers cadets program. The Trust signed a new Memorandum of Understanding with the Department for Communities in 2012 and will continue to develop and deliver the program over the next three years.The Trust partnered with Millennium Kids in 2012 to deliver the second annual Swan Canning Riverpark Youth Forum. The Forum seeks to support schools in the Swan Canning Catchment to implement long term sustainability projects that enable students to adopt behaviours that lead to a healthy river for all, forever. The Forum has also resulted in the development of the Swan Canning Online Schools Project where schools can share their stories of sustainability.
Agency performance>Communication of environmental information tBack Contents Forwardu
Primary school students learn about feral fish at a RiverWise Activity Day.

Swan River Trust Annual Report 2011-12 18
Service 3: Statutory assessment of developmentThe Statutory Planning service ensures that development around the river does not unduly impact on Riverpark values and meets the community’s expectations.The Trust’s Development Control Area (DCA) review continued in 2011-12. The purpose of the review was largely to correct anomalies between the DCA and the Metropolitan Region Scheme (MRS) and will ensure a more streamlined and clearer assessment pathway.
The review of the Swan and Canning Rivers Management Regulations 2007 also continued. The proposed amendments have been rationalised to remove areas of contention but will still provide a more streamlined process for many types of application. The amended regulations will be submitted to Government for final consideration early in the 2012-13 year.
Statutory assessmentsThe Trust deals with assessment matters in several statutory streams defined by the Act, the Swan and Canning Rivers Management Regulations 2007, and the MRS. When requested by the Department of Planning, the Trust also provides advice in relation to subdivision applications made under the Planning and Development Act 2005.
This year 332 applications were assessed. These applications related to development in, or next to, the Trust DCA or were applications for subdivision of land that affected the DCA. Of these, 326 applications were approved by the Trust or recommended for approval by the Minister for Environment, the WAPC or local government.
Planning policy and strategiesThe review of Trust assessment policies continued during the year. The setback policy review was finalised, as was the new nutrient offsets policy which provides a framework for nutrient offsets to be implemented if developers propose offsets to progress a land use change that may not be approved unless unacceptable nutrient outputs are addressed. It does not require offsets or referral of planning applications to the Trust.
A comprehensive review of the stormwater management policy has been undertaken and a new policy to guide the provision of car parking and access in the foreshore reserve has been drafted and advertised for public comment. A policy addressing the consideration of Noongar values in the statutory assessment and decision making process has also been drafted and is expected to be released for comment in 2012-13.
A discussion paper on the management of dewatering effluent has been prepared and released for targeted stakeholder consultation as a precursor to the review of the policy. Two key issues are explored in the discussion paper:
• Acceptable water quality criteria for the discharge of dewatering effluent to the river, either directly to the river or through a stormwater drain; and
• Effective governance arrangements and statutory powers for the implementation of a dewatering policy and discharge criteria.
The Trust provided detailed advice to the Department of Health on its draft Government Sewerage Policy to ensure that environmental and waterway protection is actively considered in situations where reticulated sewerage cannot be provided. The Trust also provided advice to the Department of Water on its draft revised foreshore areas policy, guidelines for controlled groundwater levels and water quality protection notes.
Agency performance>Statutory assessment of development tBack Contents Forwardu

Swan River Trust Annual Report 2011-12 19
Major proposals consideredElizabeth Quay construction started towards the end of the financial year. Prior to its start the Trust considered and provided comprehensive binding advice to the Western Australian Planning Commission concerning approval of the first two stages of the development.
The Commission has delegated to the Trust, the responsibility for overseeing compliance with conditions of approval that affect the river. The compliance work started in October 2011 with the review of numerous management plans by the Trust and has continued since that time. The Trust has a dedicated officer performing the compliance role while other senior officers have been engaged in working groups, and with the assessment of the development proposals and various management plans.
Other ongoing and significant projects for Trust consideration during the year included the proposal to redevelop the Belmont Race Course with a major residential and commercial development, the Metropolitan Redevelopment Authority Waterbank project next to the Causeway and the proposed Perth Major Stadium project on the Burswood Peninsula.
Strategic land-use planningThis year, as part of the Healthy Rivers Action Plan, the land use planning program:• Provided advice on six strategic planning proposals likely to impact on
water quality in the Swan Canning river system, including urban water management plans in West Martin and Huntingdale.
• Supported other government agencies in preparing three district structure plans and the associated district water management strategies, including plans for the proposed Bullsbrook Industrial Cell and Perth Waterfront Development.
The land use planning program works in partnership with other agencies to build capacity in water sensitive urban design and total water cycle management. The Trust continued its role as a partner in the New WAter Ways capacity building program and funded water sensitive urban design training sessions. The Trust also supports the Cooperative Research Centre (CRC) for Water Sensitive Cities research program and has provided input on the scope and nature of the research plans being developed. The CRC will formally start in 2012-13.
Compliance and auditA total of 360 compliance actions were undertaken during the year, a 20 per cent increase on the previous year that reflects the streamlined approach that has been developed to undertake this work. Checks were undertaken on proposals approved under Part 5 of the Act, by permit under Trust regulations and on developments approved by the Western Australian Planning Commission or local governments adjoining the Trust Development Control Area.
Of the 293 checks made on approvals issued by the Trust, 202 (69 per cent) were found to be in full compliance at the time of inspection, a slight decrease from the previous year when 74 per cent were found to be compliant. Continued efforts will be made to improve the administration of the system to help maximise Trust officers time in the field.
Agency performance>Statutory assessment of development tBack Contents Forwardu
The Trust helps guide riverfront planning and approvals for a diverse range of organisations including yacht clubs.

Swan River Trust Annual Report 2011-12 20
Service 4: Riverpark managementRiverpark management guides shoreline restoration and operational, recreational and commercial activities to enhance community benefit and amenity of the Swan Canning Riverpark.The Act establishes the Swan Canning Riverpark as 72.1 km² of river reserve and adjoining public lands and gives the Trust responsibility as the park management agency.
Boating Management StrategyThis year the Trust continued its focus on seeking environmental compliance from Riverpark yacht clubs and marinas. In 2011-12 the Trust undertook audits of environmental management systems (EMS) of all Riverpark yacht clubs and three marinas.
The Trust has worked with these riverfront organisations to review and improve EMS in line with standard ISO 14001; 2004. This process has seen improvements in EMS documentation and environmental management practices to refine responses to environmental incidents and prevent pollution of the rivers. The intent is to hand compliance over to the Department of Transport as management agents of the leases in 2012-13.
The Trust collaborated with the Department of Transport Marine Safety to draft the Aquatic Use Management Framework report for improved management and sharing of the rivers by recreational user groups.
The Trust’s Dinghy Management Strategy along the Swan Canning Riverpark Shoreline has proved to be problematic due to the complexity of issues associated with dinghy storage on public foreshores. The strategy prohibits the storage of dinghies on the shoreline unless they are stored in an approved management system. This has been endorsed by the majority of councils in the Swan Canning Riverpark and the Trust continues to work closely with local governments in the lower estuary to implement the policy.
Land Management StrategyThe Trust is developing a strategy in conjunction with the Department of Environment and Conservation and the Fire and Emergency Service Authority to help address land management issues, especially bushfire risk mitigation, in the river reserve of the upper Canning and Helena rivers. The Trust is also continuing audits of encroachment issues into the Riverpark, which is particularly prevalent in the upper reaches of the Canning River. A compliance strategy is being developed to tackle this issue on a case by case basis.
Swan Canning Riverpark Trails ProjectThe Swan Canning Riverpark Trails Project has progressed well in 2011-12 with the drafting of the Trails Masterplan (from Fremantle to Roe Highway on the Canning and Barkers Bridge Lilac Hill on the Swan). The draft plan was completed and presented to the project steering group. A draft Swan Canning Riverpark Trails logo has also been developed to help brand the project.In line with interpretation best practice, the Trust engaged the National Trust WA Branch to complete a heritage audit and statement of significance for the Swan Canning Riverpark. This was delivered in August 2011 and forms the basis of the interpretation plan. A scope for the interpretation plan was developed in partnership with the National Trust and is currently being used to seek funding. The plan will provide interpretation of three key themes – historic, natural and Noongar heritage throughout the Riverpark. This project will be a primary focus in 2012-13.The Trails steering group, including foreshore land managers and other stakeholders, met once during 2011-12. During this time significant data has been collected on trial projects being undertaken in the Riverpark by foreshore land managers that can link to the Riverpark Trails network.
Agency performance>Riverpark management tBack Contents Forwardu

Swan River Trust Annual Report 2011-12 21
Aboriginal Heritage approvalsThe Trust continues to improve working relationships with the Noongar community in protecting and managing Noongar heritage throughout the Riverpark. This was highlighted through the Trust’s involvement in the trial of new State Government heritage protocols in the City of Canning. This project is being implemented in collaboration with the City of Canning, Department of Indigenous Affairs, and the South West Aboriginal Land and Sea Council. The project is seeking to obtain an Aboriginal Heritage Act approval for proposed river restoration projects, general maintenance work and facility upgrades within the City of Canning section of the Riverpark. Historically this has been conducted on a case by case basis.
Events, complaints, incidents and enforcementThe Trust responds to complaints and incidents in the Riverpark and takes action as appropriate. This year the Trust responded to 222 complaints, compared with 225 last year. The number of incidents recorded under the categories of ‘aquatic deaths’ and ‘destruction of vegetation’ were significantly less this year compared to last year.
Damage to Riverpark vegetation by landowners trying to improve the view remains a problem and this year the Trust reviewed its vegetation management strategy and worked with Statutory Planning to update relevant policies and develop guidelines.
The Trust responded to 28 reports of destruction to vegetation and installed three vegetation destruction warning signs at three sites during 2011-12. Two prosecution briefs were referred to court in 2011-12 and a trial date has been set. Both briefs are for cases involving damage to vegetation on private property, but within the Trust’s Development Control Area.
Riverpark also reviewed the Trust’s Commercial Operation management and drafted a policy that is planned for release for public comment in 2012-13.
Agency performance>Riverpark management tBack Contents Forwardu
Case study - BooneenboroThe Trust’s first purpose-built patrol boat took to the waters of the Swan and Canning rivers this year, boosting enforcement and compliance efforts and heralding a new era of Riverpark management. The vessel marks an important step in the transition of the Trust’s operations from a logistics support role to holistic park management. The new vessel, the $201,000 Booneenboro, will patrol for speeding craft, attend spills and other incidents, and monitor compliance with navigational rules. And with a raft of purpose-built features, Riverpark Manager Chris Mather said the new boat would be a big boost to the compliance and enforcement functions of the Trust. Since the establishment of Riverpark operations, we have moved our focus to education, enforcement and compliance,” he said. “This new boat is the last piece of the puzzle, giving our guys the tools to respond to any incident, event or enforcement action required in the Riverpark. They are equipped to deal with anything.”
Booneenboro, the Trust’s first purpose-built patrol boat, takes to the waters of the Swan River near Heirisson Island.

Swan River Trust Annual Report 2011-12 22
Table 1: Incident and complaints management summary
Subcategories 2005-06 2006-07 2007-08 2008-09 2009-10 2010-11 2011-12
Algal blooms 4 6 5 9 8 2 3
Aquatic deaths 7 10 12 23 15 10 6
Chemical spills 0 3 5 4 0 3 Nil
Vegetation destruction 12 30 23 30 42 42 28
Foaming 2 8 0 1 4 4 4
Foreshore damage 7 8 19 13 8 1 5
General complaints 68 82 68 79 82 46 54
Herbicides/pesticide spraying 3 1 3 2 1 3 1
Industrial discharge/dewatering 17 11 14 14 16 5 11
Offensive odour 7 10 3 5 4 Nil 2
Oil slicks/spills 33 32 26 34 27 23 22
River discolouration 4 3 4 6 10 16 10
Sewage discharge 21 10 11 12 9 5 6
Unauthorised development 15 13 16 13 11 9 13
Waste/rubbish dump 23 13 17 21 18 18 14
Watercraft nuisance 29 19 21 34 12 37 42
Weeds 5 5 1 7 4 1 1
TOTAL 257 264 248 307 271 225 222
Foot/vessel patrols (upper Canning, upper Swan, Helena and Southern rivers) - Riverpark Operations officers conducted a series of one-day foot patrols focusing on the upper reaches of the River Reserve/DCA, identifying a significant number of compliance and enforcement issues requiring attention. These included minor incidents of unlawful development, littering, encroachment and possible unauthorised water extraction, resulting in the need for the Trust to implement a ‘Land Management Strategy’ to help resolve these issues.
Compliance - In the 2011-12 financial year, Trust officers conducted five jetty based compliance actions and eight compliance boat patrols, targeting speeding vessels in the Swan Canning Riverpark. A total of 181 vessels were stopped, with 13 infringement notices and nine written cautions issued, along with 78 verbal cautions for a variety of marine offences. Trust officers also took control of the new patrol vessel Booneenboro during the summer period, which has been an operational success.
Fish kill - In January 2012 the Trust responded to a fish kill (approximately 5,000 fish) upstream of the Middle Swan Bridge, a result of low dissolved oxygen in the river.
Dolphin entanglement - In April 2012 there was significant publicity surrounding the dolphin Gizmo who was partly entangled in netting. Gizmo was freed in June 2012.
Fish kill - In May 2012 the Trust responded to another fish kill (approximately 2500 fish) in the upper Swan River, the result of a Karlodinium algal bloom.
Agency performance>Riverpark management tBack Contents Forwardu
Five most notable incidents of 2011-12

Swan River Trust Annual Report 2011-12 23
Trust officers continue to spend considerable time removing litter and waste from Swan Canning Riverpark waterways and foreshores. This year a total of 11,000 kilograms of general refuse plus other large items were removed from waterways and foreshores.
The Trust continues to liaise with other agencies (including Water Corporation, Department of Health, and Department of Environment and Conservation) and endeavours to reduce the impacts of wastewater overflows.
During major river events, such as the Australia Day Skyworks and Avon Descent, the Trust plays a support role, helping with event planning and providing logistical support and compliance during the event.
Table 2: Tonnes of materials removed from waterways and foreshores
Tonnes removed per yearMaterial 2008-09 2009-10 2010-11 2011-12
Rubbish 7.726 6.765 6.577 9.27*
Fish 0.101 0.001 0.03 0.01
Timber 9.984 19.416 7.378 2.081
Weed 152.4 112.8 0 53.3
TOTAL 170.211 138.982 13.985 64.6
Note: in tables 2 and 3 “rubbish” includes all general refuse and may also include rubble and remnants of old structures demolished and removed from the Riverpark.*Approximately one third of this figure is associated with the removal of rubble (source unknown) at Minim Cove.
Table 3: Summary of materials removed from waterways and foreshores
Material Units 2008-09 2009-10 2010-11 2011-12
Rubbish Kg 7726 6765 6577 9270*
White goods Each 3 7 0 0
Tyres Each 11 16 46 48
Drums Each 12 20 7 16
Signs Each 33 13 10 19
Vessels Each 2 1 0
Shopping trolleys Each 120 49 48 9
Fish Kg 101 1 30 10
Birds Each 8 6 2 1
Other animals Each 0 2 1 0
Timber Kg 9984 19416 7378 2081
Weed Tonnes 152.4 112.8 0 53.3
Pallets/crates Each 12 37 20 12
Chairs Each 24 21 51 21
Agency performance>Riverpark management tBack Contents Forwardu

Swan River Trust Annual Report 2011-12 24
RiverbankThe Riverbank program has contributed more than $8 million for river restoration projects during the past 10 years matched by an additional $8 million from partners in local governments to realise on-ground environmental projects. Since 2002 the Riverbank program has restored 500,000 m2
(equivalent of 28 Subiaco Ovals) of shoreline each year, planted 700,000 trees and has built and maintained approximately 6 kilometres of riverwalls throughout the Riverpark.
Riverbank 2011-12 fundingDuring 2011-12, $912,761 was distributed for 12 priority projects, addressing erosion control, revegetation, weed control, riverwall repair and preparation of foreshore management plans. In addition $279,275 was provided to the City of Belmont for emergency repairs to the shoreline in front of the Ascot Race Course.
Swan River Trust Bush Fire Response Initiative fundingDepartment of Environment and ConservationWeed control and infill planting at five areas within the Canning River Regional Park following a bush fire which occurred in February 2011 - $111,000.
Swan River Trust Proactive Emergency Works fundingCity of Belmont Repairs and replacement to sections of the river wall, Ascot Race Course - $279,275.
Table 4: Riverbank Grants funding recipients 2011-12
Recipient Project Amount
City of MelvilleImplementation of foreshore stabilisation works as recommended in the Point Walter Concept Plan
$229,295
City of South Perth
Implementation of the Salter Point Foreshore Restoration Plan using bioengineering techniques
$60,000
Town of Bassendean
Implementation of the Success Hill Reserve Concept Plan: removal of the old jetty, improved access to the foreshore and associated restoration works
$103,471
City of South Perth
Revegetation, shoreline stabilisation and weed control at Milyu Reserve $18,475
City of Gosnells Revegetation and weed control at three sites in the City of Gosnells $16,360
City of Armadale Revegetation and weed control at three sites in the City of Armadale $27,050
City of Nedlands Revegetation and bank stabilisation at Point Resolution Reserve $67,500
City of Canning Stabilisation of the foreshore and revegetation at two sites in Shelley $13,533
City of Canning Restoration of Shelley Beach with sand renourishment and revegetation $65,000
Town of Mosman Park
Removal of a stand of giant reed and preparation of the site for revegetation $34,127
City of Fremantle Revegetation, weed and rabbit control and mulching of the North Fremantle foreshore $27,950
Agency performance>Riverpark management tBack Contents Forwardu

Swan River Trust Annual Report 2011-12 25
Riverbank funding scheme review
The Riverbank program has formalised three funding streams to be implemented in 2012-13. The Riverbank Grants scheme will be retained, although its focus will change to small scale community-based projects. The Proactive Funding Scheme has been established with detailed assessment guidelines focusing most Riverbank funding towards large scale multi-year priority projects. The Emergency Funding Scheme will provide funding for works required in response to unforeseen events such as severe storms.
These formalise the approach that has been undertaken during the past three years and provide rigour and accountability to the distribution of funding for foreshore restoration projects.
Communication and extension
The Riverbank branch successfully implemented the communication and extension plan aimed at ensuring foreshore land managers have access to technical information, project management support and training.
The Trust ran a series of successful workshops and demonstration site visits and produced key training publications including guidelines for foreshore management plans and restoration plans. These tools inform foreshore land managers of the details required in foreshore and restoration management plans, which are often a requirement of development applications.
Asset Management System
The Trust has finalised implementation of the software-based Asset Management System. This system has been integrated with the Department of Environment and Conservation’s information technology network, including Geographical Information System mapping. This system will help the Trust to manage the proactive river-wide funding process, examining priority sites across the Riverpark.
The Trust began the broad AMS information collection during 2011-12 which will continue in 2012-13. Once this data is integrated in the Asset Management System, it will assist the implementation of the proactive funding scheme.
Agency performance>Riverpark management tBack Contents Forwardu
Trust and City of Canning staff installing log brush mattressing on the Shelley Foreshore.

Swan River Trust Annual Report 2011-12 26
Servicing the agency: Strategic programsThe Strategic Programs branch is responsible for the planning and policy framework that guides the Trust and others to achieve collaborative, coordinated Riverpark management.
Draft River Protection StrategyThe Trust has worked with other state agencies and key stakeholders to develop a draft River Protection Strategy, which is a requirement of the Swan and Canning Rivers Management Act 2006. The draft Strategy aims to achieve better coordination and collaboration between management and community organisations and recommends actions to protect Riverpark values.
The Trust coordinated development of the draft Strategy in partnership with 21 local government authorities, 15 State Government agencies, natural resource management groups and community members.
The monitoring, evaluation and reporting framework prepared for the draft Strategy ensures a high standard of accountability through reporting requirements. The supporting Strategic Management Program document outlines commitments given by key management agencies to undertake actions during the next five years to help achieve long term management objectives.
The supporting Management Guides document provides information on a range of critical issues and incidents. The draft Strategy will be presented to the Minister for Environment; Water for consideration in the 2012-13 financial year.
Agency performance>Strategic programs tBack Contents Forwardu
Figure 6: Swan Avon Catchment
!
!
!
!
!
!
!
!
!
!
!
!
!
!HYDEN
PERTH
BEACON
GINGIN
NORTHAM
WICKEPIN
PINGELLY
ARMADALE
LAKEKING
WANDERING
CALINGIRI
DALWALLINU
KOOLYANOBBING
SOUTHERNCROSS
Belka River
Canning
River
Helena RiverSwan
River Yilgarn
River
Camm River
Mortlock River
Wakeman Creek
Salt Ri
ver
Lockhart
River
Avon River
INDIAN
OCEAN
SRT_AnnualReport_2006-2007_Swan-Avon_catchment.mxd
SRT_AnnualReport_2006-2007_Swan-Avon_catchment.mxd
Swan Canning Catchment
Major river
! Town
LEGEND
Swan Avon Catchment Boundary
´0 20 40 60 80 10010
Kilometres

Swan River Trust Annual Report 2011-12 27
Aquatic Use Management FrameworkThe Trust in partnership with the Department of Transport has produced a draft Aquatic Use Management Framework. Known as Sharing the Rivers, it promotes the safe, equitable and sustainable use of the Swan Canning Riverpark’s waterways into the future. The framework provides an updated aquatic use plan and identifies processes for future decision making. Key stakeholder consultation was completed in February 2011.
Useability IndexThe Useability Index is being developed as a tool to help the Trust and its partners assess the level of community benefit and amenity of foreshore reserves and parks in the Riverpark. This will assist in the ongoing monitoring of the recreational value of these assets.
Operational legislative reviewRegulation amendments to simplify and streamline approval process requirements for development and activities affecting the Swan Canning Riverpark were drafted in preparation for Cabinet consideration.
Agency performance>Strategic programs tBack Contents Forwardu
Case study - River Forum 2011Engaging the community to help protect Perth’s Swan Canning Riverpark was a strong theme of the Swan River Trust Forum 2011, held at the Perth Convention and Exhibition Centre in November 2011. The forum, titled Sharing Knowledge, Use, Responsibility, united scientists, community user groups, researchers, local government, industry representatives and key government agencies. Key speakers were Western Australia’s Chief Scientist Professor Lyn Beazley and the Minister for Environment; Water Bill Marmion who both stressed the importance of working collaboratively to meet the challenges ahead.Professor Beazley said the community, individuals, and government and industry groups would all have to play their part as population and development pressures increase throughout the Riverpark.Other topics included urban catchment management, research on Riverpark wildlife (including birds, dolphins and fish), water quality, climate change and key Trust projects in the Riverpark.
Panellists at the Swan River Trust Forum 2011, which brought together scientists, community, researchers, industry and government.

Swan River Trust Annual Report 2011-12 28
Servicing the agency: Business managementThe Business Management branch ensures accountability, good governance and financial sustainability by improving management systems within the Swan River Trust.Work has continued in year to improve the internal financial reporting processes in line with the Financial Management Act 2006 and Treasurer’s Instructions.
Reporting requirementsThe Department of Environment and Conservation (DEC) provides the Trust with staff, facilities and corporate services as defined by the Act. The Service Level Agreement between DEC and the Trust has been reviewed and a new Memorandum of Understanding is being negotiated. Outputs pertaining to the DEC disability access and inclusion plan, equal employment, substantive equality, cultural diversity and language services, corruption prevention, youth, compliance with public sector standards and ethical codes applicable to the Trust are incorporated in the outcomes reported in the DEC Annual Report 2011-12.
Conflict of interestThe Trust has procedures for identifying, preventing and resolving conflicts of interest, as outlined in the DEC Code of Conduct (May 2011). Trust Board members are required to declare conflicts of interest. This year, three Trust members declared a conflict of interest in 13 items.
Freedom of informationThis year, there were eight requests under the provisions of the Freedom of Information Act 1992. For the purposes of the Act, the Trust is a ‘related agency’ to DEC.
Record keepingRecord keeping was centralised to the Trust in 2009-10. During the year, the State Records Office approved the Trust’s Record Keeping Plan, including retention and disposal schedules.
Advertising and marketingThe Trust does not conduct campaign advertising or marketing and has no budget allocation for this activity. Trust advertising this year related to public comment on draft policies and the draft River Protection Strategy and advertising of the sale of the work vessel Wilma Vincent.
Table 5: Advertising and marketing expenditure
Class of expenditure Supplier Consolidated fund expenditure
Advertising of draft policies for public comment and public notification
WA and community newspapers $2,527
Public comment for draft River Protection Strategy WA newspaper $2,054
Advertising of sale of Wilma Vincent vessel and trailer
Adcorp $681
TOTAL $5,262
Agency performance>Business management tBack Contents Forwardu

Swan River Trust Annual Report 2011-12 29
Public commentThe Trust encourages public comment on river management issues during the year and actively works to provide the Perth community with opportunities to participate in decision making. Public meetings are held to discuss key issues and matters of significant public interest are advertised to seek submissions from the community.
Table 6: Public comments received on significant development applications and management plans
Item for public comment Letters Emails Total
Swan Canning Riverpark Aquatic Use Review and Management Framework
328 Nil 328
Draft River Protection Strategy
17 22 39
Disclosures and legal complianceThe Trust has a Finance and Audit Committee consisting of Board members. The Trust has an exemption from the Department of Treasury and Finance to employ an in-house Chief Financial Officer if there is support by an approved external accountancy firm.
Under Section 34 of the Act, the Environment Minister may give directions in writing to the Trust, generally with respect to the performance of its functions. The Trust is to give effect to any such direction. This year, there were no Ministerial directives.
Capital projectsThe Trust took delivery of a new patrol boat, the Booneenboro at a cost of $222,181 (including GST) and a tip truck at $217,450 (including GST).
A contract for the replacement of the work vessel Wilma Vincent was placed, but owing to the company’s inability to construct and deliver within the financial year, delivery will not take place until the start of the 2012-13 financial year. Total cost $176,127.
EmployeesTrust officers are provided by DEC and are subject to its industrial agreements. Executive remuneration is paid in accordance with public service conditions and reflects the Department’s industrial agreements. Workers compensation statistics are included in the DEC Annual Report 2011-2012.
Governance mattersThe Trust operates in accordance with Schedule 6 of the Swan and Canning Rivers Management Act 2006, Public Sector Management Act 1994, and DEC Code of Conduct (May 2011). Board members received the following remuneration. Board members who are public servants are not remunerated.
Agency performance>Business management tBack Contents Forwardu

Swan River Trust Annual Report 2011-12 30
Position Committees 2011-12 2011-12
ChairmanJames Freemantle
Retired 15 February 2012
Board + 2 Finance and Audit Committee
River Protection Strategy Advisory Committee
$24,524
Deputy ChairMichael Poole
Chairman with effect from 27 February 2012
Board + 2 Finance and Audit Committee
River Protection Strategy Advisory Committee to 26 April 2012
$19,575
Dudley Maier Board + 2 Chair of Finance and Audit Committee River Protection Strategy Advisory Committee to 26 April 2012
$14,473
Hamish Beck Board + 1 Finance and Audit Committee
$11,963
Jason Berry
Deputy Chair with effect from 27 February 2012
Board $7,918
Tony Evans
Resigned October 2011
Board + 1 River Protection Strategy Advisory Committee
NIL*
Position Committees 2011-12 2011-12
Lindsay Baxter Board + 1 River Protection Strategy Advisory Committee to 26 April 2012
NIL*
Vanessa Davies
Board + 1 River Protection Strategy Advisory Committee to 26 April 2012
$11,135
Jan Star
Retired September 2011
Board + 1 Chair of Swan Canning Water Quality Improvement Plan Steering Committee
$2,323
Shelley Taylor-Smith
Board + 1 River Protection Strategy Advisory Committee to 26 April 2012
$13,743
Barbara Watroba Board $2,655
Note: An overpayment of $500 was recouped from retired Member Carolyn Jakobsen Amount reflects remuneration paid to members and oncosts*Member is a public servant and therefore does not receive remuneration
Table 7: Board members remuneration Agency performance>Business management tBack Contents Forwardu

Swan River Trust Annual Report 2011-12 31
There were 11 Trust Board meetings held during 2011-2012.
Table 8: Trust Board meeting attendance
Member Total Attended
Mr James Freemantle 7 5
Prof Michael Poole 11 9
Mr Jason Berry 8 8
Cr Dudley Maier 11 11
Ms Jan Star 3 3
Mr Hamish Beck 11 8
Ms Shelley Taylor-Smith 11 7
Tony Evans (DPI representative, resigned October 2011) 4 3
Lindsay Baxter (DoP representative) 5 4
Ms Vanessa Davies 11 9
Ms Barbara Watroba 4 4
Table 9: Finance and Audit Committee attendance
Member Total Attended
Mr James Freemantle 3 2
Mr Dudley Maier 4 4
Mr Hamish Beck 4 3
Prof Michael Poole 1 1
DelegationsSection 33 of the Act allows for the delegation of Trust functions. The delegation gazetted in September 2007 and January 2010 remains in effect. During the year the Trust delegated further powers to the General Manager to vary Collaborative Agreements struck under the Act. The delegation was gazetted in June 2012.
In December 2011 the Western Australian Planning Commission delegated to the General Manager of the Swan River Trust powers under the Planning and Development Act 2005 to ensure compliance with conditions of approval relating to the Perth Waterfront Project.
Performance monitoring and reportingTrust officers provide written monthly reports on activities and financial statements to the Trust Board and its committees. Performance against the strategic and business plans is evaluated quarterly. Annual performance is reported in the Trust Annual Report to Parliament and the Minister for Environment; Water.
Agency performance>Business management tBack Contents Forwardu

Swan River Trust Annual Report 2011-12 32
Asset managementThe carry forward value of Trust property, plant and equipment was $22,186,993.
Other legal requirementsThe Trust does not conduct campaign advertising.
Compliance with public sector standards and ethical codesTrust officers are subject to the DEC Code of Conduct (May 2011) and Public Sector Management Act 1994, as required by the Western Australian Public Sector Code of Ethics.
Government policy requirementsTrust officers are subject to the DEC Code of Conduct (May 2011) and Public Sector Management Act 1994, including corruption prevention and substantive equality.
Occupational safety, health and injury managementThe Trust maintains an active occupational safety and health (OSH) committee with representatives from each branch. The committee meets regularly and actively promotes a culture of safety and health in the workplace. There were four Occupational Safety and Health incidents reported, however none of these resulted in a Lost Time Injury. Workstation ergonomic assessments have continued to be undertaken and manual handling training has also been implemented.
OSH is a standing item at weekly executive management team meetings and at six-weekly staff meetings.
Agency performance>Business management tBack Contents Forwardu
Trust staff share a commitment to the environmental health of the rivers.

Swan River Trust Annual Report 2011-12 33
Disclosures and legal compliance>Independent auditor’s report tBack Contents Forwardu
Disclosures and legal compliance
Independent auditor’s report
To the Parliament of Western AustraliaSWAN RIVER TRUSTReport on the Financial StatementsI have audited the accounts and financial statements of the Swan River Trust.
The financial statements comprise the Statement of Financial Position as at 30 June 2012, the Statement of Comprehensive Income, Statement of Changes in Equity and Statement of Cash Flows for the year then ended, and Notes comprising a summary of significant accounting policies and other explanatory information.
Board’s Responsibility for the Financial Statements
The Board is responsible for keeping proper accounts, and the preparation and fair presentation of the financial statements in accordance with Australian Accounting Standards and the Treasurer’s Instructions, and for such internal control as the Board determines is necessary to enable the preparation of financial statements that are free from material misstatement, whether due to fraud or error.
Auditor’s Responsibility
As required by the Auditor General Act 2006, my responsibility is to express an opinion on the financial statements based on my audit. The audit was conducted in accordance with Australian Auditing Standards. Those Standards require compliance with relevant ethical requirements relating to audit engagements and that the audit be planned and performed to obtain reasonable assurance about whether the financial statements are free from material misstatement.
An audit involves performing procedures to obtain audit evidence about the amounts and disclosures in the financial statements. The procedures selected depend on the auditor’s judgement, including the assessment of the risks of material misstatement of the financial statements, whether due to fraud or error. In making those risk assessments, the auditor considers internal control relevant to the Trust’s preparation and fair presentation of the financial statements in order to design audit procedures that are appropriate in the circumstances. An audit also includes evaluating the appropriateness of the accounting policies used and the reasonableness of accounting estimates made by the Board, as well as evaluating the overall presentation of the financial statements.
I believe that the audit evidence obtained is sufficient and appropriate to provide a basis for my audit opinion.
OpinionIn my opinion, the financial statements are based on proper accounts and present fairly, in all material respects, the financial position of the Swan River Trust at 30 June 2012 and its financial performance and cash flows for the year then ended. They are in accordance with Australian Accounting Standards and the Treasurer’s Instructions.
Report on ControlsI have audited the controls exercised by the Swan River Trust during the year ended 30 June 2012.
Controls exercised by the Swan River Trust are those policies and procedures established by the Board to ensure that the receipt, expenditure and investment of money, the acquisition and disposal of property, and the incurring of liabilities have been in accordance with legislative provisions.

Swan River Trust Annual Report 2011-12 34
Disclosures and legal compliance>Independent auditor’s report tBack Contents Forwardu
Board’s Responsibility for Controls
The Board is responsible for maintaining an adequate system of internal control to ensure that the receipt, expenditure and investment of money, the acquisition and disposal of public and other property, and the incurring of liabilities are in accordance with the Financial Management Act 2006 and the Treasurer’s Instructions, and other relevant written law.
Auditor’s Responsibility
As required by the Auditor General Act 2006, my responsibility is to express an opinion on the controls exercised by the Swan River Trust based on my audit conducted in accordance with Australian Auditing and Assurance Standards.
An audit involves performing procedures to obtain audit evidence about the adequacy of controls to ensure that the Trust complies with the legislative provisions. The procedures selected depend on the auditor’s judgement and include an evaluation of the design and implementation of relevant controls.
I believe that the audit evidence obtained is sufficient and appropriate to provide a basis for my audit opinion.
OpinionIn my opinion, the controls exercised by the Swan River Trust are sufficiently adequate to provide reasonable assurance that the receipt, expenditure and investment of money, the acquisition and disposal of property, and the incurring of liabilities have been in accordance with legislative provisions during the year ended 30 June 2012.
Report on the Key Performance IndicatorsI have audited the key performance indicators of the Swan River Trust for the year ended 30 June 2012.
The key performance indicators are the key effectiveness indicators and the key efficiency indicators that provide information on outcome achievement and service provision.
Board’s Responsibility for the Key Performance Indicators
The Board is responsible for the preparation and fair presentation of the key performance indicators in accordance with the Financial Management Act 2006 and the Treasurer’s Instructions and for such controls as the Board determines necessary to ensure that the key performance indicators fairly represent indicated performance.
Auditor’s Responsibility
As required by the Auditor General Act 2006, my responsibility is to express an opinion on the key performance indicators based on my audit conducted in accordance with Australian Auditing and Assurance Standards.
An audit involves performing procedures to obtain audit evidence about the key performance indicators. The procedures selected depend on the auditor’s judgement, including the assessment of the risks of material misstatement of the key performance indicators. In making these risk assessments the auditor considers internal control relevant to the Board’s preparation and fair presentation of the key performance indicators in order to design audit procedures that are appropriate in the circumstances. An audit also includes evaluating the relevance and appropriateness of the key performance indicators for measuring the extent of outcome achievement and service provision.
I believe that the audit evidence obtained is sufficient and appropriate to provide a basis for my audit opinion.
OpinionIn my opinion, the key performance indicators of the Swan River Trust are relevant and appropriate to assist users to assess the Trust’s performance and fairly represent indicated performance for the year ended 30 June 2012.
IndependenceIn conducting this audit, I have complied with the independence requirements of the Auditor General Act 2006 and Australian Auditing and Assurance Standards, and other relevant ethical requirements.

Swan River Trust Annual Report 2011-12 35
Disclosures and legal compliance>Independent auditor’s report tBack Contents Forwardu
Matters Relating to the Electronic Publication of the Audited Financial Statements and Key Performance IndicatorsThis auditor’s report relates to the financial statements and key performance indicators of the Swan River Trust for the year ended 30 June 2012 included on the Trust’s website. The Trust’s management is responsible for the integrity of the Trust’s website. I have not been engaged to report on the integrity of the Trust’s website. The auditor’s report refers only to the financial statements and key performance indicators described above. It does not provide an opinion on any other information which may have been hyperlinked to/from these financial statements or key performance indicators. If users of the financial statements and key performance indicators are concerned with the inherent risks arising from publication on a website, they are advised to refer to the hard copy of the audited financial statements and key performance indicators to confirm the information contained in this website version of the financial statements and key performance indicators.
Page 3 of 3
An audit involves performing procedures to obtain audit evidence about the key performance indicators. The procedures selected depend on the auditor’s judgement, including the assessment of the risks of material misstatement of the key performance indicators. In making these risk assessments the auditor considers internal control relevant to the Board’s preparation and fair presentation of the key performance indicators in order to design audit procedures that are appropriate in the circumstances. An audit also includes evaluating the relevance and appropriateness of the key performance indicators for measuring the extent of outcome achievement and service provision. I believe that the audit evidence obtained is sufficient and appropriate to provide a basis for my audit opinion. Opinion In my opinion, the key performance indicators of the Swan River Trust are relevant and appropriate to assist users to assess the Trust’s performance and fairly represent indicated performance for the year ended 30 June 2012. Independence In conducting this audit, I have complied with the independence requirements of the Auditor General Act 2006 and Australian Auditing and Assurance Standards, and other relevant ethical requirements. Matters Relating to the Electronic Publication of the Audited Financial Statements and Key Performance Indicators This auditor’s report relates to the financial statements and key performance indicators of the Swan River Trust for the year ended 30 June 2012 included on the Trust’s website. The Trust’s management is responsible for the integrity of the Trust’s website. I have not been engaged to report on the integrity of the Trust’s website. The auditor’s report refers only to the financial statements and key performance indicators described above. It does not provide an opinion on any other information which may have been hyperlinked to/from these financial statements or key performance indicators. If users of the financial statements and key performance indicators are concerned with the inherent risks arising from publication on a website, they are advised to refer to the hard copy of the audited financial statements and key performance indicators to confirm the information contained in this website version of the financial statements and key performance indicators.
GLEN CLARKE DEPUTY AUDITOR GENERAL Delegate of the Auditor General for Western Australia Perth, Western Australia 21 August 2012
GLEN CLARKE
DEPUTY AUDITOR GENERAL
Delegate of the Auditor General for Western Australia
Perth, Western Australia
21 August 2012

Swan River Trust Annual Report 2011-12 36
Board’s endorsement of key performance indicatorsKey Performance Indicators for the year ended 30 June 2012Certification of performance indicators
We hereby certify that the performance indicators are based on proper records, are relevant and appropriate for assisting users to assess the Trust’s performance, and fairly represent the performance of the Trust for the financial year ended 30 June 2012.
M. Poole
Chairperson
Accountable Authority
14 August 2012
D. Maier
Member
Accountable Authority
14 August 2012
Disclosures and legal compliance>Board’s endorsement of key performance indicators tBack Contents Forwardu

Swan River Trust Annual Report 2011-12 37
Summary of key performance indicatorsThe following table illustrates the relationship between the agency’s services and desired outcomes and the government goal it contributes to.
The key effectiveness indicators measure the extent of impact of the delivery of the service on the achievement of desired outcomes. The key efficiency indicators monitor the relationship between the service delivered and the resources used to produce the service.
Table 10: Summary of key performance indicators
Government goal - Social and Environmental Responsibility: Ensuring that economic activity is managed in a socially and environmentally responsible manner for the long-term benefit of the state
Desired outcomes Services Effectiveness performance indicators Efficiency performance indicators
The ecological health of the Swan Canning river system is protected and enhanced
Development and implementation of environmental management programs
The extent to which management water quality targets are achieved in the Swan and Canning rivers and catchments
Average cost of river monitoring per kilometre of river managed (approximately 156 kms)
Percentage of foreshores protected and rehabilitated in relation to total area
Average cost per square metre of foreshore undergoing protection and rehabilitation works
Communication of environmental information
Percentage of people attending environmental education programs who change their behaviours as a result
Average cost per person attending an environmental education program
The long-term community benefit of the Swan Canning river system is protected and enhanced
Statutory assessment of development proposals
Percentage of development recommendations which have attracted negative responses from the community
Average cost per application assessed
Riverpark management Percentage of developments audited in full compliance with approval conditions
Average cost of audit compliance
Average cost per tonne of waste removed
Disclosures and legal compliance>Summary of key performance indicators tBack Contents Forwardu
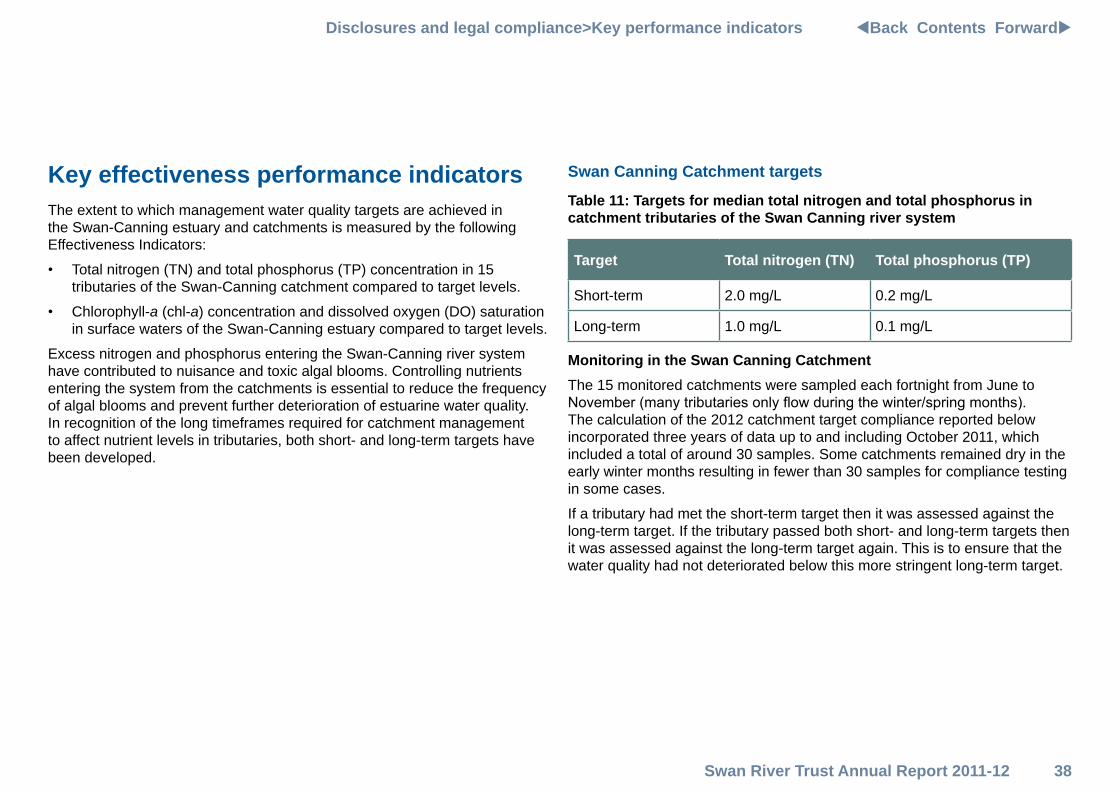
Swan River Trust Annual Report 2011-12 38
Key effectiveness performance indicatorsThe extent to which management water quality targets are achieved in the Swan-Canning estuary and catchments is measured by the following Effectiveness Indicators:
• Total nitrogen (TN) and total phosphorus (TP) concentration in 15 tributaries of the Swan-Canning catchment compared to target levels.
• Chlorophyll-a (chl-a) concentration and dissolved oxygen (DO) saturation in surface waters of the Swan-Canning estuary compared to target levels.
Excess nitrogen and phosphorus entering the Swan-Canning river system have contributed to nuisance and toxic algal blooms. Controlling nutrients entering the system from the catchments is essential to reduce the frequency of algal blooms and prevent further deterioration of estuarine water quality. In recognition of the long timeframes required for catchment management to affect nutrient levels in tributaries, both short- and long-term targets have been developed.
Swan Canning Catchment targets
Table 11: Targets for median total nitrogen and total phosphorus in catchment tributaries of the Swan Canning river system
Target Total nitrogen (TN) Total phosphorus (TP)
Short-term 2.0 mg/L 0.2 mg/L
Long-term 1.0 mg/L 0.1 mg/L
Monitoring in the Swan Canning CatchmentThe 15 monitored catchments were sampled each fortnight from June to November (many tributaries only flow during the winter/spring months). The calculation of the 2012 catchment target compliance reported below incorporated three years of data up to and including October 2011, which included a total of around 30 samples. Some catchments remained dry in the early winter months resulting in fewer than 30 samples for compliance testing in some cases.
If a tributary had met the short-term target then it was assessed against the long-term target. If the tributary passed both short- and long-term targets then it was assessed against the long-term target again. This is to ensure that the water quality had not deteriorated below this more stringent long-term target.
Disclosures and legal compliance>Key performance indicators tBack Contents Forwardu
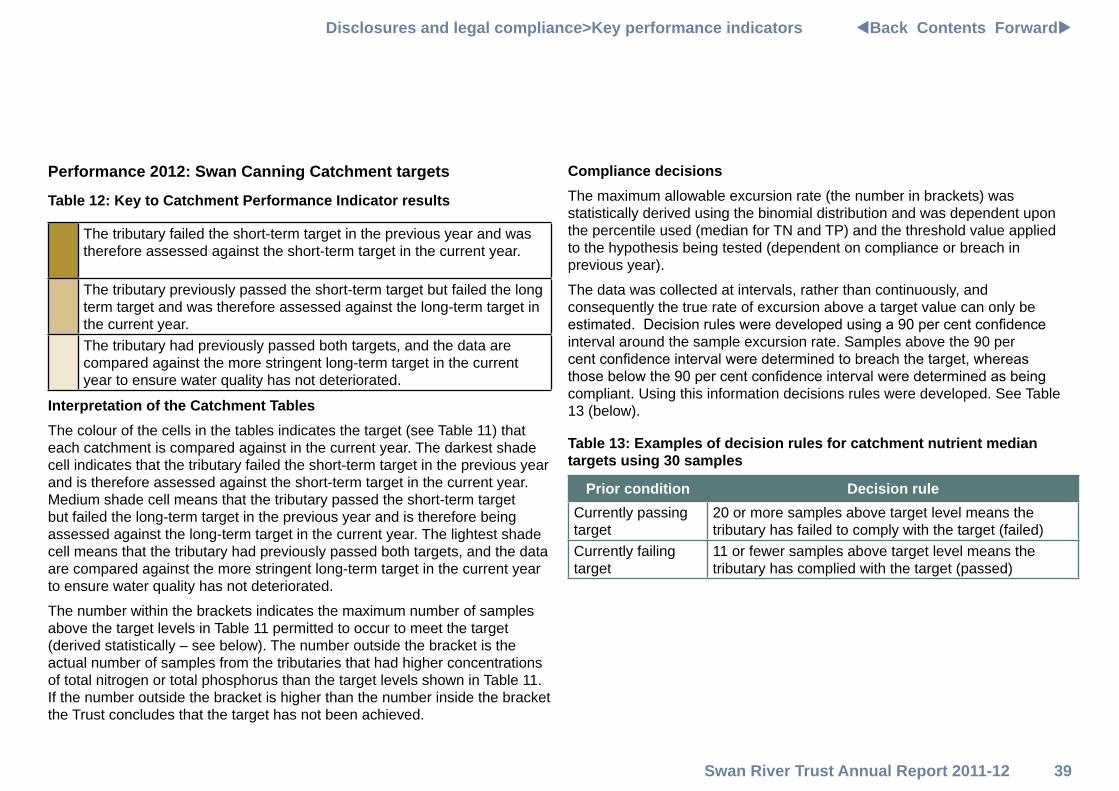
Swan River Trust Annual Report 2011-12 39
Performance 2012: Swan Canning Catchment targets
Table 12: Key to Catchment Performance Indicator results
The tributary failed the short-term target in the previous year and was therefore assessed against the short-term target in the current year.
The tributary previously passed the short-term target but failed the long term target and was therefore assessed against the long-term target in the current year.The tributary had previously passed both targets, and the data are compared against the more stringent long-term target in the current year to ensure water quality has not deteriorated.
Interpretation of the Catchment TablesThe colour of the cells in the tables indicates the target (see Table 11) that each catchment is compared against in the current year. The darkest shade cell indicates that the tributary failed the short-term target in the previous year and is therefore assessed against the short-term target in the current year. Medium shade cell means that the tributary passed the short-term target but failed the long-term target in the previous year and is therefore being assessed against the long-term target in the current year. The lightest shade cell means that the tributary had previously passed both targets, and the data are compared against the more stringent long-term target in the current year to ensure water quality has not deteriorated.
The number within the brackets indicates the maximum number of samples above the target levels in Table 11 permitted to occur to meet the target (derived statistically – see below). The number outside the bracket is the actual number of samples from the tributaries that had higher concentrations of total nitrogen or total phosphorus than the target levels shown in Table 11. If the number outside the bracket is higher than the number inside the bracket the Trust concludes that the target has not been achieved.
Compliance decisionsThe maximum allowable excursion rate (the number in brackets) was statistically derived using the binomial distribution and was dependent upon the percentile used (median for TN and TP) and the threshold value applied to the hypothesis being tested (dependent on compliance or breach in previous year).
The data was collected at intervals, rather than continuously, and consequently the true rate of excursion above a target value can only be estimated. Decision rules were developed using a 90 per cent confidence interval around the sample excursion rate. Samples above the 90 per cent confidence interval were determined to breach the target, whereas those below the 90 per cent confidence interval were determined as being compliant. Using this information decisions rules were developed. See Table 13 (below).
Table 13: Examples of decision rules for catchment nutrient median targets using 30 samples
Prior condition Decision ruleCurrently passing target
20 or more samples above target level means the tributary has failed to comply with the target (failed)
Currently failing target
11 or fewer samples above target level means the tributary has complied with the target (passed)
Disclosures and legal compliance>Key performance indicators tBack Contents Forwardu

Swan River Trust Annual Report 2011-12 40
Table 14: Compliance of monitored tributaries discharging into the Swan Canning estuary with short-term and long-term total nitrogen targets
Tributary 2008 2009 2010 2011 2012
Ellen Brook (18) 20 (10) 16 (10) 20 (9) 16 (8) 17
Mills Street Main Drain (12) 25 (12) 25 (12) 26 (12) 25 (12) 21
Bannister Creek (12) 27 (12) 25 (12) 25 (12) 27 (12) 28
Bayswater Main Drain (12) 21 (12) 24 (12) 26 (12) 27 (12) 27
Southern River (12) 18 (12) 16 (12) 24 (12) 27 (12) 29
Bickley Brook (12) 20 (12) 20 (12) 22 (12) 16 (12) 14
Bennett Brook (11) 17 (12) 19 (12) 25 (12) 29 (12) 26
Yule Brook (21) 19 (21) 19 (21) 17 (21) 10 (21) 9
Blackadder Creek (20) 14 (20) 14 (21) 18 (18) 14 (18) 15
Canning River (21) 3 (21) 3 (21) 5 (21) 4 (21) 5
Helena River (20) 11 (20) 11 (19) 10 (17) 6 (15) 6
South Belmont Main Drain (21) 5 (21) 5 (21) 5 (21) 5 (21) 2
Avon River (21) 13 (21) 12 (21) 17 (21) 15 (21) 18
Susannah Brook (17) 8 (15) 5 (17) 7 (15) 5 (14) 10
Jane Brook (19) 5 (19) 5 (20) 8 (18) 7 (16) 10
Short-term target met (%) 93 93 93 93 93
Long-term target met (%) 53 53 53 53 53
Table 15: Compliance of monitored tributaries discharging into the Swan Canning estuary with short-term and long-term total phosphorus targets
Tributary 2008 2009 2010 2011 2012
Ellen Brook (10) 25 (10) 23 (10) 25 (9) 24 (8) 23
Mills Street Main Drain (12) 26 (12) 27 (12) 29 (12) 26 (12) 18
Southern River (12) 18 (12) 17 (12) 22 (12) 24 (12) 25
South Belmont Main Drain (12) 10 (21) 7 (21) 11 (21) 19 (21) 18
Bannister Creek (21) 7 (21) 5 (21) 2 (21) 3 (21) 4
Yule Brook (21) 11 (21) 10 (21) 5 (21) 3 (21) 6
Bayswater Main Drain (21) 4 (21) 2 (21) 0 (21) 0 (21) 1
Bickley Brook (21) 2 (21) 1 (21) 1 (21) 1 (21) 1
Blackadder Creek (20) 0 (20) 1 (21) 1 (18) 1 (18) 0
Jane Brook (19) 0 (19) 0 (20) 0 (18) 0 (16) 0
Avon River (21) 1 (21) 0 (21) 0 (21) 0 (21) 0
Bennett Brook (21) 2 (21) 1 (21) 0 (21) 1 (21) 0
Canning River (21) 1 (21) 0 (21) 0 (21) 0 (21) 0
Helena River (20) 0 (20) 0 (19) 0 (17) 0 (15) 0
Susannah Brook (17) 0 (15) 0 (17) 0 (15) 0 (14) 0
Short-term target met (%) 93 93 93 93 93
Long-term target met (%) 80 80 80 80 80
Disclosures and legal compliance>Key performance indicators tBack Contents Forwardu

Swan River Trust Annual Report 2011-12 41
Catchment Results 2008-2012Total nitrogen concentration Prior to 2008 all tributaries achieved the short-term target and were assessed against the long-term target, but in 2008 Ellen Brook failed to maintain compliance with its short-term target. It was then assessed against the short-term target for the first time in 2009 and the catchment appears unlikely to achieve the short-term TN target in the foreseeable future.
In 2008, 53 per cent of the monitored tributaries were meeting the long-term compliance target, and that has continued to the present.
Total phosphorus concentrationFrom 2008 to present, 93 per cent of tributaries have met the short-term target. Ellen Brook was the only tributary where P concentrations were higher than the short-term target.
Since 2008, 80 per cent of the monitored tributaries have complied with the long-term TP target.
The nitrogen and phosphorus concentrations in the Swan-Canning tributaries range from low to high and have generally remained steady over the 2008 to 2012 reporting period.
These results are encouraging, however there is the possibility that one influencing factor is the reduction of total annual rainfall in recent years. This has most likely reduced the amount of nutrients entering the Swan-Canning tributaries from the catchments. The trend is likely to continue, with predictions of significantly less rainfall in the Swan Canning Catchment and further reduction of flow in the short-term (20 years) and longer-term (70 years). This was evident recently with 2010 being a very dry year resulting in the Swan River (January to October 2010) experiencing the lowest stream flows on record (1975 to present).
It is significant that phosphorus levels in Ellen Brook remain high. This tributary discharges directly into the upper Swan River during the winter months and has a significant influence on phytoplankton growth in the middle and upper basins of the Swan River estuary. The 2012 data suggest that Ellen Brook is unlikely to meet the short-term target soon, with all of the 23 samples used to calculate target compliance having TP concentrations greater than 0.2 mg/L.
Disclosures and legal compliance>Key performance indicators tBack Contents Forwardu
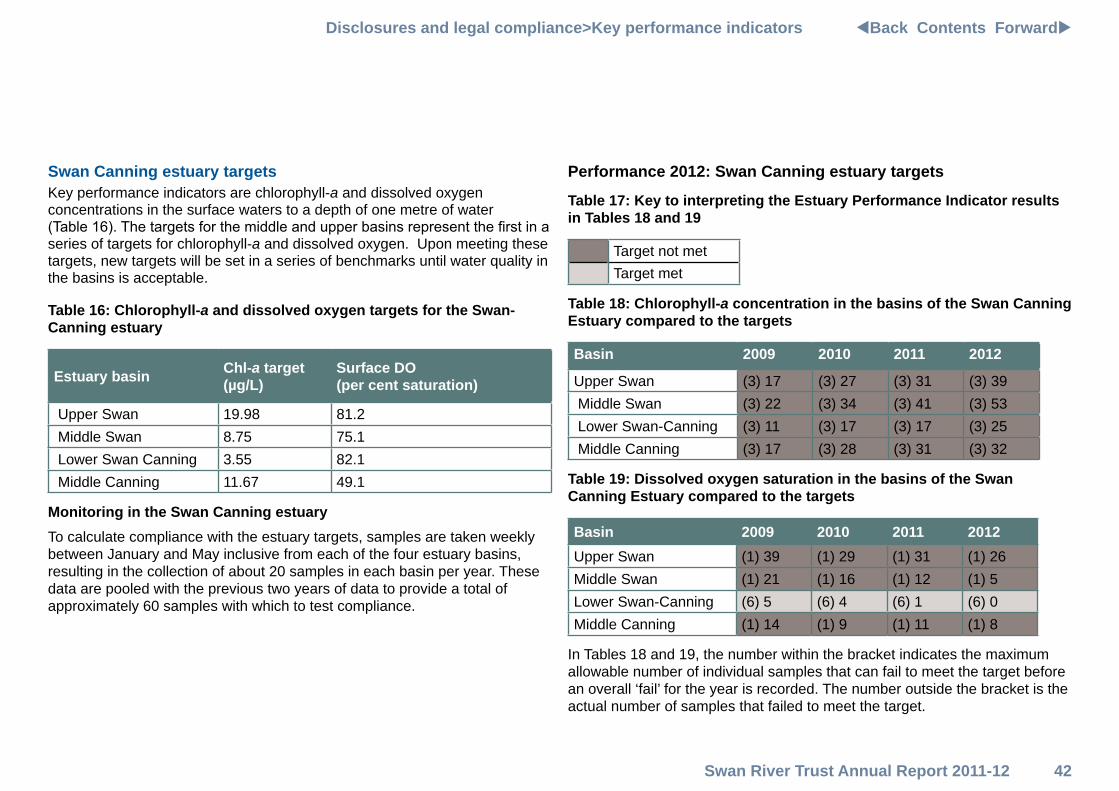
Swan River Trust Annual Report 2011-12 42
Swan Canning estuary targetsKey performance indicators are chlorophyll-a and dissolved oxygen concentrations in the surface waters to a depth of one metre of water (Table 16). The targets for the middle and upper basins represent the first in a series of targets for chlorophyll-a and dissolved oxygen. Upon meeting these targets, new targets will be set in a series of benchmarks until water quality in the basins is acceptable.
Table 16: Chlorophyll-a and dissolved oxygen targets for the Swan-Canning estuary
Estuary basin Chl-a target (µg/L)
Surface DO (per cent saturation)
Upper Swan 19.98 81.2 Middle Swan 8.75 75.1 Lower Swan Canning 3.55 82.1 Middle Canning 11.67 49.1
Monitoring in the Swan Canning estuaryTo calculate compliance with the estuary targets, samples are taken weekly between January and May inclusive from each of the four estuary basins, resulting in the collection of about 20 samples in each basin per year. These data are pooled with the previous two years of data to provide a total of approximately 60 samples with which to test compliance.
Performance 2012: Swan Canning estuary targets
Table 17: Key to interpreting the Estuary Performance Indicator results in Tables 18 and 19
Target not metTarget met
Table 18: Chlorophyll-a concentration in the basins of the Swan Canning Estuary compared to the targets
Basin 2009 2010 2011 2012
Upper Swan (3) 17 (3) 27 (3) 31 (3) 39 Middle Swan (3) 22 (3) 34 (3) 41 (3) 53 Lower Swan-Canning (3) 11 (3) 17 (3) 17 (3) 25 Middle Canning (3) 17 (3) 28 (3) 31 (3) 32
Table 19: Dissolved oxygen saturation in the basins of the Swan Canning Estuary compared to the targets
Basin 2009 2010 2011 2012Upper Swan (1) 39 (1) 29 (1) 31 (1) 26Middle Swan (1) 21 (1) 16 (1) 12 (1) 5Lower Swan-Canning (6) 5 (6) 4 (6) 1 (6) 0Middle Canning (1) 14 (1) 9 (1) 11 (1) 8
In Tables 18 and 19, the number within the bracket indicates the maximum allowable number of individual samples that can fail to meet the target before an overall ‘fail’ for the year is recorded. The number outside the bracket is the actual number of samples that failed to meet the target.
Disclosures and legal compliance>Key performance indicators tBack Contents Forwardu

Swan River Trust Annual Report 2011-12 43
Estuary Results 2009 - 2012Interpreting the Estuary TablesThe monitoring data from each of the estuary basins are compared to the targets in Table 16. There are only two possible outcomes, pass or fail. Dark cells in Tables 18 and 19 indicate that the target was not met, where as light cells indicate that the target was achieved. Note that for chlorophyll-a, a region failed when a sample had a higher concentration than the target while for dissolved oxygen, a region failed when a sample had a lower concentration than the target.
Chlorophyll-a concentrationThe lower basin of the Swan Canning estuary failed the chlorophyll-a target for the first time in 2008. This basin has continued to fail the target since then (Table 18). The middle and upper basin of the Swan River estuary and the middle basin of the Canning estuary failed to meet the target in all four years.
Oxygen saturationThe lower basin of the Swan Canning estuary met the dissolved oxygen target in every year evaluated (Table 19). The upper and middle Swan, and the middle Canning, failed to meet the dissolved oxygen targets in all four years.
The targets for the lower estuary were developed so that they could be met under the conditions experienced at the time of approval in 2001. Failing these targets indicates that the water quality has deteriorated. Since the lower basin of the Swan Canning estuary failed to meet the chlorophyll-a target in 2008, compliance is now assessed using a different decision rule, under which the basin is expected to fail the chlorophyll-a target until there is an improvement in water quality.
Dissolved oxygen and chlorophyll-a concentrations in the middle basins of the Swan and Canning estuary, the upper basin of the Swan River estuary and chlorophyll-a in the lower basin, are currently unacceptable in terms of these targets. These basins are expected to fail their targets until there is an improvement in water quality above the conditions experienced at the time the targets were set.
Algal biomass and dissolved oxygen concentrations in the summer are strongly influenced by the seasonal and long-term store of nutrients in the estuarine sediments.
A reduction in algal blooms and the restoration of bottom water dissolved oxygen levels in the estuary will largely depend on the capacity to reduce the sediment store of nutrients. Consequently, there will most likely be a time lag between implementing appropriate management actions and observing the desired change in the estuary.
Disclosures and legal compliance>Key performance indicators tBack Contents Forwardu

Swan River Trust Annual Report 2011-12 44
Key effectiveness performance indicator
Table 20: Percentage of foreshore protected and rehabilitated in relation to total area
2010-11 Actual 2011-12 Target 2011-12 Actual
2.25% 0.9% 2.1%
InterpretationThe Trust has an important role in facilitating foreshore protection and rehabilitation. It provides operational work capacity, technical expertise and grant funding for foreshore plans and rehabilitation projects undertaken by state and local government land managers in partnership with community groups. This work contributes significantly to mitigating riverbank erosion, restoring foreshore vegetation and protecting associated ecological aesthetic and social values.
This indicator measures the percentage of the total foreshore area subject to management effort during the year. The total foreshore area is 22,282,198 m² In 2011-12 an estimated area of 192,740 m² or 0.86 per cent of foreshore was to receive some form of management effort facilitated by the Trust. The actual area was significantly higher being 474,829 m² or 2.1 per cent of the total area. This is due to the fact the majority of foreshore on restoration projects facilitated through the Riverbank Grants Scheme during 2011-12 were revegetation and natural shoreline restoration projects which are considerably less expensive than river walling projects which can cost up to $8,000 per linear metre.
Disclosures and legal compliance>Key performance indicators tBack Contents Forwardu

Swan River Trust Annual Report 2011-12 45
Key effectiveness performance indicator
Table 21: Percentage of people attending environmental education programs who change their behaviours as a result
2010-11 Actual 2011-12 Target 2011-2012 Actual
67.5% 70% 71.9%
The Trust’s Community Engagement Program delivers environmental education projects that provide the Perth community with the tools and information to change their behaviour to help protect the Swan Canning Riverpark.
The Great Gardens Workshop program is the most effective of these and is used as the effectiveness indicator for the entire program.
During 2011-12 the Trust funded 16 Great Gardens workshops that were attended by 1,442 people. These included 12 Trust workshops and four special workshops in Bennett Springs and Ellenbrook. The Trust funding leveraged a further 64 workshops attended by 8,127 people.
Great Gardens workshop participants who were surveyed and underwent home audits demonstrated a 71.9 per cent river wise behaviour change as compared to 67.5 per cent the previous year. When compared to average behaviour change rates of 30-40 per cent, it would appear the Great Gardens workshop program has effectively empowered the community towards sustainable behaviour adoption. The Great Gardens behaviour change surveys were sent to 1026 participants. Of these, 157 participants (15%) responded within the two-week time limit for the surveys to be evaluated.
Since 2003 more than 29,000 people have attended one of the 323 Great Garden workshops funded by the Trust. The Trust continues to work closely with Great Gardens to continually improve and refine the workshop program to ensure key messages are delivered, including the new messages and delivery mechanisms that have been identified through research/focus groups with external experts.
The Trust Strategic Plan (2010-15) outlines a Communications KPI to provide community education and involvement leading to behaviour change. The Trust will continue to work with our specialist behaviour change team to positively influence participants attending these workshops. The Trust also endeavours to effect ‘river-friendly’ behavioural change through a variety of RiverWise workshops and community engagement projects delivered through the River Guardians program.
The Communications Branch recently completed some important formative research for a behaviour change pilot program (a planned program achievement contained within the Trust’s 2011-12 Business Plan) with the help of independent consultants. This has enabled the Trust to produce a Behavioural Change Strategy designed to deliver river-focused behavioural change in Bennett Springs in 2012-14.
Importantly, a comprehensive community survey has also been completed for the Trust by independent researchers. The survey was created in close consultation with behavioural economist and the Trust’s Technical Advisory Panel member, Colin Ashton-Graham. Researchers undertook 8-10 minute telephone surveys and sampled residents across the Swan Canning Catchment (in line with recent ABS statistics). This research has enabled the Trust to obtain some baseline data before commencing its pilot behaviour change project in Bennett Springs.
The focus group and survey results will help further strengthen the Trust’s behaviour change key performance indicator and will inform the Trust on current levels of brand awareness, knowledge, attitudes and community perceptions surrounding fertiliser and water use. These metrics will then be used to measure the future successes of the Trust’s Community Engagement Program.
Disclosures and legal compliance>Key performance indicators tBack Contents Forwardu

Swan River Trust Annual Report 2011-12 46
Key effectiveness performance indicator
Table 22: Percentage of development recommendations which have attracted negative responses from the community
2010-11 Actual 2011-12 Target 2011-12 Actual6% 2% 0%
In accordance with Part 5 of the Swan and Canning Rivers Management Act 2006, draft reports on proposed developments are approved by the Trust for comment by the public. The draft reports are published on the Trust website for three weeks to allow for this to occur. The process allows the Trust to consider the public’s response to the decisions it makes before a final recommendation is made to the Minister. Importantly it allows the Trust to gauge its alignment with community values on development matters within the Development Control Area.
In 2011-12, 18 applications were determined under Part 5 and none of those attracted a negative response from the community. This is reflected in the zero per cent measure recorded in Table 22.
Key effectiveness performance indicator
Table 23: Percentage of developments audited in full compliance with approval conditions
2010-11 Actual 2011-12 Target 2011-12 Actual74% 100% 69%
The effectiveness of the Trust’s development control process is measured as a percentage of developments found to be complying with those approval conditions relevant at the time of audit.
Of the 293 compliance actions conducted on developments approved under Part 5 of the Act, or by way of permit under the Swan and Canning River Management Regulations 2007, 91 were found to be non-compliant with one or more relevant approval conditions at the time of the compliance action.
There was an increase in the number of audit actions carried out from 257 in 2010-11 to 293 in 2011-12. The percentage in full compliance was slightly lower at 69 per cent compared to 74 per cent in the previous year.
In addition to the audits carried out on Trust approvals, 67 compliance audits were also carried out on projects approved by local governments or the Western Australian Planning Commission with advice and conditions recommended by the Trust. Of those projects 80 per cent of audits revealed full compliance with conditions recommended by the Trust.
Disclosures and legal compliance>Key performance indicators tBack Contents Forwardu

Swan River Trust Annual Report 2011-12 47
Key efficiency performance indicatorsThe Trust’s key efficiency performance indicators are calculated to include appropriated corporate costs and other costs not directly attributed to the specific service.
Table 24: Key efficiency performance indicators
Desired outcomes Services Key efficiency performance
indicators
2010-11 Actual $
2011-12 Target $
2011-12 Actual $
Comments
The ecological health of the Swan Canning river system is protected and enhanced
Development and implementation of environmental management programs
Average cost of river monitoring per kilometre of river managed (approximately 156 kms)
560 534 772 The difference is due to projects being completed earlier than expected, resulting in higher grant acquittals.
Average cost per square metre of foreshore undergoing protection and rehabilitation works
16.14 29.21 7.05
The cost per square meter of foreshore rehabilitated can change significantly depending on the type of work being completed. In 2010-11 the Trust focused effort on river walling which can cost up to $8,000 per linear meter. This was thought to continue in 2011-12 however Riverbank Grants focused on revegetation projects which is significantly cheaper and covers a larger area reducing cost per square metre.
Communication of environmental information
Average cost per person attending an environmental education program
532 1,249 1,072 Increased attendance at workshops have led to cost efficiencies.
The long-term community benefit of the Swan Canning river system is protected and enhanced
Statutory assessment of development proposals
Average cost per application assessed 3,629 4,317 3,972 Target was met by continued refinement of processes which
led to cost efficiencies.
Riverpark management
Average cost of audit compliance 379 600 401 The continued use of an efficient tracking and recording
system has maintained the cost effectiveness of this process.
Average cost per tonne of waste removed 158,520 16,450 39,244
The budget average cost per tonne of waste removed for 2011-12 was based on estimate of 140 tonnes being removed. Actual waste removed was only 65 tonnes. This can be attributed to changed collection method of weed which is now stockpiled on the foreshore and allowed to dry out prior to collection reducing the weight of weed therefore decreasing total amount and increasing cost per tonne to remove.
Disclosures and legal compliance>Key performance indicators tBack Contents Forwardu

Swan River Trust Annual Report 2011-12 48
Certification of Financial Statements for the year ended 30 June 2012The accompanying financial statements of the Swan River Trust have been prepared in compliance with the provisions of the Financial Management Act 2006 from proper accounts and records to present fairly the financial transactions for the financial year ended 30 June 2012 and the financial position as at 30 June 2012.At the date of signing we are not aware of any circumstances which would render the particulars included in the financial statements misleading or inaccurate.
K. Rogers M. Poole D. MaierChief Finance Officer Chairperson Member Date: 14 August 2012 Date: 14 August 2012 Date: 14 August 2012
Financial statements

Swan River TrustFinancial Statements for the year ended 30 June 2012
Swan River Trust Annual Report 2011-12 49
SWAN RIVER TRUST
STATEMENT OF COMPREHENSIVE INCOMEFOR THE YEAR ENDED 30 JUNE 2012
Note 2012 2011$ $
COST OF SERVICESExpensesEmployee benefits expense 4 5,198,064 4,941,792Supplies and services 5 3,813,293 3,564,626Depreciation and amortisation expense 6 202,251 128,953Accommodation expenses 7 624,680 576,490Other expenses 8 161,090 196,743Grants and subsidies 9 6,093,518 8,604,483Total cost of services 16,092,896 18,013,087
IncomeRevenueCommonwealth grants and contributions 10 531,100 450,848Grants and contributions 11 3,079,006 4,597,034Other revenue 12 15,698 126,459Total revenue 3,625,804 5,174,341
GainsGain on disposal of non-current assets 13 68,182 21,906
Total income other than income from State Government 3,693,986 5,196,247
NET COST OF SERVICES 12,398,910 12,816,840
Income from State Government 14Service appropriation 11,249,000 12,179,000Resources received free of charge 95,430 26,511
Total income from State Government 11,344,430 12,205,511SURPLUS/(DEFICIT) FOR THE PERIOD (1,054,480) (611,329)
OTHER COMPREHENSIVE INCOMEChanges in asset revaluation surplus 24 513,000 - Total other comprehensive income 513,000 -
TOTAL COMPREHENSIVE INCOME FOR THE PERIOD (541,480) (611,329)
See also note 36 'Schedule of Income and Expenses by Service'.The Statement of Comprehensive Income should be read in conjunction with the accompanying notes.
1
SWAN RIVER TRUST
STATEMENT OF FINANCIAL POSITIONAS AT 30 JUNE 2012
Note 2012 2011$ $
ASSETSCurrent AssetsCash and cash equivalents 25 1,956,856 2,260,633Restricted cash and cash equivalents 15 1,115,404 1,452,364Receivables 16 235,619 435,628Prepayments 17 3,710,202 4,451,476Amounts receivable for services 18 180,000 68,000Total Current Assets 7,198,081 8,668,101Non-current AssetsAmounts receivable for services 18 265,000 331,000Property, plant and equipment 19 22,293,377 21,443,829Intangible assets 20 45,939 85,346Total Non-current Assets 22,604,316 21,860,175
TOTAL ASSETS 29,802,397 30,528,276
LIABILITIESCurrent LiabilitiesPayables 22 218,669 359,062Other current liabilities 23 435,607 479,613Total Current Liabilities 654,276 838,675
TOTAL LIABILITIES 654,276 838,675
NET ASSETS 29,148,121 29,689,601
EQUITY 24Contributed equity 20,735,600 20,735,600Reserves 513,000 - Accumulated surplus 7,899,521 8,954,001TOTAL EQUITY 29,148,121 29,689,601
The Statement of Financial Position should be read in conjunction with the accompanying notes. 2
See also note 36 ‘Schedule of Income and Expenses by Service’.The Statement of Comprehensive Income should be read in conjunction with the accompanying notes.
The Statement of Financial Position should be read in conjunction with the accompanying notes.

Swan River TrustFinancial Statements for the year ended 30 June 2012
Swan River Trust Annual Report 2011-12 50
SWAN RIVER TRUST
STATEMENT OF CHANGES IN EQUITYFOR THE YEAR ENDED 30 JUNE 2012
Contributed Reserves AccumulatedNote equity surplus Total equity
$ $ $ $
Balance at 1 July 2010 24 325,500 - 9,565,330 9,890,830
Total comprehensive income for the period - - (611,329) (611,329)Transactions with owners in their capacityas owners: Transfer of net assets from owners 20,410,100 - - 20,410,100
Balance at 30 June 2011 20,735,600 - 8,954,001 29,689,601
Balance at 1 July 2011 20,735,600 - 8,954,001 29,689,601
Surplus/(deficit) - - (1,054,480) (1,054,480)Other comprehensive income - 513,000 - 513,000
Total comprehensive income for the period - 513,000 (1,054,480) (541,480)
Balance at 30 June 2012 20,735,600 513,000 7,899,521 29,148,121
The Statement of Changes in Equity should be read in conjunction with the accompanying notes. 3
The Statement of Changes in Equity should be read in conjunction with the accompanying notes.

Swan River TrustFinancial Statements for the year ended 30 June 2012
Swan River Trust Annual Report 2011-12 51
SWAN RIVER TRUST
STATEMENT OF CASH FLOWSFOR THE YEAR ENDED 30 JUNE 2012
Note 2012 2011$ $
CASH FLOWS FROM STATE GOVERNMENTService appropriation 11,135,000 12,075,000Holding account drawdowns 68,000 143,000Net cash provided by State Government 11,203,000 12,218,000
Utilised as follows :CASH FLOWS FROM OPERATING ACTIVITIESPaymentsEmployee benefits (5,262,350) (4,977,138)Supplies and services (3,754,699) (3,449,293)Grants and subsidies (5,451,942) (7,925,575)Accommodation (624,680) (576,490)GST payments on purchases (890,998) (1,106,930)GST payments to the taxation authority - (62,027)Other payments (163,737) (194,096)
ReceiptsCommonwealth grants and contributions 665,100 396,848Grants and contributions 3,035,000 5,035,175GST receipts on sales 86,690 254,921GST receipts from the taxation authority 943,617 972,768Other receipts 5,472 146,818Net cash used in operating activities 25 (11,412,527) (11,485,019)
CASH FLOWS FROM INVESTING ACTIVITIESPaymentsPurchase of non-current physical assets (499,392) (306,715)ReceiptsProceeds from the sale of non-current physical assets 68,182 108,900Net cash used in investing activities (431,210) (197,815)Net increase in cash and cash equivalents (640,737) 535,166
Cash and cash equivalents at the beginning of the period 3,712,997 3,177,831
25 3,072,260 3,712,997CASH AND CASH EQUIVALENTS AT THE END OF THE PERIOD
The Statement of Cash Flows should be read in conjunction with the accompanying notes. 4
The Statement of Cash Flows should be read in conjunction with the accompanying notes.

Swan River TrustNotes to Financial Statements for the year ended 30 June 2012
Swan River Trust Annual Report 2011-12 52
SWAN RIVER TRUST
NOTES TO THE FINANCIAL STATEMENTS FOR THE YEAR ENDED 30 JUNE 2012
1 AUSTRALIAN ACCOUNTING STANDARDS
General
The Trust’s financial statements for the year ended 30 June 2012 have been prepared in accordance with Australian Accounting Standards. The term ‘Australian Accounting Standards’ includes Standards and Interpretations issued by the Australian Accounting Standard Board (AASB).
The Trust has adopted any applicable, new and revised Australian Accounting Standards from their operative dates.
Early adoption of standards
The Trust cannot early adopt an Australian Accounting Standard unless specifically permitted by Treasurer’s Instruction TI 1101 Application of Australian Accounting Standards and Other Pronouncements. There has been no early adoption of Australian Accounting Standards that have been issued or amended (but not operative) by the Trust for the annual reporting period ended 30 June 2012.
2 SUMMARY OF SIGNIFICANT ACCOUNTING POLICIES
(a) General statement
The Trust is a not-for-profit reporting entity that prepares general purpose financial statements in accordance with Australian Accounting Standards, the Framework, Statements of Accounting Concepts and other authoritative pronouncements of the AASB as applied by the Treasurer’s instructions. Several of these are modified by the Treasurer’s instructions to vary application, disclosure, format and wording.
The Financial Management Act and the Treasurer’s instructions impose legislative provisions that govern the preparation of financial statements and take precedence over Australian Accounting Standards, the Framework, Statements of Accounting Concepts and other authoritative pronouncements of the AASB.
Where modification is required and has had a material or significant financial effect upon the reported results, details of that modification and the resulting financial effect are disclosed in the notes to the financial statements.
5
tBack to Financial Statements
Swan River TrustNotes to Financial Statements for the year ended 30 June 2012
Swan River Trust Annual Report 2011-12 53
SWAN RIVER TRUST
NOTES TO THE FINANCIAL STATEMENTS FOR THE YEAR ENDED 30 JUNE 2012
(b) Basis of preparation
The financial statements have been prepared on the accrual basis of accounting using the historical cost convention, except for land and buildings which have been measured at fair value.
The accounting policies adopted in the preparation of the financial statements have been consistently applied throughout all periods presented unless otherwise stated.
The financial statements are presented in Australian dollars and all values are rounded to the nearest dollar.
(c) Reporting entity
The reporting entity comprises the Trust and entities listed at note 34 ‘Related and Affiliated Bodies’.
(d) Contributed equity
AASB Interpretation 1038 Contributions by Owners Made to Wholly-Owned Public Sector Entities requires transfers in the nature of equity contributions, other than as a result of a restructure of administrative arrangements, to be designated by the Government (the owner) as contributions by owners (at the time of, or prior to transfer) before such transfers can be recognised as equity contributions. Capital contributions have been designated as contributions by owners by TI 955 Contributions by Owners made to Wholly-Owned Public Sector Entities and have been credited directly to Contributed equity.
The transfers of net assets to/from other agencies, other than as a result of a restructure of administrative arrangements, are designated as contributions by owners where the transfers are non-discretionary and non-reciprocal.
(e) Income
Revenue recognitionRevenue is recognised and measured at the fair value of consideration received or receivable. The following specific recognition criteria must also be met before revenue is recognised for the major business activities as follows:
Sale of goods Revenue is recognised from the sale of goods and disposal of other assets when the significant risks and rewards of ownership transfer to the purchaser and can be measured reliably.
Provision of services Revenue is recognised by reference to the stage of completion of the transaction.
6
tBack to Financial Statements

Swan River TrustNotes to Financial Statements for the year ended 30 June 2012
Swan River Trust Annual Report 2011-12 54
SWAN RIVER TRUST
NOTES TO THE FINANCIAL STATEMENTS FOR THE YEAR ENDED 30 JUNE 2012
InterestRevenue is recognised as the interest accrues.
Service appropriations Service Appropriations are recognised as revenues at fair value in the period in which the Trust gains control of the appropriated funds. The Trust gains control of appropriated funds at the time those funds are deposited to the bank account or credited to the ‘Amounts receivables for services’ (holding account) held at Treasury.
Grants, donations, gifts and other non-reciprocal contributions Revenue is recognised at fair value when the Trust obtains control over the assets comprising the contributions, usually when cash is received.
Other non-reciprocal contributions that are not contributions by owners are recognised at their fair value. Contributions of services are only recognised when a fair value can be reliably determined and the services would be purchased if not donated.
GainsRealised and unrealised gains are usually recognised on a net basis. These include gains arising on the disposal of non-current assets and some revaluations of non-current assets.
(f) Property, plant and equipment
Capitalisation/Expensing of assetsItems of property, plant and equipment costing $5,000 or more are recognised as assets and the cost of utilising assets is expensed (depreciated) over their useful lives. Items of property, plant and equipment costing less than $5,000 are immediately expensed direct to the Statement of Comprehensive Income (other than where they form part of a group of similar items which are significant in total).
Initial recognition and measurementAll items of property, plant and equipment are initially recognised at cost.
For items of property, plant and equipment acquired at no cost or for nominal cost, the cost is the fair value at the date of acquisition.
Subsequent measurementSubsequent to initial recognition as an asset, the revaluation model is used for the measurement of land and buildings and historical cost for all other property, plant and equipment. Land and buildings are carried at fair value less accumulated depreciation (buildings only) and accumulated impairment losses. All other items of property, plant and equipment are stated at historical cost less accumulated depreciation and accumulated impairment losses.
7
tBack to Financial Statements

Swan River TrustNotes to Financial Statements for the year ended 30 June 2012
Swan River Trust Annual Report 2011-12 55
SWAN RIVER TRUST
NOTES TO THE FINANCIAL STATEMENTS FOR THE YEAR ENDED 30 JUNE 2012
Where market-based evidence is available, the fair value of land and buildings is determined on the basis of current market buying values determined by reference to recent market transactions. When buildings are revalued by reference to recent market transactions, the accumulated depreciation is eliminated against the gross carrying amount of the asset and the net amount restated to the revalued amount.
In the absence of market-based evidence, fair value of land and buildings is determined on the basis of existing use. This normally applies where buildings are specialised or where land use is restricted. Fair value for existing use assets is determined by reference to the cost of replacing the remaining future economic benefits embodied in the asset, i.e. the depreciated replacement cost. Where the fair value of buildings is determined on the depreciated replacement cost basis, the gross carrying amount and the accumulated depreciation are restated proportionately.
Land and buildings are independently valued annually by the Western Australian Land Information Authority (Valuation Services) and recognised annually to ensure that the carrying amount does not differ materially from the asset’s fair value at the end of the reporting period.
The most significant assumptions in estimating fair value are made in assessing whether to apply the existing use basis to assets and in determining estimated useful life. Professional judgment by the valuer is required where the evidence does not provide a clear distinction between market type assets and existing use assets.
DerecognitionUpon disposal or derecognition of an item of property, plant and equipment, any revaluation surplus relating to that asset is retained in the asset revaluation surplus.
Asset revaluation surplusThe asset revaluation surplus is used to record increments and decrements on the revaluation of non-current assets as described in note 19 ‘Property, plant and equipment’.
DepreciationAll non-current assets having a limited useful life are systematically depreciated over their estimated useful lives in a manner that reflects the consumption of their future economic benefits.
Land is not depreciated. Depreciation on other assets is calculated using the straight line method, using rates which are reviewed annually. Estimated useful lives for each class of depreciable asset are:
Plant and equipment 5 to 20 years Information technology assets 2 to 4 years Furniture and fittings 7 to 10 years
8
tBack to Financial Statements

Swan River TrustNotes to Financial Statements for the year ended 30 June 2012
Swan River Trust Annual Report 2011-12 56
SWAN RIVER TRUST
NOTES TO THE FINANCIAL STATEMENTS FOR THE YEAR ENDED 30 JUNE 2012
(g) Intangible Assets
Capitalisation/expensing of assetsAcquisitions of intangible assets costing $5,000 or more and internally generated intangible assets costing $25,000 or more are capitalised. The cost of utilising the assets is expensed (amortised) over their useful life. Costs incurred below these thresholds are immediately expensed directly to the Statement of Comprehensive Income.
Intangible assets are initially recognised at cost. For assets acquired at no cost or for nominal cost, the cost is their fair value at the date of acquisition.
The cost model is applied for subsequent measurement requiring the asset to be carried at cost less any accumulated amortisation and accumulated impairment losses.
Amortisation for intangible assets with finite useful lives is calculated for the period of the expected benefit (estimated useful life which is reviewed annually) on the straight line basis. All intangible assets controlled by the Trust have a finite useful life and zero residual value.
The expected useful lives for each class of intangible asset are: Software(a) 2 to 5 years
(a) Software that is not integral to the operation of any related hardware
Computer softwareSoftware that is an integral part of the related hardware is recognised as property, plant and equipment. Software that is not an integral part of the related hardware is recognised as an intangible asset. Software costing less than $5,000 is expensed in the year of acquisition.
(h) Impairment of assets
Property, plant and equipment and intangible assets are tested for any indication of impairment at the end of each reporting period. Where there is an indication of impairment, the recoverable amount is estimated. Where the recoverable amount is less than the carrying amount, the asset is considered impaired and is written down to the recoverable amount and an impairment loss is recognised. As the Trust is a not-for-profit entity, unless an asset has been identified as a surplus asset, the recoverable amount is the higher of an asset’s fair value less costs to sell and depreciated replacement cost.
The risk of impairment is generally limited to circumstances where an asset’s depreciation is materially understated, where the replacement cost is falling or where there is a significant change in useful life. Each relevant class of assets is reviewed annually to verify that the accumulateddepreciation/amortisation reflects the level of consumption or expiration of the asset’s future economic benefits and to evaluate any impairment risk from falling replacement costs.
9
tBack to Financial Statements

Swan River TrustNotes to Financial Statements for the year ended 30 June 2012
Swan River Trust Annual Report 2011-12 57
SWAN RIVER TRUST
NOTES TO THE FINANCIAL STATEMENTS FOR THE YEAR ENDED 30 JUNE 2012
Intangible assets with an indefinite useful life and intangible assets not yet available for use are tested for impairment at the end of each reporting period irrespective of whether there is any indication of impairment.
The recoverable amount of assets identified as surplus assets is the higher of fair value less costs to sell and the present value of future cash flows expected to be derived from the asset. Surplus assets carried at fair value have no risk of material impairment where fair value is determined by reference to market-based evidence. Where fair value is determined by reference to depreciated replacement cost, surplus assets are at risk of impairment and the recoverable amount is measured. Surplus assets at cost are tested for indications of impairment at the end of each reporting period.
(i) Leases
The Trust holds operating leases for its head office building, motor vehicles and photocopiers. Lease payments are expensed on a straight line basis over the lease term as this represents the pattern of benefits derived from the leased property, motor vehicles and photocopiers.
(j) Financial instruments
In addition to cash, the Trust has two categories of financial instrument:
• Loans and receivables; and • Financial liabilities measured at amortised cost.
Financial Instruments have been disaggregated into the following classes:
Financial Assets • Cash and cash equivalents • Restricted cash and cash equivalents • Receivables • Amounts receivable for services
Financial Liabilities • Payables
Initial recognition and measurement of financial instruments is at fair value which normally equates to the transaction cost or the face value. Subsequent measurement is at amortised cost using the effective interest method.
The fair value of short-term receivables and payables is the transaction cost or the face value because there is no interest rate applicable and subsequent measurement is not required as the effect of discounting is not material.
10
tBack to Financial Statements

Swan River TrustNotes to Financial Statements for the year ended 30 June 2012
Swan River Trust Annual Report 2011-12 58
SWAN RIVER TRUST
NOTES TO THE FINANCIAL STATEMENTS FOR THE YEAR ENDED 30 JUNE 2012
(k) Cash and cash equivalents
For the purpose of the Statement of Cash Flows, cash and cash equivalent (and restricted cash and cash equivalent) assets comprise cash on hand and short-term deposits with original maturities of three months or less that are readily convertible to a known amount of cash and which are subject to insignificant risk of changes in value.
(l) Accrued salaries
Accrued salaries (see note 22 ‘Payables’) represent the amount due to staff but unpaid at the end of the financial year. Accrued salaries are settled within a fortnight of the financial year end. The Trust considers the carrying amount of accrued salaries to be equivalent to its fair value.
(m) Amounts receivable for services (holding account)
The Trust receives income from the State Government partly in cash and partly as an asset (holding account receivable). The accrued amount appropriated is accessible on the emergence of the cash funding requirement to cover asset replacement.
(n) Receivables
Receivables are recognised at original invoice amount less an allowance for any uncollectible amounts (i.e. impairment). The collectability of receivables is reviewed on an ongoing basis and any receivables identified as uncollectible are written-off against the allowance account. The allowance for uncollectible amounts (doubtful debts) is raised when there is objective evidence that the Trust will not be able to collect the debts. The carrying amount is equivalent to fair value as it is due for settlement within 30 days. See note 2(j) ‘Financial instruments’ and note 16 ‘Receivables’.
(0) Payables
Payables are recognised when the Trust becomes obliged to make future payments as a result of a purchase of assets or services. The carrying amount is equivalent to fair value, as settlement is generally settled within 30 days.
(p) Provisions
Provisions are liabilities of uncertain timing or amount and are recognised where there is a present legal or constructive obligation as a result of a past event and when the outflow of resources embodying economic benefits is probable and a reliable estimate can be made of the amount of the obligation. Provisions are reviewed at the end of each reporting period.
Provisions - employee benefitsAll employees performing the functions of the Trust are employees of the Department of Environment and Conservation. Therefore the Trust has no liability in relation to employee benefits. Liability for employee entitlements rests with the Department of Environment and Conservation.
11
tBack to Financial Statements

Swan River TrustNotes to Financial Statements for the year ended 30 June 2012
Swan River Trust Annual Report 2011-12 59
SWAN RIVER TRUST
NOTES TO THE FINANCIAL STATEMENTS FOR THE YEAR ENDED 30 JUNE 2012
(q) Superannuation expense
The superannuation expense in the Statement of Comprehensive Income comprises employer contributions paid to the Gold State Superannuation Scheme (GSS) concurrent contributions, the West State Superannuation Scheme (WSS), the GESB Super Scheme (GESBS), or other superannuation fund.
The GSS is a defined benefit scheme for the purposes of employees and whole of government reporting. However, it is a defined contribution plan for agency purposes because the concurrent contributions (defined contributions) made by the Trust to GESB extinguishes the Trust’s obligations to the related superannuation liability.
(r) Resources received free of charge or for nominal cost
Resources received free of charge or for nominal cost that can be reliably measured are recognised as income at fair value. Where the resource received represents a service that the Trust would otherwise pay for, a corresponding expense is recognised. Receipts of assets are recognised in the Statement of Financial Position.
Assets or services received from other State Government agencies are separately disclosed under Income from State Government in the Statement of Comprehensive Income.
(s) Comparative figures
Comparative figures are, where appropriate, reclassified to be comparable with the figures presented in the current financial year.
12
tBack to Financial Statements

Swan River TrustNotes to Financial Statements for the year ended 30 June 2012
Swan River Trust Annual Report 2011-12 60
SWAN RIVER TRUST
NOTES TO THE FINANCIAL STATEMENTS FOR THE YEAR ENDED 30 JUNE 2012
3 DISCLOSURE OF CHANGES IN ACCOUNTING POLICY AND ESTIMATES
Initial application of an Australian Accounting Standard
The Trust has applied the following Australian Accounting Standards effective for annual reporting periods beginning on or after 1 July 2011 that impacted on the Trust.
AASB 1054 Australian Additional Disclosures
This Standard, in conjunction with AASB 2011-1 Amendments to Australian Accounting Standards arising from the Trans-Tasman Convergence Project, removes disclosure requirements from other Standards and incorporates them in a single Standard to achieveconvergence between Australian and New Zealand Accounting Standards. There is no financial impact.
AASB 2009-12 Amendments to Australian Accounting Standards [AASB 5, 8, 108, 110, 112, 119, 133, 137, 139, 1023 & 1031 and Int 2, 4, 16, 1039 & 1052]
This Standard makes editorial amendments to a range of Australian Accounting Standards and Interpretations. There is no financial impact.
AASB 2010-4 Further Amendments to Australian Accounting Standards arising from the Annual Improvements Project [AASB 1, 7, 101 & 134 and Int 13]
The amendments to AASB 7 clarify financial instrument disclosures in relation to credit risk. The carrying amount of financial assets that would otherwise be past due or impaired whose terms have been renegotiated is no longer required to be disclosed. There is no financial impact.
The amendments to AASB 101 clarify the presentation of the statement of changes in equity. The disaggregation of other comprehensive income reconciling the carrying amount at the beginning and the end of the period for each component of equity canbe presented in either the Statement of Changes in Equity or the Notes. There is no financial impact.
AASB 2010-5 Amendments to Australian Accounting Standards [AASB 1, 3, 4, 5, 101, 107, 112, 118, 119, 121, 132, 133, 134, 137, 139, 140, 1023 & 1038 and Int 112, 115, 127, 132 & 1042]
This Standard makes editorial amendments to a range of Australian Accounting Standards and Interpretations. There is no financial impact.
AASB 2010-6 Amendments to Australian Accounting Standards – Disclosures on Transfers of Financial Assets [AASB 1 & 7]
This Standard introduces additional disclosure relating to transfers of financial assets in AASB 7. An entity shall disclose all transferred financial assets that are not derecognised and any continuing involvement in a transferred asset, existing at the reporting date, irrespective of when the related transfer transaction occurred. There is no financial impact.
13
tBack to Financial Statements

Swan River TrustNotes to Financial Statements for the year ended 30 June 2012
Swan River Trust Annual Report 2011-12 61
SWAN RIVER TRUST
NOTES TO THE FINANCIAL STATEMENTS FOR THE YEAR ENDED 30 JUNE 2012
AASB 2011-1 Amendments to Australian Accounting Standards arising from the Trans-Tasman Convergence Project [AASB 1, 5, 101, 107, 108, 121, 128, 132 & 134 and Int 2, 112 & 113]
This Standard, in conjunction with AASB 1054, removes disclosure requirements from other Standards and incorporates them in a single Standard to achieve convergence between Australian and New Zealand Accounting Standards. There is no financial impact.
AASB 2011-5 Amendments to Australian Accounting Standards – Extending Relief from Consolidation, the Equity Method and Proportionate Consolidation [AASB 127, 128 & 131]
This Standard extends the relief from consolidation, the equity method and proportionate consolidation by removing the requirement for the consolidated financial statements prepared by the ultimate or any intermediate parent entity to be IFRS compliant, provided that the parent entity, investor or venturer and the ultimate or intermediate parent entity are not-for-profit non-reporting entities that comply with Australian Accounting Standards. There is no financial impact.
14
tBack to Financial Statements

Swan River TrustNotes to Financial Statements for the year ended 30 June 2012
Swan River Trust Annual Report 2011-12 62
SWAN RIVER TRUST
NOTES TO THE FINANCIAL STATEMENTS FOR THE YEAR ENDED 30 JUNE 2012
Future impact of Australian Accounting Standards not yet operative
The Trust cannot early adopt an Australian Accounting Standard unless specifically permitted by TI 1101 Application of Australian Accounting Standards and Other Pronouncements. Consequently, the Trust has not applied early any of the following Australian Accounting Standards that have been issued that may impact the Trust. Where applicable, the Trust plans to apply these Australian Accounting Standards from their application date.
Operative for reporting periods
beginningon/after
AASB 9 Financial Instruments 1 Jan 2013
This Standard supersedes AASB 139 Financial Instruments: Recognition and Measurement, introducing a number of changes to accounting treatments.
The Standard was reissued in December 2010. The Trust has not yet determined the application or the potential impact of the Standard.
AASB 10 Consolidated Financial Statements 1 Jan 2013
This Standard supersedes requirements under AASB 127 Consolidated and Separate Financial Statements and Int 112 Consolidation – Special Purpose Entities, introducing a number of changes to accounting treatments.
The Standard was issued in August 2011. The Trust has not yet determined the application or the potential impact of the Standard.
15
tBack to Financial Statements

Swan River TrustNotes to Financial Statements for the year ended 30 June 2012
Swan River Trust Annual Report 2011-12 63
SWAN RIVER TRUST
NOTES TO THE FINANCIAL STATEMENTS FOR THE YEAR ENDED 30 JUNE 2012
Operative for reporting periods
beginningon/after
AASB 11 Joint Arrangements 1 Jan 2013
This Standard supersedes AASB 131 Interests in Joint Ventures, introducing a number of changes to accounting treatments.
The Standard was issued in August 2011. The Trust has not yet determined the application or the potential impact of the Standard.
AASB 12 Disclosure of Interests in Other Entities 1 Jan 2013
This Standard supersedes disclosure requirements under AASB 127 Consolidated and Separate Financial Statements, AASB 128 Investments in Associates and AASB 131 Interests in Joint Ventures.
The Standard was issued in August 2011. The Trust has not yet determined the application or the potential impact of the Standard.
AASB 13 Fair Value Measurement 1 Jan 2013
This Standard defines fair value, sets out a framework for measuring fair value and requires disclosures about fair value measurements. There is no financial impact.
AASB 119 Employee Benefits 1 Jan 2013
This Standard supersedes AASB 119 (October 2010). As the Trust does not operate a defined benefit plan, the impact of the change is limited to measuring annual leave as a long-term employee benefit. The resultant discounting of the annual leave benefit has an immaterial impact.
The Standard was issued in September 2011. The Trust has not yet determined the application or the potential impact of the Standard.
16
tBack to Financial Statements

Swan River TrustNotes to Financial Statements for the year ended 30 June 2012
Swan River Trust Annual Report 2011-12 64
SWAN RIVER TRUST
NOTES TO THE FINANCIAL STATEMENTS FOR THE YEAR ENDED 30 JUNE 2012
Operative for reporting periods
beginningon/after
AASB 127 Separate Financial Statements 1 Jan 2013
This Standard supersedes requirements under AASB 127 Consolidated and Separate Financial Statements, introducing a number of changes to accounting treatments.
The Standard was issued in August 2011. The Trust has not yet determined the application or the potential impact of the Standard.
AASB 128 Investments in Associates and Joint Ventures 1 Jan 2013
This Standard supersedes AASB 128 Investments in Associates, introducing a number of changes to accounting treatments.
The Standard was issued in August 2011. The Trust has not yet determined the application or the potential impact of the Standard.
AASB 1053 Application of Tiers of Australian Accounting Standards 1 Jul 2013
This Standard establishes a differential financial reporting framework consisting of two tiers of reporting requirements for preparing general purpose financial statements. There is no financial impact.
AASB 2009-11 Amendments to Australian Accounting Standards arising from AASB 9 [AASB 1, 3, 4, 5, 1 Jul 2013 7, 101, 102, 108, 112, 118, 121, 127, 128, 131, 132, 136, 139, 1023 & 1038 and Int 10 & 12]
[Modified by AASB 2010-7]
17
tBack to Financial Statements
Swan River TrustNotes to Financial Statements for the year ended 30 June 2012
Swan River Trust Annual Report 2011-12 65
SWAN RIVER TRUST
NOTES TO THE FINANCIAL STATEMENTS FOR THE YEAR ENDED 30 JUNE 2012
Operative for reporting periods
beginningon/after
AASB 2010-2 Amendments to Australian Accounting Standards arising from Reduced Disclosure 1 Jul 2013 Requirements, [AASB 1, 2, 3, 5, 7, 8, 101, 102, 107, 108, 110, 111, 112, 116, 117, 119, 121, 123, 124, 127, 128, 131, 133, 134, 136, 137, 138, 140, 141, 1050 & 1052 and Int 2, 4, 5, 15, 17, 127, 129 & 1052]
This Standard makes amendments to Australian Accounting Standards and Interpretations to introduce reduced disclosure requirements for certain types of entities. There is no financial impact.
AASB 2010-7 Amendments to Australian Accounting Standards arising from AASB 9 (December 2010) 1 Jan 2013 [AASB 1, 3, 4, 5, 7, 101, 102, 108, 112, 118, 120, 121, 127, 128, 131, 132, 136, 137, 139, 1023 & 1038 and Int 2, 5, 10, 12, 19 & 127]
This Standard makes consequential amendments to other Australian Accounting Standards and Interpretations as a result of issuing AASB 9 in December 2010. The Trust has not yet determined the application or the potential impact of the Standard.
AASB 2011-2 Amendments to Australian Accounting Standards arising from the Trans-Tasman 1 Jul 2013 Convergence Project – Reduced Disclosure Requirements [AASB 101 & 1054]
This Standard removes disclosure requirements from other Standards and incorporates them in a single Standard to achieve convergence between Australian and New Zealand Accounting Standards for reduced disclosure reporting. There is no financial impact.
18
tBack to Financial Statements

Swan River TrustNotes to Financial Statements for the year ended 30 June 2012
Swan River Trust Annual Report 2011-12 66
SWAN RIVER TRUST
NOTES TO THE FINANCIAL STATEMENTS FOR THE YEAR ENDED 30 JUNE 2012
Operative for reporting periods
beginningon/after
AASB 2011-6 Amendments to Australian Accounting Standards – Extending Relief from Consolidation, 1 Jul 2013 the Equity Method and Proportionate Consolidation – Reduced Disclosure Requirements [AASB 127, 128 & 131]
This Standard extends the relief from consolidation, the equity method and proportionate consolidation by removing the requirement for the consolidated financial statements prepared by the ultimate or any intermediate parent entity to be IFRS compliant, provided that the parent entity, investor or venturer and the ultimate or intermediate parent entity comply with Australian Accounting Standards or Australian Accounting Standards – Reduced Disclosure Requirements. There is no financial impact.
AASB 2011-7 Amendments to Australian Accounting Standards arising from the Consolidation and Joint 1 Jan 2013 Arrangements Standards [AASB 1, 2, 3, 5, 7, 9, 2009-11, 101, 107, 112, 118, 121, 124, 132, 133, 136, 138, 139, 1023 & 1038 and Int 5, 9, 16 & 17]
This Standard gives effect to consequential changes arising from the issuance of AASB 10, AASB 11, AASB 127 Separate Financial Statements and AASB 128 Investments in Associates and Joint Ventures. The Trust has not yet determined the application or the potential impact of the Standard.
AASB 2011-8 Amendments to Australian Accounting Standards arising from AASB 13 [AASB 1, 2, 3, 4, 1 Jan 2013 5, 7, 9, 2009-11, 2010-7, 101, 102, 108, 110, 116, 117, 118, 119, 120, 121, 128, 131, 132, 133, 134, 136, 138, 139, 140, 141, 1004, 1023 & 1038 and Int 2, 4, 12, 13, 14, 17, 19, 131 & 132]
This Standard replaces the existing definition and fair value guidance in other Australian Accounting Standards and Interpretations as the result of issuing AASB 13 in September 2011. There is no financial impact.
19
tBack to Financial Statements

Swan River TrustNotes to Financial Statements for the year ended 30 June 2012
Swan River Trust Annual Report 2011-12 67
SWAN RIVER TRUST
NOTES TO THE FINANCIAL STATEMENTS FOR THE YEAR ENDED 30 JUNE 2012
20
Operative for reporting periods
beginningon/after
AASB 2011-9 Amendments to Australian Accounting Standards – Presentation of Items of Other 1 Jul 2012 Comprehensive Income [AASB 1, 5, 7, 101, 112, 120, 121, 132, 133, 134, 1039 & 1049]
This Standard requires to group items presented in other comprehensive income on the basis of whether they are potentially reclassifiable to profit or loss subsequently (reclassification adjustments). The Trust has not yet determined the application or the potential impact of the Standard.
AASB 2011-10 Amendments to Australian Accounting Standards arising from AASB 119 1 Jan 2013 (September 2011) [AASB 1, 8, 101, 124, 134, 1049 & 2011-8 and Int 14]
This Standard makes amendments to other Australian Accounting Standards and Interpretations as a result of issuing AASB 119 Employee Benefits in September 2011. There is no financial impact.
AASB 2011-11 Amendments to AASB 119 (September 2011) arising from Reduced Disclosure 1 Jan 2013 Requirements
This Standard gives effect to Australian Accounting Standards – Reduced Disclosure Requirements for AASB 119 (September 2011). There is no financial impact.
AASB 2012-1 Amendments to Australian Accounting Standards – Fair Value Measurement – 1 Jul 2013 Reduced Disclosure Requirements [AASB 3, 7, 13, 140, & 141]
This Standard establishes and amends reduced disclosure requirements for additional and amended disclosures arising from AASB 13 and the consequential amendments implemented through AASB 2011-8. There is no financial impact.
tBack to Financial Statements

Swan River TrustNotes to Financial Statements for the year ended 30 June 2012
Swan River Trust Annual Report 2011-12 68
SWAN RIVER TRUST
NOTES TO THE FINANCIAL STATEMENTSFOR THE YEAR ENDED 30 JUNE 2012
2012 2011$ $
4 EMPLOYEE BENEFITS EXPENSE
Wages and salaries (a) 4,736,785 4,522,647Superannuation - defined contribution plans(b) 461,279 419,145
5,198,064 4,941,792
(a) Includes the value of the fringe benefit to the employee plus the fringe benefits tax component(b) Defined contribution plans include West State, Gold State and GESB Super Scheme (contributions paid)
5 SUPPLIES AND SERVICES
Consultants and contractors 2,989,329 2,805,814Travel 20,371 10,266Materials 349,885 197,732Audit fees 14,200 13,400Communications 133,874 151,657Other 305,634 385,757
3,813,293 3,564,626
6 DEPRECIATION AND AMORTISATION EXPENSE
DepreciationFurniture and fittings 1,138 1,045Information Technology Assets 4,444 4,573Plant and equipment 157,262 110,163Total depreciation 162,844 115,781
AmortisationIntangible assets 39,407 13,172Total amortisation 39,407 13,172
Total depreciation and amortisation 202,251 128,953
Officers are employed by DEC. All entitlements are provided for within the DEC financial statements.
21
tBack to Financial Statements

Swan River TrustNotes to Financial Statements for the year ended 30 June 2012
Swan River Trust Annual Report 2011-12 69
SWAN RIVER TRUST
NOTES TO THE FINANCIAL STATEMENTSFOR THE YEAR ENDED 30 JUNE 2012
2012 2011$ $
7 ACCOMMODATION EXPENSES
Lease rentals 603,223 562,207Power expenses 21,457 14,283
624,680 576,490
8 OTHER EXPENSES
Repairs and maintenance 145,222 183,485Employment on-costs 15,868 13,258
161,090 196,743
9 GRANTS AND SUBSIDIES
RecurrentBurswood Park Board 28,000 - Chemcentre 85,241 - City of Armadale 38,116 - City of Bayswater 82,337 119,000City of Belmont 16,270 111,613City of Canning 591,534 644,389City of Fremantle 43,994 20,500City of Gosnells 142,571 33,339City of Melville 50,000 - City of Nedlands 99,903 180,120City of Perth - 1,444,940City of South Perth 291,133 450,442City of Swan 45,080 233,836CSIRO Australia - 20,000Curtin University of Technology 9,446 - Department of Agriculture and Food Western Australia 37,000 - Department of Environment and Conservation 143,000 129,100Department of Finance - Shared Services 675,812 - Department of Water 1,727,685 2,691,420Eastern Metropolitan Regional Council 135,450 100,000Ellen Brockman Integrated Catchment Group 154,957 316,137EMS Plant Production 6,872 - Main Roads Western Australia 224,280 485,000
22
tBack to Financial Statements

Swan River TrustNotes to Financial Statements for the year ended 30 June 2012
Swan River Trust Annual Report 2011-12 70
SWAN RIVER TRUST
NOTES TO THE FINANCIAL STATEMENTSFOR THE YEAR ENDED 30 JUNE 2012
2012 2011$ $
Murdoch University 268,314 130,472Perth Plant Propogation Pty Ltd 5,235 - Perth Region NRM 150,000 766,706Shire of Peppermint Grove - 8,200South East Regional Centre for Urban Landcare 854,455 508,399Town of Bassendean 163,854 162,914Town of Claremont - 27,000Town of East Fremantle 25,860 20,956WA Horse Council 5,000 - Wandoo Heights Preservation Group 7,439 - University of WA (15,320) -
Expenses incurred for the year 6,093,518 8,604,483
23
tBack to Financial Statements

Swan River TrustNotes to Financial Statements for the year ended 30 June 2012
Swan River Trust Annual Report 2011-12 71
SWAN RIVER TRUST
NOTES TO THE FINANCIAL STATEMENTSFOR THE YEAR ENDED 30 JUNE 2012
2012 2011$ $
10 COMMONWEALTH GRANTS AND CONTRIBUTIONSCaring for our Country(a) 531,100 450,848
531,100 450,848
(a)
11 GRANTS AND CONTRIBUTIONS
Burswood Casino Levy (a) 3,044,006 2,561,534State Natural Resource Management (b) 25,000 1,945,500Department of Regional Development and Lands - 90,000Department of Communities 10,000 -
3,079,006 4,597,034
(a)
(b) During the 2010-11 year, the State Government provided the Trust with funds of $1,945,500 through the State Natural Resource Management (NRM) program to implement the Swan Canning Water Quality Improvement Plan (SCWQIP). Projects to implement management actions of the SCWQIP include riparian fencing and revegetation along the Ellen Brook and structural nutrient interventions in the Ellen Brook, Southern River and Mills Street Main Drain catchments. An additional $25,000 was received in 2011-12.
During 2009-10, the Commonwealth Government agreed to provide the Trust with $2.5million through the Caring For Our Country program over three years, of which $531,100 was recognised as income by the Trust in 2011-12. The work to be undertaken aligns with management actions for the Swan Canning Water Quality Improvement Plan, including in stream nutrient intervention, improving land management practices and soil quality, undertaking extension activities and on-ground actions through community and landholder engagement.
Revenue from the Burswood Casino Levy arose initially in 2009-10 from the passage through State Parliament of legislation to amend the Agreement Act between the State and the Burswood Island Casino. Electronic gaming machine levy funds are made available to the Trust subject to it providing a range of programs to the Burswood Park Board for management and protection of the Swan and Canning rivers.
24
tBack to Financial Statements

Swan River TrustNotes to Financial Statements for the year ended 30 June 2012
Swan River Trust Annual Report 2011-12 72
SWAN RIVER TRUST
NOTES TO THE FINANCIAL STATEMENTSFOR THE YEAR ENDED 30 JUNE 2012
2012 2011$ $
12 OTHER REVENUE
Sale of intellectual property rights - 65,318Other 15,698 61,141
15,698 126,459
13 NET GAIN ON DISPOSAL OF NON-CURRENT ASSETS
Proceeds from disposal of non-current assetsProperty, plant and equipment 68,182 108,900
Costs of disposal of non-current assetsProperty, plant and equipment - (86,994)Net Gain 68,182 21,906
14 INCOME FROM STATE GOVERNMENT
Appropriation received during the period:Service appropriation (a) 11,249,000 12,179,000
Resources received free of charge (b)
Determined on the basis of the following estimates provided by agencies:
Landgate - 16,541Department of Transport 76,227 - Department of Finance 4,852 6,295State Solicitor's Office 12,268 2,645Department of Water 2,083 1,030
95,430 26,51111,344,430 12,205,511
(a)
(b)
Service appropriations fund the net cost of services delivered. Appropriation revenue comprises a cash component and a receivable (asset). The receivable (holding account) comprises the depreciation expense for the year and any agreed increase in leave liability during the year.
Assets or services received free of charge or for nominal cost are recognised as revenue at fair value of the assets and/or services that can be reliably measured and which would have been purchased if they were not donated. Contributions of assets or services in the nature of contributions by owners are recognised direct to equity.
25
tBack to Financial Statements
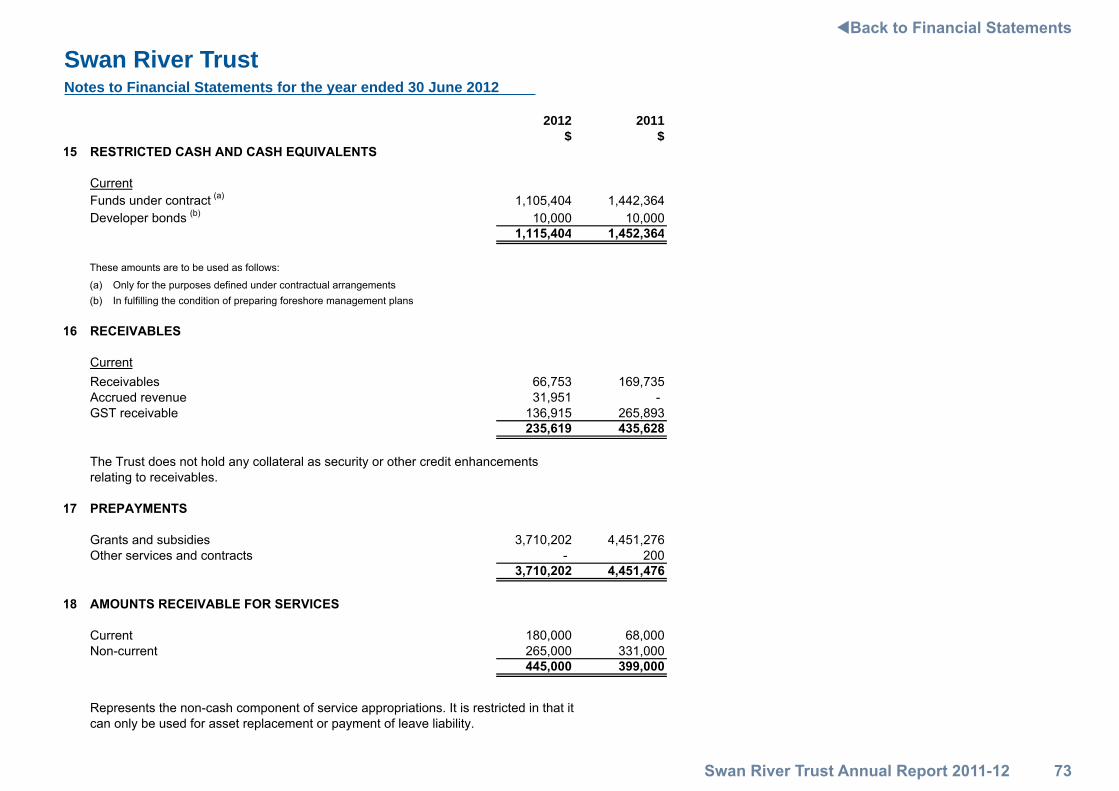
Swan River TrustNotes to Financial Statements for the year ended 30 June 2012
Swan River Trust Annual Report 2011-12 73
SWAN RIVER TRUST
NOTES TO THE FINANCIAL STATEMENTSFOR THE YEAR ENDED 30 JUNE 2012
2012 2011$ $
15 RESTRICTED CASH AND CASH EQUIVALENTS
CurrentFunds under contract (a) 1,105,404 1,442,364Developer bonds (b) 10,000 10,000
1,115,404 1,452,364
These amounts are to be used as follows:
(a) Only for the purposes defined under contractual arrangements(b) In fulfilling the condition of preparing foreshore management plans
16 RECEIVABLES
CurrentReceivables 66,753 169,735Accrued revenue 31,951 - GST receivable 136,915 265,893
235,619 435,628
17 PREPAYMENTS
Grants and subsidies 3,710,202 4,451,276Other services and contracts - 200
3,710,202 4,451,476
18 AMOUNTS RECEIVABLE FOR SERVICES
Current 180,000 68,000Non-current 265,000 331,000
445,000 399,000
Represents the non-cash component of service appropriations. It is restricted in that it can only be used for asset replacement or payment of leave liability.
The Trust does not hold any collateral as security or other credit enhancements relating to receivables.
26
tBack to Financial Statements

Swan River TrustNotes to Financial Statements for the year ended 30 June 2012
Swan River Trust Annual Report 2011-12 74
SWAN RIVER TRUST
NOTES TO THE FINANCIAL STATEMENTSFOR THE YEAR ENDED 30 JUNE 2012
2012 2011$ $
19 PROPERTY, PLANT AND EQUIPMENTLand - ReservesAt fair value(a) 21,091,100 20,578,100
21,091,100 20,578,100
Plant and equipmentAt cost 1,555,693 1,299,936Accumulated depreciation (522,745) (509,392)
1,032,948 790,544
Plant and equipment under constructionConstruction costs 152,322 52,596
152,322 52,596
Information technology assetsAt cost 15,142 20,379Accumulated depreciation (7,336) (8,129)
7,806 12,250
Furniture and fittingsAt cost 16,423 16,423Accumulated depreciation (7,222) (6,084)
9,201 10,339
22,293,377 21,443,829
(a)Land was revalued as at 1 July 2011 by the Western Australian Land Information Authority (Valuations Services). The valuations were performed during the year ended 30 June 2012 and recognised at 30 June 2012. Fair value was determined on the basis of existing use. See note 2(f) 'Property, plant and equipment' .
27
tBack to Financial Statements

Swan River TrustNotes to Financial Statements for the year ended 30 June 2012
Swan River Trust Annual Report 2011-12 75
SWAN RIVER TRUST
NOTES TO THE FINANCIAL STATEMENTSFOR THE YEAR ENDED 30 JUNE 2012
19 (Continued)
Land - Reserves
Plant and equipment
Plant and equipment
underconstruction IT assets
IT assets work in
progressFurniture
and fittings Total$ $ $ $ $ $ $
Carrying amount at start of period 20,578,100 790,544 52,596 12,250 - 10,339 21,443,829Additions - 399,666 99,726 - - - 499,392Revaluation increments/(decrements) 513,000 - - - - - 513,000Depreciation - (157,262) - (4,444) - (1,138) (162,844)Carrying amount at end of period 21,091,100 1,032,948 152,322 7,806 - 9,201 22,293,377
Land - Reserves
Plant and equipment
Plant and equipment
underconstruction IT assets
IT assets work in
progressFurniture
and fittings Total$ $ $ $ $ $ $
Carrying amount at start of period 168,000 763,811 - 8,541 79,346 8,609 1,028,307Additions - 223,890 52,596 8,282 - 2,775 287,543Transfers (a) 20,410,100 - - - (79,346) - 20,330,754Disposals - (86,994) - - - - (86,994)Depreciation - (110,163) - (4,573) - (1,045) (115,781)Carrying amount at end of period 20,578,100 790,544 52,596 12,250 - 10,339 21,443,829
(a) The transfers shown in 2011 under land relate to land transferred at fair value from the Department of Regional Development and Lands ($20,229,100) and the Department of Water ($181,000). The transfer shown under IT assetswork in progress represents the reclassification of expenditure on asset management software under Intangible Assets(see note 20)
2011
2012
Reconciliations of the carrying amounts of property, plant and equipment at the beginning and end of the reporting period are set out in the table below.
28
tBack to Financial Statements

Swan River TrustNotes to Financial Statements for the year ended 30 June 2012
Swan River Trust Annual Report 2011-12 76
SWAN RIVER TRUST
NOTES TO THE FINANCIAL STATEMENTSFOR THE YEAR ENDED 30 JUNE 2012
2012 2011$ $
20 INTANGIBLE ASSETS
Computer SoftwareAt cost 98,518 98,518Accumulated amortisation (52,579) (13,172)
45,939 85,346
Reconciliation:Computer SoftwareCarrying amount at start of period 85,346 - Transfers from property, plant and equipment - 79,346Additions - 19,172Amortisation expense (39,407) (13,172)Carrying amount at end of period 45,939 85,346
21 IMPAIRMENT OF ASSETS
22 PAYABLES
CurrentAccrued expenses 98,267 237,448Accrued salaries 120,402 121,614
218,669 359,062
There were no indications of impairment of property, plant and equipment or intangible assets at 30 June 2012.
The Trust held no goodwill or intangible assets with an indefinite useful life during the reporting period. At the end of the reporting period there were no intangible assets not yet available for use.
All surplus assets at 30 June 2012 have either been classified as assets held for sale or written-off.
29
tBack to Financial Statements

Swan River TrustNotes to Financial Statements for the year ended 30 June 2012
Swan River Trust Annual Report 2011-12 77
SWAN RIVER TRUST
NOTES TO THE FINANCIAL STATEMENTSFOR THE YEAR ENDED 30 JUNE 2012
2012 2011$ $
23 OTHER LIABILITIES
CurrentDeveloper bonds 10,000 10,000Revenue in advance (a) 425,607 469,613
435,607 479,613
(a)
24 EQUITY
Contributed equity
Balance at start of period 20,735,600 325,500
Transfer of net assets from other agenciesLand at Fair Value (a) - 20,410,100Total contributions by owners - 20,410,100Balance at end of period 20,735,600 20,735,600
ReservesAsset revaluation reserveBalance at start of year - - Net revaluation increments/(decrements):Land 513,000 - Balance at end of year 513,000 -
Accumulated surplus
Balance at start of period 8,954,001 9,565,330Result for the period (1,054,480) (611,329)Balance at end of period 7,899,521 8,954,001
Total Equity at end of period 29,148,121 29,689,601
(a) This is land transferred at fair value from the Department of Regional Development and Lands ($20,229,100) and the Department of Water ($181,000)
The amount held in this account is from Burswood funding (see note 11) and is to be used only for the programs approved by the Burswood Park Board
Equity represents the residual interest in the net assets of the Trust. The Government holds the equity interest in the Trust on behalf of the community.
30
tBack to Financial Statements

Swan River TrustNotes to Financial Statements for the year ended 30 June 2012
Swan River Trust Annual Report 2011-12 78
SWAN RIVER TRUST
NOTES TO THE FINANCIAL STATEMENTSFOR THE YEAR ENDED 30 JUNE 2012
2012 2011$ $
25 NOTES TO THE STATEMENT OF CASH FLOWS
Reconciliation of cash
Cash and cash equivalents 1,956,856 2,260,633
1,115,404 1,452,3643,072,260 3,712,997
Reconciliation of net cost of services to net cash flows used in operating activities
Net cost of services (12,398,910) (12,816,840)
Non-cash items:Depreciation and amortisation expense (note 6) 202,251 128,953Resources received free of charge (note 14) 95,430 26,511Gain on disposal of non-current assets (note 13) (68,182) (21,906)
(Increase)/decrease in assets:Current receivables (c) 71,030 (40,370)Current prepayments 741,275 606,181
Increase/(decrease) in liabilities:Current payables (140,393) 127,782Other current liabilities (44,006) 438,141
Net GST receipts/(payments) (a) 139,309 62,631Change in GST in receivables/payables (b) (10,331) 3,898
Net cash used in operating activities (11,412,527) (11,485,019)
(a) This is the net GST paid/received, i.e. cash transactions(b) This reverses out the GST in receivables and payables(c)
Restricted cash and cash equivalents (note 15 'Restricted cash and cash equivalents')
Cash at the end of the financial year as shown in the Statement of Cash Flows is reconciled to the related items in the Statement of Financial Position as follows:
Note that the Australian Taxation Office (ATO) receivable in respect of GST is not included in these items as they do not form part of the reconciling items
31
tBack to Financial Statements

Swan River TrustNotes to Financial Statements for the year ended 30 June 2012
Swan River Trust Annual Report 2011-12 79
SWAN RIVER TRUST
NOTES TO THE FINANCIAL STATEMENTSFOR THE YEAR ENDED 30 JUNE 2012
2012 2011$ $
26 RESOURCES PROVIDED FREE OF CHARGE
27 COMMITMENTS
Capital expenditure commitments
Within 1 year 17,613 380,55217,613 380,552
The capital commitments include amounts for:Plant and equipment 17,613 380,552
17,613 380,552Lease commitments
Non-cancellable operating leases:
Within 1 year 744,539 682,426Later than 1 year and not later than 5 years 536,442 1,031,943
1,280,981 1,714,369
The property lease is a non-cancellable lease with a two year and six month term, with rent payable monthly in advance. Contingent rent provisions within the lease agreement require that theminimum lease payments shall be increased based on a regular market rent review or CPIincrease. The lease expires on 31 December 2014.
The vehicle leases are non-cancellable and the terms vary depending on the vehicle.The lease payments are fixed for the term of the lease and are payable monthly in advance. There is no option to renew the lease at the end of the lease term.
These commitments are all inclusive of GST.
28 CONTINGENT LIABILITIES AND CONTINGENT ASSETS
The Trust has no contingent liabilities or contingent assets as at 30 June 2012.
29 EVENTS OCCURRING AFTER THE END OF THE REPORTING PERIOD
The Trust has no events to report after the end of the reporting period.
Capital expenditure commitments, being contracted capital expenditure additional to the amounts reported on the financial statements, are payable as follows:
During the year there were no resources provided to other agencies free of charge for functions outside the normal operations of the Trust.
Commitments in relation to leases contracted for at the end of the reporting period but not recognised in the financial statements are payable as follows:
32
tBack to Financial Statements

Swan River TrustNotes to Financial Statements for the year ended 30 June 2012
Swan River Trust Annual Report 2011-12 80
SWAN RIVER TRUST
NOTES TO THE FINANCIAL STATEMENTSFOR THE YEAR ENDED 30 JUNE 2012
2012 2011$ $
26 RESOURCES PROVIDED FREE OF CHARGE
27 COMMITMENTS
Capital expenditure commitments
Within 1 year 17,613 380,55217,613 380,552
The capital commitments include amounts for:Plant and equipment 17,613 380,552
17,613 380,552Lease commitments
Non-cancellable operating leases:
Within 1 year 744,539 682,426Later than 1 year and not later than 5 years 536,442 1,031,943
1,280,981 1,714,369
The property lease is a non-cancellable lease with a two year and six month term, with rent payable monthly in advance. Contingent rent provisions within the lease agreement require that theminimum lease payments shall be increased based on a regular market rent review or CPIincrease. The lease expires on 31 December 2014.
The vehicle leases are non-cancellable and the terms vary depending on the vehicle.The lease payments are fixed for the term of the lease and are payable monthly in advance. There is no option to renew the lease at the end of the lease term.
These commitments are all inclusive of GST.
28 CONTINGENT LIABILITIES AND CONTINGENT ASSETS
The Trust has no contingent liabilities or contingent assets as at 30 June 2012.
29 EVENTS OCCURRING AFTER THE END OF THE REPORTING PERIOD
The Trust has no events to report after the end of the reporting period.
Capital expenditure commitments, being contracted capital expenditure additional to the amounts reported on the financial statements, are payable as follows:
During the year there were no resources provided to other agencies free of charge for functions outside the normal operations of the Trust.
Commitments in relation to leases contracted for at the end of the reporting period but not recognised in the financial statements are payable as follows:
32
SWAN RIVER TRUST
NOTES TO THE FINANCIAL STATEMENTSFOR THE YEAR ENDED 30 JUNE 2012
30 EXPLANATORY STATEMENT
Significant variances between estimated and actual result for 2012
2012 2012Estimate Actual Variation
$ $ $
ExpensesSupplies and services 5,249,000 3,813,293 1,435,707Other expenses 377,000 161,090 215,910Grants and subsidies 3,470,000 6,093,518 (2,623,518)
IncomeGrants and contributions 4,318,000 3,610,106 707,894
Supplies and services
Other Expenses
Grants and subsidies
Grants and contributions
Significant variations between estimates and actual results for 2012 and between the actual results for 2011 and 2012 are shown below. Significant variations are considered to be those greater than 10% and $200,000.
Funding for projects was reallocated to grants and subsidies to meet operational requirements.
Funding was transferred to Grants and Subsidies to meet operational requirements.
Funding for projects was reallocated from supplies and services to grants and subsidies to meet operational output demands.
Federal Caring for our Country funding of $805K for the prefeasibility assessment of wetlands project was deferred to 2012-13. The Trust received an additional $70K in Caring for Our Country Funding for Community Engagement Programs.
33
tBack to Financial Statements

Swan River TrustNotes to Financial Statements for the year ended 30 June 2012
Swan River Trust Annual Report 2011-12 81
SWAN RIVER TRUST
NOTES TO THE FINANCIAL STATEMENTSFOR THE YEAR ENDED 30 JUNE 2012
30 (Continued)
Significant variances between actual results for 2011 and 2012
2012 2011 Variance$ $ $
IncomeGrants and contributions 3,079,006 4,597,034 (1,518,028)
ExpensesGrants and subsidies 6,093,518 8,604,483 (2,510,965)
Grants and subsidiesThe reduction in expense in 2011-12 reflects the cut in State Natural Resource Management funding compared to that received in 2010-11.
Grants and contributionsThe variance represents the reduction in State Natural Resource Management Funding in 2011-12
34
tBack to Financial Statements
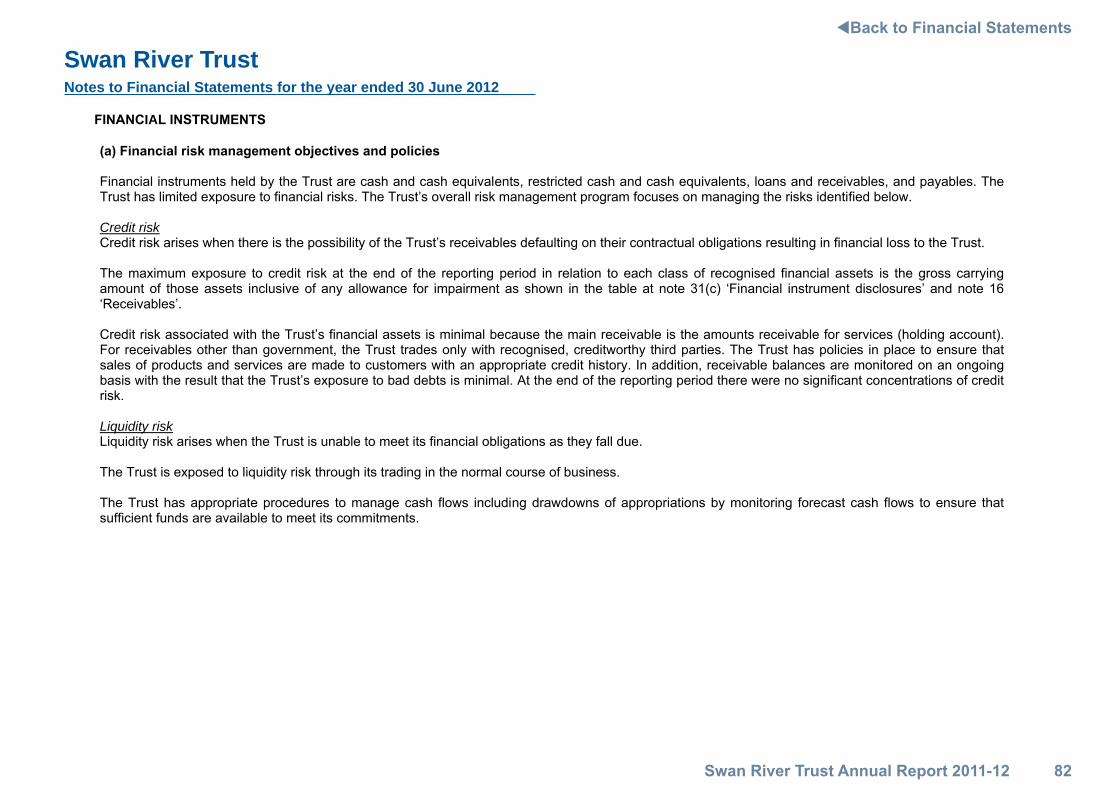
Swan River TrustNotes to Financial Statements for the year ended 30 June 2012
Swan River Trust Annual Report 2011-12 82
SWAN RIVER TRUST
NOTES TO THE FINANCIAL STATEMENTS FOR THE YEAR ENDED 30 JUNE 2012
31 FINANCIAL INSTRUMENTS
(a) Financial risk management objectives and policies
Financial instruments held by the Trust are cash and cash equivalents, restricted cash and cash equivalents, loans and receivables, and payables. The Trust has limited exposure to financial risks. The Trust’s overall risk management program focuses on managing the risks identified below.
Credit riskCredit risk arises when there is the possibility of the Trust’s receivables defaulting on their contractual obligations resulting in financial loss to the Trust.
The maximum exposure to credit risk at the end of the reporting period in relation to each class of recognised financial assets is the gross carrying amount of those assets inclusive of any allowance for impairment as shown in the table at note 31(c) ‘Financial instrument disclosures’ and note 16 ‘Receivables’.
Credit risk associated with the Trust’s financial assets is minimal because the main receivable is the amounts receivable for services (holding account). For receivables other than government, the Trust trades only with recognised, creditworthy third parties. The Trust has policies in place to ensure that sales of products and services are made to customers with an appropriate credit history. In addition, receivable balances are monitored on an ongoing basis with the result that the Trust’s exposure to bad debts is minimal. At the end of the reporting period there were no significant concentrations of credit risk.
Liquidity riskLiquidity risk arises when the Trust is unable to meet its financial obligations as they fall due.
The Trust is exposed to liquidity risk through its trading in the normal course of business.
The Trust has appropriate procedures to manage cash flows including drawdowns of appropriations by monitoring forecast cash flows to ensure that sufficient funds are available to meet its commitments.
35
tBack to Financial Statements

Swan River TrustNotes to Financial Statements for the year ended 30 June 2012
Swan River Trust Annual Report 2011-12 83
SWAN RIVER TRUST
NOTES TO THE FINANCIAL STATEMENTS FOR THE YEAR ENDED 30 JUNE 2012
36
31 (Continued)
Market riskMarket risk is the risk that changes in market prices such as foreign exchange rates and interest rates will affect the T rust’s income or the value of its holdings of financial instruments. The Trust does not trade in foreign currency and is not materially exposed to other price risks. (b) Categories of financial instruments In addition to cash, the carrying amounts of each of the following categories of financial assets and financial liabilities at the end of the reporting period are:
2012 $
2011 $
Financial Assets
Cash and cash equivalents 1,956,856 2,260,633
Restricted cash and cash equivalents 1,115,404 1,452,364
Loans and receivables (a) 98,704 169,735 Amounts receivable for services 445,000 399,000
Financial Liabilities
Financial liabilities measured at amortised cost 218,669 359,062 (a) The amount of loans and receivables excludes GST recoverable from the ATO (statutory receivable)
tBack to Financial Statements

Swan River TrustNotes to Financial Statements for the year ended 30 June 2012
Swan River Trust Annual Report 2011-12 84
SWAN RIVER TRUST
NOTES TO THE FINANCIAL STATEMENTSFOR THE YEAR ENDED 30 JUNE 2012
31 (Continued)
(c) Financial instrument disclosures
Credit risk
2012Cash and cash equivalents -658,659,1658,659,1 - - - - -Restricted cash and cash equivalents -404,511,1404,511,1 - - - - -Receivables (a) -319,46407,89 - - -197,33 -Amounts receivable for services -000,544000,544 - - - - -
-371,285,3469,516,3 - -197,33 - -
2011Cash and cash equivalents -336,062,2336,062,2 - - - - -Restricted cash and cash equivalents -463,254,1463,254,1 - - - - -Receivables (a) -004,961537,961 - - -533 -Amounts receivable for services -000,993000,993 - - - - -
-793,182,4237,182,4 - -533 - -
(a) The amount of receivables excludes the GST recoverable from the ATO (statutory receivable)
Aged analysis of financial assets
Past due but not impaired
The Trust does not hold any collateral as security or other credit enhancement relating to the financial assets it holds.
The following tables disclose the Trust’s maximum exposure to credit risk and the ageing analysis of financial assets. The Trust’s maximum exposure to credit risk at the end of the reporting period is the carrying amount of financial assets as shown below. The table discloses the ageing of financial assets that are past due but not impaired and impaired financial assets. The table is based on information provided to senior management of the Trust.
37
CarryingAmount
$
Up to 1month
$
financialassets
$
Impairedthan 5years
$
More1-3
months$
3 monthsto 1 year
$
1-5years
$
and notimpaired
$
Not past due
tBack to Financial Statements
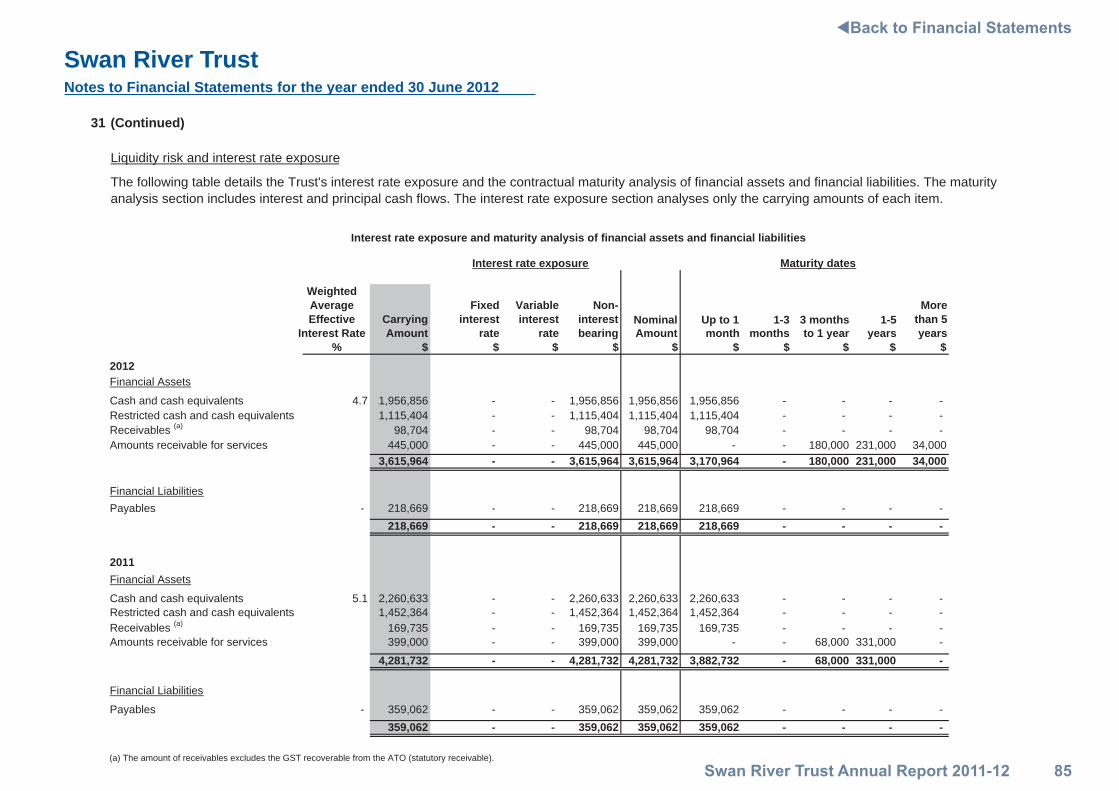
Swan River TrustNotes to Financial Statements for the year ended 30 June 2012
Swan River Trust Annual Report 2011-12 85
SWAN RIVER TRUST
NOTES TO THE FINANCIAL STATEMENTSFOR THE YEAR ENDED 30 JUNE 2012
31 (Continued)
Liquidity risk and interest rate exposure
The following table details the Trust's interest rate exposure and the contractual maturity analysis of financial assets and financial liabilities. The maturityanalysis section includes interest and principal cash flows. The interest rate exposure section analyses only the carrying amounts of each item.
% $ $ $ $ $ $ $ $ $ $2012Financial Assets
Cash and cash equivalents 4.7 1,956,856 - - - - -658,659,1658,659,1658,659,1 -Restricted cash and cash equivalents 1,115,404 - - - - -404,511,1404,511,1404,511,1 -Receivables (a) 98,704 - - - - -407,89407,89407,89 -Amounts receivable for services 445,000 - 000,43000,132000,081 - -000,544000,544 -
3,615,964 - 000,43000,132000,081 -469,071,3469,516,3469,516,3 -
Financial LiabilitiesPayables - 218,669 - - - - -966,812966,812966,812 -
218,669 - -966,812966,812966,812 - - - -
2011Financial Assets
Cash and cash equivalents 5.1 2,260,633 - - - - -336,062,2336,062,2336,062,2 -Restricted cash and cash equivalents 1,452,364 - - - - -463,254,1463,254,1463,254,1 -Receivables (a) 169,735 - - - - -537,961537,961537,961 -Amounts receivable for services 399,000 - -000,133000,86 - -000,993000,993 -
4,281,732 - -000,133000,86 -237,288,3237,182,4237,182,4 -
Financial Liabilities
Payables 260,953 - - - - - -260,953260,953260,953 -359,062 - -260,953260,953260,953 - - - -
(a) The amount of receivables excludes the GST recoverable from the ATO (statutory receivable).
Maturity datesInterest rate exposure
Interest rate exposure and maturity analysis of financial assets and financial liabilities
38
WeightedAverageEffective
Interest Rate
Morethan 5years
Non-interestbearing
Variableinterest
rate
Fixedinterest
rateUp to 1month
1-3months
3 monthsto 1 year
1-5years
CarryingAmount
NominalAmount
tBack to Financial Statements

Swan River TrustNotes to Financial Statements for the year ended 30 June 2012
Swan River Trust Annual Report 2011-12 86
SWAN RIVER TRUST
NOTES TO THE FINANCIAL STATEMENTSFOR THE YEAR ENDED 30 JUNE 2012
32 REMUNERATION OF MEMBERS OF THE TRUST AND SENIOR OFFICERS
Remuneration of members of the Trust
2012 2011 $
0 - 10,000 5 3 10,001 - 20,000 5 4 20,001 - 30,000 1 1
$ $The total remuneration of members of the Trust (a) 103,283 92,750
No members of the Trust are members of the Pension Scheme.
(a)
Remuneration of senior officers
2012 2011 $
180,001 - 190,000 - 1 190,001 - 200,000 1 -
$ $The total remuneration of senior officers (b) 191,794 183,583
No senior officers are members of the Pension Scheme.
(b)
The number of members of the Trust, whose total of fees, salaries, superannuation, non-monetary benefits and other benefits for the financial year, fall within the following bands are:
The number of senior officers, other than senior officers reported as members of the Trust, whose total fees, salaries, superannuation, non-monetary benefits and other benefits for the financial year fall within the following bands are:
Inclusion of accrued salaries and accrued leave entitlements have made the figure to be amended from the published statements from prior year.
The total remuneration includes the superannuation expense incurred by the Trust in respect of senior officers other than senior officers reported as members of the Trust.
The total remuneration includes the superannuation expense incurred by the Trust in respect of members of the Trust.
Inclusion of accrued salaries have made the figure to be amended from the published statements for prior year.
39
tBack to Financial Statements

Swan River TrustNotes to Financial Statements for the year ended 30 June 2012
Swan River Trust Annual Report 2011-12 87
SWAN RIVER TRUST
NOTES TO THE FINANCIAL STATEMENTSFOR THE YEAR ENDED 30 JUNE 2012
2012 2011$ $
33 REMUNERATION OF AUDITOR
14,200 13,400
34 RELATED AND AFFILIATED BODIES
35 SUPPLEMENTARY FINANCIAL INFORMATION
(a) Write-offs
(b) Losses through theft, defaults and other causes
(c) Gifts of public propertyThe Trust had no gifts of public property during the financial year.
The Trust does not provide any assistance to other agencies which would deem them to be regarded as related or affiliated bodies under the definitions included in TI 951.
Auditing the accounts, financial statements and key performance indicators
The Trust did not write off any bad debts, revenue, debts due to the State, public or other property during the financial year.
The Trust had no losses through theft, defaults and other causes during the financial year.
Remuneration paid or payable to the Auditor General in respect to the audit for the current financial year is as follows:
40
tBack to Financial Statements

Swan River TrustNotes to Financial Statements for the year ended 30 June 2012
Swan River Trust Annual Report 2011-12 88
SWAN RIVER TRUST
NOTES TO THE FINANCIAL STATEMENTSFOR THE YEAR ENDED 30 JUNE 2012
36 SCHEDULE OF INCOME AND EXPENSES BY SERVICE
Statutory Assessment of Development
Proposals Waterways
Management
Development and Implementation of
EnvironmentalManagement Programs
2012 2011 2012 2011 2012 2011 2012 2011 2012 2011$ $ $ $ $ $ $ $ $ $
COST OF SERVICESExpenses
Employee benefits expense 881,812 881,446 1,431,376 1,332,743 2,118,292 2,038,315 766,584 689,288 5,198,064 4,941,792Supplies and services 372,240 347,475 776,303 663,902 1,958,098 2,081,156 706,652 472,093 3,813,293 3,564,626Depreciation and amortisation expense 3,638 5,059 177,580 89,606 18,287 31,655 2,746 2,633 202,251 128,953Accommodation expense 74,021 60,889 122,668 102,887 372,109 381,019 55,882 31,695 624,680 576,490Grants and subsidies 95,000 10,000 - 10,000 5,998,518 8,584,483 - - 6,093,518 8,604,483Other expenses 16,458 1,395 27,212 2,712 103,487 180,791 13,933 11,845 161,090 196,743Total cost of services 1,443,169 1,306,264 2,535,139 2,201,850 10,568,791 13,297,419 1,545,797 1,207,554 16,092,896 18,013,087
Income
RevenueCommonwealth grants and contributions - 14,411 - 24,351 461,100 284,584 70,000 127,502 531,100 450,848Grants and contributions 40,763 3,893 1,196,553 (8,954) 1,424,916 4,194,019 416,774 408,076 3,079,006 4,597,034Other revenue 1,145 2,564 (983,591) 31,949 996,993 89,099 1,151 2,847 15,698 126,459Gains/(losses) on disposal of non-current assets 8,079 4,162 13,389 (10,467) 40,615 26,044 6,099 2,167 68,182 21,906
49,987 25,030 226,351 36,879 2,923,624 4,593,746 494,024 540,592 3,693,986 5,196,247NET COST OF SERVICES 1,393,182 1,281,234 2,308,788 2,164,971 7,645,167 8,703,673 1,051,773 666,962 12,398,910 12,816,840
INCOME FROM STATE GOVERNMENTService appropriation 1,332,946 1,286,338 2,208,967 2,173,597 6,700,788 8,049,441 1,006,299 669,624 11,249,000 12,179,000Resources received free of charge 11,308 4,408 18,739 7,702 56,846 12,029 8,537 2,372 95,430 26,511Total income from State Government 1,344,254 1,290,746 2,227,706 2,181,299 6,757,634 8,061,470 1,014,836 671,996 11,344,430 12,205,511Surplus/(Deficit) for the period (48,928) 9,512 (81,082) 16,328 (887,533) (642,203) (36,937) 5,034 (1,054,480) (611,329)
The Schedule of Income and Expenses by Service should be read in conjunction with the accompanying notes.
Total
Total income other than income from State Government
Communication of Environmental
Information
41
tBack to Financial Statements

Swan River Trust Annual Report 2011-12 49
GOVERNMENT OFWESTERN AUSTRALIA
ECOSYSTEM HEALTH SENSE OF PLACE COMMUNITY BENEFIT ECONOMIC BENEFIT
Swan River Trust
Level 1 Fortescue Centre | 20 Terrace Road | East Perth | Western Australia 6004
PO Box 6829 | East Perth | Western Australia 6892
Telephone (08) 9278 0900 | Facsimile (08) 9325 7149
www.swanrivertrust.wa.gov.au