2010... · Web viewAgriculture Agriculture in the United States Agriculture production contributed...
68
United States WT/TPR/S/235 Page 80 IV. DEVELOPMENTS IN SELECTED SECTORS (1) AGRICULTURE (i) Agriculture in the United States 1. Agriculture production contributed slightly less than 0.8% to U.S. GDP in 2009 while total employment in the sector was about 1.4% of the civilian labour force. Agriculture products represented 6% of total exports and about 3% of total imports. Thus, agriculture is an important part of the U.S. economy and, for some individual states, it is one of the main economic activities. 2. The value of agricultural production in the United States increased from US$195 billion in crop year 2002 to US$311 billion in 2007 as a result of high commodity prices and increased production. 1 It declined to about US$287 billion in 2009 as a result of lower international prices. The United States is the world's biggest producer of several agriculture products including soybeans, maize, beef, chicken meat, and milk. It is also the second or third biggest producer of barley, wheat, sugar beet, and several fruits and vegetables. 2 Although a wide range of products are produced, five commodities contributed more than half of the total value of production (Table IV.1). Table IV.1 Value of production, 2007-09 (US$ million) 2007 % 2008 % 2009 % Total value of production (at farm gate) 311,228 100 315,597 100 287,022 100 of which: Maize 54,667 17.6 49,313 15.6 48,489 16.9 Dairy products 35,666 11.5 34,977 11.1 24,200 8.4 Cattle and calves 35,973 11.6 34,859 11.0 30,757 10.7 Soybeans 26,974 8.7 29,458 9.3 31,760 11.1 Broilers 21,514 6.9 23,112 7.3 21,677 7.6 Hay 16,842 5.4 18,639 5.9 14,990 5.2 Wheat 13,289 4.3 16,626 5.3 10,626 3.7 Note: Figures for 2009 are estimates. Source: U.S. Census Bureau (2009), The 2010 Statistical Abstract, The National Data Book . Viewed at: http://www.census.gov/compendia/statab/cats/agriculture.html, except 1 Crop year varies from one commodity to another. 2 Online data from FAOStat. Viewed at: http://faostat.fao.org/site/339/default.aspx [July 2010].
Transcript of 2010... · Web viewAgriculture Agriculture in the United States Agriculture production contributed...

United States WT/TPR/S/235Page 80
IV. DEVELOPMENTS IN SELECTED SECTORS
(1) AGRICULTURE
(i) Agriculture in the United States
1. Agriculture production contributed slightly less than 0.8% to U.S. GDP in 2009 while total employment in the sector was about 1.4% of the civilian labour force. Agriculture products represented 6% of total exports and about 3% of total imports. Thus, agriculture is an important part of the U.S. economy and, for some individual states, it is one of the main economic activities.
2. The value of agricultural production in the United States increased from US$195 billion in crop year 2002 to US$311 billion in 2007 as a result of high commodity prices and increased production.1 It declined to about US$287 billion in 2009 as a result of lower international prices. The United States is the world's biggest producer of several agriculture products including soybeans, maize, beef, chicken meat, and milk. It is also the second or third biggest producer of barley, wheat, sugar beet, and several fruits and vegetables.2 Although a wide range of products are produced, five commodities contributed more than half of the total value of production (Table IV.1).
Table IV.1Value of production, 2007-09(US$ million)
2007 % 2008 % 2009 %
Total value of production (at farm gate) 311,228 100 315,597 100 287,022 100of which:
Maize 54,667 17.6 49,313 15.6 48,489 16.9Dairy products 35,666 11.5 34,977 11.1 24,200 8.4Cattle and calves 35,973 11.6 34,859 11.0 30,757 10.7Soybeans 26,974 8.7 29,458 9.3 31,760 11.1Broilers 21,514 6.9 23,112 7.3 21,677 7.6Hay 16,842 5.4 18,639 5.9 14,990 5.2Wheat 13,289 4.3 16,626 5.3 10,626 3.7
Note: Figures for 2009 are estimates.
Source: U.S. Census Bureau (2009), The 2010 Statistical Abstract, The National Data Book. Viewed at: http://www.census.gov/compendia/statab/cats/agriculture.html, except for total value of production, reported by the authorities and based on National Agricultural Statistics Service (NASS) data, and ERS cash receipts data for commodities not available from NASS.
3. The United States is the world's largest exporter of agriculture products and one of the biggest importers and consumers. For a number of products, a large proportion of production is exported, representing a large proportion of world trade (Table IV.2). Because the United States accounts for a significant share of the global market for a number of agriculture products, the measures it takes that support production and trade can affect world prices and, thus, international trade. The authorities pointed out that import measures, such as high tariffs, taken by other countries that account for a significant share of world consumption, can have similar effects on world prices and markets.
1 Crop year varies from one commodity to another.2 Online data from FAOStat. Viewed at: http://faostat.fao.org/site/339/default.aspx [July 2010].

WT/TPR/S/235 Trade Policy ReviewPage 81
Table IV.2Production and exports of selected commodities, selected years(Million tonnes unless otherwise stated)
2005 2008 2009
Prod. Exports % of world exports Prod. Exports
% of world
exportsProd. Export
% of world
exportsWheat 57.0 27.4 24.1 68.0 27.6 19.3 60.3 23.5 18.8Maize 282.0 56.1 67.9 307.1 47.2 55.9 333.5 48.3 56.1Soybeans 84.0 25.6 40.1 80.8 34.9 44.4 91.4 39.3 47.7Rice, milled basis 7.1 3.9 13.2 6.5 3.0 10.4 7.0 3.3 11.0Cotton (million bales) 19.2 13.7 35.5 12.8 13.3 44.1 12.2 12 35.1
Source: World Agriculture Supply and Demand Estimates, USDA, April 2010.
(ii) Agriculture policies
4. Most agriculture policies in the United States are set out in the Food, Conservation, and Energy Act of 2008, which authorizes agricultural programmes for 2008-2013.3 There is a large body of legislation underlying the Farm Act, much of which is incorporated into it. Some of the programmes have their roots in legislation going back many years, although they have evolved significantly over time and new programmes have been introduced, existing ones amended or dropped.
5. The Farm Act of 2008, like its predecessor, was prepared and passed in Congress. In 2008, passage of the Farm Act had to overcome two Presidential vetoes. The current law provides for a series of wide-ranging policies that cover almost all agriculture production but with very different programmes in different areas, not all of which provide support to producers. The Act, like previous Farm Acts, has a limited duration. In theory, if a new Act is not passed before the current one expires (in 2013) the legislation reverts to the permanent legislation, most of which is in the Agricultural Adjustment Act of 1938, the Agriculture Act of 1949, and the Commodity Credit Corporation Charter Act of 1948. However, in the past, the existing Act has been extended in these circumstances.
6. In many respects, the 2008 Farm Act is divided into a number of Titles, which set out the programmes run by the USDA and other government agencies. It covers more than support to agriculture: the largest budgetary outlays are domestic food aid programmes.
7. What follows is a summary of the main Titles of the Farm Act, including other relevant information under the same heading.
(a) Title I (Commodity Programs)
Direct Payments
8. Farms that used to produce cereals, cotton, peanuts and oilseeds are eligible for Direct Payments, which are based on historic planting and yields and are decoupled from current production and prices. The 2008 Farm Act lowered payments to 83.3% of base acres for 2009-2011 from 85% in the 2002 Act. However, the payment rates remain the same. (Table AIV.2)
3 The Farm Act of 2008. Viewed at: http://frwebgate.access.gpo.gov/cgi-bin/getdoc. cgi?dbname= 110_cong_bills&docid=f:h2419enr.txt.pdf [February 2010].

United States WT/TPR/S/235Page 82
Marketing Assistance Loans and Loan Deficiency Payments
9. Marketing assistance loans are available from the Commodity Credit Corporation (CCC) to eligible producers of the covered commodities.4 After harvest, a producer may obtain a marketing loan from the CCC equal to the loan rate multiplied by the quantity produced. The loan may be redeemed by: repaying the capital plus interest (generally set at 1 percentage point above the U.S. Treasury borrowing rate); or, when market prices are below the loan rate, transferring ownership of the crop to the CCC or repaying at a loan repayment rate based on local (county) market prices. As an alternative to taking out a marketing assistance loan, a producer may receive a loan deficiency payment based on the difference between the loan rate and market prices. The loan rates in the 2008 Farm Act were the same as in the previous Act with increases and decreases for some products set for 2009-12. For seed and high-moisture-content maize, loans cannot be repaid by transferring ownership of the crop. For upland cotton, the repayment rate is based on world market prices rather than local prices (Table AIV.3).
Counter-cyclical Payments Program
10. Counter-Cyclical Payments are based on historical production and the difference between a target price and the "effective" price (based on current market prices). The target price for each eligible commodity is set out in the Farm Act (Table AIV.4) and are the same as those set by the previous Act for 2004-07, except for upland cotton whose target price was set slightly lower. For 2010-12, most rates were set at the same level except for wheat and oats, which were increased. The 2008 Farm Act extended the crops covered by Counter-Cyclical Payments Program to include dry peas, lentils, and chickpeas. Although these payments are based on prices, current production of the covered crop, or any other crop, is not required for payment and the size of the payment is not affected by current production of any crop.
11. The payment rate for counter-cyclical payments is the target price minus the direct payment rate minus the higher of the loan rate or the market price. The payment rate is then multiplied by the historical yield and historical acreage to give the total payment due to the producer.5
Sugar
12. Sugar qualifies for non-recourse loans, i.e. processors may borrow at the loan rate set out in the Farm Act and redeem the loan by repayment or by forfeiting the crop to the CCC. The processors are required by law to pay producers at a rate proportional to the value of the loan. In addition, sugar is subject to annually determined marketing allotments, which potentially restrict marketing and are meant to prevent sugar being transferred to the CCC in forfeit. The Secretary of Agriculture may also purchase sugar intended for food use and sell it to bioenergy producers although, in practice, this has not happened.
4 The covered commodities are wheat, maize, grain sorghum, barley, oats, upland cotton, extra-long staple cotton, rice, peanuts, soybeans, other oilseeds, dry peas, lentils, chickpeas, wool, mohair, honey, sugar beet, and sugar cane. To be eligible for marketing assistance loans and loan deficiency payments, a producer must comply with conservation and wetland protection requirements, report how they use their cropland, have beneficial interest in the commodity, and ensure the commodities meet minimum grade and quality standards. (See: http://www.fsa.usda.gov/FSA/newsReleases?area=newsroom&subject=landing&topic=pfs&newstype= prfactsheet&type=detail&item=pf_20070601_farln_en_nonrecmkt.html [July 2010].)
5 For example, for wheat, assuming the loan rate is higher than the market price, the counter-cyclical payment rate for 2008-09 would be: US$144.04 - US$19.11 - US$101.05 = US$23.88/tonne of eligible historical production.

WT/TPR/S/235 Trade Policy ReviewPage 83
13. Under the Refined Sugar Re-Export Program a company may obtain a licence to import sugar duty-free for refining and export, or to import raw sugar to replace domestically produced refined sugar that has been exported. Under the Sugar Containing Products Re-Export Program, a manufacturer of products that contain sugar can import sugar duty free for use in products to be exported. The Polyhydric Alcohol Program allows manufacturers of polyhydric alcohol to buy duty-free sugar from licensed refiners for use in the production of polyhydric alcohol for non-human consumption.
Table IV.3Exports of sugar and sugar-containing products, 2005-09(Tonnes)
Sugar-containing products Refined sugar
2005 145,337 162,4502006 157,571 197,7352007 162,259 322,0652008 144,932 200,6982009 154,264 137,553
Source: Data provided by the U.S. authorities.
Average Crop Revenue Election (ACRE) Program
14. The 2008 Farm Act introduced the Average Crop Revenue Election (ACRE) Program as an option to counter-cyclical payments. ACRE Program payments are also counter-cyclical but based on revenue (State yields and market prices compared to historic yields and prices). Opting for the ACRE Program means Direct Payments are reduced by 20% and loan rates by 30%. A total of 128,620 farms (7.7% of total enrolled farms) have signed up 32,528,628 acres (12.8% of total base acres).
Economic Assistance to Cotton Users
15. The Economic Adjustment Assistance Program provides a payment to domestic users of upland cotton from any source for specified uses, including modernizing plants or equipment. Domestic users and exporters of extra-long staple cotton also receive payments when world market prices fall for four consecutive weeks below U.S. prices and below 134% of the loan rate for extra-long staple cotton.
Dairy
16. The dairy sector is supported by several programmes that differ markedly from other support programmes under Title I of the Farm Act of 2008. Price support is provided through purchase prices set out in the Act; the CCC "will buy butter, cheddar cheese, and non-fat dry milk offered to it" at the prices set out in the 2008 Farm Act.6 These purchases may be resold and, in 2009 and 2010, the CCC sold about 455 tonnes of non-fat dairy milk, for conversion into edible dry casein or caseinate, at a price of about US$1.58 per kg.
17. In addition to the purchase prices set by the Farm Act, Federal Milk Marketing Orders (FMMOs) set minimum prices for fluid Grade A milk7 that "first handlers" (processors or manufacturers) must pay for milk. According to the authorities, minimum prices are set to encourage
6 USDA, ERS online information, "Briefing Rooms, Dairy: Policy", March 2009. Viewed at: http://www.ers.usda.gov/ Briefing/Dairy/Policy.htm [May 2010].
7 Grade A milk is milk that complies with the Pasteurized Milk Ordinance (PMO) by the Food and Drug Administration concerning sanitary standards; 99% of milk produced in the United States is Grade A.
United States WT/TPR/S/235Page 84
the production and movement of fluid milk from areas of surplus production to areas where production is low and demand is high. FMMO prices can vary from month to month depending on expected supply and demand, and are not guaranteed: average milk prices have fluctuated sharply in recent years. Currently, there are ten federal marketing orders covering about 62% of milk produced in the United States. California operates a similar system which covers about 22% of milk produced, and the states of Maine, Montana, Nevada, and Virginia regulate nearly all the remainder. Under the federal system, the minimum prices depend on the end-use of the milk: Class I for milk used in milk beverages; Class II for milk used in soft and frozen products (fluid cream, yoghurts, ice cream, etc.); Class III for milk used for cheese; and Class IV for milk used for butter or milk powder. Each month minimum prices are set for each Class: the prices for Classes II to IV are based on the wholesale prices of these products; and the price for Class I is set as a margin over the minimum price for milk used for manufactured dairy products.
18. The 2008 Farm Act continued, with some changes, the Milk Income Loss Contract (MILC) Program, under which a direct payment is made to dairy producers in each month that the price of fluid milk is less than an annually determined fixed price. The payments provide partial compensation when prices are below the reference price, subject to a quantity limit.8
(b) Title II (Conservation)
19. The agriculture conservation programmes are part of a much larger set of measures to protect the natural environment. These programmes involve the Bureau of Land Management, the Fish and Wildlife Service, the Forest Service (part of USDA), and other federal agencies. In 2007, spending on USDA conservation programmes accounted for about 16% of the US$33.8 billion spent on programmes to protect natural resources.9 Producer participation in most programmes is voluntary with the exception of certain commodity programmes where producers on highly erodible and protected wetlands risk not receiving benefits if they fail to meet the programmes' conservation requirements. The 2008 Farm Act provided an additional US$8 billion for conservation programmes and changed the amount of land that may be brought into reserve programmes. The area allowed in the Conservation Reserve Program was reduced from 39.2 million acres to 32 million acres, while in some smaller programmes (Wetland Reserve and Grassland Reserve) the area was increased.
(c) Title III (Trade)
20. The Farm Act 2008 retained some of the agriculture export programmes from the previous Act. The Foreign Agricultural Service (FAS) of the USDA administers most of the programmes with the exception of some food aid programmes, which are the responsibility of the United States' Agency for International Development (USAID). The Act terminated the Export Enhancement Program, the Supplier Guarantee Credit Program, and GSM-103.
Export subsidies
21. The Dairy Export Incentive Program (DEIP) provides subsidies (bonuses) through the CCC to exporters of dairy products. In May 2009, DEIP was made available for the year beginning 1 July
8 The reference price is the Class I milk price in the Boston market under the applicable FMMO (currently US$16.94 per cwt or US$373 per tonne). Compensation is paid at 45% of the difference for the period 1 October 2008 – 31 August 2012 and subject to a limit of 2.985 million lbs (1,354 tonnes) per operation. From 1 September 2012, the rate is 3%, and the allowable quantity per dairy operation is 2.4 million pounds (1,087 tonnes).
9 USDA ERS online information, "Briefing Rooms, Conservation Policy: Background" January 2009. Viewed at: http://www.ers.usda.gov/Briefing/ConservationPolicy/background.htm [February 2010].
WT/TPR/S/235 Trade Policy ReviewPage 85
2008 through publication of invitations for offers to apply for bonuses for exports of non-fat dry milk, cheese, or butterfat quantities. On 6 July 2009, another announcement activated the program for the year beginning 1 July 2009. The global limits for exports under the DEIP were 19,235 tonnes of butterfat, 68,201 tonnes of non-fat dry milk, and 3,030 tonnes of cheese. The export subsidy per unit exported varies with each offer. Once an offer is received, the USDA/CCC makes a decision based on the data provided by the exporter as it relates to the export sales contract. The determination by USDA/CCC is based on an evaluation of both the export and domestic markets for that commodity. According to the authorities, the DEIP bonus is intended only to offset the differential between the export market and the domestic market.
22. For the programme year beginning 1 July 2008, bonuses were awarded for 20,025 tonnes of non-fat dry milk; 1,862 tonnes of butter/butteroil; and 152 tonnes of cheese. For the fiscal year beginning 1 October 2008, budgetary outlays were: US$7.2 million for non-fat dry milk; US$11.3 million for butter/butteroil; and US$0.3 million for cheese.
23. Most agricultural products are eligible for the Export Credit Guarantee Program (GSM-102). Under GSM-102, the USDA provides guarantees for credits extended by private banks in the United States to approved foreign banks for purchases of agricultural products by foreign buyers. Fees are based on the risk of the obligor country, the tenor of the loan, and other factors.10 As of 30 September 2009, exporters had registered US$5.3 billion (although by May 2010 this had fallen, due to the cancellation of some guarantees). The default percentage (defined as the lifetime default claims as a percentage of disbursements) was 5.33%. The estimated budget cost for FY2010 of GSM-102 is -1.21%, meaning that its fees plus recoveries on default claim payments are expected to exceed default claim payments on a net present value basis.
Export promotion
24. The FAS is also responsible for the Market Access Program (MAP), which provides cost-share financial assistance to approved organizations for overseas marketing and promotional activities, including trade shows, market research, consumer promotions for retail products, technical capacity building, and seminars to educate overseas customers. Assistance for brand promotion is restricted to small-sized entities11, cooperatives, and producer associations. Authorized funding for the MAP remained at US$200 million from 2007 through 2009. Under the Technical Assistance for Speciality Crops (TASC) Program, funds are made available for projects that address SPS and TBT measures in export markets, including: seminars and workshops; study tours; field surveys; pest and disease research; and pre-clearance programmes. Authorized funding for the TASC Program increased from US$2 million in 2007 to US$4 million in 2008 and US$7 million in 2009.
Food aid
25. For many years, the United States has been the world's biggest donor of food aid, usually delivering about half of total aid (3.2 million tonnes grain equivalent or 49% of the total in 2008).12
Most aid is given under the Food for Peace Act of 200813, which replaced the Agricultural Trade Development and Assistance Act of 1954 (P.L. 480). The objectives of the Food for Peace Act are to:
10 USDA (2010), GSM-102 Guarantee Fee Rate Schedule, April. Viewed at: http://www.fas.usda. gov/excredits/gsm102fees.html [July 2010].
11 The definition of a small business entity follows the Small Business Size Standards of the Small Business Size Regulations (13 CFR 121). For farming, the general rule is an enterprise with a turnover of less then US$750,000, for the food industry it is an enterprise with less than between 500 and 1,000 employees depending on the type of activity undertaken.
12 World Food Programme (2010).
United States WT/TPR/S/235Page 86
combat world hunger and malnutrition and their causes; promote broad-based, equitable, and sustainable development, including agricultural development; expand international trade; foster and encourage the development of private enterprise and democratic participation in developing countries; and prevent conflicts. Nearly all aid is given in fully grant form through the World Food Programme or private voluntary organizations.
26. Most food aid donated by the United States is provided as direct transfers (i.e. as in-kind commodities) rather than as cash for local or regional purchases. Direct transfers have been criticized as being less efficient than cash for local or regional purchases.14 A declining amount of food aid is monetized by private voluntary organizations to generate proceeds for development activities or to cover their administrative and distribution expenses. The GAO has stated that food aid donations by the United States could be made more efficient if some legal requirements were relaxed, such as the obligation to carry 75% of food aid in U.S.-flagged ships.15
27. In order to give USDA more flexibility in administering food aid programmes, the 2008 Farm Act provided authority under a pilot programme (the Local and Regional Procurement Project) to purchase food aid in local and regional markets. The funding provided was: US$5 million for FY2009; US$25 million for fiscal years 2010 and 2011; and US$5 million for FY2012.16 In addition, in FY2010, the Administration received US$300 million in the International Disaster Assistance (IDA) account for emergency food assistance such as local and regional procurement, cash voucher and cash transfers, which allow for greater flexibility and timeliness in delivering food assistance. The Administration is requesting this IDA funding again in FY2011.
28. Under the Food for Progress Act of 1985, 18 projects were approved or active in 2009 with an estimated value of US$212 million.17 In total the Food for Progress Program provided over US$238 million in food assistance in FY2009, supporting the purchase and shipment of 288,530 tonnes of commodities. The McGovern-Dole International Food for Education and Child Nutrition Program also provided US$175.5 million in aid in FY200918, with more than 126,523 tonnes of commodities to support child nutrition and school feeding programmes in 18 countries. In addition, the Bill Emerson Humanitarian Trust (BEHT) is a reserve of commodities and cash used to meet unanticipated food aid needs. The BEHT currently holds only cash.
(d) Title IV (Nutrition)
29. In addition to the Supplemental Nutrition Assistance Program, formerly known as the Food Stamp Program, the Farm Act authorizes other nutrition programmes including: the National School Lunch Program; the School Breakfast Program; the Child and Adult Care Food Program; the Summer Food Service Program; and the USDA Fruit and Vegetable Program. The Food and Nutrition Service of the USDA is also responsible for the Women, Infants, and Children (WIC)
13 For the full text of the Food for Peace Act of 2008, see: http://www.fas.usda.gov/excredits/ FoodAid/pl480/Food_for_Peace_Act.pdf [February 2010].
14 OECD (2006).15 GAO (2007).16 USDA FAS (2009).17 USDA FAS Press Release, "USDA Announces US$212 million in International Assistance under the
Food for Progress Program". 17 December 2008. Viewed at: http://www.fas.usda.gov/scriptsw/PressRelease/ pressrel_dout.asp?Entry=valid&PrNum=0179-08.
18 USDA FAS Press Release, "Agriculture Secretary Vilsack Announces Additional US$80 million in Food Assistance Under McGovern-Dole Program: USDA Releases Final Rule on Food Assistance Program Regulations", 7 April 2009. Viewed at: http://www.fas.usda.gov/scriptsw/PressRelease/pressrel_dout.asp? Entry=valid&PrNum=0057-09.

WT/TPR/S/235 Trade Policy ReviewPage 87
Program which provides food, education and healthcare to women on low incomes before and after childbirth and for children up to five years of age. The total spending on nutrition programmes under the USDA was about US$93.85 billion in FY2010 out of a total budget of US$135.52 billion (not all of which was funded through the Farm Act).19
30. The Agricultural Marketing Service of the USDA also operates commodity purchase programmes to acquire food products for the National School Lunch Program (NSLP) and other Federal nutrition programmes that may also be used to "help to stabilize prices in agriculture commodity markets by balancing supply and demand".20 These programmes purchase a wide variety of products, including livestock products, fruit, vegetables, nuts, speciality items, and corn syrup. Under the NSLP, participating schools are entitled to receive food valued at US$0.195 per lunch served. The entitlement varies from one year to another based on changes in food prices. In addition, schools and other feeding programmes can get "bonus" commodities as they become available through agricultural surpluses. During the 2009 school year, the USDA purchased over US$973 million worth of commodities for schools/child nutrition programmes.21
(e) Title V (Credit)
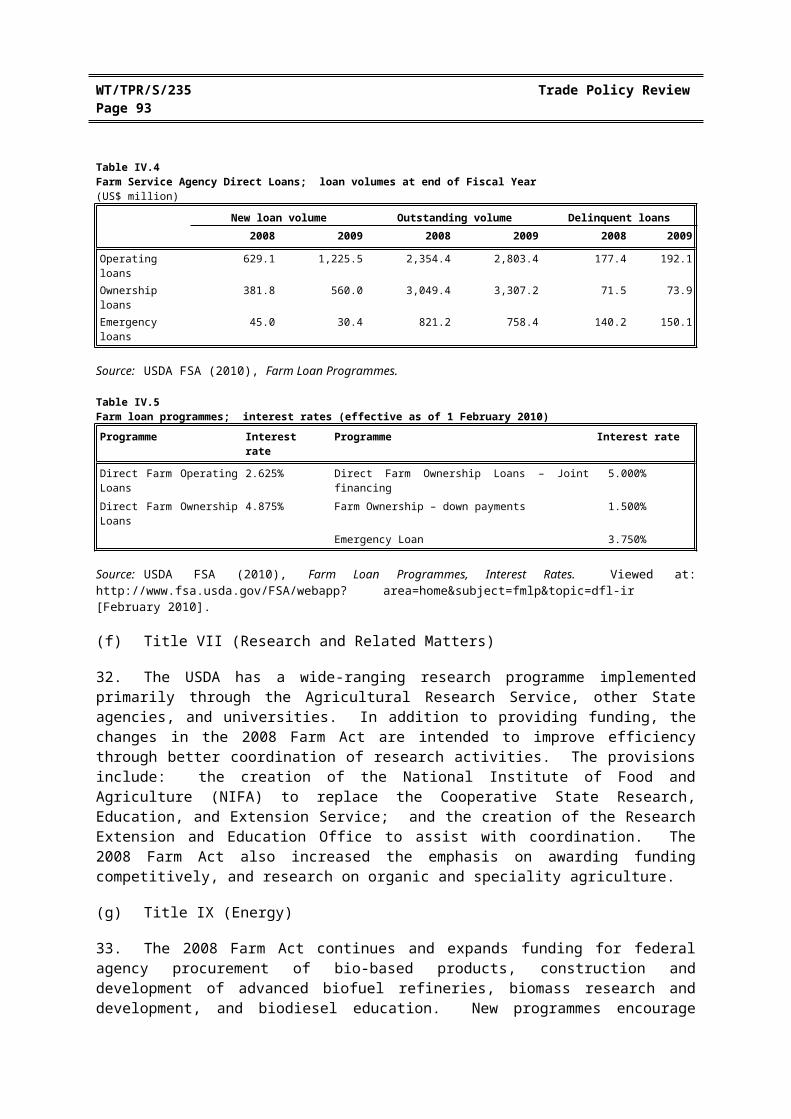
31. The 2008 Farm Act made some relatively minor amendments to the existing legislation on lending to agricultural producers through the USDA Farm Service Agency (FSA). Direct loans of up to US$300,000 are available from government funds for: purchasing farmland; investment in buildings and other fixtures (Direct Ownership Loans); or for operating expenses (Direct Operating Loans). Under the Direct Ownership Loans, an applicant may opt for a joint-financing plan with the FSA providing half the loan and the rest through commercial banks. Emergency Farm Loans are available to help farmers recover from natural disasters or quarantine conditions imposed as a result of an SPS measure (Tables IV.4 and IV.5). Such loans are available only to citizens or permanent residents of the United States. Individuals starting out in farming or ranching may obtain direct loans from the FSA of up to US$300,000 or loan guarantees for borrowings of up to US$1,094,000. In addition, each year the FSA targets a portion of its loans to socially disadvantaged farmers and ranchers, as well as to beginning farmers and ranchers.
Table IV.4Farm Service Agency Direct Loans; loan volumes at end of Fiscal Year(US$ million)
New loan volume Outstanding volume Delinquent loans2008 2009 2008 2009 2008 2009
Operating loans 629.1 1,225.5 2,354.4 2,803.4 177.4 192.1Ownership loans 381.8 560.0 3,049.4 3,307.2 71.5 73.9Emergency loans 45.0 30.4 821.2 758.4 140.2 150.1
Source: USDA FSA (2010), Farm Loan Programmes.
Table IV.5Farm loan programmes; interest rates (effective as of 1 February 2010)
Programme Interest rate Programme Interest rate
Direct Farm Operating Loans 2.625% Direct Farm Ownership Loans – Joint financing 5.000%Direct Farm Ownership Loans 4.875% Farm Ownership – down payments 1.500%
Emergency Loan 3.750%
19 USDA (2010).20 USDA AMS (2008).21 USDA FNS (2009).

United States WT/TPR/S/235Page 88
Source: USDA FSA (2010), Farm Loan Programmes, Interest Rates. Viewed at: http://www.fsa.usda.gov/FSA/webapp? area=home&subject=fmlp&topic=dfl-ir [February 2010].
(f) Title VII (Research and Related Matters)
32. The USDA has a wide-ranging research programme implemented primarily through the Agricultural Research Service, other State agencies, and universities. In addition to providing funding, the changes in the 2008 Farm Act are intended to improve efficiency through better coordination of research activities. The provisions include: the creation of the National Institute of Food and Agriculture (NIFA) to replace the Cooperative State Research, Education, and Extension Service; and the creation of the Research Extension and Education Office to assist with coordination. The 2008 Farm Act also increased the emphasis on awarding funding competitively, and research on organic and speciality agriculture.
(g) Title IX (Energy)
33. The 2008 Farm Act continues and expands funding for federal agency procurement of bio-based products, construction and development of advanced biofuel refineries, biomass research and development, and biodiesel education. New programmes encourage renewable energy use by bio-refineries, renewable energy systems and energy efficiency improvements, rural energy self-sufficiency, development of next generation feedstocks, and use of forest and woody biomass for energy production. The Biorefinery Assistance programme seeks to encourage production of biofuels from renewable biomass sources other than maize-kernel starch. It covers grants for the construction of biofuel refineries of demonstration size, and loans for the construction of new refineries of commercial size. In addition, the Bioenergy Program for Advanced Biofuels provides payments to producers who produce, under contracts with the USDA, biofuels from renewable biomass other than corn-kernel starch. The new programmes in the 2008 Farm Act include the Biomass Crop Assistance Program to assist producers of biomass crops and conversion plants, and the Agricultural Bioenergy Feedstock and Energy Efficiency Research and Extension Initiative, which provides grants for research and extension services. Total mandatory funding through the 2008 Farm Act is about US$620 million.
(h) Title X (Horticulture and Organic Agriculture)
34. Under the Agricultural Marketing Agreement Act of 1937, growers and handlers of certain agricultural products may, with the approval of the Secretary of Agriculture, establish a marketing order under which measures can be taken to promote orderly markets. Orders vary considerably in their terms and conditions. In some cases they may include supply control through marketing restrictions and/or reserve pools. Marketing orders for tart cherries, cranberries, hazelnuts, dried prunes, raisins, and spearmint oil include volume control measures.22
35. Federal crop insurance is addressed under Title X although it covers a wide range of crops and risks. Although the insurance is provided by the private sector, "the Government subsidizes a significant portion of the cost."23
36. The 2008 Farm Act extended the Speciality Crop Block Grant Program through to FY2012. Under the Programme, individual States may apply to the USDA's Agricultural Marketing Service for
22 USDA (2008).23 USDA, Briefing Rooms: Fruit and Tree Nuts: Policy, Viewed at http://www.ers.usda.gov/
Briefing/FruitandTreeNuts/Policy.htm#cropins [February 2010].
WT/TPR/S/235 Trade Policy ReviewPage 89
grants to improve the competitiveness of fruits, vegetables, tree nuts, dried fruits, horticulture, and nursery crops (including floriculture).
(i) Title XI (Livestock)
37. Although the 2008 Farm Act has a Title dedicated to livestock, the provisions under Title XI are not all exclusively for livestock, such as the provisions relating to country-of-origin-labelling (COOL). In most cases, the United States' policies relating to livestock are confined to insurance and disaster relief programmes, animal health programmes, and assistance in meeting sanitary measures within the United States and in export markets. According to the OECD, transfers arising from government programmes in FY2006-2008 to pig meat, poultry, beef, and veal producers were zero.24
38. The main exception to the general livestock policy is wool and mohair production. The 2002 Farm Act reintroduced support for wool and mohair, which was continued in Title I of the 2008 Farm Act (see Table AIV.3).
39. The 2008 Farm Act added chicken, goat meat, ginseng, pecans and macadamia nuts to the list of commodities covered by the country-of-origin labelling provisions.25 It also introduced different categories of labels depending on whether the animal was born, raised and/or slaughtered in the United States. On 19 November 2009, the DSB established a panel to hear complaints from Canada and Mexico on the country-of-origin labelling provisions.26
(j) Title XII (Crop Insurance and Disaster Assistance Programs)
40. The 2008 Farm Act retained, with minor amendments, the crop insurance programme set up under earlier legislation. As stated, under Title X, crop insurance is provided by the private sector at subsidized rates under terms set by the Federal Crop Insurance Corporation and administered by the USDA Risk Management Agency.
41. Supplemental Agricultural Disaster Assistance (SADA) provides disaster assistance payments to producers of eligible commodities (crops, farm-raised fish, honey, and livestock) in counties declared by the Secretary of Agriculture to be "disaster counties," including counties contiguous to disaster counties and any farms with losses in normal production of more than 50% in a calendar year. SADA is effective only for losses incurred as result of a disaster, adverse weather, or other environmental condition that occurs on or before 30 September 2011.
(iii) Agriculture tariffs and tariff quotas
42. Tariffs and tariff-rate quotas for agricultural products are not covered in the Farm Act 2008. Based on the WTO definition of agricultural products, the Harmonized Tariff Schedule of the United States (HTSUS) has 1,791 tariff lines at the 8-digit national level. Some of these lines refer to in-quota tariff rates with other tariff lines for the same product giving the out-of-quota rate. There are 1,595 tariff lines for out-of-quota tariff rates for agricultural products.27
24 OECD (2009b), p. 239.25 Other commodities include: muscle cuts of beef, lamb, and pork; ground beef, ground lamb, and
ground pork; farm-raised fish and shellfish; wild fish and shellfish; perishable agricultural commodities (fresh fruits and vegetables as defined by the Perishable Agricultural Commodities Act); and peanuts.
26 WTO document series WT/DS/384/- and WT/DS/386; and WT/DSB/M/276, 29 January 2010.27 For more information see HTSUS at: http://www.usitc.gov/publications/docs/tata/hts/bychapter/
1000gntoc.htm [May 2010].
United States WT/TPR/S/235Page 90
43. For these 1,595, the average applied MFN tariff is 8.9%, which is relatively low compared with some other WTO Members. However, rates vary a lot from one product group to another, from 350% for some tobacco tariff lines to zero for 368 tariff lines. Of these 1,595 tariff lines, 696 have non-ad valorem duties. Ethyl alcohol used as fuel is also subject to "other duties or charges" and bound in HTSUS at US$0.1427 per litre.
44. The highest tariffs are on tobacco, sugar, peanuts, and dairy products, followed by beef, cotton, and certain horticultural products (such as mushrooms).
45. The United States notifies the Committee on Agriculture for 44 tariff quotas covering 171 tariff lines, mostly for dairy products, sugar products, products containing sugar and/or dairy ingredients and cotton. The most recent notification is for 2007 and 2008.28 Fill rates varied significantly from one quota to another and have been particularly low for cotton, possibly reflecting the decline of the textiles and clothing industry. They were also quite low for some dairy and other products. On the other hand, in-quota imports were close to or greater than the quota quantity in several cases.
46. The United States has reserved the right to use the Special Agricultural Safeguard on 189 tariff lines, mostly dairy products, sugar products, products containing sugar and/or dairy ingredients, and cotton. The quantity-based SSG was last used in 2003. However, the price-based safeguard has been applied much more frequently. It was used 61 times in 2007, and 53 times in 2008. In nearly all cases, the SSG was applied to very small quantities, for example: 4kg of cream over 45% fat; and 3kg of cocoa powder over 65% sugar, but it was also used on commercially significant imports, such as 327 tonnes of milk-based drinks and 2,598 tonnes of frozen, boneless bovine meat.29
(iv) Support levels
47. Notifications by the United States to the WTO Committee on Agriculture cover domestic support up to crop year 2007 and do not include changes resulting from the 2008 Farm Act. However, although changes were made in the Act to payment rates and coverage in existing programmes, and some new programmes were established, the 2008 Farm Act does not represent a radical departure from the 2002 Farm Act.
48. The notification for support for crop year 2007 stated that total support to agriculture was US$84.65 billion. Of this, US$76.2 billion was notified under the Green Box, of which: US$54.4 billion was for domestic food aid; US$5.2 billion was notified as Direct Payments under decoupled income support; US$4.3 billion was annual outlays by states for services; and US$1.9 billion was for the Conservation Reserve Program.
49. The Current Total Aggregate Measurement of Support (Current Total AMS) in the United States was US$6.3 billion in 2007. In addition, there was US$2.0 billion in non-product-specific support and US$0.2 billion in other product-specific support, which were below the de minimis limits.
50. Thus, Amber Box support in the United States is a small portion of total support notified to the WTO. Most of this support is related to prices, to production or to both. Marketing assistance loan programmes for cereals, oilseeds and cotton effectively give nearly all producers of these
28 WTO document G/AG/N/USA/72 of 1 March 2010.29 WTO document G/AG/N/USA/67, 2 March 2009.
WT/TPR/S/235 Trade Policy ReviewPage 91
products guaranteed minimum prices by providing compensation for falls in market prices30 below the loan rates set out in the Farm Act. Counter-cyclical payments also provide some compensation should prices fall below the target prices in the Act, although in this case, payments are decoupled from production. Apart from upland cotton, there have been essentially no marketing loan payments since 2005 because market prices have been greater than the Farm Bill loan rates. Other commodities also qualify for price-related support programmes such as non-recourse commodity loans for sugar and minimum purchase prices for dairy products.
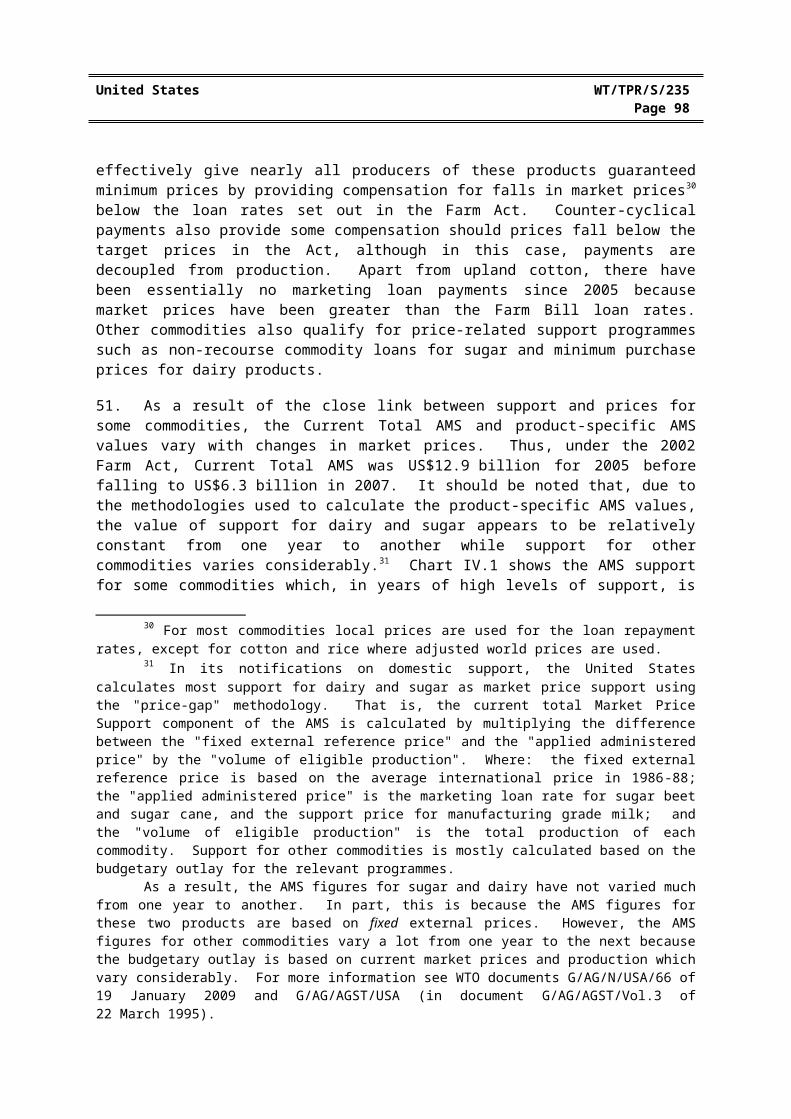
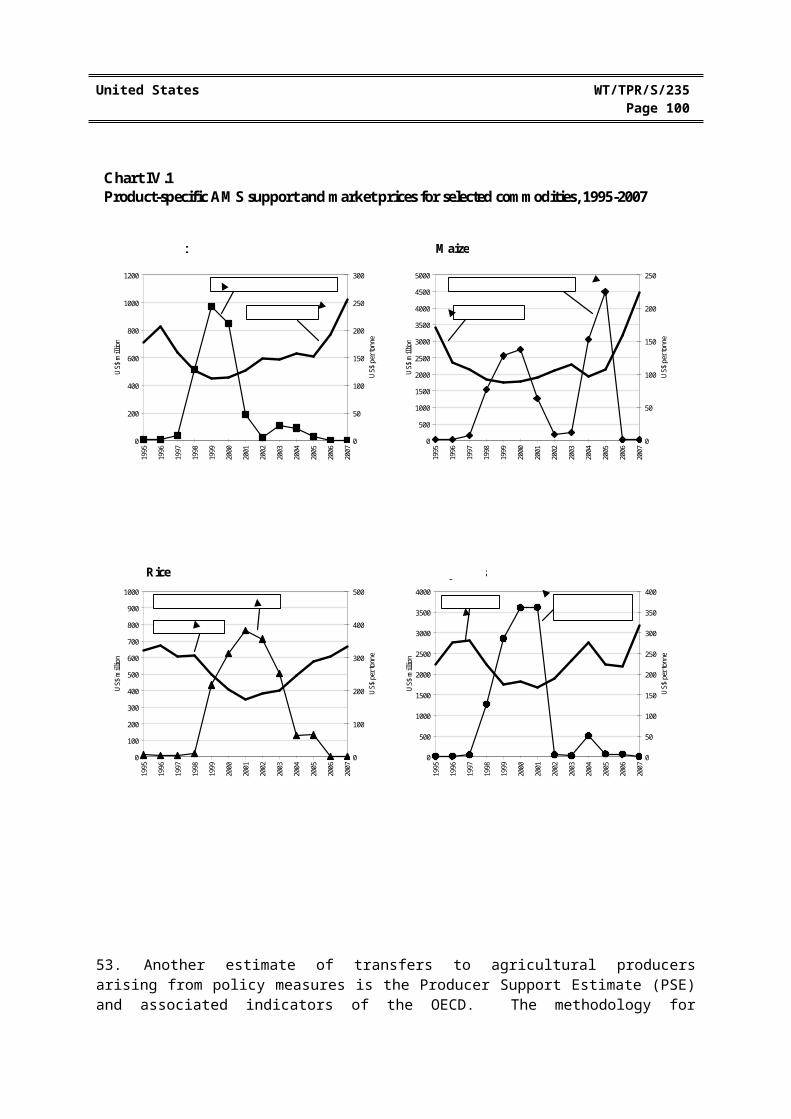
51. As a result of the close link between support and prices for some commodities, the Current Total AMS and product-specific AMS values vary with changes in market prices. Thus, under the 2002 Farm Act, Current Total AMS was US$12.9 billion for 2005 before falling to US$6.3 billion in 2007. It should be noted that, due to the methodologies used to calculate the product-specific AMS values, the value of support for dairy and sugar appears to be relatively constant from one year to another while support for other commodities varies considerably.31 Chart IV.1 shows the AMS support for some commodities which, in years of high levels of support, is almost entirely made up of payments under the marketing assistance loan programme. The chart shows the degree to which support, as measured by the Current Total AMS, varies with prices. It does not include counter-cyclical payments which, though price-based, are decoupled from production.
52. Notifications to the Committee on Agriculture of the Current Total and product-specific AMS were not meant to be indicators of the value of transfers to producers. The Current Total AMS is the basis for the Committee on Agriculture to review implementation of commitments in the WTO. However, for the United States, for products other than dairy and sugar, the product-specific AMS can be a useful indicator of support as it reflects budgetary outlay.
30 For most commodities local prices are used for the loan repayment rates, except for cotton and rice where adjusted world prices are used.
31 In its notifications on domestic support, the United States calculates most support for dairy and sugar as market price support using the "price-gap" methodology. That is, the current total Market Price Support component of the AMS is calculated by multiplying the difference between the "fixed external reference price" and the "applied administered price" by the "volume of eligible production". Where: the fixed external reference price is based on the average international price in 1986-88; the "applied administered price" is the marketing loan rate for sugar beet and sugar cane, and the support price for manufacturing grade milk; and the "volume of eligible production" is the total production of each commodity. Support for other commodities is mostly calculated based on the budgetary outlay for the relevant programmes.
As a result, the AMS figures for sugar and dairy have not varied much from one year to another. In part, this is because the AMS figures for these two products are based on fixed external prices. However, the AMS figures for other commodities vary a lot from one year to the next because the budgetary outlay is based on current market prices and production which vary considerably. For more information see WTO documents G/AG/N/USA/66 of 19 January 2009 and G/AG/AGST/USA (in document G/AG/AGST/Vol.3 of 22 March 1995).

United States WT/TPR/S/235Page 92
0
200
400
600
800
1000
1200
1995
1996
1997
1998
1999
2000
2001
2002
2003
2004
2005
2006
2007
US$
mill
ion
0
50
100
150
200
250
300
US$
per
tonn
e
Chart IV.1Product-specific AMS support and market prices for selected commodities, 1995-2007
Wheat
0
500
1000
1500
2000
2500
3000
3500
4000
4500
5000
1995
1996
1997
1998
1999
2000
2001
2002
2003
2004
2005
2006
2007
US$
mill
ion
0
50
100
150
200
250
US$
per
tonn
e
Maize
0
100
200
300
400
500
600
700
800
900
1000
1995
1996
1997
1998
1999
2000
2001
2002
2003
2004
2005
2006
2007
US$
mill
ion
0
100
200
300
400
500
US$
per
tonn
e
0
500
1000
1500
2000
2500
3000
3500
4000
1995
1996
1997
1998
1999
2000
2001
2002
2003
2004
2005
2006
2007
US$
mill
ion
0
50
100
150
200
250
300
350
400
US$
per
tonn
e
Rice Soybeans
Note: Year starting 1 June.Wheat price for U.S. No. 1 HRW, f.o.b. Gulf of Mexico.
Note: Year starting 1 September.Maize price for U.S. No. 2 yellow, f.o.b. Gulf of Mexico.
Note: Year starting 1 August.Price for 5% broken, nominal price quote, f.o.b. Bangkok.
Note: Year starting 1 September.Price for soybeans; U.S., c.i.f. Rotterdam.
Wheat product-specific AMS Maize product-specific AMS
Rice product-specific AMS Soybeans product-specific AMS
IMF price IMF price
IMF price
IMF price
Note: Product-specific AMS includes de minimis support but does not include counter-cyclical payments.
Source: WTO notifications: G/AG/N/USA/10, 17, 27, 36, 43, 51/Rev.1, 60/Rev.1 and 66. Annual average prices are based on IMF Commodity Prices for the relevant crop years.
WT/TPR/S/235 Trade Policy ReviewPage 93
53. Another estimate of transfers to agricultural producers arising from policy measures is the Producer Support Estimate (PSE) and associated indicators of the OECD. The methodology for calculating PSEs and associated indicators is different from that used to calculate the AMS and the two sets of data are not compatible or comparable. Furthermore, the methodology used by the OECD is evolving and was revised for the 2007 Monitoring and Evaluation report resulting in several changes, including the estimates of support of specific commodities.32
54. According to the OECD, the PSE for agriculture in the United States was 7% of gross farm receipts, which is the third lowest among OECD countries where the average PSE was 21%.33 It is also lower than in some non-OECD countries for which PSE figures have been calculated.34
However, because the United States has a large agriculture sector this percentage translates into an absolute level of support of US$23.3 billion, which is the third highest in the OECD.
55. The PSE is an indicator of support to all agricultural producers. The OECD indicator for commodity-specific support is the Single Commodity Transfer (SCT) which, for the United States (and other countries), varies from one product to another reflecting the different programmes affecting different products. The SCT for each product also varies from one year to another which reflects the close link between commodity-specific programmes and production and prices (see Table IV.6) for some products. The high levels of support shown for sugar and milk in some years reflects the relatively high tariffs in these two sectors as well as the budgetary programmes covering them.
Table IV.6Total producer support estimate and single commodity transfer values for selected commodities(US$ million or % of gross farm receipts)
2004 2005 2006 2007 2008
Total PSEUS$ million 43,104 41,929 31,199 33,953 23,359% of gross farm receipts 16 16 11 10 7
WheatUS$ million 353 124 544 493 502% of gross farm receipts 4.6 1.7 6.6 3.6 2.9
MaizeUS$ million 2.952 4,443 138 -246 727.0% of gross farm receipts 10.8 16.7 0.4 -0.5 1.5
RiceUS$ million 135 110 18 8 12.0% of gross farm receipts 7.4 6.1 0.9 0.3 0.4
Soya beansUS$ million 517 -87 -77 152 1,241.0% of gross farm receipts 2.8 -0.5 -0.4 0.6 4.3
SugarUS$ million 1,053 896 519 775 574% of gross farm receipts 54.2 44.4 21.4 34.8 27.0
MilkUS$ million 7,623 4,833 3,700 8,433 5% of gross farm receipts 27.6 18.0 15.6 23.6 0.0
Source: OECD (2007, 2008, and 2009), Agricultural Policies in OECD Countries. Monitoring and Evaluation, Paris.
56. According to the OECD, marketing loan benefits (used for cereals, oilseeds, cotton, pulses, and wool) and market price supports (used for sugar and dairy), are among the less efficient and more
32 OECD (2007).33 OECD (2009b).34 OECD (2009a).

United States WT/TPR/S/235Page 94
trade-distorting forms of support to agricultural producers. The OECD has stated that such policies are less efficient than alternatives, such as decoupled or area-based payments, because a large part of the benefits are lost to higher input and resource costs, and that these policies can also distort trade to a greater extent than their more efficient alternatives.35
(2) FINANCIAL SERVICES
(i) General legal framework
57. The Gramm-Leach-Bliley Act (Financial Services Modernization) of 1999 (GLBA) is the main law regulating the consolidated financial sector.36 The Financial Services Regulatory Relief Act of 2006 introduced changes to U.S. financial service legislation affecting banking, securities, and insurance. Under the McCarran-Ferguson Act of 1945 (U.S. Code Title 15, Chapter 20), regulation of insurance services is primarily at the state level. The Federal Reserve is the umbrella regulator for financial conglomerates that include a bank. The activities of subsidiaries of financial holding companies (FHCs) are regulated by several different regulators.37 Banking sector supervision is the responsibility of both federal and state regulators.38
58. There have been no major changes affecting the basic conditions of market access and national treatment for foreign financial institutions in the United States since 2008. Initial entry into the U.S. market is permitted in all states through the establishment or acquisition of a nationally chartered bank subsidiary by a foreign person. U.S. bank subsidiaries of foreign banks are granted national treatment. A foreign bank must establish an insured banking subsidiary to accept or maintain domestic retail deposits of less than US$100,000. Branches and agencies of foreign banks have similar powers to banks but agencies may not accept deposits from U.S. citizens or residents. At the state level, there are limitations on the acquisition or establishment of a state-chartered bank, and on the establishment of branches or agencies.
59. Insurance companies, agents, and brokers must be licensed under the law of the State in which the risk they intend to insure is located, but states have taken steps to facilitate multi-state operations. Foreigners may acquire an insurance company licensed in all states, incorporate subsidiaries in 47 states, or operate as branches in 36 states and the District of Columbia. A federal tax on insurance policies covering U.S. risks is imposed at a rate of 1% of gross premiums on all reinsurance but at 4% of gross premiums with respect to non-life insurance when the insurer is not subject to U.S. net income tax on the premiums.
(ii) Recent developments
60. During the period under review, the U.S. financial sector was impacted by the severe crisis, which was triggered by a protracted downturn in the housing market and a sharp increase in delinquencies of sub-prime mortgages leading to a sudden drop in the price of the securities backed by those mortgages. The sub-prime mortgage crisis was the result of a macroeconomic environment with a prolonged period of low interest rates, high liquidity, and low volatility, which led financial
35 OECD (2002).36 WTO (2008).37 The Office of the Comptroller of the Currency (OCC) in the case of national banks; a state banking
agency and the Federal Reserve or Federal Deposit Insurance Corporation (FDIC) in the case of state-chartered banks; the Securities and Exchange Commission (SEC) in the case of securities firms; and a State insurance commission in the case of insurance companies.
38 The Federal Reserve Board shares responsibility with the OCC, the FDIC, the Office of Thrift Supervision (OTS), as well as with State regulators.

WT/TPR/S/235 Trade Policy ReviewPage 95
institutions to underestimate risks; lax credit and risk management practices in many financial institutions; and shortcomings in financial regulation and supervision.39
61. Output and employment in the financial services sector declined sharply during the review period. Real GDP in financial services and insurance declined for five consecutive quarters between Q4 2007 and Q4 2008 inclusive, before resuming positive growth rates in the first three quarters of 2009, and declining again in the fourth quarter of 2009.40 Employment in the U.S. financial services sector (finance and insurance) has also been strongly affected. Between early 2008 and March 2010, total employment in the sector contracted 7% to 5.7 million.41
62. Having recorded impressive growth rates in 2007 and 2008, U.S. exports and imports of financial services contracted severely during the last two quarters of 2008 and throughout 2009, before resuming growth in the first quarter of 2010 (Table IV.7).42 Exports of insurance services showed positive growth rates in 2008 and 2009, probably due to the major stability of insurance premiums compared with financial services assets, whose contraction may be reflected in the fall of fees and commissions included in financial services data. Imports of insurance services declines slightly in 2009.
Table IV.7Exports and imports of financial and insurance services, 2008-10Year-on-year percentage change
2008:I 2008:II 2008:III 2008:IV 2009:I 2009:II 2009:III 2009:IV 2010:I
Exports
Financial services 13.5 4.2 -8.6 -8.6 -16.0 -13.7 -3.3 -1.2 8.3
Insurance services 21.9 31.1 25.0 21.7 19.1 8.0 2.6 4.5 1.3
Imports
Financial services 20.3 5.5 -2.9 -12.7 -30.4 -17.8 -15.7 -7.6 12.8
Insurance services 15.7 18.4 14.5 23.8 9.6 -1.8 -5.6 -7.2 -4.8
Source: U.S. Bureau of Economic Analysis online information. Viewed at: http://www.bea.gov.
(iii) Policy actions in response to the crisis
63. During the period under review, developments in financial services policy and regulation were driven to a large extent by the unprecedented financial crisis that virtually paralysed credit markets. Through a series of actions by the Federal Reserve, the FDIC, and the Treasury Department, the immediate effects of the crisis were mitigated and some degree of stability returned to the financial system, allowing policymakers to turn their attention to overall financial regulatory reform.
64. The immediate measures taken fall into the following categories: (1) guarantees of bank liabilities; (2) retail deposit guarantees; (3) central bank assistance measures; (4) bank recapitalization through equity investments by private investors and Government; (5) open-market or negotiated acquisitions of illiquid or otherwise undesirable assets from weakened financial institutions; and (6) assistance to individual financial institutions.
39 WTO (2008).40 USBEA (2010).41 Department of Labor online information. Viewed at: http://data.bls.gov/PDQ/servlet/Survey
utputServlet.42 Figures for financial services supplied through affiliates are only available up to 2007. Nonetheless
the U.S. Bureau of Economic Analysis has recently revised the statistics for services supplied through affiliates and has for the first time incorporated services provided by bank affiliates, and for U.S. multinationals, services provided by non-bank affiliates of bank parents.

United States WT/TPR/S/235Page 96
65. On 3 October 2008, the U.S. President signed into law the Emergency Economic Stabilization Act of 2008 (EESA), which provided budgetary authorization of up to US$700 billion to respond to the crisis. This authorization was utilized through the Troubled Assets Relief Program (TARP), which enabled the Secretary of the Treasury to purchase, and to make and fund commitments to purchase troubled assets from any financial institutions. The purpose of the TARP was to restore the liquidity and stability of the financial system. The Act defines "financial institution" as including "any institution, including, but not limited to, any bank, savings association, credit union, security broker or dealer, or insurance company, established and regulated under the laws of the United States or any State, territory, or possession of the United States ... but excluding any central bank of, or institution owned by, a foreign government". Foreign institutions established and regulated in the United States were therefore, in principle, eligible for relief. In May 2010, the Department of the Treasury notified Congress that the projected lifetime cost of TARP would total US$105.4 billion.43
66. To meet the goals of the EESA, the Treasury established several programmes under the TARP, and defined eligibility guidelines for each programme. According to the application guidelines for the Capital Purchase Program, the largest single program under TARP, and the TARP Capital Assistance Program, "applicants must be established and operating in the United States and may not be controlled by a foreign bank or company".44 Similarly, according to the "summary of terms" for the TARP Legacy Loans Program, banks or savings associations owned or controlled by a foreign bank or company are not eligible to participate in this programme.45 According to the U.S. authorities, this approach was based on the rationale that: U.S. subsidiaries of foreign banks that needed additional capital should initially look to their parent banks; and the financial regulator of the country where the parent bank is subject to comprehensive consolidated supervision are best positioned to determine the overall strength of the financial conglomerate. The U.S. authorities also note that this principle is well established in international banking supervision and regulation, as set out, for example, in the Basel Committee’s Concordat.46
67. In addition to the TARP programmes, temporary liquidity guarantee programmes were implemented by the FDIC. These are the Transaction Account Guarantee Program (TAGP), which fully guarantees non-interest-bearing transaction deposit accounts above US$250,000, and the Debt Guarantee Program (DGP), which guarantees eligible senior unsecured debt issued by eligible institutions. All insured depository institutions, including insured U.S. branches of foreign banks, were eligible to participate in the TAGP, while all U.S. established entities that are, or own, an insured bank were eligible to participate in the Debt Guarantee Program. The standard insurance amount of US$250,000 per depositor (increased from US$100,000) is in effect until 31 December, 2013.
68. Substantial liquidity support – well over US$1 trillion – was provided by the Federal Reserve, both directly to the markets and via programmes such as the Asset-Backed Securities Loan Facility, or the Term Asset-Backed Securities Loan Facility (TALF); the Primary Dealer Credit Facility; and liquidity swaps with foreign central banks.47
43 U.S. Department of the Treasury (2010), Troubled Assets Relief Program: Monthly 105(a) Report May 2010, 10 June. Viewed at: http://www.financialstability.gov/docs/May%202010%20105(a)%20Report_ final.pdf.
44 Application Guidelines for TARP Capital Purchase Program. Viewed at: http://www. financialstability.gov/docs/CPP/application-guidelines.pdf; and Application Guidelines for Capital Assistance Program. Viewed at: http://www.financialstability.gov/docs/CAP_App-Guidelines.pdf.
45 Legacy Loans Program Summary of Terms. Viewed at: http://www.treas.gov/press/releases/ eports/legacy_loans_terms.pdf.
46 Principles for the Supervision of Bank’s Foreign Establishments.

WT/TPR/S/235 Trade Policy ReviewPage 97
(iv) Financial regulatory reform
69. On 17 June 2009, the U.S. Administration released the details of its comprehensive financial regulatory reform proposal, aimed at addressing the regulatory gaps that resulted in the financial crisis.48 This white paper was soon followed by proposed implementing legislation.
70. The proposal is structured around five key objectives: (1) promote robust supervision and regulation of financial firms; (2) establish comprehensive supervision of financial markets; (3) protect consumers and investors from financial abuses; (4) provide the Government with the tools needed to manage financial crises; and (5) raise international regulatory standards and improve international cooperation. The legislation has not been approved by Congress (June 2010).
(3) TRANSPORT
(i) Air transport services
(a) Main features
71. By many measures the United States continues to have the largest airlines, busiest airports, and most comprehensive air transport network in the world:
In terms of passengers carried, five of the top ten airlines are based in the United States (Southwest Airlines, American Airlines, Delta Air Lines, United Airlines, and US Airways);
In terms of passenger-kilometres flown five of the top ten airlines are based in the United States (American Airlines, United Airlines, Delta Air Lines, Continental Airlines, and Southwest Airlines);
The world's two largest air cargo carriers, in terms of tonne-kilometres are based in the United States (Federal Express and UPS Airlines)49; and
Five of the ten busiest airports in the world are in the United States (Hartsfield-Jackson Atlanta International, O'Hare International, Los Angeles International, Dallas-Fort Worth International, and Denver International).50
72. Air freight is mostly used for perishable and/or high value goods and, in 2007, represented only 40 billion ton-miles out of a total of 3,491 billion ton-miles for all modes of transport.51
Nevertheless, in value terms, air freight accounted for 23% of imports in 2006 52 (and presumably a similar portion in more recent years). However, in 2009, the quantity delivered by air freight was down 23% from its 2007 peak. The Implementing Recommendations of the 9/11 Commission Act of
47 The TALF is a joint endeavour of Treasury (which contributed a US$20 billion subordinated loan) and the Federal Reserve, whose objective was to fund buyers of asset-backed securities. On 31 March 2010 TALF ceased for issued asset-backed securities and legacy commercial mortgage-backed securities.
48 See Financial Regulatory Reform – A New Foundation: Rebuilding Financial Supervision and Regulation.
49 IATA (2010), and taking into account the merger of Delta Air Lines and Northwest Airlines announced in April 2010.
50 EU Infrastructure, "The Busiest Airports in the World", Sam Conrad 8 October 2009. Viewed at: http://www.euinfrastructure.com/news/Busy-month-for-Heathrow/ [March 2010] and taking into account the merger of Delta Air Lines and Northwest Airlines announced in April 2010.
51 Department of Transportation (2008).52 Interagency Working Group on Food Safety (2007).
United States WT/TPR/S/235Page 98
2007, require that, as of 1 August 2010, each piece of cargo transported on passenger aircraft in the United States to be screened before being transported. In 2009 50% of such cargo was screened. According to the FAA, the additional cost of screening and the burden of the additional time needed will fall on the air cargo industry.53
73. Commercial aviation in the United States (and elsewhere) faced various difficulties in 2008 and 2009. In FY2008 and 2009, commercial carriers in the United States had net losses of US$18.6 billion and US$8.1 billion. Costs and passenger revenues both declined in 2009 as a result of lower fuel prices and reduced fares.54 The airlines' financial problems in 2008 and 2009 probably reinforced the trends towards: consolidation among airlines, such as the merger between Delta and Northwest Airlines; concentration of activity in a smaller number of airports, as some hub-and-spoke carriers have focussed services at fewer hubs; and convergence of unit costs between low-cost and network airlines.55
74. The performance of the largest U.S. air carriers (i.e., certificated air carriers that account for at least 1% of domestic scheduled passenger revenues) in terms of on-time arrivals improved from 73% in 2007 to 80% in 2009. The primary causes of delays in 2009 were the national aviation system, the late arrival of the incoming aircraft, and air-carrier caused delays.56 All were related to congestion, and the improvement in on-time arrivals during 2007-09 could be because fewer passengers and planes were in the air (i.e., less congestion) as airlines cut capacity due to the general economic downturn. According to the authorities, the Department of Transportation is committed to protecting consumers and ensuring that the quality of air service continues to improve. The U.S. Department of Transportation plans to pursue enforcement action aggressively, including assessment of civil penalties, against U.S. airlines that violate a new rule that went into effect in April 2010 that prohibits them from operating chronically delayed flights or subjecting passengers to lengthy tarmac delays.
75. All public airports with commercial services are publicly owned, although some are partly or wholly operated through outsourcing and management contracts.57 This practice is particularly common in airport services, such as terminal and parking area operations, ground transport, building maintenance, baggage handling, and construction and engineering. With the exception of security services, foreign services suppliers may provide services to airports on the same terms and conditions as domestic suppliers. Security standards for all public airports, and security screening at such airports are administered, regulated, and enforced by the Transportation Security Administration of the Department of Homeland Security.
76. Through the Airport Improvement Program (AIP) the FAA provides grants for the development of public airports, including airports with no scheduled passenger flights, which may be privately owned.58 The proportion of costs covered by grants from the AIP vary with the type of work and the size of the airport and can be as high as 95% of eligible costs for small primary, and general aviation airports. The Program is funded through taxes on passenger ticket sales and aviation fuel. Grants for airport improvement require airlines to be able to self-handle and use of airport facilities to be non-discriminatory.59 US$3.9 billion was authorized for the AIP in FY2009.60
53 FAA (2010b).54 FAA (2010b).55 Tsoukalas et. al (2008); and Button (2008).56 Research and Innovative Technology Administration (2010).57 WTO (2008).58 Kirk (2009).59 WTO (2008).

WT/TPR/S/235 Trade Policy ReviewPage 99
77. Funds provided under the ARRA, specifically to the Federal Aviation Administration for airports, require that the steel and manufactured goods used in the project must be produced in the United States (see Chapter III(3)(iii)).61 A waiver may be sought when procuring a facility or equipment if the cost of components and subcomponents produced in the United States is more than 60% of the cost of all components, and final assembly is in the United States.
78. There are no legal or regulatory barriers to private ownership of airports with commercial service, but the general legal complexity at federal, state and local level, plus restrictions on the use of revenues have meant that there has been little interest from the private sector. The Airport Privatization Pilot Program, which began in 1997, was intended to assess whether privatization is a feasible way to tap private capital for airport improvement and development. However, the scope of the programme is limited as it provides for only one large hub airport, and an application (which remains active) was made in September 2006 by a public body, the City of Chicago, for the Chicago Midway International Airport. Of the other seven airports considered for the programme:
one is no longer in the programme (Stewart International Airport, Newburgh, NY);
three have withdrawn their applications (San Diego Brown Field, CA; Rafael Hernandez Airport, Puerto Rico; and New Orleans Lakefront, LA);
one has had its application terminated (Niagara Falls International Airport, NY); and
two have had preliminary applications approved (Luìs Muñoz Marín International Airport in Puerto Rico, and Louis Armstrong New Orleans International Airport in New Orleans).62
79. Stewart International Airport (SWF) in Newburgh, NY, is the only airport to receive final agency approval. National Express Group, a private company from the United Kingdom, operated SWF Airport from March 2000, until October 2007, when the Port Authority of New York and New Jersey purchased the National Express Group's Airport Lease.
80. The authorities note that an airport's participation in the Pilot Program is voluntary; and the decision to submit an application rests with the airport owner. They also point out that there is usually heightened interest in the Program during periods of economic distress, as local municipalities look to the Pilot Program in an effort to increase municipal funds without raising taxes. However, overall, there has not been significant interest in airport privatization in general in the United States for a number of reasons: (1) local government's reluctance to cede control of the airport to a private entity; (2) the availability of, and access to tax exempt financing and other low cost financing options, and (3) airlines' opposition to airport privatization and their perception that the loss of governmental control may produce higher costs. The authorities also note that the Chicago Midway application marks the first time airlines have agreed to support airport privatization at an air carrier airport, and they state that such support (65% of air carriers serving an airport) is necessary for a public sponsor to recover funds from the sale or lease of the airport.
(b) Regulatory framework
81. There has been no significant change in the regulatory framework for air transport during the review period. Within the Department of Transportation, the Office of the Assistant Secretary for
60 Federal Aviation Administration Extension Act of 2009, Sec. 4. Viewed at: http://frwebgate.access. gpo.gov/cgi-bin/getdoc.cgi?dbname=111_cong_bills&docid=f:h1512rds.txt.pdf [April 2010].
61 49 U.S.C. section 50101.62 FAA (2010a).
United States WT/TPR/S/235Page 100
Aviation and International Affairs is responsible for economic policy and regulation, while the Federal Aviation Administration is responsible for safety issues, regulation of commercial space aviation, and monitoring air carriers operating in the territory of the United States. The Transportation Security Administration of the Department of Homeland Security is responsible for the security of air transport in the United States, including regulating and monitoring the implementation of security standards at U.S. airports, and of U.S. aircraft operators and foreign air carriers operating to, from, and within the United States.
82. Anyone wishing to provide air transport services as an air carrier must obtain two separate authorizations from the DOT: "economic" authority from the Office of the Secretary of Transportation, and "safety" authority from the FAA. The FAA's Air Traffic Organization (ATO) established in February 2004 to oversee the U.S. air traffic system. It provides all air traffic services in the United States. In addition, any authority to operate in U.S. air commerce granted by the Secretary of Transportation is conditional on the operator also satisfying the security requirements established by the Transportation Security Administration of the Department of Homeland Security.
83. U.S. air carriers are still required to be under the actual control of U.S. citizens.63 Non-U.S. citizens may not own more than 25% of the voting interest in a U.S. air carrier. The Department of Transportation may, on a case-by-case basis, allow total foreign equity investments (voting and non-voting) above 25%, as long as actual control remains in the hands of U.S. citizens. In all cases, the president and two thirds of the board of directors and other managing officers must also be U.S. citizens. The restrictions on foreign ownership of airlines based in the United States were first included in the Air Commerce Act of 1926 and set at 75% domestic ownership in the Civil Aeronautics Act of 1938.64
84. The FAA's War Risk Aviation Insurance Program provides war risk hull loss and passenger and third-party liability insurance to the domestic airline industry, as required by the Homeland Security Act of 2002 as amended by the FAA Extension Act of 2010. The authorities note that the Program charges premiums and has accumulated reserves to pay claims. They state that the general procedure used to develop the premium structure for each of the three insurance categories is:
To adopt a plausible accident scenario basis for the severity and frequency of future hostile acts against aviation (the premiums for all three insurance categories assumed an accident rate of one catastrophic incident every two years, or equivalently, one-half accident per year);
To estimate the reasonable liability implications for each insurance category under that accident scenario;
To calculate the aggregate premium level that would be needed (per year and over the term of the policy) to cover the expected liability under each insurance category; and
To allocate those premiums among the airlines on the basis of fair and relevant factors.
85. The United States has GATS commitments with respect to aircraft repairs and maintenance, and has scheduled MFN exemptions with regard to the sale and marketing of air transport services and the operation and regulation of CRS services.
86. Since end 2007 the United States has completed negotiations on "open-skies" agreements with Australia, Barbados Croatia, Kenya, Laos, Armenia, Zambia, Israel, and Trinidad and Tobago,
63 WTO document WT/TPR/S/200/Rev.1.64 Dempsey (2008).
WT/TPR/S/235 Trade Policy ReviewPage 101
and with the European Commission on further liberalization of air transport.65 It also initialled an MOU with Japan in December 2009, which would, upon signature, implement an open-skies agreement. The United States also forms part of the Multilateral Agreement on the Liberalization of Air Transport (MALIAT) concluded between various members of APEC (Brunei, Chile, Cook Islands, United States, New Zealand, Samoa, Singapore, Tonga, and Mongolia). Altogether, the United States has negotiated Open Skies agreements with 99 partners, (counting the EU as 27).
87. The second-stage U.S.-EU Air Transport Agreement was signed on 24 June 2010. With respect to ownership of U.S. and EU airlines, the agreement provides for the possible expansion of opportunities in the future, contingent on confirmation that reciprocal investment is allowed. The U.S.-EU Joint Committee, which meets at least once a year, is mandated to review developments and to improve cooperation, including appropriate recommendations in this regard. Cabotage restrictions in the United States remain and domestic transport may only be provided by U.S. carriers except in limited circumstances. Furthermore, the crews engaged in domestic air passenger and freight service must be U.S. nationals or resident aliens, and other restrictions apply.66
(ii) Maritime transport
(a) Main features
88. In 2008, waterborne commerce in the United States was about 2.3 billion tonnes, down 0.5% from its peak in 2006, while the share of foreign trade remained fairly constant at about 60%.67 U.S. foreign trade accounted for 17% of global waterborne trade in 2008. Foreign container trade grew by 35% to 235 million tonnes from 2003 to 2008 but then contracted in 2009 to 214 million tonnes. Container trade remains concentrated in a few ports; the top four container ports (Los Angeles, Long Beach, New York/New Jersey, and Savannah) accounted for 60% of container imports in 2009 and 47% of container exports. Container cargo represents only 17% of U.S. international ocean-borne trade in terms of tonnage but 56% in terms of cargo value.68
89. Domestic trade accounts for 40% of waterborne trade in the United States. The Great Lakes represented over 9% of the domestic waterborne trade in 2008 (Chart IV.2).
90. The trade deficit in freight and port services declined from US$20.7 billion in 2005 to nearly US$9.8 billion in 2009 as exports of these services increased faster than imports between 2006 and 2008 and then, in 2009, they fell by less than imports.69
91. In 2008, there were 675 U.S.-owned ocean and Great Lakes vessels of which 238 were under the United States' flag and 145 had unrestricted coastwise trading privileges (Jones Act vessels – see below). The number of ocean-going vessels sailing under the flag of the United States has declined by 5% since 2003.
65 An "open-skies" agreement, while normally a significant step towards deregulation, is defined as not having limits on the number of flights or operating points, but this may not be extended to all freedoms.
66 WTO (2008).67 Department of Transportation (2009) Maritime Administration.68 Department of Commerce online information, USA Trade Online, U.S. Bureau of Census.
Viewed at: http://www.usatradeonline.gov/, April 27, 2010.69 BEA (2010b).

United States WT/TPR/S/235Page 102
Chart IV.2Waterborne trade in the United States, 2008(Million tonnes)
Source: U.S. Department of Transportation, Maritime Administration (2009), U.S. Water Transportation
Imports(892)
Great Lakes(85)
Inland(567)
Exports(484)
Coastwise(182)
Others(87)
Statistical_snapshot.pdf Statistical Snapshot , viewed at: http://www.marad.dot.gov/documents/US_Water_Transportation_
Petroleum(606)
LNG(10.1)
Grain(118.9)
Container(235.1)
Other(284.9)
Coal(102.8) Iron ore
(18.7)
(b) Regulatory framework
92. The regulatory framework for maritime transport in the United States has not changed during the review period. The United States Coast Guard of the Department of Homeland Security is the primary federal agency responsible for regulating maritime transport, including regulating vessel safety and security, environmental protection and response, and the licensing of mariners. In addition, the Maritime Administration (MARAD) of the Department of Transportation is responsible for certain maritime regulations, programmes that promote the use of waterborne transportation and its integration with other segments of the transportation system, and the viability of the U.S. merchant marine. MARAD is also responsible for a variety of programmes involving ships and shipbuilding, port operations, environment, and safety. It also maintains a reserve fleet of cargo ships for national emergencies, and operates a training academy for merchant seamen and provides training vessels for six state maritime academies.
93. The independent Federal Maritime Commission (FMC) is responsible for the regulation of ocean transportation intermediaries, ocean common carriers, cruise operators, and marine terminal operators. The FMC also operates a Consumer Affairs and Alternative Dispute Resolution programme. The FMC is responsible for the implementation of an alternative competition regime for ocean common carriers and marine terminal operators, whose collaboration may qualify for exemption from the generally applicable antitrust laws under the Shipping Act. Under the mandates of the Controlled Carrier Act, Section 19 of the Merchant Marine Act, 1920, and the Foreign Shipping Practices Act, the FMC also monitors the laws and practices of foreign governments and carriers for unreasonable practices affecting U.S. ocean-borne foreign commerce.70
70 FMC online information. Viewed at: http://www.fmc.gov.
WT/TPR/S/235 Trade Policy ReviewPage 103
94. The United States did not table an offer in the WTO Negotiations on Maritime Transport Services, suspended in June 1996. It has not tabled an offer with respect to maritime transport services in its offer on services in the Doha Development Agenda.71
(c) Water-borne trade
95. As reported in previous Trade Policy Reviews, cabotage of goods and passengers is restricted by Section 27 of the Merchant Marine Act of 1920 (Jones Act) and the Passenger Vessel Services Act of 1886. Under the Jones Act, cabotage is reserved for ships registered, built, and maintained in the United States, owned by a domestic individual, including corporations, and three quarters of the crew must be citizens of the United States. According to MARAD, the Jones Act fleets totals 38,000 vessels (including the 145 ocean and Great Lakes vessels referred to above) which represented an investment of US$48 billion and moves over 1 billion tonnes of cargo annually.72
96. Requests for waivers of the provisions of the Jones Act and the Passenger Vessel Services Act are made to the Commissioner, U.S. Customs and Border Protection (CBP). CBP is required to consult with MARAD and, as a matter of practice, also consults with other interested agencies before a waiver is granted or denied. Waivers of the Jones Act are only granted by the Secretary of the Department of Homeland Security only "in the interest of national defence", and consequently, only in "extremely rare" cases.73 MARAD is responsible for canvassing domestically flagged shipping to locate suitable vessels. Additionally, MARAD has sole responsibility for the programme for small passenger vessels to apply for waivers. Since 2006, one anchor-handling vessel was granted a waiver in April 2010 to operate in waters off Alaska, and waivers have also been granted in response to the oil spill cleanup arising from the Deepwater Horizon incident in the Gulf of Mexico.
97. The United States has bilateral maritime agreements in effect with Brazil (signed September 2005), China (December 2003), Russia (June 2001) and Viet Nam (March 2007). It also has an exchange of letters with Japan (November 1997) on port services, which has the effect of an agreement.74
98. The United States administers a number of maritime transport programmes related to national defence:
The Maritime Security Program (MSP) provides a fixed payment to operators of domestically flagged vessels under the Maritime Security Act of 2003. Annual spending of up to US$156 million was authorized for FY2006-08, US$174 for 2009-11; and US$186 for FY2012-1575; In FY2009, 59 vessels received MSP payments totalling US$166.5 million, or an average of US$2.8 million per vessel;
The Voluntary Intermodal Sealift Agreement (VISA) programme provides the Department of Defense with assured access to commercial intermodal capacity during time of war or
71 WTO document TN/S/O/USA, 9 April 2003.72 MARAD (2008).73 MARAD online information. Viewed at: http://www.marad.dot.gov/ ships_shipping_landing_page/
domestic_shipping/Domestic_Shipping.htm.74 MARAD online information. Viewed at: http://www.marad.dot.gov/about_us_landing_page/
international_activities/international_agreements/International_Agreements.htm [March 2010].75 MARAD online information. Viewed at: http://www.marad.dot.gov/ships_shipping_landing_page/
domestic_shipping/Domestic_Shipping.htm [March 2010].

United States WT/TPR/S/235Page 104
national emergency. VISA participants receive priority for award of DOD peacetime ocean freight contracts; and76
The Cargo Preference Act of 1904 requires all items procured for or owned by defence agencies to be carried exclusively on U.S.-flagged vessels.
99. Under the American Recovery and Reinvestment Act of 2009 MARAD received US$100 million for the Small Shipyards Grant Program, up from US$10 million in 2008. In August 2009, the Department of Transportation announced 70 grants worth US$98 million under the Program which provides grants of up to 75% of the cost of a wide variety of infrastructure and training projects.77 Port infrastructure projects are also eligible for projects under the Transportation Investment Generating Economic Recovery.78
100. In addition, existing legislation applies preferences to using domestically flagged vessels transporting goods under government programmes:
The Cargo Preference Act of 1954 requires that at least 50% of the gross tonnage of all government-generated cargo be transported on privately owned, domestically flagged commercial vessels, to the extent such vessels are available at fair and reasonable rates. The Act also requires that shipments from or to the Strategic Petroleum Reserve use domestically flagged tankers for at least 50% of oil transport;
The Food Security Act of 1985, requires that 75% of agricultural cargoes under certain USDA and USAID foreign assistance be carried on domestically flagged vessels: It also established the ocean freight differential (OFD) programme, which reimburses USDA and USAID for the additional cost of using these vessels; and
Public Resolution No. 17 of 1934 requires that exports of goods that benefit from export loans or credit guarantees from the Export Import Bank, must be carried in U.S. vessels, although the vessels of a recipient country may be granted access to 50% of those cargoes, where there is no discriminatory treatment against U.S.-flag carriers. Waivers may be granted, subject to reciprocal treatment for U.S.-flag vessels by the recipient country.79
101. The carriage of goods for international trade by liner services has traditionally been exempt from antitrust rules, and subject to regulation. Under the Ocean Shipping Reform Act (OSRA) of 1998, agreements among liner operators and marine terminal operators to discuss, fix, or regulate transportation rates, and other conditions of service, or cooperate on operational matters must be filed with, and examined by the Federal Maritime Commission. The Act also requires ocean carriers to publish tariff rates and charges for carriage for trade with foreign countries. The FMC also reviews the rates of government-controlled ocean carriers to ensure that the commercial carriers with whom they compete are not unfairly disadvantaged.
102. Under the Foreign Shipping Practices Act of 1988 the FMC is required to monitor and investigate conditions arising from foreign government or business practices in the U.S. foreign
76 MARAD online information. Viewed at: http://www.marad.dot.gov/ships_shipping_landing_page/ national_security/vol_intermodal_sealift_agreement/vol_intermodal_sealift_agreement.htm [March 2010].
77 MARAD online information. Viewed at: http://www.marad.dot.gov/about_us_landing_page/ marad_recovery_ act/recovery.htm. [March 2010].
78 Department of Transportation (2009).79 MARAD online information. Viewed at: http://www.marad.dot.gov/ships_shipping_landing_page/
cargo_preference/Cargo_Preference_Landing_Page.htm [March 2010].

WT/TPR/S/235 Trade Policy ReviewPage 105
shipping trades. The Commission is authorized to take action to address "unfavourable shipping conditions in U.S. foreign commerce and may impose penalties". No action was taken in FY2009.80
While the FMC continues to monitor potentially restrictive foreign shipping laws and practices, the only current active item is Docket 96-20, Port Restrictions and Requirements in the U.S./Japan Trade.
103. Although the European Union no longer applies exemptions to competition law for liner shipping, the United States has not indicated that it intends to move in a similar direction.
(4) TELECOMMUNICATIONS
(i) Market structure81
104. The telecommunications market in the United States is the largest in the world by revenue; at US$393 billion in 2007, it grew by 3% per year between 2004 and 2007. Annual investment also increased steadily since in the same period, reaching US$74.5 billion in 2007. Although this represented more than 40% of all investment in telecommunications in OECD countries, it is lower than the peak of US$113 billion in 2000. As in other countries, revenue from mobile services and data continued to grow while fixed-line voice revenues declined.
105. In 2007, there were 1,248 fixed-line operators, 177 mobile operators, 33,736 cable TV systems, and 74.7 million broadband subscribers. Despite the low fixed-line charges in the United States, analogue and ISDN lines continued to decline, falling by 10% in 2005-07 to 151 million, as broadband and mobile carrying both data and voice replaced them. Mobile phone subscriptions continue to increase and reached just over 91 per 100 inhabitants in 2009. Mobile broadband penetration (3G and 4G) has been increasing rapidly with over 98% of the population served by one or more mobile broadband providers82 and over 28% of subscribers reported to have 3G devices in September 2008.83
106. Broadband connections continue to increase. The authorities note that 64% of households had broadband access in February 2010, up from 51% in 2007.84 According to the OECD, in 2008, the primary access technologies for broadband were by cable and DSL although fibre is gaining market share. As in other countries, radio, television, internet and voice telephone services are merging, although for many consumers and suppliers they remain separate products. Voice over internet protocol (VoIP), video streaming, broadband by cable, wireless internet, and other developments mean that "broadcasters, telecommunication operators (fixed and mobile), Internet service providers, content aggregators, advertisers and users are all active parts of a new, converged market"85, which is also drawing in other data and entertainment providers.
107. Due to the digitization of all terrestrial broadcasting in the United States, additional spectrum has been made available for wireless telecommunications services. The first U.S. auction of spectrum for commercial mobile wireless services, as a result of the digital television transition, took place in 2000. There have been subsequent auctions of licences in additional spectrum blocks subject to the digital transition. Since June 2009, all full-power over-the-air television broadcasts in the United States have been digital-only using the ATSC standard.86 There is no television licence fee for households to own a television in the United States.
80 FMC (2010).81 Unless otherwise indicated the data in this section are from OECD (2009c).82 FCC (2010a).83 Sullivan, E (2008).84 Department of Commerce (2010).85 OECD (2009c), p. 16.
United States WT/TPR/S/235Page 106
108. In 2007, cable was the main type of distribution for television, accounting for 57.5% of households with a television. Cable is also used to deliver broadband communications, highlighting the convergence of different telecoms services. However, direct broadcast satellite (DBS) continued to make inroads, and accounted for 27% of households. Terrestrial made up the remainder.
(ii) GATS commitments
109. The United States' commitments on basic telecommunications attached to the Fourth Protocol of the GATS cover most services.87 Excluded from the commitments are one-way satellite transmissions direct-to-home (DTH), direct broadcast satellite (DBS) services, and digital audio radio services (DARS).
110. The United States has taken an exemption under GATS Article II (MFN) to allow for "differential treatment of countries due to application of reciprocity measures or through international agreements guaranteeing market access or national treatment" for DTH and DBS television services and digital audio services (DARS).88 The United States also reserved the right to "allow the deduction for expenses of an advertisement carried by a foreign broadcast undertaking and directed primarily to a U.S. market only where the broadcast undertaking is located in a foreign country that allows a similar deduction for an advertisement placed with a U.S. broadcast undertaking". 89 The purpose of this MFN exemption is to "encourage the allowance of advertising expenses internationally".
(iii) Regulatory and policy authority
111. The Federal Communications Commission (FCC) is responsible for "regulating interstate and international communications by radio, television, wire, satellite, and cable. The FCC's jurisdiction covers the 50 states, the District of Colombia, and U.S. possessions."90 The FCC was established by the Communications Act of 1934, as amended, as an independent government agency. Intra-state basic telecoms services continue to be regulated by the state authorities.
112. The National Telecommunications and Information Administration (NTIA) of the Department of Commerce is the principal advisor to the President on telecommunications and information policy issues.91 The International Communication and Information Policy (CIP) Office in the Department of State, along with the FCC and NTIA, represent the United States in bilateral and multilateral affairs concerning telecommunications, the Internet, and information technology.92
113. The United States Trade Representative is responsible for developing and coordinating trade policy, including the negotiation and enforcement of specific provisions relating to telecommunications in the trade agreements to which the United States is a party.
86 For more about the Advanced Television Systems Committee see: http://www.atsc.org/cms/ [February 2010].
87 WTO (2008); and WTO documents GATS/SC/90/Suppl.2, 11 April 1997 and S/DCS/W/USA, 27 February 2003.
88 WTO document GATS/EL/90/Suppl.2, 11 April 1997.89 WTO document GATS/EL/90, 15 April 1994.90 For more information on the Federal Communications Commission see: http://www.fcc.gov/
aboutus.html [June 2010].91 For more information on the NTIA see: http://www.ntia.doc.gov/about.html [February 2010].92 For more information on the International Communication and Information Policy Group
see: http://www.state.gov/e/eeb/cip/abt/index.htm [February 2010].
WT/TPR/S/235 Trade Policy ReviewPage 107
114. The principle legislation covering telecommunications is the Communications Act of 1934 and its amendments. The Telecommunications Act of 1996 was a major reform that sought to improve competition by: reducing barriers to entry for telecomms services; obliging incumbents to permit new entrants to connect with their networks; allowing the removal of restrictions on the provision of long-distance services by regional Bell operating companies when certain conditions had been met; and adopting rules for intercarrier compensation.93
115. The issue of intercarrier compensation continues to be a subject of discussion. In November 2008, the FCC released a Further Notice of Proposed Rulemaking, seeking comments on proposals to comprehensively reform rules governing payments between service providers (intercarrier compensation) for the origination and termination of communications. The National Broadband Plan (NBP), delivered to Congress in March 2010 and under review by the Executive Branch before the NBP's recommendations are formally adopted, also recognizes the need to comprehensively reform the intercarrier compensation system. In April 2010, the FCC announced its agenda for implementing key recommendations in the National Broadband Plan, which includes an intercarrier compensation Notice of Proposed Rulemaking expected in the fourth quarter of 2010.
116. Since the last TPR Report on the United States in 2008, there have been no major changes to the regulatory authority or legal framework for telecoms. Section 310 of the Communications Act, restricts the granting of a common carrier wireless licence to foreign governments, as well as to any non-U.S. citizens or corporations, or any corporation with more than 20% foreign ownership. However, the FCC may grant a licence to a U.S. company that is controlled by a holding company in which foreign individuals, corporations, or governments own or vote up to 100% of the capital stock. The FCC gives preference to foreign investments by other WTO Members, who are treated with a refutable presumption that foreign investment from them does not pose competitive concerns in the U.S. market. In all cases, the FCC is authorized to attach conditions to a licence, or to deny a licence, if it is in the public interest to do so.
117. The FCC seeks the advice of other government agencies on matters concerning national security, law enforcement, foreign policy and trade policy concerns when it considers an application to provide international telecoms services or to take control of an existing provider of domestic or international telecoms services.94
118. The FCC has also proposed creating rules to ensure net neutrality, that is, all content on the Internet is equally accessible and there is no discrimination among different contents.95
119. The American Recovery and Reinvestment Act of 2009 (the Recovery Act) requires the FCC to develop a plan to deliver broadband to everyone in the United States.96 The purpose of the FCC's plan, which was submitted to Congress in March 2010 and under review by the Executive Branch before the National Broad Band Plan's recommendations are formally adopted, is to "include a detailed strategy for achieving affordability and maximizing use of broadband."97 The Recovery Act also makes available US$4.7 billion to the NTIA for the Broadband Technology Opportunities
93 The Communications Act of 1934 as amended by the Telecommunications Act of 1996. Viewed at: http://www.fcc.gov/Reports/1934new.pdf [February 2010].
94 OECD (2009c).95 FCC (2009), Notice of Proposed Rule Making, October. Viewed at: http://hraunfoss.fcc.gov/
edocs_public/attachmatch/FCC-09-93A1.pdf [July 2010].96 American Recovery and Reinvestment Act of 2000, Title VI – Broadband Technology Opportunities
Program, Section 6000. Viewed at: http://en.wikisource.org/wiki/American_Recovery_and_Reinvestment_ Act_of_2009 [February 2010].
97 FCC (2010b).
United States WT/TPR/S/235Page 108
Program (BTOP) that will support the deployment of broadband infrastructure, enhance and expand public computer centers, and encourage sustainable adoption of broadband service. NTIA will also develop and maintain a nationwide public map of broadband service capability and availability.
120. In addition, the Recovery Act states that up to US$350 million may be used to implement the Broadband Data Improvement Act (Public Law No. 110-385) and to develop and maintain a broadband inventory map. It also permits the NTIA to transfer funds to the FCC for the purposes of creating a national broadband plan. The Recovery Act also allocates US$2.5 billion to the Department of Agriculture to accelerate broadband deployment in rural areas of the country through the Broadband Initiative Program (BIP). Under the BIP, the Department of Agriculture's Rural Utilities Service will award grants, loans, and loan/grant combinations to fund broadband infrastructure throughout the country.
121. The authorities stated that, in June 2010, the President signed a Presidential Memorandum committing the United States government to make 500 megahertz of spectrum available for wireless technology by the end of the decade. This would nearly double the total amount of spectrum available for wireless technologies. This is also consistent with the FCC’s recommendation in the National Broadband Plan that it should make 500 megahertz of spectrum newly available for broadband within 10 years. Amongst other things, the Presidential Memorandum requires that the National Telecommunications and Information Administration (NTIA), in collaboration with the FCC, complete a plan and timetable by 1 October 2010 for identifying and making available this additional 500 megahertz of spectrum over the next 10 years.98
(iv) International settlements policy
122. The FCC's International Settlements Policy refers to the settlement between carriers of charges for international telecommunications traffic. The Policy originated in the 1930s and was incorporated into the FCC's rules in the 1980s. It was designed to create a unified bargaining position between domestic and foreign carriers at a time when many countries had monopoly service providers. Under the Policy, agreements between domestic and foreign carriers must not discriminate among domestic carriers; a domestic carrier must receive the same proportion of incoming traffic as it provides in outbound traffic; and the accounting rate is divided equally between the domestic and the foreign carrier. In 1997, the FCC issued an Order which requires U.S. carriers to negotiate settlement rates cannot exceed benchmark rates set out in the Order. Since the start of 2004, the FCC stopped applying the Policy to routes for which U.S. carriers had negotiated benchmark compliant rates.99 The authorities state that, as of May 2010, 165 international routes have been exempted from the International Settlements Policy and 38 routes remain subject to it. Separately, the Commission maintains a "List of Foreign Carriers that are Presumed to Possess Market Power in Foreign Telecommunications Markets". This list of carriers is used for the purposes of implementing the Policy and certain other FCC rules on switched services over private lines and U.S. international common carriers and cable landing licensees.100
123. A petition from U.S. carriers to remove the Policy from the 38 routes to which the policy continues to apply is currently before the Commission. Commission staff are preparing recommendations to the Commission on the petition and possible changes to related Commission rules. In addition, in 2004 the Commission initiated a Notice of Inquiry on the effect of mobile
98 White House (2010), Presidential Memorandum: Unleashing the Wireless Broadband Revolution, Office of the Press Secretary. Viewed at: http://www.whitehouse.gov/the-press-office/presidential-memorandum-unleashing-wireless-broadband-revolution [July 2010].
99 FCC (2008a).100 FCC (2007b).
WT/TPR/S/235 Trade Policy ReviewPage 109
termination rates on U.S. customers. The proceeding resulted in internal staff analysis with continuing Commission review of the issue.
(v) Satellite services
124. The Domestic and International Satellite Consolidation Order (DISCO II) was intended to meet the United States' commitments in the WTO Agreement on Basic Telecommunications Services as they relate to access to satellites.101 Under the Order, an earth station operator may apply for a licence to access a foreign satellite or the satellite operator may file a Petition for Declaratory Ruling requesting authority to serve customers in the United States. Foreign operators may also ask that their satellites operating in the conventional C-, Ku-, or Ka-bands be included in the Permitted Space Station List. Once a foreign satellite is on the Permitted List, all U.S. earth stations with "routine" technical parameters may access the satellite. There are 29 foreign satellites on the Permitted Space Station List; and 21 other foreign satellites are authorized to provide service in the United States.
125. All requests under the DISCO II Order are examined to ensure they are consistent with the public interest provisions of the Communications Act, which include competition, spectrum availability, eligibility requirements such as legal, technical, and financial qualifications, operating requirements, and national security, law enforcement, foreign policy, and trade policy concerns.
126. The United States excluded direct-to-home (DTH), direct broadcast services (DBS) and digital audio services (DARS) from its commitments under the Agreement on Basic Telecommunications in the WTO. For these services, the FCC applies an ECO-Sat (effective competitive opportunities for satellites) analysis, which requires the applicant to show that satellite systems licensed in the United States may provide a similar service in the applicant's home market. If this is not the case, and unless the Commission determines that there is a strong public interest reason in favour of the service, the FCC will not permit a foreign satellite system to provide these services to the United States' market.102 The United States has bilateral agreements covering some of these GATS-excluded services with Mexico (DARS and DTH), Argentina (DTH and DBS), and Canada (DARS).103 In total, the FCC has allowed 11 foreign satellites to provide DTH, DBS and/or SDARS to the U.S. market.
(vi) Media ownership rules
127. In its last Quadrennial Regulatory Review of its broadcast ownership rules, the FCC maintained certain restrictions on media ownership such as the prohibition on mergers between the top four television broadcast networks (ABC, CBS, Fox, and NBC) and restrictions on the numbers of television and radio stations any entity may own in a single market.104 The Commission changed its rules in order to permit the cross-ownership of newspapers and broadcasters in certain cases, depending on the size of the market and the market share of the entities proposing to merge. However, the changes to those rules are currently subject to a court challenge.
128. In August 2009, the U.S. Court of Appeals for the District of Colombia Circuit struck down the FCC rule that set a 30% limit on the number of MVPD subscribers a cable operator may serve nationwide. Because the rule has been vacated by the court, the FCC will need to develop a new rule.
101 FCC (1997).102 FCC (2007a).103 FCC (2009)104 WTO document WT/TPR/S/200/Rev.1; and FCC (2008).
United States WT/TPR/S/235Page 110
129. In November 2009, the FCC initiated the 2010 Quadrennial Review of broadcast ownership rules with a series of workshops intended to get public input to its future decision on what, if any, changes should be made to its media ownership rules.105
(5) PROFESSIONAL AND BUSINESS SERVICES
(i) Introduction
130. The surplus in international trade in business, professional, and technical services106 continued to grow in 2007-08. The main exports are management and consulting services, followed by research and development, equipment services (installation, maintenance, and repair), and legal services. The main imports are the same as the main exports, except for legal services.
131. As noted in the previous Trade Policies Review of the United States, individual states have competence for the regulation, licensing, and oversight of the professions practised within their jurisdictions and the federal government does not itself evaluate diplomas or credits or recognize qualifications.107 Although there is no federal-level licensure that supersedes state regulation, and the different regulatory systems may create different market access conditions among the states, some professions are subject to national qualifying examinations recognized in most states as part of the licensing process. Furthermore, there is considerable convergence among states for some professions.108 In cases, such as accounting, architecture, and engineering services, there are single exams by professional bodies that are recognized nationally. In many cases, the states also use independent institutions, including professional associations, to set and enforce regulations and standards.109
132. The H-1B visa programme allows for the entry of foreign professionals in "speciality occupations." The duration of stay is three years, extendible to six, and the annual cap on H-1B admissions is 65,000 per fiscal year plus an additional 20,000 foreign nationals holding a master 's degree or higher from a U.S. university. In addition, H-1B workers who are petitioned for or employed at an institution of higher education or its affiliated or related non-profit entities or a non-profit research organization, or a government research organization are not subject to this limit. In recent years demand for H-1B visas has been strong and the caps were reached shortly after the applications process was opened on 1 April each year; for example, on 8 April 2008, the USCIS announced that the cap for the 2009 fiscal year had already been reached.110 However, interest waned in 2009 and the caps for the 2010 fiscal year were not reached until December 2009.111
105 FCC (2010c).106 There is no internationally recognized definition of the term "professional services". In the
United States' BEA statistics the term "business, professional, and technical services" includes: computer services; management and consulting services; research and development and testing services; operational leasing; accounting, auditing, and bookkeeping services; advertising; architectural, engineering, and other technical services; construction; industrial engineering; installation, maintenance, and repair of equipment; legal services; medical services; mining; sports and performing arts; trade-related services; training services; and other.
107 Department of Education (2007).108 WTO (2008).109 Williams and Nersessian (2007).110 USCIS online information. "USCIS Reaches FY 2009 H-1B Cap". Viewed at: http://www.uscis.
gov/portal/site/uscis/menuitem.5af9bb95919f35e66f614176543f6d1a/?vgnextoid=c5b6628090e29110VgnVCM1000004718190aRCRD&vgnextchannel=68439c7755cb9010VgnVCM10000045f3d6a1RCRD [March 2010].
111 USCIS online information. "USCIS Reaches FY 2010 H-1B Cap". Viewed at: http://www.uscis. gov/portal/site/uscis/menuitem.5af9bb95919f35e66f614176543f6d1a/?
WT/TPR/S/235 Trade Policy ReviewPage 111
133. The U.S.-Chile and U.S.-Singapore trade agreements include provisions that allow non-immigrant professionals to enter the United States temporarily to engage in business activities. The numbers are limited to 1,400 for Chile112, and 5,400 for Singapore.113 The H1B1 admission category was introduced in 2004 to implement the temporary entry provisions for these agreements. In addition, citizens of Mexico or Canada may enter the United States temporarily to work in a professional occupation recognized under the terms of the NAFTA without numerical limitations.
0
20,000
40,000
60,000
80,000
100,000
120,000
1997 1998 1999 2000 2001 2002 2003 2004 2005 2006 2007 2008
Chart IV.3Exports and imports of business, professional and technical services, 1997-2008
Source: BEA (2010), International Economic Accounts, February. Viewed at: http://www.bea.gov/international/international_services.htm#detailedstatisticsfor.
ImportsExports
US$ million
(ii) Accounting services
134. Although the United States has an overall surplus in trade in the business, professional, and technical services category, it has a deficit in the accounting, auditing, and bookkeeping sub-category (Chart IV.5). However, trade is a small part of the total value of the accounting and bookkeeping sector, which had a gross output of about US$128 billion in 2008 with export revenues of US$1.4 billion. There are thousands of accountancy firms in the United States, many of which are
vgnextoid=153a1638367b5210VgnVCM100000082ca60aRCRD&vgnextchannel=b56db6f2cae63110VgnVCM1000004718190aRCRD [June 2010].
112 Chile-United States Free Trade Agreement. Chapter 14. Viewed at: http://www.ustr.gov/ trade-agreements/free-trade-agreements/chile-fta/final-text [March 2010].
113 United State-Singapore Free Trade Agreement. Chapter 11. Viewed at: http://www.ustr.gov/sites/ default/files/uploads/agreements/fta/singapore/asset_upload_file708_4036.pdf [March 2010].
United States WT/TPR/S/235Page 112
part of one of the Big 4 (PricewaterhouseCoopers, Deloitte Touche Tohmatsu, Ernst & Young, and KPMG) each of which has nearly 100 offices around the country.
135. Issuing reports on financial statements and other attestations and financial compilation services are reserved for accountants and auditors who must be licensed by, or have a practice privilege from, the regulatory authorities of each state where they wish to practise. Auditors for all companies are regulated by the State Boards of Accountancy, and auditors with public company clients (defined as "issuers" under the Securities Exchange Act of 1934), are also regulated by the SEC and the Public Company Accounting Oversight Board (PCAOB). The PCAOB is a private-sector entity created under the Sarbanes-Oxley Act of 2002 to oversee auditors of public companies. The Board has five members appointed by the SEC, and is funded mainly by annual fees on public companies in proportion to their market capitalization.114
136. At the federal level, the Office of the Chief Accountant (OCA) in the Securities and Exchange Commission (SEC) is responsible for establishing and enforcing accounting and auditing standards. The Office works with the private-sector accounting bodies, such as the Financial Accounting Standards Board and the PCAOB as well as with international accounting, auditing, and regulatory bodies. In this context, state regulators are responsible for private-company standard setting, for which they look to the FASB and AICPA for support. At state level, each state (plus the District of Colombia, Puerto Rico, U.S. Virgin Islands, Guam, and the Commonwealth of the Northern Mariana Islands) has regulatory authority to adopt standards and license individuals and firms to practise public accounting. The state boards have joined to coordinate their efforts at the national level via the National Association of State Boards of Accounting (NASBA). The NASBA seeks to improve uniformity of accounting standards as well as qualification and licensing requirements among the states.115
137. The American Institute of Certified Public Accountants (AICPA) is by far the largest professional accountants association in the United States. It works with state boards and NASBA in developing the Uniform Certified Public Accountancy (CPA) Examination. Passing the Uniform CPA Examination is essential for CPA status, and CPA status is needed to practise accounting in all states of the United States. In addition, candidates must have a required number of hours of accountancy and related education (normally 150 hours) and work experience (minimally one year) (the so-called "3 Es" of exam, education, and experience).116
114 PCAOB online information, About the PCAOB. Viewed at: http://pcaobus.org/Pages/default.aspx.115 NASBA (2010b).116 For information on specific licensing requirements of each State, see NASBA Accountancy
Licensing Library at: http://all.nasbatools.com/jurisdiction/list_jurisdiction [April 2010].
WT/TPR/S/235 Trade Policy ReviewPage 113
0
500
1,000
1,500
2,000
2,500
2006 2007 2008
Chart IV.4Trade in accounting, auditing, and bookkeeping, 2006-2008
Source: BEA (2010), International Economic Accounts, February. Viewed at: http://www.bea.gov/international/international_services.htm#detailedstatisticsfor.
ImportsExports
US$ million
138. The AICPA and NASBA, through the International Qualifications Appraisal Board, have negotiated mutual recognition agreements with accountancy bodies in several countries, including: the Certified Practicing Accountants of Australia; the Institute of Chartered Accountants in Australia; the Canadian Institute of Chartered Accountants; the Instituto Mexicano de Contadores Públicos; Chartered Accountants Ireland; and the New Zealand Institute of Chartered Accountants. Professionals in good standing with these institutions may apply to sit the International Qualification Examination (IQEX) in lieu of taking the Uniform CPA Examination.117 Successful candidates may apply for licensure as a CPA in those states that have adopted the mutual recognition agreements.
139. Since the Sarbanes-Oxley Act of 2002, which increased accountancy requirements, there have been no major changes in federal legislation affecting corporate accounting.118 However, the United States standard setters are in the process of converging U.S. Generally Accepted Accounting Principles (GAAP) with the International Financial Reporting Standards (IFRS) developed by the International Accounting Standards Board (IASB). The SEC is engaged in a "work plan" that could move public company accounting into convergence with IFRS by 2015. The move to the principle-based IFRS would represent a significant shift for the accountants and industry, which is
117 NASBA (2010a).118 WTO (2008).
United States WT/TPR/S/235Page 114
why the standard setters have been working to harmonize the two systems for some time and the AICPA has been working to try to smooth the transition.119
(iii) Legal services
140. The United States continues to run a large, and growing, trade surplus in legal services (Chart IV.6), although trade is only a small portion of gross output of legal services, which was US$252 billion in 2008 with exports of US$7.3 billion. There are about 180,000 law offices in the United States and, although some are large firms, the industry is quite fragmented with the 50 largest firms generating less than 15% of revenue. In 2008, there were over a million lawyers in the United States; about three quarters were in private practice.120 The American Bar Association (ABA), the American Law Institute, and other organizations represent lawyers as a profession.
0
1,000
2,000
3,000
4,000
5,000
6,000
7,000
8,000
2006 2007 2008
Chart IV.5Trade in legal services, 2006-2008
Source: BEA (2010), International Economic Accounts, February. Viewed at: http://www.bea.gov/international/international_services.htm#detailedstatisticsfor.
ImportsExports
US$ million
119 American Institute of Certified Public Accountants (2010).120 American Bar Association (2009).

WT/TPR/S/235 Trade Policy ReviewPage 115
141. Under the 10th Amendment to the Constitution, each state of the United States has sovereignty for its court system. Therefore, each state has the authority to set its own standards for qualifications to practise law. In most cases, after finishing law school, the state's bar exam and the Multistate Professional Responsibility Examination (MPRE) must be passed.121 Other requirements must also be met before a legal service provider may call her/himself a lawyer, attorney, or counsellor and be admitted to legal practice. Legal services in the United States must be supplied by natural persons.
142. Many states also provide limited rights to practise law for certain categories, including foreign legal consultants. There are 31 jurisdictions with foreign legal consultant (FLC) rules (these 31 jurisdictions represent 88% of the U.S. market for legal services as measured by GDP).122 The FLC rules vary considerably from one state to another.123 In some states, FLCs are only entitled to provide advice on legal matters relating to the country where they hold a legal qualification; in some other states they may also provide advice on international law and/or third-country law, and in other states an FLC can also provide advice on U.S. or state law if they rely on a local lawyer. In some cases, the restrictions and requirements may be quite severe; for example, New Jersey requires that an FLC work in association with a New Jersey attorney who assumes full responsibility for the FLC; and North Carolina prohibits an FLC from being hired as a partner, and requires that s/he be supervised by a North Carolina attorney.124
143. Foreign law firms may establish legal subsidiaries in the United States, with the same rights as U.S. firms, including the right to hire domestic lawyers. These subsidiaries may operate by using local domestic lawyers or using foreign lawyers who have registered as FLCs or have qualified as domestic U.S. lawyers. In 2008 and 2009, 3,874 foreign applicants (in 25 jurisdictions) successfully passed a U.S. bar exam.
144. The United States has made GATS commitments on market access and national treatment for the provision of foreign legal consultancy services in 16 jurisdictions.125
121 National Conference of Bar Examiners (2010).122 National Conference of Bar Examiners (2010). Comprehensive Guide to Bar Admission
Requirements 2010. Viewed at: http://www.ncbex.org/fileadmin/mediafiles/downloads/Comp_Guide/Comp Guide_2010.pdf [June 2010].
123 American Bar Association (2009b).124 Silver and DeBruin (2006).125 Alaska, California, Connecticut, District of Colombia, Florida, Georgia, Hawaii, Illinois, Michigan,
Minnesota, New Jersey, New York, Ohio, Oregon, Texas, and Washington.
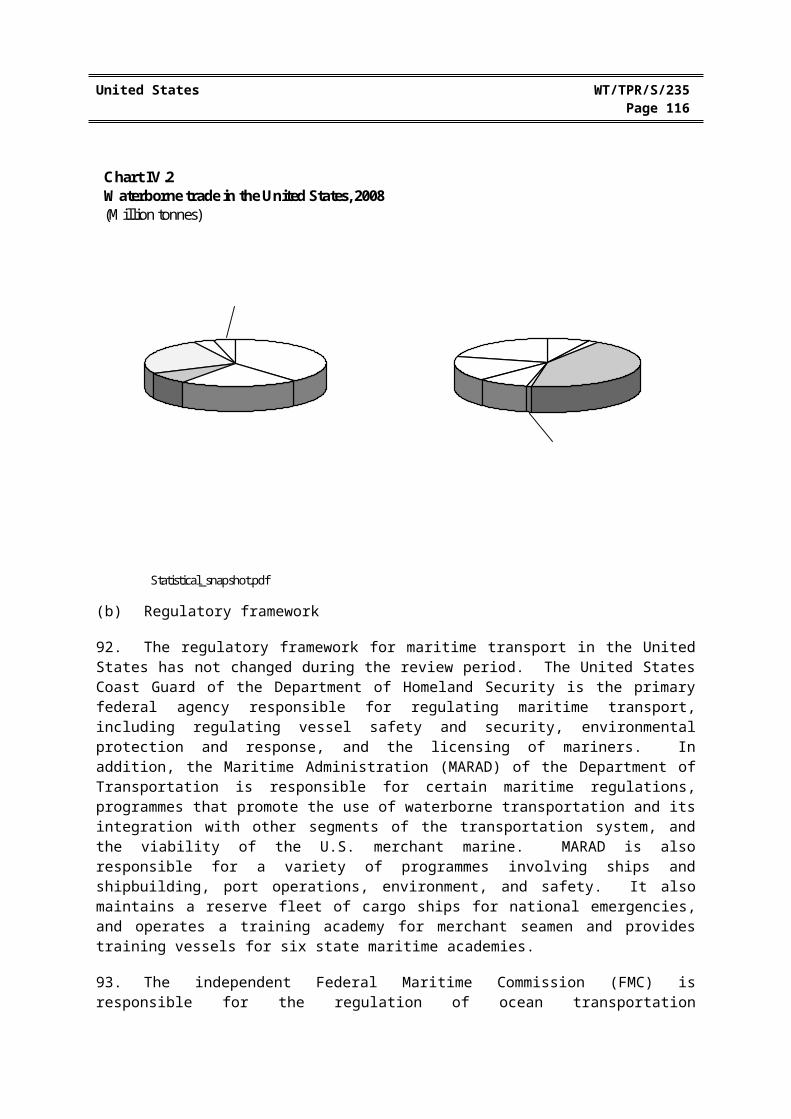
United States WT/TPR/S/235Page 116
REFERENCES
American Bar Association (2009a), Lawyer Demographics. Viewed at: http://new.abanet.org/ marketresearch/PublicDocuments/Lawyer_Demographics.pdf.
American Bar Association (2009b), Summary of State Action on ABA MJP Recommendations 8 & 9). Viewed at: http://www.abanet.org/cpr/mjp/8_and_9_status_chart.pdf [April 2010].
American Institute of Certified Public Accountants (2010), IFRS Resources. Viewed at: http://www.ifrs.com/index.html [March 2010].
Antitrust Modernization Commission (2007), Report and Recommendations, April. Viewed at: http://govinfo.library.unt.edu/amc/report_recommendation/toc.htm.
Baughman, Laura M., and Joseph F. François (2009), Economic Analysis of the Cost of Buy American Rules, September. Viewed at: http://www.uschamber.com/publications/reports/100217buyamerican. htm.
BEA (2010a), Gross Domestic Product: Fourth Quarter 2009 (Third Estimate), BEA 10-11, 26 March 2010. Viewed at: http://www.bea.gov/national/index.htm#gdp.
BEA (2010b), U.S. International Transactions Accounts Data. Available at: http://www.bea.gov/ international/bp_web/simple.cfm?anon=71&table_id=22&area_id=1 [June 2010].
Button, K. (2008), The Impacts of Globalisation on International Air Transport Activity Past trends and future perspectives, paper prepared for the OECD/ITF Global Forum on Transport and Environment in a Globalising World, November.
CBO (2010), The Budget and Economic Outlook: Fiscal Years 2010 to 2020, January. Viewed at: http://www.cbo.gov/ftpdocs/108xx/doc10871/Frontmatter.shtml.
CBP (2004), What Every Member of the Trade Community Should Know About: Entry , March. Viewed at: http://www.cbp.gov/xp/cgov/trade/legal/informed_compliance_pubs.
CBP (2005), What Every Member of the Trade Community Should Know About: Customs Brokers , January. Viewed at: http://www.cbp.gov/xp/cgov/trade/legal/informed_compliance_pubs.
CBP (2008), C-TPAT: A Guide to Program Benefits. Viewed at: http://www.cbp.gov/linkhandler/ cgov/trade/cargo_security/ctpat/what_ctpat/ctpat_benefits.ctt/ctpat_benefits.pdf.
Congressional Oversight Panel (2009), Testimony of Ron Bloom before the Congressional Oversight Panel: Regarding the Treasury's Automotive Industry Financing Program, 27 July. Viewed at: http://www.cop.senate.gov/documents/testimony-072709-bloom.pdf.
Council of Economic Advisers (2010), Economic Report of the President, February, Washington, D.C.
CPSC (2010), Report to Congress Pursuant to the Statement of Managers Accompanying P.L. 111-117, 15 January. Viewed at: http://www.cpsc.gov/about/cpsia/cpsiareport01152010.pdf.
WT/TPR/S/235 Trade Policy ReviewPage 117
Dempsey, P. S. (2008), Capital and Market Access in International Aviation: Nationality Requirements and Cabotage Restrictions, McGill University Institute of Air & Space Law.
Department of Commerce, (2010), Digital Nation 21st Century America's Progress Toward Universal Broadband Internet Access, An NTIA Research Preview, National Telecommunications and Information Administration February. Viewed at: http://www.ntia.doc.gov/reports/2010/NTIA _internet _use_report_ Feb2010.pdf.
Department of Defense, American Forces Press Service, "Gates Proposes Revamp of Export System", 20 April 2010. Viewed at: http://www.defense.gov/news/newsarticle.aspx?id=58830 [April 2010].
Department of Justice (2008), Competition and Monopoly: Single-Firm Conduct Under Section 2 of the Sherman Act, September. Viewed at: http://www.usdoj.gov/atr/public/reports/236681.htm.
Department of State (2010a), Consent Agreements. Viewed at: http://pmddtc.state.gov/compliance/ consent_agreements.html.
Department of State (2010b), Country Policies and Embargoes. Viewed at: http://pmddtc.state. gov/embargoed_countries/index.html [April 2010].
Department of State (2010c), Defence Trade Controls, List of Statutorily Debarred Parties, July 1988-March 2010. Viewed at: http://pmddtc.state.gov/compliance/documents/debar.pdf [April 2010].
Department of Transportation (2008), Bureau of Transportation Statistics, Transportation Statistics Annual Report 2008. Washington, D.C. Viewed at: http://www.bts.gov/publications/transportation_ statistics_ annual_report/2008/pdf/entire.pdf [March 2010].
Department of Transportation (2009a), DOT Information Related to the American Recovery and Reinvestment Act of 2009 (Recovery Act). Viewed at: http://www.dot.gov/recovery/ost/ [March 2010].
Department of Transportation (2009b), U.S. Water Transportation, Statistical Snapshot, Maritime Administration, Washington, D.C., July.
Ex-Im Bank (2007), Report to the U.S. Congress on Export Credit Competition and the Export-Import Bank of the United States, June. Viewed at: http://www.exim.gov/about/reports/compet/documents/ 2006CompetitivenessReport.pdf.
Ex-Im Bank (2009), Actions in Response to the Financial Crisis – Direct Lending, Office of the Inspector General Evaluation Report OIG-EV-09-02, September, Washington, D.C.
Ex-Im Bank (various years), Annual Report. Viewed at: http://www.exim.gov/about/reports/ar/ index.cfm.
FAA (2010a), Airport Privatization Pilot Program. January. Viewed at: http://www.faa.gov/ airports/airport_compliance/privatization/[March 2010].
FAA (2010b), FAA Aerospace Forecasts FY 2010-2030. March. Viewed at: http://www.faa. gov/data_research/ aviation/aerospace_forecasts/2010-2030/ [March 2010].
United States WT/TPR/S/235Page 118
FCC (1997), Amendment of the Commission's Regulatory Policies to Allow Non-U.S. Licensed Space Stations to Provide Domestic and International Satellite Service in the United States. FCC 97-399, Viewed at: http://www.fcc.gov/Bureaus/International/Orders/1997/fcc97399.txt [February 2010].
FCC (2007a), Annual Report and Analysis of Competitive Market Conditions with Respect to Domestic and International Satellite Communications Services, FCC 07-34, 26 March. Viewed at: http://www.docstoc.com/docs/19437053/FCC-Seeks-Comment-to-Ensure-All-Cable-Customers-Receive-Programming-After-the-Digital-Television-Transition-5407-FCC [February 2010].
FCC (2007b), The International Bureau Revises and Reissues the Commission's List of Foreign Telecommunications Carriers that Are Presumed to Possess Market Power in Foreign Telecommunications Markets, Public Notice DA 07-233, 26 January. Viewed at: http://hraunfoss.fcc.gov/edocs_public/attachmatch/ DA-07-233A1.pdf [June 2010].
FCC (2008a), International Settlements Policy and U.S.-Internatioinal Accounting Rates, 15 November. Viewed at: http://www.fcc.gov/ib/pd/pf/account.html [February 2010].
FCC (2008b), 2006 Quadrennial Regulatory Review – Review of the Commission's Broadcast Ownership Rules and Other Rules Adopted Pursuant to Section 202 of the Telecommunications Act of 1996, 2002 Biennial Regulatory Review – Review of the Commission's Broadcast Ownership Rules and Other Rules Adopted Pursuant to Section 202 of the Telecommunications Act of 1996, Cross-Ownership of Broadcast Stations and Newspapers, Rules and Policies Concerning Multiple Ownership of Radio Broadcast Stations in Local Markets, Definition of Radio Markets, Ways to Further Section 257 Mandate and To Build on Earlier Studies, Public Interest Obligations of TV Broadcast Licensees, MB Docket Nos. 06-121, 02-277, 01-235, 01-317, 00-244, 04-228, 99-360, February. Viewed at: http://hraunfoss.fcc.gov/ edocs_public/attachmatch/FCC-07-216A1.pdf [February 2010].
FCC (2009), International Agreements, December. Viewed at: http://www.fcc.gov/ib/sand/agree/ [February 2010].
FCC (2010a), Annual Report and Analysis of Competitive Market Conditions with respect to Mobile Wireless, Including Commercial Mobile Services, Fourteenth Report, May. Viewed at: http://hraunfoss. fcc.gov/edocs_public/attachmatch/FCC-10-81A1.doc [June 2010].
FCC (2010b), National Broadband Plan, Connecting America. Viewed at: http://www.broadband. gov/plan/ [June 2010].
FCC (2010c), 2010 Review of Media Ownership Rules, MB Docket No. 09-182, January. Viewed at: http://www.fcc.gov/ownership/.
FDA (2009a), Food Facility Registration, FDA Actions on Bioterrorism Act of 2002 Legislation, August. Viewed at: http://www.fda.gov/Food/FoodDefense/Bioterrorism/FoodFacilityRegistration/ default.htm.
FDA (2009b), Guidance for Industry, Regulation of Genetically Engineered Animals Containing Heritable Recombinant DNA Constructs. Final Guidance, January. Viewed at: http://www.fda.gov/ downloads/AnimalVeterinary/GuidanceComplianceEnforcement/GuidanceforIndustry/UCM113903. pdf [March 2010].

WT/TPR/S/235 Trade Policy ReviewPage 119
Federal Procurement Data System (2007), Federal Procurement Report FY 2007. Viewed at: https://www.fpds.gov/fpdsng_cms/index.php/reports.
FMC (2010), 48th Annual Report for Fiscal Year 2009. March. Viewed at: http://www.fmc.gov/ userfiles/pages/file/Annual_Report_FY_2009.pdf.
FTC (2003), Report of the State Action Task Force, September. Viewed at: http://www.ftc.gov/ os/2003/09/stateactionreport.pdf.
FTC (2010), The FTC in 2010, April. Viewed at: http://www.ftc.gov/os/annualreports/index.shtm.
GAO (2007), Foreign Assistance, Various Challenges Impede the Efficiency and Effectiveness of U.S. Food Aid, GAO-07-560, Washington, D.C. April. Viewed at: http://www.gao.gov/new. items/d07560. pdf [February 2010].
GAO (2009a), Sovereign Wealth Funds: Laws Limiting Foreign Investment Affect Certain U.S. Assets and Agencies Have Various Enforcement Processes, GAO-09-608, May, Washington, D.C.
GAO (2009b), Troubled Asset Relief Program: Continued Stewardship Needed as Treasury Develops Strategies for Monitoring and Divesting Financial Interests in Chrysler and GM, GAO-10-151, November, Washington, D.C. Viewed at: http://www.gao.gov.
GAO (2009c), Biofuels: Potential Effects and Challenges of Required Increases in Production and Use, GAO-09-446, August, Washington, D.C. Viewed at: http://www.gao.gov.
GAO (2010), Consumer Safety: Better Information and Planning Would Strengthen CPSC's Oversight of Imported Products, GAO-09-803, August, Washington, D.C.
Gupta, S., and L. F. Mills (2003), "Does Disconformity in State Corporate Income Tax Systems Affect Compliance Cost Burdens?", National Tax Journal LVI(2), June.
IATA (2010), Facts and Figures, Ranking Tables from WATS for 2008 (53rd Edition). Viewed at: http://www.iata.org/pressroom/facts_figures/watsrankings.htm [March 2010] and taking into account the merger of Delta Air Lines and Northwest Airlines announced in April 2010.
IMF (2009), United States: 2009 Article IV Consultation—Staff Report; Staff Supplement; and Public Information Notice on the Executive Board Discussion, IMF Country Report No. 09/228, July, Washington, D.C.
IMF (2010), World Economic Outlook, April, Washington, D.C.
Interagency Working Group on Food Safety (2007), Protecting American Consumers Every Step of the Way. A strategic framework for continual improvement in import safety. A Report to the President, 10 September. Viewed at: http://www.importsafety.gov/report/report.pdf.
ITDS (2009), Report to Congress on the International Trade Data System, September. Viewed at: http://www.itds.gov/xp/itds/toolbox/library/resource_documents/sep09_reports.

United States WT/TPR/S/235Page 120
Joint Committee on Taxation (2009a), Estimated Budget Effects of the Revenue Provisions Contained in the Conference Agreement for H.R. 1, The "American Recovery and Reinvestment Tax Act of 2009", JCX 19-09, 12 February. Viewed at: http://www.jct.gov/publications.html.
Joint Committee on Taxation (2009b), Tax Expenditures for Energy Production and Conservation, JCX-25-09R, 21 April. Viewed at: http://www.jct.gov/publications.html.
Kirk (2009), Airport Improvement Program (AIP): Reauthorization Issues for Congress, Congressional Research Service, May. Viewed at: http://fas.org/sgp/crs/misc/R40608.pdf [April 2010].
Koncz-Bruner, and Flatness (2009), "U.S. International Services Cross-Border Trade in 2008 and Services Supplied Through Affiliates in 2007", October.
MARAD (2008), The Maritime Administration Annual Report to Congress 2007. Washington D.C. Viewed at: http://www.marad.dot.gov/documents/MReport_2007_v8_final.pdf.
McNichol, Elizabeth, and Nicholas Johnson (2010), Recession Continues to Batter State Budgets; State Responses Could Slow Recovery, Center on Budget and Policy Priorities, 25 February. Viewed at: http://www.cbpp.org /cms/?fa=view&id=711.
NASBA (2010a), Mutual Recognition Agreements. Viewed at: http://www.nasba.org/nasbaweb/ NASBAWeb.nsf/NWL/80905496B87DA4798625759A00791EC0?OpenDocument [April 2010].
NASBA (2010b), Opening Doors 2009 Annual Report. Viewed at: http://www.nasba.org/ 862571B900737CED/23949EF6C54D2EBE8625766A00744E72/$file/2009_AnnualReport_POST. pdf [March 2010].
OECD (2002), Agricultural Policies in OECD Countries. A Positive Reform Agenda, Paris.
OECD (2006), The Development Effectiveness of Food Aid, Does Tying Matter?, Paris.
OECD (2007), Agricultural Policies in OECD Countries Monitoring and Evaluation 2007, Paris.
OECD (2009a), Agricultural Policies in Emerging Economies Monitoring and Evaluation, Paris.
OECD (2009b), Agriculture Policies in OECD Countries Monitoring and Evaluation 2009, Paris
OECD (2009c), Information and Communications Technologies, OECD Communications Outlook 2009, Paris, August.
PCAOB (2010), About the PCAOB. Viewed at: http://pcaobus.org/Pages/default.aspx.
Research and Innovative Technology Administration (2010), Airline On-Time Statistics and Delay Causes, Bureau of Transportation Statistics. Viewed at: http://www.transtats.bts. gov/OT_Delay/OT_DelayCause1.asp?pn=1 [March 2010].
Shapiro, R. J. and K. A. Hassett (2005) The Economic Value of Intellectual Property, Sonecon, July. Viewed at: http://www.sonecon.com/docs/studies/IntellectualPropertyReport-October2005.pdf [April 2010].
WT/TPR/S/235 Trade Policy ReviewPage 121
Shenai, N. (2010), Export Control Reform 2010: Transforming the Legal Architecture of Dual-Use and Defense Trade Controls, American Enterprise Institute for Public Policy Research, AEI Working Paper #163, 2 February. Viewed at: http://www.aei.org/paper/100078 [April 2010].
Silver, C. and N. DeBruin (2006), Comparative Analysis of United States Rules Licensing Legal Consultants, May. Viewed at: http://www.abanet.org/cpr/mjp/silver_flc_chart.pdf [April 2010].
Sullivan, E (2008), U.S. Sees 80 Percent Growth in 3G subscribers, TMCnet, 4 September. Viewed at: http://www.tmcnet.com/voip/ip-communications/articles/38872-us-sees-80-percent-growth-3gsubscribers.htm [July 2010].
Tsoukalas, G., P. Belobaba, W. Swelbar (2008), Cost Convergence in the U.S. Airline Industry: An Analysis of Unit Costs 1995-2006, MIT Global Airline Industry Program, December 2007, revised April 2008.
USBEA (2010), Gross Domestic Product: Fourth Quarter 2009 (Third Estimate), BEA 10-11, 26 March. Viewed at: http://www.bea.gov/national/index.htm#gdp.
USCIS (2009), USCIS Reaches FY 2010 H-1B Cap. Viewed at: http://www.uscis.gov/portal/site/ uscis/menuitem.5af9bb95919f35e66f614176543f6d1a/?vgnextoid=153a1638367b5210VgnVCM100000082ca60aRCRD&vgnextchannel=b56db6f2cae63110VgnVCM1000004718190aRCRD [June 2010]
USDA (2008), Industry Marketing and Promotion, Marketing Order Commodity Index. Viewed at: http://www.ams.usda.gov/AMSv1.0/ams.fetchTemplateData.do?template=TemplateN&navID=ViewInformationonAllFederalMarketingOrders&rightNav1=ViewInformationonAllFederalMarketingOrders&topNav=&leftNav=&page=FVMarketingOrderIndex&resultType=&acct=fvmktord [February 2010].
USDA (2010), FY2011 Budget Summary and Annual Performance Plan.
USDA AMS (2008), Commodity Purchasing. Viewed at: http://www.ams.usda.gov/AMSv1.0/ ams.fetchTemplateData.do?template=TemplateQ&navID=CommodityPurchasing&leftNav=CommodityPurchasing&page=CommodityPurchasing&acct=AMSPW [February 2010].
USDA APHIS (2007), Strategic Plan (2007-2012), July. Viewed at: http://www.aphis. usda.gov/about_aphis/downloads/strategic_plan/APHIS_SP_final_july07.doc [March 2010].
USDA APHIS (2008), APHIS' Quarantine 56 Revision. Viewed at: http://www.aphis. usda.gov/publications/ plant_health/content/printable_version/fs_q56reg.pdf [May 2010].
USDA APHIS (2009), Current In-Progress PPQ Risk Analyses as of December 20009. Viewed at: http://www.aphis.usda.gov/import_export/plants/plant_imports/downloads/PRAlist.pdf [March 2010].
USDA FAS (2009), Local and Regional Procurement Project. Viewed at: http://www.fas.usda.gov/ excredits/FoodAid/LRP/LRP.asp [February 2010].
USDA FNS (2009), Schools/Child Nutrition Commodity Programs, September. Viewed at: http://www.fns.usda.gov/fdd/programs/schcnp/pfs-schcnp.pdf [May 2010].

United States WT/TPR/S/235Page 122
USDA FSIS (2009a), Notice of Enforcement by the United States Department of Agriculture, Food Safety and Inspection Service Regarding Imported Food Products Containing a Small Amount of Meat, Poultry, or Processed Egg Product Ingredients. Viewed at: http://www.fsis.usda. gov/pdf/Notice_of_Enforcement_Regarding_Imported_Food_Products.pdf [March 2010].
USDA FSIS (2009b), Regulations & Policies, Import Information, Apply for Initial Equivalence, December. Viewed at: http://www.fsis.usda.gov/regulations_&_policies/Apply_for_Initial_ Equivalence/index. asp [March 2010].
USDA FSIS (2010), Quarterly Enforcement Report, July 1, 2009 through September 30, 2009. Viewed at: http://www.fsis.usda.gov/PDF/QER_Q4_FY09_Tables_1-8.pdf#page=2.
USITC (2009a), Certain Passenger Vehicle and Light Truck Tires From China, Investigation No. TA-421-7, Publication 4085, July, Washington, D.C.
USITC (2009b), The Year in Trade 2008: Operation of the Trade Agreements Program, July, Washington, D.C.
USITC (2009c), Use of the "First Sale Rule" for Customs Valuation of U.S. Imports, December, Washington, D.C.
USNEI (2007), Department of Education, Network for Education Information, Recognition of Foreign Qualifications: Professional Recognition. Viewed at: http://www2.ed.gov/about/offices/ list/ous/international/usnei/us/profrecog.doc.
USPTO (2009), Performance and Accountability Report: Fiscal Year 2009, November. Viewed at: http://www.uspto.gov/about/stratplan/ar/index.jsp [April 2010].
USPTO (2010), Office of the Administrator for External Affairs – Geographical Indications (GI) Protection. Viewed at: http://www.uspto.gov/ip/global/geographical/protection/index.jsp [April 2010].
USTR (2009), 2009 Trade Policy Agenda and 2008 Annual Report of the President of the United States on the Trade Agreements Program, February, Washington, D.C. Viewed at: http://www.ustr.gov/about-us/press-office/reports-and-publications/2009/2009-trade-policy-agenda-and-2008-annual-report.
USTR (2010a), Anti-Counterfeiting Trade Agreement (ACTA). Viewed at: http://www.ustr.gov/acta [April 2010].
USTR (2010b), 2010 Trade Policy Agenda and 2009 Annual Report of the President of the United States on the Trade Agreements Program, March. Viewed at: http://www.ustr.gov/2010-trade-policy-agenda.
Williams, S. and D. Nersessian (2007), Overview of the Professional Services Industry and the Legal Profession, Harvard Law School Center.
World Bank (2009), Doing Business 2010, Washington, D.C. Viewed at: http://www.doingbusiness. org/features/Highlights2010.aspx [April 2010].

WT/TPR/S/235 Trade Policy ReviewPage 123
World Food Programme (2010), Food Aid Information System, Reports, Quantities Delivered Report (3D). Viewed at: http://www.wfp.org/fais/reports/quantities-delivered-report [February 2010].
WTO (2006), Trade Policy Review: United States, Geneva.
WTO (2008), Trade Policy Review: United States, Geneva.