
2010 Macro & Fixed Income Outlook - janney.com library/conference calls/janney 2010... · 2009 was...
28
FIXED INCOME STRATEGY & RESEARCH 2010 Macro & Fixed Income Outlook Guy LeBas Chief Fixed Income Strategist January 8, 2010
Transcript of 2010 Macro & Fixed Income Outlook - janney.com library/conference calls/janney 2010... · 2009 was...

FIXED INCOME STRATEGY & RESEARCH
2010 Macro & Fixed Income Outlook
Guy LeBasChief Fixed Income Strategist
January 8, 2010
2
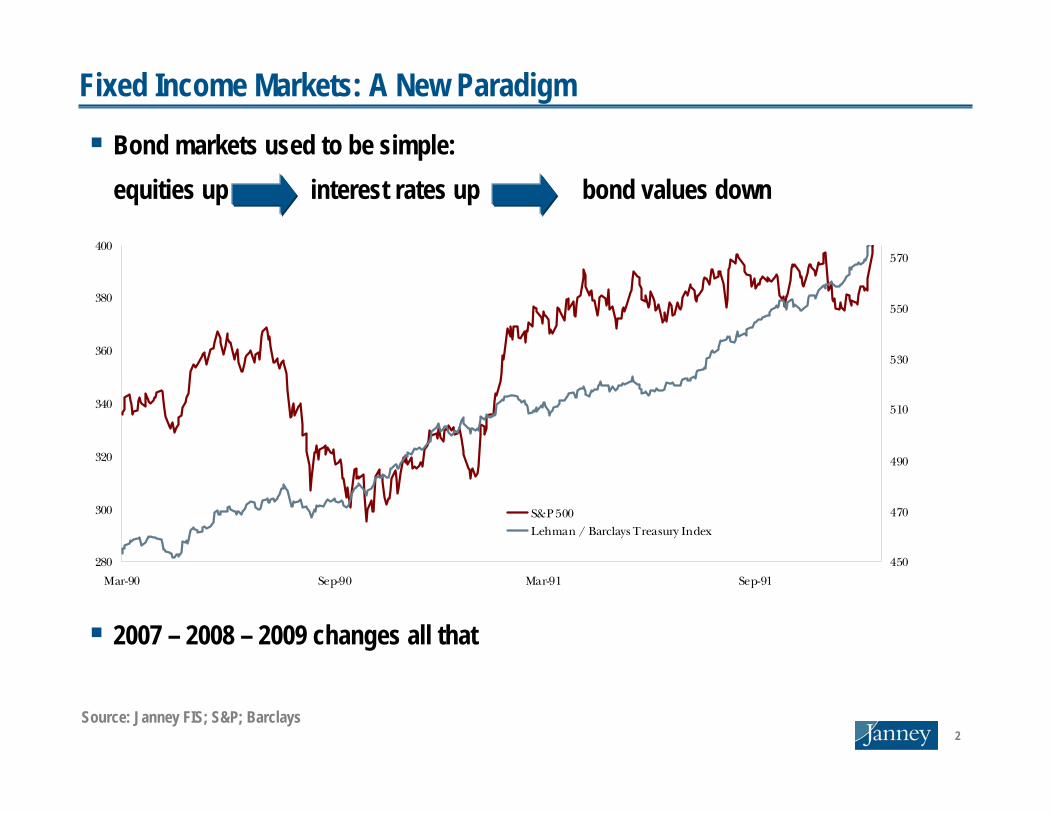
Fixed Income Markets: A New Paradigm
Bond markets used to be simple: equities up interest rates up bond values down
2007 – 2008 – 2009 changes all that
Source: Janney FIS; S&P; Barclays
280
300
320
340
360
380
400
Mar-90 Sep-90 Mar-91 Sep-91
450
470
490
510
530
550
570
S&P 500Lehman / Barclays Treasury Index

3
Fixed Income Markets: A New Paradigm
Conceptual timeline crisis2002 – 2004: Rate cuts bring bank funding costs to negative real levels
2005 – 2006: Rate hikes increase funding costs, but earnings competition continues
2005 – 2007: Competition shows in race for volumes, weakening lending standards
2007 – 2008: Over-lending leads to over-contraction
2007 – 2009: Over-contraction leads to writedowns and falling bond prices
2008 – 2009: Bond prices affect the equity markets
2010 & Beyond: A new paradigm of interaction between rates, credit, and equity

4
Macro Pressures: GrowthCredit is the key: Janney Credit Availability Oscillator
Credit conditions “modestly tight,” but demand for credit non-existent
Source: Janney FIS
(100)
(80)
(60)
(40)
(20)
-
20
40
60
Oct
-09
Oct
-09
Oct
-08
Oct
-07
Oct
-06
Oct
-05
Oct
-04
Oct
-03
Oct
-02
Oct
-01
-10.0%
-8.0%
-6.0%
-4.0%
-2.0%
0.0%
2.0%
4.0%
6.0%
Janney CAO (Left Axis) GDP Growth (Right Axis)
5
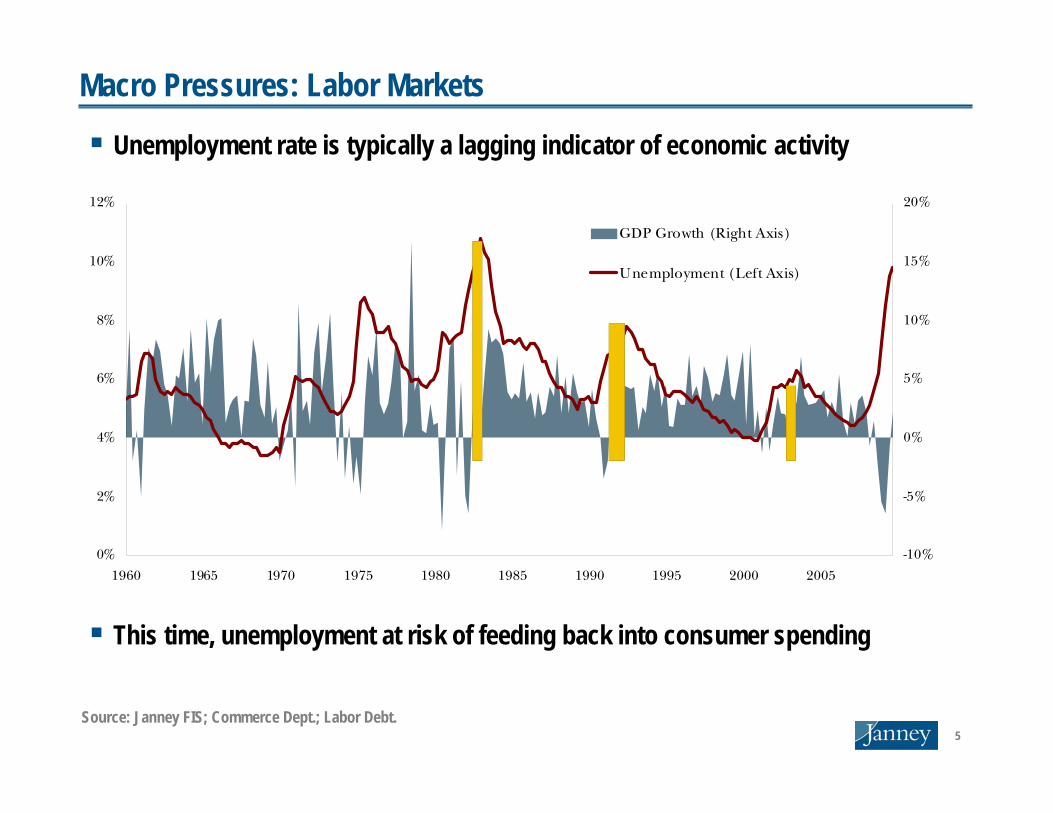
Macro Pressures: Labor Markets
Unemployment rate is typically a lagging indicator of economic activity
This time, unemployment at risk of feeding back into consumer spending
0%
2%
4%
6%
8%
10%
12%
1960 1965 1970 1975 1980 1985 1990 1995 2000 2005
-10%
-5%
0%
5%
10%
15%
20%
GDP Growth (Right Axis)
Unemployment (Left Axis)
Source: Janney FIS; Commerce Dept.; Labor Debt.
6
0.5%
1.0%
1.5%
2.0%
2.5%
3.0%
3.5%
4.0%
4.5%
Jan-06 Jul-06 Jan-07 Jul-07 Jan-08 Jul-08 Jan-09 Jul-09
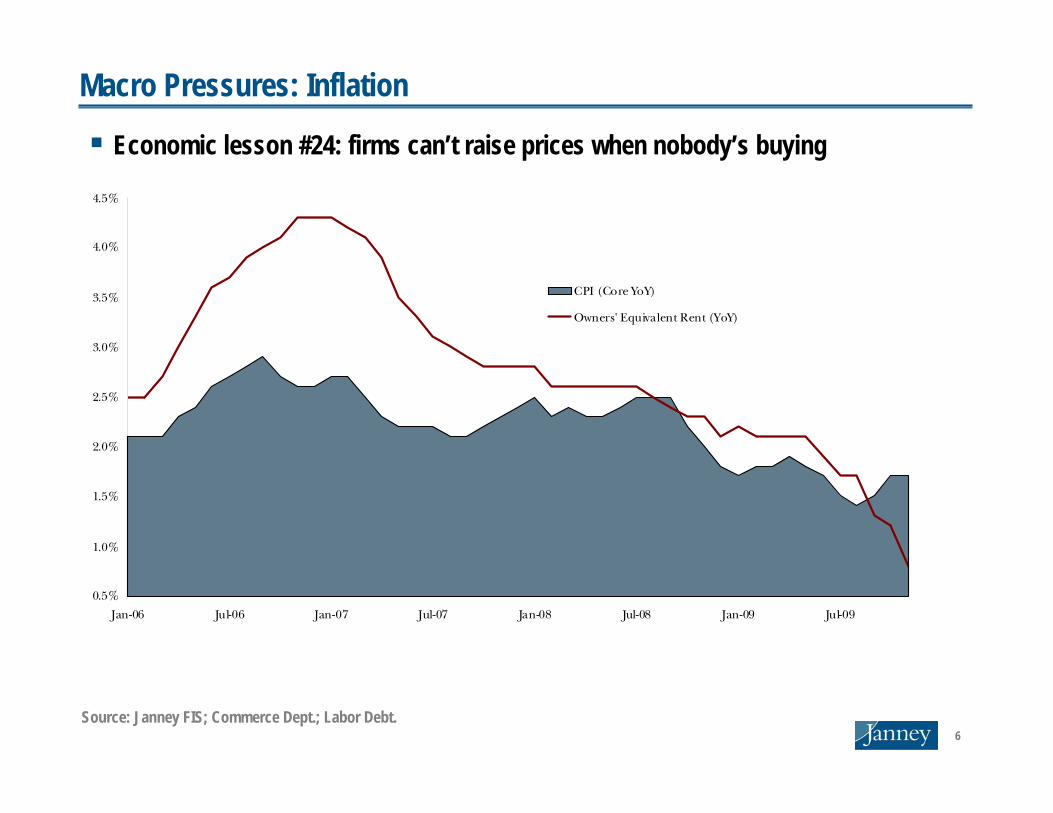
CPI (Core YoY)
Owners' Equivalent Rent (YoY)
Macro Pressures: Inflation
Economic lesson #24: firms can’t raise prices when nobody’s buying
Source: Janney FIS; Commerce Dept.; Labor Debt.

7
Central Bank Rates 4Q 2009 1Q 2010 2Q 2010 3Q 2010 4Q 2010 2010 Change 4Q 2011Fed Funds O/N 0.13% 0.13% 0.13% 0.50% 1.00% +88 bps 2.00%
Treasury Curve 4Q 2009 1Q 2010 2Q 2010 3Q 2010 4Q 2010 2010 Change 4Q 20113m Bill 0.06% 0.12% 0.36% 0.67% 1.17% +111 bps 2.60%2yr Note 1.11% 1.33% 1.72% 2.13% 2.47% +136 bps 3.56%5yr Note 2.84% 2.94% 3.20% 3.40% 3.58% +74 bps 4.39%10yr Note 3.87% 3.91% 3.99% 4.18% 4.35% +48 bps 4.75%30yr Bond 4.68% 4.60% 4.67% 4.78% 4.89% +20 bps 5.07%
2s/10s Spread 276 bps 258 bps 227 bps 205 bps 187 bps -88 bps 119 bps10s/30s Spread 82 bps 69 bps 67 bps 60 bps 54 bps -28 bps 32 bps
Interest Rate Strategy: Forecast Detail
Rates Forecasts
Base case rate forecasts include Fed rate hikes beginning in August 2010, but risks are tilted towards later hikes
8
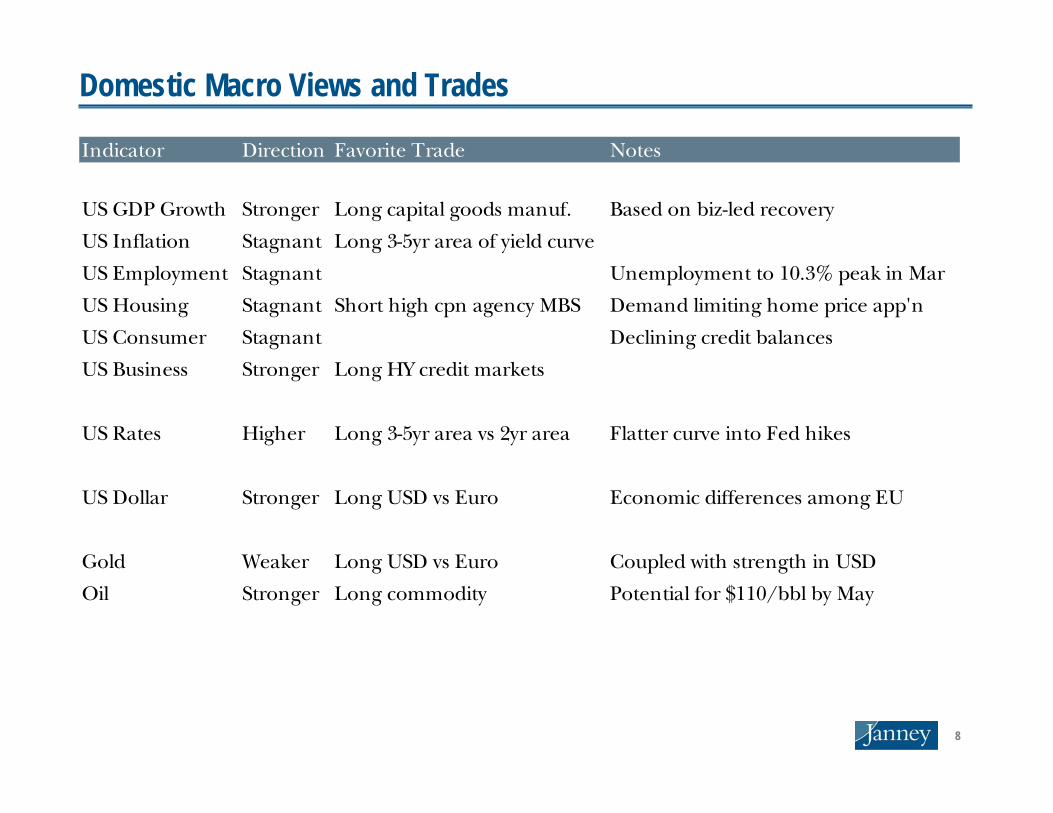
Domestic Macro Views and Trades
Indicator Direction Favorite Trade Notes
US GDP Growth Stronger Long capital goods manuf. Based on biz-led recovery
US Inflation Stagnant Long 3-5yr area of yield curve
US Employment Stagnant Unemployment to 10.3% peak in Mar
US Housing Stagnant Short high cpn agency MBS Demand limiting home price app'n
US Consumer Stagnant Declining credit balances
US Business Stronger Long HY credit markets
US Rates Higher Long 3-5yr area vs 2yr area Flatter curve into Fed hikes
US Dollar Stronger Long USD vs Euro Economic differences among EU
Gold Weaker Long USD vs Euro Coupled with strength in USD
Oil Stronger Long commodity Potential for $110/bbl by May

9
Fixed Income SectorsTreasuries: Underweight. Carry offered in other sectors is more attractive. Our preference is for the 5 year area of the curve, which offers a superior risk/return tradeoff in the bear flattener we expect.
Agencies: Marketweight. Net negative issuance for 2010 will drive supply out of the markets and concerns about Treasuries should push more buyers into agency space.
Mortgages: Underweight. The interaction between rising Treasury rates, the end of the Fed’s buy program, and still-impaired home prices creates an uncertain prepayment outlook.
Investment Grade Credit: Marketweight. We are maintaining a position we took in September after spread contraction reduced attractiveness of corporates.
High Yield Credit: Short term marketweight, long term underweight. High yield markets based on the additional carry offered versus lower risk sectors, but there are refinancing overhangs post-2010.
Tax-Exempt Municipals: Overweight. Credit performance will be substantially better than headline fears suggest and tax policy will likely be favorable into year end and early 2011.
Build America Bonds: Overweight. As BABs become more mainstream in 2010, we anticipate a portion of their value will disappear through spread tightening.

10
Treasuries/Rates Markets
Treasury Curve 1Q 2010 2Q 2010 3Q 2010 4Q 2010 2010 Change 2010 Total Return3m Bill 0.12% 0.36% 0.67% 1.17% +111 bps2yr Note 1.33% 1.72% 2.13% 2.47% +136 bps 0.28%5yr Note 2.94% 3.20% 3.40% 3.58% +74 bps 1.33%10yr Note 3.91% 4.00% 4.18% 4.35% +48 bps 1.35%30yr Bond 4.61% 4.67% 4.79% 4.89% +20 bps 2.07%
Rate forecasts suggest 30yr bonds will have greatest return, but risk level is too rich for our blood
Our preference is for risk/return tradeoff is 5yr area of the yield curve
Not coincidentally, we’re not confident in inflation forecasts out past 5yrs
High issuance ($1.0 tln) not negligible, but economics is bigger factor
11
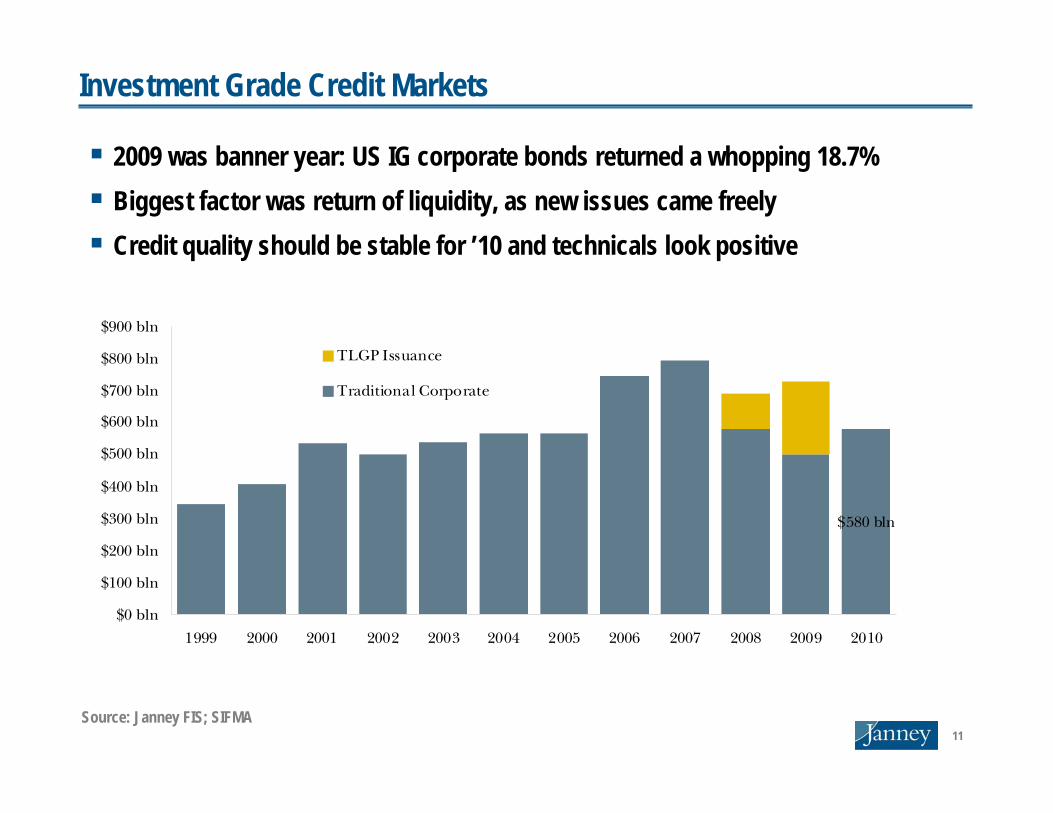
Investment Grade Credit Markets
2009 was banner year: US IG corporate bonds returned a whopping 18.7%Biggest factor was return of liquidity, as new issues came freelyCredit quality should be stable for ’10 and technicals look positive
$580 bln
$0 bln
$100 bln
$200 bln
$300 bln
$400 bln
$500 bln
$600 bln
$700 bln
$800 bln
$900 bln
1999 2000 2001 2002 2003 2004 2005 2006 2007 2008 2009 2010
TLGP Issuance
Traditional Corporate
Source: Janney FIS; SIFMA

12
High Yield Credit Markets
High yield markets outperformed S&P 500 by 2:1 ratio primarily on liquidity improvementsCredit cycle is now on the downswing, but series risks from refinancing remain in 2011 – 2015 timeframe
$0 bln
$50 bln
$100 bln
$150 bln
$200 bln
$250 bln
$300 bln
$350 bln
2016201520142013201220112010
High Yield Debt Maturities
Leveraged Loan Maturities
Source: Janney FIS; Barclays; S&P; Merrill Lynch

13
Conclusions
Economic situation suggests stable but very slow growth with limited inflation; biggest risk is unemployment feeding back into spending
Rates are headed higher in bear flattener—but not as far as dire forecasts suggest
There are few clear opportunities in the fixed income markets, and returns are likely to be positive, though low
The 2007 – 2009 credit cycle has finally turned and defaults are on the downswing, but beware high yield in 2011 – 2015

14
Top 10 Surprises1. Labor Markets (moderate probability, high impact): Rising unemployment feeds 1Q spending, pushing
the domestic economy back into a double dip recession and forestalling Fed rate hikes.2. Inflation (high probability, moderate impact): Short term evidence of core inflation again refuses to
materialize amid limited end user demand for goods and services, limiting the Fed’s need to raise rates.3. Inflation (low probability, moderate impact): Policy actions successfully tame long term inflation,
leading a sharp flattening of the yield curve, particularly in the 5-30 year range.4. Commodities (high probability, moderate impact): Oil prices rally past $110 per barrel by May on
demand for industrial chemicals and limited refining capacity.
$30
$50
$70
$90
$110
$130
$150
Dec-07 Mar-08 Jun-08 Sep-08 Dec-08 Mar-09 Jun-09 Sep-09 Dec-09
Oil (Barrel)
Regular Unleaded (Scaled x30 Gallons)
Source: Janney FIS; Barclays; S&P; Merrill Lynch

15
Top 10 Surprises5. Housing (moderate probability, high impact): Higher mortgage rates have a greater than anticipated
impact on housing demand and lead to another leg downward in residential real estate prices.
6. Currencies (high probability, moderate impact): U.S. dollar rallies back aggressively versus major currencies—especially the Euro—and gold prices slide sharply as a result.
7. Sovereigns (low probability, high impact): European Union members bail out a member country to stave off default risk, thereby further stretching the economic fabric of both the EU and the Euro.
8. Sovereigns (low to moderate probability, moderate impact): A Middle East sovereign default triggers a range of concerns in the region and in the emerging market sector in general.
9. Credit (moderate probability, moderate impact): Commercial real estate defaults fail to materialize at the predicted pace as liquidity improves and lenders offer concessions to avoid ruthless defaults.
10.Credit (low probability, high impact): Fed/Treasury elect not to provide support for a financial institution that met the $100 billion “systemically important” threshold and instead unwind the offending institution.

16
Disclaimer
This report is the intellectual property of Janney Montgomery Scott LLC (Janney) and may not be reproduced, distributed, or published by any person for any purpose without Janney’s express prior written consent.
This report and any names or data used has been prepared by Janney and is to be used for informational purposes only and may not represent specific features of a security. The information presented herein is taken from sources believed to be reliable, but is not guaranteed by Janney as to accuracy or completeness. The yield information presented is representative of yields for various fixed income products as of the date of this report. Unless otherwise noted, all data and modeling comes from Bloomberg and Janney Fixed Income Strategy. In no event should this report be construed as a solicitation or offer to purchase or sell a security. Securities mentioned may not be available and/or may not be available at the stated yields or price. Preliminary Official Statements, Final Official Statements or Prospectus for any new issues mentioned herein are available upon request. The securities mentioned may not be suitable for an investor depending on investment objective, financial situations and tax status.
The securities indicated are subject to availability and market price fluctuation. Certain securities may be subject to redemption prior to maturity. The yield and average life of a Collateralized Mortgage Obligation (CMO) may fluctuate significantly depending on the actual prepayment experience of the underlying mortgage and changes in current interest rates. The government guarantee of GNMAs only applies to face value of the CMO and not any premium paid. Some municipal bonds may be subject to Alternative Minimum Tax (AMT) treatment; consult your tax professional regarding any questions on the security’s tax implications. CDs are insured by the Federal Deposit Insurance Corp (FDIC) up to $100,000 per investor. The FDIC limit has been temporarily increased to $250,000 per investor until December 31, 2009; after this date it will return to $100,000. IRA accounts are insured up to $250,000. CDs sold in the secondary market for less than the original investment amount prior to maturity or redemption will be subject to a loss in principal. Losses to principal are not guaranteed by the FDIC. For investment advice specific to your individual situation, or for additional information on this or other topics, please contact your Janney Financial Consultant and/or your tax or legal advisor.

17
TECHNICAL STRATEGY
First Quarter Outlook
Dan Wantrobski, CMTTechnical Strategist
January 8, 2010
18
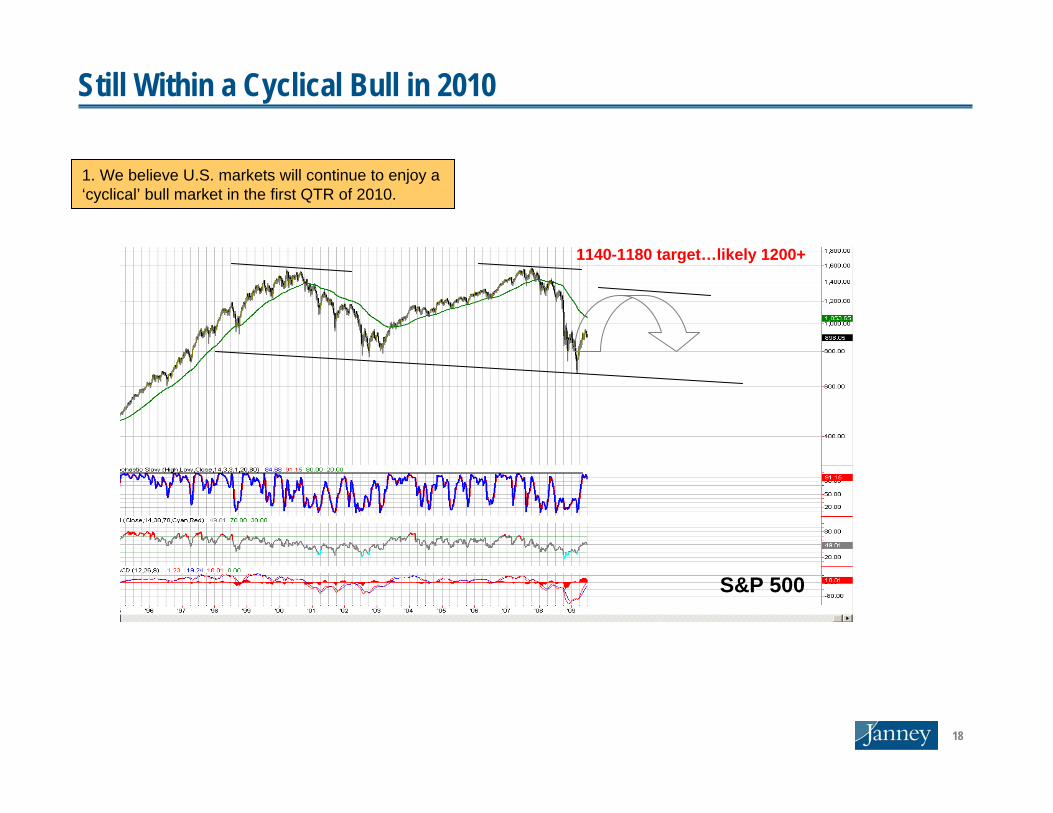
Still Within a Cyclical Bull in 2010
S&P 500
1. We believe U.S. markets will continue to enjoy a ‘cyclical’ bull market in the first QTR of 2010.
1140-1180 target…likely 1200+

191880s 1920s 1940s 1980s 20??
1900s 1930s 1960s 2000
inflationary deflationary inflationary deflationary
Interest Rates
Equities
Commodities
We are here.
bull
bear
bull
bear
bull
bear
bull
bear
bear
bull
bear
bull
bear
bull
bear
bull
2. But this new cyclical uptrend resides within a deflationary bear market cycle.
Secular Market Curve

20
1. 78% rally from 1975 to mid-1976
2. 25% decline from 1976 to early 1978
1974
1982
3. The miniscule range from 1978 to early 1980
4. 33% rally from 1980 to 1981
5. 25% decline from 1981 into 1982
1974:Dow Bottom: 12/74Recession Trough: 03/75Credit Trough: 3rd QTR 75
3. At 10+ years in, we have likely reached the midpoint of this secular bear cycle- but the remaining years are likely to be more choppy than they have been since 2000…use 1974 to 1982 as an example of the type of range we will likely encounter- this was the tail-end of our last secular bear market (1966-1982).
US Markets: 1966-1982
What Will the Next Years Look Like?
21
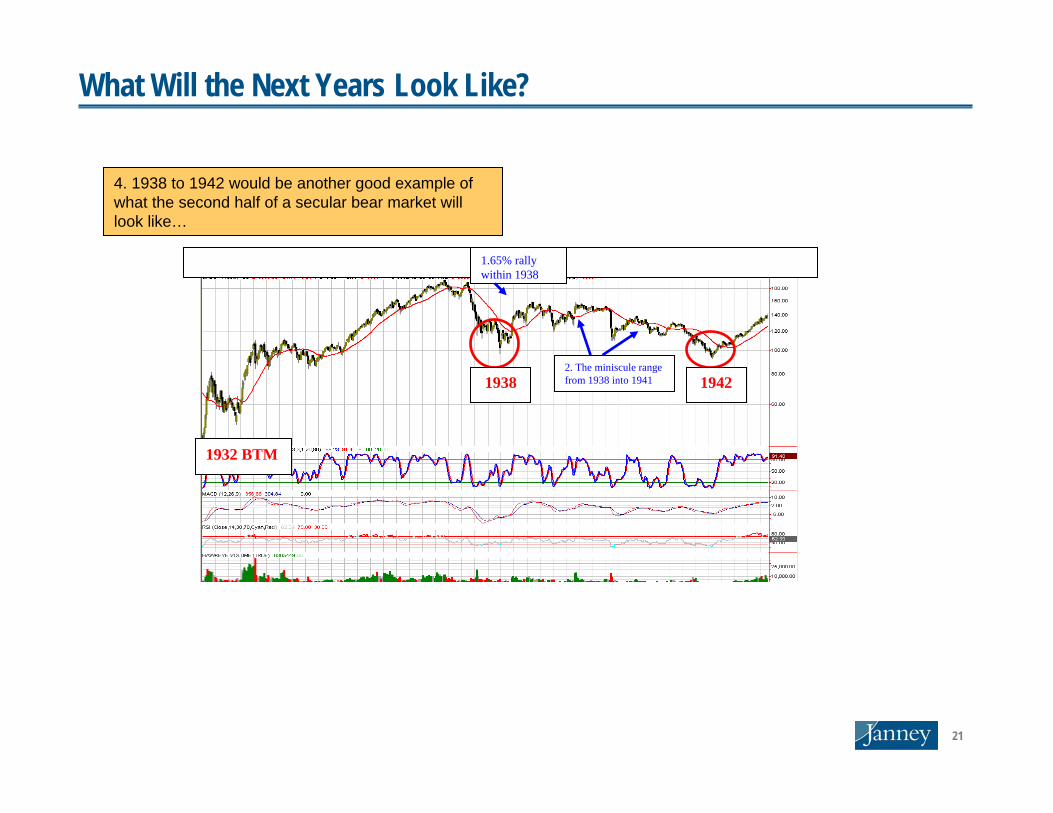
1932 BTM
1938 1942
1.65% rally within 1938
2. The miniscule range from 1938 into 1941
4. 1938 to 1942 would be another good example of what the second half of a secular bear market will look like…
What Will the Next Years Look Like?

22
Technicals: New secular bull markets always take us past the prior bull market…on to new all-time highs-
1. Technicals
2. Valuations
3. Velocity/credit
4. Demographics
Each secular bull market (green line) breaks us out of the multi-year base built during the preceding secular bear (red line)…
5. What does it take to transition into the next secular bull cycle?
Four Keys to Secular Bull

23
6. Secular bull markets are born when stocks are cheap- not expensive or even fairly valued…right now, we have the trailing 12 on the SPX around 20. Past bull markets began when it posted monthly closes below 10…
Stocks Aren’t Cheap: P/E vs S&P
24
V e lo c i t y
1 .5 0 0
1 .6 0 0
1 .7 0 0
1 .8 0 0
1 .9 0 0
2 .0 0 0
2 .1 0 0
1959
1961
1963
1965
1967
1969
1971
1973
1975
1977
1979
1981
1983
1985
1987
1989
1991
1993
1995
1997
1999
2001
2003
2005
2007
1966-1982
1982-2000
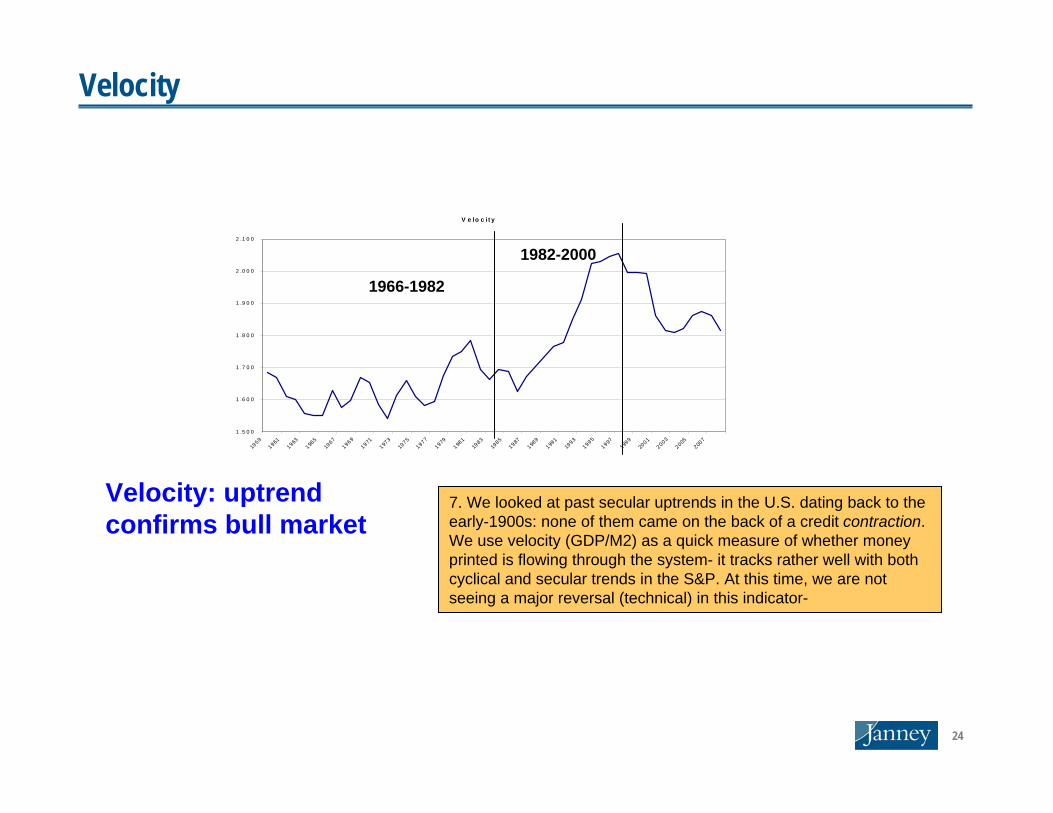
Velocity: uptrend confirms bull market
7. We looked at past secular uptrends in the U.S. dating back to the early-1900s: none of them came on the back of a credit contraction. We use velocity (GDP/M2) as a quick measure of whether money printed is flowing through the system- it tracks rather well with both cyclical and secular trends in the S&P. At this time, we are notseeing a major reversal (technical) in this indicator-
Velocity

25
1 .0 0
10 .00
1 00 .00
1 ,0 00 .00
1 0 ,0 00 .001/
31/1
942
1/31
/194
4
1/31
/194
6
1/31
/194
8
1/31
/195
0
1/31
/195
2
1/31
/195
4
1/31
/195
6
1/31
/195
8
1/31
/196
0
1/31
/196
2
1/31
/196
4
1/31
/196
6
1/31
/196
8
1/31
/197
0
1/31
/197
2
1/31
/197
4
1/31
/197
6
1/31
/197
8
1/31
/198
0
1/31
/198
2
1/31
/198
4
1/31
/198
6
1/31
/198
8
1/31
/199
0
1/31
/199
2
1/31
/199
4
1/31
/199
6
1/31
/199
8
1/31
/200
0
1/31
/200
2
1/31
/200
4
millenials born
baby boomers retire
millenials nest
2nd gen. nests
2nd gen. retires
1940s-1950s1960s-1970s
1980s-1990s
2000s-2010s
baby boomers incubatebaby boomers born
baby boomers nest millenials incubate
Largest cohort typically drives secular bull markets: the echo-boom (‘Millenials’) are not “online” just yet…
8. Demographic trends have typically been a key component for secular bull markets in the U.S. The cycle follows a ‘boom / bust’ pattern, where the boom cohorts tend to drive secular expansions when they ‘grow up’ and begin nesting. The last major cohort was the Baby Boomers (early 1980s), and prior to that it was the ‘Great Generation’ or ‘WWII Generation’ (in the early 1940s). The next boom in demographics for the U.S. are the ‘Millenials’ (or Echo Boom), which has not yet begun ‘nesting.’ In fact reports cite that their peak college admissions was either this year or last year- which means we have some time before this cohort begins to drive a new secular expansion.
Demographics

26
Gold
Dollar Index
S&P 500
10. There is a potential positive correlation developing with the U.S. dollar…
Developments for 2010: The Dollar

27
We feel that the US markets are likely to remain range-bound in the years ahead, as the current deflationary bear cycle continues to unwind- we have not yet seen any major developments in the 4 key factors cited here (technicals, valuations, credit picture, demographics) to warrant the call for a new secular bull market in the U.S.
That being said, we continue to believe that the markets have reached the midpoint of this secular bear cycle, and as such, the tail-end of the bear will be comprised of much more muted trading ranges in the final years. These choppy trading grounds will provide the environment for stock valuations to push lower (based generally on the PE ratio of the SPX), the credit picture within the broader economy to slowly correct itself (velocity to improve), and the Millenials the time needed to complete their adolescent endeavors and get out into the real world- just in time to drive the next secular uptrend. The result of these developments materializing will be the emergence of a new multi-decade bull market for stocks that brings the S&P well north of its prior secular peak, in our opinion.
Conclusions

28
Technical opinions expressed in this report are not dependent upon the opinion of the fundamental analyst covering any security. Accordingly, the Technical opinions contained herein may differ from those of the fundamental analysts. Copies of the Fundamental Analysis reports are available upon request. All charts courtesy of TradeStation and or Bloomberg.ANALYST CERTIFICATION AND IMPORTANT DISCLOSURESResearch Analyst CertificationI, Dan Wantrobski, the Primarily Responsible Analyst for this research report, hereby certify that all of the views expressed in this research report accurately reflect my personal views about any and all of the subject securities or issuers. No part of my compensation was, is, or will be, directly or indirectly, related to the specific recommendations or views I expressed in this research report.Janney Montgomery Scott LLC (“JMS”) Equity Research Disclosure Legend1.JMS is a market maker in the securities of the company and may at any time hold a long or short position in this security.2.The research analyst primarily responsible for preparing this research report or a member of the research analyst’s household has a financial interest in the securities of the company in the form of a long position in such securities.3.The research analyst primarily responsible for preparing this research report or a member of the research analyst’s household has a financial interest in the securities of the company in the form of options (O), warrants (W), futures (F), and/or a short position (S).4.JMS or an affiliate managed or co-managed a public offering of securities for the company in the past 12 months.5.JMS or an affiliate received compensation for investment banking services from the company in the past 12 months.6.JMS or an affiliate received compensation for products or services other than investment banking services from the company in the past 12 months.7.JMS may seek compensation for investment banking services from the subject company (ies) in the next 3 months. 8.The research analyst is compensated based on, in part, JMS’s profitability, which includes its investment banking revenues.9.JMS or an affiliate beneficially owns 1% or more of any class of common equity securities of the company. 10.An Employee or Director of JMS is an officer or Director of subject company.11.Other: Definition of RatingsBUY: Janney expects that the subject company will appreciate in value. Additionally, we expect that the subject company willoutperform comparable companies within its sector.NEUTRAL: Janney believes that the subject company is fairly valued and will perform in line with comparable companieswithin its sector. Investors may add to current positions on short-term weakness and sell on strength as the valuations orfundamentals become more or less attractive.SELL: Janney expects that the subject company will likely decline in value and will underperform comparable companieswithin its sector.Ratings Distribution 09/30/09Janney Montgomery Scott Ratings Distribution* as of 9/30/09BUY NEUTRAL SELL49% 49% 2% *As a percent of total coverage. See ratings definition above. Janney Montgomery Scott Ratings of Investment Banking Relationships* as of 6/30/09BUY NEUTRAL SELL11% 3% 0%*Percentages of each rating category where Janney has performed Investment Banking services over the past 12 months.Other DisclosuresInvestment opinions are based on each stock’s 6-12 month return potential. Our ratings are not based on formal price targets, however our analysts will discuss fair value and/or target price ranges in research reports. Decisions to buy or sell a stock should be based on the investor’s investment objectives and risk tolerance and should not rely solely on the rating. Investors should read carefully the entire research report, which provides a more complete discussion of the analyst’s views.This research report is provided for informational purposes only and shall in no event be construed as an offer to sell or a solicitation of an offer to buy any securities. The information described herein is taken from sources which we believe to be reliable, but the accuracy and completeness of such information is not guaranteed by us. The opinions expressed herein may be given only such weight as opinions warrant. This Firm, its officers, directors, employees, or members of their families may have positions in the securities mentioned and may make purchases or sales of such securities from time to time in the open market or otherwise and may sell to or buy from customers such securities on a principal basis. Supporting information related to the recommendation, if any, made in the research report is available upon request.
Disclaimer