©2010 LarsonAllen LLP 1 An Introduction to and Initial Results from Our Operational Excellence...
76
©2010 LarsonAllen LLP 1 An Introduction to and Initial Results from Our Operational Excellence Journey
-
Upload
silas-charles -
Category
Documents
-
view
214 -
download
0
Transcript of ©2010 LarsonAllen LLP 1 An Introduction to and Initial Results from Our Operational Excellence...
©20
10 L
arso
nA
llen
LLP
1
An Introduction to and Initial Results from Our Operational Excellence Journey

©20
10 L
arso
nA
llen
LLP
2
Introduction
• Share LarsonAllen’s Operational Excellence journey
• Like Lean, it’s not:– The only way– The “best” way
• It’s just “our” way– 20% is tools & techniques; 80% is people & culture; a
“can do” attitude– Hunger to find a “better” way
©20
10 L
arso
nA
llen
LLP
3
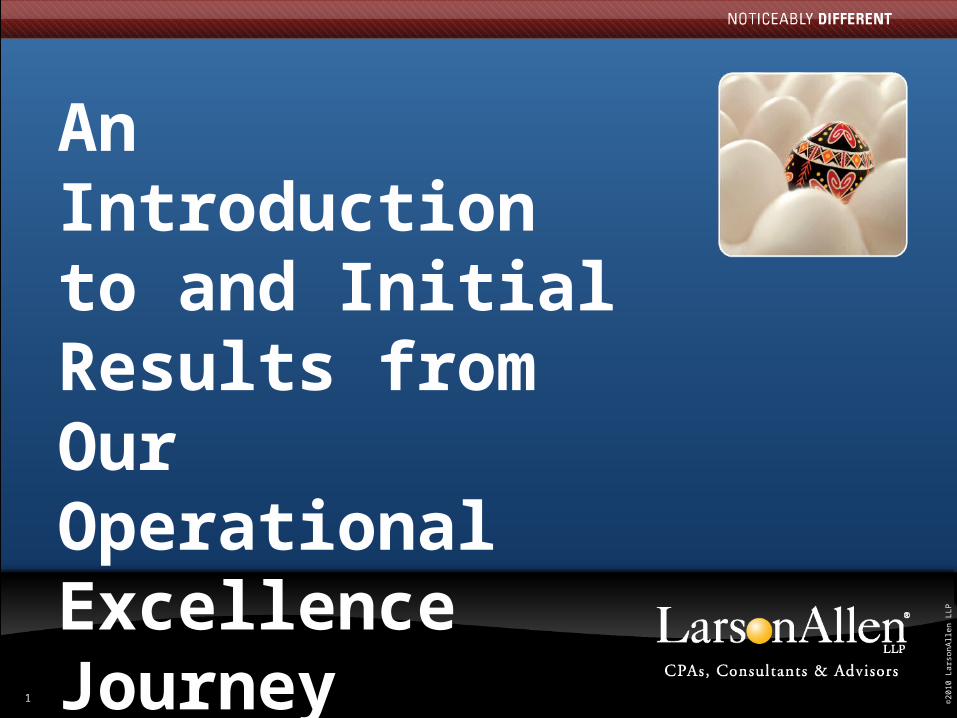
Opening Questions
• How many believe we are being asked or required to do more today for our core services, either due to regulatory or client demands?
• How many are experiencing price sensitivity with clients today?
• How many are actively doing something about it?• By show of hands, how many have decreased
hours in core services for every engagement, even with the increase in requirements?
• How many believe this is possible?
©20
10 L
arso
nA
llen
LLP
4
Opening Questions
• How many measure how long it takes your average audit engagement to issue from the end of fieldwork?
• For those that do, how long does it take?– 1 quarter/3 months? -- 2 months?– 1 month? -- 2 weeks?– 1 week? -- 1 day?
• Anyone frustrated with how long this takes, or is it “just the way it is”?
• What happens during this wrap-up time to slow this down?
©20
10 L
arso
nA
llen
LLP
5
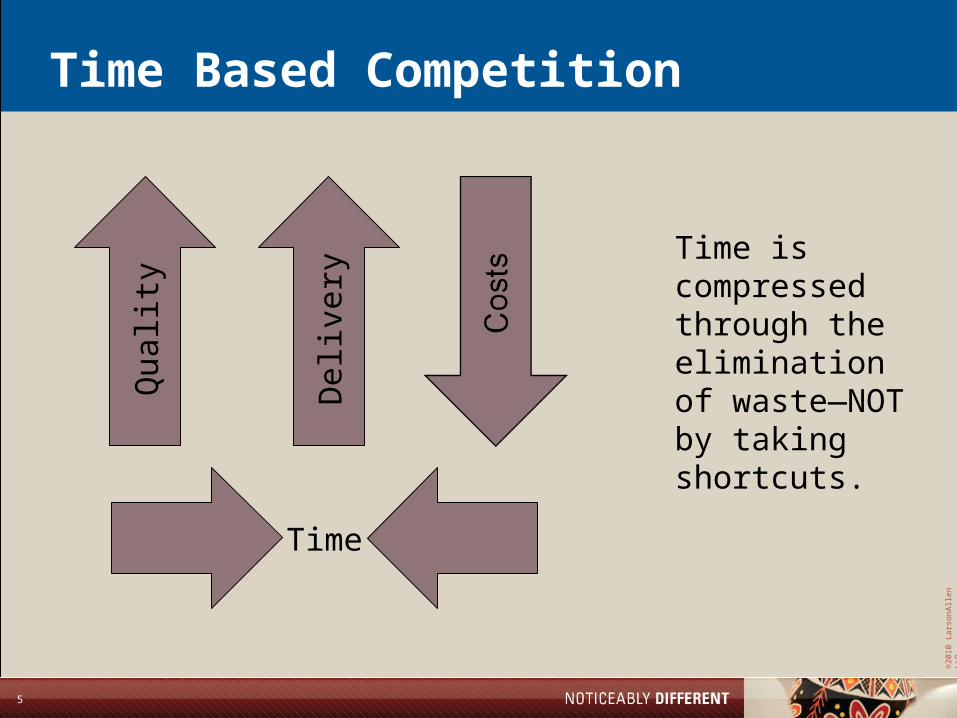
Time Based Competition
Qua
lity
Del
iver
y
Time
Time is compressed through the elimination of waste—NOT by taking shortcuts.

©20
10 L
arso
nA
llen
LLP
6
Continuous Improvement—Waste Reduction
VA WasteTypicalCompany
VATraditionalOperationalImprovement
Lean
Waste
OriginalLead Time
MinorImprovement
MajorImprovementVA Waste

©20
10 L
arso
nA
llen
LLP
7
Phases of Operational Excellence
Remove the rocks
Reduce variation
Stabilize
Move the furniture
5 years
Repeat
Few-broad
Many-narrow
©20
10 L
arso
nA
llen
LLP
8
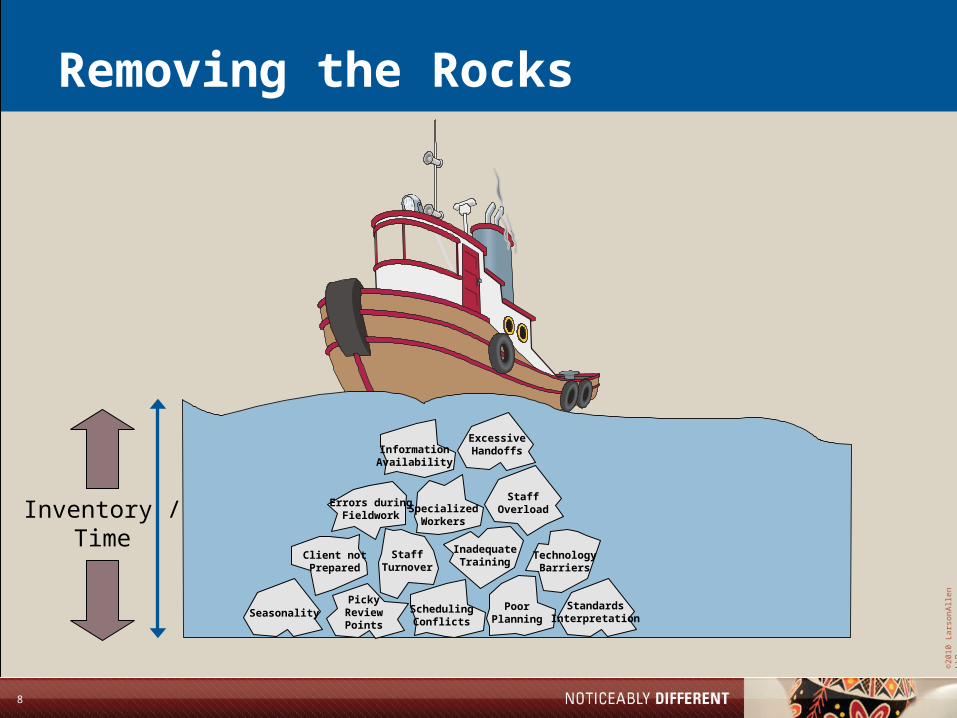
Removing the Rocks
Inventory /Time
SeasonalityPicky
ReviewPoints
SchedulingConflicts
PoorPlanning
StandardsInterpretation
Client notPrepared
StaffTurnover
InadequateTraining
TechnologyBarriers
Errors duringFieldwork
SpecializedWorkers
StaffOverload
ExcessiveHandoffsInformation
Availability

©20
10 L
arso
nA
llen
LLP
9
The Toyota Way
Overview*
*Some content from “The Toyota Way,” by Dr. Jeffrey Liker

©20
10 L
arso
nA
llen
LLP
10
The 14 Principles of the Toyota Way1. Long-term philosophy
2. Continuous flow
3. Pull systems
4. Level workload
5. Stop to fix problems
6. Standardized tasks
7. Visual control
8. Reliable and tested technologies
9. Leadership development
10. Team development
11. Respect for partners and suppliers
12. Go and see
13. Consensus decisions, rapid implementation
14. Learning organization and continuous improvement
McGraw-Hill Professional, 2004

©20
10 L
arso
nA
llen
LLP
11
Principle 1
Long-termPhilosophy

©20
10 L
arso
nA
llen
LLP
1212
Implementation Curve—Long-term view
1 2 3
Years Implementing Lean
OrganizationalAcceptance

©20
10 L
arso
nA
llen
LLP
13
Principle 2
ContinuousFlow
©20
10 L
arso
nA
llen
LLP
14
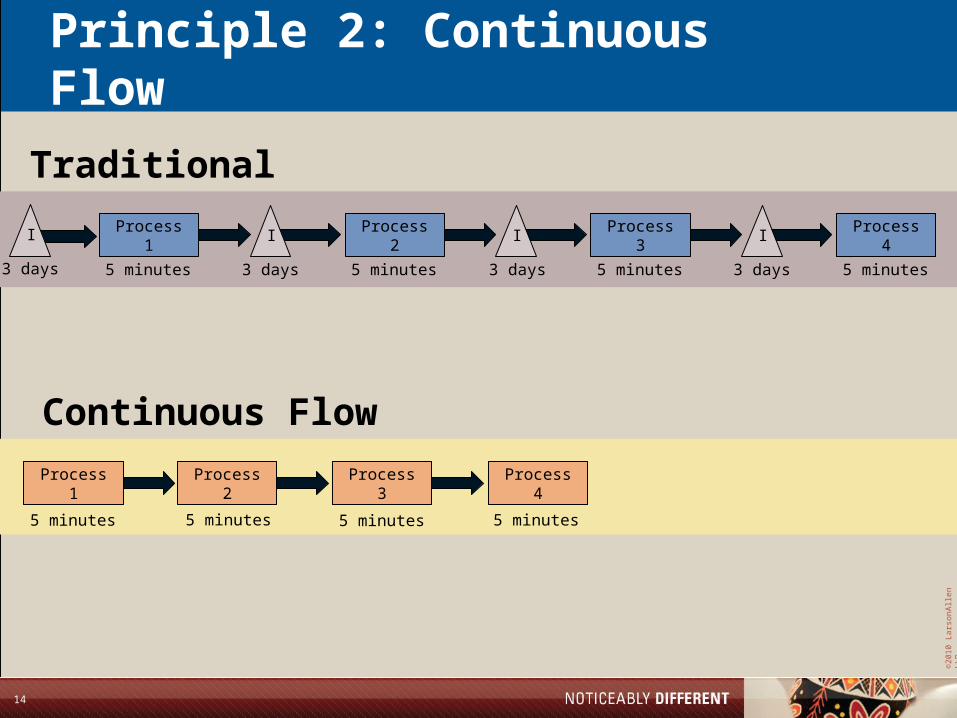
Principle 2: Continuous Flow
Process 1 I Process 2 I Process 3 I Process 4
Traditional
5 minutes 5 minutes 5 minutes 5 minutes3 days 3 days 3 days
I
3 days
Process 1 Process 2 Process 3 Process 4
Continuous Flow
5 minutes 5 minutes 5 minutes 5 minutes
©20
10 L
arso
nA
llen
LLP
15
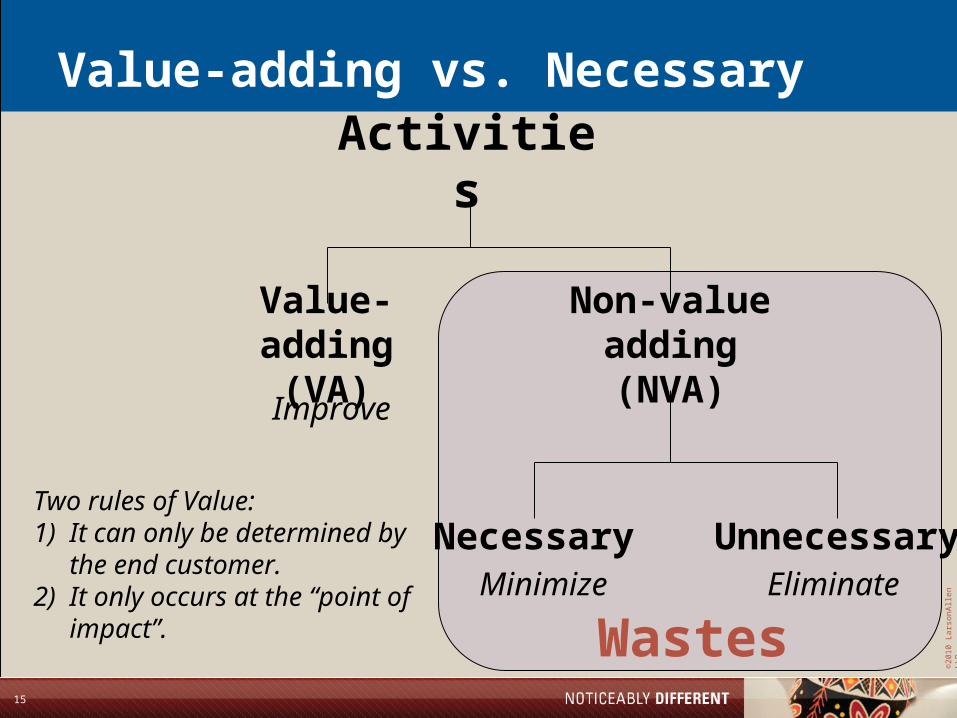
Value-adding vs. Necessary
Wastes
Necessary UnnecessaryEliminateMinimize
Two rules of Value:1) It can only be determined by
the end customer.2) It only occurs at the “point of
impact”.
Activities
Value-adding(VA)
Non-value adding(NVA)
Improve

©20
10 L
arso
nA
llen
LLP
16
Seven Wastes
• Waste of inventory• Waste of correction • Waste of transportation• Waste of over-processing• Waste of waiting• Waste of motion• All leading to …
the waste of a person
©20
10 L
arso
nA
llen
LLP
17
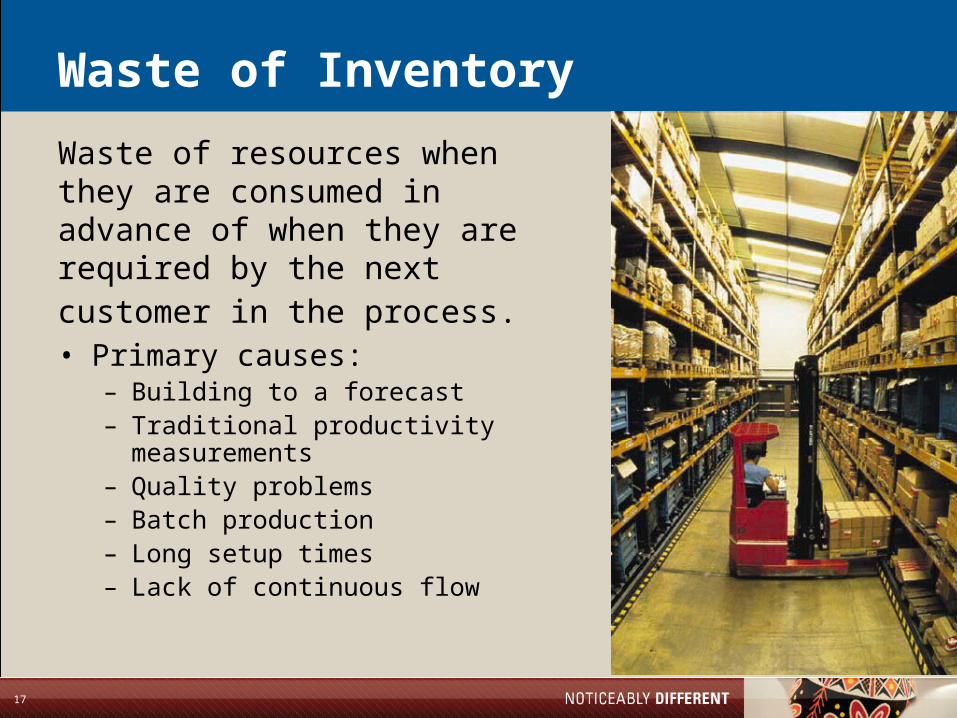
Waste of Inventory
• Primary causes:– Building to a forecast– Traditional productivity
measurements– Quality problems– Batch production– Long setup times– Lack of continuous flow
Waste of resources when they are consumed in advance of when they are required by the next customer in the process.

©20
10 L
arso
nA
llen
LLP
18
Waste of Correction
• Primary causes:– Lack of error proofing– Poor instructions and training– Lack of communication
between processes– Lack of standard work– Inadequate supplier quality– Need for adjustments
Waste that occurs when a product does not conform to proper specifications. The result could involve product rework or scrap.

©20
10 L
arso
nA
llen
LLP
19
Waste of Transportation
• Primary causes:– Inefficient facility layout– Inefficient facility location– Inefficient use of technology
Waste caused by unnecessary movement of material or product.
©20
10 L
arso
nA
llen
LLP
20
Waste of Over-Processing
• Primary causes:– Not identifying customer values– Not asking 5-why’s for a process
step– Variation within a process
Waste of unnecessary processes and operations.
©20
10 L
arso
nA
llen
LLP
21
Waste of Waiting
• Primary causes:– Operations not linked– Material and supplies do not arrive
in the quantity needed
Waste caused by not having all the material, supplies or information available exactly when needed for the worker to do their value-added job without interruption.

©20
10 L
arso
nA
llen
LLP
22
Waste of Motion
• Primary causes:– Inefficient workplace layout– Inefficient tools– Lack of standard work—
consistency
Waste caused by non-value added movement of workers and production machines.
©20
10 L
arso
nA
llen
LLP
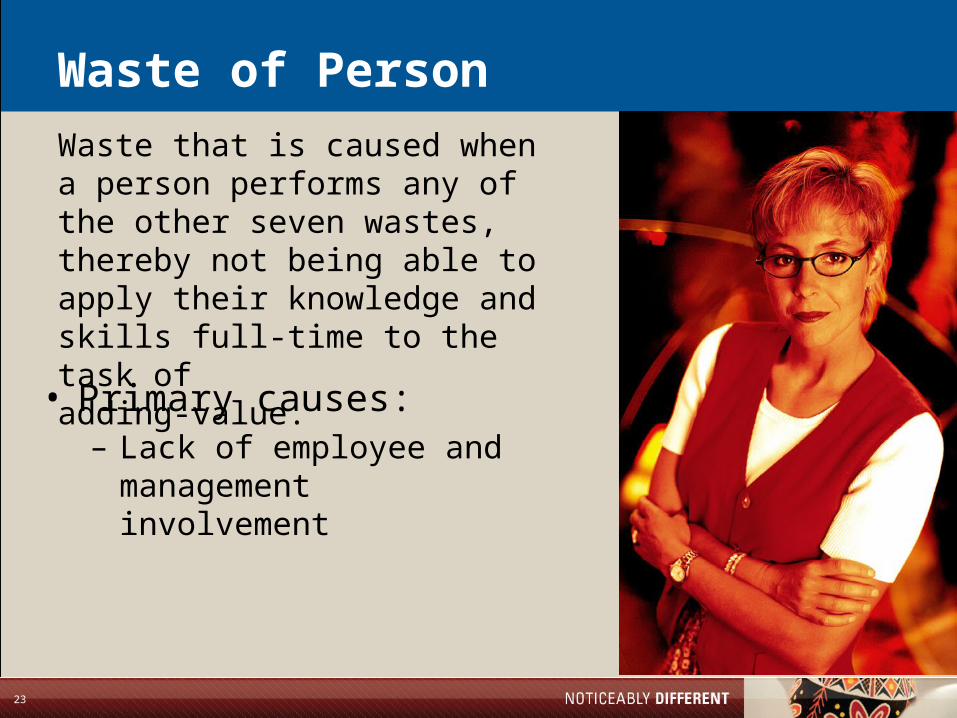
23
Waste of Person
• Primary causes:– Lack of employee and
management involvement
Waste that is caused when a person performs any of the other seven wastes, thereby not being able to apply their knowledge and skills full-time to the task of adding-value.

©20
10 L
arso
nA
llen
LLP
24
Principle 4
LevelProduction
©20
10 L
arso
nA
llen
LLP
25
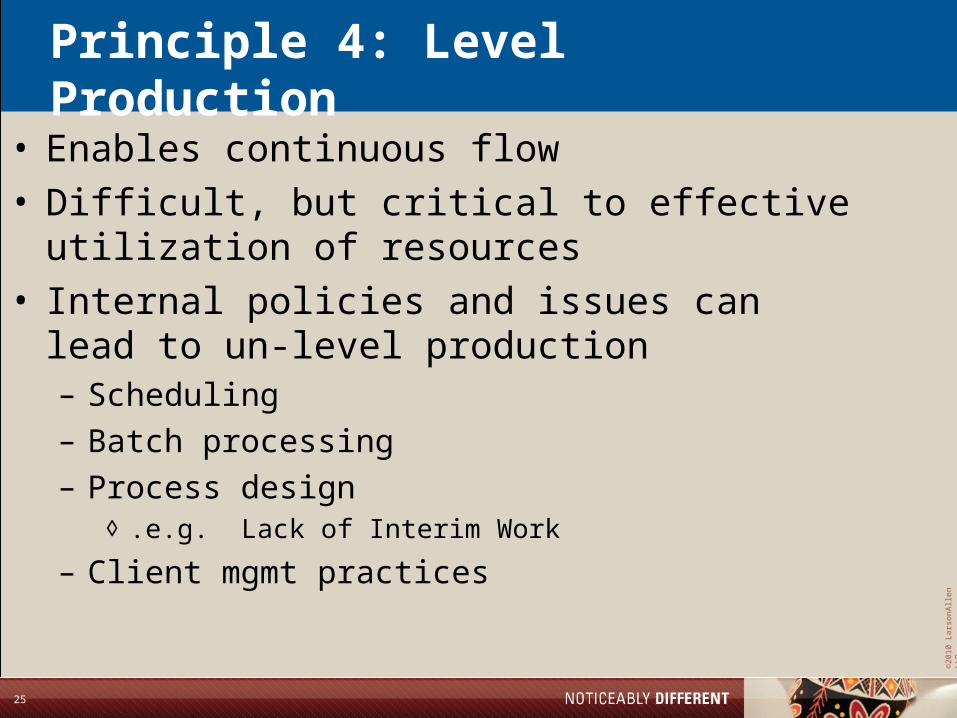
Principle 4: Level Production
• Enables continuous flow• Difficult, but critical to effective utilization of
resources• Internal policies and issues can lead to un-level
production– Scheduling– Batch processing– Process design
◊ .e.g. Lack of Interim Work
– Client mgmt practices
©20
10 L
arso
nA
llen
LLP
26
Principle 5
Stop and FixProblems
©20
10 L
arso
nA
llen
LLP
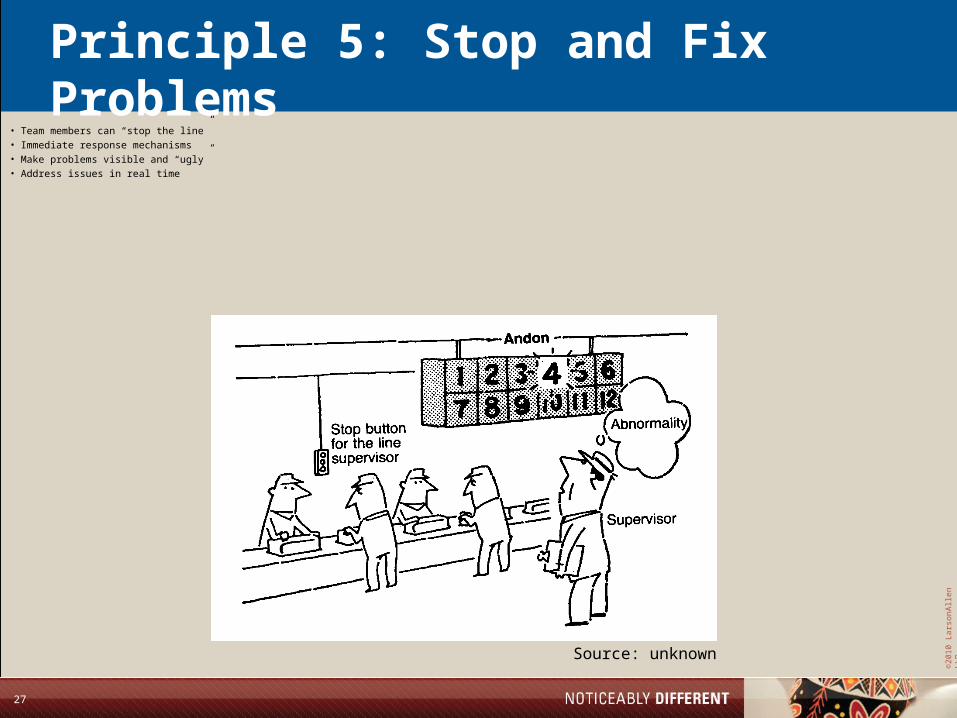
27
Principle 5: Stop and Fix Problems• Team members can “stop the line”
• Immediate response mechanisms
• Make problems visible and “ugly”
• Address issues in real time
Source: unknown
©20
10 L
arso
nA
llen
LLP
28
Stop and Fix Problems
• Sounds easy, natural, right?• Does anyone ever have an audit staff person that
has a question that stops their progress in one audit section or area? Or on that whole engagement?
• What do you have them do?• What would happen if all work on an audit
stopped if one person had a question that wasn’t answered or that interrupted their work?
• How would you respond? How quickly would you respond?

©20
10 L
arso
nA
llen
LLP
29
Challenges With “Stop to Fix Problems”
• Too many problems to address• People not skilled in problem solving• Not organized to react immediately• Fear of customer impacts• Cultural inertia to work around problems• Must have a blame-free environment
©20
10 L
arso
nA
llen
LLP
30
Principle 6
StandardizedTasks

©20
10 L
arso
nA
llen
LLP
31
Principle 6: Standardized Tasks
One best way, done by everybody,
until …
a better way is found.

©20
10 L
arso
nA
llen
LLP
32
www.istockphoto.comPurchased 10/19/2010By Rob Tracy
Standardization is Difficult
• Standardization creates the foundation for improvement
• Standardization is an enabler of change … not a barrier to change
• One of the most difficult cultural challenges

©20
10 L
arso
nA
llen
LLP
33
Principle 7
VisualControl
©20
10 L
arso
nA
llen
LLP
34
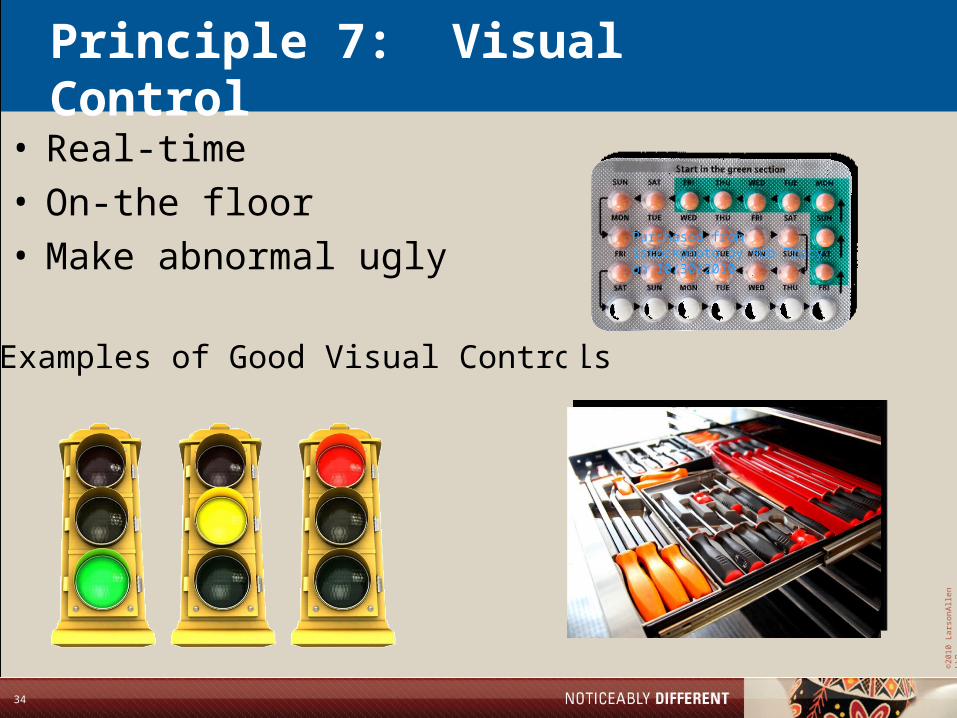
Principle 7: Visual Control
• Real-time• On-the floor• Make abnormal ugly
Examples of Good Visual Controls
Purchased from istockphoto by Rob Tracy on 10/30/2010
Pur
chas
ed f
rom
Ist
ockp
hoto
.com
by
Rob
Tra
cy o
n 10
/30/
2010
Purchased from istockphoto by Rob Tracy on 10/30/2010

©20
10 L
arso
nA
llen
LLP
35
Purchased from istockphoto by Rob Tracy on 10/30/2010
Purchased from istockphoto by Rob Tracy on 10/30/2010
Purchased from istockphoto by Rob Tracy on 10/30/2010
Principle 7: Visual Control
Examples of Poor Visual Controls

©20
10 L
arso
nA
llen
LLP
36
Principles 9 and 10
Leader &
Team Development

©20
10 L
arso
nA
llen
LLP
37
Principle 9: Leader Development• Champions of the Toyota Way• Understand the work• Teach to others• Use every opportunity as a coaching moment
Making things means making people.
—Fujio Cho, Chairman, Toyota

©20
10 L
arso
nA
llen
LLP
38
Principle 10: Team Development• Adjectives for associates
in a lean environment– Aligned
– Engaged
– Empowered
– Smart
– Skilled
– Valued
– Respected
Implementing the Toyota Way is 20% Tools and 80% People
President
Associates
Customers
©20
10 L
arso
nA
llen
LLP
39
Our Approach: Kaizen

©20
10 L
arso
nA
llen
LLP
40
What is Kaizen?
• Definition: Continuous Incremental Improvement• Literal Translation:
“Change” & “For The Better”• Kaizen structure
– One week– Focused– Cross-functional– Outcome oriented– Fast-paced– Results, not recommendations

©20
10 L
arso
nA
llen
LLP
41
Kaizen “rules”
• No stripes• Everyone participates & contributes• Seek to understand other’s perspectives• Treat others with respect• Consensus decision making
– If impasse is reached – majority rule
• Minimize the post-kaizen to-do list• Stay focused – no Blackberries• Be on time
©20
10 L
arso
nA
llen
LLP
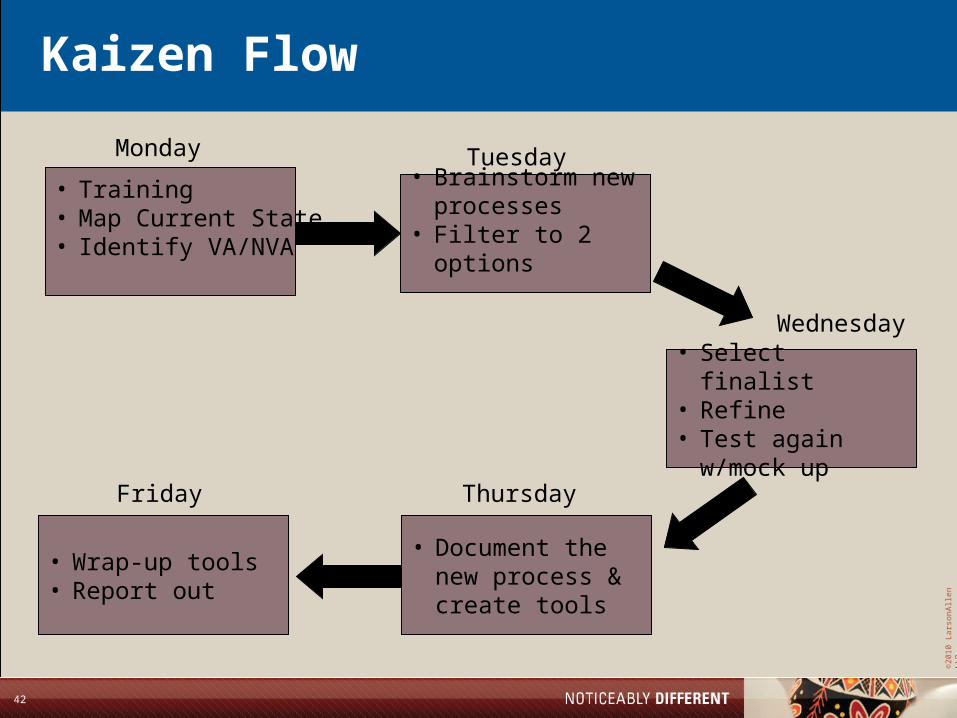
42
Kaizen Flow
• Training• Map Current State• Identify VA/NVA
• Brainstorm new processes
• Filter to 2 options
• Select finalist • Refine• Test again w/mock
up
• Document the new process & create tools
• Wrap-up tools• Report out
Monday Tuesday
Wednesday
ThursdayFriday

©20
10 L
arso
nA
llen
LLP
43
The Purpose of Process Mapping
• To describe the current process
– Document reality
• To build team understanding of the process
• To identify waste
• To stimulate identification of
countermeasures
©20
10 L
arso
nA
llen
LLP
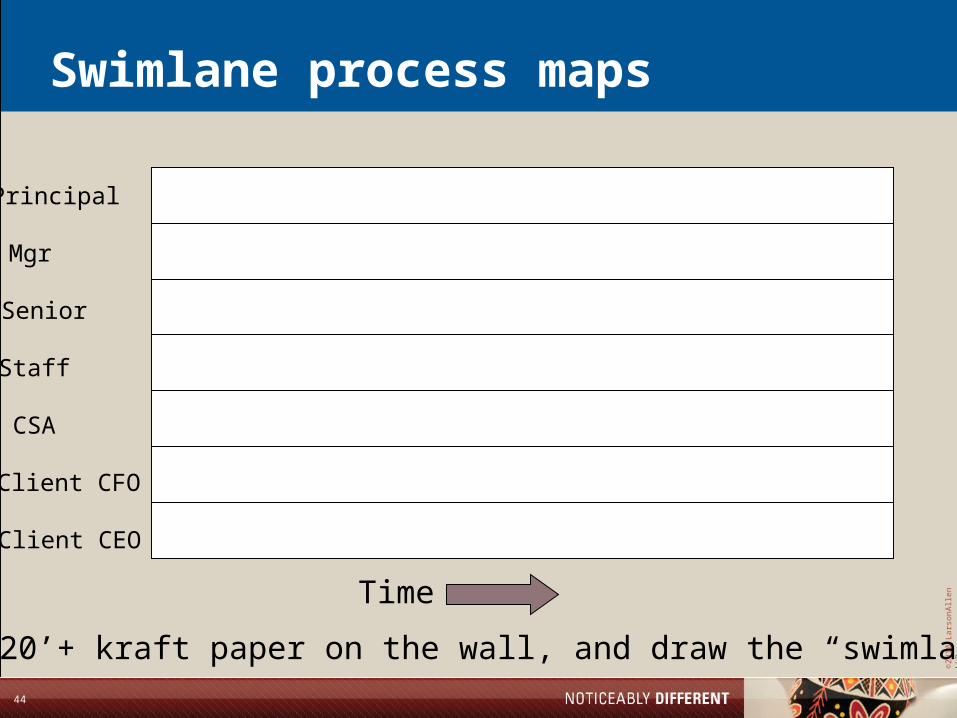
44
Swimlane process maps
Principal
Mgr
Senior
Staff
CSA
Client CFO
Client CEO
Tape 20’+ kraft paper on the wall, and draw the “swimlanes”
Time

©20
10 L
arso
nA
llen
LLP
45
Swimlane process maps
Principal
Mgr
Senior
Staff
CSA
Client CFO
Client CEO
Put tasks on post-it notes & place them on the map.
Time

©20
10 L
arso
nA
llen
LLP
46
The Kaizen Week
46
M T W
EmotionalEnergy
Th F
©20
10 L
arso
nA
llen
LLP
47

©20
10 L
arso
nA
llen
LLP
48
Kaizen Week Outputs
• Future State Process Map• Standard Work Instructions• Tools & Templates (as needed)• Project Charters for implementation• Communication plan and materials• Training plan and materials

©20
10 L
arso
nA
llen
LLP
49
Cultural Differences
Current state Future state
Principal preference Standard work
React Plan and execute with precision
My book of business Our book of business
Individuals Teams
Keep people busy Make work flow
Get jobs started Get jobs completed
Hard on the people Hard on the process
Problems are problems Problems are learningopportunities
©20
10 L
arso
nA
llen
LLP
50
How These Principles Relate to Us (some of our tools & techniques)

©20
10 L
arso
nA
llen
LLP
51
Principle 2
ContinuousFlow

©20
10 L
arso
nA
llen
LLP
52
Manage to the plan Manage to the plan & check in with& check in withthe client oftenthe client often
Don’t start untilDon’t start untilit is readyit is ready
Have a plan & gain Have a plan & gain client’s buy-inclient’s buy-in
Don’t stop untilDon’t stop untilit is completeit is complete
52
Cornerstones of Managing for Daily Improvement
MDI Cornerstones

©20
10 L
arso
nA
llen
LLP
53
Daily client service plan - completed
In-ChargeClient Name Client YE 1 2 3 4 5 6 7 8 9 10 11 12 13 14 15 16 17 18 19 20 21 22 23 24 25 26 27 28 29 30
Nov-09 Dermott BRADMAN LAKE INC12/31 C P P P P I
Dec-09 Dermott BRADMAN LAKE INC12/31 P P P
Jan-10 Dermott BRADMAN LAKE INC12/31 F F F TA PF F F QT RD TP TP TR TR TC TR RD
Feb-10 Dermott BRADMAN LAKE INC12/31 RD TR
©20
10 L
arso
nA
llen
LLP
54
Principle 4
LevelProduction
©20
10 L
arso
nA
llen
LLP
55
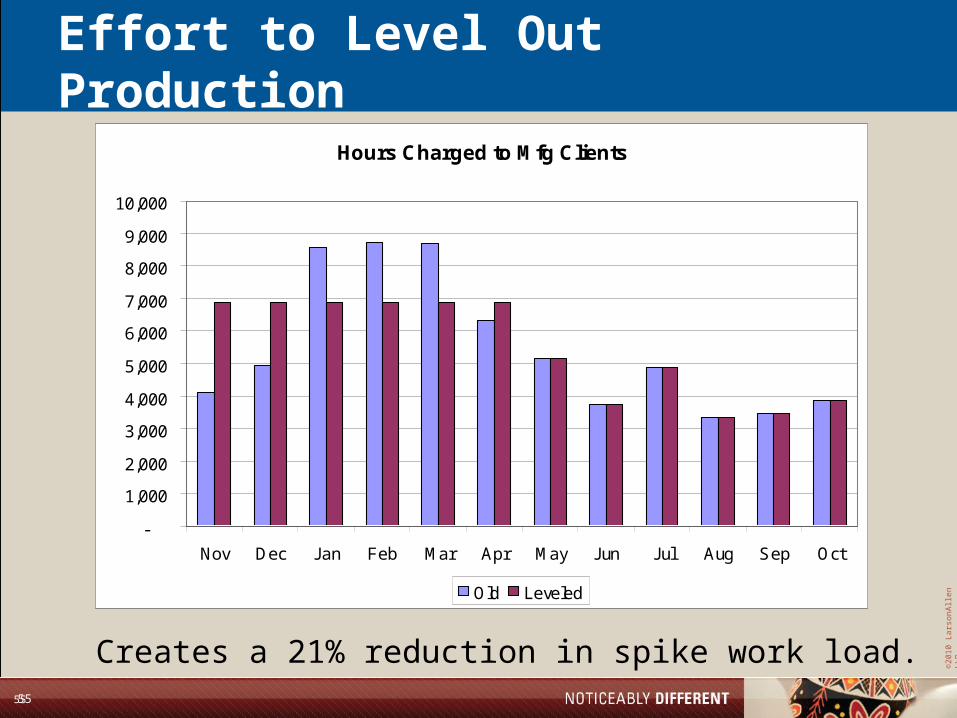
Effort to Level Out Production
Hours Charged to Mfg Clients
-
1,000
2,000
3,000
4,000
5,000
6,000
7,000
8,000
9,000
10,000
Nov Dec Jan Feb Mar Apr May Jun Jul Aug Sep Oct
Old Leveled
55
Creates a 21% reduction in spike work load.

©20
10 L
arso
nA
llen
LLP
56
Principle 5
Stop and FixProblems

©20
10 L
arso
nA
llen
LLP
57
Weekly Stand Up Meetings – 15 minutes
Charlotte Health Care MWI
Timeline Last Day ofCycle TimeExpectedIn-Charge Client Name Rec'd FieldworkBenchmarkCompletion 6/22 6/29 7/6 7/13 7/20 7/27 8/3 8/10 8/17 8/24 8/31 9/7 9/14 9/21 9/28 10/5 10/12 10/19 10/26 11/2
LederCommunity Blood Center of the CarolinasYes 10/22/10 14 11/5/10 KC/TS FC MC/IR IF MC FR/FS FFMorgan Cornelia Nixon Davis Yes 12/3/10 14 12/17/10 KC TS FC MC MC IFWoods Duplin General HospitalYes 11/22/10 14 12/6/10 TS KC IR FC IF MC FR FF/FS FS/FF
Linn Fairfield Memorial HospitalYes 12/10/10 14 12/24/10 KC IR TS FC MC IF MCClark FirstHealth of the CarolinasYes 11/24/10 14 12/8/10Szulak Johnston Health Yes 11/19/10 14 12/3/10 KC TS/FC IR IF MC MC MC MCMorganLaurens County Healthcare SystemYes 12/10/10 14 12/24/10 KC TS FC IR IF/MC MCMorgan Loris Healthcare SystemYes 11/24/10 14 12/8/10 TS IR/FC MC MC/IF MCHicks Lutheran Homes of SC Yes 11/5/10 14 11/19/10 KC IR TS/FC MC IF MC MC FR FF FFMageeMorehead Memorial HospitalYes 11/30/10 14 12/14/10 TS IR/FC MC MC IF MC MC
Linn Outer Banks Hospital Yes 11/19/10 14 12/3/10 FC MC IR/FC IF MC FR FF/FSWoods Pardee Memorial HospitalYes 12/3/10 14 12/17/10 KC TS IR/FC MC IF MCHicks Person Hospital Yes 10/29/10 14 11/12/10 KC TS FC IR MC/IF MC MC FR FFClark Rutherford Hospital Yes 12/10/10 14 12/24/10 KC TS FC/IR IF MC MC MC MCHicks Southminster, Inc. Yes 11/5/10 14 11/19/10 KC TS FC MC IR IF FS MC/FR FFClark Stanly Health Services Yes 11/5/10 14 11/19/10 KC TS FC MC MC FR FF FF FF/FSLinnUniversity Health Systems of Eastern CarolinaYes 11/19/10 14 12/3/10 FC IR IF MC FR FF/FSLinn Wake Ortho Yes 10/22/10 14 11/5/10 KC IR TS MC/IF FR FF/FS FF
Szulak WakeMed Yes 11/5/10 14 11/19/10 FF FF FFSzulak Wallace Thomson HospitalYes 12/10/10 14 12/24/10 KC/FC TS MC MC/IR IF MCMorgan Wayne Memorial HospitalYes 11/12/10 14 11/26/10 KC TS/FC IR MC MC/IF/FR FF FF

©20
10 L
arso
nA
llen
LLP
58
Principle 6
StandardizedTasks
©20
10 L
arso
nA
llen
LLP
59
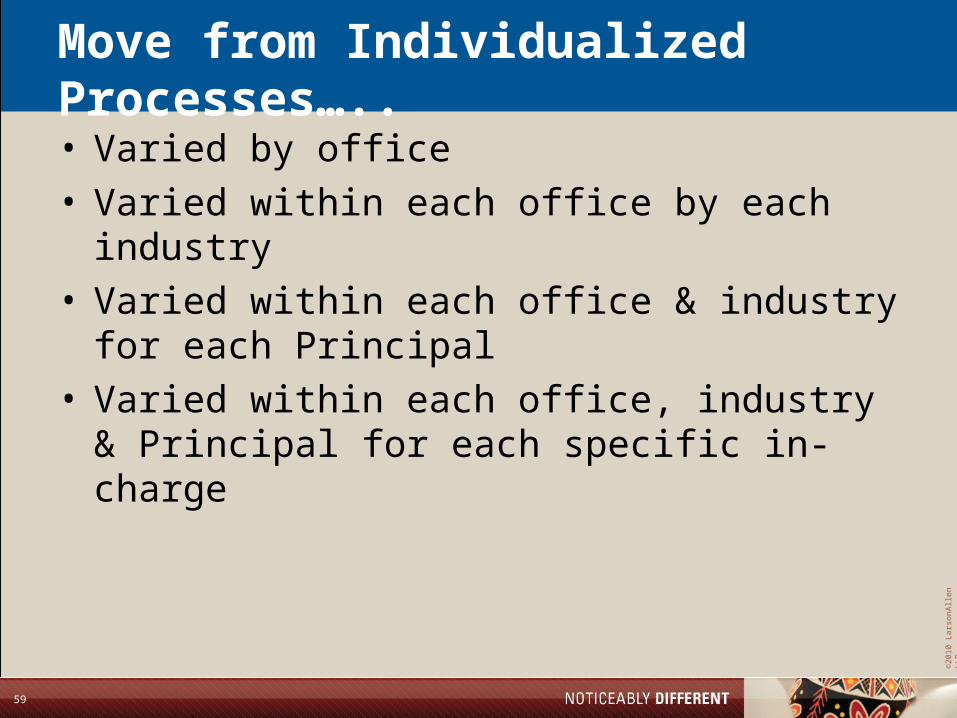
Move from Individualized Processes…..
• Varied by office• Varied within each office by each industry• Varied within each office & industry for each
Principal• Varied within each office, industry & Principal for
each specific in-charge

©20
10 L
arso
nA
llen
LLP
60
Current Process Maps

©20
10 L
arso
nA
llen
LLP
61
Current Process Maps
©20
10 L
arso
nA
llen
LLP
62
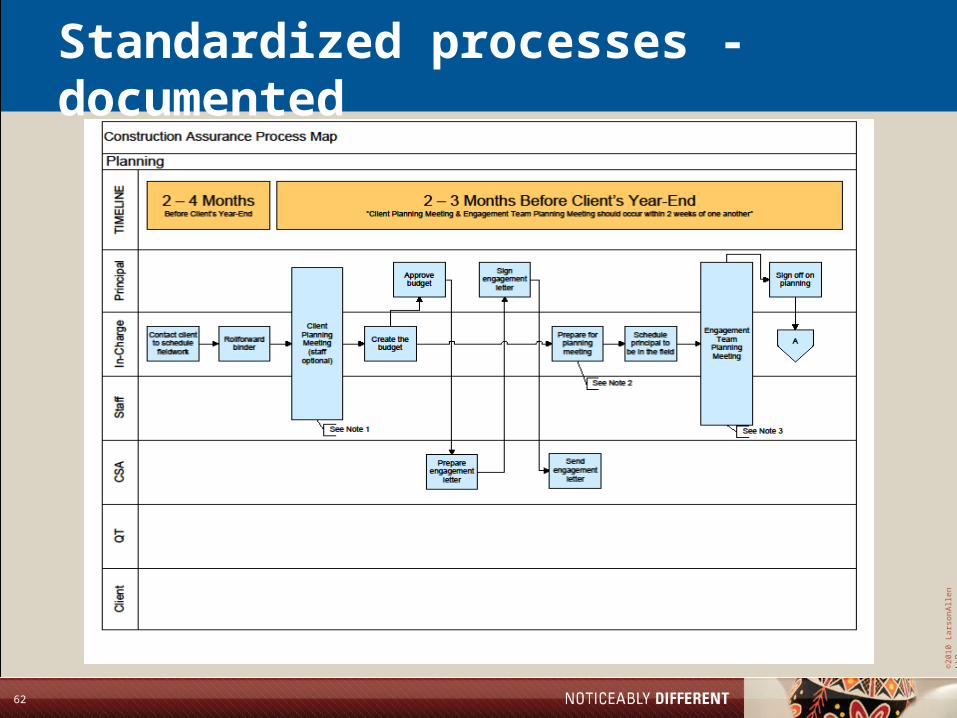
Standardized processes - documented
©20
10 L
arso
nA
llen
LLP
63
Principle 7
VisualControl
©20
10 L
arso
nA
llen
LLP
64
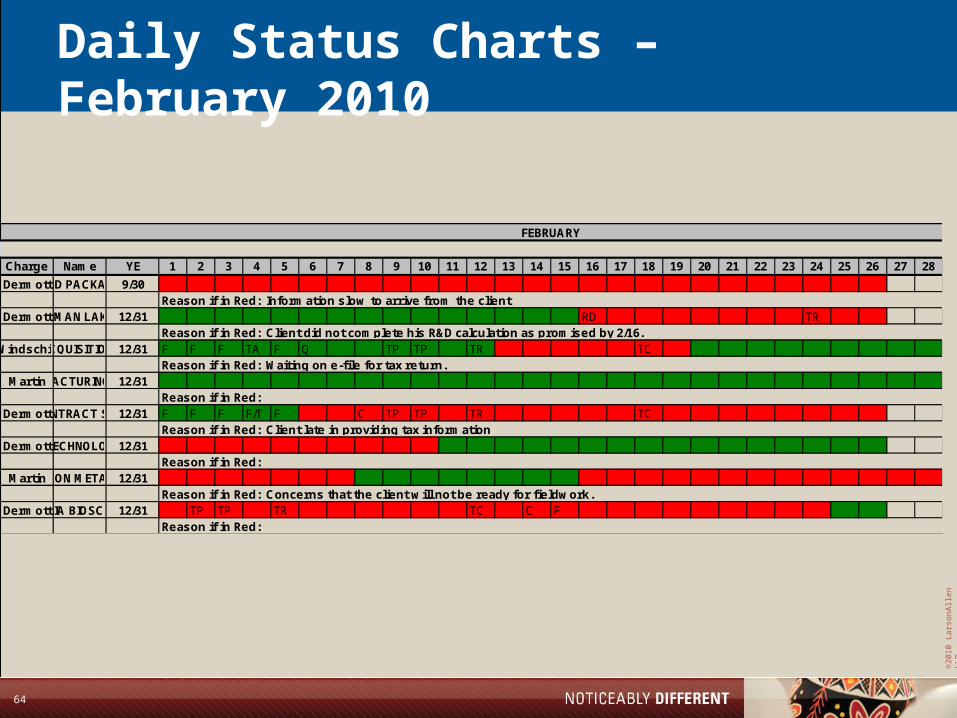
Daily Status Charts – February 2010
In-Charge
Client Name
Client YE 1 2 3 4 5 6 7 8 9 10 11 12 13 14 15 16 17 18 19 20 21 22 23 24 25 26 27 28
DermottCOLOR AD PACKAGING INC9/30
DermottBRADMAN LAKE INC12/31 RD TR
WindschitlEAM ACQUISITION CORP12/31 F F F TA F Q TP TP TR TC
MartinHUBNER MANUFACTURING CORPORATION12/31
DermottINSOURCE CONTRACT SERVICES, LLC12/31 F F F F/T F C TP TP TR TC
DermottLEHIGH TECHNOLOGIES, INC12/31
MartinPARAGON METALS INC12/31
DermottPASTEURIA BIOSCIENCE INC12/31 TP TP TR TC C F
Reason if in Red: Client late in providing tax information
Reason if in Red:
Reason if in Red: Concerns that the client w ill not be ready for fieldwork.
Reason if in Red:
FEBRUARY
Reason if in Red: Information slow to arrive from the client
Reason if in Red: Client did not complete his R&D calculation as promised by 2/16.
Reason if in Red: Waiting on e-file for tax return.
Reason if in Red:
©20
10 L
arso
nA
llen
LLP
65
Principles 9 and 10
Leader &
Team Development

©20
10 L
arso
nA
llen
LLP
66
Language, Culture & Communication
• Focused, disciplined approach to improvement efforts
• Approach applied consistently• Defined support & cost required for each
improvement effort• Defined, targeted outcomes• Prescreening/approval• Oversight by Operational Excellence Advisory
Board

©20
10 L
arso
nA
llen
LLP
67

©20
10 L
arso
nA
llen
LLP
68
Detailed Implementation Plans

©20
10 L
arso
nA
llen
LLP
69
Examples of Our Results to Date

©20
10 L
arso
nA
llen
LLP
70
Kaizen Results – by Implementation Plan/AreaOE BOWLING CHART
Team Name: OEAB
No. Measure JOP Dec-09 Jan-10 Feb-10 M ar-10 Apr-10 M ay-10 Jun-10 Aug-10 Sep-10 Oct-10 Nov-10 Dec-10 Jan-11 Target
0.0% 20.0% 20.0% 20.0% 20.0% 20.0% 20.0% 20.0% 20.0% 20.0% 5.0% 5.0% 5.0%
0.0% 3.0% 7.3% 7.4% 4.9% ?? 7.9% 7.9%
N/A N/A 10% 15% 20% 20% 20% 20% 20% 20% 20% 20% 20%
N/A N/A -50% 14% 20%
N/A 5% 7% 10% 10% 12% 12% 15% 18% 18% 18% 18% 20%
N/a N/A 36% 25% 20%
N/A N/A 5% 10% 10% 10% 10% 10% 10% 10% 10% 10% 10%
N/A N/A 20% 12% 2%
N/A -15% -10% -5% 0% 0% 0% 0% 0% 0% 0% 0% 0%
-7.2% 9.5% ~10%
96 24 24 24 24 24 24 24 24 24 24 24 24
8.00 ??
20%
20%
20%
10%
0% 0.0
24 hours
Individual YTD realization up 4% (82.8% to 86.8%) 13%
Business YTD realization up 3.7% (90.6% to 94.3%), 25%
1
2
3
4
0%
0%
0%
M&D EngagementReduce same-job hours by 20% (YTD completed
eng.)(Erik)
M&D Tax - IndividualReduce same job hours for individual tax preparation/
review by 20%(Ben)
M&D Tax - BusinessReduce same-job hours
spent on business returns by 20%
(Ben)
6
MarketingProduce eFlash from
start to finish in a maximum of 24 hours.
(John R.)
120 hours
5
Dallas0% reduction in same-job hours (we don't go
backwards due to paperless conversion)
(Ben)
Business YTD realization up .5% (91.5/92.0). Individual YTD down .2% (93.6/93.4). Combined up .2%
(92.2/92.4).
Business YTD realization down 2.6% (83/80.4). Individual YTD up .4% (72.4/72.8).
Combined down 1.6% (78.7/77.1)
Phoenix TaxReduce same-job hours
by 10%(Terry)
0%

©20
10 L
arso
nA
llen
LLP
71
MWI results – CLT Manufacturing Year 1• Goal – issue audit reports within 14 days of
fieldwork• Results - recurring audit engagements, those
engagements in year 3 or more:– Decrease in hours from previous year: -16%
– Decrease in WIP dollars from previous year: -8%
– Days from end of fieldwork to report issuance: 19.X
• Lessons learned:– Involving clients in plan & timeline critical
– Managing clients and timeline poor
– Interim work poorly executed; incomplete
– Must resolve problems more often than weekly
©20
10 L
arso
nA
llen
LLP
72
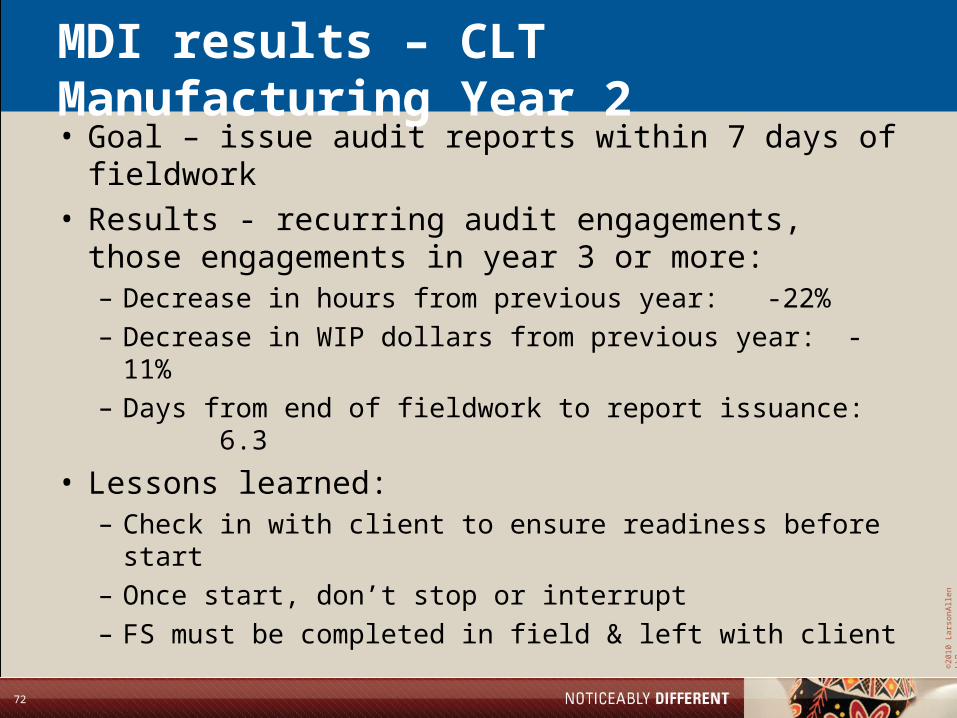
MDI results – CLT Manufacturing Year 2• Goal – issue audit reports within 7 days of
fieldwork• Results - recurring audit engagements, those
engagements in year 3 or more:– Decrease in hours from previous year: -22%– Decrease in WIP dollars from previous year: -11%– Days from end of fieldwork to report issuance: 6.3
• Lessons learned:– Check in with client to ensure readiness before start– Once start, don’t stop or interrupt– FS must be completed in field & left with client

©20
10 L
arso
nA
llen
LLP
73
MWI results – CLT Dealerships Year 1• Goal – issue audit reports within 14 days of
fieldwork• Results - recurring audit engagements, those
engagements in year 3 or more:– Decrease in hours from previous year: -49%– Decrease in WIP dollars from previous year: ??– Days from end of fieldwork to report issuance: 13.8
©20
10 L
arso
nA
llen
LLP
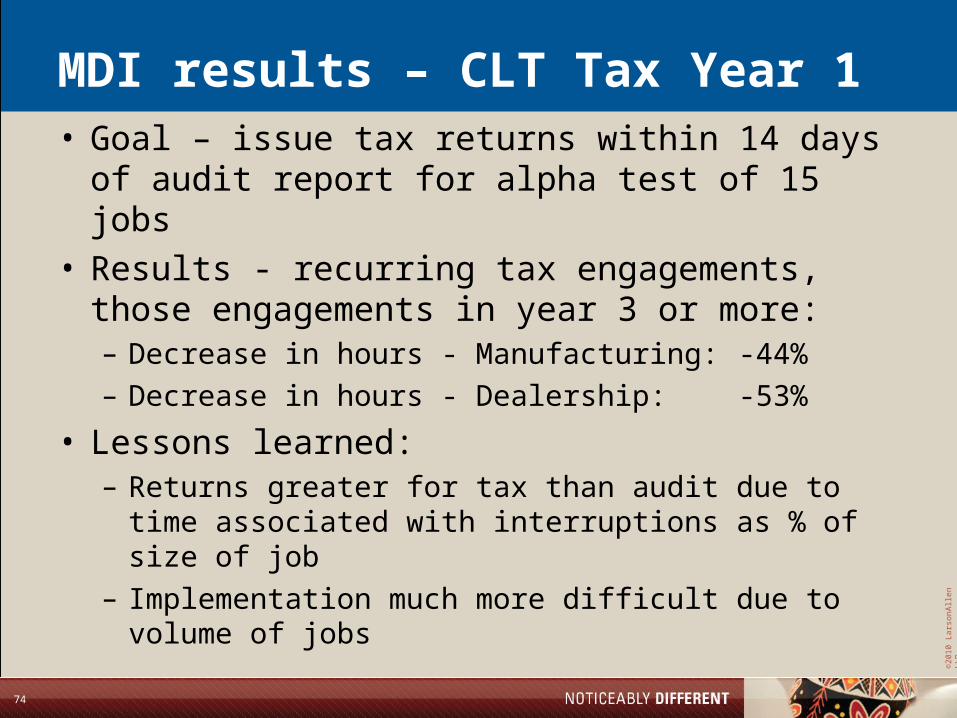
74
MDI results – CLT Tax Year 1• Goal – issue tax returns within 14 days of audit
report for alpha test of 15 jobs• Results - recurring tax engagements, those
engagements in year 3 or more:– Decrease in hours - Manufacturing: -44%– Decrease in hours - Dealership: -53%
• Lessons learned:– Returns greater for tax than audit due to time
associated with interruptions as % of size of job– Implementation much more difficult due to volume of
jobs
©20
10 L
arso
nA
llen
LLP
75
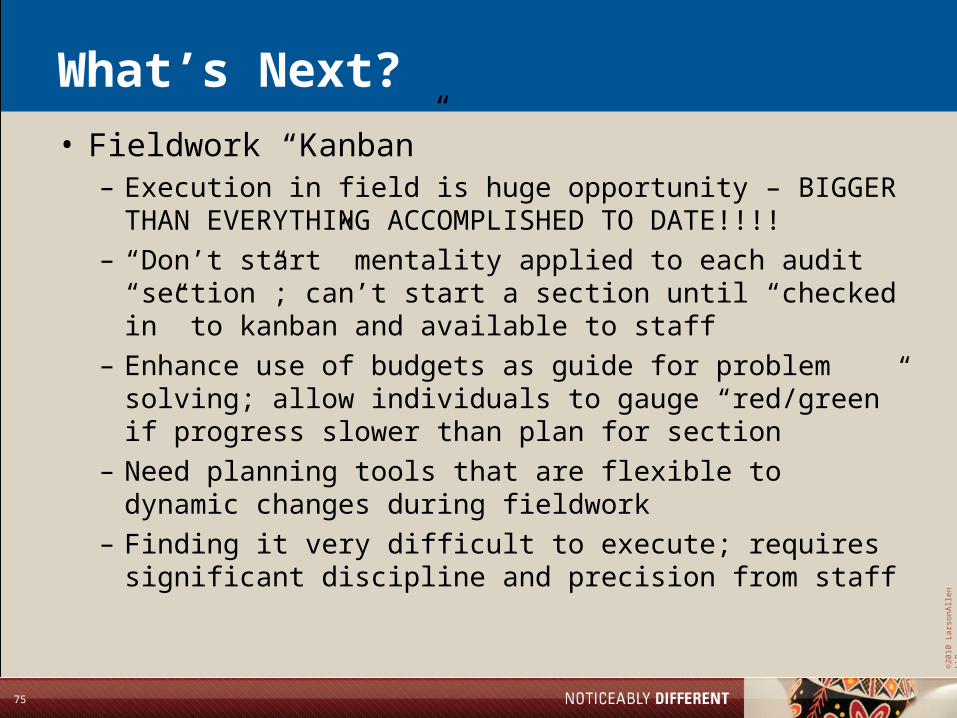
What’s Next?
• Fieldwork “Kanban”– Execution in field is huge opportunity – BIGGER THAN
EVERYTHING ACCOMPLISHED TO DATE!!!!– “Don’t start” mentality applied to each audit “section”;
can’t start a section until “checked in” to kanban and available to staff
– Enhance use of budgets as guide for problem solving; allow individuals to gauge “red/green” if progress slower than plan for section
– Need planning tools that are flexible to dynamic changes during fieldwork
– Finding it very difficult to execute; requires significant discipline and precision from staff
©20
10 L
arso
nA
llen
LLP
76
Closing Questions and Discussion
• Not necessarily “the best” or “the only” way, just our way
• Observations? How do you think we can do this better?
• Questions?• Discuss at your tables:
– What are your takeaways?– Is this a real opportunity for your firm?– If so, how would you do it? What fits your firm?– What do you think your payback would be?