2010 Investor Day - s1.q4cdn.com · 2010 Investor Day March 11, 2010. Global Prepaid Solutions...
54
2010 Investor Day March 11, 2010
Transcript of 2010 Investor Day - s1.q4cdn.com · 2010 Investor Day March 11, 2010. Global Prepaid Solutions...
2010 Investor DayMarch 11, 2010

Global Prepaid SolutionsBrian Triplett Head of Global Prepaid Products

Product and Services Strategy
3
Drive growth of Prepaid products across all core segments with an emphasis on the underbanked• Expand core business in the U.S.
• Extend to key countries internationally
• Integrate and innovate with other products and services to drive new revenue streams
Processing Products & Services
Brand
Acceptance
Clients
Local Market Focus
Goal:

Prepaid Value Chain
Manage funds, provide BINs,compliance and risk services
Account mgt, network access, and customer care
Runs programs, product mgt, marketing, wholesale dist.
Network switching services, reloads, acceptance services, category development
Retail sales and merchandising support, acceptance and reload locations
DistributionProgram ManagerIssuerIssuer
ProcessorNetwork
Revenue Drivers
• % of Interchange• Account, Access• Float
• Activation• Implementation
• Accounts and Transactions
• % of Interchange
• Account, Load, Transactions and Customer Service
• Retail Sale
• Revenue Share
• Card Service
• Processing
Visa participates Visa does not currently participate
Sources: Aite Group, “Prepaid Cards: The State of the Industry,” 7/2007, Visa Inc. Analysis
• Visa• MasterCard
• American Express
• Green Dot (Reload network)
• Visa• TSYS
• FIS
• Galileo
• Chase
• US Bank
• MetaBank
• Bancorp Bank
• Green Dot
• Blackhawk Network
• Rush Card
• Chase
• Wal-Mart• Money Gram• ACE• ADP• AT&T• Evolution Benefits• States/Local Gov’t
Sample of Major Players
Consum
ers – Corporations – G
overnments
Role
4

Prepaid Global Expansion
5
More than 10,000 programs totaling over 135 million active Visa cards across 110 countries…
Note: As of October 2009 Visa Inc., and Visa Europe
…Prepaid continues to be the fastest growing form of payment for Visa for the sixth consecutive year

Source: VisaNetNote: Total Volume (CSV) = Payments Volume + Cash
Visa U.S. Prepaid Volume Trends
6
2006
2007
2008
2009
2005
Period TotalCY05 84%CY06 75%CY07 69%CY08 74%CY09 84%
CSV

U.S. Estimated Industry Opportunity
7
Figures represent estimated prepaid industry opportunity and do not reflect anticipated Visa volumes, transactions or prepaid segment share. The estimated opportunity sizing in this presentation is directional only and Visa is not responsible for any business decisions made using the enclosed data.
Visa Inc. U.S. Prepaid Industry Segment Study, 2009
Prepaid Opportunity ($ Trillions)2009 U.S. prepaid segment
estimated at $2.0 trillion 56% or $1.1 trillion is the projected cardable opportunity
Category growth projected at 4.7% compounded annual growth
Leading segments as percent of cardable opportunity:– General Purpose: 33%– Payroll: 15% – Government: 10%– Gift: 10%
$2.0
$1.1
2009
$2.3
$1.3
2012
4.7% CAGR
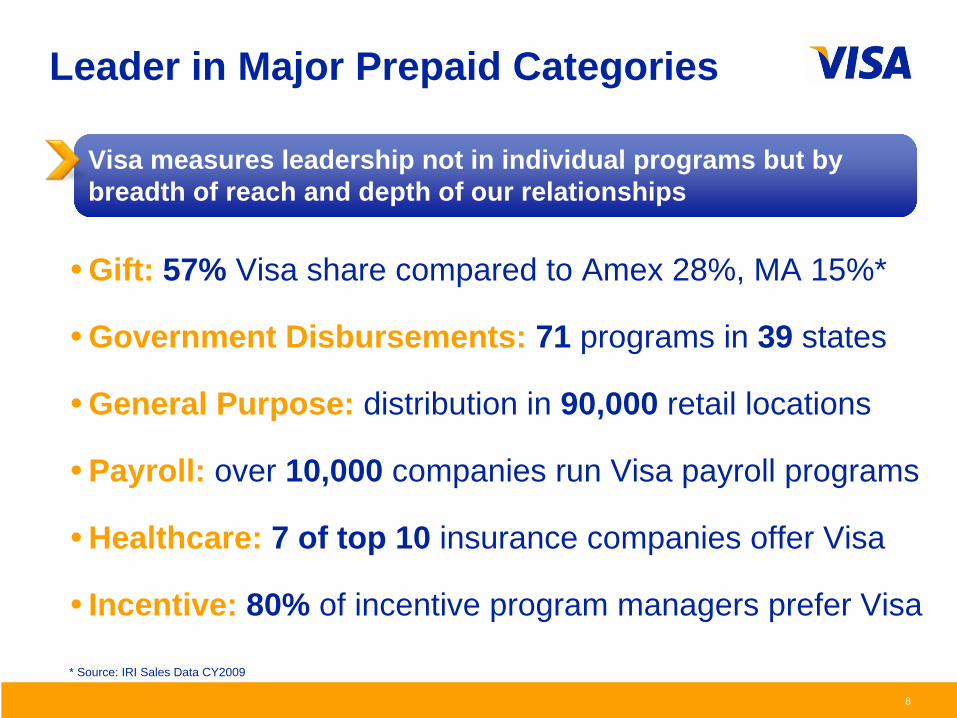
Leader in Major Prepaid Categories
8
• Gift: 57% Visa share compared to Amex 28%, MA 15%*
• Government Disbursements: 71 programs in 39 states
• General Purpose: distribution in 90,000 retail locations
• Payroll: over 10,000 companies run Visa payroll programs
• Healthcare: 7 of top 10 insurance companies offer Visa
• Incentive: 80% of incentive program managers prefer Visa
Visa measures leadership not in individual programs but by breadth of reach and depth of our relationships
* Source: IRI Sales Data CY2009

Industry Awards and Recognition
9
• Best Government Program: US Bank Visa Reliacard
• Most Innovative Program: US Bank PayID card
• Best General Purpose: Walmart Visa MoneyCard
• Best New General Purpose: Western Union Visa MoneyWise Card
• Best Non-US Program: Vancouver 2010 Olympic Games, Citizens Bank of Canada and Vancity Credit Union
• Best B2B Corporate Funded Card: Bancorp Visa InsurCard
• Best B2C Corporate Funded Card: Sprint Referral Rewards Visa Card
Annual PayBefore Awards recognize Visa and our Partners’ contribution to prepaid across all major categories
* Source: PayBefore Industry Awards; PayBefore.com
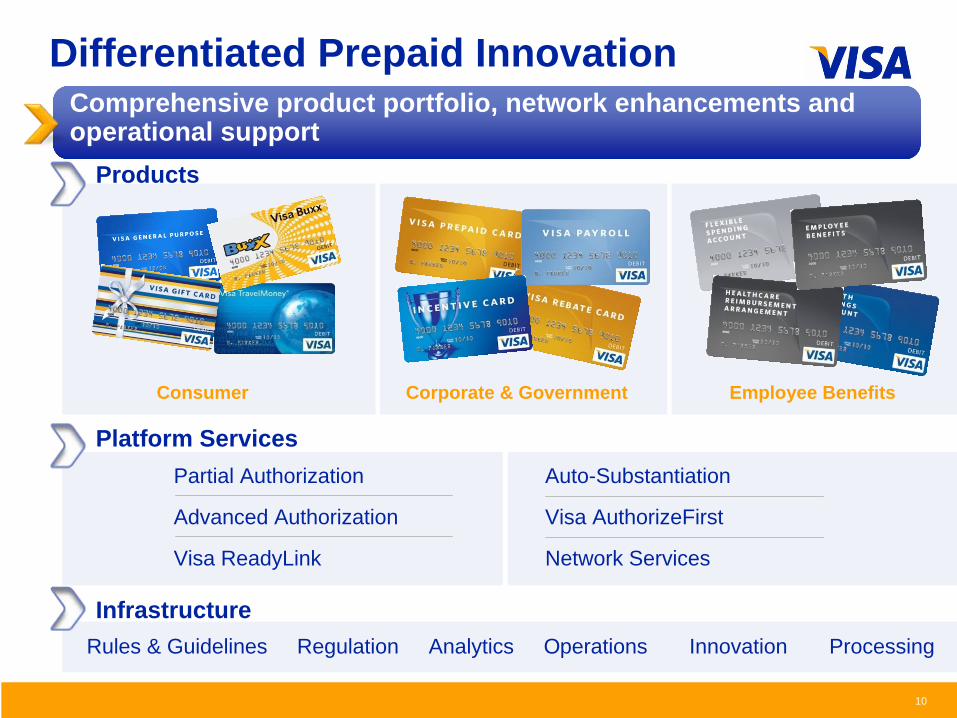
Employee BenefitsConsumer Corporate & Government
Products
Rules & Guidelines Regulation Analytics Operations Innovation Processing
Differentiated Prepaid Innovation
Platform ServicesPartial Authorization Auto-Substantiation
Advanced Authorization Visa AuthorizeFirst
Visa ReadyLink Network Services
Infrastructure
10
Comprehensive product portfolio, network enhancements and operational support

Visa ReadyLink Load Innovation
National retail reload network with over 50,000 participating locations
Immediate availability of funds
Introduced ability to reload through ATM’s
11
Q3
2007
Q4
2007
Q1
2008
Q2
2008
Q3
2008
Q4
2008
Q1
2009
Q2
2009
Q3
2009
Q4
2009
Active Merchant Locations Quarterly Load Activity

Partial Authorization Success
Improves customer and merchant experience by easily enabling split tender at the point-of-sale
Developed and introduced first by Visa (April 2005)
In major merchant categories, increased approvals by up to 44%, decreased NSF declines up to 82%
Note: Transactions include offline and Interlink; Partial Authorizations in MM for CY2009. Source: VisaNet
Over 45,000 locations with a growth rate of 41%, anticipate accelerated adoption as Debit issuers utilize PA to satisfy new overdraft requirements
12

Prepaid Innovation and Integration
13

Focus for 2010 and Beyond
14
Growth: With a focus on the underbanked, accelerate expansion in the U.S. and lay the infrastructure for expansion in key geographies around the world
Innovation: Open new channels of distribution with an emphasis on commercial and government segments
Partnership: Differentiate value-add through increased marketing programs, client portfolio analytics, comprehensive research and creation of new product categories

Global Commercial SolutionsDarren ParslowHead of Global Commercial Product Strategy
15

Product and Services Strategy
16
Provide differentiated, innovative payment solutions to enable commercial spend capture
• Grow the core to drive revenue growth
• Expand platform to new geographies• Penetrate commercial opportunity via products that
accelerate shift to electronic payments
• Utilize technology and information platform innovations to capture new spend categories
Goal:
Processing Products & Services
Brand
Acceptance
Clients
Local Market Focus

Global Commercial Opportunity
17
Source: Visa Commercial Consumption Expenditure Index; Economist Intelligence Unit (EIU) modeling and analysis, June 2009. Global CCE index data sources include Bureau of Economic Analysis (BEA), U.S. Census Bureau, Organization for Economic Cooperation and Development (OECD), STructural ANalysis (STAN) Database, EuroStat Database, General Government Accounts from the National Accounts of OECD Countries, United Nations Statistics Division National Accounts Main Aggregates Database, EIU proprietary databases, government data and EIU model estimates where government data was unavailable. Large contracted defense spending not included in CCE index.
2008 Global CCE$90.2T USD
Small Business
19%US
23%
Canada 3%
Asia Pacific26%
CEMEA8%
LAC6% Europe
35%
18%
32%
45%
5%
Small Business
Medium Business
Large Business
Government
Commercial Consumption Expenditure (CCE) Index Measures Business-to-Business and Government Spending

Global Commercial Opportunity
18
Small Business
19%US
23%
Canada 3%
Asia Pacific26%
CEMEA8%
LAC6% Europe
35%
18%
32%
45%
5%
Small Business
Medium Business
Large Business
Government
Commercial Consumption Expenditure (CCE) Index Measures Business-to-Business and Government Spending
• Addressable by cards: ~10%
• Addressable by new platforms: TBD
• Current card industry CCE penetration: ~2%
2008 Global CCE$90.2T USD
Source: Visa Commercial Consumption Expenditure Index; Economist Intelligence Unit (EIU) modeling and analysis, June 2009. Global CCE index data sources include Bureau of Economic Analysis (BEA), U.S. Census Bureau, Organization for Economic Cooperation and Development (OECD), STructural ANalysis (STAN) Database, EuroStat Database, General Government Accounts from the National Accounts of OECD Countries, United Nations Statistics Division National Accounts Main Aggregates Database, EIU proprietary databases, government data and EIU model estimates where government data was unavailable. Large contracted defense spending not included in CCE index.

Global Commercial Leadership
19
2009 Global Commercial Card Volume by Brand
Source: Packaged Facts, December 2009 – Commercial Payment Cards: The U.S. and Global Markets and Trends, 6th Edition
43%
MasterCard22%
Amex26%
Visa Inc. 33%
Visa Europe
10%
China UnionPay
1%
JCB 1%
Closed-loop Fleet 5%Diner’s Club
1%
Discover <1%
Visa is the commercial segment leader with 43% volume share

Global Commercial Performance
20
1999 2000 2001 2002 2003 2004 2005 2006 2007 2008 2009
Source: Visa Inc. Operating Certificates for 4 quarters ending September each year in constant dollars. Purchase volumes shown for Business Credit, Business Debit, Corporate, Purchasing. CAGR = Compound Annual Growth Rate. $318 billion for 4 quarters ending September 2009.
$318B
Visa Commercial product volume has delivered over 20%growth over the last 10 years
Small Business 10-year CAGR = 27%
Large/Middle Market10-year CAGR = 17%
Visa Inc. Commercial Volume1999 – 2009 CAGR = 22%

Commercial Innovation Milestones
21
1993First to offer suite of Business, Corporate and Purchasing payment cards
2001Launched Visa Information Source web-based reporting
2004Created Commercial Consumption Expenditure (CCE) index
2006Launched Signature Business premium card
2003Launched Visa Information Management
2008Launched Visa Payables Automation
2009Introduced Syncada
2009Launched IntelliLink Spend Management
1998Launched Business Check Card
2001Launched first hotel (folio) data offering
1989Launched industry’s first Purchasing Card for the U.S. Government
1999Launched Commercial Card for Middle Market
2005Introduced Program Optimization
2008 Launched Meetings Card
1997Launched Fleet Card
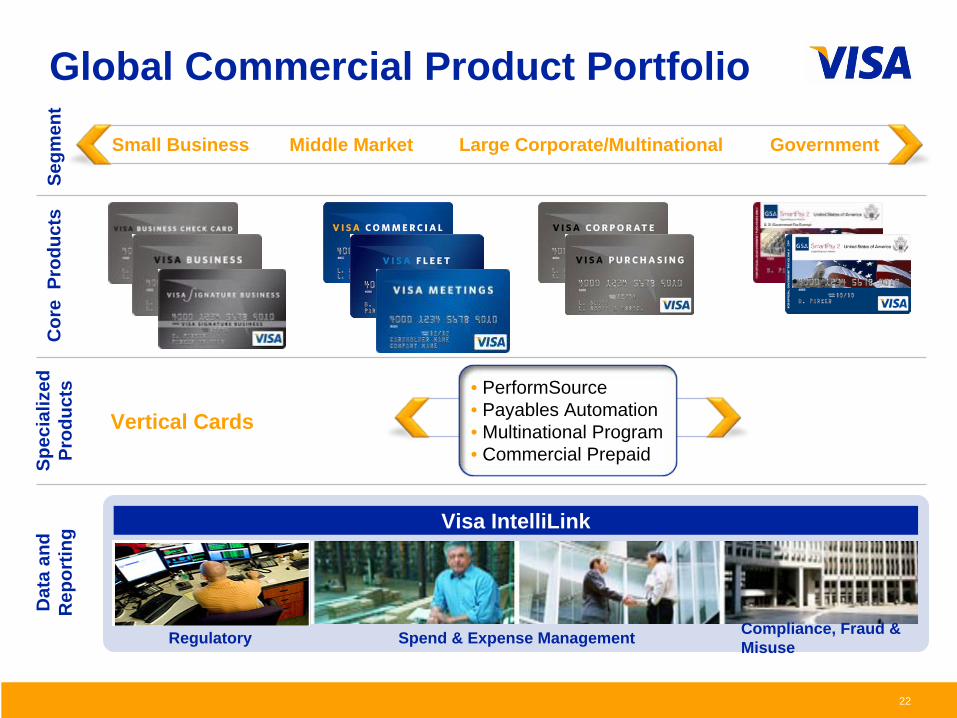
Global Commercial Product Portfolio
22
Cor
e P
rodu
cts
Segm
ent
Spec
ializ
ed
Prod
ucts
Dat
a an
d R
epor
ting
Middle MarketSmall Business Large Corporate/Multinational Government
Vertical Cards• PerformSource• Payables Automation• Multinational Program• Commercial Prepaid
Visa IntelliLink
Regulatory Spend & Expense Management Compliance, Fraud & Misuse
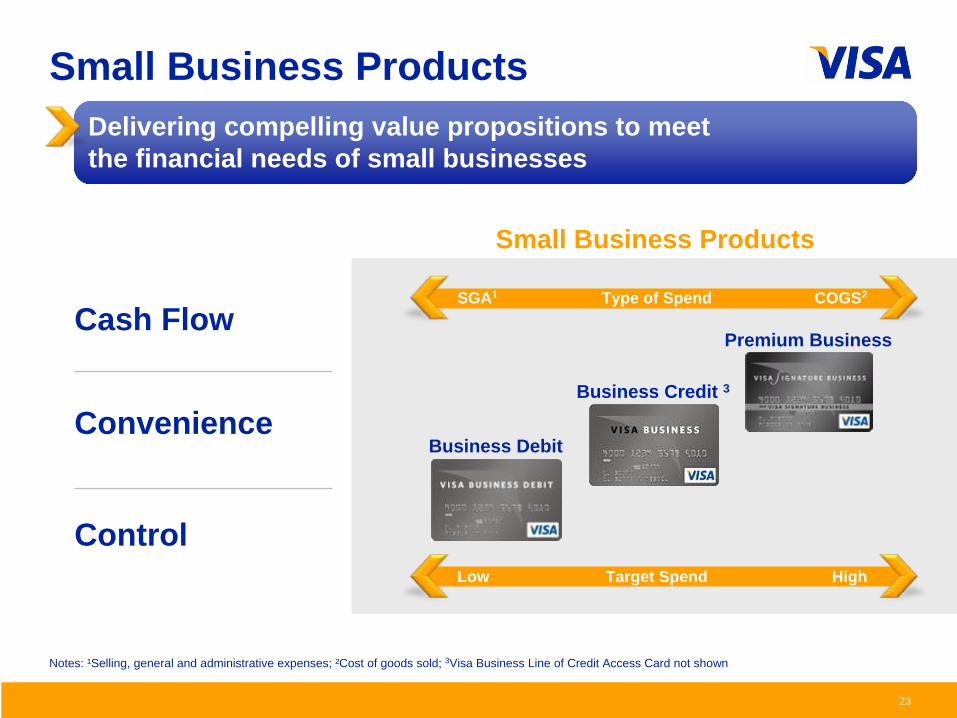
Small Business Products
23
Small Business Products
Target Spend HighLow
Type of Spend COGS2SGA1
Business Credit 3
Premium Business
Business Debit
Notes: ¹Selling, general and administrative expenses; ²Cost of goods sold; 3Visa Business Line of Credit Access Card not shown
Convenience
Cash Flow
Control
Delivering compelling value propositions to meetthe financial needs of small businesses
24
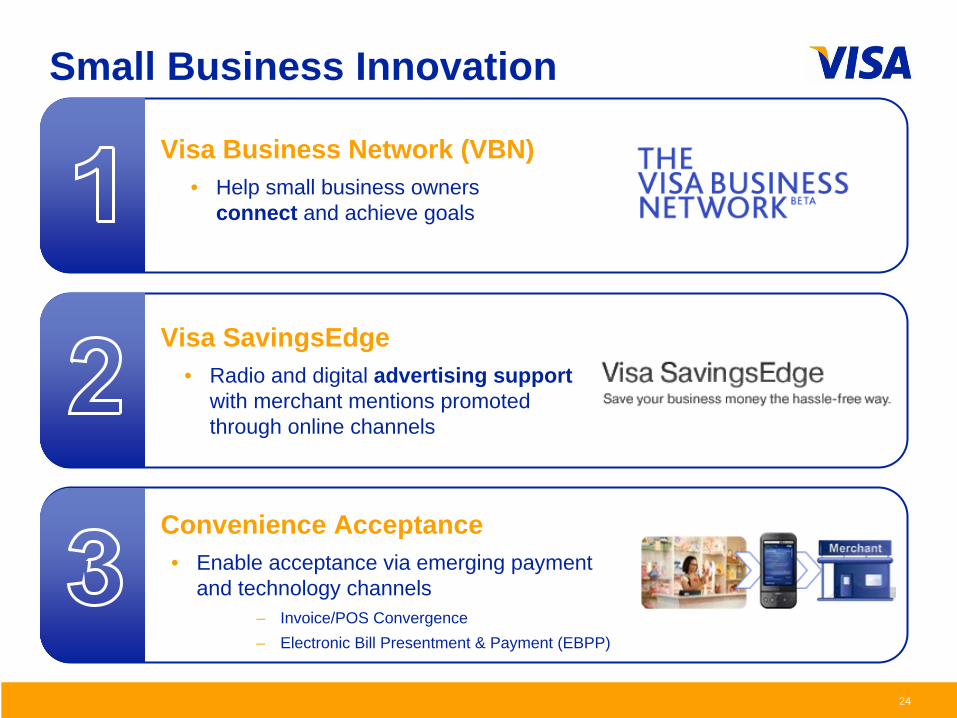
Small Business Innovation
Visa SavingsEdge• Radio and digital advertising support
with merchant mentions promoted through online channels
Convenience Acceptance• Enable acceptance via emerging payment
and technology channels– Invoice/POS Convergence– Electronic Bill Presentment & Payment (EBPP)
Visa Business Network (VBN)• Help small business owners
connect and achieve goals

Large/Middle Market/Government Products
25
Large/Middle Market/Government Sector Products
Cash Flow Management
Spend Visibility and Control
Integration with Financial Reporting Systems
Cost Savings from Process Efficiencies
• Middle Market One Card
• Procurement & Payables
• T&E– Multinational Program– Central Travel Accounts
• Public Sector
Meeting sophisticated requirements of large companies through core T&E and purchasing platforms
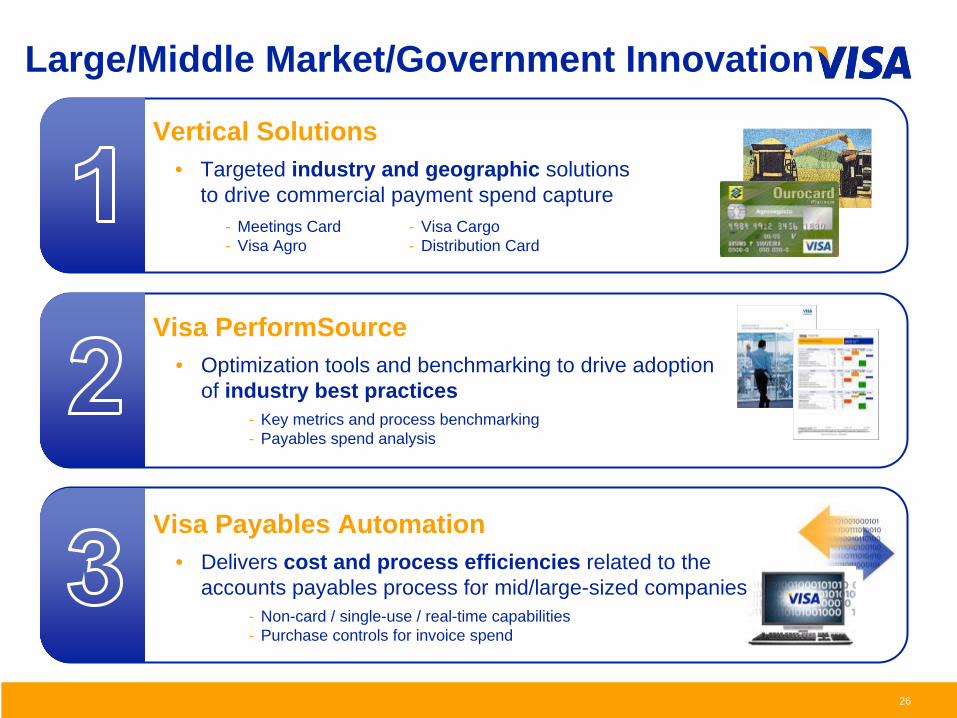
Large/Middle Market/Government Innovation
26
Visa PerformSource• Optimization tools and benchmarking to drive adoption
of industry best practices- Key metrics and process benchmarking- Payables spend analysis
Vertical Solutions • Targeted industry and geographic solutions
to drive commercial payment spend capture- Meetings Card- Visa Agro
- Visa Cargo- Distribution Card
Visa Payables Automation• Delivers cost and process efficiencies related to the
accounts payables process for mid/large-sized companies- Non-card / single-use / real-time capabilities- Purchase controls for invoice spend
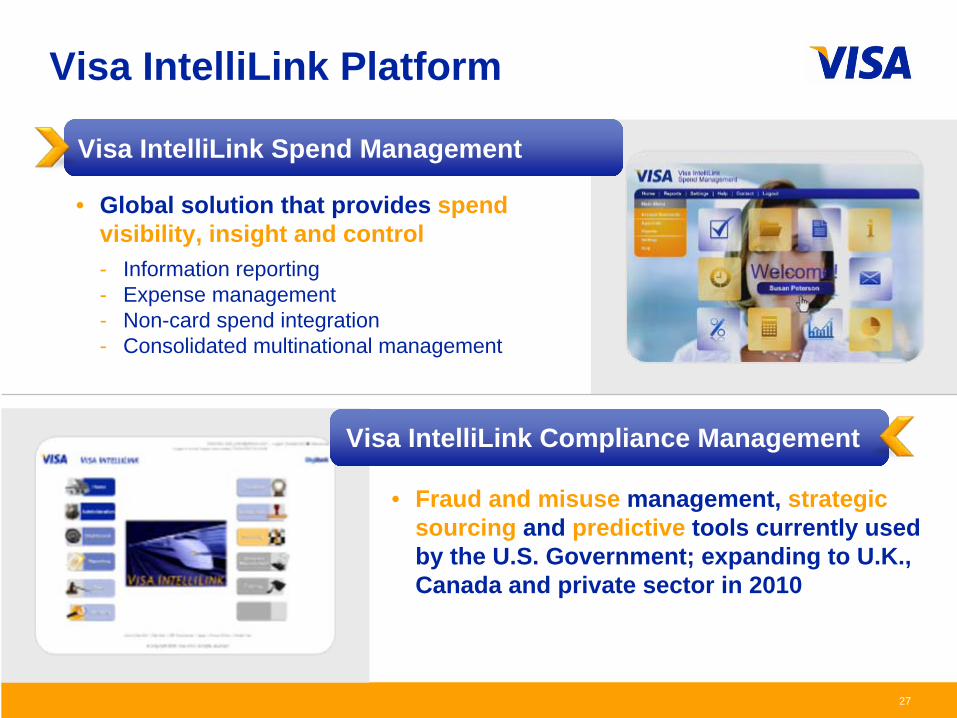
Visa IntelliLink Platform
27
• Fraud and misuse management, strategic sourcing and predictive tools currently used by the U.S. Government; expanding to U.K., Canada and private sector in 2010
Visa IntelliLink Spend Management
• Global solution that provides spend visibility, insight and control- Information reporting- Expense management- Non-card spend integration- Consolidated multinational management
Visa IntelliLink Compliance Management

28
Invoice Processing Invoice Payment Trade Finance
Enabling increased control and efficiency over financial supply chains through global business-to-business network
* Syncada is a joint venture between Visa and US Bank

Global Processing and Acceptance Marc LuetHead of Global Processing, Acceptance and Advisory Services
30
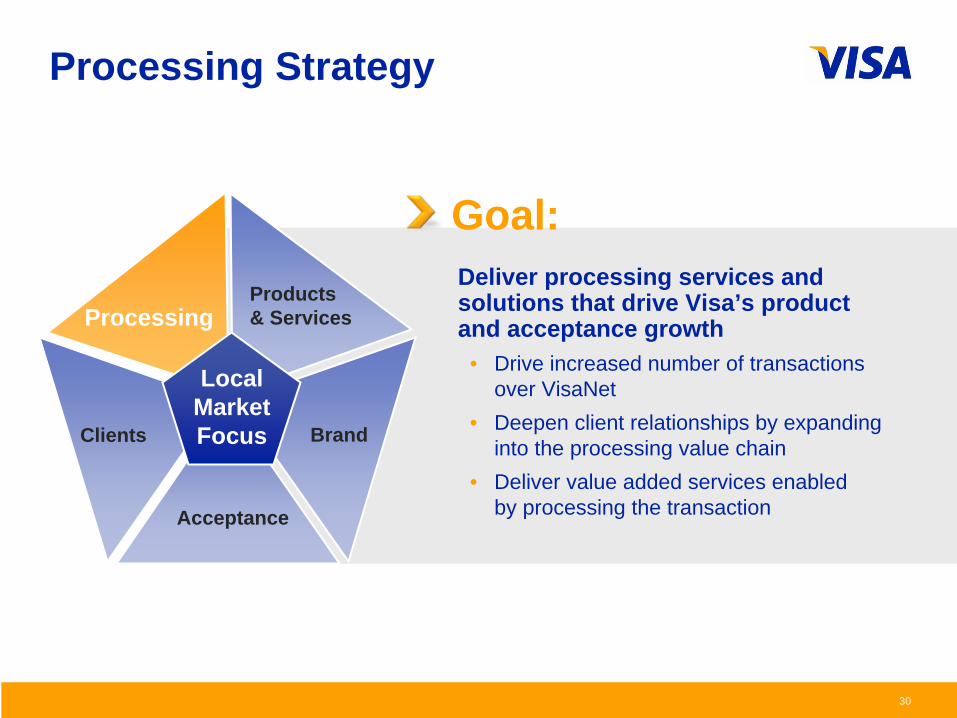
Goal:
Processing Strategy
BrandClients
Acceptance
Products & ServicesProcessing
Local Market Focus
Deliver processing services and solutions that drive Visa’s product and acceptance growth
• Drive increased number of transactions over VisaNet
• Deepen client relationships by expanding into the processing value chain
• Deliver value added services enabled by processing the transaction

What is Processing?
Network / Switch
Acquirer Processor
Issuer Processor
Processing is comprised of three components: network, issuer and acquirer processing
Payments Value Chain
Network Processing: • Transaction authorization,
clearing, and settlement processing
• In-flight transaction risk services
• Exception item processing
• Establishment of business practices and standards
Issuer Processing: • Transaction processing –
authorization, settlement, ATM Driving
• Fraud/Risk services
• Back office tools/operations
• Card management
• Network Connectivity / Gateway Services
• Call Center services
• Merchant set-up and ongoing maintenance
• POS terminal setup and servicing
• Billing statement management
• Help desk and technical support
• Connectivity to Network
• Risk Fraud management
Acquirer Processing:
Merchant Acquirer Issuer Consumer
31

What is Processing?
Network / Switch
Acquirer Processor
Issuer Processor
Processing is comprised of three components: network, issuer and acquirer processing
Payments Value Chain
Network Processing: • Transaction authorization,
clearing, and settlement processing
• In-flight transaction risk services
• Exception item processing
• Establishment of business practices and standards
Issuer Processing: • Transaction processing –
authorization, settlement, ATM Driving
• Fraud/Risk services
• Back office tools/operations
• Card management
• Network Connectivity / Gateway Services
• Call Center services
• Merchant set-up and ongoing maintenance
• POS terminal setup and servicing
• Billing statement management
• Help desk and technical support
• Connectivity to Network
• Risk Fraud management
Acquirer Processing:
Merchant Acquirer Issuer Consumer
32
VisaNet DPS & VPSCurrently Evaluating

33
VisaNet OverviewVisaNet is a centralized and modular payments network, providing three essential functions in one complete, flexible package
Risk Management• Protect against:
– Fraud
– Theft
– Unauthorized use
• Deliver real-time fraud scoring and multiple layers of security
Information & Analytics• Transformation of data to
business intelligence
• Optimization of revenue
• Enrichment of the cardholder experience
• Empowerment of governments and businesses to better manage expenditures
• 130 million transactions every day
• 165 currencies
• Over 195 countries
• Over 16,000 financial institutions
• Capable of handling over 20,000 transaction messages per second
Transaction Processing
34
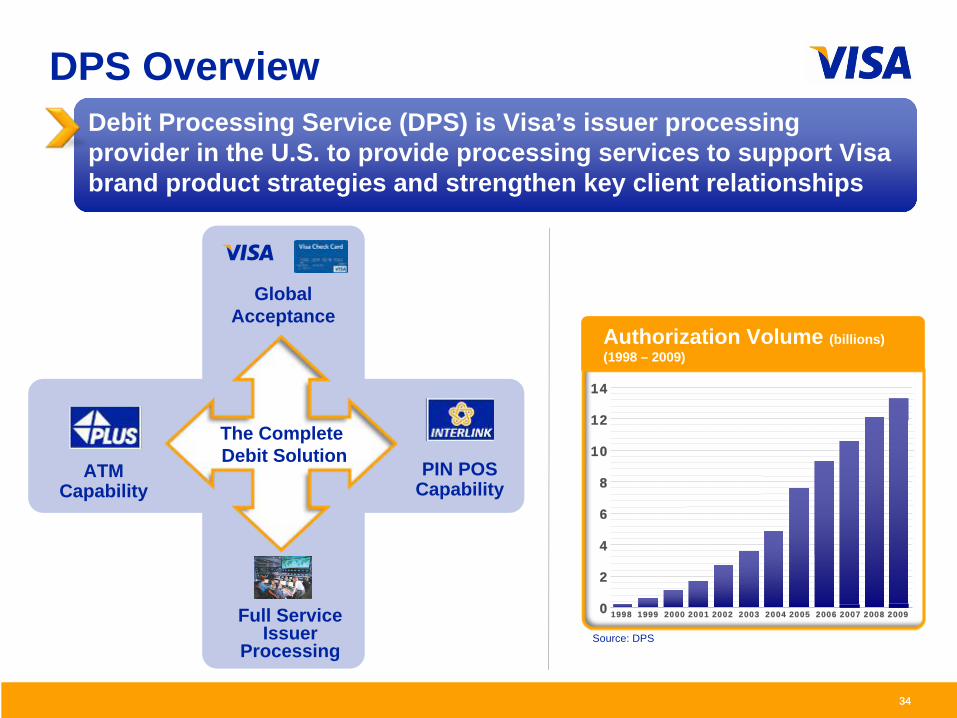
DPS Overview
34
Global Acceptance
Full Service Issuer
Processing
ATM Capability
The Complete Debit Solution
PIN POS Capability
Debit Processing Service (DPS) is Visa’s issuer processing provider in the U.S. to provide processing services to support Visa brand product strategies and strengthen key client relationships
Authorization Volume (billions) (1998 – 2009)
14
12
10
8
6
4
2
0 1998 1999 2000 2001 2002 2003 2004 2005 2006 2007 2008 2009
Source: DPS

35
VPS Service Offering
VPS Overview
35
Strategic Rationale for Creation of VPS • Expansion into value chain outside U.S.• Support product development and brand • Drive incremental revenue
Recognizing the strategic and financial importance that DPS proved to be in the U.S., VPS was formed in 2008 to serve as the issuer processing provider for international clients
Tailored Programs
Multiple:
• Products
• Currencies
• Card types
• Languages
Multi-Channel Enablement
• Retail POS
• Mobile
• Online
• ATM
• Branch
Program Management
• Credit and fraud risk management
• Exception processing
• Card and account management
• Reporting
Dedicated Client/ Cardholder Support• Account
maintenance
• Alerts and notification
• 24/7 call center support
Network Transaction Processing
• Authorization routing
• Settlement reconciliation

36
Global VisaNet Penetration
~100%: U.S. >50%: Canada, Australia, India, Brazil
<50%: Russia, Japan, GCC
0%: China, Mexico, South Korea
36
Outside the U.S., Visa faces network processing challenges
Processed Transactions (Billions)
FY08 FY09
37.039.9

37
Global VisaNet Penetration
~100%: U.S. >50%: Canada, Australia, India, Brazil
<50%: Russia, Japan, GCC
0%: China, Mexico, South Korea
37
Outside the U.S., Visa faces network processing challenges
Processed Transactions (Billions)
FY08 FY09
37.039.9
Alternatives to VisaNet
1. On-us transactions
2. Bi-lateral arrangements
3. Domestic / 3rd party networks

38
Acceptance Strategy
38
Accelerate the electronification of commerce• Increase acceptance locations in targeted
geographies and merchant categories
• Drive usage by delivering a superior customer experience at the point of sale
• Enhance value of network by delivering new products and services to customers
• Accelerate PCE penetration by supporting global acceptance infrastructure
Goal:
BrandClients
Acceptance
Products & ServicesProcessing
Local Market Focus

39
Acceptance Across Segments
39
Merchant Acceptance Per 1,000 urban population
T&E Merchants (hotels, airlines)
Larger Ticket Purchases (department stores)
Other Emerging
Everyday Spend (grocery, gas, drugstore)
Lower-ticket (convenience stores, QSRs)
Bill Payment (utilities, rent)
Cash Access1 (branches, ATMs)
Country Development Lifecycle
Low
High
Card Payment Volume as % of total PCE
Tipping Point: Acceptance ubiquity makes plastic preferred payment method
1Cash access is the foundational element for most geographies, with the exception of the U.S. and Canada, where cards were used for payment volume prior to the development of ATMs

40
U.S. Priority Segments
Category Key Tactics
Debt Repayment • Partner with top financial institutions • Develop usage programs with partners
Bill Payment• Create consumer awareness through marketing programs• Promote usage through leading billers• Provide incentives to 3rd parties and acquirers to sign up
new acceptors
Charities • Partner with top charities• Launched charitable giving portal
Healthcare Out of Pocket
• Create healthcare best practices • Establish relationships with key industry groups and industry
service providers• Evaluate healthcare provider portal
Vending and Taxi• Establish industry partnerships to grow acceptance• Provide incentives to expand acceptance• Promote awareness with cardholders
Although the U.S. is a sophisticated market from a payments perspective, there are still several large segments for Visa to grow acceptance
40
41
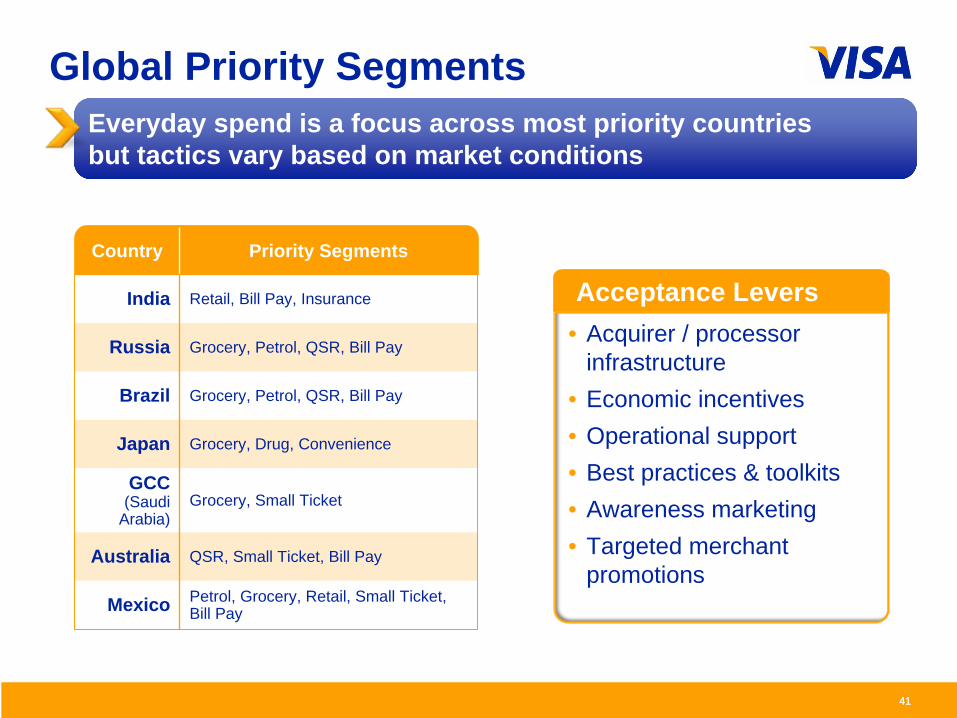
Global Priority Segments
41
Country Priority Segments
India Retail, Bill Pay, Insurance
Russia Grocery, Petrol, QSR, Bill Pay
Brazil Grocery, Petrol, QSR, Bill Pay
Japan Grocery, Drug, Convenience
GCC (Saudi
Arabia)Grocery, Small Ticket
Australia QSR, Small Ticket, Bill Pay
Mexico Petrol, Grocery, Retail, Small Ticket, Bill Pay
Everyday spend is a focus across most priority countries but tactics vary based on market conditions
• Acquirer / processor infrastructure
• Economic incentives• Operational support• Best practices & toolkits• Awareness marketing• Targeted merchant
promotions
Acceptance Levers

Visa Corporate Strategy
4242
Achieve superior financial performance to drive shareholder return
Grow participants of network: Issuers, acceptors, cardholders, new users
Grow usage of network: Drive brand preference, expand channels, increase processing penetration
Enhance value of network: Core products expansion, value-added services, new businesses
Emphasize local market focus and talent to ensure sustainable competitive advantage globally
Support global payment ecosystem by managing stakeholders and ensuring value creation for all
Vision: The world’s best way to pay and be paidMission: Accelerate the electronification of commerce
12
Turning Strategy Into ActionDeveloping domestic processing action plans for eight priority countries
Rolling out value added services like advanced authorization outside the U.S.
Expanding VPS into new countries
Competing for SBI-led JV in India
Rolling out enhanced mobile application offering for DPS clientsExecuting acceptance initiatives in priority countries
Building on Trust: Securing the Payments SystemEllen Richey Chief Enterprise Risk Officer
43

Payment System Risk: The Mission
44
Compliance & Internal Audit
StrategicRisks
Legal & Regulatory
Risks
Financial Risks
Operational Risks
Visa Risk Framework
Internal Data Security
Payment System Security
Sustain stakeholder trust and business growth by promoting the integrity and security of the payment system

The Center of Electronic Payments
45
CardholdersMerchants
CardProcessors
Merchant Processors
Acquirers Issuers16,000+ financial institutions
62 billion total transactions*$4.4 trillion in total volume*
* Source: Visa Inc. data for 12 months ended December 2009
Protecting the payment system is a shared responsibility among participants

1992
1993
1994
1995
1996
1997
1998
1999
2000
2001
2002
2003
2004
2005
2006
2007
2008
2009
Terminal Placement and CVV
CAMS IIAdvanced Authorization
PED
PCI SSCCVV2 VbV
EMV Co
AIS-CISP
PABP
CAMS
CAP
DSS
CAP IIPADSS
Controlling Fraud through Innovation
46
Glo
bal F
raud
to S
ales
Rat
e
Source: Visa Inc. - Reported fraud to Sales Volume*2009 through September
Account Data Compromises
*
Visa has led in developing innovative solutions:
• Risk tools• Standards and oversight• Education and partnership
First Commercial Chip Security
First Fraud Detection System
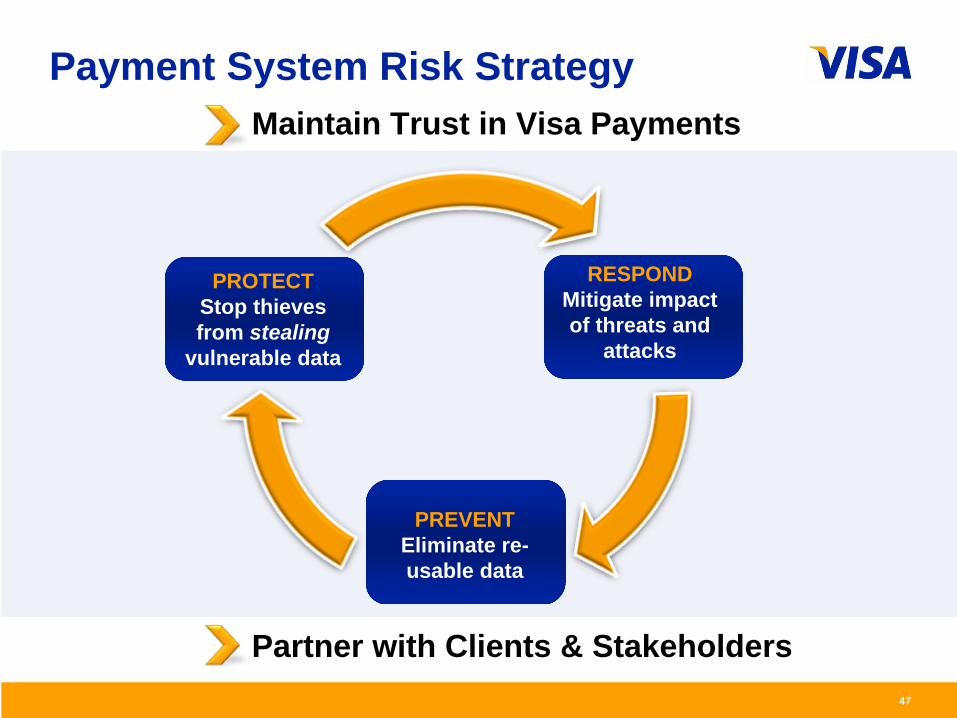
Maintain Trust in Visa Payments
Partner with Clients & Stakeholders
Payment System Risk Strategy
47
PROTECTStop thieves from stealing
vulnerable data
PREVENTStop thieves from using stolen data
RESPONDMitigate impact of threats and
attacks
PREVENTEliminate re- usable data

48
2010: The Security ChallengeFraudsters have evolved their business models and migrated between channels, products and geographies
Criminals continue to adapt and challenge the system• The number of compromise incidents involving cardholder
information has grown globally• Stakeholder costs are increasing • Security tops consumer concerns• Regulators name “cybersecurity” a top priority
24 April 2009
Visitors to a Brazil bank’s web site
were redirected to a counterfeit site
designed to steal customer
credentials
The Menace in the Machines ---
Cyber-Scams On the Uptick In
Downturn M.P. McQueen
29 January 2009Falling economy pushing cybercrimes up
May 21, 2009
Nov 2009
LA PRENSA - PANAMA

Protect the System
49
• Data Security• Application
and Device Security
• Encryption
Standards
• Training and Consulting
• Implementation guidance
• Best Practices and Guidelines
Education
• Incentive Programs
• Requirements and Mandates
• Partnerships and Compliance
Oversight
• Device and service testing
• Analytics and Reporting
• Alerts and Bulletins
Tools
Lead the industry in protecting vulnerable payment data
Opportunity: Shrink the “Card Data Environment” to reduce stakeholder cost and risk

Respond to Threats
50
Identify Analyze Mitigate
• Point of Compromise Tools
• Proactive Alerts• Authorization
Solutions
• Zero Liability• Incident
Response
• Intelligence Sharing• Risk Councils
• Performance Benchmarking
• Risk Services• Public/Private
Partnerships
• Consumer Alerts• Fraud ID systems
• Cyber Intelligence & Investigations• Fraud Control Programs
Tools & Solutions
Programs & Processes
Information & Partnerships
Minimize the impact of threats on stakeholders through early identification and advanced event management
Opportunity: Identify attacks earlier to shut down fraud faster Empower consumers to protect themselves from fraud

Authenticate Devices
Prevent Attacks
51
Reduce the incentive for criminals to steal data by eliminating re-usable data from the system
Opportunity: Make transaction data useless by moving to dynamic authentication technologies
Authenticate Participants
Dynamic DataStatic Data
• Signature/PIN
• One time pass-codes
• Challenge-Response
• CVV/CVV2 • Smart Cards
• IP Validation
• dCVV • Tokenization
• Passwords
Only the legitimate
customer can initiate a
transaction
Data can only be used for the
original transaction• Trusted PC

20/20 Vision The Future of Payments Security
Dynamic Authentication: allowing merchants to focus less on security and more on commerce
Powerful Security: among stakeholders who retain vulnerable data
Intelligent Response: to shut down fraud and put criminals behind bars
Solutions that Engage Consumers: to protect themselves from fraud
Innovation, Leadership & Collaboration: making clients prefer Visa
52
1
2
3
4
5

Questions and Answers SessionBrian TriplettDarren ParslowMarc LuetEllen Richey

2010 Investor DayMarch 11, 2010
54