2010 Comprehensive Annual Financial Report year ended June 30, 2010 Chapel hill, North CaroliNa A...
106
Fiscal year ended June 30, 2010 CHAPEL HILL, NORTH CAROLINA A Constituent Institution of the University of North Carolina System and a Component Unit of the State of North Carolina 2010 Comprehensive Annual Financial Report THE UNIVERSITY of NORTH CAROLINA at CHAPEL HILL
-
Upload
nguyentuong -
Category
Documents
-
view
214 -
download
1
Transcript of 2010 Comprehensive Annual Financial Report year ended June 30, 2010 Chapel hill, North CaroliNa A...

1
Fiscal year ended June 30, 2010
Chapel hill, North CaroliNa
A Constituent Institution of the University of North Carolina System and a Component Unit of the State of North Carolina
2010 Comprehensive Annual Financial Report T h e U n i v e r s i T y o f n o r T h C a r o l i n a a t C h a p e l h i l l

FisCal ye ar eNded JuNe 30, 2010 | Chapel hill, North CaroliNa
2010 Comprehensive Annual Financia l Report
Fiscal year ended June 30, 2010
Chapel hill, North CaroliNa2010 Comprehensive Annual Financial Report T h e U n i v e r s i T y o f n o r T h C a r o l i n a a t C h a p e l h i l l
prepared by the CoNtroller ’s oFFiCe

Fiscal year ended June 30, 2010
Chapel hill, North CaroliNa
A Constituent Institution of the University of North Carolina System and a Component Unit of the State of North Carolina
2010 Comprensive Annual Financia l Report T h e U n i v e r s i T y o f n o r T h C a r o l i n a a t C h a p e l h i l l

T h e U n i v e r s i T y o f n o r T h C a r o l i n a a t C h a p e l h i l l2

32010 Comprehensive A nnua l Financia l Repor t
4 inTrodUCTory seCTion
6 | Message from the Chancellor
7 | Letter of Transmittal
10 | Progress and Major Initiatives
18 | Board of Trustees
18 | Chancellor’s Cabinet
19 | Organization Chart
2 0 finanCi al seCTion
22 | Report of the Independent Auditor
24 | Management’s Discussion and Analysis
Basic Financial Statements
34 | Statement of Net Assets
35 | Statement of Revenues, Expenses, and Changes in Net Assets
36 | Statement of Cash Flows
38 | Statement of Financial Position – Component Units
39 | Statement of Activities and Changes in Net Assets – Component Units
40 | Notes to the Financial Statements
7 2 sTaTisTiC al seCTion
74 | Narrative to the Statistical Section
75 | Net Assets By Component
76 | Changes in Net Assets
79 | Changes in Net Assets Adjusted for Inflation
81 | Operating Expenses by Function
82 | Revenue Base
82 | Academic Year Tuition and Required Fees
83 | Principal Revenue Payers
84 | Long-term Debt
85 | Summary of Ratios
92 | Specific Revenue and General Revenue Bond Coverage
94 | Annual Undergraduate Educational Costs per Student
96 | Admissions, Enrollment, and Degrees Earned
98 | Demographic Data
99 | Principal Employers
100 | Faculty and Staff
102 | Capital Assets
Table of ContentsT h e U n i v e r s i T y o f n o r T h C a r o l i n a a t C h a p e l h i l l

inT
ro
dU
CT
or
y s
eC
Tio
n


T h e U n i v e r s i T y o f n o r T h C a r o l i n a a t C h a p e l h i l l6
Holden Thorp
This fall, we enrolled another impressive incoming class of nearly 5,000 undergraduate, graduate and professional students. As the economy kept taking its toll, we met an 11 percent increase in students eligible for need-based aid. Faculty attracted $803 million in research funding – up 12 percent. The Times Higher Education Magazine in London ranked us 30th among the world’s top universities. And donors made $268 mil-lion in gifts – a great vote of confidence in our students, faculty and staff.
We were fortunate to predict the impact of state cuts to this year’s budget. But we could only minimize cuts by retaining the revenue from the tuition increases authorized by the General Assembly. We protected the classroom experience of our stu-dents as much as possible.
The economy made this a tough year for most campuses. But I would put Carolina up against any campus for how we responded and moved forward.
At this writing, North Carolina faces a shortfall next year exceeding $3 billion. We’ve been asked for cut scenarios of 5 percent and 10 percent. That means more tough choices when we can’t cut again without harming academics. Working with General Administration and new President Tom Ross, we’ll make the strongest possible case for Carolina when the General Assembly convenes next year.
The best way for Carolina to be strong is to plan boldly so we can seize opportunities when the economy recovers.
Engaged students, faculty and staff long have had contributed ideas that led to big changes. Examples include the campus master plan, which we started implementing after approval of the state bond referendum. One result was the science com-plex, which has allowed faculty to grow our research. Planning informed by faculty also led to the state-supported University Cancer Research Fund, now the envy of cancer researchers everywhere. The fund permitted us to hire 67 new faculty and retain 14 others.
Now we’re developing a new Academic Plan, our to-do list for the next decade. It will help frame our decisions about curricula and intellec-tual growth, future funding allocations and people. It will make a big statement about how the University can best serve students and the public.
These efforts are complemented by Innovate@Carolina: Important Ideas for a Better World, a roadmap outlining how we can produce new knowledge with the highest impact. We are seeking private funding to implement the plan. The goal is to spur innovation of every sort, from artistic endeavors that promote greater understanding between peoples to laboratory discoveries that improve livelihoods around the world.
Carolina is one of the world’s great research institutions, and we’re getting better every day. Our biggest contribution to North Carolina is sending bright, capable young people to communities across the state – and beyond – to become the next generation of leaders. Inspired by our faculty, they come ready to help start tackling society’s biggest problems.
holden thorpMessage from the ChancellorT h e U n i v e r s i T y o f n o r T h C a r o l i n a a t C h a p e l h i l l
inT
ro
dU
CT
or
y
GreaT ThinGs are happeninG; Bold pl anninG Key To sUCCess
“The best way for Carolina to be strong
is to plan boldly so we can seize
opportunities when the economy recovers.”

72010 Comprehensive A nnua l Financia l Repor t
This Comprehensive Annual Financial Report (CAFR)includes the financial state-ments for the year ended June 30, 2010, as well as other useful informa-tion that helps ensure the University’s accountability to the public. Responsibility
for the accuracy of the information and for the completeness and fairness of its presentation, including all disclosures, rests with the University’s management. We believe the informa-tion is accurate in all material respects and fairly presents the University’s financial position, revenues, expenses, and other changes in net assets.
We believe our system of internal controls is sound and sufficient to disclose material deficiencies in controls to the auditors and the audit committee and to provide management with reasonable, although not absolute, assurance that assets are safeguarded against loss from unauthorized use or disposi-tion. The University is a participant in Finance Improvement and Transformation (UNC FIT). UNC FIT is a collaborative project sponsored by the UNC System’s General Administra-tion that seeks to strengthen internal controls in the finance areas to ensure financial integrity and accountability and meet the requirements of Enhancing Accountability in Government through Leadership and Education (EAGLE). EAGLE is the State’s internal control program that was established by the Office of the State Controller to meet the requirements of House Bill 1551, Chapter 143D “State Governmental Accountability and Internal Control Act.”
State law, federal guidelines, and certain bond covenants require that the University’s accounting and financial records be audited by the Office of the State Auditor each year. The University’s internal auditors also perform fiscal, compliance,
and performance audits. The reports resulting from these audits are shared with University management. Internal and external audit reports are provided to the Audit and Finance Committee of the Board of Trustees. The audit of the University’s federal financial assistance programs is performed by the Office of the State Auditor in conjunction with the statewide Single Audit.
The CAFR includes Management’s Discussion and Analysis and all disclosures necessary for the reader to gain a broad understanding of the University’s financial position and results of operations for the fiscal year ended June 30, 2010.
profile of The UniversiTy
The University of North Carolina was anticipated by the first state constitution drawn up in 1776 directing the establishing of “one or more universities” in which “all useful learning shall be duly encouraged and promoted.” The American Revolution inter-vened and it was not until 1789, the year that George Washing-ton became president of the new nation, that the University was chartered by the General Assembly. On October 12, 1793, the cornerstone was laid for the first campus building.
Now in its third century, UNC belongs to the select group of American and Canadian campuses forming the Association of American Universities. UNC’s academic offerings span more than 100 fields, including bachelor’s, master’s and doctoral degrees as well as professional degrees in dentistry, medicine, pharmacy and law. Five health schools which, with UNC Hospitals, comprise one of the nation’s most complete academic medical centers are integrated with liberal arts, basic sciences and high-tech academic programs.
The accompanying financial statements present all funds belonging to the University and its component units. While the multi-campus University of North Carolina System’s Board of Governors has ultimate responsibility, the chancellor, the University’s Board of Trustees, and the Board of Trustees of the
Richard L. Mann
November 30, 2010Letter of TransmittalT h e U n i v e r s i T y o f n o r T h C a r o l i n a a t C h a p e l h i l l
To ChanCellor Thorp, MeMBers of The Board of TrUsTees, and friends of The UniversiTy of norTh Carolina aT Chapel hill:

T h e U n i v e r s i T y o f n o r T h C a r o l i n a a t C h a p e l h i l l8
Endowment Fund have both delegated and statutory responsi-bilities for financial accountability of the University’s funds. For the fiscal year ended June 30, 2010, the University implemented Governmental Accounting Standards Board (GASB) Statement No. 51, Accounting and Financial Reporting for Intangible Assets and GASB Statement No. 53, Accounting and Financial Report-ing for Derivative Instruments. GASB Statement No. 51 requires reporting certain intangible assets as capital assets. GASB State-ment No. 53 requires reporting certain derivative instruments at fair value.
The financial reporting entity for the financial statements is comprised of the University and ten component units. Seven of these, although legally separate, are reported as if they were part of the University. These include The University of North Carolina at Chapel Hill Foundation Investment Fund, Inc. (Investment Fund), UNC Investment Fund, LLC (System Fund), UNC Management Company, Inc. (Management Company), The University of North Carolina at Chapel Hill Foundation, Inc. (UNC-CH Foundation), The Kenan-Flagler Business School Foundation (Business School Foundation), The School of Educa-tion Foundation, Inc. (School of Education Foundation), and U.N.C. Law Foundation, Inc. (Law Foundation).
Separate financial statements for three other component units are reported based on GASB Statement No. 39. The Medi-cal Foundation of North Carolina, Inc. (Medical Foundation), The Educational Foundation Scholarship Endowment Trust (Educational Foundation Trust), and The University of North Carolina at Chapel Hill Arts and Sciences Foundation, Inc. (Arts and Sciences Foundation) are legally separate, non-profit, tax-exempt organizations and are reported as discretely presented component units based on the nature and significance of their relationship to the University.
The accounting and financial records of the Investment Fund, UNC-CH Foundation, System Fund, Management Company, Business School Foundation, School of Education Founda-tion, Law Foundation, Arts and Sciences Foundation, Medical Foundation, Educational Foundation Trust, WUNC Radio, and the Athletic Department are each audited by a public accounting firm in addition to the State Auditor review. All audit reports are available for public inspection.
Other related foundations and similar non-profit corporations for which the University is not financially accountable are not part of the accompanying financial statements. The University of North Carolina at Chapel Hill is a constituent institution of the multi-campus University of North Carolina System, which is a component unit of the State of North Carolina and an integral part of the State’s Comprehensive Annual Financial Report.
The University is responsible for controlling its budget and using the funds to fulfill its educational, research, and public service missions. It is also responsible for planning, developing, and controlling budgets and expenditures within authorized
allocations in accordance with University, state, and federal policies and procedures. The University maintains budgetary controls to ensure compliance with provisions embodied in the annual appropriated budget approved by the North Carolina General Assembly, and as further directed by the Board of Governors. Project-length financial plans are adopted for capital projects.
After the budget has been approved by the chancellor and the Board of Governors, the University follows an established system of budgetary controls. Finance and Administration issues periodic interim budget statements to department heads to guide them in managing their budget allocations. Monthly financial reports are provided on each fund to individual manag-ers responsible for the fund. Financial reports are also provided to the state. When actual conditions require changes to the budget, revisions are prepared and these revisions are appropri-ately approved and communicated to those affected. Changes to the budget are approved at the University level and/or the state level as required. Based on the state’s management flexibility legislation, the University has received delegated authority for designated budget changes. The University maintains an encumbrance accounting system as another method to ensure that imposed expenditure constraints are observed.
eConoMiC CondiTion
According to the September 20, 2010 statement from the Business Cycle Dating Committee of the National Bureau of Economic Research, the group accepted as the arbiter on when recessions begin and end in the U.S., the recession that began in December 2007 ended in June 2009. While this was the longest recession since the 1929–1933 “Great Depression,” this 18-month duration was much shorter.
Also on September 20, 2010, the Bureau of Economic Analysis of the U.S. Department of Commerce issued the report, “State Personal Income: Second Quarter 2010.” This reflected total personal income in North Carolina in the second quarter of 2010 at a seasonally adjusted annual rate of $337.9 billion. That was ahead of the $334.2 billion in Massachusetts and below the $342.4 billion in Georgia. Among other southeastern states, North Carolina trailed the $734.1 billion in Florida and $356.2 billion in Virginia. North Carolina’s ranking in the U.S. for total personal income at a seasonally adjusted rate in the second quarter of 2010 was 12th.
Total personal income in North Carolina in the second quarter of 2010 was 2.7 percent of the total U.S. and represented a 1.5 percent increase from the second quarter of 2009. Among all 50 states, only three – New Mexico at 2.2 percent, Texas at 1.6 percent and Alaska at 1.6 percent – experienced faster growth in the first year of the new expansion. Kentucky had the same percentage increase as North Carolina.

92010 Comprehensive A nnua l Financia l Repor t
On September 21, 2010, the Bureau of Labor Statistics reported that the total number of people employed in North Carolina on a seasonally adjusted basis in August 2010 was 4,054,900 and that the unemployment rate was 9.7 percent. That represented a significant drop from the 10.9 percent rate of August 2009. However, total employment was still 6.3 percent below the 4,328,400 people employed in December 2007 when the recession began.
Non-farm payroll employment on a seasonally adjusted basis for August 2010 was much improved for North Carolina. That number rose by 18,600 jobs from July to 3,912,500 such jobs in August, reflecting the largest increase among all 50 states. Mis-souri was in second place with a gain of 3,600 jobs. In contrast, Michigan lost 50,300 non-farm jobs in August while Texas lost 34,200 and California lost 33,600. For the year ended in August 2010, North Carolina posted a gain of 36,700 non-farm payroll jobs on a seasonally adjusted basis. Texas had the biggest increase at 129,100 such jobs. The all-time peak in non-farm payroll employment in North Carolina on a seasonally adjusted basis was 4,170,400 jobs in January 2008 right after the reces-sion began. The bottom was in September 2009 when there were 3,872,300 non-farm jobs.
The Census Bureau estimate for the total resident popula-tion of North Carolina in July 2009 is 9,380,884 people. This population ranked tenth in the U.S. after Georgia and ahead of New Jersey.
The Federal Housing Finance Agency reported that the seasonally adjusted purchase index for single-family homes for
North Carolina rose 0.74 percent in the second quarter over the first quarter of 2010. Average home prices were down 2.96 percent from a year earlier, but up 8.95 percent from five years earlier. Average home prices in North Carolina in the second quarter of 2010 were 90.17 percent above the first quarter of 1991. The national average increased 94.28 percent over the same period.
The overwhelming consensus is that the upcoming year will bring slow but steady growth in overall economic activity and personal incomes in North Carolina.
The University is committed to long-term financial and bud-getary planning as addressed in the economic outlook section of the Management’s Discussion and Analysis.
Carolina’s progress, priorities, and major initiatives during fiscal 2009–2010 reflected the University’s vision of becoming the nation’s leading public university. Following this letter are recent highlights.
aWards and aCKnoWledGeMenTs
The Government Finance Officers Association of the United States and Canada (GFOA) awarded a Certificate of Achievement for Excellence in Financial Reporting to the University for its CAFR for the fiscal year ended June 30, 2009. This was the 15th consecutive year that the University has been honored with this prestigious award. To receive a Certificate of Achieve-ment, a government unit must publish an easily readable and efficiently organized CAFR. This report must satisfy both generally accepted accounting principles and applicable legal requirements.
A Certificate of Achievement is valid for one year. We believe our current CAFR continues to meet the Certificate of Achieve-ment Program’s requirements and we are submitting it to the GFOA to determine its eligibility for another certificate.
Preparation of this CAFR in a timely manner would not have been possible without the coordinated efforts of the Univer-sity community, with special assistance from the Chancellor’s Office, the Office of the Executive Vice Chancellor and Provost, Research and Economic Development, Student Affairs, Informa-tion Technology Services, University Advancement, University Relations, Institutional Research, the Office of Scholarships and Student Aid, the Department of Athletics, and Dr. James F. Smith, Adjunct Professor of Business Administration in the Kenan-Flagler Business School. In addition, the Office of the State Auditor provided invaluable assistance.
Dr. Richard L. MannVice Chancellor for Finance and Administration
The University of North Carolina at Chapel Hill has received the award for reporting excellence for the past 15 years.

T h e U n i v e r s i T y o f n o r T h C a r o l i n a a t C h a p e l h i l l1 0
A chievements Strengthen Standing Among World ’s Great Research Universities
inT
ro
dU
CT
or
y
Carolina long has been considered one of the world’s most influential and respected research universities. Every day, the University’s students, faculty and staff work together to improve the lives of people across North Carolina, the United States and around the world. Those contri-butions during fiscal 2009–2010 have only enhanced the University’s reputation as a global higher education leader.
Highlights include the following:
• Thisfall,theUniversityenrolledanotherimpressiveincomingclass of nearly 5,000 undergraduate, graduate and professional students.
• Astheeconomykepttakingitstoll,Carolinametan11percentincrease in students eligible for need-based aid.
• Facultyattractedacampusrecord$803millioninresearchfunding–up 12 percent – to conduct life-changing research.
• TheTimesHigherEducationMagazineinLondonrankedCarolina30thamong the world’s top universities and 21st among U.S. campuses.
• TheUniversitylaunchedInnovate@Carolina:ImportantIdeasfora Better World to engage the campus in finding new ways to create knowledge and to address society’s problems.
• CarolinadedicatedVenableandMurrayhalls–thelatestadditionsto the science complex, the most ambitious construction project in campus history.
• AndalumniandfriendsdemonstratedgreatconfidenceinCarolinabymaking $268 million in gifts.
Following is a brief sampling of successes and progress at Carolina in fiscal 2009–10 and beyond.
Top, Protecting the classroom experience for students has been Carolina’s top budget priority. Bottom left, Don Stanford, adjunct professor at the Kenan-Flagler Business School, uses a ball to control the movement of an octopus projected on a wall during CHAT (Collaborations: Humanities, Arts & Technology), a digital arts and humanities festival. The exhibit was titled “The Bathysphere: Motion Capture as Art.” Bottom right, Counselors welcome Samantha Farquharson for Carolina Kickoff, which brings about 175 incoming students to a retreat off campus with faculty and current students.
Fiscal year 2009–2010Progress and Major InitiativesT h e U n i v e r s i T y o f n o r T h C a r o l i n a a t C h a p e l h i l l

1 12010 Comprehensive A nnua l Financia l Repor t

T h e U n i v e r s i T y o f n o r T h C a r o l i n a a t C h a p e l h i l l1 2
Carolina aT TraCTs Top sTUdenTs, proTeCTs aCCessiBiliTy
The University provides outstanding students seeking the best a public university can offer with the opportunity to learn in one of the highest-quality academic environments on any college campus. The University’s academic culture fosters excellence in interdisciplinary teaching and scholarship between and among the liberal arts and humanities, as well as the health, natural and social sciences along with professional schools. This approach helps develop students into thoughtful, informed citizens and compassionate leaders.
Meet the Class of 2014 – Among the Best Prepared EverThe Class of 2014 maintained high standards with their achieve-ments in key indicators of academic success. The University received 23,271 applications and enrolled 3,960 students in August 2010. That was up slightly from 23,224 applications in 2009, while the size of the incoming class remained steady. Academically, the percentage of enrolled students who were in the top 10 percent of their high school class or who were among the top 10 students in that class stayed about the same – at 78 percent and 42 percent, respectively. The number of valedicto-rians or salutatorians also held – at nearly 12 percent – along with a 2-point gain in the average SAT score (to 1304). And the University continued its focus on attracting more of the very best students from North Carolina. Numbers alone do not tell
the true story of these great students. The Office of Undergradu-ate Admissions staff takes a thorough, compassionate approach to assessing the true potential of applicants including their character and heart. Because of the economy, 11 percent more students came to campus with financial need than a year ago. Among first-year students, that number also was 11 percent higher. Carolina met all of the need for those who qualified and applied for aid on time. First-generation college students made up 18 percent of the first-year class. Carolina Covenant Scholars accounted for more than 11 percent of the first-year students.
Carolina Covenant Scholars Successful Academically A new report card shows the Carolina Covenant helps close the gap for earning degrees between low-income and other students.
The program, which provides a debt-free education to qualified low-income students, is a national model. More than 90 similar programs have been established at U.S. colleges and universities since Carolina announced the Covenant in 2003.
Above, New Tar Heels pose for a group shot during their first convocation in the Smith Center. Right, Carolina Covenant Scholar Alisa Eanes at her work-study job in the School of Medicine’s OB-GYN department.

1 32010 Comprehensive A nnua l Financia l Repor t
For the report card, the University compared Covenant Schol-ars who enrolled in 2005 with a group of 2003 entering students who would have qualified. Covenant students performed 9.6 percentage points better in four-year graduation rates (66.3 percent) than the comparison group. Graduation rates for all students gained 2.5 percentage points and, overall, were slightly higher. The retention rate for 2005 Covenant Scholars in their third year was 4 percentage points higher (90.2 percent) than for the 2003 group and very close to the mark for all students (93.5 percent).
Most noteworthy of all: the graduation rate among male Covenant Scholars increased a whopping 27 percent over the 2003 male comparison group, narrowing the achievement gap between Covenant men and women.
Since the program began, more than 2,900 students have benefitted. Carolina currently enrolls about 2,200 Carolina Covenant Scholars.
Carolina Produces Most Rhodes Scholars Among Publics Since 2000, Carolina has produced more Rhodes Scholars than any other state-supported university, and the ninth most of any public or private school. Over the past five years, Carolina has tied for fifth overall, ahead of several Ivy League schools. Only Harvard, Yale, Stanford and Princeton produced more Rhodes winners than Carolina during that period. In 2009, Carolina had two winners, the sixth time that had occurred in the same
year. Since the U.S. Rhodes Scholar program began in 1904, 45 Carolina students have been selected – the second most among top public research universities.
Carolina’s 2009 winners, both Morehead-Cain Scholars, were Elizabeth “Libby” Longino of Dallas, Texas, and Henry Spelman of Swathmore, Pa. They were among 32 U.S. students selected. Longino interned with a microcredit program in Vietnam, helped start a group combating child prostitution in Cambodia and completed an Outward Bound Wilderness Expedition in the Pacific Northwest. She double-majored in English and public policy analysis. Spelman worked in refu-gee camps in Tanzania, tutored underprivileged high school students and trekked more than 125 miles in Washington’s Olympic Mountains. He majored in classical languages with a minor in creative writing.
Students often catch up at the Old Well, the visual symbol of the University. Tradition holds that a drink from the well on the first day of class will bring good grades year round.
Libby LonginoHenry Spelman

T h e U n i v e r s i T y o f n o r T h C a r o l i n a a t C h a p e l h i l l1 4
faCUlTy CondUCT life-ChanGinG researCh, BrinG in larGesT revenUe sTreaM
Carolina ranks among the top U.S. public universities in research support. Faculty attracted more than $803 million in total contract and grant funding in fiscal 2010 – up 12.2 percent over the previous year and double the amount awarded a decade ago. This year’s figure includes a strong showing ($126 million) in the level of federal stimulus research funding awarded as part of the American Recovery and Reinvestment Act. With its steady growth over the past 14 years, research funding has become the University’s largest revenue stream – a great tribute to the suc-cess of the faculty and a multidisciplinary approach to advanc-ing knowledge and science.
University Cancer Research Fund Ref lects State’s Commitment to PatientsIn 2007, the N.C. General Assembly created the University Can-cer Research Fund to support basic research in medicine, phar-macy and public health, as well as basic science departments of the College of Arts and Sciences through the Lineberger Comprehensive Cancer Center and the School of Medicine.
Supporting laboratory, clinical and outreach efforts across North Carolina, the fund directed $25 million to Carolina in 2007–08 and $40 million in 2008–09. The annual total increased to $50 million annually in 2009. The fund, combined with the opening of the $180 million North Carolina Cancer Hospital, demonstrated unprecedented positive momentum for cancer research at Carolina. The fund has permitted Carolina to hire 67 new faculty and retain 14 others.
The recruits include Dr. Ben Major, assistant professor of cell and developmental biology, who came from the University of Washington and chose Carolina over other prestigious universi-ties at which he had offers. He aims to find out what our 20,000 genes do, what happens when they work together and what that means for the fight against cancer.
Major’s approach focuses on how many of our genes work together because that helps determine which sets of genes are important for cancer’s development, growth and spread. By precisely inactivating genes one at a time, he aims to determine what their role is by what happens or doesn’t happen when they are removed from the action. If that works, Major says researchers can pinpoint the function of each gene in the human genome – and whether they should be considered for targeted drug discovery efforts.
The research fund’s support was responsible for Major receiving a $1.5 million grant from the National Institutes of Health for his
Dr. Ben Major, assistant professor of cell and developmental biology, received a prestigious $1.5 million grant from the National Institutes of Health, to investigate a new approach to determine gene function. The grant was made possible by previous support from the University Cancer Research Fund.
“Not only was I able to get my laboratory
and research up and running quickly at
UNC, but I am also able to interact on a
daily basis with top-notch colleagues
who encourage me to take the kinds of
smart risks that pay off with big rewards.”

1 52010 Comprehensive A nnua l Financia l Repor t
research. The 2010 NIH Director’s New Innovator Awards go to “highly innovative research that has the potential for significant impact.” Major was the only North Carolina recipient and also was named a 2010 Sidney Kimmel Scholar, recognized for being one of the country’s most promising young cancer researchers.
“Not only was I able to get my laboratory and research up and running quickly at UNC, but I am also able to interact on a daily basis with top-notch colleagues who encourage me to take the kinds of smart risks that pay off with big rewards,” Major says.
innovaTion pl an refleCTs BiG ThinKinG for The fUTUre
The University recently unveiled Innovate@Carolina: Important Ideas for a Better World. It’s a roadmap developed by alumni and friends, along with faculty and students, under the leadership of alumnus Lowry Caudill.
The recommendations outline how Carolina can produce new knowledge with the highest impact. The campus plans to spur innovation of every sort, from artistic endeavors that promote greater understanding between peoples to laboratory discover-ies that improve livelihoods around the world.
Carolina wants to create an environment where faculty, students and staff feel comfortable taking risks and addressing new problems.
Implementing the plan will cost about $125 million in private support. The University already has secured more than $12
million in commitments from donors who are excited about the potential.
University leaders don’t know of another university taking this kind of campus-wide approach to innovation. And it’s another way Carolina can prepare to seize opportunities when the economy recovers.
The poWer of 1 Can reaCh ThoUsands of norTh Carolinians
Through teaching, research and public service, Carolina improves people’s lives and builds futures across North Carolina. The following examples are adapted from one.unc.edu, a website featuring stories about Carolina people who are helping North Carolinians and, at the same time, helping to lead the state into the future. It is part of a University effort to illustrate how powerful the work of one person at Carolina can be.
1 Determined Scientist; 2,200 Square Miles of Healthier WaterProfessor Hans Paerl of the UNC Institute of Marine Sciences knew that collecting water quality data from Pamlico Sound would prove invaluable. As the second-largest estuary on the East Coast, the most important fishery and a popular recre-ational destination, Pamlico Sound is critical to the state.
To collect that invaluable data, Paerl and research partner Joe Ramus developed FerryMon, the nation’s first ferry-based water
Read more about the Innovate@Carolina campaign, including the full roadmap, at innovate.unc.edu.

T h e U n i v e r s i T y o f n o r T h C a r o l i n a a t C h a p e l h i l l1 6
quality-monitoring system. It uses sensors attached to ferries already patrolling the 2,200-square mile Pamlico Sound and its tributary rivers daily. The sensors measure salinity, temperature, chlorophyll and other water-quality data and send it back to Paerl’s lab in real time.
Changes in the water’s composition, which can happen after a storm or other natural event, can be harmful to wildlife and upset the balance of the ecosystem. That’s why it’s crucial to monitor changes in the water closely.
Before FerryMon, post-hurricane water quality was commonly diminished – a fact unknown until thousands of fish turned up dead. Now, coastal managers know of changes right away and can react accordingly. “We’re capturing events and changes that a standard monthly monitoring program would not catch, which is why it’s such valuable data,” Paerl says.
State environmental agencies such as the N.C. Department of Environment and Natural Resources use FerryMon data to make decisions about fishing, recreation and other activity on the water. Educators and fishermen also use the data that is accessible online.
While it may seem like just a bunch of numbers, informa-tion from FerryMon is ensuring the future for North Carolina’s many visitors and residents. “Healthy marine life equals healthy individuals,” Paerl says.
1 Dedicated Team; 110 Energized Businesses A few years ago, the small mountain town of Spruce Pine was facing a major loss of jobs in its once-thriving textile and furni-ture industries.
The town contacted the Kenan-Flagler Business School for
guidance. The leaders in Spruce Pine had heard of the school’s STAR (Student Teams Achieving Results) program, which matches students with businesses in need.
Thanks in part to a Golden LEAF grant, STAR sends teams of top MBA and undergraduate students to build strategies for corporations and non-profits looking to strengthen their global competitiveness. The students get real-world experience, and the businesses benefit from advice that would otherwise cost a fortune.
A year of collaboration with the STAR team, led by MBA students Jon Parise and Tina Prevatte, brought big changes for Spruce Pine. They successfully marketed their crafts to national retailer A Southern Season, made plans to sell their products online and developed marketing and branding strategies.
Since STAR students collaborated with Spruce Pine, the project has grown to help more than 100 artisans – such as woodworker Frank Baskin – sell their crafts.
Construction Highlights Include Murray and Venable HallsCarolina benefits from a capital construction program that has been among the most ambitious in American public higher education. This physical transformation was made possible in part by North Carolinians’ approval of the $3.1 billion bond referendum for higher education in 2000. Through 49 projects, the bonds provided more than $515 million for renovations and new buildings. In addition, the University leveraged appropria-tions from the N.C. General Assembly with investments from non-state sources, including private gifts raised during the Carolina First Campaign and overhead receipts from faculty
Left, Professor Hans Paerl of the Institute of Marine Sciences collects water quality data from Pamlico Sound, the second-largest estuary on the East Coast, the most important fishery and a popular recreational destination. Right, Student leader Jon Parise is part of the Kenan-Flagler Business School’s STAR (Student Teams Achieving Results) program, which matches students with businesses in need. He was part of the team that helped businesses in Spruce Pine.

1 72010 Comprehensive A nnua l Financia l Repor t
research grants, for other buildings essential to excellence. The resulting capital construction program exceeded $2.3 billion and was among the largest at any major U.S. university. More than 100 projects were completed.
Recent milestones include the dedication of venable hall and Murray hall, the latest buildings to open as part of the Carolina Physical Science Complex. The namings honor the Ven-able family and longtime Professor Royce Murray. The original Venable Hall, home to the chemistry department since 1925, was demolished in 2007. The new Venable and Murray halls house the William R. Kenan Jr. Chemistry Library along with department of chemistry classrooms, lecture halls, conference rooms and the department of marine sciences.
privaTe sUpporT reMains sTronG
The Carolina First Campaign finished in 2007 as the fifth biggest fund-raising drive among completed campaigns at that time in the history of U.S. higher education and as the largest in the South. Carolina First raised $2.38 billion, and those funds have helped Carolina compete nationally for top faculty and students, invest in departments and programs and build and renovate facilities.
Carolina’s fundraising brought in $268.1 million in gifts in fiscal 2010. In commitments for the year, which ended June 30, Carolina secured $292 million. Commitments include pledges as well as gifts. The commitments total was up from fiscal year 2009’s $290.4 million, and gifts were down just 1 percent from the previous year.
Highlights in fiscal 2010 included a $5 million gift from the William R. Kenan, Jr. Charitable Trust to support the recruit-ment of outstanding young faculty. The funds will target hires in the College of Arts and Sciences, the School of Education, the School of Nursing and Kenan-Flagler Business School.
Commitments in 2010 also helped create 17 endowed profes-sorships, as well as a total of 98 undergraduate scholarships and graduate fellowships. Carolina had more than 73,500 donors for the year.
ranKinGs reCoGniZe GloBal repUTaTion, aCadeMiC eXCellenCe
Several international and national publications regularly issue rankings or ratings that list Carolina prominently in categories ranging from academic quality to affordability to diversity to international presence to public service. Recent highlights focusing on academic achievement include the following:
• 30thamongtheworld’stop200universitiesasrankedbytheLondon-based Times Higher Education magazine. 21st among all U.S. universities appearing on the list. Times Higher Education used quantitative measures of quality, including 13 separate performance indicators in areas ranging from teach-ing to research to knowledge transfer.
• 1stamongthe100bestU.S.publiccollegesanduniversitiesthat offer the best combination of top-flight academics and affordable costs as ranked by Kiplinger’s Personal Finance magazine in January 2010. 1st every time since Kiplinger’s began its periodic ranking in 1998. Kiplinger’s analysis stressed academic quality, as well as cost and financial aid offerings. Kiplinger’s said Carolina retained its top ranking “in part for its ability to attract and keep high-flying students.” The story described Carolina as “an academic superstar that competes with the Ivies. … Besides boasting top students, an outstanding faculty and a historic campus, Chapel Hill enjoys one big advantage over many other public schools: strong state support for financial aid.”
• 5thbestpublicuniversityinU.S. News & World Report’s 2011 “Best Colleges” guidebook for the 10th consecutive year. 1st among public campuses for the 6th consecutive year; 14th overall in “Great Schools, Great Prices,” based on academic quality and the net cost of attendance for a student who received the average level of need-based financial aid. Rated highly (second among public universities) for academic repu-tation by high school guidance counselors.
The Carolina Physical Science Complex is the most ambitious construction project in the University’s history.
The London-based Times Higher Education magazine ranked Carolina 30th among the world’s top universities for 2010–11. UNC also was 21st among U.S. universities. Times Higher Education used quantitative data to help measure quality instead of reputational surveys, which typically count in a number of ranking formulas including U.S. News & World Report magazine.

T h e U n i v e r s i T y o f n o r T h C a r o l i n a a t C h a p e l h i l l1 8
Board of TrusteesJ U n e 3 0 , 2 0 1 0
Holden ThorpChancellor
Richard A. BaddourDirector of Athletics
Bruce W. CarneyExecutive Vice Chancellor and Provost
Larry D. ConradVice Chancellor for Information Technology and Chief Information Officer
Winston B. CrispVice Chancellor for Student Affairs
Nancy K. DavisAssociate Vice Chancellor for University Relations
Douglas S. DibbertPresident, General Alumni Association
Archie W. ErvinAssociate Provost for Diversity and Multicultural Affairs
Karen M. Gil Dean, College of Arts and Sciences
Brenda W. KirbySecretary of the University
Matthew G. KupecVice Chancellor for University Advancement
Brenda Richardson MaloneVice Chancellor for Human Resources
Richard L. MannVice Chancellor for Finance and Administration
Ann E. PennEqual Opportunity/ ADA Officer
Dwayne L. PinkneySpecial Assistant to the Chancellor for State and Local Relations and Assistant Vice Chancellor for Finance and Administration
William L. RoperVice Chancellor for Medical Affairs and Dean, School of Medicine
Leslie Chambers StrohmVice Chancellor and General Counsel
Tony G. WaldropVice Chancellor for Research and Economic Development
inT
ro
dU
CT
or
y
Chancellor’s CabinetJ U n e 3 0 , 2 0 1 0
Robert W. Winston III Chair, Raleigh, NC
Barbara Rosser HydeVice Chair, Memphis, TN
Phillip L. Clay Secretary, Cambridge, MA
Donald Williams CurtisRaleigh, NC
John G. B. Ellison, Jr.Greensboro, NC
Alston GardnerChapel Hill, NC
Wade Hampton Hargrove Jr.Raleigh, NC
Roger L. Perry Sr.Chapel Hill, NC
Sallie Shuping-Russell Durham, NC
Edward C. Smith Jr.Greenville, NC
John L. Townsend III Greenwich, CT
Felicia A. WashingtonCharlotte, NC
Hogan MedlinEx-Officio, Chapel Hill, NC

1 92010 Comprehensive A nnua l Financia l Repor t
board of trustees Chair
Robert W. Winston III
Chancellor
Holden Thorp
director of athletics
Richard A. Baddour
Vice Chancellor for Medical affairs
William L. Roper
internal auditor
Phyllis C. Petree
Vice Chancellor and General Counsel
Leslie Chambers Strohm
equal opportunity/ ada officer
Ann E. Penn
Vice Chancellor for Finance
and administration
Richard L. Mann
executive Vice Chancellor and provost
Bruce W. Carney
Vice Chancellor for research and
economic development
Tony G. Waldrop
Vice Chancellor for student affairs
Winston B. Crisp
Vice Chancellor for Information Technology
Larry D. Conrad
Vice Chancellor for university advancement
Matthew G. Kupec
Vice Chancellor for human resources
Brenda Richardson Malone
June 30, 2010Organization ChartT h e U n i v e r s i T y o f n o r T h C a r o l i n a a t C h a p e l h i l l

fin
an
Cia
l s
eC
Tio
n


T h e U n i v e r s i T y o f n o r T h C a r o l i n a a t C h a p e l h i l l2 2

2 32010 Comprehensive A nnua l Financia l Repor t

T h e U n i v e r s i T y o f n o r T h C a r o l i n a a t C h a p e l h i l l2 4
inTrodUCTion
Management’s Discussion and Analysis provides an overview of the financial position and activities of The University of North Carolina at Chapel Hill (the “University”) for the fiscal year that ended June 30, 2010, with comparative information for the fiscal year ended June 30, 2009. Management has prepared the discus-sion and analysis to be read in conjunction with the financial statements and accompanying notes to the financial statements.
The University is a constituent institution of the multi-campus University of North Carolina System (UNC System), a component unit of the State of North Carolina and an integral part of the State’s Comprehensive Annual Financial Report (CAFR). The financial reporting entity for the financial state-ments is comprised of the University and ten component units. Seven component units are reported as if they were part of the University, and three are reported as discretely presented component units based on the nature and significance of their relationship to the University. The reader may refer to Note 1A for detail information on the financial reporting entity.
finanCial hiGhliGhTs
The University’s financial position at June 30, 2010 continued to be impacted by economic weaknesses as the State’s revenues were below budgeted levels, although the global financial markets recorded gains and experienced a sharper recovery than economies around the world, which are improving at a more modest pace. The University implemented spending reductions and other measures to address shortfalls in resources. The University’s proactive decisions helped mitigate the impacts of the financial shortfalls.
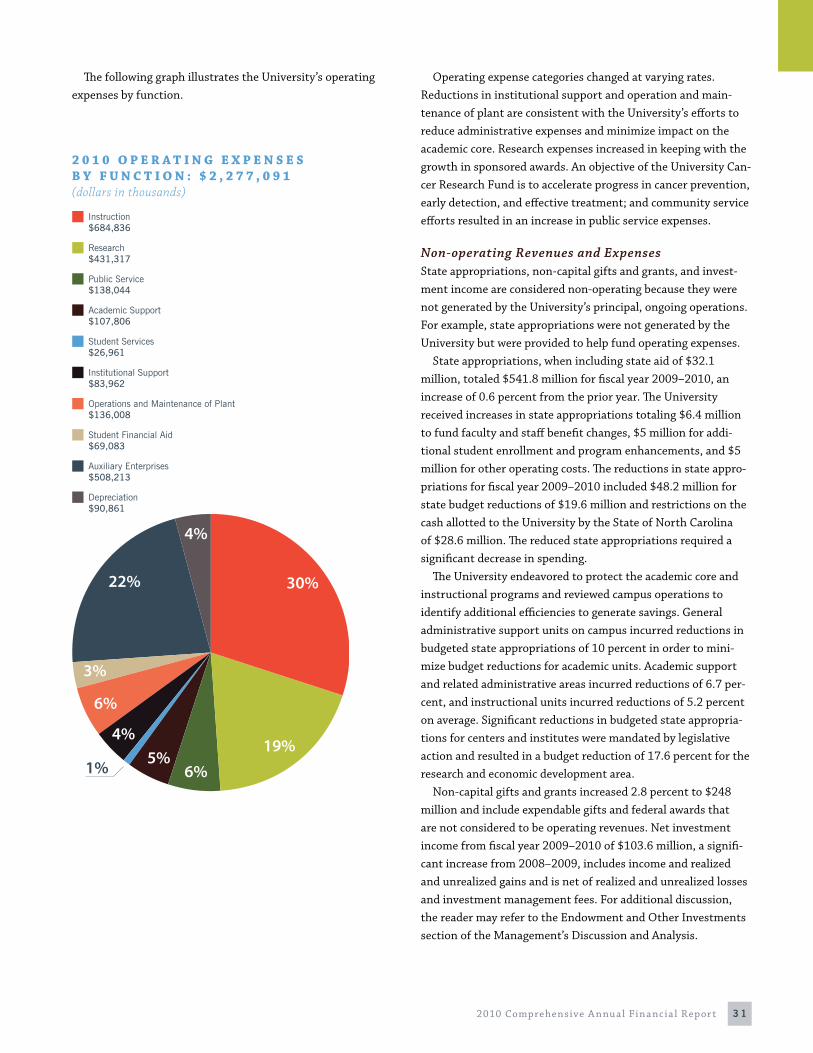
The University’s total assets were $6.5 billion at June 30, 2010. Net assets, which represent the residual interest in the University’s assets after deducting liabilities, were $3.7 billion at June 30, 2010. The University’s net assets increased by $249 million in fiscal year 2009–2010 as a result of operating, non-operating, and other changes in net assets. A comparison of the total assets, liabilities, and net assets at June 30, 2010 and June 30, 2009, and a comparison of the major components of the changes in net assets for the two fiscal years are presented below:
fin
an
Cia
l
s T a T e M e n T o f r e v e n U e s , e X p e n s e s , a n d C h a n G e s i n n e T a s s e T s (dollars in thousands)
s T a T e M e n T o f n e T a s s e T s (dollars in thousands)
0
2,500,000
2,000,000
1,500,000
1,000,000
3,000,000
500,000
(500,000)2009
1,542,275
816,002
167,970
2,277,091
249,156
1,429,487
432,559
115,287
2,224,326
(246,993)
2010
Operating Revenues
Non-operating Revenues, net
Capital Gifts, Grants and Endowments
Operating Expenses
Increase (Decrease) in Net Assets
1,000,000
6,000,000
5,000,000
4,000,000
3,000,000
7,000,000
2,000,000
02009
6,503,485 3,711,598
2,791,887
5,939,362 3,462,442
2,476,920
2010
Total Assets
Net Assets
Total Liabilities
unauditedManagement’s Discussion and AnalysisT h e U n i v e r s i T y o f n o r T h C a r o l i n a a t C h a p e l h i l l

2 52010 Comprehensive A nnua l Financia l Repor t
Net assets increased 7.2 percent at June 30, 2010 over the prior year. Total assets increased 9.5 percent from the prior year and total liabilities rose 12.7 percent for the same period. Operating revenues increased at a greater rate than operating expenses in fiscal year 2009–2010 over the prior year, 7.9 per-cent and 2.4 percent, respectively. Net non-operating revenues and expenses increased 88.6 percent in fiscal year 2009–2010 over the prior year, due primarily to the substantial increase in investment income from ($296.9) million in fiscal year 2008–2009 to $103.6 million in 2009–2010. Research funding, fund raising for operational and capital needs, state appropriations, and tuition and fees continued to provide important resources for the University.
UsinG The finanCial sTaTeMenTs
The financial statements have been prepared in accordance with generally accepted accounting principles as prescribed by the Governmental Accounting Standards Board (GASB), which establishes standards for external financial reporting for public colleges and universities. The financial statements are presented on a consolidated basis to focus on the University as a whole. The full scope of the University’s activities is considered to be a single business-type activity and accordingly, is reported within a single column in the basic financial statements.
The University’s CAFR includes the following three financial statements.
Statement of Net Assets Statement of Revenues, Expenses, and Changes
in Net Assets Statement of Cash Flows
Management’s Discussion and Analysis provides information regarding the Statement of Net Assets and the Statement of Revenues, Expenses, and Changes in Net Assets.
Condensed sTaTeMenT of neT asseTs
The Statement of Net Assets presents the financial position of the University at the end of the fiscal year, includes all assets and liabilities of the University and segregates the assets and liabilities into current and non-current components. Net assets represent the difference between total assets and total liabilities and are one indicator of the University’s current financial condi-tion. The following table summarizes the University’s assets, liabilities, and net assets on June 30, 2010 and June 30, 2009.
Current Assets and LiabilitiesThe Statement of Net Assets shows that working capital, which is current assets less current liabilities, was $915.6 million at June 30, 2010, an increase of 30.1 percent, or $212.1 million, over the previous year. While the working capital increase results from many factors, two significant changes were a decrease of $88.5 million in short-term debt used as bridge financing for capital construction and an increase of $101.1 million in short-term investments. The Statement of Net Assets details the current asset and current liability categories.
Endowment, Restricted and Other Investments Endowment investments increased 3.2 percent during 2009–10 and were $1.19 billion at June 30, 2010 and $1.15 billion at June 30, 2009, and include permanent endowments, funds internally designated as endowments and similar funds such as gift annuities and charitable trusts. Net assets of endowment and similar funds were $1.18 billion at June 30, 2010, and $1.13 billion for the prior year.
The endowment assets are invested with The University of North Carolina at Chapel Hill Foundation Investment Fund, Inc. (“Investment Fund”), which is reported as a governmental exter-nal investment pool in the financial statements. The Investment
a s s e T s , l i a B i l i T i e s , a n d n e T a s s e T s (dollars in thousands)
Assets Current assets $1,253,869 $1,126,655 11.3
Non-current assets Endowment, restricted and other investments 2,268,098 2,058,756 10.2 Capital assets, net 2,782,886 2,530,951 10.0 Other non-current assets 198,632 223,000 (10.9)
Total Assets 6,503,485 5,939,362 9.5
Liabilities Current liabilities 338,285 423,124 (20.1)
Non-current Liabilities Funds held in trust for pool participants 1,071,561 940,560 13.9 Long-term liabilities 1,330,159 1,082,197 22.9 Other non-current liabilities 51,882 31,039 67.2
Total Liabilities 2,791,887 2,476,920 12.7
Net Assets Invested in capital assets, net of related debt 1,420,104 1,338,833 6.1 Restricted 1,513,055 1,423,329 6.3 Unrestricted 778,439 700,280 11.2
Total Net Assets $3,711,598 $3,462,442 7.2
Percent 2010 2009 Change

T h e U n i v e r s i T y o f n o r T h C a r o l i n a a t C h a p e l h i l l2 6
Fund is a 501(c)(3) non-profit corporation established to support the University by operating an investment pool for charitable, non-profit foundations, associations, trusts, endow-ments, and funds that are organized and operated primarily to support the University. It is expected that all or substantially all of the assets of the Investment Fund will be invested in the UNC Investment Fund, LLC (System Fund), which began functioning as a pooled investment fund effective January 1, 2003.
The investment objective is to earn an average real total return of at least 5.5 percent per year, net of all fees, over rolling five- and 10-year periods. The earnings distribution policy is to provide a stable source of spending support that is sustainable over the long term while preserving the purchasing power of the endowment investments. The earnings distribution rate was established at 5 percent of the previous year’s market value, with annual increases based on inflationary factors. Each year’s distribution is subject to a 4 percent floor and a 7 percent cap based on estimated fiscal year-end market value.
Restricted investments of $1.01 billion at June 30, 2010 include funds of affiliated entities that are neither part of the University’s reporting entity nor reported discretely but do invest through the System Fund. Other investments include bond reserves and related funds of $67.5 million.
Most of the University’s endowment investments are currently managed within the System Fund, a pooled investment fund vehicle. The System Fund is designed to provide long term, stable rates of return (Consumer Price Index plus 5.5 percent) on the invested assets through the use of a diversified portfolio strategy.
Fiscal year 2009–10 represented a year of recovery from the period from late 2007 through the spring of 2009 that included the severe banking system and financial crisis and a significant weakening in most economies around the world. As reported by UNC Management Company, Inc., the manager of the System Fund, the investment return on the endowment assets invested in the Fund for fiscal year 2009–10 was 6.8 percent. The respec-tive returns for fiscal years 2008–2009 and 2007–2008 were (19.6) percent and 8.0 percent.
The System Fund’s 6.8 percent return for fiscal year 2009 2010 lagged the 10.9 percent return on the Strategic Investment Policy Portfolio (SIPP) benchmark by 4.1 percentage points. The SIPP is a blended portfolio benchmark that represents a weighted average of the appropriate market benchmarks for the Fund’s strategic asset classes. The 70/30 “traditional” domestic benchmark is comprised of 70 percent invested in the S&P 500 equity index and 30 percent in the Barclay’s Aggregate bond index, and the System Fund lagged the 70/30 index return by 6.5 percentage points in fiscal year 2009–2010.
The investment performance resulted in the System Fund earning a three year annualized return of (2.5) percent at June 30, 2010. This three year return measure compares with the corresponding measure of (1.7) percent for the SIPP and (4.5) percent for the 70/30 benchmark. For the five years ended June 30, 2010, the System Fund earned 6.4 percent annualized return compared to 4.8 percent for the SIPP and the 1.4 percent for the 70/30 benchmark.
A policy for the University Statutory Endowment was approved during fiscal year 2008–2009 to address the provisions of the Uniform Prudent Management of Institutional Funds Act, which was adopted by the State of North Carolina in March 2009. For fiscal year 2009–2010, the market values for 174 of the 1,069 endowments had fallen below book value; and the actual, annual earnings distribution from the University Statu-tory Endowment was subsequently reduced by 8.5 percent, or $4.3 million, from the calculated earnings distribution to avoid any principal invasion.
The policy indicates that campus departments shall examine the endowment-supported activity for the upcoming fiscal year for possible deferment of program expenses, and then pursue alternative funding for essential activities, and finally shall con-sult with donors regarding other funding options for program support. Invasion of endowment principal is an option of last resort and will only be done consistent with approved limita-tions to preserve the endowment principal’s value.
Capital Assets and Debt ManagementAn essential aspect for enhancing and maintaining the Univer-sity’s academic, research, and service programs and its residen-tial life is the development and renewal of its capital assets. The University Board of Trustees approved the campus master plan in March 2001 to guide the University’s physical development in the 21st Century. The master plan and subsequent modifica-tions mesh the critical pieces needed for smart growth in the 21st Century – transportation, parking, housing, utilities, and sustainability – with the program needs of a growing campus. The master plan combines the practical requirements of a research university with the beauty that inspired its founders. The University expects continued growth in the future, includ-ing advancing plans for Carolina North, a satellite campus on property about two miles north of main campus.

2 72010 Comprehensive A nnua l Financia l Repor t
A summary of changes in capital assets is disclosed in Note 6. Capital assets, net of accumulated depreciation, at June 30, 2010 and June 30, 2009, were as follows:
The University maintains a combination of variable and fixed rate debt, consistent with its debt management policy. The interest rate on the commercial paper program for fiscal year 2009–2010 was 0.32 percent and for 2008–2009 was 1.20 percent. Interest rates on the University’s variable rate, long-term bonds were 0.19 percent for fiscal year 2009–2010 and 1.2 percent for fiscal year 2008–2009. Interest rates on fixed rate, long-term bonds are disclosed in Note 9B of the financial statements. These rates reflect direct interest rates and do not reflect any impact from the interest rate swaps as referenced in Note 4.
The University’s debt policy uses two key ratios to measure debt capacity, financial health, and credit quality. The expend-able resources to debt ratio measures unrestricted, expendable restricted, and temporarily restricted net assets to funded debt and serves as a relative indicator of financial health or cushion. The debt service to operations ratio provides an indicator of the University’s ability to repay annual principal and interest relative to its overall operating expenses. Each ratio is compared to the University’s debt policy standard and the appropriate peer group comparison for fiscal year 2008–2009 (the latest available numbers). At June 30, 2010, the expendable resources to debt ratio was 1.4 times, the debt service to operations ratio was 3.3 percent.
The fiscal year 2009–2010 measure for expendable resources to debt of 1.4 times is less than the guideline floor of 1.5 times and reflects a strategic decision by management to finance mission-critical capital projects. Expendable resources to debt is a proxy indicator of financial cushion and is not a direct measurement of the primary source of repayment for debt. The University only debt finances projects for which an associated net revenue source has been identified for repayment of the obligation. The 1.5 times debt policy floor is a guideline, and the University’s expendable resources increased 6.4 percent during fiscal year 2009–2010. Outstanding University debt at June 30, 2010 increased 13.5 percent due to the issuance of general revenue bonds and a promissory note by a University component unit.
The Summary of Ratios, as included in the Statistical Section, includes the actual measures for both of these ratios, as well as other ratios, for the last nine fiscal years. During fiscal year
The University is engaged in a $2.3 billion capital construc-tion program that began in 2000 and will continue through the next few years. The 155 projects in the capital program include major capital renewal of existing buildings and infrastructure to address both deferred maintenance and programmatic needs. The 114 completed projects total $1.3 billion, or 56 percent of the $2.3 billion capital construction program. The 19 projects under construction total $625 million or 27 percent, and the 22 projects under design represent $409 million or 17 percent. Capital funds resulting from North Carolina Higher Education Bonds (HEB) provided essential resources for construction, and the HEB program concluded in February 2010. The University is directly investing in its capital construction program using a variety of other funding sources including general revenue bonds, cost reimbursements from research grants, internal reserves, and private gifts.
The University continues to use its commercial paper program to provide low-cost bridge financing for capital projects until gifts are received or in anticipation of an external bond issue. Commercial paper debt was $59.8 million at June 30, 2010 and $148.3 million at June 30, 2009. The University currently plans to issue a long-term bond during fiscal year 2011–2012 to refund a significant portion of outstanding commercial paper and to provide additional funds for capital projects.
C a p i T a l a s s e T s (dollars in thousands)
Capital Assets Construction in progress $346,226 $614,308 (43.6) Land and other non-depreciable assets 194,064 146,428 32.5 Buildings 1,605,894 1,425,456 12.7 General infrastructure 470,698 207,171 127.2 Machinery and equipment 166,004 137,588 20.7
Total $2,782,886 $2,530,951 10.0
Percent 2010 2009 Change

T h e U n i v e r s i T y o f n o r T h C a r o l i n a a t C h a p e l h i l l2 8
2009–2010, Moody’s Investor Services recalibrated its rating scale for public finance resulting in a recalibration of the Uni-versity’s long-term bond rating to Aaa from Aa1. The University continues to maintain its long-term bond ratings of AA+/AA+ from Standard & Poor’s, and Fitch Ratings, respectively.
are not discretely presented, but the entities do invest through the System Fund. The increase in funds held in trust of 13.9 percent over the prior year resulted from additional participant contributions, new participants in the System Fund, and net investment gains.
Net AssetsNet assets represent the value of the University’s assets after liabilities are deducted. The University’s net assets were $3.7 billion at June 30, 2010, an increase of $249.2 million over the prior year. Net assets invested in capital assets, net of related debt, represents the University’s total investment in capital assets, net of outstanding debt obligations related to those capital assets. To the extent debt has been incurred but not yet expended for capital assets, such amounts are not included. Non-expendable restricted net assets include endowment and similar assets whose use is limited by donors or other outside sources and as a condition of the gift, the principal is to be maintained in perpetuity. Expendable restricted net assets include resources in which the University is legally obligated to spend the resources in accordance with restrictions provided by external parties. Unrestricted net assets are not subject to exter-nally imposed stipulations; however, most of these resources have been designated for particular academic, research, or other programs, as well as capital projects.
Times
0.0
2.5
2.0
1.5
1.0
3.0
0.5
2010 2009 2008 University Debt Policy
(Minimum)
Moody’s Public
Universities Aaa, 2009
1.4
2.0
1.5
1.9
1.5
e X p e n d a B l e r e s o U r C e s T o d e B T
Percent
0.0
3.5
2.5
1.5
1.0
4.5
4.0
3.0
2.0
0.5
2010 2009 2008 University Debt Policy
(Maximum)
Moody’s Public
Universities Aaa, 2009
3.5
4.0
3.33.33.3
d e B T s e r v i C e T o o p e r a T i o n s
Other Non-current Assets and LiabilitiesOther non-current assets were $198.6 million at June 30, 2010 and $223 million at June 30, 2009, a 10.9 percent decrease. Non-current liabilities were $2.5 billion at June 30, 2010 and $2.1 billion at June 30, 2009, and include funds held in trust for the University’s affiliated foundations and other campuses in the UNC System and their affiliates of $1.1 billion and $940.6 million, respectively. These entities are not part of the University’s financial reporting entity and
2 0 1 0 n e T a s s e T s : $ 3 , 7 1 1 , 5 9 8 (dollars in thousands)
Unrestricted$778,439
Restricted Expendable$891,182
Investment in Capital Assets, net of related debt$1,420,104
Restricted Non-expendable$621,873
21%
38%
17%
24%

2 92010 Comprehensive A nnua l Financia l Repor t
Operating RevenuesThe operating revenues represent resources generated by the University in fulfilling its instruction, research, and public service missions. Student tuition and fees are reported net of the scholarship discount, which was $68.7 million for fiscal year 2009–2010 and $63.5 million for the prior year. Net revenues from student tuition and fees increased 5.1 percent over the prior year. Tuition rates increased for fiscal year 2009–2010 by 4.3 percent for undergraduate residents, 5.6 percent for undergraduate non-residents, 8 percent for graduate residents, and 2.1 percent for graduate non-residents.
Revenues from non-capital grants and contracts increased 10.6 percent over the prior year when operating and non-oper-ating sources are combined. Discussion of grants and contracts in terms of awards provides another useful perspective. The University is among the nation’s leading public research uni-versities, with a diversified portfolio of research that attracted $803 million in sponsored program funding during fiscal year 2009–2010, the largest amount in campus history and a 12.2 percent increase over the $716 million received last fiscal year. The contracts and grants come primarily from the federal gov-ernment, especially the National Institutes of Health (NIH) and the National Science Foundation. The NIH is traditionally the University’s largest source of research funding.
In many cases, researchers from multiple University schools, departments and units collaborate on research grants, contracts and studies. That approach reflects the University’s emphasis on interdisciplinary teaching and scholarship between and among the health, natural and social sciences, as well as the liberal arts and the humanities.
Sales and services include the revenues of campus auxiliary operations such as student housing, student stores, student health services, the utilities system, and parking and transpor-tation, as well as revenues from patient services provided by the professional health-care clinics. Other revenues represent operating resources not separately identified and include, for example, an assessment to the Investment Fund to support University administrative services.
Condensed sTaTeMenT of revenUes, eXpenses, and ChanGes in neT asseTs
The Statements of Revenues, Expenses, and Changes in Net Assets present the University’s results of operations. The state-ments for the fiscal year ended June 30, 2010 and the prior year are summarized as follows:
U n i v e r s i T y o p e r a T i o n s (dollars in thousands)
Operating Revenues Student tuition and fees, net $249,083 $236,960 5.1 Grants and contracts 688,721 624,420 10.3 Sales and services, net 597,196 559,471 6.7 Other 7,275 8,636 (15.8)
Total Operating Revenues 1,542,275 1,429,487 7.9
Operating Expenses 2,277,091 2,224,326 2.4
Operating Loss (734,816) (794,839) (7.6)
Non-operating Revenues (Expenses) State appropriations and state aid 541,753 538,327 0.6 Non-capital gifts and grants 247,994 241,242 2.8 Investment income (loss) 103,605 (296,904) 134.9 Interest and fees on debt (64,261) (52,465) 22.5 Federal interest subsidy on debt 1,130 N/A Other net non-operating revenues (14,219) 2,359 (702.8)
Income Before Other Changes 81,186 (362,280) 122.4
Refund of prior years capital appropriations (444) (3,317) (86.6) Capital grants and appropriations 86,117 39,663 117.7 Capital gifts 50,688 34,686 46.1 Additions to permanent endowments 31,609 44,255 (28.6)
Increase (Decrease) in Net Assets 249,156 (246,993) 200.9
Net Assets – July 1 3,462,442 3,709,435 (6.7)
Net Assets – June 30 $3,711,598 $3,462,442 7.2
Percent 2010 2009 Change
Fiscal year 2009–2010 revenues and other changes total $2,605,171 and expenses total $2,356,015. Fiscal year 2008–2009 revenues and other changes total $2,330,019 and expenses total $2,577,012.

T h e U n i v e r s i T y o f n o r T h C a r o l i n a a t C h a p e l h i l l3 0
The following graph illustrates the University’s operating expenses by the natural classification.
Operating ExpensesThe University’s operating expenses were $2.3 billion for the fiscal year ended June 30, 2010, an increase of 2.4 percent over the prior year. The operating expenses are reported by natural classification in the financial statements and by functional classification in the notes to the financial statements (Note 12). The following table illustrates the University’s operating expenses by functional classification and by natural classification.
o p e r a T i n G e X p e n s e s B y n a T U r e (dollars in thousands)
Salaries and benefits $1,340,749 $1,309,862 2.4 Supplies and materials 156,404 174,501 (10.4) Services 538,784 533,023 1.1 Scholarships and fellowships 69,083 58,557 18.0 Utilities 81,210 77,636 4.6 Depreciation 90,861 70,747 28.4
Total Operating Expenses $2,277,091 $2,224,326 2.4
Percent 2010 2009 Change
o p e r a T i n G e X p e n s e s B y f U n C T i o n (dollars in thousands)
Instruction $684,836 $674,942 1.5 Research 431,317 398,754 8.2 Public service 138,044 126,427 9.2 Academic support 107,806 107,371 0.4 Student services 26,961 27,967 (3.6) Institutional support 83,962 89,954 (6.7) Operations and maintenance of plant 136,008 145,550 (6.6) Student financial aid 69,083 58,557 18.0 Auxiliary enterprises 508,213 524,057 (3.0) Depreciation 90,861 70,747 28.4
Total Operating Expenses $2,277,091 $2,224,326 2.4
Percent 2010 2009 Change
2 0 1 0 o p e r a T i n G e X p e n s e s B y n a T U r e : $ 2 , 2 7 7 , 0 9 1 (dollars in thousands)
Scholarships and Fellowships$69,083
Services$538,784
Salaries and Benefits$1,340,749
Supplies and Materials$156,404
3%4% 4%
58%
7%
24%
Depreciation$90,861
Utilities$81,210
3 12010 Comprehensive A nnua l Financia l Repor t
The following graph illustrates the University’s operating expenses by function.
Operating expense categories changed at varying rates. Reductions in institutional support and operation and main-tenance of plant are consistent with the University’s efforts to reduce administrative expenses and minimize impact on the academic core. Research expenses increased in keeping with the growth in sponsored awards. An objective of the University Can-cer Research Fund is to accelerate progress in cancer prevention, early detection, and effective treatment; and community service efforts resulted in an increase in public service expenses.
Non-operating Revenues and ExpensesState appropriations, non-capital gifts and grants, and invest-ment income are considered non-operating because they were not generated by the University’s principal, ongoing operations. For example, state appropriations were not generated by the University but were provided to help fund operating expenses.
State appropriations, when including state aid of $32.1 million, totaled $541.8 million for fiscal year 2009–2010, an increase of 0.6 percent from the prior year. The University received increases in state appropriations totaling $6.4 million to fund faculty and staff benefit changes, $5 million for addi-tional student enrollment and program enhancements, and $5 million for other operating costs. The reductions in state appro-priations for fiscal year 2009–2010 included $48.2 million for state budget reductions of $19.6 million and restrictions on the cash allotted to the University by the State of North Carolina of $28.6 million. The reduced state appropriations required a significant decrease in spending.
The University endeavored to protect the academic core and instructional programs and reviewed campus operations to identify additional efficiencies to generate savings. General administrative support units on campus incurred reductions in budgeted state appropriations of 10 percent in order to mini-mize budget reductions for academic units. Academic support and related administrative areas incurred reductions of 6.7 per-cent, and instructional units incurred reductions of 5.2 percent on average. Significant reductions in budgeted state appropria-tions for centers and institutes were mandated by legislative action and resulted in a budget reduction of 17.6 percent for the research and economic development area.
Non-capital gifts and grants increased 2.8 percent to $248 million and include expendable gifts and federal awards that are not considered to be operating revenues. Net investment income from fiscal year 2009–2010 of $103.6 million, a signifi-cant increase from 2008–2009, includes income and realized and unrealized gains and is net of realized and unrealized losses and investment management fees. For additional discussion, the reader may refer to the Endowment and Other Investments section of the Management’s Discussion and Analysis.
2 0 1 0 o p e r a T i n G e X p e n s e s B y f U n C T i o n : $ 2 , 2 7 7 , 0 9 1 (dollars in thousands)
Academic Support$107,806
Public Service$138,044
Instruction$684,836
Research$431,317
4%
30%
19%
6%1% 5%4%
6%
3%
22%
Institutional Support$83,962
Student Services$26,961
Student Financial Aid$69,083
Operations and Maintenance of Plant$136,008
Depreciation$90,861
Auxiliary Enterprises$508,213

T h e U n i v e r s i T y o f n o r T h C a r o l i n a a t C h a p e l h i l l3 2
Other Changes in Net AssetsCapital grants and appropriations of $85.7 million for fiscal year 2009–2010 and $36.3 million for fiscal year 2008–2009 are from statewide higher education bond proceeds and state appro-priations for capital construction projects. Capital gifts of $50.7 million for fiscal year 2009–2010 and $34.7 million for the prior year resulted from fund-raising efforts and also provided funding for construction projects. Non-expendable gifts and funds from the state’s program to match gifts for distinguished professorship endowments resulted in additions to permanent endowments of $31.6 million during fiscal year 2009–2010 and $44.3 million during fiscal year 2008–2009.
eConoMiC oUTlooK
The economic downturn that impacted fiscal year 2009–2010 will also impact University resources for fiscal year 2010–2011. The University’s fiscal state improved during fiscal year 2009–2010 when compared to the prior year, and its overall financial condition remained solid. The University will continue to main-tain and generate sufficient resources to successfully fulfill its teaching, research, and service missions. Decisions to curtail or eliminate administrative expenses have consistently protected the academic core from significant resource limitations.
The University maintains low tuition levels in relative terms that provide important resources. Support from the state was impacted due to the economic downturn, but in relative terms higher education in North Carolina is soundly funded. Spon-sored awards are a proven and reliable source in support of the University’s research mission, philanthropic efforts continue to demonstrate success in a challenging environment, and invested funds provide an important distribution of earnings and rebounded from previous declines in the global financial mar-kets. The University’s strong debt credit ratings of Aaa and AA+ allow it to obtain competitive financing for capital construction.
Tuition rates increased for fiscal year 2010–2011 by 24.6 per-cent for undergraduate residents, 7.7 percent for undergraduate non-residents, 17.6 percent for graduate residents, and 6.5 percent for graduate non-residents. The University’s academic standing allows it to continuously attract top students. For the first-class enrolling for the Fall 2010 semester, 76.1 percent graduated in the top 10 percent of their class. The University’s CAFR Statistical Section includes historical data for important metrics including the ratio of accepted applications as a percentage of total applications and the ratio of enrolled students as a percent-age of accepted applications.
Total Operating and Non-operating RevenuesOperating and non-operating revenues such as state appropria-tions, non-capital grants, non-capital gifts, and investment income are used to fund University operations. The following chart illustrates the University’s operating and non-operating revenues, which total $2.4 billion for fiscal year 2009–2010.
2 0 1 0 T o T a l r e v e n U e s B y s o U r C e : $ 2 , 4 3 6 , 7 5 7 (dollars in thousands)
State and Local Grants and Contracts$37,679
Federal Grants and Contracts$530,368
Non-operating Revenues$894,482
Student Tuition and Fees, net$249,083
15%
36%
10%
0%
22%
2% 5% 10%
Patient Services, net$242,757
Nongovernmental Grants$120,674
State Appropriations & State Aid$541,753
Noncapital Grants$172,113
Noncapital Gifts, net$75,881
Investment Income (net of Investment Expense)$103,605
Federal Interest Subsidy on Debt$1,130 (0%)
Sales and Services, net$354,439
Interest Earnings on Loans$790 (0%)
Other Operating Revenues$6,485 (0%)
4%
3%
7%
22%

3 32010 Comprehensive A nnua l Financia l Repor t
The University has benefited from the historically strong support that public higher education receives from the Gover-nor and General Assembly. On a relative basis and considering the economic climate, there were positive aspects in the state appropriations budget for fiscal year 2010–2011. Funding com-mitments for need-based financial aid, for growth in student enrollment, and for operating costs for many new buildings were important aspects of the state appropriations budget. Authorized tuition increases helped offset reductions in state appropriations that would have necessitated offering fewer classes, increasing class sizes, and reducing library and other academic support services.
Despite the economic challenges, the projected funding level for state appropriations for fiscal year 2010–2011 totals $552.1 million, which represents an increase of 1.9 percent over fiscal year 2009–2010 actual state appropriations. This projected level of state appropriations funding includes a $21.7 million reduc-tion, the impact of which was mitigated by a specified tuition increase generating $15.9 million. Projected state appropria-tions also include $7.3 million for additional student enrollment and program enhancements and are net of $5.3 million held in reserve as cautionary action given the current economic environment. Additional reductions in state appropriations have not been identified, but the economic situation of the State continues to be monitored. There were no state appropriations provided for pay increases for fiscal year 2010–2011.
External awarded funding from contracts and grants increased to $803 million during fiscal year 2009–2010, the largest amount in campus history. The awarded amount of $126 million came from the American Recovery and Reinvestment Act (ARRA), also known as the stimulus bill. A total of 308 University projects were selected for ARRA funding, increas-ing to 319 the total number of ARRA-funded projects selected between the start of the federal initiative in February 2009 and the end of fiscal year 2009–2010. ARRA funding supports new and ongoing research at the University to help improve the state and national economies by creating jobs in addition to expanding our knowledge about diseases, human health and the environment.
The University’s investment management operation is separately organized as the UNC Management Company, Inc. (UNCMC), the non-profit corporation organized and operated as a 501(c)(3) entity, to provide investment management services and administrative services to the University and to the other campuses of the UNC System and their affiliated non-profit foundations as appropriate. This structure provides the ability to attract and retain investment professionals and increase the pool of funds and resulting investment returns. As of June 30,
2010, the UNCMC managed invested assets of $2.5 billion.Although the course the financial markets will take this
fiscal year and beyond is not known, UNCMC will manage the funds in a highly diversified manner to capture a fair share of the upside in asset classes that are strengthening while, more importantly, providing downside protection in periods of declin-ing markets. The focus remains on the core mission of identify-ing the most attractive intermediate-to-long-term investment opportunities while also remaining highly aware of the elevated risks in the current financial environment.
Fund-raising has been a cornerstone resource for the Univer-sity, and in a down economy becomes even more vital. The Uni-versity’s fund-raising efforts brought in $268.1 million in gifts in fiscal year 2009–2010. The University secured $292 million in commitments, which includes pledges as well as gifts, in fiscal year. The commitments total was up from the prior fiscal year total of $290.4 million. Commitments in 2009–2010 helped the University create 17 endowed professorships, as well as a total of 98 undergraduate scholarships and graduate fellowships. The University had more than 73,500 donors for the fiscal year.
The University will continue to provide excellent teaching, research, and public service endeavors for students, citizens, and other constituents. Management has taken action to restructure and reduce the operating budget while protecting the academic foundation. Carolina Counts is a program initi-ated by the Chancellor to carry out key recommendations from a significant review of the campus operating structure and to address ways to make the University more efficient.
The mission of the Carolina Counts initiative is to make The University of North Carolina at Chapel Hill the most collabora-tive, well-managed university in the country. The objectives of the initiative are to streamline campus operations and provide more funding for academics and University’s core missions; to implement simpler, more responsive systems and processes that enable informed decision-making while complying with policies and laws; and to reduce bureaucracy and create a more satisfying work environment for faculty and staff.
The University remains committed to sound financial and budgetary planning, protection and enhancement of its endowed and physical assets, as well as its observance of compliance and control standards.
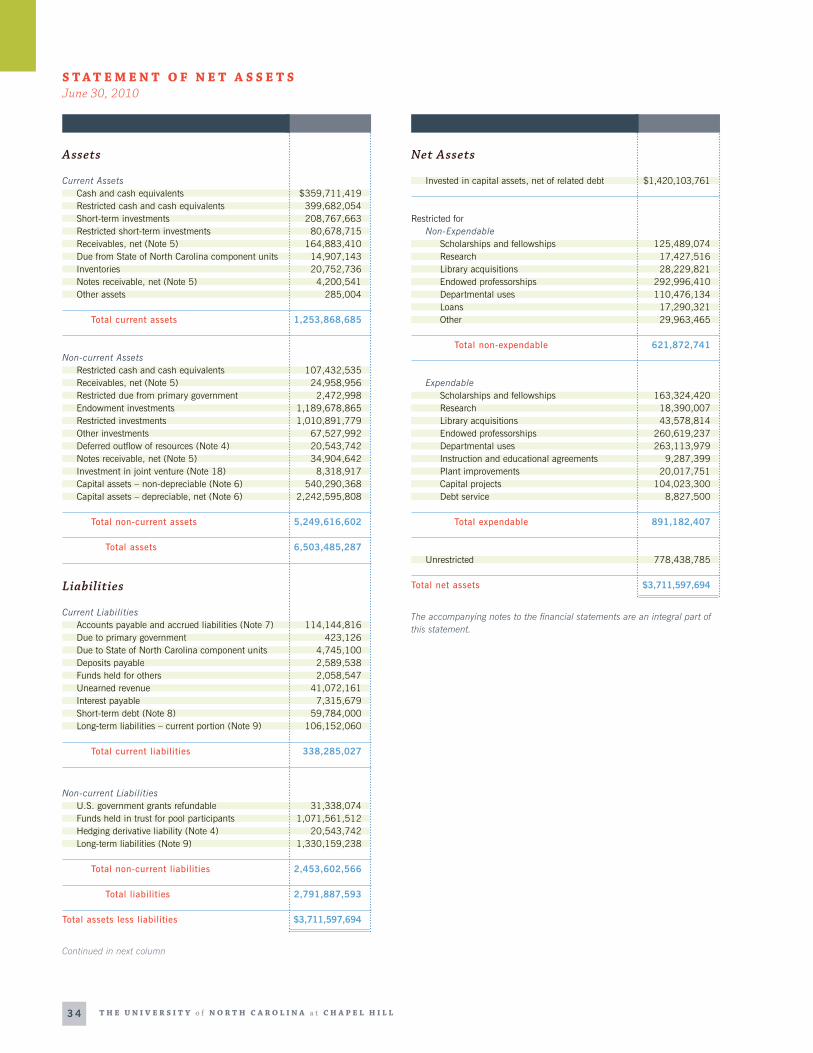
T h e U n i v e r s i T y o f n o r T h C a r o l i n a a t C h a p e l h i l l3 4
Assets
Current Assets Cash and cash equivalents $359,711,419 Restricted cash and cash equivalents 399,682,054 Short-term investments 208,767,663 Restricted short-term investments 80,678,715 Receivables, net (Note 5) 164,883,410 Due from State of North Carolina component units 14,907,143 Inventories 20,752,736 Notes receivable, net (Note 5) 4,200,541 Other assets 285,004
Total current assets 1,253,868,685
Non-current Assets Restricted cash and cash equivalents 107,432,535 Receivables, net (Note 5) 24,958,956 Restricted due from primary government 2,472,998 Endowment investments 1,189,678,865 Restricted investments 1,010,891,779 Other investments 67,527,992 Deferred outflow of resources (Note 4) 20,543,742 Notes receivable, net (Note 5) 34,904,642 Investment in joint venture (Note 18) 8,318,917 Capital assets – non-depreciable (Note 6) 540,290,368 Capital assets – depreciable, net (Note 6) 2,242,595,808
Total non-current assets 5,249,616,602
Total assets 6,503,485,287
Liabilities
Current Liabilities Accounts payable and accrued liabilities (Note 7) 114,144,816 Due to primary government 423,126 Due to State of North Carolina component units 4,745,100 Deposits payable 2,589,538 Funds held for others 2,058,547 Unearned revenue 41,072,161 Interest payable 7,315,679 Short-term debt (Note 8) 59,784,000 Long-term liabilities – current portion (Note 9) 106,152,060
Total current liabilities 338,285,027
Non-current Liabilities U.S. government grants refundable 31,338,074 Funds held in trust for pool participants 1,071,561,512 Hedging derivative liability (Note 4) 20,543,742 Long-term liabilities (Note 9) 1,330,159,238
Total non-current liabilities 2,453,602,566
Total liabilities 2,791,887,593
Total assets less liabilities $3,711,597,694
Net Assets
Invested in capital assets, net of related debt $1,420,103,761
Restricted for Non-Expendable Scholarships and fellowships 125,489,074 Research 17,427,516 Library acquisitions 28,229,821 Endowed professorships 292,996,410 Departmental uses 110,476,134 Loans 17,290,321 Other 29,963,465
Total non-expendable 621,872,741
Expendable Scholarships and fellowships 163,324,420 Research 18,390,007 Library acquisitions 43,578,814 Endowed professorships 260,619,237 Departmental uses 263,113,979 Instruction and educational agreements 9,287,399 Plant improvements 20,017,751 Capital projects 104,023,300 Debt service 8,827,500
Total expendable 891,182,407
Unrestricted 778,438,785
Total net assets $3,711,597,694
s T a T e M e n T o f n e T a s s e T s June 30, 2010
The accompanying notes to the financial statements are an integral part of this statement.
Continued in next column

3 52010 Comprehensive A nnua l Financia l Repor t
Revenues
Operating Revenues Student tuition and fees, net (Note 11) $249,082,638 Patient services, net (Note 11) 242,757,083 Federal grants and contracts 530,368,427 State and local grants and contracts 37,678,761 Non-governmental grants and contracts 120,673,852 Sales and services, net (Note 11) 354,438,534 Interest earnings on loans 790,880 Other operating revenues 6,484,862
Total operating revenues 1,542,275,037
Expenses
Operating Expenses Salaries and benefits 1,340,748,680 Supplies and materials 156,404,438 Services 538,783,972 Scholarships and fellowships 69,082,962 Utilities 81,210,113 Depreciation 90,860,983
Total operating expenses 2,277,091,148
Operating loss (734,816,111)
Non-Operating Revenues (Expenses)
State appropriations 509,690,868 State aid – federal recovery funds 32,062,595 Non-capital grants – student financial aid 17,098,881 Other non-capital grants 155,013,464 Non-capital gifts, net (Note 11) 75,881,170 Investment income (net of investment expense of $4,233,708) 103,605,476 Interest and fees on debt (64,261,203) Federal interest subsidy on debt 1,130,168 Other non-operating expenses (14,218,891)
Net non-operating revenues 816,002,528
Income before other revenues, expenses, gains, or losses 81,186,417
Refund of prior years capital appropriations (443,816) Capital grants 86,116,493 Capital gifts 50,688,450 Additions to endowments 31,608,582
Increase in net assets 249,156,126
Net Assets
Net assets – July 1, 2009 3,462,441,568
Net assets – June 30, 2010 $3,711,597,694
s T a T e M e n T o f r e v e n U e s , e X p e n s e s , a n d C h a n G e s i n n e T a s s e T s For the Fiscal Year Ended June 30, 2010
The accompanying notes to the financial statements are an integral part of this statement.

T h e U n i v e r s i T y o f n o r T h C a r o l i n a a t C h a p e l h i l l3 6
Cash Flows from Operating Activities
Received from customers $1,561,263,167 Payments to employees and fringe benefits (1,336,405,091) Payments to vendors and suppliers (773,468,112) Payments for scholarships and fellowships (69,082,962) Loans issued (5,544,386) Collection of loans 4,454,376 Interest earned on loans 708,418 Other payments (8,345,386)
Net cash used by operating activities (626,419,976)
Cash Flows from Non-Capital Financing Activities
State appropriations 509,690,868 State aid – federal recovery funds 32,062,595 Non-capital grants – student financial aid 16,819,264 Other non-capital grants 128,188,888 Non-capital gifts 83,565,747 Additions to endowments 31,608,582 William D. Ford direct lending receipts 110,950,873 William D. Ford direct lending disbursements (110,705,380) Related activity agency receipts 405,734,936 Related activity agency disbursements (294,845,117)
Net cash provided by non-capital financing activities 913,071,256
Cash Flows from Capital Financing and Related Financing Activities
Proceeds from capital debt 298,801,728 Refund of prior years capital appropriations (443,816) Capital grants 90,317,386 Capital gifts 14,469,264 Acquisition and construction of capital assets (309,290,825) Principal paid on capital debt and leases (156,161,848) Interest and fees paid on capital debt and leases (53,180,058) Federal interest subsidy on debt received 1,130,168
Net cash used by capital financing and related financing activities (114,358,001)
Cash Flows from Investing Activities
Proceeds from sales and maturities of investments 2,061,160,614 Investment income 61,553,471 Purchase of investments and related fees (2,289,519,217)
Net cash used by investing activities (166,805,132)
Net increase in cash and cash equivalents 5,488,147
Cash and cash equivalents – July 1, 2009 861,337,861
Cash and cash equivalents – June 30, 2010 $866,826,008
s T a T e M e n T o f C a s h f l o W s For the Fiscal Year Ended June 30, 2010
Continued on next page

3 72010 Comprehensive A nnua l Financia l Repor t
Reconciliation of Net Operating Revenues (Expenses) to Net Cash Used by Operating Activities
Operating loss ($734,816,111)
Adjustments to reconcile operating loss to net cash used by operating activities Depreciation expense 90,860,983 Allowances, write-offs, and amortizations 5,943,921
Changes in assets and liabilities: Receivables, net 9,752,583 Inventories 2,228,131 Notes receivable, net (1,080,995) Other assets (91,089) Accounts payable and accrued liabilities 5,285,458 Due to primary government (3,486,800) U.S. government grants refundable 299,006 Unearned revenue 1,290,558 Compensated absences (2,605,621)
Net cash used by operating activities ($626,419,976)
Non-Cash Investing, Capital, and Financing Activities
Assets acquired through a gift $36,219,186 Assets acquired through the assumption of a capital lease $3,421,701 Change in fair value of investments $45,110,690 Loss on disposal of capital assets ($6,135,758)
Reconciliation of Cash and Cash Equivalents
Current assets Cash and cash equivalents $359,711,419 Restricted cash and cash equivalents 399,682,054
Non-current assets Restricted cash and cash equivalents 107,432,535
Total cash and cash equivalents – June 30, 2010 $866,826,008
The accompanying notes to the financial statements are an integral part of this statement.

T h e U n i v e r s i T y o f n o r T h C a r o l i n a a t C h a p e l h i l l3 8
s T a T e M e n T o f f i n a n C i a l p o s i T i o n June 30, 2010
The accompanying notes to the financial statements are an integral part of this statement.
Assets
Current Assets Cash and cash equivalents $8,753,487 $9,887,025 $52,736,243 Investments 154,543,744 67,668,547 Unconditional promises to give, net 9,518,364 5,656,452 2,379,407 Contributions receivable from split-interest agreements 2,602,232 Accounts receivable 50,600 Funds held in trust 1,242,136 Interest receivable 30,826 Prepaid expenses 39,403 Miscellaneous receivables 269,437
Total current assets 19,564,587 172,689,453 123,123,863
Property and equipment Building 555,729 Furniture and equipment 595,729 436,902 Leasehold interest – building 3,750,483 Vehicle 26,422 Allowance for depreciation (791,787) (415,913)
Total property and equipment 3,580,847 576,718
Other assets Investments 117,089,982 66,057,983 Unconditional promises to give, net 6,110,050 4,772,549 Restricted cash 5,232,263 3,608,984 Split-interest agreements 1,541,500 2,943,822 Restricted investments 398,396 Cash surrender value of life insurance 1,937,749 230,757
Total other assets 129,973,795 1,937,749 78,012,491
Total non-current assets 133,554,642 1,937,749 78,589,209
Total assets $153,119,229 $174,627,202 $201,713,072
Liabilities and Net Assets
Current liabilites Accounts payable $12,711 $212,325 Annuities payable $95,815 Accrued expenses 169,174 922,597
Total current liabilities 181,885 95,815 1,134,922
Long-term debt 850,000
Total liabilities 1,031,885 95,815 1,134,922
Net assets Unrestricted 18,139,378 8,403,274 Temporarily restricted 54,935,550 71,002,472 119,249,193 Permanently restricted 79,012,416 103,528,915 72,925,683
Total net assets 152,087,344 174,531,387 200,578,150
Total liabilities and net assets $153,119,229 $174,627,202 $201,713,072
The Educational The Medical UNC–CH Arts Foundation Foundation and Sciences Scholarship of North Foundation, Inc. Endowment Trust Carolina, Inc.C o M p o n e n T U n i T s
3 92010 Comprehensive A nnua l Financia l Repor t
s T a T e M e n T o f a C T i v i T i e s a n d C h a n G e s i n n e T a s s e T s For the Fiscal Year Ended June 30, 2010
The accompanying notes to the financial statements are an integral part of this statement.
Support and Revenue
Support Contributions $8,389,243 $1,663,313 $12,246,756 Development assessment fee 2,202,627 Change in value of split-interest agreements 83,900 (385,179) Donated facilities 82,675 Actuarial adjustment of annuities payable (692) Endowment investment return designated for current operations 8,733,309
Total support 10,758,445 10,395,930 11,861,577
Revenue Interest and dividend income 1,842,716 Net unrealized and realized gains on investments 6,897,861 11,680,214 Investment income 993,898 Other income 41,956 1,363,938
Total revenue 7,933,715 14,886,868
Total support and revenue 18,692,160 10,395,930 26,748,445
Expenses
Program services Grants 8,276,740 15,998,024 Scholarship expense distribution 8,724,663 Annuity payments 8,646 Other expenses 515,838
Total program services 8,276,740 9,249,147 15,998,024
Supporting services Fundraising expenses 2,435,560 1,266,366 Management and general 963,122 1,467,430
Total supporting services 3,398,682 2,733,796
Total expenses 11,675,422 9,249,147 18,731,820
Lease guarantee 653,093 Loss from bad debt 934,153 225,331
Total expenses, lease guarantee, and bad debt 12,609,575 9,249,147 19,610,244
Changes in Nets Assets from Operations 6,082,585 1,146,783 7,138,201
Other Changes
Investment return in excess of amounts designated for current operations 944,575
Changes in Net Assets
Unrestricted 3,406,496 (1,856,657) Temporarily restricted 625,658 943,883 7,519,448 Permanently restricted 2,050,431 1,147,475 1,475,410
Total changes in net assets 6,082,585 2,091,358 7,138,201
Net Assets – Beginning of Year 146,004,759 172,440,029 193,439,949
Net Assets – End of Year $152,087,344 $174,531,387 $200,578,150
The Educational The Medical UNC–CH Arts Foundation Foundation and Sciences Scholarship of North Foundation, Inc. Endowment Trust Carolina, Inc.C o M p o n e n T U n i T s

T h e U n i v e r s i T y o f n o r T h C a r o l i n a a t C h a p e l h i l l4 0
fin
an
Cia
lf
ina
nC
ial
Table of Contents
4 1 noTe 1 Sig nif icant Accounting Pol ic ies
A | Financial Reporting Entity
B | Basis of Presentation
C | Basis of Accounting
D | Cash and Cash Equivalents
E | Investments
F | Receivables
G | Inventories
H | Capital Assets
I | Restricted Assets
J | Funds Held in Trust for Pool Participants
K | Funds Held in Trust by Others
L | Non-current Long-term Liabilities
M | Compensated Absences
N | Net Assets
O | Scholarship Discounts
P | Revenue and Expense Recognition
Q | Internal Sales Activities
4 6 noTe 2 Deposits and Investments
A | Deposits
B | Investments
5 4 noTe 3 Endow ment Investments
5 5 noTe 4 Der ivat ive Instr uments
5 7 noTe 5 Receivables
5 8 noTe 6 Capita l A ssets
5 9 noTe 7 Accounts Payable and
Accr ued Liabi l it ies
5 9 noTe 8 Shor t-ter m Debt
6 0 noTe 9 Long-ter m Liabi l it ies
A | Changes in Long-term Liabilities
B | Bonds Payable
C | Demand Bonds
D | Capital Appreciation Bonds
E | Annual Requirements
F | Bond Defeasance
G | Notes Payable
H | Annuities Payable
6 4 noTe 10 Lease Obl igat ions
A | Capital Lease Obligations
B | Operating Lease Obligations
C | Other Lease Obligations
6 5 noTe 11 Revenues
6 6 noTe 12 Operat ing Ex penses by Funct ion
6 6 noTe 13 Pension Plans
A | Retirement Plans
B | Deferred Compensation and
Supplemental Retirement Income Plans
6 7 noTe 14 Other Postemploy ment Benef its
A | Health Benefits
B | Disability Income
6 8 noTe 15 R isk Management
7 0 noTe 16 Commitments and Contingencies
A | Commitments
B | Pending Litigation and Claims
C | Other Contingent Receivables
7 1 noTe 17 Related Par t ies
7 1 noTe 18 Investment in Joint Venture
7 1 noTe 19 Changes in Financia l Accounting
and Repor t ing
7 1 noTe 20 Subsequent Events
June 30, 2010Notes to the Financial StatementsT h e U n i v e r s i T y o f n o r T h C a r o l i n a a t C h a p e l h i l l

4 12010 Comprehensive A nnua l Financia l Repor t
A | Financial Reporting Entity
The concept underlying the definition of the financial reporting entity is that elected officials are accountable to their constitu-ents for their actions. As required by accounting principles generally accepted in the United States of America (GAAP), the financial reporting entity includes both the primary government and all of its component units. An organization other than a primary government serves as a nucleus for a reporting entity when it issues separate financial statements. The University of North Carolina at Chapel Hill (University) is a constituent institution of the multi-campus University of North Carolina System, which is a component unit of the State of North Caro-lina and an integral part of the State’s Comprehensive Annual Financial Report.
The accompanying financial statements present all funds belonging to the University and its component units. While the Board of Governors of the University of North Carolina System has ultimate responsibility, the chancellor, the Board of Trustees, and the Board of Trustees of the Endowment Fund have delegated responsibilities for financial accountability of the University’s funds. The University’s component units are either blended or discretely presented in the University’s financial statements. The blended component units, although legally separate, are, in substance, part of the University’s operations and therefore, are reported as if they were part of the Univer-sity. Discretely presented component units’ financial data are reported in separate financial statements because of their use of different GAAP reporting models and to emphasize their legal separateness.
Blended Component Units – Although legally separate, The University of North Carolina at Chapel Hill Foundation Invest-ment Fund, Inc. (Investment Fund), UNC Investment Fund, LLC (System Fund), UNC Management Company, Inc. (Management Company), The University of North Carolina at Chapel Hill Foundation, Inc. (UNC-Chapel Hill Foundation), The Kenan-Flagler Business School Foundation (Business School Founda-tion), U.N.C. Law Foundation, Inc. (Law Foundation), and The University of North Carolina at Chapel Hill School of Education Foundation, Inc. (School of Education Foundation), are reported as if they were part of the University.
The Investment Fund is governed by a board consisting of 11 ex-officio directors and two to four elected directors. Ex-officio directors include all of the members of the Board of Trustees of the Endowment Fund of the University, which includes the chairman of the University Board of Trustees and the chancel-lor, the vice chancellor for finance and administration, and the vice chancellor for university advancement. The UNC-Chapel
Hill Foundation Board may, in its discretion, elect one or two of its at-large members to the Investment Fund Board. The ex-officio directors may elect one or two directors by unanimous written consent. The Investment Fund supports the University by operating an investment fund for charitable, non-profit foundations, associations, trusts, endowments, and funds that are organized and operated primarily to support the University. Because members of the Board of Directors of the Investment Fund are officials or appointed by officials of the University and the Investment Fund’s primary purpose is to benefit the Uni-versity and other organizations operated primarily to support the University, its financial statements have been blended with those of the University.
The System Fund was organized by the Investment Fund to allow the University, other constituent institutions of the University of North Carolina System (UNC System), affiliated foundations, associations, trusts, and endowments that support the University and the UNC System, to pool their resources and invest collectively in investment opportunities identified, structured and managed by the Management Company. The membership interests are offered only to government entities or tax-exempt organizations that are controlled by or support the University or UNC System. The Investment Fund contrib-uted and assigned all of its assets to the System Fund effective January 1, 2003, in exchange for its membership interest in the System Fund. Upon such contribution and assignment, and in consideration thereof, the System Fund has assumed all liabilities and obligations of the Investment Fund in respect of such contributed assets. At June 30, 2010, the Investment Fund membership interest was approximately 76.5 percent of the System Fund total membership interests. Because the Investment Fund is the organizer and controlling member of the System Fund, the financial statements of the System Fund have been blended with those of the University.
The Management Company is a North Carolina non-profit corporation organized and operated exclusively to support the educational mission of the University. The Management Company provides investment management and administra-tive services to the University, UNC System, and institutions and affiliated tax-exempt organizations, and performs other functions for and generally carries out the purposes of the University. The Management Company is governed by five ex-officio directors and one to three additional directors as fixed or changed from time to time by the board, elected by the ex-officio directors. The ex-officio directors consist of the chancellor, the vice chancellor for finance and administration, the chairman of the University Board of Trustees, the chairman of the Board of Directors of the Investment Fund, and the president of the Management Company. Because members of the Board of Direc-tors of the Management Company are officials or appointed by officials of the University and the Management Company’s
noTe 1 Significant Accounting Policies
T h e U n i v e r s i T y o f n o r T h C a r o l i n a a t C h a p e l h i l l4 2
primary purpose is to benefit the University and other organiza-tions operated primarily to support the University, its financial statements have been blended with those of the University.
The UNC-Chapel Hill Foundation is governed by a 17-member board consisting of nine ex-officio directors and eight elected directors. Ex-officio directors include the chairman of the University Board of Trustees, the chancellor, the vice chancel-lor for finance and administration, and the vice chancellor for university advancement (non-voting). In addition, the Board of Trustees elects two ex-officio directors from among its own members as well as three ex-officio directors from the Board of Trustees of the Endowment Fund who have not otherwise been selected. The eight remaining directors are elected as members of the UNC-Chapel Hill Foundation Board of Directors by action of the ex-officio directors. The UNC-Chapel Hill Foundation aids, supports, and promotes teaching, research, and service in the various educational, scientific, scholarly, professional, artistic, and creative endeavors of the University. Because members of the Board of Directors of the UNC-Chapel Hill Foundation are officials or appointed by officials of the University and the UNC-Chapel Hill Foundation’s sole purpose is to benefit the Univer-sity, its financial statements have been blended with those of the University.
The Business School Foundation is governed by a board con-sisting of four ex-officio directors and four or more elected direc-tors. Ex-officio directors include the dean of the Kenan-Flagler Business School (Business School), as well as the school’s chief financial officer, associate dean of academic affairs, and associ-ate dean for MBA Programs. The remaining directors are elected to the Business School Foundation Board of Directors by action of the ex-officio directors. The Business School Foundation aids, promotes, and supports the Kenan-Flagler Business School at the University. Because members of the Board of Directors of the Business School Foundation are officials or appointed by officials of the University, the financial statements of the Business School Foundation have been blended with those of the University.
The Law Foundation is governed by a board consisting of one ex-officio director, six appointed directors, and six elected directors. The ex-officio director is the dean of the School of Law of the University. The ex-officio director appoints six directors and the Board of Directors of the Law Alumni Association of the UNC, Inc. elects the other six directors. The Law Foundation provides support, fosters, and encourages the study and teach-ing of law at the University’s Law School. Because a majority of the members of the Board of Directors of the Law Founda-tion are officials or appointed by officials of the University, the financial statements of the Law Foundation have been blended with those of the University.
The School of Education Foundation is governed by a board consisting of seven ex-officio directors and up to 15 elected
directors. Ex-officio directors include the dean of the School of Education, as well as the school’s associate dean for academic programs, assistant dean for external relations, assistant dean for administration and finance, director of alumni relations, president of the alumni council, and president-elect of the alumni council. The remaining directors are elected to the School of Education Foundation Board of Directors by action of the ex-officio directors. The School of Education Foundation aids, supports and promotes teaching, research, and service at the School of Education. Because members of the Board of Directors of the School of Education Foundation are officials or appointed by officials of the University, the financial statements of the School of Education Foundation have been blended with those of the University.
Separate financial statements for the Investment Fund, System Fund, the Management Company, and blended founda-tions may be obtained from the University Controller’s Office, Campus Box 1270, Chapel Hill, NC 27599-1270, or by calling (919) 962-1370.
Discretely Presented Component Units – The Medical Foundation of North Carolina, Inc. (Medical Foundation), The University of North Carolina at Chapel Hill Arts and Sciences Foundation, Inc. (Arts and Sciences Foundation), and The Educational Foundation Scholarship Endowment Trust (Educational Foundation Trust) are legally separate, not-for-profit, tax-exempt organizations and are reported as discretely presented component units based on the nature and significance of their relationship to the University.
The Medical Foundation is governed by a board consisting of three ex-officio directors and up to 33 elected directors, which serve staggered terms. Its purpose is to support educational and research efforts of the University’s medical school and UNC Hospitals. Historically, the University’s medical school has been the major recipient of financial support from the Medical Foun-dation rather than UNC Hospitals. Although the University does not control the timing or amount of receipts from the Medical Foundation, the majority of resources or income that the Medi-cal Foundation holds and invests is restricted to the University by the donors. Because these restricted resources held by the Medical Foundation can only be used by, or for the benefit of the University, the Medical Foundation is considered a component unit of the University.
The Arts and Sciences Foundation is governed by a board con-sisting of four ex-officio directors, 30 elected directors and such number of emeritus directors determined from time to time by the board of directors. The 30 elected directors are elected for staggered terms by the board of directors in office at the time of election. The purpose of the Arts and Sciences Foundation is to promote and support the University’s College of Arts and Sciences. Although the University does not control the timing or amount of receipts from the Arts and Sciences Foundation,

4 32010 Comprehensive A nnua l Financia l Repor t
the majority of resources or income that the Arts and Sciences Foundation holds and invests is restricted to the activities of the University by the donors. Because these restricted resources held by the Arts and Sciences Foundation can only be used by, or for the benefit of the University, the Arts and Sciences Founda-tion is considered a component unit of the University.
The Educational Foundation Trust is governed by The Educational Foundation Scholarship Endowment Trust Agree-ment which designates the voting members of the Investment Committee of The Educational Foundation, Inc. as trustees. The Investment Committee consists of five members elected from the membership of The Educational Foundation, Inc. The Educa-tional Foundation Trust operates solely to assist the University in providing financial assistance to students at the University. On an annual basis, the Board of Trustees of the Educational Foundation Trust appropriates a portion of the net appreciation on its assets to The Educational Foundation, Inc. in its capacity as agent for the Educational Foundation Trust. The distribu-tion from the Educational Foundation Trust to The Educational Foundation, Inc. is then forwarded by The Educational Founda-tion, Inc. to the University to provide financial assistance to students at the University. Although the University does not control the timing or amount of receipts from the Educational Foundation Trust, the majority of resources or income that the Educational Foundation Trust holds and invests is restricted to the students of the University by the donors. Because these restricted resources held by the Educational Foundation Trust can only be used for the benefit of the students of the Univer-sity, the Educational Foundation Trust is considered a compo-nent unit of the University.
The Medical Foundation, the Arts and Sciences Foundation, and the Educational Foundation Trust are private, non-profit organizations that report their financial results under Financial Accounting Standards Board (FASB) Statements. As such, certain revenue recognition criteria and presentation features are different from Governmental Accounting Standards Board (GASB) revenue recognition criteria and presentation features. No modifications have been made to the financial information in the University’s financial reporting entity for these differences.
During the year ended June 30, 2010, the Medical Founda-tion, Arts and Sciences Foundation, and the Educational Foun-dation Trust distributed in total $32,999,427 to the University for both restricted and unrestricted purposes. Complete finan-cial statements for the Medical Foundation, Arts and Sciences Foundation, and Educational Foundation Trust can be obtained from the University Controller’s Office, Campus Box 1270, Chapel Hill, NC 27599-1270, or by calling (919) 962-1370.
Other related foundations and similar non-profit corpora-tions for which the University is not financially accountable are not part of the accompanying financial statements.
B | Basis of Presentation
The accompanying financial statements are presented in accordance with accounting principles generally accepted in the United States of America as prescribed by the Governmental Accounting Standards Board (GASB).
Pursuant to the provisions of GASB Statement No. 34, Basic Financial Statements – and Management’s Discussion and Analysis – for State and Local Governments, as amended by GASB State-ment No. 35, Basic Financial Statements – and Management’s Discussion and Analysis – for Public Colleges and Universities, the full scope of the University’s activities is considered to be a single business-type activity and accordingly, is reported within a single column in the basic financial statements.
In accordance with GASB Statement No. 20, Accounting and Financial Reporting for Proprietary Funds and Other Governmental Entities That Use Proprietary Fund Accounting, the University does not apply Financial Accounting Standards Board (FASB) pronouncements issued after November 30, 1989, unless the GASB amends its pronouncements to specifically adopt FASB pronouncements issued after that date.
C | Basis of Accounting
The financial statements of the University have been prepared using the economic resource measurement focus and the accrual basis of accounting. Under the accrual basis, revenues are recognized when earned, and expenses are recorded when an obligation has been incurred, regardless of the timing of the cash flows.
Non-exchange transactions, in which the University receives (or gives) value without directly giving (or receiving) equal value in exchange includes state appropriations, certain grants, and donations. Revenues are recognized, net of estimated uncollect-ible amounts, as soon as all eligibility requirements imposed by the provider have been met, if probable of collection.
D | Cash and Cash Equivalents
This classification includes undeposited receipts, petty cash, cash on deposit with private bank accounts, cash on deposit with fiscal agents, and deposits held by the State Treasurer in the short-term investment fund. The short-term investment fund maintained by the State Treasurer has the general characteristics of a demand deposit account in that participants may deposit and withdraw cash at any time without prior notice or penalty.
E | Investments
Investments generally are reported at fair value. The fair values of all debt and equity securities with readily determinable fair

T h e U n i v e r s i T y o f n o r T h C a r o l i n a a t C h a p e l h i l l4 4
market values are based on quoted market prices. Investments for which a readily determinable fair value does not exist include investments in certain commingled funds and limited partner-ships. These investments are carried at estimated fair values as provided by the respective fund managers of these investments. The Management Company reviews and evaluates the values provided by the fund managers as well as the valuation methods and assumptions used in determining the fair value of such investments. Those estimated fair values may differ significantly from the values that would have been used had a ready market for these investments existed. The net increase or decrease in the fair value of investments is recognized as a component of investment income.
Money market funds, real estate not held by a governmental external investment pool, and other asset holdings are reported at cost, if purchased, or at fair value or appraised value at date of gift, if donated.
Short-term investments include marketable securities representing the investment of cash that is available for current operations. A majority of this available cash is invested in the University’s Temporary Pool, a governmental external invest-ment pool.
Endowment investments include the principal amount of gifts and bequests that, according to donor restrictions, must be held in perpetuity, along with any accumulated investment earnings on such amounts. Further, endowment investments also include amounts internally designated by the University for investment in an endowment capacity (i.e. quasi-endowments), along with accumulated investment earnings on such amounts. Land and other real estate held as investments by endowments are reported at fair value, consistent with how investments are generally reported.
F | Receivables
Receivables consist of tuition and fees charged to students and charges to patients for services provided by the UNC Physi-cians & Associates and the Dental Faculty Practices. Receivables also include amounts due from the federal government, state and local governments, private sources in connection with reimbursement of allowable expenditures made pursuant to contracts and grants, and pledges that are verifiable, measur-able, and expected to be collected and available for expenditures for which the resource provider’s conditions have been satis-fied, and notes receivables from loans to students. Patients, pledges, and notes receivables are recorded net of the allowance for doubtful accounts. The accounts and other receivables are shown at book value with no provision for doubtful accounts considered necessary.
G | Inventories
Inventories held by the University are priced at cost or average cost except for the Student Stores inventory, which is valued at the lower of cost or market. Inventories consist of expendable supplies, postage, fuel held for consumption, textbooks, and other merchandise for resale.
H | Capital Assets
Capital assets are stated at cost at date of acquisition or fair value at date of donation in the case of gifts. The value of assets constructed includes all material direct and indirect construc-tion costs. Interest costs incurred are capitalized during the period of construction.
The University capitalizes assets that have a value or cost in excess of $5,000 at the date of acquisition and an expected useful life of more than one year except for intangible assets which are capitalized when the value or cost is $100,000 or greater and internally generated software which is capitalized when the value or cost is $1,000,000 or greater. Library books are generally not considered to have a useful life of more than one year unless part of a collection and are expensed in the year of acquisition.
Depreciation is computed using the straight-line method over the estimated useful lives of the assets, generally 10 to 50 years for general infrastructure, 12 to 75 years for buildings, and 6 to 30 years for equipment.
The University’s historic property, artworks, and literary collections are capitalized at cost or fair value at the date of donation. These properties and collections are considered inex-haustible and are therefore not depreciated.
I | Restricted Assets
Certain resources are reported as restricted assets because restrictions on asset use change the nature or normal under-standing of the availability of the asset. Resources that are not available for current operations and are reported as restricted include resources restricted or designated for the acquisition or construction of capital assets and resources segregated for the payment of principal and interest as required by debt covenants or as internally designated.
J | Funds Held in Trust for Pool Participants
Funds held in trust for pool participants represent the external portion of the University’s governmental external investment pool more fully described in Note 2. The assets associated with this liability are included in restricted investments, cash, and other similar asset accounts.

4 52010 Comprehensive A nnua l Financia l Repor t
K | Funds Held in Trust by Others
Funds held in trust by others are resources neither in the possession nor the control of the University, but held and administered by an outside organization, with the University deriving income from such funds. Such funds established under irrevocable trusts where the University has legally enforceable rights or claims have not been recorded on the accompanying financial statements. The value of these assets at June 30, 2010 is approximately $24,653,187.
L | Non-current Long-term Liabilities
Non-current long-term liabilities include principal amounts of bonds payable, notes payable, capital lease obligations, annuity and life income payable, and compensated absences that are not scheduled to be paid within the next fiscal year.
Bonds payable are reported net of unamortized premiums or discounts and deferred losses on refunds. The University amor-tizes bond premiums/discounts over the life of the bonds using the straight-line method. The deferred losses on refunds are amortized over the life of the old debt or new debt (whichever is shorter) using the straight-line method. Issuance costs are expensed.
M | Compensated Absences
The University’s policy is to record the cost of vacation leave when earned. The policy provides for a maximum accumula-tion of unused vacation leave of 30 days which can be carried forward each January 1 or for which an employee can be paid upon termination of employment. Also, any accumulated vaca-tion leave in excess of 30 days at year-end is converted to sick leave. Under this policy, the accumulated vacation leave for each employee at June 30 equals the leave carried forward at the previous December 31 plus the leave earned, less the leave taken between January 1 and June 30.
In addition to the vacation leave described above, compensated absences include the accumulated unused portion of the special annual leave bonuses awarded by the North Carolina General Assembly. The bonus leave balance on December 31 is retained by employees and transferred into the next calendar year. It is not subject to the limitation on annual leave carried forward described above and is not subject to conversion to sick leave.
When classifying compensated absences into current and non-current, leave is considered taken using a last-in, first-out (LIFO) method.
There is no liability for unpaid accumulated sick leave because the University has no obligation to pay sick leave upon termi-nation or retirement. However, additional service credit for retirement pension benefits is given for accumulated sick leave upon retirement.
N | Net Assets
The University’s net assets are classified as follows:Invested in Capital Assets, Net of Related Debt – This rep-
resents the University’s total investment in capital assets, net of outstanding debt obligations related to those capital assets. To the extent debt has been incurred but not yet expended for capital assets, such amounts are not included as a component of invested in capital assets, net of related debt.
Restricted Net Assets – Non-expendable – Non-expendable restricted net assets include endowments and similar type assets whose use is limited by donors or other outside sources, and, as a condition of the gift, the principal is to be maintained in perpetuity.
Restricted Net Assets – Expendable – Expendable restricted net assets include resources for which the University is legally or contractually obligated to spend in accordance with restrictions imposed by external parties.
Unrestricted Net Assets – Unrestricted net assets include resources derived from student tuition and fees, sales and services, unrestricted gifts, royalties, and interest income.
Restricted and unrestricted resources are tracked using a fund accounting system and are spent in accordance with estab-lished fund authorities. Fund authorities provide rules for the fund activity and are separately established for restricted and unrestricted activities. When both restricted and unrestricted funds are available for expenditure, the decision for funding is transactional based within the departmental management system in place at the University. For projects funded by tax-exempt debt proceeds and other sources, the debt proceeds are always used first.
O | Scholarship Discounts
Student tuition and fees revenues and certain other revenues from University charges are reported net of scholarship dis-counts in the accompanying Statement of Revenues, Expenses, and Changes in Net Assets. The scholarship discount is the difference between the actual charge for goods and services pro-vided by the University and the amount that is paid by students or by third parties on the students’ behalf. Student financial assistance grants, such as Pell grants, and other federal, state, or non-governmental programs, are recorded as non-operating rev-enues in the accompanying Statement of Revenues, Expenses, and Changes in Net Assets. To the extent that revenues from these programs are used to satisfy tuition, fees, and other charges, the University has recorded a scholarship discount.

T h e U n i v e r s i T y o f n o r T h C a r o l i n a a t C h a p e l h i l l4 6
P | Revenue and Expense Recognition
The University classifies its revenues and expenses as operating or non-operating in the accompanying Statement of Revenues, Expenses, and Changes in Net Assets. Operating revenues and expenses generally result from providing services and produc-ing and delivering goods in connection with the University’s principal ongoing operations. Operating revenues include activities that have characteristics of exchange transactions, such as (1) student tuition and fees, (2) sales and services of auxiliary enterprises, (3) certain federal, state and local grants and contracts that are essentially contracts for services, and (4) interest earned on loans. Operating expenses are all expense transactions incurred other than those related to capital and non-capital financing or investing activities as defined by GASB Statement No. 9, Reporting Cash Flows of Proprietary and Non-expendable Trust Funds and Governmental Entities That Use Proprietary Fund Accounting.
Non-operating revenues include activities that have the characteristics of non-exchange transactions. Revenues from non-exchange transactions and state appropriations that represent subsidies or gifts to the University, as well as invest-ment income, are considered non-operating since these are investing, capital or non-capital financing activities. Capital contributions are presented separately after non-operating revenues and expenses.
Q | Internal Sales Activities
Certain institutional auxiliary operations provide goods and services to University departments, as well as to its customers. These institutional auxiliary operations include activities such as utility services, telecommunications, central stores, printing and copy centers, postal services, and repairs and maintenance services. In addition, the University has other miscellaneous sales and service units that operated either on a reimbursement or charge basis. All internal sales activities to University depart-ments from auxiliary operations and sales and service units have been eliminated in the accompanying financial statements. These eliminations are recorded by removing the revenue and expense in the auxiliary operations and sales and service units and, if significant, allocating any residual balances to those departments receiving the goods and services during the year.
A | Deposits
Unless specifically exempt, the University is required by North Carolina General Statute 147 77 to deposit moneys received with the State Treasurer or with a depository institution in the name of the State Treasurer. In addition, the University of North Carolina Board of Governors, pursuant to G.S. 116 36.1, requires the University to deposit its institutional trust funds, except for funds received for services rendered by health care professionals, with the State Treasurer. Although specifically exempted, the University may voluntarily deposit endowment funds, special funds, revenue bond proceeds, debt service funds, and funds received for services rendered by health care professionals with the State Treasurer. Special funds consist of moneys for intercollegiate athletics and agency funds held directly by the University.
At June 30, 2010, the amount shown on the Statement of Net Assets as cash and cash equivalents includes $823,889,372, which represents the University’s equity position in the State Treasurer’s Short-Term Investment Fund. The Short-Term Investment Fund (a portfolio within the State Treasurer’s Investment Pool, an external investment pool that is not regis-tered with the Securities and Exchange Commission and does not have a credit rating) had a weighted average maturity of 1.6 years as of June 30, 2010. Assets and shares of the Short-Term Investment Fund are valued at amortized cost, which approxi-mates fair value. Deposit and investment risks associated with the State Treasurer’s Investment Pool (which includes the State Treasurer’s Short-Term Investment Fund) are included in the State of North Carolina’s Comprehensive Annual Financial Report. An electronic version of this report is available by accessing the North Carolina Office of the State Controller’s Internet home page http://www.osc.nc.gov/ and clicking on “Proceed directly to OSC’s index page,” then “Reports,” or by calling the State Controller’s Financial Reporting Section at (919) 981 5454.
Cash on hand at June 30, 2010 was $153,546. The carrying amount of the University’s deposits not with the State Treasurer was $42,783,090 and the bank balance was $42,282,322. Custo-dial credit risk is the risk that in the event of a bank failure, the University’s deposits may not be returned to it. Pursuant to G.S. 116 36.1, funds received for health care services not deposited with the State Treasurer shall be fully secured in the manner as prescribed by the State Treasurer for the security of public deposits. The University does not have a deposit policy for custodial credit risk. As of June 30, 2010, $39,411,675 of the University’s bank balance was exposed to custodial credit risk as uninsured and uncollateralized.
noTe 2 Deposits and Investments

4 72010 Comprehensive A nnua l Financia l Repor t
B | Investments
The University is authorized by The University of North Carolina Board of Governors pursuant to G.S. 116-36.2 and Section 600.2.4 of the Policy Manual of the University of North Caro-lina, to invest its special funds and funds received for services rendered by health care professionals in the same manner as the State Treasurer is required to invest, as discussed below.
G.S. 147-69.1(c), applicable to the State’s General Fund, and G.S. 147-69.2, applicable to institutional trust funds, authorize the State Treasurer to invest in the following: obligations of or fully guaranteed by the United States; obligations of certain federal agencies; repurchase agreements; obligations of the State of North Carolina; time deposits of specified institutions; prime quality commercial paper; and asset-backed securities with specified ratings. Also, G.S. 147-69.1(c) authorizes the fol-lowing: specified bills of exchange or time drafts and corporate bonds and notes with specified ratings. G.S. 147-69.2 authorizes the following: general obligations of other states; general obliga-tions of North Carolina local governments; and obligations of certain entities with specified ratings.
In accordance with the bond resolutions, bond proceeds and debt service funds are invested in obligations that will by their terms mature on or before the date funds are expected to be required for expenditure or withdrawal.
G.S. 116-36(e) provides that the trustees of the Endowment Fund shall be responsible for the prudent investment of the fund in the exercise of their sound discretion, without regard to any statute or rule of law relating to the investment of funds by fiduciaries but in compliance with any lawful condition placed by the donor upon that part of the Endowment Fund to be invested.
Investments of the University’s component units, UNC-Cha-pel Hill Foundation, Management Company, Investment Fund, System Fund, Business School Foundation, Law Foundation, School of Education Foundation, Medical Foundation, Arts and Sciences Foundation, and Educational Foundation Trust, are subject to and restricted by G.S. 36E “Uniform Prudent Manage-ment of Institutional Funds Act” (UPMIFA) and any require-ments placed on them by contract or donor agreements. The Management Company does not hold endowment funds.
Investments of various funds may be pooled unless prohibited by statute or by terms of the gift or contract. The University utilizes investment pools to manage investments and distribute investment income.
Investments are subject to the following risks. Interest Rate Risk: Interest rate risk is the risk the Univer-
sity may face should interest rate variances affect the fair value of investments. The University does not have a formal policy that addresses interest rate risk.
Credit Risk: Credit risk is the risk that an issuer or other counterparty to an investment will not fulfill its obligations. The University does not have a formal policy that addresses credit risk.
Foreign Currency Risk: Foreign currency risk is the risk that changes in exchange rates will adversely affect the fair value of an investment. The University does not have a formal policy for foreign currency risk.
Temporary Investment Pool (Temporary Pool) – This is a fixed income portfolio managed by the UNC Management Company, Inc. (Management Company) and Novant Asset Management, LLC. It operates in conjunction with the University’s Bank of America disbursing account for all special funds, funds received for services rendered by health care professionals, and endow-ment revenue funds (internal portion) and funds of affiliated foundations (external portion). Because of the participation in the Temporary Pool by affiliated foundations, it is considered a governmental external investment pool. The external portion of the Temporary Pool is presented in the accompanying financial statements as Funds Held in Trust for Pool Participants. Fund ownership of the University’s Temporary Pool is measured using the unit value method. Under this method, participant activity is recorded on a cost basis in the UNC-Chapel Hill Money Mar-ket System. This is the official means of recording activity in the Temporary Pool. The Temporary Pool is not registered with the SEC and is not subject to any formal oversight other than that provided by the University Board of Trustees. The University has not provided legally binding guarantees during the period to support the value of the pool’s investments. There are no involuntary participants in the Temporary Pool.
The Bank of New York Mellon is the custodian for the Tempo-rary Pool and provides the University with monthly statements defining income and market value information. Investments of the Temporary Pool are highly liquid and generally include U.S. government securities, collateralized mortgage obligations, asset-backed securities, corporate bonds, and mutual funds. The University has elected to invest a portion of the Temporary Pool assets in the Investment Fund.
By request to accounting services, participants may purchase and sell shares in the Temporary Pool at a fixed value of $1 per share. Generally, the purchase and sale of participation shares occur only at the beginning of the month. Income distribution is determined each quarter by multiplying the distribution rate by the average of the invested fund balance. Statements are pro-vided via internet website to each participating account or group of accounts on a quarterly basis reflecting the participants’ balance and income distribution. The rate earned by an account is dependent upon its account classification and investable fund balance. The rates are set by policy and approved by the vice chancellor for finance and administration.

T h e U n i v e r s i T y o f n o r T h C a r o l i n a a t C h a p e l h i l l4 8
The following table presents the fair value of the Temporary Pool investments by type and investments subject to interest rate risk at June 30, 2010.
At June 30, 2010, investments in the Temporary Pool had the following credit quality distribution for securities with credit exposure:
Rating Agency: Moody’s/Standard & Poor’s/Fitch
U.S. Agencies $133,164,825 $750,724 $132,414,101 Collateralized Mortgage Obligations 55,064,831 6,217,079 $1,818,670 $7,131,665 $1,076,449 $17,137,657 21,683,311 Asset-backed Securities 3,563,393 2,400,121 1,163,272 Mutual Bond Funds 4,225,770 4,225,770 Money Market Mutual Funds 41,412,513 41,412,513 Domestic Corporate Bonds 19,214,570 2,102,392 15,427,957 756,769 927,452
Total $256,645,902 $50,482,708 $4,218,791 $26,785,392 $1,833,218 $19,228,381 $154,097,412
BB, Ba Fair Value AAA, Aaa AA, Aa A BBB, Baa and below Unrated
T e M p o r a r y p o o l i n v e s T M e n T sInvestment Maturities (in Years)
Investment Type
Debt Securities U.S. Treasuries $48,170,389 $13,035,410 $35,134,979 U.S. Agencies 133,164,825 27,898,703 47,148,505 $3,463,401 $54,654,216 Collateralized Mortgage Obligations 55,064,831 13,577,784 548,065 2,098,225 38,840,757 Asset-backed Securities 3,563,393 3,563,393 Mutual Bond Funds 4,225,770 4,225,770 Money Market Mutual Funds 41,412,513 41,412,513 Domestic Corporate Bonds 19,214,570 5,967,552 12,319,567 927,451
Total Debt Securities 304,816,291 $105,455,355 $95,151,116 $5,561,626 $98,648,194
Other Securities Domestic Stocks 30,000 Total Temporary Pool Investments $304,846,291
Fair Value Less Than 1 1 to 5 6 to 10 More Than 10

4 92010 Comprehensive A nnua l Financia l Repor t
Intermediate Investment Pool – Established in October 2007, this is a portfolio managed by the UNC Management Company, Inc. (Management Company) and is comprised of fixed income investments and investments with The University of North Carolina at Chapel Hill Foundation Investment Fund, Inc. Participation in the Intermediate Pool is open to all participants that are eligible for the UNC Chapel Hill Temporary Investment Pool, however currently the University is the only member. Fund ownership of the University’s Intermediate Pool is measured using the unit value method. Under this method, each participant’s investment bal-ance is determined on a market value basis. The Intermediate Pool is not registered with the SEC and is not subject to any formal oversight other than that provided by the University Board of Trustees. The University has not provided legally binding guarantees during the period to support the value of the pool’s investments. There are no involuntary participants in the Intermediate Pool.
The Bank of New York Mellon is the custodian for the Intermediate Pool and provides the University with monthly statements defining income and market value information. Generally a minimum of 45 percent and a maximum of 65 percent of the market value of the Intermediate Pool will be invested in the University of North Carolina at Chapel Hill Foundation Investment Fund, Inc. The remaining assets of the Intermediate Pool will be invested primarily (at least 80 percent) in cash, money market instruments, high quality bonds, and other high quality fixed income instruments in accordance with the Investment Guidelines.
By written request to university accounting services, the purchase and sale of participation shares occur at the beginning of the month. As calculated by the Management Company, returns net of fees and expenses will be allocated 85 percent to the Interme-diate Pool participants and 15 percent to the University. Statements are provided by the Management Company to each participant on a monthly basis reflecting the participants’ balance and investment activity.
Since a separate annual financial report of the Temporary Investment Pool has not been and is not planned to be issued, the following additional disclosures are being provided in the University’s financial statements.
The Temporary Investment Pool’s Statement of Net Assets and Statement of Operations and Changes in Net Assets as of and for the period ended June 30, 2010, are as follows:
Assets Cash in Bank $577,672 State Treasurer Investment Fund 167,500,000 Accounts Receivable 116,402 Accrued Investment Income 1,941,203 Deferred Loss 1,425,026 Investment Fund 38,469,590 Investments 304,846,291
Total Assets $514,876,184
Liabilities Accounts Payable $174,271
Total Liabilities 174,271
Net Assets Internal Portion 339,718,704 External Portion 174,983,209
Total Net Assets 514,701,913
Total Liabilities and Net Assets $514,876,184
s T a T e M e n T o f n e T a s s e T s June 30, 2010
Amount
Increase in Net Assets from Operations Revenues: Investment Income $7,338,295 Expenses: Investment Management (1,054,170)
Net Increase in Net Assets Resulting from Operations 6,284,125
Distributions to Participants Distributions Paid and Payable (6,284,125)
Share Transactions Net Share Purchases 57,213,546
Total Increase in Net Assets 57,213,546
Net Assets Beginning of Year 457,488,367
End of Year $514,701,913
s T a T e M e n T o f o p e r a T i o n s a n d C h a n G e s i n n e T a s s e T s For the fiscal year ended June 30, 2010
Amount

T h e U n i v e r s i T y o f n o r T h C a r o l i n a a t C h a p e l h i l l5 0
At June 30, 2010, the Intermediate Investment Pool had investments of $19,547,949 in the Investment Fund.
UNC-Chapel Hill Foundation Investment Fund, Inc. (Investment Fund) – This is a North Carolina non-profit corporation exempt from income tax pursuant to Section 501(c)(3). It was established in January 1997 and is classified as a governmental external investment pool. The pool is utilized to manage the investments for charitable, non-profit foundations, associations, trusts, endow-ments, and funds that are organized and operated primarily to support the University. The University’s Endowment, UNC-Chapel Hill Foundation, Business School Foundation, School of Education Foundation, Law Foundation, Medical Foundation, Arts and Sciences Foundation, and Educational Foundation Trust are participants in the Investment Fund and are included in the University’s reporting entity (internal portion). Other affiliated organizations (external portion) in the Investment Fund are not included in the University’s reporting entity. Fund ownership of the University’s Investment Fund is measured using the unit value method. Under this method, each participant’s investment balance is determined on a market value basis. The external portion of the Investment Fund is presented in the accompanying financial statements as Funds Held in Trust for Pool Participants.
The Investment Fund is not registered with the SEC and is not subject to any formal oversight other than that provided by the Investment Fund Board of Directors (See Note 1A).
The Investment Fund is the primary participant of UNC Investment Fund, LLC (System Fund) and on a monthly basis receives a unitization report from the Management Company defining change in book and market value, applicable realized gains and losses and expenses. The Investment Fund uses a unit basis to determine each participant’s market value and to distribute the fund’s earn-ings according to the fund’s spending policy. There are no involuntary participants in the Investment Fund. The University has not provided or obtained any legally binding guarantees during the period to support the value for the Investment Fund. The audited financial statements for the Investment Fund may be obtained from the University Controller’s Office, Campus Box 1270, Chapel Hill, NC 27599-1270, or by calling (919) 962-1370.
The Investment Fund consists of an approximately 76.5 percent membership in the System Fund categorized on the next page.
At June 30, 2010, investments in the Intermediate Pool had the following credit quality distribution for securities with credit exposure:
The following table presents the fair value of the investments by type and investments subject to interest rate risk at June 30, 2010.
i n T e r M e d i a T e p o o l i n v e s T M e n T sInvestment Maturities (in Years)
Investment Type
Debt Securities Mutual Bond Funds $7,942,629 $7,942,629 Money Market Mutual Funds 7,767,264 $7,767,264
Total Intermediate Pool Investments $15,709,893 $7,767,264 $7,942,629 $0 $0
Fair Value Less Than 1 1 to 5 6 to 10 More Than 10
Mutual Bond Funds $7,942,629 $7,942,629 Money Market Mutual Funds 7,767,264 7,767,264
Total $15,709,893 $15,709,893
Rating Agency: Moody’s/Standard & Poor’s/Fitch
Fair Value AAA, Aaa

5 12010 Comprehensive A nnua l Financia l Repor t
UNC Investment Fund, LLC (System Fund) – This is a limited liability company organized under the laws of the State of North Carolina. It was established in December 2002 by the Invest-ment Fund and is classified as a governmental external invest-ment pool. The pool is utilized to manage the investments for The University of North Carolina, its constituent institutions, and affiliates of the constituent institutions. This includes chari-table, non-profit foundations, associations, trusts, endowments, and funds that are organized and operated primarily to support these institutions. The Investment Fund, with an approximately 76.5 percent membership interest as of June 30, 2010, is the predominant member of the System Fund. The University’s reporting entity portion of the Investment Fund and the Man-agement Company’s portion of the System Fund is characterized as the internal portion. Other affiliated organizations in the Investment Fund in addition to other members of the System Fund not included in the University’s reporting entity are char-acterized as the external portion. The external portion of the System Fund is presented in the accompanying financial state-ments as Funds Held in Trust for Pool Participants. Membership interests of the System Fund are measured using the unit value method. Under this method, each member’s investment balance
is determined on a market value basis. The System Fund is not registered with the SEC and is not
subject to any formal oversight other than that provided by the Investment Fund as the controlling member (See Note 1A). Effective January 1, 2003, the Management Company entered into an investment management services agreement with the System Fund and will provide investment management and administrative services.
The Bank of New York Mellon is the custodian for the System Fund and provides the University with monthly statements defining income and market value information. The System Fund uses a unit basis to determine each member’s market value and to distribute the fund’s earnings. There are no invol-untary participants in the System Fund. The University has not provided or obtained any legally binding guarantees during the period to support the value for the System Fund investments. The audited financial statements for the System Fund may be obtained from the University Controller’s Office, Campus Box 1270, Chapel Hill, NC 27599-1270, or by calling (919) 962-1370.
The following table presents the fair value of the System Fund investments by type and investments subject to interest rate risk at June 30, 2010.
s y s T e M f U n d p o o l i n v e s T M e n T sInvestment Maturities (in Years)
Investment Type
Debt Securities U.S. Treasuries $52,180,780 $39,540,750 $7,726,750 $4,913,280 U.S. Agencies 11,083,618 $39,651 3,057,711 1,207,315 6,778,941 Collateralized Mortgage Obligations 17,404,790 771,419 16,633,371 Asset-backed Securities 7,602,984 7,602,984 Money Market Mutual Funds 25,106,137 25,106,137 Domestic Corporate Bonds 5,252,940 3,361,115 1,891,825
Total Debt Securities 118,631,249 $25,145,788 $43,369,880 $12,295,180 $37,820,401
Other Securities International Mutual Funds 70,602,730 Other Mutual Funds 43,471,403 Real Estate Investment Trust 333,380 Hedge Funds 1,207,430,424 Limited Partnerships 961,267,494 Domestic Stocks 91,868,262 Foreign Stocks 6,321,869 Other 1,791,084 Total System Fund Pool Investments $2,501,717,895
Fair Value Less Than 1 1 to 5 6 to 10 More Than 10

T h e U n i v e r s i T y o f n o r T h C a r o l i n a a t C h a p e l h i l l5 2
In addition to the interest rate risk disclosed above, the System Fund invests in hedge funds containing securities with fair values that are highly sensitive to interest rate changes. The System Fund includes $257,028,161 in commingled securities and $35,666,135 in high-yield bonds. The commingled securities are subject to additional risk since they hold domestic corporate bonds, bonds issued from abroad, or mortgage-backed securities. Bonds issued from overseas carry additional risk due to currency fluctuations, interest rates of foreign countries, or political risks. Corporate bonds are also subject to interest rate risk as well as the financial risk inherent in any company. Mortgage-backed bonds are subject to the interest rate risk within the pools of collateralized securities. All of these factors may impact interest rates and therefore have a higher risk. The high-yield bonds have both long and short positions. These strategies carry additional risk since high-yield securities often have a higher rate of default to accompany their higher interest rates. These factors make the investments more sensitive to interest rate movements than investment grade domestic bonds.
At June 30, 2010, investments in the System Fund Pool had the following credit quality distribution for securities with credit exposure:
Foreign Currency Risk – At June 30, 2010, the System Fund Pool’s exposure to foreign currency risk is as follows:
Rating Agency: Moody’s/Standard & Poor’s/Fitch
U.S. Agencies $11,083,618 $11,083,618 Collateralized Mortgage Obligations 17,404,790 $928,391 $253,658 $461,370 $1,256,846 $14,504,525 Asset-backed Securities 7,602,984 292,874 7,310,110 Domestic Corporate Bonds 5,252,940 713,760 1,120,590 2,901,235 517,355 Money Market Mutual Funds 25,106,137 25,106,137
Total $66,450,469 $26,748,288 $1,667,122 $3,362,605 $1,774,201 $21,814,635 $11,083,618
BB, Ba Fair Value AAA, Aaa AA, Aa A BBB, Baa and below Unrated
Limited Partnerships Euro $57,428,875 Hedge Funds Euro 6,613,014 Limited Partnerships British Pound Sterling 6,546,862 Limited Partnerships Australian Dollar 2,230,224 Limited Partnerships Canadian Dollar 1,553,763 Foreign Stock Canadian Dollar 174,430
Total $74,547,168
Currency Fair Value (U.S. Dollars)

5 32010 Comprehensive A nnua l Financia l Repor t
At June 30, 2010, the University’s Non-Pooled investments had the following credit quality distribution for securities with credit exposure:
Non-Pooled Investments – The following table presents the fair value of investments by type and investments subject to interest rate risk at June 30, 2010.
Rating Agency: Moody’s/Standard & Poor’s/Fitch
U.S. Agencies $278,091 $164,942 $113,149 Mortgage Pass Throughs 177,018 154,277 $19,263 $3,478 Collateralized Mortgage Obligations 68,574 49,264 19,310 State and Local Government 114,378 77,199 $37,179 Asset-backed Securities 37,263 37,263 Mutual Bond Funds 5,539,769 1,364,076 3,138,524 386,608 272,238 $378,323 Money Market Mutual Funds 56,869,462 56,853,617 15,845 Domestic Corporate Bonds 313,028 105,580 124,448 83,000 Foreign Corporate Bonds 117,786 30,216 25,402 62,168 Foreign Government Bonds 33,806 33,806
Total $63,549,175 $58,616,392 $3,288,769 $697,957 $371,585 $461,323 $113,149
BB, Ba Fair Value AAA, Aaa AA, Aa A BBB, Baa and below Unrated
n o n - p o o l e d i n v e s T M e n T sInvestment Maturities (in Years)
Investment Type
Debt Securities U.S. Treasuries $334,220 $174,563 $112,702 $46,955 U.S. Agencies 278,091 $79,521 140,242 58,328 Mortgage Pass Throughs 177,018 104,766 72,252 Collateralized Mortgage Obligations 68,574 68,574 State and Local Government 114,378 114,378 Asset-backed Securities 37,263 37,263 Mutual Bond Funds 5,539,769 4,497,348 1,042,421 Money Market Mutual Funds 56,869,462 56,869,462 Domestic Corporate Bonds 313,028 23,408 289,620 Foreign Corporate Bonds 117,786 55,618 62,168 Foreign Government Bonds 33,806 33,806
Total Debt Securities 63,883,395 $56,948,983 $338,213 $5,118,382 $1,477,817
Other Securities International Mutual Funds 3,630,367 Other Mutual Funds 5,971,102 Investments in Real Estate 2,303,303 Real Estate Investment Trust 112,328 Limited Partnerships 3,282,774 Domestic Stocks 13,125,963 Foreign Stocks 391,781 Other 14,485,056 Total Non-Pooled Investments $107,186,069
Fair Value Less Than 1 1 to 5 6 to 10 More Than 10

T h e U n i v e r s i T y o f n o r T h C a r o l i n a a t C h a p e l h i l l5 4
Total Investments – The following table presents the fair value of the total investments at June 30, 2010.
The following is an analysis of investments not held by the University:
Total investments include $371,915,136 held in the System Fund for the component units that are discretely presented in the accompanying financial statements. The University’s report-ing entity, including the three discretely presented component units, comprises 62.9 percent of the System Fund.
Component Units – Investments of the University’s discretely presented component unit, the Medical Foundation of North Carolina, Inc., are subject to and restricted by G.S. 36E “Uniform Prudent Management of Institutional Funds Act” (UPMIFA) and any requirements placed on them by contract or donor agree-ments. Because the Medical Foundation reports under the FASB reporting model, disclosures of the various investment risks are not required.
Investment Type
Debt Securities U.S. Treasuries $100,685,389 U.S. Agencies 144,526,534 Mortgage Pass Throughs 177,018 Collateralized Mortgage Obligations 72,538,195 State and Local Government 114,378 Asset-backed Securities 11,203,640 Mutual Bond Funds 17,708,168 Money Market Mutual Funds 131,155,376 Domestic Corporate Bonds 24,780,538 Foreign Corporate Bonds 117,786 Foreign Government Bonds 33,806
Total Debt Securities 503,040,828
Other Securities International Mutual Funds 74,233,097 Other Mutual Funds 49,442,505 Investments in Real Estate 2,303,303 Real Estate Investment Trust 445,708 Hedge Funds 1,207,430,424 Limited Partnerships 964,550,268 Domestic Stocks 105,024,225 Foreign Stocks 6,713,650 Other 16,276,140
Total Investments $2,929,460,148
T o T a l i n v e s T M e n T s
Fair Value
Substantially all of the investments of the University’s endow-ment funds are pooled in the Investment Fund. Under the “Uniform Prudent Management of Institutional Funds Act” (UPMIFA), authorized by the North Carolina General Assembly on March 19, 2009, the Board may appropriate expenditures from eligible non-expendable balances if deemed prudent and necessary to meet program outcomes and for which such spend-ing is not specifically prohibited by the donor agreements. Dur-ing the year, the Board did not appropriate expenditures from eligible non-expendable endowment funds. Investment return of the University’s pooled endowment funds is predicated on the total return concept (yield plus appreciation). Annual distributions from the Investment Fund to the University’s pooled endowment funds are generally based on an adopted distribution policy. Under this policy, the prior year distribution is increased by the rate of inflation as measured by the Con-sumer Price Index (CPI) unless the Board determines otherwise. Each year’s distribution, however, is subject to a minimum of 4 percent and a maximum of 7 percent of the pooled endowment fund’s average market value for the previous year.
To the extent that the total return for the current year exceeds the distribution, the excess is added to principal. If cur-rent year earnings do not meet the distribution requirements, the University uses accumulated income and appreciation to make up the difference. At June 30, 2010, accumulated income and appreciation of $393,588,583 was available in the Univer-sity’s pooled endowment funds of which $381,747,111 was restricted to specific purposes.
Certificates of Deposit $511,675 Equities 10,498,237 Mutual Funds 22,265,614
Total Investments $33,275,526
Investment Type Carrying Value
noTe 3 Endowment Investments

5 52010 Comprehensive A nnua l Financia l Repor t
Hedging derivative instruments held at June 30, 2010 are as follows:
Derivative instruments held at June 30, 2010 are as follows:
noTe 4 Derivative Instruments
Pay-Fixed Interest Rate Swap Hedge changes in cash flows $19,990,000 10/03/00 11/01/25 Pay 5.24%, Receive SIFMA on General Revenue 2001B Series Bonds Pay-Fixed Interest Rate Swap Hedge changes in cash flows 100,000,000 12/01/07 12/01/36 Pay 3.314%, on General Revenue 2001B&C Receive 67% 1 Mo. LIBOR and 2002A Series Bonds
Effective Termination Type Objective Notional Amount Start Date End Date Terms
Change in Fair Value Fair Value
Hedging Derivative Instruments
Cash Flow Hedges Pay-Fixed Interest Rate Swap $19,990,000 Deferred Outflow of Resources ($790,257) Hedging Derivative Liability ($4,470,223) 2001B Bonds (Lehman Brothers) Pay-Fixed Interest Rate Swap 100,000,000 Deferred Outflow of Resources (5,993,861) Hedging Derivative Liability (16,073,519) 2001B&C and 2002A Bonds (Wachovia)
($6,784,118) ($20,543,742)
Type Notional Amount Classification Increase (Decrease) Classification Asset (Liability)

T h e U n i v e r s i T y o f n o r T h C a r o l i n a a t C h a p e l h i l l5 6
The fair value for the Lehman Brothers Special Financing, Inc. interest rate swap was provided by the University’s financial advisor, Prager, Sealy, & Co. Their method calculates the future net settlement payments required by the swap assuming that the current forward rates implied by the yield curve correctly anticipate future spot interest rates. These payments are then discounted using the spot rates implied by the current yield curve for LIBOR due on the date of each future net settlement on the swap.
The fair value for the Wachovia Bank, N.A. interest rate swap was provided by Wachovia. Their method calculates the present value of all expected future payments on the swap based on forward curves discounted at current market rates.
During fiscal year 2009, Lehman Brothers Special Financing, Inc., filed for bankruptcy and no longer disburses the variable payment scheduled under the agreement to the University. To account for this consideration and as allowed under the swap documents, the University nets its scheduled fix payment against that payment that should be received from Lehman Brothers Special Financing, Inc., based upon SIFMA.
Risks
Interest Rate Risk: The University is exposed to interest rate risk on its interest rate swaps. The fair values of these instru-ments are highly sensitive to interest rate changes. Because rates have changed since the effective dates of the swaps, both of the swaps have a negative fair value as of June 30, 2010. The nega-tive fair value may be countered by a reduction in total interest payments required under the variable-rate bonds, creating lower synthetic interest rates. Because the coupons on the University’s variable-rate bonds adjust to changing interest rates, the bonds do not have corresponding fair value increases. The fair values are the calculated values as of June 30, 2010. As the yield curve rises, the value of the swaps will increase and as rates fall, the value of the swaps decrease.
Credit Risk: As of June 30, 2010, the University was not exposed to credit risk because the swaps had a negative fair
value. Wachovia was rated AA by S&P, AA- by Fitch and Aa2 by Moody’s. The University does not have a formal policy regard-ing requiring collateral or other security to support hedging derivative instruments subject to credit risk. The University does not have a formal policy regarding entering into master netting arrangements.
Basis Risk: The University is exposed to basis risk on the swaps when its bonds begin to trade at a yield above the refer-enced index rate. For the Lehman Brothers swap, basis risk also exists since swap payments are received semi-annually while bond payments are made monthly. With the alternative tax structure of the swap, a change in tax law would trigger the swap being converted from a SIFMA swap to a percentage of LIBOR swap.
Termination Risk: The swap agreements use the Interna-tional Swap Dealers Association Master Agreement, which includes standard termination events, such as failure to pay and bankruptcy. Termination could result in the University being required to make an unanticipated termination payment. The swap may terminate if the University or Lehman Brothers or Wachovia fails to perform under terms of the contract.
Rollover Risk: The University is not exposed to rollover risk for the Lehman Brothers swap based solely upon the maturity date of the bonds since the termination date of the swap, November 1, 2025, is prior to the maturity date of the hedged bonds, December 1, 2025. However, since the underlying hedged variable rate debt is in the form of variable rate demand bonds, the University is subject to rollover risk in the event that the bonds are tendered and cannot be remarketed by the remarketing agent. The University is exposed to rollover risk for the Wachovia swap based upon the maturity date of the underlying debt and due to the form of the debt as variable rate demand bonds.
Future swaps – The University has also entered into a future dated interest rate swap agreement for $150,000,000 to be effective December 1, 2011, on variable rate bonds.

5 72010 Comprehensive A nnua l Financia l Repor t
Receivables at June 30, 2010 were as follows:
noTe 5 Receivables
Current Receivables Students $4,093,708 $4,093,708 Patients 105,261,879 $79,054,603 26,207,276 Accounts 41,352,935 41,352,935 Intergovernmental 72,148,824 72,148,824 Pledges 18,119,089 452,977 17,666,112 Investment Earnings 2,638,925 2,638,925 Interest on Loans 737,400 737,400 Other 38,230 38,230
Total Current Receivables $244,390,990 $79,507,580 $164,883,410
Non-current ReceivablesPledges $25,598,929 $639,973 $24,958,956
Notes Receivable Notes receivable – Current: Federal Loan Programs $3,551,173 $183,341 $3,367,832 Institutional Student Loan Programs 902,385 69,676 832,709
Total Notes Receivable – Current $4,453,558 $253,017 $4,200,541
Notes receivable – Non-current: Federal Loan Programs $30,718,123 $1,650,067 $29,068,056 Institutional Student Loan Programs 6,089,542 252,956 5,836,586
Total Notes Receivable – Non-current $36,807,665 $1,903,023 $34,904,642
Less Allowance Gross Receivables for Doubtful Accounts Net Receivables

T h e U n i v e r s i T y o f n o r T h C a r o l i n a a t C h a p e l h i l l5 8
Pledges are receivable over varying time periods ranging from one to 10 years, and have been discounted based on a projected interest rate of 0.93 percent for the outstanding periods, and allowances are provided for the amounts estimated to be uncollectible.
Scheduled receipts, the discounted amount under these pledge commitments, and allowances for uncollectible pledges are as follows:
A summary of changes in the capital assets for the year ended June 30, 2010 is presented as follows:
noTe 6 Capital Assets
2011 $18,119,089 2012 11,545,364 2013 8,777,023 2014 3,531,742 2015 609,424 2016–2020 1,835,252
Total Pledge Receipts Expected 44,417,894
Less Discount Amount Representing Interest (0.93% Rate of Interest) 699,876
Present Value of Pledge Receipts Expected 43,718,018
Less Allowance for Uncollectible 1,092,950
Pledges Receivable $42,625,068
Fiscal Year Fair Value
Capital Assets, Non-depreciable Land $38,431,938 $25,896,978 $2,209,258 $62,119,658 Art, Literature, and Artifacts 74,163,351 6,160,394 960 80,322,785 Construction in Progress 614,308,478 144,326,625 412,408,776 346,226,327 Computer Software in Development 32,823,163 17,798,435 50,621,598 Other Intangible Assets 1,009,000 9,000 1,000,000
Total Capital Assets, Non-depreciable 760,735,930 194,182,432 414,627,994 540,290,368
Capital Assets, Depreciable Buildings 2,014,598,586 240,414,275 1,253,080 2,253,759,781 Machinery and Equipment 295,646,055 50,663,886 13,156,901 333,153,040 General Infrastructure 422,273,124 278,279,372 31,357 700,521,139
Total Capital Assets, Depreciable 2,732,517,765 569,357,533 14,441,338 3,287,433,960
Less Accumulated Depreciation for Buildings 589,142,582 59,329,190 605,860 647,865,912 Machinery and Equipment 158,057,798 16,779,446 7,688,104 167,149,140 General Infrastructure 215,102,110 14,752,347 31,357 229,823,100
Total Accumulated Depreciation 962,302,490 90,860,983 8,325,321 1,044,838,152
Total Capital Assets, Depreciable, Net 1,770,215,275 478,496,550 6,116,017 2,242,595,808
Capital Assets, Net $2,530,951,205 $672,678,982 $420,744,011 $2,782,886,176
Balance Balance 07/01/09 Increases Decreases 06/30/10

5 92010 Comprehensive A nnua l Financia l Repor t
Accounts payable and accrued liabilities at June 30, 2010 were as follows:
Short-term debt activity for the year ended June 30, 2010 was as follows:
noTe 7 Accounts Payable and Accrued Liabilities
noTe 8 Short-term Debt
The University’s commercial paper program provides up to $400,000,000 in short-term financing for the University’s capital improvement projects and is supported by a pledge of the University’s available funds. The University will typically utilize the com-mercial paper program for construction financing and will periodically issue long-term bonds to refund the outstanding balances under this program in order to provide permanent financing for these capital improvement projects.
Commercial paper was redeemed with proceeds from The University of North Carolina General Revenue Bonds, Series 2009A and payments from campus entities with outstanding commercial paper.
The University of North Carolina at Chapel Hill Foundation, Inc. (Foundation) and Chapel Hill Real Estate Holdings, Inc. entered into an interest rate swap agreement, in the form of an interest rate cap, with the Bank of New York Mellon on July 2, 2009. The Foundation used the Bank of America Line of Credit to fund the one-time, up-front payment to the Bank of New York Mellon under the agreement. The Foundation then paid in full the Line of Credit with cash reserves on July 13, 2009.
Commercial Paper Program $148,291,000 $33,000,000 $121,507,000 $59,784,000 Line of Credit 665,000 665,000 0
Total Short-term Debt $148,291,000 $33,665,000 $122,172,000 $59,784,000
Balance Balance 07/01/09 Draws Repayments 06/30/10
Accounts Payable $63,228,877 Accrued Payroll 47,972,762 Contract Retainage 2,819,132 Intergovernmental Payables 124,045
Total Accounts Payable and Accrued Liabilities $114,144,816
Amount

T h e U n i v e r s i T y o f n o r T h C a r o l i n a a t C h a p e l h i l l6 0
A | Changes in Long-term Liabilities
A summary of changes in the long-term liabilities for the year ended June 30, 2010 is presented as follows:
noTe 9 Long-term Liabilities
Revenus Bonds Payable $1,056,780,000 $210,540,000 $24,470,000 $1,242,850,000 $96,424,207 Add/Deduct Premium/Discount (3,309,104) 8,846,728 (7,681,551) 13,219,175 Deduct Deferred Charge on Refunding (3,034,493) (401,922) (2,632,571)
Total Revenue Bonds Payable 1,050,436,403 219,386,728 16,386,527 1,253,436,604 96,424,207
Notes Payable 675,000 45,750,000 325,000 46,100,000 350,000 Capital Leases Payable 1,710,142 3,421,701 1,670,032 3,461,811 1,007,926 Compensated Absences 125,342,115 68,372,984 70,978,605 122,736,494 6,929,381 Annuity and Life Income Payable 11,555,016 83,458 1,062,085 10,576,389 1,440,546
Total Long-term Liabilities $1,189,718,676 $337,014,871 $90,422,249 $1,436,311,298 $106,152,060
Additional information regarding capital lease obligations is included in Note 10.
Balance Balance Current 07/01/09 Additions Reductions 06/30/10 Portion

6 12010 Comprehensive A nnua l Financia l Repor t
B | Revenue Bonds Payable
The University was indebted for revenue bonds payable for the purposes shown in the following table:
General Revenue Bonds were issued for various construction projects and refunding of bonds and commercial paper.*For variable rate debt, interest rates in effect at June 30, 2010 are included. For variable rate debt with interest rate swaps, the synthetic fixed rates are included.**The Unviersity has elected to treat these bonds as federally taxable “Build America Bonds” for the purposes of the American Recovery and Reinvestment Act and to receive a cash subsidy from the U.S. Treasury equal to 35% of the interest payable on these bonds. For these bonds, the interest rate included is the taxable rate, which does not factor in the cash subsidy from the U.S. Treasury.
Housing System 1997B 4.875%–5.000% 11/01/11 $7,210,000 $5,510,000 $1,700,000 (1)
General Revenue 2001A 5.000%–5.375% 12/01/25 89,930,000 53,865,000 36,065,000 2001B 0.18%–5.17%* 12/01/25 54,970,000 17,860,000 37,110,000 2001C 0.150%–2.969%* 12/01/25 54,970,000 17,860,000 37,110,000 2002B 5.0% 12/01/11 66,555,000 49,420,000 17,135,000 2003 3.00%–5.00% 12/01/33 107,960,000 11,215,000 96,745,000 2005A 4.0%–5.0% 12/01/34 404,960,000 2,595,000 402,365,000 2007 4.45–5.00% 12/01/36 298,475,000 0 298,475,000 2009A 3.0%–5.0% 12/01/39 97,735,000 0 97,735,000 2009B 5.757%** 12/01/39 112,805,000 0 112,805,000
Total General Revenue 1,288,360,000 152,815,000 1,135,545,000
Utility System 1997 5.25%–5.50% 08/01/21 84,135,000 ($24,361,590) 59,773,410 (3) Student Union 2000 5.0% 06/01/10 12,465,000 12,465,000 0 (2) Student Recreation Center 1997 5.0% 06/01/11 3,545,000 3,135,000 410,000 (2) U.S. EPA Project 1991 9.05% 02/15/15 58,125,000 37,065,000 21,060,000
Total Revenue Bonds Payable (principal only) $1,453,840,000 $210,990,000 ($24,361,590) 1,218,488,410
Less: Unamortized Loss on Refunding (2,632,571) Plus: Unamortized Discount 37,580,765
Total Revenue Bonds Payable $1,253,436,604
Original Principal Amount Principal Discount Outstanding Interest Final of issue Paid on Capital plus Capital See Rate/ Maturity plus Capital Through Appreciation Appreciation Table Purpose Series Ranges Date Appreciation 06/30/10 Bonds 06/30/10 Below
The University has pledged future revenues, net of specific operating expenses, to repay revenue bonds as shown in the table below:
(1) Housing Revenues $1,785,734 $25,015,789 $785,000 $102,809 4% (2) Student Fees $430,500 $1,764,044 $890,000 $65,000 24% (3) Utilities Revenues $84,135,000 $37,559,597 $3,109,217 $0 19%
Total Future Revenues Principal Estimate of % of Ref Revenue Source Revenues Pledged Net of Expenses & Accretion Interest Revenues Pledged
Current Year

T h e U n i v e r s i T y o f n o r T h C a r o l i n a a t C h a p e l h i l l6 2
C | Demand Bonds
Included in bonds payable are several variable rate demand bond issues. Demand bonds are securities that contain a “put” feature that allows bondholders to demand payment before the maturity of the debt upon proper notice to the University’s remarketing or paying agents.
With regards to the following demand bonds, the University has not entered into legal agreements, which would convert the demand bonds not successfully remarketed into another form of long-term debt.
GeneRal Revenue, seRies 2001B and 2001C
In 2001 the University issued two series of variable rate demand bonds in the amount of $54,970,000 (2001B) and $54,970,000 (2001C) that each has a final maturity date of December 1, 2025. The bonds are subject to mandatory sinking fund redemp-tion on the interest payment date on or immediately preceding each December throughout the term of the bonds. The proceeds of these issuances were used to provide funds to refund in advance of their maturity the following issues: Ambulatory Care Clinic, Series 1990; Athletic Facilities, Series 1998; Carolina Inn, Series 1994; School of Dentistry, Series 1995; Kenan Stadium, Series 1996; Housing System Series 2000; and Parking System, Series 1997C. While bearing interest at a weekly rate, the bonds are subject to purchase on demand with seven days notice and delivery to the University’s remarketing agents J.P. Morgan Chase (2001B) and Bank of America, LLC (2001C). Effective September 23, 2008, J.P. Morgan Chase replaced Lehman Brothers, Inc.
The University entered into a line of credit agreement in the amount of $300,000,000 with Wachovia Bank (or Bank) on September 21, 2006. Under the line of credit agreement, the University is entitled to draw amounts sufficient to pay the principal and accrued interest on Variable Rate Demand Bonds (or Commercial Paper Bonds) delivered for purchase. Under the line of credit agreement, the University may request that the Bank increase the commitment by increments of $25,000,000 for a total commitment of up to $400,000,000. A request for increase is subject to the Bank’s sole discretion, and the University cannot be in default under the agreement at the time of the request. During fiscal year 2009, Wells Fargo purchased Wachovia Bank, but the line of credit agreement remains in place under original terms and conditions.
The University is required to pay a quarterly facility fee for the line of credit in the amount of 0.08 percent per annum based on the size of the commitment. If a long-term debt rating assigned
AA AA Aa2 0.10% AA- AA- Aa3 0.11% A+ A+ A1 0.14% A A A2 0.18%
S&P Fitch Moody’s Facility Fee
by S&P, Moody’s, or Fitch is lowered, the facility fee assigned to the lowest rating in the below table shall apply:
In the event that the Bank increases the available commitment prior to the due date for payment of a facility fee, upon request by the University as referenced in the prior paragraph, the University must pay a supplemental fee based on the facility fee applied to the amount of the increase at the time of commitment to increase. The University will also pay an accrued interest fee equal to the amount of accrued interest, at the time of purchase of the bonds, multiplied by the prime rate multiplied by the ratio of the number of days from the date of purchase of the bonds until the date of payment of the accrued interest to 365 days.
Under the line of credit agreement, draws to purchase bonds will accrue interest at the prime rate payable on the same interest date as provided in the trust agreement for the original bonds. The University is required to begin making a series of ten fully amortizing semi-annual principal payments on bonds held by the Bank six months after the date of purchase. Commercial paper bonds held by the Bank may be rolled over for a period of 180 days and must be reduced by 1/10th of the original amount of the commercial paper bonds for a period of up to ten roll-overs. All outstanding principal and accrued but unpaid interest is due in full at the maturity of the line of credit.
The line of credit agreement expires on September 21, 2011 and is subject to covenants customary to this type of transac-tion, including a default provision in the event that the Univer-sity’s long-term bond ratings were lowered to below a BBB- for S&P, BBB- for Fitch, and Baa3 for Moody’s.
D | Capital Appreciation Bonds
The University’s Series 1997 Utility System and the Series 1991 U.S. Environmental Protection Agency Project bond issues include capital appreciation bonds with an original issue amount of $30,379,142 and $3,828,921, respectively. These bonds are recorded in the amounts of $59,773,410 ($84,135,000 ulti-mate maturity less $24,361,590 discount) and $21,060,000 ($25,275,000 ultimate maturity less $4,215,000 accreted prin-cipal), respectively, which is the accreted value at June 30, 2010. These bonds mature in the years from 2010 to 2021.

6 32010 Comprehensive A nnua l Financia l Repor t
E | Annual Requirements
The annual requirements to pay principal and interest on the long-term obligations at June 30, 2010 are as follows:
F | Prior Year Bond Defeasance
During the prior years, the University extinguished long-term debt obligations by the issuance of new long-term debt instruments as follows:
Student Union: On August 30, 2005, the University defeased $8,750,000 of outstanding Student Fee Revenue Bonds, Series 2000. Securities were deposited into an irrevocable trust with an escrow agent to provide for all future debt service payments on the defeased bonds. The trust assets and the liability for the defeased bonds are not included in the Statement of Net Assets. At June 30, 2010, the outstanding balance of the defeased Student Fee Revenue Bonds, Series 2000 bonds was $0.
General Revenue Bonds, Series 2001A: On August 30, 2005, the University defeased $33,310,000 of outstanding General Revenue Bonds, Series 2001A. Securities were deposited into an irrevocable trust with an escrow agent to provide for all future debt service payments on the defeased bonds. The trust assets and the liability for the defeased bonds are not included in the Statement of Net Assets. At June 30, 2010, the outstanding balance of the defeased General Revenue Bonds, Series 2001A bonds was $33,310,000.
G | Notes Payable
The University was indebted for notes payable for the purposes shown in the following table:
2011 $28,515,000 $52,375,609 $2,600,522 $350,000 $666,000 2012 29,250,000 51,465,024 2,445,612 665,471 2013 29,690,000 50,747,639 2,285,681 45,750,000 1,788 2014 28,695,000 50,210,269 2,090,008 2015 29,405,000 49,645,054 1,938,274 2016–2020 133,865,000 239,046,597 7,244,455 2021–2025 144,710,000 219,750,357 3,178,587 2026–2030 154,180,000 185,460,003 132,336 2031–2035 497,560,000 116,319,897 2036–2040 166,980,000 13,827,048
Total Requirements $1,242,850,000 $1,028,847,497 $21,915,475 $46,100,000 $1,333,259
Interest Rate Fiscal Year Principal Interest Swaps, Net* Principal Interest
Interest on the variable rate General Revenue Bonds 2001B is calculated at 0.18% at June 30, 2010.Interest on the variable rate General Revenue Bonds 2001C is calculated at 0.15% at June 30, 2010.Interest rates are reset each week by the remarketing agent based upon a combination of the University’s credit rating and market conditions.
This schedule also includes the debt service requirements for debt associated with interest rate swaps.More detailed information about interest rate swaps is presented in Note 4.*Computed using (5.24% – 0.25) X ($22,000,000 – annual swap reduction) and (3.314 – 0.348) X $54,230,000 notional amount.
Bonds Payable
Annual Requirements
Notes Payable
Real Property Purchases Bank of America 1.597% 06/30/11 $675,000 $325,000 $350,000 Real Property Purchases Bank of America 1.454% 07/01/12 $45,750,000 45,750,000
Total Notes Payable $675,000 $45,750,000 $325,000 $46,100,000
Beginning Principal Financial Interest Final Balance Outstanding Purpose Institution Rate Maturity Date 07/01/09 Draws Repayments 06/30/10

T h e U n i v e r s i T y o f n o r T h C a r o l i n a a t C h a p e l h i l l6 4
Rental expense for all operating leases during the year was $18,342,988.
The UNC-Chapel Hill Foundation, part of the University’s reporting entity, has a line of credit agreement issued by Bank of America, originally in the aggregate principal amount up to $10,000,000 to finance the costs of projects benefiting the foundation or the University. The line of credit had a maturity date of August 30, 2009 but was extended to June 30, 2011. The aggregate principal amount remained at $6,000,000. Advances under the line of credit accrue interest at the variable rate of the LIBOR Market Index plus 1.25 percent. An unused commitment fee is due each quarter calculated as 0.25 percent of the differ-ence between the commitment amount and the average balance outstanding for the quarter through June 30, 2005, and 0.215 percent thereafter. The University repays draws on the note with capital improvement funds designated for land acquisition.
On July 1, 2009, the UNC Chapel Hill Foundation, Inc. and Chapel Hill Foundation Real Estate Holdings Inc., (collectively, the Borrowers), entered into a loan agreement with the Bank of America, N.A. for $45,750,000 to fund the acquisition of student housing and rental real property. Interest payments are made quarterly at the variable rate of the BBA LIBOR Daily Floating Rate plus 1.10 percent. The principal balance of the loan is due at maturity. A one-time loan fee of 0.25 percent of the Commitment was paid on the effective date of the agree-ment. The loan is unsecured, but is governed by a loan agree-ment with financial and other covenants on the Borrowers. The loan matures on July 1, 2012.
H | Annuities Payable
The University participates in split-interest agreements with donors that require benefits payments for a specified period to a designated beneficiary out of assets held in trust for this pur-pose. At the end of the predetermined period (e.g., the lifetime of the beneficiary specified by the donor), the remaining assets of the trust revert to the University for its use or for a purpose specified by the donor. At the end of each fiscal year, annuities and life income payable to the beneficiaries is calculated using IRS issued 90CM table, taking into consideration beneficiary’s age and the amount of the gift, and using IRS issued Life Table 90CM.
noTe 10 Lease Obligations
2011 $1,456,980 2012 1,403,000 2013 673,497 2014 608,415 2015 605,021 2016–2020 149,558
Total Minimum Lease Payments 4,896,471
Amount Representing Interest (0%–24.1% Rate of Interest) 1,434,660
Present Value of Future Lease Payments $3,461,811
Fiscal Year Amount
2011 $7,088,088 2012 3,790,201 2013 2,909,044 2014 351,736 2015 171,514 2016–2020 91,949 2021–2025 42,240 2026–2030 42,240 2031–2035 6,336
Total Minimum Lease Payments $14,493,348
Fiscal Year Amount
A | Capital Lease Obligations
Capital lease obligations relating to medical and research equipment are recorded at the present value of the minimum lease payments. Future minimum lease payments under capital lease obligations consist of the following at June 30, 2010:
Machinery and equipment acquired under capital lease amounted to $4,470,577 at June 30, 2010.
B | Operating Lease Obligations
Future minimum lease payments under non-cancelable operating leases consist of the following at June 30, 2010:

6 52010 Comprehensive A nnua l Financia l Repor t
C | Other Lease Obligations
The UNC-Chapel Hill Foundation issued certificates of participation to provide for construction of alumni facilities. The University constructed the facilities as an agent for the UNC-Chapel Hill Foundation. In October 1989, the University entered into a 20-year lease agreement with the UNC-Chapel Hill Foundation and simultaneously entered into a sublease agreement with the General Alumni Association, an affiliated organization, for the same time period for the use of the alumni facilities. Legal interpretation of the sublease agreement assigned the debt obligation to the General Alumni Association.
Payments under the terms of the lease were a limited obligation of the University, payable solely from and secured by the annual rental income derived from the sublease of the alumni facilities. The University had no other obligations for repayment of the cer-tificates of participation; therefore, the certificates were not reported as a liability in prior year financial statements. The University paid the certificates’ aggregate principal amount of $9,950,000 in October 2009 and recorded the facilities as a capital asset at June 30, 2010.
A summary of eliminations and allowances by revenue classification is presented as follows:
noTe 11 Revenues
Operating Revenues
Student Tuition and Fees $317,817,133 $68,734,495 $249,082,638
Patient Services $597,853,986 ($22,517,787) $377,614,690 $242,757,083
Sales and Services Residential Life $59,898,831 $48,890 $10,150,791 $49,699,150 Dining 29,378,488 1,278 29,377,210 Student Union Services 586,657 577,631 9,026 Health, Physical Education, and Recreation Services 6,809,684 2,000 360,902 6,446,782 Bookstore 26,749,546 1,152,106 809,955 24,787,485 Parking 22,263,282 22,263,282 Athletic 47,681,789 24,425 47,657,364 Utilities 125,446,425 95,809,611 29,636,814 Telecommunications 17,802,481 14,454,694 3,347,787 Other Professional Income 85,523,612 6,269,096 79,254,516 Printing/Carolina Copy 7,043,448 4,062,560 2,980,888 Repairs & Maintenance 28,175,286 27,079,270 1,096,016 Materials Management and Disbursements 3,144,772 3,094,573 50,199 Rental Property 5,679,842 111,455 5,568,387 Carolina Living & Learning Center 2,545,433 2,545,433 Performing Arts Series 1,520,160 1,520,160 KFBS Center 2,360,590 2,360,590 Trademark License Program 4,830,103 4,830,103 UNC Management Company 6,560,908 6,560,908 School of Government 4,604,382 4,604,382 Other 67,273,883 37,431,831 29,842,052
Total Sales and Services $555,879,602 $190,119,420 $11,321,648 $0 $0 $354,438,534
Non-operating – Non-capital Gifts $76,015,359 $134,189 $75,881,170
Less Indigent Care Internal Less Less Change in and Gross Sales Scholarship Allowance for Contractual Net Revenues Eliminations Discounts Uncollectibles Adjustments Revenues

T h e U n i v e r s i T y o f n o r T h C a r o l i n a a t C h a p e l h i l l6 6
noTe 12 Operating Expenses by Function
The University’s operating expenses by functional classification are presented as follows:
Instruction $524,684,780 $25,167,214 $134,817,384 $166,244 $684,835,622 Research 263,254,060 51,799,142 115,673,625 590,270 431,317,097 Public Service 64,854,224 12,129,018 60,947,215 113,341 138,043,798 Academic Support 76,500,833 13,446,204 17,723,357 135,616 107,806,010 Student Services 14,397,566 925,671 11,637,609 425 26,961,271 Institutional Support 58,773,567 3,052,868 22,091,314 44,126 83,961,875 Operations and Maintenance of Plant 45,282,795 3,587,669 16,999,380 70,138,695 136,008,539 Student Financial Aid $69,082,962 69,082,962 Auxiliary Enterprises 293,000,855 46,296,652 158,894,088 10,021,396 508,212,991 Depreciation/Amortization $90,860,983 90,860,983
Total Operating Expenses $1,340,748,680 $156,404,438 $538,783,972 $69,082,962 $81,210,113 $90,860,983 $2,277,091,148
Salaries Supplies Scholarships and Benefits and Materials Services and Fellowships Utilities Depreciation Total
A | Retirement Plans
Each permanent full time employee, as a condition of employ-ment, is a member of either the Teachers’ and State Employees’ Retirement System or the Optional Retirement Program. Eligible employees can elect to participate in the Optional Retirement Program at the time of employment, otherwise they are automatically enrolled in the Teachers’ and State Employees’ Retirement System.
The Teachers’ and State Employees’ Retirement System is a cost sharing multiple employer defined benefit pension plan estab-lished by the State to provide pension benefits for employees of the State, its component units, and local boards of education. The plan is administered by the North Carolina State Treasurer.
Benefit and contribution provisions for the Teachers’ and State Employees’ Retirement System are established by North Carolina General Statutes 135 5 and 135 8 and may be amended only by the North Carolina General Assembly. Employer and member contribution rates are set each year by the North Carolina General Assembly based on annual actuarial valua-tions. For the year ended June 30, 2010, these rates were set at 3.57 percent of covered payroll for employers and 6 percent of covered payroll for members.
For the current fiscal year, the University had a total payroll of $1,144,377,392, of which $465,899,657 was covered under the Teachers’ and State Employees’ Retirement System. Total employer and employee contributions for pension benefits for the year were $16,632,618 and $27,953,979, respectively.
Required employer contribution rates for the years ended June 30, 2009, and 2008, were 3.36 percent and 3.05 percent, respec-tively, while employee contributions were 6 percent each year. The University made 100 percent of its annual required contribu-tions for the years ended June 30, 2010, 2009, and 2008, which were $16,632,618, $15,756,451, and $13,032,159, respectively.
The Teachers’ and State Employees’ Retirement System’s financial information is included in the State of North Carolina’s Comprehensive Annual Financial Report. An electronic version of this report is available by accessing the North Carolina Office of the State Controller’s Internet home page http://www.osc.nc.gov/ and clicking on “Proceed directly to OSC’s index page,” then “Reports,” or by calling the State Controller’s Financial Reporting Section at (919) 981 5454.
The Optional Retirement Program (Program) is a defined contribution retirement plan that provides retirement benefits with options for payments to beneficiaries in the event of the participant’s death. Administrators and eligible faculty of the University may join the Program instead of the Teachers’ and State Employees’ Retirement System. The Board of Governors of The University of North Carolina is responsible for the adminis-tration of the Program and designates the companies authorized to offer investment products or the trustee responsible for the investment of contributions under the Program and approves the form and contents of the contracts and trust agreements.
Participants in the Program are immediately vested in the value of employee contributions. The value of employer contri-butions is vested after five years of participation in the Program. Participants become eligible to receive distributions when they terminate employment or retire.
noTe 13 Pension Plans

6 72010 Comprehensive A nnua l Financia l Repor t
Participant eligibility and contributory requirements are established by General Statute 135 5.1. Employer and member contribution rates are set each year by the North Carolina General Assembly. For the year ended June 30, 2010, these rates were set at 6.84 percent of covered payroll for employers and 6 percent of covered payroll for members. The University assumes no liability other than its contribution.
For the current fiscal year, the University had a total pay-roll of $1,144,377,392, of which $466,394,293 was covered under the Optional Retirement Program. Total employer and employee contributions for pension benefits for the year were $31,901,370 and $27,983,658, respectively.
B | Deferred Compensation and Supplemental Retirement Income Plans
IRC Section 457 Plan – The State of North Carolina offers its permanent employees a deferred compensation plan created in accordance with Internal Revenue Code Section 457 through the North Carolina Public Employee Deferred Compensation Plan (the Plan). The Plan permits each participating employee to defer a portion of his or her salary until future years. The deferred compensation is available to employees upon separa-tion from service, death, disability, retirement, or financial hardships if approved by the Board of Trustees of the Plan. The Board, a part of the North Carolina Department of Administra-tion, maintains a separate fund for the exclusive benefit of the participating employees and their beneficiaries, the North Caro-lina Public Employee Deferred Compensation Trust Fund. The Board also contracts with an external third party to perform certain administrative requirements and to manage the trust fund’s assets. All costs of administering and funding the Plan are the responsibility of the Plan participants. No costs are incurred by the University. The voluntary contributions by employees amounted to $7,984,418 for the year ended June 30, 2010.
IRC Section 401(k) Plan – All members of the Teachers’ and State Employees’ Retirement System and the Optional Retirement Program are eligible to enroll in the Supplemental Retirement Income Plan, a defined contribution plan, cre-ated under Internal Revenue Code Section 401(k). All costs of administering the Plan are the responsibility of the Plan par-ticipants. No costs are incurred by the University except for a 5 percent employer contribution for the University’s law enforce-ment officers, which is mandated under General Statute 143 166.30(e). Total employer contributions on behalf of University law enforcement officers for the year ended June 30, 2010, were $123,490. The voluntary contributions by employees amounted to $3,638,752 for the year ended June 30, 2010.
IRC Section 403(b) and 403(b)(7) Plans – Eligible Univer-sity employees can participate in tax sheltered annuity plans created under Internal Revenue Code Sections 403(b) and 403(b)(7). The employee’s eligible contributions, made through salary reduction agreements, are exempt from federal and State income taxes until the annuity is received or the contributions are withdrawn. These plans are exclusively for employees of universities and certain charitable and other nonprofit institu-tions. All costs of administering and funding these plans are the responsibility of the Plan participants. No costs are incurred by the University. The voluntary contributions by employees amounted to $24,036,209 for the year ended June 30, 2010.
A | Health Benefits
The University participates in the Comprehensive Major Medi-cal Plan (the Plan), a cost sharing, multiple employer defined benefit health care plan that provides postemployment health insurance to eligible former employees. Eligible former employ-ees include long term disability beneficiaries of the Disability Income Plan of North Carolina and retirees of the Teachers’ and State Employees’ Retirement System or the Optional Retire-ment Program. Coverage eligibility varies depending on years of contributory membership service in their retirement system prior to disability or retirement.
The Plan’s benefit and contribution provisions are established by North Carolina General Statute 135 7 and Chapter 135, Article 3A, of the General Statutes and may be amended only by the North Carolina General Assembly. The Plan does not provide for automatic post retirement benefit increases.
By General Statute, a Retiree Health Benefit Fund (the Fund) has been established as a fund in which accumulated contribu-tions from employers and any earnings on those contributions shall be used to provide health benefits to retired and disabled employees and applicable beneficiaries. By statute, the Fund is administered by the Board of Trustees of the Teachers’ and State Employees’ Retirement System and contributions to the fund are irrevocable. Also by law, Fund assets are dedicated to provid-ing benefits to retired and disabled employees and applicable beneficiaries and are not subject to the claims of creditors of the employers making contributions to the Fund. Contribution rates to the Fund, which are intended to finance benefits and administrative expenses on a pay as you go basis, are deter-mined by the General Assembly.
For the current fiscal year the University contributed 4.5 percent of the covered payroll under the Teachers’ and State
noTe 14 Other Postemployment Benefits

T h e U n i v e r s i T y o f n o r T h C a r o l i n a a t C h a p e l h i l l6 8
Employees’ Retirement System and the Optional Retirement Program to the Fund. Required contribution rates for the years ended June 30, 2009, and 2008, were 4.1 percent and 4.1 per-cent, respectively. The University made 100 percent of its annual required contributions to the Plan for the years ended June 30, 2010, 2009, and 2008, which were $41,953,228, $37,956,143, and $34,676,317, respectively. The University assumes no liabil-ity for retiree health care benefits provided by the programs other than its required contribution.
Additional detailed information about these programs can be located in the State of North Carolina’s Comprehensive Annual Financial Report. An electronic version of this report is available by accessing the North Carolina Office of the State Controller’s Internet home page http://www.osc.nc.gov/ and clicking on “Proceed directly to OSC’s index page,” then “Reports,” or by calling the State Controller’s Financial Reporting Section at (919) 981 5454.
B | Disability Income
The University participates in the Disability Income Plan of North Carolina (DIPNC), a cost sharing, multiple employer defined benefit plan, to provide short term and long term dis-ability benefits to eligible members of the Teachers’ and State Employees’ Retirement System and the Optional Retirement Program. Benefit and contribution provisions are established by Chapter 135, Article 6, of the General Statutes, and may be amended only by the North Carolina General Assembly. The plan does not provide for automatic post retirement benefit increases.
Disability income benefits are funded by actuarially deter-mined employer contributions that are established by the Gen-eral Assembly. For the fiscal year ended June 30, 2010, the Uni-versity made a statutory contribution of 0.52 percent of covered payroll under the Teachers’ and State Employees’ Retirement System and the Optional Retirement Program to the DIPNC. Required contribution rates for the years ended June 30, 2009, and 2008, were 0.52 percent and 0.52 percent, respectively. The University made 100 percent of its annual required contribu-tions to the DIPNC for the years ended June 30, 2010, 2009, and 2008, which were $4,847,929, $4,813,950, and $4,397,972, respectively. The University assumes no liability for long term disability benefits under the Plan other than its contribution.
Additional detailed information about the DIPNC is disclosed in the State of North Carolina’s Comprehensive Annual Financial Report.
The University is exposed to various risks of loss related to torts; theft of, damage to, and destruction of assets; errors and omissions; injuries to employees; and natural disasters. These exposures to loss are handled via a combination of methods, including participation in state administered insurance pro-grams, purchase of commercial insurance, and self retention of certain risks. Settled claims have not exceeded coverage in any of the past three fiscal years.
Public Officer’s and Employee’s Liability Insurance – Tort claims of up to $1,000,000 are retained under the authority of the State Tort Claims Act. In addition, the state provides excess public officers’ and employees’ liability insurance up to $10,000,000 through a contract with a private insurance com-pany. The University pays the premium, based on a composite rate, directly to the private insurer.
System Fund (blended component unit) Liability Insurance – The System Fund is exposed to various risks of loss related to torts, theft of assets, and errors and omissions. The Manage-ment Company is a separate legal entity from The University of North Carolina System and the University. However, the Management Company’s employees conduct System Fund’s affairs. Therefore, exposures to loss are handled by the purchase of commercial insurance by the Management Company. This insurance is independent of the risk management programs of The University of North Carolina System and the University.
Fire and Other Property Loss – The University is required to maintain fire and lightning coverage on all state owned buildings and contents through the State Property Fire Insur-ance Fund (Fund), an internal service fund of the state. Such coverage is provided at no cost to the University for operations supported by the state’s General Fund. Other operations not supported by the state’s General Fund are charged for the coverage. Losses covered by the Fund are subject to a $5,000 per occurrence deductible. The University reduced its property insurance from the previous year by eliminating campus-wide extended coverage purchased from the Fund.
Automobile Liability Insurance – All state owned vehicles are covered by liability insurance through a private insurance company and handled by the North Carolina Department of Insurance. The liability limits for losses are $1,000,000 per claim and $10,000,000 per occurrence. The University pays premiums to the North Carolina Department of Insurance for the coverage.
Employee and Computer Fraud – The University is protected for losses from employee dishonesty and computer fraud. This coverage is with a private insurance company and is handled by the North Carolina Department of Insurance. Universities are charged a premium by the private insurance company. Cover-age limit is $5,000,000 per occurrence. The private insurance
noTe 15 Risk Management

6 92010 Comprehensive A nnua l Financia l Repor t
company pays 90 percent of each loss less a $75,000 deductible. Other authorized coverage not handled by the North
Carolina Department of Insurance is purchased through the state’s insurance agent of record. Examples include, but are not limited to, fine arts, boiler and machinery, medical professional liability, athletic accident and revenues, and study abroad health insurance.
Comprehensive Major Medical Plan – University employees and retirees are provided comprehensive major medical care benefits. Coverage is funded by contributions to the State Health Plan (Plan), a component unit of the State of North Carolina. The Plan has contracted with third parties to process claims.
The North Carolina Workers’ Compensation Program provides benefits to workers injured on the job. All employees of the state and its component units are included in the program. When an employee is injured, the University’s primary responsibility is to arrange for and provide the necessary treatment for work related injury. The University is responsible for paying medi-cal benefits and compensation in accordance with the North Carolina Workers’ Compensation Act. The University retains the risk for workers’ compensation.
Liability Insurance Trust Fund – The University participates in the Liability Insurance Trust Fund (Trust Fund), a claims-ser-vicing public entity risk pool for healthcare professional liability protection. The Trust Fund services professional liability claims, managing separate accounts for each participant from which the losses of that participant are paid. Although participant assess-ments are determined on an actuarial basis, ultimate liability for claims remains with the participants and, accordingly, the insurance risks are not transferred to the Trust Fund.
The Trust Fund is an unincorporated entity created by Chapter 116, Article 26, of the North Carolina General Statutes and The University of North Carolina Board of Governors Resolution of June 9, 1978. The Trust Fund is a self-insurance program estab-lished to provide professional medical malpractice liability cover-ing The University of North Carolina Hospitals at Chapel Hill (UNC Hospitals) and The University of North Carolina at Chapel Hill Physicians and Associates (UNC P&A), the program partici-pants. The Trust Fund provides coverage for program participants and individual health care practitioners working as employees, agents, or officers of program participants. The Trust Fund is exempt from federal and state income taxes, and is not subject to regulation by the North Carolina Department of Insurance.
Participation in the Trust Fund is open to the University of North Carolina, any constituent institution of the University of North Carolina, the UNC Hospitals, and any health care institu-tion, agency or entity that has an affiliation agreement with the University of North Carolina, with a constituent institution of the University of North Carolina, or with the UNC Hospitals. Only the UNC P&A and the UNC Hospitals have participated in the Trust Fund to date. Participants provide management and
administrative services to the Trust Fund at no cost. The Trust Fund is governed by the Liability Insurance Trust
Fund Council (the Council). The Council consists of 13 members as follows: one member each appointed by the State Attorney General, the State Auditor, the State Insurance Commissioner, the Director of the Office of State Budget and Management, the State Treasurer, (each serving at the pleasure of the appointer); and eight members appointed to three-year terms (with no limit on the number of terms) by the UNC System’s Board of Governors.
The Trust Fund establishes claim liabilities based on estimates of the ultimate cost of claims (including future expenses and claim adjustment expenses) that have been reported but not settled and of claims incurred but not reported. Claim liabilities are recomputed annually based on an independent actuary’s study to produce current estimates that reflect recent settle-ments, claims frequency, inflation, and other factors. Participant assessments are determined at a level to fund claim liabilities, discounted for future investment earnings. Each participant is required by statute to maintain a fund balance of $100,000 at all times. Participants are subject to additional premium assess-ments in the event of deficiencies.
For the period July 1, 2009 through June 30, 2010, the Trust Fund provided coverage on an occurrence basis of $3,000,000 per individual and $7,000,000 in the aggregate per claim. Effective July 1, 2006, in lieu of purchasing commercial reinsur-ance, participants contributed approximately $10,000,000 to a reimbursement fund for future losses. Prior to July 1, 2006, the Trust Fund entered into an excess of loss agreement with an unaffiliated reinsurer. In addition during FY 2010, the partici-pants contributed an additional $1,006,106 to replenish the Reimbursement Fund to its original $10,000,000 level.
For the fiscal year ending June 30, 2010, the Trust Fund purchased a direct insurance policy to cover the first $1,000,000 per occurrence and $3,000,000 in the aggregate for dental residents. North Carolina General Statutes Chapter 116 was amended during 1987 to authorize the Trust Fund to borrow necessary amounts up to $30,000,000, in the event that the Trust Fund may have insufficient funds to pay existing and future claims. Any such borrowing would be repaid from the assets and revenues of program participants. No line of credit or borrowing has been established pursuant to this authorization. The Council believes adequate funds are on deposit in the Trust Fund to meet estimated losses based upon the results of the independent actuary’s report.
The Trust Fund has purchased annuity contracts to settle claims for which the claimant has signed an agreement releasing the Fund from further obligation. The related claim liabilities have been removed from estimated malpractice costs.
The Council may choose to terminate the Trust Fund, or the respective participants may choose to terminate their

T h e U n i v e r s i T y o f n o r T h C a r o l i n a a t C h a p e l h i l l7 0
participation. In the event of such termination by either the Council or a participant, an updated actuarial study will be per-formed to determine amounts due to or from the participants based on loss experience up to the date of termination.
At June 30, 2010, University assets in the Trust Fund totaled $36,165,415 while University liabilities totaled $26,100,073 resulting in net assets of $10,065,342.
Additional disclosures about the funding status and obliga-tions of the Trust Fund are set forth in the Audited Financial Statements of the Liability Insurance Trust Fund. Copies of this report may be obtained from The University of North Carolina Health Care System, 211 Friday Center Drive, Hedrick Building, Room 2029, Chapel Hill, NC 27517.
Term life insurance (death benefits) of $25,000 to $50,000 is provided to eligible workers. This Death Benefit Plan is adminis-tered by the State Treasurer and funded via employer contribu-tions. The employer contribution rate was 0.16 percent for the current fiscal year.
Additional details on the state administered risk management programs are disclosed in the State’s Comprehensive Annual Financial Report, issued by the Office of the State Controller.
A | Commitments
The University has commitments of $149,104,017 for various cap-ital improvements projects that include construction and comple-tion of new buildings, and renovations of existing buildings.
The UNC Investment Fund, LLC (System Fund) has entered into agreements with limited partnerships to invest capital. These agreements represent the funding of capital over a desig-nated period of time and are subject to adjustments. As of June 30, 2010, the System Fund had approximately $509,898,500 unfunded committed capital.
B | Pending Litigation and Claims
The Supreme Court of North Carolina issued a ruling on July 1, 2005 regarding litigation between North Carolina School Boards Association, et. al. v. Richard H. Moore, State Treasurer, et. al. which involves various state officials in their official capac-ity seeking a judicial determination as to whether the state constitution requires certain monetary payments collected by state agencies to be paid to the local county school funds rather than statutorily designated recipients. The complaint alleged in part that the monetary payments collected pursuant to statu-tory authority by the University for violations of parking and
traffic regulations and library fines are “civil penalties” which the state constitution requires to be paid to the school fund in the county where they are collected. The lawsuit sought declara-tory judgment that the State Civil Penalty and Forfeiture Fund, the State School Technology Fund, and the Public Settlement Reserve Fund are unconstitutional. The North Carolina Supreme Court affirmed the Court of Appeals ruling that library fines are not civil penalties. The North Carolina Supreme Court reversed the ruling that fines for parking and traffic regulations are not civil penalties.
The University of North Carolina at Chapel Hill, a constitu-ent university of the UNC System, has collected $10,097,719 representing net fines from the Department of Public Safety from January 1, 1996 through June 30, 2005. Of that amount 10 percent may be retained by the University to fund related operating expenses. Therefore, approximately $9,087,947 may be payable by the University. Collected fines of $3,587,768 remain unexpended. Annual fines are approximately $850,000. Fines net of approved operating expenses have been remitted to the State Treasurer on a monthly basis beginning July 1, 2005.
On August 8, 2008 a ruling was made by the Superior Court Division resulting in a judgment entered against the UNC System for $42,368,982 to be paid into the Civil Penalty and Forfeiture Fund for distribution to the public schools pursu-ant to G.S. 115C-457.1 and Article IX, Section 7 of the North Carolina Constitution. Settlement of the obligation is being facilitated by the General Assembly.
In January of 2009, the plaintiffs filed a Motion for Addi-tional Relief with the court requesting that the plaintiffs be paid $18,183,251 that the various University campuses have placed in escrow from 2001 through 2005. The University of North Carolina at Chapel Hill’s share of that $18,183,251 is $3,907,525. The plaintiff’s motion was heard and denied. The plaintiffs appealed the denial before the Court of Appeals.
On August 7, 2009, the General Assembly of North Carolina enacted Session Law 2009-451, Section 5.1.(b) requiring that all University of North Carolina campuses remit all parking fines held in escrow in the amount of $18,183,251 to the Civil Penalty and Forfeiture Fund for appropriation. The University recorded a liability of $3,907,525 at June 30, 2009 for its share of the escrow amount. The University remitted $3,516,772 in Novem-ber 2009 representing the amount of the recorded liability less 10% collection costs.
The University is undertaking environmental remediation efforts on the Old Sanitary Landfill. The amount of the liability associated with this site cannot reasonably be estimated at this time.
The University is a party to other litigation and claims in the ordinary course of its operations. Since it is not possible to pre-dict the ultimate outcome of these matters, no provision for any liability has been made in the financial statements. University management believes that the liability, if any, for any of these
noTe 16 Commitments and Contingencies

7 12010 Comprehensive A nnua l Financia l Repor t
matters will not have a material adverse effect on the financial position of the University.
C | Other Contingent Receivables
The University has received notification of other gifts and grants for which funds have not been disbursed by the resource pro-vider and for which conditions attached to the gift or grant have not been satisfied or, in the case of permanent endowments, cannot begin to be satisfied. In accordance with accounting principles generally accepted in the United States of America, these amounts have not been recorded on the accompanying financial statements. The purpose and amount of other contin-gent receivables at year-end is as follows:
There are 14 separately incorporated non-profit foundations associated with the University. These foundations are the Botani-cal Garden Foundation, Inc., The Dental Alumni Association, Inc., The Dental Foundation of North Carolina, Inc., The Educational Foundation, Inc., The General Alumni Association, The School of Government Foundation, Inc., The Morehead-Cain Scholarship Fund, The Pharmacy Foundation of North Carolina, Inc., The School of Journalism and Mass Communication Foundation of North Carolina, Inc., The University of North Carolina at Chapel Hill Public Health Foundation, Inc., The University of North Caro-lina at Chapel Hill School of Nursing Foundation, Inc., The School of Social Work Foundation, Inc., James B. Hunt, Jr. Institute for Educational Leadership and Policy Foundation, Inc., and Carolina for Kibera, Inc. Some of these organizations serve, in conjunc-tion with the University’s component units (See Note 1A), as the primary fundraising arm of the University through which indi-viduals, corporations, and other organizations support University programs by providing scholarships, fellowships, faculty salary supplements, and unrestricted funds to specific colleges and the University’s overall academic environment. The alumni associations provide educational opportunities or other services to alumni. The University’s financial statements do not include the assets, liabili-ties, net assets, or operational transactions of these organizations, except for support from each organization to the University. This support totaled $11,878,662 for the year ended June 30, 2010.
The University is a member of the Southern Observatory for Astronomical Research Consortium (SOAR), a joint venture accounted for under the equity method. The University is partners with Michigan State University, the Association of Universities for Research in Astronomy, and the Ministry of Science and Technology of the Federal Republic of Brazil. SOAR designed, constructed, and now operates a 4.0-meter telescope with instrumentation and related support buildings located at Cerro Pachon, a mountain in central Chile. The SOAR agreement allocates the University 15.6 percent of observing time until 2023. The audited financial statements for SOAR may be obtained from the University Controller’s Office, Campus Box 1270, Chapel Hill, NC 27599-1270, or by calling (919) 962-1370.
For the fiscal year ended June 30, 2010, the University implemented the following pronouncements issued by the Governmental Accounting Standards Board (GASB):
GASB Statement No. 51, Accounting and Financial Reporting for Intangible Assets.
GASB Statement No. 53, Accounting and Financial Reporting for Derivative Instruments.
GASB Statement No. 51, requires reporting certain intangible assets as capital assets.
GASB Statement No. 53, requires reporting certain derivative instruments at fair value.
On September 14, 2010, the University purchased renovations to Kenan Stadium from the Educational Foundation, Inc. for $24,995,000. On November 18, 2009, the State in care of the University entered into a ground lease with the Educational Foundation, Inc. The lease allowed the Educational Foundation, Inc. to add a fifth-floor on and renovate existing offices and team facilities in the Kenan Football Center.
Pledges to permanent endowments $25,813,241
Purpose Amount
noTe 17 Related Parties
noTe 18 Investment in Joint Venture
noTe 20 Subsequent Events
noTe 19 Changes In Financial Accounting and Reporting

sT
aT
isT
iCa
l s
eC
Tio
n


T h e U n i v e r s i T y o f n o r T h C a r o l i n a a t C h a p e l h i l l7 4
sT
aT
isT
iCa
l
Table of Contents
finanCi al Trends
T hese schedu les conta in trend infor mation to
help the reader understand how the Universit y ’s
f inancia l per for mance has changed over t ime.
| Net Assets by Component
| Changes in Net Assets
| Changes in Net Assets Adjusted for Inf lation
| Operating Expenses by Function
revenUe C apaCiT y
T hese schedu les conta in infor mation to help
the reader assess the Universit y ’s revenue sources.
| Revenue Base
| Academic Year Tuition and Required Fees
| Principal Revenue Payers
deBT C apaCiT y
T hese schedu les present infor mation to help
the reader assess the Universit y ’s cur rent levels
of outstanding debt.
| Long-term Debt
| Summary of Ratios
| Specific Revenue and General Revenue
Bond Coverage
deMoGr aphiC and
eConoMiC inforMaTion
T hese schedu les of fer demog raphic and economic
indicators to help the reader understand the
env ironment w ithin which the Universit y ’s f inancia l
act iv it ies ta ke place.
| Annual Undergraduate Educational
Costs Per Student
| Admissions, Enrollment and Degrees Earned
| Demographic Data
| Principal Employers
oper aTinG inforMaTion
T hese schedu les conta in ser v ice and infrastr ucture
data to help the reader understand how the
Universit y ’s f inancia l infor mation relates to the
act iv it ies it per for ms.
| Faculty and Staff
| Capital Assets
June 30, 2010Narrative to the Statistical SectionT h e U n i v e r s i T y o f n o r T h C a r o l i n a a t C h a p e l h i l l

7 52010 Comprehensive A nnua l Financia l Repor t
(as restated)
Invested in Capital Assets $1,420,104 $1,338,833 $1,290,034 $1,211,805 $1,119,040 $1,017,383 $855,740 $771,281 $668,386 Restricted, Non-expendable 621,873 586,175 548,151 493,305 430,316 378,234 328,735 323,961 304,097 Restricted, Expendable 891,182 837,154 1,199,280 1,086,353 853,133 736,631 648,019 559,128 645,390 Unrestricted 778,439 700,280 671,970 617,573 525,513 475,631 408,705 370,816 346,546
Total Net Assets $3,711,598 $3,462,442 $3,709,435 $3,409,036 $2,928,002 $2,607,879 $2,241,199 $2,025,186 $1,964,419
% % % % % % % % %
Invested in Capital Assets 38.3 38.7 34.8 35.5 38.2 39.0 38.2 38.1 34.0 Restricted, Non-expendable 16.7 16.9 14.8 14.5 14.7 14.5 14.7 16.0 15.5 Restricted, Expendable 24.0 24.2 32.3 31.9 29.2 28.2 28.9 27.6 32.9 Unrestricted 21.0 20.2 18.1 18.1 17.9 18.3 18.2 18.3 17.6
Total Net Assets 100.0 100.0 100.0 100.0 100.0 100.0 100.0 100.0 100.0
% % % % % % % % % (as restated)
Invested in Capital Assets 6.1 3.8 6.5 8.3 10.0 18.9 11.0 15.4 n/a Restricted, Non-expendable 6.1 6.9 11.1 14.6 13.8 15.1 1.5 6.5 n/a Restricted, Expendable 6.5 (30.2) 10.4 27.3 15.8 13.7 15.9 (13.4) n/a Unrestricted 11.2 4.2 8.8 17.5 10.5 16.4 10.2 7.0 n/a
Total Net Assets 7.2 (6.7) 8.8 16.4 12.3 16.4 10.7 3.1 n/a
n e T a s s e T s B y C o M p o n e n T Last nine fiscal years
Fiscal year ended June 30, 2010 2009 2008 2007 2006 2005 2004 2003 2002
Fiscal year ended June 30, 2010 2009 2008 2007 2006 2005 2004 2003 2002
Fiscal year ended June 30, 2010 2009 2008 2007 2006 2005 2004 2003 2002
in thousands
expressed as a percent of the total
percentage increase (decrease) from prior year

T h e U n i v e r s i T y o f n o r T h C a r o l i n a a t C h a p e l h i l l7 6
(as restated)
r e v e n U e s
Operating Revenues Student tuition and fees, net $249,083 $236,960 $218,763 $210,651 $195,882 $164,457 $153,943 $146,961 $124,661 Patient services, net 242,757 237,966 214,706 197,221 184,324 172,063 172,877 131,256 137,035 Federal grants and contracts 530,368 471,680 447,793 429,059 422,229 403,100 384,618 356,845 330,403 State and local grants and contracts 37,679 29,091 51,207 45,256 41,842 39,816 39,793 34,289 38,512 Non-governmental grants and contracts 120,674 123,649 115,513 92,572 89,976 81,560 75,388 64,547 75,536 Sales and services, net 354,439 321,505 349,372 324,432 301,303 290,397 270,351 262,106 246,568 Interest earnings on loans 790 801 666 679 672 1,441 435 281 121 Other operating revenues 6,485 7,835 6,232 4,574 5,283 4,167 5,233 7,283 14,629
Total operating revenues 1,542,275 1,429,487 1,404,252 1,304,444 1,241,511 1,157,001 1,102,638 1,003,568 967,465
e X p e n s e s
Operating Expenses Salaries and benefits 1,340,749 1,309,862 1,210,757 1,122,269 1,042,452 966,629 917,840 876,266 829,473 Supplies and materials 156,404 174,501 161,219 165,704 152,911 148,440 151,196 146,986 148,324 Services 538,784 533,023 526,646 462,093 432,212 407,690 380,126 377,856 364,832 Scholarships and fellowships 69,083 58,557 58,058 56,662 54,105 51,170 47,427 45,618 40,415 Utilities 81,210 77,636 66,197 60,727 56,277 47,870 46,208 43,915 45,452 Depreciation 90,861 70,747 66,413 80,827 64,475 60,102 60,589 53,076 48,517
Total operating expenses 2,277,091 2,224,326 2,089,290 1,948,282 1,802,432 1,681,901 1,603,386 1,543,717 1,477,013
Operating loss (734,816) (794,839) (685,038) (643,838) (560,921) (524,900) (500,748) (540,149) (509,548)
non-oper aT inG r evenUe s (eXpen se s)
State appropriations 509,691 518,276 543,292 492,471 440,070 406,673 380,446 368,024 368,504 State aid – federal recovery funds 32,062 20,051 0 0 0 0 0 0 0 Non-capital grants – federal student financial aid 17,099 10,170 0 0 0 0 0 0 0 Non-capital grants 155,014 143,846 102,932 62,669 67,388 62,544 53,154 40,995 34,769 Non-capital gifts, net 75,881 87,226 113,094 73,637 68,824 73,693 68,517 60,888 62,404 Investment income (loss), net 103,605 (296,904) 146,650 317,767 207,423 154,900 135,369 47,398 52,957 Interest and fees on debt (64,261) (52,465) (53,311) (42,926) (39,921) (21,823) (18,339) (15,681) (15,031) Federal interest subsidy on debt 1,130 0 0 0 0 0 0 0 0 Other non-operating revenues (expenses) (14,219) 2,359 851 146 (230) 8,374 (8,132) (1,899) (7,662)
Net non-operating revenues 816,002 432,559 853,508 903,764 743,554 684,361 611,015 499,725 495,941
Income before other revenues 81,186 (362,280) 168,470 259,926 182,633 159,461 110,267 (40,424) (13,607)
Capital appropriations 0 12,539 47,206 52,888 15,776 5,166 898 0 0 Refund of prior years capital appropriations (444) (3,317) 0 0 0 0 0 0 0 Capital grants 86,117 27,124 12,885 118,850 52,277 152,844 74,392 72,486 27,480 Capital gifts 50,688 34,686 11,596 15,662 13,368 11,521 6,359 7,553 8,238 Additions to endowments 31,609 44,255 60,242 39,442 56,069 37,688 24,098 21,153 23,283
Increase (Decrease) in Net Assets $249,156 ($246,993) $300,399 $486,768 $320,123 $366,680 $216,014 $60,768 $45,394
C h a n G e s i n n e T a s s e T s Last nine fiscal years
Fiscal year ended June 30, 2010 2009 2008 2007 2006 2005 2004 2003 2002
in thousands
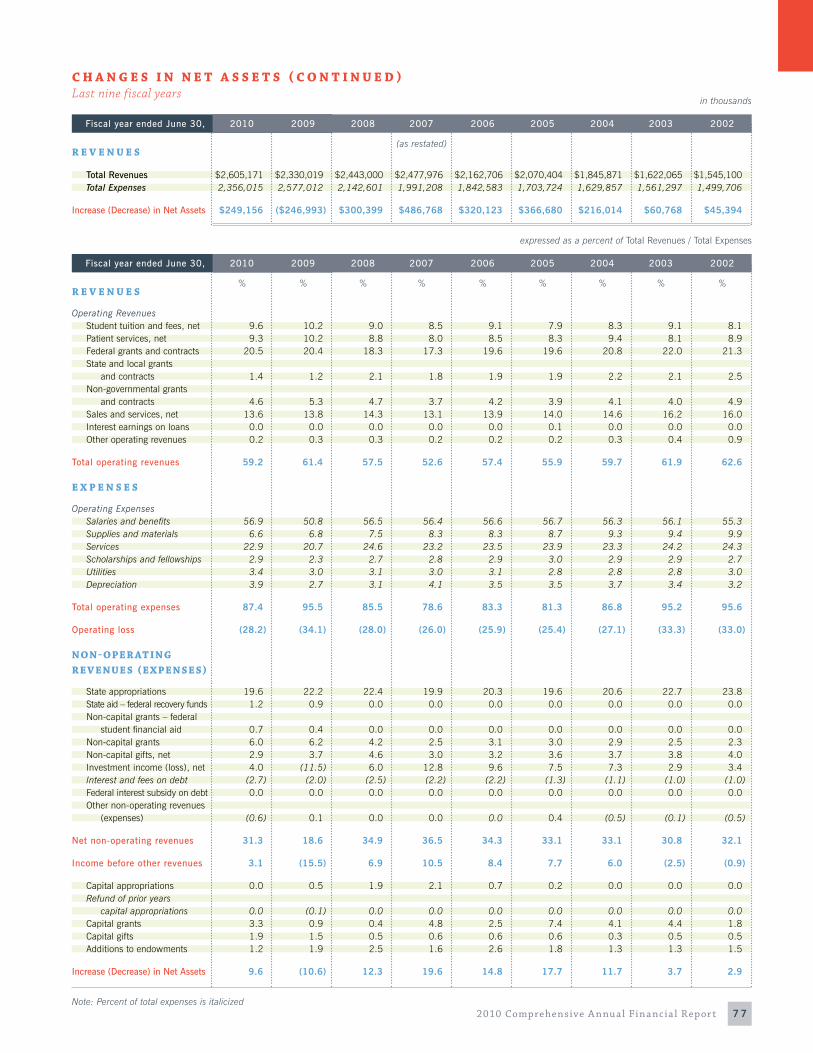
7 72010 Comprehensive A nnua l Financia l Repor t
(as restated)r e v e n U e s
Total Revenues $2,605,171 $2,330,019 $2,443,000 $2,477,976 $2,162,706 $2,070,404 $1,845,871 $1,622,065 $1,545,100 Total Expenses 2,356,015 2,577,012 2,142,601 1,991,208 1,842,583 1,703,724 1,629,857 1,561,297 1,499,706
Increase (Decrease) in Net Assets $249,156 ($246,993) $300,399 $486,768 $320,123 $366,680 $216,014 $60,768 $45,394
C h a n G e s i n n e T a s s e T s ( C o n T i n U e d ) Last nine fiscal years
Fiscal year ended June 30, 2010 2009 2008 2007 2006 2005 2004 2003 2002
in thousands
% % % % % % % % %r e v e n U e s
Operating Revenues Student tuition and fees, net 9.6 10.2 9.0 8.5 9.1 7.9 8.3 9.1 8.1 Patient services, net 9.3 10.2 8.8 8.0 8.5 8.3 9.4 8.1 8.9 Federal grants and contracts 20.5 20.4 18.3 17.3 19.6 19.6 20.8 22.0 21.3 State and local grants and contracts 1.4 1.2 2.1 1.8 1.9 1.9 2.2 2.1 2.5 Non-governmental grants and contracts 4.6 5.3 4.7 3.7 4.2 3.9 4.1 4.0 4.9 Sales and services, net 13.6 13.8 14.3 13.1 13.9 14.0 14.6 16.2 16.0 Interest earnings on loans 0.0 0.0 0.0 0.0 0.0 0.1 0.0 0.0 0.0 Other operating revenues 0.2 0.3 0.3 0.2 0.2 0.2 0.3 0.4 0.9
Total operating revenues 59.2 61.4 57.5 52.6 57.4 55.9 59.7 61.9 62.6
e X p e n s e s
Operating Expenses Salaries and benefits 56.9 50.8 56.5 56.4 56.6 56.7 56.3 56.1 55.3 Supplies and materials 6.6 6.8 7.5 8.3 8.3 8.7 9.3 9.4 9.9 Services 22.9 20.7 24.6 23.2 23.5 23.9 23.3 24.2 24.3 Scholarships and fellowships 2.9 2.3 2.7 2.8 2.9 3.0 2.9 2.9 2.7 Utilities 3.4 3.0 3.1 3.0 3.1 2.8 2.8 2.8 3.0 Depreciation 3.9 2.7 3.1 4.1 3.5 3.5 3.7 3.4 3.2
Total operating expenses 87.4 95.5 85.5 78.6 83.3 81.3 86.8 95.2 95.6
Operating loss (28.2) (34.1) (28.0) (26.0) (25.9) (25.4) (27.1) (33.3) (33.0)
non-oper aT inG r evenUe s (eXpen se s)
State appropriations 19.6 22.2 22.4 19.9 20.3 19.6 20.6 22.7 23.8 State aid – federal recovery funds 1.2 0.9 0.0 0.0 0.0 0.0 0.0 0.0 0.0 Non-capital grants – federal student financial aid 0.7 0.4 0.0 0.0 0.0 0.0 0.0 0.0 0.0 Non-capital grants 6.0 6.2 4.2 2.5 3.1 3.0 2.9 2.5 2.3 Non-capital gifts, net 2.9 3.7 4.6 3.0 3.2 3.6 3.7 3.8 4.0 Investment income (loss), net 4.0 (11.5) 6.0 12.8 9.6 7.5 7.3 2.9 3.4 Interest and fees on debt (2.7) (2.0) (2.5) (2.2) (2.2) (1.3) (1.1) (1.0) (1.0) Federal interest subsidy on debt 0.0 0.0 0.0 0.0 0.0 0.0 0.0 0.0 0.0 Other non-operating revenues (expenses) (0.6) 0.1 0.0 0.0 0.0 0.4 (0.5) (0.1) (0.5)
Net non-operating revenues 31.3 18.6 34.9 36.5 34.3 33.1 33.1 30.8 32.1
Income before other revenues 3.1 (15.5) 6.9 10.5 8.4 7.7 6.0 (2.5) (0.9)
Capital appropriations 0.0 0.5 1.9 2.1 0.7 0.2 0.0 0.0 0.0 Refund of prior years capital appropriations 0.0 (0.1) 0.0 0.0 0.0 0.0 0.0 0.0 0.0 Capital grants 3.3 0.9 0.4 4.8 2.5 7.4 4.1 4.4 1.8 Capital gifts 1.9 1.5 0.5 0.6 0.6 0.6 0.3 0.5 0.5 Additions to endowments 1.2 1.9 2.5 1.6 2.6 1.8 1.3 1.3 1.5
Increase (Decrease) in Net Assets 9.6 (10.6) 12.3 19.6 14.8 17.7 11.7 3.7 2.9
Fiscal year ended June 30, 2010 2009 2008 2007 2006 2005 2004 2003 2002
expressed as a percent of Total Revenues / Total Expenses
Note: Percent of total expenses is italicized

T h e U n i v e r s i T y o f n o r T h C a r o l i n a a t C h a p e l h i l l7 8
% % % % % % % % % (as restated)
r e v e n U e s
Operating Revenues Student tuition and fees, net 5.1 8.3 3.9 7.5 19.1 6.8 4.8 17.9 n/a Patient services, net 2.0 10.8 8.9 7.0 7.1 (0.5) 31.7 (4.2) n/a Federal grants and contracts 12.4 5.3 4.4 1.6 4.7 4.8 7.8 8.0 n/a State and local grants and contracts 29.5 (43.2) 13.1 8.2 5.1 0.1 16.1 (11.0) n/a Non-governmental grants and contracts (2.4) 7.0 24.8 2.9 10.3 8.2 16.8 (14.5) n/a Sales and services, net 10.2 (8.0) 7.7 7.7 3.8 7.4 3.1 6.3 n/a Interest earnings on loans (1.4) 20.3 (1.9) 1.0 (53.4) 231.3 54.8 132.2 n/a Other operating revenues (17.2) 25.7 36.2 (13.4) 26.8 (20.4) (28.1) (50.2) n/a
Total operating revenues 7.9 1.8 7.7 5.1 7.3 4.9 9.9 3.7 n/a
e X p e n s e s
Operating Expenses Salaries and benefits 2.4 8.2 7.9 7.7 7.8 5.3 4.7 5.6 n/a Supplies and materials (10.4) 8.2 (2.7) 8.4 3.0 (1.8) 2.9 (0.9) n/a Services 1.1 1.2 14.0 6.9 6.0 7.3 0.6 3.6 n/a Scholarships and fellowships 18.0 0.9 2.5 4.7 5.7 7.9 4.0 12.9 n/a Utilities 4.6 17.3 9.0 7.9 17.6 3.6 5.2 (3.4) n/a Depreciation 28.4 6.5 (17.8) 25.4 7.3 (0.8) 14.2 9.4 n/a
Total operating expenses 2.4 6.5 7.2 8.1 7.2 4.9 3.9 4.5 n/a
Operating loss (7.6) 16.0 6.4 14.8 6.9 4.8 (7.3) 6.0 n/a
non-oper aT inG r evenUe s (eXpen se s)
State appropriations (1.7) (4.6) 10.3 11.9 8.2 6.9 3.4 (0.1) n/a State aid – federal recovery funds 68.1 n/a n/a n/a n/a n/a n/a n/a n/a Non-capital grants – federal student financial aid n/a n/a n/a n/a n/a n/a n/a n/a n/a Non-capital grants 7.8 39.7 64.2 (7.0) 7.7 17.7 29.7 17.9 n/a Non-capital gifts, net (13.0) (22.9) 53.6 7.0 (6.6) 7.6 12.5 (2.4) n/a Investment income (loss), net 134.9 (302.5) (53.8) 53.2 33.9 14.4 185.6 (10.5) n/a Interest and fees on debt 22.5 (1.6) 24.2 7.5 82.9 19.0 17.0 4.3 n/a Federal interest subsidy on debt n/a n/a n/a n/a n/a n/a n/a n/a n/a Other non-operating revenues (expenses) (702.8) 177.2 482.9 163.5 (102.7) 203.0 (328.2) 75.2 n/a
Net non-operating revenues 88.6 (49.3) (5.6) 21.5 8.6 12.0 22.3 0.8 n/a
Income before other revenues 122.4 (315.0) (35.2) 42.3 14.5 44.6 372.8 (197.1) n/a
Capital appropriations (100.0) (73.4) (10.7) 235.2 205.4 475.3 n/a n/a n/a Refund of prior years capital appropriations (86.6) n/a n/a n/a n/a n/a n/a n/a n/a Capital grants 217.5 110.5 (89.2) 127.3 (65.8) 105.5 2.6 163.8 n/a Capital gifts 46.1 199.1 (26.0) 17.2 16.1 81.2 (15.8) (8.3) n/a Additions to endowments (28.6) (26.5) 52.7 (29.7) 48.8 56.4 13.9 (9.1) n/a
Increase (Decrease) in Net Assets 200.9 (182.2) (38.3) 52.1 (12.7) 69.7 255.5 33.9 n/a
C h a n G e s i n n e T a s s e T s ( C o n T i n U e d ) Last nine fiscal years
Fiscal year ended June 30, 2010 2009 2008 2007 2006 2005 2004 2003 2002
percentage increase (decrease) from prior year

7 92010 Comprehensive A nnua l Financia l Repor t
(as restated)
r e v e n U e s
Operating Revenues Student tuition and fees, net $184,282 $177,112 $167,333 $169,936 $163,271 $144,436 $141,073 $139,428 $124,661 Patient services, net 179,602 177,864 164,230 159,101 153,637 151,116 158,424 124,528 137,035 Federal grants and contracts 392,389 352,550 342,519 346,129 351,935 354,026 352,462 338,553 330,403 State and local grants and contracts 27,877 21,744 39,168 36,509 34,876 34,969 36,466 32,531 38,512 Non-governmental grants and contracts 89,280 92,420 88,356 74,679 74,997 71,631 69,085 61,238 75,536 Sales and services, net 262,229 240,304 267,236 261,725 251,141 255,043 247,749 248,670 246,568 Interest earnings on loans 584 599 509 548 560 1,266 399 267 121 Other operating revenues 4,798 5,856 4,767 3,690 4,403 3,660 4,796 6,910 14,629
Total operating revenues 1,141,041 1,068,449 1,074,118 1,052,317 1,034,820 1,016,147 1,010,454 952,125 967,465
e X p e n s e s
Operating Expenses Salaries and benefits 991,943 979,036 926,114 905,353 868,902 848,949 841,105 831,348 829,473 Supplies and materials 115,714 130,428 123,317 133,676 127,454 130,369 138,555 139,451 148,324 Services 398,615 398,400 402,834 372,778 360,256 358,057 348,346 358,487 364,832 Scholarships and fellowships 51,111 43,768 44,409 45,710 45,097 44,940 43,462 43,280 40,415 Utilities 60,083 58,028 50,634 48,989 46,908 42,042 42,345 41,664 45,452 Depreciation 67,223 52,879 50,800 65,204 53,741 52,785 55,524 50,355 48,517
Total operating expenses 1,684,689 1,662,539 1,598,108 1,571,710 1,502,358 1,477,142 1,469,337 1,464,585 1,477,013
Operating loss (543,648) (594,090) (523,990) (519,393) (467,538) (460,995) (458,883) (512,460) (509,548)
non-oper aT inG r evenUe s (eXpen se s)
State appropriations 377,091 387,377 415,567 397,285 366,806 357,164 348,639 349,159 368,504 State aid – federal recovery funds 23,721 14,987 0 0 0 0 0 0 0 Non-capital grants – federal student financial aid 12,651 7,601 0 0 0 0 0 0 0 Non-capital grants 114,686 107,515 78,733 50,556 56,169 54,930 48,710 38,894 34,769 Non-capital gifts, net 56,140 65,196 86,506 59,404 57,366 64,721 62,789 57,767 62,404 Investment income (loss), net 76,651 (221,916) 112,173 256,348 172,891 136,042 124,052 44,968 52,957 Interest and fees on debt (47,543) (39,214) (40,778) (34,629) (33,275) (19,166) (16,806) (14,877) (15,031) Federal interest subsidy on debt 836 0 0 0 0 0 0 0 0 Other non-operating revenues (expenses) (10,520) 1,763 651 118 (192) 7,355 (7,452) (1,802) (7,662)
Net non-operating revenues 603,713 323,309 652,852 729,082 619,765 601,046 559,932 474,109 495,941
Income before other revenues 60,065 (270,781) 128,862 209,689 152,227 140,051 101,049 (38,351) (13,607)
Capital appropriations 0 9,372 36,108 42,666 13,150 4,537 823 0 0 Refund of prior years capital appropriations (328) (2,479) 0 0 0 0 0 0 0 Capital grants 63,713 20,273 9,856 95,878 43,574 134,236 68,173 68,770 27,480 Capital gifts 37,501 25,926 8,870 12,635 11,142 10,118 5,827 7,166 8,238 Additions to endowments 23,386 33,078 46,079 31,819 46,735 33,100 22,083 20,069 23,283
Increase (Decrease) in Net Assets $184,337 ($184,611) $229,775 $392,687 $266,828 $322,042 $197,955 $57,654 $45,394
Higher Education Price Index (HEPI) 305.2 302.1 295.2 279.9 270.9 257.1 246.4 238.0 225.8
C h a n G e s i n n e T a s s e T s a d J U s T e d f o r i n f l a T i o n Last nine fiscal years (2002 dollars)
Fiscal year ended June 30, 2010 2009 2008 2007 2006 2005 2004 2003 2002
in thousands

T h e U n i v e r s i T y o f n o r T h C a r o l i n a a t C h a p e l h i l l8 0
% % % % % % % % % (as restated)
r e v e n U e s
Operating Revenues Student tuition and fees, net 4.0 5.8 (1.5) 4.1 13.0 2.4 1.2 11.8 n/a Patient services, net 1.0 8.3 3.2 3.6 1.7 (4.6) 27.2 (9.1) n/a Federal grants and contracts 11.3 2.9 (1.0) (1.6) (0.6) 0.4 4.1 2.5 n/a State and local grants and contracts 28.2 (44.5) 7.3 4.7 (0.3) (4.1) 12.1 (15.5) n/a Non-governmental grants and contracts (3.4) 4.6 18.3 (0.4) 4.7 3.7 12.8 (18.9) n/a Sales and services, net 9.1 (10.1) 2.1 4.2 (1.5) 2.9 (0.4) 0.9 n/a Interest earnings on loans (2.5) 17.7 (7.1) (2.1) (55.8) 217.3 49.4 120.7 n/a Other operating revenues (18.1) 22.8 29.2 (16.2) 20.3 (23.7) (30.6) (52.8) n/a
Total operating revenues 6.8 (0.5) 2.1 1.7 1.8 0.6 6.1 (1.6) n/a
e X p e n s e s
Operating Expenses Salaries and benefits 1.3 5.7 2.3 4.2 2.4 0.9 1.2 0.2 n/a Supplies and materials (11.3) 5.8 (7.7) 4.9 (2.2) (5.9) (0.6) (6.0) n/a Services 0.1 (1.1) 8.1 3.5 0.6 2.8 (2.8) (1.7) n/a Scholarships and fellowships 16.8 (1.4) (2.8) 1.4 0.3 3.4 0.4 7.1 n/a Utilities 3.5 14.6 3.4 4.4 11.6 (0.7) 1.6 (8.3) n/a Depreciation 27.1 4.1 (22.1) 21.3 1.8 (4.9) 10.3 3.8 n/a
Total operating expenses 1.3 4.0 1.7 4.6 1.7 0.5 0.3 (0.8) n/a
Operating loss (8.5) 13.4 0.9 11.1 1.4 0.5 (10.5) 0.6 n/a
non-oper aT inG r evenUe s (eXpen se s)
State appropriations (2.7) (6.8) 4.6 8.3 2.7 2.4 (0.1) (5.2) n/a State aid – federal recovery funds 58.3 100.0 n/a n/a n/a n/a n/a n/a n/a Non-capital grants – federal student financial aid 66.4 100.0 n/a n/a n/a n/a n/a n/a n/a Non-capital grants 6.7 36.6 55.7 (10.0) 2.3 12.8 25.2 11.9 n/a Non-capital gifts, net (13.9) (24.6) 45.6 3.6 (11.4) 3.1 8.7 (7.4) n/a Investment income (loss), net (134.5) (297.8) (56.2) 48.3 27.1 9.7 175.9 (15.1) n/a Interest and fees on debt 21.2 (3.8) 17.8 4.1 73.6 14.0 13.0 (1.0) n/a Other non-operating revenues (expenses) (696.7) 170.8 451.7 (161.5) (102.6) (198.7) 313.5 (76.5) n/a
Net non-operating revenues 86.7 (50.5) (10.5) 17.6 3.1 7.3 18.1 (4.4) n/a
Income before other revenues 122.2 (310.1) (38.5) 37.7 8.7 38.6 (363.5) 181.8 n/a
Capital appropriations (100.0) (74.0) (15.4) 224.5 189.8 451.3 n/a n/a n/a Refund of prior years capital appropriations (86.8) (100.0) n/a n/a n/a n/a n/a n/a n/a Capital grants 214.3 105.7 (89.7) 120.0 (67.5) 96.9 (0.9) 150.3 n/a Capital gifts 44.6 192.3 (29.8) 13.4 10.1 73.6 (18.7) (13.0) n/a Additions to endowments (29.3) (28.2) 44.8 (31.9) 41.2 49.9 10.0 (13.8) n/a
Increase (Decrease) in Net Assets 199.9 (180.3) (41.5) 47.2 (17.1) 62.7 243.3 27.0 n/a
C h a n G e s i n n e T a s s e T s a d J U s T e d f o r i n f l a T i o n ( C o n T i n U e d ) Last nine fiscal years (2002 dollars)
Fiscal year ended June 30, 2010 2009 2008 2007 2006 2005 2004 2003 2002
percentage increase (decrease) from prior year

8 12010 Comprehensive A nnua l Financia l Repor t
Instruction $684,836 $674,942 $662,228 $624,128 $595,319 $575,951 $532,927 $531,123 $497,771 Research 431,317 398,754 358,199 312,160 285,646 271,208 257,945 247,434 237,275 Public Service 138,044 126,427 95,618 90,025 85,330 83,005 78,276 75,410 76,896 Academic Support 107,806 107,371 106,613 97,776 86,229 75,384 75,693 70,888 67,618 Student Services 26,961 27,967 28,434 25,865 23,957 21,653 20,488 19,491 18,225 Institutional Support 83,962 89,954 86,549 76,188 71,609 67,426 64,732 63,461 58,560 Operations and Maintenance of Plant 136,008 145,550 133,031 124,991 111,720 92,860 87,891 86,451 90,942 Student Financial Aid 69,083 58,557 58,058 56,662 54,105 51,170 47,427 45,618 40,415 Auxiliary Enterprises 508,213 524,057 494,147 459,660 424,042 383,142 377,418 350,765 340,794 Depreciation 90,861 70,747 66,413 80,827 64,475 60,102 60,589 53,076 48,517
Total Operating Expenses by Function $2,277,091 $2,224,326 $2,089,290 $1,948,282 $1,802,432 $1,681,901 $1,603,386 $1,543,717 $1,477,013
% % % % % % % % %
Instruction 30.1 30.4 31.7 32.2 33.1 34.3 33.2 34.4 33.7 Research 18.9 17.9 17.2 16.0 15.8 16.1 16.1 16.0 16.0 Public Service 6.1 5.7 4.6 4.6 4.7 4.9 4.9 4.9 5.2 Academic Support 4.7 4.8 5.1 5.0 4.8 4.5 4.7 4.6 4.6 Student Services 1.2 1.3 1.3 1.3 1.3 1.3 1.3 1.3 1.2 Institutional Support 3.7 4.0 4.1 3.9 4.0 4.0 4.0 4.1 4.0 Operations and Maintenance of Plant 6.0 6.5 6.4 6.4 6.2 5.5 5.5 5.6 6.2 Student Financial Aid 3.0 2.6 2.8 2.9 3.0 3.0 3.0 3.0 2.7 Auxiliary Enterprises 22.3 23.6 23.6 23.6 23.5 22.8 23.5 22.7 23.1 Depreciation 4.0 3.2 3.2 4.1 3.6 3.6 3.8 3.4 3.3
Total Operating Expenses by Function 100.0 100.0 100.0 100.0 100.0 100.0 100.0 100.0 100.0
% % % % % % % % %
Instruction 1.5 1.9 6.1 4.8 3.4 8.1 0.3 6.7 n/a Research 8.2 11.3 14.7 9.3 5.3 5.1 4.2 4.3 n/a Public Service 9.2 32.2 6.2 5.5 2.8 6.0 3.8 (1.9) n/a Academic Support 0.4 0.7 9.0 13.4 14.4 (0.4) 6.8 4.8 n/a Student Services (3.6) (1.6) 9.9 8.0 10.6 5.7 5.1 6.9 n/a Institutional Support (6.7) 3.9 13.6 6.4 6.2 4.2 2.0 8.4 n/a Operations and Maintenance of Plant (6.6) 9.4 6.4 11.9 20.3 5.7 1.7 (4.9) n/a Student Financial Aid 18.0 0.9 2.5 4.7 5.7 7.9 4.0 12.9 n/a Auxiliary Enterprises (3.0) 6.1 7.5 8.4 10.7 1.5 7.6 2.9 n/a Depreciation 28.4 6.5 (17.8) 25.4 7.3 (0.8) 14.2 9.4 n/a
Total Operating Expenses by Function 2.4 6.5 7.2 8.1 7.2 4.9 3.9 4.5 n/a
o p e r a T i n G e X p e n s e s B y f U n C T i o n Last nine fiscal years
Fiscal year ended June 30, 2010 2009 2008 2007 2006 2005 2004 2003 2002
Fiscal year ended June 30, 2010 2009 2008 2007 2006 2005 2004 2003 2002
Fiscal year ended June 30, 2010 2009 2008 2007 2006 2005 2004 2003 2002
in thousands
expressed as a percent of the total
percentage increase (decrease) from prior year

T h e U n i v e r s i T y o f n o r T h C a r o l i n a a t C h a p e l h i l l8 2
National Institutes of Health Total Appropriations (000’s) $31,246,200 $30,553,298 $29,465,000 $28,626,000 $28,586,617 $28,495,157 $27,887,512 $27,066,782 $23,296,382 percent increase from prior year 2.27% 3.69% 2.93% 0.14% 0.32% 2.18% 3.03% 16.18% n/a
National Science Foundation Total Appropriations (000’s) $6,926,400 $6,490,400 $6,064,900 $5,917,160 $5,580,000 $5,472,820 $5,577,830 $5,309,995 $4,789,240 percent increase from prior year 6.72% 7.02% 2.50% 6.04% 1.96% (1.88%) 5.04% 10.87% n/a
U n C - C h a p e l h i l l v s a s s o C i a T i o n o f a M e r i C a n U n i v e r s i T i e s ( a a U )
Resident Undergraduate – UNC-CH $5,625 $5,397 $5,340 $5,033 $4,613 $4,451 $4,072 $3,856 $3,277 percent increase from prior year 4.23% 1.07% 6.10% 9.11% 3.64% 9.31% 5.60% 17.67% n/a AAU Public Universities (mean) $8,806 $8,283 $7,771 $7,321 $6,906 $6,458 $5,980 $5,160 $4,656 percent increase from prior year 6.31% 6.59% 6.15% 6.01% 6.94% 7.99% 15.89% 10.82% n/a
Non-Resident Undergraduate – UNC-CH $23,513 $22,295 $20,988 $19,681 $18,411 $17,549 $15,920 $15,140 $13,269 percent increase from prior year 5.46% 6.23% 6.64% 6.90% 4.91% 10.23% 5.15% 14.10% n/a AAU Public Universities (mean) $24,775 $23,104 $21,821 $20,652 $19,579 $18,471 $16,849 $15,089 $13,656 percent increase from prior year 7.23% 5.88% 5.66% 5.48% 6.00% 9.63% 11.66% 10.49% n/a
Resident Graduate – UNC-CH $7,162 $6,693 $6,236 $5,680 $5,014 $4,651 $4,269 $4,043 $3,449 percent increase from prior year 7.01% 7.33% 9.79% 13.27% 7.80% 8.95% 5.59% 17.22% n/a AAU Public Universities (mean) $10,795 $10,133 $9,432 $8,913 $8,379 $7,812 $7,260 $6,315 $5,750 percent increase from prior year 6.53% 7.43% 5.82% 6.37% 7.26% 7.60% 14.96% 9.83% n/a
Non-Resident Graduate – UNC-CH $21,560 $21,091 $20,234 $19,678 $19,012 $17,899 $16,267 $15,692 $13,760 percent increase from prior year 2.22% 4.23% 2.83% 3.50% 6.22% 10.03% 3.66% 14.04% n/a AAU Public Universities (mean) $23,002 $21,912 $20,618 $20,067 $19,295 $18,367 $16,488 $14,898 $13,729 percent increase from prior year 4.97% 6.28% 2.75% 4.00% 5.05% 11.40% 10.67% 8.51% n/a
r e v e n U e B a s e Last nine fiscal years
a C a d e M i C y e a r T U i T i o n a n d r e Q U i r e d f e e s Last nine fiscal years
Fiscal year ended June 30, 2010 2009 2008 2007 2006 2005 2004 2003 2002
Fiscal year ended June 30, 2010 2009 2008 2007 2006 2005 2004 2003 2002
Sources: National Institute of Health, National Science Foundation.
Sources: “Academic Year Tuition and Required Fees, AAU Public Universities,” Univ. of Missouri System, Sept. 2009; The University of North Carolina at Chapel Hill Fact Book; Office of Institutional Research and Assessment

8 32010 Comprehensive A nnua l Financia l Repor t
State and local grants and contracts $37,679 $29,091 $51,207 $45,256 $41,842 $39,816 $39,793 $34,289 $38,512 State appropriations and state aid 541,753 538,327 543,292 492,471 440,070 406,673 380,446 368,024 368,504 Capital appropriations 0 12,539 47,206 52,888 15,776 5,166 898 0 0 Capital grants 86,116 27,124 12,885 118,850 52,277 152,844 74,392 72,486 27,480
NC State Government $665,548 $607,081 $654,590 $709,465 $549,965 $604,499 $495,529 $474,799 $434,496
percent increase from prior year 9.63% (7.26%) (7.73%) 29.00% (9.02%) 21.99% 4.37% 9.28% n/a Federal grants and contracts $530,368 $471,680 $447,793 $429,059 $422,229 $403,100 $384,618 $356,845 $330,403 Non-capital grants 172,113 154,016 102,932 62,669 67,388 62,544 53,154 40,995 34,769
Federal Government $702,481 $625,696 $550,725 $491,728 $489,617 $465,644 $437,772 $397,840 $365,172
percent increase from prior year 12.27% 13.61% 12.00% 0.43% 5.15% 6.37% 10.04% 8.95% n/a
p r i n C i p a l r e v e n U e p a y e r s Last nine fiscal years
Fiscal year ended June 30, 2010 2009 2008 2007 2006 2005 2004 2003 2002
in thousands

T h e U n i v e r s i T y o f n o r T h C a r o l i n a a t C h a p e l h i l l8 4
General Revenue Debt $1,135,545 $943,585 $961,280 $678,980 $694,575 $338,210 $351,430 $190,255 $195,810 Plus Unamortized Disc/Premium 37,824 30,438 31,898 26,821 28,050 8,098 8,662 5,409 5,867 Less Unamortized Loss on Refunding (2,633) (3,034) (3,436) (3,838) (4,240) (2,280) (2,606) (2,932) (3,257)
Net General Revenue Debt 1,170,736 970,989 989,742 701,963 718,385 344,028 357,486 192,732 198,420
Revenue Bonds 82,944 79,734 81,480 83,502 85,642 112,395 114,553 181,531 186,438 Plus Unamortized Disc/Premium (243) (287) (333) (158) (181) (330) (356) (716) (903)
Net Revenue Bonds 82,701 79,447 81,147 83,344 85,461 112,065 114,197 180,815 185,535
Total Revenue Bonds Payble 1,253,437 1,050,436 1,070,889 785,307 803,846 456,093 471,683 373,547 383,955 Notes Payable 46,100 675 1,037 1,362 21,054 33,519 35,000 39,333 3,800 Capital Leases Payable 3,462 1,710 2,804 2,404 379 970 1,320 927 606
Total $1,302,999 $1,052,821 $1,074,730 $789,073 $825,279 $490,582 $508,003 $413,807 $388,361
Long Term Debt (whole dollars) per Student FTE $48,789 $39,946 $41,503 $30,966 $32,954 $19,835 $20,893 $17,213 $16,514 per Dollar of Total Grants and Contracts $1.51 $1.35 $1.50 $1.25 $1.33 $0.84 $0.92 $0.83 $0.81 per Dollar of State Appropriations and State Aid $2.41 $1.96 $1.98 $1.60 $1.88 $1.21 $1.34 $1.12 $1.05
l o n G - T e r M d e B T Last nine fiscal years
Fiscal year ended June 30, 2010 2009 2008 2007 2006 2005 2004 2003 2002
Total Student FTE 26,707 26,356 25,895 25,482 25,043 24,733 24,314 24,041 23,517 State appropriations and State aid $541,753 $538,327 $543,292 $492,471 $440,070 $406,673 $380,446 $368,024 $368,504 Federal grants and contracts $530,368 $471,680 $447,793 $429,059 $422,229 $403,100 $384,618 $356,845 $330,403 State and local grants and contracts 37,679 29,091 51,207 45,256 41,842 39,816 39,793 34,289 38,512 Non-governmental grants and contracts 120,674 123,649 115,513 92,572 89,976 81,560 75,388 64,547 75,536 Non-capital grants 172,113 154,016 102,932 62,669 67,388 62,544 53,154 40,995 34,769
Total Grants and Contracts $860,834 $778,436 $717,445 $629,556 $621,435 $587,020 $552,953 $496,676 $479,220
Data used in the above calculations
in thousands
Net General Revenue Debt $1,170,736 $970,989 $989,742 $701,963 $718,385 $344,028 $357,486 $192,732 $198,420 Commercial Paper Program 59,784 148,291 101,157 192,414 117,414 141,141 8,841 19,000 1,000
Total General Revenue Debt $1,230,520 $1,119,280 $1,090,899 $894,377 $835,799 $485,169 $366,327 $211,732 $199,420
General Revenue Debt (whole dollars) per Student FTE $46,075 $42,468 $42,128 $35,098 $33,375 $19,616 $15,067 $8,807 $8,480 per Dollar of Total Grants and Contracts $1.43 $1.44 $1.52 $1.42 $1.34 $0.83 $0.66 $0.43 $0.42 per Dollar of State Appropriations and State Aid $2.27 $2.08 $2.01 $1.82 $1.90 $1.19 $0.96 $0.58 $0.54
Fiscal year ended June 30, 2010 2009 2008 2007 2006 2005 2004 2003 2002

8 52010 Comprehensive A nnua l Financia l Repor t
The Composite Financial Index (CFI) provides a methodology for a single overall financial measurement of the institution’s health based on the four core ratios. The CFI uses a reasonable weighting plan and allows a weakness or strength in a specific ratio to be offset by another ratio result, which provides a more balanced measure. The CFI provides a more holistic approach to understanding the financial health of the institution. The CFI scores are not intended to be precise measures; they are indicators of ranges of financial health that can be indicators of overall institutional well-being when combined with non-financial indicators.Ratio/Strength Factors are capped at a maximum of 10 before the weighing factors are applied so that a higher CFI does not unduly mask a weakness in a component ratio.
(as restated)
C o M p o n e n T U n i T s
+ Primary Reserve Ratio 0.83 x 0.79 x 1.06 x 1.05 x 0.92 x 0.86 x 0.79 x 0.60 x 0.66 x / Strength Factor 0.133 0.133 0.133 0.133 0.133 0.133 0.133 0.133 0.133 = Ratio / Strength Factor 6.24 5.94 7.97 7.89 6.92 6.47 5.94 4.51 4.96 * Weighting Factor 35% 35% 35% 35% 35% 35% 35% 35% 35% = Ratio Subtotal 2.18 2.08 2.79 2.76 2.42 2.26 2.08 1.58 1.74 = Ratio 10.00 Cap Subtotal 2.18 2.08 2.79 2.76 2.42 2.26 2.08 1.58 1.74
+ Return on Net Assets Ratio 7.2% (6.7%) 8.8% 16.7% 12.3% 16.4% 10.7% 3.1% 2.4% / Strength Factor 2.00% 2.00% 2.00% 2.00% 2.00% 2.00% 2.00% 2.00% 2.00% = Ratio / Strength Factor 3.60 (3.35) 4.40 8.35 6.15 8.20 5.35 1.55 1.20 * Weighting Factor 20% 20% 20% 20% 20% 20% 20% 20% 20% = Ratio Subtotal 0.72 (0.67) 0.88 1.67 1.23 1.64 1.07 0.31 0.24 = Ratio 10.00 Cap Subtotal 0.72 (0.67) 0.88 1.67 1.23 1.64 1.07 0.31 0.24 + Net Operating Revenues Ratio 3.3% (18.9%) 7.3% 11.5% 9.0% 8.6% 6.3% (2.7%) (0.9%) / Strength Factor 0.70% 0.70% 0.70% 0.70% 0.70% 0.70% 0.70% 0.70% 0.70% = Ratio / Strength Factor 4.71 (27.00) 10.43 16.43 12.86 12.29 9.00 3.74 1.33 * Weighting Factor 10% 10% 10% 10% 10% 10% 10% 10% 10% = Ratio Subtotal 0.47 (2.70) 1.04 1.64 1.29 1.23 0.90 (0.37) (0.13) = Ratio 10.00 Cap Subtotal 0.47 (2.70) 1.00 1.00 1.00 1.00 0.90 (0.37) (0.13) + Viability Ratio 1.4 x 1.5 x 1.9 x 2.1 x 1.8 x 2.3 x 2.5 x 2.1 x 2.5 x / Strength Factor 0.417 0.417 0.417 0.417 0.417 0.417 0.417 0.417 0.417 = Ratio / Strength Factor 3.36 3.60 4.56 5.04 4.32 5.52 6.00 5.04 6.00 * Weighting Factor 35% 35% 35% 35% 35% 35% 35% 35% 35% = Ratio Subtotal 1.18 1.26 1.60 1.76 1.51 1.93 2.10 1.76 2.10 = Ratio 10.00 Cap Subtotal 1.18 1.26 1.60 1.76 1.51 1.93 2.10 1.76 2.10
Composite Financial Index 4.55 (0.03) 6.31 7.83 6.45 7.06 6.15 3.26 3.95
Composite Financial Index with 10.00 Cap 4.55 (0.03) 6.27 7.19 6.16 6.83 6.15 3.26 3.95
s U M M a r y o f r a T i o s Last nine fiscal years
Fiscal year ended June 30, 2010 2009 2008 2007 2006 2005 2004 2003 2002

T h e U n i v e r s i T y o f n o r T h C a r o l i n a a t C h a p e l h i l l8 6
Measures the financial strength of the institution by indicating how long the institution could function using its expendable reserves to cover operations should additional net assets not be available. A positive ratio and an increasing amount over time denotes strength.
*For the fiscal year ended June 30, 2004, the University implemented Governmental Accounting Standards Board Statement No. 39, Determining Whether Certain Organizations are Component Units. This Statement amends GASB Statement No. 14, The Financial Reporting Entity, to provide additional guidance to determine whether certain organizations for which the University is not financially accountable should be reported as component units based on the nature and significance of their relationship to the University. The component units of the University are discretely presented in the Financial Section.
Measures total economic return. While an increasing trend reflects strength, a decline may be appropriate and even warranted if it represents a strategy on the part of the institution to fulfill its mission.
(as restated)
p r i M a r y r e s e r v e r a T i o
Unrestricted Net Assets $778,439 $700,280 $671,970 $617,573 $525,513 $475,631 $408,705 $370,816 $346,546 Unrestricted Net Assets – Component Units * 26,543 23,334 28,897 28,627 23,709 20,653 17,724 n/a n/a Expendable Restricted Net Assets 891,182 837,154 1,199,280 1,086,353 853,133 736,632 648,019 559,128 645,390 Temporarily Restricted Net Assets – Component Units * 245,187 237,867 363,803 361,559 284,351 238,745 209,030 n/a n/a
Expendable Net Assets $1,941,351 $1,798,635 $2,263,950 $2,094,112 $1,686,706 $1,471,661 $1,283,478 $929,944 $991,936 Operating Expenses $2,277,091 $2,224,326 $2,089,290 $1,948,282 $1,802,432 $1,681,901 $1,603,386 $1,543,717 $1,477,013 Interest and Fees on Debt 64,261 52,465 53,311 42,926 39,921 21,823 18,339 15,681 15,031
Total Expenses $2,341,352 $2,276,791 $2,142,601 $1,991,208 $1,842,353 $1,703,724 $1,621,725 $1,559,398 $1,492,044 Expendable Net Assets $1,941,351 $1,798,635 $2,263,950 $2,094,112 $1,686,706 $1,471,661 $1,283,478 $929,944 $991,936
Total Expenses $2,341,352 $2,276,791 $2,142,601 $1,991,208 $1,842,353 $1,703,724 $1,621,725 $1,559,398 $1,492,044
Ratio 0.83 x 0.79 x 1.06 x 1.05 x 0.92 x 0.86 x 0.79 x 0.60 x 0.66 x
(as restated)
r e T U r n o n n e T a s s e T s r a T i o
Change in Net assets $249,156 ($246,993) $300,399 $486,768 $320,123 $366,680 $216,014 $60,768 $45,394
Total Net Assets (Beginning of Year) $3,462,442 $3,709,435 $3,409,036 $2,922,268 $2,607,879 $2,241,199 $2,025,186 $1,964,418 $1,919,024
Ratio 7.2% (6.7%) 8.8% 16.7% 12.3% 16.4% 10.7% 3.1% 2.4%
s U M M a r y o f r a T i o s ( C o n T i n U e d ) Last nine fiscal years
Fiscal year ended June 30, 2010 2009 2008 2007 2006 2005 2004 2003 2002
Fiscal year ended June 30, 2010 2009 2008 2007 2006 2005 2004 2003 2002
in thousands
in thousands

8 72010 Comprehensive A nnua l Financia l Repor t
Measures whether the institution is living within available resources. A positive ratio and an increasing amount over time, generally reflects strength.
Measures the ability of the institution to cover its debt as of the balance sheet date, should the institution need to do so. A positive ratio of greater than 1:1 generally denotes strength. *For the fiscal year ended June 30, 2004, the University implemented Governmental Accounting Standards Board Statement No. 39, Determining Whether Certain Organizations are Component Units. This Statement amends GASB Statement No. 14, The Financial Reporting Entity, to provide additional guidance to determine whether certain organizations for which the University is not financially accountable should be reported as component units based on the nature and significance of their relationship to the University. The component units of the University are discretely presented in the Financial Section.
(as restated)
n e T o p e r a T i n G r e v e n U e s r a T i o
Total Operating Revenues $1,542,275 $1,429,487 $1,404,252 $1,304,444 $1,241,511 $1,157,001 $1,102,637 $1,003,568 $967,465 State Appropriations and State Aid 541,753 538,327 543,292 492,471 440,070 406,673 380,446 368,024 368,505 Non-capital Gifts and Grants, net 247,994 241,242 216,026 136,306 136,212 136,237 121,671 101,882 97,173 Investment Income (Loss), net 103,605 (296,904) 146,650 317,767 207,423 154,900 135,369 47,398 52,957
Adjusted Net Operating Revenues $2,435,627 $1,912,152 $2,310,220 $2,250,988 $2,025,216 $1,854,811 $1,740,123 $1,520,872 $1,486,100 Income (Loss) Before Other Revenues, Expenses, Gains, or Losses $81,186 ($362,280) $168,470 $259,926 $182,633 $159,462 $110,267 ($40,424) ($13,607)
Adjusted Net Operating Revenues $2,435,627 $1,912,152 $2,310,220 $2,250,988 $2,025,216 $1,854,811 $1,740,123 $1,520,872 $1,486,100
Ratio 3.3% (18.9%) 7.3% 11.5% 9.0% 8.6% 6.3% (2.7%) (0.9%)
(as restated)
v i a B l i l i T y r a T i o
Unrestricted Net Assets $778,439 $700,280 $671,970 $617,573 $525,513 $475,631 $408,705 $370,816 $346,546 Unrestricted Net Assets – Component Units * 26,543 23,334 28,897 28,627 23,709 20,653 17,724 n/a n/a Expendable Restricted Net Assets 891,182 837,154 1,199,280 1,086,353 853,133 736,632 648,019 559,128 645,390 Temporarily Restricted Net Assets – Component Units * 245,187 237,867 363,803 361,559 284,351 238,745 209,030 n/a n/a
Expendable Net Assets $1,941,351 $1,798,635 $2,263,950 $2,094,112 $1,686,706 $1,471,661 $1,283,478 $929,944 $991,936 Bonds $1,253,437 $1,050,436 $1,070,889 $785,307 $803,846 $456,093 $471,684 $373,548 $383,955 Commercial Paper 59,784 148,291 101,157 192,414 117,414 141,141 8,841 19,000 1,000 Capital Leases 3,462 1,710 2,804 2,404 379 970 1,320 927 606 Notes 46,100 675 1,037 1,362 21,054 33,519 35,000 39,332 3,800 Notes – Component Units * 850 1,400 1,500 2,100 3,000 263 255 n/a n/a
Total Adjusted University Debt $1,363,633 $1,202,512 $1,177,387 $983,587 $945,693 $631,986 $517,100 $432,807 $389,361 Expendable Net Assets $1,941,351 $1,798,635 $2,263,950 $2,094,112 $1,686,706 $1,471,661 $1,283,478 $929,944 $991,936
Total Adjusted University Debt $1,363,633 $1,202,512 $1,177,387 $983,587 $945,693 $631,986 $517,100 $432,807 $389,361
Ratio 1.4 x 1.5 x 1.9 x 2.1 x 1.8 x 2.3 x 2.5 x 2.1 x 2.5 x
s U M M a r y o f r a T i o s ( C o n T i n U e d ) Last nine fiscal years
Fiscal year ended June 30, 2010 2009 2008 2007 2006 2005 2004 2003 2002
Fiscal year ended June 30, 2010 2009 2008 2007 2006 2005 2004 2003 2002
in thousands
in thousands

T h e U n i v e r s i T y o f n o r T h C a r o l i n a a t C h a p e l h i l l8 8
A more restrictive measure of whether the institution is living within available resources. A positive ratio and an increasing amount over time generally reflects strength.
A broader measure of the ability of the institution to cover its debt as of the balance sheet date.*For the fiscal year ended June 30, 2004, the University implemented Governmental Accounting Standards Board Statement No. 39, Determining Whether Certain Organizations are Component Units. This Statement amends GASB Statement No. 14, The Financial Reporting Entity, to provide additional guidance to determine whether certain organizations for which the University is not financially accountable should be reported as component units based on the nature and significance of their relationship to the University. The component units of the University are discretely presented in the Financial Section.**U.S. EPA Project Bonds are secured by an irrevocable lease from the U.S. government. This lease covers the debt service requirements for the term of the Bonds.
(as restated)o p e r a T i n G M a r G i n e X C l U d i n G G i f T s
Income (Loss) Before Other Revenues, Expenses, Gains, or Losses $81,186 ($362,280) $168,470 $259,926 $182,632 $159,462 $110,267 ($40,424) ($13,607) Less: Noncapital Gifts and Grants, net (247,994) (241,242) (216,026) (136,306) (136,212) (136,237) (121,671) (101,882) (97,173)
Adjusted Income (Loss) Before Other Revenues, Expenses, Gains or Losses ($166,808) ($603,522) ($47,556) $123,620 $46,420 $23,225 ($11,404) ($142,306) ($110,780) Total Operating Revenues $1,542,275 $1,429,487 $1,404,252 $1,304,444 $1,241,511 $1,157,001 $1,102,637 $1,003,568 $967,465 State Appropriations and State Aid 541,753 538,327 543,292 492,471 440,070 406,673 380,446 368,024 368,505 Investment Income (Loss), net 103,605 (296,904) 146,650 317,767 207,423 154,900 135,369 47,398 52,957
Adjusted Net Operating Revenues less Gifts $2,187,633 $1,670,910 $2,094,194 $2,114,682 $1,889,004 $1,718,574 $1,618,452 $1,418,990 $1,388,927 Adjusted Income (Loss) Before Other Revenues, Expenses, Gains or Losses ($166,808) ($603,522) ($47,556) $124,719 $46,420 $23,225 ($11,404) ($142,306) ($110,780)
Adjusted Net Operating Revenues less Gifts $2,187,633 $1,670,910 $2,094,194 $2,114,682 $1,889,004 $1,718,574 $1,618,452 $1,418,990 $1,388,927
Ratio (7.6%) (36.1%) (2.3%) 5.8% 2.5% 1.4% (0.7%) (10.0%) (8.0%)
(as restated)e X p e n d a B l e r e s o U r C e s T o d e B T
Unrestricted Net Assets $778,439 $700,280 $671,970 $617,573 $525,513 $475,631 $408,705 $370,816 $346,546 Unrestricted Net Assets – Component Units * 26,543 23,334 28,897 28,627 23,709 20,653 17,724 n/a n/a Expendable Restricted Net Assets 891,182 837,154 1,199,280 1,086,353 853,133 736,632 648,019 559,128 645,390 Temporarily Restricted Net Assets – Component Units * 245,187 237,867 363,803 361,559 284,351 238,745 209,030 n/a n/a
Expendable Net Assets $1,941,351 $1,798,635 $2,263,950 $2,094,112 $1,686,706 $1,471,661 $1,283,478 $929,944 $991,936
Total Notes, Bonds, Capital Leases and Commercial Paper $1,362,783 $1,201,112 $1,175,887 $981,487 $942,693 $631,723 $516,845 $432,807 $389,361 Long-Term Debt – Component Units * 850 1,400 1,500 2,100 3,000 263 255 n/a n/a Less: U.S. EPA Project Bonds ** (21,060) (19,286) (21,478) (23,495) (25,349) (27,317) (29,221) (30,975) (32,591)
Total Adjusted University Debt $1,342,573 $1,183,226 $1,155,909 $960,092 $920,344 $604,669 $487,879 $401,832 $356,770
Expendable Net Assets $1,941,351 $1,798,635 $2,263,950 $2,094,112 $1,686,706 $1,471,661 $1,283,478 $929,944 $991,936
Total Adjusted University Debt $1,342,573 $1,183,226 $1,155,909 $960,092 $920,344 $604,669 $487,879 $401,832 $356,770
Ratio 1.4 x 1.5 x 2.0 x 2.2 x 1.8 x 2.4 x 2.6 x 2.3 x 2.8 x
s U M M a r y o f r a T i o s ( C o n T i n U e d ) Last nine fiscal years
Fiscal year ended June 30, 2010 2009 2008 2007 2006 2005 2004 2003 2002
Fiscal year ended June 30, 2010 2009 2008 2007 2006 2005 2004 2003 2002
in thousands
in thousands

8 92010 Comprehensive A nnua l Financia l Repor t
A broader measure of the ability of the institution to cover its debt as of the balance sheet date.
Measures the financial strength of the institution by indicating how long the institution would take to repay the debt using the cash provided by its operations.A decreasing ratio over time denotes strength.
(as restated)
T o T a l f i n a n C i a l r e s o U r C e s T o d i r e C T d e B T
Unrestricted Net Assets $778,439 $700,280 $671,970 $617,573 $525,513 $475,631 $408,705 $370,816 $346,546 Non-expendable Restricted Net Assets 621,873 586,175 548,151 493,305 430,316 378,234 328,735 323,961 304,097 Expendable Restricted Net Assets 891,182 837,154 1,199,280 1,086,353 853,133 736,632 648,019 559,128 645,390
Total Financial Resources $2,291,494 $2,123,609 $2,419,401 $2,197,231 $1,808,962 $1,590,497 $1,385,459 $1,253,905 $1,296,033 Total Financial Resources $2,291,494 $2,123,609 $2,419,401 $2,197,231 $1,808,962 $1,590,497 $1,385,459 $1,253,905 $1,296,033
Total Notes, Bonds, Capital Leases and Commercial Paper $1,362,783 $1,201,112 $1,175,887 $981,487 $942,693 $631,723 $516,845 $432,807 $389,361
Ratio 1.7 x 1.8 x 2.1 x 2.2 x 1.9 x 2.5 x 2.7 x 2.9 x 3.3 x
(as restated)
d i r e C T d e B T T o a d J U s T e d C a s h f l o W
Net Cash Used by Operating Activities ($626,420) ($679,012) ($641,134) ($570,342) ($492,016) ($460,046) ($348,742) ($382,265) ($440,099) State Appropriations and State Aid 541,753 538,327 543,292 492,471 440,070 406,673 380,446 368,024 368,505 Grants for Other than Capital Purposes 172,113 154,016 102,932 62,669 67,388 62,544 53,154 40,995 34,769 Non-capital Gifts 75,881 87,226 113,094 73,637 68,824 73,693 68,517 60,888 62,404
Adjusted Cash Flow from Operations $163,327 $100,557 $118,184 $58,435 $84,266 $82,864 $153,375 $87,642 $25,579
Total Notes, Bonds, Capital Leases and Commercial Paper $1,362,783 $1,201,112 $1,175,887 $981,487 $942,693 $631,723 $516,845 $432,807 $389,361
Adjusted Cash Flow from Operations $163,327 $100,557 $118,184 $58,435 $84,266 $82,864 $153,375 $87,642 $25,579
Ratio 8.3 x 11.9 x 9.9 x 16.8 x 11.2 x 7.6 x 3.4 x 4.9 x 15.2 x
s U M M a r y o f r a T i o s ( C o n T i n U e d ) Last nine fiscal years
Fiscal year ended June 30, 2010 2009 2008 2007 2006 2005 2004 2003 2002
Fiscal year ended June 30, 2010 2009 2008 2007 2006 2005 2004 2003 2002
in thousands
in thousands

T h e U n i v e r s i T y o f n o r T h C a r o l i n a a t C h a p e l h i l l9 0
Measures the financial strength of the institution by indicating how long the institution could function using its expendable reserves to cover operations should additional net assets not be available. A positive ratio and an increasing amount over time denotes strength.
Measures the financial strength of the institution.*U.S. EPA Project Bonds are secured by an irrevocable lease from the U.S. government. This lease covers the debt service requirements for the term of the Bonds.
(as restated)
d e B T B U r d e n r a T i o
Interest and Fees Paid on Debt and Leases $53,180 $53,010 $52,779 $43,676 $40,390 $22,644 $20,438 $18,303 $21,117 Principal Paid on Debt and Leases 148,637 46,462 238,672 43,344 228,037 39,608 21,900 14,044 14,130 Less: Principal Paid from Gifts and Excess Funds (17,639) (20,866) (15,732) 0 0 0 0 0 0 Less: Principal Paid from Refinancing Activities (104,858) 0 (198,244) (19,719) (206,539) (19,910) (4,333) 0 0
Debt Service $79,320 $78,606 $77,475 $67,301 $61,888 $42,342 $38,005 $32,347 $35,247
Operating Expenses $2,277,091 $2,224,326 $2,089,290 $1,948,282 $1,802,432 $1,681,901 $1,603,386 $1,543,717 $1,477,013 Interest and Fees on Debt 64,261 52,465 53,311 42,926 39,921 21,823 18,339 15,681 15,031 Fixed Asset Writedowns (if not included in Operating Expenses) 0 0 0 0 0 2,635 8,132 1,899 7,661 Less: Depreciation Expense (90,861) (70,747) (66,413) (80,827) (64,475) (60,102) (60,589) (53,076) (48,517) Plus: Principal Paid on Debt and Leases 148,637 46,462 238,672 43,344 228,037 39,608 21,900 14,044 14,130 Less: Principal Paid from Gifts and Excess Funds (17,639) (20,866) (15,732) 0 0 0 0 0 0 Less: Principal Paid from Refinancing Activities (104,858) 0 (198,244) (19,719) (206,539) (19,910) (4,333) 0 0
Total Expenditures $2,276,631 $2,231,640 $2,100,884 $1,934,006 $1,799,376 $1,665,955 $1,586,835 $1,522,265 $1,465,318
Debt Service $79,320 $78,606 $77,475 $67,301 $61,888 $42,342 $38,005 $32,347 $35,247
Total Expenditures $2,276,631 $2,231,640 $2,100,884 $1,934,006 $1,799,376 $1,665,955 $1,586,835 $1,522,265 $1,465,318
Ratio 3.5% 3.5% 3.7% 3.5% 3.4% 2.5% 2.4% 2.1% 2.4%
(as restated)d e B T s e r v i C e T o o p e r a T i o n s
Interest and Fees Paid on Debt and Leases $53,180 $53,010 $52,779 $43,676 $40,390 $22,644 $20,438 $18,303 $21,117 Less: Interest and Fees Paid – U.S. EPA Project Bonds * (6) (360) (683) (977) (1,264) (1,534) (1,781) (2,013) (2,210) Principal Paid on Debt and Leases 148,637 46,462 238,672 43,344 228,037 39,608 21,900 14,044 14,130 Less: Non-contractual Principal Paid from Gifts and Excess Funds (17,639) (20,866) (15,732) 0 0 0 0 0 0 Less: Principal Paid from Refinancing Activities (104,858) 0 (198,244) (19,719) (206,539) (19,910) (4,333) 0 0 Less: Principal Paid – U.S. EPA Project Bonds * (4,215) (3,860) (3,540) (3,245) (3,240) (3,065) (2,815) (2,585) (2,385)
Debt Service $75,099 $74,386 $73,252 $63,079 $57,384 $37,743 $33,409 $27,749 $30,652
Operating Expenses $2,277,091 $2,224,326 $2,089,290 $1,948,282 $1,802,432 $1,681,901 $1,603,386 $1,543,717 $1,477,013
Debt Service $75,099 $74,386 $73,252 $63,079 $57,384 $37,743 $33,409 $27,749 $30,652
Operating Expenses $2,277,091 $2,224,326 $2,089,290 $1,948,282 $1,802,432 $1,681,901 $1,603,386 $1,543,717 $1,477,013
Ratio 3.3% 3.3% 3.5% 3.2% 3.2% 2.2% 2.1% 1.8% 2.1%
s U M M a r y o f r a T i o s ( C o n T i n U e d ) Last nine fiscal years
Fiscal year ended June 30, 2010 2009 2008 2007 2006 2005 2004 2003 2002
Fiscal year ended June 30, 2010 2009 2008 2007 2006 2005 2004 2003 2002
in thousands
in thousands

9 12010 Comprehensive A nnua l Financia l Repor t
Measures the institution’s research expense to the total operating expenses.
Measures the institution’s net student tuition and fees received per student.
Measures institution’s dependency on state appropriations.
(as restated)
r e s e a r C h e X p e n s e s T o T o Ta l o p e r aT i n G e X p e n s e s
Operating Expenses $2,277,091 $2,224,326 $2,089,290 $1,948,282 $1,802,432 $1,681,901 $1,603,386 $1,543,717 $1,477,013 Interest and Fees on Debt 64,261 52,465 53,311 42,926 39,921 21,823 18,339 15,681 15,031 Fixed Asset Writedowns (if not included in Operating Expenses) 0 0 0 0 0 2,635 8,132 1,899 7,661
Total Adjusted Operating Expenses $2,341,352 $2,276,791 $2,142,601 $1,991,208 $1,842,353 $1,706,359 $1,629,857 $1,561,297 $1,499,705
Research Expenses $431,317 $398,753 $358,199 $312,160 $285,646 $271,208 $257,945 $247,434 $237,275
Total Adjusted Operating Expenses $2,341,352 $2,276,791 $2,142,601 $1,991,208 $1,842,353 $1,706,359 $1,629,857 $1,561,297 $1,499,705
Ratio 18.4% 17.5% 16.7% 15.7% 15.5% 15.9% 15.8% 15.8% 15.8%
(as restated)
n e T T U i T i o np e r s T U d e n T
Student Tuition and Fees, net $249,083 $236,960 $218,763 $210,651 $195,882 $164,457 $153,943 $146,961 $124,661 Less: Scholarships and Fellowships (69,083) (58,557) (58,059) (56,662) (54,105) (51,170) (47,427) (45,618) (40,415)
Net Tuition and Fees $180,000 $178,403 $160,703 $153,989 $141,777 $113,287 $106,516 $101,343 $84,246
Net Tuition and Fees $180,000 $178,403 $160,703 $153,989 $141,777 $113,287 $106,516 $101,343 $84,246
Undergraduate, Graduate and Professional FTE 26,707 26,356 25,895 25,482 25,043 24,733 24,314 24,041 23,517
Net Tuition per Student (whole dollars) $6,740 $6,769 $6,206 $6,043 $5,661 $4,580 $4,381 $4,215 $3,582
(as restated)
s T a T e a p p r o p r i a T i o n sa n d s T a T e a i dp e r s T U d e n T
State Appropriations and State Aid $541,753 $538,327 $543,292 $492,471 $440,070 $406,673 $380,446 $368,024 $368,505
Undergraduate, Graduate and Professional FTE 26,707 26,356 25,895 25,482 25,043 24,733 24,314 24,041 23,517
State Appropriation per Student (whole dollars) $20,285 $20,425 $20,981 $19,326 $17,573 $16,443 $15,647 $15,308 $15,670
s U M M a r y o f r a T i o s ( C o n T i n U e d ) Last nine fiscal years
Fiscal year ended June 30, 2010 2009 2008 2007 2006 2005 2004 2003 2002
Fiscal year ended June 30, 2010 2009 2008 2007 2006 2005 2004 2003 2002
Fiscal year ended June 30, 2010 2009 2008 2007 2006 2005 2004 2003 2002
in thousands
in thousands
in thousands

T h e U n i v e r s i T y o f n o r T h C a r o l i n a a t C h a p e l h i l l9 2
s p e C i f i C r e v e n U e a n d G e n e r a l r e v e n U e B o n d C o v e r a G e Last ten fiscal years
General Revenue Bond Debt Service includes debt service for specific revenue bonds refunded or defeased by issuance of general revenue debt during theyear of refunding.
in thousands
s p e C i f i C r e v e n U eB o n d C o v e r a G e
Gross Operating Revenues $204,725 $195,265 $177,705 $160,112 $143,900 Direct Operating Expenses 129,049 144,364 114,352 115,450 105,885
Net Revenue Available for Debt Service $75,676 $50,901 $63,353 $44,662 $38,015
Principal $5,890 $5,515 $6,340 $6,180 $5,635 Interest 168 588 1,090 1,527 2,325
Specific Revenue Debt Service Requirements $6,058 $6,103 $7,430 $7,707 $7,960
Coverage 12.49 8.34 8.53 5.79 4.78
a v a i l a B l e f U n d sG e n e r a l r e v e n U e B o n d s
Total Unrestricted Revenue $1,572,416 $1,483,607 $1,539,517 $1,447,939 $1,316,160 Less: State Appropriations and State Aid (541,753) (538,327) (543,292) (492,471) (440,070) Tuition and Fees (249,083) (236,960) (218,763) (210,652) (195,882) Specific Revenue Debt Service Requirements (6,058) (6,103) (7,430) (7,707) (7,960) Plus: Adjusted Beginning Unrestricted Net Assets 699,458 671,970 617,573 525,513 475,631
Total Available Funds $1,474,980 $1,374,187 $1,387,605 $1,262,622 $1,147,879
Annual Increase $100,793 ($13,418) $124,983 $114,743 $126,292 % Increase 7.3% (1.0%) 9.9% 10.0% 12.4%
G e n e r a l r e v e n U eB o n d C o v e r a G e
Total Available Funds $1,474,980 $1,374,187 $1,387,605 $1,262,622 $1,147,879
Principal $18,580 $17,695 $16,175 $15,595 $15,285 Interest 48,596 44,876 38,970 32,814 28,373
General Revenue Debt Service Requirements $67,176 $62,571 $55,145 $48,409 $43,658
Coverage 21.96 21.96 25.16 26.08 26.29
For the fiscal year ended June 30, 2010 2009 2008 2007 2006
For the fiscal year ended June 30, 2010 2009 2008 2007 2006
For the fiscal year ended June 30, 2010 2009 2008 2007 2006
The University of North Carolina at Chapel Hill has issued General Revenue Bonds, which are repaid from Available Funds. Available Funds
are defined as any unrestricted Net Assets remaining after satisfying obligations of the University under trust indentures, trust agreements
or bond resolutions (Specific Revenue Bonds), but excluding State Appropriations, Tuition, and certain special facilities revenues. Specific
Revenue Bonds have a pledged revenue stream as the repayment source.

9 32010 Comprehensive A nnua l Financia l Repor t
(1) For fiscal year ended June 30, 2002, the University implemented GASB Statement No. 34, Basic Financial Statements – and Management’s Discussion and Analysis – for State and Local Governments as amended by GASB Statement No. 35, Basic Financial Statements – and Management’s Discussion and Analysis – for Public Colleges and Universities. In addition, the University implemented GASB Statement No. 38, Certain Financial Statement Note Disclosures. The definition of available funds has not changed as a result of implementing these GASB Statements.
in thousands
s p e C i f i C r e v e n U eB o n d C o v e r a G e
Gross Operating Revenues $125,968 $121,470 $116,985 $102,042 $92,977 Direct Operating Expenses 90,218 90,057 90,731 73,720 64,808
Net Revenue Available for Debt Service $35,750 $31,413 $26,254 $28,322 $28,169
Principal $5,700 $5,335 $6,420 $10,090 $9,195 Interest 3,669 4,034 4,414 8,433 10,203
Specific Revenue Debt Service Requirements $9,369 $9,369 $10,834 $18,523 $19,398
Coverage 3.82 3.35 2.42 1.53 1.45
a v a i l a B l e f U n d sG e n e r a l r e v e n U e B o n d s
Total Unrestricted Revenue $1,191,976 $1,148,297 $1,055,273 $987,708 $1,009,353 Less: State Appropriations and State Aid (406,673) (380,446) (368,024) (368,505) (402,205) Tuition and Fees (164,457) (153,943) (146,961) (124,661) (139,319) Specific Revenue Debt Service Requirements (9,369) (9,369) (10,834) (18,523) (19,398) Plus: Adjusted Beginning Unrestricted Net Assets 410,110 370,816 346,546 392,613 354,936
Total Available Funds $1,021,587 $975,355 $876,000 $868,632 $803,367
Annual Increase $46,232 $99,355 $7,368 $65,265 $58,989 % Increase 4.7% 11.3% 0.8% 8.1% 7.9%
G e n e r a l r e v e n U eB o n d C o v e r a G e
Total Available Funds $1,021,587 $975,355 $876,000 $868,632 $803,367
Principal $13,220 $11,745 $7,150 $4,060 $2,840 Interest 14,459 10,017 8,332 7,094 5,012
General Revenue Debt Service Requirements $27,679 $21,762 $15,482 $11,154 $7,852
Coverage 36.91 44.82 56.58 77.88 102.31
For the fiscal year ended June 30, 2005 2004 2003 2002 2001
For the fiscal year ended June 30, 2005 2004 2003 2002 (1) 2001
For the fiscal year ended June 30, 2005 2004 2003 2002 2001

T h e U n i v e r s i T y o f n o r T h C a r o l i n a a t C h a p e l h i l l9 4
a n n U a l U n d e r G r a d U a T e e d U C a T i o n a l C o s T s p e r s T U d e n T
Public concern over tuition prices at colleges and universities led in 1997 to the establishment by Congress of the National Commission on the Cost of Higher Education. The task of the commission was to investigate the college cost-price conun-drum and recommend ways to address it. In response, the National Association of College and University Business Officers (NACUBO) developed the Cost of College Project. The goal was to create a uniform methodology that any college or university could use to explain and present how much it costs to provide one year of undergraduate education and related services. The criteria governing the project include: simplicity of use and understanding; basis should be on existing data from annual financial statements; should be applicable to all types of colleges and universities; and should produce reasonable results when compared with more detailed cost data derived from the institu-tion’s internal accounting methods.
After more than two years in development and testing by almost 150 colleges and universities, the final project report was delivered in November 2002. Carolina was one of those testing sites. A single-page template was developed by NACUBO to be used to record the necessary information. The template shows annual costs per resident undergraduate student at the Uni-versity. The graphs displayed on the next page show historical trends in the total annual costs per resident and non-resident undergraduate student at the University, and the difference between the price the student pays (i.e., tuition and fees) and state support (i.e., “subsidy”). The methodology was created to help individual institutions calculate and report the annual cost of providing an undergraduate education. It was not designed to be a mechanism for collecting national data on college costs or creating industry benchmarks. It is also not a measure of the value or quality of the education provided by the institution.

9 52010 Comprehensive A nnua l Financia l Repor t
C o s T o f C o l l e G e f o r r e s i d e n T U n d e r G r a d U a T e s T U d e n T s (dollars in thousands)
C o s T o f C o l l e G e f o r n o n - r e s i d e n T U n d e r G r a d U a T e s T U d e n T s (dollars in thousands)
0
20,000
15,000
10,000
25,000
5,000
$10,558
$12,923
$2,365
FY 99–00
$13,705
$10,937
$2,768
FY 00–01
$14,815
$11,538
$3,277
FY 01–02
$15,415
$11,559
$3,856
FY 02–03
$16,295
$12,223
$4,072
FY 03–04
$17,605
$13,154
$4,451
FY 04–05
$18,850
$14,237
$4,613
FY 05–06
$21,553
$16,213
$5,340
FY 07–08
$20,394
$15,361
$5,033
FY 06–07 FY 08–09
6.1%
3.6%
17.0%
8.1%
5.5%
18.4%
4.1%
0.2%
17.7%
5.7%
5.7%
5.6%
8.2%
7.9%
9.1%
5.7%
5.6%
6.1%
$22,160
$16,763
$5,397
2.8%
3.4%
1.1%
7.1%
8.2%
3.6%
8.0%
7.6%
9.3%
Subsidy Increase in Percentage
Price
0
20,000
15,000
10,000
25,000
5,000
-5,000
$1,392
$12,923
$11,531
FY 99–00
$13,705
$1,771
$11,934
FY 00–01
$14,815
$1,546
$13,269
FY 01–02
$15,415
$275$15,140
FY 02–03
$16,295
$375$15,920
FY 03–04
$17,605$56
$17,549
FY 04–05
$18,850
$439
$18,411
FY 05–06
$21,553$565
$20,988
FY 07–08 FY 08–09
$20,394
$713
$19,681
FY 06–07
6.1%
27.2%
3.5%
8.1%
12.7%
11.2%
4.1%
82.2%
14.1%
5.7%
36.4%
5.2%
8.2%
62.4%
6.9%
5.7%
20.8%
123.9%
6.6%
6.2%
$22,160
($135)
$22,295
2.8%
7.1%
683.9%
4.9%
8.0%
85.1%
10.2%
Subsidy Increase or decrease in Percentage
Price

T h e U n i v e r s i T y o f n o r T h C a r o l i n a a t C h a p e l h i l l9 6
Source: The University of North Carolina at Chapel Hill Fact Book.
a d M i s s i o n – f r e s h M e n
Applications 23,224 21,543 20,090 19,728 18,414 18,850 17,591 17,141 15,946 16,569 Accepted 7,345 7,315 6,999 6,737 6,736 6,741 6,441 6,073 6,339 6,088 Enrolled 3,960 3,852 3,893 3,807 3,751 3,589 3,516 3,460 3,687 3,415 Accepted as a Percentage of Applications 31.6% 34.0% 34.8% 34.1% 36.6% 35.8% 36.6% 35.4% 39.8% 36.7% Enrolled as a Percentage of Accepted 53.9% 52.7% 55.6% 56.5% 55.7% 53.2% 54.6% 57.0% 58.2% 56.1% Average SAT Scores – Total 1,302 1,301 1,302 1,292 1,299 1,287 1,283 1,267 1,257 1,251 Verbal 642 643 646 638 643 638 634 625 623 622 Math 660 658 656 654 656 649 649 642 634 629
e n r o l l M e n T
Undergraduate, Graduate and Professional FTE 26,707 26,356 25,895 25,482 25,043 24,733 24,314 24,041 23,517 23,000 Undergraduate, Graduate and Professional Headcount 28,916 28,567 28,136 27,717 27,276 26,878 26,359 26,028 25,464 24,872
Men (Headcount) 11,825 11,825 11,635 11,563 11,403 11,288 10,941 10,661 10,344 10,090 Percentage of Total 40.9% 41.4% 41.4% 41.7% 41.8% 42.0% 41.5% 41.0% 40.6% 40.6% Women (Headcount) 17,091 16,742 16,501 16,154 15,873 15,590 15,418 15,367 15,120 14,782 Percentage of Total 59.1% 58.6% 58.6% 58.3% 58.2% 58.0% 58.5% 59.0% 59.4% 59.4%
African American (Headcount) 2,793 2,820 2,813 2,756 2,692 2,686 2,658 2,574 2,490 2,398 Percentage of Total 9.8% 9.9% 10.0% 9.9% 9.9% 10.0% 10.1% 9.9% 9.7% 9.6% White (Headcount) 19,616 19,788 19,860 19,819 19,695 19,665 19,635 19,779 19,720 19,547 Percentage of Total 67.8% 69.3% 70.6% 71.5% 72.2% 73.2% 74.4% 76.0% 77.3% 78.5% Other (Headcount) 6,507 5,959 5,463 5,142 4,889 4,527 4,066 3,675 3,254 2,927 Percentage of Total 22.4% 20.8% 19.4% 18.6% 17.9% 16.8% 15.5% 14.1% 12.9% 11.9%
d e f r e e s e a r n e d
Bachelor’s 4,444 4,302 4,131 3,787 3,773 3,888 3,715 3,741 3,560 3,477 Master’s 1,840 1,832 1,836 1,871 1,914 1,847 1,872 1,739 1,638 1,679 Doctoral 513 485 600 512 490 459 439 412 390 398 Professional 643 618 604 601 608 610 587 672 589 599
a d M i s s i o n s , e n r o l l M e n T a n d d e G r e e s e a r n e d Last ten fiscal years (Fall enrollment)
2009–10 2008–09 2007–08 2006–07 2005–06 2004–05 2003–04 2002–03 2001–02 2000–01
2009–10 2008–09 2007–08 2006–07 2005–06 2004–05 2003–04 2002–03 2001–02 2000–01
2009–10 2008–09 2007–08 2006–07 2005–06 2004–05 2003–04 2002–03 2001–02 2000–01

9 72010 Comprehensive A nnua l Financia l Repor t
0
20,000
15,000
10,000
25,000
5,000 3,8
52
7,3
15
20
,09
0
21
,54
3
3,8
93
6,9
99
19
,72
8
3,8
076
,73
7
18
,41
4
3,7
51
6,7
36
18
,85
0
3,5
89
6,7
41
17
,59
1
3,5
16
6,4
41
17
,14
1
3,4
60
6,0
73
15
,94
6
3,6
87
6,3
39
16
,56
9
3,4
15
6,0
88
23
,22
4
3,9
60
7,3
45
2009–10 2008–09 2006–072007–08 2005–06 2004–05 2003–04 2002–03 2001–02 2000–01
Applications
Accepted
Enrolled
f r e s h M a n a p p l i e d , a C C e p T e d , a n d e n r o l l e d
h e a d C o U n T T o T a l
d e G r e e s e a r n e d
0
20,000
15,000
10,000
25,000
5,000
2009–10 2008–09 2006–072007–08 2005–06 2004–05 2003–04 2002–03 2001–02 2000–01
2,8
20 5
,95
9
19
,78
8
16,742
11,825
2,8
13 5,4
63
19
,86
0
2,7
93 6
,50
7
19
,61
6
17,091
11,825
16,501
11,635
16,154 15,873 15,590 15,418 15,367 15,120 14,782
11,563 11,403 11,288 10,941 10,661 10,344 10,090
2,7
56 5,1
42
19
,81
9
2,6
92 4,8
89
19
,69
5
2,6
86 4,5
27
19
,66
5
2,6
58 4,0
66
19
,63
5
2,5
74
3,6
75
19
,77
9
2,4
90
3,2
54
19
,72
0
2,3
98
2,9
27
19
,54
7
African American
White
Women
Men
Other
0
3,000
2,500
2,000
1,500
1,000
4,500
4,000
3,500
500
2009–10 2008–09 2006–072007–08 2005–06 2004–05 2003–04 2002–03 2001–02 2000–01
4,1
31
60
06
04
1,8
36
3,7
87
51
26
01
1,8
71
3,7
73
49
0 60
8
1,9
14
3,8
88
45
9 61
0
1,8
47
3,7
15
43
9 58
7
1,8
72
3,7
41
41
2 67
2
1,7
39
3,5
60
39
0 58
9
1,6
38
3,4
77
39
8 59
9
1,6
79
4,3
02
48
5 61
8
1,8
32
4,4
44
51
3 64
3
1,8
40
Bachelor’s
Master’s
Professional
Doctoral

T h e U n i v e r s i T y o f n o r T h C a r o l i n a a t C h a p e l h i l l9 8
North Carolina Population 9,516,907 9,380,884 9,222,414 9,061,032 8,856,505 8,683,242 8,541,221 8,407,248 8,320,146 North Carolina Population – 18 year olds 134,940 142,644 131,240 126,722 122,281 120,352 119,691 118,653 114,518 North Carolina Personal Income (in millions) n/a $333,031 $317,611 $305,022 $286,402 $265,299 $249,797 $237,379 $229,353 North Carolina Per Capita Income n/a $35,501 $34,439 $33,663 $32,338 $30,553 $29,246 $28,235 $27,566 North Carolina Unemployment Rate 10.00% 11.02% 5.95% 4.94% 4.56% 5.33% 5.49% 6.51% 6.27%
d e M o G r a p h i C d a T a Last nine fiscal years
Fiscal year ended June 30, 2010 2009 2008 2007 2006 2005 2004 2003 2002
n/a – data not available
Sources: Office of the State Controller, North Carolina State Data Center, U.S. Census Bureau

9 92010 Comprehensive A nnua l Financia l Repor t
p r i n C i p a l e M p l o y e r s
Notes: All figures are based on 1st quarter average. Percentage of total state employment is based on the average of the ranges given.
Source: Office of the State Controller (North Carolina Employment Security Commission)
State of North Carolina 180,000–184,999 1 4.46% 160,000–164,999 1 4.27% Federal Government 65,000–69,999 2 1.65% 60,000–64,999 2 1.64% Wal-Mart Stores, Inc. 50,000–54,999 3 1.28% 30,000–34,999 3 0.86% Duke University 25,000–29,999 4 0.67% 20,000–24,999 5 0.59% Charlotte Hospital Authority 25,000–29,999 5 0.67% 10,000–14,999 10 0.33% Food Lion, LLC 25,000–29,999 6 0.67% 25,000–29,999 4 0.72% Charlotte Board of Education 20,000–24,999 7 0.55% 15,000–19,999 7 0.46% Wells Fargo Bank, N.A. 20,000–24,999 8 0.55% 10,000–14,999 9 0.33% Wake Public Schools 15,000–19,999 9 0.43% 10,000–14,999 8 0.33% Lowes Home Centers, Inc. 15,000–19,999 10 0.43% — — IBM Corporation — — 15,000-19,999 6 0.46%
Total 440,000–489,990 11.36% 355,000–404,990 9.99%
Percentage of Percentage of Total State Total State Employer Employees Rank Employment Employees Rank Employment
2010 2001Fiscal Year
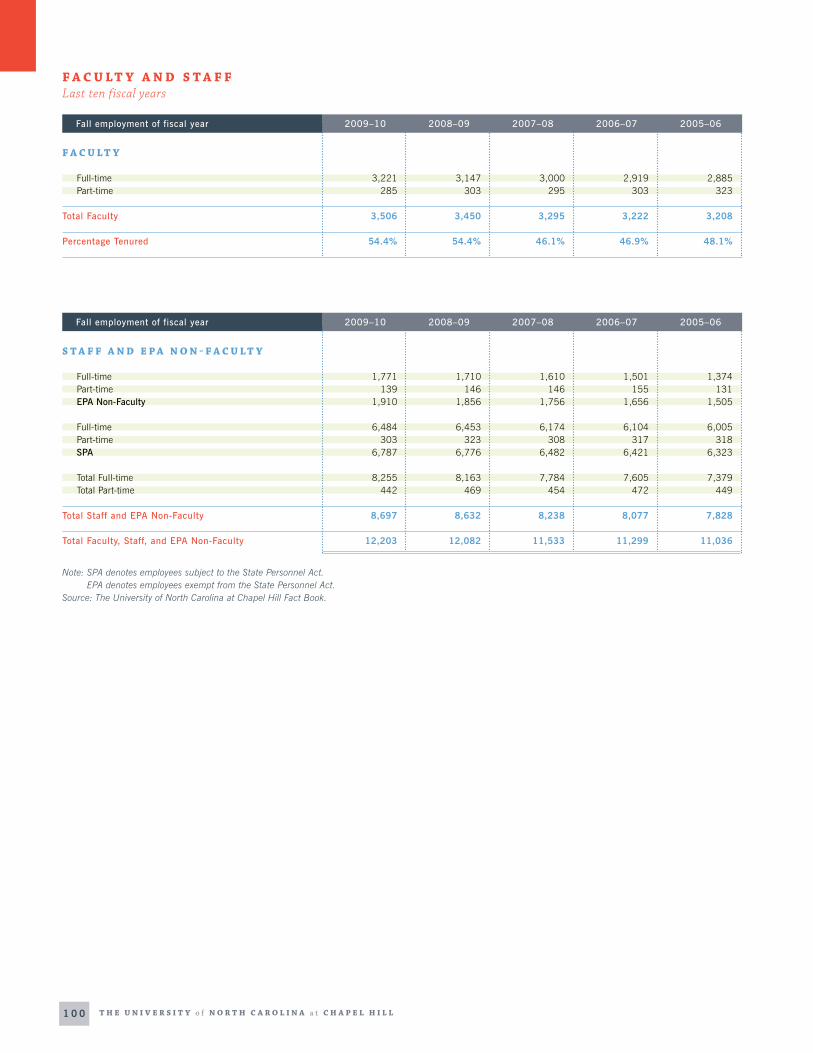
T h e U n i v e r s i T y o f n o r T h C a r o l i n a a t C h a p e l h i l l1 0 0
f a C U l T y a n d s T a f f Last ten fiscal years
Note: SPA denotes employees subject to the State Personnel Act. EPA denotes employees exempt from the State Personnel Act.Source: The University of North Carolina at Chapel Hill Fact Book.
f a C U l T y
Full-time 3,221 3,147 3,000 2,919 2,885 Part-time 285 303 295 303 323
Total Faculty 3,506 3,450 3,295 3,222 3,208
Percentage Tenured 54.4% 54.4% 46.1% 46.9% 48.1%
s T a f f a n d e p a n o n - f a C U l T y
Full-time 1,771 1,710 1,610 1,501 1,374 Part-time 139 146 146 155 131 EPA Non-Faculty 1,910 1,856 1,756 1,656 1,505
Full-time 6,484 6,453 6,174 6,104 6,005 Part-time 303 323 308 317 318 SPA 6,787 6,776 6,482 6,421 6,323
Total Full-time 8,255 8,163 7,784 7,605 7,379 Total Part-time 442 469 454 472 449
Total Staff and EPA Non-Faculty 8,697 8,632 8,238 8,077 7,828
Total Faculty, Staff, and EPA Non-Faculty 12,203 12,082 11,533 11,299 11,036
Fall employment of fiscal year 2009–10 2008–09 2007–08 2006–07 2005–06
Fall employment of fiscal year 2009–10 2008–09 2007–08 2006–07 2005–06

2010 Comprehensive A nnua l Financia l Repor t 1 0 1
Note: SPA denotes employees subject to the State Personnel Act. EPA denotes employees exempt from the State Personnel Act.Source: The University of North Carolina at Chapel Hill Fact Book.
f a C U l T y
Full-time 2,844 2,744 2,701 2,598 2,488 Part-time 330 313 307 322 294
Total Faculty 3,174 3,057 3,008 2,920 2,782
Percentage Tenured 48.7% 45.9% 50.5% 52.1% 53.9%
s T a f f a n d e p a n o n - f a C U l T y
Full-time 1,307 1,227 1,157 1,034 993 Part-time 132 128 111 97 92 EPA Non-Faculty 1,439 1,355 1,268 1,131 1,085
Full-time 6,004 5,947 5,915 5,782 5,574 Part-time 321 317 290 278 284 SPA 6,325 6,264 6,205 6,060 5,858
Total Full-time 7,311 7,174 7,072 6,816 6,567 Total Part-time 453 445 401 375 376
Total Staff and EPA Non-Faculty 7,764 7,619 7,473 7,191 6,943
Total Faculty, Staff, and EPA Non-Faculty 10,938 10,676 10,481 10,111 9,725
Fall employment of fiscal year 2004–05 2003–04 2002–03 2001–02 2000–01
Fall employment of fiscal year 2004–05 2003–04 2002–03 2001–02 2000–01

T h e U n i v e r s i T y o f n o r T h C a r o l i n a a t C h a p e l h i l l1 0 2
Academic/ Administrative buildings 131 129 127 125 122 122 122 120 120 Dormitories/ Auxiliary buildings 90 90 90 90 88 83 83 79 79 Art/Library collections 6 6 6 6 6 6 6 6 6
C a p i T a l a s s e T s Last nine fiscal years
Fiscal year ended June 30, 2010 2009 2008 2007 2006 2005 2004 2003 2002
1 0 2

FisCal ye ar eNded JuNe 30, 2010 | Chapel hill, North CaroliNa
p h o T o C r e d i T s Dan Sears: Pages 1, 2, 5, 6, 7, 9, 11, 12 r ight, 13 bot tom, 16 lef t,
17, 21, 73, inside back cover; Richard Cox: Page 13 top; Submit ted: Pages 12 lef t, 14 , 16 r ight
d e s i G n U NC Desig n Ser vices

FisCal ye ar eNded JuNe 30, 2010 | Chapel hill, North CaroliNa
2010 Comprehensive Annual Financia l Report