2010 Australian National Infant Feeding Survey
69
Australian Institute of Health and Welfare Canberra Cat. No. PHE 156 2010 Australian National Infant Feeding Survey Indicator results
Transcript of 2010 Australian National Infant Feeding Survey
Australian Institute of Health and Welfare
Canberra
Cat. No. PHE 156
2010 Australian National Infant
Feeding Survey
Indicator results
The Australian Institute of Health and Welfare is a major national agency
which provides reliable, regular and relevant information and statistics
on Australia’s health and welfare. The Institute’s mission is
authoritative information and statistics to promote better health and wellbeing.
© Australian Institute of Health and Welfare 2011
This product, excluding the AIHW logo, Commonwealth Coat of Arms and any material owned by a
third party or protected by a trademark, has been released under a Creative Commons BY 3.0
(CC-BY 3.0) licence. Excluded material owned by third parties may include, for example, design and
layout, images obtained under licence from third parties and signatures. We have made all reasonable
efforts to identify and label material owned by third parties.
You may distribute, remix and build upon this work. However, you must attribute the AIHW as the
copyright holder of the work in compliance with our attribution policy available at
<www.aihw.gov.au/copyright/>. The full terms and conditions of this licence are available at
<http://creativecommons.org/licenses/by/3.0/au/>.
Enquiries relating to copyright should be addressed to the Head of the Communications, Media and
Marketing Unit, Australian Institute of Health and Welfare, GPO Box 570, Canberra ACT 2601.
Suggested citation
Australian Institute of Health and Welfare 2011. 2010 Australian National Infant Feeding Survey:
indicator results. Canberra: AIHW.
Australian Institute of Health and Welfare
Board Chair
Dr Andrew Refshauge
Director
David Kalisch
Any enquiries about or comments on this publication should be directed to:
Communications, Media and Marketing Unit
Australian Institute of Health and Welfare
GPO Box 570
Canberra ACT 2601
Tel: (02) 6244 1032
Email: [email protected]
Published by the Australian Institute of Health and Welfare
Please note that there is the potential for minor revisions of data in this report.
Please check the online version at <www.aihw.gov.au> for any amendments.
Australian National Infant Feeding Survey: Indicator results iii
Contents
Acknowledgments.............................................................................................................................. iv
Abbreviations ....................................................................................................................................... v
Symbols ................................................................................................................................................. v
Summary .............................................................................................................................................. vi
1 Introduction .................................................................................................................................... 1
2 Overview of indicator results ..................................................................................................... 7
3 Detailed indicator results .......................................................................................................... 14
4 Factors influencing infant feeding practices .......................................................................... 38
Appendix A Explanatory notes ........................................................................................................ 43
Glossary ................................................................................................................................................ 57
References ............................................................................................................................................ 59
List of tables ........................................................................................................................................ 60
List of figures ...................................................................................................................................... 62
Related publications .......................................................................................................................... 63
iv 2010 Australian National Infant Feeding Survey: Indicator results
Acknowledgments
The report was prepared by Pramod Adhikari and Mark Cooper-Stanbury from the Australian Institute of Health and Welfare (AIHW). Assistance and support in data verification was provided by David Batts.
Thanks are due to the Technical Advisory Group who advised the project team on technical aspects of the survey in the design stages.
The AIHW would particularly like to acknowledge Erica Nixon, Kathleen Graham, Pippa Robinson, Rosemary Knight (from the Department of Health and Ageing); Luba Dubyk, Steve Gilbert, Rory King, Judy Zang (from Medicare Australia); Sushma Mathur, Ann Hunt (from the AIHW); Greg Smith and Ashwin Prekesh (from UNSW Global).
The project was funded by the Australian Government Department of Health and Ageing. The expert advice on all ethical aspects of the survey was provided by the Institute’s Ethics Committee.
Finally, this work was completely dependent on the cooperation of the mothers and carers who gave up their time to take part in the survey. Many thanks to all respondents who shared personal experiences about infant and child feeding practices.
Australian National Infant Feeding Survey: Indicator results v
Abbreviations
ABS Australian Bureau of Statistics
AIHW Australian Institute of Health and Welfare
ANIFS Australian National Infant Feeding Survey
BMI body mass index
CATI computer-assisted telephone interviewing
DoHA Australian Government Department of Health and Ageing
EAA Educational Assessment Australia
LSAC Longitudinal Study of Australian Children
PAL primary approach letter
OCR optical character recognition
ORS oral rehydration solution
SEIFA Socio-Economic Indexes for Areas
WHO World Health Organization
Symbols
— nil or rounded to zero
n.p. not publishable because of small numbers, confidentiality or other concerns about the quality of the data
vi 2010 Australian National Infant Feeding Survey: Indicator results
Summary
The 2010 Australian National Infant Feeding Survey, conducted in 2010–11, was the first large-scale, specialised, national survey of infant feeding practices and related attitudes and behaviours conducted in Australia. The main aim of the survey was to provide baseline data on estimates of the prevalence and duration of breastfeeding and other feeding practices adopted by mothers/carers.
Main findings
Initiation, duration and intensity of breastfeeding
• Breastfeeding was initiated for 96% of children aged 0–2 years.
• Around 69% of infants were still receiving some breastmilk at 4 months of age, although only 39% were exclusively breastfed to 3 months (less than 4 months), and around 60% were still receiving some breastmilk at 6 months, but only 15% were exclusively breastfed to 5 months (less than 6 months).
• A total of 47% of infants were predominantly (fully) breastfed to 3 months (less than 4 months), dropping to 21% predominantly breastfed to 5 months (less than 6 months).
Introduction of non-human milk and other fluids/foods
In the day before the survey:
• About 40% of infants aged 1 month old received non-human milk or infant formula, with the rate rising gradually to 55% at 6 months. Nearly 80% of children aged 12 months received non-human milk or infant formula.
• Less than 1% of infants aged 1 month old had consumed soft/semi-solid/solid food, rising to 35% of infants aged 4 months, 92% of infants aged 6 months and 95% of children aged 12 months.
Characteristics associated with breastfeeding practices
• Higher rates of initiation and higher intensity feeding for longer periods were associated with:
– mothers/carers aged 35 and over
– mothers/carers with tertiary education, and higher incomes
– infants who did not regularly use a dummy.
• These same groups were associated with lower and later rates of introduction of non-human milk and soft/semi-solid/solid foods.
Factors influencing breastfeeding practices
• The reasons most cited for giving the child breastmilk were ‘healthier for child’ (94%), ‘convenient’ (64%) and ‘helps with mother–infant bonding’ (64%).
• The reasons most cited for not breastfeeding were ‘previously unsuccessful experience’ (38%), ‘so my partner can share feeding’ (29%) and ‘infant formula as good as breastmilk’ (26%).
Australian National Infant Feeding Survey: Indicator results 1
1 Introduction
Breastfeeding helps protect infants against a number of conditions including diarrhoea, respiratory and ear infections, and obesity and chronic diseases in later life. For mothers, it provides many positive health effects, such as reducing the risk of some cancers and osteoporosis, as well as encouraging bonding between mother and child (NHMRC 2003).
Australia’s dietary guidelines recommend exclusive breastfeeding of infants until 6 months of age, with the introduction of solid foods at around 6 months and continued breastfeeding until the age of 12 months—and beyond if both mother and child wish (NHMRC 2003).
In 2009 all Australian health ministers endorsed the Australian National Breastfeeding Strategy 2010–2015 (Strategy) (AHMC 2009). The Strategy aims to improve the health, nutrition and wellbeing of infants and young children, and the health and wellbeing of mothers, by protecting, promoting, supporting and monitoring breastfeeding. One of the Strategy’s principles is that it is consistently informed by the best available evidence, and that the percentage of babies breastfed is regularly monitored and outcomes evaluated.
Most states and territories monitor breastfeeding rates and duration, but there is a lack of consistency in the data collected and the indicators reported. Several states use computer-assisted telephone interviewing (CATI) to collect data on breastfeeding rates, including Queensland, Victoria, Western Australia and South Australia. South Australia also uses CATI to ask additional questions about community perceptions of breastfeeding and to evaluate social marketing campaigns.
At a national level, breastfeeding data have been collected through the National Health Surveys and the National Aboriginal and Torres Strait Islander Health Surveys. The most recent national data are from the 2004 Longitudinal Study of Australian Children (LSAC).
Data from the 2004 LSAC survey indicated a breastfeeding initiation rate of 92%. However, at 1 week old, less than 80% of infants were fully breastfed, with a steady decline each month of age thereafter. At 3 months of age, 56% of infants were reportedly fully breastfed, reducing to 28% at 5 months and 14% at 6 months (AIFS 2008).
The measurement of breastfeeding is a complex matter. In 2001, as part of a broader food and nutrition monitoring and surveillance project, Webb et al. (2001) proposed a set of breastfeeding indicators for Australia. Considerations included the need to ensure that the indicators were relevant to the Australian policy environment, consistent with World Health Organization indicators (WHO 2008), feasible with a nationally representative sample and suitable for priority groups.
In 2006, 19 headline indicators for priority areas for children’s health, development and wellbeing were endorsed by the Australian Health Ministers’ Conference, the Community and Disability Services Ministers’ Conference and the Australian Education Systems Officials Committee (DHS 2006). The proportion of infants exclusively breastfed at 4 months of age is one of the headline indicators. This indicator is for 4 rather than 6 months because exclusive breastfeeding at 6 months is not a stable indicator as solid foods are often introduced at this time.
The Australian Institute of Health and Welfare (AIHW) has previously reported Children’s Headline Indicators for which data are currently available, including a summary of the available national and state/territory breastfeeding data (AIHW 2011a).
2 2010 Australian National Infant Feeding Survey: Indicator results
Until the 2010 Australian National Infant Feeding Survey (ANIFS), there has been limited national data to effectively monitor infant feeding practices. Further, due to lack of standardised measures and inconsistent use of definitions it was difficult to compare breastfeeding rates across jurisdictions.
In December 2010, the AIHW convened a workshop to gain consensus on a core set of national breastfeeding indicators. Workshop attendees included those who had participated in the 2008 review of breastfeeding indicators (Hector 2008); federal, state and territory government employees working in nutrition, epidemiology/health data and maternal health areas; and academics and researchers in child health.
During the workshop, a set of draft breastfeeding indicators was discussed for their suitability, stability, simplicity and measurability as core national breastfeeding indicators. The following set of indicators was agreed (AIHW 2011b):
Indicator 1: Proportion of children ever breastfed (for children aged 0–24 months)
Indicator 2: Proportion of children breastfed at each month of age, 0–24 months
Indicator 3: Proportion of children exclusively breastfed to each month of age, 0–6 months
Indicator 4: Proportion of children predominantly breastfed to each month of age, 0–6 months
Indicator 5: Proportion of children receiving soft/semi-solid/solid food at each month of age, 0–12 months
Indicator 6: Proportion of children receiving non-human milk or formula at each month of age, 0–12 months.
2010 Australian National Infant Feeding Survey In this context, the 2010 ANIFS was designed to provide baseline data on estimates of the prevalence and duration of breastfeeding and other feeding practices adopted by mothers/carers, and related attitudes. Barriers to initiating and continuing breastfeeding were also explored in the survey.
The initial methodology for the ANIFS was developed by the Australian Government Department of Health and Ageing in consultation with Medicare Australia and the Australian Bureau of Statistics (ABS). A summary of the relevant literature was completed in October 2008. This summary was used by the ABS to inform the development of the survey questionnaire which was completed in June 2009.
A pilot study to test the survey method and survey instrument was conducted from August 2010 to September 2010. The main survey was conducted between October 2010 and February 2011.
The sampling frame for the survey was the Medicare enrolment database. About 52,000 children aged up to 24 months were randomly selected nationwide. Medicare Australia applied an activity test when identifying children for inclusion in the sample. If there was at least one Medicare service or at least one episode recorded in the Australian Childhood Immunisation Register in the previous 12 months (enrolment was considered an activity), the child was included in the sample.

Australian National Infant Feeding Survey: Indicator results 3
A primary approach letter (PAL) explaining the purpose of the survey was sent in late October 2010 to the primary card holder on whose Medicare card the selected infant or baby was listed. About a week later, a survey instrument was sent, along with a reply paid envelope. There was also an option of completing the survey online. A week later, a reminder/thankyou letter was sent to all survey participants (except those who notified to opt out of the survey). A fourth and last mail-out reminding any remaining non-responding mothers/carers to complete the survey was sent in the first week of December 2010. More details on the survey methodology, including the weighting and analytical approach, are provided in Appendix A.
The survey achieved a response rate of 56%, considered to be an exceptional result for a mail survey. Two features of the design contributed to an improved response rate:
• for two-fifths of the initial sample (20,000 people), a pen with the inscription ‘Department of Health and Ageing’ was included in the mail-out containing the survey questionnaire, and this appears to have provided a small boost in the response rate among that subsample
• in preparing for the fourth mail-out, 5,000 of the survey sample—for whom a response had yet to be received—were excluded from the fourth mail-out. Among this group the response rate was only 5%, compared with 21% among the subsample who had received the fourth mail-out. That is, the fourth mail-out was influential in obtaining responses towards the end of the survey period.
About this report
Understanding how child’s age is used in this report
This report uses two different but related concepts of the child’s age for reporting.
Some indicator results are expressed using the current age of the child in completed months, as reported by the mother/carer at the time the survey was completed. For example, Indicator 2 (receiving any breastmilk at x months), Indicator 5 (introducing soft food at x months), and Indicator 6 (receiving non-human milk or formula at x months) are expressed using the child’s age in completed months.
By way of illustration (see Figure 1.1), a child aged 6 months (had completed 6 months of life, or was in their seventh month of life) who received solid foods in the past 24 hours is reported as receiving solid foods at 6 months. The use of the child’s age in such a way has been necessitated by the way the survey collected information on infant feeding time events.
Other indicators that are based on time-to-event techniques are expressed by the term ‘to’ months. Indicator 3 (exclusively breastfed) and Indicator 4 (predominantly breastfed) require the infant not to have experienced any ‘non-human milk’ to qualify for exclusive or predominant breastfeeding.
4 2010 Australian National Infant Feeding Survey: Indicator results
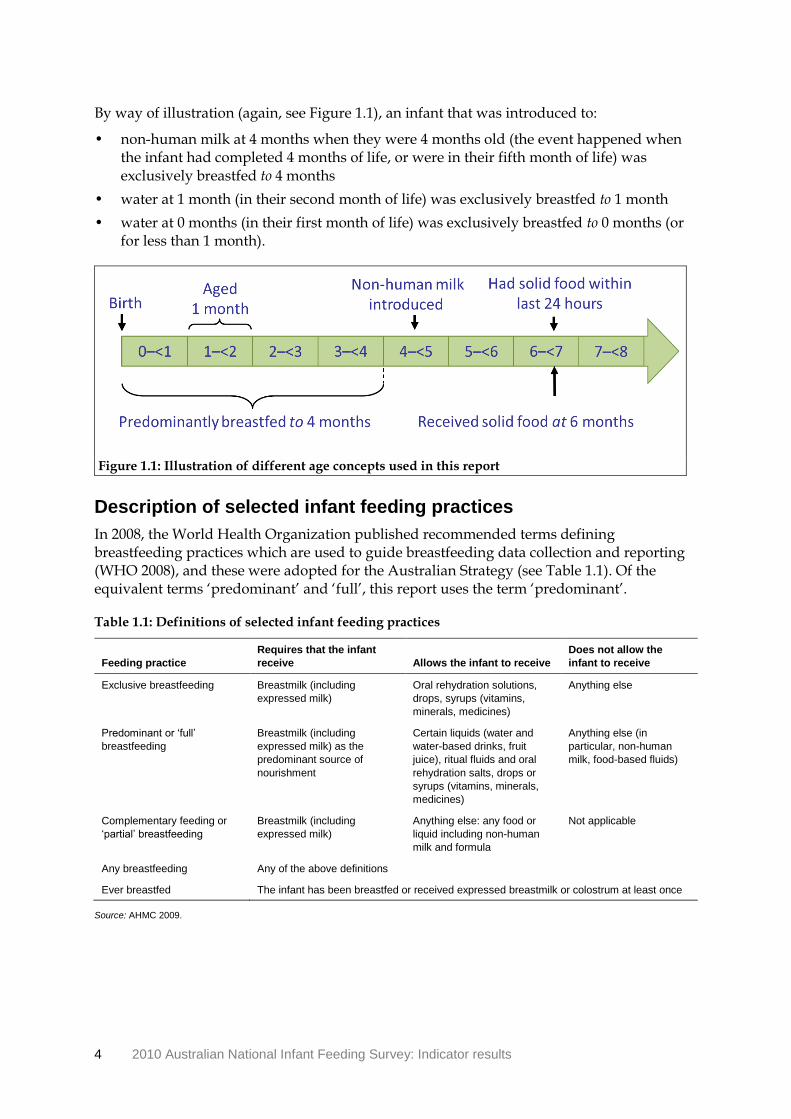
By way of illustration (again, see Figure 1.1), an infant that was introduced to:
• non-human milk at 4 months when they were 4 months old (the event happened when the infant had completed 4 months of life, or were in their fifth month of life) was exclusively breastfed to 4 months
• water at 1 month (in their second month of life) was exclusively breastfed to 1 month
• water at 0 months (in their first month of life) was exclusively breastfed to 0 months (or for less than 1 month).
Figure 1.1: Illustration of different age concepts used in this report
Description of selected infant feeding practices
In 2008, the World Health Organization published recommended terms defining breastfeeding practices which are used to guide breastfeeding data collection and reporting (WHO 2008), and these were adopted for the Australian Strategy (see Table 1.1). Of the equivalent terms ‘predominant’ and ‘full’, this report uses the term ‘predominant’.
Table 1.1: Definitions of selected infant feeding practices
Feeding practice
Requires that the infant
receive Allows the infant to receive
Does not allow the
infant to receive
Exclusive breastfeeding Breastmilk (including
expressed milk)
Oral rehydration solutions,
drops, syrups (vitamins,
minerals, medicines)
Anything else
Predominant or ‘full’
breastfeeding
Breastmilk (including
expressed milk) as the
predominant source of
nourishment
Certain liquids (water and
water-based drinks, fruit
juice), ritual fluids and oral
rehydration salts, drops or
syrups (vitamins, minerals,
medicines)
Anything else (in
particular, non-human
milk, food-based fluids)
Complementary feeding or
‘partial’ breastfeeding
Breastmilk (including
expressed milk)
Anything else: any food or
liquid including non-human
milk and formula
Not applicable
Any breastfeeding Any of the above definitions
Ever breastfed The infant has been breastfed or received expressed breastmilk or colostrum at least once
Source: AHMC 2009.
Australian National Infant Feeding Survey: Indicator results 5
Time-to-event analysis
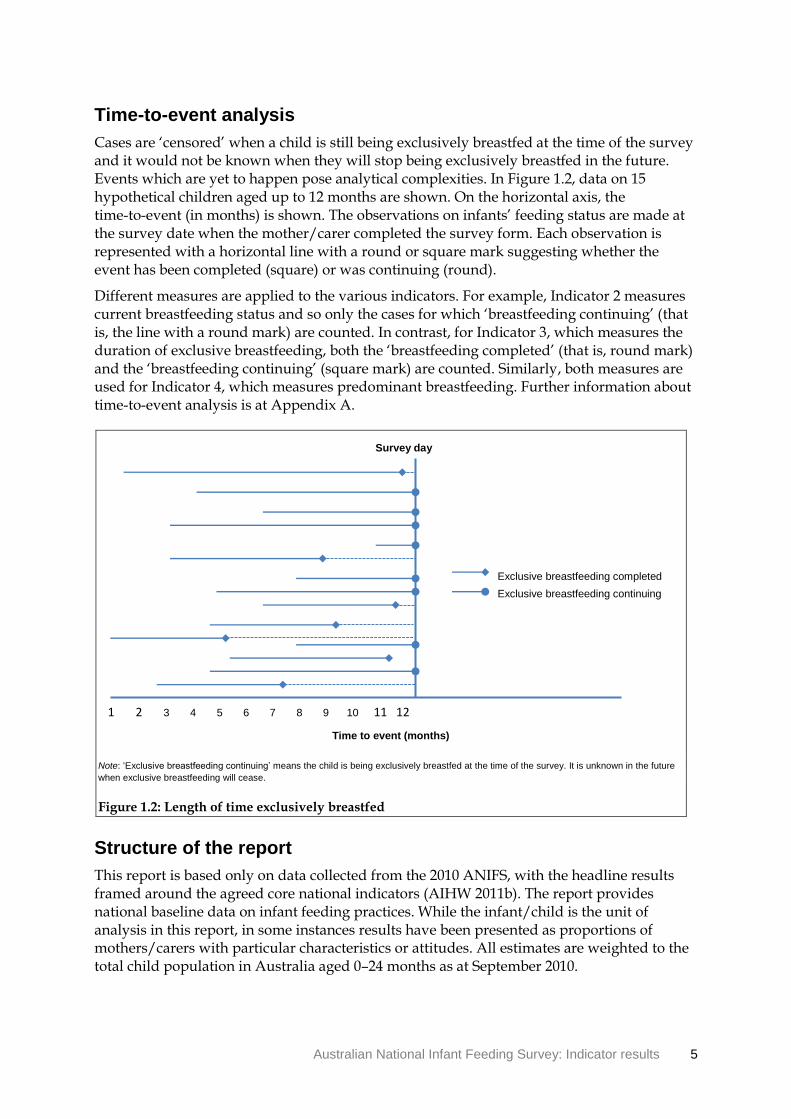
Cases are ‘censored’ when a child is still being exclusively breastfed at the time of the survey and it would not be known when they will stop being exclusively breastfed in the future. Events which are yet to happen pose analytical complexities. In Figure 1.2, data on 15 hypothetical children aged up to 12 months are shown. On the horizontal axis, the time-to-event (in months) is shown. The observations on infants’ feeding status are made at the survey date when the mother/carer completed the survey form. Each observation is represented with a horizontal line with a round or square mark suggesting whether the event has been completed (square) or was continuing (round).
Different measures are applied to the various indicators. For example, Indicator 2 measures current breastfeeding status and so only the cases for which ‘breastfeeding continuing’ (that is, the line with a round mark) are counted. In contrast, for Indicator 3, which measures the duration of exclusive breastfeeding, both the ‘breastfeeding completed’ (that is, round mark) and the ‘breastfeeding continuing’ (square mark) are counted. Similarly, both measures are used for Indicator 4, which measures predominant breastfeeding. Further information about time-to-event analysis is at Appendix A.
Note: ‘Exclusive breastfeeding continuing’ means the child is being exclusively breastfed at the time of the survey. It is unknown in the future
when exclusive breastfeeding will cease.
Figure 1.2: Length of time exclusively breastfed
Structure of the report
This report is based only on data collected from the 2010 ANIFS, with the headline results framed around the agreed core national indicators (AIHW 2011b). The report provides national baseline data on infant feeding practices. While the infant/child is the unit of analysis in this report, in some instances results have been presented as proportions of mothers/carers with particular characteristics or attitudes. All estimates are weighted to the total child population in Australia aged 0–24 months as at September 2010.
Exclusive breastfeeding completed
Exclusive breastfeeding continuing
Survey day
Time to event (months)
1 2 3 4 5 6 7 8 9 10 11 12
6 2010 Australian National Infant Feeding Survey: Indicator results
The context and introduction to the survey are described in this chapter . The next chapter contains an overview of the results for each of the core indicators.
Chapter 3 provides further breakdowns for each indicator where the sample is sufficient to support further analysis. These breakdowns include selected sociodemographic characteristics of the mother/carer, area-based characteristics and other characteristics.
Chapter 4 presents results on the attitudes and barriers to breastfeeding, and identifies factors that may predict breastfeeding practices in Australia.
This report only provides results for breastfeeding indicators and factors influencing infant feeding practices. The results on perinatal depression are not included in this report; these were separately provided to the Department of Health and Ageing.
Appendix A contains detailed descriptions of the survey methodology and related matters, including how the detailed indicator results were derived from the survey questions.
A glossary of relevant terms is also provided.
Additional tables are available from the AIHW web page at <www.aihw.gov.au>, including confidence intervals for key results. The survey form is also available at this web page.
Australian National Infant Feeding Survey: Indicator results 7
2 Overview of indicator results
The results presented here are framed by the core national breastfeeding indicators agreed at the consensus workshop in December 2010 (AIHW 2011b). Prevalence figures for exclusive and predominant breastfeeding are given using the term ‘to’ x months rather than using the more traditional concept of at x months.
Indicator 1: Proportion of children ever breastfed
Breastfeeding was initiated for a total of 95.9% of children aged 0–2 years. These results varied by sociodemographic characteristics of the mother/carer, with clear gradients seen by mother’s/carer’s age, level of education and income (see Tables 3.1 to 3.3).
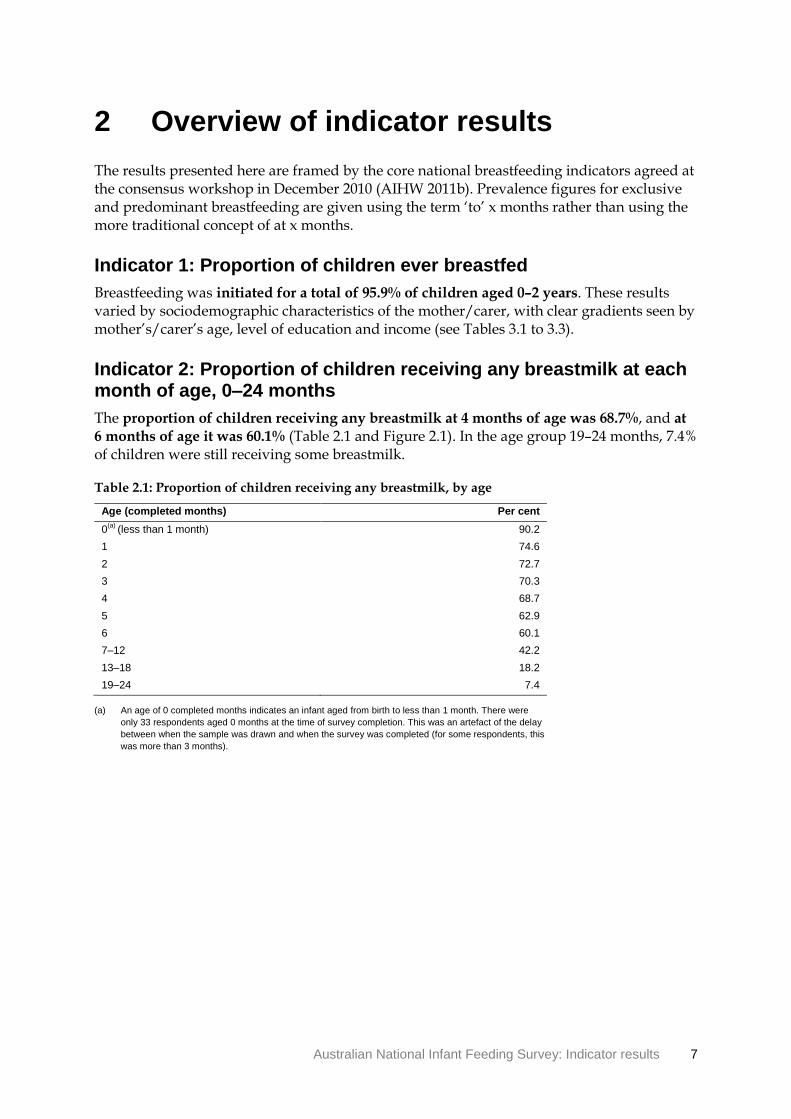
Indicator 2: Proportion of children receiving any breastmilk at each month of age, 0–24 months
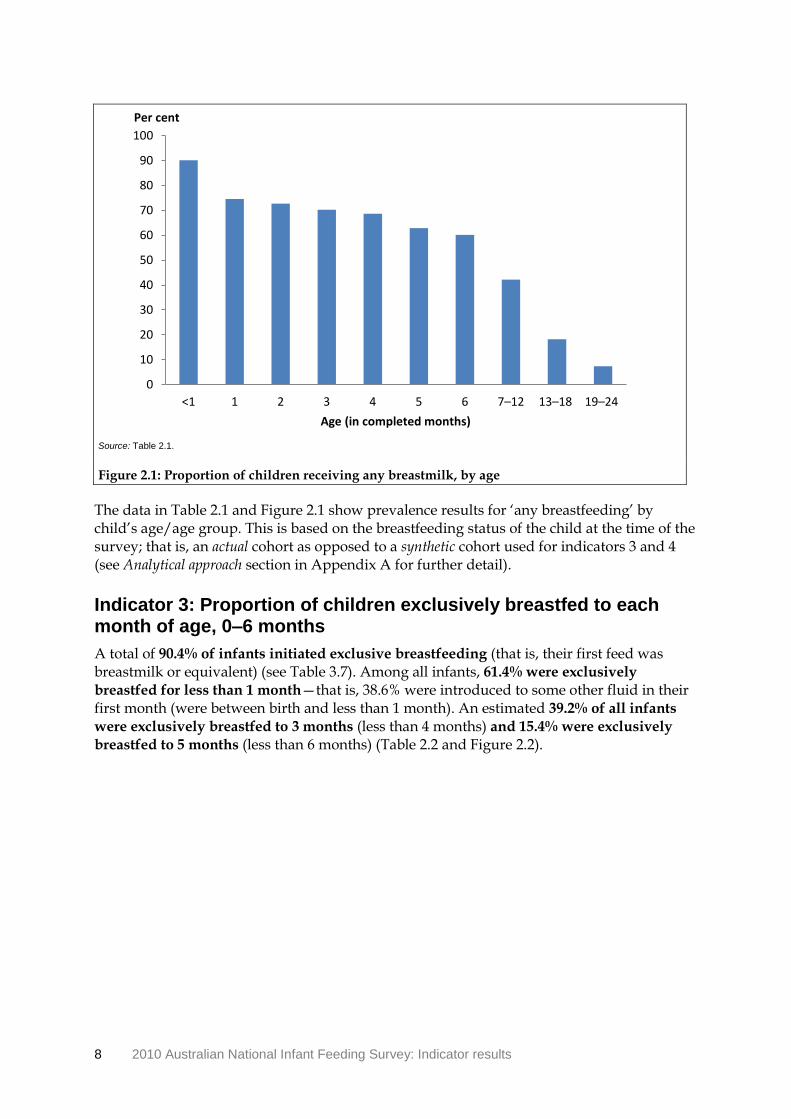
The proportion of children receiving any breastmilk at 4 months of age was 68.7%, and at
6 months of age it was 60.1% (Table 2.1 and Figure 2.1). In the age group 19–24 months, 7.4% of children were still receiving some breastmilk.
Table 2.1: Proportion of children receiving any breastmilk, by age
Age (completed months) Per cent
0(a)
(less than 1 month) 90.2
1 74.6
2 72.7
3 70.3
4 68.7
5 62.9
6 60.1
7–12 42.2
13–18 18.2
19–24 7.4
(a) An age of 0 completed months indicates an infant aged from birth to less than 1 month. There were
only 33 respondents aged 0 months at the time of survey completion. This was an artefact of the delay
between when the sample was drawn and when the survey was completed (for some respondents, this
was more than 3 months).
8 2010 Australian National Infant Feeding Survey: Indicator results
Source: Table 2.1.
Figure 2.1: Proportion of children receiving any breastmilk, by age
The data in Table 2.1 and Figure 2.1 show prevalence results for ‘any breastfeeding’ by child’s age/age group. This is based on the breastfeeding status of the child at the time of the survey; that is, an actual cohort as opposed to a synthetic cohort used for indicators 3 and 4 (see Analytical approach section in Appendix A for further detail).
Indicator 3: Proportion of children exclusively breastfed to each month of age, 0–6 months
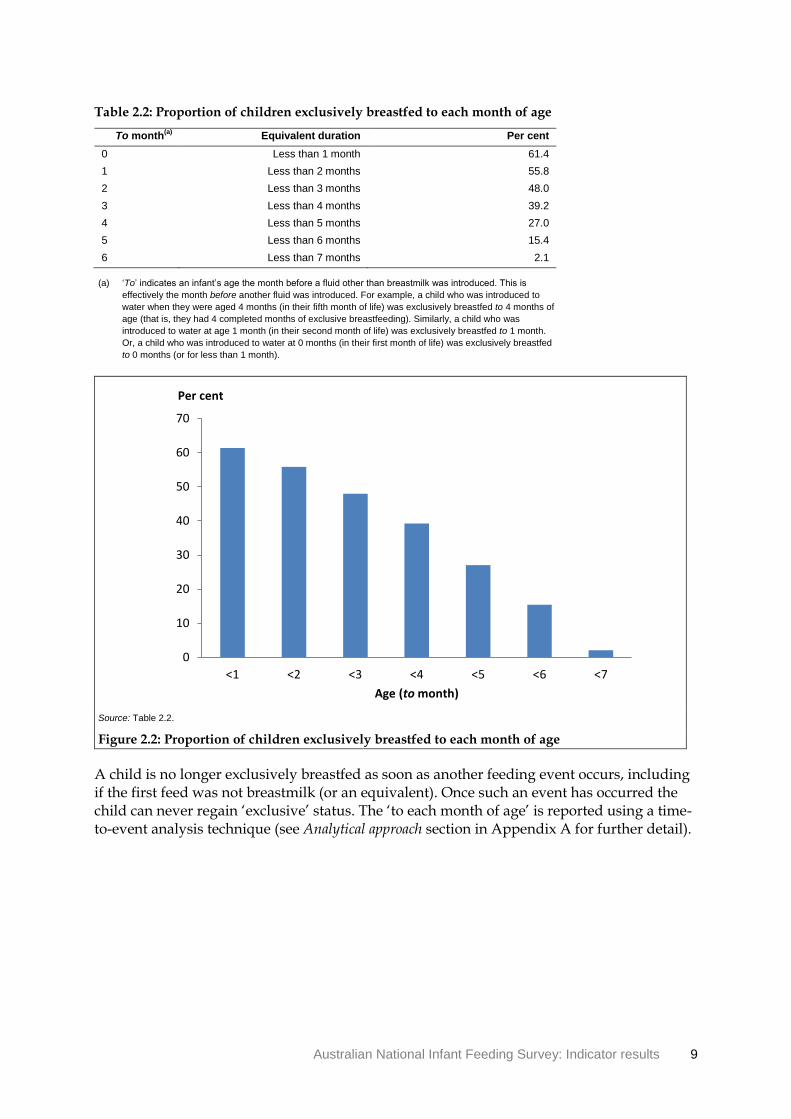
A total of 90.4% of infants initiated exclusive breastfeeding (that is, their first feed was breastmilk or equivalent) (see Table 3.7). Among all infants, 61.4% were exclusively
breastfed for less than 1 month—that is, 38.6% were introduced to some other fluid in their first month (were between birth and less than 1 month). An estimated 39.2% of all infants
were exclusively breastfed to 3 months (less than 4 months) and 15.4% were exclusively
breastfed to 5 months (less than 6 months) (Table 2.2 and Figure 2.2).
0
10
20
30
40
50
60
70
80
90
100
<1 1 2 3 4 5 6 7–12 13–18 19–24
Per cent
Age (in completed months)
Australian National Infant Feeding Survey: Indicator results 9
Table 2.2: Proportion of children exclusively breastfed to each month of age
To month(a)
Equivalent duration Per cent
0 Less than 1 month 61.4
1 Less than 2 months 55.8
2 Less than 3 months 48.0
3 Less than 4 months 39.2
4 Less than 5 months 27.0
5 Less than 6 months 15.4
6 Less than 7 months 2.1
(a) ‘To’ indicates an infant’s age the month before a fluid other than breastmilk was introduced. This is
effectively the month before another fluid was introduced. For example, a child who was introduced to
water when they were aged 4 months (in their fifth month of life) was exclusively breastfed to 4 months of
age (that is, they had 4 completed months of exclusive breastfeeding). Similarly, a child who was
introduced to water at age 1 month (in their second month of life) was exclusively breastfed to 1 month.
Or, a child who was introduced to water at 0 months (in their first month of life) was exclusively breastfed
to 0 months (or for less than 1 month).
Source: Table 2.2.
Figure 2.2: Proportion of children exclusively breastfed to each month of age
A child is no longer exclusively breastfed as soon as another feeding event occurs, including if the first feed was not breastmilk (or an equivalent). Once such an event has occurred the child can never regain ‘exclusive’ status. The ‘to each month of age’ is reported using a time-to-event analysis technique (see Analytical approach section in Appendix A for further detail).
0
10
20
30
40
50
60
70
<1 <2 <3 <4 <5 <6 <7
Per cent
Age (to month)
10 2010 Australian National Infant Feeding Survey: Indicator results
Indicator 4: Proportion of children predominantly breastfed to each month of age, 0–6 months
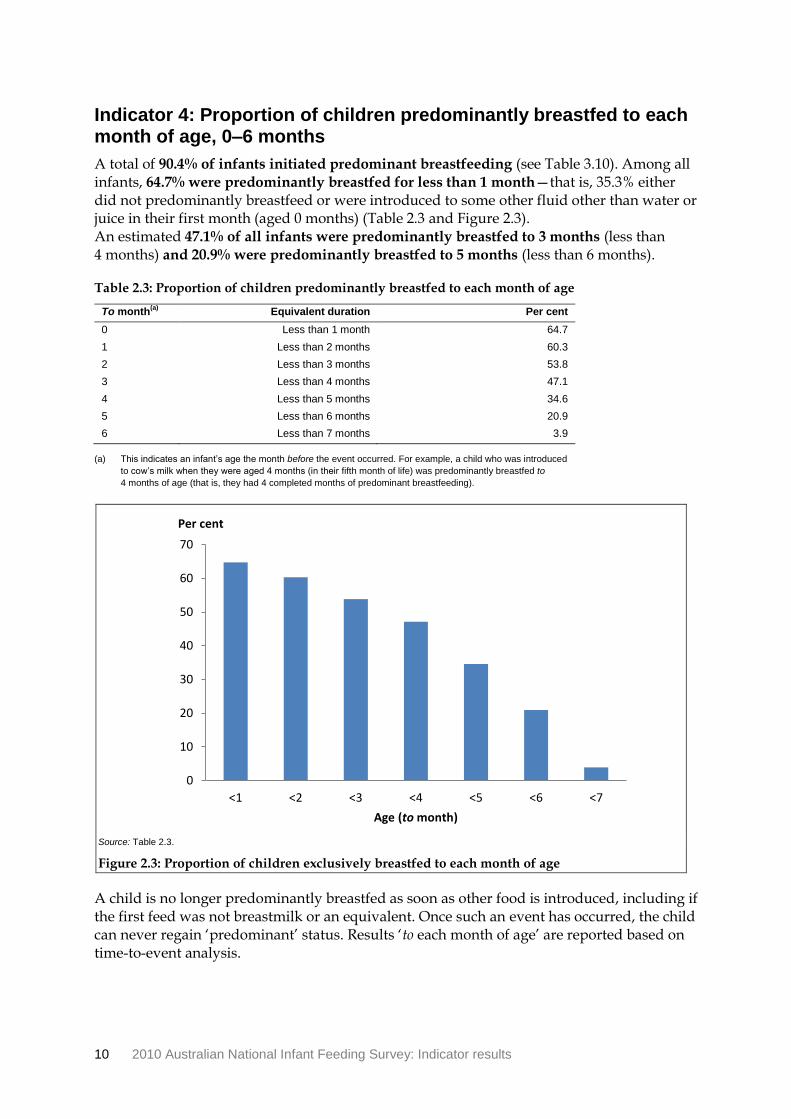
A total of 90.4% of infants initiated predominant breastfeeding (see Table 3.10). Among all infants, 64.7% were predominantly breastfed for less than 1 month—that is, 35.3% either did not predominantly breastfeed or were introduced to some other fluid other than water or juice in their first month (aged 0 months) (Table 2.3 and Figure 2.3). An estimated 47.1% of all infants were predominantly breastfed to 3 months (less than 4 months) and 20.9% were predominantly breastfed to 5 months (less than 6 months).
Table 2.3: Proportion of children predominantly breastfed to each month of age
To month(a)
Equivalent duration Per cent
0 Less than 1 month 64.7
1 Less than 2 months 60.3
2 Less than 3 months 53.8
3 Less than 4 months 47.1
4 Less than 5 months 34.6
5 Less than 6 months 20.9
6 Less than 7 months 3.9
(a) This indicates an infant’s age the month before the event occurred. For example, a child who was introduced
to cow’s milk when they were aged 4 months (in their fifth month of life) was predominantly breastfed to
4 months of age (that is, they had 4 completed months of predominant breastfeeding).
Source: Table 2.3.
Figure 2.3: Proportion of children exclusively breastfed to each month of age
A child is no longer predominantly breastfed as soon as other food is introduced, including if the first feed was not breastmilk or an equivalent. Once such an event has occurred, the child can never regain ‘predominant’ status. Results ‘to each month of age’ are reported based on time-to-event analysis.
0
10
20
30
40
50
60
70
<1 <2 <3 <4 <5 <6 <7
Per cent
Age (to month)
Australian National Infant Feeding Survey: Indicator results 11
Indicator 5: Proportion of children receiving soft/semi-solid/solid food at each month of age, 0–12 months
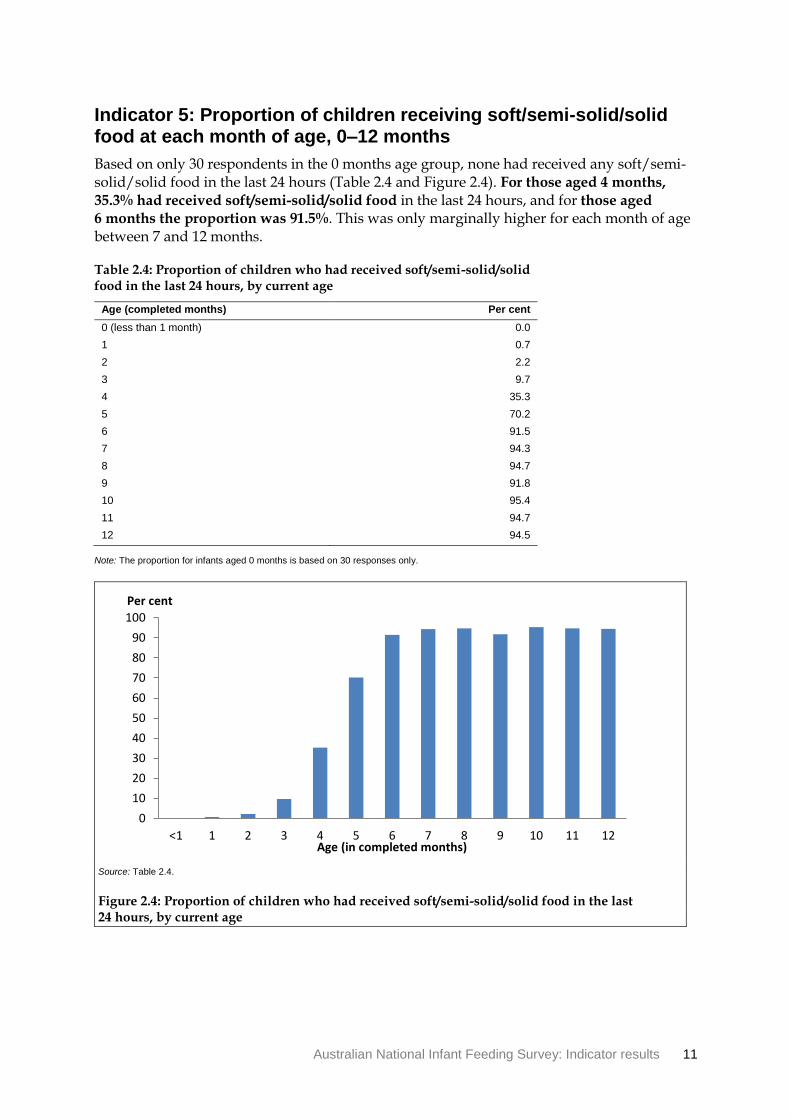
Based on only 30 respondents in the 0 months age group, none had received any soft/semi-solid/solid food in the last 24 hours (Table 2.4 and Figure 2.4). For those aged 4 months,
35.3% had received soft/semi-solid/solid food in the last 24 hours, and for those aged 6 months the proportion was 91.5%. This was only marginally higher for each month of age between 7 and 12 months.
Table 2.4: Proportion of children who had received soft/semi-solid/solid food in the last 24 hours, by current age
Age (completed months) Per cent
0 (less than 1 month) 0.0
1 0.7
2 2.2
3 9.7
4 35.3
5 70.2
6 91.5
7 94.3
8 94.7
9 91.8
10 95.4
11 94.7
12 94.5
Note: The proportion for infants aged 0 months is based on 30 responses only.
Source: Table 2.4.
Figure 2.4: Proportion of children who had received soft/semi-solid/solid food in the last 24 hours, by current age
0
10
20
30
40
50
60
70
80
90
100
<1 1 2 3 4 5 6 7 8 9 10 11 12
Per cent
Age (in completed months)
12 2010 Australian National Infant Feeding Survey: Indicator results
For this indicator, the definition requires a child to have received soft/semi-solid/solid food within the last 24 hours, hence this indicator is reported using ‘current’ status, like Indicator 2. In the detailed results in Chapter 3, we present time-to-event results for this indicator, which requires the ‘last 24 hours’ constraint to be excluded.
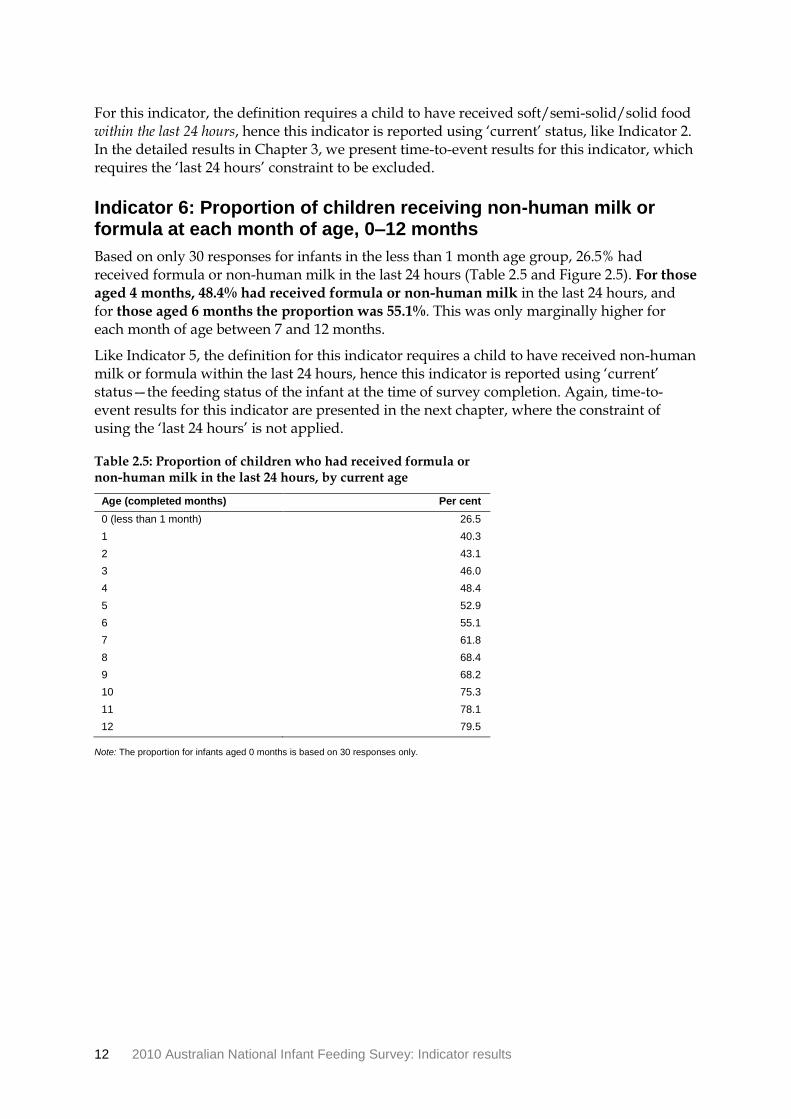
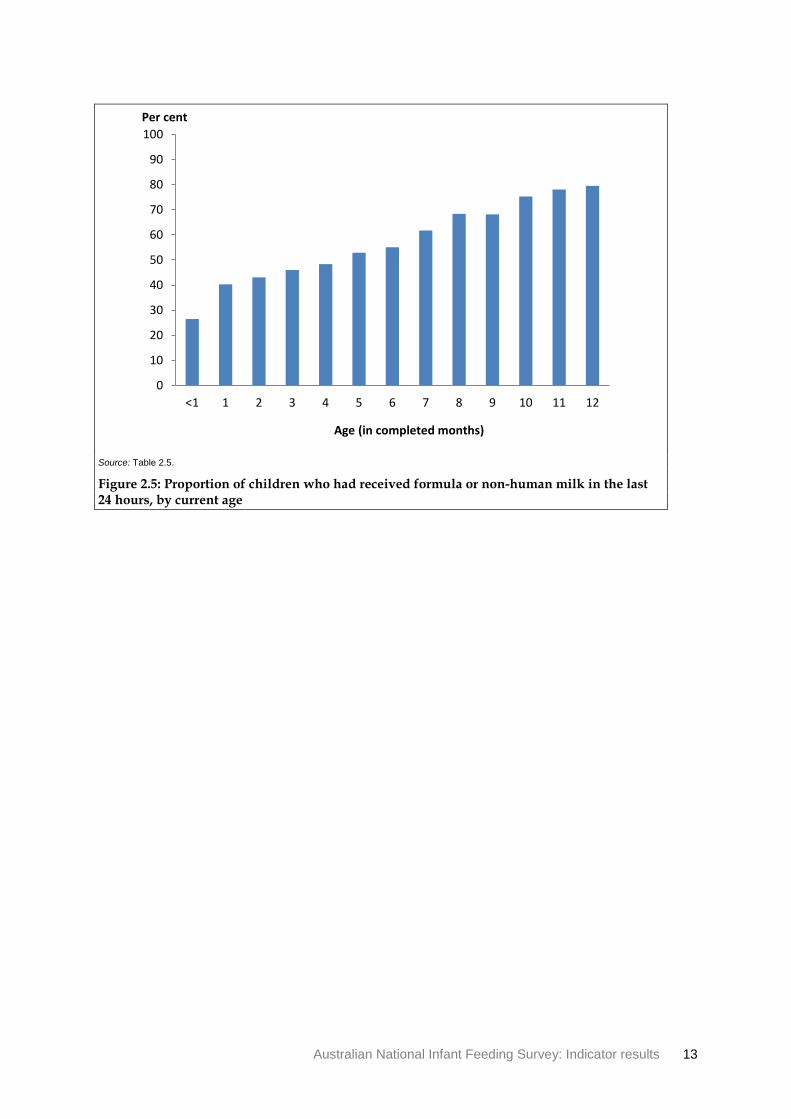
Indicator 6: Proportion of children receiving non-human milk or formula at each month of age, 0–12 months
Based on only 30 responses for infants in the less than 1 month age group, 26.5% had received formula or non-human milk in the last 24 hours (Table 2.5 and Figure 2.5). For those
aged 4 months, 48.4% had received formula or non-human milk in the last 24 hours, and for those aged 6 months the proportion was 55.1%. This was only marginally higher for each month of age between 7 and 12 months.
Like Indicator 5, the definition for this indicator requires a child to have received non-human milk or formula within the last 24 hours, hence this indicator is reported using ‘current’ status—the feeding status of the infant at the time of survey completion. Again, time-to-event results for this indicator are presented in the next chapter, where the constraint of using the ‘last 24 hours’ is not applied.
Table 2.5: Proportion of children who had received formula or non-human milk in the last 24 hours, by current age
Age (completed months) Per cent
0 (less than 1 month) 26.5
1 40.3
2 43.1
3 46.0
4 48.4
5 52.9
6 55.1
7 61.8
8 68.4
9 68.2
10 75.3
11 78.1
12 79.5
Note: The proportion for infants aged 0 months is based on 30 responses only.
Australian National Infant Feeding Survey: Indicator results 13
Source: Table 2.5.
Figure 2.5: Proportion of children who had received formula or non-human milk in the last 24 hours, by current age
0
10
20
30
40
50
60
70
80
90
100
<1 1 2 3 4 5 6 7 8 9 10 11 12
Per cent
Age (in completed months)
14 2010 Australian National Infant Feeding Survey: Indicator results
3 Detailed indicator results
Introduction This chapter presents results using a standard set of tables for each indicator. These cover mother’s/carer’s sociodemographic characteristics, area-level characteristics, and other characteristics. A few highlights from each table are drawn out in the commentary. All the estimates are statistically reliable unless otherwise stated. Supplementary tables on this report’s web page at <www.aihw.gov.au> provide confidence intervals for each result.
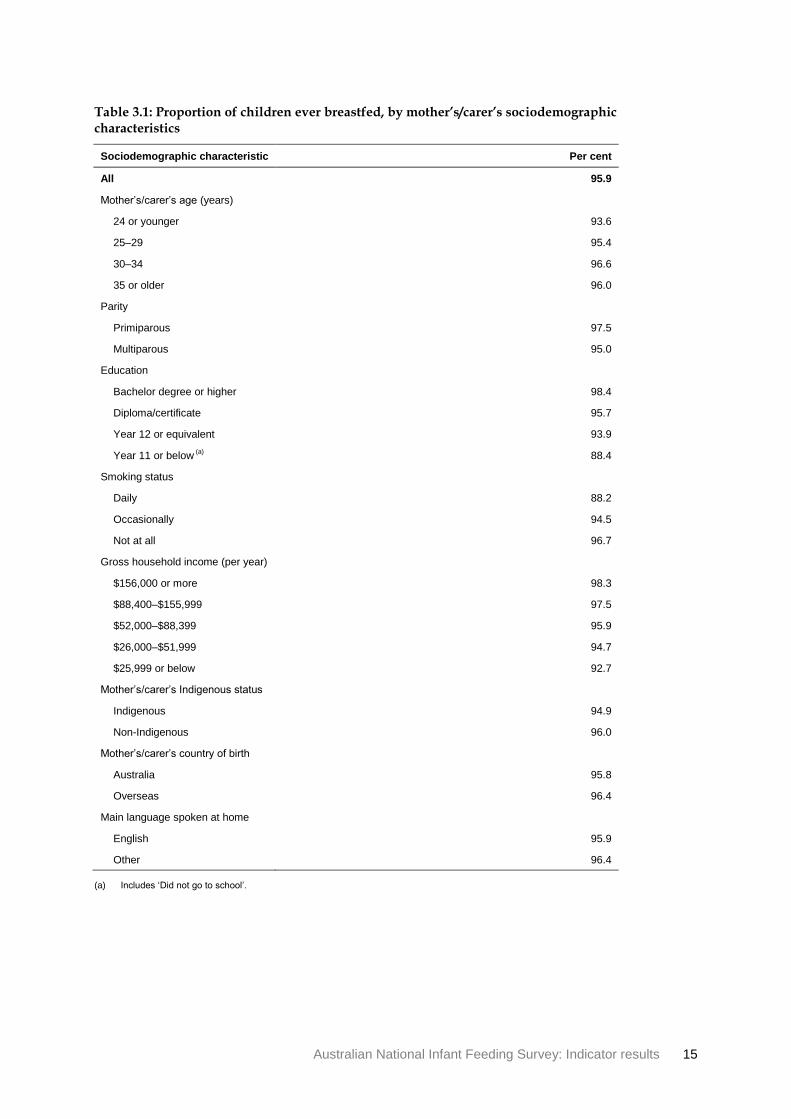
Indicator 1: Proportion of children ever breastfed
The survey showed that the breastfeeding initiation rate for all children aged 24 months and under, was 96%. Other highlights include:
From Table 3.1:
• The lowest breastfeeding initiation rate was reported by mothers/carers who were daily smokers (88%).
• A similar low rate for breastfeeding initiation was reported by mothers/carers whose level of education was Year 11 or lower (88%).
• Children in households whose income fell within the highest category had a very high breastfeeding initiation rate (98%).
• There were no significant differences in breastfeeding initiation rates by mother’s/carer’s country of birth or main language spoken at home.
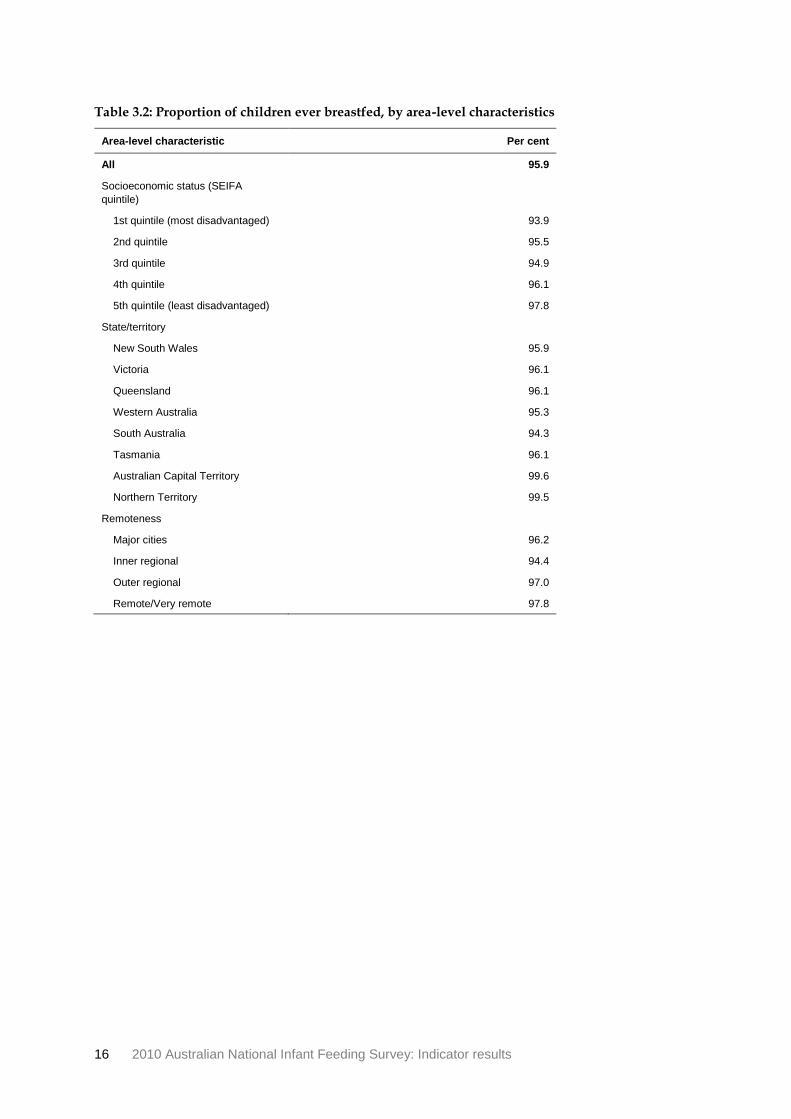
From Table 3.2:
• There was little variation for those who were reported to have ever been breastfed across socioeconomic areas based on Socio-Economic Indexes for Areas (SEIFA), ranging from 94% in the most disadvantaged fifth to 98% in the least disadvantaged fifth.
• Rates were similar across the six Australian states, but significantly higher in the two territories.
• There was no clear pattern in ever breastfed rates by geographical remoteness.
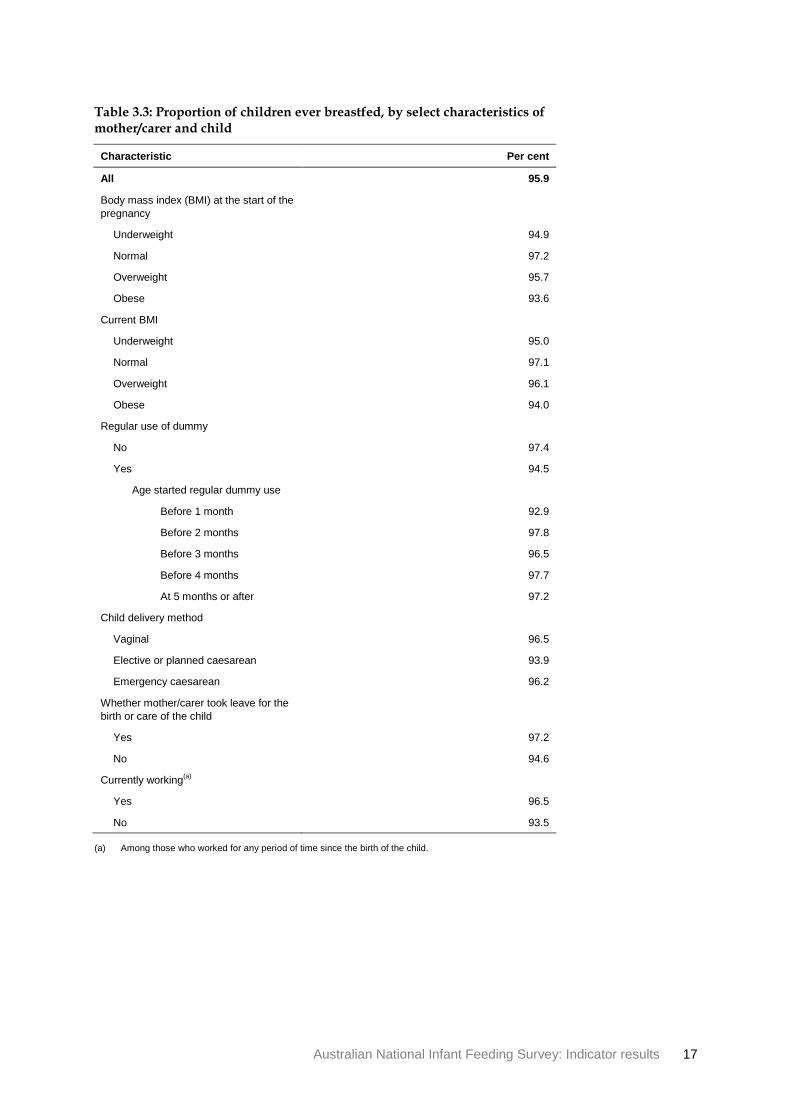
From Table 3.3:
• Ever breastfed rates were significantly higher where the body mass index (BMI) of the mother/carer fell within the normal range compared with those whose BMI was within the obese range.
• Rates were significantly higher among mothers/carers who took leave for the birth or care of the child (97%) compared with those who did not take leave (95%).
• Rates were lower among mothers/carers who were not working (94%) compared with those who were working (97%).
Australian National Infant Feeding Survey: Indicator results 15
Table 3.1: Proportion of children ever breastfed, by mother’s/carer’s sociodemographic characteristics
Sociodemographic characteristic Per cent
All 95.9
Mother’s/carer’s age (years)
24 or younger 93.6
25–29 95.4
30–34 96.6
35 or older 96.0
Parity
Primiparous 97.5
Multiparous 95.0
Education
Bachelor degree or higher 98.4
Diploma/certificate 95.7
Year 12 or equivalent 93.9
Year 11 or below (a)
88.4
Smoking status
Daily 88.2
Occasionally 94.5
Not at all 96.7
Gross household income (per year)
$156,000 or more 98.3
$88,400–$155,999 97.5
$52,000–$88,399 95.9
$26,000–$51,999 94.7
$25,999 or below 92.7
Mother’s/carer’s Indigenous status
Indigenous 94.9
Non-Indigenous 96.0
Mother’s/carer’s country of birth
Australia 95.8
Overseas 96.4
Main language spoken at home
English 95.9
Other 96.4
(a) Includes ‘Did not go to school’.
16 2010 Australian National Infant Feeding Survey: Indicator results
Table 3.2: Proportion of children ever breastfed, by area-level characteristics
Area-level characteristic Per cent
All 95.9
Socioeconomic status (SEIFA
quintile)
1st quintile (most disadvantaged) 93.9
2nd quintile 95.5
3rd quintile 94.9
4th quintile 96.1
5th quintile (least disadvantaged) 97.8
State/territory
New South Wales 95.9
Victoria 96.1
Queensland 96.1
Western Australia 95.3
South Australia 94.3
Tasmania 96.1
Australian Capital Territory 99.6
Northern Territory 99.5
Remoteness
Major cities 96.2
Inner regional 94.4
Outer regional 97.0
Remote/Very remote 97.8
Australian National Infant Feeding Survey: Indicator results 17
Table 3.3: Proportion of children ever breastfed, by select characteristics of mother/carer and child
Characteristic Per cent
All 95.9
Body mass index (BMI) at the start of the
pregnancy
Underweight 94.9
Normal 97.2
Overweight 95.7
Obese 93.6
Current BMI
Underweight 95.0
Normal 97.1
Overweight 96.1
Obese 94.0
Regular use of dummy
No 97.4
Yes 94.5
Age started regular dummy use
Before 1 month 92.9
Before 2 months 97.8
Before 3 months 96.5
Before 4 months 97.7
At 5 months or after 97.2
Child delivery method
Vaginal 96.5
Elective or planned caesarean 93.9
Emergency caesarean 96.2
Whether mother/carer took leave for the
birth or care of the child
Yes 97.2
No 94.6
Currently working(a)
Yes 96.5
No 93.5
(a) Among those who worked for any period of time since the birth of the child.
18 2010 Australian National Infant Feeding Survey: Indicator results
Indicator 2: Proportion of children breastfed at each month of age
The survey asked all respondents whose child had ever been breastfed to report whether the child was currently receiving breastmilk (including expressed breastmilk or breastmilk from a donor). The results presented here are by the month of age of the child at the time the survey was completed. As the sample size was considerably reduced for children aged 7–24 months, these ages have been grouped into 6-month bands.
The results show that 90% of infants who were in their first month of life were receiving breastmilk (Table 3.4). For those in their second month (aged 1 month) the rate dropped to 75%, and then decreased gradually to 69% among infants aged 4 months and to 60% among infants aged 6 months. The survey also showed that 7% of children aged 19–24 months were still receiving some breastmilk. Other highlights include:
From Table 3.4:
• Age of the mother/carer was strongly associated with current breastfeeding, with higher rates found among older mothers/carers compared with younger ones across all child ages.
• The lowest rates were observed among the youngest mothers (aged 24 years or younger) across all child ages.
• A similar (but opposite) gradient of current breastfeeding was observed for education levels of mothers/carers, with higher proportions of children of higher-educated mothers/carers receiving any breastmilk compared with less-educated mothers/carers; however, this difference had dissipated for older children.
• Children of mothers/carers who were daily smokers had much lower rates of any breastfeeding: for example, infants at age 6 months showed almost a threefold difference in the rate of any breastfeeding (63% among infants of non-smokers and 23% among infants of daily smokers).
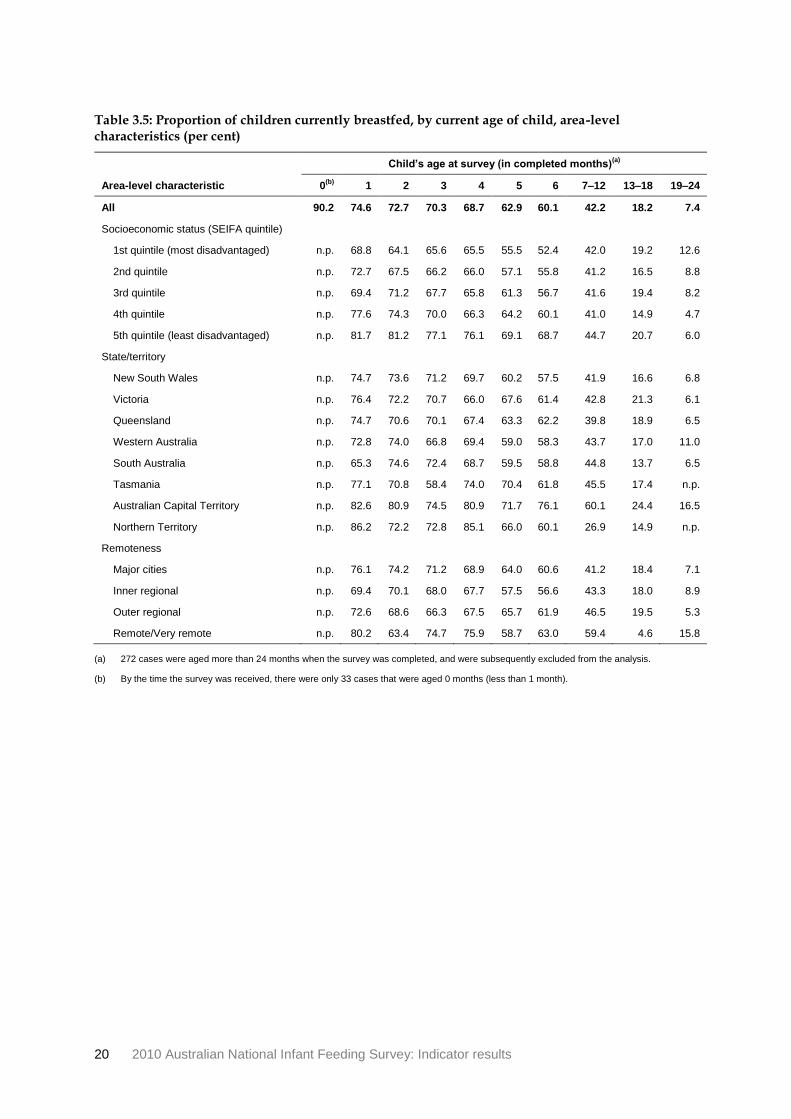
From Table 3.5:
• For infants aged up to [but less than] 6 months, there was a general gradient of increased breastfeeding rates with increasing socioeconomic status; for children aged 19–24 months this pattern reversed.
• Across all age groups, breastfeeding rates were consistently higher in the Australian Capital Territory, although the Northern Territory had the highest rate of any breastfeeding for infants aged 1 and 4 months.
• There was no clear pattern of current breastfeeding across geographical regions.
From Table 3.6:
• Breastfeeding rates were significantly lower among mothers/carers who were obese compared with those whose weights fell within the normal BMI range.
• The regular use of a dummy was associated with lower breastfeeding rates. For example, among infants aged 4 months who did not regularly use a dummy the breastfeeding rate was 81%, compared with 58% among those who did use a dummy.

Australian National Infant Feeding Survey: Indicator results 19
Table 3.4: Proportion of children currently breastfed, by current age of child, mother’s/carer’s sociodemographic characteristics (per cent)
Child’s age at survey (in completed months)(a)
Sociodemographic characteristic 0(b)
1 2 3 4 5 6 7–12 13–18 19–24
All 90.2 74.6 72.7 70.3 68.7 62.9 60.1 42.2 18.2 7.4
Mother’s/carer’s age (years)
24 or younger n.p. 61.9 53.0 47.0 53.1 35.6 39.1 19.2 4.8 2.6
25–29 n.p. 73.6 70.2 66.2 65.9 60.9 56.7 41.2 15.1 6.2
30–34 n.p. 79.1 77.9 76.1 71.8 67.2 63.5 44.2 17.5 5.5
35 or older n.p. 76.7 76.3 73.7 72.5 67.1 64.1 44.8 22.4 10.0
Parity
Primiparous n.p. 73.7 71.0 68.4 67.7 60.9 57.1 41.8 15.8 7.0
Multiparous n.p. 75.5 74.2 72.3 69.8 65.0 62.8 43.1 20.2 7.3
Education
Bachelor degree or higher n.p. 84.5 84.8 80.4 79.7 74.6 73.1 52.6 22.1 8.6
Diploma/certificate n.p. 69.0 66.3 63.8 62.2 53.5 51.7 35.5 15.0 5.5
Year 12 or equivalent n.p. 75.4 66.0 65.9 57.2 56.2 52.0 37.0 11.4 5.9
Year 11 or below(c)
n.p. 60.0 60.2 51.9 55.7 46.9 40.3 26.3 21.4 12.9
Smoking status
Daily n.p. 55.3 43.3 38.1 37.9 27.6 23.3 20.3 9.7 4.7
Occasionally n.p. 75.5 58.1 50.7 55.9 51.2 48.2 23.7 n.p. n.p.
Not at all n.p. 76.4 75.6 73.1 71.4 65.7 63.3 44.9 19.6 7.4
Gross household income (per year)
$156,000 or more n.p. 85.2 84.5 78.6 76.6 70.8 73.6 42.0 16.8 7.1
$88,400–$155,999 n.p. 77.6 78.5 73.7 75.2 68.9 64.3 42.8 16.7 5.1
$52,000–$88,399 n.p. 76.8 72.5 70.9 66.1 60.3 60.9 43.3 18.5 7.7
$26,000–$51,999 n.p. 69.9 64.7 66.1 63.9 57.4 49.9 43.3 19.5 11.3
$25,999 or below n.p. 64.5 62.8 57.5 52.4 54.0 49.5 36.6 20.5 7.9
Mother’s/carer’s Indigenous status
Indigenous n.p. 69.2 61.4 67.3 59.2 57.3 45.4 n.p. n.p. n.p.
Non-Indigenous n.p. 74.7 72.9 70.3 68.8 62.9 60.3 n.p. n.p. n.p.
Mother’s/carer’s country of birth
Australia n.p. 73.1 70.6 68.4 66.8 60.7 58.4 41.4 17.3 6.3
Overseas n.p. 78.8 78.7 75.1 74.0 68.7 65.4 44.4 20.8 10.6
Main language spoken at home
English n.p. 73.3 71.8 69.4 68.0 62.0 60.0 41.2 17.8 6.5
Other n.p. 83.7 79.8 76.9 74.7 71.0 60.6 50.5 23.1 15.4
(a) 272 cases were aged more than 24 months when the survey was completed, and were subsequently excluded from the analysis.
(b) By the time the survey was received, there were only 33 cases that were aged 0 months (less than 1 month).
(c) Includes ‘Did not go to school’.
20 2010 Australian National Infant Feeding Survey: Indicator results
Table 3.5: Proportion of children currently breastfed, by current age of child, area-level characteristics (per cent)
Child’s age at survey (in completed months)(a)
Area-level characteristic 0(b)
1 2 3 4 5 6 7–12 13–18 19–24
All 90.2 74.6 72.7 70.3 68.7 62.9 60.1 42.2 18.2 7.4
Socioeconomic status (SEIFA quintile)
1st quintile (most disadvantaged) n.p. 68.8 64.1 65.6 65.5 55.5 52.4 42.0 19.2 12.6
2nd quintile n.p. 72.7 67.5 66.2 66.0 57.1 55.8 41.2 16.5 8.8
3rd quintile n.p. 69.4 71.2 67.7 65.8 61.3 56.7 41.6 19.4 8.2
4th quintile n.p. 77.6 74.3 70.0 66.3 64.2 60.1 41.0 14.9 4.7
5th quintile (least disadvantaged) n.p. 81.7 81.2 77.1 76.1 69.1 68.7 44.7 20.7 6.0
State/territory
New South Wales n.p. 74.7 73.6 71.2 69.7 60.2 57.5 41.9 16.6 6.8
Victoria n.p. 76.4 72.2 70.7 66.0 67.6 61.4 42.8 21.3 6.1
Queensland n.p. 74.7 70.6 70.1 67.4 63.3 62.2 39.8 18.9 6.5
Western Australia n.p. 72.8 74.0 66.8 69.4 59.0 58.3 43.7 17.0 11.0
South Australia n.p. 65.3 74.6 72.4 68.7 59.5 58.8 44.8 13.7 6.5
Tasmania n.p. 77.1 70.8 58.4 74.0 70.4 61.8 45.5 17.4 n.p.
Australian Capital Territory n.p. 82.6 80.9 74.5 80.9 71.7 76.1 60.1 24.4 16.5
Northern Territory n.p. 86.2 72.2 72.8 85.1 66.0 60.1 26.9 14.9 n.p.
Remoteness
Major cities n.p. 76.1 74.2 71.2 68.9 64.0 60.6 41.2 18.4 7.1
Inner regional n.p. 69.4 70.1 68.0 67.7 57.5 56.6 43.3 18.0 8.9
Outer regional n.p. 72.6 68.6 66.3 67.5 65.7 61.9 46.5 19.5 5.3
Remote/Very remote n.p. 80.2 63.4 74.7 75.9 58.7 63.0 59.4 4.6 15.8
(a) 272 cases were aged more than 24 months when the survey was completed, and were subsequently excluded from the analysis.
(b) By the time the survey was received, there were only 33 cases that were aged 0 months (less than 1 month).
Australian National Infant Feeding Survey: Indicator results 21
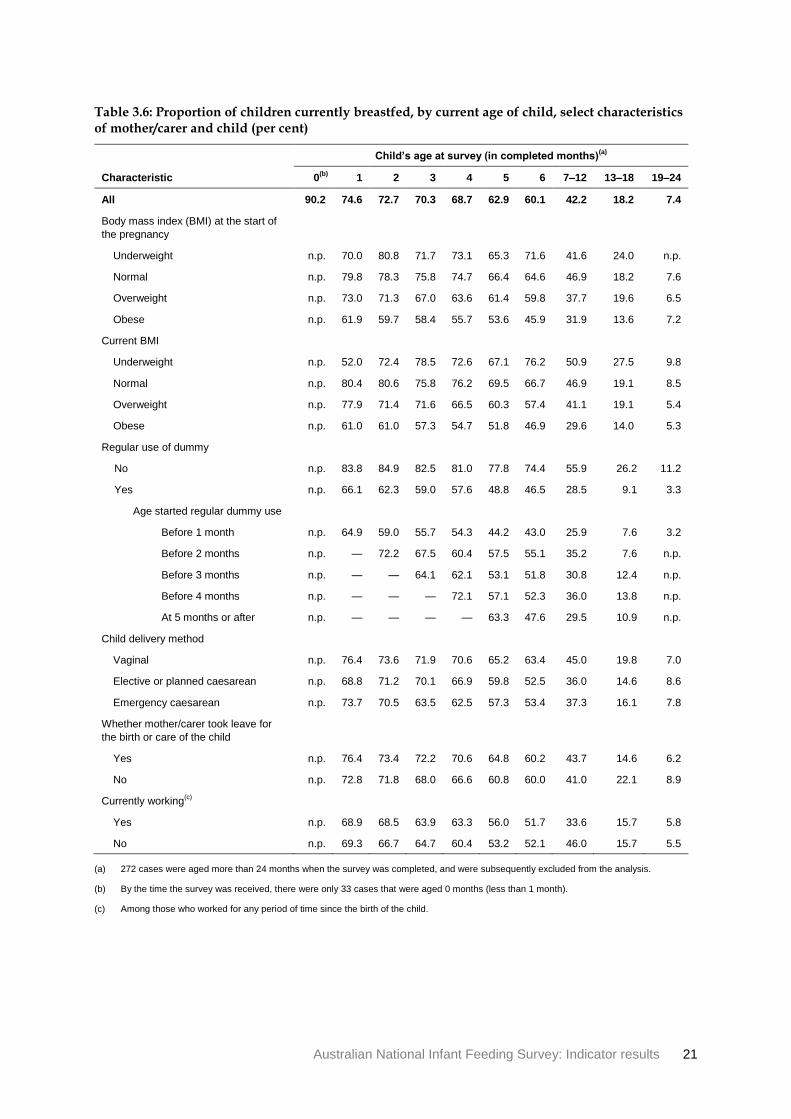
Table 3.6: Proportion of children currently breastfed, by current age of child, select characteristics of mother/carer and child (per cent)
Child’s age at survey (in completed months)(a)
Characteristic 0(b)
1 2 3 4 5 6 7–12 13–18 19–24
All 90.2 74.6 72.7 70.3 68.7 62.9 60.1 42.2 18.2 7.4
Body mass index (BMI) at the start of
the pregnancy
Underweight n.p. 70.0 80.8 71.7 73.1 65.3 71.6 41.6 24.0 n.p.
Normal n.p. 79.8 78.3 75.8 74.7 66.4 64.6 46.9 18.2 7.6
Overweight n.p. 73.0 71.3 67.0 63.6 61.4 59.8 37.7 19.6 6.5
Obese n.p. 61.9 59.7 58.4 55.7 53.6 45.9 31.9 13.6 7.2
Current BMI
Underweight n.p. 52.0 72.4 78.5 72.6 67.1 76.2 50.9 27.5 9.8
Normal n.p. 80.4 80.6 75.8 76.2 69.5 66.7 46.9 19.1 8.5
Overweight n.p. 77.9 71.4 71.6 66.5 60.3 57.4 41.1 19.1 5.4
Obese n.p. 61.0 61.0 57.3 54.7 51.8 46.9 29.6 14.0 5.3
Regular use of dummy
No n.p. 83.8 84.9 82.5 81.0 77.8 74.4 55.9 26.2 11.2
Yes n.p. 66.1 62.3 59.0 57.6 48.8 46.5 28.5 9.1 3.3
Age started regular dummy use
Before 1 month n.p. 64.9 59.0 55.7 54.3 44.2 43.0 25.9 7.6 3.2
Before 2 months n.p. — 72.2 67.5 60.4 57.5 55.1 35.2 7.6 n.p.
Before 3 months n.p. — — 64.1 62.1 53.1 51.8 30.8 12.4 n.p.
Before 4 months n.p. — — — 72.1 57.1 52.3 36.0 13.8 n.p.
At 5 months or after n.p. — — — — 63.3 47.6 29.5 10.9 n.p.
Child delivery method
Vaginal n.p. 76.4 73.6 71.9 70.6 65.2 63.4 45.0 19.8 7.0
Elective or planned caesarean n.p. 68.8 71.2 70.1 66.9 59.8 52.5 36.0 14.6 8.6
Emergency caesarean n.p. 73.7 70.5 63.5 62.5 57.3 53.4 37.3 16.1 7.8
Whether mother/carer took leave for
the birth or care of the child
Yes n.p. 76.4 73.4 72.2 70.6 64.8 60.2 43.7 14.6 6.2
No n.p. 72.8 71.8 68.0 66.6 60.8 60.0 41.0 22.1 8.9
Currently working(c)
Yes n.p. 68.9 68.5 63.9 63.3 56.0 51.7 33.6 15.7 5.8
No n.p. 69.3 66.7 64.7 60.4 53.2 52.1 46.0 15.7 5.5
(a) 272 cases were aged more than 24 months when the survey was completed, and were subsequently excluded from the analysis.
(b) By the time the survey was received, there were only 33 cases that were aged 0 months (less than 1 month).
(c) Among those who worked for any period of time since the birth of the child.
22 2010 Australian National Infant Feeding Survey: Indicator results
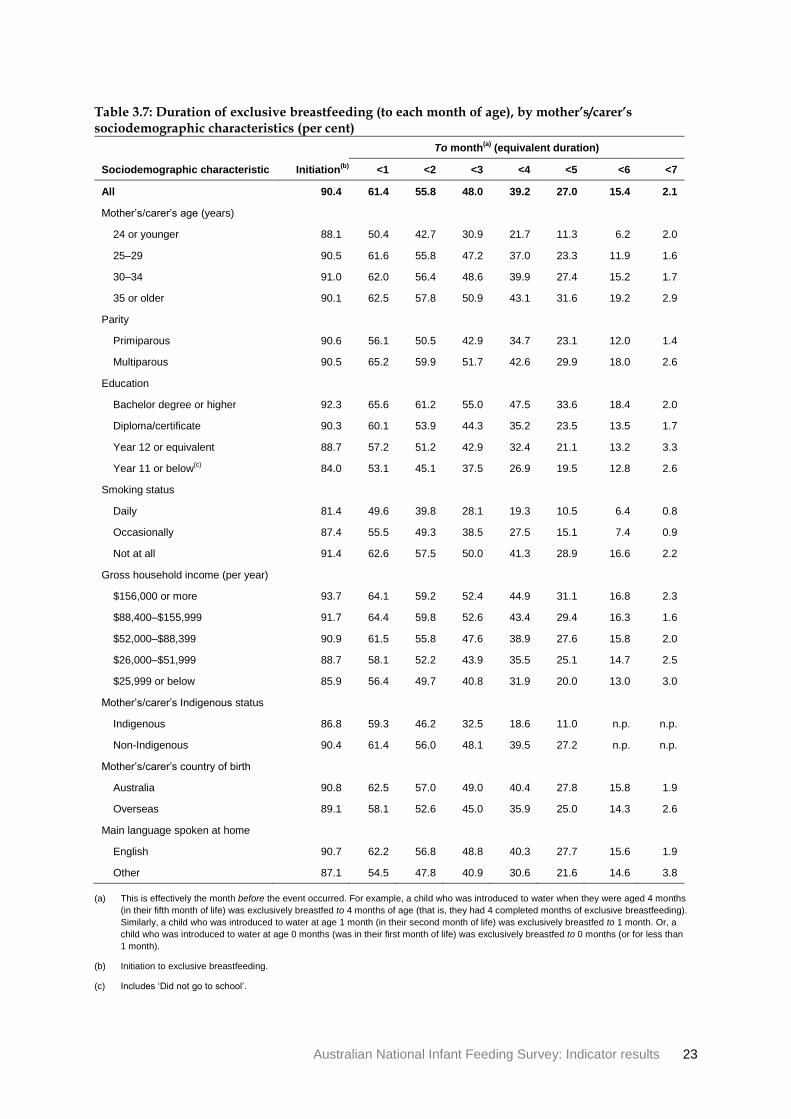
Indicator 3: Proportion of children exclusively breastfed to each month of age
As described earlier, the results for this indicator are derived using a survival analysis technique (see Appendix A for details).
The survey showed that of all children aged 0–24 months, 90% initiated exclusive breastfeeding (Table 3.7). However, before they completed their first month of life, one-third of these children had been introduced to something other than breastmilk (for example, water, juice or infant formula). Overall, just 15% of infants were exclusively breastfed to 5 months of age (that is, for less than 6 months). Other highlights include:
From Table 3.7:
• There was little variation in initiation rates by mother’s/carer’s age, but the rate of exclusive breastfeeding to 4 months (for example) was 3 times as high in older mothers/carers compared with younger ones; this is largely a result of only 50% of infants with younger mothers/carers (24 years or younger) starting their second month of life exclusively breastfed.
• Initiation of children to exclusive breastfeeding was significantly higher by mothers/carers who had a tertiary education (92%) compared with those who had completed Year 11 or below (84%), but this difference had diminished by 6 months. A similar pattern was seen for household income, with higher initiation rates associated with higher income, but the gradient lessening as the infant aged.
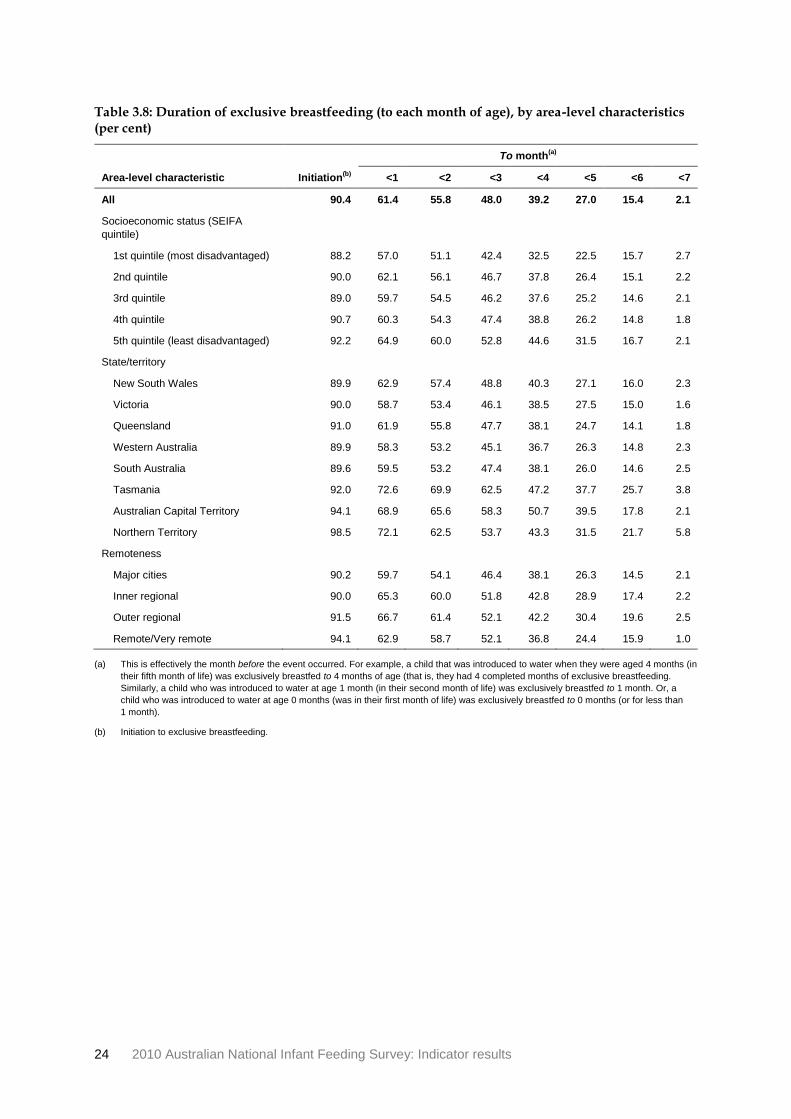
From Table 3.8:
• Among states and territories, the highest initiation rate was seen in the Northern Territory (99%), compared with the five mainland states at around 90%. In Tasmania, initiation was above the national average of 90%, and exclusive breastfeeding was among the highest for each month through to 6 months.
• There was no clear pattern of exclusive breastfeeding by geographical region.
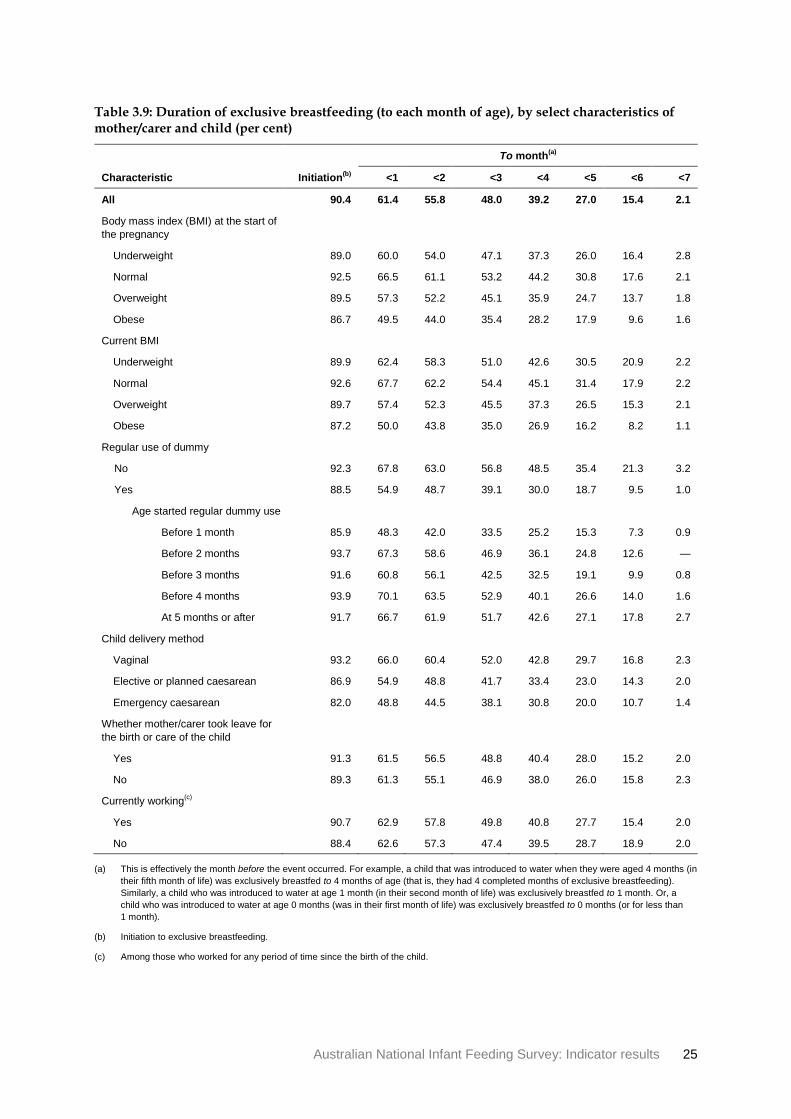
From Table 3.9:
• Children of mothers/carers with a normal BMI at the start of the pregnancy had a higher initiation to exclusive breastfeeding (93%) than of mothers/carers who were obese (87%), and the higher rates were sustained across the duration of exclusive breastfeeding (for example, 31% to 4 months among mothers/carers with a normal BMI compared with 18% among mothers/carers who were obese).
• The regular use of a dummy was associated with considerably lower rates of exclusive breastfeeding: for example, 19% of children who regularly used a dummy were exclusively breastfed to 4 months compared with 35% of children who did not regularly use a dummy.
• There was no real pattern of difference in exclusive breastfeeding rates among mothers/carers who took leave compared with those that did not.
Australian National Infant Feeding Survey: Indicator results 23
Table 3.7: Duration of exclusive breastfeeding (to each month of age), by mother’s/carer’s sociodemographic characteristics (per cent)
To month(a)
(equivalent duration)
Sociodemographic characteristic Initiation(b)
<1 <2 <3 <4 <5 <6 <7
All 90.4 61.4 55.8 48.0 39.2 27.0 15.4 2.1
Mother’s/carer’s age (years)
24 or younger 88.1 50.4 42.7 30.9 21.7 11.3 6.2 2.0
25–29 90.5 61.6 55.8 47.2 37.0 23.3 11.9 1.6
30–34 91.0 62.0 56.4 48.6 39.9 27.4 15.2 1.7
35 or older 90.1 62.5 57.8 50.9 43.1 31.6 19.2 2.9
Parity
Primiparous 90.6 56.1 50.5 42.9 34.7 23.1 12.0 1.4
Multiparous 90.5 65.2 59.9 51.7 42.6 29.9 18.0 2.6
Education
Bachelor degree or higher 92.3 65.6 61.2 55.0 47.5 33.6 18.4 2.0
Diploma/certificate 90.3 60.1 53.9 44.3 35.2 23.5 13.5 1.7
Year 12 or equivalent 88.7 57.2 51.2 42.9 32.4 21.1 13.2 3.3
Year 11 or below(c)
84.0 53.1 45.1 37.5 26.9 19.5 12.8 2.6
Smoking status
Daily 81.4 49.6 39.8 28.1 19.3 10.5 6.4 0.8
Occasionally 87.4 55.5 49.3 38.5 27.5 15.1 7.4 0.9
Not at all 91.4 62.6 57.5 50.0 41.3 28.9 16.6 2.2
Gross household income (per year)
$156,000 or more 93.7 64.1 59.2 52.4 44.9 31.1 16.8 2.3
$88,400–$155,999 91.7 64.4 59.8 52.6 43.4 29.4 16.3 1.6
$52,000–$88,399 90.9 61.5 55.8 47.6 38.9 27.6 15.8 2.0
$26,000–$51,999 88.7 58.1 52.2 43.9 35.5 25.1 14.7 2.5
$25,999 or below 85.9 56.4 49.7 40.8 31.9 20.0 13.0 3.0
Mother’s/carer’s Indigenous status
Indigenous 86.8 59.3 46.2 32.5 18.6 11.0 n.p. n.p.
Non-Indigenous 90.4 61.4 56.0 48.1 39.5 27.2 n.p. n.p.
Mother’s/carer’s country of birth
Australia 90.8 62.5 57.0 49.0 40.4 27.8 15.8 1.9
Overseas 89.1 58.1 52.6 45.0 35.9 25.0 14.3 2.6
Main language spoken at home
English 90.7 62.2 56.8 48.8 40.3 27.7 15.6 1.9
Other 87.1 54.5 47.8 40.9 30.6 21.6 14.6 3.8
(a) This is effectively the month before the event occurred. For example, a child who was introduced to water when they were aged 4 months
(in their fifth month of life) was exclusively breastfed to 4 months of age (that is, they had 4 completed months of exclusive breastfeeding).
Similarly, a child who was introduced to water at age 1 month (in their second month of life) was exclusively breastfed to 1 month. Or, a
child who was introduced to water at age 0 months (was in their first month of life) was exclusively breastfed to 0 months (or for less than
1 month).
(b) Initiation to exclusive breastfeeding.
(c) Includes ‘Did not go to school’.
24 2010 Australian National Infant Feeding Survey: Indicator results
Table 3.8: Duration of exclusive breastfeeding (to each month of age), by area-level characteristics (per cent)
To month(a)
Area-level characteristic Initiation(b)
<1 <2 <3 <4 <5 <6 <7
All 90.4 61.4 55.8 48.0 39.2 27.0 15.4 2.1
Socioeconomic status (SEIFA
quintile)
1st quintile (most disadvantaged) 88.2 57.0 51.1 42.4 32.5 22.5 15.7 2.7
2nd quintile 90.0 62.1 56.1 46.7 37.8 26.4 15.1 2.2
3rd quintile 89.0 59.7 54.5 46.2 37.6 25.2 14.6 2.1
4th quintile 90.7 60.3 54.3 47.4 38.8 26.2 14.8 1.8
5th quintile (least disadvantaged) 92.2 64.9 60.0 52.8 44.6 31.5 16.7 2.1
State/territory
New South Wales 89.9 62.9 57.4 48.8 40.3 27.1 16.0 2.3
Victoria 90.0 58.7 53.4 46.1 38.5 27.5 15.0 1.6
Queensland 91.0 61.9 55.8 47.7 38.1 24.7 14.1 1.8
Western Australia 89.9 58.3 53.2 45.1 36.7 26.3 14.8 2.3
South Australia 89.6 59.5 53.2 47.4 38.1 26.0 14.6 2.5
Tasmania 92.0 72.6 69.9 62.5 47.2 37.7 25.7 3.8
Australian Capital Territory 94.1 68.9 65.6 58.3 50.7 39.5 17.8 2.1
Northern Territory 98.5 72.1 62.5 53.7 43.3 31.5 21.7 5.8
Remoteness
Major cities 90.2 59.7 54.1 46.4 38.1 26.3 14.5 2.1
Inner regional 90.0 65.3 60.0 51.8 42.8 28.9 17.4 2.2
Outer regional 91.5 66.7 61.4 52.1 42.2 30.4 19.6 2.5
Remote/Very remote 94.1 62.9 58.7 52.1 36.8 24.4 15.9 1.0
(a) This is effectively the month before the event occurred. For example, a child that was introduced to water when they were aged 4 months (in
their fifth month of life) was exclusively breastfed to 4 months of age (that is, they had 4 completed months of exclusive breastfeeding.
Similarly, a child who was introduced to water at age 1 month (in their second month of life) was exclusively breastfed to 1 month. Or, a
child who was introduced to water at age 0 months (was in their first month of life) was exclusively breastfed to 0 months (or for less than
1 month).
(b) Initiation to exclusive breastfeeding.
Australian National Infant Feeding Survey: Indicator results 25
Table 3.9: Duration of exclusive breastfeeding (to each month of age), by select characteristics of mother/carer and child (per cent)
To month(a)
Characteristic Initiation(b)
<1 <2 <3 <4 <5 <6 <7
All 90.4 61.4 55.8 48.0 39.2 27.0 15.4 2.1
Body mass index (BMI) at the start of
the pregnancy
Underweight 89.0 60.0 54.0 47.1 37.3 26.0 16.4 2.8
Normal 92.5 66.5 61.1 53.2 44.2 30.8 17.6 2.1
Overweight 89.5 57.3 52.2 45.1 35.9 24.7 13.7 1.8
Obese 86.7 49.5 44.0 35.4 28.2 17.9 9.6 1.6
Current BMI
Underweight 89.9 62.4 58.3 51.0 42.6 30.5 20.9 2.2
Normal 92.6 67.7 62.2 54.4 45.1 31.4 17.9 2.2
Overweight 89.7 57.4 52.3 45.5 37.3 26.5 15.3 2.1
Obese 87.2 50.0 43.8 35.0 26.9 16.2 8.2 1.1
Regular use of dummy
No 92.3 67.8 63.0 56.8 48.5 35.4 21.3 3.2
Yes 88.5 54.9 48.7 39.1 30.0 18.7 9.5 1.0
Age started regular dummy use
Before 1 month 85.9 48.3 42.0 33.5 25.2 15.3 7.3 0.9
Before 2 months 93.7 67.3 58.6 46.9 36.1 24.8 12.6 —
Before 3 months 91.6 60.8 56.1 42.5 32.5 19.1 9.9 0.8
Before 4 months 93.9 70.1 63.5 52.9 40.1 26.6 14.0 1.6
At 5 months or after 91.7 66.7 61.9 51.7 42.6 27.1 17.8 2.7
Child delivery method
Vaginal 93.2 66.0 60.4 52.0 42.8 29.7 16.8 2.3
Elective or planned caesarean 86.9 54.9 48.8 41.7 33.4 23.0 14.3 2.0
Emergency caesarean 82.0 48.8 44.5 38.1 30.8 20.0 10.7 1.4
Whether mother/carer took leave for
the birth or care of the child
Yes 91.3 61.5 56.5 48.8 40.4 28.0 15.2 2.0
No 89.3 61.3 55.1 46.9 38.0 26.0 15.8 2.3
Currently working(c)
Yes 90.7 62.9 57.8 49.8 40.8 27.7 15.4 2.0
No 88.4 62.6 57.3 47.4 39.5 28.7 18.9 2.0
(a) This is effectively the month before the event occurred. For example, a child that was introduced to water when they were aged 4 months (in
their fifth month of life) was exclusively breastfed to 4 months of age (that is, they had 4 completed months of exclusive breastfeeding).
Similarly, a child who was introduced to water at age 1 month (in their second month of life) was exclusively breastfed to 1 month. Or, a
child who was introduced to water at age 0 months (was in their first month of life) was exclusively breastfed to 0 months (or for less than
1 month).
(b) Initiation to exclusive breastfeeding.
(c) Among those who worked for any period of time since the birth of the child.
26 2010 Australian National Infant Feeding Survey: Indicator results
Indicator 4: Proportion of children predominantly breastfed to each month of age
As described earlier, the results for this indicator are derived using a survival analysis technique (see Appendix A for details).
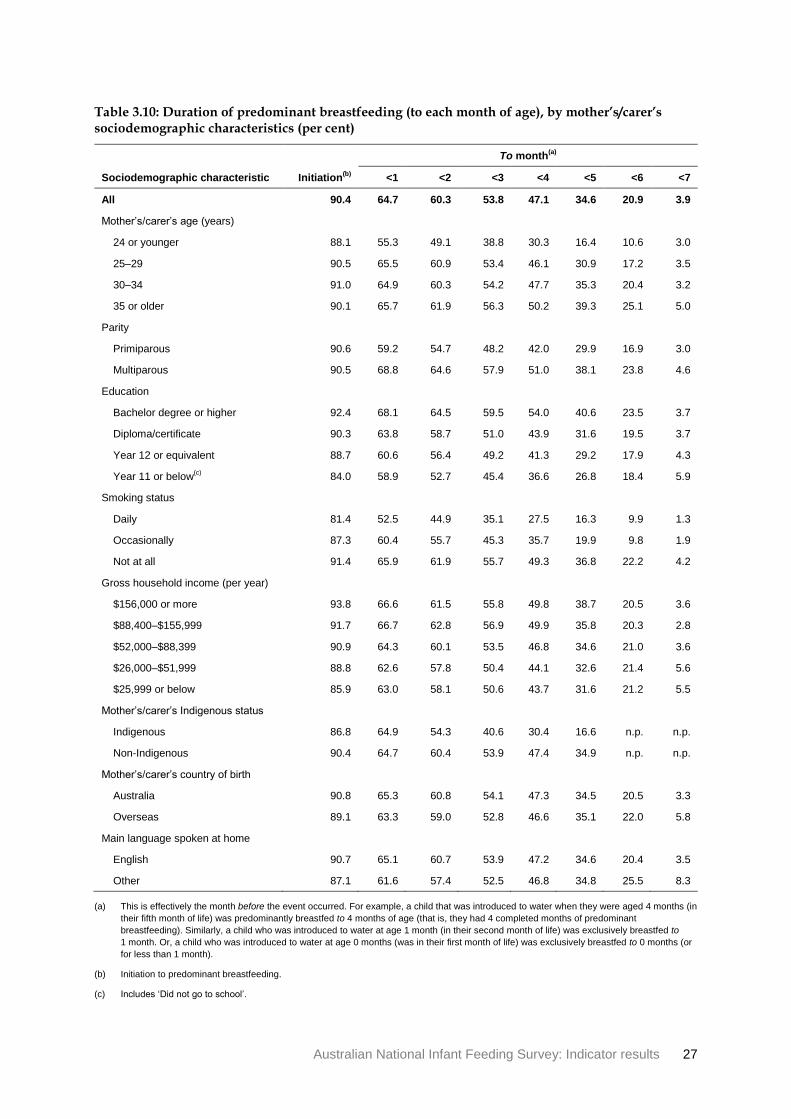
The survey showed that of all children aged 0–24 months, 90% initiated predominant breastfeeding (Table 3.10). However, before they completed their first month of life, nearly one-third of these children had been introduced to something other than breastmilk, water or juice (for example, infant formula). Overall, around 21% of infants were predominantly breastfed to 5 months of age (aged less than 6 months) compared to 15% of infants who were exclusively breastfed. Other highlights include:
From Table 3.10:
• There was little variation in initiation rates by mother’s/carer’s age, but the rate of predominant breastfeeding to 4 months of age (for example) was more than twice as high for older mothers/carers aged 35 years or older (39%) than for mothers/carers aged 24 years or younger (16%).
• Initiation to predominant breastfeeding was significantly higher where mothers/carers had a tertiary education (92%) compared with Year 11 or below (84%), but this difference had diminished by 6 months of age. A similar pattern was seen for household income, with higher initiation rates associated with higher income, with the gradient lessening as the infant aged.
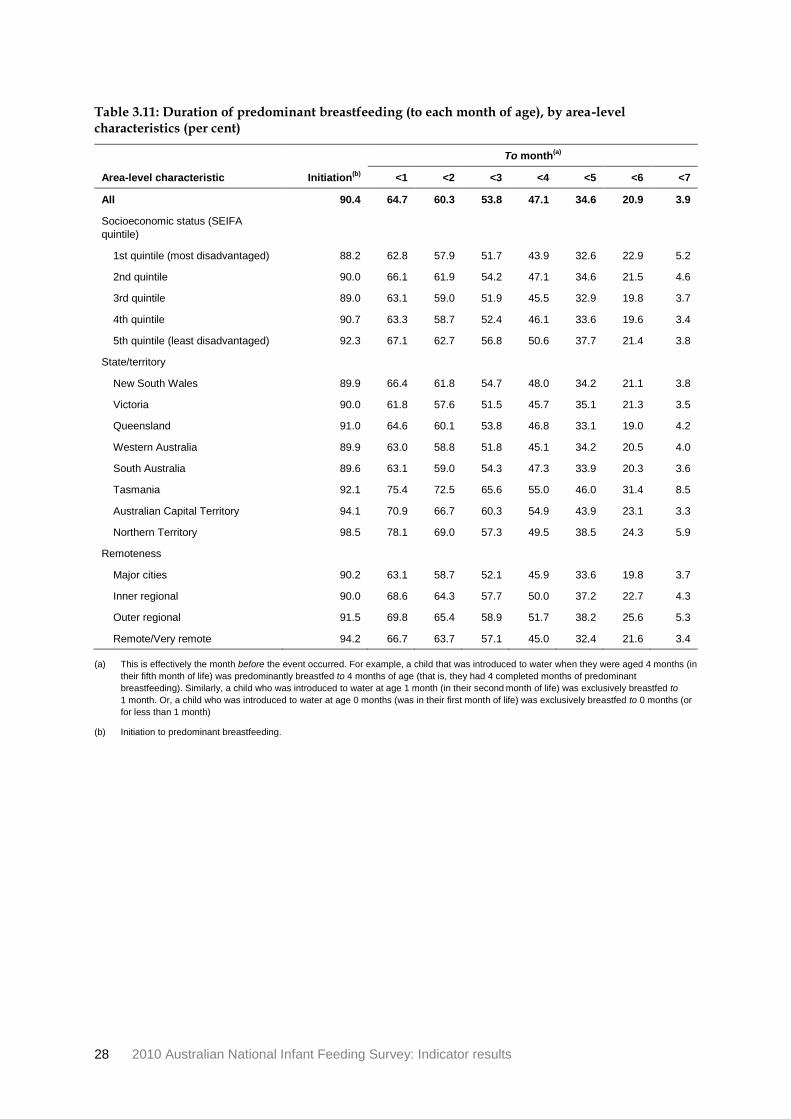
From Table 3.11:
• Among the states and territories, the highest initiation rate of predominant breastfeeding was seen in the Northern Territory (99%), compared with the five mainland states at around 90%. In Tasmania, initiation was above the national average, and predominant breastfeeding was then highest from 1 month through to 6 months of age.
• There was a slight gradient in predominant breastfeeding rates by geographical remoteness, with slightly higher initiation rates in more remote areas (compared with major cities) and slightly higher rates sustained through to 2 months of age.
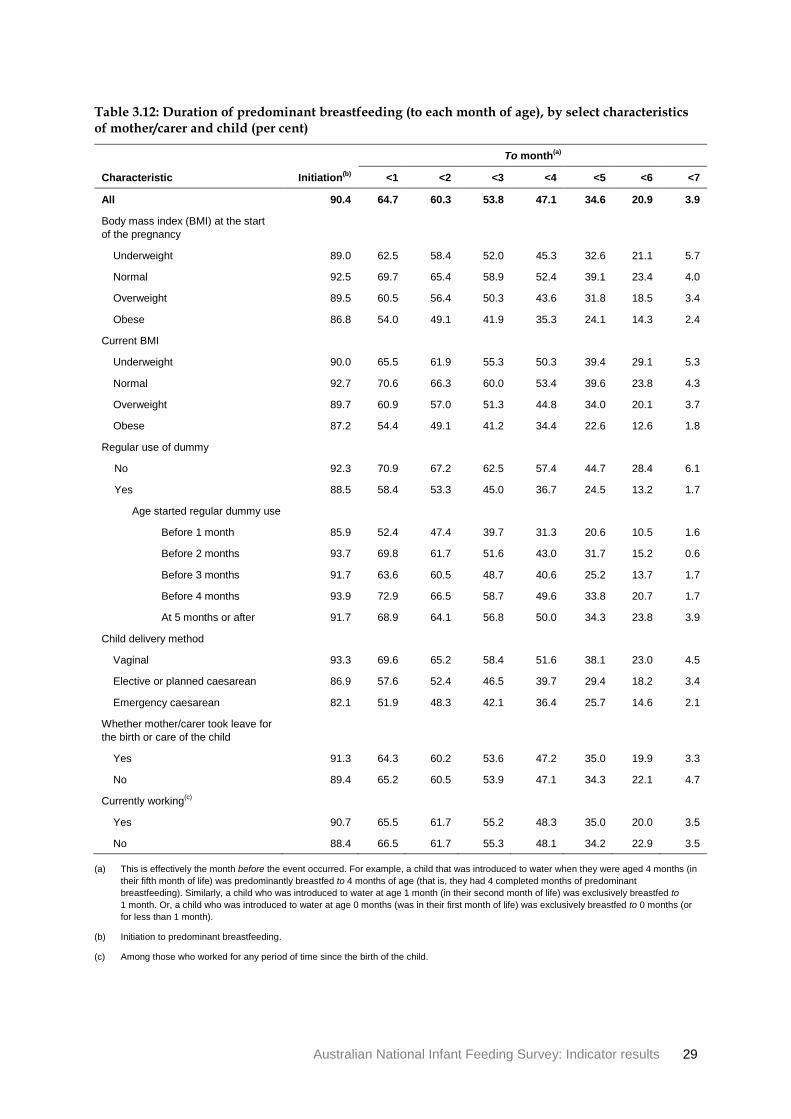
From Table 3.12:
• Children of mothers/carers with a normal BMI had a higher initiation to predominant breastfeeding (93%) than of mothers/carers who were obese (87%), and the higher rates were sustained across the duration of predominant breastfeeding (for example, 40% to 4 months among mothers/carers with a currently normal BMI compared with 23% among mothers/carers who were obese).
• The regular use of a dummy was associated with considerably lower rates of predominant breastfeeding; for example, 25% of children who regularly used a dummy were predominantly breastfed to 4 months compared with 45% of children who did not regularly use a dummy.
• There was no real difference in the pattern of predominant breastfeeding among mothers/carers who took leave compared with those who did not.
Australian National Infant Feeding Survey: Indicator results 27
Table 3.10: Duration of predominant breastfeeding (to each month of age), by mother’s/carer’s sociodemographic characteristics (per cent)
To month(a)
Sociodemographic characteristic Initiation(b)
<1 <2 <3 <4 <5 <6 <7
All 90.4 64.7 60.3 53.8 47.1 34.6 20.9 3.9
Mother’s/carer’s age (years)
24 or younger 88.1 55.3 49.1 38.8 30.3 16.4 10.6 3.0
25–29 90.5 65.5 60.9 53.4 46.1 30.9 17.2 3.5
30–34 91.0 64.9 60.3 54.2 47.7 35.3 20.4 3.2
35 or older 90.1 65.7 61.9 56.3 50.2 39.3 25.1 5.0
Parity
Primiparous 90.6 59.2 54.7 48.2 42.0 29.9 16.9 3.0
Multiparous 90.5 68.8 64.6 57.9 51.0 38.1 23.8 4.6
Education
Bachelor degree or higher 92.4 68.1 64.5 59.5 54.0 40.6 23.5 3.7
Diploma/certificate 90.3 63.8 58.7 51.0 43.9 31.6 19.5 3.7
Year 12 or equivalent 88.7 60.6 56.4 49.2 41.3 29.2 17.9 4.3
Year 11 or below(c)
84.0 58.9 52.7 45.4 36.6 26.8 18.4 5.9
Smoking status
Daily 81.4 52.5 44.9 35.1 27.5 16.3 9.9 1.3
Occasionally 87.3 60.4 55.7 45.3 35.7 19.9 9.8 1.9
Not at all 91.4 65.9 61.9 55.7 49.3 36.8 22.2 4.2
Gross household income (per year)
$156,000 or more 93.8 66.6 61.5 55.8 49.8 38.7 20.5 3.6
$88,400–$155,999 91.7 66.7 62.8 56.9 49.9 35.8 20.3 2.8
$52,000–$88,399 90.9 64.3 60.1 53.5 46.8 34.6 21.0 3.6
$26,000–$51,999 88.8 62.6 57.8 50.4 44.1 32.6 21.4 5.6
$25,999 or below 85.9 63.0 58.1 50.6 43.7 31.6 21.2 5.5
Mother’s/carer’s Indigenous status
Indigenous 86.8 64.9 54.3 40.6 30.4 16.6 n.p. n.p.
Non-Indigenous 90.4 64.7 60.4 53.9 47.4 34.9 n.p. n.p.
Mother’s/carer’s country of birth
Australia 90.8 65.3 60.8 54.1 47.3 34.5 20.5 3.3
Overseas 89.1 63.3 59.0 52.8 46.6 35.1 22.0 5.8
Main language spoken at home
English 90.7 65.1 60.7 53.9 47.2 34.6 20.4 3.5
Other 87.1 61.6 57.4 52.5 46.8 34.8 25.5 8.3
(a) This is effectively the month before the event occurred. For example, a child that was introduced to water when they were aged 4 months (in
their fifth month of life) was predominantly breastfed to 4 months of age (that is, they had 4 completed months of predominant
breastfeeding). Similarly, a child who was introduced to water at age 1 month (in their second month of life) was exclusively breastfed to
1 month. Or, a child who was introduced to water at age 0 months (was in their first month of life) was exclusively breastfed to 0 months (or
for less than 1 month).
(b) Initiation to predominant breastfeeding.
(c) Includes ‘Did not go to school’.
28 2010 Australian National Infant Feeding Survey: Indicator results
Table 3.11: Duration of predominant breastfeeding (to each month of age), by area-level characteristics (per cent)
To month(a)
Area-level characteristic Initiation(b)
<1 <2 <3 <4 <5 <6 <7
All 90.4 64.7 60.3 53.8 47.1 34.6 20.9 3.9
Socioeconomic status (SEIFA
quintile)
1st quintile (most disadvantaged) 88.2 62.8 57.9 51.7 43.9 32.6 22.9 5.2
2nd quintile 90.0 66.1 61.9 54.2 47.1 34.6 21.5 4.6
3rd quintile 89.0 63.1 59.0 51.9 45.5 32.9 19.8 3.7
4th quintile 90.7 63.3 58.7 52.4 46.1 33.6 19.6 3.4
5th quintile (least disadvantaged) 92.3 67.1 62.7 56.8 50.6 37.7 21.4 3.8
State/territory
New South Wales 89.9 66.4 61.8 54.7 48.0 34.2 21.1 3.8
Victoria 90.0 61.8 57.6 51.5 45.7 35.1 21.3 3.5
Queensland 91.0 64.6 60.1 53.8 46.8 33.1 19.0 4.2
Western Australia 89.9 63.0 58.8 51.8 45.1 34.2 20.5 4.0
South Australia 89.6 63.1 59.0 54.3 47.3 33.9 20.3 3.6
Tasmania 92.1 75.4 72.5 65.6 55.0 46.0 31.4 8.5
Australian Capital Territory 94.1 70.9 66.7 60.3 54.9 43.9 23.1 3.3
Northern Territory 98.5 78.1 69.0 57.3 49.5 38.5 24.3 5.9
Remoteness
Major cities 90.2 63.1 58.7 52.1 45.9 33.6 19.8 3.7
Inner regional 90.0 68.6 64.3 57.7 50.0 37.2 22.7 4.3
Outer regional 91.5 69.8 65.4 58.9 51.7 38.2 25.6 5.3
Remote/Very remote 94.2 66.7 63.7 57.1 45.0 32.4 21.6 3.4
(a) This is effectively the month before the event occurred. For example, a child that was introduced to water when they were aged 4 months (in
their fifth month of life) was predominantly breastfed to 4 months of age (that is, they had 4 completed months of predominant
breastfeeding). Similarly, a child who was introduced to water at age 1 month (in their second month of life) was exclusively breastfed to
1 month. Or, a child who was introduced to water at age 0 months (was in their first month of life) was exclusively breastfed to 0 months (or
for less than 1 month)
(b) Initiation to predominant breastfeeding.
Australian National Infant Feeding Survey: Indicator results 29
Table 3.12: Duration of predominant breastfeeding (to each month of age), by select characteristics of mother/carer and child (per cent)
To month(a)
Characteristic Initiation(b)
<1 <2 <3 <4 <5 <6 <7
All 90.4 64.7 60.3 53.8 47.1 34.6 20.9 3.9
Body mass index (BMI) at the start
of the pregnancy
Underweight 89.0 62.5 58.4 52.0 45.3 32.6 21.1 5.7
Normal 92.5 69.7 65.4 58.9 52.4 39.1 23.4 4.0
Overweight 89.5 60.5 56.4 50.3 43.6 31.8 18.5 3.4
Obese 86.8 54.0 49.1 41.9 35.3 24.1 14.3 2.4
Current BMI
Underweight 90.0 65.5 61.9 55.3 50.3 39.4 29.1 5.3
Normal 92.7 70.6 66.3 60.0 53.4 39.6 23.8 4.3
Overweight 89.7 60.9 57.0 51.3 44.8 34.0 20.1 3.7
Obese 87.2 54.4 49.1 41.2 34.4 22.6 12.6 1.8
Regular use of dummy
No 92.3 70.9 67.2 62.5 57.4 44.7 28.4 6.1
Yes 88.5 58.4 53.3 45.0 36.7 24.5 13.2 1.7
Age started regular dummy use
Before 1 month 85.9 52.4 47.4 39.7 31.3 20.6 10.5 1.6
Before 2 months 93.7 69.8 61.7 51.6 43.0 31.7 15.2 0.6
Before 3 months 91.7 63.6 60.5 48.7 40.6 25.2 13.7 1.7
Before 4 months 93.9 72.9 66.5 58.7 49.6 33.8 20.7 1.7
At 5 months or after 91.7 68.9 64.1 56.8 50.0 34.3 23.8 3.9
Child delivery method
Vaginal 93.3 69.6 65.2 58.4 51.6 38.1 23.0 4.5
Elective or planned caesarean 86.9 57.6 52.4 46.5 39.7 29.4 18.2 3.4
Emergency caesarean 82.1 51.9 48.3 42.1 36.4 25.7 14.6 2.1
Whether mother/carer took leave for
the birth or care of the child
Yes 91.3 64.3 60.2 53.6 47.2 35.0 19.9 3.3
No 89.4 65.2 60.5 53.9 47.1 34.3 22.1 4.7
Currently working(c)
Yes 90.7 65.5 61.7 55.2 48.3 35.0 20.0 3.5
No 88.4 66.5 61.7 55.3 48.1 34.2 22.9 3.5
(a) This is effectively the month before the event occurred. For example, a child that was introduced to water when they were aged 4 months (in
their fifth month of life) was predominantly breastfed to 4 months of age (that is, they had 4 completed months of predominant
breastfeeding). Similarly, a child who was introduced to water at age 1 month (in their second month of life) was exclusively breastfed to
1 month. Or, a child who was introduced to water at age 0 months (was in their first month of life) was exclusively breastfed to 0 months (or
for less than 1 month).
(b) Initiation to predominant breastfeeding.
(c) Among those who worked for any period of time since the birth of the child.
30 2010 Australian National Infant Feeding Survey: Indicator results
Indicator 5: Proportion of children receiving soft/semi-solid/solid food at each month of age
As noted in Chapter 2, the definition for this indicator requires the child to have received soft/semi-solid/solid food within the last 24 hours. However, for the detailed results presented here, this time constraint is removed, and instead we present survival-type analysis. Note, because this indicator is about having an attribute (in this case, some type of food), the results are presented as at 4 months (say), not to. Note further, the results represent a ‘reverse’ survival curve, in that the rates increase over time (age of child) rather than decline as seen in the previous two indicators. For brevity, the commentary below referring to ‘solids’ covers soft, semi-solid and solid foods.
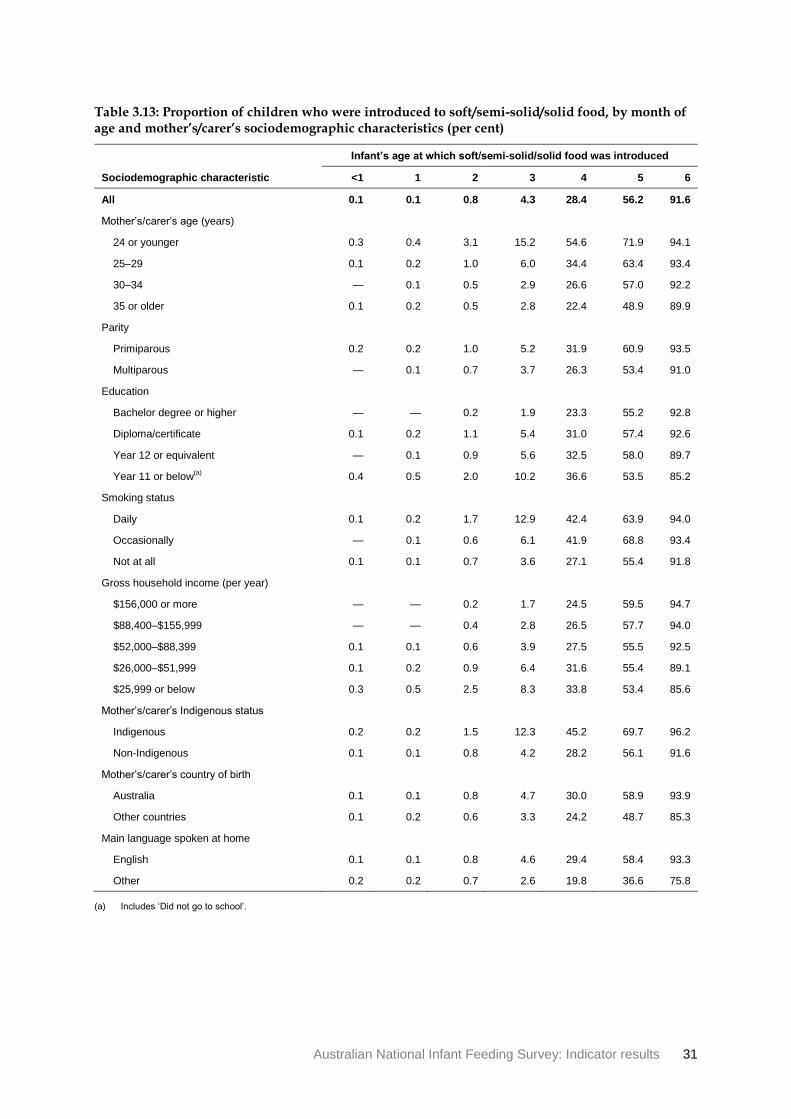
The results show that by 2 months of age, less than 1% of infants had been introduced to solid foods; by 6 months, 92% of infants had been introduced to solids (Table 3.13). Other highlights include:
From Table 3.13:
• The age of the mother/carer was strongly associated with introduction of solids, with younger mothers/carers introducing solid foods at comparatively younger infant ages than older mothers/carers. For example, at 4 months, 55% of infants with younger mothers (aged 24 or younger) had been introduced to solid foods compared with 22% of infants with older mothers (aged 35 or older).
• A substantial gradient was also observed for education, with higher proportions of children of lower-educated mothers/carers introduced to solid foods at younger ages than children of more-educated mothers/carers; however, this gradient had reversed for children aged 6 months.
• The main language spoken at home was associated with earlier introduction of solid foods. For example, by the age of 4 months, 29% of children in homes where the main language was English had been introduced to solid foods, compared with 20% of children in homes with another main language.
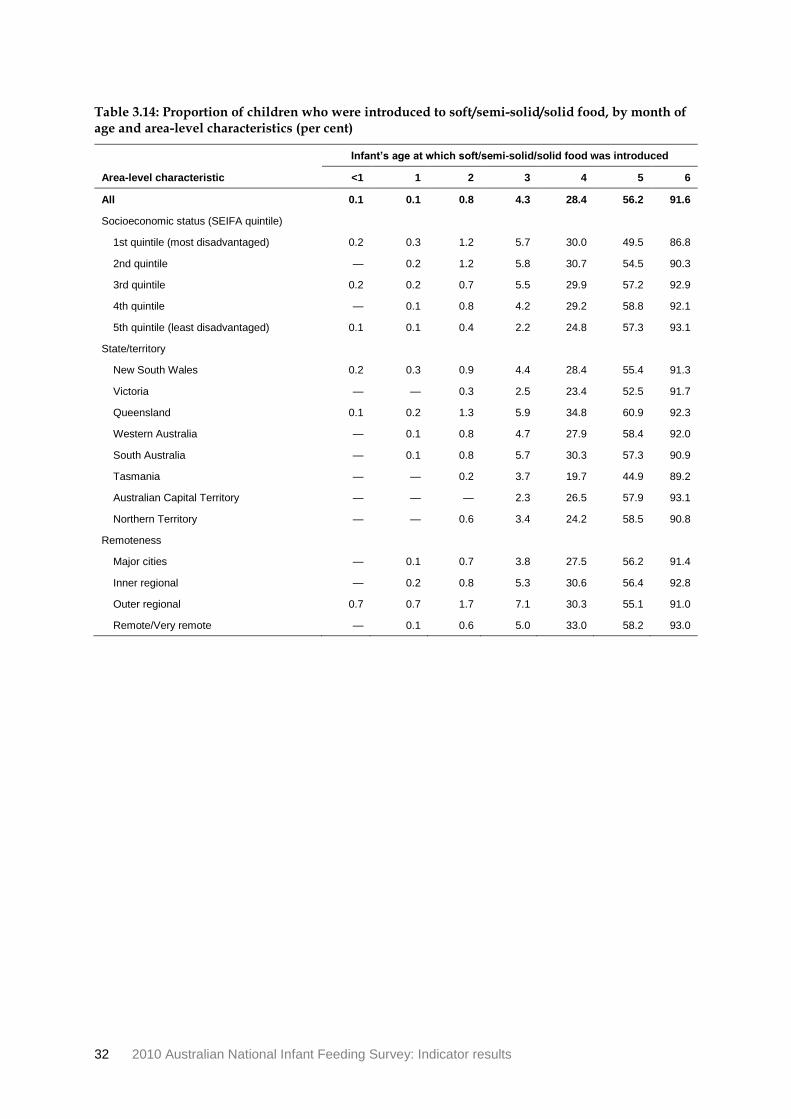
From Table 3.14:
• There was no clear pattern of introduction of solid foods by socioeconomic status of an area, state or territory, or geographical remoteness.
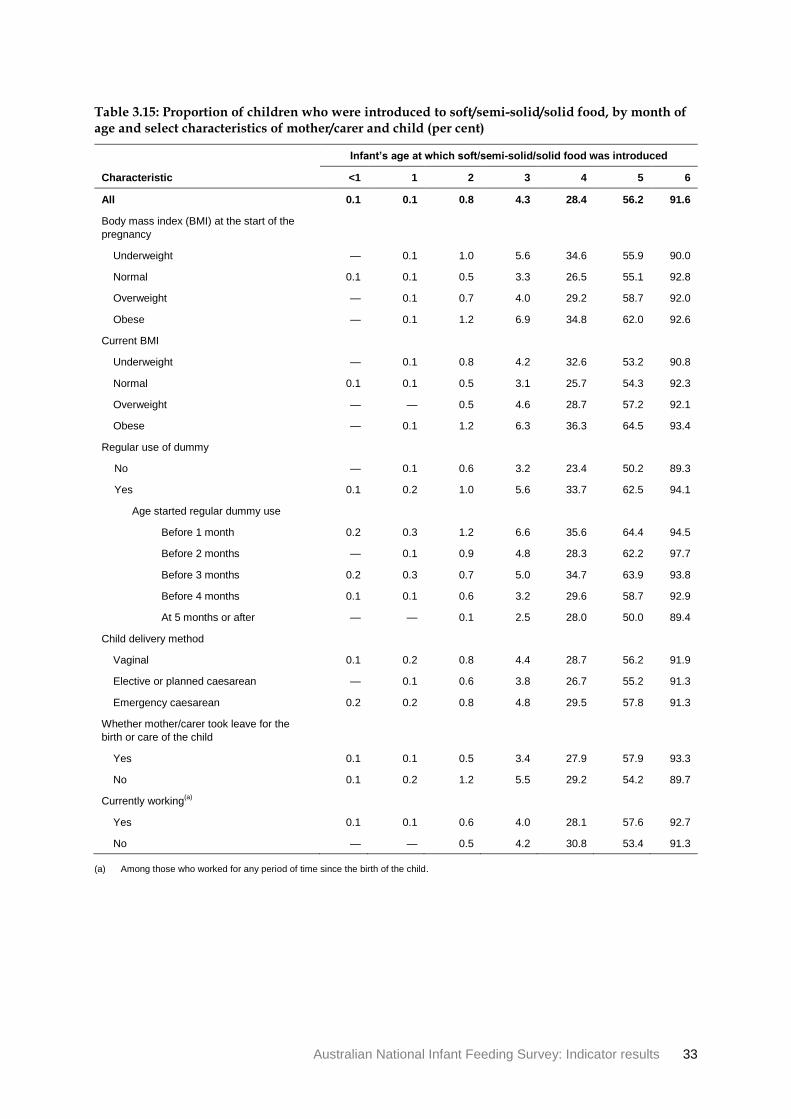
From Table 3.15:
• Children of mothers/carers who were obese were introduced to solid foods at slightly younger ages than those whose mothers/carers had a normal BMI.
• The regular use of a dummy was associated with earlier introduction to solid foods. For example, among infants aged 4 months who regularly used a dummy, 34% had been introduced to solid foods, compared with 23% among those who did not regularly use a dummy.
Australian National Infant Feeding Survey: Indicator results 31
Table 3.13: Proportion of children who were introduced to soft/semi-solid/solid food, by month of age and mother’s/carer’s sociodemographic characteristics (per cent)
Infant’s age at which soft/semi-solid/solid food was introduced
Sociodemographic characteristic <1 1 2 3 4 5 6
All 0.1 0.1 0.8 4.3 28.4 56.2 91.6
Mother’s/carer’s age (years)
24 or younger 0.3 0.4 3.1 15.2 54.6 71.9 94.1
25–29 0.1 0.2 1.0 6.0 34.4 63.4 93.4
30–34 — 0.1 0.5 2.9 26.6 57.0 92.2
35 or older 0.1 0.2 0.5 2.8 22.4 48.9 89.9
Parity
Primiparous 0.2 0.2 1.0 5.2 31.9 60.9 93.5
Multiparous — 0.1 0.7 3.7 26.3 53.4 91.0
Education
Bachelor degree or higher — — 0.2 1.9 23.3 55.2 92.8
Diploma/certificate 0.1 0.2 1.1 5.4 31.0 57.4 92.6
Year 12 or equivalent — 0.1 0.9 5.6 32.5 58.0 89.7
Year 11 or below(a)
0.4 0.5 2.0 10.2 36.6 53.5 85.2
Smoking status
Daily 0.1 0.2 1.7 12.9 42.4 63.9 94.0
Occasionally — 0.1 0.6 6.1 41.9 68.8 93.4
Not at all 0.1 0.1 0.7 3.6 27.1 55.4 91.8
Gross household income (per year)
$156,000 or more — — 0.2 1.7 24.5 59.5 94.7
$88,400–$155,999 — — 0.4 2.8 26.5 57.7 94.0
$52,000–$88,399 0.1 0.1 0.6 3.9 27.5 55.5 92.5
$26,000–$51,999 0.1 0.2 0.9 6.4 31.6 55.4 89.1
$25,999 or below 0.3 0.5 2.5 8.3 33.8 53.4 85.6
Mother’s/carer’s Indigenous status
Indigenous 0.2 0.2 1.5 12.3 45.2 69.7 96.2
Non-Indigenous 0.1 0.1 0.8 4.2 28.2 56.1 91.6
Mother’s/carer’s country of birth
Australia 0.1 0.1 0.8 4.7 30.0 58.9 93.9
Other countries 0.1 0.2 0.6 3.3 24.2 48.7 85.3
Main language spoken at home
English 0.1 0.1 0.8 4.6 29.4 58.4 93.3
Other 0.2 0.2 0.7 2.6 19.8 36.6 75.8
(a) Includes ‘Did not go to school’.
32 2010 Australian National Infant Feeding Survey: Indicator results
Table 3.14: Proportion of children who were introduced to soft/semi-solid/solid food, by month of age and area-level characteristics (per cent)
Infant’s age at which soft/semi-solid/solid food was introduced
Area-level characteristic <1 1 2 3 4 5 6
All 0.1 0.1 0.8 4.3 28.4 56.2 91.6
Socioeconomic status (SEIFA quintile)
1st quintile (most disadvantaged) 0.2 0.3 1.2 5.7 30.0 49.5 86.8
2nd quintile — 0.2 1.2 5.8 30.7 54.5 90.3
3rd quintile 0.2 0.2 0.7 5.5 29.9 57.2 92.9
4th quintile — 0.1 0.8 4.2 29.2 58.8 92.1
5th quintile (least disadvantaged) 0.1 0.1 0.4 2.2 24.8 57.3 93.1
State/territory
New South Wales 0.2 0.3 0.9 4.4 28.4 55.4 91.3
Victoria — — 0.3 2.5 23.4 52.5 91.7
Queensland 0.1 0.2 1.3 5.9 34.8 60.9 92.3
Western Australia — 0.1 0.8 4.7 27.9 58.4 92.0
South Australia — 0.1 0.8 5.7 30.3 57.3 90.9
Tasmania — — 0.2 3.7 19.7 44.9 89.2
Australian Capital Territory — — — 2.3 26.5 57.9 93.1
Northern Territory — — 0.6 3.4 24.2 58.5 90.8
Remoteness
Major cities — 0.1 0.7 3.8 27.5 56.2 91.4
Inner regional — 0.2 0.8 5.3 30.6 56.4 92.8
Outer regional 0.7 0.7 1.7 7.1 30.3 55.1 91.0
Remote/Very remote — 0.1 0.6 5.0 33.0 58.2 93.0
Australian National Infant Feeding Survey: Indicator results 33
Table 3.15: Proportion of children who were introduced to soft/semi-solid/solid food, by month of age and select characteristics of mother/carer and child (per cent)
Infant’s age at which soft/semi-solid/solid food was introduced
Characteristic <1 1 2 3 4 5 6
All 0.1 0.1 0.8 4.3 28.4 56.2 91.6
Body mass index (BMI) at the start of the
pregnancy
Underweight — 0.1 1.0 5.6 34.6 55.9 90.0
Normal 0.1 0.1 0.5 3.3 26.5 55.1 92.8
Overweight — 0.1 0.7 4.0 29.2 58.7 92.0
Obese — 0.1 1.2 6.9 34.8 62.0 92.6
Current BMI
Underweight — 0.1 0.8 4.2 32.6 53.2 90.8
Normal 0.1 0.1 0.5 3.1 25.7 54.3 92.3
Overweight — — 0.5 4.6 28.7 57.2 92.1
Obese — 0.1 1.2 6.3 36.3 64.5 93.4
Regular use of dummy
No — 0.1 0.6 3.2 23.4 50.2 89.3
Yes 0.1 0.2 1.0 5.6 33.7 62.5 94.1
Age started regular dummy use
Before 1 month 0.2 0.3 1.2 6.6 35.6 64.4 94.5
Before 2 months — 0.1 0.9 4.8 28.3 62.2 97.7
Before 3 months 0.2 0.3 0.7 5.0 34.7 63.9 93.8
Before 4 months 0.1 0.1 0.6 3.2 29.6 58.7 92.9
At 5 months or after — — 0.1 2.5 28.0 50.0 89.4
Child delivery method
Vaginal 0.1 0.2 0.8 4.4 28.7 56.2 91.9
Elective or planned caesarean — 0.1 0.6 3.8 26.7 55.2 91.3
Emergency caesarean 0.2 0.2 0.8 4.8 29.5 57.8 91.3
Whether mother/carer took leave for the
birth or care of the child
Yes 0.1 0.1 0.5 3.4 27.9 57.9 93.3
No 0.1 0.2 1.2 5.5 29.2 54.2 89.7
Currently working(a)
Yes 0.1 0.1 0.6 4.0 28.1 57.6 92.7
No — — 0.5 4.2 30.8 53.4 91.3
(a) Among those who worked for any period of time since the birth of the child.
34 2010 Australian National Infant Feeding Survey: Indicator results
Indicator 6: Proportion of children receiving non-human milk or formula at each month of age
As noted in Chapter 2, the definition for this indicator requires the child to have received non-human milk or formula within the last 24 hours. However, for the detailed results presented here, this time constraint is removed, and instead we present survival-type analysis. Like the previous indicator, the results are presented as at x months, not to, and represent a ‘reverse’ survival curve (or a failure curve). For brevity, the commentary below referring to ‘non-human milk’ covers non-human milk and infant formula.
The results show that 34% of infants had been introduced to non-human milk in their first month of life (aged 0 months) (Table 3.16). By 2 months of age, this had risen to 45%, and 69% of infants had been introduced to non-human milk by the age of 6 months. Other highlights include:
From Table 3.16:
• The age of the mother/carer was associated with introduction of non-human milk, with younger mothers/carers introducing non-human milk at comparatively younger infant ages than older mothers/carers. For example, at age 0 months, 42% of infants with mothers/carers aged 24 or younger had been introduced to non-human milk, compared with 33% of infants with mothers/carers aged 35 or older. By 4 months, this difference had increased: 74% for infants of younger mothers/carers compared with 53% for infants of older mothers/carers.
• A gradient was also observed for education, with higher proportions of children of lower-educated mothers/carers introduced to non-human milk at younger ages than children of higher-educated mothers/carers.
• There were no clear differences in introduction of non-human milk by mother’s/carer’s country of birth, or by the main language spoken at home.
From Table 3.17:
• There was no clear pattern of introduction of non-human milk by socioeconomic status of an area, or by geographical remoteness.
• Infants in Tasmania were introduced to non-human milk at older ages than infants in other jurisdictions, although by 4 months the proportion of children who had been introduced to non-human milk was similar across most jurisdictions.
From Table 3.18:
• Children of mothers/carers who were obese were introduced to non-human milk at younger ages than those whose mothers/carers had a normal BMI. For example, at age 0 months, 44% of infants whose mothers/carers were currently obese had been introduced to non-human milk, compared with 29% of infants whose mothers/carers had a normal BMI. By 4 months, the proportions were 69% and 51%, respectively.
• The regular use of a dummy was associated with earlier introduction to non-human milk. For example, among infants aged 2 months who regularly used a dummy, 54% had been introduced to non-human milk, compared with 36% among those who did not regularly use a dummy.
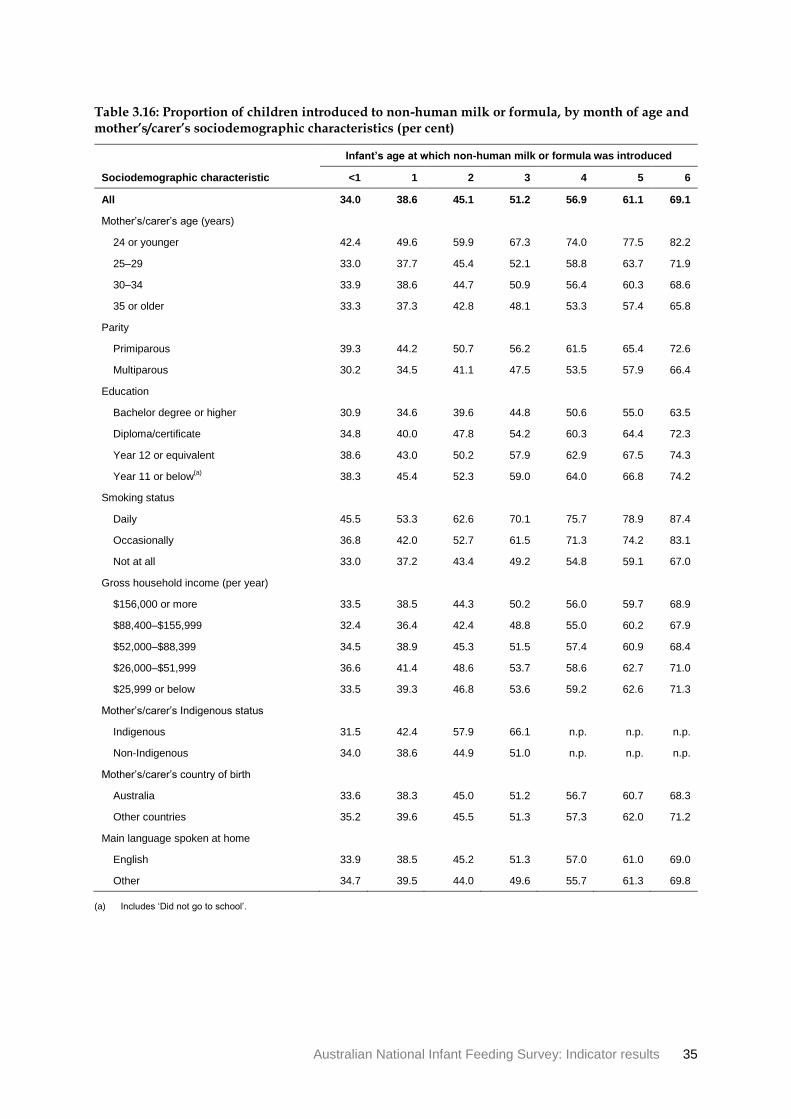
Australian National Infant Feeding Survey: Indicator results 35
Table 3.16: Proportion of children introduced to non-human milk or formula, by month of age and mother’s/carer’s sociodemographic characteristics (per cent)
Infant’s age at which non-human milk or formula was introduced
Sociodemographic characteristic <1 1 2 3 4 5 6
All 34.0 38.6 45.1 51.2 56.9 61.1 69.1
Mother’s/carer’s age (years)
24 or younger 42.4 49.6 59.9 67.3 74.0 77.5 82.2
25–29 33.0 37.7 45.4 52.1 58.8 63.7 71.9
30–34 33.9 38.6 44.7 50.9 56.4 60.3 68.6
35 or older 33.3 37.3 42.8 48.1 53.3 57.4 65.8
Parity
Primiparous 39.3 44.2 50.7 56.2 61.5 65.4 72.6
Multiparous 30.2 34.5 41.1 47.5 53.5 57.9 66.4
Education
Bachelor degree or higher 30.9 34.6 39.6 44.8 50.6 55.0 63.5
Diploma/certificate 34.8 40.0 47.8 54.2 60.3 64.4 72.3
Year 12 or equivalent 38.6 43.0 50.2 57.9 62.9 67.5 74.3
Year 11 or below(a)
38.3 45.4 52.3 59.0 64.0 66.8 74.2
Smoking status
Daily 45.5 53.3 62.6 70.1 75.7 78.9 87.4
Occasionally 36.8 42.0 52.7 61.5 71.3 74.2 83.1
Not at all 33.0 37.2 43.4 49.2 54.8 59.1 67.0
Gross household income (per year)
$156,000 or more 33.5 38.5 44.3 50.2 56.0 59.7 68.9
$88,400–$155,999 32.4 36.4 42.4 48.8 55.0 60.2 67.9
$52,000–$88,399 34.5 38.9 45.3 51.5 57.4 60.9 68.4
$26,000–$51,999 36.6 41.4 48.6 53.7 58.6 62.7 71.0
$25,999 or below 33.5 39.3 46.8 53.6 59.2 62.6 71.3
Mother’s/carer’s Indigenous status
Indigenous 31.5 42.4 57.9 66.1 n.p. n.p. n.p.
Non-Indigenous 34.0 38.6 44.9 51.0 n.p. n.p. n.p.
Mother’s/carer’s country of birth
Australia 33.6 38.3 45.0 51.2 56.7 60.7 68.3
Other countries 35.2 39.6 45.5 51.3 57.3 62.0 71.2
Main language spoken at home
English 33.9 38.5 45.2 51.3 57.0 61.0 69.0
Other 34.7 39.5 44.0 49.6 55.7 61.3 69.8
(a) Includes ‘Did not go to school’.
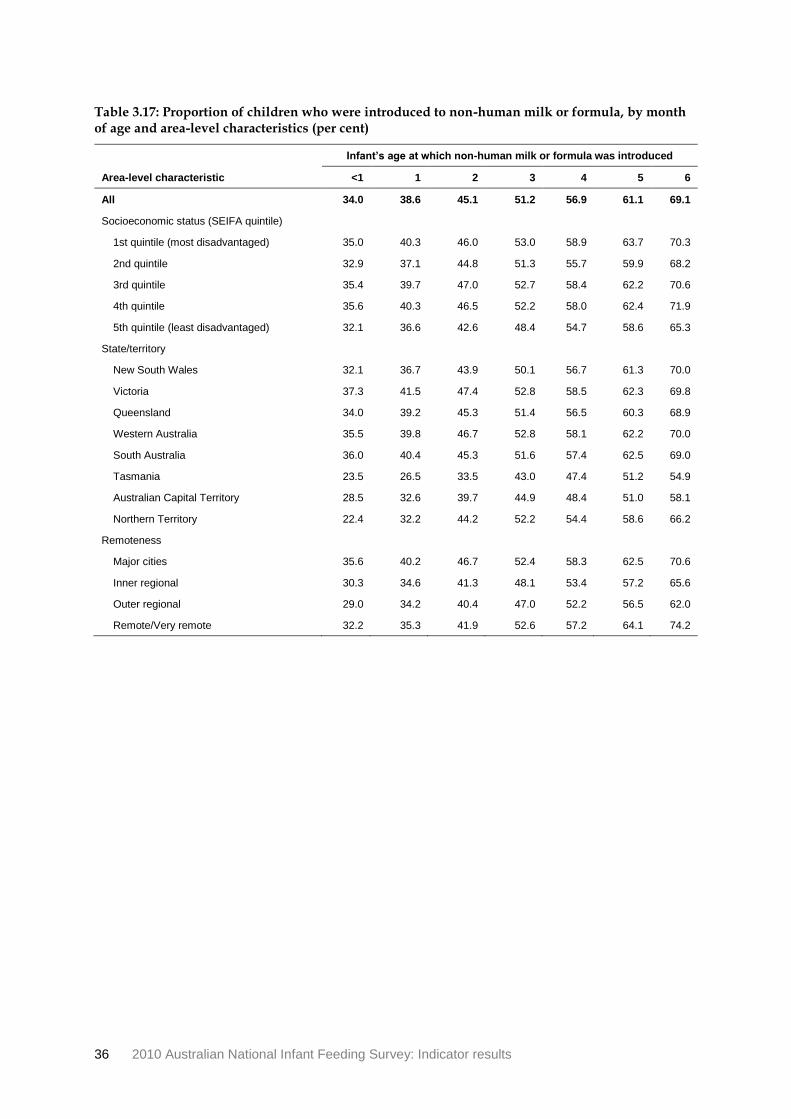
36 2010 Australian National Infant Feeding Survey: Indicator results
Table 3.17: Proportion of children who were introduced to non-human milk or formula, by month of age and area-level characteristics (per cent)
Infant’s age at which non-human milk or formula was introduced
Area-level characteristic <1 1 2 3 4 5 6
All 34.0 38.6 45.1 51.2 56.9 61.1 69.1
Socioeconomic status (SEIFA quintile)
1st quintile (most disadvantaged) 35.0 40.3 46.0 53.0 58.9 63.7 70.3
2nd quintile 32.9 37.1 44.8 51.3 55.7 59.9 68.2
3rd quintile 35.4 39.7 47.0 52.7 58.4 62.2 70.6
4th quintile 35.6 40.3 46.5 52.2 58.0 62.4 71.9
5th quintile (least disadvantaged) 32.1 36.6 42.6 48.4 54.7 58.6 65.3
State/territory
New South Wales 32.1 36.7 43.9 50.1 56.7 61.3 70.0
Victoria 37.3 41.5 47.4 52.8 58.5 62.3 69.8
Queensland 34.0 39.2 45.3 51.4 56.5 60.3 68.9
Western Australia 35.5 39.8 46.7 52.8 58.1 62.2 70.0
South Australia 36.0 40.4 45.3 51.6 57.4 62.5 69.0
Tasmania 23.5 26.5 33.5 43.0 47.4 51.2 54.9
Australian Capital Territory 28.5 32.6 39.7 44.9 48.4 51.0 58.1
Northern Territory 22.4 32.2 44.2 52.2 54.4 58.6 66.2
Remoteness
Major cities 35.6 40.2 46.7 52.4 58.3 62.5 70.6
Inner regional 30.3 34.6 41.3 48.1 53.4 57.2 65.6
Outer regional 29.0 34.2 40.4 47.0 52.2 56.5 62.0
Remote/Very remote 32.2 35.3 41.9 52.6 57.2 64.1 74.2
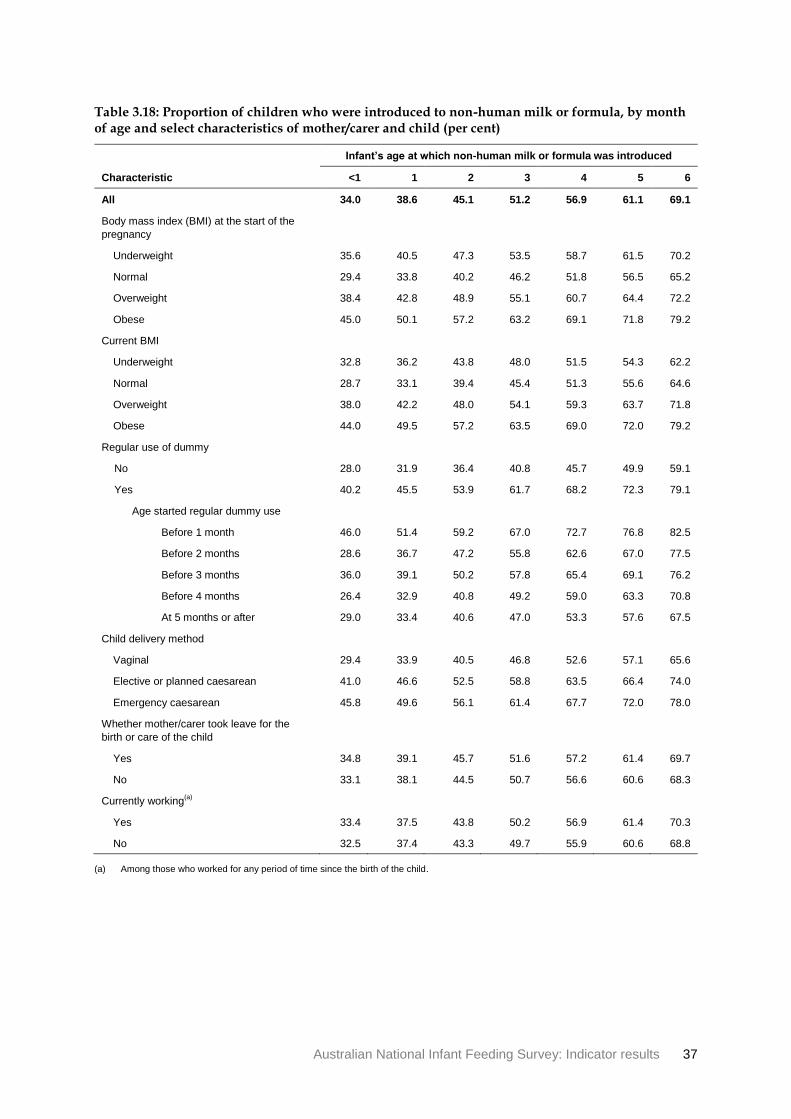
Australian National Infant Feeding Survey: Indicator results 37
Table 3.18: Proportion of children who were introduced to non-human milk or formula, by month of age and select characteristics of mother/carer and child (per cent)
Infant’s age at which non-human milk or formula was introduced
Characteristic <1 1 2 3 4 5 6
All 34.0 38.6 45.1 51.2 56.9 61.1 69.1
Body mass index (BMI) at the start of the
pregnancy
Underweight 35.6 40.5 47.3 53.5 58.7 61.5 70.2
Normal 29.4 33.8 40.2 46.2 51.8 56.5 65.2
Overweight 38.4 42.8 48.9 55.1 60.7 64.4 72.2
Obese 45.0 50.1 57.2 63.2 69.1 71.8 79.2
Current BMI
Underweight 32.8 36.2 43.8 48.0 51.5 54.3 62.2
Normal 28.7 33.1 39.4 45.4 51.3 55.6 64.6
Overweight 38.0 42.2 48.0 54.1 59.3 63.7 71.8
Obese 44.0 49.5 57.2 63.5 69.0 72.0 79.2
Regular use of dummy
No 28.0 31.9 36.4 40.8 45.7 49.9 59.1
Yes 40.2 45.5 53.9 61.7 68.2 72.3 79.1
Age started regular dummy use
Before 1 month 46.0 51.4 59.2 67.0 72.7 76.8 82.5
Before 2 months 28.6 36.7 47.2 55.8 62.6 67.0 77.5
Before 3 months 36.0 39.1 50.2 57.8 65.4 69.1 76.2
Before 4 months 26.4 32.9 40.8 49.2 59.0 63.3 70.8
At 5 months or after 29.0 33.4 40.6 47.0 53.3 57.6 67.5
Child delivery method
Vaginal 29.4 33.9 40.5 46.8 52.6 57.1 65.6
Elective or planned caesarean 41.0 46.6 52.5 58.8 63.5 66.4 74.0
Emergency caesarean 45.8 49.6 56.1 61.4 67.7 72.0 78.0
Whether mother/carer took leave for the
birth or care of the child
Yes 34.8 39.1 45.7 51.6 57.2 61.4 69.7
No 33.1 38.1 44.5 50.7 56.6 60.6 68.3
Currently working(a)
Yes 33.4 37.5 43.8 50.2 56.9 61.4 70.3
No 32.5 37.4 43.3 49.7 55.9 60.6 68.8
(a) Among those who worked for any period of time since the birth of the child.
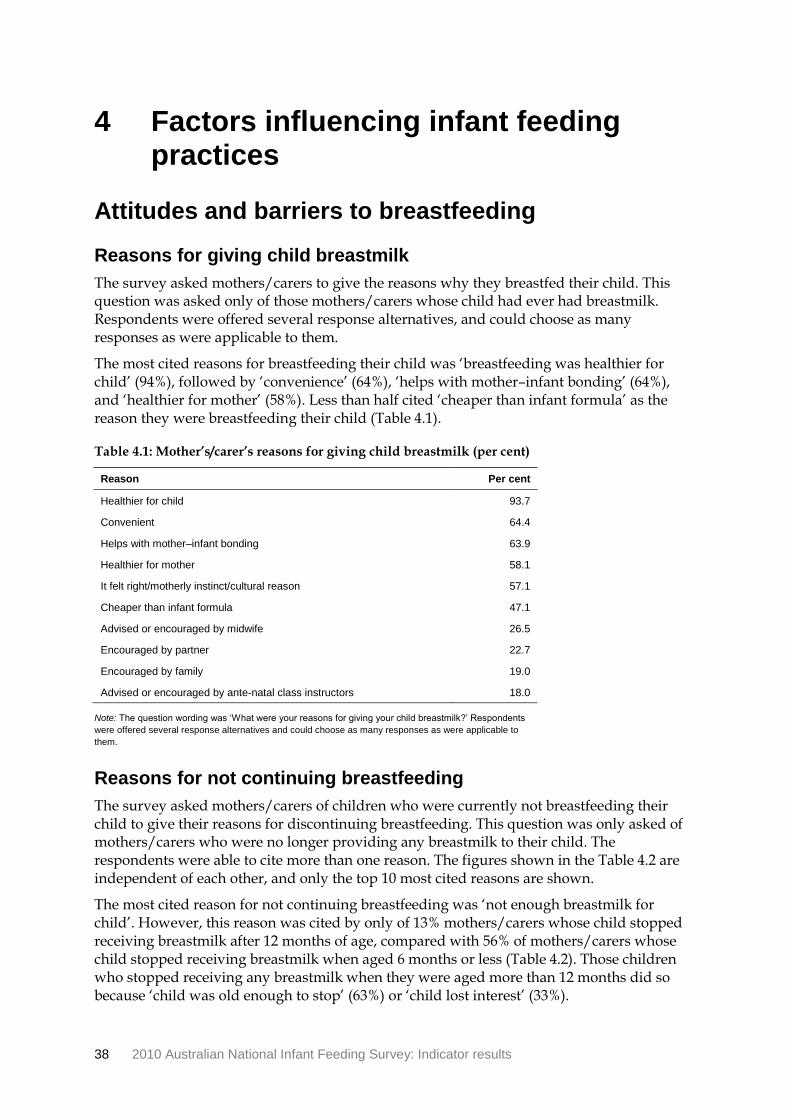
38 2010 Australian National Infant Feeding Survey: Indicator results
4 Factors influencing infant feeding practices
Attitudes and barriers to breastfeeding
Reasons for giving child breastmilk
The survey asked mothers/carers to give the reasons why they breastfed their child. This question was asked only of those mothers/carers whose child had ever had breastmilk. Respondents were offered several response alternatives, and could choose as many responses as were applicable to them.
The most cited reasons for breastfeeding their child was ‘breastfeeding was healthier for child’ (94%), followed by ‘convenience’ (64%), ‘helps with mother–infant bonding’ (64%), and ‘healthier for mother’ (58%). Less than half cited ‘cheaper than infant formula’ as the reason they were breastfeeding their child (Table 4.1).
Table 4.1: Mother’s/carer’s reasons for giving child breastmilk (per cent)
Reason Per cent
Healthier for child 93.7
Convenient 64.4
Helps with mother–infant bonding 63.9
Healthier for mother 58.1
It felt right/motherly instinct/cultural reason 57.1
Cheaper than infant formula 47.1
Advised or encouraged by midwife 26.5
Encouraged by partner 22.7
Encouraged by family 19.0
Advised or encouraged by ante-natal class instructors 18.0
Note: The question wording was ‘What were your reasons for giving your child breastmilk?’ Respondents
were offered several response alternatives and could choose as many responses as were applicable to
them.
Reasons for not continuing breastfeeding
The survey asked mothers/carers of children who were currently not breastfeeding their child to give their reasons for discontinuing breastfeeding. This question was only asked of mothers/carers who were no longer providing any breastmilk to their child. The respondents were able to cite more than one reason. The figures shown in the Table 4.2 are independent of each other, and only the top 10 most cited reasons are shown.
The most cited reason for not continuing breastfeeding was ‘not enough breastmilk for child’. However, this reason was cited by only of 13% mothers/carers whose child stopped receiving breastmilk after 12 months of age, compared with 56% of mothers/carers whose child stopped receiving breastmilk when aged 6 months or less (Table 4.2). Those children who stopped receiving any breastmilk when they were aged more than 12 months did so because ‘child was old enough to stop’ (63%) or ‘child lost interest’ (33%).
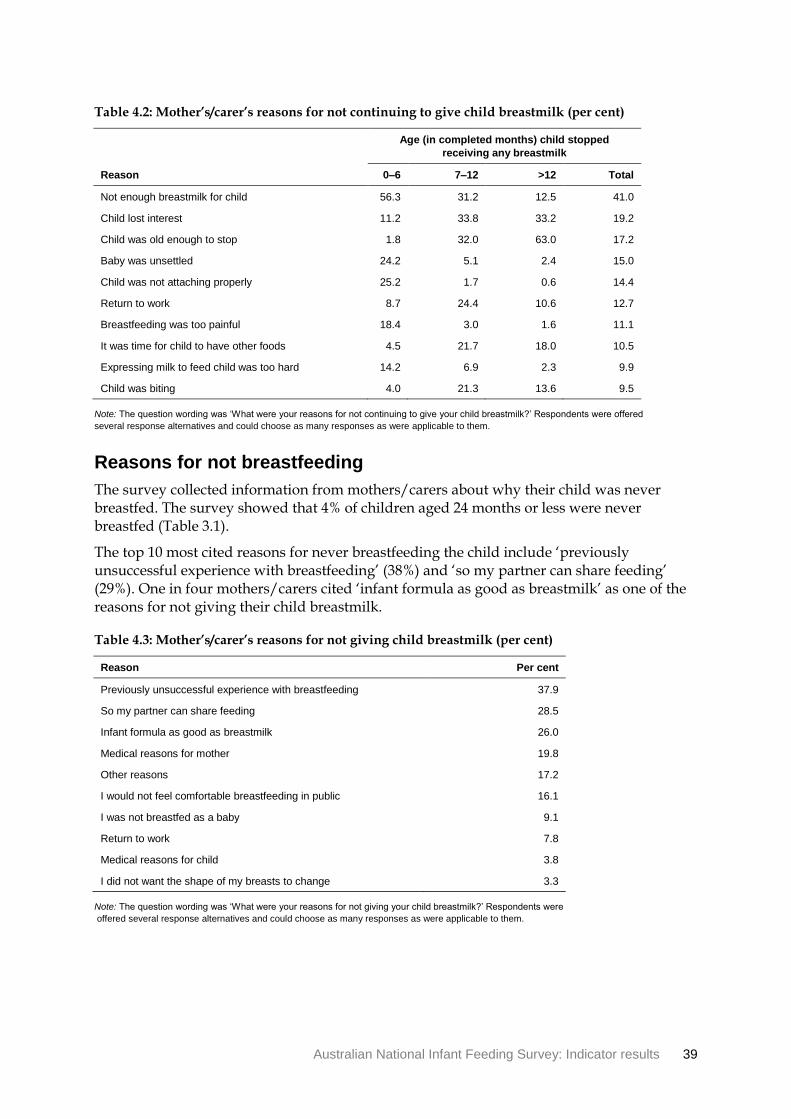
Australian National Infant Feeding Survey: Indicator results 39
Table 4.2: Mother’s/carer’s reasons for not continuing to give child breastmilk (per cent)
Age (in completed months) child stopped
receiving any breastmilk
Reason 0–6 7–12 >12 Total
Not enough breastmilk for child 56.3 31.2 12.5 41.0
Child lost interest 11.2 33.8 33.2 19.2
Child was old enough to stop 1.8 32.0 63.0 17.2
Baby was unsettled 24.2 5.1 2.4 15.0
Child was not attaching properly 25.2 1.7 0.6 14.4
Return to work 8.7 24.4 10.6 12.7
Breastfeeding was too painful 18.4 3.0 1.6 11.1
It was time for child to have other foods 4.5 21.7 18.0 10.5
Expressing milk to feed child was too hard 14.2 6.9 2.3 9.9
Child was biting 4.0 21.3 13.6 9.5
Note: The question wording was ‘What were your reasons for not continuing to give your child breastmilk?’ Respondents were offered
several response alternatives and could choose as many responses as were applicable to them.
Reasons for not breastfeeding
The survey collected information from mothers/carers about why their child was never breastfed. The survey showed that 4% of children aged 24 months or less were never breastfed (Table 3.1).
The top 10 most cited reasons for never breastfeeding the child include ‘previously unsuccessful experience with breastfeeding’ (38%) and ‘so my partner can share feeding’ (29%). One in four mothers/carers cited ‘infant formula as good as breastmilk’ as one of the reasons for not giving their child breastmilk.
Table 4.3: Mother’s/carer’s reasons for not giving child breastmilk (per cent)
Reason Per cent
Previously unsuccessful experience with breastfeeding 37.9
So my partner can share feeding 28.5
Infant formula as good as breastmilk 26.0
Medical reasons for mother 19.8
Other reasons 17.2
I would not feel comfortable breastfeeding in public 16.1
I was not breastfed as a baby 9.1
Return to work 7.8
Medical reasons for child 3.8
I did not want the shape of my breasts to change 3.3
Note: The question wording was ‘What were your reasons for not giving your child breastmilk?’ Respondents were
offered several response alternatives and could choose as many responses as were applicable to them.
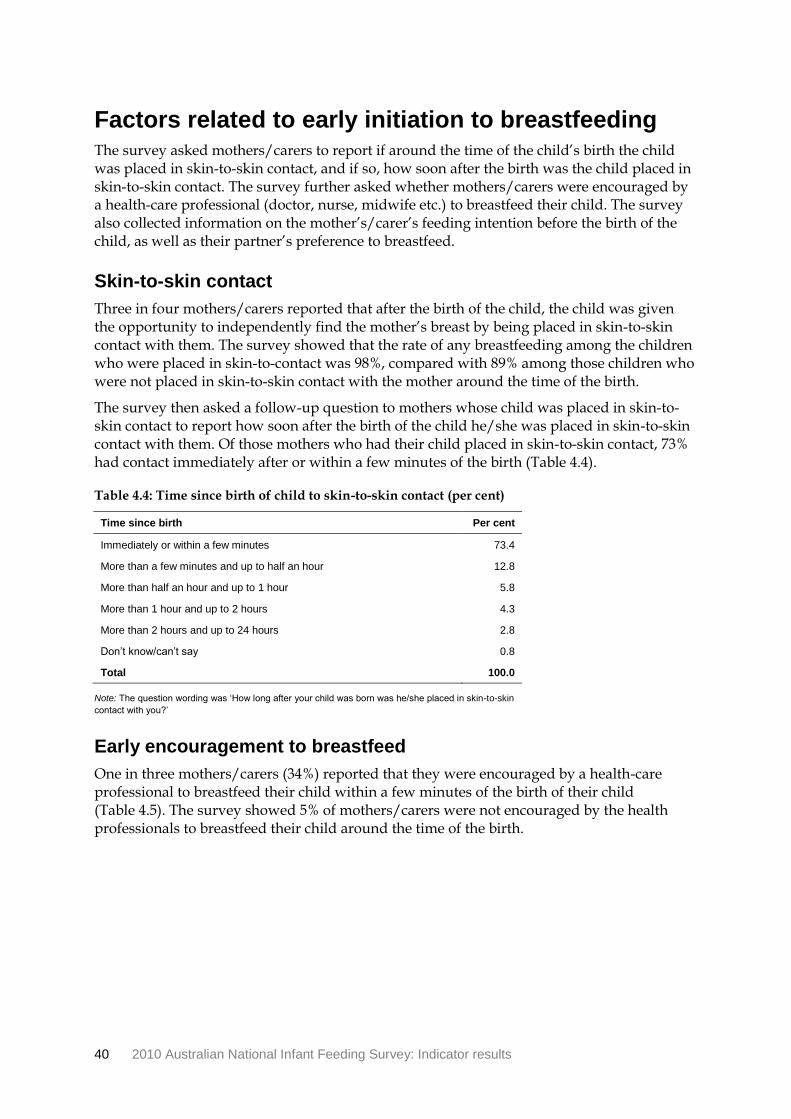
40 2010 Australian National Infant Feeding Survey: Indicator results
Factors related to early initiation to breastfeeding The survey asked mothers/carers to report if around the time of the child’s birth the child was placed in skin-to-skin contact, and if so, how soon after the birth was the child placed in skin-to-skin contact. The survey further asked whether mothers/carers were encouraged by a health-care professional (doctor, nurse, midwife etc.) to breastfeed their child. The survey also collected information on the mother’s/carer’s feeding intention before the birth of the child, as well as their partner’s preference to breastfeed.
Skin-to-skin contact
Three in four mothers/carers reported that after the birth of the child, the child was given the opportunity to independently find the mother’s breast by being placed in skin-to-skin contact with them. The survey showed that the rate of any breastfeeding among the children who were placed in skin-to-contact was 98%, compared with 89% among those children who were not placed in skin-to-skin contact with the mother around the time of the birth.
The survey then asked a follow-up question to mothers whose child was placed in skin-to-skin contact to report how soon after the birth of the child he/she was placed in skin-to-skin contact with them. Of those mothers who had their child placed in skin-to-skin contact, 73% had contact immediately after or within a few minutes of the birth (Table 4.4).
Table 4.4: Time since birth of child to skin-to-skin contact (per cent)
Time since birth Per cent
Immediately or within a few minutes 73.4
More than a few minutes and up to half an hour 12.8
More than half an hour and up to 1 hour 5.8
More than 1 hour and up to 2 hours 4.3
More than 2 hours and up to 24 hours 2.8
Don’t know/can’t say 0.8
Total 100.0
Note: The question wording was ‘How long after your child was born was he/she placed in skin-to-skin
contact with you?’
Early encouragement to breastfeed
One in three mothers/carers (34%) reported that they were encouraged by a health-care professional to breastfeed their child within a few minutes of the birth of their child (Table 4.5). The survey showed 5% of mothers/carers were not encouraged by the health professionals to breastfeed their child around the time of the birth.
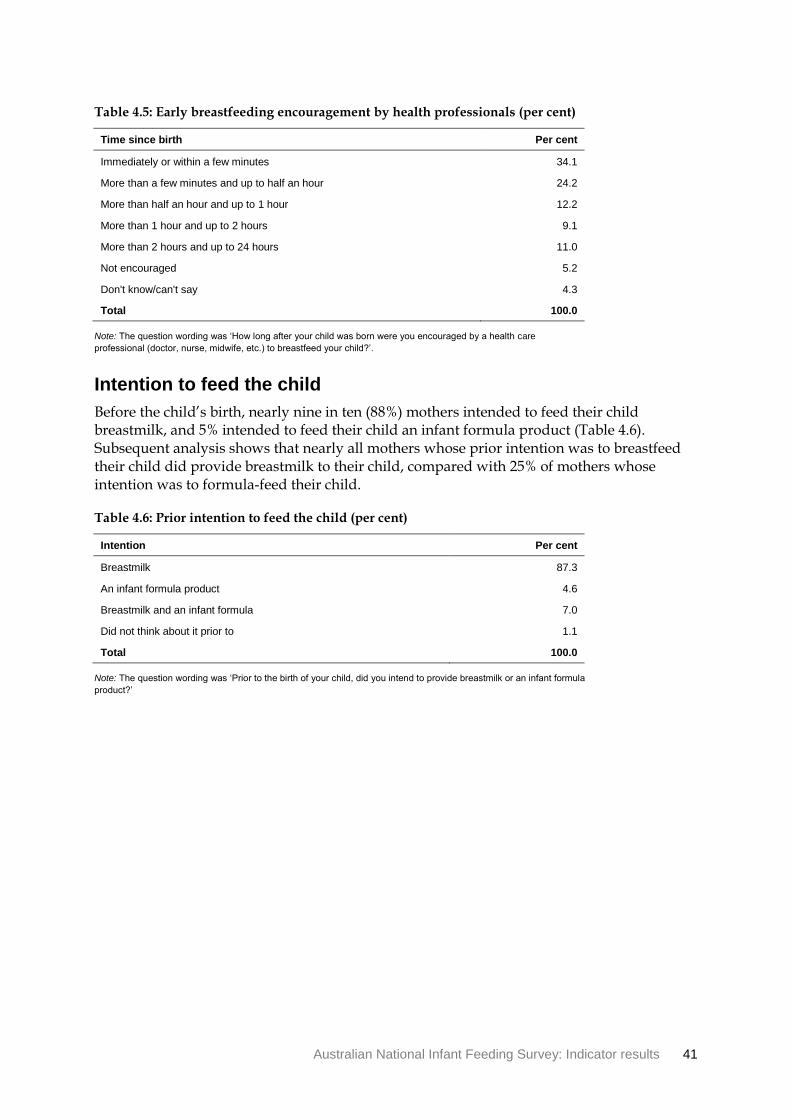
Australian National Infant Feeding Survey: Indicator results 41
Table 4.5: Early breastfeeding encouragement by health professionals (per cent)
Time since birth Per cent
Immediately or within a few minutes 34.1
More than a few minutes and up to half an hour 24.2
More than half an hour and up to 1 hour 12.2
More than 1 hour and up to 2 hours 9.1
More than 2 hours and up to 24 hours 11.0
Not encouraged 5.2
Don't know/can't say 4.3
Total 100.0
Note: The question wording was ‘How long after your child was born were you encouraged by a health care
professional (doctor, nurse, midwife, etc.) to breastfeed your child?’.
Intention to feed the child
Before the child’s birth, nearly nine in ten (88%) mothers intended to feed their child breastmilk, and 5% intended to feed their child an infant formula product (Table 4.6). Subsequent analysis shows that nearly all mothers whose prior intention was to breastfeed their child did provide breastmilk to their child, compared with 25% of mothers whose intention was to formula-feed their child.
Table 4.6: Prior intention to feed the child (per cent)
Intention Per cent
Breastmilk 87.3
An infant formula product 4.6
Breastmilk and an infant formula 7.0
Did not think about it prior to 1.1
Total 100.0
Note: The question wording was ‘Prior to the birth of your child, did you intend to provide breastmilk or an infant formula
product?’
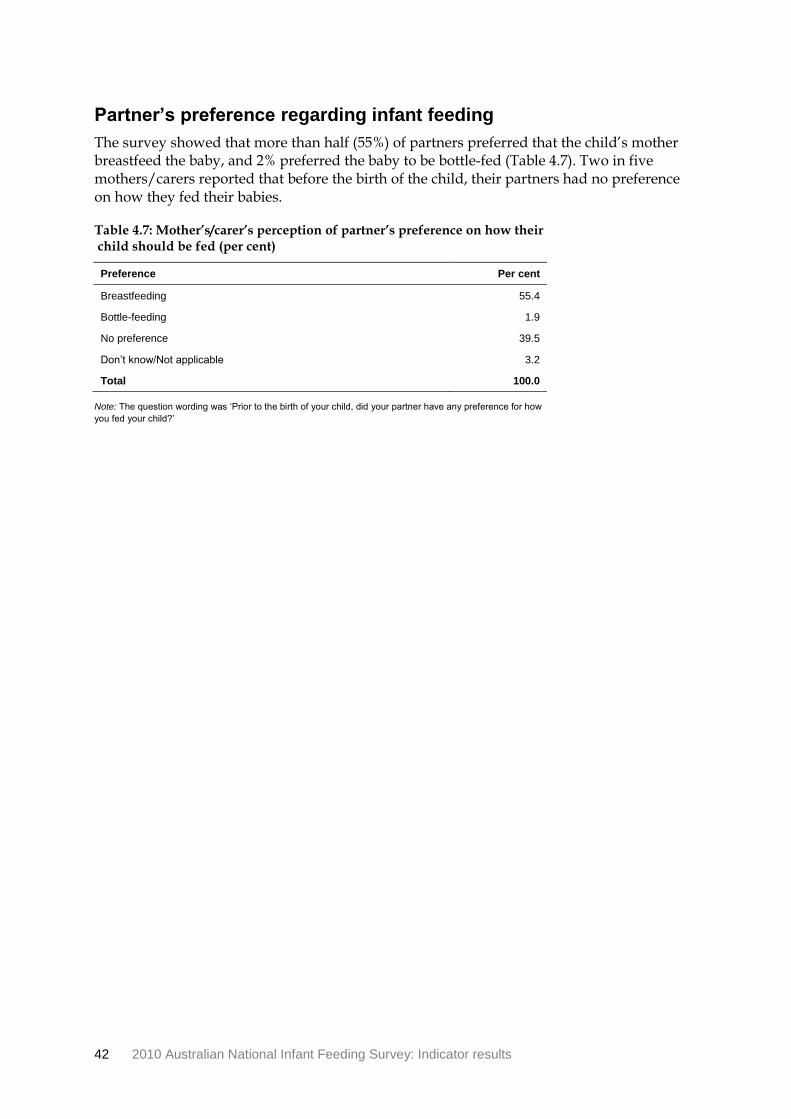
42 2010 Australian National Infant Feeding Survey: Indicator results
Partner’s preference regarding infant feeding
The survey showed that more than half (55%) of partners preferred that the child’s mother breastfeed the baby, and 2% preferred the baby to be bottle-fed (Table 4.7). Two in five mothers/carers reported that before the birth of the child, their partners had no preference on how they fed their babies.
Table 4.7: Mother’s/carer’s perception of partner’s preference on how their child should be fed (per cent)
Preference Per cent
Breastfeeding 55.4
Bottle-feeding 1.9
No preference 39.5
Don’t know/Not applicable 3.2
Total 100.0
Note: The question wording was ‘Prior to the birth of your child, did your partner have any preference for how
you fed your child?’
Australian National Infant Feeding Survey: Indicator results 43
Appendix A Explanatory notes
Introduction The 2010 Australian National Infant Feeding Survey used two data collection modes: mail-out mail-in and ‘online’ options. The Australian Institute of Health and Welfare (AIHW) commissioned Educational Assessment Australia (EAA) to undertake formatting and scanning of the survey questionnaire. EAA also formatted and captured the ‘online’ survey forms. Medicare Australia extracted the sample and managed the mailing out of the survey communications and survey forms. The data collection period for the survey was from October 2010 to February 2011.
Survey objectives The survey is the first of its kind in Australia. It aims to provide cross-sectional data to produce reliable estimates of infant feeding practices in Australia.
The objectives of the survey are to:
• collect and report national baseline data on the prevalence and duration of breastfeeding
• collect and report national baseline data on other foods and drinks consumed by infants and toddlers
• collect and report national baseline data on perinatal depression
• analyse and report on the barriers to initiating and continuing breastfeeding by exploring the associations with demographic information and other characteristics of the child and parent/carer.
Methodology
Pilot survey
A pilot survey involving mothers/carers of a sample of 1,000 children aged up to 24 months was conducted to test the survey methodology and to assess response patterns, including the likely impact on response rates of the survey incentive—a Department of Health and Ageing (DoHA) pen. The sample of 1,000 children was randomly drawn from the Medicare Australia enrolment database. The pilot survey included all the steps proposed for the full Australian National Infant Feeding Survey.
The data from the pilot survey were not included in the main survey for technical and administrative reasons. After the pilot, there were minor changes made to the questionnaire to incorporate an additional question.
44 2010 Australian National Infant Feeding Survey: Indicator results
Survey questionnaire
The DoHA had asked the Australian Bureau of Statistics (ABS) to cognitively test the survey questions, response categories in order to assess the flow, ease of understanding and skip pattern, and overall integrity of survey instrument. The AIHW was provided with the final draft of the survey instrument. Only slight modifications were made to the questionnaire after the pilot. The copy of the survey questionnaire is available at <www.aihw.gov.au>.
Main survey
A sample of 52,008 children aged 0–2 years was randomly selected from the Medicare Australia enrolment database. Cardholders of these children were sent a primary approach letter (PAL) to participate in the survey. Medicare Australia printed and mailed out the PALs, thankyou/reminder postcards, questionnaires and reply-paid envelopes. Medicare Australia also arranged for the DoHA-supplied pens to be included with the survey materials.
Survey hotline
The AIHW established a toll-free survey hotline during both the pilot and the main survey. This allowed survey participants to seek information on the purpose of the survey, how to complete the questionnaire, or to advise if they did not wish to take part in the survey.
Sample selection and data collection
The AIHW, in close cooperation with officers from the DoHA and Medicare Australia, determined the required sample size. EAA, as the data collection agency, collected the returned questionnaires from the designated post office, and scanned the survey responses using optical character recognition (OCR) technology.
Sampling
• Children aged 0–24 months on 8 October 2010 and included in the Medicare Australia enrolment database comprised the sample frame.
• Those born less than 30 days from when the sample was drawn were considered to be 0–1 month old.
• Children from external territories were excluded from the sample.
• The sample was stratified by age and infants each month of age up to 6 months were oversampled by a factor of 10 compared with children aged each of 7–24 months.
• If the selected child was the only person listed on the Medicare card (that is, there was no adult listed on the card), then the child was excluded from the sample. Over 5,000 children were listed alone on the Medicare card.
• Medicare Australia applied an activity test when identifying children for inclusion in the sample. If there was at least one Medicare service or at least an episode in the Australian Childhood Immunisation Register in the previous 12 months (enrolment was considered an activity), the child was eligible to be included in the sample.
Australian National Infant Feeding Survey: Indicator results 45
Mail-out
• In cases where a child was associated with more than one Medicare card, a PAL was sent to each adult on whose Medicare card the child was listed. The survey materials were sent only to the primary cardholder. This meant that in some cases the survey materials were addressed to the father of the child. In essence, the number of PALs mailed out exceeded the survey sample size.
• Immediately before mailing, the record of sampled children and the associated adults was matched against the national ‘fact-of-death’ file.
• After the mail-out of the PAL, mail-out of the actual survey instrument occurred within 7 days.
• All ‘return to sender’ envelopes were addressed to Medicare Australia.
• The completed survey forms were sent to a reply-paid post box at the Alexandria Post Office (Sydney) for daily collection by EAA.
• Thankyou/reminder cards were sent to all respondents within 1 week, irrespective of whether they had completed the survey.
• The second mail-out of the questionnaire to non-responding mothers/carers occurred 3 weeks after mailing the thankyou/reminder cards.
Weighting
Weights were applied to the survey data to adjust for differential probability of selection, differential response rates and also to adjust for non-coverage.
Adjustment for differential probability of selection
Altogether 52,008 children were selected in the sample. Infants aged up to 6 months were oversampled to obtain sound estimates of breastfeeding intensity and duration for this age period and to facilitate comparisons with future national survey data. For each month of age up to 6 months, 6,667 infants were randomly selected nationally, whereas only 667 children were selected for each month for children aged 7 to 24 months. [The sample was further stratified by state and territory. Although the selection probability within each age (in months) was constant across Australia, the selection probability varied by state or territory.]
To adjust for the differential probability of selection, a first weight (w1) was used. This weight is the inverse of the selection probability of a child within each age (in months) and state/territory. The population and the sample for each month of age by state/territory are in tables A1 and A2, respectively.
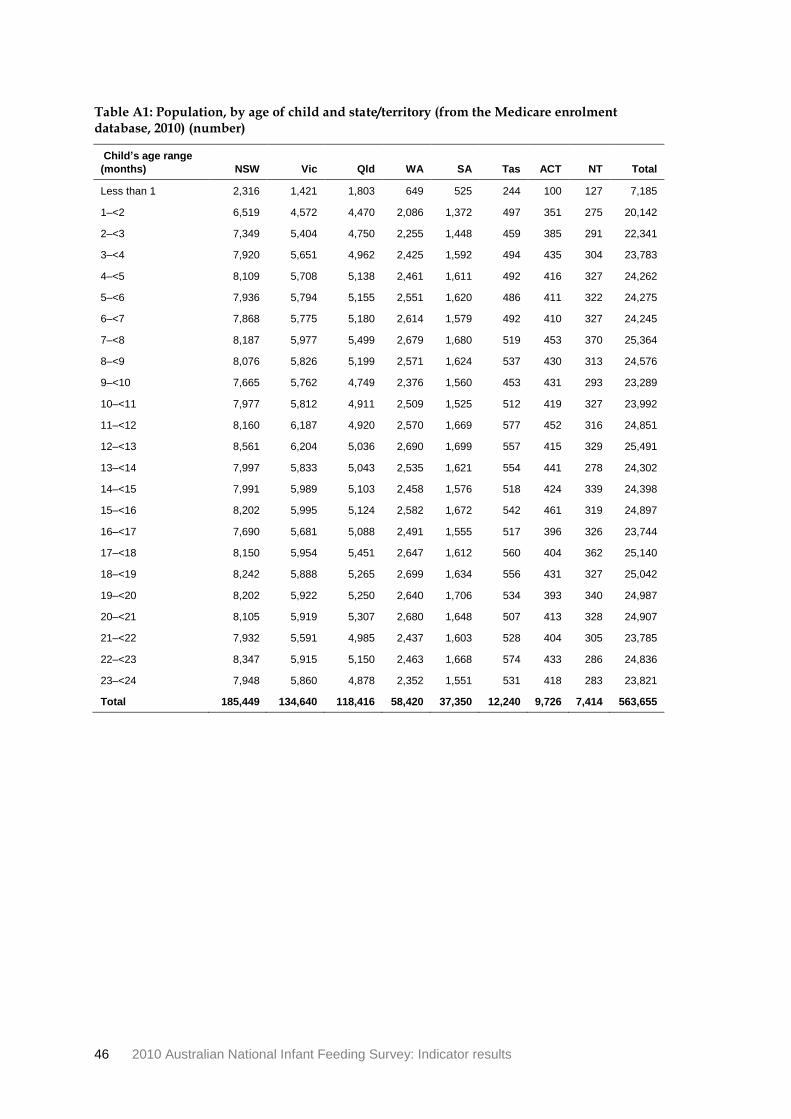
46 2010 Australian National Infant Feeding Survey: Indicator results
Table A1: Population, by age of child and state/territory (from the Medicare enrolment database, 2010) (number)
Child’s age range
(months) NSW Vic Qld WA SA Tas ACT NT Total
Less than 1 2,316 1,421 1,803 649 525 244 100 127 7,185
1–<2 6,519 4,572 4,470 2,086 1,372 497 351 275 20,142
2–<3 7,349 5,404 4,750 2,255 1,448 459 385 291 22,341
3–<4 7,920 5,651 4,962 2,425 1,592 494 435 304 23,783
4–<5 8,109 5,708 5,138 2,461 1,611 492 416 327 24,262
5–<6 7,936 5,794 5,155 2,551 1,620 486 411 322 24,275
6–<7 7,868 5,775 5,180 2,614 1,579 492 410 327 24,245
7–<8 8,187 5,977 5,499 2,679 1,680 519 453 370 25,364
8–<9 8,076 5,826 5,199 2,571 1,624 537 430 313 24,576
9–<10 7,665 5,762 4,749 2,376 1,560 453 431 293 23,289
10–<11 7,977 5,812 4,911 2,509 1,525 512 419 327 23,992
11–<12 8,160 6,187 4,920 2,570 1,669 577 452 316 24,851
12–<13 8,561 6,204 5,036 2,690 1,699 557 415 329 25,491
13–<14 7,997 5,833 5,043 2,535 1,621 554 441 278 24,302
14–<15 7,991 5,989 5,103 2,458 1,576 518 424 339 24,398
15–<16 8,202 5,995 5,124 2,582 1,672 542 461 319 24,897
16–<17 7,690 5,681 5,088 2,491 1,555 517 396 326 23,744
17–<18 8,150 5,954 5,451 2,647 1,612 560 404 362 25,140
18–<19 8,242 5,888 5,265 2,699 1,634 556 431 327 25,042
19–<20 8,202 5,922 5,250 2,640 1,706 534 393 340 24,987
20–<21 8,105 5,919 5,307 2,680 1,648 507 413 328 24,907
21–<22 7,932 5,591 4,985 2,437 1,603 528 404 305 23,785
22–<23 8,347 5,915 5,150 2,463 1,668 574 433 286 24,836
23–<24 7,948 5,860 4,878 2,352 1,551 531 418 283 23,821
Total 185,449 134,640 118,416 58,420 37,350 12,240 9,726 7,414 563,655
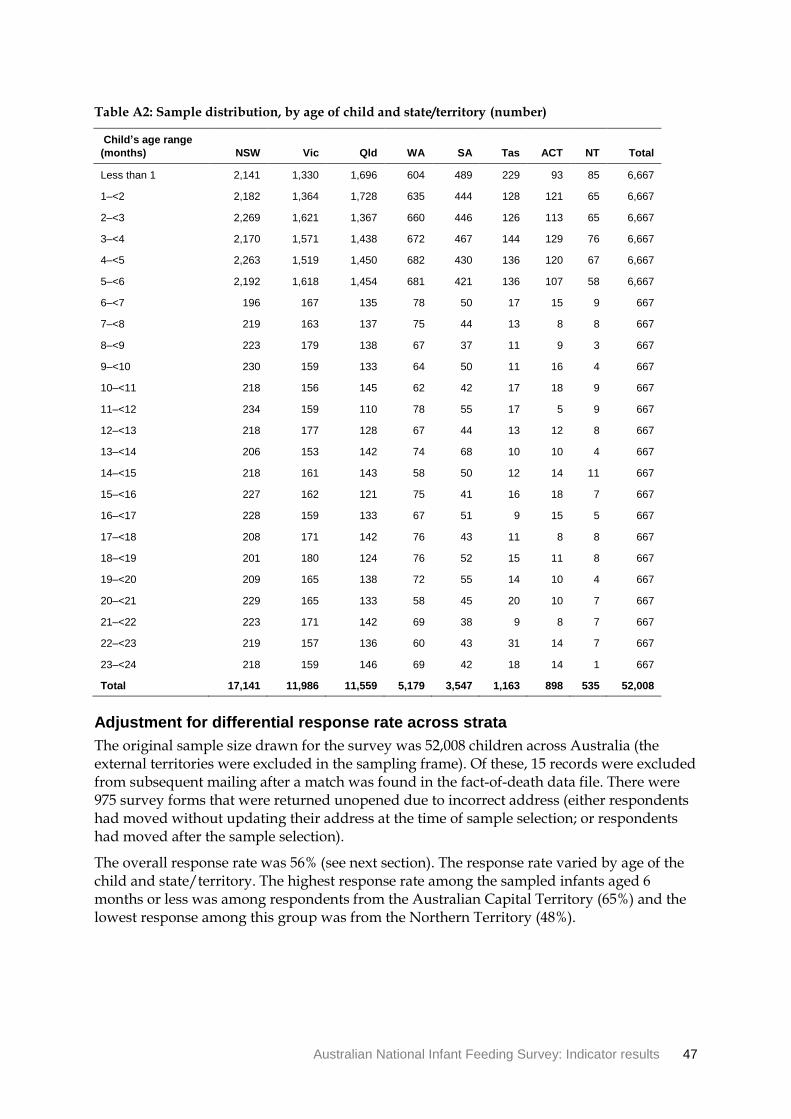
Australian National Infant Feeding Survey: Indicator results 47
Table A2: Sample distribution, by age of child and state/territory (number)
Child’s age range
(months) NSW Vic Qld WA SA Tas ACT NT Total
Less than 1 2,141 1,330 1,696 604 489 229 93 85 6,667
1–<2 2,182 1,364 1,728 635 444 128 121 65 6,667
2–<3 2,269 1,621 1,367 660 446 126 113 65 6,667
3–<4 2,170 1,571 1,438 672 467 144 129 76 6,667
4–<5 2,263 1,519 1,450 682 430 136 120 67 6,667
5–<6 2,192 1,618 1,454 681 421 136 107 58 6,667
6–<7 196 167 135 78 50 17 15 9 667
7–<8 219 163 137 75 44 13 8 8 667
8–<9 223 179 138 67 37 11 9 3 667
9–<10 230 159 133 64 50 11 16 4 667
10–<11 218 156 145 62 42 17 18 9 667
11–<12 234 159 110 78 55 17 5 9 667
12–<13 218 177 128 67 44 13 12 8 667
13–<14 206 153 142 74 68 10 10 4 667
14–<15 218 161 143 58 50 12 14 11 667
15–<16 227 162 121 75 41 16 18 7 667
16–<17 228 159 133 67 51 9 15 5 667
17–<18 208 171 142 76 43 11 8 8 667
18–<19 201 180 124 76 52 15 11 8 667
19–<20 209 165 138 72 55 14 10 4 667
20–<21 229 165 133 58 45 20 10 7 667
21–<22 223 171 142 69 38 9 8 7 667
22–<23 219 157 136 60 43 31 14 7 667
23–<24 218 159 146 69 42 18 14 1 667
Total 17,141 11,986 11,559 5,179 3,547 1,163 898 535 52,008
Adjustment for differential response rate across strata
The original sample size drawn for the survey was 52,008 children across Australia (the external territories were excluded in the sampling frame). Of these, 15 records were excluded from subsequent mailing after a match was found in the fact-of-death data file. There were 975 survey forms that were returned unopened due to incorrect address (either respondents had moved without updating their address at the time of sample selection; or respondents had moved after the sample selection).
The overall response rate was 56% (see next section). The response rate varied by age of the child and state/territory. The highest response rate among the sampled infants aged 6 months or less was among respondents from the Australian Capital Territory (65%) and the lowest response among this group was from the Northern Territory (48%).

48 2010 Australian National Infant Feeding Survey: Indicator results
To adjust for this differential non-response, a second weight (w2) was applied. This weight is the ratio of usable sample divided by the number of respondents within each age/state stratum. As the stratum detail for the ‘return-to-sender’ component was not known, w2 was created using the sample size rather than usable sample. This had a negligible effect on the overall weighting scheme. The distribution of respondents is shown in Table A3.
Table A3: Respondents, by age of child (at time of sample) and state/territory (number)
Child’s age range
(months) NSW Vic Qld WA SA Tas ACT NT Total
Less than 1 1,147 753 888 331 280 121 54 41 3,615
1–<2 1,280 856 1,004 370 272 78 85 25 3,970
2–<3 1,364 1,082 793 427 300 88 69 36 4,159
3–<4 1,233 951 820 394 283 83 87 36 3,887
4–<5 1,262 926 732 399 273 93 81 34 3,800
5–<6 1,153 897 638 383 266 85 65 29 3,516
6–<7 115 104 54 44 27 12 9 3 368
7–<8 116 89 54 39 24 5 7 3 337
8–<9 110 98 57 37 25 10 6 2 345
9–<10 122 68 65 37 33 7 8 1 341
10–<11 98 71 62 21 21 7 8 1 289
11–<12 126 78 45 42 21 8 3 3 326
12–<13 95 95 59 42 22 12 9 5 339
13–<14 95 79 54 37 31 5 4 3 308
14–<15 92 66 53 28 28 9 4 5 285
15–<16 100 70 50 37 14 5 9 2 287
16–<17 90 89 64 27 25 5 9 2 311
17–<18 82 95 64 41 19 6 3 2 312
18–<19 91 94 56 29 28 3 6 2 309
19–<20 95 78 59 32 20 5 6 4 299
20–<21 99 73 58 31 26 5 4 1 297
21–<22 90 81 48 33 15 10 1 2 280
22–<2 81 72 65 24 19 12 6 1 280
23–<24 52 45 39 15 14 6 5 0 176
Total 9,188 6,910 5,881 2,900 2,086 680 548 243 28,436
Note: This table does not include 329 respondents for whom age and/or state and territory was not reported.
Post-stratification adjustment weight
In order to make the total survey estimates sum to the population of children for each age (in months) and stratum, a final weight (w3) was created. This weight is the ratio of the population (as of September 2010) of children at each month of age (up to 24 months) at stratum divided by the population from the sampling frame.
When the composite weight (as a product of w1, w2 and w3) is applied to the survey responses, the total survey estimate sums to the number of children at the stratum level. In all, there are 192 unique weights (24 age groups by 8 states/territories).
Australian National Infant Feeding Survey: Indicator results 49
Response rate
The survey was officially ‘closed’ on 11 February, 2011. By that time there were:
• survey forms received by mail: 27,106
• online survey forms completed (including duplicates and partial complete): 1,763
This resulted in a total received at EAA of 28,869. Of these, there were 48 blank and a further 104 duplicates, as some respondents returned a second set of survey forms when they received the reminder letter. When we received two completed forms from a single respondent, we used the responses from the first form and discarded those from the second form. After removing duplicates and blank survey forms, the number of completed, usable forms totalled 28,759.
The response rate calculation is based on the following information:
1. Total sample selected: 52,008
2. Records deleted from mail-out due to a match in fact-of-death file 15
3. Survey forms returned unopened (‘return to sender’) 975
4. Respondents chose to opt out (via email or by calling the hotline) 266
5. Total completed and usable (including partially complete) 28,759
Respondents’ characteristics
The survey form was addressed to the primary cardholder on whose Medicare card the selected child was listed. Although children were the survey sample, primary carers of these selected children responded to the survey. In Table A4 selected characteristics of the respondents are shown. More than a third (36%) of the respondents were aged between 30 and 34 years, two-fifths (41%) had given birth to one child and a similar proportion had a bachelor degree or higher level of education. Nearly one in ten respondents smoked (either regularly or occasionally). The vast majority of respondents were born in Australia (73%) and reported English as the main language spoken at home (88%). Only a small proportion of respondents were Indigenous (1%) and some 4% respondents were carers (not the biological mother of the child).
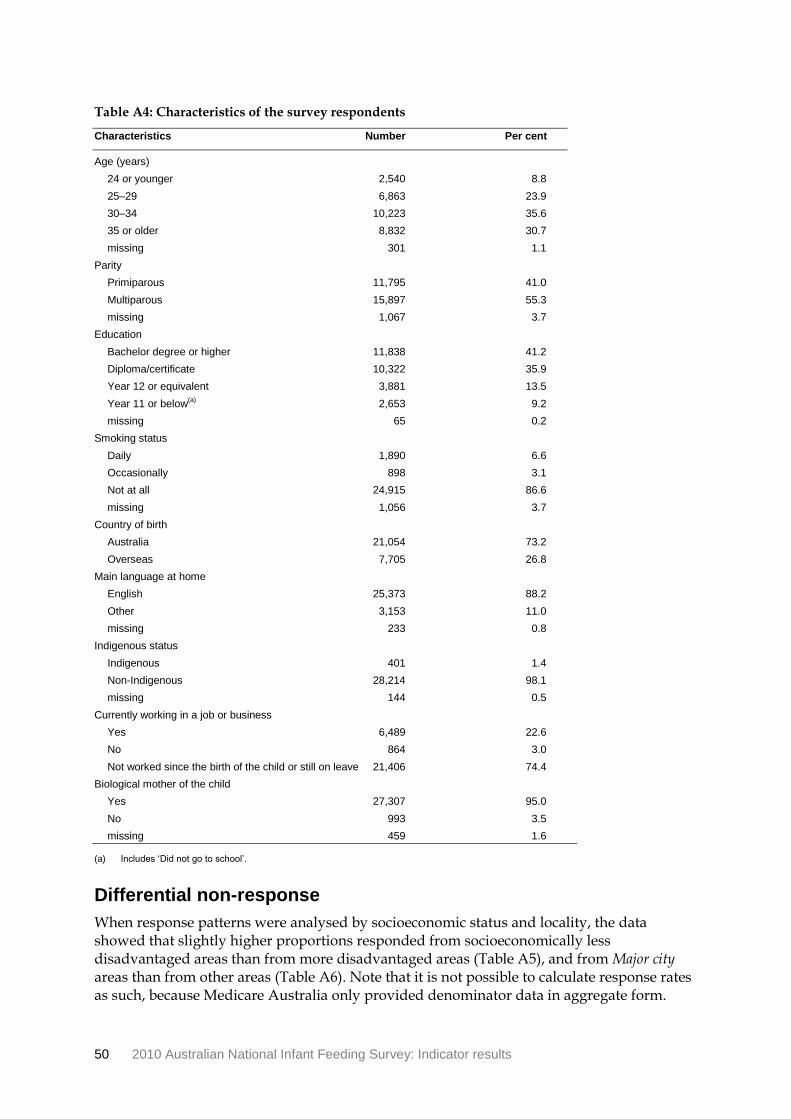
50 2010 Australian National Infant Feeding Survey: Indicator results
Table A4: Characteristics of the survey respondents
Characteristics Number Per cent
Age (years)
24 or younger 2,540 8.8
25–29 6,863 23.9
30–34 10,223 35.6
35 or older 8,832 30.7
missing 301 1.1
Parity
Primiparous 11,795 41.0
Multiparous 15,897 55.3
missing 1,067 3.7
Education
Bachelor degree or higher 11,838 41.2
Diploma/certificate 10,322 35.9
Year 12 or equivalent 3,881 13.5
Year 11 or below(a)
2,653 9.2
missing 65 0.2
Smoking status
Daily 1,890 6.6
Occasionally 898 3.1
Not at all 24,915 86.6
missing 1,056 3.7
Country of birth
Australia 21,054 73.2
Overseas 7,705 26.8
Main language at home
English 25,373 88.2
Other 3,153 11.0
missing 233 0.8
Indigenous status
Indigenous 401 1.4
Non-Indigenous 28,214 98.1
missing 144 0.5
Currently working in a job or business
Yes 6,489 22.6
No 864 3.0
Not worked since the birth of the child or still on leave 21,406 74.4
Biological mother of the child
Yes 27,307 95.0
No 993 3.5
missing 459 1.6
(a) Includes ‘Did not go to school’.
Differential non-response
When response patterns were analysed by socioeconomic status and locality, the data showed that slightly higher proportions responded from socioeconomically less disadvantaged areas than from more disadvantaged areas (Table A5), and from Major city areas than from other areas (Table A6). Note that it is not possible to calculate response rates as such, because Medicare Australia only provided denominator data in aggregate form.
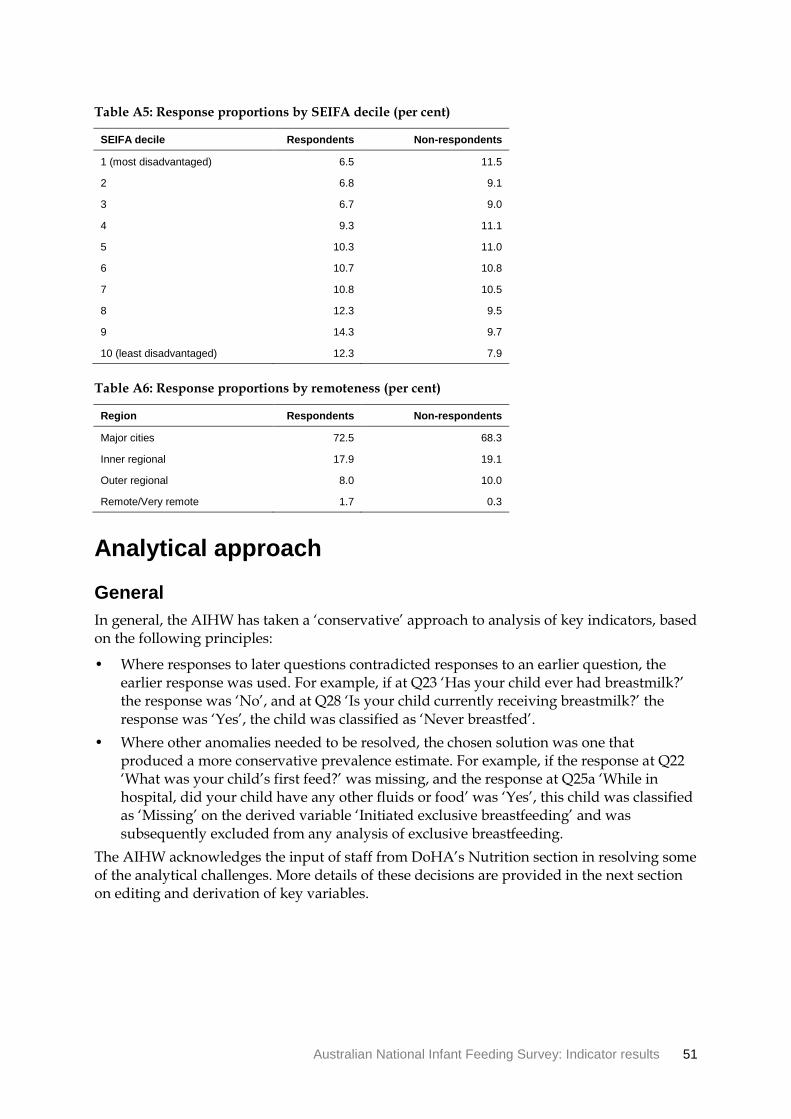
Australian National Infant Feeding Survey: Indicator results 51
Table A5: Response proportions by SEIFA decile (per cent)
SEIFA decile Respondents Non-respondents
1 (most disadvantaged) 6.5 11.5
2 6.8 9.1
3 6.7 9.0
4 9.3 11.1
5 10.3 11.0
6 10.7 10.8
7 10.8 10.5
8 12.3 9.5
9 14.3 9.7
10 (least disadvantaged) 12.3 7.9
Table A6: Response proportions by remoteness (per cent)
Region Respondents Non-respondents
Major cities 72.5 68.3
Inner regional 17.9 19.1
Outer regional 8.0 10.0
Remote/Very remote 1.7 0.3
Analytical approach
General
In general, the AIHW has taken a ‘conservative’ approach to analysis of key indicators, based on the following principles:
• Where responses to later questions contradicted responses to an earlier question, the earlier response was used. For example, if at Q23 ‘Has your child ever had breastmilk?’ the response was ‘No’, and at Q28 ‘Is your child currently receiving breastmilk?’ the response was ‘Yes’, the child was classified as ‘Never breastfed’.
• Where other anomalies needed to be resolved, the chosen solution was one that produced a more conservative prevalence estimate. For example, if the response at Q22 ‘What was your child’s first feed?’ was missing, and the response at Q25a ‘While in hospital, did your child have any other fluids or food’ was ‘Yes’, this child was classified as ‘Missing’ on the derived variable ‘Initiated exclusive breastfeeding’ and was subsequently excluded from any analysis of exclusive breastfeeding.
The AIHW acknowledges the input of staff from DoHA’s Nutrition section in resolving some of the analytical challenges. More details of these decisions are provided in the next section on editing and derivation of key variables.
52 2010 Australian National Infant Feeding Survey: Indicator results
Survival analysis
Another feature of the data was ‘censored’ responses, that is, children who had not experienced a relevant ‘event’ (for example, introduction of water to disqualify them as exclusively breastfed) by the time the survey was completed. For exclusive and predominant breastfeeding, relevant responses were combined with the ‘retrospective’ responses; that is, children who had experienced relevant disqualifying events. For exclusive and predominant breastfeeding, the indicator results were derived using a non-parametric survival analysis technique, essentially constructed on synthetic ‘cohorts’ of children to each month of age. This cohort method is consistent with international practice on reporting breastfeeding duration (CDC 2011).
Editing and derivation of key variables
As described earlier, the survey was conducted using a postal survey where respondents marked their responses in the hard copy survey form. (The survey also provided an ‘online’ option, but only 1,730 respondents (6%) completed the survey using the online option. The data entry was automatic for the online responses where all the ‘skip patterns’ were automatically controlled by the software.) Since not all questions in the survey forms were applicable to all respondents, there were a lot of ‘skip’ instructions. Data entry for the hard copy forms was completed using optical character recognition (OCR) technology, where survey responses were captured by scanning the survey forms (including any written responses). Not all the respondents followed all skip patterns as instructed. As a result, there was a need to edit the data for some inconsistencies.
Derivation of survey variables used for the core indicators
Proportion of children ever breastfed
The survey asked a number of questions about a child’s breastfeeding history. Question 22 asked about child’s first feed. Respondents were asked to mark only one response—either ‘breastmilk’, ‘infant formula’ or ‘other’. If they answered ‘other’, they were asked to specify ‘other’. From the responses specifying ‘other’ categories, over 80 responses were identified as being a form of breastmilk. If a respondent chose a response other than breastmilk (including colostrum, expressed milk from mother or from a donor) as a first feed they were directed to Question 23. Question 23 asked whether their child ever had breastmilk.
The responses from these two questions (questions 22 and 23) were used to classify whether a child ever had any breastmilk. If a respondent reported that either the first feed was breastmilk (Question 22) or responded ‘Yes’ to whether their child ever had breastmilk (Question 23), then the child was classified as ‘ever had breastmilk’. If a child’s first feed was not breastmilk or if a response was missing to this question and a ‘No’ response was given for Question 23 then the child was classified as ‘never had breastmilk’.
If responses to both of these questions were missing, these cases were not assigned to any category, and were subsequently excluded from the analysis for this indicator. This indicator can also be used as breastfeeding initiation rate.
Australian National Infant Feeding Survey: Indicator results 53
Proportion of children currently breastfed
The survey included a question (Question 28) about whether the child was currently receiving breastmilk (including expressed breastmilk or breastmilk from a donor). If the response to this question was ‘Yes’ then the child was categorised as receiving breastmilk at survey completion date. If the response to this question was ‘No’, the child was categorised as not receiving any breastmilk at survey completion time. No other information was used to identify ‘currently’ breastfed children.
Proportion of children exclusively breastfed
To estimate the proportion of children exclusively breastfed we first estimated the exclusive breastfeeding initiation rate. The numerator comprised children whose first feed was breastmilk (from Question 22) and the denominator comprised all who provided a valid response for the child’s first feed. That is, unless information about the child’s first feed was available, that child’s information was not used in the exclusive breastfeeding analysis. The initiation of exclusive breastfeeding rate was calculated as the proportion of all children whose first feed was breastmilk.
Once initiation of exclusive breastfeeding was established, the duration of exclusive breastfeeding could be calculated as follows. For children whose first feed was breastmilk, who had not been introduced to any other fluid or food and who were still receiving breastmilk when the mother/carer completed the survey, the duration of exclusive breastfeeding for these children was their current age. This meant that if a child was 3 months old when the mother/carer completed the survey and up to that time their child had only received breastmilk, then 3 months was assigned as the duration of exclusive breastfeeding for that child.
For other children who had initiated exclusive breastfeeding, but by the time the survey was completed had been introduced to other fluids or foods, then the estimation of the duration of exclusive breastfeeding consisted of a few extra steps. First the child’s age when he/she first drank infant formula (Question 37), water (Question 41), cow’s milk (Question 44), soy milk (Question 49), water-based drinks (Question 53) or fruit juice (Question 56) or ate any soft or semi-solid or solid food (Question 62) was determined. We then determined the child’s age when the earliest ‘event’ occurred—the child was exclusively breastfed until the age when this ‘event’ happened. We then estimated the duration of exclusive breastfeeding using techniques that are used for event history analysis.
There were two additional criteria employed to estimate the duration of exclusive breastfeeding. First, even if a child’s first feed was breastmilk, if he/she drank any water, infant formula or other milk/solids while in hospital, then the duration of exclusive breastfeeding was set to 0 months. Second, a child may have had breastmilk as their first feed and not received any other milk or solids other than breastmilk while in hospital but if when he/she came home from hospital the child was not receiving breastmilk; here again the duration of exclusive breastfeeding was set to 0 months. Of all the children surveyed, about 8,000 reported that they had other fluids or food while in hospital.
For those children who were exclusively breastfed during the survey period, we are not able to know how long they will be continued to be exclusively breastfed into the future. In survival analysis terms, these are termed ‘censored cases’. Analysing event history for a group who has not yet experienced an ‘event’ requires specific analytical tools.
54 2010 Australian National Infant Feeding Survey: Indicator results
Proportion of children predominantly breastfed
To estimate the proportion of children predominantly breastfed, we used a similar technique to that used to estimate the proportion of children ever breastfed. For a child to be classified as predominantly breastfed, the child is allowed in addition to breastmilk (including colostrum, expressed milk, donor milk) oral rehydration solutions, vitamins and mineral drops and syrups, water and water-based drinks, and fruit juice. Therefore, the numerator was the number of children who initiated exclusive breastfeeding as well as those children whose first feed was glucose solution, juice or water-based drinks. The denominator was the number of all children who reported a valid response for the child’s first feed.
Once the proportion of children predominantly breastfed was established, the duration of predominant breastfeeding could be estimated. For all the children this duration is equal to or greater than the duration of exclusive breastfeeding. For ‘censored’ cases, the duration of exclusive breastfeeding and the duration of predominant breastfeeding is the same. For other children, the age at which they were first introduced to infant formula (Question 37), cow’s milk (Question 44), soy milk (Question 49) and soft, semi-soft and solid food (Question 62) was determined first; the child was predominantly breastfed until the age when this ‘event’ happened. An estimation of the duration of predominant breastfeeding could then follow, using techniques that are used for event history analysis.
Proportion of children receiving soft/semi-solid/solid food
The survey has a soft/semi-soft /solid food module, comprising four questions. The first question asked whether a child has ever eaten any soft or semi-solid or solid food. If the response was ‘No’, further questions in this module were not asked. If the answer was ‘Yes’, then the respondent was asked to state the age of the child when they first ate soft or semi-soft or solid food. A further question was asked to determine the type of fluids that were added to the food and, a final question on last time the child ate soft or semi-soft or solid food.
For this indicator, the numerator was the number of children who had ever eaten any soft or semi-soft or solid food and this event had occurred 24 hours before survey completion. The denominator was the total number of children.
Note, though, that for the tables in Chapter 3, the numerator did not include the ‘past 24 hours’ qualifier, and the proportions were derived from event history analysis.
Proportion of children receiving non-human milk or formula
To estimate the proportion of children receiving non-human milk or formula, we first identified whether a child had ever received non-human milk or formula. To do this, we used information about the first feed (Question 22); any infant formula (Question 35); cow’s milk (Question 43); and/or soy milk (Question 48).
The numerator comprised children who had ever had non-human milk or formula and had consumed the same within 24 hours before survey completion. The denominator was the total number of children.
Note, again, for the tables in Chapter 3, the numerator did not include the ‘past 24 hours’ qualifier, and the proportions were derived from event history analysis.
Australian National Infant Feeding Survey: Indicator results 55
Derivation of variables used for geographical classification and socioeconomic status
Socioeconomic status
Socio-Economic Indexes for Areas (SEIFAs) are categories that summarise the socioeconomic conditions of an area. They are derived by the ABS from the 2006 population Census.
Respondents’ usual residence was allocated a postal area (ABS equivalent of Australia Post’s postcode). Then each postal area was assigned an Index of Relative Socioeconomic Disadvantage (SEIFA) quintile. Lower SEIFA quintile means that the postal area in general is more disadvantaged compared to other postal areas with higher SEIFA quintile.
Geographical classification
Geographical remoteness in this report is classified according to the Australian Standard Geographical Classification Remoteness Areas, developed by the ABS to allow quantitative comparisons between ‘city’ and ‘country’ Australia.
Using information on mother/carer’s usual residency, the area was classified into one of the ABS remoteness structures: major cities; inner regional; outer regional; and remote/very remote. Due to small number of cases in rural and very remote areas, the two groups were combined to one.
Reliability of estimates
Sampling error
The prevalence estimate obtained from a sample will differ from the prevalence rate obtained from counting the whole population. The error in this estimate is known as sampling error. This error occurs because observations are only made on the sample. Other things remaining the same, sampling error can be minimised by selecting a higher proportion of the population in the sample. The confidence bands for the estimates are based on the sampling error. The lower the sampling error, the tighter the confidence boundaries. Confidence boundaries are presented in tables on this report’s web page at <www.aihw.gov.au>. The confidence intervals are calculated using the svy command in Stata.
Non-sampling error
Non-sampling error can be attributed to many sources. These include respondents understanding questions differently, respondents not providing correct information, definitional problems, processing errors and recall errors. To minimise non-sampling error, we piloted the survey instrument to assess whether respondents understood the concepts and questions and whether they were able to provide coherent answers. The pilot for this survey was conducted nationwide on a sample of 1,000 mother/carers of children up to 24 months of age. Over 600 respondents completed the pilot survey. The pilot showed that there were no major issues with the questionnaire, other survey-related materials or with the method of contacting the respondents. After the pilot, minor changes were made to the survey instrument.
56 2010 Australian National Infant Feeding Survey: Indicator results
Responses are based on mother’s/carer’s recall of infant feeding practices without reference to written records. As such, the prevalence estimates may overestimate or underestimate actual breastfeeding rates.
Limitations of the data
As with all self-reported survey data, the major limitation is that the estimates are based on recall of infant feeding practices. Poor memory, misunderstanding of the question or intentional deception can all contribute to inaccuracies in the data. Further, although the sample size was reasonable for the national level, any estimates for subpopulations are based on a smaller sample size and are less precise.
Since the survey used the Medicare Australia enrolment database, children who were not enrolled at the time of sample selection date were excluded from the survey. Further, Medicare Australia performed an activity test, and only those children who had at least one Medicare service or Australian Childhood Immunisation Register episode in the previous 12 months (including enrolment) were included in the survey.
Access to the survey data The de-identified survey data can be obtained from the Australian Social Science Data Archive (ASSDA), Australian National University.
Australian National Infant Feeding Survey: Indicator results 57
Glossary
Any breastfeeding: The child receives some breastmilk but can also receive any food or liquid including non-human milk.
Breastfeeding duration: The total length of time a child receives any breastmilk from initiation through until weaning is complete.
Breastmilk: Human milk and colostrum (including expressed breastmilk and breastmilk from a donor or donor milk bank).
Breastmilk substitute: Any milk (other than breastmilk), or food-based fluid used in infant feeding as a replacement for breastmilk, whether or not it is suitable for that purpose (commonly includes infant formula, cow’s milk, and other milks fed to infants).
Complementary feeding (partial breastfeeding): The child receives both breastmilk and any other fluid or food (this may include any food or liquid including non-human milk).
Complementary foods: Any nutrient-containing foods or liquids (other than breastmilk) given to children who are receiving breastmilk.
Current practices: Respondents are asked about very recent infant feeding practices, usually in the previous 24 hours. Compare with Retrospective (recalled) practices.
Dummy: (also known as a pacifier or soother): An artificial teat typically made of rubber or silicone, on which the child sucks for comfort.
Ever breastfed: An infant has been put to the breast, if only once, and/or an infant has received expressed breastmilk or breastmilk from a donor or donor milk bank.
Exclusive breastfeeding: An infant receives only breastmilk from their mother or a wet nurse, or expressed breastmilk, and no other liquids or solids with the exception of drops or syrups consisting of vitamins, mineral supplements or medicines including oral rehydration solutions.
Fully breastfed: See Predominant breastfeeding.
Indicator: An indicator is used to describe a specific and measurable statistical construct for monitoring progress towards a goal (a broad statement of desired improvement).
Infant: Refers to a child less than 12 month of age. In this report, the term ‘children’ includes infants.
Initiation: The infant was introduced to breastmilk at some point. For initiation to exclusive breastfeeding, the infant’s first feed has to be breastmilk, colostrum, expressed breastmilk or breastmilk from a donor or donor milk bank.
Multiparous: A woman who has given birth more than once.
Pacifier: See Dummy.
Parity: The classification of a woman by the number of times she has given birth (see Primiparous and Multiparous).
Primiparous: A woman who has given birth once.
58 2010 Australian National Infant Feeding Survey: Indicator results
Predominant breastfeeding: An infant’s predominant source of nourishment is breastmilk but the infant may also receive water and water-based drinks (sweetened and flavoured water, teas, infusions etc.); fruit juice; oral rehydration solutions (ORSs); drop and syrup forms of vitamins, minerals and medicines; and ritual fluids (in limited quantities). All other food-based fluids are excluded, in particular non-human milk.
Remoteness: Geographical remoteness in this report is classified according to the Australian Standard Geographical Classification Remoteness Areas, developed by the ABS to allow quantitative comparisons between ‘city’ and ‘country’ Australia.
Retrospective (recalled) practices: Practices measured retrospectively; that is, respondents are asked to recall and report their behaviours that may be in the past.
SEIFA: Socio-Economic Indexes for Areas (SEIFAs) are categories that summarise the socioeconomic conditions of an area. They are derived by the Australian Bureau of Statistics (ABS) from the 2006 population Census.
Soft, semi-solid or solid foods: Any nutrient-containing foods (soft/semi-solid/solid); for example, dilute infant cereals. Does not include breastmilk or breastmilk substitutes, fruit and vegetable juices, sugar water etc.
Weaning: The period during which children are introduced to breastmilk substitutes and/or solid foods with the intention of replacing some or all of the breastmilk in the diet.
Australian National Infant Feeding Survey: Indicator results 59
References
AHMC (Australian Health Ministers’ Conference) 2009. The Australian National Breastfeeding Strategy 2010–2015. Canberra: Australian Government Department of Health and Ageing.
AIFS (Australian Institute of Family Studies) 2008. Growing up in Australia: The Longitudinal Study of Australian Children, annual report 2006–07. Viewed 19 October 2011, <http://www.aifs.gov.au/growingup/pubs/ar/ar200607/breastfeeding.html>.
AIHW (Australian Institute of Health and Welfare) 2011a. Headline indicators for children’s health, development and wellbeing, 2011. Cat. no. PHE 144. Canberra: AIHW.
AIHW 2011b. National breastfeeding indicators: workshop report. Cat. no. PHE 146. Canberra: AIHW.
CDC (Centers for Disease Control and Prevention) 2011. Breastfeeding report card—United States. Viewed 19 October 2011, <http://www.cdc.gov/breastfeeding/data/NIS_data/survey_methods.htm>.
DHS (Department of Human Services Victoria) 2006. National headline indicators for children’s health, development and wellbeing (report), June 2006. Melbourne: DHS.
Hector D. 2008. Review and update of the breastfeeding indicators contained in the report: Towards a national system for monitoring breastfeeding in Australia: recommendations for population indicators, definitions and next steps by Webb et al. 2001. Unpublished report commissioned by the Australian Government Department of Health and Ageing, 2008.
NHMRC (National Health and Medical Research Council) 2003. Dietary guidelines for children and adolescents in Australia incorporating the infant feeding guidelines for health workers. Canberra: NHMRC.
Webb K, Marks GC, Lund-Adams M, Rutishauser IHE & Abraham B 2001. Towards a national system for monitoring breastfeeding in Australia: recommendations for population indicators, definitions and next steps. Canberra: Commonwealth Department of Health and Aged Care.
WHO (World Health Organization) 2008. Indicators for assessing infant and young child feeding practices—part 1: definitions: conclusions of a consensus meeting held 6–8 November 2007 in Washington DC, USA. Viewed 19 October 2011, <http://www.who.int/nutrition/publications/infantfeeding/9789241596664/en/index.html>. Last accessed 19 October 2011.
60 2010 Australian National Infant Feeding Survey: Indicator results
List of tables
Table 1.1: Definitions of selected infant feeding practices ............................................................................ 4
Figure 1.2: Length of time exclusively breastfed ........................................................................................... 5
Table 2.1: Proportion of children receiving any breastmilk, by age ............................................................ 7
Figure 2.1: Proportion of children receiving any breastmilk, by age .......................................................... 8
Table 2.2: Proportion of children exclusively breastfed to each month of age .......................................... 9
Table 2.3: Proportion of children predominantly breastfed to each month of age ................................. 10
Table 2.4: Proportion of children who had received soft/semi-solid/solid food in the last 24 hours, by current age ................................................................................................................... 11
Figure 2.4: Proportion of children who had received soft/semi-solid/solid food in the last 24 hours, by current age ................................................................................................................... 11
Table 2.5: Proportion of children who had received formula or non-human milk in the last 24 hours, by current age ................................................................................................................... 12
Table 3.1: Proportion of children ever breastfed, by mother’s/carer’s sociodemographic characteristics ................................................................................................................................ 15
Table 3.2: Proportion of children ever breastfed, by area-level characteristics ....................................... 16
Table 3.3: Proportion of children ever breastfed, by select characteristics of mother/carer and child ................................................................................................................................................ 17
Table 3.4: Proportion of children currently breastfed, by current age of child, mother’s/carer’s sociodemographic characteristics (per cent) ............................................................................. 19
Table 3.5: Proportion of children currently breastfed, by current age of child, area-level characteristics (per cent) .............................................................................................................. 20
Table 3.6: Proportion of children currently breastfed, by current age of child, select characteristics of mother/carer and child (per cent) ............................................................... 21
Table 3.7: Duration of exclusive breastfeeding (to each month of age), by mother’s/carer’s sociodemographic characteristics (per cent) ............................................................................. 23
Table 3.8: Duration of exclusive breastfeeding (to each month of age), by area-level characteristics (per cent) .............................................................................................................. 24
Table 3.9: Duration of exclusive breastfeeding (to each month of age), by select characteristics of mother/carer and child (per cent).............................................................................................. 25
Table 3.10: Duration of predominant breastfeeding (to each month of age), by mother’s/carer’s sociodemographic characteristics (per cent) ............................................................................. 27
Table 3.11: Duration of predominant breastfeeding (to each month of age), by area-level characteristics (per cent) .............................................................................................................. 28
Table 3.12: Duration of predominant breastfeeding (to each month of age), by select characteristics of mother/carer and child (per cent) ............................................................... 29
Table 3.13: Proportion of children who were introduced to soft/semi-solid/solid food, by month of age and mother’s/carer’s sociodemographic characteristics (per cent) .............. 31
Table 3.14: Proportion of children who were introduced to soft/semi-solid/solid food, by month of age and area-level characteristics (per cent) ............................................................ 32
Australian National Infant Feeding Survey: Indicator results 61
Table 3.15: Proportion of children who were introduced to soft/semi-solid/solid food, by month of age and select characteristics of mother/carer and child (per cent) ..................... 33
Table 3.16: Proportion of children introduced to non-human milk or formula, by month of age and mother’s/carer’s sociodemographic characteristics (per cent) ....................................... 35
Table 3.17: Proportion of children who were introduced to non-human milk or formula, by month of age and area-level characteristics (per cent) ............................................................ 36
Table 3.18: Proportion of children who were introduced to non-human milk or formula, by month of age and select characteristics of mother/carer and child (per cent) ..................... 37
Table 4.1: Mother’s/carer’s reasons for giving child breastmilk (per cent) ............................................. 38
Table 4.2: Mother’s/carer’s reasons for not continuing to give child breastmilk (per cent) .................. 39
Table 4.3: Mother’s/carer’s reasons for not giving child breastmilk (per cent) ...................................... 39
Table 4.4: Time since birth of child to skin-to-skin contact (per cent) ....................................................... 40
Table 4.5: Early breastfeeding encouragement by health professionals (per cent) ................................. 41
Table 4.6: Prior intention to feed the child (per cent) .................................................................................. 41
Table 4.7: Mother’s/carer’s perception of partner’s preference on how their child should be fed (per cent) ........................................................................................................................................ 42
Table A1: Population, by age of child and state/territory (from the Medicare enrolment database, 2010) (number)............................................................................................................. 46
Table A2: Sample distribution, by age of child and state/territory (number) ......................................... 47
Table A3: Respondents, by age of child (at time of sample) and state/territory (number) ................... 48
Table A4: Characteristics of the survey respondents .................................................................................. 50
Table A5: Response proportions by SEIFA decile (per cent) ...................................................................... 51
Table A6: Response proportions by remoteness (per cent) ........................................................................ 51
62 2010 Australian National Infant Feeding Survey: Indicator results
List of figures
Figure 1.1: Illustration of different age concepts used in this report .......................................................... 4
Figure 1.2: Length of time exclusively breastfed ........................................................................................... 5
Figure 2.1: Proportion of children receiving any breastmilk, by age .......................................................... 8
Figure 2.2: Proportion of children exclusively breastfed to each month of age ........................................ 9
Figure 2.3: Proportion of children exclusively breastfed to each month of age ...................................... 10
Figure 2.4: Proportion of children who had received soft/semi-solid/solid food in the last 24 hours, by current age ................................................................................................................... 11
Figure 2.5: Proportion of children who had received formula or non-human milk in the last 24 hours, by current age ................................................................................................................... 13
Australian National Infant Feeding Survey: Indicator results 63
Related publications
The following AIHW publications relating to children, youth and families might also be of interest:
• AIHW (Australian Institute of Health and Welfare) 2010. Health and wellbeing of young Australians: indicator framework and key national indicators. Bulletin no. 77. Cat. no. AUS 123. Canberra: AIHW.
• AIHW 2011. Headline indicators for children’s health, development and wellbeing. Cat. no. PHE 144. Canberra: AIHW.