2010 ASSESSMENT Chapter 3.4 Emerging Markets for...
23
193 Assessments should identify forest landscape areas where there is a real, near term potential to access and supply traditional, non-timber, and/or emerging markets such as those for biomass or ecosys- tem services. These might be areas where necessary infrastructure currently exists, is planned or developing, where group certification of landowners has created market supply aggregation poten- tial, or where retention and management of forest cover presents a money saving alternative to an engineered fix – such as a water filtration facility. Strengthening and developing new market oppor- tunities for forest products and benefits provide incentives for forest stewardship and conservation (excerpted from the U.S. Forest Service State and Private Forestry Farm Bill Requirement and Rede- sign Strategies). KEY FINDINGS Emerging markets for renewable energy, ecosystem services and niche products are impacting how forest and rangelands are managed. Developing appropriate policies re- quires a better understanding of the benefits and environmental impacts of these emerg- ing markets and how society values the various market and non-market products and services provided by forests and rangelands. Renewable Energy Overview y In the Mojave and Colorado Desert bioregions the number and size of proposed solar and wind power generation sites has engendered controversy over potential impacts to wildlife habitat. The science-driven Desert Renewable Energy Con- servation Plan is intended to become the state road map for renewable energy project development that will advance state and federal conservation goals while Chapter 3.4 Emerging Markets for Forest and Rangeland Products and Services
Transcript of 2010 ASSESSMENT Chapter 3.4 Emerging Markets for...
193
2010 ASSESSMENT Chapter 3.4 Emerging Markets for Forest and Rangeland Products and Services
Assessments should identify forest landscape areas where there is a real, near term potential to access and supply traditional, non-timber, and/or emerging markets such as those for biomass or ecosys-tem services. These might be areas where necessary infrastructure currently exists, is planned or developing, where group certification of landowners has created market supply aggregation poten-tial, or where retention and management of forest cover presents a money saving alternative to an engineered fix – such as a water filtration facility. Strengthening and developing new market oppor-tunities for forest products and benefits provide incentives for forest stewardship and conservation (excerpted from the U.S. Forest Service State and Private Forestry Farm Bill Requirement and Rede-sign Strategies).
KEY FINDINGS
Emerging markets for renewable energy, ecosystem services and niche products are
impacting how forest and rangelands are managed. Developing appropriate policies re-
quires a better understanding of the benefits and environmental impacts of these emerg-
ing markets and how society values the various market and non-market products and
services provided by forests and rangelands.
Renewable Energy Overview y In the Mojave and Colorado Desert bioregions the number and size of proposed
solar and wind power generation sites has engendered controversy over potential
impacts to wildlife habitat. The science-driven Desert Renewable Energy Con-
servation Plan is intended to become the state road map for renewable energy project development that will advance state and federal conservation goals while
Chapter 3.4Emerging Markets for Forest and Rangeland Products and Services

California’s Forests and Rangelands: 2010 ASSESSMENT
194
facilitating the timely permitting of renewable energy projects in these desert regions.
Biomass Energy – Current Status and Trends y Biomass energy from forestlands provides about one percent of California’s electricity, while having the
potential to provide nearly eight times this amount. Biomass also has unutilized potential for heating
homes, businesses and schools and for conversion to liquid transportation fuels (as conversion technol-
ogy evolves).
y Capturing energy from biomass that would otherwise decay, be disposed of by pile and burn or poten-
tially consumed by wildfire, provides numerous economic and environmental benefits, which are not
captured as an actual economic return for operators of facilities that utilize woody biomass material.
Case studies confirm that fuels treatment activities involving biomass removal can mitigate wildfire
behavior (Cone Fire, 2002).
y The various benefits and environmental impacts of forest biomass removal are complex and further
research is required to guide appropriate policies and practices. Questions of long-term biomass supply
(especially from public lands), as well as possible ecological and other impacts of biomass removal on
forest sustainability, are key issues in California.
y The future of the biomass energy industry in California, at least as it relates to the forestry sector, is
uncertain. California had 49 operating biomass plants in the mid-1990s; today there are 33.
y The California Energy Commission, working through the Bioenergy Interagency Working Group, has
produced a comprehensive strategy for sustainable development of biomass in the state. The first Bio-
energy Action Plan was released in 2006, and the goal is to adopt an updated plan by the end of 2010.
Biomass Energy – Ecosystem Health AnalysisBenefits of making six idle and six proposed biomass facilities operational are derived in terms of treating
priority landscapes for ecosystem health from the wildfire and forest pests analyses articulated in previous
chapters.
y Currently, 22 percent of high priority landscapes are within 25 miles of an operational biomass facility.
Adding 12 facilities would increase this number to 39 percent, and would primarily benefit the Klam-
ath/North Coast, Modoc and Sierra bioregions.
y Even with the additional facilities, 61 percent of high priority landscapes are farther than 25 miles from
a facility. Since 57 percent of the high priority landscapes are on U.S. Forest Service lands, coordination
across agency boundaries will be critical.
Biomass Energy – Community Safety AnalysisBuilding upon the wildfire and forest pests community safety analyses presented in previous chapters, this
analysis determines the benefits of making six idle and six proposed biomass facilities operational in terms of
treating priority communities.
y Currently, only 14 of the 66 priority communities are within 25 miles of an operational biomass facil-
ity. Adding the new facilities would reach eleven additional priority communities. Of the remaining 41
priority communities, 31 are in the South Coast bioregion.

195
2010 ASSESSMENT Chapter 3.4 Emerging Markets for Forest and Rangeland Products and Services
y Developing a biomass industry in the South Coast bioregion that addresses the significant wildfire and
forest pest threats will be challenging. In the bioregion, there are large acreages in shrub species that
are difficult to recover and utilize as biomass, and much of the forestland is in public ownership.
Carbon y Carbon sequestration is an ecosystem service for which markets are emerging; as part of these markets,
the value of the service is quantified, prices determined and dollars generated for carbon credits.
y Markets are emerging for both voluntary exchange between parties (voluntary markets) and in response
to the need to reduce carbon impacts as part of regulatory requirements (compliance markets).
y Demand for forest and range-related carbon is projected to be very significant in such markets and
other venues.
y Carbon credit supply is constrained by economics, risk and other factors. It is estimated that one to two
million metric tons a year will be available to the compliance market from California forests, which is
only 10–25 percent of demand.
y Protocols already have been developed for forest and range-related carbon. The development of ad-
ditional project type protocols for forests and rangelands could promote activities with ecological and
economic co-benefits and increase the supply of carbon credits.
y California has large acreages of forest stands that with additional investment, could provide larger, fu-
ture benefits in terms of forest products, jobs and carbon storage and sequestration. Opportunities also
exist on rangeland, but the markets and necessary technologies to capture carbon are not sufficiently
developed to quantify these opportunities.
Niche Markets y There is potential for niche markets to stimulate rural economies through certified products, micro-bio-
mass or landowner collaboratives to produce and market timber using small scale or portable milling
technologies.
Ecosystem Services y In many cases, market mechanisms for exchange of values from ecosystem services in California are
still limited. Despite this, substantial investments have been made in the state that support ecosystem
services. Typically, these investments involve protecting areas that provide unique or high levels of de-
sired services, or restoring areas impacted by past events.
y These investments come through a variety of programs, agencies and stakeholders. Involvement of
landowners and the development of partnerships and cooperation have been key factors. To a large
degree, the underlying funding comes from public sources, such as ballot initiatives or agency budgets.
Augmenting this with emerging market-based solutions could enhance the ability to sustain these im-
portant services into the future.
California’s Forests and Rangelands: 2010 ASSESSMENT
196
RENEWABLE ENERGY OVERVIEWCurrent Status and TrendsThrough legislation and executive orders, California has focused on increasing use and development of re-newable energy. For example, one of the goals of the Renewables Portfolio Standard (RPS) (SB 107, 2006 and SB 1078, 2002) is to help reduce greenhouse gas (GHG) emissions. Another example is AB 32 which, in large part, is devoted to GHG reduction.
Related executive orders include:
y Executive Order S-06-06 (2006): established a biomass target of 20 percent within the estab-lished RPS goals for 2010 and 2020.
y Executive Order S-14-08 (2008): established accelerated RPS targets (33 percent by 2020) as recommended in the Energy Action Plan II. The order also called for the formation of the Renewable Energy Action Team, comprised of the California Energy Commission (CEC), Department of Fish and Game, U.S. Bureau of Land Management and U.S. Fish and Wildlife Service. Through the team, the Energy Com-mission and the Department of Fish and Game are to prepare a plan for renewable develop-ment in sensitive desert habitat.
y Executive Order S-21-09 (2009): directs the Air Resources Board (ARB) to work with the California Public Utilities Commission, the California Independent System Operator, and the Energy Commission to adopt regulations increasing California’s RPS to 33 percent by 2020. The ARB must adopt these regulations by July 31, 2010.
The Air Resources Board’s Scoping Plan points to achieving the RPS and 33 percent renewable as a key strategy for reducing greenhouse gases. The Califor-nia Public Utilities Commission, California Energy Commission and Governor Schwarzenegger have sanctioned the Energy Action Plan, requiring that renewable energy sources increase to 33 percent of the state supply by 2020.
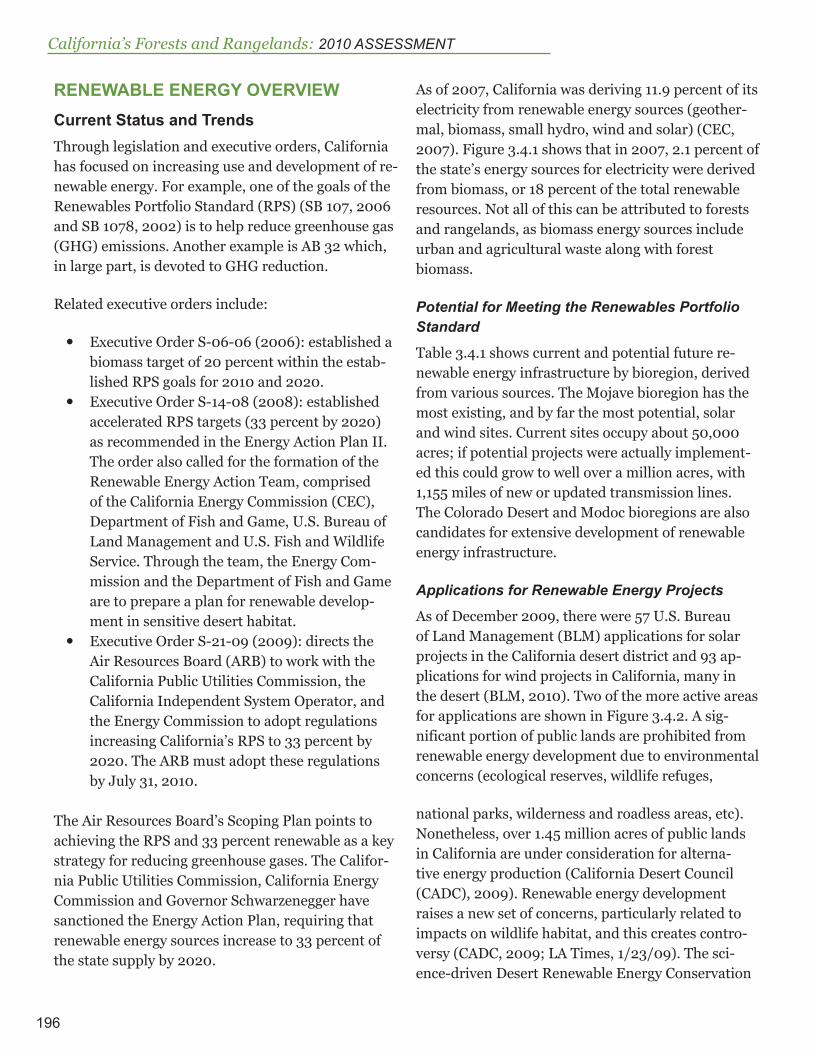
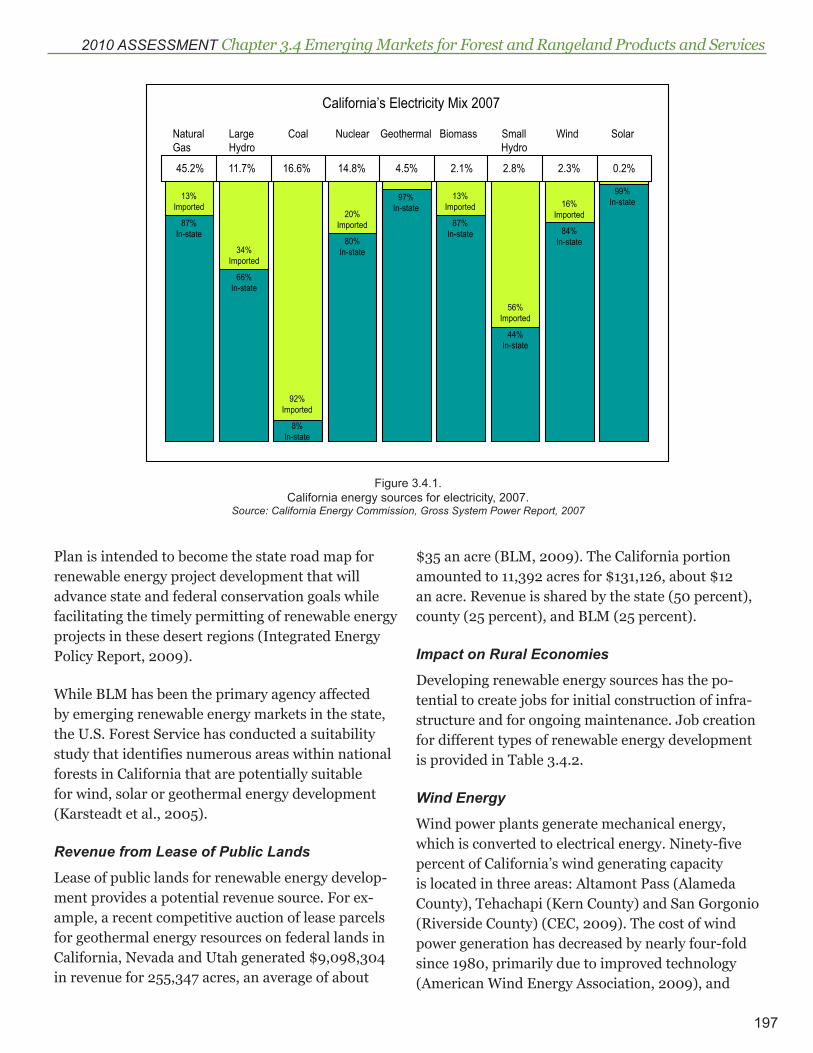
As of 2007, California was deriving 11.9 percent of its electricity from renewable energy sources (geother-mal, biomass, small hydro, wind and solar) (CEC, 2007). Figure 3.4.1 shows that in 2007, 2.1 percent of the state’s energy sources for electricity were derived from biomass, or 18 percent of the total renewable resources. Not all of this can be attributed to forests and rangelands, as biomass energy sources include urban and agricultural waste along with forest biomass.
Potential for Meeting the Renewables Portfolio Standard
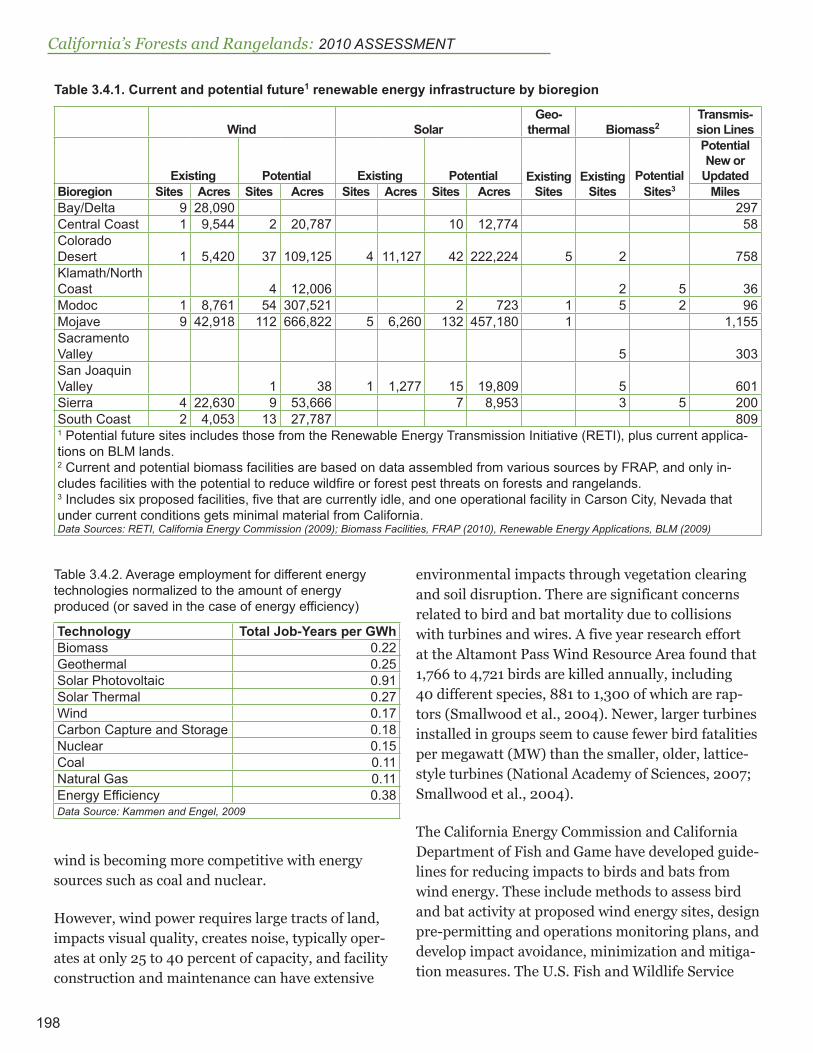
Table 3.4.1 shows current and potential future re-newable energy infrastructure by bioregion, derived from various sources. The Mojave bioregion has the most existing, and by far the most potential, solar and wind sites. Current sites occupy about 50,000 acres; if potential projects were actually implement-ed this could grow to well over a million acres, with 1,155 miles of new or updated transmission lines. The Colorado Desert and Modoc bioregions are also candidates for extensive development of renewable energy infrastructure.
Applications for Renewable Energy Projects
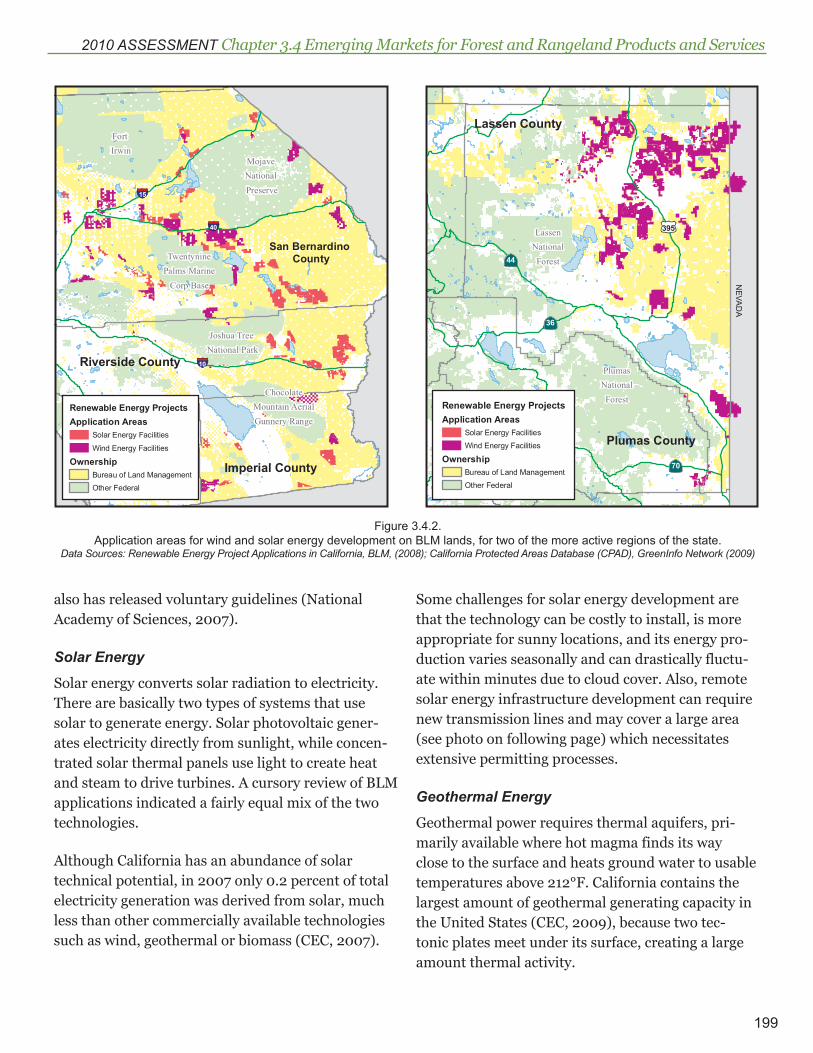
As of December 2009, there were 57 U.S. Bureau of Land Management (BLM) applications for solar projects in the California desert district and 93 ap-plications for wind projects in California, many in the desert (BLM, 2010). Two of the more active areas for applications are shown in Figure 3.4.2. A sig-nificant portion of public lands are prohibited from renewable energy development due to environmental concerns (ecological reserves, wildlife refuges,
national parks, wilderness and roadless areas, etc). Nonetheless, over 1.45 million acres of public lands in California are under consideration for alterna-tive energy production (California Desert Council (CADC), 2009). Renewable energy development raises a new set of concerns, particularly related to impacts on wildlife habitat, and this creates contro-versy (CADC, 2009; LA Times, 1/23/09). The sci-ence-driven Desert Renewable Energy Conservation
197
2010 ASSESSMENT Chapter 3.4 Emerging Markets for Forest and Rangeland Products and Services
Plan is intended to become the state road map for renewable energy project development that will advance state and federal conservation goals while facilitating the timely permitting of renewable energy projects in these desert regions (Integrated Energy Policy Report, 2009).
While BLM has been the primary agency affected by emerging renewable energy markets in the state, the U.S. Forest Service has conducted a suitability study that identifies numerous areas within national forests in California that are potentially suitable for wind, solar or geothermal energy development (Karsteadt et al., 2005).
Revenue from Lease of Public Lands
Lease of public lands for renewable energy develop-ment provides a potential revenue source. For ex-ample, a recent competitive auction of lease parcels for geothermal energy resources on federal lands in California, Nevada and Utah generated $9,098,304 in revenue for 255,347 acres, an average of about
$35 an acre (BLM, 2009). The California portion amounted to 11,392 acres for $131,126, about $12 an acre. Revenue is shared by the state (50 percent), county (25 percent), and BLM (25 percent).
Impact on Rural Economies
Developing renewable energy sources has the po-tential to create jobs for initial construction of infra-structure and for ongoing maintenance. Job creation for different types of renewable energy development is provided in Table 3.4.2.
Wind Energy
Wind power plants generate mechanical energy, which is converted to electrical energy. Ninety-five percent of California’s wind generating capacity is located in three areas: Altamont Pass (Alameda County), Tehachapi (Kern County) and San Gorgonio (Riverside County) (CEC, 2009). The cost of wind power generation has decreased by nearly four-fold since 1980, primarily due to improved technology (American Wind Energy Association, 2009), and
California’s Electricity Mix 2007
Natural Large Coal Nuclear Geothermal Biomass Small Wind Solar Gas Hydro Hydro
45.2% 11.7% 16.6% 14.8% 4.5% 2.1% 2.8% 2.3% 0.2%
13%Imported
87%In-state
34%Imported
66%In-state
92%Imported
8%In-state
20%Imported
80%In-state
97%In-state
13%Imported
87%In-state
56%Imported
44%In-state
16%Imported
84%In-state
99%In-state
Figure 3.4.1. California energy sources for electricity, 2007.
Source: California Energy Commission, Gross System Power Report, 2007
California’s Forests and Rangelands: 2010 ASSESSMENT
198
wind is becoming more competitive with energy sources such as coal and nuclear.
However, wind power requires large tracts of land, impacts visual quality, creates noise, typically oper-ates at only 25 to 40 percent of capacity, and facility construction and maintenance can have extensive
environmental impacts through vegetation clearing and soil disruption. There are significant concerns related to bird and bat mortality due to collisions with turbines and wires. A five year research effort at the Altamont Pass Wind Resource Area found that 1,766 to 4,721 birds are killed annually, including 40 different species, 881 to 1,300 of which are rap-tors (Smallwood et al., 2004). Newer, larger turbines installed in groups seem to cause fewer bird fatalities per megawatt (MW) than the smaller, older, lattice-style turbines (National Academy of Sciences, 2007; Smallwood et al., 2004).
The California Energy Commission and California Department of Fish and Game have developed guide-lines for reducing impacts to birds and bats from wind energy. These include methods to assess bird and bat activity at proposed wind energy sites, design pre-permitting and operations monitoring plans, and develop impact avoidance, minimization and mitiga-tion measures. The U.S. Fish and Wildlife Service
Table 3.4.2. Average employment for different energy technologies normalized to the amount of energy produced (or saved in the case of energy efficiency)
Technology Total Job-Years per GWhBiomass 0.22Geothermal 0.25Solar Photovoltaic 0.91Solar Thermal 0.27Wind 0.17Carbon Capture and Storage 0.18Nuclear 0.15Coal 0.11Natural Gas 0.11Energy Efficiency 0.38Data Source: Kammen and Engel, 2009
Table 3.4.1. Current and potential future1 renewable energy infrastructure by bioregion
Wind SolarGeo-
thermal Biomass2Transmis-sion Lines
Existing Potential Existing Potential ExistingSites
ExistingSites
PotentialSites3
Potential New or
UpdatedBioregion Sites Acres Sites Acres Sites Acres Sites Acres MilesBay/Delta 9 28,090 297Central Coast 1 9,544 2 20,787 10 12,774 58Colorado Desert 1 5,420 37 109,125 4 11,127 42 222,224 5 2 758Klamath/North Coast 4 12,006 2 5 36Modoc 1 8,761 54 307,521 2 723 1 5 2 96Mojave 9 42,918 112 666,822 5 6,260 132 457,180 1 1,155Sacramento Valley 5 303San Joaquin Valley 1 38 1 1,277 15 19,809 5 601Sierra 4 22,630 9 53,666 7 8,953 3 5 200South Coast 2 4,053 13 27,787 8091 Potential future sites includes those from the Renewable Energy Transmission Initiative (RETI), plus current applica-tions on BLM lands. 2 Current and potential biomass facilities are based on data assembled from various sources by FRAP, and only in-cludes facilities with the potential to reduce wildfire or forest pest threats on forests and rangelands. 3 Includes six proposed facilities, five that are currently idle, and one operational facility in Carson City, Nevada that under current conditions gets minimal material from California.Data Sources: RETI, California Energy Commission (2009); Biomass Facilities, FRAP (2010), Renewable Energy Applications, BLM (2009)
199
2010 ASSESSMENT Chapter 3.4 Emerging Markets for Forest and Rangeland Products and Services
also has released voluntary guidelines (National Academy of Sciences, 2007).
Solar Energy
Solar energy converts solar radiation to electricity. There are basically two types of systems that use solar to generate energy. Solar photovoltaic gener-ates electricity directly from sunlight, while concen-trated solar thermal panels use light to create heat and steam to drive turbines. A cursory review of BLM applications indicated a fairly equal mix of the two technologies.
Although California has an abundance of solar technical potential, in 2007 only 0.2 percent of total electricity generation was derived from solar, much less than other commercially available technologies such as wind, geothermal or biomass (CEC, 2007).
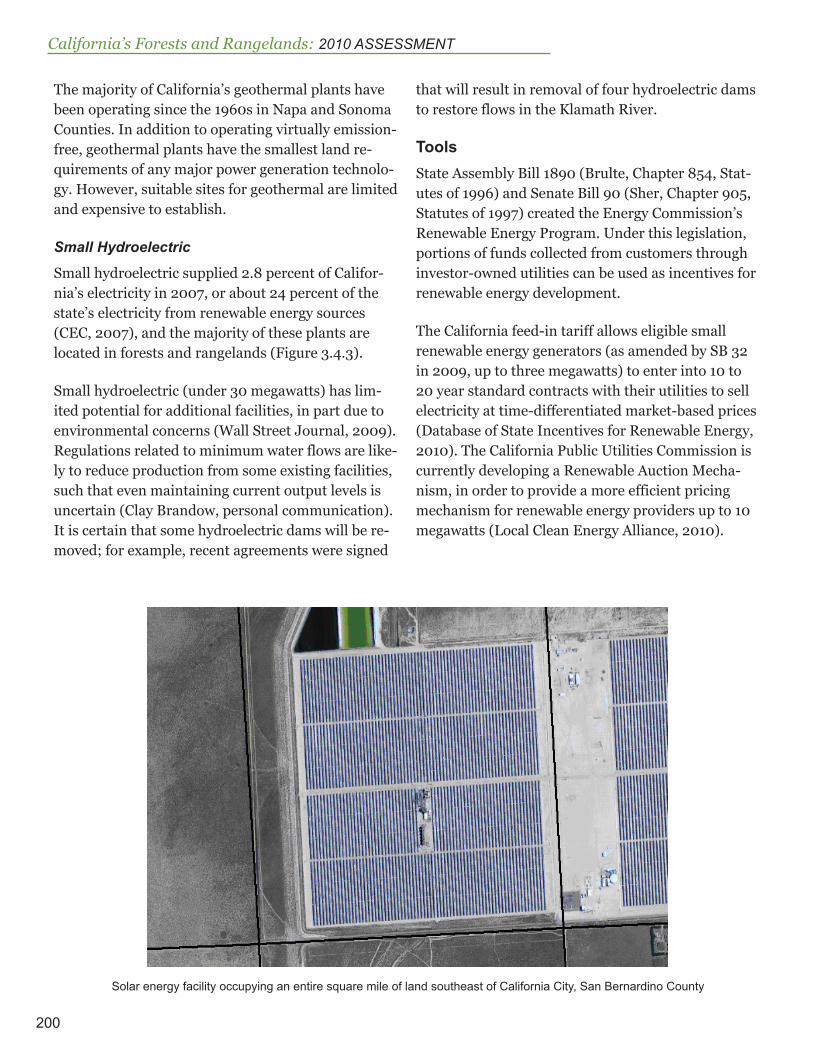
Some challenges for solar energy development are that the technology can be costly to install, is more appropriate for sunny locations, and its energy pro-duction varies seasonally and can drastically fluctu-ate within minutes due to cloud cover. Also, remote solar energy infrastructure development can require new transmission lines and may cover a large area (see photo on following page) which necessitates extensive permitting processes.
Geothermal Energy
Geothermal power requires thermal aquifers, pri-marily available where hot magma finds its way close to the surface and heats ground water to usable temperatures above 212°F. California contains the largest amount of geothermal generating capacity in the United States (CEC, 2009), because two tec-tonic plates meet under its surface, creating a large amount thermal activity.
NEVA
DA
Lassen County
Plumas County·|}70
·|}44
·|}89
·|}36
·|}70
£¤395
Renewable Energy ProjectsApplication Areas
Solar Energy Facilities
Wind Energy Facilities
OwnershipBureau of Land Management
Other Federal
LassenNationalForest
PlumasNationalForest
San Bernardino County
Riverside County
Imperial CountySan Diego County
§̈¦40
§̈¦10
§̈¦15
§̈¦15Renewable Energy ProjectsApplication Areas
Solar Energy Facilities
Wind Energy Facilities
OwnershipBureau of Land Management
Other Federal
Mojave National Preserve
Fort Irwin
TwentyninePalms Marine
Corp Base
ChocolateMountain AerialGunnery Range
Joshua Tree National Park
Figure 3.4.2. Application areas for wind and solar energy development on BLM lands, for two of the more active regions of the state.
Data Sources: Renewable Energy Project Applications in California, BLM, (2008); California Protected Areas Database (CPAD), GreenInfo Network (2009)
California’s Forests and Rangelands: 2010 ASSESSMENT
200
The majority of California’s geothermal plants have been operating since the 1960s in Napa and Sonoma Counties. In addition to operating virtually emission-free, geothermal plants have the smallest land re-quirements of any major power generation technolo-gy. However, suitable sites for geothermal are limited and expensive to establish.
Small Hydroelectric
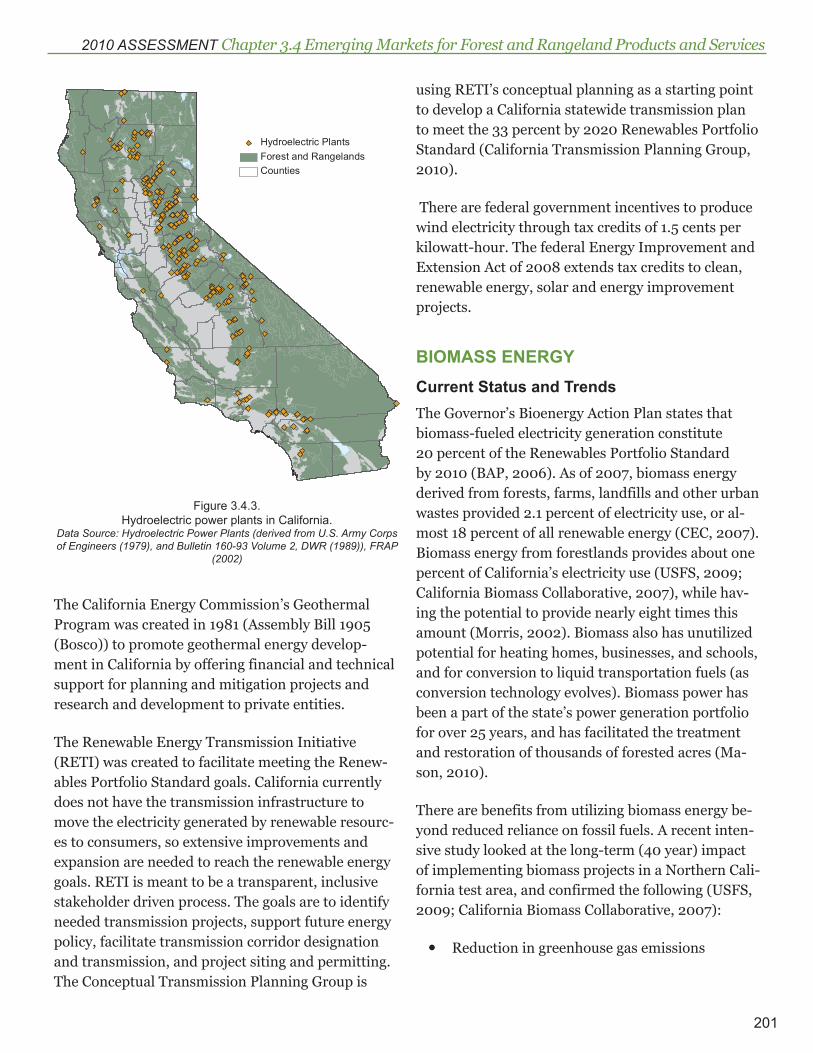
Small hydroelectric supplied 2.8 percent of Califor-nia’s electricity in 2007, or about 24 percent of the state’s electricity from renewable energy sources (CEC, 2007), and the majority of these plants are located in forests and rangelands (Figure 3.4.3).
Small hydroelectric (under 30 megawatts) has lim-ited potential for additional facilities, in part due to environmental concerns (Wall Street Journal, 2009). Regulations related to minimum water flows are like-ly to reduce production from some existing facilities, such that even maintaining current output levels is uncertain (Clay Brandow, personal communication). It is certain that some hydroelectric dams will be re-moved; for example, recent agreements were signed
that will result in removal of four hydroelectric dams to restore flows in the Klamath River.
ToolsState Assembly Bill 1890 (Brulte, Chapter 854, Stat-utes of 1996) and Senate Bill 90 (Sher, Chapter 905, Statutes of 1997) created the Energy Commission’s Renewable Energy Program. Under this legislation, portions of funds collected from customers through investor-owned utilities can be used as incentives for renewable energy development.
The California feed-in tariff allows eligible small renewable energy generators (as amended by SB 32 in 2009, up to three megawatts) to enter into 10 to 20 year standard contracts with their utilities to sell electricity at time-differentiated market-based prices (Database of State Incentives for Renewable Energy, 2010). The California Public Utilities Commission is currently developing a Renewable Auction Mecha-nism, in order to provide a more efficient pricing mechanism for renewable energy providers up to 10 megawatts (Local Clean Energy Alliance, 2010).
Solar energy facility occupying an entire square mile of land southeast of California City, San Bernardino County
201
2010 ASSESSMENT Chapter 3.4 Emerging Markets for Forest and Rangeland Products and Services
The California Energy Commission’s Geothermal Program was created in 1981 (Assembly Bill 1905 (Bosco)) to promote geothermal energy develop-ment in California by offering financial and technical support for planning and mitigation projects and research and development to private entities.
The Renewable Energy Transmission Initiative (RETI) was created to facilitate meeting the Renew-ables Portfolio Standard goals. California currently does not have the transmission infrastructure to move the electricity generated by renewable resourc-es to consumers, so extensive improvements and expansion are needed to reach the renewable energy goals. RETI is meant to be a transparent, inclusive stakeholder driven process. The goals are to identify needed transmission projects, support future energy policy, facilitate transmission corridor designation and transmission, and project siting and permitting. The Conceptual Transmission Planning Group is
using RETI’s conceptual planning as a starting point to develop a California statewide transmission plan to meet the 33 percent by 2020 Renewables Portfolio Standard (California Transmission Planning Group, 2010).
There are federal government incentives to produce wind electricity through tax credits of 1.5 cents per kilowatt-hour. The federal Energy Improvement and Extension Act of 2008 extends tax credits to clean, renewable energy, solar and energy improvement projects.
BIOMASS ENERGYCurrent Status and TrendsThe Governor’s Bioenergy Action Plan states that biomass-fueled electricity generation constitute 20 percent of the Renewables Portfolio Standard by 2010 (BAP, 2006). As of 2007, biomass energy derived from forests, farms, landfills and other urban wastes provided 2.1 percent of electricity use, or al-most 18 percent of all renewable energy (CEC, 2007). Biomass energy from forestlands provides about one percent of California’s electricity use (USFS, 2009; California Biomass Collaborative, 2007), while hav-ing the potential to provide nearly eight times this amount (Morris, 2002). Biomass also has unutilized potential for heating homes, businesses, and schools, and for conversion to liquid transportation fuels (as conversion technology evolves). Biomass power has been a part of the state’s power generation portfolio for over 25 years, and has facilitated the treatment and restoration of thousands of forested acres (Ma-son, 2010).
There are benefits from utilizing biomass energy be-yond reduced reliance on fossil fuels. A recent inten-sive study looked at the long-term (40 year) impact of implementing biomass projects in a Northern Cali-fornia test area, and confirmed the following (USFS, 2009; California Biomass Collaborative, 2007):
y Reduction in greenhouse gas emissions
#
#
###
##
#
# ####
####
####
##
####
####
#
#
#
#
#
####
#
#
# ### ### ##
###
#
#####
#
##
###
#
##
####
#
####
#
#
#
#
##
#
#
# #
#
#
#
##
#
#
#
#
#
####
#
#
##
######
#
##
#
##
##
#
#
##
##
##
# ##
#
#
#
### #
#####
##
#
#
#
#
#######
#
####
###
#
#
##
##### #
#
#
###
###
###
####
###
#
#
#
#
#
#
##
###
# ###
#
##
####
# #####
#
#
##
#
#
#
#
#
#
#
##
##
###
#
# Hydroelectric PlantsForest and RangelandsCounties
Figure 3.4.3. Hydroelectric power plants in California.
Data Source: Hydroelectric Power Plants (derived from U.S. Army Corps of Engineers (1979), and Bulletin 160-93 Volume 2, DWR (1989)), FRAP
(2002)
California’s Forests and Rangelands: 2010 ASSESSMENT
202
y Reduction in acres burned by wildfires, as well as severity of fires, with an associated reduction in damages to human infrastructure, economic values from working landscapes, and fire sup-pression costs
y Negligible impact on habitat suitability y Minimal cumulative watershed impacts
Numerous studies indicate that the societal benefits derived from biomass removal and utilization are significant (USFS, 2009; California Biomass Collab-orative, 2007). Biomass energy displaces the need to burn fossil fuels, and efficiently disposes of materi-als that would otherwise release methane emissions through decay, pile and burn disposal or wildfire (Reese, 2009). From an air quality perspective, five of six regulated emission categories are reduced by over 95 percent by burning material for biomass ver-sus in open piles or by wildfire (Reese, 2009). Case studies (Cone Fire, 2002) confirm that fuels treat-ment activities that involve biomass removal can in fact mitigate wildfire behavior. Biomass energy can create jobs in rural economies that have been depen-dent on traditional resource-based industries. A 50 megawatt (MW) biomass plant can employ about 50 people, and also generate 125 indirect jobs (Reese, 2009). A 1999 study (Morris, 1999) found that 4.9 full time jobs are created for each MW of biomass power generation capacity.
However, there are public concerns about the envi-ronmental impacts of biomass removal. The various benefits and environmental impacts of forest bio-mass removal are complex and further research is required to guide appropriate policies and practices. Questions of long term biomass supply (especially from public lands), as well as possible ecological and other impacts of biomass removal on forest sustain-ability, are key issues in California (Heinz and Pin-chot, 2010).
Other states also are challenged with balancing the need to reduce fire and forest pest risk, stimulate rural economies and expand renewable energy use while minimizing environmental impacts. Oregon passed legislation in 2005 (Oregon SB 1072) to
promote the health of forests and rural economies through active forest management. The State For-ester is directed to prepare a report every three years summarizing the effect of biomass removal on plants, wildlife, air and water, and identify changes that are necessary to encourage biomass energy use and avoid negative effects on the environment. The first report emphasized changes to insure that ad-equate downed wood and snags are left on site. The need for scientific input to help establish appropriate removal/residual policies for forest slash in thin-nings and fuel reduction treatments by forest cover type, and continuing to encourage logger certifica-tion programs to include woody biomass harvesting techniques training (Oregon Department of Forestry, 2008).
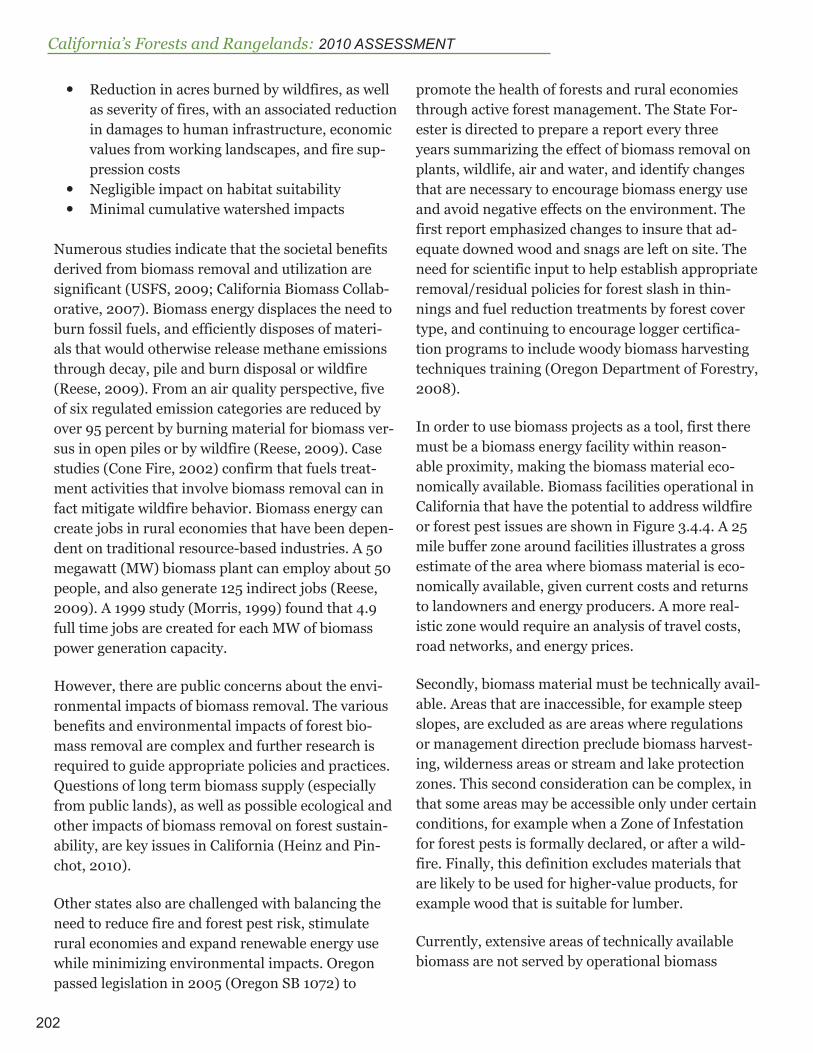
In order to use biomass projects as a tool, first there must be a biomass energy facility within reason-able proximity, making the biomass material eco-nomically available. Biomass facilities operational in California that have the potential to address wildfire or forest pest issues are shown in Figure 3.4.4. A 25 mile buffer zone around facilities illustrates a gross estimate of the area where biomass material is eco-nomically available, given current costs and returns to landowners and energy producers. A more real-istic zone would require an analysis of travel costs, road networks, and energy prices.
Secondly, biomass material must be technically avail-able. Areas that are inaccessible, for example steep slopes, are excluded as are areas where regulations or management direction preclude biomass harvest-ing, wilderness areas or stream and lake protection zones. This second consideration can be complex, in that some areas may be accessible only under certain conditions, for example when a Zone of Infestation for forest pests is formally declared, or after a wild-fire. Finally, this definition excludes materials that are likely to be used for higher-value products, for example wood that is suitable for lumber.
Currently, extensive areas of technically available biomass are not served by operational biomass
203
2010 ASSESSMENT Chapter 3.4 Emerging Markets for Forest and Rangeland Products and Services
plants. Factors that constrain investment in new facilities include:
y Uncertainty in future energy prices, affecting biomass value and travel costs (Reese, 2009)
y Uncertainty over access to biomass on public lands
y Local opposition to the existence or proposed location of biomass facilities (SDN, 2009)
y Barriers related to permitting (CBC, 2006)
There are currently six idle biomass facilities that po-tentially could address wildfire and forest pest issues in California (including one in Nevada). The primary reason for closure is a reduction in timber harvesting associated with the current economic downturn (Si-erra Pacific Industries, 2009). The Northern Nevada
Correctional Facility biomass plant near Carson City, Nevada currently has minimal impact for biomass re-movals in California, and is included as an idle plant since under certain future conditions it could service areas in need of treatment in the Lake Tahoe area.
In addition, at least six new biomass facilities have been proposed across the state, which could address wildfire and forest pest issues. It remains to be seen which, if any of these will actually become operation-al. The optimal scale of new standalone grid energy biomass facilities in the Pacific Coast region, includ-ing California, appears to be small to medium (5 to 15 MW). The size of projects involves variables such as fossil energy prices, emerging technologies for liquid fuels, heat and power needs, carbon credit val-ues, energy policy, and local forest conditions (Heinz and Pinchot, 2010).
Given current trends, government action may be required if woody biomass utilization is to make a greater contribution towards meeting Renewables Portfolio Standard targets, or facilitate treatment of more areas at risk or damaged by wildfire and for-est pests. Government action may also be warranted given that use of biomass for energy generation com-petes with other renewable energy sources or uses of biomass that are subsidized or otherwise encour-aged through various government policies. Example policies include the diversion credit for use of green biomass as daily cover in landfills (BPA, 2009).
AnalysesThe potential for biomass projects to play an increas-ing role in threat reduction and restoration efforts related to ecosystem health and community safety was analyzed, drawing on the analytical results pre-sented in previous chapters. This involved simulating the effects of adding six proposed biomass facilities and making six idle facilities operational. However, a specific strategy to implement this scenario could require actions on multiple issues and a variety of options for addressing them, including changes to policies, programs or practices and funding sources.
#
#
#
#
#
##
# #
###### #
##
#
##
###
#
# Operational Facilities25 mile bufferNational Forest landsCounties
Figure 3.4.4. Operational biomass facilities in California. This does not include numerous facilities that have limited potential to address wildfire
or forest pest issues, for example those that primarily utilize biomass from landfills, urban waste, or agriculture. Exception –
the two Southern California facilities shown on the map currently utilize primarily urban or agricultural wastes.Data Source: Biomass Facilities, FRAP (2009 v1)
California’s Forests and Rangelands: 2010 ASSESSMENT
204
Ecosystem Health
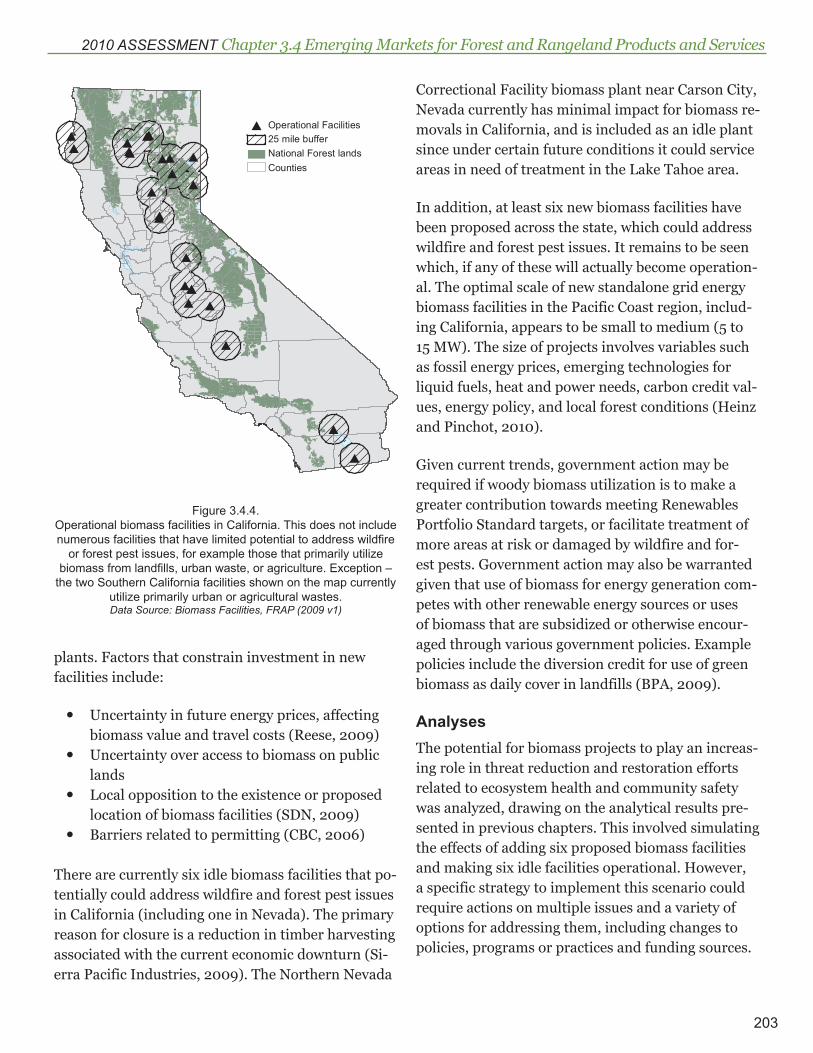
The potential for biomass projects to reduce threats and facilitate restoration efforts related to ecosystem health was examined. Each of the four priority land-scapes in the following diagram represents priority areas where biomass projects could be applied. For example, biomass projects that thin overstocked stands and remove ladder fuels can reduce wildfire and forest pest threat. Restoring impacted areas of-ten requires removal of dead, dying or infected trees.
Priority Landscape(Wildfire Threat toEcosystem Health)
+Priority Landscape(Restoring WildfireImpacted Areas)
Priority Landscape(Forest Pest Threat
to Ecosystem Health)= Priority Landscape
(Ecosystem Health)+ +Priority Landscape(Restoring Forest
Pest Impacted Areas)
These four priority landscapes were combined to cre-ate a single priority landscape for ecosystem health, by assigning the maximum of the four component ranks. An area that is ranked high for any of the four inputs is also ranked high in the output. The result-ing ecosystem health priority landscape represents areas most in need of treatments, such as biomass projects to reduce threats or restore impacted areas. The analysis involved determining which ecosys-tem health priority landscapes potentially become economically available as a result of adding the 12 facilities, and summarizing the results by county and bioregion.
Community Safety
A second analysis examined reducing wildfire and forest pest threats to community safety, or restoring impacted communities. Wildfire poses a direct threat to human infrastructure, while forest pests cause tree mortality that leads to indirect impacts from falling trees on roads, power lines and houses.
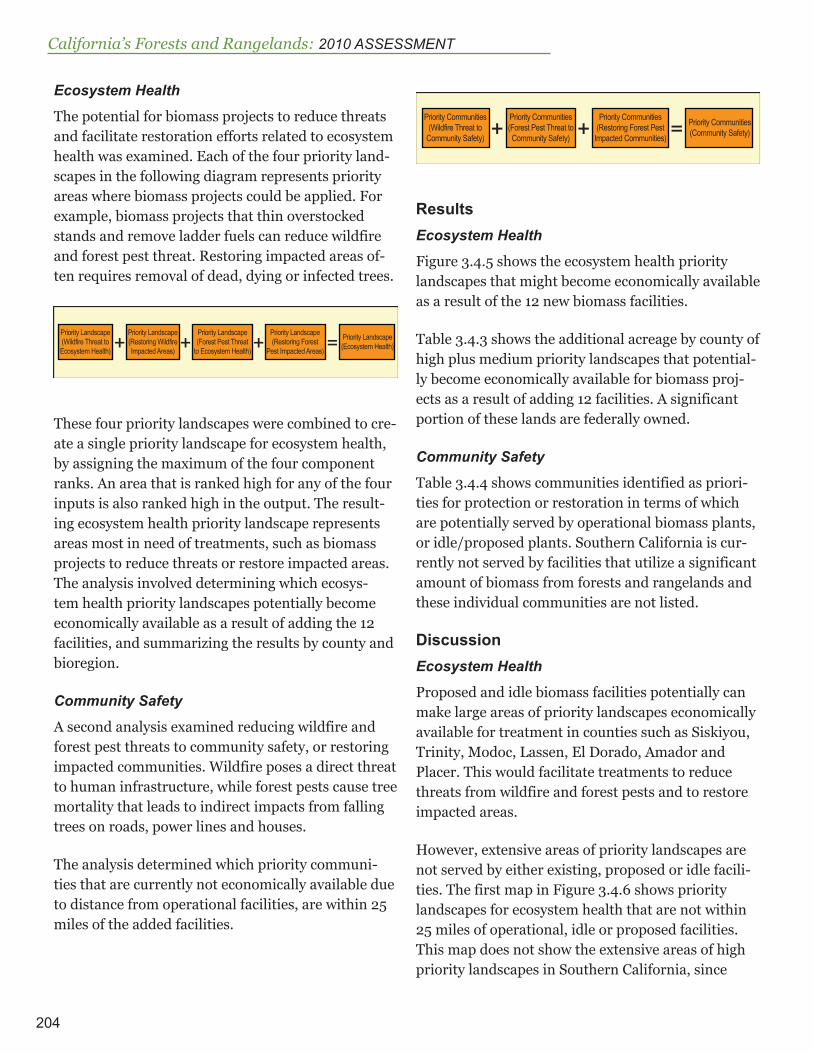
The analysis determined which priority communi-ties that are currently not economically available due to distance from operational facilities, are within 25 miles of the added facilities.
Priority Communities(Wildfire Threat to
Community Safety)+
Priority Communities(Forest Pest Threat toCommunity Safety)
Priority Communities(Restoring Forest Pest
Impacted Communities)= Priority Communities
(Community Safety)+
ResultsEcosystem Health
Figure 3.4.5 shows the ecosystem health priority landscapes that might become economically available as a result of the 12 new biomass facilities.
Table 3.4.3 shows the additional acreage by county of high plus medium priority landscapes that potential-ly become economically available for biomass proj-ects as a result of adding 12 facilities. A significant portion of these lands are federally owned.
Community Safety
Table 3.4.4 shows communities identified as priori-ties for protection or restoration in terms of which are potentially served by operational biomass plants, or idle/proposed plants. Southern California is cur-rently not served by facilities that utilize a significant amount of biomass from forests and rangelands and these individual communities are not listed.
Discussion Ecosystem Health
Proposed and idle biomass facilities potentially can make large areas of priority landscapes economically available for treatment in counties such as Siskiyou, Trinity, Modoc, Lassen, El Dorado, Amador and Placer. This would facilitate treatments to reduce threats from wildfire and forest pests and to restore impacted areas.
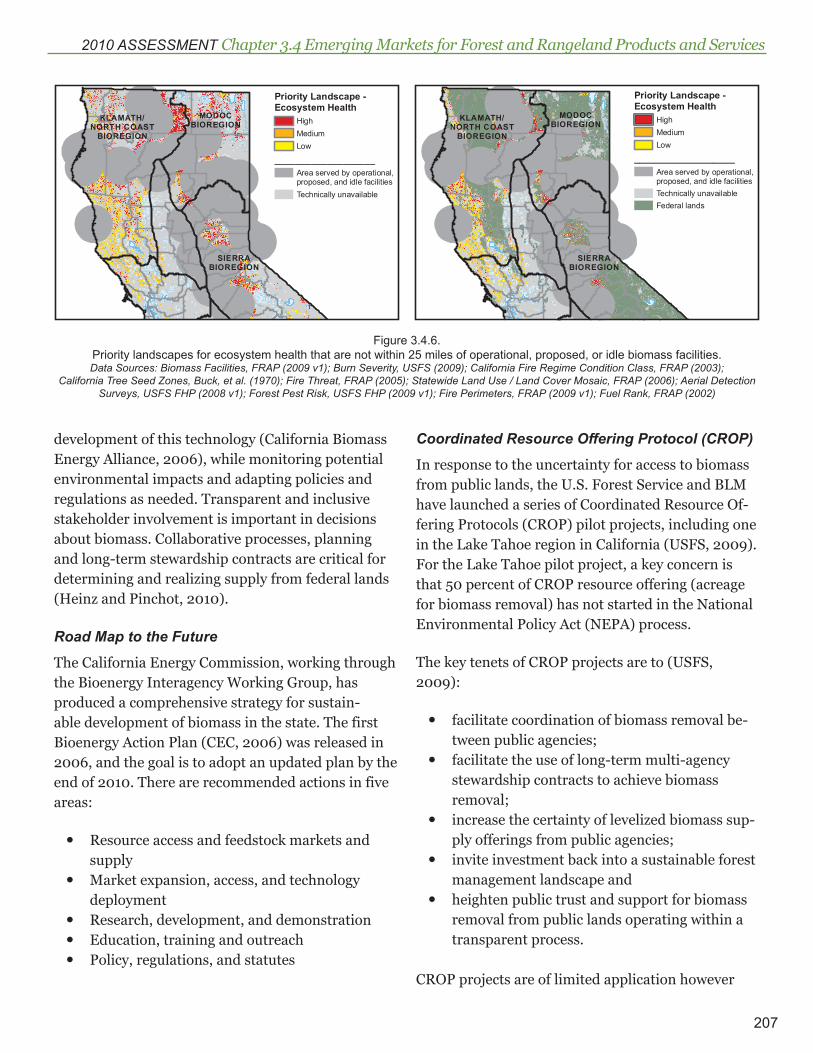
However, extensive areas of priority landscapes are not served by either existing, proposed or idle facili-ties. The first map in Figure 3.4.6 shows priority landscapes for ecosystem health that are not within 25 miles of operational, idle or proposed facilities. This map does not show the extensive areas of high priority landscapes in Southern California, since

205
2010 ASSESSMENT Chapter 3.4 Emerging Markets for Forest and Rangeland Products and Services
in this region of the state there are currently no facilities that utilize significant biomass from for-est or rangeland. The second map shows that since so much of these priority landscapes are on federal lands, access to a stable flow of material, especially from national forests, will be a critical factor in terms of whether these areas will ever be served by facilities.
Community Safety
Currently, only 14 of the 66 priority communities are within 25 miles of an operational biomass fa-cility. Adding the 12 new facilities would reach 11
more priority communities. Of the remaining 41 communities, 31 are in Southern California.
Bioregional Findings
Ecosystem HealthAdding the idle and proposed facilities potentially would facilitate treatment of extensive priority land-scape areas for ecosystem health in the Klamath/North Coast, Modoc and Sierra bioregions.
However, even if all idle and proposed facilities are made operational, there will still be extensive areas of priority landscapes that are not served by bio-
")
")
")
")
")
!(
!(
!(
!(
!(
")!(
KLAMATH/NORTH COAST
BIOREGION
MODOCBIOREGION
SIERRABIOREGION
SACRAMENTOVALLEY
BAY/DELTA
Priority Landscape - Ecosystem HealthHighMediumLow
__________________________________Idle/Proposed Facilities!( Idle") Proposed
Area served by new biomass facilitiesBioregions
Figure 3.4.5. Priority landscapes for ecosystem health with potential for new biomass facilities. Priority landscapes that are technically unavail-
able (e.g., steep slopes, stream buffers, wilderness areas), or have too little biomass to be economically available (less than 50,000 lbs/ha) are excluded in the map. Map shows only the portion of the state that is affected by making the 12 idle or proposed biomass
facilities operational.Data Sources: Biomass Facilities, FRAP (2009 v1); Burn Severity, USFS (2009); California Fire Regime Condition Class, FRAP (2003); California
Tree Seed Zones, Buck, et al. (1970); Fire Threat, FRAP (2005); Statewide Land Use / Land Cover Mosaic, FRAP (2006); Aerial Detection Surveys, USFS FHP (2008 v1); Forest Pest Risk, USFS FHP (2009 v1); Fire Perimeters, FRAP (2009 v1); Fuel Rank, FRAP (2002)

California’s Forests and Rangelands: 2010 ASSESSMENT
206
mass facilities in these same bioregions, though the majority of this is federal lands.
Community SafetyAs a result of adding idle and proposed facilities, 11 additional priority communities could potentially be treated using biomass projects, six of these are in the Lake Tahoe area. Numerous additional communi-ties could be served, primarily in the Klamath/North Coast and Sierra bioregions.
About half of the priority communities identified occur in the South Coast bioregion where biomass projects currently are not a viable treatment tool due to lack of biomass facilities.
ToolsCalifornia had 49 operating biomass plants in the mid 1990s, today there are 33 (Reese, 2009). The current environment does not seem conducive to bringing new plants that rely on forest biomass online, or in some cases even keeping existing plants operational. The challenge is to develop strategies that capture the array of benefits provided by bio-mass energy in terms of incentives for sustainable
Table 3.4.4. Priority communities for protection or restoration for forest pests and wildfire, that are potentially serviced by an operational biomass facility, or idle/proposed facility
County
Priority Community (F = Wildfire; P = Forest Pests)
Biomass Facility (O = Opera-tional; I = Idle/Proposed)
Alameda Oakland (F) -Alpine Kirkwood (P) -
ButteMagalia (P) OParadise (P) O
CalaverasArnold (FP) 1 IMountain Ranch (P) I
El Dorado South Lake Tahoe (P) IHumboldt Willow Creek (P) 1 IMarin Inverness (P) -Mono Mammoth Lakes (P) -Monterey Aromas (P) -
NevadaGrass Valley (P) -Truckee (P) 1 I
Placer
Dollar Point (P) IForesthill (P) IKings Beach (P) ISunnyside–Tahoe City (P) I
Plumas
Bucks Lake (P) OEast Quincy (P) OGraeagle (P) OIron Horse (P) OJohnsville (P) OLa Porte (P) OMeadow Valley (P) OMohawk Vista (P) O
ShastaLakehead–Lakeshore (P) ORedding (F) O
SiskiyouMount Shasta (P) IWeed (P) I
Sonoma
Guerneville (P) -Healdsburg (P) -Occidental (P) -Monte Rio (P) -
Tehama Mineral (P) OTuolumne Groveland–Big Oak Flat (P) O
Southern California 2
23 Communities (F) 7 Communities (P) 1 Community (F;P) -
1 Community is just inside the 25 mile buffer of an operational facility, but would be better served by a closer proposed/idle facility.2 San Diego, Orange, Los Angeles, San Bernardino, and Ventura counties.
Table 3.4.3. High plus medium priority landscape (HMPL) acres (rounded to the nearest hundred) for ecosystem health by county that are potentially economically available as a result of making 12 proposed or idle biomass facilities operational
County HMPL Acres* Percent FederalAmador 89,900 9Calaveras 64,600 14El Dorado 377,000 53Humboldt 104,400 49Lassen 163,900 60Mariposa 4,000 97Mendocino 53,600 2Modoc 166,300 47Nevada 4,300 16Placer 141,300 68Shasta 48,300 54Siskiyou 485,300 47Tehama 8,500 87Trinity 415,700 78Tuolumne 108,200 78State Total 2,235,600 54*counties with less than 1,000 HMPL acres excluded.
207
2010 ASSESSMENT Chapter 3.4 Emerging Markets for Forest and Rangeland Products and Services
development of this technology (California Biomass Energy Alliance, 2006), while monitoring potential environmental impacts and adapting policies and regulations as needed. Transparent and inclusive stakeholder involvement is important in decisions about biomass. Collaborative processes, planning and long-term stewardship contracts are critical for determining and realizing supply from federal lands (Heinz and Pinchot, 2010).
Road Map to the Future
The California Energy Commission, working through the Bioenergy Interagency Working Group, has produced a comprehensive strategy for sustain-able development of biomass in the state. The first Bioenergy Action Plan (CEC, 2006) was released in 2006, and the goal is to adopt an updated plan by the end of 2010. There are recommended actions in five areas:
y Resource access and feedstock markets and supply
y Market expansion, access, and technology deployment
y Research, development, and demonstration y Education, training and outreach y Policy, regulations, and statutes
Coordinated Resource Offering Protocol (CROP)
In response to the uncertainty for access to biomass from public lands, the U.S. Forest Service and BLM have launched a series of Coordinated Resource Of-fering Protocols (CROP) pilot projects, including one in the Lake Tahoe region in California (USFS, 2009). For the Lake Tahoe pilot project, a key concern is that 50 percent of CROP resource offering (acreage for biomass removal) has not started in the National Environmental Policy Act (NEPA) process.
The key tenets of CROP projects are to (USFS, 2009):
y facilitate coordination of biomass removal be-tween public agencies;
y facilitate the use of long-term multi-agency stewardship contracts to achieve biomass removal;
y increase the certainty of levelized biomass sup-ply offerings from public agencies;
y invite investment back into a sustainable forest management landscape and
y heighten public trust and support for biomass removal from public lands operating within a transparent process.
CROP projects are of limited application however
KLAMATH/NORTH COASTBIOREGION
MODOCBIOREGION
SIERRABIOREGION
Priority Landscape -Ecosystem Health
___________________
HighMediumLow
Area served by operational,proposed, and idle facilitiesTechnically unavailableFederal lands
KLAMATH/NORTH COASTBIOREGION
MODOCBIOREGION
SIERRABIOREGION
Priority Landscape -Ecosystem Health
___________________
HighMediumLow
Area served by operational,proposed, and idle facilitiesTechnically unavailable
Figure 3.4.6. Priority landscapes for ecosystem health that are not within 25 miles of operational, proposed, or idle biomass facilities.Data Sources: Biomass Facilities, FRAP (2009 v1); Burn Severity, USFS (2009); California Fire Regime Condition Class, FRAP (2003);
California Tree Seed Zones, Buck, et al. (1970); Fire Threat, FRAP (2005); Statewide Land Use / Land Cover Mosaic, FRAP (2006); Aerial Detection Surveys, USFS FHP (2008 v1); Forest Pest Risk, USFS FHP (2009 v1); Fire Perimeters, FRAP (2009 v1); Fuel Rank, FRAP (2002)
California’s Forests and Rangelands: 2010 ASSESSMENT
208
due to the fact that they are focused only on bio-mass material sourced from federal lands. Financial institutions that provide funding for biomass utili-zation projects are interested in reliable sources of woody biomass material across all land ownership categories.
Integrated Resource Stewardship Contract
A promising contracting tool that the U.S. Forest Service and BLM have been utilizing in recent years is the Integrated Resource Stewardship Contract, which is focused on treatments conducted over three to ten years. Stewardship contracts have proven to facilitate forest fuels reduction and restoration activities at the landscape level. There are numer-ous examples of these contracts in place or proposed in California for fuels reduction projects to pro-tect communities, endangered species habitat, key watersheds for anadromous fish and for ecosystem restoration (http://www.forestsandrangelands.gov/stewardship/ca.shtml).
Biomass Crop Assistance Program
Biomass Crop Assistance Program (BCAP) provides financial assistance to producers or entities that de-liver eligible biomass material to designated biomass conversion facilities for use as heat, power, bio-based products or biofuels (USDA Farm Service Agency, 2009). For example, in Butte County BCAP funds made it economically feasible to convert 15,500 dry tons of charred timber into clean energy, and en-abled Bamford Company to keep 37 people employed (timberbuysell.com).
CARBONCarbon sequestration is an emerging market that quantifies and helps pay for an ecosystem service. Terrestrial carbon sequestration is considered in policy and at the project level. The role of carbon in compliance markets along with the economics of carbon and the opportunities in California for forest and rangeland carbon are explored here while the sequestration of carbon by trees and other plants is described in Chapter 3.7.
Carbon accounting may use “on-site” to describe car-bon stored in the forest or soil while “off-site” refers to the pool of carbon in wood products, either in-use or in a landfill.
There are two kinds of carbon markets: voluntary and compliance. Voluntary carbon markets are gen-erally unregulated by government, with transactions usually occurring directly between the buyer and seller. Specific systems, protocols and registries exist for the voluntary market. Compliance markets occur under regulatory schemes, usually cap-and-trade, where offsets are sold to emitters. These usually involve contracts between buyer and seller, but are regulated by the trading system so that offsets meet the system criteria, are properly credited, and are not used more than once. Entities may operate in both voluntary and compliance markets to assemble mul-tiple landowners into projects for economies of scale.
Standards and guidelines are necessary to quantify greenhouse gas benefits from forestry and range-re-lated activities. For example, protocols are the rules for carbon accounting that a project developer must follow to quantify reductions, while registries func-tion like carbon credit banks where ownership may be tracked.
Two general approaches to protocol development are project specific (i.e., Clean Development Mechanism) and programmatic (i.e., Climate Action Reserve (CAR)). Project types that relate to forestry include reforestation, avoided conversion, urban forestry and forest management. Range-related project types in-clude manure management systems and soil seques-tration. Currently, the most likely forestry protocols to receive near-term adoption under AB32 or West-ern Climate Initiative (WCI) cap-and-trade systems would be CAR forestry protocols, the CAR manure management protocol and the Alberta Offset System soil sequestration protocol (WCI, 2010).
The State of California has supported the CAR forestry protocols for use in the voluntary market. It is expected that these protocols, or modifications of them, will be used for forestry offsets under a
209
2010 ASSESSMENT Chapter 3.4 Emerging Markets for Forest and Rangeland Products and Services
cap-and-trade compliance market under the Global Warming Solutions Act of 2006, WCI, or a national cap-and-trade program. Other protocols will also likely participate.
Reductions are the metric tons of carbon dioxide equivalent (CO2e) attributed to a project and may be referred to as credits in general or a more specific name associated with a specific protocol or registry. The quality of credits varies according to many fac-tors, such as the nature of the carbon reduction, the extent to which the carbon removed will stay out of the atmosphere, and the ability to accurately mea-sure and verify the amount of carbon saved.
An “offset” is the term generally used in conjunction with a cap-and-trade program where credits are gen-erated outside of the capped sectors. Offsets are used in lieu of emission allowances. The use of offsets has been controversial, with critics questioning the effec-tiveness and proponents emphasizing the near-term necessity of offsets.
Within California, the amount of offsets to be al-lowed under cap-and-trade systems is still unknown. By one estimate, which proposed that four percent of annual GHG emissions in California could be met by each entity with offsets, total annual use of offsets could be about 7.7 million metric tons in 2012–2014, over 16 million metric tons in 2015–17, and over 15 million metric tons each year from 2018–2020 (ARB, 2009). Proposed federal legislation would allow upwards of one billion metric tons of domes-tic offsets a year with another billion metric tons of international offsets.
The apparent demand for offsets far exceeds the supply, at least in the near term (Sikorski, 2010). Estimates and potential value in markets that are emerging can be made for forest-related supply in California. Live tree carbon stored in California for-ests is estimated to be 5.1 billion metric tons (tera-gram, Tg) (see Chapter 1.2); the sequestration rate was 30 million metric tons (gigagram, Gg) per year. The estimate for private timberlands was 1.4 Tg; the sequestration rate was five Gg per year. A widely
held 2020 auction allowance price range for AB 32, WCI and national programs is $15–$25 per metric ton (Economic and Allocation Advisory Committee, 2010; Point Carbon, 2010; PEW, 2010). For illustra-tion, applying a $15 and $20 per metric ton value to offsets under a compliance market, the theoretical values if all carbon were monetized are:
y Total California forest carbon storage (live trees): $77–102 billion
y Total California forest carbon sequestration: $450–600 million/year
y California private timberland forest carbon storage (live trees): $21–28 billion
y California private timberland carbon sequestra-tion: $75–100 million/year
Potential market revenue based on the $15–20 per metric ton assumption for offsets in a compliance market under AB32 is as follows:
y First Compliance Period (2012–2014): $116–155 million/year
y Second Compliance Period (2015–2017): $246–328 million/year
y Third Compliance Period (2018–2020): $226–301 million/year
These estimates are for all offset project types. Sikor-ski (2010) estimates that about two-thirds of nation-wide domestic offsets will be supplied by forestry project types to 2020. This would reduce the poten-tial revenues to the forestry sector accordingly.
In the case of range-related carbon, no estimates have been made on the supply from manure manage-ment; there is lack of information on the impacts of technology and other obstacles. Soil sequestration from forests and rangelands was not estimated; the associated protocols are unclear at this point.
The type of forest project is a critical factor when considering possible offset supply to 2020. For example, urban forestry and reforestation project types rely on carbon accruing in young trees, which will be minimal before 2020 although important for
California’s Forests and Rangelands: 2010 ASSESSMENT
210
later years. In contrast, the avoided conversion and improved forest management project types could generate substantial credits in the next ten years.
The following assumptions were used in the esti-mates of credits generated from the avoided conver-sion and improved forest management project types. The stocking and sequestration estimates are from Chapter 1.2.
y One-half of the 139 metric tons per acre aver-age stocking on forestlands are credited on average on avoided conversion projects
y Avoided conversion projects are 10,000 acres a year
y Sequestration rate is 0.746 metric tons per acre on forestland
y Sequestration rate is 1.244 metric tons per acre on timberland
y Non-industrial forestland owners will par-ticipate in the improved forest management projects at 10 to 20 thousand acres a year while industrial timberland owners will participate at 20 to 40 thousand acres a year.
y Improved forest management projects that have initial inventories above common practice are 11 to 23 thousand acres a year and result in immediate credits of 35 metric tons per acre.
Avoided conversion projects would produce 0.7 mil-lion metric tons per year. Improved forest manage-ment projects, by the CAR protocol, may produce credits in two ways: to incrementally as forests grow and as an avoided emissions type credit for exceed-ing common practice. Based on analysis of avoided conversion and improved forest management, estimates of annual forest carbon offsets available to a California compliance market for the three compli-ance periods results in the following:
y Compliance Period 1 (2012–2014): 1.17 to 1.67 million metric tons per year
y Compliance Period 2 (2015–2017): 1.25 to 1.83 million metric tons per year
y Compliance Period 3 (2018–2020): 1.33 to 2.00 million metric tons per year
If these estimates are approximately correct then the forestry sector in California will meet 10–25 percent of the potential offset demand through 2020. Ful-filling the demand for offsets to 2020 will require more landowner participation, other sector offsets, the development of other project types such as soil or avoided emissions from fire, or the use of forestry offsets from outside of California.
Carbon credits will be in demand for both the volun-tary and compliance markets. Protocols are in place for many project types. The price of carbon, however, is generally low relative to the value for high quality timber products. A thousand board feet of Douglas-fir that is worth $400 is approximately four metric tons of CO2e, which is $80 at $20 a metric ton. This value discrepancy combined with the risk associated with a 100-year commitment to maintain the seques-tered carbon, which is required for CAR projects, will likely keep supply low. If credits become widely used for mitigating climate impacts identified in the Cali-fornia Environmental Quality Act (CEQA) analyses of development projects, then prices in the voluntary market could possibly exceed prices in the compli-ance market, further constraining cap-and-trade supply.
Investments in working landscapes could bolster terrestrial carbon inventories and reduce risk of loss. Priority landscapes for carbon are identified in Chap-ter 3.7. Significant acreages on private and public lands could benefit from management. Carbon man-agement must, however, be considered in the context of the multiple benefits that forests and rangelands provide. Quantities of carbon should be considered in combination with the risk of emission and long-term ecosystem health. Investments in restoring stands converted from either conifer or hardwood cover should be made soon to address ecological res-toration and carbon contributions in future decades.
211
2010 ASSESSMENT Chapter 3.4 Emerging Markets for Forest and Rangeland Products and Services
NICHE MARKETS DefinitionNatural Resources Canada defines niche products as “specialty, higher-value, non-commodity wood prod-ucts that are directed at specific markets that value the unique appearance/quality of a product that has a limited production supply. Niche products are usu-ally produced by smaller manufacturing plants that focus on producing a unique, high quality product in limited volumes. These are usually products that an end-user believes has an added-value component due to unique appearance/quality, end-use, etc. Many niche products have the same number of competitors as established commodity products but niche prod-ucts have the advantage of being able to create brand or product loyalty to separate themselves from com-petitors, are more regional in market focus, are more attuned to market/demand changes and trends, and are quick to adapt to changes in market demand.” (Natural Resources Canada, Canada Wood, 2003)
Niche Markets for Certified ProductsNiche products are differentiated based on the na-ture of the process used to create them, in terms of being a more environmentally and socially respon-sible option for consumers. This typically involves a certification process by third-party entities such as the Forest Stewardship Council (FSC) or Sustain-able Forest Initiative (SFI) for wood products, or the USDA National Organic Program for agricultural products. There are also various programs for certifi-cation of “natural” beef and grass-fed beef, which are generally less restrictive standards than organic.
“An on-product label that says a product is certified to a program such as SFI or FSC delivers assurance you are making a choice that represents conserva-tion of biological diversity, protection of special sites, sustainable harvests, respect for local communities, and much more” (Larry Selzer, President and CEO, The Conservation Fund).
The demand for certified wood products can be driven by higher level certification programs, for example the trend towards “green building” and
certification programs such as Leadership in Energy and Environmental Design (LEED®) (http://www.usgbc.org/DisplayPage.aspx?CategoryID=19).
In some cases, major retailers have endorsed certi-fied products to the point of excluding or limiting se-lection of non-certified products. For example, Home Depot began endorsing certified wood products in 1999, and now sells more FSC certified wood than any retailer in America (http://corporate.homede-pot.com/wps/portal/Wood_Purchasing).
Advantages of Niche ProductsThe mass marketing business model involves intense competition based on standardized product lines and fierce price competition (Hacker, 2006). Niche markets involve a unique business model that can often command higher prices by competing to meet a unique need for custom products.
Niche products sometimes utilize materials that would otherwise be discarded, or even incur a dis-posal cost. Eric Oldar of the California Department of Forestry and Fire Protection pioneered a project to utilize urban trees that would otherwise end up in landfills, by investing in portable sawmills and kilns which are loaned to municipalities (Hacker, 2006). The City of Lompoc, which was faced with a tree disposal problem and landfill regulations, was able to meet a need for higher quality park benches, floor-ing, and other wood products (Gamstetter, 2009). The number of municipalities now using portable sawmilling is widespread throughout the country in response to landfill regulations (Hacker, 2006).
Examples of Niche ProductsNiche products are vast and diverse, a list of some of the more interesting or promising in California includes:
y West Coast Arborists, Anaheim: Utilizing the latest technology for urban forestry inventory, planning, and management (http://www.wca-inc.com/Introduction.aspx).

California’s Forests and Rangelands: 2010 ASSESSMENT
212
y California Hardwood Producers, Auburn: Utilizing tree removals from urban forests and orchards for high quality flooring, cabinets, beams, countertops, etc. (http://californiahard-wood.com/).
y Humboldt Woodworkers Guild, Humboldt County: Collective marketing of unique high quality, environmentally and socially respon-sible wood products (http://woodguild.com/).
y Calaveras Healthy Impact Product Solutions, San Andreas: In response to local sawmill closures and fire hazard from small trees, this community organizing effort, funded by a $96,500 USDA grant, implemented a chip-ping station for landscaping and heating. One customer uses wood chips to heat a four acre greenhouse that supplies fresh organic local produce.
y Sierra Nevada Geotourism: The Sierra Business Council has partnered with the National Geo-graphic Society and the Sierra Nevada Con-servancy to develop a website to capture the history, heritage and attractions distinctive to the Sierra Nevada Region, to promote tourism that can conserve the region’s historic towns and heritage sites, restore and protect the land-scape, and sustain local businesses and com-munities (http://www.sbcouncil.org/Projects/Sierra-Nevada-Geotourism).
y There are many examples of California ranches that produce organic, natural or grass-fed ani-mals and meat products.
y Numerous California livestock operators fill niche markets for various specialty products and services, ranging from beef jerky to ranch tours.
Opportunities for Niche Markets in CaliforniaThere is a strong potential for niche markets to increase economic activity and employment in the state.
California hardwoods have historically received a lot of attention, since they are an underutilized re-source. California is a major consumer of hardwood
lumber (20 percent of nation’s production) but the hardwood lumber production industry in the state is almost non-existent; this is in spite of a sizable hard-wood tree resource (12 billion cubic feet of timber growing stock) (http://ucanr.org/delivers/impac-tview.cfm?impactnum=196). Although California producers have been unable to compete in traditional high-volume markets, the potential exists for utiliz-ing this resource to fill additional niche markets.
As California loses more sawmills, many landowners will be unable to sell their timber. Portable sawmills provide an opportunity for these landowners to pro-cess their own logs, and sell their timber as finished products, commanding a higher price. This will require innovation in terms of forming landowner cooperatives for processing and marketing their products.
While this chapter deals extensively with opportuni-ties for additional large biomass facilities, there is also potential for utilizing small or micro-biomass power generation, particularly for heating homes, businesses and schools. Examples include the U.S. Forest Service State and Private Forestry’s Fuels for Schools program being initiated in six western states.
The various certification programs for rangeland products provide an opportunity for some ranchers to increase profitability. This could become espe-cially important if food safety concerns become an emerging issue. For example, grass-fed beef avoids potential food safety concerns that could arise from sending animals to feedlots.
ECOSYSTEM SERVICESForests and rangelands provide a number of values which historically have not been captured easily in traditional markets. Examples are: carbon seques-tration (until recently), watershed services, wildlife habitat and biodiversity, scenic and related values. Often these are viewed as “public goods” which are provided as benefits to the public at little or no cost. Since landowners are generally not compensated for providing these services, they may not receive
213
2010 ASSESSMENT Chapter 3.4 Emerging Markets for Forest and Rangeland Products and Services
adequate consideration in decisions related to keep-ing lands in production, or in how they are managed.
Markets have been slow to emerge for a number of reasons, such as the difficulty of defining market units and price, few buyers, and limited support in the investment community. However, a growing recognition of the importance of these services is leading to efforts to quantify their value, which could lead to market-based solutions. At the national level, for example, the Food, Conservation, and Energy Act of 2008 directs states to identify high-value areas for providing various ecosystem services and to delin-eate threats to those areas. The Act also seeks to fa-cilitate landowner participation in emerging markets for ecosystem services. The Secretary of Agriculture must develop technical guidelines that measure the environmental services benefits from conservation and land management activities. These guidelines will facilitate measurement and reporting protocols and registries. A verification process and guidelines for reporting conservation and land management activities must also be developed (http://www.fs.fed.us/ecosystemservices/).
Across the country, some market-based frameworks can be found in the area of ecosystem services. These can include private payments, public payments or incentives and trading schemes. For example, in the case of preserving wildlife and plant diversity, pay-ments for specific areas or programs can come from non-governmental organizations, pharmaceutical, agricultural or other companies, and even the eco-tourism industry. In some cases regulatory frame-works have fostered a way to do market transactions, such as the emergence of conservation and mitiga-tion banking in California and the U.S. Other invest-ments are made in an effort to comply with or lessen cost of regulatory compliance, such as flood control structures or better road design to improve water quality.
Local or regional districts can also serve a quasi-mar-ket function. Examples include the East Bay Regional Park District, the Mid Peninsula Open Space District and the Marin Open Space District. These districts
have programs that support ecosystem services directly or indirectly. They utilize property taxes, as-sessments, fees/rents/other charges, grants, interest and other funding sources. Programs relate to what the voters want and for which they will pay.
Some programs can influence market opportuni-ties for ecosystem services. An example of this is the Private Lands Wildlife Habitat Enhancement and Management Area (PLM) Program administered by the Department of Fish and Game. The program was first authorized in 1983 and has undergone several revisions. The goals of the PLM are to encourage private landowners to manage for the benefit of fish and wildlife. In exchange for developing a manage-ment plan and adopting specific wildlife habitat improvements, landowners receive incentives that allow them to better realize the recreational value of wildlife. Incentives can include more flexible sea-sons and quality hunting experiences. Landowners gain by charging fees for hunting, fishing and other uses, such as photography and observing wildlife. (DFG, 2008). There are now 90 PLM properties that encompass almost 900,000 acres of wildlife habitat (http://www.dfg.ca.gov/wildlife/hunting/plm.html).
Conservation easements are another mechanism widely used in California. Many examples exist such as efforts by organizations including the Trust for Public Land, the Nature Conservancy and the California Rangeland Trust. Under a conservation easement, a landowner voluntarily donates or sells certain rights related to their property, such as the opportunity to develop to a private organization or public agency. This entity is willing to hold the right to enforce limitations agreed to by the landowners. Often landowners retain rights to manage the prop-erty for ongoing agricultural, rangeland or forestry uses, together with associated habitat, watershed and open space values. These easements are le-gally recorded agreements and conditions continue with the land when the land is sold. Compensation to the landowner can take several forms, such as direct payments or tax credits. Credits come from various sources. One example of a tax credit is the Natural Heritage Preservation Tax Credit (2000).
California’s Forests and Rangelands: 2010 ASSESSMENT
214
Administered by the Wildlife Conservation Board, the Tax Credit Act allows state tax credits for dona-tions of qualified land (fee title or conservation ease-ment) and water rights.
Still another example is the Oak Woodlands Conser-vation Act (2001). Under the Conservation Act, the Wildlife Conservation Board established a grant pro-gram designed to protect and restore oak woodlands utilizing conservation easements, cost-share and long-term agreements, technical assistance, public education and outreach.
In addition, state law provides for tax and zoning approaches that encourage landowners to maintain land in agriculture, ranching and timber production. The two key frameworks are the California Land Conservation Act, better known as the Williamson Act, and the Timberland Production Zone under the Forest Taxation Reform Act. Under both these laws, properties are taxed in a manner that supports con-tinued use of the land for resource production with its related ecosystem service benefits (such as wild-life habitat and watershed health).
The provision of ecosystem services in California has benefited greatly from development of partnerships and cooperation among landowners, governmental agencies, non-profit organizations and other stake-holders. Forms of the partnerships vary, but can be seen in the abundance of watershed groups, Fire Safe Councils and community or neighborhood based organizations. Agencies, landowners, and non-gov-ernmental organizations all play key roles. These ef-forts have facilitated watershed and habitat planning, restoration, management and acquisition, and efforts to improve forest health.
Support for such activities comes from different sources. The main contributors are property own-ers, non-profit organizations, public agencies and the public. By far, the largest funding sources for projects and for ongoing program support for envi-ronmental services comes in the budgets of federal, state and local agencies. Funding comes from general
taxes, special taxes and dedicated funds, user fees, and other sources.
Especially important to support and enhancement of ecosystem services in California has been voter sup-port of four ballot initiatives in the last decade. These are Proposition 40 (2002), Proposition 50 (2002), Proposition 84 (2006), and Proposition 1E (2006). Funds from these initiatives are being used for many aspects of ecosystem services. These includie such things as assessment and planning for watersheds, fish and wildlife, infrastructure and habitat restora-tion and enhancement, habitat acquisition, improv-ing forest health and conservation and technical assistance.
Federal initiatives have also been important. Exam-ples include funding and programs related to: im-proved water quality; restoration and enhancement of ecosystems, wildlife and fish habitat; and fuel reduction and improved forest health. Some federal programs focus on specific areas and issues such as Lake Tahoe or the forests of Southern California.
Planning for and determination of projects, as well as management and ongoing support that relate to eco-system services, take many forms. Much depends on enabling legislation and direction in agency budgets of governmental agencies. In addition, program fo-cus and even type or location of projects can be writ-ten as part of state or local ballot measures. Goals of landowners, contributors and non-governmental organizations also play a role.
One example is that the importance of forested and rangeland watersheds to water quality and supply has been recognized in various ballot initiatives, related legislation, the CALFED Program and, most recently, in the draft California Water Plan. Public funding has been the primary source of investment in these watersheds. For example, under CALFED, millions of dollars have been invested for watershed assessment, watershed management and technical and staff assistance. A number of agencies, but espe-cially the State and Regional Water Quality Control
215
2010 ASSESSMENT Chapter 3.4 Emerging Markets for Forest and Rangeland Products and Services
Boards and the Department of Fish and Game, have worked with stakeholders to carry out such efforts.
The same is true for investment in forests and range-lands critical to providing biodiversity, habitat and open space. Funding has come from a variety of sources, again largely public in origin. Conservancies, such as the Coastal Conservancy and the Sierra Ne-vada Conservancy, have been established to provide facilitation, coordination, project focus and manage-ment. Several state departments have worked with stakeholders to guide these investments. Key among them is the California Department of Fish and Game, especially the Wildlife Conservation Board (WCB).
Many policies, programs, agencies and stakehold-ers are involved with making decisions over where to make investments that affect ecosystem services. This typically involves protecting areas that provide unique or high levels of desired services, or restoring areas impacted by past events. Augmenting this with emerging market-based solutions could enhance our ability to sustain these important services into the future.