2010 Annual Report - Hulamin
128
2010 Annual Report
Transcript of 2010 Annual Report - Hulamin

2010 Annual Report

Elphias Ngcobo, Hot Finishing Mill Operator
Introduction
Hulamin is an independent semi-fabricator and fabricator of aluminium products, situated in South Africa. Although much of the primary aluminium metal produced in the region is exported with little added value, Hulamin, as the only major aluminium rolling operation in sub-Saharan Africa, remains the primary local benefi ciator of the metal. Hulamin is focused on specifi c product and end-user markets around the world.
We create value for stakeholders by meeting our customers’ needs for high-value semi-fabricated aluminium products. In so doing, we stimulate economic activity in our region, which is situated in the province of KwaZulu-Natal, generating an increase in business activity, creating employment and contributing to the upliftment of the local community.
We contribute to the upliftment of manufacturing in South Africa, through our role as both supplier and customer, and through our role as a responsible leader in sustainable development in Southern Africa.
Each of our businesses shares a passion for aluminium – a unique metal with a superior range of benefi ts and endless application possibilities.
Contents
Business overviewIntroduction inside front fl apHulamin statement of value inside front coverGroup operations 1Geographic profi le 2The rolling process 4The extrusion process 7Application of our products 8Key performance indicators 10Business objectives and deliverables 11Strategic priorities for 2011 11
CommentaryChairman’s statement 12Chief Executive Offi cer’s review 14
GovernanceDirectorate 18Executive Committee 20Sustainability report 22Corporate governance 44
Five-year review 50
Financial statementsStatutory approvals and reports 54Accounting policies of the group and company 67Group fi nancial statements 76Company fi nancial statements 114
Shareholder informationAnalysis of ordinary shareholders 122Shareholders’ diary 123Hulamin share price 123Corporate information 124
Cover top left image: Nqobile Lembethe, Material Handler
Cover bottom right image:Mandla Mbhele, Foil Slitter Operator

Hulamin statement of value
Our philosophy
Through the commitment to a common purpose we can forge our own destiny. Knowledge and attitude gives us power over our business challenges and personal circumstances.
Our business
We manufacture and market high-quality rolled and extruded aluminium products which meet the needs of our customers in South Africa and internationally.
Our core purpose
Our core purpose is to consistently meet or exceed the reasonable expectations of our major stakeholders (which specifi cally include our employees, customers, suppliers, shareholders and the communities that surround us). We do this by creating value through the manufacture of high-value aluminium semi-fabricated products. In doing so, we contribute to the upliftment of the standard of living in the region. We achieve this by stimulating business activities associated with adding value to the large quantities of primary aluminium produced in the region and through pursuing related business opportunities within which we can further apply our capabilities.
Our vision
We continually seek to grow our business by satisfying the demands of our customers and supporting the growth of aluminium usage in our chosen market sectors. Our logo, the circle of synergy, shows our commitment to partnerships with our suppliers, customers and the communities in which we operate.
Our statement of value
We deliver on our promises.
Our promises
• Earn a reputation for excellent customer service;
• Generate respectable profi ts in our operations;
• Set the benchmark in our industry for safe and responsible manufacturing; and
• Assist all employees to uplift their skill levels.
Mutual respect
We treat each other as we would like ourselves to be treated. We respect the rights and fair expectations of others – this has particular importance in our diverse society.
Working safely and responsibly
Every employee has the right to work without fear or risk of personal injury and has the responsibility to work in ways that give the same right to fellow workers. Furthermore, every employee has the additional responsibility to ensure zero harm to our environment.
Honesty and integrity
We behave in ways that are ethical and result in trust, openness and fairness.
Customer value
• We strive to exceed our customers’ expectations;
• We recognise that our customers have alternatives; and
• We strive to be our customers’ fi rst-choice supplier.
Teamwork
We are all team players. We achieve more working together than the total of everyone’s efforts working alone. Our logo symbolises our commitment to teamwork.
The standards we set ourselves
Our success will be measured by the extent to which:
• We are respected and admired by all our stakeholders;
• We are regarded as an employer of choice;
• We are fi lled with pride in our achievements; and
• We make the world a better place.
Annual Report 2010 • page 1
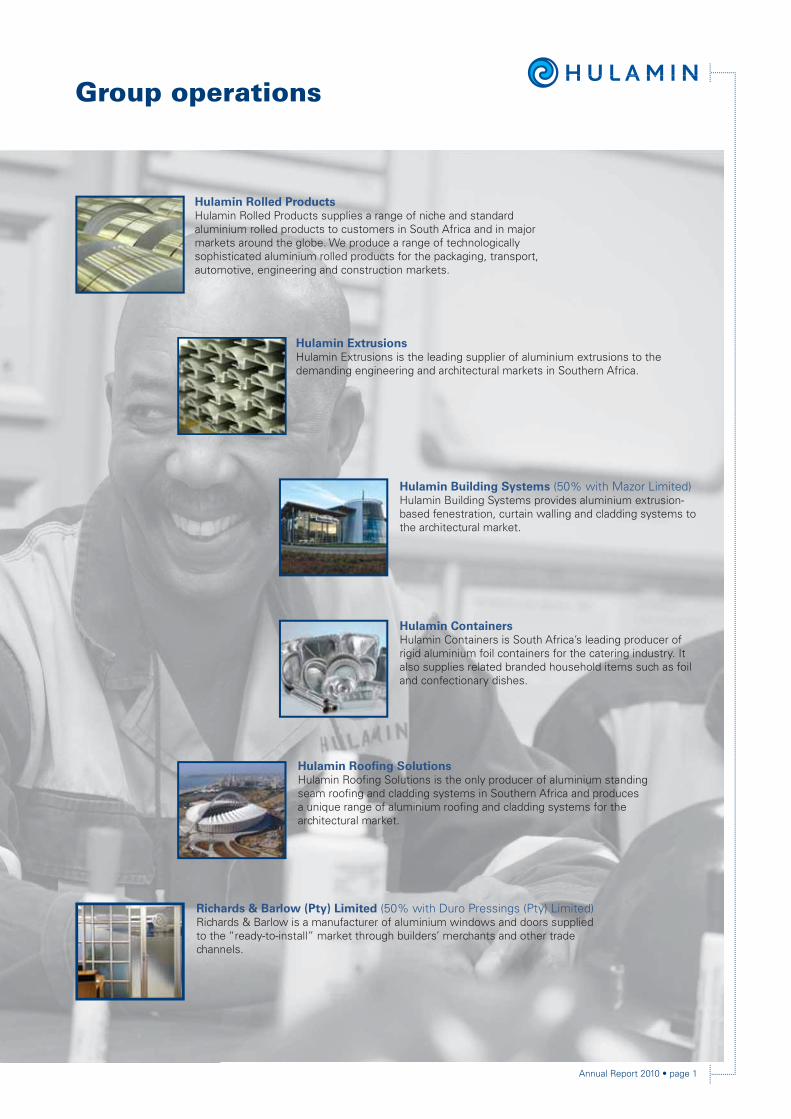
Group operations
Hulamin Rolled ProductsHulamin Rolled Products supplies a range of niche and standard aluminium rolled products to customers in South Africa and in major markets around the globe. We produce a range of technologically sophisticated aluminium rolled products for the packaging, transport, automotive, engineering and construction markets.
Hulamin ExtrusionsHulamin Extrusions is the leading supplier of aluminium extrusions to the demanding engineering and architectural markets in Southern Africa.
Hulamin Building Systems (50% with Mazor Limited)Hulamin Building Systems provides aluminium extrusion- based fenestration, curtain walling and cladding systems to the architectural market.
Hulamin ContainersHulamin Containers is South Africa’s leading producer of rigid aluminium foil containers for the catering industry. It also supplies related branded household items such as foil and confectionary dishes.
Hulamin Roofi ng SolutionsHulamin Roofi ng Solutions is the only producer of aluminium standing seam roofi ng and cladding systems in Southern Africa and produces a unique range of aluminium roofi ng and cladding systems for the architectural market.
Richards & Barlow (Pty) Limited (50% with Duro Pressings (Pty) Limited)Richards & Barlow is a manufacturer of aluminium windows and doors supplied to the “ready-to-install” market through builders’ merchants and other trade channels.

2 page • Annual Report 2010
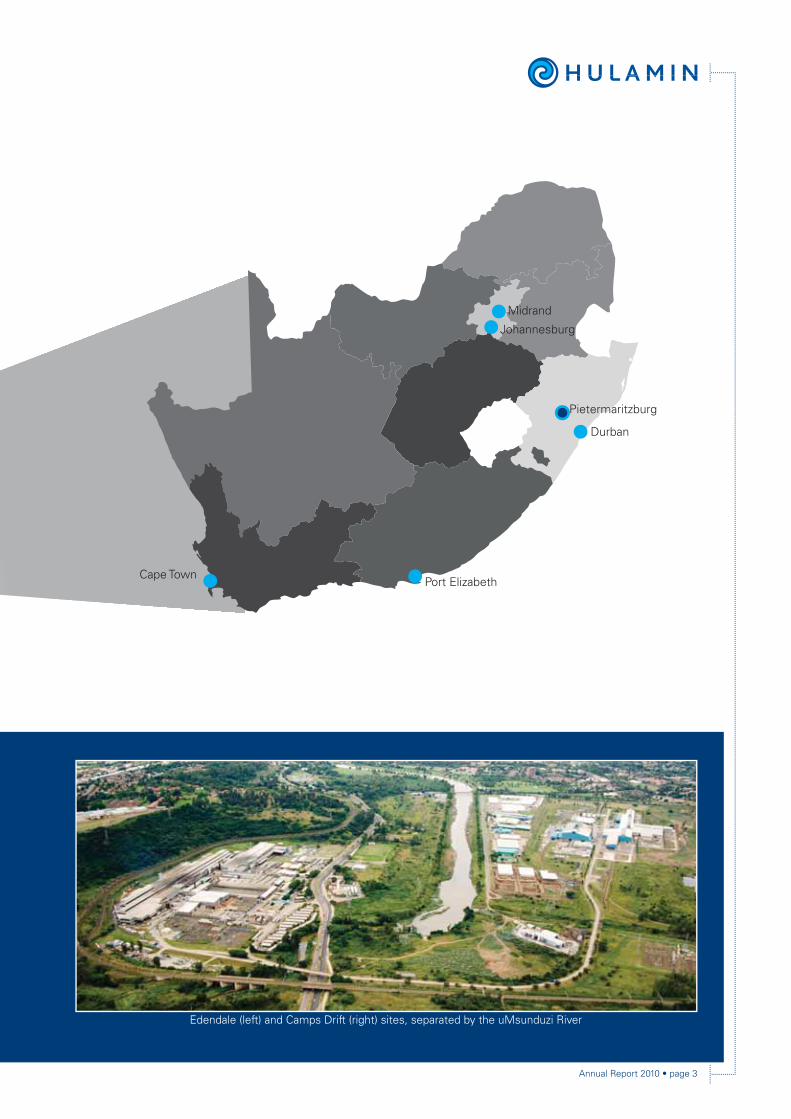
Geographic profi le
With activities stretching over 60 countries, we export to customers around the globe, while distinguishing ourselves as a key supplier to the South African industry. We are committed to developing the South African aluminium industry and making a meaningful contribution to sustainable development in Southern Africa.
Offi cesAgents
Annual Report 2010 • page 3
Cape TownPort Elizabeth
Durban
Pietermaritzburg
Midrand
Johannesburg
Edendale (left) and Camps Drift (right) sites, separated by the uMsunduzi River

4 page • Annual Report 2010
3ScalpingThe surface of a rolling ingot contains oxides and segregated layers formed during the solidifi cation process. This surface layer is detrimental to the product and the rolling slabs are therefore machined in a milling operation to remove this surface.2
CastingMolten metal is transferred into holding furnaces, where the liquid metal is treated and impurities allowed to settle out. Molten metal is then fi ltered, skimmed to remove fl oating dross and further cleaned. The furnace is thereafter tilted, allowing the liquid aluminium to fl ow through a system of launders into water-cooled rectangular moulds. This process, known as direct chill (DC) casting, results in rolling slabs that weigh up to 16 tons. During casting, the metal is further treated and fi ltered. Additional rolling slab is purchased from the smelters.
1Remelting and scrap recyclingScrap from the Hulamin manufacturing processes is charged into melting furnaces together with primary aluminium and alloying elements.
5Hot rollingRolling slabs are heated and are then processed through the reversing hot roughing mill. This initial hot rolling process reduces the thickness by up to 95% and increases its length up to 24 times. Lead and tail ends of the strip are cropped during this process to ensure uniformity along the length. The strip is then transferred along a roller table to the hot fi nishing mill to ensure that it is rolled to a tight tolerance intermediate thickness. The temperature of the coil after rolling is 300˚C to 360˚C. It is then removed from the hot line and cooled to ambient temperature.
4
The rolling process
Twin roll castingThe alternative route to steps one through to fi ve, known as TRC, is a continuous process that produces an aluminium strip directly from molten metal. The combination of a high solidifi cation rate and deformation in a semi-solid state imparts specifi c characteristics to the resulting material that cannot be achieved through conventional DC casting and hot rolling. These same mechanisms limit the range of alloys that can be produced via the TRC process to the more dilute alloys of the 1xxx, 3xxx and 8xxx series. Typical products produced from TRC reroll stock include foil, closures, fi nstock, rigid foil containers, general engineering and painted sheet.
PreheatingRolling slabs are loaded into gas-fi red pre-heating furnaces at between 500˚C and 620˚C. These are pusher type furnaces where rolling slabs are ‘pushed’ sequentially through the furnace’s fi ve heating zones. Automated control systems regulate the temperatures for precise homogenisation.
HOTROLLING
TWIN ROLLCASTING
HOTROLLINGSCALPING PREHEATING
ALLOYINGELEMENTS
PRIMARYALUMINIUM
PROCESSSCRAP
REMELTING, SCRAP RECYLING AND CASTING
TWIN ROLLCASTING
AP TING
ALLOYINGELEMENTS
PRIMARYALUMINIUM
PROCESSSCRAP

Annual Report 2010 • page 5
6
78
9
10
11
12
13
Annealing After cold rolling, some products must be softened through reheating known as annealing. This is done to regulate the mechanical properties or to permit further reduction in thickness during cold rolling.
COLDROLLING
FINISHINGAREAS
ANNEALING
FOIL ROLLING
PLATE PRODUCTION
COIL COATING
COIL PROCESSING
INSPECTION AND PACKING
SHIPPING
COLD
Foil rollingFoil rolling is a cold rolling process designed for very thin products and certain alloys. Hulamin’s stand-alone foil mills can reduce cold rolled products to gauges as low as 6 micros.
Plate productionPlate products are those that do not require cold rolling and they generally include sheets thicker than 6 mm. Most plate rolled by Hulamin is produced from heat-treatable alloys. Heat treatment imparts strength to the fi nal products and involves heating, water cooling, and artifi cial hardening. Once the required mechanical properties are achieved, the plates are processed for width, length, fl atness and surface fi nish via automated shears, saws and cut-to-length lines.
Coil coatingProducts may require paint or lacquer for the manufacture of beverage can ends, building and construction products. The aluminium surface is cleaned, dried, and pre-treated. Paint or lacquer is applied using rollers and is thereafter oven cured. The coil coating process is designed to ensure highly consistent quality.
Coil processingMany customers require widths, lengths or coil sizes that are not ideal for cold rolling, and further processing is able to achieve the required dimensions. Also, fl atness and metal surface cleanliness can be mechanically improved through precision slitters, cut-to-length lines, shears, tension levellers, embossing rolls and degreasing lines.
Inspection and packingHulamin’s inspection process includes a variety of tests performed to verify properties and fi nish of the material. These are then released for shipment according to applicable international standards. Coils, sheets and plates are then packed for transportation to the customer.
ShippingCoils are transported to local customers, or to the port of Durban where containers are loaded at the harbour. Hulamin exports to more than sixty countries around the world, on all continents.
Cold rollingCold rolling is the process where hot rolled coils are rolled to the customer’s required thickness.
Cold rolling derives its name from the fact that coils are at ambient temperature when starting the rolling process, unlike hot rolling which requires preheating. Cold rolling pass schedules are designed by experienced metallurgical and control engineers to achieve the required tight gauge tolerances and mechanical properties.

6 page • Annual Report 2010
The Camps Drift Hot Line
Annual Report 2010 • page 7
1 2 3
4 5
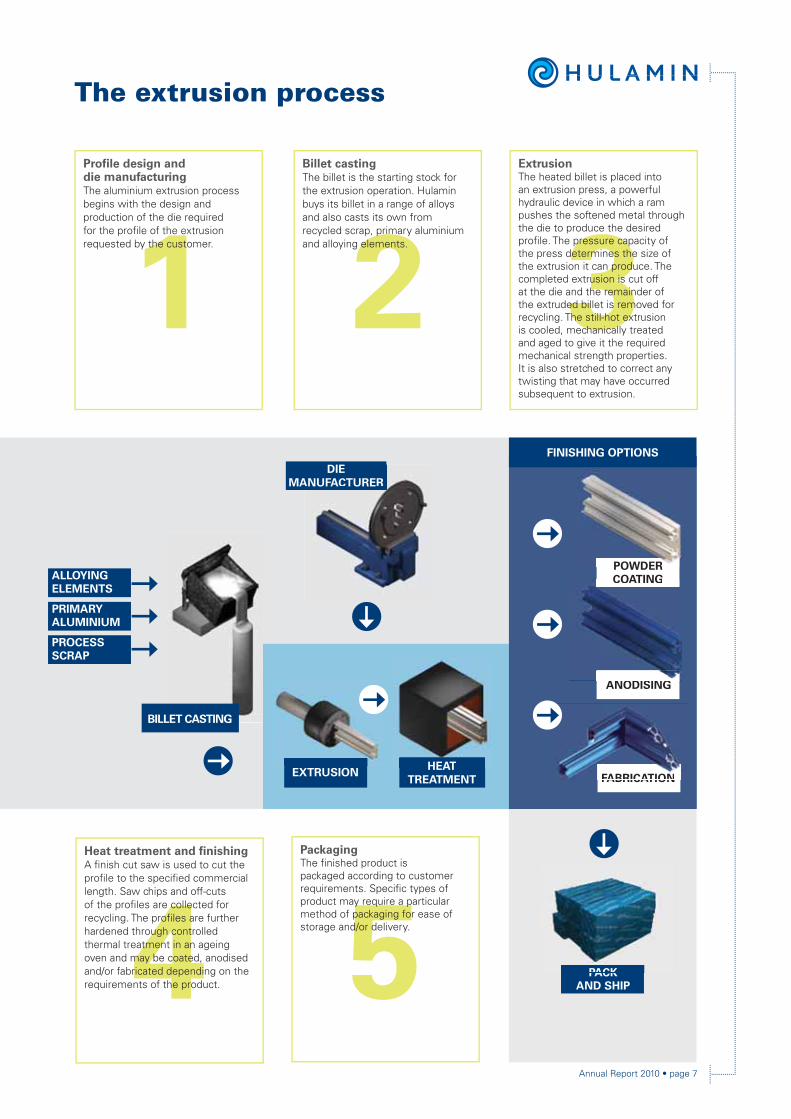
ExtrusionThe heated billet is placed into an extrusion press, a powerful hydraulic device in which a ram pushes the softened metal through the die to produce the desired profi le. The pressure capacity of the press determines the size of the extrusion it can produce. The completed extrusion is cut off at the die and the remainder of the extruded billet is removed for recycling. The still-hot extrusion is cooled, mechanically treated and aged to give it the required mechanical strength properties. It is also stretched to correct any twisting that may have occurred subsequent to extrusion.
Heat treatment and fi nishingA fi nish cut saw is used to cut the profi le to the specifi ed commercial length. Saw chips and off-cuts of the profi les are collected for recycling. The profi les are further hardened through controlled thermal treatment in an ageing oven and may be coated, anodised and/or fabricated depending on the requirements of the product.
PackagingThe fi nished product is packaged according to customer requirements. Specifi c types of product may require a particular method of packaging for ease of storage and/or delivery.
Billet castingThe billet is the starting stock for the extrusion operation. Hulamin buys its billet in a range of alloys and also casts its own from recycled scrap, primary aluminium and alloying elements.
Profi le design and die manufacturingThe aluminium extrusion process begins with the design and production of the die required for the profi le of the extrusion requested by the customer.
The extrusion process
DIE MANUFACTURER
PACK AND SHIP
ALLOYINGELEMENTS
PRIMARYALUMINIUM
PROCESSSCRAP
EXTRUSION HEAT TREATMENT
DIEANUFACTURER
HEAT
PACK
POWDER COATING
ANODISING
FABRICATIONFABRICATION
COATING
O S G
FINISHING OPTIONS
BILLET CASTING
POWDER

8 page • Annual Report 2010
Application of our products
Due to its payload advantages, aluminium is widely-used in the transport industry, e.g. truck bodies, trailers, tankers, boats and train wagons, together with their components. In cars, our products are
used in the manufacture of radiators, heat shields, car jacks, extruded suspension components, dashboards and other components.
Some of our extruded products are used in airplanes due to aluminium’s light-weight properties.
Our coated and uncoated building products are used in a wide range of structures in the building and construction industry, including roofs, facades, panels, components, awnings, cladding, gutters and downpipes, ceilings and many more.
Our extruded aluminium sections are used in the making of various household frames. These include doors, windows, facades, partitionings, furniture, pumps, scaffolding, ladders, fridges, stoves and lights.
Applications for our products are numerous and are available for everyday use. They are used in the manufacture of a wide range of packaging, building, construction, transport, automotive and general engineering end-use products through manufacturers, distributors and specifi ers in more than 60 countries across the globe.
Annual Report 2010 • page 9
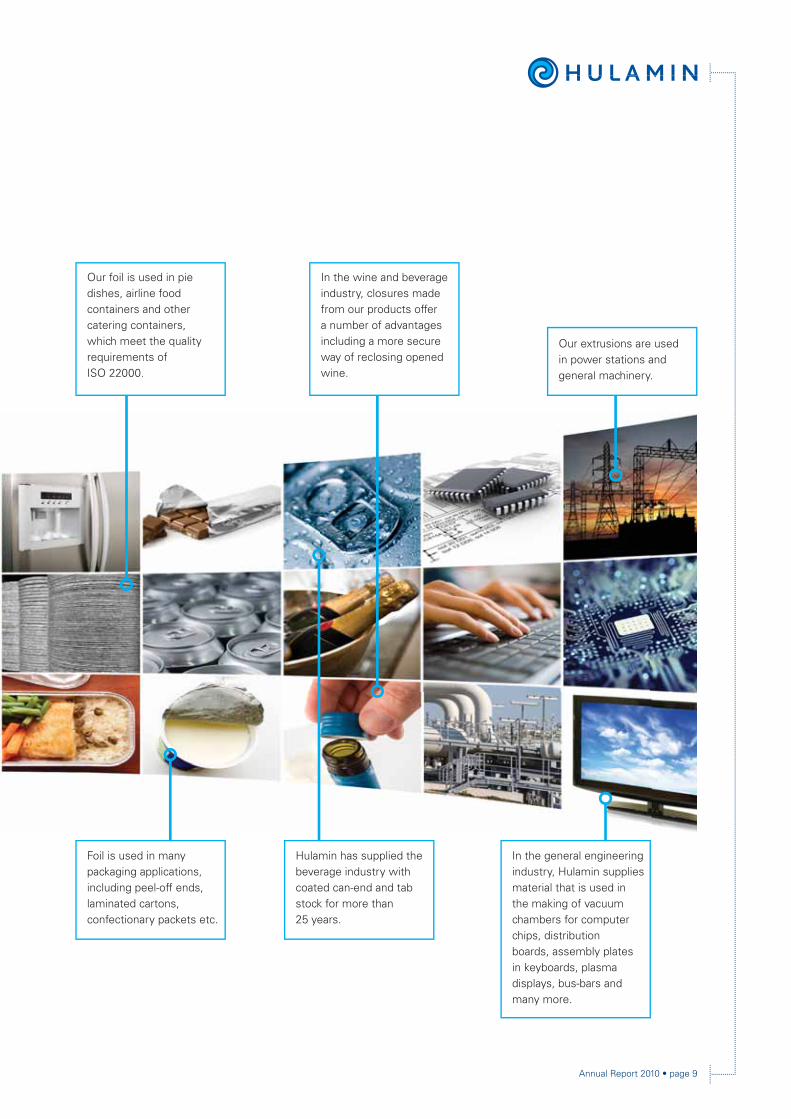
Our extrusions are used in power stations and general machinery.
Our foil is used in pie dishes, airline food containers and other catering containers, which meet the quality requirements of ISO 22000.
Foil is used in many packaging applications, including peel-off ends, laminated cartons, confectionary packets etc.
Hulamin has supplied the beverage industry with coated can-end and tab stock for more than 25 years.
In the wine and beverage industry, closures made from our products offer a number of advantages including a more secure way of reclosing opened wine.
In the general engineering industry, Hulamin supplies material that is used in the making of vacuum chambers for computer chips, distribution boards, assembly plates in keyboards, plasma displays, bus-bars and many more.
10 page • Annual Report 2010
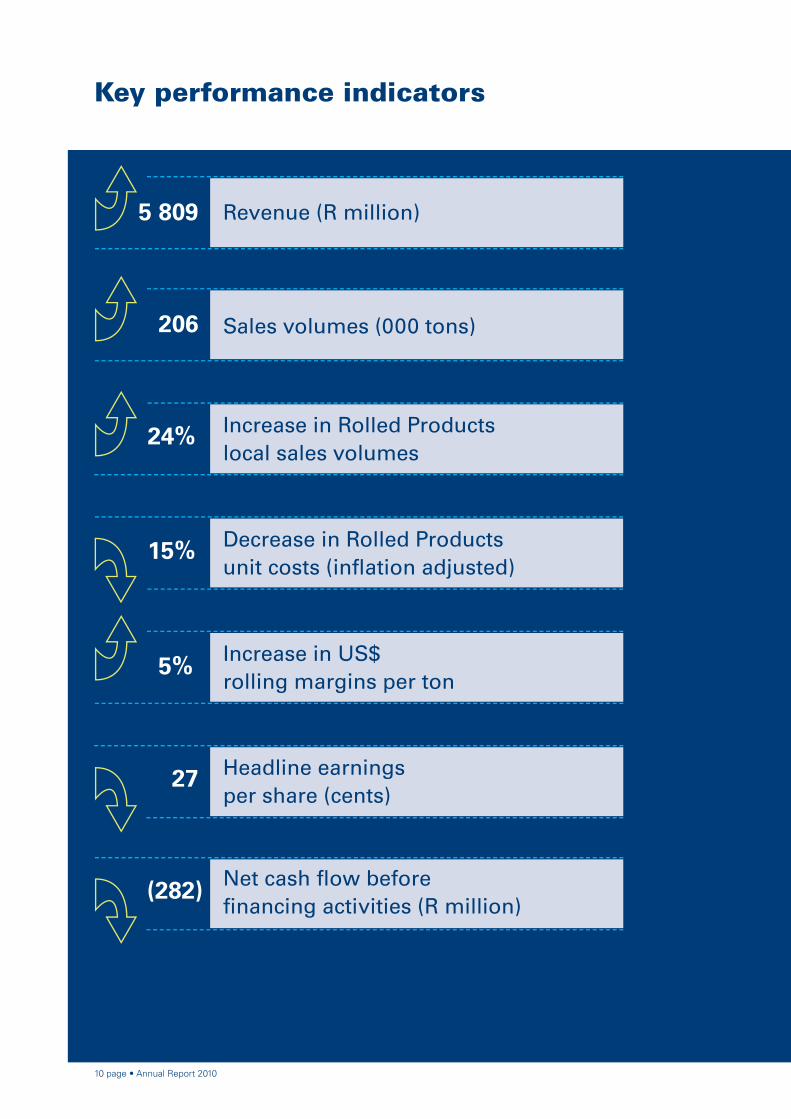
Key performance indicators
Net cash fl ow before fi nancing activities (R million)
Decrease in Rolled Productsunit costs (infl ation adjusted)
15%
Increase in Rolled Products local sales volumes
24%
5 809
Increase in US$ rolling margins per ton
5%
Headline earnings per share (cents)
27
(282)
Revenue (R million)
206 Sales volumes (000 tons)

Annual Report 2010 • page 11
Business objectives and deliverables
Business objective Achievement in 2010
Achieve a return that exceeds the cost of capital
Hulamin’s ROCE reduced from 3,8% in 2009 to 3,4% in 2010.
Grow Rolled Products sales volumes Rolled Products sales volumes grew by 32% compared to 142 000 tons in 2009.
Enhance product mix Rolled Products mix of high value products improved to 68% compared to 58% in 2009.
Maintain a competitive cost structure Specifi c cost reduction projects have generated sustainable cost savings approaching R200 million per annum.
Grow the local market Hulamin sales of Rolled Products in the local market grew by 24,3% compared to 2009.
Strategic priorities for 2011
• Continue the path of manufacturing excellence with emphasis on equipment reliability, process control and our Lean/Six Sigma projects.
• Maintain our overall safety performance improvement momentum.
• Improve our cost competitiveness.
• Improve our mix of high value products.
• Grow Rolled Products sales volumes towards full capacity of 250 000 tons.
• Optimise our investment in working capital.
12 page • Annual Report 2010
Chairman’s statement
Mafi ka Edmund Mkwanazi
The year 2010 proved to be one of the most challenging for South African manufacturing. Factors in the broader economy, specifi cally the strength of the Rand and energy infl ation, notably electricity, impacted on Hulamin and other manufacturers. In spite of these challenges, Hulamin showed many important improvements, reverting to its growth path, which had been interrupted by the impact of the global fi nancial crisis in 2008/9.

Annual Report 2010 • page 13
Corporate governance
The directors of Hulamin are fully committed to the principles of sound corporate governance, in particular engaging with integrity, transparency, responsibility, fairness and accountability with all stakeholders. Corporate Governance is covered in more depth on pages 44 to 49 of this report.
Sustainability
Hulamin continues to place a high priority on its sustainability initiatives and recognises that the achievement of its growth objectives and its sustainability performance are heavily intertwined. It is therefore imperative to continue with the maintenance of good and positive relationships with our stakeholders such as government, communities we operate in, capital providers and employees. We are committed to engaging with these stakeholders in an informed, responsive and socially accountable manner. It is most pleasing that Hulamin is one of only fi ve small cap companies to be included in the JSE Socially Responsible Index (SRI) and also, for the fi rst time, has completed a limited external assurance of its sustainability report. Sustainability is covered extensively in pages 22 to 43 of this report.
Availability of rolling slab and extrusion billet
BHP Billiton discontinued the supply of extrusion billet in 2009 and announced their intention to discontinue supply of rolling slab at the end of 2010, which was subsequently revised to the end of June 2012. We have continued to engage with BHP Billiton and other stakeholders in order to ensure long-term supply of aluminium rolling slab and extrusion billet. In addition to satisfying Hulamin’s requirements, our aim has also been to participate fully on a local industry basis to develop solutions for the benefi t of all. We remain concerned that the potential unavailability of essential aluminium raw material threatens the viability of the entire local aluminium industry. South Africa requires a healthy manufacturing industry for the growth of employment and there is much potential for a vibrant and growing downstream aluminium benefi ciation sector.
Appointments and restructuring
In July 2010, the Hulamin board appointed Richard Jacob as the new Chief Executive Offi cer following the retirement of Alan Fourie, and agreed to changes to the Executive Committee. These changes to the Executive Committee support Hulamin’s focus on operational effi ciency, sustainable growth and effective business support. New executives are Hector Molale and Pierre Taljaard who are responsible for corporate affairs and business technology respectively.
Appreciation
In June 2010, Alan Fourie retired from Hulamin after 27 years with the company, eight of which were as Managing Director and Chief Executive Offi cer. The board and I express our appreciation for the valuable contribution that Alan has made to Hulamin and wish him the best in his retirement.
On behalf of the board, I would like to thank the Hulamin team for their hard work and renewed efforts focusing on operational performance improvements.
Conclusion
Whilst headwinds remain, Hulamin has demonstrated renewed efforts to exploit the increased capacity and opportunities provided by substantial investment in recent years, and to improve returns to shareholders and other stakeholders. I look forward to a year of continued market recovery and further progress in manufacturing performance.
Mafi ka Edmund MkwanaziIndependent Non-executive Chairman
14 page • Annual Report 2010
Chief Executive Offi cer’s review
Richard Jacob
Hulamin emerged from the challenges of 2010 a healthier and more resilient business. Operational performance improved to record levels, our major cost reduction and effi ciency programme is continuing to show good results and inventory levels are reducing. Most pleasingly, employees have responded with renewed determination to the diffi cult economic climate and the restructuring that was completed in July.
Career in brief
1988 Appointed as a Training Offi cer in the South African Navy.
1990 Joined Hulett Aluminium as an Industrial Engineer.
1992 Promoted to Area Manager: Coil Coating following commissioning of the company’s R75 million Coil Coating Line project.
1996 On completion of an MBA, he was appointed as Market Manager for the company’s Building and Painted Products divisions. He also assumed the role of Business Development Manager responsible for growing the market for aluminium rolled products within the South African fabrication industry.
2002 Appointed to the board of directors of Hulett Aluminium and to the Executive Committee as director responsible for Coated Products, Hulamin Roofi ng Solutions and Corporate Affairs.
2010 Appointed to the board of Hulamin Limited as Chief Executive Offi cer.

Annual Report 2010 • page 15
EBIT before corporate structuring costs Annual average ZAR/USD rate
Demand for aluminium products continues unabated. In 2010, global aluminium consumption grew by 13%, as the world economy recovered from the 2009 recession. In the longer term, aluminium’s remarkable strength-to-weight ratio, ductility, barrier properties, conductivity, refl ectivity, corrosion resistance and, most importantly, its recyclability will continue to fuel growth ahead of global GDP.
World demand growth is being fuelled by developing countries. In Brazil, demand for aluminium grew by almost 16% in 2010 while in China, which uses more than one third of the world’s aluminium, consumption grew by approximately 21%. Through Hulamin’s packaging and automotive products particularly, we are well positioned to capitalise on the accelerating demand for packaged food and motor vehicles in the developing world.
The year 2010 provided a number of challenges for Hulamin. The inconsistent pace of global recovery resulted in variable demand while the Rand strengthened sharply against the US Dollar. In addition, Hulamin’s aluminium supplier, BHP Billiton, who has given notice to terminate supply of rolling slab, ceased shipments of extrusion billet towards the end of 2009. As an added complexity, completion of the R970 million Hulamin Rolled Products expansion project resulted in testing learning curves for the newly installed equipment and signifi cant fi xed cost increases ahead of the planned sales growth.
2010 Financial performance
Sales volumes increased to 206 000 tons from 159 000 in 2009, which resulted in turnover increasing to R5,81 billion in 2010 from R4,50 billion in the previous year.
Operating profi t was further enhanced by better US Dollar margins and a reduction in unit costs, the latter despite an increase in the cost base resulting from the start-up of new equipment and rising energy costs. This improvement in operational performance was offset by the strengthening of the Rand against the US Dollar, from R7,39 at the end of 2009 to R6,63 at the end of 2010, and operating profi t therefore reduced to R218 million from R244 million in 2009.
Operating cash fl ow totalled R48 million. Net cash outfl ow before fi nancing activities amounted to R282 million after deducting capital expenditure of R193 million, which was severely curtailed but included R71 million on the rolling slab and other capacity expansion projects, and interest paid of R137 million.
In June, Hulamin raised R750 million in a fully subscribed rights offer to shareholders, resulting in short and long-term borrowings being reduced. This capital was raised to fund additional slab casting capacity, to protect the business from aluminium price volatility and to fund working capital increases related to sales volume growth.
Hulamin Rolled Products
Rolled Products achieved sales of 187 000 tons in 2010, an increase of 32% over 2009 sales of 142 000 tons. Sales improved consistently during the year to 203 000 tons (annualised) in the second half, due to increased demand and higher production. The product mix improved in 2010 with sales of high-value products growing to 65% of the total, on the back of improvements in sales of can-end stock, brazing sheet, light gauge foil and heat treated plate. Can-end stock exports grew by 53% and foil by 200%, the latter due to the installation of new foil rolling capacity.
Brazing sheet, used for automotive heat exchangers such as radiators and charge air coolers, grew by 94% over 2009, although off a base severely affected by the global fi nancial crisis. Export markets for heat treated plate and standard products (sheet and plate) fi rmed steadily throughout the year, and Hulamin ended 2010 with full order books and rising US Dollar prices into the fi rst quarter of 2011.
Rolling margins (revenue less metal costs) in US Dollars improved consistently over the course of the year. The overall average rolling margin earned improved by 5%, driven both by fi rming demand and by the weakening Dollar. End-user products (largely automotive and packaging) continued their steady margin improvement, while the traditionally more volatile standard products (sheet and plate) improved more strongly as the year closed.
03 04 05 06 07 08 09 10
Can-end sales (‘000 tons)Rolled Products sales (‘000 tons)
03 04 05 06 07 08 09 10020100
10
8
6
500
400
300
200
100
0
200
150
100
50
60
50
40
30
20
10
0

16 page • Annual Report 2010
Hulamin Rolled Products has two downstream businesses: Hulamin Containers continues to produce healthy profi ts and strong cash fl ows, while Hulamin Roofi ng Solutions continues to establish itself and its Ziptech brand as one of the leading providers of sophisticated roofi ng solutions in the region.
Hulamin Extrusions
The extrusions industry in South Africa continues to face a broad range of challenges. These include the weak South African manufacturing and construction industries, the dependence on imported raw material in the form of extrusion billet and the sharp increase in imports from China.
Hulamin Extrusions incurred an operating loss of R8 million for the year, a disappointing turnaround from the operating profi t of R5 million in 2009 and R12 million in 2008. Volumes increased by 11% over 2009, while margins declined on the back of low priced imports into the local market. Costs were impacted by rising energy and manpower costs and the need to import billet, the latter also impacting the cash cycle, resulting in a reduced cash infl ow of R3 million.
Sales were affected by the South African port workers’ strike in April, which caused a temporary shortage of imported billet and the consequent loss of approximately 300 tons of sales. The building and construction industry, which provides the major market for aluminium extrusions, continues to decline, compounding the negative impact on sales. Plans passed in South Africa in 2010 reduced by 4,6% compared to 2009, while buildings completed declined by 19,6%. It was therefore not entirely unexpected that Africa Glass Industries, owner of the AGI Profal extrusion business, was placed in liquidation at the end of 2010.
While the South African market for extrusions recovered in 2010 off the low 2009 base, there was also a marked increase in the share of imported extrusions, primarily from China. The strength of the Rand, termination of extrusion billet supply in late 2009 and subsidised exports, especially from China, motivated the South African extruders under the auspices of the Aluminium Federation of South Africa (AFSA) to apply to the International Trade Administration Commission (ITAC) for the re-instatement of import duties on extrusions. Import duties were phased out by ITAC in 2009 – a move opposed by Hulamin at the time. Hearings at the Commission were completed at the end of 2010, the outcome of which is expected early in 2011.
All of Hulamin Extrusion’s downstream operations showed improved performance in 2010. The Hulamin Building Systems joint venture with Mazor Limited showed a pleasing turnaround and has returned to consistent profi tability, as has the Richard and Barlow joint venture with Duro Pressings. Equally encouraging has been the performance of Almin in Zimbabwe.
Metal supply
Until the end of 2009, Hulamin purchased three formats of metal from BHP Billiton. These included rolling slab and extrusion billet, the raw material inputs for the rolling and extrusion processes respectively, as well as melting ingot, from which Hulamin casts its own slab and billet. In November 2010, Hulamin signed a new fi ve-year agreement with BHP Billiton for the supply of its melting ingot requirements to 2015.
In 2009, BHP Billiton announced its plans to cease manufacturing both extrusion billet and rolling slab for the South African aluminium industry. Billet supply terminated in September 2009, while the contractual arrangement for slab supply will conclude in June 2012.
In contrast to growing global demand, the South African manufacturing industry remains troubled by the same headwinds as Hulamin: declining Rand export selling prices and imports fl ooding in as a result of the strong Rand. The Bureau for Economic Research reports that South African production volumes have declined overall since 2005 and capacity utilisation remains below 80%. The fl ood of imports has also been fuelled by current trade policy allowing free access of many imported products into the South African market from nations with subsidised and supported manufacturers. Hulamin’s local sales peaked in 2006.
The strength of the Rand has resulted in reduced export proceeds while local South African costs, particularly energy, continue to rise. Responding to this margin squeeze, Hulamin has intensifi ed its focus on reducing manufacturing costs and improving effi ciencies, increasing sales volumes and unlocking working capital. Particularly pleasing in 2010 were the improvements resulting from Hulamin’s manufacturing excellence programme, specifi cally product recoveries, unit cost reduction and throughput rates. Total annualised direct savings and improvements from interventions during the year amounted to R200 million.
Employment costs are the operation’s single largest manufacturing cost element, and the total effective employment complement has been reduced by six percent and total overtime hours worked have been reduced by close to 70%. At the same time total plant output increased to a six-month record of 200 000 annualised tons in the second half.
Installation and commissioning of the recent R970 million expansion project is complete. Specifi c focus is on the upgraded foil operation, on which approximately 55% of capital investment was spent. This operation, which is on its light gauge foil customer qualifi cation curve, has added approximately R20 million annually to the business’ fi xed cost base, and it is therefore a strong management focus for 2011 to accelerate the additional revenue generation from the new foil rolling operation.
Chief Executive Offi cer’s review continued

Annual Report 2010 • page 17
Hulamin produces both extrusion billet and rolling slab in its own facilities in Pietermaritzburg, but requires additional volumes over and above its own capacity. After the termination of local billet supply, Hulamin Extrusions commenced importing billet from October 2009, however at the cost of numerous technical, working capital and logistic complexities.
Throughout 2010, Hulamin worked closely with other industry stakeholders including BHP Billiton, extruders, the cable and wire industry, casting industry, government, the Aluminium Federation of South Africa and other agencies to explore alternatives to ensure long-term supply security necessary for the survival and growth of the benefi ciation industries currently supplied by the Bayside casthouse.
In April 2010, Hulamin approved a R75 million expansion of its slab casting and recycling capacity at its Pietermaritzburg plant which will start-up during the fi rst half of 2011 and will add approximately 50 000 tons of annual slab casting capacity.
Additional projects, cumulatively required to provide suffi cient rolling slab to enable Hulamin Rolled Products to reach full capacity of 250 000 tons, will remain on hold until all preferred alternatives have been exhausted.
Appreciations
Doug Timmerman served Hulamin for 32 years, most recently as Operations Director in Hulamin Rolled Products, and decided to take early retirement at the end of 2010. Doug’s passion for the company has inspired many, and he will be remembered for his enormous contribution in shaping Hulamin as a leading aluminium rolling operation.
Wolfgang Ortner joined Hulamin in 2007 and assisted in establishing its North American and European sales infrastructure. Wolfgang brought a wealth of international experience to the Hulamin team, led the international sales team from start-up and provided a valuable external perspective to the executive.
Prospects
The renewed focus on achieving global benchmarks in manufacturing performance and in utilising best practices in improving operational performance maintained its acceleration throughout 2010 and will continue to be the focus of management effort in the year ahead. Hulamin has invested in product technology to further improve its product range and sell higher margin products. The benefi ts of these investments will be seen in improvements to both the mix of high value products and margins earned.
After the disruptions resulting from the 2008/9 economic crisis, Hulamin has returned to its trajectory of increasing volume growth, mix improvement, cost containment and working capital optimisation to deliver an attractive return on the capital invested in the business. With the operational improvements currently underway, Hulamin is well positioned to show signifi cant benefi ts from the satisfactory resolution of the rolling slab and extrusion billet supply issues, further improvement in its markets and any return to the purchase-power-parity/interest-rate-parity measured value of the Rand.
Richard JacobChief Executive Offi cer
Mauritz van der Westhuizen and Sibusiso Hlongwane, CNC Machine Operators
Brian Ngcobo, Foil Inspector
Aluminium rolling slab on the Hot Roughing Mill
18 page • Annual Report 2010
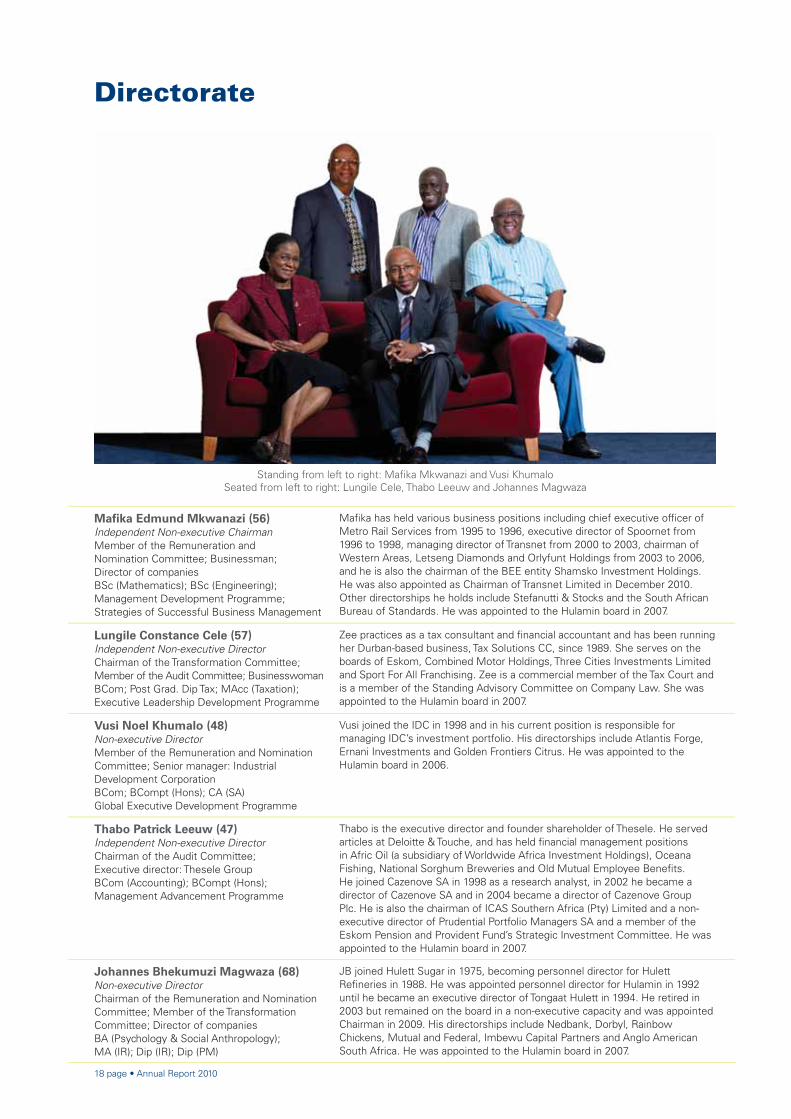
Directorate
Mafi ka Edmund Mkwanazi (56)Independent Non-executive ChairmanMember of the Remuneration and Nomination Committee; Businessman; Director of companiesBSc (Mathematics); BSc (Engineering); Management Development Programme; Strategies of Successful Business Management
Mafi ka has held various business positions including chief executive offi cer of Metro Rail Services from 1995 to 1996, executive director of Spoornet from 1996 to 1998, managing director of Transnet from 2000 to 2003, chairman of Western Areas, Letseng Diamonds and Orlyfunt Holdings from 2003 to 2006, and he is also the chairman of the BEE entity Shamsko Investment Holdings. He was also appointed as Chairman of Transnet Limited in December 2010. Other directorships he holds include Stefanutti & Stocks and the South African Bureau of Standards. He was appointed to the Hulamin board in 2007.
Lungile Constance Cele (57)Independent Non-executive DirectorChairman of the Transformation Committee; Member of the Audit Committee; BusinesswomanBCom; Post Grad. Dip Tax; MAcc (Taxation);Executive Leadership Development Programme
Zee practices as a tax consultant and fi nancial accountant and has been running her Durban-based business, Tax Solutions CC, since 1989. She serves on the boards of Eskom, Combined Motor Holdings, Three Cities Investments Limited and Sport For All Franchising. Zee is a commercial member of the Tax Court and is a member of the Standing Advisory Committee on Company Law. She was appointed to the Hulamin board in 2007.
Vusi Noel Khumalo (48)Non-executive DirectorMember of the Remuneration and Nomination Committee; Senior manager: Industrial Development CorporationBCom; BCompt (Hons); CA (SA) Global Executive Development Programme
Vusi joined the IDC in 1998 and in his current position is responsible for managing IDC’s investment portfolio. His directorships include Atlantis Forge, Ernani Investments and Golden Frontiers Citrus. He was appointed to the Hulamin board in 2006.
Thabo Patrick Leeuw (47)Independent Non-executive DirectorChairman of the Audit Committee;Executive director: Thesele GroupBCom (Accounting); BCompt (Hons);Management Advancement Programme
Thabo is the executive director and founder shareholder of Thesele. He served articles at Deloitte & Touche, and has held fi nancial management positions in Afric Oil (a subsidiary of Worldwide Africa Investment Holdings), Oceana Fishing, National Sorghum Breweries and Old Mutual Employee Benefi ts. He joined Cazenove SA in 1998 as a research analyst, in 2002 he became a director of Cazenove SA and in 2004 became a director of Cazenove Group Plc. He is also the chairman of ICAS Southern Africa (Pty) Limited and a non-executive director of Prudential Portfolio Managers SA and a member of the Eskom Pension and Provident Fund’s Strategic Investment Committee. He was appointed to the Hulamin board in 2007.
Johannes Bhekumuzi Magwaza (68)Non-executive DirectorChairman of the Remuneration and Nomination Committee; Member of the Transformation Committee; Director of companiesBA (Psychology & Social Anthropology); MA (IR); Dip (IR); Dip (PM)
JB joined Hulett Sugar in 1975, becoming personnel director for Hulett Refi neries in 1988. He was appointed personnel director for Hulamin in 1992 until he became an executive director of Tongaat Hulett in 1994. He retired in 2003 but remained on the board in a non-executive capacity and was appointed Chairman in 2009. His directorships include Nedbank, Dorbyl, Rainbow Chickens, Mutual and Federal, Imbewu Capital Partners and Anglo American South Africa. He was appointed to the Hulamin board in 2007.
Standing from left to right: Mafi ka Mkwanazi and Vusi KhumaloSeated from left to right: Lungile Cele, Thabo Leeuw and Johannes Magwaza
Annual Report 2010 • page 19
Nomgando Nomalungelo Angelina Matyumza (47)Independent Non-executive Director Member of the Audit Committee BCom; BCompt (Hons); CA (SA); LLB Ordained Minister of Religion
Nomgando has held various positions in fi nancial and general management and was employed between 1994 and 2004 at Petronet, fi rstly as fi nancial manager and then as deputy CEO from 1999 to 2004. From 2004 to 2008 she was employed at Eskom Distribution as general manager for the Eastern Region.Nomgando is presently an ordained Minister of the African Methodist Episcopal Church at Umlazi, KwaZulu-Natal. She is a director on a number of boards, including Transnet Limited, Wilson Bayley Holmes-Ovcon Limited and, with effect from 1 February 2010, Cadiz Holdings Limited. She was appointed to the Hulamin board with effect from 1 March 2010.
Sibusiso Peter-Paul Ngwenya (57)Non-executive Director Executive chairman: Makana Investment Corporation BCom (Hons)
Following his release from Robben Island in 1991, Peter-Paul joined Engen and later South African Breweries. In 1997 he joined Makana Trust, where he is a founding trustee and former chairman. He later co-founded Makana Investment Corporation of which he is the current executive chairman. Peter-Paul is the treasurer of the Ex-Political Prisoners Committee. He is also the chairman of South African Airlink, Heart 104.9 and Igagasi 99.5 radio stations and Sebenza Forwarding and Shipping Consultancy. He was appointed to the Hulamin board in 2007 as an alternate to Johannes Bhekumuzi Magwaza and a full director of Hulamin in October 2009.
Peter Heinz Staude (57)Independent Non-executive Director Chief executive offi cer: Tongaat Hulett Limited BSc (Ind Eng) (Hons) (cum laude); MBA
Peter lectured at the University of Pretoria before joining Hulamin in 1978. In 1990 he became managing director of Hulamin Rolled Products and in 1996 managing director of Hulamin. He was appointed chief executive offi cer of Tongaat Hulett in 2002. Peter was chairman of the Hulamin board from 2002 to July 2007. He is also chairman of Trade and Investment KwaZulu-Natal.
Richard Jacob (45)Chief Executive Offi cerBSc (Engineering); MBA
Richard joined Hulamin in 1990 and was appointed Chief Executive Offi cer with effect from 1 July 2010. Prior to his appointment as Chief Executive Offi cer in 2010, he led Hulamin Rolled Products coated products business, which included can-end stock and painted products. Richard was also responsible for the communication and investor relations functions at Hulamin and for Hulamin Roofi ng Solutions.
Charles Daniel Hughes (55)Chief Financial Offi cer BAcc; CA (SA)
Charles joined Hulamin in 1979 and was appointed fi nancial directorof Hulamin in 2003 and chief fi nancial offi cer in 2007. Charles is alsodirector of a number of Hulamin subsidiaries.
Moses Zamani Mkhize (49)Executive Director: Foil ProductsBCom (Hons); Higher Diploma (Electrical Engineering)
Moses joined Hulamin in July 1982, was appointed Hot Mill production manager in 1989 and Foil Mill manager in 1994. In 1997 he became a director of Hulamin Rolled Products and in 2000 he was appointed a director of Hulamin. He is also a director of a number of subsidiaries of Hulamin.
Note: Ages quoted for all directors are at 31 December 2010
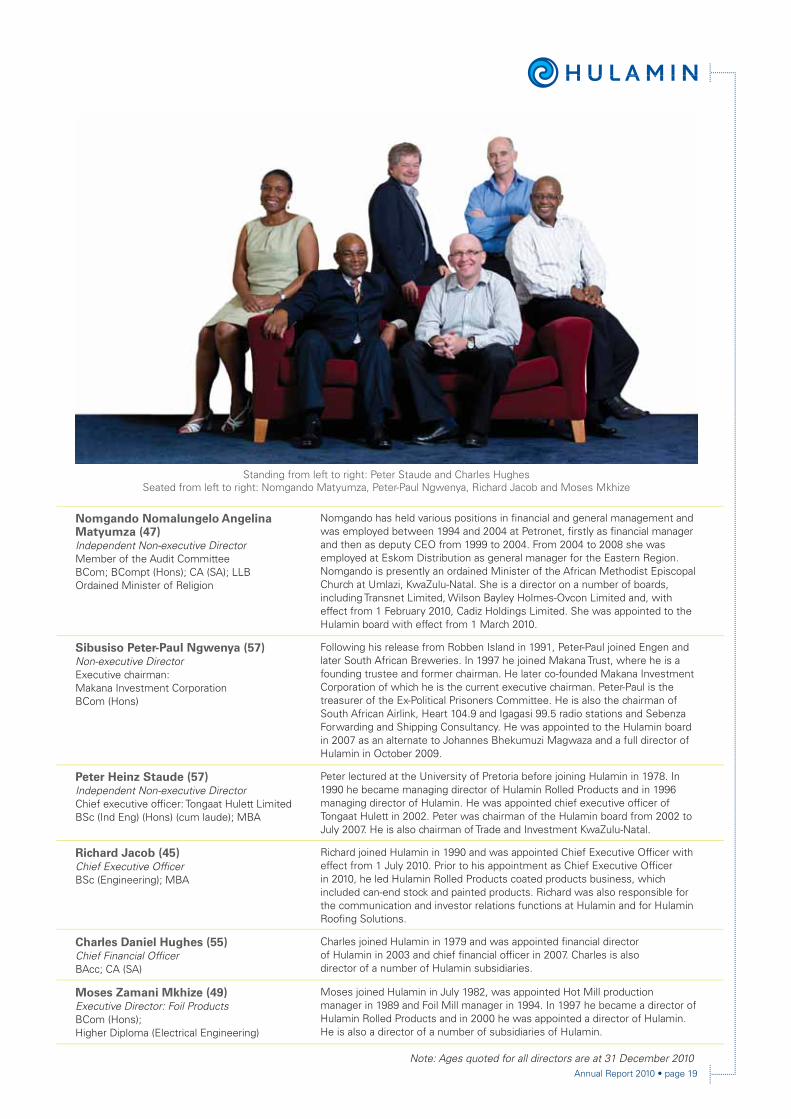
Standing from left to right: Peter Staude and Charles HughesSeated from left to right: Nomgando Matyumza, Peter-Paul Ngwenya, Richard Jacob and Moses Mkhize
20 page • Annual Report 2010
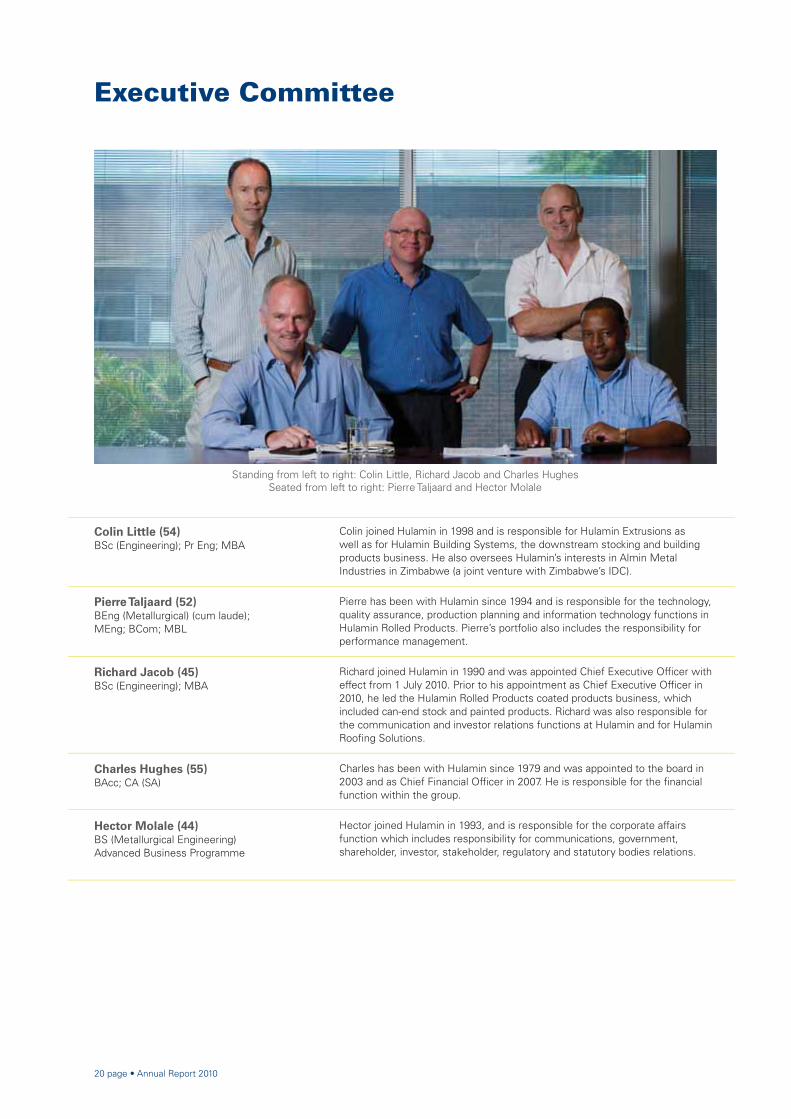
Colin Little (54)BSc (Engineering); Pr Eng; MBA
Colin joined Hulamin in 1998 and is responsible for Hulamin Extrusions as well as for Hulamin Building Systems, the downstream stocking and building products business. He also oversees Hulamin’s interests in Almin Metal Industries in Zimbabwe (a joint venture with Zimbabwe’s IDC).
Pierre Taljaard (52)BEng (Metallurgical) (cum laude); MEng; BCom; MBL
Pierre has been with Hulamin since 1994 and is responsible for the technology, quality assurance, production planning and information technology functions in Hulamin Rolled Products. Pierre’s portfolio also includes the responsibility for performance management.
Richard Jacob (45)BSc (Engineering); MBA
Richard joined Hulamin in 1990 and was appointed Chief Executive Offi cer with effect from 1 July 2010. Prior to his appointment as Chief Executive Offi cer in 2010, he led the Hulamin Rolled Products coated products business, which included can-end stock and painted products. Richard was also responsible for the communication and investor relations functions at Hulamin and for Hulamin Roofi ng Solutions.
Charles Hughes (55)BAcc; CA (SA)
Charles has been with Hulamin since 1979 and was appointed to the board in 2003 and as Chief Financial Offi cer in 2007. He is responsible for the fi nancial function within the group.
Hector Molale (44)BS (Metallurgical Engineering)Advanced Business Programme
Hector joined Hulamin in 1993, and is responsible for the corporate affairs function which includes responsibility for communications, government, shareholder, investor, stakeholder, regulatory and statutory bodies relations.
Executive Committee
Standing from left to right: Colin Little, Richard Jacob and Charles HughesSeated from left to right: Pierre Taljaard and Hector Molale
Annual Report 2010 • page 21
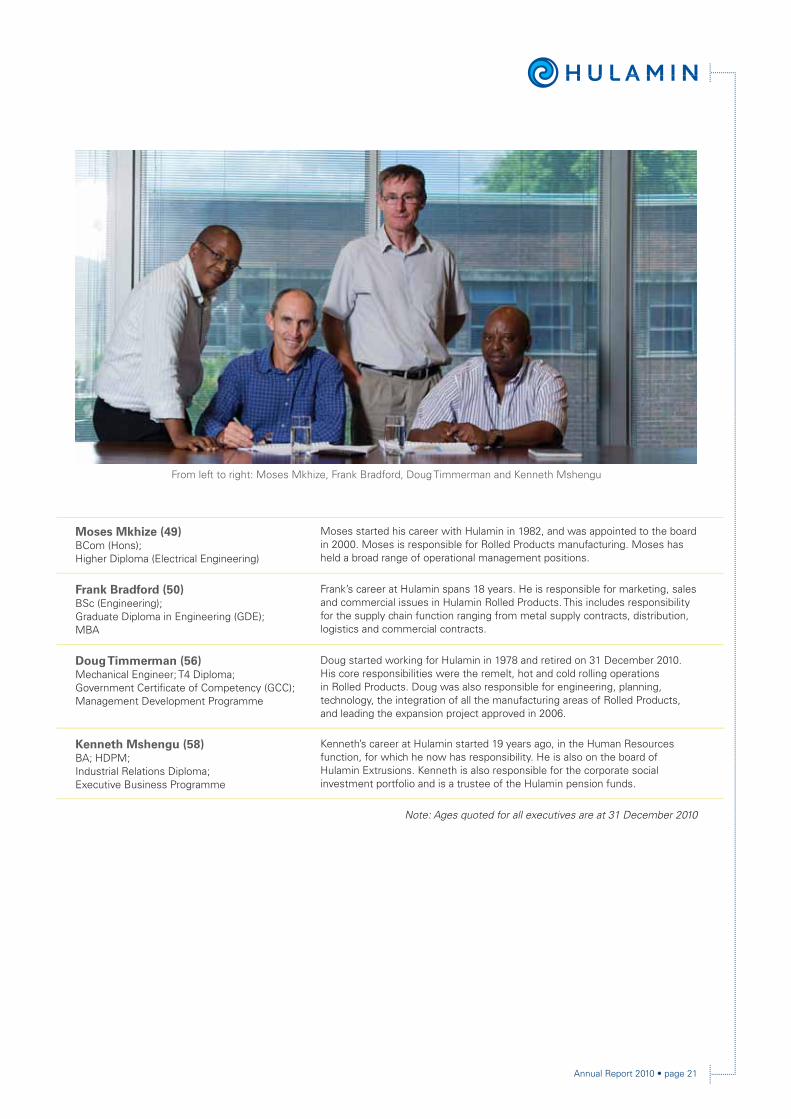
Moses Mkhize (49)BCom (Hons); Higher Diploma (Electrical Engineering)
Moses started his career with Hulamin in 1982, and was appointed to the board in 2000. Moses is responsible for Rolled Products manufacturing. Moses has held a broad range of operational management positions.
Frank Bradford (50)BSc (Engineering); Graduate Diploma in Engineering (GDE); MBA
Frank’s career at Hulamin spans 18 years. He is responsible for marketing, sales and commercial issues in Hulamin Rolled Products. This includes responsibility for the supply chain function ranging from metal supply contracts, distribution, logistics and commercial contracts.
Doug Timmerman (56)Mechanical Engineer; T4 Diploma; Government Certifi cate of Competency (GCC); Management Development Programme
Doug started working for Hulamin in 1978 and retired on 31 December 2010. His core responsibilities were the remelt, hot and cold rolling operations in Rolled Products. Doug was also responsible for engineering, planning, technology, the integration of all the manufacturing areas of Rolled Products, and leading the expansion project approved in 2006.
Kenneth Mshengu (58)BA; HDPM; Industrial Relations Diploma;Executive Business Programme
Kenneth’s career at Hulamin started 19 years ago, in the Human Resources function, for which he now has responsibility. He is also on the board of Hulamin Extrusions. Kenneth is also responsible for the corporate social investment portfolio and is a trustee of the Hulamin pension funds.
Note: Ages quoted for all executives are at 31 December 2010
From left to right: Moses Mkhize, Frank Bradford, Doug Timmerman and Kenneth Mshengu

22 page • Annual Report 2010
Sustainability report
MESSAGE FROM THE CHIEF EXECUTIVE OFFICER
At Hulamin we remain committed to our core purpose of being accountable to our stakeholders for the impact we have on our community, environment and industry.
Despite operating in a tough business environment in 2010, Hulamin continued to improve its performance in the broader areas of sustainability. For the fi rst time, in line with the requirements of South Africa’s King Code of Governance Principles (King III), Hulamin has engaged in a sustainability assurance programme. We continue using Global Reporting Initiative (GRI) G3 guidelines, supported by Hulamin’s internal guidelines to standardise our reporting process and to afford stakeholders the opportunity to compare Hulamin with other organisations.
The aim of our sustainability report is to provide those Hulamin stakeholders a more in-depth level of detail about our sustainability performance. For this reporting period, selected KPIs were identifi ed and subjected to external independent limited assurance. This same report is communicated to employees through various internal communication channels.
We recognise that growing our business is ultimately dependent on attracting and retaining the best and most skilled employees, those who are proud of Hulamin’s performance in all spheres of activity. This growth is also achieved by maintaining positive relationships with other principal stakeholders; including funders, shareholders, suppliers and customers, and the communities we operate in. We are committed to continue conducting our business in an informed, responsive and socially responsible manner.
Economic development, climate change, energy and water scarcity are challenges that are becoming important and have a bearing on our business activities. We do, however, recognise that we are part of a collective society in responding to these challenges.
I am particularly proud of the work of my colleagues who have contributed to this report and would like to acknowledge these efforts in reporting the positive contributions to society by the entire Hulamin team.
REPORT PROFILE
This report is an overview of Hulamin’s sustainability performance during the 2010 fi nancial year, with references to, and comparison with, data from previous years where appropriate.
The foundation for Hulamin’s strategic agenda and vision of being a recognised global enterprise is based on the principle that organisation health and growth cannot be separated and consequently, sustainability must underpin all our actions.
We have been conscious of making positive socio-economic contributions in the region where we operate, by stimulating job creation, contributing
One of Hulamin’s benefi ciaries, Ekukhanyeni School for mentally impaired children, is located in Imbali township near Pietermaritzburg

Annual Report 2010 • page 23
to skills development, investing in the community, and promoting broad-based black economic empowerment (BBBEE). We have also actively pursued a culture of safety in the workplace. As a responsible corporate citizen we have sought to reduce our environmental footprint, especially in reducing our greenhouse gas emission and water usage impacts.
This report does not cover the entire list of GRI G3 indicators; rather it follows the format of the 2009 report with the added dimension of limited assurance on selected KPIs.
Where available, targets are covered in this report. Where targets are absent, notably in the Environmental section, this is due to the complexity in understanding what is possible in our unique circumstances. In these cases, the philosophy of continuous improvement is adopted until such time as targets have been set.
STAKEHOLDER ENGAGEMENT
We interact with our stakeholders on a regular basis. Our most important stakeholder group remains our employees with whom we conduct structured and regular communication.
Our key stakeholder categories are as follows:
Employees
Employees are the foundation upon which all our activities depend. Effective communication with employees is essential to the ongoing functioning of the business. We use many different channels to communicate with employees, including:
1. Weekly shopfl oor walkabouts by all members of the Executive Committee;
2. Regular letters from the Chief Executive Offi cer;
3. Internal newsletters;
4. Communication boards;
5. Employee relations meetings;
6. Shop-fl oor briefi ngs; and
7. Interim and full-year fi nancial performance updates.
We continuously seek ways for further engagement with our employees.
Government
We continually work to establish and maintain constructive relations with government through a range of agencies at national, provincial and local levels. We constantly seek to integrate and align with government policy and growth objectives in our growth planning.
Investors
Our funders and the broader investment community are constantly updated of our fi nancial results and other topical issues through regular presentations and discussions with bankers, investment analysts, fund managers and journalists. The broader investment public receives information about Hulamin in key daily newspapers, radio and television.
Suppliers and customers
We work closely with our contractors, service providers and our customers to understand and address their concerns and requirements on material issues.
Other stakeholders
We continue to engage cooperatively with our peers through industry associations, which also provide a conduit for communication with government.
Local communities and non-governmental organisations
We engage with the communities where we operate to better understand their concerns and interests, giving us an opportunity to participate appropriately. We contribute widely in corporate social investment activities within the immediate communities.
The media
We remain engaged with the media in sharing information that seeks to promote Hulamin, its activities and products.
Scope and boundaries
Apart from sales offi ces in Europe and North America, Hulamin is located entirely in South Africa. All reporting takes place within the South African regulatory and socio-economic context, with consideration for international standards.
Participating in sustainability indices
In 2010, Hulamin was admitted into the Socially Responsible Index (SRI) by the Johannesburg Securities Exchange (JSE) for notable corporate governance, and environmental and social responsibility practices. The JSE’s SRI encourages companies to embrace the triple bottom line (social, economic and environmental performance) as a method of doing business, while balancing this with the need to demonstrate a return for the shareholders. We are proud to be only one of fi ve small cap companies to be inducted in 2010.
STATEMENT OF VERIFICATION
All content and qualitative data included in this report has been reviewed and approved by Hulamin senior management. KPMG has provided limited assurance over selected KPIs. Particular emphasis has been placed on ensuring that the report refl ects a complete and fair picture of sustainability issues impacting the company.

24 page • Annual Report 2010
Sustainability report continued
INDEPENDENT ASSURANCE REPORT ON SELECTED SUSTAINABILITY INFORMATION
To the directors of Hulamin Limited
We have undertaken an assurance engagement on selected sustainability information, as described below and presented in the Sustainability Report included in the 2010 Annual Report of Hulamin Limited (Hulamin) for the year ended 31 December 2010 (the Report).
We have complied with the International Federation of Accountants’ Code of Ethics for Professional Accountants, which includes comprehensive independence and other requirements founded on fundamental principles of integrity, objectivity, professional competence and due care, confi dentiality and professional behaviour. Our engagement was conducted by a multidisciplinary team of health, safety, social, environmental and assurance specialists with extensive experience in sustainability reporting.
Selected sustainability information and level of assurance
We are required to provide limited assurance on the indicators below:
• Employment equity indicators (expressed as the total number of people for each category) – black representation at senior management; black representation at middle management; black representation at skilled and supervisory level; women at senior management; women at middle management; women at skilled and supervisory level; people with disabilities (page 37).
• Social performance indicators (expressed in Rand) – socio-economic development (SED) (CSI component) spend (page 30); total BBBEE spend (page 29); total skills development spend for disabled and black employees (page 41); total enterprise development spend (page 27).
• Environmental indicators – direct energy consumption (page 32); indirect energy consumption (page 32); carbon footprint (page 33); total water consumption (page 35); total weight of waste disposed (by category) or recycled (page 34); number of environmental incidents (page 32).
• Health and safety indicators – HIV/AIDS spend (expressed in Rand) (page 39); noise induced hearing loss (NIHL) cases for year (page 43); employee and contractor lost time injury frequency rate (LTIFR)(page 42).
Directors’ responsibilities
The directors are responsible for the selection, preparation and presentation of the sustainability information, the identifi cation of stakeholders and stakeholder requirements, material issues, for commitments with respect to sustainability performance, and establishing and maintaining appropriate performance management and internal control systems from which the reported information is derived, and for such internal control as the directors determine is necessary to enable the preparation of the Sustainability Report that is free from material misstatement, whether due to fraud or error.
The directors are also responsible for the selection and application of the criteria, which are the Global Reporting Initiative (GRI) G3 Guidelines, to the selected sustainability information.
Annual Report 2010 • page 25
Our responsibility
Our responsibility is to express a limited assurance conclusion on the selected sustainability information based on our work performed. We conducted our engagement in accordance with International Standard on Assurance Engagements (ISAE) 3000, Assurance Engagements other than the Audits or Reviews of Historical Financial Information, issued by the International Auditing and Assurance Standards Board. That Standard requires that we plan and perform our engagement to obtain limited assurance about whether the selected information is free from material misstatement.
Our procedures and the extent of our procedures depend on our judgement, including the risks of material misstatement of the selected sustainability information. In making our risk assessments, we considered internal control relevant to Hulamin’s preparation of the Report. In a limited assurance engagement, the evidence gathering procedures are less than where reasonable assurance is expressed. We believe the evidence we have obtained is suffi cient and appropriate to provide a basis for our limited assurance conclusion.
Summary of work performed
Our work included the following evidence gathering procedures:
• Interviewing management to obtain an understanding of the internal control environment, risk assessment process and information systems relevant to the sustainability reporting process;
• Testing the controls which generate, collate, aggregate and monitor the selected sustainability information;
• Inspecting supporting documentation and performing analytical procedures; and
• Evaluating whether the information presented in the Report is consistent with our overall knowledge and experience of sustainability management and performance at Hulamin.
Conclusion
Based on our work performed, nothing has come to our attention that causes us to believe that the selected sustainability information set out above, for the year ended 31 December 2010, is not fairly stated in all material respects in accordance with the Global Reporting Initiative (GRI) G3 Guidelines.
Limitation of liability
Our work has been undertaken to enable us to express a limited assurance conclusion on the selected sustainability information to the Directors of Hulamin in accordance with the terms of our engagement, and for no other purpose. We do not accept or assume liability to any party other than Hulamin, for our work, for this Report, or for the conclusion we have reached.
KPMG Services (Pty) Limited
Per PD NaidooDirectorJohannesburg
16 March 2011

26 page • Annual Report 2010
Sustainability report continued
SOCIAL RESPONSIBILITY
Enterprise development
Philosophy and why it is important
The goal of Enterprise Development (ED) at Hulamin is to facilitate the development of sustainable black-owned businesses as preferred suppliers. Hulamin is committed to this process by providing business opportunities to new enterprises and support for small, medium and micro enterprises (SMMEs) through the provision of professional, fi nancial and logistical support as well as various start-up support services.
Successful implementation of ED ensures participation of SMMEs in Hulamin’s supply, which results in positive cost benefi ts to the business while facilitating skills development and job creation.
Responsibilities
The Black Economic Empowerment (BEE) Review Committee coordinates activities of enterprise development, as well as procurement activities, and reports to the Transformation Committee, which is a sub-committee of the board. An independent accredited verifi cation agency verifi es records of enterprise development activities.
Approach
Enterprise development strategies and activities are mandated by the BEE Review Committee at quarterly reviews, where feedback is provided on ED performance against targets, resources are allocated and fresh mandates are provided. Hulamin has also developed a partnership with the Pietermaritzburg-based Business Support Centre (BSC), a non-governmental organisation which is well equipped to facilitate ED, providing a far broader impact than Hulamin can achieve on its own. Hulamin supported the BSC to the extent of R300 000 in 2010 alone, and a cumulative total of almost R900 000 since 2006.
Targets and performance
Targets for 2010:
• Establish fi ve black business enterprises to provide Hulamin with goods and services; and
• Provide business support to existing Hulamin contractors to maintain or increase business with Hulamin.
Four enterprises were established during 2010, being:
• Hulacore – engineering;
• Progress Engineering – engineering;
• Mapholoba Metal Works – industrial ducting services; and
• Winter Knight – forklifts.
R’000 2010 2009
Turnover 5 808 667 4 499 582
Bought-in materials and services 4 665 636 3 422 944
Value added by
operations 1 143 031 1 076 638
Applied as follows:
To pay employees
Salaries, wages and benefi ts 729 997 636 140
To pay providers
of capital 116 923 142 350
Interest on borrowings 116 923 113 813
Dividends to ordinary shareholders – 28 537
Taxation 30 716 40 911
Re-invested in
business 265 395 257 237
Depreciation 192 899 197 733
Retained earnings 72 496 59 504
1 143 031 1 076 638
Value added analysis
Distribution of value added
2010 2009
Employees
Providers of capital
Tax
Reinvested
63,9%
10,2%
2,7%
23,2%
59,1%
13,2%
3,8%
23,9%
ECONOMIC VALUE
Value added analysis
The minimum wage rate is R29,76 per hour.
Annual Report 2010 • page 27
Successful enterprise development projects facilitated by Hulamin in 2010
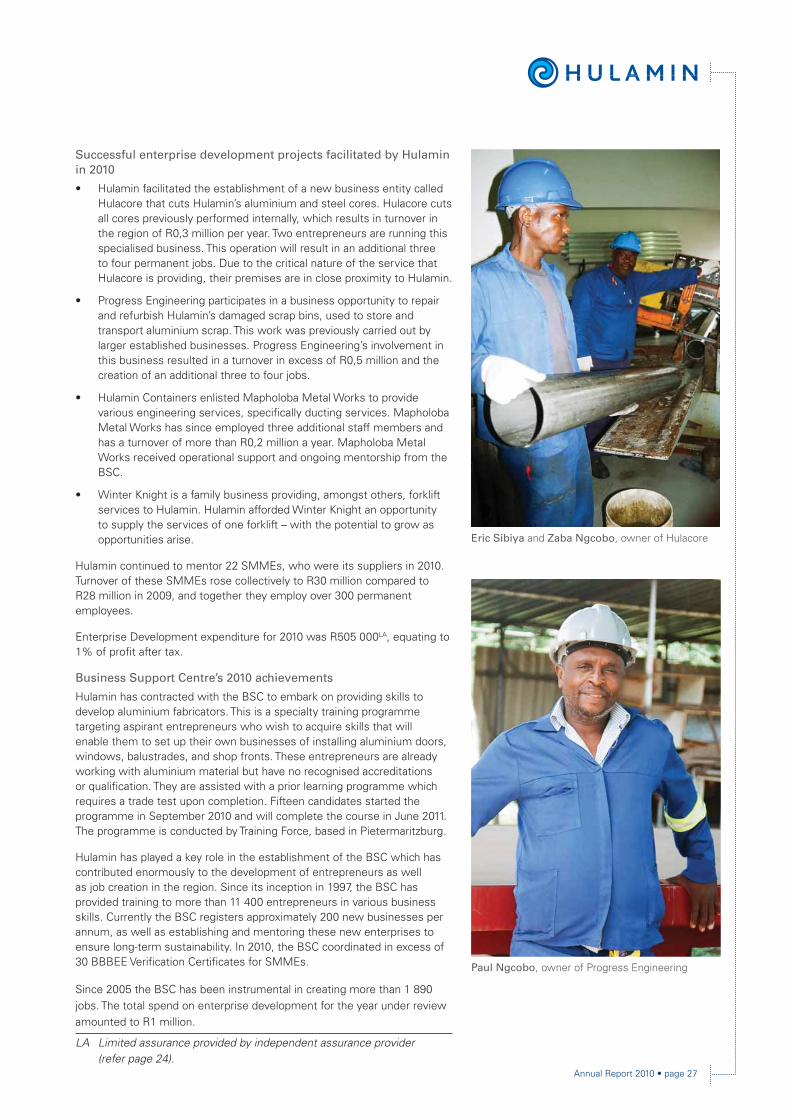
• Hulamin facilitated the establishment of a new business entity called Hulacore that cuts Hulamin’s aluminium and steel cores. Hulacore cuts all cores previously performed internally, which results in turnover in the region of R0,3 million per year. Two entrepreneurs are running this specialised business. This operation will result in an additional three to four permanent jobs. Due to the critical nature of the service that Hulacore is providing, their premises are in close proximity to Hulamin.
• Progress Engineering participates in a business opportunity to repair and refurbish Hulamin’s damaged scrap bins, used to store and transport aluminium scrap. This work was previously carried out by larger established businesses. Progress Engineering’s involvement in this business resulted in a turnover in excess of R0,5 million and the creation of an additional three to four jobs.
• Hulamin Containers enlisted Mapholoba Metal Works to provide various engineering services, specifi cally ducting services. Mapholoba Metal Works has since employed three additional staff members and has a turnover of more than R0,2 million a year. Mapholoba Metal Works received operational support and ongoing mentorship from the BSC.
• Winter Knight is a family business providing, amongst others, forklift services to Hulamin. Hulamin afforded Winter Knight an opportunity to supply the services of one forklift – with the potential to grow as opportunities arise.
Hulamin continued to mentor 22 SMMEs, who were its suppliers in 2010. Turnover of these SMMEs rose collectively to R30 million compared to R28 million in 2009, and together they employ over 300 permanent employees.
Enterprise Development expenditure for 2010 was R505 000LA, equating to 1% of profi t after tax.
Business Support Centre’s 2010 achievements
Hulamin has contracted with the BSC to embark on providing skills to develop aluminium fabricators. This is a specialty training programme targeting aspirant entrepreneurs who wish to acquire skills that will enable them to set up their own businesses of installing aluminium doors, windows, balustrades, and shop fronts. These entrepreneurs are already working with aluminium material but have no recognised accreditations or qualifi cation. They are assisted with a prior learning programme which requires a trade test upon completion. Fifteen candidates started the programme in September 2010 and will complete the course in June 2011. The programme is conducted by Training Force, based in Pietermaritzburg.
Hulamin has played a key role in the establishment of the BSC which has contributed enormously to the development of entrepreneurs as well as job creation in the region. Since its inception in 1997, the BSC has provided training to more than 11 400 entrepreneurs in various business skills. Currently the BSC registers approximately 200 new businesses per annum, as well as establishing and mentoring these new enterprises to ensure long-term sustainability. In 2010, the BSC coordinated in excess of 30 BBBEE Verifi cation Certifi cates for SMMEs.
Since 2005 the BSC has been instrumental in creating more than 1 890 jobs. The total spend on enterprise development for the year under review amounted to R1 million.
Paul Ngcobo, owner of Progress Engineering
LA Limited assurance provided by independent assurance provider (refer page 24).
Eric Sibiya and Zaba Ngcobo, owner of Hulacore
28 page • Annual Report 2010
Sustainability report continued
To achieve its preferential procurement objectives, Hulamin ensures that:
• Black businesses are sought as suppliers of choice;
• Hulamin subsequently works closely with these suppliers to assist them in achieving their goals;
• Non-BBBEE suppliers are encouraged to improve their own BBBEE ratings with the objective of becoming BBBEE suppliers to Hulamin; and
• All suppliers are also encouraged to seek opportunities to create partnerships or other interactions, in order to effect a skills and knowledge transfer to BBBEE enterprises.
In addition to its objective of developing black business in general, Hulamin actively seeks African entrepreneurs who have the potential to grow into successful suppliers.
All contracts with preferred suppliers, including African SMEs (small and medium enterprises), are concluded on regular commercial terms, ensuring that all suppliers meet Hulamin’s requirement for the best value package, comprising price, quality, service, delivery performance, Safety, Health and Environment, and payment terms.
In order to achieve the objective of developing African SMEs, Hulamin commits to the following:
• In assessing competing suppliers, Hulamin gives preference to African SMEs which present a value package that is equivalent to non-African SMEs. This applies particularly to African SMEs from communities within which Hulamin operates;
• Hulamin actively seeks out African SMEs and encourages them to become suppliers to Hulamin. This is achieved through a database of potential suppliers, as well as working through organisations such as the Business Support Centre;
• Hulamin seeks to work closely with African SME suppliers who would benefi t from exposure to Hulamin’s technical and management skills, with the goal of encouraging skills transfer and a more competitive supplier base; and
• Hulamin encourages the formation of willing partnerships between African entrepreneurs and established suppliers, where such partnerships permit the transfer of business skills, knowledge and experience, thereby empowering the African entrepreneurs, and over time enabling them to take over the business or to establish their own competitive businesses.
Hulamin’s objective of developing African SMEs is pursued through the involvement of all Hulamin’s employees. The procurement department consults broadly in all areas in identifying and structuring supply opportunities that will suit African SMEs and in the further development of these suppliers.
Consultation takes many forms: from employees identifying and communicating opportunities they see, to management arriving at a decision to outsource a non-core function, or to close down an internal function and source from a third party. Examples over the past years include the outsourcing of the printing department, the box making department, the canteen, and contractual agreements with ex-employees now rendering cleaning services to the company.
Preferential procurement
Philosophy and why it is important
Hulamin promotes the economic empowerment of black South Africans and encourages business relationships with companies which actively pursue sound employment equity and black economic empowerment programmes.
Hulamin’s future and the future growth of South Africa are dependent on growing the economic involvement in main stream business, on a sustainable basis, of all previously disadvantaged groups. At Hulamin, these objectives are achieved through the preferential procurement programme.
Responsibilities
The Procurement Review Committee, chaired by a member of the Executive Committee, oversees the company’s progress in preferential procurement.
The committee is responsible for strategy and planning, approving suitable supply opportunities, reviewing results and supplier performance, and approving additional suppliers and any preferential terms.
The committee meets on a quarterly basis to review progress and achievements related to preferential procurement and enterprise development opportunities. It plans to increase BBBEE spend and enterprise development, and to discuss and resolve issues or obstacles related to achieving Hulamin’s BBBEE targets.
Approach
Hulamin promotes the development of black-owned businesses and in particular wholly African-owned entities as preferred suppliers. Expenditure with these businesses is tracked over time, from which targets are set and performance is managed.

Annual Report 2010 • page 29
2010 Results/achievements
Due to the nature of its business, Hulamin sources over fi fty percent, by value, of its purchases in the form of aluminium metal from the local aluminium smelter, BHP Billiton. This amounted to R3,5 billion over the past 12-month period. In 2010, BHP Billiton moved up to become a level 7 supplier (from level 8 in 2009), allowing 50% of the invoice amount to now be classifi ed as BBBEE expenditure.
This change in BBBEE rating of BHP Billiton has had a signifi cant impact on Hulamin’s overall BBBEE spend value and effectively doubles Hulamin’s total expenditure with BBBEE enterprises. Now BHP Billiton single-handedly accounts for approximately 64% of Hulamin’s total BBBEE spend.
In 2010, Hulamin spent R3,012 billion in total with BBBEE enterprises. Of this total, R129,7 million was spent with Qualifying Small Enterprises (QSEs) and Emerging Micro Enterprises (EMEs), R224,5 million on black enterprises (greater than 50% black-owned), and R22,2 million with black woman-owned businesses (greater than 30% black woman-owned).
BBBEE expenditure now represents 55% of total expenditure for 2010 (after exclusions such as imported goods and services) and shows a signifi cant increase on the 26% in 2009, 18% in 2007 and 22% in 2008.
Hulamin met and slightly exceeded the targeted spend of R32 million with wholly African-owned entities for 2010, showing a fi nal spend of R32,7 million.
Summary of Hulamin BBBEE expenditure in 2010:
Total spend
All BBBEE spend
QSE/EME spend
Black(>50%)
Black women
spend
5 472 608 128 3 012 593 737LA 129 737 588 224 460 904 22 170 721
Total
Percentage of total 55,05 2,37 4,10 0,41
Possible points 12,00 3,00 3,00 2,00 20,00
Potential score 12,00 0,71 0,91 0,14 13,76
Corporate social investment
Philosophy and why it is important
Hulamin is committed to improving the quality of life of the people in the regions within which it operates, with particular focus on historically disadvantaged communities. Hulamin continues to direct its efforts primarily towards education, health, development of community skills, welfare, environment, and crime prevention.
Hulamin regards itself as part of the community within which it operates and therefore believes that it is imperative to make a difference by adding value to the development of these communities.
Total TTspend
All BBBEE spend
QSE/EME
spend
Black(>50%)spend
Blackwomenspend
Analysis of 2010 BBBEE expenditure (R billion)
LA Limited assurance provided by independent assurance provider(refer page 24).
6
5
4
3
2
1
0

30 page • Annual Report 2010
Responsibilities
The Chief Executive Offi cer is ultimately responsible for corporate social investment (CSI) but this responsibility is delegated to the Human Resources (HR) executive for execution.
As one of the elements of the BBBEE scorecard, CSI is verifi ed by an independent and accredited verifi cation agency. The latest verifi cation exercise was concluded for the period up to 31 December 2010.
Approach
The Hulamin board, the local community and the community-based organisations and employees are the stakeholders who contribute to defi ning the CSI strategy.
Hulamin consults with all potential benefi ciaries in order to evaluate their needs and the impact to the community. An evaluation is also undertaken to test if the requests are aligned to business priorities and fall within the Hulamin CSI strategy.
Targets and performance against targets
The target for CSI expenditure in 2010 was 1% of profi t after tax (PAT).
Total CSI expenditure for 2010 was R1,3 millionLA, which spend represents approximately 2% of PAT.
Key CSI projects undertaken in 2010
In 2010, Hulamin contributed R1,3 million towards CSI projects, which included many benefi ciaries such as health care-based organisations, crime-fi ghting initiatives, and child and family welfare initiatives.
Donations have been made to Edendale and Greys Hospitals, Pietermaritzburg and District Community Chest, Business Fighting Crime, Safe City, PROTEC, Ekukhanyeni Special School, and iThemba Projects, amongst others.
The company has supported the Pietermaritzburg and District Community Chest for many years and in 2010 earned the title of top corporate donor for the third successive year.
Funds raised by the Chest benefi t numerous local registered welfare organisations in the Pietermaritzburg region ranging from Child and Family Welfare, care of the homeless and the disabled, poverty alleviation, care of those suffering from HIV/AIDS, education of learners with special needs, crime prevention, and prevention of substance abuse.
PROTEC (Programme for Technological Careers) Pietermaritzburg Academy provides quality Maths and Science enrichment education to children from disadvantaged backgrounds in grades 9 to 12. English tuition and career guidance and lifeskills training are also provided. These programmes are held on Saturdays as well as through the vacation school tuition arrangement. Hulamin has contributed towards these education programmes since the inception of PROTEC in 1989. Over the years, the company has also awarded tertiary study bursaries to post-PROTEC students, some of whom are now employed by Hulamin.
Sustainability report continued
Little Lindo Ndlela from St Raphaels Crèche in Sweetwaters, near Pietermaritzburg. The crèche is supported by Hulamin through iThemba Projects
Comparison of CSI expenditure (R million)
LA Limited assurance provided by independent assurance provider(refer page 24).
2010200920082007
2,5
2,0
1,5
1,0
0,5
0
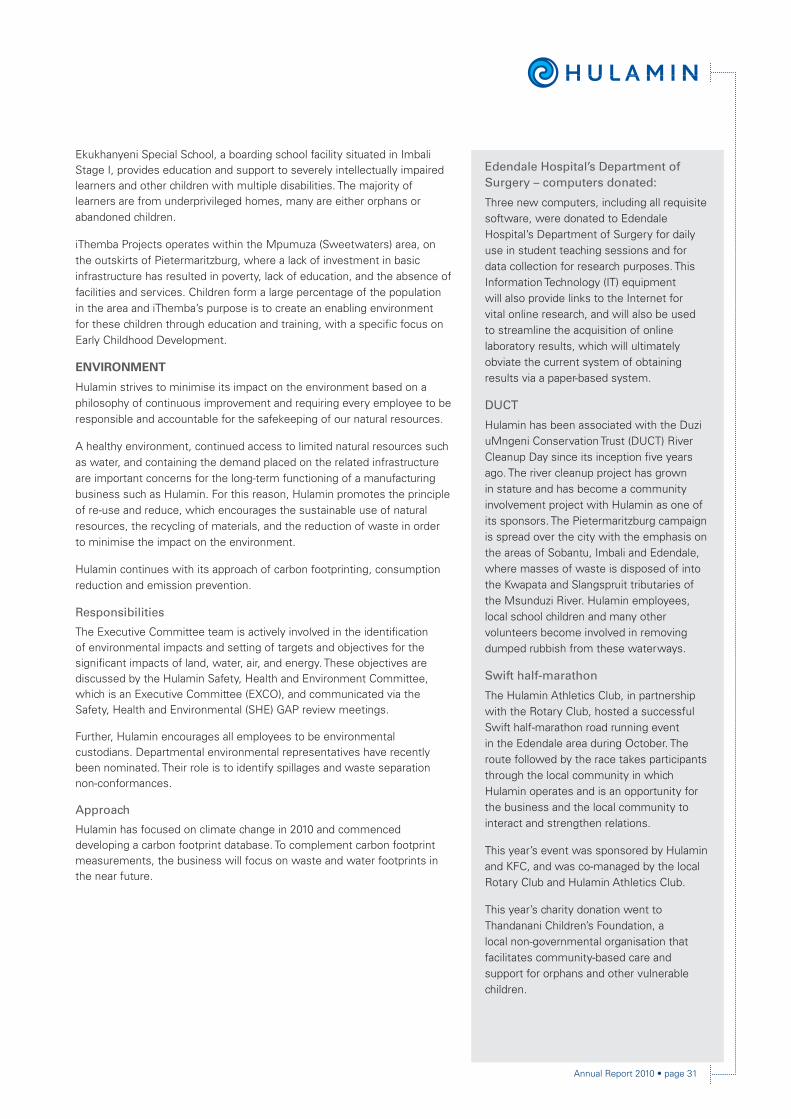
Annual Report 2010 • page 31
Ekukhanyeni Special School, a boarding school facility situated in Imbali Stage I, provides education and support to severely intellectually impaired learners and other children with multiple disabilities. The majority of learners are from underprivileged homes, many are either orphans or abandoned children.
iThemba Projects operates within the Mpumuza (Sweetwaters) area, on the outskirts of Pietermaritzburg, where a lack of investment in basic infrastructure has resulted in poverty, lack of education, and the absence of facilities and services. Children form a large percentage of the population in the area and iThemba’s purpose is to create an enabling environment for these children through education and training, with a specifi c focus on Early Childhood Development.
ENVIRONMENT
Hulamin strives to minimise its impact on the environment based on a philosophy of continuous improvement and requiring every employee to be responsible and accountable for the safekeeping of our natural resources.
A healthy environment, continued access to limited natural resources such as water, and containing the demand placed on the related infrastructure are important concerns for the long-term functioning of a manufacturing business such as Hulamin. For this reason, Hulamin promotes the principle of re-use and reduce, which encourages the sustainable use of natural resources, the recycling of materials, and the reduction of waste in order to minimise the impact on the environment.
Hulamin continues with its approach of carbon footprinting, consumption reduction and emission prevention.
Responsibilities
The Executive Committee team is actively involved in the identifi cation of environmental impacts and setting of targets and objectives for the signifi cant impacts of land, water, air, and energy. These objectives are discussed by the Hulamin Safety, Health and Environment Committee, which is an Executive Committee (EXCO), and communicated via the Safety, Health and Environmental (SHE) GAP review meetings.
Further, Hulamin encourages all employees to be environmental custodians. Departmental environmental representatives have recently been nominated. Their role is to identify spillages and waste separation non-conformances.
Approach
Hulamin has focused on climate change in 2010 and commenced developing a carbon footprint database. To complement carbon footprint measurements, the business will focus on waste and water footprints in the near future.
Edendale Hospital’s Department of Surgery – computers donated:
Three new computers, including all requisite software, were donated to Edendale Hospital’s Department of Surgery for daily use in student teaching sessions and for data collection for research purposes. This Information Technology (IT) equipment will also provide links to the Internet for vital online research, and will also be used to streamline the acquisition of online laboratory results, which will ultimately obviate the current system of obtaining results via a paper-based system.
DUCT
Hulamin has been associated with the Duzi uMngeni Conservation Trust (DUCT) River Cleanup Day since its inception fi ve years ago. The river cleanup project has grown in stature and has become a community involvement project with Hulamin as one of its sponsors. The Pietermaritzburg campaign is spread over the city with the emphasis on the areas of Sobantu, Imbali and Edendale, where masses of waste is disposed of into the Kwapata and Slangspruit tributaries of the Msunduzi River. Hulamin employees, local school children and many other volunteers become involved in removing dumped rubbish from these waterways.
Swift half-marathon
The Hulamin Athletics Club, in partnership with the Rotary Club, hosted a successful Swift half-marathon road running event in the Edendale area during October. The route followed by the race takes participants through the local community in which Hulamin operates and is an opportunity for the business and the local community to interact and strengthen relations.
This year’s event was sponsored by Hulamin and KFC, and was co-managed by the local Rotary Club and Hulamin Athletics Club.
This year’s charity donation went to Thandanani Children’s Foundation, a local non-governmental organisation that facilitates community-based care and support for orphans and other vulnerable children.
32 page • Annual Report 2010
Energy saved due to effi ciency and conservation efforts
Numerous electricity consumption projects were undertaken including work on cooling tower fans at the Campsdrift Hotline, the S6 cold rolling mill and the foil mill. Lighting was improved by installing energy effi cient bulbs. All the reciprocating compressors were replaced with the more effi cient screw type compressors. This work resulted in a signifi cant saving of 6 069 152 kWh (21 849 GJ).
Electricity consumption – comparative savings: 2008 – 2010
2010 6 069 152,00 kWh 29,8 kWh/MT sold
2009 5 368 879,80 kWh 35,9 kWh/MT sold
2008 5 596 682,84 kWh 30,2 kWh/MT sold
Additional energy savings projects included a focus on support of the internal oil recovery systems (to reduce rolling oil and hydraulic oils consumption) and resulted in a saving of 31 939 GJ. The optimisation of the recuperator operation at the CD remelt facility (LPG) resulted in a saving of 16 900 GJ against “business as usual”.
Energy savings between 2009 and 2010
Electricity 21 849 GJ 107,3 MJ/MT sold
Rolling and hydraulic oils 31 939 GJ 156,9 MJ/MT sold
LPG 16 900 GJ 83,0 MJ/MT sold
Total 70 688 GJ 347,2 MJ/MT sold
(Note that the data indicates savings against 203 582 metric tons (MT) of aluminium sold.)
Air quality
A baseline assessment as per the new legislative requirements in terms of listed activities was conducted, the results of which are pending at the time of publication.
Greenhouse gas emissions
Carbon footprint
A carbon footprint is “the total set of greenhouse gas (GHG) emissions caused by an organisation, event or product”. Hulamin recognised the need to assess its carbon footprint in 2007 and started to build up annual data regarding greenhouse gas emissions for assessment of the Hulamin carbon footprint. This was soon followed by reporting the GHG emission data to the Carbon Disclosure Project (CDP). Hulamin considers measuring the carbon footprint as a means of monitoring continuous improvement within the organisation, both from an environmental and a business perspective.
The Hulamin Environmental Manager is responsible for recording the Hulamin carbon footprint. Since the scope of the carbon footprint has grown signifi cantly, an internally appointed environmental specialist has been identifi ed to further support this function.
Progress in developing the Hulamin carbon footprint in 2010 has included demarcating the Hulamin main site in Pietermaritzburg into energy accountable centres to enable specifi c areas to monitor their contribution to the carbon footprint. Hulamin has further included emission sources not previously monitored, such as emissions from company fl eet vehicles and those from product use. Other Hulamin manufacturing sites (four) have started monitoring their carbon footprint this year and should be in a position to report their carbon footprint contribution to Hulamin in 2011.
Sustainability report continued
The business has addressed the new legislative requirements as covered in the Waste Management Act, 2008 and the air quality emission standards for listed activities, 2010. These activities include air quality, waste management, and the environmental impact assessment process.
The ISO 140001 environmental management system forms the framework for managing environmental issues. Open and constructive interaction with employees, local communities, regulatory agencies, business organisations, and other affected and interested parties is promoted and maintained.
Targets have not been set due to the need for improvement measurements on which to base these targets. Limited improvements and upgrades have been made to the monitoring of key indicators during 2010 and further improvements are planned for 2011.
2010 Results/achievements
There were no fi nes or sanctions issued in 2010. However, 18LA spills were recorded in the reporting period.
Hulamin spent R3,5 million at the Edendale site and R1,3 million at the Camps Drift site on managing effl uent.
Environmental training
A new system including environmental representatives, who conduct formal monthly inspections and submit these to the SHE meeting, was introduced at departmental level. These representatives have undergone training on a formal one-day course on basic environmental awareness and spills training.
The process has added value in terms of the identifi cation of spills and compliance to waste separation.
Energy consumption
The total direct energy consumption (LPG, low sulphur oil, diesel and petrol) for 2010 was: 1 658 371 GJLA.
The total indirect energy consumption (electricity) for 2010 was 1 045 340 GJLA.
LA Limited assurance provided by independent assurance provider(refer page 24).
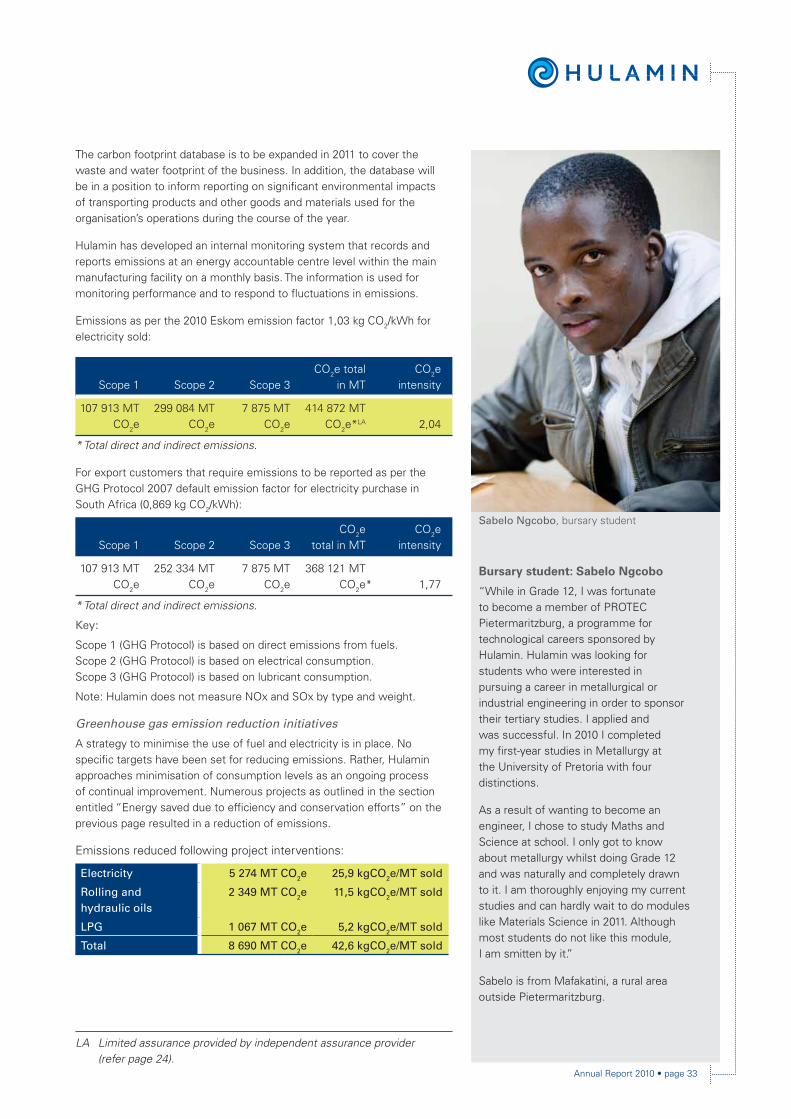
Annual Report 2010 • page 33
The carbon footprint database is to be expanded in 2011 to cover the waste and water footprint of the business. In addition, the database will be in a position to inform reporting on signifi cant environmental impacts of transporting products and other goods and materials used for the organisation’s operations during the course of the year.
Hulamin has developed an internal monitoring system that records and reports emissions at an energy accountable centre level within the main manufacturing facility on a monthly basis. The information is used for monitoring performance and to respond to fl uctuations in emissions.
Emissions as per the 2010 Eskom emission factor 1,03 kg CO2/kWh for electricity sold:
Scope 1 Scope 2 Scope 3CO2e total
in MTCO2e
intensity
107 913 MT CO2e
299 084 MT CO2e
7 875 MT CO2e
414 872 MT CO2e*LA 2,04
* Total direct and indirect emissions.
For export customers that require emissions to be reported as per the GHG Protocol 2007 default emission factor for electricity purchase in South Africa (0,869 kg CO2/kWh):
Scope 1 Scope 2 Scope 3CO2e
total in MTCO2e
intensity
107 913 MTCO2e
252 334 MTCO2e
7 875 MT CO2e
368 121 MTCO2e* 1,77
* Total direct and indirect emissions.
Key:
Scope 1 (GHG Protocol) is based on direct emissions from fuels. Scope 2 (GHG Protocol) is based on electrical consumption. Scope 3 (GHG Protocol) is based on lubricant consumption.
Note: Hulamin does not measure NOx and SOx by type and weight.
Greenhouse gas emission reduction initiatives
A strategy to minimise the use of fuel and electricity is in place. No specifi c targets have been set for reducing emissions. Rather, Hulamin approaches minimisation of consumption levels as an ongoing process of continual improvement. Numerous projects as outlined in the section entitled “Energy saved due to effi ciency and conservation efforts” on the previous page resulted in a reduction of emissions.
Emissions reduced following project interventions:
Electricity 5 274 MT CO2e 25,9 kgCO2e/MT sold
Rolling and hydraulic oils
2 349 MT CO2e 11,5 kgCO2e/MT sold
LPG 1 067 MT CO2e 5,2 kgCO2e/MT sold
Total 8 690 MT CO2e 42,6 kgCO2e/MT sold
Bursary student: Sabelo Ngcobo
“While in Grade 12, I was fortunate to become a member of PROTEC Pietermaritzburg, a programme for technological careers sponsored by Hulamin. Hulamin was looking for students who were interested in pursuing a career in metallurgical or industrial engineering in order to sponsor their tertiary studies. I applied and was successful. In 2010 I completed my fi rst-year studies in Metallurgy at the University of Pretoria with four distinctions.
As a result of wanting to become an engineer, I chose to study Maths and Science at school. I only got to know about metallurgy whilst doing Grade 12 and was naturally and completely drawn to it. I am thoroughly enjoying my current studies and can hardly wait to do modules like Materials Science in 2011. Although most students do not like this module,I am smitten by it.”
Sabelo is from Mafakatini, a rural area outside Pietermaritzburg.
LA Limited assurance provided by independent assurance provider(refer page 24).
Sabelo Ngcobo, bursary student
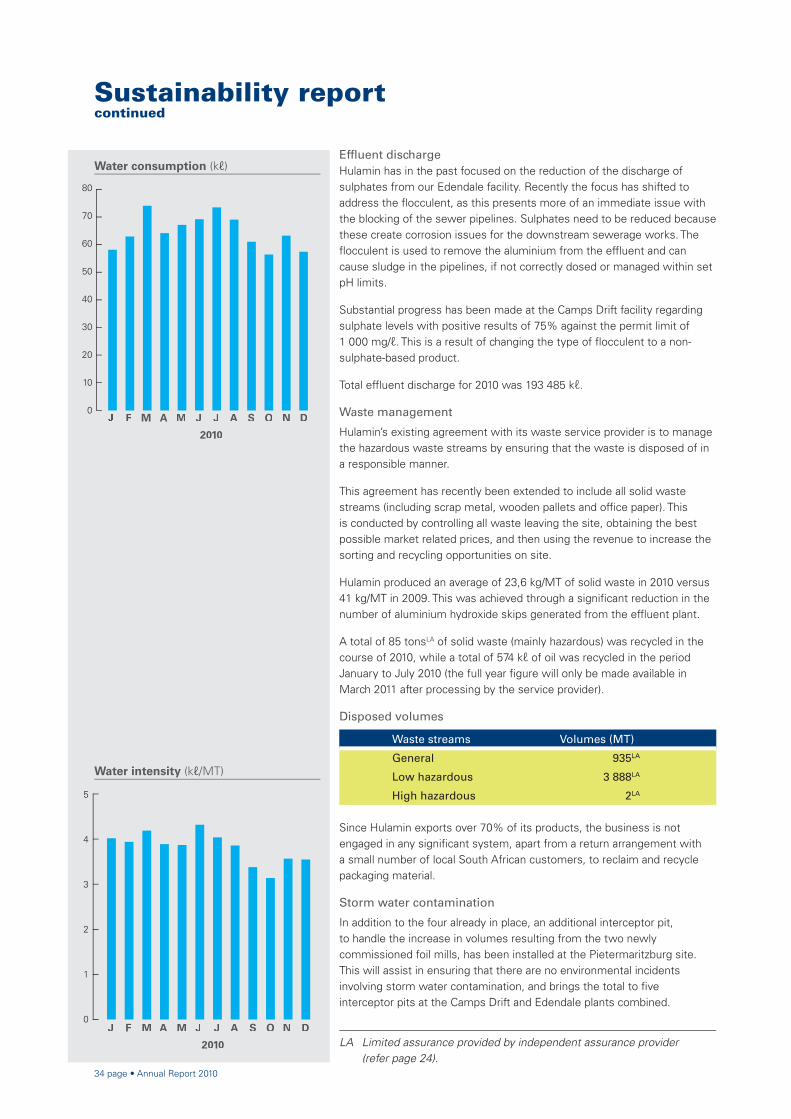
34 page • Annual Report 2010
Effl uent discharge Hulamin has in the past focused on the reduction of the discharge of sulphates from our Edendale facility. Recently the focus has shifted to address the fl occulent, as this presents more of an immediate issue with the blocking of the sewer pipelines. Sulphates need to be reduced because these create corrosion issues for the downstream sewerage works. The fl occulent is used to remove the aluminium from the effl uent and can cause sludge in the pipelines, if not correctly dosed or managed within set pH limits.
Substantial progress has been made at the Camps Drift facility regarding sulphate levels with positive results of 75% against the permit limit of 1 000 mg/ℓ. This is a result of changing the type of fl occulent to a non-sulphate-based product.
Total effl uent discharge for 2010 was 193 485 kℓ.
Waste management
Hulamin’s existing agreement with its waste service provider is to manage the hazardous waste streams by ensuring that the waste is disposed of in a responsible manner.
This agreement has recently been extended to include all solid waste streams (including scrap metal, wooden pallets and offi ce paper). This is conducted by controlling all waste leaving the site, obtaining the best possible market related prices, and then using the revenue to increase the sorting and recycling opportunities on site.
Hulamin produced an average of 23,6 kg/MT of solid waste in 2010 versus 41 kg/MT in 2009. This was achieved through a signifi cant reduction in the number of aluminium hydroxide skips generated from the effl uent plant.
A total of 85 tonsLA of solid waste (mainly hazardous) was recycled in the course of 2010, while a total of 574 kℓ of oil was recycled in the period January to July 2010 (the full year fi gure will only be made available in March 2011 after processing by the service provider).
Disposed volumes
Waste streams Volumes (MT)
General 935LA
Low hazardous 3 888LA
High hazardous 2LA
Since Hulamin exports over 70% of its products, the business is not engaged in any signifi cant system, apart from a return arrangement with a small number of local South African customers, to reclaim and recycle packaging material.
Storm water contamination
In addition to the four already in place, an additional interceptor pit, to handle the increase in volumes resulting from the two newly commissioned foil mills, has been installed at the Pietermaritzburg site. This will assist in ensuring that there are no environmental incidents involving storm water contamination, and brings the total to fi ve interceptor pits at the Camps Drift and Edendale plants combined.
Sustainability report continued
Water intensity (kℓ/MT)
F M A M J J A S O N D
2010
Water consumption (kℓ)
80
70
60
50
40
30
20
10
0
LA Limited assurance provided by independent assurance provider(refer page 24).
J F M A M J J A S O N D
2010
5
4
3
2
1
0

Annual Report 2010 • page 35
For this reporting period, Hulamin achieved an average contamination of around 17 mg/ℓ of oil, (similar to that of 2009) at the interceptor pits. An environmental management plan is being drawn up to address the upstream sources of oil leaks.
Water consumption
Water is a scarce resource in South Africa. The need for water conservation is likely to increase in the future in order to ensure sustainable supply.
The total water consumption for 2010 was 3,81 kℓ/MT of aluminium sold, compared to 4,47 kℓ/MT for 2009. The total water consumed was 774 930 kℓLA.
Water is drawn from the local Msunduzi Municipality, originally supplied by Umgeni Water. Hulamin recognises that the current infrastructure for water metering needs improvement. Steps have been put in place to improve the measuring and monitoring of water consumption in individual areas to encourage ownership for conservation. Progress has been made in 2010, in particular at the cooling towers.
The emphasis in 2010 was on improving, monitoring and measuring rather than on reducing consumption and recycling. Nevertheless, efforts to reduce leaks at the Edendale site have resulted in a reduction in water consumption and in addition, the Hulamin Extrusions operations at the Edendale site initiated a water recycling project in their cooling towers. As this project is in its early stages, the volume of water being recycled cannot be confi rmed. (See side story for details of this project.)
EMPLOYEE PARTICIPATION AND REPRESENTATION
Employees are key to all aspects of Hulamin’s performance and future success. Hulamin’s employee representation strategy is based on open communication and consultation with its employees and their representatives.
Responsibilities and structures Responsibility for employee relations lies jointly with the Human Resources (HR) executive and line management.
Formal communication with employees and their representatives takes place regularly and at various levels, including the Departmental Action Forums (DAFs), where employees meet with line management, and the Employee Relations Committee (ERC), where employee representatives meet with senior management. In addition, employees regularly engage with management through weekly Visual Felt Leadership structures.
Policies and procedures
Hulamin’s grievance and disciplinary policies and procedures are in place. These are guidelines for both employees and management when dealing with disciplinary and grievance procedures in the workplace and a disciplinary code is given to all employees on commencement of employment.
66% of Hulamin employees are covered by collective bargaining agreements
No time was lost due to work stoppages, strikes or stay-aways during 2010.
LA Limited assurance provided by independent assurance provider. (refer page 24).
Rowan Moses involved in installing booster pump
Water Conservation Project: Hulamin Extrusions
Aluminium extrusions require cooling or quenching as they leave the extrusion press in order to control mechanical properties of the aluminium alloy. This is achieved through forced air convection, water spray, water immersion or a combination of these three methods.
In 2006, Hulamin Extrusions started producing aluminium forging bars for an automotive application. It was found that by spray-quenching the bars with water, increased productivity could be achieved. The water was drawn from the municipal ring main for spray quenching, rather than the internal process water, due to the higher pressure and cleanliness. The water drawn for this spray process feeds back into the plant process water. Initially this was not an issue as the consumption of about 200 kℓ per month was less than the makeup water required by the process water cooling tower. However, by early 2010, volume on the forging bar project had increased to the extent where water consumption was over 2 000 kℓ per month, and costing over R30 000 per month. It was no longer feasible to consume the higher volume of spray water in the cooling towers, resulting in an overfl ow and wastage.
The installation of a booster pump with fi ltration system reduced the need to use municipal water. After the commissioning of this project in September 2010, water consumption dropped to below 500 kℓ per month.
36 page • Annual Report 2010
Sustainability report continued
The following measures are in place to ensure targets are reached:
• Training and development initiatives;
• Talent and performance management;
• Mentorship and coaching programmes;
• Career development programmes;
• Development programmes for technologists;
• Development plans for women;
• Diversity management programmes;
• Targeted recruitment and selection for people from designated groups;
• Targeted promotion for people from designated groups;
• Learnership programmes for people with disabilities;
• Developed strategic partnerships with universities and Universities of Technology to recruit people from disciplines relevant to our business; and
• Retention strategies.
Targets and achievements
Areas of achievement include:
• During the past two years steady progress has been achieved in improving the percentage of black representation at management level from 51% to 58%. This is notable progress considering that black representation at this level remained at around 50% for some time;
• During the past two years the number of women employees has increased to 372 from 317 in January 2008. Over the past three years the number of women technologists has increased from 12 to 28, with most of these women being appointed through the in-service training programme;
• The 2010 in-service trainee intake comprised of 76% women compared to 50% in 2009;
• Sixteen women apprentices qualifi ed as artisans in less than the required four-year training period. Currently there are four women apprentices out of a total of 20. Plans are in place to accelerate the development of female artisans to senior artisan positions. Some of the strategies being employed include coaching, mentoring, on-the-job training, specialised technical training and inter-departmental rotation;
• There are 174 women workers at shop fl oor level compared to 151 in January 2009. Efforts remain focused on developing women at shop fl oor level so as to have a pool of technically qualifi ed women from which apprentices can be sourced. Three women from shop fl oor positions have been appointed to team leader positions, which previously were predominantly occupied by males. Training programmes are in place to enhance the development of women at shop fl oor level; and
• Eight people with disabilities completed a learnership programme at Hulamin which began in May 2007 and ended in February 2010. Four of these learners have been appointed to permanent positions and one has been offered a limited duration contract of 12 months. Of the remaining three people, two have been appointed to permanent administrative positions at Standard Bank and one has been appointed to a learnership programme at the local municipality.
In September 2009, an additional eleven people with disabilities began an 18-month learnership programme. One of these learners has been appointed permanently to a switchboard operator position.
EMPLOYMENT EQUITY
Philosophy and why it is important
Hulamin believes in the development of all its employees regardless of race and gender, with emphasis on the people from designated groups, and regards employment equity as a special intervention required to address the situation resulting from blacks having been previously disadvantaged in South Africa.
Employment equity is an integral component of Hulamin’s business strategy and is focused on the following:
– The elimination of unfair discrimination within the workplace; and
– The implementation of affi rmative action measures to achieve equitable representation of designated groups across all occupational levels within the organisation.
Responsibilities
The CEO is ultimately responsible for employment equity within the organisation and the HR executive is the appointed senior employment equity manager to drive the implementation thereof. Employment equity progress is monitored through divisional employment equity committees, which report to the Hulamin Employment Equity Committee. This committee in turn reports to the Transformation Committee.
Structure
The Hulamin board, Executive Committee, employee representatives and employees are the stakeholders for employment equity.
Over and above the annual consultation process as required by law, consultation takes place regularly within the following forums:
− Employment equity committees, comprising employees, which exist at a strategic and an operational level, monitor and evaluate progress on employment equity issues at meetings held quarterly; and
− The Transformation Committee is chaired by a non-executive director and the Hulamin Employment Equity Meeting is chaired by the CEO. Meetings take place quarterly.
Targets are set according to a three-year horizon. Targets were set in 2008 to be achieved by 31 December 2010. (See table “Performance against targets” on the next page.) New targets will be set for the period 1 January 2011 to 31 December 2013.
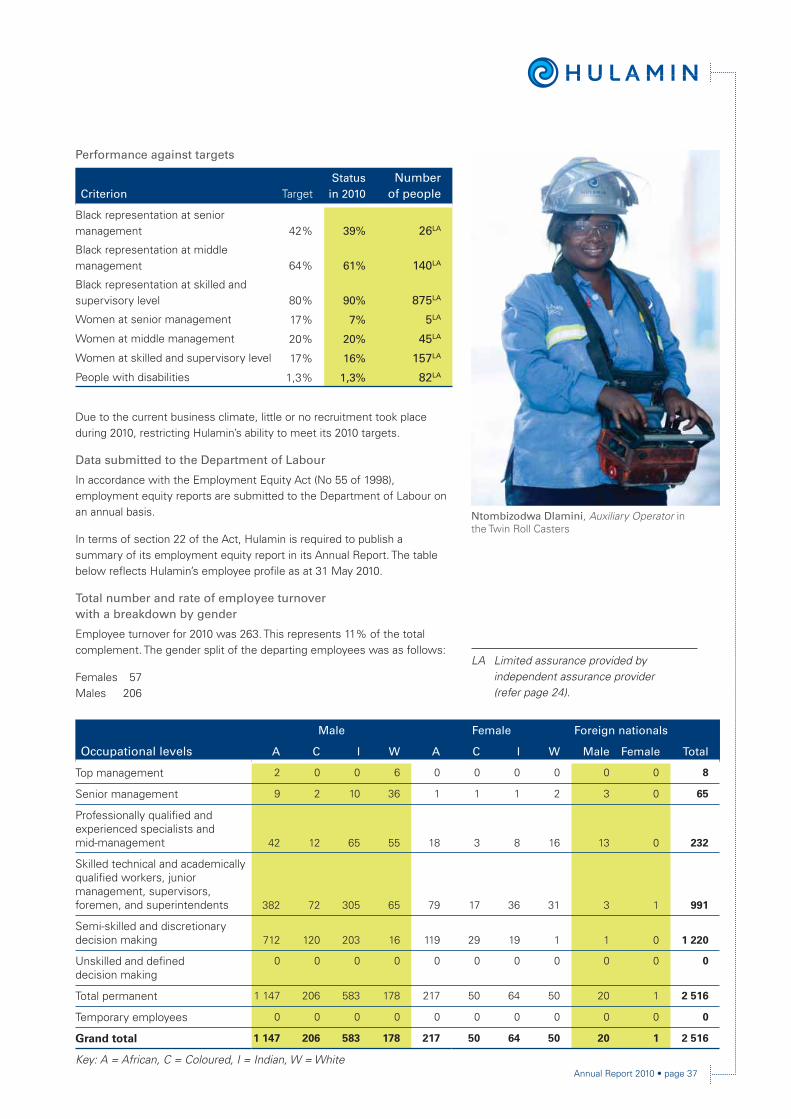
Annual Report 2010 • page 37
Performance against targets
Criterion TargetStatus
in 2010Number
of people
Black representation at senior management 42% 39% 26LA
Black representation at middle management 64% 61% 140LA
Black representation at skilled and supervisory level 80% 90% 875LA
Women at senior management 17% 7% 5LA
Women at middle management 20% 20% 45LA
Women at skilled and supervisory level 17% 16% 157LA
People with disabilities 1,3% 1,3% 82LA
Due to the current business climate, little or no recruitment took place during 2010, restricting Hulamin’s ability to meet its 2010 targets.
Data submitted to the Department of Labour
In accordance with the Employment Equity Act (No 55 of 1998), employment equity reports are submitted to the Department of Labour on an annual basis.
In terms of section 22 of the Act, Hulamin is required to publish a summary of its employment equity report in its Annual Report. The table below refl ects Hulamin’s employee profi le as at 31 May 2010.
Total number and rate of employee turnover with a breakdown by gender
Employee turnover for 2010 was 263. This represents 11% of the total complement. The gender split of the departing employees was as follows:
Females 57Males 206
Occupational levels
Male Female Foreign nationals
A C I W A C I W Male Female Total
Top management 2 0 0 6 0 0 0 0 0 0 8
Senior management 9 2 10 36 1 1 1 2 3 0 65
Professionally qualifi ed and experienced specialists and mid-management 42 12 65 55 18 3 8 16 13 0 232
Skilled technical and academically qualifi ed workers, junior management, supervisors, foremen, and superintendents 382 72 305 65 79 17 36 31 3 1 991
Semi-skilled and discretionary decision making 712 120 203 16 119 29 19 1 1 0 1 220
Unskilled and defi ned decision making
0 0 0 0 0 0 0 0 0 0 0
Total permanent 1 147 206 583 178 217 50 64 50 20 1 2 516
Temporary employees 0 0 0 0 0 0 0 0 0 0 0
Grand total 1 147 206 583 178 217 50 64 50 20 1 2 516
Key: A = African, C = Coloured, I = Indian, W = White
Ntombizodwa Dlamini, Auxiliary Operator in the Twin Roll Casters
LA Limited assurance provided by independent assurance provider (refer page 24).

38 page • Annual Report 2010
Sustainability report continued
HEALTH
Hulamin regards employee wellness as a shared responsibility with its employees. In this regard the company equips employees with the appropriate education and healthcare facilities in order for employees to best manage their own health.
The good health of employees is essential to motivation, capability and productivity, and likewise offers benefi ts for employees and their families and friends. The enhancement of employee health also contributes to reduced absenteeism and promotes good working relationships.
Responsibilities
The HR executive leads the Employee Health portfolio, who reports to the CEO who, in turn, reports to the board of directors.
The South African Bureau of Standards conducts an annual audit of the Healthcare Centre, to ensure compliance with ISO 140001 certifi cation (the Environmental Management System) and the OHSAS 18001 standard (Health and Safety Management System).
Approach
A broad range of stakeholders are involved in employee health, including the Hulamin board, management, employee representatives, employee families, health practitioners and the employees themselves. Hulamin is dependant on its workforce for valuable skills and experience, and thus the consequence of poor health affects Hulamin’s performance across all indicators.
Several healthcare programmes are in place, including occupation health risk assessment and control measures, hygiene surveys and medical surveillance programmes (which comprise, inter alia, lung function tests, audiograms and eyesight tests). Biological monitoring is also conducted where appropriate. Vision screening, specifi cally for forklift and crane operators, has started.
A Healthcare Centre is manned by employees with the appropriate skills, competencies and qualifi cations in the fi eld of medicine and Occupational Health Nursing Practices.
Health and wellness education programmes form a vital component of occupational health. Such programmes are also linked to wellness days which are held bi-annually. The key elements of these programmes include health and lifestyle education, and personal health assessment, including voluntary counselling and testing (VCT).
Progress is monitored through the reviews conducted by the Safety Committee, Health and Environment Committee, Risk Management Committee and the Healthcare Centre.
HIV/AIDS
Hulamin’s HIV/AIDS policy provides guidelines for addressing HIV/AIDS related issues in the workplace. These include inter alia:
• Preventing unfair discrimination based on HIV status;
• Promoting a non-discriminatory environment in which employees living with HIV/AIDS are able to be open about their status without fear of stigmatisation or rejection;
• Promoting appropriate and effective ways of managing HIV/AIDS, which includes the following core elements:
– ensure appropriate structures, plans and programmes are in place to manage HIV/AIDS in the workplace;
– provide awareness, education and prevention programmes;
– provide treatment, care and support for HIV positive employees;
– monitor and address the impact of HIV/AIDS on business operations;
– participate in, and partner with, community initiatives; and
• Creating a balance between the rights and responsibilities of all parties.
Hulamin has set a goal for all employees to know their HIV status.
2010 Results/achievements
In total 902 employees went through HIV/AIDS testing in 2010, of which 121 were tested for the fi rst time.
Thabisile Kheswa, Switchboard Operator

Annual Report 2010 • page 39
VCT total – comparative
2010 902
2009 410
2008 1 361
Hulamin has not yet met its target of all employees knowing their HIV status. A number of employees prefer to consult their own doctors without disclosing the results to the company.
As at the end of 2010, 222 employees (approximately 9% of the Hulamin workforce) were known to be HIV positive, and of these HIV positive employees, 60 were receiving antiretroviral (ARV) support from Hulamin as at the end of 2010.
(Note: these fi gures refl ect the Pietermaritzburg main sites – Edendale and Camps Drift only.)
Expenditure incurred on ARV treatment for 2010 was R477 736LA.
SKILLS DEVELOPMENT
Philosophy
Hulamin strives to develop skilled and motivated employees through an outcomes-based approach to development that endorses personal growth, individual responsibility and a culture of lifelong learning.
Training and development initiatives draw on the technological, operational and process knowledge that exists within the business, and uses this to guide employees into developing innovative solutions for real business challenges. This further builds organisational learning while maximising the potential of individual employees within the working environment.
Hulamin believes that it is important to continue to develop organisational capabilities for future sustainability, and to contribute to reducing the skills shortage, thus boosting growth within the South African manufacturing context.
Responsibilities
To ensure a consistent approach, the HR executive is given overall responsibility for training and development strategies. Line managers are responsible for leading the training and development efforts within each manufacturing area. They are supported by training and development specialists who report to the HR executive. Engagement at shop fl oor level takes place through quarterly training committee meetings that include union representatives. Training progress is monitored quarterly at the Hulamin Learning and Development Review, attended by line management and executives.
Approach
The learning programmes are based on a blended approach, which combines class-based programmes with on-the-job training, participation in projects and task teams as well as E-learning. Hulamin has intensive training programmes in place, including but not limited to the following:
• Mission Directed Works Teams (MDWT);
• Goal Oriented Learning (GOL);
• Learnerships – portability of skills;
• Talent management; and
• Traineeship development programmes.
LA Limited assurance provided by independent assurance provider (refer page 24).
Performance management remains the key driver in our talent management approach. All staff employees are subject to bi-annual performance reviews. The review process includes feedback from the immediate manager and at least two other colleagues who work closely with the employee. This multiple perspective process provides a broader view of employee capabilities.
Learning programmes: Performance in 2010
Mission Directed Works Teams (MDWT)
The fundamental principle of the MDWT programme is employee involvement in continuous improvement projects. This is monitored through 48 mini business teams that visually measure performance against agreed goals for quality, speed, cost, safety and people (QSCSP).
In sustaining the programme, teams meet daily to visually review the performance of the previous day and to update performance graphs. Support is provided by:
• Nine cross-functional teams that meet for daily problem solving sessions; and
• Monthly multi-level meetings to improve communication and ensure that the mini business teams’ goals are aligned to company goals. Multi-level meeting attendees also receive feedback on company performance which is cascaded to the mini business teams’ meetings in their daily meetings.
Dr JL Dunton, Company Doctor, Pietermaritzburg
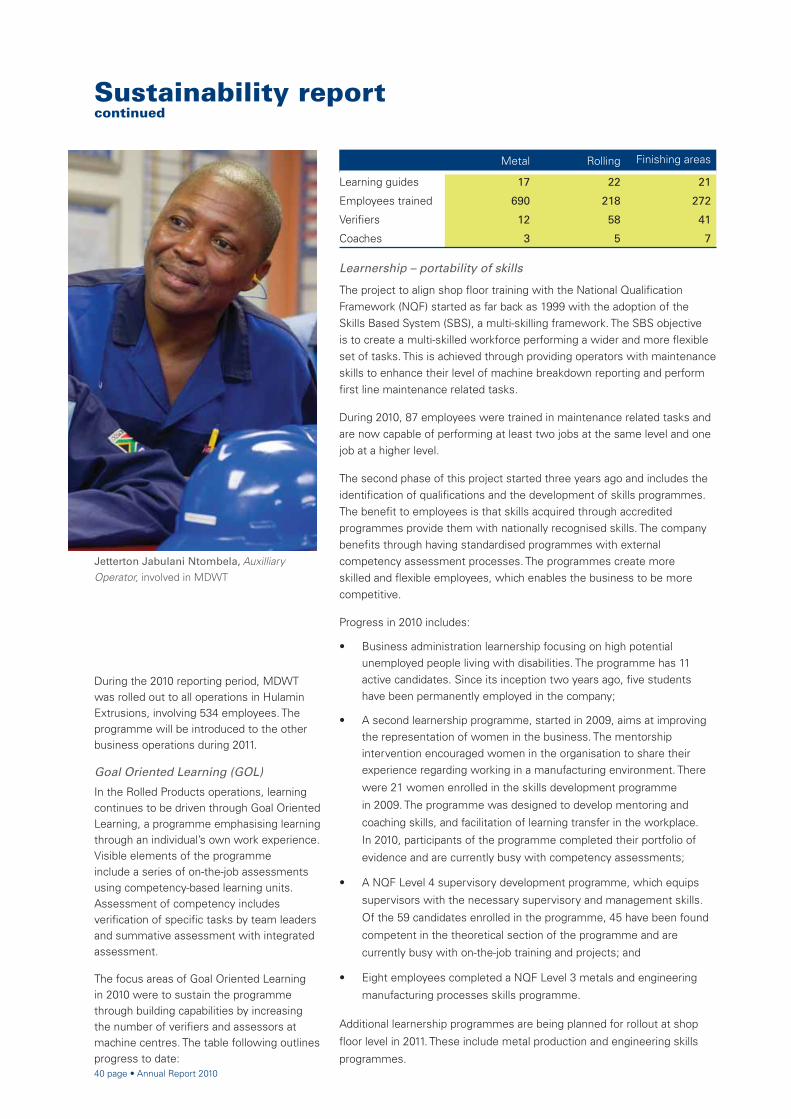
40 page • Annual Report 2010
Metal Rolling Finishing areas
Learning guides 17 22 21
Employees trained 690 218 272
Verifi ers 12 58 41
Coaches 3 5 7
Learnership – portability of skills
The project to align shop fl oor training with the National Qualifi cation Framework (NQF) started as far back as 1999 with the adoption of the Skills Based System (SBS), a multi-skilling framework. The SBS objective is to create a multi-skilled workforce performing a wider and more fl exible set of tasks. This is achieved through providing operators with maintenance skills to enhance their level of machine breakdown reporting and perform fi rst line maintenance related tasks.
During 2010, 87 employees were trained in maintenance related tasks and are now capable of performing at least two jobs at the same level and one job at a higher level.
The second phase of this project started three years ago and includes the identifi cation of qualifi cations and the development of skills programmes. The benefi t to employees is that skills acquired through accredited programmes provide them with nationally recognised skills. The company benefi ts through having standardised programmes with external competency assessment processes. The programmes create more skilled and fl exible employees, which enables the business to be more competitive.
Progress in 2010 includes:
• Business administration learnership focusing on high potential unemployed people living with disabilities. The programme has 11 active candidates. Since its inception two years ago, fi ve students have been permanently employed in the company;
• A second learnership programme, started in 2009, aims at improving the representation of women in the business. The mentorship intervention encouraged women in the organisation to share their experience regarding working in a manufacturing environment. There
were 21 women enrolled in the skills development programme
in 2009. The programme was designed to develop mentoring and
coaching skills, and facilitation of learning transfer in the workplace.
In 2010, participants of the programme completed their portfolio of
evidence and are currently busy with competency assessments;
• A NQF Level 4 supervisory development programme, which equips
supervisors with the necessary supervisory and management skills.
Of the 59 candidates enrolled in the programme, 45 have been found
competent in the theoretical section of the programme and are
currently busy with on-the-job training and projects; and
• Eight employees completed a NQF Level 3 metals and engineering
manufacturing processes skills programme.
Additional learnership programmes are being planned for rollout at shop
fl oor level in 2011. These include metal production and engineering skills
programmes.
Sustainability report continued
During the 2010 reporting period, MDWT was rolled out to all operations in Hulamin Extrusions, involving 534 employees. The programme will be introduced to the other business operations during 2011.
Goal Oriented Learning (GOL)
In the Rolled Products operations, learning continues to be driven through Goal Oriented Learning, a programme emphasising learning through an individual’s own work experience. Visible elements of the programme include a series of on-the-job assessments using competency-based learning units. Assessment of competency includes verifi cation of specifi c tasks by team leaders and summative assessment with integrated assessment.
The focus areas of Goal Oriented Learning in 2010 were to sustain the programme through building capabilities by increasing the number of verifi ers and assessors at machine centres. The table following outlines progress to date:
Jetterton Jabulani Ntombela, Auxilliary Operator, involved in MDWT
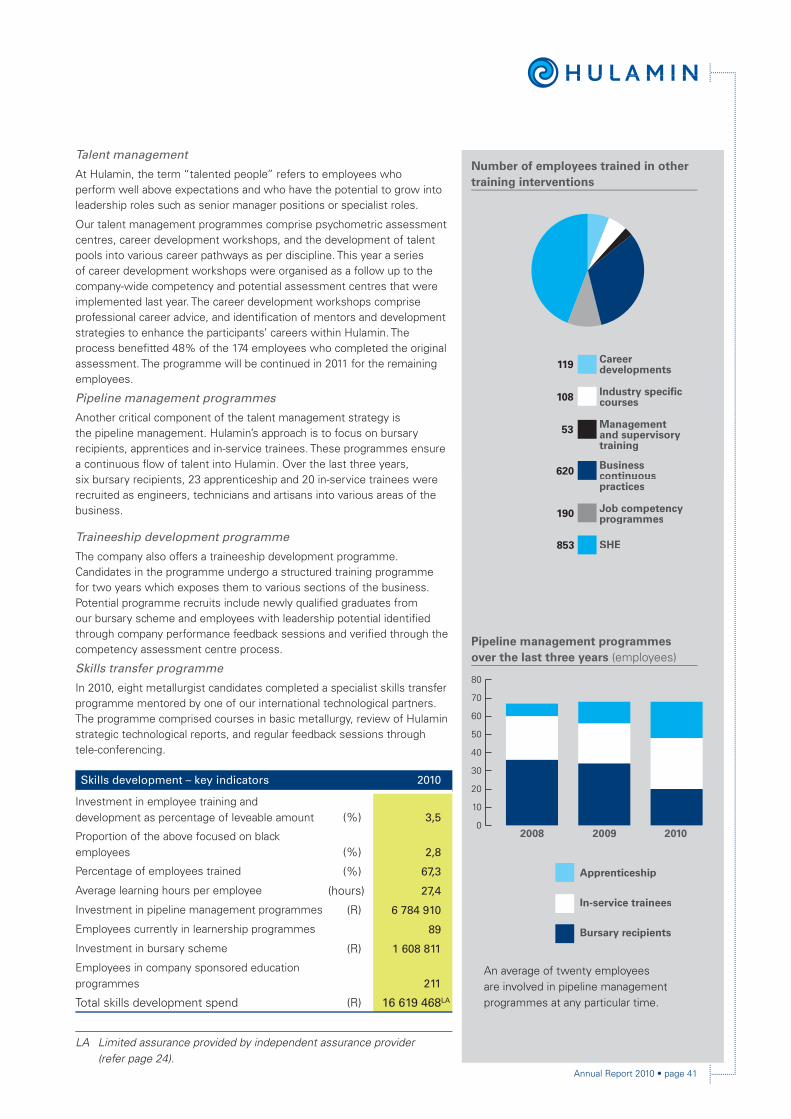
Annual Report 2010 • page 41
Talent management
At Hulamin, the term “talented people” refers to employees who perform well above expectations and who have the potential to grow into leadership roles such as senior manager positions or specialist roles.
Our talent management programmes comprise psychometric assessment centres, career development workshops, and the development of talent pools into various career pathways as per discipline. This year a series of career development workshops were organised as a follow up to the company-wide competency and potential assessment centres that were implemented last year. The career development workshops comprise professional career advice, and identifi cation of mentors and development strategies to enhance the participants’ careers within Hulamin. The process benefi tted 48% of the 174 employees who completed the original assessment. The programme will be continued in 2011 for the remaining employees.
Pipeline management programmes
Another critical component of the talent management strategy is the pipeline management. Hulamin’s approach is to focus on bursary recipients, apprentices and in-service trainees. These programmes ensure a continuous fl ow of talent into Hulamin. Over the last three years, six bursary recipients, 23 apprenticeship and 20 in-service trainees were recruited as engineers, technicians and artisans into various areas of the business.
Traineeship development programme
The company also offers a traineeship development programme. Candidates in the programme undergo a structured training programme for two years which exposes them to various sections of the business. Potential programme recruits include newly qualifi ed graduates from our bursary scheme and employees with leadership potential identifi ed through company performance feedback sessions and verifi ed through the competency assessment centre process.
Skills transfer programme
In 2010, eight metallurgist candidates completed a specialist skills transfer programme mentored by one of our international technological partners. The programme comprised courses in basic metallurgy, review of Hulamin strategic technological reports, and regular feedback sessions through tele-conferencing.
Skills development – key indicators 2010
Investment in employee training and development as percentage of leveable amount (%) 3,5
Proportion of the above focused on black employees (%) 2,8
Percentage of employees trained (%) 67,3
Average learning hours per employee (hours) 27,4
Investment in pipeline management programmes (R) 6 784 910
Employees currently in learnership programmes 89
Investment in bursary scheme (R) 1 608 811
Employees in company sponsored education programmes 211
Total skills development spend (R) 16 619 468LA
LA Limited assurance provided by independent assurance provider(refer page 24).
Pipeline management programmes over the last three years (employees)
Apprenticeship
In-service trainees
Bursary recipients
An average of twenty employees are involved in pipeline management programmes at any particular time.
2008 2009 2010
Number of employees trained in other training interventions
80
70
60
50
40
30
20
10
0
Businesscontinuouscontinuouspractices
Job competencyprogrammes
SHE
Career developments
Industry specifi c courses
Management and supervisorytraining
119
108
53
620
853
190

42 page • Annual Report 2010
SAFETY
Philosophy and why it is important
Hulamin is committed to operating its plants safely and protecting employees from injury or harm due to incidents or exposure by embedding a culture of safety. This is driven by encouraging employees and the teams in which they work to take responsibility for their own safety. Hulamin seeks to continuously improve its safety performance by measuring and monitoring both leading and lagging indicators which are aligned to industry best practice.
The commitment to the well-being of employees and providing a safe working environment ensures that the business continues to function effectively and to retain and attract skilled people in future.
Responsibilities
The Hulamin Executive Committee is accountable for safety in the organisation. There are formal structures in place to identify, evaluate, and control operational risks. The Hulamin Safety, Health and Environment Committee meets quarterly. All management structures are involved in Visible Felt Leadership processes, which involve a walkabout on the shop fl oor
to discuss progress and identify barriers and constraints to improving performance. Employees are expected to take ownership of their own safety; however, management provides structured direction aimed at inculcating a culture of safe behaviour. Line management is responsible for safety in their respective areas and is centrally supported by the safety, health and environmental team. Hulamin is audited for verifi cation and compliance in line with OHSAS 18001 annually.
Approach Hulamin has an integrated approach to safety, adopting the principle of behaviour-based safety and the OHSAS 18001 standard.
Processes have been implemented to address high and low potential risks through formal risk assessment principles.
The low potential risks, such as nip points, personal protective equipment (PPE), and scrap handling are addressed by means of the following tools:
• Behaviour-based safety;
• Housekeeping audits;
• Visible felt leadership;
• Baseline risk assessments; and
• System reviews.
The high potential risks, which include explosions, the operation of cranes, and driving of forklifts, are addressed by utilising the more comprehensive risk assessments tools such as Fault Tree and FMEAs.
The reporting of near misses is a priority as this is a leading indicator that can assist in forecasting potential injuries. Teams are encouraged through the behaviour-based safety PACTING process to report their near misses and these are then investigated as if they were injuries.
2010 Results/achievements
Target Actual
Indicators RateNumber of incidents Rate
Number of incidents
2010 LTIFR 0,20 7 0,33LA 10
2010 TRCFR 0,87 23 1,87 45
There were ten Lost Time Incidents (LTI) in 2010, resulting in targets not being met. The 2009 targets were retained for 2010. However, in 2010, production activity levels returned to those of pre-2009, resulting in more shifts being covered, and increased risk exposure. The incidents experienced encompassed the following:
• Three injuries associated with hands;
• Three incidents associated with the back;
• One incident associated with the head; and
• Three incidents associated with falls, bumping against load and falling from a ladder.
In order to mitigate incidents in the future, an incident verifi cation review has been introduced that audits the following:
• Timeous submission of investigation forms;
• Quality of the investigation;
• Evidence of conducting of safety talks;
• Closure of corrective actions; and
• Completion of task-based risk assessment.
LA Limited assurance provided by independent assurance provider(refer page 24).
Sustainability report continued
Anne Gouws, Coating Line Operator, conducts a fi re-fi ghting demonstration
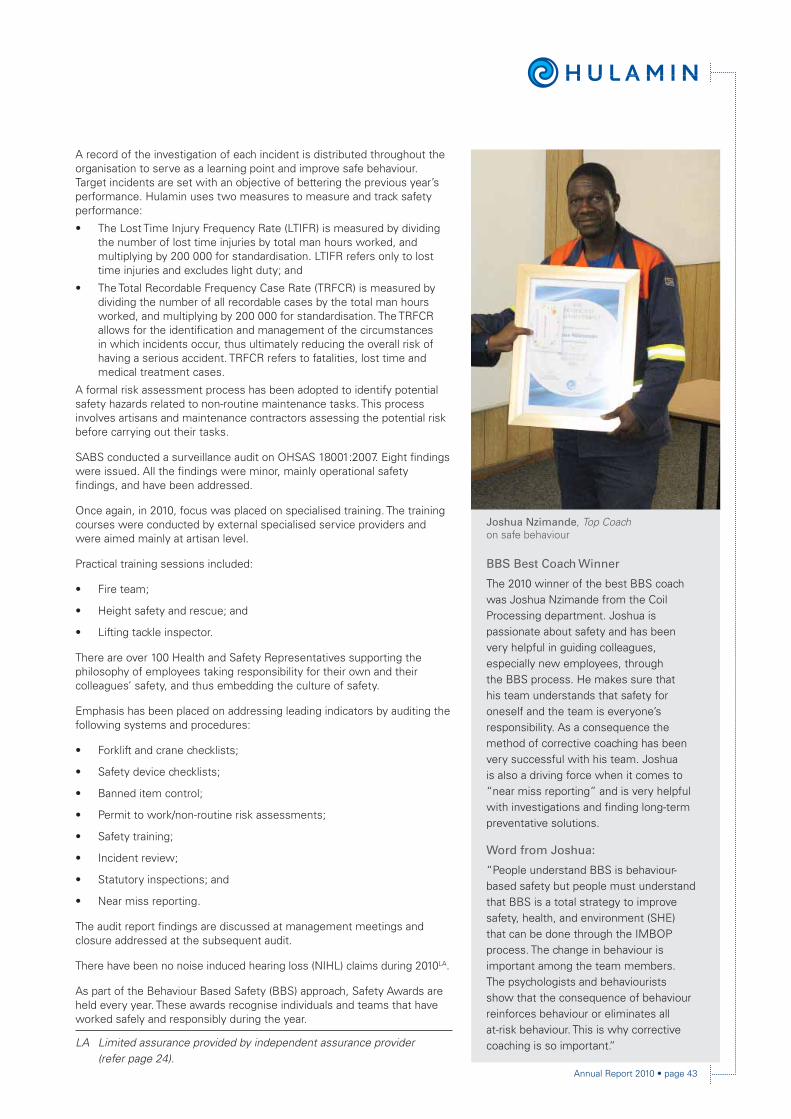
Annual Report 2010 • page 43
BBS Best Coach Winner
The 2010 winner of the best BBS coach was Joshua Nzimande from the Coil Processing department. Joshua is passionate about safety and has been very helpful in guiding colleagues, especially new employees, through the BBS process. He makes sure that his team understands that safety for oneself and the team is everyone’s responsibility. As a consequence the method of corrective coaching has been very successful with his team. Joshua is also a driving force when it comes to “near miss reporting” and is very helpful with investigations and fi nding long-term preventative solutions.
Word from Joshua:
“People understand BBS is behaviour-based safety but people must understand that BBS is a total strategy to improve safety, health, and environment (SHE) that can be done through the IMBOP process. The change in behaviour is important among the team members. The psychologists and behaviourists show that the consequence of behaviour reinforces behaviour or eliminates all at-risk behaviour. This is why corrective coaching is so important.”
Joshua Nzimande, Top Coach on safe behaviour
A record of the investigation of each incident is distributed throughout the organisation to serve as a learning point and improve safe behaviour.Target incidents are set with an objective of bettering the previous year’s performance. Hulamin uses two measures to measure and track safety performance:
• The Lost Time Injury Frequency Rate (LTIFR) is measured by dividing the number of lost time injuries by total man hours worked, and multiplying by 200 000 for standardisation. LTIFR refers only to lost time injuries and excludes light duty; and
• The Total Recordable Frequency Case Rate (TRFCR) is measured by dividing the number of all recordable cases by the total man hours worked, and multiplying by 200 000 for standardisation. The TRFCR allows for the identifi cation and management of the circumstances in which incidents occur, thus ultimately reducing the overall risk of having a serious accident. TRFCR refers to fatalities, lost time and medical treatment cases.
A formal risk assessment process has been adopted to identify potential safety hazards related to non-routine maintenance tasks. This process involves artisans and maintenance contractors assessing the potential risk before carrying out their tasks.
SABS conducted a surveillance audit on OHSAS 18001:2007. Eight fi ndings were issued. All the fi ndings were minor, mainly operational safety fi ndings, and have been addressed.
Once again, in 2010, focus was placed on specialised training. The training courses were conducted by external specialised service providers and were aimed mainly at artisan level.
Practical training sessions included:
• Fire team;
• Height safety and rescue; and
• Lifting tackle inspector.
There are over 100 Health and Safety Representatives supporting the philosophy of employees taking responsibility for their own and their colleagues’ safety, and thus embedding the culture of safety.
Emphasis has been placed on addressing leading indicators by auditing the following systems and procedures:
• Forklift and crane checklists;
• Safety device checklists;
• Banned item control;
• Permit to work/non-routine risk assessments;
• Safety training;
• Incident review;
• Statutory inspections; and
• Near miss reporting.
The audit report fi ndings are discussed at management meetings and closure addressed at the subsequent audit.
There have been no noise induced hearing loss (NIHL) claims during 2010LA.
As part of the Behaviour Based Safety (BBS) approach, Safety Awards are held every year. These awards recognise individuals and teams that have worked safely and responsibly during the year.
LA Limited assurance provided by independent assurance provider(refer page 24).

44 page • Annual Report 2010
Corporate governance
Hulamin views the implementation of good corporate governance practices
as integral to its business and recognises the need to conduct its business
with openness, integrity and accountability.
The company has complied with the provisions of the King II Report, other
than that the majority of members of the Remuneration and Nomination
Committee are not independent directors, and has complied with the
Listings Requirements of the JSE Limited during the period under review.
The board of directors is committed to comply in all material respects
with the King III principles and best practice recommendations. Various
initiatives are in progress to ensure that Hulamin will be able to report
compliance with King III by the end of December 2011.
Board of directors
As set out in its charter, the board’s objective is to provide responsible
business leadership to the group with due regard to the interest of all
stakeholders.
Hulamin has a unitary board consisting of three executive directors and
eight non-executive directors of whom fi ve are independent.
Details of the directors are listed on pages 18 and 19 together with a brief
resume of each director. The roles of M E Mkwanazi as an independent
non-executive Chairman and R G Jacob as the Chief Executive Offi cer are
separate with a clear division of responsibilities.
At board level there is a clear division of responsibilities to ensure a
balance of power and authority, such that no one individual has unfettered
powers of decision making.
VK “Kido” Daniso, jigging aluminium extrusions onto a fl ight bar in preparation for anodising
The board of directors is committed to comply in all material respects with the King III principles and best practice recommendations..
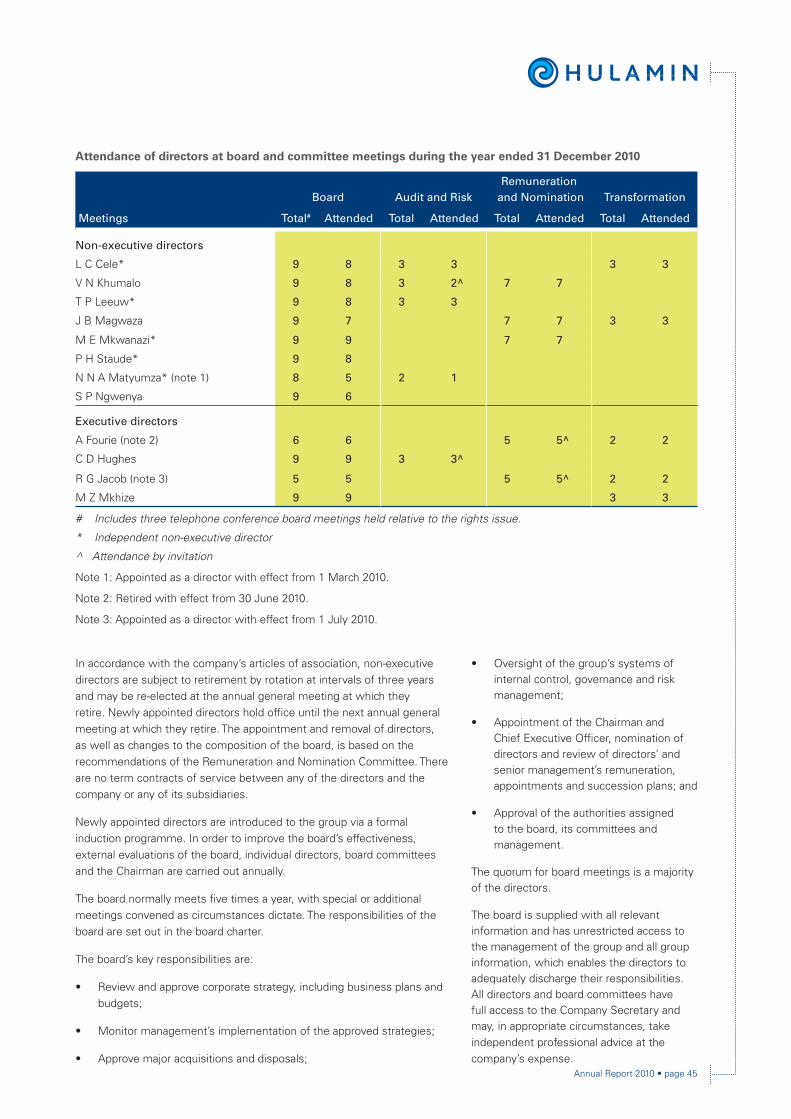
Annual Report 2010 • page 45
In accordance with the company’s articles of association, non-executive directors are subject to retirement by rotation at intervals of three years and may be re-elected at the annual general meeting at which they retire. Newly appointed directors hold offi ce until the next annual general meeting at which they retire. The appointment and removal of directors, as well as changes to the composition of the board, is based on the recommendations of the Remuneration and Nomination Committee. There are no term contracts of service between any of the directors and the company or any of its subsidiaries.
Newly appointed directors are introduced to the group via a formal induction programme. In order to improve the board’s effectiveness, external evaluations of the board, individual directors, board committees and the Chairman are carried out annually.
The board normally meets fi ve times a year, with special or additional meetings convened as circumstances dictate. The responsibilities of the board are set out in the board charter.
The board’s key responsibilities are:
• Review and approve corporate strategy, including business plans and budgets;
• Monitor management’s implementation of the approved strategies;
• Approve major acquisitions and disposals;
Attendance of directors at board and committee meetings during the year ended 31 December 2010
Board Audit and RiskRemuneration
and Nomination Transformation
Meetings Total# Attended Total Attended Total Attended Total Attended
Non-executive directors
L C Cele* 9 8 3 3 3 3
V N Khumalo 9 8 3 2^ 7 7
T P Leeuw* 9 8 3 3
J B Magwaza 9 7 7 7 3 3
M E Mkwanazi* 9 9 7 7
P H Staude* 9 8
N N A Matyumza* (note 1) 8 5 2 1
S P Ngwenya 9 6
Executive directors
A Fourie (note 2) 6 6 5 5^ 2 2
C D Hughes 9 9 3 3^
R G Jacob (note 3) 5 5 5 5^ 2 2
M Z Mkhize 9 9 3 3
# Includes three telephone conference board meetings held relative to the rights issue.
* Independent non-executive director
^ Attendance by invitation
Note 1: Appointed as a director with effect from 1 March 2010.
Note 2: Retired with effect from 30 June 2010.
Note 3: Appointed as a director with effect from 1 July 2010.
• Oversight of the group’s systems of internal control, governance and risk management;
• Appointment of the Chairman and Chief Executive Offi cer, nomination of directors and review of directors’ and senior management’s remuneration, appointments and succession plans; and
• Approval of the authorities assigned to the board, its committees and management.
The quorum for board meetings is a majority of the directors.
The board is supplied with all relevant information and has unrestricted access to the management of the group and all group information, which enables the directors to adequately discharge their responsibilities. All directors and board committees have full access to the Company Secretary and may, in appropriate circumstances, take independent professional advice at the company’s expense.

46 page • Annual Report 2010
Corporate governancecontinued
Board committees
The board has delegated, through formal terms of reference, specifi c matters to a number of committees whose members and chairman are appointed by the board. There is full disclosure of matters handled by the committees to the board.
The board has an Audit and Risk Committee, a Remuneration and Nomination Committee and a Transformation Committee.
Audit and Risk Committee
The group Audit and Risk Committee consists solely of independent non-executive directors and has had its responsibilities expanded in 2010 to include risk management and became the Audit and Risk Committee in compliance with the recommendations of King III. Its members are T P Leeuw (Chairman), L C Cele and N N A Matyumza, the latter being appointed a member of the committee with effect from 1 March 2010. The Chief Financial Offi cer as well as V N Khumalo and representatives of the internal and external auditors attend committee meetings by invitation. The Company Secretary, W Fitchat is the secretary of this committee. The committee normally meets three times a year. The
responsibilities of the committee are set out in written terms of reference, which are reviewed periodically.
The group Audit and Risk Committee’s key responsibilities are:
• Ensuring the integrity of the fi nancial reporting process, including sound systems of internal control and fi nancial risk management;
• Review of Annual Reports, Interim Reports and other fi nancial announcements, including the accounting principles and policies adopted therein and compliance to JSE regulations;
• Monitor the performance and effectiveness of the external auditors and evaluate the qualifi cations, expertise, resources, fees, scope of work and independence of the external auditors prior to recommending their appointment to the board and shareholders;
• Approve the internal audit work plan and oversee the conduct of the internal audit and the implementation of internal control enhancements;
• Approve any non-audit services provided by the external auditors;
• Consider the appropriateness of the expertise, resources and experience of the fi nancial function and of the Chief Financial Offi cer;
• Approve the appointment of an external assurance provider in respect of the sustainability report; and
• Ensure the development and implementation of a policy and plan for a systematic, disciplined approach to evaluate and improve the effectiveness of risk management and control processes within the group.
Chris Greyling, Rollshop Maintenance Fitter
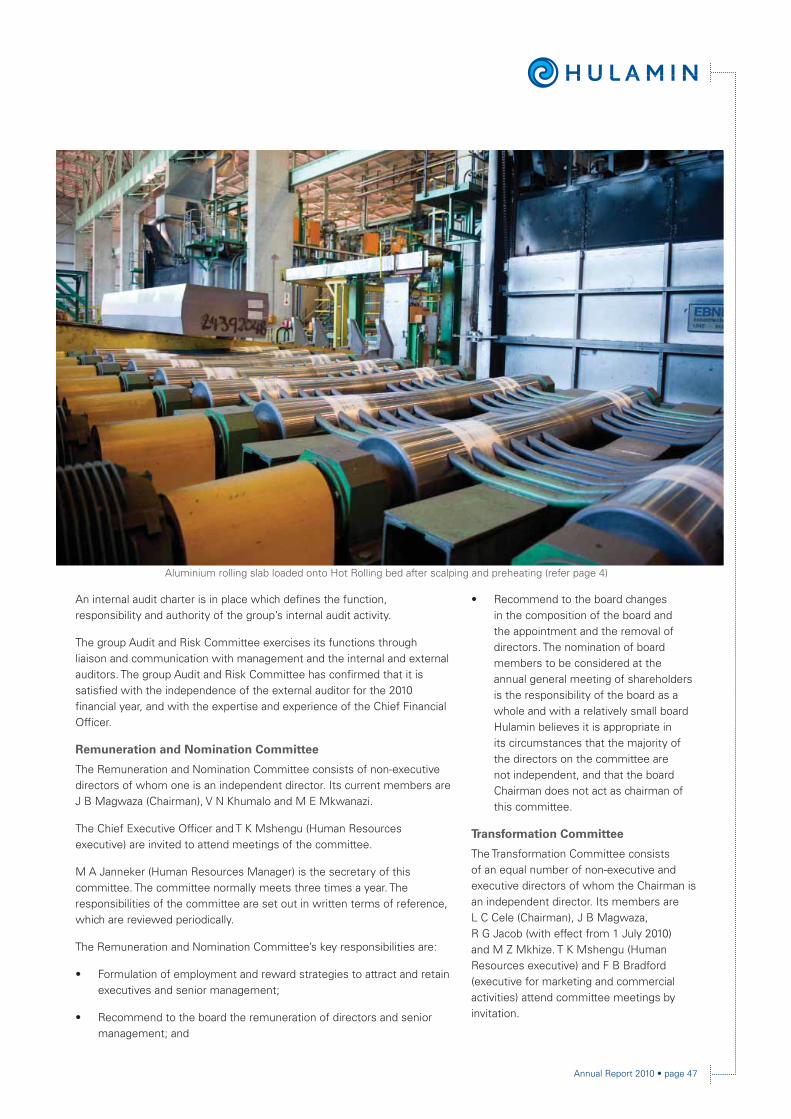
Annual Report 2010 • page 47
An internal audit charter is in place which defi nes the function, responsibility and authority of the group’s internal audit activity.
The group Audit and Risk Committee exercises its functions through liaison and communication with management and the internal and external auditors. The group Audit and Risk Committee has confi rmed that it is satisfi ed with the independence of the external auditor for the 2010 fi nancial year, and with the expertise and experience of the Chief Financial Offi cer.
Remuneration and Nomination Committee
The Remuneration and Nomination Committee consists of non-executive directors of whom one is an independent director. Its current members are J B Magwaza (Chairman), V N Khumalo and M E Mkwanazi.
The Chief Executive Offi cer and T K Mshengu (Human Resources executive) are invited to attend meetings of the committee.
M A Janneker (Human Resources Manager) is the secretary of this committee. The committee normally meets three times a year. The responsibilities of the committee are set out in written terms of reference, which are reviewed periodically.
The Remuneration and Nomination Committee’s key responsibilities are:
• Formulation of employment and reward strategies to attract and retain executives and senior management;
• Recommend to the board the remuneration of directors and senior management; and
• Recommend to the board changes in the composition of the board and the appointment and the removal of directors. The nomination of board members to be considered at the annual general meeting of shareholders is the responsibility of the board as a whole and with a relatively small board Hulamin believes it is appropriate in its circumstances that the majority of the directors on the committee are not independent, and that the board Chairman does not act as chairman of this committee.
Transformation Committee
The Transformation Committee consists of an equal number of non-executive and executive directors of whom the Chairman is an independent director. Its members are L C Cele (Chairman), J B Magwaza, R G Jacob (with effect from 1 July 2010) and M Z Mkhize. T K Mshengu (Human Resources executive) and F B Bradford (executive for marketing and commercial activities) attend committee meetings by invitation.
Aluminium rolling slab loaded onto Hot Rolling bed after scalping and preheating (refer page 4)

48 page • Annual Report 2010
Corporate governancecontinued
N Mthembu (Communications Manager) is the secretary of this committee. The committee normally meets three times a year. The responsibilities of the committee are set out in written terms of reference, and are reviewed periodically. The Transformation Committee’s key responsibilities are:
• Recommend to the board the strategies and policies to be adopted to ensure the group’s transformation targets are achieved;
• Align the group’s transformation strategy with its overall business strategy; and
• Monitor the implementation and effi cacy of the employment equity, black management development, black equity ownership, preferential procurement, skills and enterprise development and socio-economic initiatives of the group.
Group executive committees
The group has a number of executive committees consisting of executive directors and other senior executives, with formal terms of reference approved by the board.
Executive Committee
The Executive Committee consists of the executive directors and other senior executives. The current members are R G Jacob (Chairman), F B Bradford, C D Hughes, C J Little, M Z Mkhize, H T Molale (with effect from 1 July 2011), T K Mshengu and P A Taljaard (with effect from 1 July 2011).
The Company Secretary, W Fitchat is the secretary of this committee. The committee normally meets on a monthly basis.
The objective of the committee is to assist Hulamin’s board in discharging its responsibilities, while acting within the parameters of the authority limits agreed by the board. The responsibilities of the committee are set out in written terms of reference which are reviewed from time to time.
The Executive Committee’s key responsibilities are:
• Recommend the business strategy, business plans and budgets to be adopted by the group;
• Manage the implementation and execution of the business strategies and plans approved by the board;
• Recommend major acquisitions and disposals as part of the group’s business strategy;
• Ensure the group’s systems of internal control, governance and risk management are both robust and well managed;
• Implement the approved authorities matrix within the organisation and approve the appointment of senior managers and the members of the group’s other executive committees; and
• Approve the capital expenditure plans of the group, within the budget approved by the board.
Risk Management Committee
The members of the Risk Management Committee are drawn from the group’s senior executives. The current members are C D Hughes (Chairman), F B Bradford, R G Jacob, A P Krull, C J Little, M Z Mkhize, H T Molale, T K Mshengu and P A Taljaard. The Company Secretary, W Fitchat is the secretary of this committee. The committee normally meets four times a year.
While the board is ultimately accountable for risk management through the Audit and Risk Committee, the implementation of the group’s risk management policies and systems of internal control are an integral part of management of the group’s operations.
The Risk Management Committee’s key responsibilities are:
• Recommend to the board the risk management strategies and policies of the group;
• Review the integrity and appropriateness of the group’s systems of risk assessment and management;
• Identifying new or emerging risks related to all aspects of the business, including fi nancial, operational and compliance risks;
• Monitor risk reduction actions;
• Review the internal controls that have been implemented to manage signifi cant risks, and the assurance provided in respect of those controls; and
• Report on its activities to the Audit and Risk Committee.
Employment Equity Committee
The Employment Equity Committee members are drawn from the group’s senior managers. Its current members are R G Jacob (Chairman), F B Bradford, V Dukhee, C D Hughes, M A Janneker, C J Little, M M F Mabe, H T Molale, M Z Mkhize, T K Mshengu, N Mthembu, R N Nyandeni and P A Taljaard. M A Janneker (Human Resources Manager) is the secretary of this committee. The committee normally meets four times a year.

Annual Report 2010 • page 49
The Employment Equity Committee’s key responsibilities are:
• Formulate strategy, policies and targets related to employment equity;
• Monitor the implementation of the agreed strategies for employment equity; and
• Involve a diverse range of employees in employment equity decision making.
Safety, Health and Environment Committee
The Safety, Health and Environmental (SHE) Committee members are drawn from the group’s senior managers. The current members are R G Jacob (Chairman), M Aldworth, F B Bradford, B Henderson, M Z Mkhize, H T Molale, T K Mshengu and P A Taljaard. The Company Secretary, W Fitchat, is the secretary of this committee. The committee normally meets on a quarterly basis.
The Safety, Health and Environment Committee’s key responsibilities are:
• Review SHE performance;
• Review major SHE risks;
• Monitor actions to reduce SHE related risks;
• Identify new or emerging risks related to SHE; and
• Review of the internal controls to manage SHE risks.
Investor relations and shareholder communication
The group communicates its strategy, performance and vision through regular presentations to investors, analysts, employees and other stakeholders. In addition, management regularly meets with investors and institutional stakeholders on a one-to-one basis. The group website (www.hulamin.co.za) is also used for this purpose.
Code of ethics
The group’s code of ethics requires all directors and employees to be committed to fair dealing, honesty and integrity in the conduct of its business and also outlines the group’s position on gifts and entertainment. The code of ethics has been actively endorsed by the board and distributed to all employees in the group.
The code is designed to raise ethical awareness, act as a guide in day-to-day decisions and to assure customers and other stakeholders of the group’s commitment to ethical behaviour.
An important element of the induction process is to communicate to new employees the code of ethics, the group’s core values and its compliance procedures.
Compliance by all employees to the high moral, ethical and legal standards of the code is mandatory, and if employees become aware of, or suspect, a contravention of the code, they must promptly and confi dentially report it in the prescribed manner. Appropriate action has been taken in respect of all reported instances of non-compliance with the code by employees.
Whistle-blowing
Hulamin has an established whistle-blowing policy and has an anonymous reporting facility (the Vuvuzela Ethics Line), enabling employees and other stakeholders to report fraudulent, corrupt or unethical behaviour related to any of the group’s activities, without fear of victimisation and retribution. Anonymity is guaranteed and the facility is managed in compliance with the Protected Disclosures Act, No 26 of 2000.
Contact details of the Vuvuzela Ethics Line are as follows:
Toll free number: 080 225 5688
E-mail: [email protected]
Website: www.thehotline.co.za
All fraud and theft matters are reported to the Audit and Risk Committee. There were no signifi cant frauds or thefts during the period under review.
Price-sensitive information
No director, offi cer or employee may deal either directly or indirectly in the company’s shares on the basis of unpublished price-sensitive information regarding the company’s business or affairs. In addition, no director, offi cer or employee in possession of price-sensitive information may trade in the company’s shares during closed periods. Closed periods are from the end of the interim and annual reporting periods to the announcement of fi nancial and operating results for the respective periods, and while the company is under a cautionary announcement.

50 page • Annual Report 2010
Five-year review
2010 2009 2008 2007 2006#
R’000 R’000 R’000 R’000 R’000
FINANCIAL STATISTICS
Trading results
Revenue 5 808 667 4 499 582 7 119 973 6 568 371 5 476 140
Operating profi t before corporate structuring costs 218 233 243 974 465 451 380 036 432 427
Corporate structuring costs – – – (168 389) (10 000)
Operating profi t 218 233 243 974 465 451 211 647 422 427
Net fi nance costs (116 923) (113 813) (118 253) (85 262) (222 119)
Share of profi ts/(losses) of associates and joint ventures 2 654 383 1 111 216 (310)
Profi t before tax 103 964 130 544 348 309 126 601 199 998
Taxation (30 716) (40 911) (79 527) (89 131) 11 379
Non-controlling interests – – (610) 3 291 (7 305)
Net profi t attributable to shareholders 73 248 89 633 268 172 40 761 204 072
Headline earnings attributable to shareholders 74 813 91 599 267 666 39 875 204 142
Balance sheet
Property, plant, equipment, intangibles and investments 5 074 879 5 019 615 4 802 890 4 196 933 3 964 232
Retirement benefi t asset 73 819 – – – –
Deferred tax asset 22 102 13 899 11 697 16 373
Current assets 2 186 972 1 880 688 2 855 925 2 116 899 2 170 837
Total assets 7 357 772 6 914 202 7 670 512 6 330 205 6 135 069
Equity holders’ interest 4 609 534 3 744 279 3 760 146 3 494 151 2 912 318
Non-controlling interests – – – 35 142 38 433
Borrowings: non-current and current 982 836 1 473 318 1 813 060 920 653 1 213 674
Deferred tax liability 941 260 912 876 926 359 894 203 899 815
Retirement benefi t obligations 147 909 132 946 119 512 107 505 98 632
Current liabilities (excluding current borrowings) 676 233 650 783 1 051 435 878 551 972 197
Total equity and liabilities 7 357 772 6 914 202 7 670 512 6 330 205 6 135 069
Cash fl ow
Net cash (outfl ow)/infl ow from operating activities (53 732) 724 257 (34 321) 339 896 110 565
Net cash outfl ow from investing activities (228 010) (351 831) (753 041) (403 046) (237 232)
Net cash infl ow/(outfl ow) from fi nancing activities 241 768 (374 187) 761 390 91 770 149 334
Net cash (decrease)/increase for the year (39 974) (1 761) (25 972) 28 620 22 667

Annual Report 2010 • page 51
2010 2009 2008 2007 2006#
R’000 R’000 R’000 R’000 R’000
RATIOS AND STATISTICS
Earnings
Earnings per share* (cents) 26 37 110 17 88
Headline earnings per share* (cents) 27 37 110 16 88
Dividend per share** (cents) 41 48
Dividend cover** (times) 3,02 0,38
Profi tability
Operating margin (1) (%) 3,8 5,4 6,5 5,8 7,9
Return on capital employed (2) (%) 3,4 3,8 7,7 7,2 8,7
Return on equity attributable to shareholders (3) (%) 1,8 2,4 7,4 1,2 7,5
Financial
Net debt to equity (4) (%) 20,8 37,6 46,5 23,5 39,0
Current ratio (5) 2,23 2,89 2,72 2,41 2,23
Liquidity ratio (6) 1,47 1,33 1,46 1,31 1,22
Defi nitions(1) Operating profi t before corporate structuring costs expressed as a percentage of revenue.(2) Operating profi t before corporate structuring costs expressed as a percentage of average capital employed.(3) Headline earnings expressed as a percentage of average equity.(4) Current and non-current borrowings less cash divided by total equity.(5) Current assets divided by current liabilities.(6) Current assets (excluding inventories) divided by current liabilities.# The results for 2006 are the combined results of Hulamin Limited and The Hulamin Joint Venture. * EPS and HEPS prior to 2010 have been adjusted for the effects of the rights issue concluded in June 2010.** No dividends were declared in 2006, 2009 and 2010. The 2007 and 2008 dividend cover has been computed using original
HEPS, prior to adjustment for the effects of the rights issue referred to above.

52 page • Annual Report 2010
Civils construction for a new charge bucket to be used at the new melting furnace

Annual Report 2010 • page 53
Financial statements
Statutory approvals and reports Directors’ approval of the annual fi nancial statements 54Certifi cate by the Company Secretary 54Report of the independent auditors 55Directors’ statutory report 56Directors’ remuneration and shareholding 59
Accounting policies of the group and company 67
Group fi nancial statementsGroup balance sheet 76Group income statement 77Group statement of comprehensive income 77Group statement of changes in equity 78Group cash fl ow statement 80Index to the notes to the group fi nancial statements 81Financial risk management 111
Company fi nancial statementsCompany balance sheet 114Company statement of comprehensive income 115Company statement of changes in equity 116Company cash fl ow statement 117Notes to the company fi nancial statements 118
54 page • Annual Report 2010
I certify that the company has lodged with the Registrar of Companies all returns that are required of a public company in terms of the Companies Act in respect of the year ended 31 December 2010 and that all such returns are true, correct and up to date.
W FitchatCompany Secretary
Pietermaritzburg, KwaZulu-Natal24 February 2011
Certifi cate by the Company Secretary
Directors’ approval of the annual fi nancial statements for the year ended 31 December 2010
The directors are responsible for the preparation and integrity of the annual fi nancial statements of the company and the group, which have been prepared in accordance with International Financial Reporting Standards.
The directors, supported by the Audit and Risk Committee, are of the opinion, based on the information and explanations given by management and the internal auditors and on the comment by the independent auditors on the results of their statutory audit, that Hulamin’s internal accounting controls may be relied upon for preparing the fi nancial statements and maintaining accountability for assets and liabilities. Nothing has come to the attention of the directors to indicate that any material breakdown in the functioning of these controls has occurred during the year.
In preparing the fi nancial statements, the company and the group have used appropriate accounting policies, supported by reasonable and prudent judgements and estimates, and have complied with all applicable accounting standards. The directors are of the opinion that the fi nancial statements fairly present the fi nancial position of the company and the group at 31 December 2010 and the results of their operations for the year then ended. The directors have considered the group’s past results, expected future performance and reasonable changes thereto, and access to its funding, material and other resources, and are of the opinion that the company and the group will continue as a going concern.
The company’s independent external auditors, PricewaterhouseCoopers, have audited the fi nancial statements and their unqualifi ed report appears on page 55 .
The annual fi nancial statements were approved by the board of directors on 24 February 2011 and are signed on its behalf by:
Mafi ka Mkwanazi Richard JacobChairman Chief Executive Offi cer
Pietermaritzburg, KwaZulu-Natal24 February 2011
Annual Report 2010 • page 55
Report of the independent auditors
To the members of Hulamin Limited
We have audited the group annual fi nancial statements and annual fi nancial statements of Hulamin Limited which comprise the consolidated and separate balance sheets as at 31 December 2010, and the consolidated income statement, consolidated and separate statements of comprehensive income, consolidated and separate statements of changes in equity, and consolidated and separate cash fl ow statements for the year then ended, and a summary of signifi cant accounting policies and other explanatory notes, and the directors’ report, as set out on pages 56 to 121.
Directors’ responsibility for the fi nancial statements
The company’s directors are responsible for the preparation and fair presentation of these fi nancial statements in accordance with International Financial Reporting Standards and in the manner required by the Companies Act of South Africa, and for such internal control as the directors determine is necessary to enable the preparation of fi nancial statements that are free from material misstatements, whether due to fraud or error.
Auditor’s responsibility
Our responsibility is to express an opinion on these fi nancial statements based on our audit. We conducted our audit in accordance with International Standards on Auditing. Those standards require that we comply with ethical requirements and plan and perform the audit to obtain reasonable assurance whether the fi nancial statements are free from material misstatement.
An audit involves performing procedures to obtain audit evidence about the amounts and disclosures in the fi nancial statements. The procedures selected depend on the auditor’s judgement, including the assessment of the risks of material misstatement of the fi nancial statements, whether due to fraud or error. In making those risk assessments, the auditor considers internal control relevant to the entity’s preparation and fair presentation of the fi nancial statements in order to design audit procedures that are appropriate in the circumstances, but not for the purpose of expressing an opinion on the effectiveness of the entity’s internal control. An audit also includes evaluating the appropriateness of accounting policies used and the reasonableness of accounting estimates made by management, as well as evaluating the overall presentation of the fi nancial statements.
We believe that the audit evidence we have obtained is suffi cient and appropriate to provide a basis for our audit opinion.
Opinion
In our opinion, the fi nancial statements present fairly, in all material respects, the consolidated and separate fi nancial position of Hulamin Limited as at 31 December 2010, and its consolidated and separate fi nancial performance and its consolidated and separate cash fl ows for the year then ended in accordance with International Financial Reporting Standards and in the manner required by the Companies Act of South Africa.
Director: H Ramsumer
Registered Auditor
Durban, KwaZulu-Natal
24 February 2011
Director: H Ramsumer
56 page • Annual Report 2010
Directors’ statutory report
Dear shareholder
The directors have pleasure in presenting their annual report which forms part of the annual fi nancial statements of the company and the group for the year ended 31 December 2010.
Nature of business
The Hulamin group consists of two operations: Hulamin Rolled Products and Hulamin Extrusions. Their activities are dealt with separately in the annual report.
Financial results
The net profi t attributable to shareholders of the group for the year ended 31 December 2010 amounted to R73 248 000 (2009: R89 633 000). This translates into a headline earnings per share of 27 cents (2009: 37 cents) based on the weighted average number of shares in issue during the year.
The fi nancial statements on pages 76 to 121 set out the fi nancial position, results of operations and cash fl ows of the group and company for the fi nancial year ended 31 December 2010.
Dividends
No interim or fi nal dividend for the year ending 31 December 2010 was declared.
Share capital
There were the following changes in the authorised share capital of the company in the year ended 31 December 2010:
• At a shareholders’ meeting held in May 2010, shareholders approved an increase in the authorised share capital of the company from R29 500 000 to R85 500 000, by the creation of an additional 560 000 000 ordinary par value shares of 10 cents each. The authorised share capital at 31 December 2010 consisted of 800 000 000 ordinary par value shares of 10 cents each, 34 000 000 A ordinary par value shares of 10 cents each, 8 000 000 B1 ordinary par value shares of 10 cents each, 10 000 000 B2 ordinary par value shares of 10 cents each, and 3 000 000 B3 ordinary par value shares of 10 cents each.
• On the 28 June 2010, 100 000 000 ordinary par value shares of 10 cents each were issued as a consequence of the rights offer at R7,50 each, thereby raising R750 000 000.
• During the year, 590 285 (2009: 450 976) ordinary par value shares of 10 cents each were issued in terms of employee share schemes which existed at the time of unbundling from Tongaat Hulett Limited (no shares were issued to directors). This resulted in the total issued ordinary share capital (including A ordinary shares and B ordinary shares) rising to R35 313 135, or 353 131 351 ordinary par value shares of 10 cents each.
Details of the unissued ordinary shares and the group’s share incentive schemes are set out in pages 90, 101 to 109 and 119.
At a general meeting held on the 24 February 2011, shareholders approved special resolutions to increase the authorised share capital of R85 500 000 to R87 300 000 by the creation of 11 000 000 A ordinary par value shares of 10 cents each and 7 000 000 B1 ordinary par value shares of 10 cents each. This will enable the issue of further A and B shares to the existing A and B class shareholders to put them in a similar economic and voting position as they were in prior to the rights issue in June 2010.
Shareholders will also be asked to consider an ordinary resolution at the forthcoming annual general meeting to adopt amendments to the following share schemes:
• Hulamin Share Appreciation Right Scheme 2007;
• Hulamin Long Term Incentive Plan 2007; and
• Hulamin Deferred Bonus Plan 2007.
The amendments to the share schemes, which have been approved by the JSE, were made to ensure alignment of the various scheme rules relative to cessation of employment and death, and the removal of retesting provisions to ensure compliance with certain King III principles.
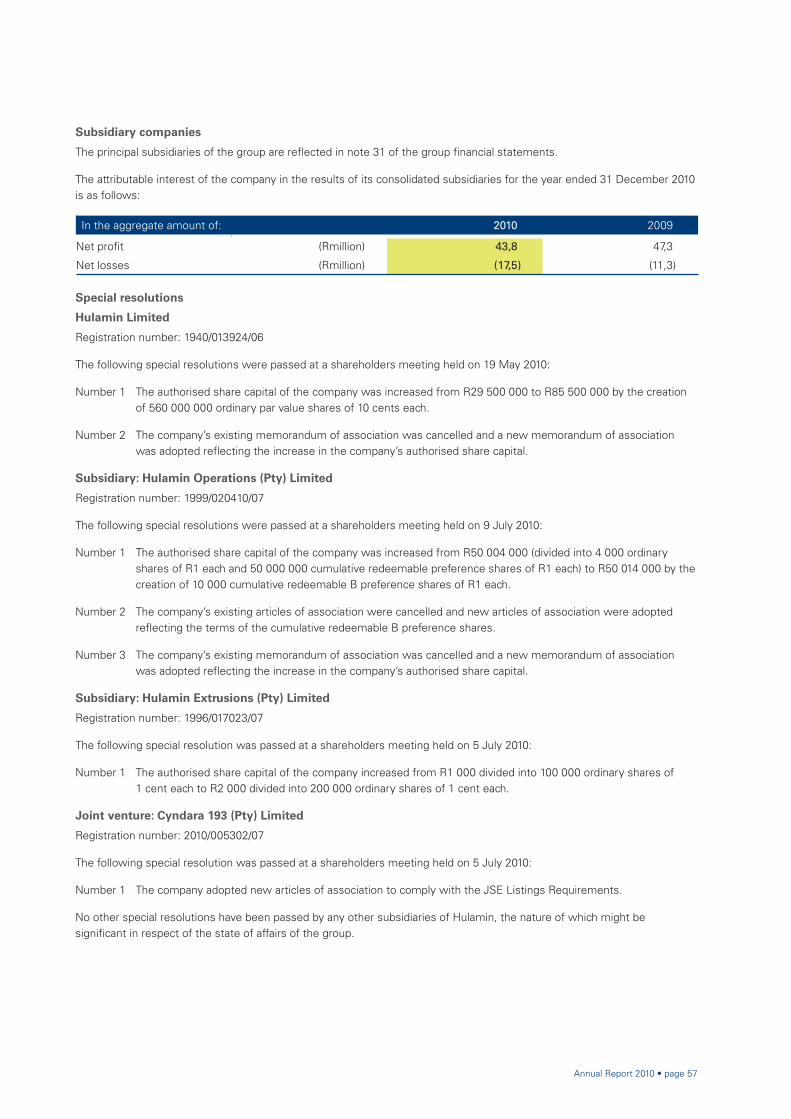
Annual Report 2010 • page 57
Subsidiary companies
The principal subsidiaries of the group are refl ected in note 31 of the group fi nancial statements.
The attributable interest of the company in the results of its consolidated subsidiaries for the year ended 31 December 2010 is as follows:
In the aggregate amount of: 2010 2009
Net profi t (Rmillion) 43,8 47,3
Net losses (Rmillion) (17,5) (11,3)
Special resolutions
Hulamin Limited
Registration number: 1940/013924/06
The following special resolutions were passed at a shareholders meeting held on 19 May 2010:
Number 1 The authorised share capital of the company was increased from R29 500 000 to R85 500 000 by the creation of 560 000 000 ordinary par value shares of 10 cents each.
Number 2 The company’s existing memorandum of association was cancelled and a new memorandum of association was adopted refl ecting the increase in the company’s authorised share capital.
Subsidiary: Hulamin Operations (Pty) Limited
Registration number: 1999/020410/07
The following special resolutions were passed at a shareholders meeting held on 9 July 2010:
Number 1 The authorised share capital of the company was increased from R50 004 000 (divided into 4 000 ordinary shares of R1 each and 50 000 000 cumulative redeemable preference shares of R1 each) to R50 014 000 by the creation of 10 000 cumulative redeemable B preference shares of R1 each.
Number 2 The company’s existing articles of association were cancelled and new articles of association were adopted refl ecting the terms of the cumulative redeemable B preference shares.
Number 3 The company’s existing memorandum of association was cancelled and a new memorandum of association was adopted refl ecting the increase in the company’s authorised share capital.
Subsidiary: Hulamin Extrusions (Pty) Limited
Registration number: 1996/017023/07
The following special resolution was passed at a shareholders meeting held on 5 July 2010:
Number 1 The authorised share capital of the company increased from R1 000 divided into 100 000 ordinary shares of 1 cent each to R2 000 divided into 200 000 ordinary shares of 1 cent each.
Joint venture: Cyndara 193 (Pty) Limited
Registration number: 2010/005302/07
The following special resolution was passed at a shareholders meeting held on 5 July 2010:
Number 1 The company adopted new articles of association to comply with the JSE Listings Requirements.
No other special resolutions have been passed by any other subsidiaries of Hulamin, the nature of which might be signifi cant in respect of the state of affairs of the group.

58 page • Annual Report 2010
Directorate
Brief curricula vitae of the directors appear on pages 18 and 19. Details of the directors’ remuneration appear on pages 59 to 61.
Mr A Fourie retired as chief executive offi cer with effect from 30 June 2010 and Mr R G Jacob was appointed as Chief Executive Offi cer with effect from 1 July 2010. Ms N N A Matyumza was appointed to the board on 1 March 2010.
Directors retiring at the annual general meeting in accordance with the articles of association are Mr T P Leeuw, Mr J B Magwaza and Mr M E Mkwanazi. These directors are all eligible and offer themselves for re-election.
Directors’ shareholdings
At 31 December 2010, the present directors of the company benefi cially held a total of 325 266 ordinary par value shares equivalent to 0,102 percent in the company (2009: 224 347 ordinary par value shares, equivalent to 0,104 per cent, were held by directors). Their associates also held a total of 11 700 ordinary par value shares equivalent to 0,004 percent in the company (2009: 8 000 ordinary par value shares equivalent to 0,004 per cent were held by associates of the directors). Details of the directors’ shareholdings and interests in the share incentive schemes are set out in pages 62 to 66.
There has been no change in the directors’ shareholdings between 31 December 2010 and 24 February 2011.
Holding company
Hulamin Limited has no holding company at 31 December 2010.
Auditors
Shareholders will be asked to confi rm the appointment of PricewaterhouseCoopers for the ensuing year.
Secretary
The name and address of the Company Secretary appears in the corporate information on the inside back cover.
Post balance sheet events
There were no material events between the balance sheet date and the date of this report.
Approval
The annual fi nancial statements of the group and company set out on pages 56 to 121 have been approved by the board.
Signed on behalf of the board of directors by:
Mafi ka Mkwanazi Richard JacobChairman Chief Executive Offi cer
Pietermaritzburg, KwaZulu-Natal24 February 2011
Directors’ statutory report continued

Annual Report 2010 • page 59
Directors’ remuneration and shareholding
1. REMUNERATION PHILOSOPHY AND POLICY
The major aim of the reward philosophy is to provide principles and guidelines in respect of reward structures and the management of reward practices that enable Hulamin to attract, retain and motivate directors of the calibre needed to enhance and maintain the group’s reputation and to achieve its strategic objectives. The reward philosophy, policy and strategies also serve to align the interests of directors and shareholders and are clearly communicated to directors concerned.
1.1 Executive directors’ remuneration
Basic salary
The cash package of the executive directors is subject to annual review by the Remuneration and Nomination Committee and the board, and is set with reference to relevant external market data.
Annual performance incentive bonus scheme
The annual performance incentive bonus scheme is based on a combination of the achievement of corporate fi nancial and safety targets and a general assessment of the individual’s overall performance which are determined annually. The fi nancial targets are related to the budgets of Hulamin as a whole as well as its operations and are decided annually. All fi nancial targets have an upper and a lower limit which are reviewed annually.
The Remuneration and Nomination Committee and the board have the discretion to decide on the payment or non-payment of performance incentive bonus awards.
Share incentive schemes
The unbundling of Hulamin from Tongaat Hulett resulted in the conversion of the existing rights of Hulamin employees to Tongaat Hulett shares, under Tongaat Hulett share incentive schemes, into rights to Hulamin shares. The value of these rights to Hulamin shares are based partly on the Tongaat Hulett share price and partly on the Hulamin share price. The original strike price established for the Tongaat Hulett schemes for these incentives was apportioned between the Tongaat Hulett and Hulamin elements of these awards. This has been covered in more detail in note 30 to the annual fi nancial statements.
Hulamin has adopted three additional share incentive schemes, namely, the Hulamin Share Appreciation Right Scheme 2007 (SARS), Hulamin Long Term Incentive Plan 2007 (LTIP) and Hulamin Deferred Bonus Plan 2007 (DBP). Executive directors and employees of the company are awarded rights to receive shares in the company based on the value of these awards (after the deduction of employees’ tax) when performance conditions have been met, the awards have vested, and, in the case of the SARS, when the share appreciation rights have been exercised.
The performance conditions governing the vesting of the above scheme instruments are related to growth in earnings per share, share price, total shareholder return and return on capital employed, relative to targets that are intended to be challenging but achievable. Targets are linked, where applicable, to the company’s medium- term business plan, over three-year performance periods, with actual grants being set each year considering the position held by the participating employee, their individual performance, and the expected combined value of the awards.
As part of the introduction of broad-based black economic empowerment ownership of the group’s shares, in 2007 Hulamin created an Employee Share Ownership Plan (ESOP) for all employees up to middle management and a Management Share Ownership Plan (MSOP) for senior black managers. Black executive directors are eligible to participate in the MSOP, which consists of share appreciation rights (SARS) and grant awards. Both the share appreciation awards and grant awards under the MSOP scheme are exercisable fi ve years after the grant date.
Other benefi ts
Membership of the Hulamin Defi ned Pension Fund (with effect from 1 November 2010) is compulsory for all senior management and disability and life insurance benefi ts are also provided to members of the fund. Prior to 1 November 2010, membership of The Tongaat-Hulett Pension Fund was compulsory for all senior management. Medical aid benefi ts and a gratuity at retirement are also provided.
Termination conditions for executives
The Chief Executive Offi cer and executives are subject to a three-month and two-month notice period respectively. Hulamin reserves the right to terminate an executive’s employment without notice, for any legally suffi cient cause. Executive employment conditions do not allow for payment on termination arising from executive failure or for balloon payments.

60 page • Annual Report 2010
1. REMUNERATION PHILOSOPHY AND POLICY continued
1.2 Non-executive directors’ remuneration
Non-executive directors receive fees for their services on the board and board committees. Director’s fees comprise a fi xed element (70%) which is paid for holding the offi ce of director, and a variable element (30%) which is linked to attendance at regular scheduled meetings of the board and/or subcommittees.
Fees for non-executive directors are reviewed on an annual basis taking relevant external market data into account. Fees are recommended by the Remuneration and Nomination Committee and are submitted to the board and the shareholders for approval at each annual general meeting.
Non-executive directors do not participate in the group’s performance incentive bonus plan or share incentive schemes.
J B Magwaza and S P Ngwenya, through their interests in Imbewu Consortium and Makana Investment Corporation respectively, are participants in the Hulamin BEE entity. (See page 109 for further details on the Hulamin BEE equity transaction.)
1.3 Directors’ remuneration
a) Directors’ remuneration during the 2010 fi nancial year was as follows:
^ Executive directors received no bonuses in relation to the 2010 year.
* Directors’ fees due to a shareholder nominee on the Hulamin board are paid to the employer organisation and not to the nominee.
(A) Includes a retirement gratuity payment of R1 197 150 and a pension fund waiver of R1 797 219 on early retirement.
(B) Includes compensation in lieu of 2010 share awards amounting to R417 795.
Director
Retainerfees
Rand
Atten-dance
feesRand
Cashpackage
Rand
Per-formance
bonusand related
payments^Rand
Retirementand
medicalcontri-
butionsRand
SubtotalRand
ShareoptiongainsRand
TotalRand
Non-executive
M E Mkwanazi 310 000 76 001 386 001 386 001
L C Cele 197 391 47 015 244 406 244 406
V N Khumalo* 139 917 29 293 169 210 169 210
T P Leeuw 182 173 43 173 225 346 225 346
J B Magwaza 190 555 39 684 230 239 230 239
N N A Matyumza 118 302 29 763 148 065 148 065
S P Ngwenya 111 333 25 293 136 626 136 626
P H Staude 111 333 25 293 136 626 136 626
Subtotal 1 361 004 315 515 1 676 519 1 676 519
Executive (A) (B)
A Fourie 2 591 796 3 270 283 5 862 079 4 879 075 10 741 154
C D Hughes 2 065 200 382 408 2 447 608 283 796 2 731 404
R G Jacob 2 337 000 400 264 2 737 264 21 950 2 759 214
M Z Mkhize 1 962 000 367 651 2 329 651 22 500 2 352 151
Subtotal 8 955 996 4 420 606 13 376 602 5 207 321 18 583 923
Total 1 361 004 315 515 8 955 996 4 420 606 15 053 121 5 207 321 20 260 442
Directors’ remuneration and shareholdingcontinued

Annual Report 2010 • page 61
ExecutiveCommitteeexcludingexecutivedirectors
Cashpackage
Rand
Performancebonus
and relatedpayments^
Rand
Retirementand medical
contributionsRand
SubtotalRand
Shareoption gains
RandTotalRand
Total 8 840 187 4 038 270* 12 878 457 1 626 396 14 504 853
1. REMUNERATION PHILOSOPHY AND POLICY continued
1.3 Directors’ remuneration continued
b) Executive Committee members (excluding executive directors) remuneration during the 2010 fi nancial year was as follows:
^ None of the executive committee members received bonuses in relation to the 2010 year. * Includes a retirement gratuity payment of R698 667 and a pension fund waiver of R1 747 170 on an early
retirement.
c) Directors’ remuneration during the 2009 fi nancial year was as follows:
^ The bonuses refl ected above are in relation to the 2009 year paid in 2010.
* Directors’ fees due to shareholder nominees on the Hulamin board are paid to the employer organisation and not to the nominees.
° Anglo nominated directors resigned with effect from 28 July 2009.
DirectorFeesRand
Cashpackage
Rand
Performancebonus
and relatedpayments^
Rand
Retirementand
medicalcontributions
RandSubtotal
Rand
Shareoption gains
RandTotal Rand
Non-executive
M E Mkwanazi 295 718 295 718 295 718
P M Baum*° 88 325 88 325 88 325
L C Cele 223 267 223 267 223 267
V N Khumalo* 154 533 154 533 154 533
T P Leeuw 206 069 206 069 206 069
J B Magwaza 211 800 211 800 211 800
P H Staude 125 933 125 933 125 933
J G Williams*° 125 933 125 933 125 933
S P Ngwenya 71 975 71 975 71 975
Subtotal 1 503 553 1 503 553 1 503 553
Executive
A Fourie 3 188 616 792 690 429 354 4 410 660 2 028 505 6 439 165
C D Hughes 1 905 600 357 872 286 896 2 550 368 215 060 2 765 428
M Z Mkhize 1 748 400 323 454 287 334 2 359 188 598 978 2 958 166
Subtotal 6 842 616 1 474 016 1 003 584 9 320 216 2 842 543 12 162 759
Total 1 503 553 6 842 616 1 474 016 1 003 584 10 823 769 2 842 543 13 666 312
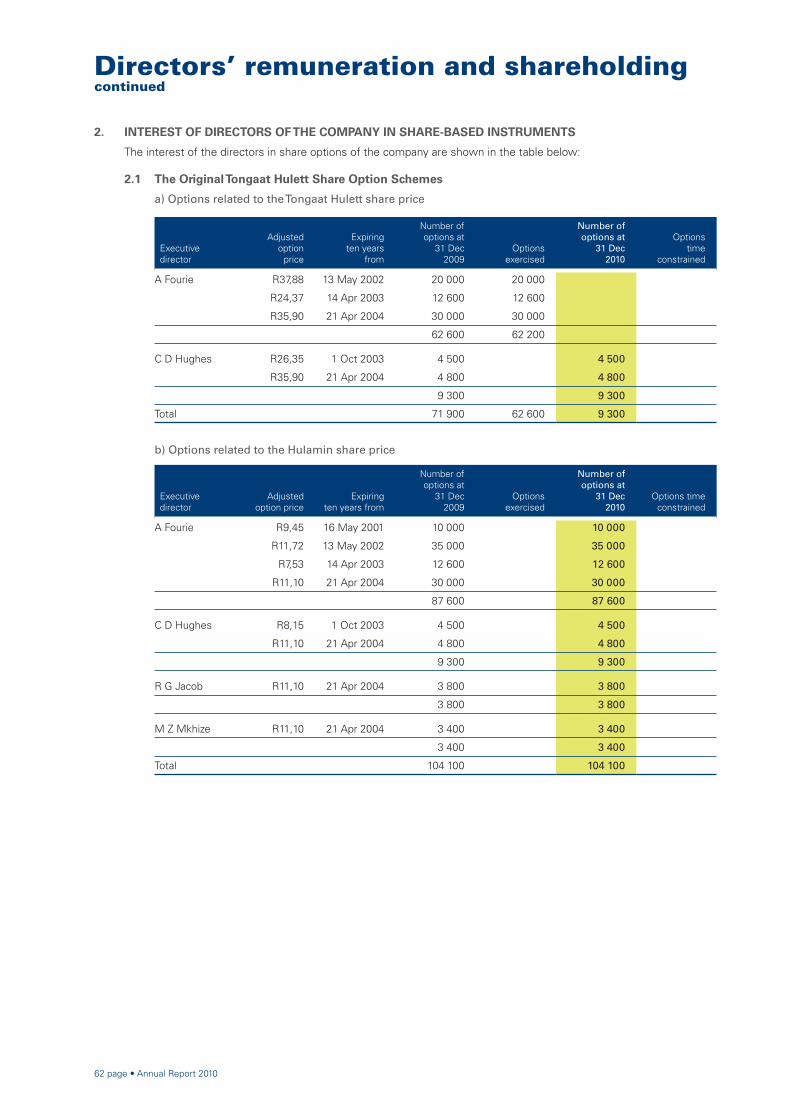
62 page • Annual Report 2010
Executive director
Adjustedoption
price
Expiringten years
from
Number ofoptions at
31 Dec2009
Optionsexercised
Number ofoptions at
31 Dec2010
Optionstime
constrained
A Fourie R37,88 13 May 2002 20 000 20 000
R24,37 14 Apr 2003 12 600 12 600
R35,90 21 Apr 2004 30 000 30 000
62 600 62 200
C D Hughes R26,35 1 Oct 2003 4 500 4 500
R35,90 21 Apr 2004 4 800 4 800
9 300 9 300
Total 71 900 62 600 9 300
b) Options related to the Hulamin share price
Executive director
Adjustedoption price
Expiring ten years from
Number ofoptions at
31 Dec2009
Optionsexercised
Number ofoptions at
31 Dec2010
Options timeconstrained
A Fourie R9,45 16 May 2001 10 000 10 000
R11,72 13 May 2002 35 000 35 000
R7,53 14 Apr 2003 12 600 12 600
R11,10 21 Apr 2004 30 000 30 000
87 600 87 600
C D Hughes R8,15 1 Oct 2003 4 500 4 500
R11,10 21 Apr 2004 4 800 4 800
9 300 9 300
R G Jacob R11,10 21 Apr 2004 3 800 3 800
3 800 3 800
M Z Mkhize R11,10 21 Apr 2004 3 400 3 400
3 400 3 400
Total 104 100 104 100
2. INTEREST OF DIRECTORS OF THE COMPANY IN SHARE-BASED INSTRUMENTS
The interest of the directors in share options of the company are shown in the table below:
2.1 The Original Tongaat Hulett Share Option Schemes
a) Options related to the Tongaat Hulett share price
Directors’ remuneration and shareholdingcontinued

Annual Report 2010 • page 63
2. INTEREST OF DIRECTORS OF THE COMPANY IN SHARE-BASED INSTRUMENTS
2.2 Tongaat-Hulett Group Limited Share Appreciation Right Scheme (SARS) 2005 Rights apportioned at unbundling
a) Rights relating to the Tongaat Hulett share price
Executive director
Number ofrights
granted in2005
Number ofrights
granted in2006
Number ofrights at31 Dec
2009Rights
exercised
Number ofrights at
31 Dec2010
Rightstime
constrained
A Fourie 37 381 23 249 60 630 60 630
C D Hughes 4 549 7 441 11 990 11 990
M Z Mkhize 4 927 7 736 4 927 4 927
46 857 38 426 77 547 77 547
Adjusted grant price R43,98 R 73,39
Expiring seven years from
10 May 2005
25 Apr 2006
b) Rights relating to the Hulamin share price
Executive director
Number ofrights
granted in2005
Number ofrights
granted in2006
Number ofrights at31 Dec
2009Rights
exercised
Number ofrights at
31 Dec2010
Rightstime
constrained
A Fourie 37 381 23 249 60 630 60 630
C D Hughes 4 549 7 441 11 990 11 990
R G Jacob 4 070 6 241 10 311 10 311
M Z Mkhize 4 927 7 736 12 663 12 663
50 927 44 667 95 594 95 594
Adjusted grant price R13,60 R22,70
Expiring seven years from
10 May 2005
25 Apr 2006
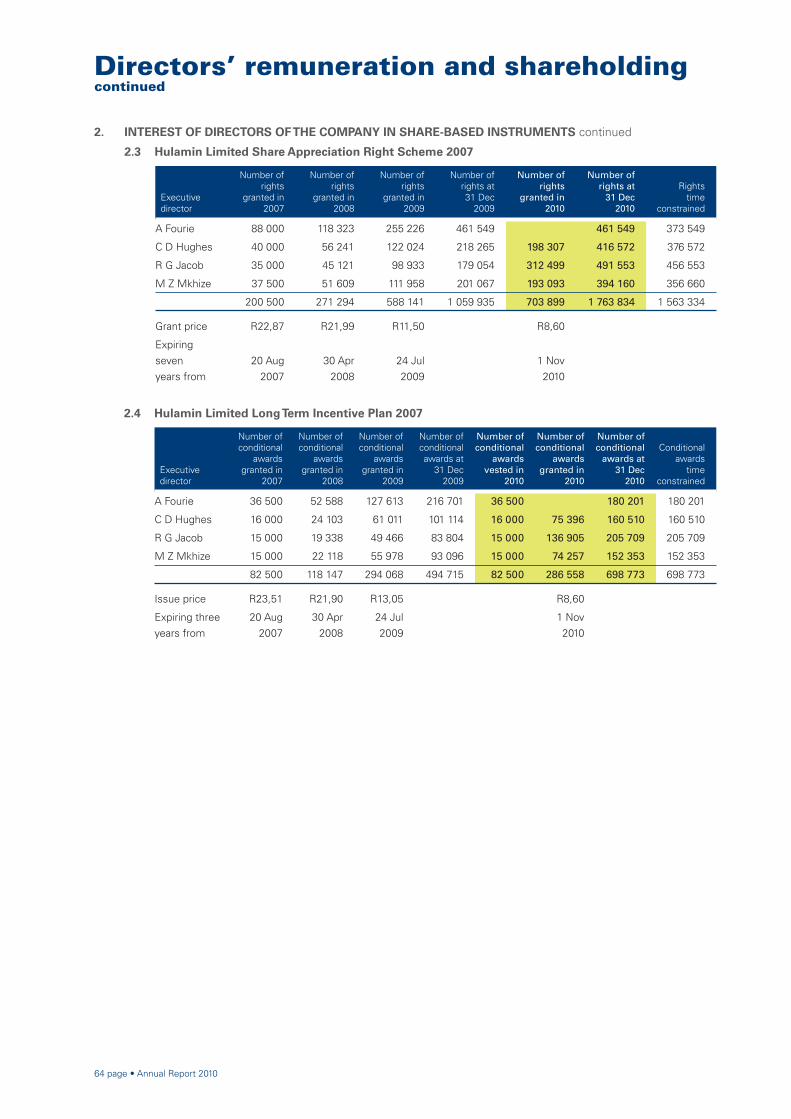
64 page • Annual Report 2010
Executivedirector
Number ofconditional
awardsgranted in
2007
Number ofconditional
awardsgranted in
2008
Number ofconditional
awardsgranted in
2009
Number ofconditionalawards at
31 Dec2009
Number ofconditional
awards vested in
2010
Number ofconditional
awardsgranted in
2010
Number ofconditional
awards at31 Dec
2010
Conditionalawards
timeconstrained
A Fourie 36 500 52 588 127 613 216 701 36 500 180 201 180 201
C D Hughes 16 000 24 103 61 011 101 114 16 000 75 396 160 510 160 510
R G Jacob 15 000 19 338 49 466 83 804 15 000 136 905 205 709 205 709
M Z Mkhize 15 000 22 118 55 978 93 096 15 000 74 257 152 353 152 353
82 500 118 147 294 068 494 715 82 500 286 558 698 773 698 773
Issue price R23,51 R21,90 R13,05 R8,60
Expiring three years from
20 Aug 2007
30 Apr 2008
24 Jul 2009
1 Nov 2010
2. INTEREST OF DIRECTORS OF THE COMPANY IN SHARE-BASED INSTRUMENTS continued
2.3 Hulamin Limited Share Appreciation Right Scheme 2007
Executive director
Number ofrights
granted in2007
Number ofrights
granted in2008
Number ofrights
granted in2009
Number ofrights at31 Dec
2009
Number ofrights
granted in2010
Number ofrights at
31 Dec2010
Rightstime
constrained
A Fourie 88 000 118 323 255 226 461 549 461 549 373 549
C D Hughes 40 000 56 241 122 024 218 265 198 307 416 572 376 572
R G Jacob 35 000 45 121 98 933 179 054 312 499 491 553 456 553
M Z Mkhize 37 500 51 609 111 958 201 067 193 093 394 160 356 660
200 500 271 294 588 141 1 059 935 703 899 1 763 834 1 563 334
Grant price R22,87 R21,99 R11,50 R8,60
Expiring seven years from
20 Aug 2007
30 Apr 2008
24 Jul 2009
1 Nov 2010
2.4 Hulamin Limited Long Term Incentive Plan 2007
Directors’ remuneration and shareholdingcontinued

Annual Report 2010 • page 65
2. INTEREST OF DIRECTORS OF THE COMPANY IN SHARE-BASED INSTRUMENTS continued
2.5 Hulamin Limited Deferred Bonus Plan 2007
Executive director
Number ofconditional
awardsgranted in
2007
Number ofconditional
awardsgranted in
2008
Number ofconditional
awardsgranted in
2009
Number ofconditionalawards at
31 Dec2009
Number ofconditional
awardsvested in
2010
Number ofconditional
awardsgranted in
2010
Number ofconditional
awards at31 Dec
2010
Conditionalawards
timeconstrained
A Fourie 11 100 14 119 29 119 54 338 11 100 43 238 43 238
C D Hughes 4 316 9 707 14 023 14 023 14 023
R G Jacob 3 840 9 707 13 547 9 906 23 453 23 453
M Z Mkhize 3 781 14 560 18 341 18 341 18 341
11 100 26 056 63 093 100 249 11 100 9 906 99 055 99 055
Issue price R23,44 R22,20 R10,50 R8,93
Expiring three years from
1 Mar 2007
25 Feb 2008
27 Feb 2009
1 Nov 2010
The deferred bonus shares were purchased by the participating employees and the transactions were concluded on 15 November 2010 in respect of the 2010 award.
Executive director
Number ofrights
granted in2007
Number ofrights at31 Dec
2009
Number ofrights
granted in2010
Number ofrights at
31 Dec2010
Conditionalrightstime
constrained
M Z Mkhize 218 930 218 930 218 930 218 930
218 930 218 930 218 930 218 930
Grant price R21,44
Expiring fi ve years from
31 Aug 2007
Executive director
Number ofconditional
awardsgranted in
2007
Number ofconditionalawards at
31 Dec2009
Number ofconditional
awards at2010
Number ofconditional
awards at31 Dec
2010
Conditionalawards
timeconstrained
M Z Mkhize 73 110 73 110 73 110 73 110
73 110 73 110 73 110 73 110
Grant price –
Expiring fi ve years from
31 Aug 2007
2.6 MSOP Share Appreciation Right Plan
2.7 MSOP Share Grant Plan
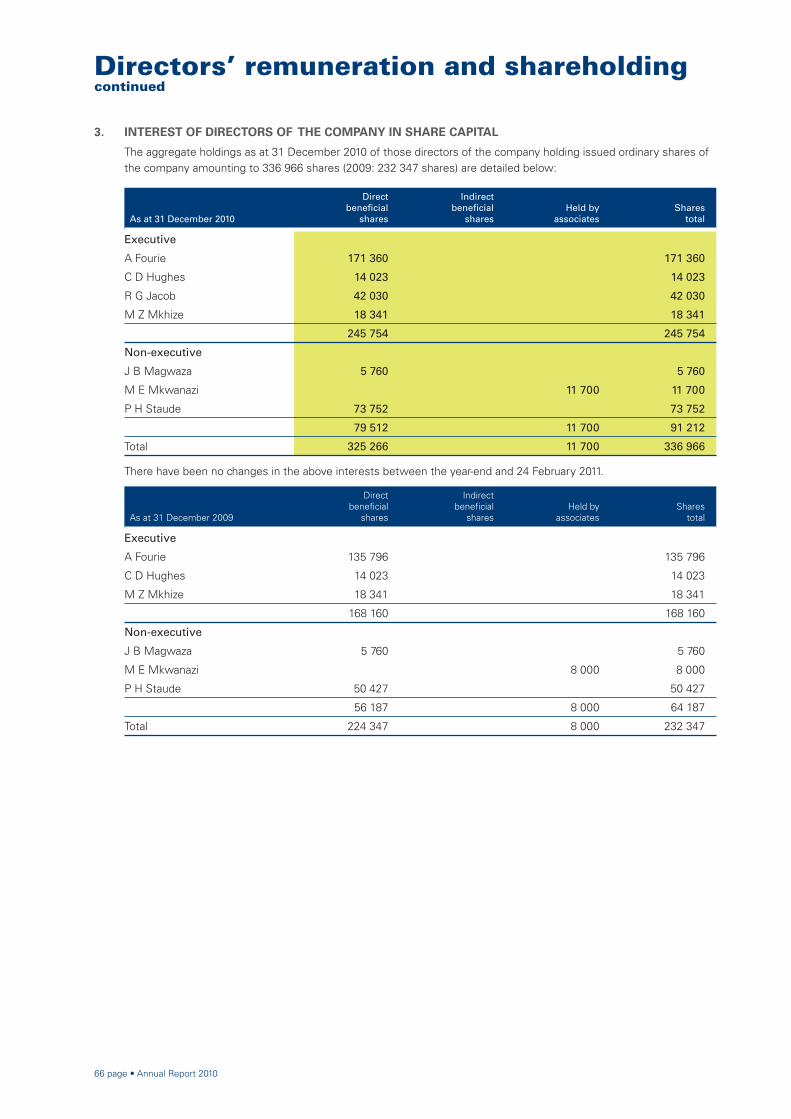
66 page • Annual Report 2010
3. INTEREST OF DIRECTORS OF THE COMPANY IN SHARE CAPITAL
The aggregate holdings as at 31 December 2010 of those directors of the company holding issued ordinary shares of the company amounting to 336 966 shares (2009: 232 347 shares) are detailed below:
As at 31 December 2010
Directbenefi cial
shares
Indirectbenefi cial
sharesHeld by
associatesShares
total
Executive
A Fourie 171 360 171 360
C D Hughes 14 023 14 023
R G Jacob 42 030 42 030
M Z Mkhize 18 341 18 341
245 754 245 754
Non-executive
J B Magwaza 5 760 5 760
M E Mkwanazi 11 700 11 700
P H Staude 73 752 73 752
79 512 11 700 91 212
Total 325 266 11 700 336 966
There have been no changes in the above interests between the year-end and 24 February 2011.
As at 31 December 2009
Directbenefi cial
shares
Indirectbenefi cial
sharesHeld by
associatesShares
total
Executive
A Fourie 135 796 135 796
C D Hughes 14 023 14 023
M Z Mkhize 18 341 18 341
168 160 168 160
Non-executive
J B Magwaza 5 760 5 760
M E Mkwanazi 8 000 8 000
P H Staude 50 427 50 427
56 187 8 000 64 187
Total 224 347 8 000 232 347
Directors’ remuneration and shareholdingcontinued

Annual Report 2010 • page 67
Accounting policies of the group and company
BASIS OF PREPARATION
1. Compliance with International Financial Reporting Standards (IFRS)
The group (consolidated) and company fi nancial statements are prepared in compliance with IFRS, interpretations of those standards and applicable legislation.
1.1 Standards and interpretations affecting current year fi nancial statements
Hulamin has not adopted any new and revised accounting standards in the current year which have affected the amounts or impacted the disclosures reported in the current year group and company fi nancial statements.
1.2 Standards and interpretations which do not affect current year fi nancial statements
The following revised accounting standards, which are effective in the current year, do not impact on the current year group or company fi nancial statements, but may affect the accounting for future transactions or arrangements:
IFRS 3 (revised) – Business Combinations (effective from 1 July 2009). The revised standard continues to apply the acquisition method to business combinations, with some signifi cant changes. All payments to purchase a business are to be recorded at fair value at the acquisition date, with some contingent payments subsequently re-measured at fair value through income. Goodwill may be calculated based on the parent’s share of net assets or it may include goodwill related to the minority interest. All transaction costs will be expensed.
IAS 27 (revised) – Consolidated and Separate Financial Statements (effective from 1 July 2009). The revisions to the standard require the effects of all transactions with non-controlling interests to be recorded in equity if there is no change in control, and these will no longer result in goodwill or gains and losses. The standard also specifi es the accounting when control is lost. Any remaining interest in the entity is re-measured to fair value and a gain or loss is recognised in profi t or loss.
IFRIC 17 – Distributions of Non-cash Assets to Owners (effective from 1 July 2009). The interpretation provides guidance on accounting for arrangements whereby an entity distributes non-cash assets to shareholders either as a distribution of reserves or as dividends. The interpretation clarifi es that: a dividend payable should be recognised when the dividend is appropriately authorised and is no longer at the discretion of the entity; an entity should measure the dividend payable at the fair value of the net assets to be distributed; and an entity should recognise the difference between the dividend paid and the carrying amount of the net assets distributed in profi t or loss.
AC 504 – IAS 19 (AC 116) – The Limit on a Defi ned Benefi t Asset, Minimum Funding Requirements and their Interaction in the South African Pension Fund Environment (effective from 1 April 2009). The interpretation provides guidance on the application of IFRIC 14 in South Africa in relation to defi ned benefi t pension obligations (governed by the Pension Funds Act, 1956) within the scope of IAS 19.
1.3 Standards and interpretations in issue not yet effective
The following new and revised accounting standards and interpretations that will impact on the fi nancial statements of the group or company, or may affect the accounting for future transactions or arrangements, have not yet become effective and have not been adopted prior to their commencement:
IFRS 9 – Financial Instruments (effective from 1 January 2013); and
IASB Annual Improvements Project: Improvements to International Financial Reporting Standards (various effective dates).
The group intends to comply with these standards from the effective dates. Adoption of these standards by the group in future reporting periods is not expected to have a signifi cant impact on the fi nancial statements of the group or company.

68 page • Annual Report 2010
BASIS OF PREPARATION continued
2. Underlying concepts
The fi nancial statements are prepared using the historical cost convention, as modifi ed by the revaluation of fi nancial assets and fi nancial liabilities (including derivative instruments) at fair value through profi t or loss, and are prepared on the going concern basis.
The fi nancial statements are prepared using accrual accounting whereby the effects of transactions and other events are recognised when they occur rather than when the cash is received.
Assets and liabilities and income and expenses are not offset unless specifi cally permitted by an accounting standard.
Financial assets and fi nancial liabilities are offset and the net amount reported only when a currently legally enforceable right to set off the amounts exists and the intention is either to settle on a net basis or to realise the asset and settle the liability simultaneously.
Accounting policies are the specifi c principles, bases, conventions, rules and practices applied in preparing and presenting fi nancial statements. Changes in accounting policies resulting from the initial application of a standard or an interpretation are accounted for in accordance with the transitional provisions in the accounting standard. If no such guidance is given, they are applied retrospectively.
Changes in accounting estimates resulting from new information or new developments are recognised in the income statement in the period they occur.
Prior period errors are retrospectively restated unless it is impracticable to do so, in which case they are applied prospectively.
3. Judgements made by management
There were no material judgements made by management, in the application of accounting policies, that could have had a signifi cant effect on the amounts recognised in the fi nancial statements other than those dealt with below.
4. Recognition of assets and liabilities
Assets and liabilities are recognised when it is probable that future economic benefi ts associated with them will fl ow to and from the group respectively, and when their costs or fair values can be measured reliably.
Financial instruments are recognised when the company becomes a party to the contractual provisions of the instrument.
Financial assets are recognised based on trade dates.
5. Derecognition of assets and liabilities
Financial assets or parts thereof are derecognised, when the contractual rights to receive the cash fl ows have expired or been transferred and substantially all the risks and rewards of ownership or control have passed.
All other assets are derecognised on disposal or when the substantial risks and rewards associated with ownership have passed to another party, or when no future economic benefi ts are expected from their use.
Financial liabilities are derecognised when the relevant obligation has either been discharged or cancelled or has expired.
6. Foreign currencies
The functional currency of each entity within the group is determined based on the currency of the primary economic environment in which that entity operates. Transactions in currencies other than the entity’s functional currency are recognised at the exchange rates ruling on the dates of the transactions, i.e. dates on which the transactions fi rst qualify for recognition. Foreign exchange gains and losses resulting from the settlement of these transactions and from translation at year-end exchange rates of monetary assets and liabilities denominated in foreign currencies are recognised in the income statement in the period in which they arise, except when deferred in equity as qualifying cash fl ow hedges. The company and group’s functional and presentation currency respectively is South African Rand.
Gains and losses arising from changes in the fair value of foreign exchange contracts (except cash fl ow hedges when deferred in equity) as well as gains and losses arising on translation are recognised in the income statement in the period in which they arise.
Accounting policiesof the group and company

Annual Report 2010 • page 69
BASIS OF PREPARATION continued
7. Hedge accounting
Hedge accounting is adopted when all the IFRS requirements are fulfi lled, which includes documenting at the inception of the transaction the relationship between hedging instruments and hedged items, as well as its risk management objectives and strategy for undertaking various hedging transactions. In addition, the group documents the assessment, both at hedge inception and on an ongoing basis, of the hedge effectiveness.
A fair value hedge is a hedge of the exposure to changes in the fair value of a recognised asset, liability or fi rm commitment. The gain or loss on the hedged item attributable to the hedged risk in a fair value hedge is included in the carrying amount of the hedged item and recognised in the income statement. The gain or loss on the hedged instrument is also recognised in the income statement.
A cash fl ow hedge is the hedge of the exposure to variability in cash fl ows that is attributable to a particular risk associated with an asset or a liability that could affect profi t or loss or a highly probable forecast transaction that could affect profi t or loss. The portion of the gain or loss on the hedging instrument in a cash fl ow hedge that is determined to be effective is recognised directly in other comprehensive income, whilst the ineffective portion is recognised in the income statement.
If an effective hedge of a forecast transaction subsequently results in the recognition of a fi nancial asset or fi nancial liability, the associated gains or losses previously recognised in other comprehensive income and accumulated in equity are recognised in the income statement in the same period in which the asset or liability affects the income statement.
If a hedge results in the recognition of a non-fi nancial asset or non-fi nancial liability, any associated gains or losses previously recognised in other comprehensive income and accumulated in equity are included in the initial measurement of the acquisition cost or other carrying amount of the asset.
Hedge accounting is discontinued on a prospective basis when the hedge no longer meets the hedge accounting criteria (including when it becomes ineffective), when the hedge instrument is sold, terminated or exercised when, for cash fl ow hedges, the forecast transaction is no longer expected to occur or when the hedge designation is revoked.
The hedging reserve accumulates all movement in the fair value of fi nancial instruments designated as hedges of transactions that have yet to be recognised on the balance sheet. When the underlying transaction is recognised, the related accumulated hedging reserve is released to the income statement.
8. Post balance sheet events
Recognised amounts in the fi nancial statements are adjusted to refl ect events arising after the balance sheet date that provide evidence of conditions that existed at the balance sheet date.
9. Comparative fi gures
Comparative fi gures are restated in the event of a change in accounting policy, prior period error or change in presentation or classifi cation of items in the fi nancial statements.
10. Segment reporting
The group determines and reports operating segments based on internal information that is provided to the Hulamin Executive Committee, which is the group’s most senior operating decision-making body.
BASIS OF CONSOLIDATION
11. Subsidiaries
Subsidiaries are all entities (including special-purpose entities) over which the group has the power to govern the fi nancial and operating policies generally accompanying a shareholding of more than one half of the voting rights.
The consolidated fi nancial statements incorporate the assets, liabilities, income, expenses and cash fl ows of the subsidiaries. The results of subsidiaries acquired or disposed of during the year are included in the consolidated income statement from the date the group exercises control, or up until the point it ceases to exercise control. Inter-company transactions, balances and unrealised gains and losses on transactions between group entities are eliminated on consolidation. Accounting policies of subsidiaries are changed where necessary to ensure consistency with the policies adopted by the group.
The group applies a policy of treating transactions with non-controlling interests as transactions with equity holders of the group. Gains or losses arising from these transactions are recorded in equity.
The company fi nancial statements recognise interests in subsidiaries, which include loans granted to subsidiaries by the company, at cost, except in the case of certain limited group reorganisations where net assets are disposed. In these instances, interests in subsidiaries will be based on the carrying amount of the net assets disposed.

70 page • Annual Report 2010
BASIS OF PREPARATION continued
12. Associates
Associates are accounted for using the equity method from the date on which they become an associate. The use of the equity method is discontinued from the date that the group ceases to have signifi cant infl uence over an associate.
13. Joint ventures
The group accounts for joint ventures using the equity method of accounting where the investment is carried at cost plus post-acquisition changes in the group’s share of net assets of the joint venture, less any provision for impairment.
14. Business combinations
Business combinations – IFRS 3 (Revised)
The cost of an acquisition, which is within the scope of IFRS 3 (Revised) – Business Combinations, is measured as the fair value of the assets given, equity instruments issued and liabilities incurred or assumed at the date of exchange. Acquisition related costs are expensed as incurred.
Any excess of the cost over the group’s share in the fair value of the assets, liabilities and contingent liabilities acquired is recognised as goodwill and any excess of the fair value of the assets, liabilities and contingent liabilities over the cost is recognised in the income statement.
Business combinations – common control transactions
Common control transactions are accounted for using the predecessor values method. Application of the predecessor values method results in the recording of the transaction and the results of operations as if it had taken place at the beginning of the earliest period presented.
The assets and liabilities of the acquired entity are recorded at book values. The predecessor values are adjusted to ensure uniform accounting policies.
The difference between the consideration given and the aggregate book value of the assets and liabilities (as of the date of the transaction) of the acquired entity are recorded as an adjustment to retained earnings.
ASSETS
15. Property, plant and equipment
Items of property, plant and equipment are stated at cost less accumulated depreciation and impairment losses. Cost includes the estimated cost of dismantling and removing the assets.
Depreciation is calculated so as to write off the depreciable amount of the assets, other than land, over their estimated useful lives, using a method that refl ects the pattern in which the asset’s future economic benefi ts are expected to be consumed by the entity. Depreciation is charged from the dates the assets are available for use. The property, plant and equipment acquired under fi nance leases are depreciated over the shorter of the useful life of the asset and the lease term.
Where the useful lives of signifi cant parts of an item are different from the item itself, these parts are depreciated over their useful lives.
The methods of depreciation, useful lives and residual values are reviewed annually.
Gains and losses on disposals are recognised within other income/expenses in the income statement.
16. Intangible assets
The group’s only intangible asset is computer software. Research costs are expensed when incurred. Software license and development costs are capitalised, provided that all the asset recognition criteria are met, and amortised over their useful lives.
17. Impairment of non-fi nancial assets
At each reporting date, the carrying amount of the tangible and intangible assets are assessed to determine whether there is any indication that those assets may have suffered an impairment loss. If any such indication exists, the recoverable amount of the asset is estimated in order to determine the extent of the impairment loss. Where it is not possible to estimate the recoverable amount of an individual asset, the recoverable amount of the cash-generating unit to which the asset belongs is estimated. Value in use is estimated based on discounted future cash fl ows expected to be derived from an asset or cash-generating unit.
Accounting policiesof the group and company

Annual Report 2010 • page 71
ASSETS continued
17. Impairment of non-fi nancial assets continued
If the recoverable amount of an asset (or cash-generating unit) is estimated to be less than its carrying amount, its carrying amount is reduced to the higher of its recoverable amount and zero. Impairment losses are recognised in the income statement. Subsequent to the recognition of an impairment loss, the depreciation or amortisation charge for the asset is adjusted to allocate its remaining carrying value, less any residual value, over its remaining useful life.
If an impairment loss subsequently reverses, the carrying amount of the asset (or cash-generating unit) is increased to the revised estimate of its recoverable amount but limited to the carrying amount that would have been determined had no impairment loss been recognised in prior years. A reversal of an impairment loss is recognised in the income statement.
18. Leasing
A fi nance lease is a lease that transfers substantially all the risks and rewards incidental to ownership of an asset. Title may or may not eventually be transferred. An operating lease is a lease other than a fi nance lease.
Leases are classifi ed as fi nance leases or operating leases at the inception of the lease.
Finance leases are recognised as assets and liabilities at the lower of the fair value of the asset and the present value of the minimum lease payments at the date of acquisition, being payments over the lease term, excluding contingent rent, costs for services and taxes to be paid by and reimbursed to the lessor including any amounts guaranteed by the company or by a party related to the company.
Finance costs represent the difference between the total leasing commitments and the fair value of the assets acquired. Finance costs are charged to the income statement over the term of the lease at interest rates applicable to the lease on the remaining balance of the obligations.
Rentals payable under operating leases are recognised in the income statement on a straight-line basis over the term of the relevant lease or another basis if more representative of the time pattern of the user’s benefi t.
19. Inventories
Inventories are stated at the lower of cost and net realisable value. Cost includes all costs of purchase, costs of conversion and other costs incurred in bringing the inventories to their present location and condition.
Net realisable value is the estimated selling price in the ordinary course of business, less the estimated cost of completion and costs necessary to make the sale.
The specifi c identifi cation basis is used to arrive at the cost of items that are not interchangeable. The weighted average method, in the case of consumables, and the fi rst-in-fi rst-out method, in the case of all other inventories, is used to arrive at the cost of items that are interchangeable.
20. Financial assets
Financial assets are initially measured at fair value plus transaction costs. However, transaction costs in respect of fi nancial assets classifi ed as at fair value through profi t or loss are expensed.
Financial assets classifi ed as at fair value through profi t or loss are measured at fair value with gains or losses being recognised in profi t or loss. Fair value, for this purpose, is market value if listed or a value arrived at by using appropriate valuation models if unlisted.
Financial assets classifi ed as held-to-maturity fi nancial assets are measured at amortised cost less any impairment losses recognised to refl ect irrecoverable amounts.
Loans and receivables, which include trade receivables, are measured at amortised cost less impairment losses, which are recognised in the income statement. The fair value of loans and receivables approximate their carrying value.
Available-for-sale fi nancial assets are measured at fair value with gains or losses being recognised in other comprehensive income. Fair value, for this purpose, is market value if listed or a value arrived at by using appropriate valuation models if unlisted. Cumulative gains and losses, including that deferred in equity, are recognised in the income statement on impairment. Any reversal of impairment losses on equity instruments is recognised directly in equity.
Financial assets carried at amortised cost are reviewed for impairment whenever events or changes in circumstances indicate that the carrying amount may not be recoverable. In particular, the trade receivables provision is established where there is objective evidence that the group will not collect all amounts due according to the original terms of receivables.
72 page • Annual Report 2010
ASSETS continued
20. Financial assets continued
The fair value of derivative assets is calculated as the difference between the contracted value and the value to maturity at the balance sheet date. The value to maturity of forward foreign exchange contracts is determined using quoted forward exchange rates at the balance sheet date. The value to maturity of commodity futures is determined by reference to quoted prices at the balance sheet date. The value to maturity of interest rate swaps is determined by reference to quoted swap rates at the balance sheet date.
21. Non-current assets (or disposal groups) held for sale
Non-current assets (or disposal groups) are classifi ed as assets held for sale when their carrying amount is to be recovered principally through a sale transaction and a sale is considered highly probable. Upon initial classifi cation as held for sale, non-current assets and disposal groups are recognised at the lower of carrying amount and fair value less cost to sell.
22. Contingent assets and liabilities
Contingent assets and liabilities are not recognised, although contingent liabilities are disclosed.
EQUITY AND LIABILITIES
23. Equity
Transactions relating to the acquisition and sale of shares in the company, together with their associated incremental direct costs, are accounted for in equity. Other transactions are accounted for directly in equity only if permitted by the standards.
24. Consolidated shares
Consolidated shares represent the A class ordinary shares issued to the BEE investors and the B class ordinary shares issued to the ESOP and MSOP share trusts.
25. Deferred tax
Deferred tax is provided in full using the liability method, on temporary differences arising between tax bases of the assets and liabilities and their carrying amounts in the fi nancial statements.
Deferred tax assets and liabilities are measured at the tax rates that are expected to apply in the period in which the liability is settled or the asset realised, based on the tax laws that have been enacted or substantively enacted by the end of the reporting period.
A deferred tax asset is only recognised to the extent that it is probable that taxable profi ts will be available against which deductible temporary differences can be utilised, unless specifi cally exempt.
Deferred tax liabilities arising on investments in subsidiaries, associates and joint ventures are recognised except where the group is able to control the reversal of the temporary difference and it is probable that the temporary difference will not reverse in the foreseeable future.
Deferred tax assets and deferred tax liabilities are offset if a legally enforceable right exists to set off current tax assets against current income tax liabilities, and the deferred taxes relate to the same taxable entity and the same taxation authority.
26. Financial liabilities
Financial liabilities are initially measured at fair value net of transaction costs. However, transaction costs in respect of fi nancial liabilities classifi ed as at fair value through profi t or loss are expensed.
Gains and losses arising from changes in the fair value of fi nancial liabilities at fair value through profi t or loss are presented in the income statement within other operating income.
Financial liabilities (excluding liabilities designated in a hedging relationship) that are not designated on initial recognition as fi nancial liabilities at fair value through profi t or loss are measured at amortised cost.
The fair value of derivative liabilities is calculated as the difference between the contracted value and the value to maturity at the balance sheet date. The value to maturity of forward foreign exchange contracts is determined using quoted forward exchange rates at the balance sheet date. The value to maturity of commodity futures is determined by reference to quoted prices at the balance sheet date. The value to maturity of interest rate swaps is determined by
reference to quoted swap rates at the balance sheet date.
Accounting policiesof the group and company

Annual Report 2010 • page 73
EQUITY AND LIABILITIES continued
27. Employment benefi t obligations
Pension obligations
The group provides retirement benefi ts to employees in the form of both defi ned contribution and defi ned benefi t plans. The assets of these schemes are held separately from those of the group and are administered and controlled by trustees.
Contributions to defi ned contribution schemes are charged to profi t or loss when incurred. The group has no legal or constructive obligation to pay further contributions if the fund does not hold suffi cient assets to pay all employees the benefi ts relating to employee service in the current or prior periods.
For defi ned benefi t plans, the cost of providing benefi ts is determined using the projected unit credit actuarial valuation method, with actuarial valuations being carried out at the end of each reporting period. Actuarial gains and losses, at the beginning of the year, are recognised in the income statement over the lesser of ten years or the employees’ average remaining working lives.
The defined benefit asset or liability recognised in the balance sheet comprises the present value of the defined benefit obligation, as adjusted for unrecognised actuarial gains and losses and unrecognised past service costs, and as reduced by the fair value of plan assets. The value of an asset recognised is restricted to the sum of the unrecognised past-service costs and unrecognised actuarial losses and the present value of any economic benefits available in the form of refunds from the plan or reductions in the future contributions.
Post-retirement medical aid benefi ts and retirement gratuities
Provisions for post-retirement medical aid benefi ts and gratuities payable on retirement are calculated on an actuarial basis, being present value of future liability, for services rendered to date. Actuarial gains or losses are recognised in the same manner as those of pension obligations.
Employee benefi t costs
The cost of short-term employee benefi ts, including the expected cost of short-term accumulating compensated absences, is recognised in the income statement in the period in which the service is rendered and is not discounted.
The expected cost of profi t-sharing and bonus payments is recognised as an expense when there is a legal or constructive obligation to make such payments as a result of past performance.
28. Shareholders for equity dividends
Dividends to equity holders are only recognised as a liability when declared and are included in the statement of changes in equity. Secondary tax on companies in respect of such dividends is recognised as a liability when the dividends are recognised as a liability and are included in the tax charge in the income statement.
29. Provisions
Provisions are recognised when the group has a present legal or constructive obligation, as a result of past events, for which it is probable that an outfl ow of economic benefi ts will be required to settle the obligation, and a reliable estimate can be made for the amount of the obligation.
Provisions are measured as the expenditure required to settle the present obligation. Where the effect of discounting is material, provisions are measured at their present value using a pre-tax discount rate that refl ects the current market assessment of the time value of money and the risks for which future cash fl ow estimates have not been adjusted.
74 page • Annual Report 2010
INCOME STATEMENT
30. Revenue
Revenue is recognised to the extent that it is probable that economic benefi ts will fl ow to the group or company, and when the amount of the revenue and the related costs can be reliably measured.
Revenue of the group comprises revenue from the sale of goods. Revenue of the company comprises interest income and agency fees.
Revenue from the sale of goods is recognised when the signifi cant risks and rewards of ownership have been transferred to the buyer, and is shown net of returns, rebates and discounts, and after eliminating sales within the group.
Agency fees are recognised as the services are performed.
Interest income is accrued on a time basis using the effective interest rate method.
31. Borrowing costs
Borrowing costs include interest and other costs incurred in connection with the borrowing of funds.
Borrowing costs directly attributable to the acquisition, construction or production of assets that necessarily take a substantial period of time to get ready for their intended use or sale, are added to the cost of those assets, until such time as the assets are substantially ready for their intended use or sale. All other borrowing costs are expensed in the period in which they are incurred.
32. Taxation
The tax expense for the period comprises current and deferred tax. Tax is recognised in the income statement, except to the extent that it relates to items recognised in other comprehensive income or directly in equity. In this case the tax is also recognised in other comprehensive income or directly in equity, respectively. The charge for current tax is computed on the results for the year, as adjusted for income that is exempt and expenses that are not deductible, using tax rates and tax laws that are enacted or substantively enacted by the reporting date.
33. Share-based payments
The group’s employee share incentive schemes, including the Employee Share Ownership Plan and the Management Share Ownership Plan, are accounted for as equity-settled share-based payments. The fair value of the incentives at the grant date is expensed on a straight-line basis over the period during which the incentive vests.
Fair value is determined based on an estimate of the incentives that will vest and any non-market conditions, using the Black-Scholes and binomial tree valuation models, and these estimates are reviewed annually.
For those schemes where the group purchases shares (or where in the past Tongaat Hulett has purchased shares) in order to settle the benefi t granted, any cost in excess of the fair value of the benefi t granted is recognised in equity.
The transaction for the introduction of broad-based BEE investors will result in the participants acquiring Hulamin Limited shares and is accounted for as an equity-settled share-based payment. The fair value of the transaction at the grant date was expensed in 2007. Fair value was determined using a Monte Carlo valuation model.
Accounting policiesof the group and company
Annual Report 2010 • page 75
SOURCES OF ESTIMATION UNCERTAINTY
34. Sources of estimation uncertainty
The key assumptions and sources of estimation uncertainty at the balance sheet date that could have a signifi cant risk of causing material adjustment to the carrying amounts of the assets and liabilities within the next fi nancial year are:
Useful lives and residual values of assets
Items of property, plant and equipment are depreciated over their useful lives taking into account residual values. The estimated lives and residual values are assessed annually taking into account technological innovation, product life cycles, maintenance programmes and projected disposal values.
Post-employment benefi t obligations
Actuarial valuations of post-retirement benefi t obligations are based on assumptions which include employee turnover, mortality rates, discount rate, expected long-term rate of return on retirement plan assets, healthcare costs, infl ation rates and salary increments.
Share-based payment transactions
The critical estimates and assumptions used in the IFRS 2 calculations are disclosed in note 30.
Impairment of non-fi nancial assets
The recoverable amounts of the assets (or cash-generating units to which they belong) disclosed in notes 2 to 4 of the group fi nancial statements, and note 1 of the company fi nancial statements, were estimated at period end in terms of IAS 36. It was determined that no impairment of the carrying values of these assets would be required.
The key assumptions used to determine the recoverable amount of the relevant assets (or cash-generating units) are as follows:
• Margins – Based on internal market forecasts which take into account margins for the current year and anticipated changes in market conditions, adjusted for infl ation in the group’s target markets and the estimated mix of products sold. As changes in rolling margins have a direct impact on earnings, recoverable amounts are particularly sensitive to changes in this assumption;
• Sales volumes – Based on internal market forecasts which take into account estimated production capacity and market demand;
• Currency exchange rates – Based on consensus forecasts of the major South African fi nancial institutions;
• Aluminium price – Based on internal market forecasts which take into account the Dollar aluminium price at the reporting date, changes in the Rand/Dollar exchange rate and US infl ation forecasts;
• Discount rate – The weighted average cost of capital is based on independent market data, except for the share beta which is derived from an appropriate basket of proxy companies; and
• Supplies of raw material – Aluminium, in the form of melting ingot and rolling slab, is procured from the local producer, BHP Billiton. The company casts the majority of its own rolling slab and sources the balance from BHP Billiton. The external supply is assumed to continue to enable the company to reach its planned volume and mix targets in the optimum manner.
The above key assumptions relating to margins, sales volumes, currency exchange rates, aluminium prices and raw material supplies, employed in the determination of the recoverable amounts of the relevant assets (or cash-generating units), are consistent with those used in the budgets and medium-term forecasts considered by the directors in assessing the future performance of the group.
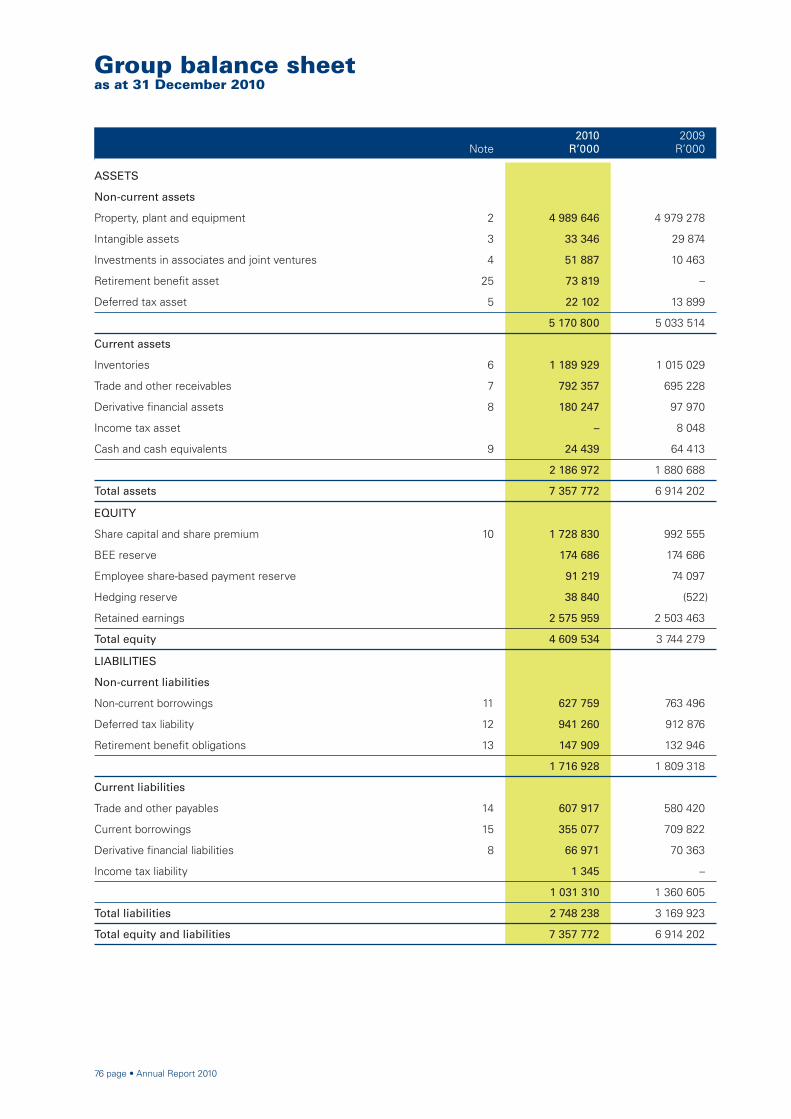
76 page • Annual Report 2010
Group balance sheetas at 31 December 2010
Note2010
R’0002009
R’000
ASSETS
Non-current assets
Property, plant and equipment 2 4 989 646 4 979 278
Intangible assets 3 33 346 29 874
Investments in associates and joint ventures 4 51 887 10 463
Retirement benefi t asset 25 73 819 –
Deferred tax asset 5 22 102 13 899
5 170 800 5 033 514
Current assets
Inventories 6 1 189 929 1 015 029
Trade and other receivables 7 792 357 695 228
Derivative fi nancial assets 8 180 247 97 970
Income tax asset – 8 048
Cash and cash equivalents 9 24 439 64 413
2 186 972 1 880 688
Total assets 7 357 772 6 914 202
EQUITY
Share capital and share premium 10 1 728 830 992 555
BEE reserve 174 686 174 686
Employee share-based payment reserve 91 219 74 097
Hedging reserve 38 840 (522)
Retained earnings 2 575 959 2 503 463
Total equity 4 609 534 3 744 279
LIABILITIES
Non-current liabilities
Non-current borrowings 11 627 759 763 496
Deferred tax liability 12 941 260 912 876
Retirement benefi t obligations 13 147 909 132 946
1 716 928 1 809 318
Current liabilities
Trade and other payables 14 607 917 580 420
Current borrowings 15 355 077 709 822
Derivative fi nancial liabilities 8 66 971 70 363
Income tax liability 1 345 –
1 031 310 1 360 605
Total liabilities 2 748 238 3 169 923
Total equity and liabilities 7 357 772 6 914 202
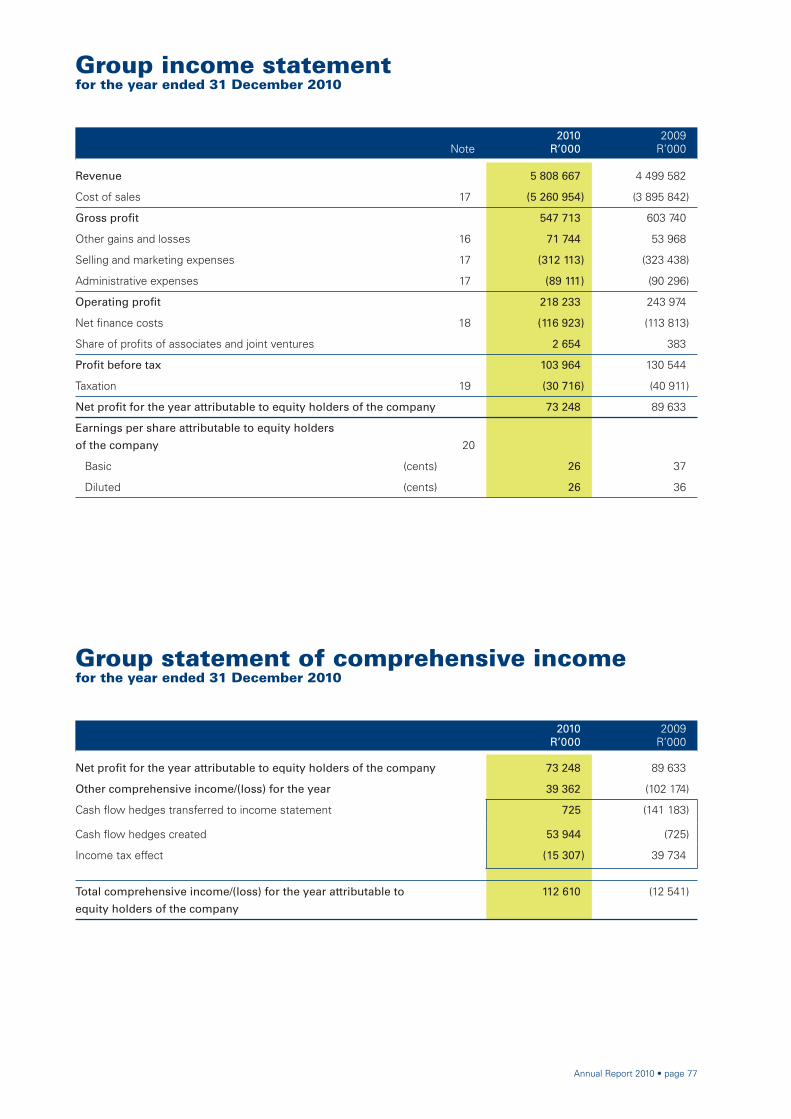
Annual Report 2010 • page 77
Note2010
R’0002009
R’000
Revenue 5 808 667 4 499 582
Cost of sales 17 (5 260 954) (3 895 842)
Gross profi t 547 713 603 740
Other gains and losses 16 71 744 53 968
Selling and marketing expenses 17 (312 113) (323 438)
Administrative expenses 17 (89 111) (90 296)
Operating profi t 218 233 243 974
Net fi nance costs 18 (116 923) (113 813)
Share of profi ts of associates and joint ventures 2 654 383
Profi t before tax 103 964 130 544
Taxation 19 (30 716) (40 911)
Net profi t for the year attributable to equity holders of the company 73 248 89 633
Earnings per share attributable to equity holders
of the company 20
Basic (cents) 26 37
Diluted (cents) 26 36
2010R’000
2009R’000
Net profi t for the year attributable to equity holders of the company 73 248 89 633
Other comprehensive income/(loss) for the year 39 362 (102 174)
Cash fl ow hedges transferred to income statement 725 (141 183)
Cash fl ow hedges created 53 944 (725)
Income tax effect (15 307) 39 734
Total comprehensive income/(loss) for the year attributable to
equity holders of the company
112 610 (12 541)
Group income statementfor the year ended 31 December 2010
Group statement of comprehensive incomefor the year ended 31 December 2010
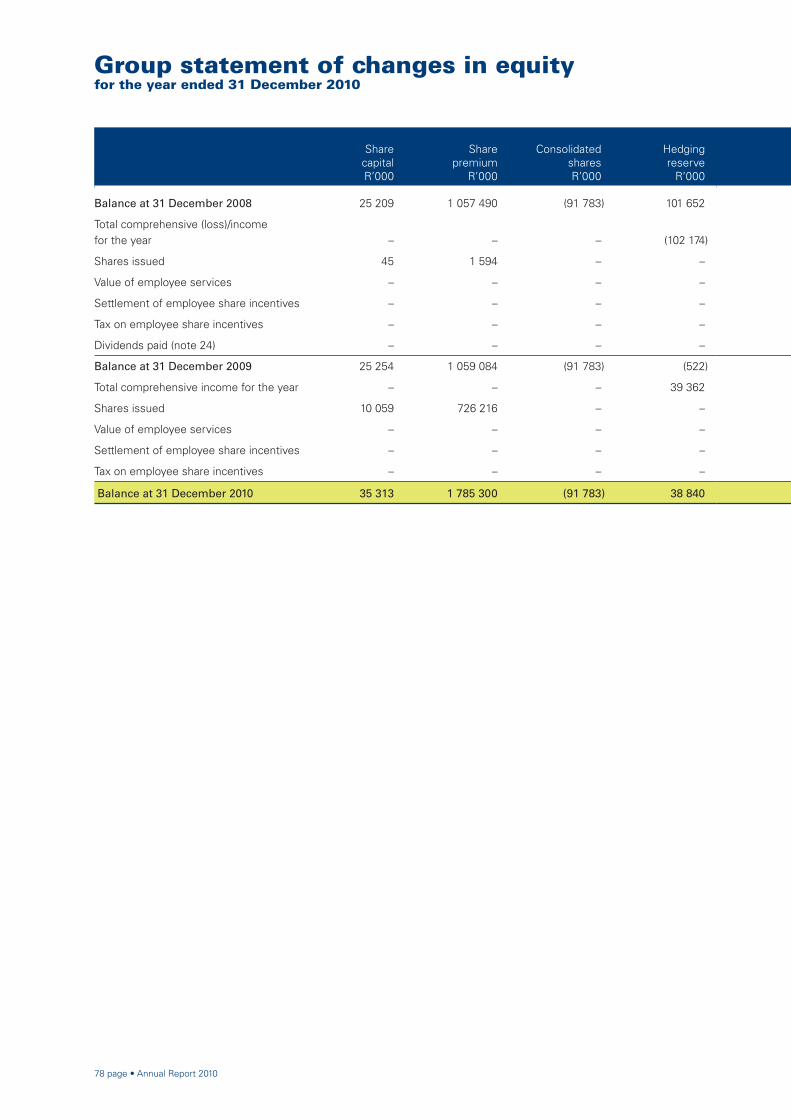
78 page • Annual Report 2010
Group statement of changes in equityfor the year ended 31 December 2010
SharecapitalR’000
Share premium
R’000
Consolidated sharesR’000
Hedging reserve
R’000
Balance at 31 December 2008 25 209 1 057 490 (91 783) 101 652
Total comprehensive (loss)/income for the year – – – (102 174)
Shares issued 45 1 594 – –
Value of employee services – – – –
Settlement of employee share incentives – – – –
Tax on employee share incentives – – – –
Dividends paid (note 24) – – – –
Balance at 31 December 2009 25 254 1 059 084 (91 783) (522)
Total comprehensive income for the year – – – 39 362
Shares issued 10 059 726 216 – –
Value of employee services – – – –
Settlement of employee share incentives – – – –
Tax on employee share incentives – – – –
Balance at 31 December 2010 35 313 1 785 300 (91 783) 38 840

Annual Report 2010 • page 79
Employee share-based
payment reserveR’000
BEE reserve
R’000
Retained earnings
R’000
Shareholders’ interest
R’000
Non-controlling interests
R’000Total equity
R’000
48 933 174 686 2 443 959 3 760 146 – 3 760 146
– – 89 633 (12 541) – (12 541)
– – – 1 639 – 1 639
29 492 – – 29 492 – 29 492
(4 328) – (3 219) (7 547) – (7 547)
– 1 627 1 627 – 1 627
– – (28 537) (28 537) – (28 537)
74 097 174 686 2 503 463 3 744 279 – 3 744 279
– – 73 248 112 610 – 112 610
– – – 736 275 – 736 275
20 355 – – 20 355 – 20 355
(3 233) – (792) (4 025) – (4 025)
– 40 40 – 40
91 219 174 686 2 575 959 4 609 534 – 4 609 534

80 page • Annual Report 2010
Note2010
R’0002009
R’000
CASH FLOWS FROM OPERATING ACTIVITIES
Cash generated before working capital changes 22 343 804 362 282
Changes in working capital 23 (244 532) 599 333
Cash generated from operations 99 272 961 615
Net interest paid (136 596) (170 409)
Income tax payment (16 408) (66 949)
Net cash (outfl ow)/infl ow from operating activities (53 732) 724 257
CASH FLOWS FROM INVESTING ACTIVITIES
Additions to property, plant and equipment (186 899) (351 811)
Additions to intangible assets (6 005) (3 554)
Proceeds on disposal of property, plant and equipment 3 664 3 534
Increase in investment in associates and joint ventures (38 770) –
Net cash outfl ow from investing activities (228 010) (351 831)
CASH FLOWS FROM FINANCING ACTIVITIES
Proceeds from borrowings – 6 277
Repayment of borrowings (490 482) (346 019)
Shares issued 736 275 1 639
Settlement of share options net of reversals (4 025) (7 547)
Dividends paid 24 – (28 537)
Net cash infl ow/(outfl ow) from fi nancing activities 241 768 (374 187)
Net decrease in cash and cash equivalents (39 974) (1 761)
Cash and cash equivalents at beginning of year 64 413 66 174
Cash and cash equivalents at end of year 9 24 439 64 413
Group cash fl ow statementfor the year ended 31 December 2010

Annual Report 2010 • page 81
Index to the notesto the group fi nancial statements
1. Operating segment analysis 822. Property, plant and equipment 833. Intangible assets 844. Investments in associates and joint ventures 845. Deferred tax asset 856. Inventories 857. Trade and other receivables 868. Derivative fi nancial instruments 879. Cash and cash equivalents 8910. Share capital 8911. Non-current borrowings 9012. Deferred tax liability 9113. Retirement benefi t obligations 9114. Trade and other payables 9115. Current borrowings 9216. Other gains and losses 9217. Expenses by nature 9318. Net fi nance costs 9419. Taxation 9420. Earnings per share 9521. Headline earnings 9522. Cash generated before working capital changes 9523. Changes in working capital 9524. Dividends paid 9625. Retirement benefi ts 9626. Lease commitments 10027. Capital expenditure commitments 10028. Related party transactions 10029. Contingent liabilities 10130. Share-based payments 10131. Details of investments in associates, subsidiary companies and joint ventures 110

82 page • Annual Report 2010
Notes to the group fi nancial statementsfor the year ended 31 December 2010
1. OPERATING SEGMENT ANALYSIS
The group is organised into two major operating divisions, namely Hulamin Rolled Products and Hulamin Extrusions. The divisions, which offer different core products, are the basis on which the group reports its primary segment information. The Hulamin Rolled Products segment manufactures and supplies rolled semi-fabricated aluminium products, which include heat treated plate, can-end stock, closure sheet, thin gauge foil and superior fi nish painted and clad products. The Hulamin Extrusions segment manufactures and supplies extruded aluminium products, which include small, large and complex extruded sections. These reportable segments are comprised of a number of aggregated operating segments. Both reportable segments are based and managed in South Africa.
2010 2009
Hulamin Rolled
ProductsR’000
Hulamin Extrusions
R’000
Group total
R’000
Hulamin Rolled
ProductsR’000
HulaminExtrusions
R’000
Group total
R’000
Revenue
Segment revenue 5 191 705 616 962 5 808 667 3 890 943 625 148 4 516 091
Inter-segment revenue – – – (9 550) (6 959) (16 509)
Revenue from external customers 5 191 705 616 962 5 808 667 3 881 393 618 189 4 499 582
Operating profi t/(loss) 226 868 (8 635) 218 233 239 377 4 597 243 974
Results
Depreciation and amortisation 166 714 26 185 192 899 174 853 22 880 197 733
Net fi nance costs 103 210 13 713 116 923 93 131 20 682 113 813
Tax 37 050 (6 334) 30 716 45 660 (4 749) 40 911
Share of associate company’s profi t 2 654 – 2 654 383 – 383
Total assets 7 069 431 288 341 7 357 772 6 554 198 360 004 6 914 202
Total liabilities 2 665 698 82 540 2 748 238 2 908 602 261 321 3 169 923
Other disclosures
Investments in associates and joint ventures 45 734 6 153 51 887 10 463 – 10 463
Additions to property, plant and equipment and intangible assets 168 815 24 089 192 904 333 534 21 831 355 365
Geographical analysis of revenue2010
R’0002009
R’000
South Africa 2 295 244 2 033 111
North America 1 122 081 867 059
Europe 927 720 580 531
Asia 716 028 322 956
Middle East 218 219 512 305
Australasia 55 626 74 248
South America 438 414 65 058
Rest of Africa 35 335 44 314
5 808 667 4 499 582
All non-current assets of the group are located in, or are attributable to, operations in South Africa.
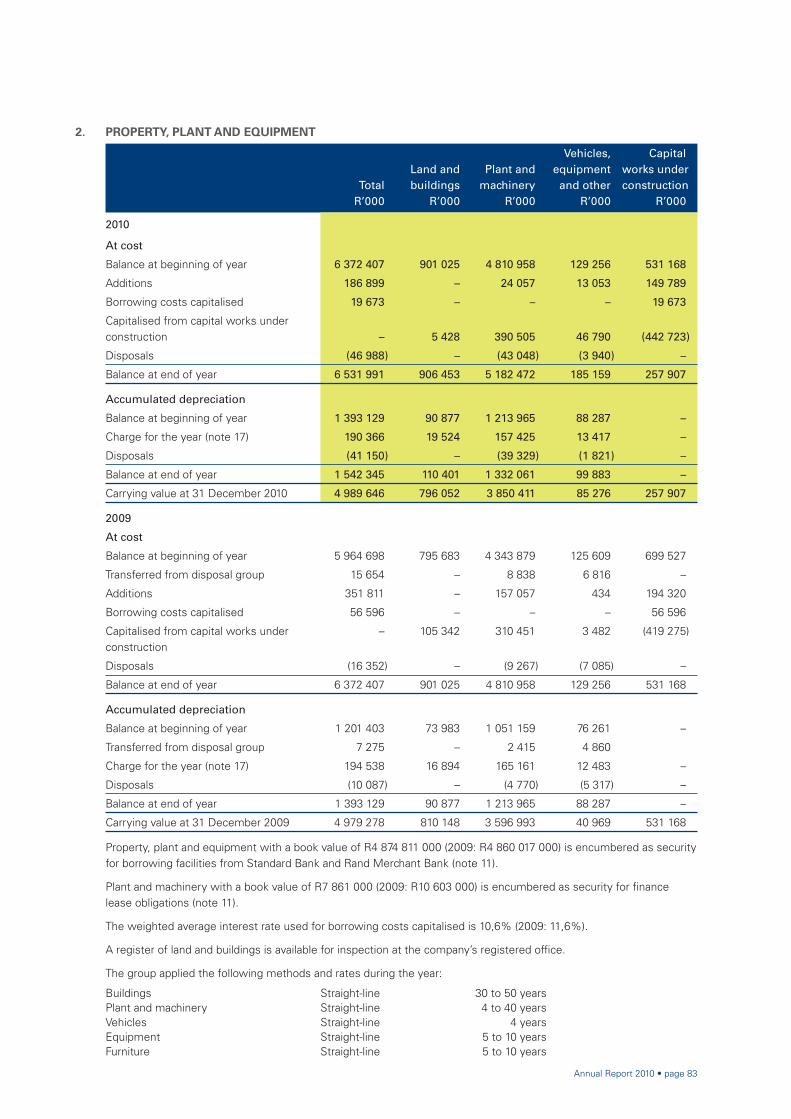
Annual Report 2010 • page 83
2. PROPERTY, PLANT AND EQUIPMENT
TotalR’000
Land andbuildings
R’000
Plant andmachinery
R’000
Vehicles,equipmentand other
R’000
Capitalworks underconstruction
R’000
2010
At cost
Balance at beginning of year 6 372 407 901 025 4 810 958 129 256 531 168
Additions 186 899 – 24 057 13 053 149 789
Borrowing costs capitalised 19 673 – – – 19 673
Capitalised from capital works under construction – 5 428 390 505 46 790 (442 723)
Disposals (46 988) – (43 048) (3 940) –
Balance at end of year 6 531 991 906 453 5 182 472 185 159 257 907
Accumulated depreciation
Balance at beginning of year 1 393 129 90 877 1 213 965 88 287 –
Charge for the year (note 17) 190 366 19 524 157 425 13 417 –
Disposals (41 150) – (39 329) (1 821) –
Balance at end of year 1 542 345 110 401 1 332 061 99 883 –
Carrying value at 31 December 2010 4 989 646 796 052 3 850 411 85 276 257 907
2009
At cost
Balance at beginning of year 5 964 698 795 683 4 343 879 125 609 699 527
Transferred from disposal group 15 654 – 8 838 6 816 –
Additions 351 811 – 157 057 434 194 320
Borrowing costs capitalised 56 596 – – – 56 596
Capitalised from capital works under construction
– 105 342 310 451 3 482 (419 275)
Disposals (16 352) – (9 267) (7 085) –
Balance at end of year 6 372 407 901 025 4 810 958 129 256 531 168
Accumulated depreciation
Balance at beginning of year 1 201 403 73 983 1 051 159 76 261 –
Transferred from disposal group 7 275 – 2 415 4 860
Charge for the year (note 17) 194 538 16 894 165 161 12 483 –
Disposals (10 087) – (4 770) (5 317) –
Balance at end of year 1 393 129 90 877 1 213 965 88 287 –
Carrying value at 31 December 2009 4 979 278 810 148 3 596 993 40 969 531 168
Property, plant and equipment with a book value of R4 874 811 000 (2009: R4 860 017 000) is encumbered as security for borrowing facilities from Standard Bank and Rand Merchant Bank (note 11).
Plant and machinery with a book value of R7 861 000 (2009: R10 603 000) is encumbered as security for fi nance lease obligations (note 11).
The weighted average interest rate used for borrowing costs capitalised is 10,6% (2009: 11,6%).
A register of land and buildings is available for inspection at the company’s registered offi ce.
The group applied the following methods and rates during the year:
Buildings Straight-line 30 to 50 yearsPlant and machinery Straight-line 4 to 40 yearsVehicles Straight-line 4 yearsEquipment Straight-line 5 to 10 yearsFurniture Straight-line 5 to 10 years

84 page • Annual Report 2010
Notes to the group fi nancial statementsfor the year ended 31 December 2010
2010R’000
2009R’000
3. INTANGIBLE ASSETS
Software costs – internally generated and capitalised
At beginning of year 29 046 25 555
Additions 3 926 3 491
At end of year 32 972 29 046
Accumulated amortisation:
At beginning of year 3 680 2 260
Charge for the year 1 992 1 420
At end of year 5 672 3 680
Carrying value at end of year 27 300 25 366
Software costs – other external
At beginning of year 13 973 13 910
Additions 2 079 63
At end of year 16 052 13 973
Accumulated amortisation:
At beginning of year 9 465 7 690
Charge for the year 541 1 775
At end of year 10 006 9 465
Carrying value at end of year 6 046 4 508
Total software costs
Cost 49 024 43 019
Accumulated amortisation 15 678 13 145
Carrying value at end of year 33 346 29 874
Intangible assets are amortised over their useful lives (currently fi ve to fi fteen years) on the straight-line basis.
4. INVESTMENTS IN ASSOCIATES AND JOINT VENTURES
At beginning of year 10 463 10 080
Acquired during the year 32 617 –
Movement in loans 6 505 –
Share of profi ts of associates and joint ventures 2 654 383
Change in unrealised profi t in closing inventory of associates and joint ventures (352) –
At end of year 51 887 10 463
Consists of:
Loans 15 258 8 753
Share of equity 36 629 1 710
51 887 10 463
The above loans are unsecured, interest-free and have no fi xed terms of repayment.

Annual Report 2010 • page 85
4. INVESTMENTS IN ASSOCIATES AND JOINT VENTURES continued
Summary fi nancial information for equity-accounted joint ventures, not adjusted for the percentage ownership held by the group:
Owner-
ship
%
Current
assets
R’000
Non-
current
assets
R’000
Current
liabilities
R’000
Non-
current
liabilities
R’000
Revenue
R’000
Expenses
R’000
2010
Richards & Barlow (Pty) Limited 50 48 303 5 725 21 819 26 387 89 249 85 407
Cyndara 193 (Pty) Limited, trading as Hulamin Building Systems 50 56 770 2 147 5 053 – 92 876 88 859
105 073 7 872 26 872 26 387 182 125 174 266
2009
Richards & Barlow (Pty) Limited 50 36 679 4 065 11 095 26 227 45 160 45 213
36 679 4 065 11 095 26 227 45 160 45 213
Additional details of associates and joint ventures are included in note 31.
2010R’000
2009R’000
5. DEFERRED TAX ASSET
At beginning of year 13 899 11 697
Accounted for in equity 10 –
Transfer from deferred tax liability 1 330 1 691
Income statement
– Current year relief on earnings 6 939 511
– Prior year’s charge (76) –
At end of year 22 102 13 899
Analysis of deferred tax asset:
Fixed assets (17 389) (16 250)
Provisions 20 660 17 792
Other 68 (82)
Assessed loss 18 763 12 439
22 102 13 899
6. INVENTORIES
Raw materials 276 320 256 783
Work-in-progress 327 285 274 040
Finished goods 461 005 378 551
Consumable stores 125 319 105 655
1 189 929 1 015 029
Inventories with a carrying value of R1 085 567 000 (2009: R904 875 064) are encumbered as security for borrowing facilities (note 11).
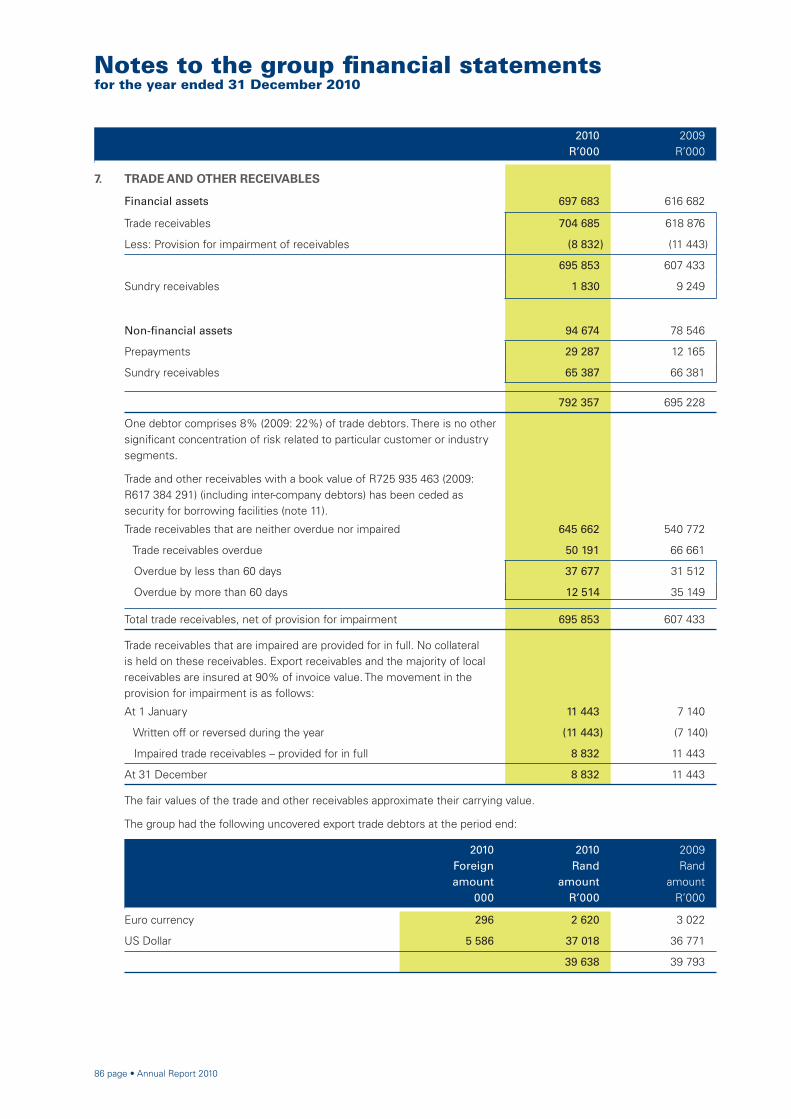
86 page • Annual Report 2010
Notes to the group fi nancial statementsfor the year ended 31 December 2010
2010R’000
2009R’000
7. TRADE AND OTHER RECEIVABLES
Financial assets 697 683 616 682
Trade receivables 704 685 618 876
Less: Provision for impairment of receivables (8 832) (11 443)
695 853 607 433
Sundry receivables 1 830 9 249
Non-fi nancial assets 94 674 78 546
Prepayments 29 287 12 165
Sundry receivables 65 387 66 381
792 357 695 228
One debtor comprises 8% (2009: 22%) of trade debtors. There is no other signifi cant concentration of risk related to particular customer or industry segments.
Trade and other receivables with a book value of R725 935 463 (2009: R617 384 291) (including inter-company debtors) has been ceded as security for borrowing facilities (note 11).
Trade receivables that are neither overdue nor impaired 645 662 540 772
Trade receivables overdue 50 191 66 661
Overdue by less than 60 days 37 677 31 512
Overdue by more than 60 days 12 514 35 149
Total trade receivables, net of provision for impairment 695 853 607 433
Trade receivables that are impaired are provided for in full. No collateral is held on these receivables. Export receivables and the majority of local receivables are insured at 90% of invoice value. The movement in the provision for impairment is as follows:
At 1 January 11 443 7 140
Written off or reversed during the year (11 443) (7 140)
Impaired trade receivables – provided for in full 8 832 11 443
At 31 December 8 832 11 443
The fair values of the trade and other receivables approximate their carrying value.
The group had the following uncovered export trade debtors at the period end:
2010Foreignamount
000
2010Rand
amountR’000
2009Rand
amountR’000
Euro currency 296 2 620 3 022
US Dollar 5 586 37 018 36 771
39 638 39 793
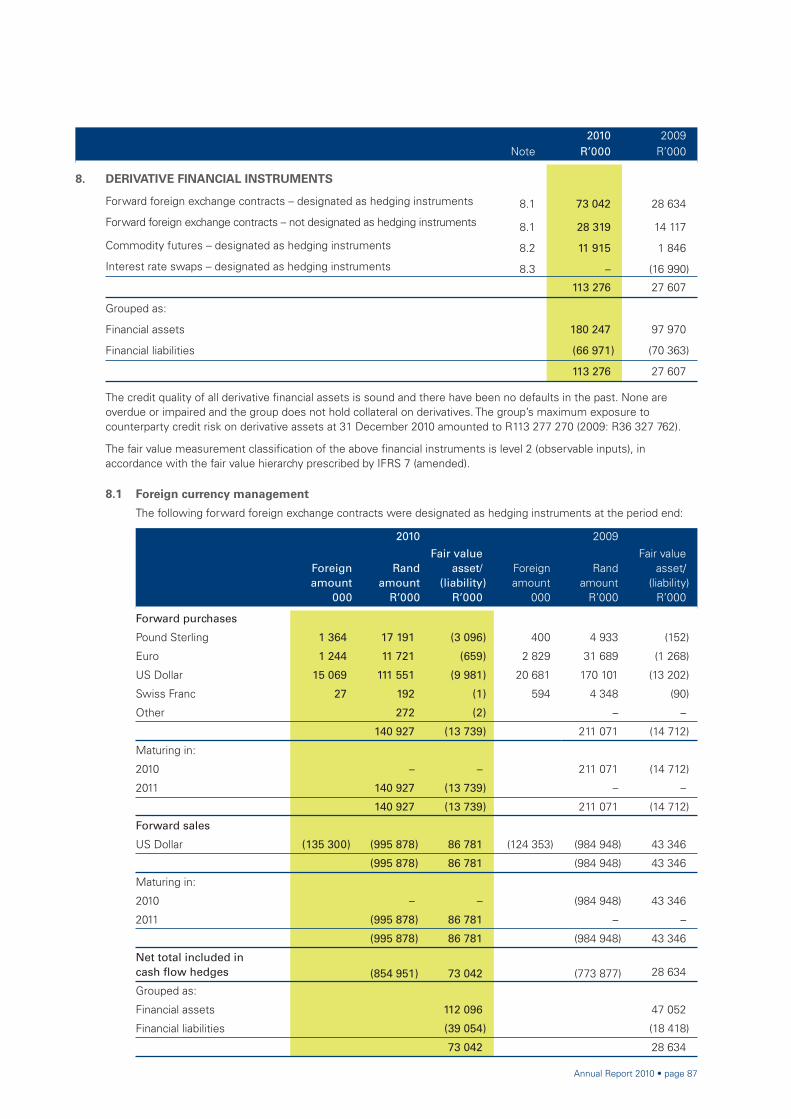
Annual Report 2010 • page 87
Note2010
R’0002009
R’000
8. DERIVATIVE FINANCIAL INSTRUMENTS
Forward foreign exchange contracts – designated as hedging instruments 8.1 73 042 28 634
Forward foreign exchange contracts – not designated as hedging instruments 8.1 28 319 14 117
Commodity futures – designated as hedging instruments 8.2 11 915 1 846
Interest rate swaps – designated as hedging instruments 8.3 – (16 990)
113 276 27 607
Grouped as:
Financial assets 180 247 97 970
Financial liabilities (66 971) (70 363)
113 276 27 607
The credit quality of all derivative fi nancial assets is sound and there have been no defaults in the past. None are overdue or impaired and the group does not hold collateral on derivatives. The group’s maximum exposure to counterparty credit risk on derivative assets at 31 December 2010 amounted to R113 277 270 (2009: R36 327 762).
The fair value measurement classifi cation of the above fi nancial instruments is level 2 (observable inputs), in accordance with the fair value hierarchy prescribed by IFRS 7 (amended).
8.1 Foreign currency management
The following forward foreign exchange contracts were designated as hedging instruments at the period end:
2010 2009
Foreignamount
000
Randamount
R’000
Fair valueasset/
(liability)R’000
Foreignamount
000
Randamount
R’000
Fair valueasset/
(liability)R’000
Forward purchases
Pound Sterling 1 364 17 191 (3 096) 400 4 933 (152)
Euro 1 244 11 721 (659) 2 829 31 689 (1 268)
US Dollar 15 069 111 551 (9 981) 20 681 170 101 (13 202)
Swiss Franc 27 192 (1) 594 4 348 (90)
Other 272 (2) – –
140 927 (13 739) 211 071 (14 712)
Maturing in:
2010 – – 211 071 (14 712)
2011 140 927 (13 739) – –
140 927 (13 739) 211 071 (14 712)
Forward sales
US Dollar (135 300) (995 878) 86 781 (124 353) (984 948) 43 346
(995 878) 86 781 (984 948) 43 346
Maturing in:
2010 – – (984 948) 43 346
2011 (995 878) 86 781 – –
(995 878) 86 781 (984 948) 43 346
Net total included in cash fl ow hedges (854 951) 73 042 (773 877) 28 634
Grouped as:
Financial assets 112 096 47 052
Financial liabilities (39 054) (18 418)
73 042 28 634
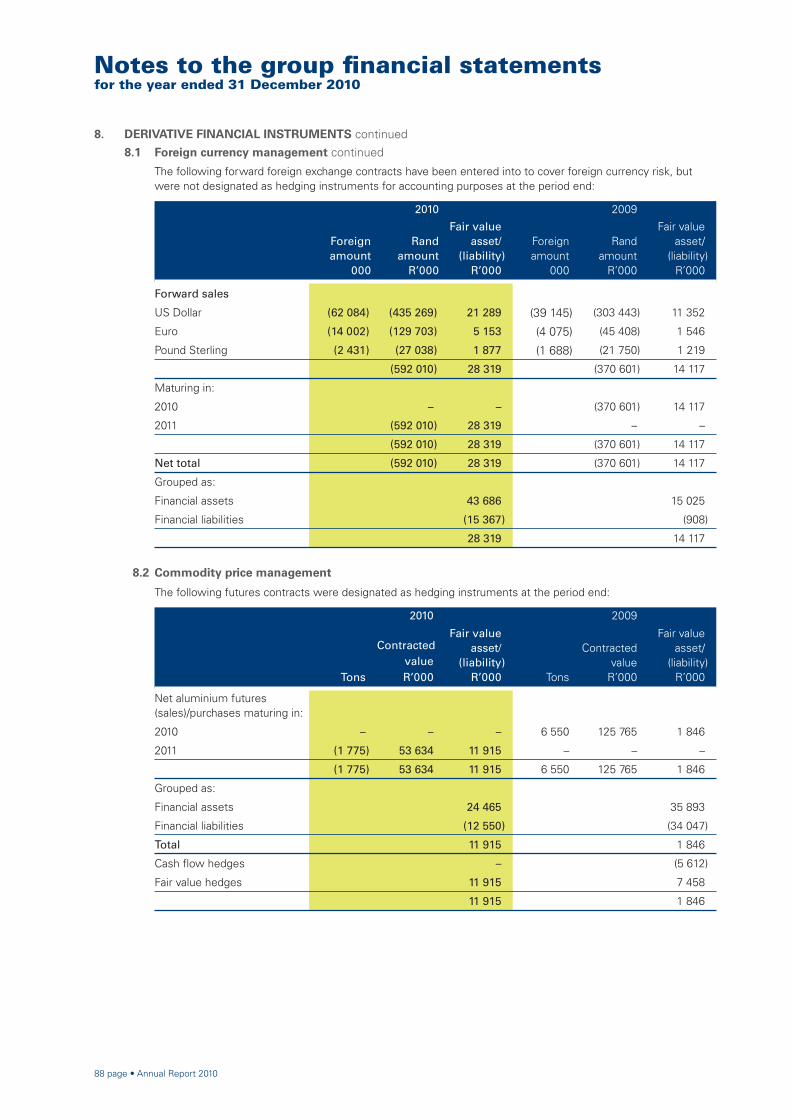
88 page • Annual Report 2010
Notes to the group fi nancial statementsfor the year ended 31 December 2010
8. DERIVATIVE FINANCIAL INSTRUMENTS continued
8.1 Foreign currency management continued
The following forward foreign exchange contracts have been entered into to cover foreign currency risk, but were not designated as hedging instruments for accounting purposes at the period end:
2010 2009
Foreignamount
000
Randamount
R’000
Fair valueasset/
(liability)R’000
Foreignamount
000
Randamount
R’000
Fair valueasset/
(liability)R’000
Forward sales
US Dollar (62 084) (435 269) 21 289 (39 145) (303 443) 11 352
Euro (14 002) (129 703) 5 153 (4 075) (45 408) 1 546
Pound Sterling (2 431) (27 038) 1 877 (1 688) (21 750) 1 219
(592 010) 28 319 (370 601) 14 117
Maturing in:
2010 – – (370 601) 14 117
2011 (592 010) 28 319 – –
(592 010) 28 319 (370 601) 14 117
Net total (592 010) 28 319 (370 601) 14 117
Grouped as:
Financial assets 43 686 15 025
Financial liabilities (15 367) (908)
28 319 14 117
8.2 Commodity price management
The following futures contracts were designated as hedging instruments at the period end:
2010 2009
Tons
ContractedvalueR’000
Fair valueasset/
(liability)R’000 Tons
Contractedvalue
R’000
Fair valueasset/
(liability)R’000
Net aluminium futures (sales)/purchases maturing in:
2010 – – – 6 550 125 765 1 846
2011 (1 775) 53 634 11 915 – – –
(1 775) 53 634 11 915 6 550 125 765 1 846
Grouped as:
Financial assets 24 465 35 893
Financial liabilities (12 550) (34 047)
Total 11 915 1 846
Cash fl ow hedges – (5 612)
Fair value hedges 11 915 7 458
11 915 1 846
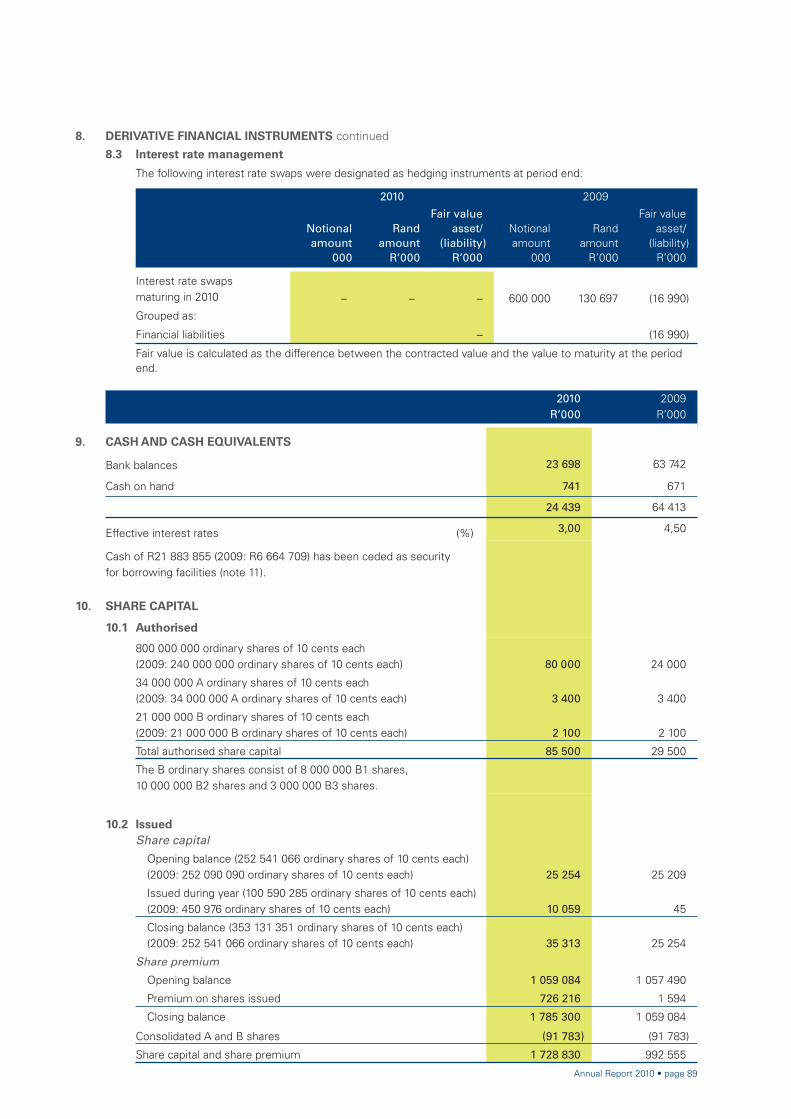
Annual Report 2010 • page 89
8. DERIVATIVE FINANCIAL INSTRUMENTS continued
8.3 Interest rate management
The following interest rate swaps were designated as hedging instruments at period end:
2010 2009
Notionalamount
000
Randamount
R’000
Fair valueasset/
(liability)R’000
Notionalamount
000
Randamount
R’000
Fair valueasset/
(liability)R’000
Interest rate swaps maturing in 2010 – – – 600 000 130 697 (16 990)
Grouped as:
Financial liabilities – (16 990)
Fair value is calculated as the difference between the contracted value and the value to maturity at the period end.
2010R’000
2009R’000
9. CASH AND CASH EQUIVALENTS
Bank balances 23 698 63 742
Cash on hand 741 671
24 439 64 413
Effective interest rates (%) 3,00 4,50
Cash of R21 883 855 (2009: R6 664 709) has been ceded as security for borrowing facilities (note 11).
10. SHARE CAPITAL
10.1 Authorised
800 000 000 ordinary shares of 10 cents each(2009: 240 000 000 ordinary shares of 10 cents each) 80 000 24 000
34 000 000 A ordinary shares of 10 cents each(2009: 34 000 000 A ordinary shares of 10 cents each) 3 400 3 400
21 000 000 B ordinary shares of 10 cents each(2009: 21 000 000 B ordinary shares of 10 cents each) 2 100 2 100
Total authorised share capital 85 500 29 500
The B ordinary shares consist of 8 000 000 B1 shares, 10 000 000 B2 shares and 3 000 000 B3 shares.
10.2 Issued Share capital
Opening balance (252 541 066 ordinary shares of 10 cents each)(2009: 252 090 090 ordinary shares of 10 cents each) 25 254 25 209
Issued during year (100 590 285 ordinary shares of 10 cents each)(2009: 450 976 ordinary shares of 10 cents each) 10 059 45
Closing balance (353 131 351 ordinary shares of 10 cents each)(2009: 252 541 066 ordinary shares of 10 cents each) 35 313 25 254
Share premium
Opening balance 1 059 084 1 057 490
Premium on shares issued 726 216 1 594
Closing balance 1 785 300 1 059 084
Consolidated A and B shares (91 783) (91 783)
Share capital and share premium 1 728 830 992 555

90 page • Annual Report 2010
Notes to the group fi nancial statementsfor the year ended 31 December 2010
10. SHARE CAPITAL continued
10.3 A ordinary shares and B ordinary shares The A ordinary shares and B ordinary shares are unlisted and carry full voting rights. The A ordinary shares have
no entitlements to any dividends or other shareholder distributions. The A ordinary shares are eliminated in the group accounts as they are held by an entity related to the introduction of broad-based BEE investors, and this entity is consolidated into the group results. The B ordinary shares are held in employee trusts, which trusts are consolidated and thus the shareholding eliminated on consolidation.
10.4 Unissued Under option to employees In terms of the Tongaat-Hulett Employees Share Incentive Scheme and The Tongaat-Hulett Group Limited 2001
Share Option Scheme, employees have been granted options to subscribe for 1 447 637 Hulamin shares. The weighted average exercise price for these options is R17,50 per share.
Details of the employee share incentive schemes are set out in note 30.
Under the control of the directors At 31 December 2010, 8 826 445 unissued ordinary shares (2009: 9 416 730) were under the control of the
directors, for the purpose, inter alia, of existing employee share incentive schemes.
At 31 December 2010, 9 653 770 unissued B ordinary shares (2009: 9 653 777) were under the control of the directors, for the purpose of the Hulamin Employee Share Ownership Plan and the Hulamin Management Share Ownership Plan.
11. NON-CURRENT BORROWINGS
Effective interest rates (%)
2010R’000
2009R’000
Secured loans:
Finance leases 11,48 933 1 642
Standard Bank 8,96 564 858 766 761
Rand Merchant Bank 8,96 62 762 85 195
628 553 853 598
Less: Current portion included in short-term borrowings 794 90 102
627 759 763 496
Borrowing payments by fi nancial year (including interest):
2011 53 036 164 426
2012 52 427 155 447
2013 126 054 146 719
2014 119 966 543 317
Thereafter 505 943 –
Book value of assets encumbered as security for fi nance lease obligations (note 2) 7 861 10 603
The facilities with Standard Bank and Rand Merchant Bank referred to above and the amounts owing in respect of the
bank overdraft, First National Bank call loan and Standard Bank call loan (note 15) are collectively secured by mortgage and notarial bonds over the moveable and immoveable assets of Hulamin Operations (Pty) Limited, and the cession of book debts, cash and material investments in and claims against wholly-owned subsidiaries, and the provision of a guarantee by the company.
In terms of the company’s articles of association the borrowing powers of the group are subject to any regulations made by the company in a general meeting to restrict the borrowing powers, failing which they are at the discretion of the directors. To date no such regulation has been imposed.
The fair values of the non-current borrowings approximate their carrying values.

Annual Report 2010 • page 91
2010R’000
2009R’000
12. DEFERRED TAX LIABILITY
At beginning of year 912 876 926 359
Accounted for in equity 15 276 (41 360)
Transfer to deferred tax asset 1 330 1 691
Income statement
Current year charge 17 738 16 430
Prior year’s (relief)/charge (5 960) 9 756
At end of year 941 260 912 876
The deferred tax liability is analysed as follows:
Accelerated tax depreciation 1 026 210 978 489
Provisions and leave pay accruals (38 165) (38 183)
Defi ned Benefi t Fund 20 669 –
Assessed loss (81 580) (31 466)
Share schemes (3 964) (4 436)
Hedging reserve 15 104 (203)
Other 2 986 8 675
941 260 912 876
13. RETIREMENT BENEFIT OBLIGATIONS
Post-retirement medical aid provision 125 796 112 092
Retirement gratuity provision 22 113 20 854
147 909 132 946
The movement of these provisions is detailed in note 25.
14. TRADE AND OTHER PAYABLES
Trade payables 464 750 397 904
Leave pay and bonus accruals 57 846 53 552
Sundry accruals and other payables 85 321 128 964
607 917 580 420
The fair value of trade and other payables approximates their carrying value.

92 page • Annual Report 2010
Notes to the group fi nancial statementsfor the year ended 31 December 2010
2010R’000
2009R’000
15. CURRENT BORROWINGS
Current portion of long-term loans 794 90 102
Bank overdrafts 52 283 75 720
First National Bank call loan 140 000 275 000
Standard Bank call loan 162 000 269 000
355 077 709 822
Effective interest rates are as follows:
Bank overdrafts (%) 8,00 9,00
First National Bank call loan (%) 7,30 8,80
Standard Bank call loan (%) 7,10 8,40
R53 077 000 hereof will be repaid during 2011. The remaining current borrowings have no fi xed repayment dates.
The bank overdrafts and call loans are secured (refer note 11).
The fair value of current borrowings approximates their carrying value.
16. OTHER GAINS AND LOSSES
Valuation adjustments on non-derivative items (note 16.1) (33 766) (85 126)
Valuation adjustments on derivative items (note 16.2) 105 510 139 094
71 744 53 968
16.1 Valuation adjustments on non-derivative items
Export receivables (49 341) (88 714)
Import payables (1 766) 7 462
Foreign currency denominated cash balances 17 341 (3 874)
(33 766) (85 126)
16.2 Valuation adjustments on derivative items
Forward foreign exchange contracts: not designated as hedging instruments 98 679 138 647
Forward foreign exchange contracts: cash fl ow hedges, transfer from equity 28 934 (30 466)
Forward aluminium purchase and sale contracts: fair value hedges (42 962) 80 060
Forward aluminium purchase and sale contracts:cash fl ow hedges, transfer from equity – (49 147)
Interest rate swaps: not designated as hedging instruments 20 859 –
105 510 139 094
16.3 The ineffective portion of all hedges is recognised in profi t or (loss)
Cash fl ow hedges (26 560) 1 658
Fair value hedges 2 208 (2 067)
(24 352) (409)

Annual Report 2010 • page 93
Note2010
R’0002009
R’000
17. EXPENSES BY NATURE
Raw materials and other costs 4 720 040 3 434 778
Employee benefi t expense 17.3 729 997 636 140
Depreciation 2 190 366 194 538
Amortisation of intangible assets 3 2 533 3 195
Write-down of inventories 11 486 21 415
Operating leases 4 338 9 475
(Decrease)/increase in provision for impairment of debtors (2 611) 4 303
Auditors’ remuneration 17.1 3 855 3 001
Loss on disposal of property, plant and equipment 2 174 2 731
5 662 178 4 309 576
Classifi ed as:
Cost of sales 5 260 954 3 895 842
Selling and marketing expenses 312 113 323 438
Administrative expenses 89 111 90 296
5 662 178 4 309 576
17.1 Auditors’ remuneration
Audit fees 3 209 2 718
Fees for other services 398 80
Prior year under provision 98 58
Expenses 150 145
3 855 3 001
17.2 Directors’ emoluments
Executives
Cash package 8 956 6 842
Retirement, medical and insurance benefi ts 4 421 1 004
Bonus – 1 474
Non-executives
Fees 1 676 1 504
15 053 10 824
17.3 Employee benefi t expense
Salaries and wages 633 360 551 049
Retirement benefi t costs:
Defi ned contribution scheme 25 8 194 6 647
Defi ned benefi t scheme 25 43 842 29 561
Post-retirement medical aid costs 25 19 514 15 554
Staff gratuities 25 4 732 3 837
Share incentive costs 30 20 355 29 492
729 997 636 140

94 page • Annual Report 2010
Notes to the group fi nancial statementsfor the year ended 31 December 2010
2010R’000
2009R’000
18. NET FINANCE COSTS
Interest paid
Long-term loan interest 90 346 114 822
Short-term loan interest 46 476 58 595
Interest capitalised (19 673) (56 596)
Interest received (226) (3 008)
Net fi nance costs 116 923 113 813
19. TAXATION
South African normal taxation:
Current
Current year 18 928 21 396
Prior year under/(over) provision 6 873 (9 014)
Deferred
Current year 10 799 15 919
Prior year (over)/under provision (5 884) 9 756
Secondary tax on companies – 2 854
30 716 40 911
South African income tax is levied on the company and its subsidiaries and not the group.
Tax rate reconciliation
Normal rate of taxation (%) 28,0 28,0
Adjusted for:
BEE and IFRS 2 costs (%) 0,2 0,1
Non-allowable items (%) 1,1 0,5
Prior year adjustment (%) 0,9 0,6
Effect of associate profi t being shown net of tax (%) (0,7) (0,1)
STC (%) – 2,2
Effective rate of taxation (%) 29,5 31,3
Estimated tax losses available for set-off against future taxable income are as follows:
Total tax losses 358 370 156 767
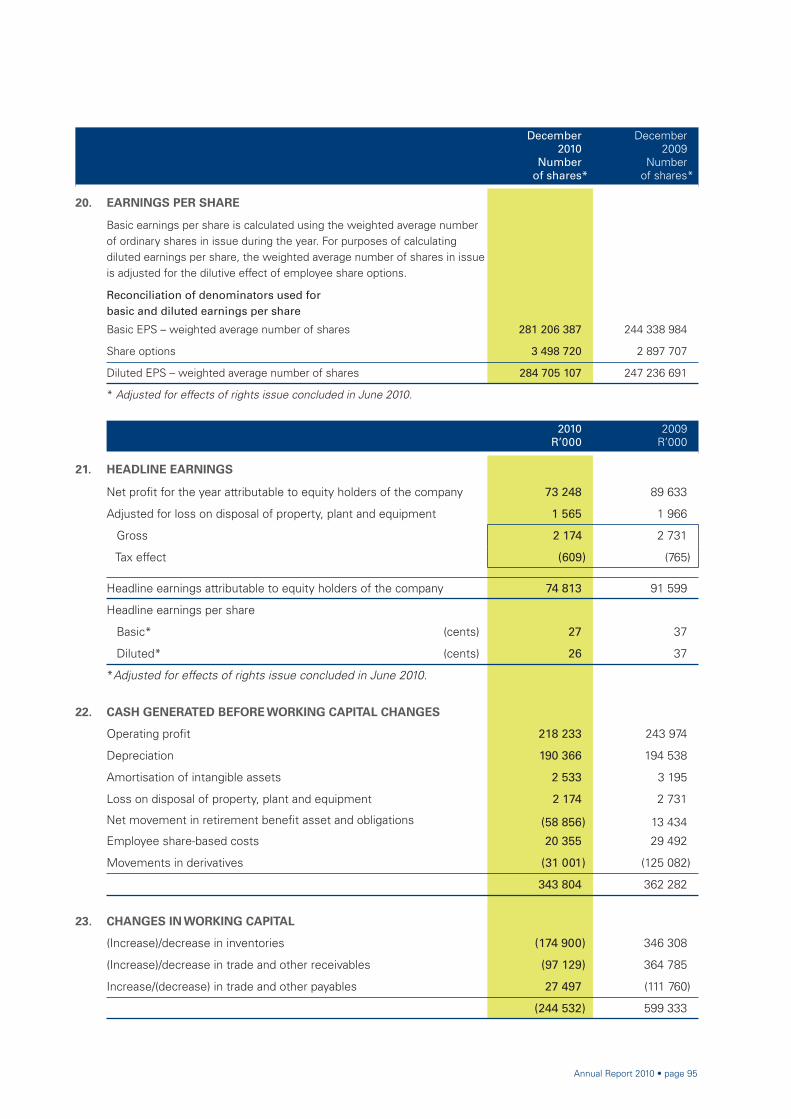
Annual Report 2010 • page 95
December2010
Numberof shares*
December2009
Numberof shares*
20. EARNINGS PER SHARE
Basic earnings per share is calculated using the weighted average number of ordinary shares in issue during the year. For purposes of calculating diluted earnings per share, the weighted average number of shares in issue is adjusted for the dilutive effect of employee share options.
Reconciliation of denominators used for basic and diluted earnings per share
Basic EPS – weighted average number of shares 281 206 387 244 338 984
Share options 3 498 720 2 897 707
Diluted EPS – weighted average number of shares 284 705 107 247 236 691
* Adjusted for effects of rights issue concluded in June 2010.
2010R’000
2009R’000
21. HEADLINE EARNINGS
Net profi t for the year attributable to equity holders of the company 73 248 89 633
Adjusted for loss on disposal of property, plant and equipment 1 565 1 966
Gross 2 174 2 731
Tax effect (609) (765)
Headline earnings attributable to equity holders of the company 74 813 91 599
Headline earnings per share
Basic* (cents) 27 37
Diluted* (cents) 26 37
*Adjusted for effects of rights issue concluded in June 2010.
22. CASH GENERATED BEFORE WORKING CAPITAL CHANGES
Operating profi t 218 233 243 974
Depreciation 190 366 194 538
Amortisation of intangible assets 2 533 3 195
Loss on disposal of property, plant and equipment 2 174 2 731
Net movement in retirement benefi t asset and obligations (58 856) 13 434
Employee share-based costs 20 355 29 492
Movements in derivatives (31 001) (125 082)
343 804 362 282
23. CHANGES IN WORKING CAPITAL
(Increase)/decrease in inventories (174 900) 346 308
(Increase)/decrease in trade and other receivables (97 129) 364 785
Increase/(decrease) in trade and other payables 27 497 (111 760)
(244 532) 599 333

96 page • Annual Report 2010
Notes to the group fi nancial statementsfor the year ended 31 December 2010
2010R’000
2009R’000
24. DIVIDENDS PAID
Final for 2008 year, paid 9 March 2009: 13 cents – 28 537
– 28 537
25. RETIREMENT BENEFITS
Retirement benefi t schemes The group contributes towards retirement benefi ts for substantially all permanent employees who are required to be
a member of one of the retirement benefi t plans, either pension fund or provident fund, elected by the group. These schemes are governed by the relevant fund legislation. Their assets consist primarily of listed shares, fi xed income securities, property investments and money market instruments and are held separately from those of the group. The scheme assets are administered by boards of trustees, each of which includes elected representatives.
Provident fund The group’s contributions to the Metal Industries Provident Fund scheme, a defi ned contribution plan, amounted to
R8 194 000 (2009: R6 647 000) and were expensed during the year.
Pension fund Hulamin and the Tongaat Hulett Group have historically participated in a common funded defi ned benefi t scheme,
The Tongaat-Hulett Pension Fund. The group’s participation in this fund had previously been accounted for as a defi ned contribution fund, as there was no determined basis for allocating the defi ned obligations and plan assets between the individual employer companies.
In August 2010, the basis for allocating the defi ned benefi t obligation and plan assets to the two new defi ned benefi t funds for the respective employers was determined. An amount of R60 245 000 (2009: R37 600 000), arising out of the excess of assets over liabilities in the fund, was allocated by the trustees to Hulamin during the course of the current fi nancial year, prior to the new Hulamin fund becoming effective. An actuarial valuation of the group’s share of its defi ned benefi t obligation and plan assets was performed in accordance with IAS 19 at 31 August 2010, resulting in an increase in the defi ned benefi t asset of R34 628 000 being recognised.
2010R’000
Balances at 31 August 2010
The defi ned benefi t asset recognised in the balance sheet at 31 August 2010 comprises:
Group’s share of fair value of plan assets 1 861 461Group’s share of present value of funded obligations (1 766 588)Defi ned benefi t asset at 31 August 2010 94 873
The principal actuarial assumptions employed in the valuation at 31 August 2010 are as follows:
Discount rate (%) 8,250Infl ation rate (%) 5,375Expected return on plan assets (%) 8,250Future salary increases (%) 7,125Future pension increases (%) 5,375
Movements in balances from 31 August 2010 to the balance sheet date
The movement in the defi ned benefi t obligation from 31 August 2010 to the balance sheet date is as follows:
Group’s share of defi ned benefi t obligation at 31 August 2010 1 766 588Current service cost 23 029Interest cost 49 078Employee contributions 6 383Actuarial gains (82 044)Benefi ts paid (16 321)Group’s share of defi ned benefi t obligation at 31 December 2010 1 746 713
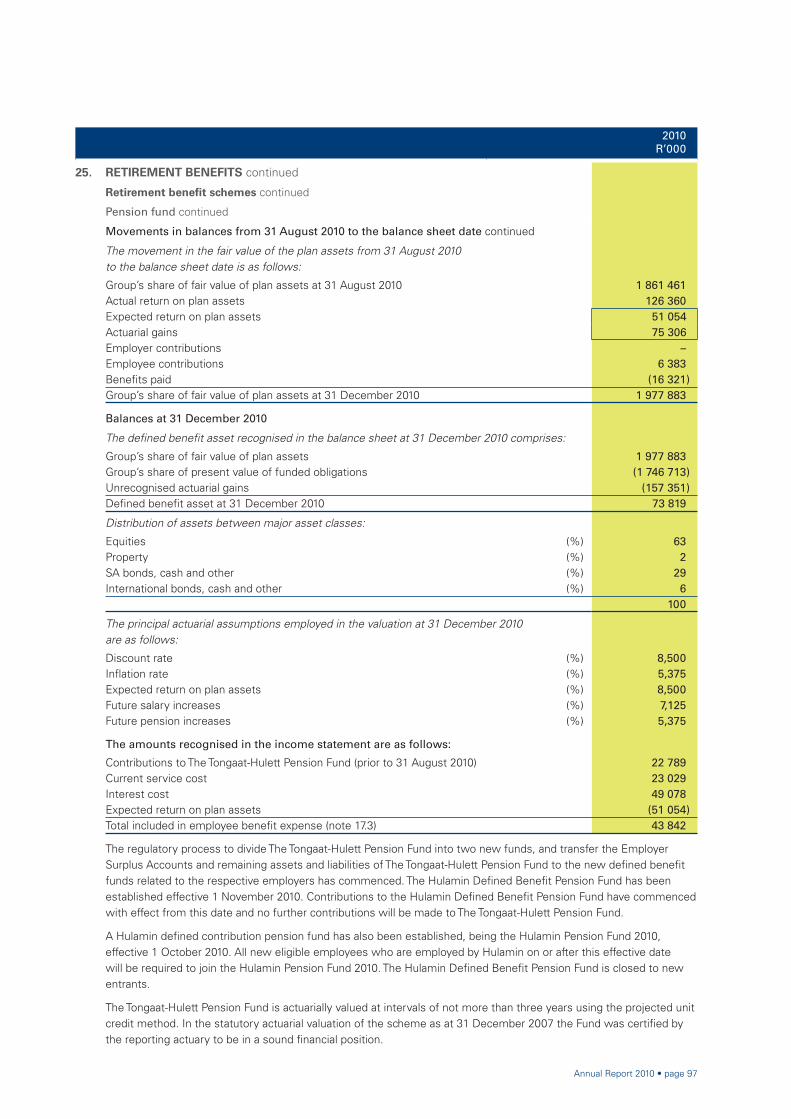
Annual Report 2010 • page 97
2010R’000
25. RETIREMENT BENEFITS continued
Retirement benefi t schemes continued
Pension fund continued
Movements in balances from 31 August 2010 to the balance sheet date continued
The movement in the fair value of the plan assets from 31 August 2010 to the balance sheet date is as follows:
Group’s share of fair value of plan assets at 31 August 2010 1 861 461Actual return on plan assets 126 360Expected return on plan assets 51 054Actuarial gains 75 306Employer contributions –Employee contributions 6 383Benefi ts paid (16 321)Group’s share of fair value of plan assets at 31 December 2010 1 977 883
Balances at 31 December 2010
The defi ned benefi t asset recognised in the balance sheet at 31 December 2010 comprises:
Group’s share of fair value of plan assets 1 977 883Group’s share of present value of funded obligations (1 746 713)Unrecognised actuarial gains (157 351)Defi ned benefi t asset at 31 December 2010 73 819
Distribution of assets between major asset classes:
Equities (%) 63 Property (%) 2 SA bonds, cash and other (%) 29 International bonds, cash and other (%) 6
100
The principal actuarial assumptions employed in the valuation at 31 December 2010 are as follows:
Discount rate (%) 8,500Infl ation rate (%) 5,375Expected return on plan assets (%) 8,500Future salary increases (%) 7,125Future pension increases (%) 5,375
The amounts recognised in the income statement are as follows:
Contributions to The Tongaat-Hulett Pension Fund (prior to 31 August 2010) 22 789Current service cost 23 029Interest cost 49 078Expected return on plan assets (51 054)Total included in employee benefi t expense (note 17.3) 43 842
The regulatory process to divide The Tongaat-Hulett Pension Fund into two new funds, and transfer the Employer Surplus Accounts and remaining assets and liabilities of The Tongaat-Hulett Pension Fund to the new defi ned benefi t funds related to the respective employers has commenced. The Hulamin Defi ned Benefi t Pension Fund has been established effective 1 November 2010. Contributions to the Hulamin Defi ned Benefi t Pension Fund have commenced with effect from this date and no further contributions will be made to The Tongaat-Hulett Pension Fund.
A Hulamin defi ned contribution pension fund has also been established, being the Hulamin Pension Fund 2010, effective 1 October 2010. All new eligible employees who are employed by Hulamin on or after this effective date will be required to join the Hulamin Pension Fund 2010. The Hulamin Defi ned Benefi t Pension Fund is closed to new entrants.
The Tongaat-Hulett Pension Fund is actuarially valued at intervals of not more than three years using the projected unit credit method. In the statutory actuarial valuation of the scheme as at 31 December 2007 the Fund was certifi ed by the reporting actuary to be in a sound fi nancial position.
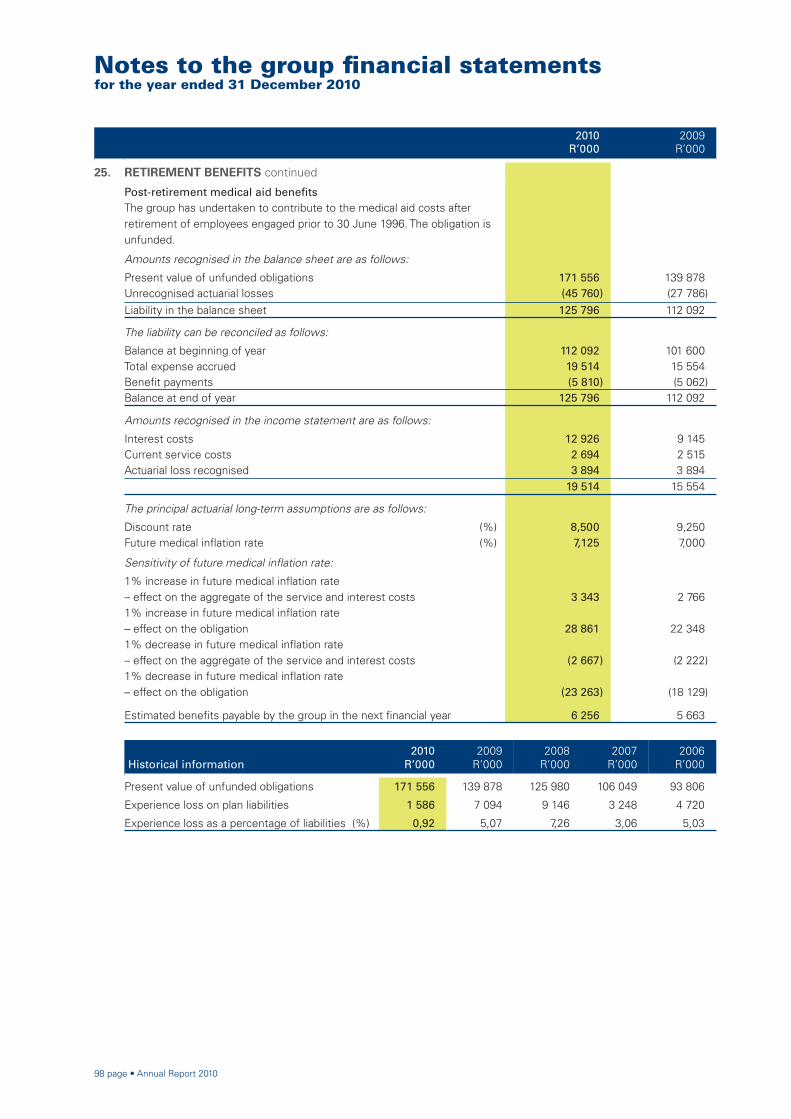
98 page • Annual Report 2010
Notes to the group fi nancial statementsfor the year ended 31 December 2010
2010R’000
2009R’000
25. RETIREMENT BENEFITS continued
Post-retirement medical aid benefi tsThe group has undertaken to contribute to the medical aid costs after retirement of employees engaged prior to 30 June 1996. The obligation is unfunded.
Amounts recognised in the balance sheet are as follows:
Present value of unfunded obligations 171 556 139 878 Unrecognised actuarial losses (45 760) (27 786)Liability in the balance sheet 125 796 112 092
The liability can be reconciled as follows:
Balance at beginning of year 112 092 101 600 Total expense accrued 19 514 15 554 Benefi t payments (5 810) (5 062)Balance at end of year 125 796 112 092
Amounts recognised in the income statement are as follows:
Interest costs 12 926 9 145 Current service costs 2 694 2 515 Actuarial loss recognised 3 894 3 894
19 514 15 554
The principal actuarial long-term assumptions are as follows:
Discount rate (%) 8,500 9,250Future medical infl ation rate (%) 7,125 7,000
Sensitivity of future medical infl ation rate:
1% increase in future medical infl ation rate – effect on the aggregate of the service and interest costs 3 343 2 766 1% increase in future medical infl ation rate – effect on the obligation 28 861 22 348 1% decrease in future medical infl ation rate – effect on the aggregate of the service and interest costs (2 667) (2 222)1% decrease in future medical infl ation rate – effect on the obligation (23 263) (18 129)
Estimated benefi ts payable by the group in the next fi nancial year 6 256 5 663
Historical information
2010R’000
2009R’000
2008R’000
2007R’000
2006R’000
Present value of unfunded obligations 171 556 139 878 125 980 106 049 93 806
Experience loss on plan liabilities 1 586 7 094 9 146 3 248 4 720
Experience loss as a percentage of liabilities (%) 0,92 5,07 7,26 3,06 5,03

Annual Report 2010 • page 99
2010R’000
2009R’000
25. RETIREMENT BENEFITS continued
Retirement gratuitiesThe group has in the past made discretionary payments, on retirement, to eligible employees who have remained in service until retirement age, and have completed a minimum service period. The obligation is unfunded.
Amounts recognised in the balance sheet are as follows:
Present value of unfunded obligations 30 116 25 959 Unrecognised actuarial losses (8 003) (5 105)Liability in the balance sheet 22 113 20 854
The liability can be reconciled as follows:
Balance at beginning of year 20 854 17 912 Total expense accrued 4 732 3 837 Gratuity payments (3 473) (895)Balance at end of year 22 113 20 854
Amounts recognised in the income statement are as follows:
Interest costs 2 506 1 727 Service costs 1 505 1 389 Actuarial loss recognised 721 721
4 732 3 837
The principal actuarial assumptions are:Discount rate (%) 8,500 9,250Future salary infl ation rate (%) 7,125 7,000
Estimated retirement gratuities, payable by the group during the next fi nancial year, are R1 184 000.
Historical information2010
R’0002009
R’0002008
R’0002007
R’0002006
R’000
Present value of unfunded obligations 30 116 25 959 22 827 18 556 15 685
Experience loss on plan liabilities 446 767 1 763 1 026 303
Experience loss as a percentage of liabilities (%) 1,48 2,95 7,72 5,53 1,93

100 page • Annual Report 2010
Notes to the group fi nancial statementsfor the year ended 31 December 2010
2010R’000
2009R’000
26. LEASE COMMITMENTS
Amounts payable under fi nance leasesMinimum lease payments due: Not later than one year 903 903 Later than one year and not later than fi ve years 152 1 055
1 055 1 958 Less: future fi nance charges (131) (324)Present value of lease obligations 924 1 634
Payable: Not later than one year 794 711 Later than one year and not later than fi ve years 130 923
924 1 634
Book value of plant and equipment encumbered as security for fi nance lease obligations (note 2). 7 861 10 603
Operating lease commitments, amounts due: Not later than one year 4 225 6 922 Later than one year and not later than fi ve years 5 167 14 168
9 392 21 090
In respect of:Property 4 568 14 600 Plant and machinery 4 824 6 490
9 392 21 090
The group leases offi ces and warehouses under non-cancellable operating lease agreements.
The leases have varying terms, escalation clauses and renewal rights.
27. CAPITAL EXPENDITURE COMMITMENTS
Capital expenditure contracted for at the end of the reporting period but not yet incurred is as follows:
Property, plant and equipment 90 381 112 557
Capital expenditure will be funded by a combination of external borrowings and cash fl ow from operations.
28. RELATED PARTY TRANSACTIONS
Balances and transactions between the company and its subsidiaries, which are related parties of the company, have been eliminated on consolidation and are not disclosed in this note. Details of transactions between the group and joint ventures and associates are disclosed below:
Sales to joint ventures and associates 53 688 6 537
Accounts receivable from joint ventures and associates 11 206 1 074
Loans to joint ventures and associates 15 258 8 753
Key management personnel compensation is detailed in note 17.2.

Annual Report 2010 • page 101
29. CONTINGENT LIABILITIES
29.1 The Department of Trade and Industry has raised a dispute with the group relating to previous GEIS claims in the amount of R5 162 000 (2009: R4 794 000). A date for a court hearing of this matter has still to be set.
Sahara Aluminium Works, a toll processor of the company’s coated scrap has claimed that there existed a long-term constructive contract with Hulamin Limited, formerly Hulett Aluminium (Pty) Limited, which would require a ten-year notice period be given before this contract could be terminated. Sahara has thus claimed R17,8 million from Hulamin, largely in respect of the loss of profi ts that Sahara would have earned over ten years, arising from the early termination of the purported constructive contract. A liability has not been raised for this amount as there is only a remote possibility that Sahara will succeed in its claim.
A fi re in February 2002 at the S6 Cold Mill resulted in the death of a contractor and injuries to his assistant. The wife of the deceased and the injured assistant have lodged civil claims amounting to R1,6 million plus interest. Judgement was delivered in September 2009 in the matter between Hulamin and the injured assistant and the court ruled in favour of Hulamin and the case was dismissed with costs. An application for leave to appeal was heard and granted in March 2010. A liability of R3 million which was previously raised for this matter was reversed in December 2009 following the favourable court ruling in September 2009.
29.2
29.3
30. SHARE-BASED PAYMENTS
30.1 Employee share incentive schemes
Details of awards in terms of the company’s share incentive schemes are as follows:
THE TONGAAT-HULETT EMPLOYEES SHARE INCENTIVE SCHEME AND THE TONGAAT-HULETT GROUP LIMITED 2001 SHARE OPTION SCHEME (THE ORIGINAL TONGAAT-HULETT SHARE OPTION SCHEMES)
Participating employees were originally awarded share options over Tongaat Hulett shares. On vesting, the employee was entitled to exercise the options and purchase the shares at the option price.
As a result of the unbundling from Tongaat Hulett, participants in these share option schemes who had not exercised their options at the unbundling date converted their existing Tongaat Hulett options into two options: a Tongaat Hulett option and a Hulamin option. Hulamin is obliged to settle all benefi ts under these share schemes in relation to its own employees using Hulamin shares which will be purchased in the market or issued by Hulamin. The benefi t for the Hulamin option will be determined with reference to the Hulamin share price, and the Tongaat Hulett option with respect to the Tongaat Hulett share price.
The original exercise price of each Tongaat Hulett option was apportioned between the Tongaat Hulett and Hulamin options with reference to the volume weighted average prices (VWAP) of both companies for the fi rst 22 trading days after the unbundling. The 22-day VWAPs were R93,89 and R29,04 respectively, with the expiry date being the same as that of the original options. The modifi cation did not result in any incremental fair value being granted to option holders.
No further awards to Hulamin employees will be made under these schemes.
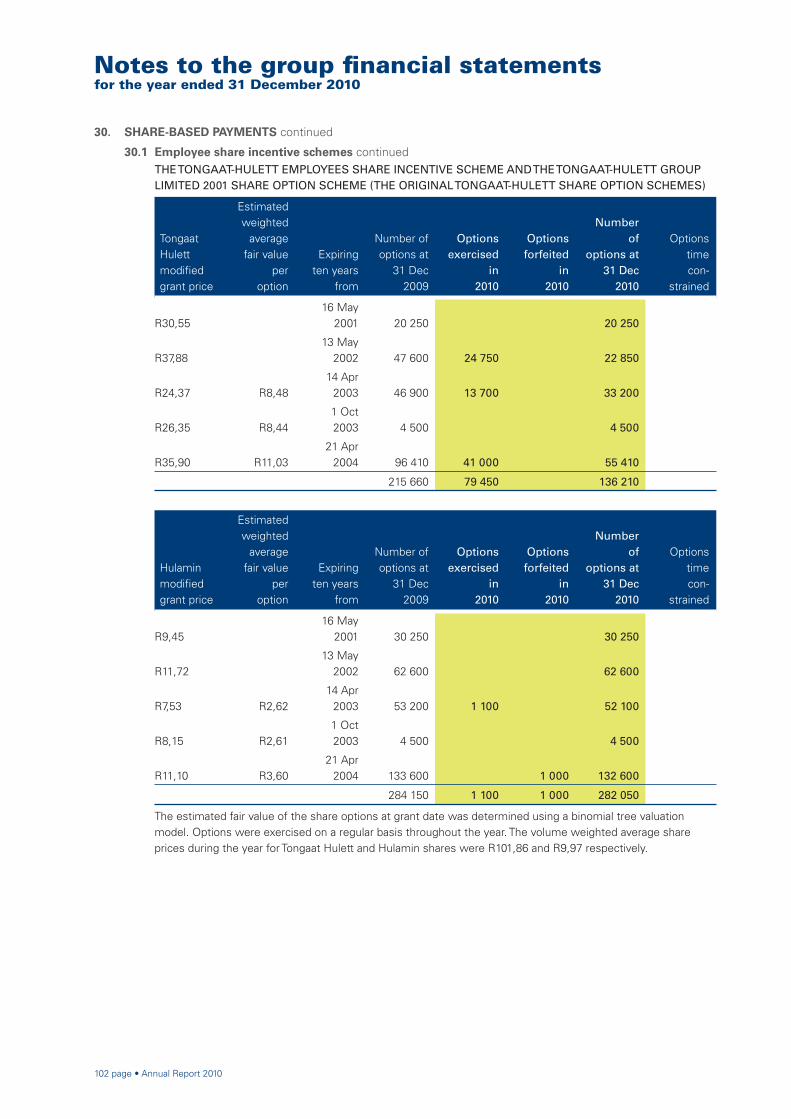
102 page • Annual Report 2010
Notes to the group fi nancial statementsfor the year ended 31 December 2010
30. SHARE-BASED PAYMENTS continued
30.1 Employee share incentive schemes continuedTHE TONGAAT-HULETT EMPLOYEES SHARE INCENTIVE SCHEME AND THE TONGAAT-HULETT GROUP LIMITED 2001 SHARE OPTION SCHEME (THE ORIGINAL TONGAAT-HULETT SHARE OPTION SCHEMES)
TongaatHulettmodifi edgrant price
Estimatedweighted
averagefair value
peroption
Expiringten years
from
Number ofoptions at
31 Dec2009
Optionsexercised
in2010
Optionsforfeited
in2010
Number of
options at31 Dec
2010
Optionstimecon-
strained
R30,5516 May
2001 20 250 20 250
R37,8813 May
2002 47 600 24 750 22 850
R24,37 R8,4814 Apr 2003 46 900 13 700 33 200
R26,35 R8,441 Oct 2003 4 500 4 500
R35,90 R11,0321 Apr 2004 96 410 41 000 55 410
215 660 79 450 136 210
Hulaminmodifi edgrant price
Estimatedweighted
averagefair value
peroption
Expiringten years
from
Number ofoptions at
31 Dec2009
Optionsexercised
in2010
Optionsforfeited
in2010
Number of
options at31 Dec
2010
Optionstime con-
strained
R9,4516 May
2001 30 250 30 250
R11,7213 May
2002 62 600 62 600
R7,53 R2,6214 Apr 2003 53 200 1 100 52 100
R8,15 R2,611 Oct 2003 4 500 4 500
R11,10 R3,6021 Apr 2004 133 600 1 000 132 600
284 150 1 100 1 000 282 050
The estimated fair value of the share options at grant date was determined using a binomial tree valuation model. Options were exercised on a regular basis throughout the year. The volume weighted average share prices during the year for Tongaat Hulett and Hulamin shares were R101,86 and R9,97 respectively.
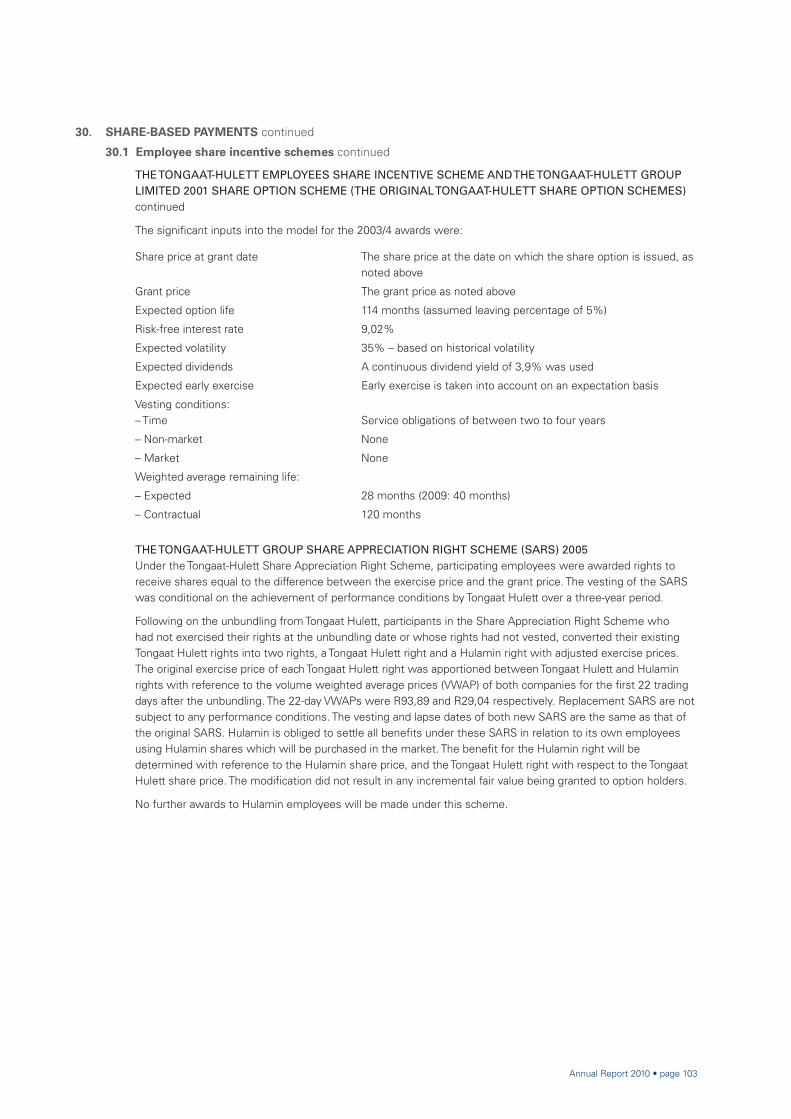
Annual Report 2010 • page 103
30. SHARE-BASED PAYMENTS continued
30.1 Employee share incentive schemes continued
THE TONGAAT-HULETT EMPLOYEES SHARE INCENTIVE SCHEME AND THE TONGAAT-HULETT GROUP LIMITED 2001 SHARE OPTION SCHEME (THE ORIGINAL TONGAAT-HULETT SHARE OPTION SCHEMES) continued
The signifi cant inputs into the model for the 2003/4 awards were:
Share price at grant date The share price at the date on which the share option is issued, as noted above
Grant price The grant price as noted above
Expected option life 114 months (assumed leaving percentage of 5%)
Risk-free interest rate 9,02%
Expected volatility 35% – based on historical volatility
Expected dividends A continuous dividend yield of 3,9% was used
Expected early exercise Early exercise is taken into account on an expectation basis
Vesting conditions: – Time Service obligations of between two to four years
– Non-market None
– Market None
Weighted average remaining life:
– Expected 28 months (2009: 40 months)
– Contractual 120 months
THE TONGAAT-HULETT GROUP SHARE APPRECIATION RIGHT SCHEME (SARS) 2005Under the Tongaat-Hulett Share Appreciation Right Scheme, participating employees were awarded rights to receive shares equal to the difference between the exercise price and the grant price. The vesting of the SARS was conditional on the achievement of performance conditions by Tongaat Hulett over a three-year period.
Following on the unbundling from Tongaat Hulett, participants in the Share Appreciation Right Scheme who had not exercised their rights at the unbundling date or whose rights had not vested, converted their existing Tongaat Hulett rights into two rights, a Tongaat Hulett right and a Hulamin right with adjusted exercise prices. The original exercise price of each Tongaat Hulett right was apportioned between Tongaat Hulett and Hulamin rights with reference to the volume weighted average prices (VWAP) of both companies for the fi rst 22 trading days after the unbundling. The 22-day VWAPs were R93,89 and R29,04 respectively. Replacement SARS are not subject to any performance conditions. The vesting and lapse dates of both new SARS are the same as that of the original SARS. Hulamin is obliged to settle all benefi ts under these SARS in relation to its own employees using Hulamin shares which will be purchased in the market. The benefi t for the Hulamin right will be determined with reference to the Hulamin share price, and the Tongaat Hulett right with respect to the Tongaat Hulett share price. The modifi cation did not result in any incremental fair value being granted to option holders.
No further awards to Hulamin employees will be made under this scheme.
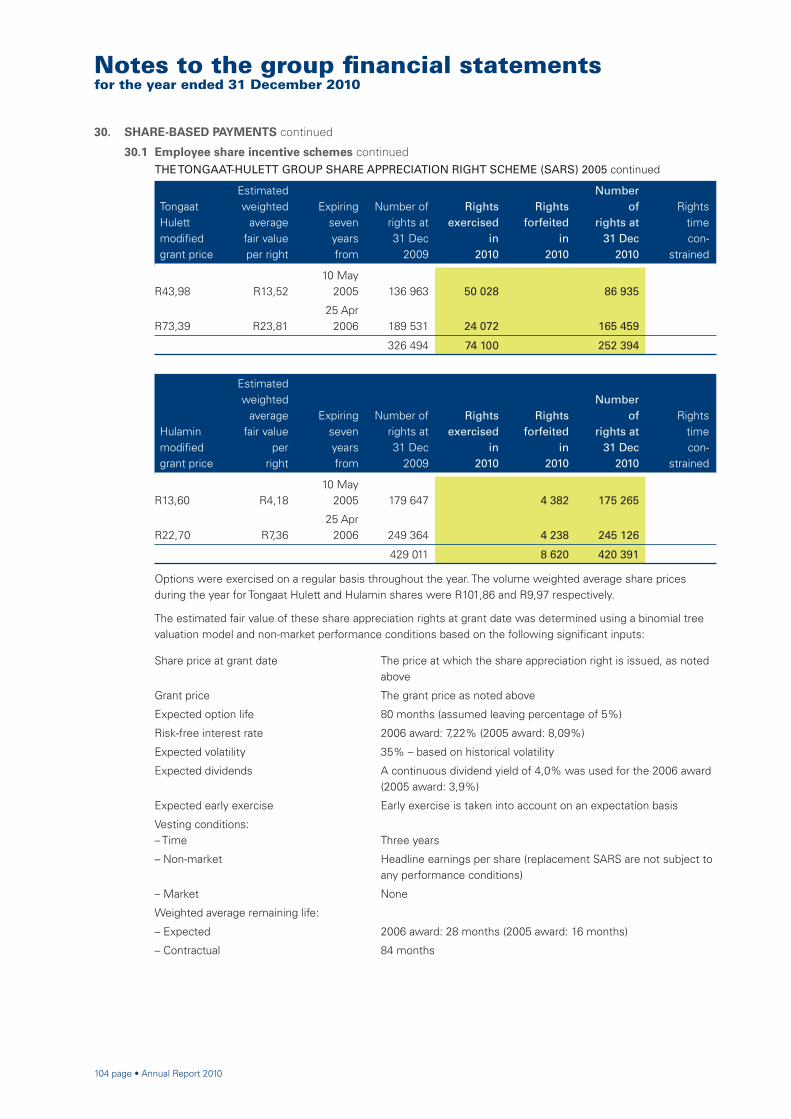
104 page • Annual Report 2010
Notes to the group fi nancial statementsfor the year ended 31 December 2010
30. SHARE-BASED PAYMENTS continued
30.1 Employee share incentive schemes continuedTHE TONGAAT-HULETT GROUP SHARE APPRECIATION RIGHT SCHEME (SARS) 2005 continued
TongaatHulettmodifi edgrant price
Estimatedweighted
averagefair valueper right
Expiringseven yearsfrom
Number ofrights at31 Dec
2009
Rightsexercised
in2010
Rightsforfeited
in2010
Number of
rights at31 Dec
2010
Rightstimecon-
strained
R43,98 R13,5210 May
2005 136 963 50 028 86 935
R73,39 R23,8125 Apr 2006 189 531 24 072 165 459
326 494 74 100 252 394
Hulaminmodifi edgrant price
Estimatedweighted
averagefair value
perright
Expiringseven yearsfrom
Number ofrights at31 Dec
2009
Rightsexercised
in2010
Rightsforfeited
in2010
Number of
rights at31 Dec
2010
Rightstime con-
strained
R13,60 R4,1810 May
2005 179 647 4 382 175 265
R22,70 R7,3625 Apr 2006 249 364 4 238 245 126
429 011 8 620 420 391
Options were exercised on a regular basis throughout the year. The volume weighted average share prices during the year for Tongaat Hulett and Hulamin shares were R101,86 and R9,97 respectively.
The estimated fair value of these share appreciation rights at grant date was determined using a binomial tree valuation model and non-market performance conditions based on the following signifi cant inputs:
Share price at grant date The price at which the share appreciation right is issued, as noted above
Grant price The grant price as noted above
Expected option life 80 months (assumed leaving percentage of 5%)
Risk-free interest rate 2006 award: 7,22% (2005 award: 8,09%)
Expected volatility 35% – based on historical volatility
Expected dividends A continuous dividend yield of 4,0% was used for the 2006 award(2005 award: 3,9%)
Expected early exercise Early exercise is taken into account on an expectation basis
Vesting conditions: – Time Three years
– Non-market Headline earnings per share (replacement SARS are not subject to any performance conditions)
– Market None
Weighted average remaining life:
– Expected 2006 award: 28 months (2005 award: 16 months)
– Contractual 84 months

Annual Report 2010 • page 105
30. SHARE-BASED PAYMENTS continued
30.1 Employee share incentive schemes continuedHULAMIN LIMITED SHARE APPRECIATION RIGHT SCHEME 2007Under the Share Appreciation Right Scheme, participating employees are awarded the right to receive shares equal to the difference between the exercise price and the grant price.
The vesting of the right is conditional on the achievement by Hulamin of performance condition over a three-year period.
Grant price
Estimatedweighted
averagefair valueper right
Expiringseven yearsfrom
Number ofrights at31 Dec
2009
Rightsgranted in
2010
Rightsforfeited
in2010
Number of
rights at31 Dec
2010
Rightstimecon-
strained
R22,87 R9,7220 Aug
2007 1 514 500 18 000 1 496 500
R21,99 R8,9130 Apr 2008 1 960 951 59 149 1 901 802 1 901 802
R11,50 R4,7624 Jul 2009 4 278 523 109 009 4 169 514 4 169 514
R8,60 R3,061 Nov 2010 5 514 943 5 514 943 5 514 943
7 753 974 5 514 943 186 158 13 082 759 11 586 259
The estimated fair value of these share appreciation rights at grant date was determined using a binomial tree valuation model, based on the following signifi cant inputs:
Share price at grant date 2010 award: R8,60 (2009 award: R13,05; 2008 award: R21,90; 2007 award: R23,51)
Grant price The grant price as noted above
Risk-free interest rate 2010 award: 7,08% (2009 award: 8,73%; 2008 award: 9,18%; 2007 award: 8,19%)
Expected volatility 2010 award: 39,21% (2009 award: 41,80%; 2008 award: 38,59%; 2007 award: 34,25%)
Expected dividends 2010 award: 4,25% (2009 award: 6,54%; 2008 award: 3,44%; 2007 award: 2,3%)
Vesting conditions:
– Time Three years
– Non-market An increase in Hulamin Limited headline earnings per ordinary share as determined by the Remuneration Committee. Retesting of the performance condition is allowed in respect of the 2007, 2008 and 2009 grants.
– Market None
Weighted average remaining life:
– Expected 2010 award: 82 months (2009 award: 67 months; 2008 award: 52 months; 2007 award: 44 months)
– Contractual 84 months

106 page • Annual Report 2010
30. SHARE-BASED PAYMENTS continued
30.1 Employee share incentive schemes continued
HULAMIN LIMITED LONG TERM INCENTIVE SCHEME 2007Under the long-term incentive plan, participating employees are granted conditional awards. These awards are converted into shares in Hulamin on the achievement of ROCE and TSR performance conditions over a three-year period.
Issue price
Estimatedweighted
averagefair value
per award
Expiringthree
yearsfrom
Number ofawards at
31 Dec2009
Con-ditionalawards
exercisedin
2010
Con-ditional awardsgranted
in2010
Number of
con-ditional
awards at31 Dec
2010
Conditional awards
timecon-
strained
R23,51 R15,3920 Aug
2007 232 500 232 500
R21,90 R13,9830 Apr 2008 300 661 300 661 300 661
R13,05 R4,0824 Jul 2009 751 713 11 034* 740 679 740 679
R8,60 R4,661 Nov 2010 926 301 926 301 926 301
1 284 874 243 534 926 301 1 967 641 1 967 641
* Due to termination of employment.
Notes to the group fi nancial statementsfor the year ended 31 December 2010
The estimated fair value of these conditional share awards at the grant date was determined using a Monte Carlo Simulation model, based on the following signifi cant inputs:
Share price at grant date 2010 award: R8,60 (2009 award: R13,05; 2008 award: R21,90: 2007 award: R23,51)
Risk-free interest rate 2010 award: 6,14% (2009 award: 8,31%; 2008 award: 9,74%; 2007 award: 8,94%)
Expected volatility 2010 award: 39,61% (2009 award: 41,42%; 2008 award: 38,59%; 2007 award: 34,25%)
Expected dividends 2010 award: 1,68% (2009 award: 3,35%; 2008 award: 3,44%; 20007 award: 2,3%)
Vesting conditions:
– Time Three years
– Non-market Return on capital employed (ROCE)
– Market Total shareholder return (TSR)
Weighted average remaining life:
– Expected 2010 award: 34 months (2009 award: 19 months; 2008 award: 4 months)
– Contractual 36 months
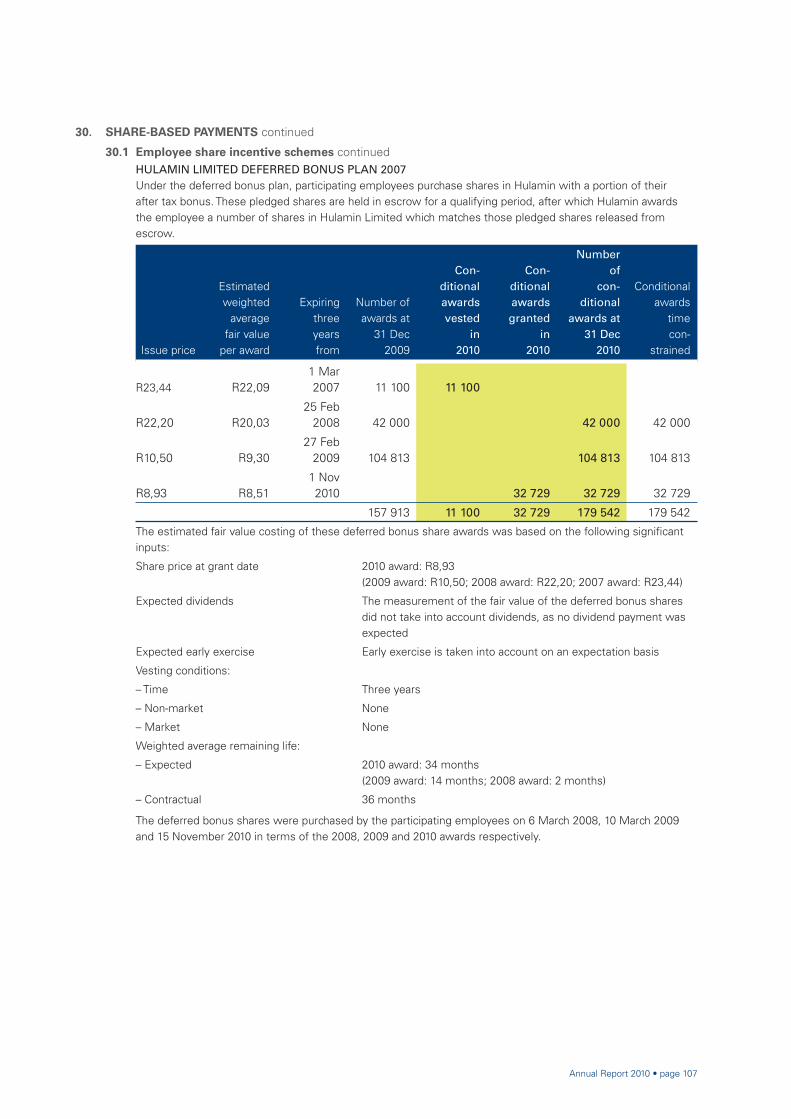
Annual Report 2010 • page 107
30. SHARE-BASED PAYMENTS continued
30.1 Employee share incentive schemes continuedHULAMIN LIMITED DEFERRED BONUS PLAN 2007 Under the deferred bonus plan, participating employees purchase shares in Hulamin with a portion of their after tax bonus. These pledged shares are held in escrow for a qualifying period, after which Hulamin awards the employee a number of shares in Hulamin Limited which matches those pledged shares released from escrow.
Issue price
Estimatedweighted
averagefair value
per award
Expiringthree
yearsfrom
Number ofawards at
31 Dec2009
Con-ditionalawardsvested
in2010
Con-ditional awardsgranted
in2010
Number of
con-ditional
awards at31 Dec
2010
Conditional awards
timecon-
strained
R23,44 R22,091 Mar 2007 11 100 11 100
R22,20 R20,0325 Feb
2008 42 000 42 000 42 000
R10,50 R9,3027 Feb 2009 104 813 104 813 104 813
R8,93 R8,511 Nov 2010 32 729 32 729 32 729
157 913 11 100 32 729 179 542 179 542
The estimated fair value costing of these deferred bonus share awards was based on the following signifi cant inputs:
Share price at grant date 2010 award: R8,93 (2009 award: R10,50; 2008 award: R22,20; 2007 award: R23,44)
Expected dividends The measurement of the fair value of the deferred bonus shares did not take into account dividends, as no dividend payment was expected
Expected early exercise Early exercise is taken into account on an expectation basis
Vesting conditions:
– Time Three years
– Non-market None
– Market None
Weighted average remaining life:
– Expected 2010 award: 34 months (2009 award: 14 months; 2008 award: 2 months)
– Contractual 36 months
The deferred bonus shares were purchased by the participating employees on 6 March 2008, 10 March 2009 and 15 November 2010 in terms of the 2008, 2009 and 2010 awards respectively.
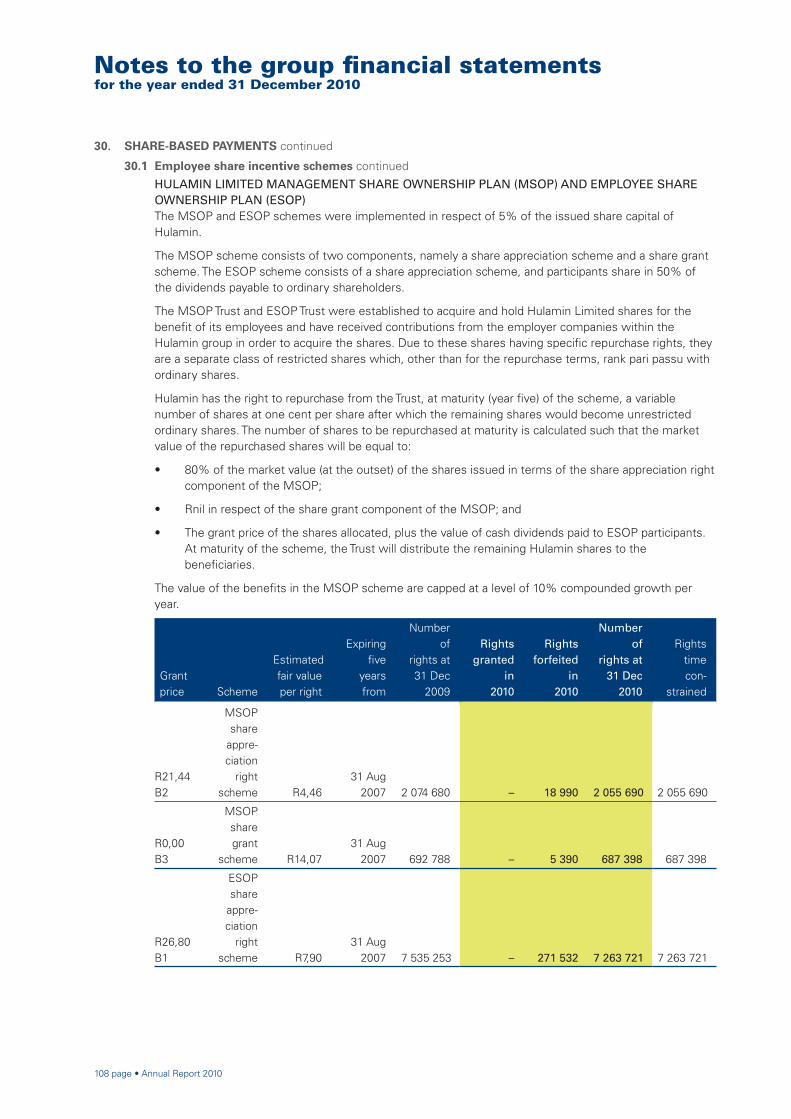
108 page • Annual Report 2010
30. SHARE-BASED PAYMENTS continued
30.1 Employee share incentive schemes continued
HULAMIN LIMITED MANAGEMENT SHARE OWNERSHIP PLAN (MSOP) AND EMPLOYEE SHARE OWNERSHIP PLAN (ESOP)
The MSOP and ESOP schemes were implemented in respect of 5% of the issued share capital of Hulamin.
The MSOP scheme consists of two components, namely a share appreciation scheme and a share grant scheme. The ESOP scheme consists of a share appreciation scheme, and participants share in 50% of the dividends payable to ordinary shareholders.
The MSOP Trust and ESOP Trust were established to acquire and hold Hulamin Limited shares for the benefi t of its employees and have received contributions from the employer companies within the Hulamin group in order to acquire the shares. Due to these shares having specifi c repurchase rights, they are a separate class of restricted shares which, other than for the repurchase terms, rank pari passu with ordinary shares.
Hulamin has the right to repurchase from the Trust, at maturity (year fi ve) of the scheme, a variable number of shares at one cent per share after which the remaining shares would become unrestricted ordinary shares. The number of shares to be repurchased at maturity is calculated such that the market value of the repurchased shares will be equal to:
• 80% of the market value (at the outset) of the shares issued in terms of the share appreciation right component of the MSOP;
• Rnil in respect of the share grant component of the MSOP; and
• The grant price of the shares allocated, plus the value of cash dividends paid to ESOP participants. At maturity of the scheme, the Trust will distribute the remaining Hulamin shares to the benefi ciaries.
The value of the benefi ts in the MSOP scheme are capped at a level of 10% compounded growth per year.
Notes to the group fi nancial statementsfor the year ended 31 December 2010
Grant price Scheme
Estimatedfair valueper right
Expiringfi ve
yearsfrom
Number of
rights at31 Dec
2009
Rightsgranted
in2010
Rights forfeited
in2010
Number of
rights at31 Dec
2010
Rightstimecon-
strained
R21,44B2
MSOP share
appre-ciation
right scheme R4,46
31 Aug 2007 2 074 680 – 18 990 2 055 690 2 055 690
R0,00B3
MSOPshare grant
scheme R14,0731 Aug
2007 692 788 – 5 390 687 398 687 398
R26,80B1
ESOP share
appre-ciation
right scheme R7,90
31 Aug 2007 7 535 253 – 271 532 7 263 721 7 263 721
Annual Report 2010 • page 109
30. SHARE-BASED PAYMENTS continued
30.1 Employee share incentive schemes continued
HULAMIN LIMITED MANAGEMENT SHARE OWNERSHIP PLAN (MSOP) AND EMPLOYEE SHARE OWNERSHIP PLAN (ESOP) continued
The estimated fair value of these share appreciation rights and share grant rights at grant date was determined using the Black-Scholes call option valuation model, based on the following signifi cant inputs:
Share price at grant date R24,90
Grant price The grant price as noted above
Risk-free interest rate 8,11%
Expected volatility 30%. As Hulamin’s shares have only recently been listed, the valuations of appropriate proxy companies were used to estimate the expected Hulamin share price volatility
Expected dividends A dividend yield of 2,3% was used
Attrition rate 4,18% per annum
Vesting conditions:
– Time Five years
– Non-market None
– Market None
Weighted average remaining life:
– Expected 20 months
– Contractual 60 months
30.2 BEE equity transaction During the 2007 fi nancial year, Hulamin concluded agreements with BEE partners to facilitate the acquisition of
an effective 10% interest in Hulamin.
The BEE partners have subscribed for 10% of the share capital of Hulamin Operations (Pty) Limited (OPCO) at a cost of R37,5 million and for 25 million A class shares in Hulamin at a cost of R2,5 million. The BEE partners will be entitled to exchange their OPCO shares for shares of an equivalent value in Hulamin seven years after the grant date, and on surrender of the A class shares. For accounting purposes the fair value of the transaction at grant date of R134 686 000, which was expensed in full in the 2007 fi nancial year, has been determined using a Monte Carlo simulation model based on the following signifi cant inputs:
Share price at grant date R34,10
Grant date 11 June 2007
Expected option life Seven years
Lock-in period Further three years
Risk-free interest rate Forward swap curve
Expected volatility 30%. As Hulamin’s shares had only listed a short time before grant date, the valuations of appropriate proxy companies were used to estimate the expected Hulamin share price volatility.
Expected dividends A dividend yield of 2,3% was used

110 page • Annual Report 2010
Notes to the group fi nancial statementsfor the year ended 31 December 2010
31. DETAILS OF INVESTMENTS IN ASSOCIATES, SUBSIDIARY COMPANIES AND JOINT VENTURES
The fi nancial statements of the group include the fi nancial statements of the company and the associates, subsidiary companies and joint ventures listed in the following table:
Name Country of incorporation
Percentageequity
interest2010
Percentageequity
interest2009
Subsidiaries
Hulamin Rolled Products (Pty) Limited* South Africa 100 100
Hulamin Systems (Pty) Limited* South Africa 100 100
Hulamin Operations (Pty) Limited South Africa 90 90
Hulamin Extrusions (Pty) Limited* South Africa 100 100
Hulamin North America LLC* United States of America 100 100
* Subsidiaries of Hulamin Operations (Pty) Limited.
All the investments are unlisted.
Associates and joint ventures
Almin Metal Industries Limited** Zimbabwe 49 49
Richards and Barlow (Pty) Limited*** South Africa 50 50
Cyndara 193 (Pty) Limited, trading as Hulamin Building Systems*** South Africa 50 50
** Investment held by Hulamin Extrusions (Pty) Limited.*** Investments held by Hulamin Operations (Pty) Limited.
All the investments are unlisted.
Almin Metal Industries operates under severe long term restrictions on the transfer of funds to the company andhas been fully impaired. Therefore, information in respect of its assets, liabilities, revenues and profi t or loss has not been disclosed in note 4.
Special purpose vehiclesThe following special purpose vehicles have also been consolidated:
– Hulamin Employee Share Ownership Trust;– Hulamin Management Share Ownership Trust; and– Chaldean Trading 67 (Pty) Limited.

Annual Report 2010 • page 111
Financial risk management
1. FINANCIAL RISK FACTORS
The group’s activities expose it to a variety of fi nancial risks: market risk, credit risk and liquidity risk. The group’s fi nancial risk management programme focuses on the unpredictability of fi nancial markets and seeks to minimise potential adverse effects on the group’s fi nancial performance, and uses derivative fi nancial instruments to hedge certain risk exposures.
Hedging is carried out by a central treasury department (group treasury) under policies approved by the board of directors, and in close co-operation with the group’s operating units.
1.1 Market risk
Foreign exchange risk
The group operates internationally and is exposed to foreign exchange risk arising from various currency exposures, primarily with respect to the US Dollar.
Foreign exchange risk arises from future commercial transactions or recognised assets or liabilities that are denominated in a currency that is not the group’s functional currency, which is South African Rand. The group’s risk management policy is to hedge its currency exposure related to import transactions, foreign currency liabilities, foreign currency assets and export transactions. Aluminium purchases and sales are determined with reference to the US Dollar and it is the group’s policy to hedge all currency exposure on aluminium, while the value added portion of export transactions is hedged from invoice date. The group uses foreign exchange contracts, transacted with commercial banks, to manage these risks.
For every 5% weakening or strengthening of the South African Rand against the US Dollar at 31 December, the after tax profi t for the year would have been higher or lower by R2 347 000 (2009: R2 988 000) based on the group’s exposure at the balance sheet date. The sensitivity of profi ts to changes in exchange rates is a result of foreign exchange gains/losses on translation of US Dollar-denominated trade receivables and payables and fi nancial assets and liabilities at fair value through profi t or loss that are offset by equivalent gains/losses in currency derivatives. Profi t is no more sensitive to movements in currency exchange rates in 2010 than in 2009, as all foreign currency denominated assets and liabilities are hedged through foreign exchange contracts. The above change in currency exchange rates would result in equity being lower or higher by R34 520 000 (2009: R28 280 000). The change in equity is mainly from foreign exchange losses/gains on translation of US Dollar-denominated cash fl ow hedging instruments.
Commodity price risk
The group purchases and sells aluminium at prices that fl uctuate with movements in prices on the London Metal Exchange and is thus exposed to commodity price risk. This commodity price risk is hedged by futures contracts.
For every 5% weakening or strengthening of the price of aluminium at 31 December, the effect on after tax profi t for year would have been lower or higher by R592 000 (2009: R704 000) based on the group’s exposure at the balance sheet date. The sensitivity of profi ts to changes in aluminium prices is a result of commodity price gains/losses on aluminium futures contracts that were all hedge accounted in 2010 and 2009. For this reason profi t is no more sensitive to movement in commodity prices in 2010 than 2009. The above change in aluminium prices would have no effect on equity as all futures contracts were part of fair value hedges (2009: lower or higher by R3 261 000). The change in 2009 equity is mainly from gains/losses on cash-fl ow hedging instruments.
Interest rate risk
The group has no signifi cant interest-bearing assets and interest rate risk is solely related to borrowings. The group’s borrowings bear interest at variable rates and it had fi xed the interest rate on R600 000 000 (2009: R600 000 000) of these borrowings through interest rate swaps that matured on 31 December 2010 and which were accounted for as a cash fl ow hedge. Consequently, every 0,5 percentage point increase or decrease in the interest rate at 31 December would have no fair value effect on after tax profi t (2009: nil) and no effect on equity (2009: increase or decrease by R846 000).
The group is also exposed to future cash fl ow risks on borrowings. Had interest rates for the year been 0,5 percentage points higher or lower and been applied to the period end net debt, the interest expense for the year would have been higher or lower by R4 792 000 (2009: R4 127 000).
The group analyses the impact on profi t and loss of defi ned interest rate shifts – taking into consideration refi nancing, renewal of existing positions, alternative fi nancing and hedging. The analysis is only for liabilities that represent the major interest-bearing positions.

112 page • Annual Report 2010
1. FINANCIAL RISK FACTORS continued 1.2 Credit risk Credit risk arises from cash and cash equivalents, derivative fi nancial instruments and deposits with banks and
fi nancial institutions, as well as credit exposures to customers, including outstanding receivables and committed transactions. All deposits are held with major South African banks and all foreign exchange and interest rate hedging transactions are undertaken with these banks. All aluminium futures are undertaken with major London Metal Exchange broker companies.
Creditworthiness of local trade debtors is assessed when credit is fi rst extended and is reviewed on a monthly basis thereafter. This assessment establishes credit limits that, where felt necessary, are supplemented by credit insurance. 90% of the invoice value of all export trade debtors is covered by insurance.
Quantitative data on credit risk is disclosed in the notes to the annual fi nancial statements on derivative fi nancial instruments (note 8) and trade and other receivables (note 7).
1.3 Liquidity risk Prudent liquidity risk management implies maintaining suffi cient cash, the availability of funding through
an adequate amount of committed credit facilities and the ability to close out market positions. Due to the dynamic nature of the underlying businesses, fl exibility in funding is maintained through ensuring availability under committed credit lines. Management monitors rolling forecasts of the group’s liquidity reserve, being the excess of available facilities over forecast net borrowings.
The group’s facility utilisation at the period end was:
Note2010
R’0002009
R’000
Total borrowing facilities 1 180 933 1 605 000
Less:
Non-current borrowings 11 (627 759) (763 496)
Current borrowings 15 (355 077) (709 822)
Add:
Bank balances 9 23 698 63 742
Committed undrawn facilities 221 795 195 424
The total borrowing facilities comprise fi nance leases of R0,9 million and long-term facilities of R630 million (with repayment profi les as set out in note 11 to the fi nancial statements) and a general short-term facility of R550 million.
Financial liabilities with contractual maturity dates beyond a year from 31 December 2010 comprise long-term borrowings. Financial liabilities with maturity dates less than one year comprise current borrowings, trade and other payables, sundry accruals and derivative liabilities.
The table below summarises the maturity profi le of the group’s fi nancial liabilities based on contractual undiscounted payments:
Financial risk managementcontinued
360days
noticeR’000
Lessthan
one yearR’000
One totwo
yearsR’000
Two tothreeyearsR’000
Three tofour
yearsR’000
Greaterthan four
yearsR’000
TotalR’000
2010Non-current borrowings 53 036 52 427 126 054 119 966 505 943 857 426Current borrowings 302 000 52 283 354 283Trade and other payables (excluding employee benefi t accruals) 550 071 550 071Derivative fi nancial liabilities 44 686 44 686
302 000 700 076 52 427 126 054 119 966 505 943 1 806 466
2009Non-current borrowings 173 356 164 426 155 447 690 036 1 183 265Current borrowings 544 000 165 822 709 822Trade and other payables (excluding employee benefi t accruals) 526 868 526 868Derivative fi nancial liabilities 70 363 70 363
544 000 763 053 173 356 164 426 155 447 690 036 2 490 318
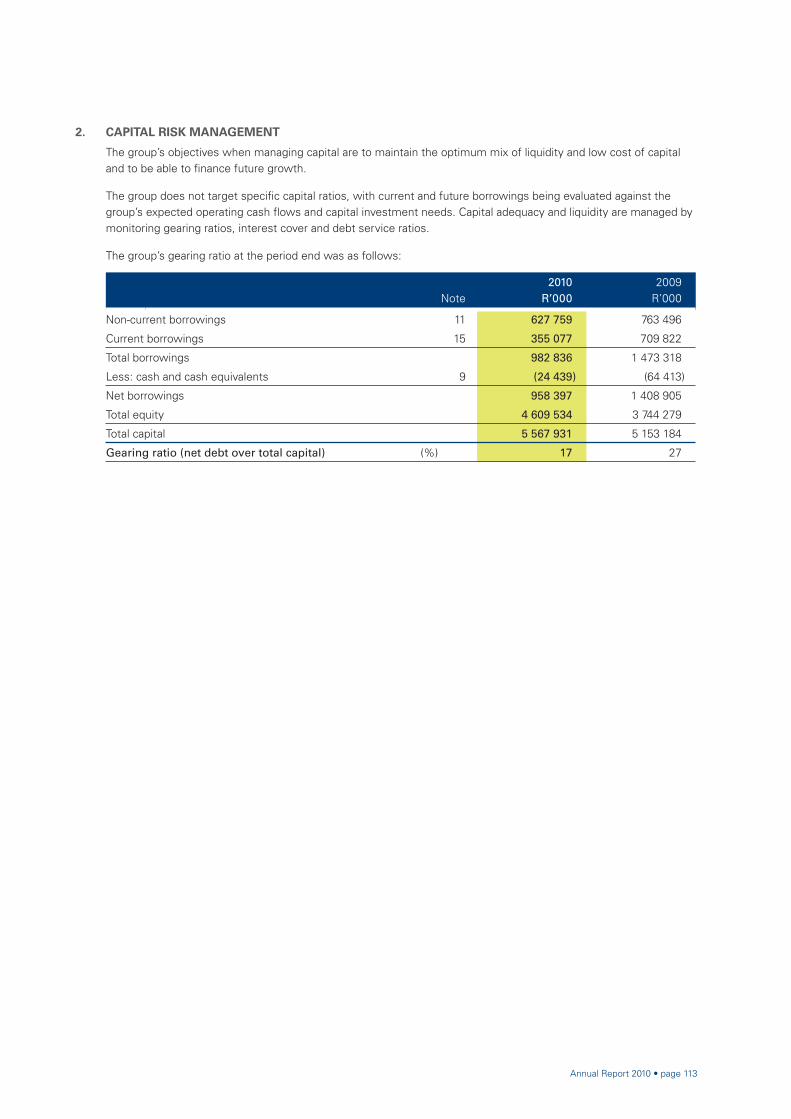
Annual Report 2010 • page 113
2. CAPITAL RISK MANAGEMENT
The group’s objectives when managing capital are to maintain the optimum mix of liquidity and low cost of capital and to be able to fi nance future growth.
The group does not target specifi c capital ratios, with current and future borrowings being evaluated against the group’s expected operating cash fl ows and capital investment needs. Capital adequacy and liquidity are managed by monitoring gearing ratios, interest cover and debt service ratios.
The group’s gearing ratio at the period end was as follows:
Note2010
R’0002009
R’000
Non-current borrowings 11 627 759 763 496
Current borrowings 15 355 077 709 822
Total borrowings 982 836 1 473 318
Less: cash and cash equivalents 9 (24 439) (64 413)
Net borrowings 958 397 1 408 905
Total equity 4 609 534 3 744 279
Total capital 5 567 931 5 153 184
Gearing ratio (net debt over total capital) (%) 17 27

114 page • Annual Report 2010
Company balance sheetas at 31 December 2010
Note2010
R’0002009
R’000
ASSETS
Non-current assets
Investment in subsidiaries 1 4 293 117 3 490 626
Deferred tax asset 2 12 935 12 208
Total assets 4 306 052 3 502 834
Current assets
Trade and other receivables 943 –
Total assets 4 306 995 3 502 834
EQUITY
Share capital and share premium 3 1 820 613 1 084 338
BEE reserve 134 686 134 686
Employee share-based payment reserve 91 219 74 097
Retained earnings 2 207 443 2 163 832
Total equity 4 253 961 3 456 953
LIABILITIES
Non-current liabilities
Retirement benefi t obligations 4 46 198 43 601
46 198 43 601
Current liabilities
Income tax liability 1 472 2 280
Trade and other payables 5 364 –
6 836 2 280
Total liabilities 53 034 45 881
Total equity and liabilities 4 306 995 3 502 834
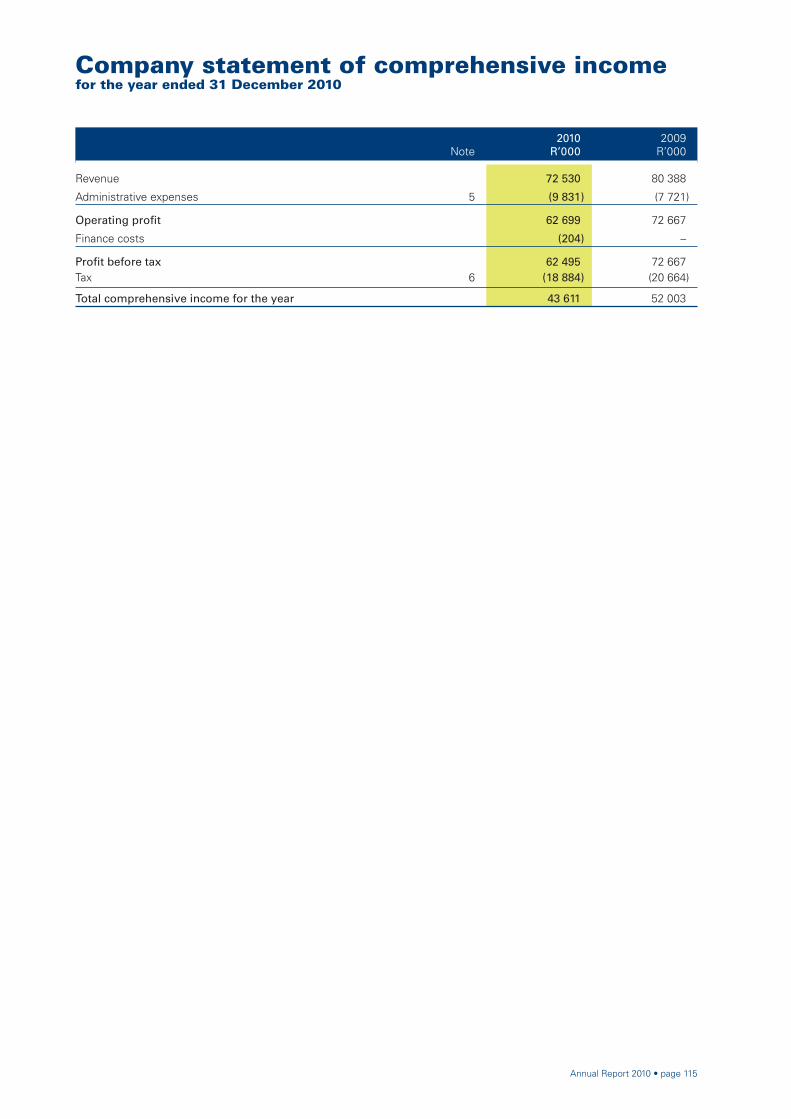
Annual Report 2010 • page 115
Note2010
R’0002009
R’000
Revenue 72 530 80 388
Administrative expenses 5 (9 831) (7 721)
Operating profi t 62 699 72 667
Finance costs (204) –
Profi t before tax 62 495 72 667Tax 6 (18 884) (20 664)
Total comprehensive income for the year 43 611 52 003
Company statement of comprehensive incomefor the year ended 31 December 2010

116 page • Annual Report 2010
SharecapitalR’000
Sharepremium
R’000
Employeeshare-based
paymentreserve
R’000
BEEreserve
R’000
Retainedearnings
R’000
Share-holders’interest
R’000
Minority interest
R’000
TotalequityR’000
Balance at 31 December 2008 25 209 1 057 490 48 933 134 686 2 140 366 3 406 684 – 3 406 684
Total comprehensive incomefor the year – – – – 52 003 52 003 – 52 003
Shares issued 45 1 594 –- – – 1 639 – 1 639
Value of employee services of subsidiaries – – 29 492 – – 29 492 – 29 492
Settlement of employee share incentives – – (4 328) – – (4 328) – (4 328)
Dividends paid – – – – (28 537) (28 537) – (28 537)
Balance at 31 December 2009 25 254 1 059 084 74 097 134 686 2 163 832 3 456 953 – 3 456 953
Total comprehensive income for the year – – – – 43 611 43 611 – 43 611
Shares issued 10 059 726 216 – – – 736 275 – 736 275
Value of employee services of subsidiaries – – 20 355 – – 20 355 – 20 355
Settlement of employee share incentives – – (3 233) – – (3 233) – (3 233)
Balance at 31 December 2010 35 313 1 785 300 91 219 134 686 2 207 443 4 253 961 – 4 253 961
Company statement of changes in equityfor the year ended 31 December 2010
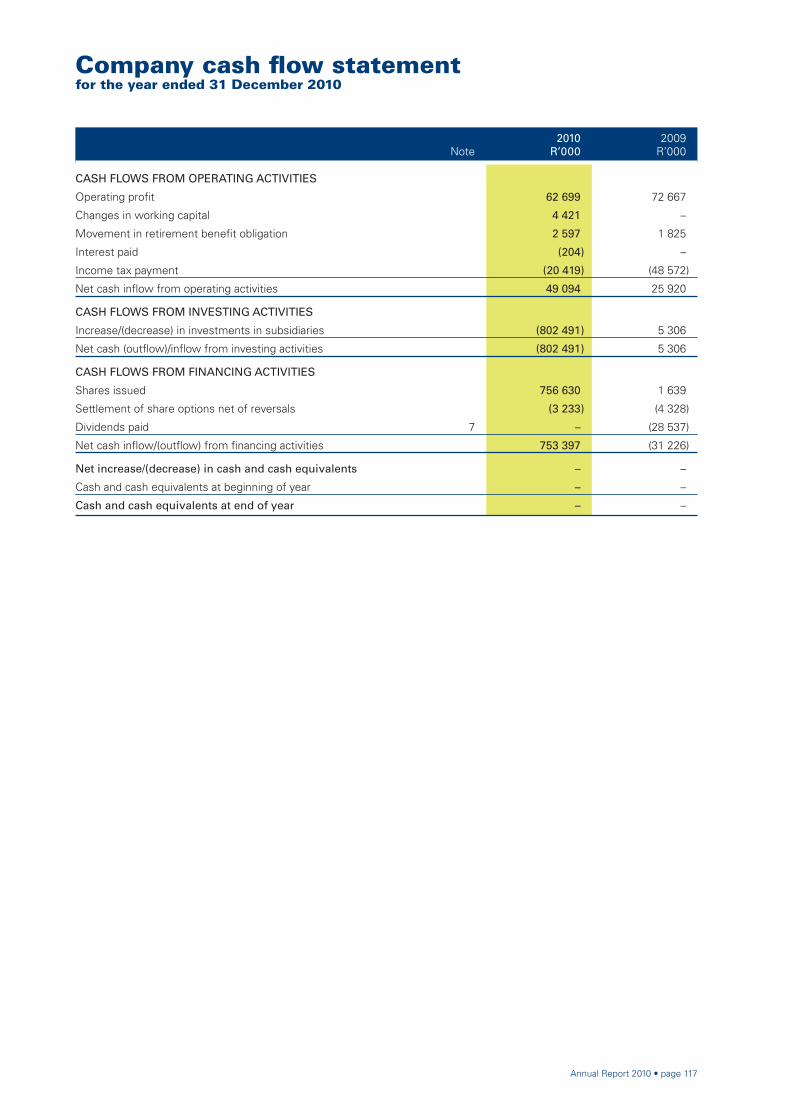
Annual Report 2010 • page 117
Company cash fl ow statementfor the year ended 31 December 2010
Note2010
R’0002009
R’000
CASH FLOWS FROM OPERATING ACTIVITIES
Operating profi t 62 699 72 667
Changes in working capital 4 421 –
Movement in retirement benefi t obligation 2 597 1 825
Interest paid (204) –
Income tax payment (20 419) (48 572)
Net cash infl ow from operating activities 49 094 25 920
CASH FLOWS FROM INVESTING ACTIVITIES
Increase/(decrease) in investments in subsidiaries (802 491) 5 306
Net cash (outfl ow)/infl ow from investing activities (802 491) 5 306
CASH FLOWS FROM FINANCING ACTIVITIES
Shares issued 756 630 1 639
Settlement of share options net of reversals (3 233) (4 328)
Dividends paid 7 – (28 537)
Net cash infl ow/(outfl ow) from fi nancing activities 753 397 (31 226)
Net increase/(decrease) in cash and cash equivalents – –
Cash and cash equivalents at beginning of year – –
Cash and cash equivalents at end of year – –
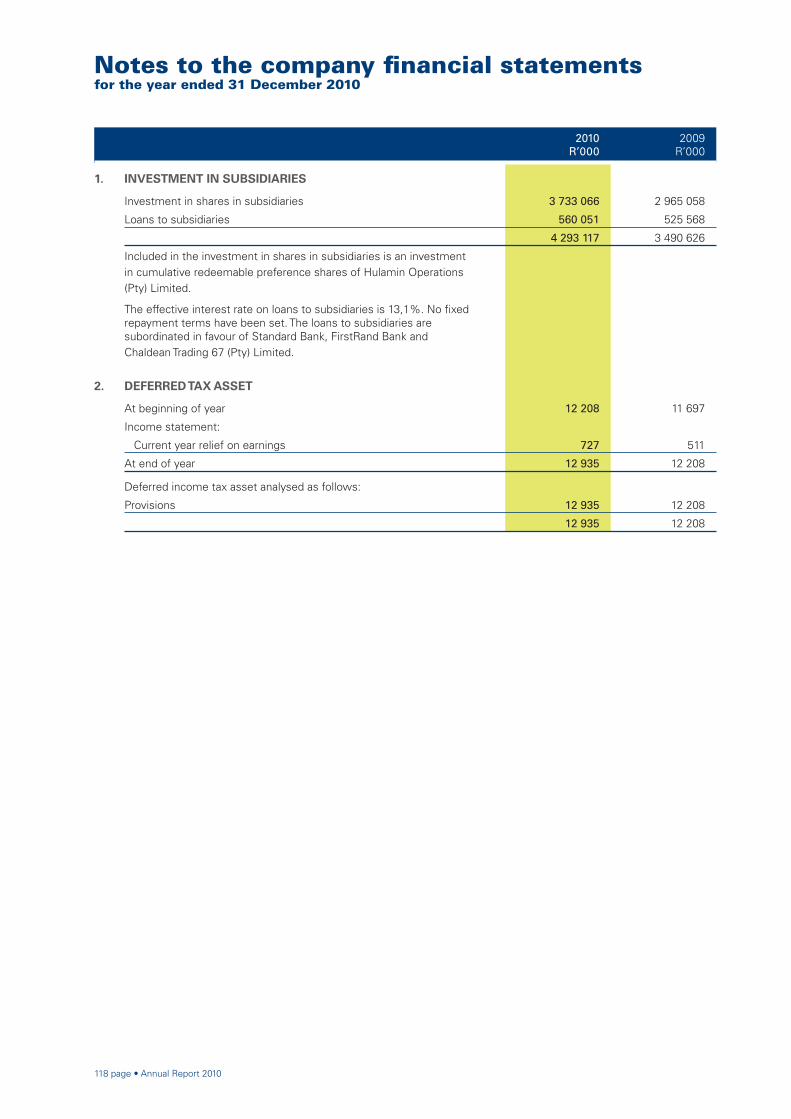
118 page • Annual Report 2010
Notes to the company fi nancial statementsfor the year ended 31 December 2010
2010R’000
2009R’000
1. INVESTMENT IN SUBSIDIARIES
Investment in shares in subsidiaries 3 733 066 2 965 058
Loans to subsidiaries 560 051 525 568
4 293 117 3 490 626
Included in the investment in shares in subsidiaries is an investment in cumulative redeemable preference shares of Hulamin Operations (Pty) Limited.
The effective interest rate on loans to subsidiaries is 13,1%. No fi xed repayment terms have been set. The loans to subsidiaries are subordinated in favour of Standard Bank, FirstRand Bank and Chaldean Trading 67 (Pty) Limited.
2. DEFERRED TAX ASSET
At beginning of year 12 208 11 697
Income statement:
Current year relief on earnings 727 511
At end of year 12 935 12 208
Deferred income tax asset analysed as follows:
Provisions 12 935 12 208
12 935 12 208

Annual Report 2010 • page 119
2010R’000
2009R’000
3. SHARE CAPITAL
3.1 Authorised
800 000 000 ordinary shares of 10 cents each(2009: 240 000 000 ordinary shares of 10 cents each) 80 000 24 000
34 000 000 A ordinary shares of 10 cents each(2009: 34 000 000 A ordinary shares of 10 cents each) 3 400 3 400
21 000 000 B ordinary shares of 10 cents each(2009: 21 000 000 B ordinary shares of 10 cents each) 2 100 2 100
Total authorised share capital 85 500 29 500
The B ordinary shares consist of 8 000 000 B1 shares, 10 000 000 B2 shares and 3 000 000 B3 shares.
3.2 Issued
Opening balance (252 541 066 ordinary shares of 10 cents each)(2009: 252 090 090 ordinary shares of 10 cents each) 25 254 25 209
Issued during year (100 590 285 ordinary shares of 10 cents each)(2009: 450 976 ordinary shares of 10 cents each) 10 059 45
Closing balance (353 131 351 ordinary shares of 10 cents each)(2009: 252 541 066 ordinary shares of 10 cents each) 35 313 25 254
Share premium
Opening balance 1 059 084 1 057 490
Premium on shares issued 726 216 1 594
Closing balance 1 785 300 1 059 084
Share capital and share premium 1 820 613 1 084 338
3.3 A ordinary shares and B ordinary shares
The A ordinary shares and B ordinary shares are unlisted and carry full voting rights. The A ordinary shares have no entitlements to any dividends other than shareholder distributions.
3.4 Unissued
Under option to employees: In terms of the Tongaat-Hulett Employees Share Incentive Scheme and The Tongaat-Hulett Group Limited 2001 Share Option Scheme, employees of the subsidiaries of the company have been granted options to subscribe for 1 477 637 Hulamin shares. The weighted average exercise price for these options is R17,50 per share.
Details of the employee share incentive schemes are set out in note 31 of the group fi nancial statements.
Under the control of the directors: At 31 December 2010, 8 826 445 unissued ordinary shares (2009: 9 416 730) were under the control of the directors, for the purpose, inter alia, of existing employee share incentive schemes.
At 31 December 2010, 9 653 770 unissued B ordinary shares (2009: 9 653 777) were under the control of the directors, for the purpose of the Hulamin Employee Share Ownership Plan and the Hulamin Management Share Ownership Plan.

120 page • Annual Report 2010
2010R’000
2009R’000
4. RETIREMENT BENEFIT OBLIGATIONS
Post-retirement medical aid provision 46 198 43 601
46 198 43 601
The movement of these provisions is detailed in note 8.
5. EXPENSES BY NATURE
Post-retirement medical aid costs 7 444 6 360
Auditors’ remuneration (note 5.1) 141 120
Other costs 2 246 1 241
9 831 7 721
Classifi ed as:
Administrative expenses 9 831 7 721
9 831 7 721
5.1 Auditors’ remuneration
Audit fees 126 106
Expenses 15 14
141 120
5.2 Directors’ emoluments
Non-executives
Fees 1 677 1 504
1 677 1 504
6. TAX
South African normal taxation:
Current
Current year 18 283 20 662
Prior year under/(over) provision 1 328 (2 341)
Deferred
Current year (note 2) (727) (511)
Secondary tax on companies – 2 854
18 884 20 664
Normal rate of taxation (%) 28,0 28,0
Adjusted for:
Prior year adjustments (%) 2,1 (3,2)
Other adjustments (%) 0,1 (0,3)
STC (%) – 3,9
Effective rate of taxation (%) 30,2 28,4
7. DIVIDENDS
Final for 2009 year: nil (fi nal for 2008 year, paid 9 March 2009: 13 cents) – 28 537
Interim for current year: nil (2009: nil) – –
– 28 537
Notes to the company fi nancial statementsfor the year ended 31 December 2010
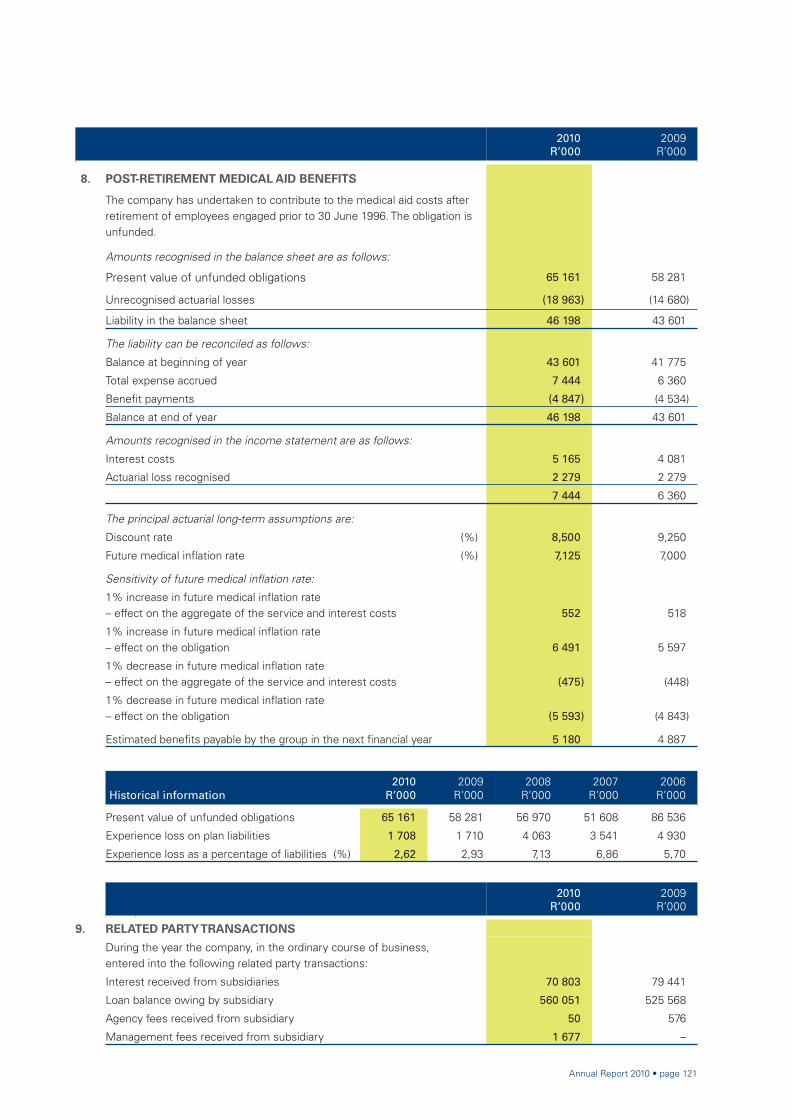
Annual Report 2010 • page 121
2010R’000
2009R’000
8. POST-RETIREMENT MEDICAL AID BENEFITS
The company has undertaken to contribute to the medical aid costs after retirement of employees engaged prior to 30 June 1996. The obligation is unfunded.
Amounts recognised in the balance sheet are as follows:
Present value of unfunded obligations 65 161 58 281
Unrecognised actuarial losses (18 963) (14 680)
Liability in the balance sheet 46 198 43 601
The liability can be reconciled as follows:
Balance at beginning of year 43 601 41 775
Total expense accrued 7 444 6 360
Benefi t payments (4 847) (4 534)
Balance at end of year 46 198 43 601
Amounts recognised in the income statement are as follows:
Interest costs 5 165 4 081
Actuarial loss recognised 2 279 2 279
7 444 6 360
The principal actuarial long-term assumptions are:
Discount rate (%) 8,500 9,250
Future medical infl ation rate (%) 7,125 7,000
Sensitivity of future medical infl ation rate:
1% increase in future medical infl ation rate – effect on the aggregate of the service and interest costs 552 518
1% increase in future medical infl ation rate – effect on the obligation 6 491 5 597
1% decrease in future medical infl ation rate – effect on the aggregate of the service and interest costs (475) (448)
1% decrease in future medical infl ation rate – effect on the obligation (5 593) (4 843)
Estimated benefi ts payable by the group in the next fi nancial year 5 180 4 887
Historical information2010
R’0002009
R’0002008
R’0002007
R’0002006
R’000
Present value of unfunded obligations 65 161 58 281 56 970 51 608 86 536
Experience loss on plan liabilities 1 708 1 710 4 063 3 541 4 930
Experience loss as a percentage of liabilities (%) 2,62 2,93 7,13 6,86 5,70
2010R’000
2009R’000
9. RELATED PARTY TRANSACTIONS
During the year the company, in the ordinary course of business,entered into the following related party transactions:
Interest received from subsidiaries 70 803 79 441
Loan balance owing by subsidiary 560 051 525 568
Agency fees received from subsidiary 50 576
Management fees received from subsidiary 1 677 –

122 page • Annual Report 2010
Analysis of ordinary shareholdersas at 31 December 2010
Number ofordinary
shareholdersPercentage
of total
Number ofordinary
sharesPercentage
of total
Size of holdings
1 – 1 000 3 432 50,84 1 084 035 0,34
1 001 – 10 000 2 555 37,84 8 378 136 2,65
10 001 – 100 000 540 8,00 14 919 573 4,71
100 001 – 1 000 000 180 2,67 55 376 594 17,48
Over 1 000 000 shares 44 0,65 237 026 783 74,82
6 751 100,00 316 785 121 100,00
Public/non-public shareholders
Non-public shareholders
Industrial Development Corporation 1 94 587 954 29,86
Directors 6 325 266 0,10
Associate of director 1 11 700 0,00
The Tongaat-Hulett Pension Fund 1 1 850 332 0,58
Total non-public shareholders 9 96 775 252 30,54
Public shareholders 6 742 220 009 869 69,46
Total listed shareholders 6 751 316 785 121 100,00
Number of ordinary
shareholdersPercentage
of totalNumber of
shares
Percentageof issued
shares
Benefi cial shareholders holding more than 5% of share capital
Industrial Development Corporation 1 94 587 954 29,86
Coronation Fund Managers 1 26 657 101 8,41
Government Employees Pension Fund 1 24 672 812 7,79
Metropolitan 1 20 329 560 6,42
Old Mutual 1 16 702 248 5,27
A class ordinary shares
Chaldean Trading 67 (Pty) Limited 1 100,00 25 000 000 100,00
B1 ordinary shares
Hulamin Employee Share Ownership Trust: No IT 645/2007/PMB
1 100,00 7 998 556 100,00
B2 ordinary shares
Hulamin Management Share Ownership Trust: No IT 644/2007/PMB
1 100,00 2 509 569 100,00
B3 ordinary shares
Hulamin Management Share Ownership Trust
1 100,00 838 105 100,00
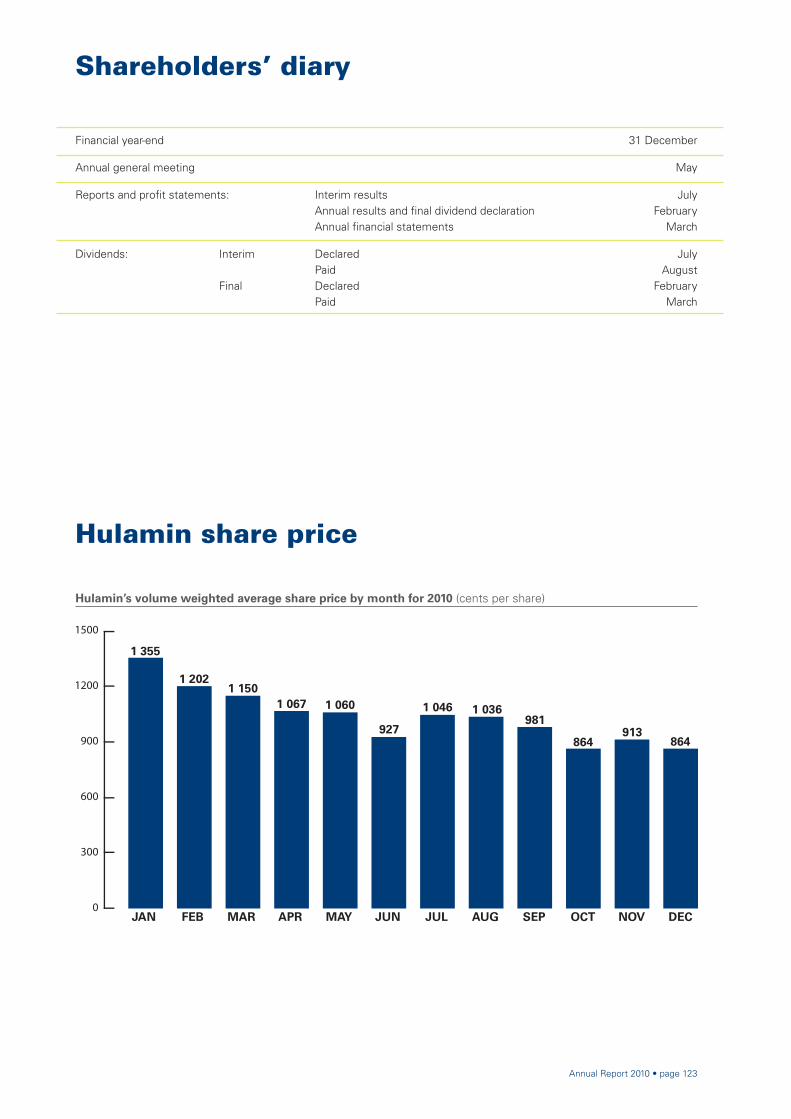
Annual Report 2010 • page 123
Shareholders’ diary
Financial year-end 31 December
Annual general meeting May
Reports and profi t statements: Interim results July Annual results and fi nal dividend declaration February Annual fi nancial statements March
Dividends: Interim Declared July Paid August Final Declared February Paid March
Hulamin share price
0
300
600
900
1200
1500
JAN FEB MAR APR MAY JUN JUL AUG SEP OCT NOV DEC
1 355
1 2021 150
1 067 1 060
927
1 046 1 036981
864913
864
Hulamin’s volume weighted average share price by month for 2010 (cents per share)

124 page • Annual Report 2010
Corporate information
Registration number: 1940/013924/06Share code: HLMISIN number: ZAE000096210
Business address
Moses Mabhida Road Pietermaritzburg 3201
Postal address
PO Box 74 Pietermaritzburg 3200
Contact details
Telephone: +27 33 395 6911Facsimile: +27 33 394 6335Website: www.hulamin.co.zaE-mail: [email protected]
Securities exchange listing
South Africa (Primary), JSE Limited
Transfer secretaries
Computershare Investor Services (Pty) Limited 70 Marshall StreetJohannesburg 2001PO Box 61051, Marshalltown, 2107
Sponsor
Rand Merchant Bank(A division of FirstRand Bank Limited) 1 Merchant PlaceCorner Fredman Drive and Rivonia Road Sandton2196PO Box 786273, Sandton, 2146
Directorate
Non-executive directors
L C CeleV N KhumaloT P LeeuwJ B MagwazaN N A Matyumza (with effect from 1 March 2010) M E Mkwanazi, ChairmanS P NgwenyaP H Staude
Executive directors
A Fourie, Chief Executive Offi cer (retired with effect from 30 June 2010)R G Jacob, Chief Executive Offi cer (appointed with effect from 1 July 2010)C D HughesM Z Mkhize