2010 Annual Report - Empire Industries LTDempind.com/.../2016/06/2010_annual_report_copy1.pdf ·...
72
2010 Annual Report
Transcript of 2010 Annual Report - Empire Industries LTDempind.com/.../2016/06/2010_annual_report_copy1.pdf ·...

2010 Annual Report

Corporate ProfileEmpire Industries Ltd. (“Empire”) is a public company that was formed in July 2006. Empire’s mission is to increase shareholder value by adding value to steel. Empire operates in two distinct market segments: Specialized Engineered Products and Steel Fabrication & Installation.
Specialized Engineered Products SegmentThe Specialized Engineered Products segment designs, manufactures, and sells proprietary engineered products throughout the world. Key customer sectors include the entertainment industry, natural resource, manufacturing, and processing industries, excavation industry, and the government sector.
Businesses in the Specialized Engineered Products segment:• Dynamic Structures (amusement park rides, observatory telescopes)• Tornado Hydrovacs (hydrovac trucks)• Ward Industrial Equipment (material handling equipment, air cleaning equipment)• Parr Metal Fabricators (pressure vessels, tanks)
Steel Fabrication & Installation SegmentThe Steel Fabrication & Installation segment provides fabrication and installation services to industrial and infrastructure markets, primarily in western Canada. It also participates in the lucrative market for oil sands maintenance services through its 49% interest in Athabasca Chipewyan Empire Industrial Services Ltd. (“ACE”) ACE is an aboriginally controlled business whose majority owner is the Athabasca Chipewyan First Nation.
Businesses in the Steel Fabrication & Installation segment:• Empire Iron Works• KWH Constructors• Somerset Engineering• Hopkins Steel Works• ACE Industrial Services
In addition to these segments, Empire holds a 45% interest in Dongguan Qiguang Dynamic Steel Structures Co. Ltd., a Chinese company whose majority owner is Guangdong Qiguang Steel Structures Co. Ltd.
Empire’s common shares are listed on the TSX Venture Exchange under the trading symbol EIL.

2010 Report to Shareholders
Empire Industries Ltd. 2010 Annual Report 1
2010 Report to Shareholders
The Company continued to react to the negative effects that the deep recession was having on its operations by restructuring and repositioning itself to focus more on its value added engineering and manufacturing capabilities and less on structural steel fabrication and erection. This resulted in the discontinuance of two business units in 2010 and the streamlining of its remaining operations through overhead and fixed cost reduction.
The key initiatives undertaken by the company over the past two years were:
• Reduced its net funded debt by $31.4 million (from $48.1 million at December 31, 2008 to $16.7 million at December 31, 2010) through a series of successful initiatives;• Discontinued two money losing operations and sold a third, that was not core to its strategy. • Reduced overhead (OG&A) by $8.4 million (48% reduction) from $17.7 million in 2009 to $9.3 million in 2010; $3.0 million of the reduction came from continuing operations and $5.4 million from discontinued operations;• Reduced domestic plant capacity from 400,000 square feet to 200,000 square feet through aggressive restructuring;• Offset and replaced the domestic capacity reduction of 200,000 square feet by undertaking a 45% investment in a Chinese joint venture that has access to an existing 400,000 square foot steel fabrication facility in China;• Committed significant resources to position the Company to be a leader in the global amusement ride business and specialty engineered products that it designs and builds.• Committed additional resources to position the Company to be a leader in the oilsands maintenance and steel erection business in Fort McMurray through its unique, First Nation controlled, partnership.
Management and the Board are confident that the Company is well positioned to exploit global opportunities for its specialty engineered products as well as participate in the western Canadian non-residential construction spending market through its steel fabrication and erection capabilities.
2010 Summary of Financial ResultsThe Company generated positive EBITDA of $1.3 million in 2010 from continuing operations compared to negative EBITDA of $1.1 million in 2009 representing a positive change in operating cash flow of $2.4 million year over year on $2 million less sales of $66 million.
The net loss of $17.8 million ($0.20 basic and diluted loss per share) for the twelve months ended December 31, 2010 breaks downs as follows:
• A loss from continuing operations of $3.8 million or $0.04 loss per share, (which includes a $0.02 non-cash loss per share on foreign exchange hedges);• A loss from discontinued operations of $14.0 million or $0.16 loss per share (which includes a $0.09 non-cash loss per share for goodwill impairment).
Cash flow used in continuing operations was $0.6 million during 2010 ($0.01 per share) versus $4.2 million in 2009 ($0.05 per share) which represented an improvement of $3.6 million.
Specialized Engineered Products SegmentOur Engineered Products segment focuses on high value added products such as amusement ride systems, observatory telescopes, hydrovac trucks, material handling equipment and pressure vessels. Many of our products are globally competitive and exported around the world. We have commenced a plan to manufacture some of these labour intensive products though our new joint venture in China.

2010 Report to Shareholders continued...
Empire Industries Ltd. 2010 Annual Report 2
A world class amusement ride project for a leading entertainment company in the U.S. was completed at the end of the second quarter of fiscal 2010, and the fabrication phase of a second amusement ride project for another leading entertainment company in the U.S. was substantially completed in 2010. Early in 2011, the Company was also awarded a $9 million contract from one of the leading entertainment companies.
Notwithstanding the decrease in 2010 sales resulting from the disposition of our non-core combustion equipment business, 2010 EBITDA almost doubled from $2.1 million in 2009 to $4.0 million in 2010.
Steel Fabrication & Installation Services Segmented ResultsWe have narrowed the focus of our steel fabrication and installation segment, to focus on steel fabrication for industrial and infrastructure applications that can leverage our unique engineering capabilities. Steel fabrication and installation in these markets is more complex than in the commercial market which is more of a commodity service. Part of this re-focusing involved the discontinuance of the fabrication business we used to process through our Trapp Avenue facility in BC.
Sales from continuing operations in this segment increased modestly over 2009 levels. OG&A expenses from continuing operations decreased from $4.7 million in 2009 to $3.5 million in 2010 (27%), reflecting staff reductions and other cost control measures we put in place during the past two years.
The positive effects of cost reductions reduced the EBITDA loss from continuing operations by $1.2 million in the year (from $1.6 million EBITDA loss to $0.4 million EBITDA loss). We feel that this segment is well positioned to return to profitability in 2011 as revenue volumes return to pre-recessionary levels and the benefits of operational leverage kick-in from the reduction of our fixed cost overhead structure.
OutlookThe Company’s backlog is starting to grow again as the economy strengthens and Empire’s contract awards increase. For example, backlog at December 31, 2010 of $19.5 million increased by $6.1 million to $25.6 million as of March 31, 2011.
The Company is actively marketing its competitive strengths in the specialized engineered product segment on the strength of its success in building some of the most innovative and exciting amusement rides in the world for two of the top entertainment companies in the world. Since the Company acquired Dynamic Structures in 2007, we have positioned Dynamic Structures to be the leader in the fast growing, amusement ride business in China and with park owners around the world, seeking to fulfill the growing middle class desire for interactive themed ride entertainment.
Moreover, Dynamic Structures, using its unique engineering skills, is working with two partners to manufacture two new, proprietary machines that each have global market reach channel to market potential. Management anticipates that these new initiatives will result in a continuous predictable stream of “value added” manufacturing cash flow and profits on a going forward basis. The specialized engineered products segment’s hydrovac truck manufacturing division continues to see a steady growth in its backlog of orders and is expected to have a good year as the oil and gas service market strengthens and the hydrovac truck penetrates the central Canadian excavation market.
The Company’s continuing steel fabrication and erection operations in western Canada are focused on fabricating and erecting complex, industrial and infrastructure steel projects out of its four steel fabrication facilities. Management believes that the long-term outlook for business capital expenditures in western Canada is very positive and the near term outlook is improving steadily. The Company expects to benefit from this increased activity through better shop and field utilization rates and better pricing which will improve margins.

The Company’s aboriginal partnership in Fort McMurray, ACE Industrial Services, provides maintenance and related services to Alberta’s oil sands producers (welding, machining and installation services). Management believes that the outlook for ACE in 2011 and beyond is tied to the significantly increasing amount of capital and maintenance expenditures expected to be invested in the oil sands area of Alberta. ACE is expected to perform better in 2011 and beyond. Its field erection operations were strengthened at the end of 2010 through the acquisition of a small erection firm in Ft. McMurray which expands its suite of services and strengthens its management team.
The Company is excited about its recently executed agreement with Qiguang Group to create a Chinese jointly owned company (45% owned by Empire Industries and 55% by The Qiguang Group). The new joint stock Company in China will enable Empire to actively participate in the steel fabrication market in China through the use of an existing leased steel fabrication facility in Guangdong Province; to actively export fabricated steel to Empire’s operations in Western Canada on a low cost base which can be incorporated into projects bid on in Western Canada; and to potentially manufacture some of the Company’s specialized engineered products in China (amusement rides, material handling equipment, hydrovac trucks, and oil and gas process equipment). The Company will have access to an existing 400,000 square foot steel fabrication facility in China, which offsets the 200,000 square feet of more expensive shop capacity the Company divested itself of in western Canada.
As the Company returns to profitability, it will benefit from sheltering its profit through utilizing gross tax loss carry forwards of $25.8 million.
The Company took the initiative in early 2011 to strengthen its balance sheet and ensure the availability of adequate working capital to enable it to pursue and complete the various opportunities in the market place by raising $2.7 million in February 2011 ($2.0 million of equity and $0.7 million of convertible debt). The Company is also in the process of raising $3.0 million of equity through a private placement and expects to close this by May 31, 2011.
ConclusionWithout question, the past two years have been challenging for the Company. Management and the Board are confident that the restructuring and strategic repositioning initiatives that have been taken in the past two years have positioned the Company to return it to profitable growth in 2011 and beyond. The Company will benefit from operating leverage arising from its leaner, more cost competitive structure and it will capitalize on its unique selling proposition, both domestically in steel fabrication and installation, and internationally through its specialized engineered products business.
We are looking forward to an exciting and profitable 2011.
2010 Report to Shareholders continued...
Empire Industries Ltd. 2010 Annual Report 3
Chairman of the Board Chief Executive Officer

Management’s Discussion and AnalysisFor the Fourth Quarter and Twelve Months ended December 31, 2010
The following Management’s Discussion and Analysis (“MD&A”) of financial condition and results of operation of Empire Industries Ltd. (“EIL” or the “Company”) is supplemental to, and should be read in conjunction with, the audited consolidated financial statements and accompanying notes of the Company for the year ended December 31, 2010.
These statements have been prepared in conformity with Canadian generally accepted accounting principles (“GAAP”) and require management to make estimates and assumptions that affect amounts reported and disclosed in such financial statements and related notes. Unless otherwise indicated, a reference to a year relates to the Company’s fiscal year ended December 31. All amounts are reported in Canadian dollars unless specifically stated to the contrary.
The Board of Directors, on the recommendation of the Audit Committee, approved the contents of this MD&A on April 29, 2011. Disclosure contained in this document is current to this date, unless otherwise stated.
Additional information on EIL is available through the System for Electronic Document Analysis and Retrieval (“SEDAR”) at www.sedar.com
1. BUSINESS DESCRIPTIONThe Company operates primarily in two market segments as described below. On January 1, 2011, the Company amalgamated all its material, operating subsidiaries. Therefore, the bulk of the Company’s operations now take place through its wholly owned subsidiary, Empire Iron Works Ltd. Empire Iron Works Ltd. has the following operating divisions:
Segment
Specialized Engineered Products
Specialized Engineered Products
Specialized Engineered Products
Business
Design and manufacture of premium amusement park rides, complex ride systems, telescopes and custom machinery and equipment. Leased facility is in Port Coquitlam, BC.
Manufacture hydrovac trucks for excavation service providers to the oil and gas industry and the municipal market. Leased facility is in Stettler, AB.
Design and manufacture of bulk material handling equipment and air cleaning equipment. Leased facility is in Welland, ON.
Division
Dynamic Structures
Tornado Hydrovacs
Ward Industrial Equipment
Management’s Discussion and Analysis
Empire Industries Ltd. 2010 Annual Report 4

Management’s Discussion and Analysis continued...
Empire Industries Ltd. 2010 Annual Report 5
Segment
Specialized Engineered Products
Steel Fabrication and Installation
Steel Fabrication and Installation
Steel Fabrication and Installation
Steel Fabrication and Installation
Segment
Steel Fabrication and Installation
Steel Fabrication and Installation
Business
Fabrication of tanks, pressure vessels and other specialty carbon and stainless steel products. Leased facility is in Winnipeg, MB.
Structural steel fabrication and installation. Two owned facilities in Winnipeg, MB and west of Edmonton, AB
Structural steel fabrication. Leased facility is in Welland, ON
Structural steel installation and related construction services. Leased facility is in Burnaby, BC.
Engineering services, particularly related to complex installation of structural steel. Leased facility is in Burnaby, BC.
Business
Steel fabrication and installation, machining, multi-trade industrial construction and maintenance services, primarily serving the oil sands market. Facilities are in Fort McMurray, AB. This is a joint venture between the Athabasca Chipewyan First Nation Business Group and Empire Industries Ltd.
Fabrication and installation of complex structural steel projects in China through a joint venture Company owned 55% by Guangdong Qiguang Steel Structures Co. Ltd. and 45% by Empire Industries Ltd. Incorporation documentation has been submitted to the authorities and is expected to be granted in the second quarter of 2011 with operations commencing at the same time.
Division
Parr Metal Fabricators
Empire Iron Works
Hopkins Steel Works
KWH Constructors
Somerset Engineering
Enterprise
Athabasca Chipewyan Empire (ACE) Industrial Services Ltd. (49%)
Dongguan Qiguang Dynamic Steel Structures, Ltd. (45%)
In addition to these wholly owned businesses, the Company holds significant equity interests in two major business enterprises:

Management’s Discussion and Analysis continued...
Empire Industries Ltd. 2010 Annual Report 6
EIL maintains its head office in Winnipeg, Manitoba. The Company’s common shares are listed on the TSX Venture Exchange under the trading symbol EIL. The Company operates in two business segments:
Steel Fabrication and Installation Services (EIW, Hopkins, KWH, Somerset, ACE partnership and Qiguang Dynamic partnership)
Industrial and Infrastructure fabrication (such as buildings and bridges) and steel erection services, multi-trade installation and maintenance in Ft. McMurray, principally in the western Canadian market place. Current operations are positioned to capitalize on the resurgent growth in industrial, commercial and institutional/infrastructure capital spending in the areas of fabrication and installation services in western Canada in general and the oilsands market in particular.
Specialized Engineered Products (Dynamic Structures, Tornado Hydrovac, Parr Metal and Ward Equipment) design and manufacture amusement rides and ride systems, custom engineered equipment, telescope observatories, hydrovac trucks, pressure vessels and tanks, industrial vacuums, air cleaning equipment, bulk material handling equipment. Many of the Company’s specialized engineered products are competitive globally and are exported around the world. EIL has commenced a plan to manufacture labour intensive, components of its specialized engineered product line in its joint venture in China.
2. SEASONALITY AND CYCLICALITYThere is limited seasonality to the company’s steel fabrication and installation business although unseasonably cold or hot weather can impact productivity rates for field installation services. The Company’s revenue from steel fabrication and installation services tend to be coincident with construction capital expenditures in the industrial, commercial and institutional/infrastructure sectors in Western Canada. The distributed nature of the Company’s steel fabrication and installation services capacity in Manitoba, Alberta and British
Columbia mitigates, to some extent, localized or regional cycles. The Company’s revenue from specialized engineered products for amusement ride systems tend to follow the underlying cycle of capital spending by global, amusement park operators and revenues from the development of observatory telescopes systems and enclosures are essentially tied to financial support from government and academic stakeholders. The Company’s revenue from the specialized hydrovac truck market is influenced by oil and gas service capital expenditures. The Company’s revenue from material handling equipment is influenced by industrial capital expenditures on equipment.
The engineered products and the steel fabrication and installation business tends to be heavily influenced by the cyclicality of business capital expenditures. This was particularly evident during this past recession that started in the fourth quarter of 2008 and where business capital expenditures in the industrialized market were reduced significantly in 2009 and 2010.
3. RESTRUCTURING PLANThroughout 2009 and 2010, the Company developed a proactive plan to deal with:
• A deep economic recession;
• Excess fabrication capacity resulting in increased competition pursuing a smaller volume of available work in 2009 and 2010 resulting in margin compression;
• A rapidly appreciating Canadian dollar; and
• Too much debt in light of the recessionary environment.
The Company aggressively pursued a number of restructuring initiatives as it narrowed its focus to only those businesses that had the highest value added within the context of

Management’s Discussion and Analysis continued...
Empire Industries Ltd. 2010 Annual Report 7
“adding value to steel.” These initiatives included the Company divesting of or discontinuing operations of those business units that, in the opinion of management, could not be competitive, or were not core to its strategy or did not have a sustainable value proposition in the new environment going forward.
The restructuring plan resulted in the Company: • Reducing its Net funded debt levels from $48.1 million at December 31, 2008 to $16.7 million at December 31, 2010 • Reducing its overhead (OG&A) by $8.4 million (48% reduction) to $9.3 million in 2009; $3.0 million of the reduction came from continuing operations and $5.4 million from discontinued operations.
• Reducing its domestic plant capacity from 400,000 square feet to 200,000 square feet and to supplement this capacity reduction with a 45% interest in a Chinese joint venture with access to an existing 400,000 square foot steel fabrication facility in China.
Management believes that these initiatives will improve the Company’s financial position and financial performance going forward and that it will benefit from operating leverage because of its leaner, more cost competitive structure.
The following table outlines the specific Company restructuring plan initiatives over the past two years.
Outcome
• On July 20, 2010 the Company’s wholly-owned subsidiary, Petrofield, completed the sale of its patents related to hydrovac trucks for $1.2 million cash proceeds and a gain of about $1.2 million. The Company retains the exclusive right to manufacture and sell in Canada and in the US on a non-exclusive basis. The Company has unrestricted access to all other geographic jurisdictions.
• In 2010, the Company generated $1.4 million of proceeds by selling redundant or underutilized machinery and equipment at approximately its net book value.
• The Company initiated a process to wind-down and discontinue the operation of its steel fabrication facility on Trapp Avenue in Burnaby, British Columbia during the fourth quarter ending December 31, 2010. The Company has sold certain surplus or underutilized machinery and equipment to the owners of the Trapp Avenue facility for $0.8 million in April 2011.
• On October 5, 2009, the Company’s wholly-owned subsidiary, Petrofield, completed the sale of the assets of its combustion business for $10.1 million. Of this amount, $6.8 million was used to fully repay the operating line and term debt owed to BMO. A further $1.8 million was paid to RBC and HSBC. The remainder of $1.5 million was used for working capital and general corporate purposes.
Restructuring Objective
Disposition of redundant or non-strategic assets

Management’s Discussion and Analysis continued...
Empire Industries Ltd. 2010 Annual Report 8
Outcome
• On July 31, 2009, the Company completed the sale and leaseback of its Kingsway facility for total proceeds of $9.5 million and a gain on sale of $1.5 million. Of the total proceeds, $7.2 million was applied to fully repay the Company’s term debt with GE (including interest of $519,000) and $2.2 million was applied to reduce the Company’s draws on its operating line with HSBC.
• In addition, the Company continues a program to dispose of underutilized or redundant fixed assets which are readily available in the rental market.
• During 2010, the Company made the decision to cease operating Petrofield Industries Ltd.’s process division. Included in the general cost savings associated with discontinuing this operation:
- The Company incurred $3.2 million and $2.1 million of Net losses from the Petrofield process division discontinued operation in 2010 and 2009 respectively.
- In April 2010, the Company transferred responsibility for the remaining term of its primary office and two plant leases in Calgary, Alberta to new tenants, with expected annual savings in lease and related operating costs of about $0.6 million per annum.
• During 2010, the Company made the decision to cease operations out of the leased Burnaby fabrication facility on Trapp Avenue (the Trapp facility). The Trapp facility was largely focused on competing in the commercial and miscellaneous steel market place in the Lower Mainland of BC.
- The Company incurred $10.8 million ($8.2 million of which was Goodwill impairment) and $3.6 million of Net losses from the George Third & Son Ltd.- Trapp plant discontinued operation in 2010 and 2009 respectively.
- The lease at Trapp Avenue was terminated early in 2011 for an annual gross rent saving of approximately $0.5 million per year.
• During 2009 and 2010, the Company undertook a number of initiatives to contain and reduce costs throughout its subsidiaries including a combination of not filling vacancies, staff lay-offs, reduced work weeks, salary rollbacks and terminations as well as the curtailment of discretionary non-payroll expenses.
Restructuring Objective
Disposition of redundant or non-strategic assets
Cost containment and cost reductions

Management’s Discussion and Analysis continued...
Empire Industries Ltd. 2010 Annual Report 9
Outcome
• The Company has undertaken significant integration of its steel fabrication capacity in BC reducing the number of plants from three to one. The salaried employees involved in steel fabrication and installation in BC went from a full-time equivalent of 96 in 2008 to 33 at the end of 2010, representing a base annual compensation reduction of over $5 million.
• Operations, general and administrative expenses in 2009 totaled $17.7 million including the discontinued and continuing operations. This was reduced by $8.4 million (48%) throughout 2009 and 2010 to $9.3 million in fiscal 2010; $3.3 million coming from continuing operations and $5.1 million from discontinued operations. There were also significant reductions made to production and indirect expenses in 2009 and 2010, largely coming from the decision to discontinue the Petrofield process division and the George Third & Son division.
• In September 2009, the Company transferred responsibility for the remaining term of its Norland property lease in Vancouver to a new tenant with expected annual savings in lease and related operating costs of about $0.1 million per annum.
• On November 2, 2009, the Company transferred responsibility for the remaining 44 month term of its Fawcett property lease in Vancouver to a new tenant with expected savings in lease and related operating costs of about $0.5 million per annum.
• The lease cost of the Kingsway facility under the sale and leaseback is expected to save about $0.8 million per year over the near term relative to the cash cost of servicing the related debt (principal and interest).
The Company has actively reduced the non-cash working capital it must finance with its bank operating lines by ensuring that the days in accounts payable exceed days in accounts receivable, while continuing to obtain normal trade credit terms from its trade suppliers. In 2010, days in accounts payable exceeded days in accounts receivable by 2 days. (44 days in payables, 42 days in receivables.) In 2009, days in accounts payable exceeded days in accounts receivable by 2 days. (42 days in payables, 40 days in receivables.)
• The Company has actively limited its capital expenditures to spending levels necessary to sustain its property, plant and equipment. The Company also redeployed surplus assets between wholly-owned divisions as a further means of reducing capital expenditures.
• As a result, capital spending declined to $0.3 million in 2010 compared to $1.4 million in 2009 compared to $6.6 million for the same period in fiscal 2008.
Restructuring Objective
Cost containment and cost reductions
Working capital management
Limit capital spending to sustaining capital expenditures

Management’s Discussion and Analysis continued...
Empire Industries Ltd. 2010 Annual Report 10
Outcome
The Company historically had term debt with three institutions; BMO, GE and RBC. On March 4, 2010, the Company successfully completed the issuance of $7.5 million in term debt from Canadian Western Bank, the proceeds of which were used to fully repay the term debt of $2.3 million owed to Royal Bank of Canada and the remainder used to repay short-term debt and improve liquidity and working capital.
As noted above, the Company has fully repaid term debt owed to RBC, BMO and GE
The Company historically had operating lines with three banks, BMO, HSBC and RBC.
On March 4, 2010, the Company successfully completed a refinancing of its short-term operating line whereby the operating lines previously held with HSBC and Royal Bank were fully repaid and consolidated under a single operating line with Canadian Western Bank.
On October 14, 2010 the Company applied distributions from its joint ventures, arising from collection of holdbacks on a major ride system, to repay $1.4 million of short-term debt owed to AMEC International (Canada) Ltd.
As noted above, substantially all of the proceeds from the disposition of non-core or redundant assets have been applied to reduce term and operating debt.
The Company’s Net funded debt has been reduced $31.5 million (65%) from $48.2 million at December 31, 2008 to $16.7 million on December 31, 2010.
The Company’s Net funded debt has been reduced $31.5 million (65%) from $48.2 million at December 31, 2008 to $16.7 million on December 31, 2010.
The Company’s Net funded debt to capitalization ratio was 58.9% in 2010 as compared to 55.4% in 2009.
In February 2011, the Company closed a private placement of common shares and warrants which raised gross proceeds of $2.0 million dollars. The warrants, if exercised, would result in a further $2.0 million of equity.
Also in February 2011, the Company closed a 5 year convertible debenture of $0.6 million.
In April 2011, the Company announced its intention to close a private placement of common shares and warrants to raise gross proceeds of up to $3.0 million. The warrants, if exercised, would result in a further $6.0 million of equity.
Restructuring Objective
Re-financing of certain long-term assets
Consolidation of bank operating lines
Reducing debt levels
Reducing debt levels
Increasing equity

Management’s Discussion and Analysis continued...
Empire Industries Ltd. 2010 Annual Report 11
4. CONSOLIDATED FINANCIAL RESULTS4.1 Discontinued OperationsDuring 2010, the Company made the decision to cease operating Petrofield Industries Ltd.’s Process division. In August 2010, the Company successfully terminated the lease of its remaining manufacturing facility directly related to the processing division.
During 2010, the Company made the decision to cease operating its Trapp Avenue steel fabrication facility. Operations were substantially wound up in 2010, and the Company surrendered the lease and disposed of the surplus equipment in April 2011.
As a result, the Company reported the results for the Process division and the Trapp facility for the current year and the comparative period last year as discontinued operations in its consolidated statement of operations. Accordingly, sales, gross profit, EBITDA, EBIT, earnings before taxes and income taxes constitute the Company’s results from continuing operations which exclude the results of the process division and the Trapp facility.
As can be seen in the table below, the Net loss from discontinued operations, net of tax, was $14.0 million in the year ending 2010 ($8.2 million of which was Goodwill impairment) and $5.7 million in 2009.
2009
$ 15,434 (2,646) (2,051)
$ 25,979 (3,999) (3,617)
$ 41,413 (6,645) (5,668)
Discontinued Operations For the years ended December 31 (in thousands, except per share amounts)
Petrofield Industries Ltd. - Processing division
Revenue Net loss from discontinued operations before taxes Net loss from discontinued operations, net of tax
George Third & Son Ltd. - Trapp facility
Revenue Net loss from discontinued operations before taxes Net loss from discontinued operations, net of tax
Total Discontinued Operations
Revenue Net loss from discontinued operations before taxes Net loss from discontinued operations, net of tax
2010
$ 1,311 (3,371) (3,207)
$ 13,699 (11,077) (10,774)
$ 15,010 (14,448) (13,981)

Management’s Discussion and Analysis continued...
Empire Industries Ltd. 2010 Annual Report 12
2009
67,907(56,724)
11,18340(8)
(12,323)
(1,108)(2,776)
(3,884)(2,417)
176(2,539)
0(4,550)
2,835
(10,379)
(6,645)
(659)1,244
585
595382977
(9,794)
(5,668)
(15,462)
Better(Worse)
(1,870)1,269
(601)218
(287)3,071
2,401403
2,804892
903,692
24,550
(4,967)
7,063
(7,804)
(453)(648)
(1,101)
(113)(396)(509)
5,962
(8,313)
(2,351)
Selected Consolidated Financial Information For the periods ended December 31 (in thousands, except per share amounts) Sales Cost of goods sold Gross profit Earnings from equity investment and other revenue (expense) Stock based compensation (expense) recovery Operating, general and administration expenses EBITDA from continuing operations Amortization EBIT from continuing operations Interest expense Amortization of deferred gain on sales and leasebacks Gain (loss) on disposal of assets Other Income Impairment loss on goodwill Unrealized gain (loss) on foreign exchange hedges Earnings (loss) from continuing operations before tax Earnings (loss) from discontinued operations before tax Provision for income tax recovery (expense) - Continuing Operations Current Future Provision for income tax recovery (expense) - Discontinued Operations Current Future Earnings (loss) from continuing operations after tax Earnings (loss) from discontinued operations after tax Net Earnings (loss)
2010
66,037(55,455)
10,582258
(295)(9,252)
1,293(2,373)
(1,080)(1,525)
2661,153
20
(2,132)
(3,316)
(14,449)
(1,112)596
(516)
482(14)468
(3,832)
(13,981)
(17,813)
4.2 Loss for the Period
Twelve months ended

Management’s Discussion and Analysis continued...
Empire Industries Ltd. 2010 Annual Report 13
2009
91,240
($ 0.11) ($ 0.06) ($ 0.17)
($ 0.04) ($ 0.03) ($ 0.03) ($ 0.05) $ 0.03
($ 0.11) ($ 0.06)
($ 0.17)
Better(Worse)
0
$ 0.07 ($ 0.10) ($ 0.03)
$ 0.03 $ 0.01 $ 0.04 $ 0.05 ($ 0.05)
$ 0.07 ($ 0.10)
($ 0.03)
Selected Consolidated Financial Information For the periods ended December 31 (in thousands, except per share amounts) Weighted average common shares issued and outstanding Earnings per share Basic & diluted from continuing operations Basic & diluted from discontinued operations Basic & diluted earnings per share
EBIT from continuing operations Interest expense Gain (loss) on disposal of assets Impairment loss on goodwill Unrealized gain (loss) on foreign exchange hedges Earnings (loss) from continuing operations after tax Earnings (loss) from discontinued operations after tax Net Earnings
2010
91,240
($ 0.04) ($ 0.16) ($ 0.20)
($ 0.01) ($ 0.02) $ 0.01 $ - ($ 0.02)
($ 0.04) ($ 0.16)
($ 0.20)
The net loss of $17.8 million ($0.20 basic and diluted loss per share) for the twelve months ended December 31, 2010 occurred in large part because of:
• Loss from continuing operations of $3.3 million ($0.04 loss per share), which includes an unrealized loss on foreign exchange hedges of $2.1 million ($0.02 loss per share) in the period
• Loss from discontinued operations of $14.0 million ($0.16 loss per share) (see Section 4.1 above)
The net loss of $15.5 million ($0.17 loss per share) for the twelve months ended December 31, 2009 occurred in large part because of:
• EBIT loss from continuing operations of $3.9 million ($0.04 loss per share)
• Interest expense of $2.4 million ($0.03 loss per share)
• Goodwill impairment charge of $4.6 million ($0.05 loss per share);
• Loss on Disposal of assets $2.5 million ($0.03 loss per share)
• Loss from Discontinued operations of $5.7 million ($0.06 loss per share) (see Section 4.1 above)
The cash flow used in continuing operations in 2010 was $0.6 million,or $0.01 per share, versus $4.2 million, or $0.05 per share in 2009, an improvement of $3.6 million, or $0.04 per share.
The provision for income tax expense for the twelve months ended December 31, 2010 included the impact of a net accrued valuation allowance of $2.8 million associated with the future tax value of its loss carry-forwards and investment tax credits. Excluding this valuation allowance, the provision for income tax recovery would have been $2.8 million as noted below under “4.7 – Income Taxes” and the net loss for the twelve month period would have been $15.0 million and the basic and diluted loss per share would have been $0.16.
Twelve months ended

Management’s Discussion and Analysis continued...
Empire Industries Ltd. 2010 Annual Report 14
4.3 Gross Profit, EBITDA and EBITThe Company’s gross profit for the twelve months ended December 31, 2010 decreased by $0.6 million to $10.6 million over the twelve months ended December 31, 2009. Steel Fabrication and Installation segment increased by $0.4 million, but this was offset by a $1.0 million decrease in the engineered products segment. The factors underlying these changes are discussed in greater detail below under “Business Segment Performance.”
Operating, general and administrative (“OG&A”) expenses for 2010 of $9.3 million was reduced by $3.3 million (or 35%) over the same period last year. As a result, earnings before interest, taxes and depreciation (“EBITDA”) from continuing operations was positive $1.3 million for the twelve months ended December 2010, an improvement of $2.4 million over the EBITDA loss from continuing operations of $1.1 million for 2009.
Amortization expenses decreased $0.4 million (or 18%) to $2.4 million for 2010 compared to 2009. As a result, the loss before interest and taxes of $1.1 million for 2010 improved by $2.8 million over a loss of $3.9 million for 2009.
4.4 Gain on Disposal of AssetsThe gain on disposal of property, plant and equipment of $1.2 million in 2010 related to the disposition of patents in July 2010 for $1.2 million in addition to assets disposed of in the ordinary course of business. Management’s opinion is that the sale of the patents had no material impact on the Company to manufacture and sell hydrovac trucks in Canada, the USA or elsewhere.
4.5 Interest ExpensesInterest costs of $1.5 million for the year ended December 31, 2010 improved by $0.9 million over 2009. Lower interest costs reflect both reductions in interest-bearing funded debt to $16.7 million at December 31, 2010 from $21.8 million at December 31, 2009 arising from scheduled and non-scheduled debt repayments and bank operating line
repayments throughout the balance of last fiscal year, coupled with lower interest rates compared to the same period last year and offset by an increase in the mix of term debt relative to short-term borrowings.
4.6 Unrealized Gain (Loss) on Foreign Exchange HedgesThe Company enters into various contracts in U.S. dollars in the normal course of business. Derivative instruments such as foreign exchange forward contracts are used by the Company to reduce its exposure to fluctuations in foreign currency exchange rates. In the normal course, the Company does not hold or issue derivative financial instruments for derivative trading purposes. The Company’s derivatives do not qualify for hedge accounting and are therefore reported in earnings on a mark-to-market basis using closing market quotations. Open foreign exchange forward contracts marked to market in this way remain unrealized and the $2.1 million loss for 2010 therefore includes a reversal of the $2.1 million unrealized gain recorded in the prior year and represents a non-cash pre-tax loss (2009 – a $2.8 million non-cash pre-tax gain) in the period.
4.7 Income TaxesThe Company’s total 2010 income tax expense was $49,000, comprised of an expense of $516,000 from continuing operations and a recovery of $467,000 from discontinued operations. This total expense includes a net charge of $2.8 million for 2010 in respect of valuation allowances on tax loss carry-forwards recognized in the current period. Excluding these valuation allowances the Company would have recorded an income tax recovery of $2.8 million representing a more normalized effective tax recovery rate of 15.7% (2009 – 21.4%).
As at December 31, 2010, the Company had consolidated tax loss carry-forwards of approximately $25.8 million available to reduce income taxes otherwise payable in future years, expiring between 2027 and 2030.

Management’s Discussion and Analysis continued...
Empire Industries Ltd. 2010 Annual Report 15
5. BUSINESS SEGMENT PERFORMANCE5.1 Steel Fabrication and Installation Services
A future tax asset of $6.5 million has been recorded at December 31, 2010 in respect of these unutilized losses. Management regularly assesses the Company’s ability to realize net future income tax assets and has concluded that a valuation allowance is required in accordance with generally accepted accounting principles. Accordingly, the Company has recorded a valuation allowance of $4.1 million
in relation to these assets. If the Company’s future earnings materialize to the extent required to permit the full realization of these loss carry-forwards, the Company would reverse the appropriate valuation allowance in the period when such a determination is made. This would result in an increase to reported earnings and a decrease to the Company’s effective tax rate in that period.
2009
29,549(26,461)
3,08840
(4,724)
(1,596)
(1,660)
(3,256)
Better(Worse)
2,601(2,683)
(82)21
1,257
1,196
360
1,556
Steel Fabrication and Installation ServicesFor the periods ended December 31 (in thousands) Sales Cost of goods sold Gross profit Earnings from equity investment and other revenue (expense) Operating, general and administration expenses EBITDA from continuing operations Amortization EBIT from continuing operations
2010
32,150(29,144)
3,00661
(3,467)
(400)
(1,300)
(1,700)
Twelve months ended
Sales from continuing operations of $32.5 million for 2010 increased by $2.6 million from 2009. Gross profit decreased by $0.1 million to $3.0 million (9% of sales), reflecting the particular mix of contracts performed in this segment.
The Company’s 49% interest in ACE is accounted for as an equity investment. Equity earnings of $83,000 in 2010 increased by 108% over 2009.
OG&A expenses from continuing operations of $3.5 million for 2010 decreased $1.3 million over 2009 (27% reduction), reflecting staff reductions and other cost control measures undertaken in the latter half of 2009 and in 2010.
The positive effects of cost reductions and containment reduced the EBITDA loss from continuing operations by $1.2 million in the year, from an EBITDA loss of $1.6 million in 2009 to $0.4 million in 2010. Amortization decreased $0.4 million to $1.3 million for 2010 as a result of lower capital spending during the course of fiscal 2009 and fiscal 2010 as well as the disposition of redundant and underutilized assets. As a result, the loss before interest and taxes of $1.7 million improved by $1.6 million from an EBIT loss of $3.3 million for 2009.
Management’s Discussion and Analysis continued...
Empire Industries Ltd. 2010 Annual Report 16
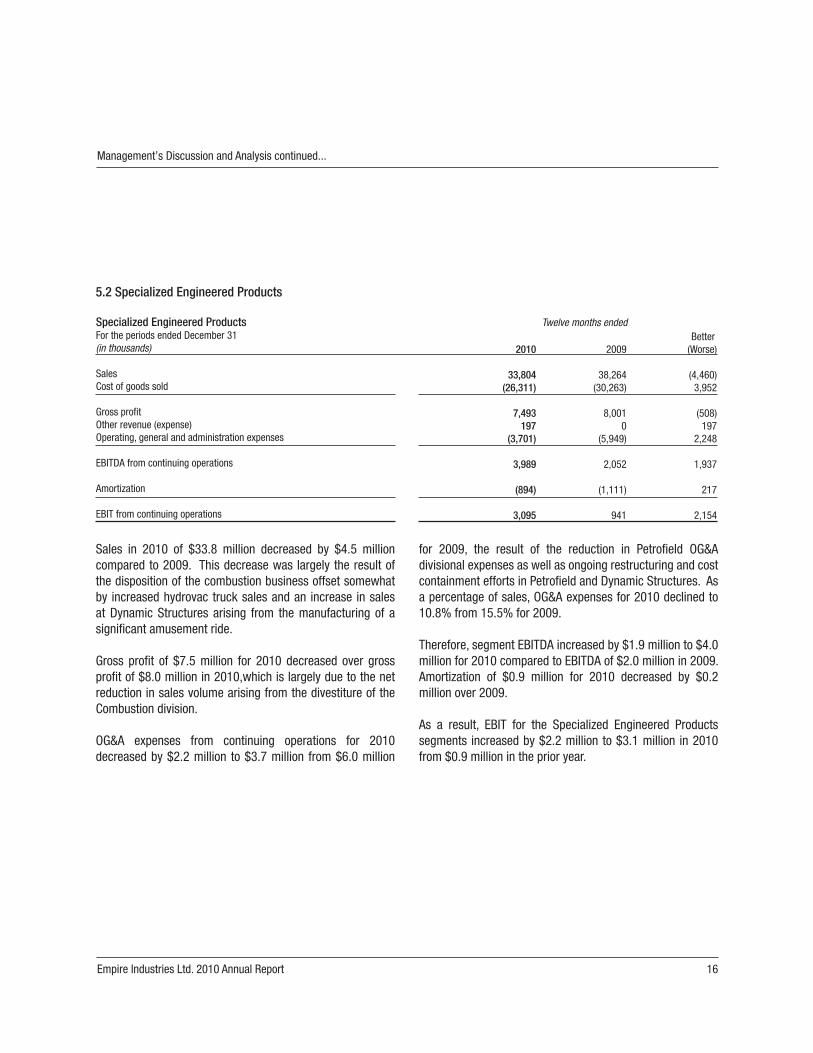
5.2 Specialized Engineered Products
2009
38,264(30,263)
8,0010
(5,949)
2,052
(1,111)
941
Better(Worse)
(4,460)3,952
(508)197
2,248
1,937
217
2,154
Specialized Engineered ProductsFor the periods ended December 31 (in thousands) Sales Cost of goods sold Gross profit Other revenue (expense) Operating, general and administration expenses EBITDA from continuing operations Amortization EBIT from continuing operations
2010
33,804(26,311)
7,493197
(3,701)
3,989
(894)
3,095
Twelve months ended
Sales in 2010 of $33.8 million decreased by $4.5 million compared to 2009. This decrease was largely the result of the disposition of the combustion business offset somewhat by increased hydrovac truck sales and an increase in sales at Dynamic Structures arising from the manufacturing of a significant amusement ride.
Gross profit of $7.5 million for 2010 decreased over gross profit of $8.0 million in 2010,which is largely due to the net reduction in sales volume arising from the divestiture of the Combustion division.
OG&A expenses from continuing operations for 2010 decreased by $2.2 million to $3.7 million from $6.0 million
for 2009, the result of the reduction in Petrofield OG&A divisional expenses as well as ongoing restructuring and cost containment efforts in Petrofield and Dynamic Structures. As a percentage of sales, OG&A expenses for 2010 declined to 10.8% from 15.5% for 2009.
Therefore, segment EBITDA increased by $1.9 million to $4.0 million for 2010 compared to EBITDA of $2.0 million in 2009. Amortization of $0.9 million for 2010 decreased by $0.2 million over 2009.
As a result, EBIT for the Specialized Engineered Products segments increased by $2.2 million to $3.1 million in 2010 from $0.9 million in the prior year.

Management’s Discussion and Analysis continued...
Empire Industries Ltd. 2010 Annual Report 17
5.3 Corporate Expenses
Cash OG&A expenses increased by $0.4 million to $2.1 million for 2010, primarily due to increased audit and accounting fees, and one-time professional fees related to establishing the new joint venture in China and the refinancing of our debt facilities.
Amortization costs reflect the amortization of deferred financing costs associated with the debt re-financing completed in March 2010 and amortized over the term of the underlying debt.
Corporate ExpensesFor the periods ended December 31 (in thousands) Miscellaneous income Cash operating, general and administration expenses Non-cash stock-based compensation EBITDA from continuing operations Amortization EBIT from continuing operations
2009
94(1,650)
(8)
(1,564)
(5)
(1,569)
Better(Worse)
(11)(434)(287)
(732)
(174)
(906)
2010
83(2,084)
(295)
(2,296)
(179)
(2,475)
Twelve months ended

Management’s Discussion and Analysis continued...
Empire Industries Ltd. 2010 Annual Report 18
5.4 Highlights of Fourth Quarter Performance
Selected Consolidated Financial InformationFor the fourth quarters ended December 31 (in thousands, except per share amounts) Sales Cost of goods sold Gross profit Earnings from equity investment and other revenue (expense)Stock based compensation (expense) recovery Operating, general and administration expenses EBITDA from continuing operations Amortization EBIT from continuing operations Interest expense Amortization of deferred gain on sales and leasebacks Gain (loss) on disposal of assets Impairment loss on goodwill Unrealized gain (loss) on foreign exchange hedges Loss from continuing operations before taxes Loss from discontinued operations before tax Provision for income tax recovery (expense) - Continuing Operations Current Future Provision for income tax recovery (expense) - Discontinued Operations Current Future Loss from continuing operations after tax Loss from discontinued operations after tax Net Earnings Steel fabrication and installation Sales Gross profit (loss) Operating, general and administrative expenses Specialized engineered products Sales Gross profit (loss) Operating, general and administrative expenses Corporate Miscellaneous Income Operating, general and administrative expenses
2009
13,948(10,739)
3,209(70)
39(2,573)
605(664)
(59)(439)
67(119)
(2,750)250
(3,050)
(2,496)
(1,085)(887)
(1,972)
28596
381
(5,022)
(2,115)
(7,137)
4,693823
(1,025)
9,2212,352
(1,243)
34(304)
Better(Worse)
(205)(2,579)
(2,784)(50)(45)843
(2,036)95
(1,941)85
03
2,750(149)
748
469
5621,4932,055
(205)(100)(305)
2,803
164
2,967
2,440(1,553)
662
(2,633)(1,219)
490
(12)(310)
2010
13,743(13,318)
425(120)
(6)(1,730)
(1,431)(569)
(2,000)(354)
67(116)
0101
(2,302)
(2,027)
(523)60683
80(4)76
(2,219)
(1,951)
(4,170)
7,133(730)(363)
6,5881,133(753)
22(614)
Twelve months ended

Management’s Discussion and Analysis continued...
Empire Industries Ltd. 2010 Annual Report 19
The net loss for the fourth quarter for fiscal 2010 was $4.2 million, which was an improvement of $2.9 million over the same quarter of the previous year. This was due primarily to a one time $2.8 million goodwill impairment charge incurred in the fourth quarter of 2009.
• Steel fabrication and installation sales increased $2.4 million in the quarter ended December 31, 2010 compared to the same quarter last year reflecting higher current activity levels. Gross profit decreased by $1.8 million to a loss of $0.7 million, reflecting particular mix of contracts in process in the respective quarters.
• Specialized engineered product sales declined $2.4 million to $7.1 million for the quarter ended December 31, 2010.
This is primarily due to generally lower sales activity in Dynamic Structures as they completed a major amusement park ride contact. This also impacted gross profit. OG&A expenses were reduced by 39% as a result of aggressive cost control and restructuring at Dynamic Structures and Petrofield.
• Corporate OG&A for the fourth quarter was $0.3 million higher in the fourth quarter of 2010 versus the same period in 2009, primarily due to professional fees related to establishing the joint venture in China, as well as increases in governance costs, professional, and public company fees.
6. SELECTED ANNUAL AND QUARTERLY FINANCIAL INFORMATION
2009
$ 67,907
(10,379)
(0.11)(0.11)
(15,462)
(0.17)(0.17)
63,1267,132
Nil
2008
$ 180,032
(1,759)
(0.02)(0.02)
(1,759)
(0.02)(0.02)
120,47712,733
Nil
Selected Annual Financial InformationFor the years ended December 31 (in thousands, except per share amounts) Sales and revenue from services Net loss from continuing operations Loss from continuing operations per share: Basic Diluted Net loss Loss per share: Basic Diluted Total assets Total long-term financial liabilities Cash dividends declared per common share
2010
$ 66,037
(3,316)
(0.04)(0.04)
(17,813)
(0.20)(0.20)
42,02310,031
Nil
Twelve months ended

Management’s Discussion and Analysis continued...
Empire Industries Ltd. 2010 Annual Report 20
Selected Quarterly Financial Information For the quarters ended (in thousands, except per share amounts) (unaudited)
Sales and revenue from services Net income (loss) from continuing operations, net of tax Earnings (loss) from continuing operations per share: Basic Diluted Net income (loss) Earning (loss) per share: Basic Diluted
2010Q4
$13,743
(2,218)
(0.02)(0.02)
(4,169)
(0.05)(0.05)
2010Q3
$16,507
(69)
(0.00)(0.00)
(9,362)
(0.10)(0.10)
2010Q2
$18,162
(1,208)
(0.01)(0.01)
(2,470)
(0.03)(0.03)
2010Q1
$17,625
(337)
(0.00)(0.00)
(1,812)
(0.02)(0.02)
2009Q4
$13,948
(5,022)
(0.06)(0.06)
(7,137)
(0.08)(0.08)
2009Q3
$13,953
(2,865)
(0.03)(0.03)
(4,539)
(0.05)(0.05)
2009Q2
$13,708
(1,088)
(0.01)(0.01)
(2,170)
(0.02)(0.02)
2009Q1
$26,298
(639)
(0.01)(0.01)
(1,616)
(0.02)(0.02)
7. OTHER MATTERS7.1 Related Party TransactionsThe Company and its subsidiaries transact with each other and other related parties in the normal course of business at commercial rates and terms. EIW and GTS subcontract steel fabrication and installation services between the companies. DSL subcontract fabrication and installation services to GTS. These inter-segment sales have been eliminated from the segmented and consolidated financial results discussed above.
Rent was paid to companies controlled by officers, directors and members of their families in the ordinary course of operations and measured at the value of consideration established and agreed to by the parties in the amount of $0.5 million for 2010 (2009 - $0.6 million).
7.2 Future Changes in Accounting Policies7.2.1 International Financial Reporting Standards (“IFRS”)In February 2008, the Accounting Standards Board of the Canadian Institute of Chartered Accountants confirmed that Canadian GAAP for publicly accountable enterprises will be converged with IFRS as issued by the International Accounting Standards Board (“IASB”) for financial years beginning on or after January 1, 2011. Effective January 1, 2011, the Company will adopt IFRS as the basis for preparing its consolidated financial statements. The Company will issue its financial results for the quarter ended March 31, 2011 prepared on an IFRS basis with comparative data on an IFRS basis, including an opening balance sheet as at January 1, 2010.
IFRS uses a conceptual framework similar to Canadian GAAP, but there are significant differences concerning recognition, measurements and disclosures. In order to meet the requirement to transition to IFRS, the Company plans to:
6. SELECTED ANNUAL AND QUARTERLY FINANCIAL INFORMATION continued...

Management’s Discussion and Analysis continued...
Empire Industries Ltd. 2010 Annual Report 21
Phase
Assess and scope the differences in Canadian GAAP and IFRS accounting policies relevant to the Company and options available to first time adopters and the impact onthe Company’s financial reporting.
Identify, evaluate and select accounting policies necessary for the Company to change over to IFRS. As well, this phase will address other business activities that may be influenced by GAAP measures such as:• Information technology;• Disclosure controls and procedures; • Internal controls over financial reporting; and • Other activities, such as debt covenants.
Integrate these accounting policies into the Company’s financial reporting systems and processes necessary for the Company to changeover to IFRS.
Progress to Date
This process was ongoing during fiscal 2009 and 2010. The Company has completed its initial diagnostics concerning these differences.
The Company has selected its various options and is in the process of quantifying the impact on its opening financial statements at January 1, 2010 with regard to the treatment of operating leases, deferred gain on sale and leaseback, property, plant and equipment, deferred income taxes among other matters.
The Company is in the process of integrating these policies into the Company’s reporting systems.
The IASB is expected to continue issuing new accounting standards during the transition period, and as a result, the final impact of IFRS on the Corporation’s consolidated financial statements will only be measured once all the IFRS applicable at the conversion date are known.
7.3 Critical Accounting EstimatesThe preparation of financial statements in accordance with GAAP necessitates the use of management estimates, assumptions and judgment that affect reported amounts of assets, liabilities, revenues and expenses and disclosure of contingent assets and liabilities at the date of the financial statements. Although management reviews its estimates on an ongoing basis, actual results may differ from these estimates as confirming events occur. The following components of the financial statements depend most heavily on such management estimates, assumptions and judgment, any changes in which may have a material impact on the Company’s financial condition or results of operations. For more information about certain assumptions and risks that
may affect these estimates, assumptions and judgments, please see the “Forward Looking Information” section of this report.
7.3.1 Revenue Recognition – Cost to CompleteSales and accounts receivable include the uncertainty inherent in estimating the costs of completing construction projects, amounts ultimately realizable on unpriced change orders and therefore estimated margins to completion of the construction contract. Revenues and income from construction contracts are determined on the percentage of completion method, based on the ratio of costs incurred to date over estimated total costs. This method is used because management considers expended costs to be the best available measure of progress on these contracts. Contract costs include all direct material and labour costs and those indirect costs relating to contract performance such as indirect labour, supplies, tools and maintenance. Provision is made for anticipated contract losses as soon as they are evident. Contract revenues and costs are adjusted to reflect change orders that have been

Management’s Discussion and Analysis continued...
Empire Industries Ltd. 2010 Annual Report 22
approved as to both price and scope. For change orders that have not been approved as to price or are unpriced, contract revenues and projected costs to complete are estimated by management. In circumstances where significant advance purchases under a contract, such as materials, would result in a materially higher percentage of completion estimate for sales, margin and accounts receivable than indicated by other measures such as labour hours, management adjusts the percentage of completion to the lower level indicated by the alternative measure.
7.3.2 Valuation of Long-lived Assets and Asset ImpairmentThe Company periodically assesses the recoverability of values assigned to long-lived assets after considering potential impairment indicated by such factors as business and market trends, future prospects, current market value and other economic factors. In performing its review of recoverability, management estimates the future cash flows expected to result from the use of the asset and its eventual disposition. If the sum of the expected future cash flows is less than the carrying value of the asset, an impairment loss would be recognized based on the excess of the carrying value of the asset over the fair market value calculated using discounted future cash flows.
7.3.3 Future Income TaxesFuture income tax assets and liabilities are recognized for the future income tax consequences attributable to temporary differences between the financial statement carrying values of assets and liabilities and their respective income tax bases. Future income tax assets or liabilities are measured using enacted or substantively enacted income tax rate expected to apply to taxable income in the years in which those temporary differences are expected to be recovered or settled. The calculation of current and future income taxes requires management to make estimates and assumptions and to exercise a certain amount of judgment concerning the carrying values of assets and liabilities. The current and future income tax assets and liabilities are also impacted by expectations about future operating results and the timing
of the reversal of temporary differences as well as possible audits of tax filings by regulatory agencies. Changes or differences in these estimates or assumptions may result in changes to the current and future income tax assets and liabilities on the Consolidated Balance Sheet and a charge to or recovery of income tax expense.
As at December 31, 2010, the Company had loss carry-forwards of about $25.8 million (2009 - $13.6 million), expiring between 2027 and 2030 and available to reduce income taxes otherwise payable in future years. Losses subject to expiry represent the non-capital losses of the Company including discretionary deductions such as capital cost allowance.
A future income tax asset of $6.5 million has been recorded as at December 31, 2010 in respect of the Company’s unutilized losses. Management regularly assesses the Company’s ability to realize on loss carry-forwards based on all relevant information available including, among other things, historical and projected future earnings, and has concluded that a valuation allowance is required in accordance with generally accepted accounting principles. Accordingly, the Company has recorded a valuation allowance related to these loss carry-forwards of $4.1 million. If the Company’s projected future earnings materialize to the extent required to permit the full realization of these loss carry-forwards, the Company would record an appropriate recovery of valuation allowance in the period when such a determination is made. This would result in an increase to reported earnings and an decrease to the Company’s effective tax expense rate in that period.

Management’s Discussion and Analysis continued...
Empire Industries Ltd. 2010 Annual Report 23
8. LIQUIDITY AND CAPITAL RESOURCES8.1 Sources and Uses8.1.1 Cash Flow Provided by Operations
2009
(1,108)
8(40)
(394)
(1,534)(2,417)
432
(3,519)(659)
(4,178)(5,376)
(9,554)
($0.05) ($0.06)
(Better) Worse
(2,401)
(287)(34)
(568)
(3,290)(892)
168
(4,014)453
(3,561)(201)
(3,762)
($0.04) ($0.00)
Cash Flow Provided by (Used in) OperationsFor the periods ended December 31 (in thousands, except per share amounts) EBITDA Add (deduct): Non-cash compensation expense Distributions (earnings) from equity and other investments Investment tax credits received Interest expense Capitalized interest Pre-tax cash flow provided by (used in) continuing operations Current income taxes Cash flow used in continuing operations Cash flow used in discontinued operations, after tax Cash flow used in operations Cash flow provided by (used in) continuing operations per share Cash flow provided by (used in) discontinued operations per share
2010
1,293
295(6)
174
1,756(1,525)
264
495(1,112)
(617)(5,175)
(5,792)
($0.01) ($0.06)
Twelve months ended
The Company’s EBITDA for 2010 improved by $2.4 million over 2009 with a $1.2 million increase in steel fabrication and installation services coupled with a $2.0 million increase in specialized engineered products and offset by a $0.7 million increase in net Corporate expenses. The factors underlying these changes are discussed in greater detail above under “Business Segment Performance.”
Non-cash compensation expense relates to stock based compensation expenses attributed to stock options issued and outstanding offset by recoveries for cancelled and expired stock options. The non-cash accretion in the convertible debentures was charged to interest expense and some interest on notes payable was capitalized as principal in accordance with the terms of the note rather than being settled in cash.

Management’s Discussion and Analysis continued...
Empire Industries Ltd. 2010 Annual Report 24
8.1.2 Non-Cash Working Capital
2009
$16,406 8,071 1,038
644(10,000)
16,159
Sources (Uses)
($1,283) $3,032 ($278) $453
$1,733
3,657
Non-cash Working CapitalAs at December 31 (in thousands) Accounts receivable Inventory Other Current Assets Intercompany receivable (liability) Accounts payable and accrued expenses
2010
$17,689 5,039 1,316
191(11,733)
12,502
Twelve months ended
Overall inventory levels at December 31, 2010 decreased $3.0 million from the same period last year, largely due to a decrease in Petrofield’s work-in-progress inventories associated with the discontinued operations of the process division.
Accounts receivable at December 31, 2010 increased $1.3 million from the prior year principally attributed to an increase in receivables in specialized engineered products (associated with final billings of holdbacks on a large ride system) offset by a decrease in receivables in steel fabrication and installation services in GTS, EIW and Hopkins. All subsidiaries continue to demonstrate consistent maintenance or improvement in accounts receivable collections over the past 12 months. Increases in overall receivables are also consistent with modest improvements in underlying sales activity in the most recent quarter.
Accounts payable and accrued expenses of $11.7 million at December 31, 2010 increased $1.7 million from December 31, 2009 reflecting increased sales activity levels resulting in higher underlying trade credit outstanding.
8.1.3 Net Capital Expenditures, Divestitures and InvestmentsCapital expenditures of $0.3 million for 2010 decreased $1.1 million over 2009 as the Company continues to actively limit its capital spending program to sustaining capital expenditures. The Company generated net proceeds from the sale of under-utilized or redundant assets of $1.4 million for 2010.
On July 20, 2010, the Company completed the sale of Petrofield hydrovac truck patents for $1.2 million in cash proceeds representing a gain on disposition of about $1.2 million. The proceeds from the sale of the patents were applied to reduce the Company’s draw on its overdraft facility as well as for general corporate purposes.

Management’s Discussion and Analysis continued...
Empire Industries Ltd. 2010 Annual Report 25
8.2 Debt8.2.1 Short-term Debt
2009
($9,554) $24,754 ($1,301)
$13,899 $12,963
($35)
$26,827
($2,619) ($7,237) ($3,694)
$13,277 ($27,016)
(13,739)
16,0003,237
Short-term DebtAs at December 31 (in thousands) Cash flow provided by (used ) operations Decrease (increase) in non-cash working capital Less: Other balance sheet adjustments Cash flow provided by operating activities Net capital and investment divestitures (expenditures) Other investments Free cash flow Financing activities Scheduled debt repayments, net of advances Non-scheduled debt repaymentsDecrease (increase) in cash and cash equivalents Sources (uses) of cash Bank operating loans, beginning of periods Bank operating loans, end of periods Revolving Credit facilities Revolving facilities Available uncommitted revolving facilities
2010
($5,792) $3,657 $1,212
($923) $1,137 $1,033
$1,247
$1,762 $-
$3,378
$6,387 ($13,739)
(7,352)
9,1001,748
Twelve months ended
The Company’s cash flow used in continuing operations was $0.6 million during 2010, an improvement of $3.6 million over 2009. The cash flow used in discontinued operations was $5.2 million during 2010 and $5.4 million in 2009. Therefore, in total, cash flow used in operations was $5.8 million in 2010, compared to cash flow used in operations of $9.5 million during 2009.
Non-cash working capital decreases generated a source of cash of $3.7 million in 2010 and $24.8 million in 2009. This was largely a result of the significant reduction in revenue that was generated in this two-year time frame plus an aggressive approach to working capital management. This total of $28.5 million provided more than enough cash to
fund the cash flow used in operations in 2010 and 2009 that totaled $15.3 million.
As described in Section 3 – Restructuring Plan, scheduled and non-scheduled debt repayments totaled $9.9 million in 2009. These debt reductions were more than funded through asset sales in 2009 and 2010 totaling $14.1 million. The four major asset sales were:
• Sale/leaseback of its Kingsway property;• Sale of its Combustion division;• Sale and licensing back of the hydrovac truck patents; and• Sale of redundant fixed assets.

Management’s Discussion and Analysis continued...
Empire Industries Ltd. 2010 Annual Report 26
On March 4, 2010, the Company completed the re-financing of its operating and term debt with the Canadian Western Bank. The proceeds of the re-financing were used to fully repay the amounts owed under the RBC Credit agreement and a revolving operating facility under the HSBC Credit Agreement. The re-financing strengthened the Company’s working capital through the issuance of long term debt to reduce the bank operating loan. The re-financing also resulted in certain vendor takeback notes becoming subordinated and/or postponed to the Canadian Western Bank facility.
The net effect of all of the above activities was that the bank operating loans reduced $19.6 million in the two year period between December 31, 2008 ($27.0 million) and December 31, 2010 ($7.4 million).
The Company’s marginable assets at December 31, 2010 were $9.8 million which was $0.7 million in excess of the Company’s maximum borrowing limit and $2.4 million in excess of the Company’s total draw on the operating line.
8.2.2 Long-term DebtThe Company made $1.8 million of scheduled principal repayments during the year combined with non-scheduled debt repayments of $2.2 million associated with the full repayment of the Company’s term debt to the Royal Bank of Canada.
Total long-term debt of $12.7 million as at December 31, 2010 consisted of $8.4 million of scheduled long-term debt including capital lease obligations, $0.3 million of notes payable and $4.0 million of subordinated notes. Of these amounts: $0.8 million is scheduled for repayment within the next 12 months, and an additional $0.3 million in notes payable are due on a demand basis. The subordinated notes payable are subordinated and postponed to the CWBank and cannot be repaid while the CWBank debt is outstanding.
8.2.3 Convertible Debentures The acquisition of Petrofield on November 30, 2007 included assuming convertible debentures (“the Debentures”) bearing interest at 8%, maturing June 1, 2011 and convertible into common shares at the rate of 100 common shares of EIL for each $67 of principal value. As at December 31, 2010, $60,000 of Debentures remained issued and outstanding, comprised of $60,000 ascribed to long-term debt and $12,975 ascribed to contributed surplus, offset by $12,975 in non-cash interest charged to retained earnings. During 2010, none of the Debentures had been converted into common shares.
8.3 Share Capital and Retained EarningsThe retained deficit of $30.2 million at December 31, 2010 was $17.8 million higher than the retained deficit at December 31, 2009 due to the net loss for 2010, including a $8.2 million goodwill impairment charge and a $2.8 million valuation allowance on the future tax value of the Company’s loss carry-forwards and investment tax credits. No dividends were declared or paid in the year.
The Company maintains a stock option plan for the benefit of officers, directors, key employees and consultants of the Company. The Company had 5,681,050 outstanding options at December 2010. The average exercise price of the outstanding options is $0.41 per share and the average exercise price of the 5,280,800 exercisable options is $0.40 per share.
8.4 Market CapitalizationThe market capitalization of the Company’s 131,239,608 issued and outstanding common shares at April 24, 2011 was $7.9 million or $0.06 per share compared with the Company’s book value of $0.069 per share at December 31, 2010. The issued and outstanding common shares at April 24, 2011, together with securities convertible into common shares are summarized in the table below.

Management’s Discussion and Analysis continued...
Empire Industries Ltd. 2010 Annual Report 27
131,239,608
89,552
6,600,000
20,000,0004,948,650
162,877,810
Fully Diluted SharesAs at April 24, 2011 (unaudited) Issued and outstanding common shares Securities convertible into common shares $60,000 - 8% convertible debentures, maturing June 1, 2011 convertible at 1,492.537 shares per $1,000 principal amount $660,000 - 10% convertible debentures, maturing Feb 14, 2016 convertible at 10,000 shares per $1,000 principal amount Warrants Stock Options
8.5 Financial RatiosThe following information is based on the table of Non-GAAP Terms, Reconciliations and Calculations presented at the end of this report.
The Company’s net funded debt of $16.7 million at December 31, 2010 decreased $5.1 million compared to the same date last year due to decreased non-cash working capital and proceeds from sale of capital assets in excess of sustaining capital expenditures, offset by cash flow used in operations as noted above under “Debt – Short-term Debt.”
The Company’s leverage ratio (net funded debt to capitalization) may fluctuate from month-to-month due to underlying cyclical and seasonal variations in short-term debt used to finance working capital requirements. The Company’s leverage ratio increased to 58.9% at December 31, 2010 from 55.4% at December 31, 2009.
The Company’s current ratio of 1.07 times at December 31, 2010 remained stable when compared to December 31, 2009.
9. RISKS AND UNCERTAINTIES9.1 Operating ResultsEIL’s mix of businesses typically require significant financial resources, and there is no assurance that future revenues will
be sufficient to generate the funds required to continue EIL’s business development and marketing activities. In certain markets, the Company competes with local, regional, national and international companies for work. With the experience of the Company’s operating subsidiaries, management believes it has developed systems, policies, and procedures to mitigate this risk.
9.2 Liquidity RequirementsThe Company requires significant amounts of working capital in order to be able to operate. The Company’s contracts are primarily based upon firm prices and billing is generally performed on a monthly basis. Projects often involve changes or requests for extra work and although the Company endeavours to bill promptly for this extra work, any delay in issuing change orders can impact cash flows. Construction projects typically allow for the general contractor to withhold between five and ten per cent of the Company’s total billings until the completion of the project. As a consequence, larger and longer-term projects can greatly increase capitalization requirements for working capital.
The Company’s ability to obtain additional capital is a significant factor in achieving its strategy of expansion in the construction industry. There can be no assurance that the current working capital of EIL will be sufficient to enable it to implement all of its objectives. Furthermore, the current

Management’s Discussion and Analysis continued...
Empire Industries Ltd. 2010 Annual Report 28
credit contraction in the world’s financial markets may limit the Company’s ability to access credit in the event that it identifies a potential acquisition or some other business opportunity that would require a significant investment in resources. There can be no assurance that if and when EIL seeks equity or debt financing, it will be able to obtain the required funding on favourable commercial terms, or at all. Any such future financing may also result in additional dilution to existing shareholders.
EIL requires sufficient financing to fund its operations. Failure to obtain financing on a timely basis could cause missed acquisition opportunities, delays in expansion and may also impact ongoing operations.
9.3 Credit RiskCredit risk arises from the possibility that customers may experience financial difficulty and be unable to fulfill their commitments to the Company. Notwithstanding the Company’s current credit policies and practices, there can be no assurance that customers will remain able to fulfill their commitments to the Company which may have an adverse effect on the Company’s financial performance.
9.4 Interest Rate RiskFluctuations in interest rates will affect that portion of the Company’s debt that is subject to variable interest rates, and will also affect the prices for other financial instruments. Such fluctuations could have an adverse effect on the Company’s financial performance.
9.5 Foreign Exchange RiskRapid currency fluctuations can have a significant impact on un-hedged non-Canadian dollar denominated projects. The Company has exported some fabricated steel products over the years to the United States and the purchase of DSL and Petrofield have increased the percentage of revenue from the United States, but a majority of these contracts have been hedged with forward contracts to sell US dollars.
9.6 Bonding CapacitySome customers require performance bonds underwritten by insurance providers, or irrevocable letters of credit as a condition of contract award. However, there can be no assurance that the Company will be able to obtain such bonds or letters of credit.
9.7 Cost of Raw MaterialThe principal cost of raw material is structural steel and other steel products. These supply and pricing arrangements are negotiated directly with steel manufacturers or steel supply companies that buy and warehouse steel products. Where appropriate, the company will endeavour to include an escalation clause for material costs in jobs being tendered in the industrial, commercial and institutional sector in each contract. In the absence of an escalation clause, the Company mitigates its risk, to the extent possible, through contracted buying arrangements or limitations on the length of time that bids can remain outstanding prior to acceptance. In the circumstance of volatility in the commodity price of steel, unexpected increases in steel prices which are not hedged by escalation clauses or similar means, may negatively impact margins on a particular job and therefore the company’s future results of operations or financial position.
9.8 Project PerformanceMost of EIL’s sales contracts are fixed-price contracts resulting from competitive bids. When bidding on a project, the Company estimates its costs, including projected increases in the costs of labour, materials and services. Despite these estimates, actual costs could vary from the estimated amounts. These variations could adversely affect the Company’s business. Any inability of the Company’s subsidiaries to execute customer projects in accordance with requirements, including adherence to completion timetables, may have a material adverse effect on the Company’s business, operations and prospects.

Management’s Discussion and Analysis continued...
Empire Industries Ltd. 2010 Annual Report 29
9.9 Percentage of Completion Accounting MethodThe Company recognizes revenue from its fabrication and erection contracts using the percentage of completion accounting method, based on costs incurred as compared to projected costs. Estimated losses on contracts are immediately recognized. Revenue estimates are based on management assumptions supported by historical experience. There can be no assurance that these estimates made during the contract execution phase will not vary from the actual results measured at the completion of the contract.
9.10 Competitive MarketCompetitors tend to be based in Western Canada and are virtually all privately or family owned businesses. The Company’s approach to competitive risk is to develop strong relationships with clients, increase the breadth of services offered and to broaden our geographic coverage to enhance service and competitiveness. From time to time, competitors out of the United States, Asia, Ontario and Quebec have bid on work and been awarded work in Western Canada. Incremental transportation costs, scheduling issues and quality standards have tended to make these options less attractive to owners and owners’ engineers.
Due to the competitive nature of the business, the Company must compete on price and quality of service. A significant portion of the Company’s business is to provide a contracted scope of work to clients on a fixed price or unit price basis. There can be no assurance that the fixed price commitment adequately recovers the full cost of providing the contracted scope of work. Nor can there be any assurance that the contracted scope of work is so clear as to prevent disagreements over the interpretation of what has been contracted for. Management is of the view that the Company’s experience in the industry provides it with the necessary expertise to resolve disputes that may arise in a manner that is satisfactory to the Company’s overall requirements.
9.11 Global Economic EnvironmentThe current economic downturn has demonstrated that businesses and industries throughout the world are very tightly connected to each other. Thus, events seemingly unrelated to the Company, such as the recent extraordinary developments in global financial markets, may adversely affect the Company over the course of time. For example, the credit contraction in financial markets, combined with reduced economic activity, may adversely affect general contractors and other businesses that collectively constitute a significant portion of the Company’s customer base. As a result, these customers may need to reduce their purchases of the Company’s products or services, or the Company may experience greater difficulty in receiving payment for the products or services that these customers purchase from the Company. Any of these events, or any other events caused by turmoil in world financial markets, may have a material adverse effect on the Company’s business, operating results, and financial condition.
9.12 Non-residential Construction Activity in Western Canada The demand for the Company’s products and services tends to fluctuate directly with non-residential construction activity. A decline in the demand for these products and services can occur if deteriorating economic conditions reduce non-residential capital expenditures which would have an adverse effect on the EIL’s business, results of operations, and financial condition.
A large portion of EIL’s revenues are derived from large projects (including joint ventures) which do not occur on a regular basis and could generate fluctuations in corporate revenues.
EIL’s business is primarily influenced by the overall level of capital spending in the mining and oil and gas industries in Western Canada. Lower commodity prices results in lower corporate profits which provides less available funds for

Management’s Discussion and Analysis continued...
Empire Industries Ltd. 2010 Annual Report 30
spending on capital projects. The Company’s activity level is therefore dependent on oil and gas prices and commodity prices.
9.13 Reliance on Key PersonnelThe business activities of the Company involve a certain degree of risk that even a combination of experience, knowledge and diligence may not be able to overcome. Shareholders must rely on the ability, expertise, judgment, direction and integrity of the management of EIL. Success will be dependent on the services of a number of key personnel, including its executive officers and other key employees, the loss of any one of whom could have an adverse effect on its operations and business prospects. The Company feels that by being a publicly traded company it will have more flexibility than its private competitors to implement attractive incentive plans for key employees to attract and retain the necessary employees.
9.14 Labour RelationsThe employment of skilled tradespersons in the field and shops is subject to multi-year, collective agreements with a variety of unions. The increasing shortage of skilled tradespersons is increasing the wage expectations and concessions of all fabricators and manufacturers, especially those companies that provide their services closest to the active markets, such as Alberta. The Company has six non-union shops, and seven unionized shops that are subject to their own collective agreements and three different collective agreements relating to the field erection business. EIL is at risk if there are labour disruptions relating to any of these collective agreements. Management feels the staggering and independence of each collective agreement mitigates the issue of work stoppage that may arise at any one location. The Company also believes it has fostered a positive relationship with its workers as is evidenced by zero work stoppages in over 40 years of operations.
9.15 AcquisitionsThe Company may seek to expand its business through acquisitions and may divest underperforming or non-core businesses. Empire’s success depends, in part, upon management’s ability to identify such acquisition and divestiture opportunities and to negotiate favourable contractual terms. The Company’s ability to successfully integrate acquisitions into its operations could affect Empire’s financial results.
9.16 Technological ChangeEIL assesses the “labour/capital” tradeoff that is associated with the increased usage of software to enhance employee productivity and increase profitability. Management has historically invested in prudent capital expenditures designed to mitigate the increasing cost of labour and the historically tight supply of skilled tradespersons. To the extent that the Company is unable to continue to invest in technological advancements designed to enhance its competitive cost structure, it may have an adverse effect on the Company’s operations and prospects.
9.17 Environment/RegulatoryEnvironmental legislation is evolving in a manner expected to result in stricter standards and enforcement, larger fines and liability and potentially increased capital expenditures and operating costs. No assurance can be given that environmental laws will not result in an increase in the costs of the Company’s activities or otherwise adversely affect the Company’s financial condition, results of operations or prospects.
EIL maintains insurance consistent with industry practice to protect against losses due to sudden and accidental environmental contamination, accidental destruction of assets, and other operating accidents or disruption. The Company also has operational and emergency response procedures, and safety and environmental programs in place to reduce potential loss exposure. EIL believes that it is in

Management’s Discussion and Analysis continued...
Empire Industries Ltd. 2010 Annual Report 31
substantial compliance, in all material respects, with all current environmental legislation and is taking such steps as it believes are prudent to ensure that compliance will be maintained.
10. FORWARD-LOOKING INFORMATIONThis Management’s Discussion and Analysis contains certain “forward-looking statements.” All statements, other than statements of historical fact, that address activities, events or developments that the Company believes, expects or anticipates will or may occur in the future (including, without limitation, statements regarding financial and business prospects and financial outlook) are forward-looking statements. These forward-looking statements reflect the current expectations or beliefs of the Company, based on information currently available to the Company. Forward-looking statements are subject to a number of risks, uncertainties and assumptions that may cause the actual results of the Company to differ materially from those discussed in the forward-looking statements and, even if such actual results are realized or substantially realized, there can be no assurance that they will have the expected consequences to, or effects on the Company. Factors that could cause actual results or events to differ materially from current expectations include, among other things, changes in general economic and market conditions, changes to regulations affecting the Company’s activities, and uncertainties relating to the availability and costs of financing needed in the future. Any forward-looking statement speaks only as at the date on which it is made and, except as may be required by applicable securities laws, the Company disclaims any intent or obligation to update any forward-looking statement, whether as a result of new information, future events or results or otherwise. Although the Company believes that the assumptions inherent in the forward-looking statements are reasonable, forward looking statements are not guarantees of future performance and, accordingly, undue reliance should not be put on such statements due to the inherent uncertainty therein.
11. OUTLOOKIn addition to other sections of the Company’s report, this section contains forward-looking information and actual outcomes may differ materially from those expressed or implied therein. For more information, see the section titled “Forward-Looking Information” is this MD&A.
In a pro-active effort to return the Company to profitability and to focus on areas of strategic importance, management made the decision to discontinue the Petrofield process business and the Trapp steel fabrication facility during 2010. The operating losses and shut-down costs of these two business units have been separated out to show how much of a financial drain these two businesses had on the Company in 2009 and 2010. This separation is also important because it shows the improving profitability of our two continuing segments more clearly (Section 5.1 – Steel Fabrication and Installation and Section 5.2 – Specialized Engineered Products).
The Company expects to benefit in the years ahead because of the significant reduction to its fixed costs of operation and the effect this will have on its operating leverage as sales and margins improve. There are two main categories of fixed costs; Operating, general and administrative expenses (OG&A) and Indirect and production expenses, both of which have been aggressively reduced. For example, OG&A from continuing operations in 2009 was $12.3 million. OG&A from continuing operations was reduced by $3.1 million (25%) in 2010 to $9.3 million. There was an additional reduction of $5.4 million of OG&A related to discontinued operations.
The Company’s continuing steel fabrication and erection operations in western Canada are focused on fabricating and erecting complex, industrial and infrastructure steel projects out of its four steel fabrication facilities. Management believes that the long-term outlook for business capital expenditures in western Canada is very positive and the near term outlook is improving steadily. The Company expects to benefit from this increased activity through better shop and field utilization rates and better pricing which will improve margins.

Management’s Discussion and Analysis continued...
Empire Industries Ltd. 2010 Annual Report 32
The Company’s backlog continues to grow as the economy strengthens and Empire’s contract awards increase. For example, backlog at December 31, 2010 of $19.5 million increased by $6.1 million to $25.6 million as of March 31, 2011.
As the Company returns to profitability, it will benefit from sheltering its profit through utilizing gross tax loss carry forwards of $25.8 million.
The Company’s aboriginal partnership in Fort McMurray, ACE Industrial Services, provides maintenance and related services to Alberta’s oilsands producers (welding, machining and installation services). The past two year’s results for ACE were negatively impacted by the reduction in capital spending but were positively affected by continued spending on maintenance services provided by ACE. Management believes that the outlook for ACE in 2011 and beyond is tied to the significantly increasing amount of capital and maintenance expenditures expected to be invested in the oilsands area of Alberta. ACE is expected to perform better in 2011 and beyond. Its field erection operations were strengthened at the end of 2010 having acquired a small erection firm in Fort McMurray during the year in order to expand its suite of services and strengthen its management team.
The Company executed a shareholders agreement dated March 18, 2011 to create a Chinese jointly owned company (45% owned by Empire Industries and 55% by The Qiguang Group). The purpose of the new joint stock Company will be: to actively participate in the steel fabrication market in China through the use of an existing leased steel fabrication facility in Guangdong Province; to actively look to export fabricated steel to Empire’s operations in Western Canada to be incorporated into projects bid on in Western Canada; to potentially manufacture some of the Company’s specialized engineered products in China (amusement rides, material handling equipment, hydrovac trucks and oil and gas process equipment). This would be accomplished through a transfer of technology and engineered product designs to the jointly owned company in China. It should be noted that the
Company will have access to use an existing 400,000 square foot leased steel fabrication facility in China which offsets the 200,000 square feet of more expensive shop capacity the Company divested itself of in western Canada.
The specialized engineered products segment’s hydrovac truck manufacturing division continues to see a steady growth in its backlog of orders and is expected to have a good year as the oil and gas service market strengthens and the hydrovac truck penetrates the central Canadian excavation market.
A world-class amusement ride project for a leading entertainment company in the U.S. was completed at the end of the second quarter of fiscal 2010 and the fabrication phase of a second amusement ride project for another leading entertainment company in the U.S. was substantially completed in 2010. Early in 2011, the Company was also awarded a $9 million contract for one of the leading entertainment companies. The Company is actively marketing its competitive strengths in this segment on the strength of its success in building some of the most innovative and exciting amusement rides in the world for two of the top entertainment companies in the world. The Company has completed over $300 million of work in the past 12 years in the amusement ride market niche, including award-winning contracts for the two industry leaders. Since the Company acquired Dynamic Structures in 2007, we have positioned Dynamic Structures to be the leader in the fast growing, amusement ride business in China and with park owners around the world, seeking to fulfill the growing middle class desire for entertainment.
Moreover, Dynamic Structures, using its unique engineering skills, is working with two partners to manufacture two new, proprietary machines that each have global market reach channel to market potential. Management expects these two opportunities could become a steady contributor of high value added manufacturing for it.
The Company continues to seek opportunities to dispose of certain remaining redundant or under-performing assets and pursue claims against certain contracts The Company is also

Management’s Discussion and Analysis continued...
Empire Industries Ltd. 2010 Annual Report 33
pursuing additional compensation on several projects that have had customer-driven changes to scope of work and schedules, as well as differences in site conditions, thereby strengthening its financial position to take full advantage of a recovery in its operating divisions.
The Company reviewed its capital requirements at year end and decided to strengthen its balance sheet to provide the working capital needed to pursue the opportunities listed above in its core business and to do so within a debt leverage ratio prudent for its shareholders and acceptable to its primary lender. The Company raised $2.0 million of equity and $0.7 million of convertible debenture on February 14, 2011, with over $2 million being subscribed for by officers and directors and insiders. On April 15, 2011, the Company announced that it intends to raise up to $3.0 million through a private placement of common shares and warrants.
USE OF NON-GAAP TERMSEarnings before interest, taxes, depreciation and amortization, gains or losses on asset disposals (“EBITDA”) and earnings before interest, taxes, gains or losses on assets disposals, (“EBIT”) are provided to assist investors in determining the ability of the Company to generate cash from operations to cover financial charges, income taxes, items not considered to be in the ordinary course of business and investing activities. A reconciliation of such measures to net income is provided in Note 25 to the Consolidated Financial Statements and in the table below. Certain items are excluded in the determination of such measures as they are non-cash in nature, income taxes, financing charges or otherwise are not considered to be in the ordinary course of business. EBITDA and EBIT provide important management information concerning business segment performance since the Company does not allocate all financing charges to these individual segments.
Such measures should not be considered in isolation to or as a substitute for (i) net income or loss, as an indicator of the Company’s operating performance or (ii) cash flows from operating, investing and financing activities, as a measure of the Company’s liquidity.
Free cash flow is provided to assist investors and is used by management in determining the cash flow available to meet ongoing financial obligations, including principal repayments on debt and refers to cash flow provided by operations less sustaining investing activities. Such measure should not be considered in isolation or as a substitute for cash flow provided by operations as a measure of the Company’s liquidity.
Net funded debt is provided to assist investors and is used by management in assessing the Company’s liquidity position and is used to monitor how much debt the Company has after taking into account the Company’s liquid assets such as cash and cash equivalents. Such a measure should not be considered in isolation or as a substitute for current liabilities, short-term debt, or long-term debt as a measure of the Company’s indebtedness.
Net funded debt to capitalization is provided to assist investors and is used by management to determine the Company’s leverage. The measure is applied net of cash and cash equivalents, as the Company either has the ability and may elect to use a portion of cash and cash equivalents to retire debt or to incur additional expenditures without increasing debt or to the extent that cheques are drawn in excess of funds on deposit, the resulting bank indebtedness represents a further increase in net funded debt.
Such measures do not have any standardized meanings prescribed by Canadian GAAP and are therefore unlikely to be comparable to similar measures presented by other companies. Reconciliations of each of the calculations in respect of the above measures are provided in the table below.

Management’s Discussion and Analysis continued...
Empire Industries Ltd. 2010 Annual Report 34
Non-GAAP Terms, Reconciliations and CalculationsFor the periods ended December 31 (in thousands, except percentages and ratios) Gross Profit Earnings from equity investment Operating, general and administration expenses EBITDA from continuing operations Amortization EBIT from continuing operations Cash flow provided by operations Decrease (increase) in working capital Property, plant and equipment expenditures Proceeds from disposal of property, plant and equipment Decrease (increase) in other long-term assets Free cash flow Bank operating loans Current portion of long-term debt and notes payable Long-term debt reclassified to current portion Long-term debt and notes payable Bank indebtedness Net funded debt Convertible debentures Subordinated shareholder loans Deferred gain on sale and leaseback Shareholders’ equity Less: Goodwill and intangible assets Tangible net worth Capitalization Net funded debt : Capitalization Current assets Current liabilities Working capital Current ratio (Current assets : Current liabilities)
2009
11,18340
(12,331)
(1,108)(2,776)
(3,884)
(9,554)23,453(1,412)14,374
(35)
26,826
13,7393,631
07,078
(2,674)
21,774
540
2,33023,774(8,628)
17,530
39,304
55.4%
31,28628,606
2,680
1.09
(Better) Worse
601(43)
(2,959)
(2,401)(403)
(2,804)
(3,762)18,584(1,068)12,893(1,068)
25,579
(6,387)(1,812)
0(251)3,378
(5,072)
64,004(780)
(17,518)8,404
(5,884)
(10,956)
3.5%
(7,011)(5,832)
(1,179)
(0.03)
2010
10,58283
(9,372)
1,293(2,373)
(1,080)
(5,792)4,869(344)1,4811,033
1,247
7,3521,819
06,827
704
16,702
604,0041,5506,256(224)
11,646
28,348
58.9%
24,27522,774
1,501
1.07
Twelve months ended

Management’s Report
Empire Industries Ltd. 2010 Annual Report 35
Management’s ReportTo the Shareholders of Empire Industries Ltd.
The accompanying consolidated financial statements of Empire Industries Ltd. contained in this report, including the notes thereto, have been prepared by management in accordance with Canadian generally accepted accounting principles and include certain estimates that reflect management’s best judgments. In addition, the financial information contained elsewhere in this annual report is consistent with the financial statements.
The Board of Directors is responsible for the financial statements included in this annual report. The Audit Committee reviewed the contents of the consolidated financial statements with management and the external auditor prior to their approval by the Board of Directors. The external auditors discussed their audit work with the Committee.
Management has overall responsibility for internal controls and maintains accounting control systems designed to provide reasonable assurance that transactions are properly authorized, assets safeguarded and that the financial records form a reliable base for the preparation of accurate and timely financial information.
Guy Nelson, MBA, B.Comm. Campbell McIntyre, CAChief Executive Officer Chief Financial Officer
April 29, 2011

Independent Auditor’s Report
Empire Industries Ltd. 2010 Annual Report 36
April 29, 2011
Independent Auditor’s Report
To the Shareholders ofEmpire Industries Ltd.
We have audited the accompanying consolidated financial statements of Empire Industries Ltd. and its subsidiaries, which comprise the consolidated balance sheets as at December 31, 2010 and December 31, 2009 and the consolidated statements of operations, shareholders’ equity, and cash flows for the years then ended, and the related notes including a summary of significant accounting policies.
Management’s responsibility for the consolidated financial statementsManagement is responsible for the preparation and fair presentation of these consolidated financial statements in accordance with Canadian generally accepted accounting principles, and for such internal control as management determines is necessary to enable the preparation of consolidated financial statements that are free from material misstatement, whether due to fraud or error.
Auditor’s responsibilityOur responsibility is to express an opinion on these consolidated financial statements based on our audits. We conducted our audits in accordance with Canadian generally accepted auditing standards. Those standards require that we comply with ethical requirements and plan and perform the audit to obtain reasonable assurance about whether the consolidated financial statements are free from material misstatement.
An audit involves performing procedures to obtain audit evidence about the amounts and disclosures in the consolidated financial statements. The procedures selected depend on the auditor’s judgment, including the assessment of the risks of material misstatement of the consolidated financial statements, whether due to fraud or error. In making those risk assessments, the auditor considers internal control relevant to the entity’s preparation and fair presentation of the consolidated financial statements in order to design audit procedures that are appropriate in the circumstances, but not for the purpose of expressing an opinion on the effectiveness of the entity’s internal control. An audit also includes evaluating the appropriateness of accounting policies used and the reasonableness of accounting estimates made by management, as well as evaluating the overall presentation of the consolidated financial statements.
We believe that the audit evidence we have obtained in our audits is sufficient and appropriate to provide a basis for our audit opinion.
PricewaterhouseCoopers LLPChartered AccountantsOne Lombard Place, Suite 2300Winnipeg, ManitobaCanada R3B 0X6Telephone +1 (204) 926 2400Facsimile +1 (204) 944 1020

Independent Auditor’s Report continued...
Empire Industries Ltd. 2010 Annual Report 37
OpinionIn our opinion, the consolidated financial statements present fairly, in all material respects, the financial position of Empire Industries Ltd. and its subsidiaries as at December 31, 2010 and December 31, 2009 and their results of operations and cash flows for the years then ended in accordance with Canadian generally accepted accounting principles.
Emphasis of matter Without qualifying our opinion, we draw attention to Note 2 to the consolidated financial statements which describes matters and conditions that indicate the existence of a material uncertainty that may cast significant doubt about the entity’s ability to continue as a going concern.
Chartered Accountants
“PricewaterhouseCoopers” refers to PricewaterhouseCoopers LLP, an Ontario limited liability partnership, which is a member firm of PricewaterhouseCoopers International Limited, each member firm of which is a separate legal entity.

Consolidated Balance Sheets
Empire Industries Ltd. 2010 Annual Report 38
EMPIRE INDUSTRIES LTD.Consolidated Balance SheetsAs at December 31Amounts Reported in thousands (000’s)
Assets
Current assets: Cash (Note 14) Accounts receivable (Note 7) Receivable from related party (Note 8) Income taxes recoverable Inventories (Note 9) Prepaid expenses and deposits Assets held for sale (Note 12) Current portion of other long-term assets Foreign exchange hedge contracts (Note 10) Future income taxes (Note 19)
Other long-term assetsAdvances to related party (Note 11)Investments (Note 11)Property, plant and equipment (Note 12)Intangible assets (Note 13)Goodwill (Note 13)Future income taxes (Note 19)
Liabilities and Shareholder’s Equity
Current liabilities: Bank indebtedness (Note 14) Bank operating lines (Note 14) Accounts payable and accrued liabilities Income taxes payable Long-term debt due within one year - Long-term debt (Note 15) Notes payable (Note 16) Convertible debentures (Note 17) Deferred gain on sale and leaseback (Note 18) Future income taxes (Note 19)
Long-term debt (Note 15)Notes payable (Note 16)Convertible debentures (Note 17)Deferred gain on sale and leaseback (Note 18)Future income taxes (Note 19)
Going concern basis of presentation (Note 2)
Shareholders’ equity: Capital stock (Note 20) Contributed surplus (Note 21) Retained deficit
See accompanying notes to the consolidated financial statements
Approved by the Board: Director Director
2010
$ 4017,689
19114
5,03948967438
101-
24,275
146314
1,30914,071
224-
1,684$ 42,023
$ 7447,352
11,566167
1,5491,070
60266
-22,774
6,8273,204
-1,2841,678
35,767
34,7201,753
(30,217)6,256
$ 42,023
2009
$ 2,67416,406
64459
8,071979
-27
2,233193
31,286
40291
1,30119,138
4558,1732,442
$ 63,126
$ -13,7399,805
195
1,6341,997
-442794
28,606
3,2673,811
541,8881,726
39,352
34,7201,458
(12,404)23,774
$ 63,126

Consolidated Statements of Operations
Empire Industries Ltd. 2010 Annual Report 39
EMPIRE INDUSTRIES LTD.Consolidated Statements of OperationsFor the years ended December 31
Sales
Cost of goods sold
Gross profit
Operating, general and administrative expenses Stock based compensation expense (Note 21) Income from equity accounted for investments (Note 11) Other incomeEarnings before the undernoted from continuing operations
Amortization of property, plant and equipmentAmortization of intangible assetAmortization of other assets
Operating loss from continuing operations
Interest on long term debt and notes payableOther interest
Other income (expenses): Amortization of deferred gain on sale and leaseback Gain (loss) on disposal of property, plant and equipment, intangibles and other assets (Note 29) Other income Impairment loss on goodwill (Note 13) Unrealized gain (loss) on foreign exchange hedge contracts (Note 10)
Net loss from continuing operations before income taxes
Income taxes recovery (expense) – continuing operations: (Note 19) Current Future
Net loss from discontinued operations, net of tax (Note 5)
Net loss
Loss per share: Basic and diluted from continuing operations (Note 6) Basic and diluted from discontinued operations (Note 6)
See accompanying notes to the consolidated financial statements
2010
$ 66,037
(55,455)
10,582
(9,252)(295)
83175
1,293
(1,974)(224)(175)
(2,373)
(1,080)
(1,018)(507)
(2,605)
266
1,1532-
(2,132)
(3,316)
(1,112)596
(516)(3,832)
(13,981)
$ (17,813)
$ (0.04)(0.16)
2009
$ 67,907
(56,724)
11,183
(12,323)(8)40
-(1,108)
(2,617)(73)(86)
(2,776)
(3,884)
(1,504)(913)
(6,301)
176
(2,539)-
(4,550)2,835
(10,379)
(659)1,244
585(9,794)
(5,668)
$ (15,462)
$ (0.11)(0.06)

Consolidated Statements of Shareholders’ Equity
Empire Industries Ltd. 2010 Annual Report 40
EMPIRE INDUSTRIES LTD.Consolidated Statements of Shareholders’ EquityFor the years ended December 31
As at December 31, 2009 Stock-based compensation expense Net loss for the period
As at December 31, 2010
See accompanying notes to the consolidated financial statements
Retained Deficit
$ (12,404)-
(17,813)
$ (30,217)
Share Capital
$ 34,720--
$ 34,720
Contributed Surplus
$ 1,458295
-
$ 1,753
Total Shareholders Equity
$ 23,774295
(17,813)
$ 6,256

Consolidated Statements of Cash Flow
Empire Industries Ltd. 2010 Annual Report 41
EMPIRE INDUSTRIES LTD.Consolidated Statements of Cash FlowFor the years ended December 31
Cash provided by (used in):Operating activities: Net loss for the year from continuing operations Amortization Deferred gain on sale or leaseback Loss (gain) on disposal of property, plant and equipment, intangibles and other assets Impairment loss on goodwill (Note 13) Impairment loss on investments (Note 11) Income from equity accounted for investments (Note 11) Non-cash interest expense Stock-based compensation Unrealized foreign exchange hedge contract loss (gain) (Note 10) Future income taxes Investment tax credits received (accrued)
Cash flow used in continuing operations
Cash flow used in discontinued operations
Cash flow used in operations
Change in non-cash working capital
Cash flow provided by (used in) operating activities
Investing activities: Proceeds on disposal of property, plant and equipment Purchase of property, plant & equipment Proceeds on disposal of intangible assets (Note 13) Increase in other long-term assets
Financing activities: Decrease in bank operating lines Issue of long-term debt Repayment of long-term debt Repayment of notes payable
Change in cash and cash equivalents
Cash and cash equivalents, beginning of the year
Cash and cash equivalents, end of the year
Supplementary cash flow information:
Interest paid
Income taxes recovered
See accompanying notes to the consolidated financial statements
Cash and cash equivalents is comprised of: Cash Bank indebtedness
2010
$ (3,832)2,373(266)
(1,153)-
75(83)264295
2,132(596)
174
(617)
(5,175)
(5,792)
4,869
(923)
1,481(344)1,200(167)2,170
(6,387)7,505
(3,928)(1,815)(4,625)
(3,378)
2,674
$ (704)
$ 1,572
$ 494
40(744)(704)
2009
$ (9,794)2,776(176)2,5394,550
-(40)432
8(2,835)(1,244)
(394)
(4,178)
(5,376)
(9,554)
23,453
13,899
14,374(1,412)
8(43)
12,927
(13,277)79
(9,743)(191)
(23,132)
3,694
(1,020)
$ 2,674
$ 2,702
$ 789
2,674-
2,674

Notes to the Consolidated Financial Statements
Empire Industries Ltd. 2010 Annual Report 42
1. Nature of the business The consolidated financial statements include the accounts of Empire Industries Ltd. (the “Company” or “Empire”) and its wholly-owned subsidiaries, Empire Iron Works Ltd., George Third & Son Ltd., Dynamic Structures Ltd., Petrofield Industries Inc. (formerly Tornado Technologies Inc.), and its 49% investment in ACE Industrial Services (ACE). The investment in ACE is accounted for using the equity method.
The financial statements of Empire Iron Works Ltd. contained herein include the accounts of its wholly owned subsidiaries, Hopkins Steel Works Limited, Ward Industrial Equipment Ltd., and Parr Metal Fabricators Ltd. The financial statements of George Third & Son Ltd. contained herein include the accounts of its wholly owned U.S. subsidiary, KWH Constructors Inc. The financial statements of Dynamic Structures Ltd. contained herein include the investment in two 50% joint ventures with AMEC International (Canada) Ltd. which are accounted for under the proportionate consolidation method. The financial statements of Petrofield Industries Inc. contained herein include the accounts of its wholly owned subsidiary, 1366377 Texas Inc. (formerly Tornado Technologies, Inc.).
On January 1, 2011 the Company amalgamated Petrofield Industries Inc., Empire Iron Works Ltd., Ward Industrial Equipment Ltd., Parr Metal Fabricators Ltd., Hopkins Steel Works Limited and Dynamic Structures Ltd into one operating company called Empire Iron Works Ltd. Empire Industries Ltd. and George Third & Son Ltd were not included in the amalgamation. The operations of George Third & Son were discontinued in 2010 (Note 5).
2. Going concern basis of presentationThese consolidated financial statements have been prepared by management on a going concern basis in accordance with Canadian generally accepted accounting principles (“GAAP”). The going concern basis of presentation assumes that the Company will continue in operation for the foreseeable future and will be able to realize its assets and discharge its
liabilities and commitments in the normal course of business as they come due. If the going concern basis of accounting is not appropriate for these consolidated financial statements, then adjustments would be necessary in the carrying value of assets and liabilities, the reported revenues and expenses and the balance sheet classifications used and such adjustments could be material.
The Company’s debt obligations are described in Notes 14, 15, 16 and 17 and certain of these debt obligations are subject to financial covenants that are based on recognized assets and liabilities, operating results and the amount of the debt obligations outstanding. The Company was not in compliance with one of its financial covenants at December 31, 2010 (Note 25). Subsequent to December 31, 2010, the Company has obtained a waiver for this covenant violation. In addition, the Company’s ability to maintain compliance with its other financial covenants in the future is dependent upon various factors, some of which are outside the control of the Company.
Based on uncertainties associated with the Company’s ability to meet its current operating projections which could be impacted by, but not limited to, negative cash flow from operations, the possibility of higher interest rates, commodity price increases, curtailment in industrial or institutional capital spending, credit losses, access to bonding, or a combination of these factors, the Company may be unable to maintain compliance with its financial covenants in the future. Failure to maintain financial covenants under its credit facilities may result in default permitting the lender to demand payment of amounts outstanding under the lending agreement. These circumstances may lend significant doubt to the ability of the Company to meet its obligations as they come due and, accordingly, the use of accounting principles applicable to a going concern may not be appropriate.
To meet these potential demands, the Company has generated additional cash flows through the refinancing of its
EMPIRE INDUSTRIES LTD.Notes to the Consolidated Financial StatementsDecember 31, 2010 and 2009Amounts reported in thousands ($000’s)

Notes to the Consolidated Financial Statements continued...
Empire Industries Ltd. 2010 Annual Report 43
operating and term debt (Note 14) and through a subsequent private placement (Note 30). The Company has discontinued the operations of two unprofitable divisions (Note 5) and reduced the cost structure of its continuing operations. The Company is proactively looking at all available alternatives in implementing the Company’s plans. The Company continues to aggressively pursue strategies to improve operating results, cash flows and capital structure in order to ensure the availability of funds to continue to meet its obligations. However, there can be no assurance as to their outcome or success.
3. Significant accounting policiesThese consolidated financial statements include the following significant accounting policies:
(a) Use of significant accounting estimatesThe preparation of consolidated financial statements in conformity with Canadian GAAP requires management to make estimates and assumptions that affect the reported amounts of assets and liabilities and the disclosure of contingent assets and liabilities as at the dates of the consolidated financial statements and the reported amounts of revenues and expenses during the reporting periods covered by the financial statements. Actual results could differ materially from those estimates. The principal financial statement components subject to measurement uncertainty include sales and accounts receivable due to the uncertainty inherent in estimating the costs of completing construction projects and estimating amounts ultimately realizable on unpriced change orders (Note 7), the carrying value of property, plant and equipment (Note 12) and the carrying value of future tax assets and liabilities (Note 19).
(b) Comprehensive incomeComprehensive income comprises net income and other comprehensive income and includes all changes in equity (net assets) of the Company during the year except those resulting from investment by and distribution to owners.
(c) Fair valuesFair values of assets and liabilities approximate amounts at which these items could be exchanged in a transaction between knowledgeable parties. Fair value is based on available public market information or when such information
is not available is estimated using present value techniques and assumptions concerning the amount and timing of future cash flows and discount rates which factor in the appropriate credit risk. The calculation of estimated fair value is based on market conditions at a specific point in time and in the respective geographic locations and may not be reflective of future fair values. Changes in interest rates, foreign exchange rates and investment risk are the primary causes of changes in the fair value of the Company’s financial instruments.
(d) Foreign currencyMonetary assets and liabilities are translated to Canadian dollars at exchange rates in effect at the balance sheet date and non-monetary assets and liabilities are translated to Canadian dollars at exchange rates in effect when the assets were acquired or obligations incurred. Revenues and expenses are translated to Canadian dollars at the average rate of exchange during the year, which approximates the actual exchange rate on the transaction date. Exchange gains and losses on translation of foreign currencies are recorded on the statement of operations in sales.
(e) Cash and cash equivalentsCash and cash equivalents consist of cash and short-term investments with maturities of less than 90 days, net of bank indebtedness.
(f) InventoriesRaw material inventory is stated at the lower of cost, on a specific unit basis, and net realizable value. Inventory of finished goods and work in progress are stated at the lower of the average cost and net realizable value. Costs include the purchase costs net of supplier allowances and the allocation of handling costs including transportation and labour to bring the inventories to their present location. Storage costs and administrative overheads and selling expenses related to inventories are expensed in the period costs are incurred.
Structural steel inventory includes handling costs associated with bringing the inventory to its present location. As soon as inventory of structural steel is commissioned for a job it is transferred to unbilled receivables where direct labour and overheads are accumulated until they are billed. Inventory relating to specialty engineered products is transferred to work-in-progress upon being commissioned where direct

Notes to the Consolidated Financial Statements continued...
Empire Industries Ltd. 2010 Annual Report 44
labour and overheads are accumulated until they are transferred to finished goods.
Inventories are written down to net realizable value when the cost of inventories is estimated to be greater than the anticipated selling price. Materials held for further use in the production of finished inventory are written down to the extent the material cost and estimated cost to complete exceeds net realizable value. When circumstances that previously required inventories to be written down below cost no longer exist, the amount of the write-down is reversed.
(g) Property, plant and equipmentProperty, plant and equipment other than product development costs are recorded at cost and amortized over their estimated useful lives. Product development costs represent the cost of material, direct labour and overhead attributable to the development of a prototype product template used in the
manufacture of goods for sale and is amortized over its estimated useful life. This requires the estimation of the useful life of the asset and its salvage and residual value.
Property, plant and equipment are reviewed for impairment when events and circumstances indicate that the carrying amount of an asset may not be recoverable. The Company’s policy is to record an impairment loss when it is determined that the carrying amount of the asset exceeds the sum of the expected undiscounted future cash flows resulting from use of the asset and its eventual disposition. Impairment losses are measured as the amount by which the carrying amount of the asset exceeds its fair value and is recognized as an expense in the period of impairment.
Amortization is calculated on a declining balance basis for all but leasehold improvements which are amortized on a straight line basis at the following annual rates:
(h) Impairment of long-lived assetsLong-lived assets are reviewed for impairment when events and circumstances indicate that the carrying amount of an asset may not be recoverable. The Company’s policy is to record an impairment loss when it is determined that the carrying amount of the asset exceeds the sum of the expected undiscounted future cash flows resulting from use of the asset and its eventual disposition. Impairment losses are measured as the amount by which the carrying amount of the asset exceeds its fair value and is recognized as an expense in the period of impairment. Long-lived assets to be disposed of are reported at the lower of the carrying amount or fair value less costs to sell.
(i) Intangible assetsGoodwill is the excess of the cost of an acquired enterprise
over the fair value of the identifiable net assets acquired and liabilities assumed at the date of acquisition. Goodwill is not amortized but is subject to a fair value impairment test performed at least annually or more frequently if events or circumstances indicate that goodwill could be impaired. Testing for impairment is accomplished by determining whether a reporting unit’s fair value exceeds its net carrying amount as of the assessment date. A reporting unit is a component of a segment in which discrete financial information is available and the segment management regularly reviews the operating results of the component. A discounted cash flow model is used to estimate the fair value of a reporting unit. This model requires the use of long-term projections and assumptions regarding industry specific economic conditions that are outside the Company’s control. If the fair value is greater than the carrying amount, no
Rate
2.5%10.0%15.0%
20% to 45%30.0%
remaining term of the lease
Asset
Declining balance:Buildings and stationary cranesPortable buildings, stationary machinery & equipment and parking lotsProduct developmentOffice furniture & equipment and moveable cranesMoveable machinery and equipment and vehicles
Straight line:Leasehold improvements

Notes to the Consolidated Financial Statements continued...
Empire Industries Ltd. 2010 Annual Report 45
impairment is necessary. Should the carrying amount exceed fair value, an impairment loss would be recognized at that time.
Patents are amortized on a declining balance of 5%. Computer software development costs are amortized on a straight line basis over a remaining useful life of two years. Other intangible assets are reviewed for impairment when events and circumstances indicate that the carrying amount of an asset may not be recoverable. The Company’s policy is to record an impairment loss when it is determined that the carrying amount of the asset exceeds the sum of the expected undiscounted future cash flows resulting from use of the asset and its eventual disposition. Impairment losses are measured as the amount by which the carrying amount of the asset exceeds its fair value and is recognized as an expense in the period of impairment.
(j) Income taxesThe Company uses the asset and liability method to account for income taxes. The asset and liability method requires that income taxes reflect the expected future tax consequences of temporary differences between the financial statement carrying amounts of existing assets and liabilities and their respective tax bases. Future income tax assets and liabilities are measured using the enacted or substantively enacted tax rates expected to apply to taxable income in the years in which those temporary differences are expected to be realized. Under the asset and liability method, the effect of future tax assets and liabilities of a change in tax rate is recognized in income in the period that includes the enactment date or date of substantive enactment.
(k) Revenue recognitionThe Company recognizes revenue on two different methods depending on the nature of the contracts performed.
Revenue and income from construction contracts are determined on the percentage of completion method, based on the ratio of costs incurred to date over estimated total costs. This method is used because management considers expended costs to be the best available measure of progress on these contracts. Contract costs include all direct material and labour costs. Provisions are recorded for anticipated contract losses as soon as they are evident. Contract revenues and
costs are adjusted to reflect change orders that have been approved as to both price and scope. For change orders that have not been approved as to price or are unpriced, contract revenues and projected costs to complete are estimated by management. In circumstances where significant advance purchases under a contract, such as materials, would result in a materially higher percentage of completion estimate for sales, gross profit and accounts receivable than indicated by other measures such as labour hours, management adjusts the percentage of completion to the lower level indicated by the alternative measure.
Revenues from the design, fabrication and installation of equipment are recorded when the products are completed and accepted by the customer or the services are rendered and collection is reasonably assured. Any foreseeable losses on contracts are charged to operations at the time they become evident. Revenues from the sale of used equipment are recognized when title passes from the Company to its customers and collection is reasonably assured. Revenues from leasing of equipment that qualify as equipment sales are generally recognized at the time of delivery and acceptance of the related equipment. Revenues from operating leases are recognized over the lease term including estimated renewal periods.
(l) Stock-based compensation and paymentsThe Company follows the fair value method of accounting for stock-based compensation and payments. This method requires the Company to expense the fair value of each new option or warrant granted in the statement of operations.
The fair value of the options granted is estimated on the date of grant using the Black-Scholes option-pricing model. Compensation expense is recognized over the vesting period with a corresponding credit to contributed surplus. Any consideration paid by the option holder on exercise of the option is credited to share capital.
The fair value of warrants granted is estimated on the date of grant using the Black-Scholes option-pricing model. The cost is recognized in the current period with a corresponding credit to contributed surplus. Any consideration paid by the warrant holder on exercise of the warrant is credited to share capital.

Notes to the Consolidated Financial Statements continued...
Empire Industries Ltd. 2010 Annual Report 46
(m) Earnings (loss) per shareEarnings (loss) per share amounts are calculated using the weighted average number of shares outstanding during the period. The dilutive effect on per share amounts resulting from outstanding options and warrants is calculated using the treasury stock method. Under this method, the diluted weighted average number of shares is calculated assuming the proceeds that arise from the exercise of the outstanding options and warrants are used to purchase shares of the Company at the average market price for the period.
(n) Financial instrumentsAll financial assets must be designated as either held for trading, available for sale, loans and receivables or held to maturity. All financial liabilities must be designated as either held for trading or other liabilities. Initial measurement of financial instruments is at fair value. Financial derivative instruments are used by the Company
to reduce its exposure to fluctuations in foreign currency exchange rates. In the normal course of operations, the Company does not hold or issue derivative instruments for derivative trading purposes. Any change in the value of the derivatives is reported in earnings in unrealized foreign exchange contracts gains and losses, unless the derivative qualifies as a cash flow hedge and hedge accounting is applied. Any change in the value of those derivatives that are embedded in a financial instrument or other contract but are not closely related to the host financial instrument or contract, respectively are included in the statement of operations. For derivatives classified as cash flow hedges, the effective portion of the change in fair value would be recognized in other comprehensive income (“OCI”) and any ineffective portion is recognized in the statement of operations. Amounts accumulated in other comprehensive income are reclassified to net earnings when the hedged item is recognized.
The Company classifies its financial instruments as follows:
Financial assets and liabilities designated as held for trading are subsequently measured at fair value with periodic changes in fair value recognized in net earnings in the period in which it arises. Investments classified as available-for-sale that do not have a quoted market price in an active market are measured at cost.
Financial assets designated as loans and receivable or held to maturity and financial liabilities designated as other liabilities are subsequently measured at amortized cost and income or expense is recognized in net earnings using the effective interest method.
Financial assets classified as available-for-sale are carried at fair value with changes in fair value recorded in accumulated OCI until the financial asset is derecognized through disposal or becomes impaired at which time they flow through net earnings.
Transaction costs are expensed as incurred for financial instruments classified or designated as held for trading. For other financial instruments, transaction costs are capitalized on initial recognition and are measured at amortized cost using the effective interest method. Transaction costs are incremental costs that are directly attributable to the
Classification
Held for tradingLoans and receivablesLoans and receivablesLoans and receivables
Available-for-saleOther liabilitiesOther liabilitiesOther liabilitiesHeld for tradingOther liabilitiesOther liabilitiesOther liabilitiesOther liabilities
Financial Instrument
CashAccounts receivableReceivable from related partyIncome taxes recoverableInvestmentsBank indebtednessBank operating linesAccounts payable and accrued liabilitiesForeign exchange hedge contractsIncome taxes payableLong-term debtNotes payableConvertible debentures

Notes to the Consolidated Financial Statements continued...
Empire Industries Ltd. 2010 Annual Report 47
acquisition, issue or disposal of a financial asset or financial liability.
(o) Currency hedgeIn the normal course of business the Company utilizes US dollar denominated financial instruments to manage its exposure to fluctuations in US dollar sales. The Company’s policy is not to utilize derivative financial instruments for trading or other speculative purposes.
The Company has designated these instruments as fair value hedges. The Company does not apply hedge accounting to these instruments. As a result, these derivative instruments are recorded at fair value in the consolidated balance sheet with changes in the fair value recognized in net earnings during the period.
4. Future changes to accounting policies(a) In February 2008, the AcSB confirmed that Canadian public entities will have to adopt International Financial Reporting Standards (“IFRS”) effective for fiscal years beginning on or after January 1, 2011 (the “changeover date”). The Company will issue consolidated financial statements in accordance with IFRS commencing in the first quarter ended March 31, 2011, with comparative information. The impact of the adoption of IFRS on the consolidated financial statements of the Company may be significant and, as such, the Company has begun to develop its convergence plan in order to transition its financial statement reporting, presentation and disclosure for IFRS to meet the January 1, 2011 deadline. The Company continues the process of evaluating the potential impact of IFRS on its consolidated financial statements. The process will be on going as new standards and recommendations are issued by the International Accounting Standards Board and AcSB.
(b) In January 2009, the CICA issued Handbook Section 1582 - Business Combinations, which replaces Section 1581 and
Section 1601 - Consolidated Financial Statements, and Section 1602 - Non-Controlling Interests, which together replace Section 1600 effective January 1, 2011. Under Section 1582, the purchase price used in a business combination is based on the fair value of shares exchanged at their market price at the date of acquisition. Furthermore, virtually all acquisition costs will be expensed which currently are capitalized as part of the purchase price. Contingent liabilities are to be recognized at fair value at the acquisition date and remeasured at fair value through earnings for each period until settled. Currently, only the contingent liabilities that are resolved and payable are included in the cost to acquire the business. In addition, negative goodwill will be recognized immediately in earnings, unlike the current requirement to eliminate it by deducting it from assets in the purchase price allocation. Sections 1601 and 1602 revise and enhance the standards for the preparation of consolidated financial statements subsequent to a business combination.
The future changes to accounting policies outlined in sections (a) and (b) above come into effect for financial periods beginning January 1, 2011 with prospective application. The impact of the adoption of this standard cannot be reasonably estimated at this time.
5. Discontinued operationsDuring 2010, the Company made the decision to cease operating its processing division in Petrofield Industries Ltd, as well its steel fabrication operation in George Third & Son Ltd. In 2010 (Trapp facility), the Company successfully terminated the lease of its remaining manufacturing facility directly related to the processing division and ceased operations in its steel fabrication facility. As a result, the Company has reported the results for the processing division and the steel fabrication facility as discontinued operations in its consolidated statement of operations. The KWH Constructors Inc. field operations included in George Third & Son Ltd is continuing with the core operations of the Company.

Notes to the Consolidated Financial Statements continued...
Empire Industries Ltd. 2010 Annual Report 48
Included in the net loss from discontinued operations for 2010 of the steel fabrication facility at the Trapp plant are exit and disposal costs of $320 relating to severances and lease
termination costs, an impairment loss on goodwill of $8,173 and asset write-offs with a net book value of $186.
Basic earnings (loss) per share are derived by dividing net the earnings (loss) for the period by the weighted average number of common shares outstanding for the period. The effect
of potentially dilutive securities (“in-the-money” executive stock options, “in-the-money” warrants and convertible debentures) are excluded if they are anti-dilutive.
6. Loss per shareFor the year ended December 31:
Net lossfor the period
(000’s)
$ (3,832)
$ (13,981)
$ (17,813)
Shares
91,239,608
91,239,608
91,239,608
Per Share
$ (0.04)
$ (0.16)
$ (0.20)
Net lossfor the period
(000’s)
$ (9,794)
$ (5,668)
$ (15,462)
Shares
91,239,608
91,239,608
91,239,608
Per Share
$ (0.11)
$ (0.06)
$ (0.17)
2010 2009
Basic and diluted loss per share from continuing operations
Basic and diluted loss per share from discontinued operations
Basic and diluted loss per share
December 31, 2010 $ 1,311$ (3,371)$ (3,207)
December 31, 2010 $ 13,699$ (11,077)$ (10,774)
December 31, 2009 $ 15,434$ (2,646)$ (2,051)
December 31, 2009 $ 25,979$ (3,999)$ (3,617)
Petrofield Industries Ltd. – Processing division
RevenueNet loss from discontinued operations before taxesNet loss from discontinued operations, net of tax
George Third & Son Ltd – Trapp plant
RevenueNet loss from discontinued operations before taxesNet loss from discontinued operations, net of tax

Notes to the Consolidated Financial Statements continued...
Empire Industries Ltd. 2010 Annual Report 49
December 31, 2010 $ 3,360 4,845 4,060 1,654 817 14,736 4,056 (1,108) 235 (230) $ 17,689
December 31, 2010 $ 450 (220) - $ 230
December 31, 2010 54 137 - - $ 191
December 31, 2009 $ 3,839 5,950 3,035 827 871 14,522 2,767 (1,290) 857 (450) $ 16,406
December 31, 2009 $ 569 (74) (45) $ 450
December 31, 2009 83 454 107 - $ 644
HoldbacksCurrent31 – 60 days61 – 90 daysGreater than 90 days
Billed receivables
Unbilled contract receivables Deferred revenueOther receivablesLess: Allowance for doubtful accounts
Total accounts receivable, net
Allowance for doubtful accounts – openingAdd: Net bad debt provisions (recoveries)Less: accounts written off
Allowance for doubtful accounts – closing
Current31 – 60 days61 – 90 daysGreater than 90 days
Receivable from related party
7. Accounts receivableThe following table outlines details of the Company’s aged receivables and related allowance for doubtful accounts:
Unbilled contract receivables consist of costs plus margin on unbilled contracts that are to be billed in the near term.
The following table outlines changes in the allowance for doubtful accounts:
8. Receivable from related party
At December 31, 2010, the Company had receivables from ACE Industrial Services in the amount of $191 (2009 - $644). The Company had sales to ACE Industrial Services Ltd. for the year ended December 31, 2010 of $3,443 (2009 - $3,329). In addition, the Company recorded expenses of $4 (2009 -
$4) to ACE Industrial Services Ltd. These transactions are in the normal course of operations and are measured at the exchange amount, which is the amount of consideration established and agreed to by the parties.

Notes to the Consolidated Financial Statements continued...
Empire Industries Ltd. 2010 Annual Report 50
December 31, 2010 $ 737 672 2,536 1,094 $ 5,039
December 31, 2009 $ 1,168 1,429 3,863 1,611 $ 8,071
Finished goodsWork-in-progressRaw materials – specialty engineered productsRaw materials – structural steel
During the year, the Company recorded inventory write-downs amounting to $1,077 (2009 - $855) of which $902 was in conjunction with the discontinued processing division at Petrofield Industries Ltd. (Note 5). There were no reversals of prior period inventory write-downs. The amount of inventories recognized as an expense within cost of goods sold is $14,125 (2009 - $32,465).
10. Foreign exchange hedge contractsThe Company utilized forward currency contracts to provide protection against foreign exchange rate movements during long-term sales contracts. These contracts have been designated as fair value hedges for financial reporting purposes. The Company’s policy is to not utilize derivative financial instruments for trading or speculative purposes.
December 31, 2010 $ 2,233
314 34
(2,480) (2,132)
101 $ 101
December 31, 2009 $ (602)
2,340 -
495 2,835
2,233 $ 2,233
Fair value of foreign currency hedge contracts, beginning balance
Change in forward currency contracts’ fair value Existing forward currency contracts Purchased forward currency contractsAdd: Realized (gains)/losses on forward currency contracts
Unrealized gain (loss) on foreign exchange hedge contracts
Fair value of foreign currency hedge contracts, ending balance
Current portion
The table below summarizes the transactions and changes in fair values during the year:
9. InventoriesInventories are comprised of the following:

Notes to the Consolidated Financial Statements continued...
Empire Industries Ltd. 2010 Annual Report 51
December 31, 2010
$ 30 - - 30 1,196 83 1,279 $ 1,309
December 31, 2009
$ 30 22 53
105 `1,156 40 1,196 $ 1,301
Investments where the Company does not exercise significant influence: River City Detailers Ltd. (15% ownership) Sky Trolley Inc. (20% ownership) Black Sea Oil & Gas Ltd. (<1% ownership)
Equity accounted for investments: ACE Industrial Services Ltd. (49% ownership): Beginning balance Equity earnings during the year
Total investments
The Company has outstanding long-term advances to ACE Industrial Services Ltd. of $314 (2009 - $291). The advances accrue interest at 8% per annum with no specific repayment terms.
During the year, the Company received $23 (2009 - $34) in interest income from ACE Industrial Services Ltd. and $8 (2009 - $30) in dividend income from River City Detailers Ltd. Included in income from equity accounted for investments and other investments are write-downs of $75 (2009 – nil) due to other than temporary impairment of the investments in Sky Trolley Inc, and Black Sea Oil & Gas Ltd.
11. InvestmentsInvestments consist of:
Cost
$ 391 2,341 18,638 660 4,657 3,038 - 89 952 995 $ 31,761
Accumulated Amortization
$ - 738 10,248 472 3,728 1,635 - 50 368 451 $ 17,690
Cost
$ 391 2,356 22,800 666 4,792 3,325 50 89 952 2,068 $ 37,489
AccumulatedAmortization
$ - 695 10,790 474 3,491 1,506 23 45 272 1,055 $ 18,351
December 31, 2010 December 31, 2009
$ 14,071 $ 19,138
LandBuildingsMachinery and equipmentVehiclesOffice furniture and equipmentCranesRail spursParking lotProduct developmentLeasehold improvements
Net book value
12. Property, plant and equipment

Notes to the Consolidated Financial Statements continued...
Empire Industries Ltd. 2010 Annual Report 52
As at December 31, 2010, equipment financed by capital leases in the amount of $3,463 (2009 - $3,925) are included in the cost of property, plant and equipment with corresponding accumulated amortization of $1,594 (2009 - $1,680).
Machinery and equipment at a cost of $1,644 and accumulated amortization of $970 were classified as assets held for sale on a net basis of $674 (2009 - nil). The total carrying value approximates the fair value of the assets held for sale. The Company recorded an impairment charge of $186 (2009 – nil) related to assets disposed of as a result of the Trapp plant closure (Note 5).
13. Intangible assetsGoodwill is the result of the difference between the purchase price and the values assigned to the underlying net assets acquired in the purchase of the shares of George Third & Son Ltd. During the year, management concluded that the goodwill associated with George Third & Son Ltd. was impaired. As a result, the Company took an impairment charge in the year equal to the full value of its remaining goodwill. In 2009, goodwill decreased by $4,672 as a result of the sale of the Petrofield Industries Inc. combustion assets (Note 29).
December 31, 2009 $ 8,173 $ 8,173
December 31, 2008 $ 8,173 9,222 $ 17,395
Disposals $ - $ -
Disposals $ - (4,672) $ (4,672)
Impairment Charge $ (8,173) $ (8,173)
Impairment Charge $ - (4,550) $ (4,550)
December 31, 2010 $ - $ -
December 31, 2009 $ 8,173 - $ 8,173
Business Segment
Steel fabrication and erection
Total Goodwill
Business Segment
Steel fabrication and erectionSpecialty engineered products
Total Goodwill
Cost
$ - 676
Accumulated Amortization
$ - 452
Cost $ 8 676
AccumulatedAmortization
$ 1 228
December 31, 2010 December 31, 2009
$ 224 $ 455
PatentsComputer software development
Net book value
Other intangible assets consist of:
The Company disposed of patents held by Petrofield Industries Ltd. for proceeds of $1,200 during the year.

Notes to the Consolidated Financial Statements continued...
Empire Industries Ltd. 2010 Annual Report 53
14. Bank indebtedness and bank operating linesThe Company’s cash balance of $40 (2009 - $2,674) represents funds on deposit. The Company’s bank indebtedness balance of $744 (2009 - $nil) represents outstanding checks drawn on the bank operating line.
At December 31, 2010, the Company had total draws on its bank operating lines of credit of $7,352 consisting of:
(i) An overdraft facility with Canadian Western Bank (“CWBank Overdraft Facility”) in the amount of $10,000 of which $7,352 (December 31, 2009 - nil) had been drawn down. Advances on the facility are payable on demand and bear interest at prime plus 2.25%. The CWBank Overdraft Facility is secured by general security agreements providing a first security interest in all present and after-acquired property and a $25,000 demand debenture providing the bank with fixed and floating charges on all assets of Empire Industries Ltd. and Empire Iron Works Ltd.
At December 31, 2009, the Company had total draws on its operating lines of credit of $13,739 consisting of:
(ii) A line of credit with the Royal Bank of Canada in the amount of $6,000 of which $4,916 had been drawn down. Advances on the line were payable on demand and bore interest at prime plus 4.5%. The Royal Bank line of credit, and the term facilities were secured by a general assignment of inventories and accounts receivable, a $6,000 debenture secured by a floating charge on all assets and a fixed charge on all property. On March 4, 2010 the line of credit was fully repaid with the proceeds of a re-financing with Canadian Western Bank and the line was cancelled.
(iii) A line of credit with HSBC in the amount of $10,000 of which $8,823 had been drawn down. Advances on the line were payable on demand and bore interest at prime plus 4%. The HSBC line of credit was secured by a general security agreement creating a first fixed charged over any present and after acquired personal property of the borrower and a floating charge over all of the borrower’s present and after acquired real property. In addition, the Company provided an indemnity agreement with respect to a master lease agreement. On March 4, 2010 the line was fully repaid with the proceeds of a re-financing with Canadian Western Bank and the line was cancelled.

Notes to the Consolidated Financial Statements continued...
Empire Industries Ltd. 2010 Annual Report 54
15. Long-term debt
December 31, 2010
$ 2,909
3,915
90
214
135
770
148
195
-
8,376 (1,549)
$ 6,827
December 31, 2009
$ -
-
110
284
537
1,017
254
337
2,362
4,901
(1,634)
$ 3,267
Canadian Western Bank term loan, monthly payments of $26 including interest at 6.5% per annum, due March 4, 2025 renewable March 4, 2015.
Canadian Western Bank term loan, monthly payments of $88 including interest at 6.5% per annum, due March 4, 2015.
HSBC Capital Lease, monthly payments of $2 including interest at 6.38% per annum with a purchase option of $27 on October 29, 2013. The lease expires on October 28, 2014.
HSBC Capital Lease, monthly payments of $6 including interest at 6.38% per annum with a purchase option of $32 on April 13, 2014. If the purchase option is not exercised, the monthly payments decrease to $5. The lease expires on November 12, 2014.
HSBC Capital Lease, monthly payments of $27 including interest at 6.13% per annum with a purchase option of $1on October 29, 2011. The lease expires on October 28, 2011.
HBSC Capital Lease, monthly payments of $20 including interest at 5.68% per annum with a purchase option of $148 on April 13, 2014. If the purchase option is not exercised, the monthly payments increase to $22. The lease expires on November 12, 2014.
HSBC Capital Lease, monthly payments of $9 including interest at 5.89% per annum with a purchase option of $50, on February 21, 2012. The lease expires on July 20, 2012.
Capital Equipment Leases, bearing interest up to 13% per annum, monthly payments from $1 to $3 including interest, due from March 2010 to April 2013.
Royal Bank of Canada non-revolving term facility, payable $70 monthly plus interest at prime plus 5%, due May 31, 2010.
Current portion of long-term debt
The CWBank Term Loans are secured by general security agreements providing a first security interest in all present and after-acquired property and a $25,000 demand debenture providing the bank with fixed and floating charges on all assets of Empire Industries Ltd. and Empire Iron Works Ltd. The HSBC and other capital leases are secured by the equipment that is being leased.
On March 4, 2010, the amount outstanding under the Royal Bank non-revolving credit agreement was fully repaid from the proceeds of the re-financing with the Canadian Western Bank.

Notes to the Consolidated Financial Statements continued...
Empire Industries Ltd. 2010 Annual Report 55
The related parties as noted above are officers and/or directors of Empire Industries Ltd. and/or its wholly owned subsidiaries. During the year, interest of $182 (2009 - $nil) was paid to these related parties. Total interest expense to the related parties amounted to $375 (2009 - $317).
The notes payable to the George Third & Son Ltd. vendors were issued on August 31, 2006 as part of the consideration for the purchase of the shares of George Third & Son Ltd. The principal plus accrued interest on these notes is due on April 30, 2011 and is secured by a general security agreement. Interest was compounded quarterly at a rate of 8.5% until August 31, 2009 at which time the rate increased to 10%. The Company has the option to pay off any portion of the notes plus accrued interest at any time prior to the due date without penalty.
Subsequent to year end, the Company sold the assets held for sale (Note 12) to holders of these notes. As a result of this transaction, $800 of the current portion of the notes payable obligation was settled.
The notes payable to the KWH Constructors Corp. vendors were issued on April 30, 2007 as part of the consideration for the purchase of the shares of KWH Constructors Corp. The principal plus accrued interest on these unsecured notes is due on April 30, 2011. Interest was compounded quarterly at a rate of 8.5% until April 30, 2010 at which time the rate increased to 10%. The Company has the option to pay off any portion of the notes plus accrued interest at any time prior to the due date without penalty.
$ 1,549 1,419 1,397 1,389 2,622 8,376 155 $ 8,531
20112012201320142015 and thereafter
Interest on capital leases
16. Notes payable
December 31, 2010 $ 2,162
1,842
-
270 4,274 (1,070) $ 3,204
December 31, 2009 $ 2,058
1,753
1,512
485 5,808 (1,997) $ 3,811
Notes payable to related parties – George Third & Son Ltd. vendors- includes accrued interest of $443 (2009 - $339)
Notes payable to related parties – KWH Constructions Corp. vendors- includes accrued interest of $339 (2009 - $250)
Note payable to AMEC - Dynamic Structures Ltd. vendor- includes accrued interest of $nil (2009 - $112)
Other notes payable
Current portion of notes payable
Principal amounts due on long-term debt in the current year and each of the next five years and thereafter and interest on capital leases are as follows:

Notes to the Consolidated Financial Statements continued...
Empire Industries Ltd. 2010 Annual Report 56
December 31, 2010 $ 60 $ -
December 31, 2009 $ 54 $ 54
Fair value of debentures maturing June 1, 2011
Long-term portion
Under the terms of the CW Bank agreement, the notes payable to George Third & Sons Ltd. and KWH Constructors Corp. vendors cannot be repaid without formal consent from the bank and therefore have been classified as long-term with the exception of the $800 which was settled with the consent of the bank subsequent to year end.
The note payable to AMEC was issued on April 16, 2007 as part of the consideration for the purchase of the shares of AMEC Dynamic Structures Ltd., subsequently known as Dynamic Structures Ltd. The principal portion of the note payable was repaid on October 14, 2010 with the accrued interest of $200 (2009 - $112) paid on December 12, 2010.
Other notes payable bear interest at a rate of 7% and are secured by a general security agreement and are payable on demand. During the year ended December 31, 2010, interest was paid to these noteholders in the amount of $29 (2009 - $34).
17. Convertible debenturesConvertible debentures formed part of the November 30, 2007 acquisition of Petrofield Industries Inc. These convertible debentures are unsecured and are convertible into Empire Industries Ltd. common shares at a conversion price of 100 common shares for each $67 of principal amount outstanding. The convertible debentures are set to mature on June 1, 2011 and attract interest at 8% annually.
18. Deferred gain on sale and leasebackDuring 2009, Dynamic Structures entered into an agreement to sell and leaseback of its fabrication facility at 1515 Kingsway in Port Coquitlam, BC, with the full gain on disposition being deferred for future recognition, on a straight-line basis, over the 10 year term of the lease. Of the original $1,545 deferred gain, $218 has been recognized in operations to date with $154 (2009 - $64) recognized in earnings for the year ended December 31, 2010.
During 2007, Tornado Technologies Inc. entered into an agreement to sell and leaseback certain of its land and buildings, with the full gain on disposition being deferred for future recognition, on a straight-line basis, over the 5 year term of the lease. Of the original $882 deferred gain, $882
has been recognized in operations to date with $514 (2009 - $176) recognized in discontinued operations for the year ended December 31, 2010 (Note 5). The unamortized amount of the gain was recognized in discontinued operations for the year in its entirety because the Company transferred the lease of the premises to a third party.
During 2004, Empire Iron Works Ltd. entered into two separate agreements to sell and leaseback certain of its land and buildings, with the full gain on disposition being deferred for future recognition, on a straight-line basis, over the 8 year term of the leases. Of the original $892 deferred gain, $669 has been recognized in operations to date with $112 (2009 - $112) recognized in earnings for the year ended December 31, 2010.

Notes to the Consolidated Financial Statements continued...
Empire Industries Ltd. 2010 Annual Report 57
$ (17,764) (5,185) 36 2,839 (244) 2,449 100 54 $ 49
29.19%
(0.20%)(15,98%)
1.37%(13.79%)(0.56%)
0.3%
(0.27%)
$ (17,024) (5,102) 210 1,748 (1,073) 2,750 19 (114) $ (1,562)
29.97 %
(1.23%)(10.27%)
6.30%(16.15%)
(0.11%)0.67%
9.18%
December 31, 2010 $ 516 (467) $ 49
December 31, 2009 $ (585) (977) $ (1,562)
December 31, 2010 December 31, 2009
Net loss before income taxes
Statutory federal and provincial tax rate
Impact of changes in future and current tax ratesValuation allowanceNon-taxable portion of capital gainsNon-deductible goodwill Non-deductible expenses Others
Income tax expense (recovery)
Income tax expense (recoveries) is comprised of:
Continuing operationsDiscontinued operations
Income tax expense (recovery)
19. Income taxesThe following table reconciles the difference between the income taxes that would result solely by applying statutory tax rates to pre-tax income and the income taxes actually provided in the accounts:

Notes to the Consolidated Financial Statements continued...
Empire Industries Ltd. 2010 Annual Report 58
Income taxes allocated to future years are comprised of the following:
There are $25,846 (2009 - $13,570) of non-capital loss carry forwards. The following table reflects the amounts and related expiration period:
Year of expiry
2027202820292030
Gross tax loss carry forwards $ 85 3,686 10,335 11,740 $ 25,846
Tax benefit $ 6,521
Valuation Allowance $ (4,102)
Net Benefit $ 2,419
December 31, 2010 $ 26 10 13 180 3 1,589 528 37 12 6,521 8,919 (912) (34) (160) (2,541) (4,884) (382) (8,913) $ 6 $ - - 1,684 (1,678) $ 6
December 31, 2009 $ 26 - 182 319 19 1,805 192 86 12 3,521 6,162 (1,064) (23) - (2,907) (2,045) (8) (6,047) $ 115 $ 193 (794) 2,442 (1,726) $ 115
Future income tax assets: Intangibles Accounts payable and accrued liabilities Deferred gain on sale and leaseback Capital leases Other assets Investment tax credits SR&ED tax pool Share issue and debenture costs Capital losses Non-capital losses carried forward
Future income tax liabilities: Accounts receivable Investments Inventories Property, plant and equipment Valuation allowance Other
Net future income tax asset
Classified in the consolidated balance sheets as: Current future income tax assets Current future income tax liabilities Long-term future income tax assets Long-term future income tax liabilities

Notes to the Consolidated Financial Statements continued...
Empire Industries Ltd. 2010 Annual Report 59
The Company has a net future tax asset in respect of Federal and Provincial Investment Tax Credits of $1,589 (2009 - $1,805), expiring between 2016 and 2029. A valuation allowance of $782 has been applied against this and other assets.
The Company has capital loss carry forwards of $99 (2009 - $99). No future tax benefit has been recorded on these capital loss carry forwards as the timing for the potential realization of these future benefits is uncertain.
20. Capital stockAuthorized and issued capital stockThe Company is permitted to issue an unlimited number of common shares without nominal or par value and an unlimited number of preferred shares. The preferred shares may be issued in one or more series, and the Directors are authorized to fix the number of shares in each series and to determine the designation, rights, privileges, restrictions and conditions attached to the shares of each series.
Stock option planThe Company maintains a stock option plan for the benefit of officers, directors, key employees, and consultants of the Company. At December 31, 2010, the Company was permitted to issue up to a maximum of 9,123,961 stock options, being 10% of the outstanding common shares.
A summary of the Company’s options as at December 31, 2010 and December 31, 2009 and changes during the periods then ended follows:
The fair value associated with the options issued was calculated using the Black-Scholes model for options valuation, assuming volatility ranging between 13% and 113% on the underlying units, and a risk-free interest rate ranging from 2.2% to 4.6% depending on the date the options were granted. Options forfeited are accounted for as incurred. Share prices for the calculation were the closing
price on the TSX Venture Exchange on the date of issue of the options, with the exception of the July 1, 2006, August 31, 2006, and November 30, 2007 issues. A share price of $0.55 was used for those calculations, reflecting the significant private placements of shares that were issued on those dates at that price.
December 31, 2010 (000’s)
$ 34,720
December 31, 2009 (000’s)
$ 34,720
Issued 91,239,608 common shares (2009 - 91,239,608)
December 31, 2010
5,420,3501,550,000
-(1,289,300)
5,681,050
5,280,800
3.81
Weighted AverageExercise Price ($)
($) 0.520.10
-0.49
0.41
0.40
December 31, 2009
7,080,830-
(459,800)(1,200,680)
5,420,350
3,948,850
3.52
Weighted AverageExercise Price ($)
($) 0.50-
0.360.45
0.52
0.50
Balance, beginning of the yearOptions grantedOptions expiredOptions forfeited
Balance, end of the year
Exercisable
Weighted remaining average life (years)

Notes to the Consolidated Financial Statements continued...
Empire Industries Ltd. 2010 Annual Report 60
December 31, 2010
--
-
-
-
Weighted Average Exercise Price
--
-
-
December 31, 2009
300,000(300,000)
-
-
-
Weighted AverageExercise Price
0.770.77
-
-
Balance, beginning of the yearWarrants expired
Balance, end of the year
Exercisable
Weighted remaining average life (years)
The following options were issued, outstanding and exercisable at December 31, 2010:
WarrantsOn November 30, 2007, warrants were issued to two parties as compensation for their assistance in relation to the acquisition of Petrofield Industries Inc. and expired
November 30, 2009. A summary of the Company’s warrants as at December 31, 2010 and December 31, 2009 and changes during the periods then ended follows:
21. Contributed surplusChanges in contributed surplus consisted of the following:
Exercise Price ($)
0.100.240.300.390.550.570.62
Total
Number Outstanding
1,550,000334,400200,000156,750
2,278,00020,900
1,141,000
5,681,050
Weighted Average Remaining Life (years)
6.670.024.860.862.600.643.73
3.81
Weighted Average Exercise Price ($)
0.100.240.300.390.550.570.62
0.41
Number Exercisable
1,550,000334,400100,000156,750
2,263,00020,900
855,750
5,280,800
Weighted Average Exercise Price ($)
0.100.240.300.390.550.570.62
0.40
Options ExercisableOptions Outstanding
December 31, 2010
$ 1,458 295 $ 1,753
December 31, 2009
$ 1,450
8 $ 1,458
Balance, beginning of the year
Amortization of the fair value of options granted (net of forfeitures)
Balance, end of the year

Notes to the Consolidated Financial Statements continued...
Empire Industries Ltd. 2010 Annual Report 61
22. Segmented informationThe Company operates in the following industry segments:
Steel fabrication and erectionSteel fabrication and erection involves the supply and or installation of structural steel for the commercial, industrial, and institutional sectors. Projects include, but are not limited to, construction of buildings, bridges, plants, mine shafts, and heavy industrial equipment. Steel fabrication and erection is carried out by Empire Iron Works Ltd., Hopkins Steel Works Limited, George Third & Son Ltd. and KWH Constructors Inc.
Specialty engineered productsSpecialty engineered products involves manufacturing items such as combustion equipment, production equipment, hydrovac and vacuum trucks, pressure vessels, air cleaning equipment, and amusement park rides. These products are supplied by Petrofield Industries Inc., Ward Industrial Equipment Ltd., Dynamic Structures Ltd., and Parr Metal Fabricators Ltd.
Steel Fabrication and Erection
$ 32,150 (29,144)
3,006 61 (3,467) (400) (1,300)
(1,700) (273) 205 (23)
$ (1,791)
$ (10,774) $ 23,000 674 1,309 259
8,173
Specialty Engineered Products
$ 33,804 (26,311)
7,493 197 (3,701) 3,989 (894)
3,095 (120) 1,216 (2,109)
$ 2,082
$ (3,207) $ 17,144 - - 83
-
Corporate $ 83 -
83 - (2,379) (2,296) (179)
(2,475) (1,132) - -
$ (3,607)
$ - $ 1,879 - - 2
-
Total $ 66,037 (55,455)
10,582 258 (9,547) 1,293 (2,373)
(1,080) (1,525) 1,421 (2,132)
$ (3,316)
$ (13,981) $ 42,023 674 1,309 344
8,173
SalesCost of goods sold
Gross profit
Income from equity and other investmentsOperating, general and administrative expenses
Amortization
Interest expenseOther incomeUnrealized loss on foreign exchange hedge contracts
Segmented (loss) income before income tax from continuing operations
Segmented (loss) from discontinued operations net of tax (Note 5)
Total AssetsAssets held for saleEquity and other investment assetsCapital expendituresGoodwill impairment – discontinued operations (Note 5)

Notes to the Consolidated Financial Statements continued...
Empire Industries Ltd. 2010 Annual Report 62
Steel Fabrication and Erection
$ 29,549 (26,461) 3,088 40 (4,724) (1,596) (1,660) (3,256) (707) 110 -
$ (3,853)
$ (3,617)
$ 30,470 8,173 1,248 837 -
Specialty Engineered Products
$ 38,264 (30,263) 8,001 - (5,949) 2,052 (1,111) 941 (524) (2,473) (4,550) 2,835
$ (3,771)
$ (2,051)
$ 30,555 - 53 572 4,550
Corporate $ 94 - 94 - (1,658) (1,564) (5) (1,569) (1,186) - - -
$ (2,755)
$ -
$ 2,101 - - 3 -
Total $ 67,907 (56,724) 11,183 40 (12,331) (1,108) (2,776) (3,884) (2,417) (2,363) (4,550) 2,835
$ (10,379)
$ (5,668)
$ 63,126 8,173 1,301 1,412 4,550
Canada $ 50,396 14,071
Canada $ 49,824 19,138 8,173
United States $ 15,641 -
United States $ 18,083 - -
Total $ 66,037 14,071
Total $ 67,907 19,138 8,173
SalesCost of goods sold
Gross profit
Income from equity and other investmentsOperating, general and administrative expenses
Amortization
Interest expenseOther income (expense)Goodwill impairment lossUnrealized gain on foreign exchange hedge contracts
Segmented loss before income tax from continuing operations
Segmented loss from discontinued operations net of tax (Note 5)
Total AssetsGoodwillEquity and other investment assetsCapital expendituresGoodwill impairment
SalesProperty, plant and equipment
For the Year Ended December 31, 2009
SalesProperty, plant and equipmentGoodwill
The Company operates in the following geographic segments:
For the Year Ended December 31, 2010

Notes to the Consolidated Financial Statements continued...
Empire Industries Ltd. 2010 Annual Report 63
23. Joint venturesThe Company entered into two 50% joint venture agreements with AMEC International (Canada) Ltd. for the completion of two projects which were completed during 2010. The Company uses the proportionate consolidation method to
record the joint ventures. The following table sets out the Company’s proportionate share of the assets, liabilities, venturers’ equity, revenues, expenses, net earnings and cash flows of these joint ventures. Income taxes are not included as they are the responsibility of the joint venture partners.
24. Other related party transactionsRent was paid to companies controlled by officers, directors, and members of their families in the amount of $483 (2009 - $571) for the year ended December 31, 2010. These transactions are in the normal course of operations and are measured at the exchange amount, which is the amount of consideration established and agreed to by the parties.
25. Capital disclosuresThe Company’s objective when managing capital is to strive for a long-term manageable level of net funded debt to total capital. The Company sets the amount of capital in proportion to risk. The Company manages the capital structure and makes adjustments to it in light of changes in economic conditions and the risk characteristics of the underlying assets. In order to maintain or adjust the capital structure,
the Company may return capital to shareholders, issue new shares or sell redundant or non-core assets to reduce debt.
Net funded debt includes bank indebtedness (net of cash), bank operating lines and non-subordinated debt and notes payable. Tangible net worth includes shareholders’ equity, deferred gain on sale and leaseback and subordinated debt such as subordinated notes payable and convertible debentures, less the value of goodwill and intangible assets.
The Company’s strategy during the period, which was unchanged from the prior period, was to maintain its ability to secure access to financing at a reasonable cost. There are external restrictions to capital as lending limits are based on asset availability and financing agreements are impacted by covenants.
December 31, 2010 $ 2,030$ 2,030 $ - 2,030$ 2,030 $ 1,715 1,330$ 385 $ -
December 31, 2009 $ 2,867$ 2,867 $ 1,222 1,645$ 2,867 $ 4,117 4,479$ (362) $ (350)
Current assets
Current liabilitiesVenturers’ equity
RevenueExpensesNet earnings (loss)
Cash provided by (used in): Operating activities

Notes to the Consolidated Financial Statements continued...
Empire Industries Ltd. 2010 Annual Report 64
December 31, 2010 $ 704 7,352 1,819 6,827 16,702 60 4,004 1,550 6,256 (224) 11,646 $ 28,348 58.9%
December 31, 2009 $ (2,674) 13,739 3,631 7,078 21,774 54 - 2,330 23,774 (8,628) 17,530 $ 39,304 55.4%
Increase (Decrease) $ 3,378 (6,387) (1,812) (251) (5,072) 6 4,004 (780) (17,518) 8,404 (5,884) $ (10,956) 3.5%
For the periods ended
Bank indebtedness (cash), netBank operating linesCurrent portion of long-term debt and notes payableLong-term debt and notes payable
Net funded debt
Convertible debenturesSubordinated notes (Note 16)Deferred gain on sale and leasebackShareholders’ equityLess: goodwill and intangibles
Tangible net worth
Capitalization
Net funded debt : Capitalization
At December 31, 2010 the Company was not in compliance one of its bank covenants contained in the CW Bank Agreement. Subsequent to December 31, 2010, the Company has obtained a waiver for this covenant violation.
26. Guarantees and contingenciesLoan guaranteesThe Company is contingently liable under two guarantees given to third-party lenders who have provided certain financing facilities to affiliated companies. As at December 31, 2010, the maximum amount of fixed guarantees provided to a third-party lender on behalf of an affiliated company is $460 (2009 - $650). In addition, the Company has provided an unlimited guarantee on behalf of an equity investment over which the Company exercises significant influence.
Director and officer indemnificationThe Company indemnifies its directors and officers against any and all claims or losses reasonably incurred in the performance of their service to the Company to the extent permitted by law. The Company has acquired and maintains liability insurance for its directors and officers as well as those of its wholly-owned subsidiaries and certain affiliated companies.
Other indemnification provisionsFrom time to time, the Company enters into agreements in the normal course of operations and in connection with business
or asset acquisitions and dispositions. By their nature, these agreements may provide for indemnification of counterparties. The varying nature of these indemnification agreements prevents the Company from making a reasonable estimate of the maximum potential amount it could incur. Historically, the Company has not made any significant payments in connection with these indemnification provisions.
Other contingenciesThe Company is subject to various product liability or general claims and legal proceedings covering matters that arise in the ordinary course of business. All such matters are adequately covered by insurance or by accruals, or are without merit, or of such kinds or amounts as would not have a material adverse effect on the financial results of the Company.
27. Risk managementIn the normal course of its business, the Company is exposed to a number of risks that can affect its operating performance. Management’s close involvement in operations helps identify risks and variations from expectations. As a part of the overall operation of the Company, management considers the avoidance of undue concentrations of risk. The Company manages its risks and risk exposures through a combination of financial instruments, insurance, a system of internal and disclosure controls and sound business practices. The primary types of financial risk which arise are liquidity, credit,

Notes to the Consolidated Financial Statements continued...
Empire Industries Ltd. 2010 Annual Report 65
and market risk. These risks and the actions taken to manage them are as follows:
(a) Liquidity riskLiquidity risk is the risk that the Company cannot meet its financial obligations associated with financial liabilities in full. A range of alternatives is available to the Company including cash flow provided by operations, additional debt, the issuance of equity or a combination thereof. The funds
are primarily used to finance working capital and capital expenditure requirements and are adequate to meet the Company’s foreseeable financial obligations associated with financial liabilities.
The following table summarizes the Company’s financial liabilities with corresponding maturity dates as at December 31, 2010:
The Company expects to have adequate resources to discharge these financial liabilities. The bank operating lines are renewable on an annual basis and, to the extent that these are renewed, there is no requirement for the balance to be paid down other than in the ordinary course of operations. The subordinated notes payable are due on April 30, 2011, but because the notes are subordinated to the bank, payment of the notes is not permitted without consent of the bank. Accordingly, the full balance has been classified as payable in 2015 with the exception of $800 which has been approved by the bank for settlement. At December 31, 2010, the Company has $17,689 of accounts receivable that once collected will allow the Company to discharge the remainder of the financial liabilities.
(b) Credit riskCredit risk arises from the possibility that customers may experience financial difficulty and be unable to fulfill their commitments to the Company. For a financial asset, this is typically the gross carrying amount, net of any amounts offset and any impairment losses. The Company has credit policies
to address credit risk on accounts receivable from customers, which may include the analysis of the financial position of customers and review of credit limits. The Company also reviews new customer credit history before establishing credit and periodically reviews existing customer credit performance. The Company may require letters of credit or credit insurance. An allowance for doubtful accounts is established based upon factors surrounding credit risk of specific customers, historical trends and other information.
At December 31, 2010, the Company had one individual customer accounting for about 14% of total accounts receivable. The Company’s maximum credit risk exposure is disclosed in Note 7.
(c) Market riskMarket risk is the risk that changes in market prices will have an effect on future cash flows associated with financial instruments. Market risk comprises three types of risk: currency risk, interest rate risk and commodity price risk.
Total
$11,566
1677,3528,376
2704,004
601,4599,527
$42,781
2011
$11,566
1677,3521,549
27080060
4953,604
$25,863
2012 $ -
--
1,419---
4002,428
$4,247
2013 $ -
--
1,397---
3101,725
$3,432
2014 $ -
--
1,389---
214700
$2,303
2015 + $ -
--
2,622-
3,204-
401,070
$6,936
Accounts payable and accrued liabilitiesIncome taxes payableBank operating linesLong-term debt Notes payable Notes payable - subordinatedConvertible debenturesLong-term funded debt interestOperating leases
Total

Notes to the Consolidated Financial Statements continued...
Empire Industries Ltd. 2010 Annual Report 66
(i) Currency riskThe Company sells its products as well as purchases goods in both Canadian and U.S. currencies. Accordingly, the Company is exposed to currency risk as it relates to customer accounts receivable balances and trade accounts payable denominated in U.S. currency. Changes in the applicable exchange rate may result in a decrease or increase in foreign exchange income or expense. The Company may enter into forward exchange contracts or use other hedging activities to manage part of the foreign risk exposures relating to
customer accounts receivable balances and trade accounts payable denominated in U.S. currency.
As at December 31, 2010, the Company had U. S. dollar forward currency contracts for $2,906 (2009 - $15,475) with exchange rates ranging from $0.9997 to $1.3850 per U.S. dollar and maturity dates ranging from January 2011 to June 2011. The accounts noted below include amounts denominated in U. S. currency that have been converted to the Canadian dollar equivalent on the balance sheet date at a rate of $1.00 per U.S. dollar (2009 - $1.051):
For the year ended December 31, 2010, if the Canadian dollar had strengthened 10% per cent against the US dollar with all other variables held constant, net income for the period would have been $64 lower (2009 - $12 lower). Conversely, if the Canadian dollar had weakened 10% per cent against the US
dollar with all other variables held constant, net income would have been $64 higher (2009 - $12 higher).
Foreign exchange hedges available for future net receivables are as follows:
December 31, 2010 $ 405 3,722 (580)
(2,906) $ 641
December 31, 2010 $ 2,906 (2,906) -
December 31, 2009 $ 1,632 6,486 (748)
(7,252) $ 118
December 31, 2009 $ 15,475 (6,900) 8,575
Cash (bank balance less outstanding cheques)Accounts receivableAccounts payable & accrued liabilitiesForeign exchange hedges related to above accounts – US$2,906(2009 – US$6,900)
Net foreign currency exposure
(Denominated in US dollars)
Total foreign exchange hedgesForeign exchange hedges related to working capital accounts
Foreign exchange hedges available for future net receivables
Included in sales are realized gains on translation of foreign currencies monetary assets and liabilities and realized gains on foreign exchange hedges of $2,268 (2009 - $1,021).
(ii) Interest rate riskInterest rate risk is the risk that the fair value or future cash flows of a financial instrument will fluctuate because of changes in market interest rates. The Company is exposed to interest rate risk primarily through its variable rates on bank operating lines and long term borrowings. The Company manages exposure to interest rate risk by using a combination of fixed and floating rate debt instruments.
For the year ended December 31, 2010, if interest rates had been 50 basis points lower with all other variables held constant, after-tax net income for the period would have been $37 (December 31, 2009 - $56) higher, arising mainly as a result of lower interest expenses on variable borrowings. If interest rates had been 50 basis points higher, with all other variables held constant, after-tax net income would have been $37 (December 31, 2009 - $56) lower, arising mainly as a result of higher interest expenses on variable borrowings.
(iii) Commodity price riskManufacturing costs for the Company’s products are affected by fluctuations in the price of raw materials, primarily

Notes to the Consolidated Financial Statements continued...
Empire Industries Ltd. 2010 Annual Report 67
steel. In order to manage its risk, the Company implements selling price adjustments in order to match raw material cost changes, albeit with a slight time lag. This matching is not always possible as customers react to selling price pressures related to raw material cost fluctuations according to conditions pertaining to their markets. For long-term contracts, the Company may negotiate the inclusion of a flow through price adjustment clause into contracts whereby the customer agrees to price changes based on the underlying market value of steel. In order to limit the risk associated with steel price increases, the Company locks in order prices to the extent possible as soon as contracts are awarded.
The sensitivity analyses in the currency risk and interest rate risk sections above do not take into consideration that the Company’s liabilities are actively managed. Additionally, the financial position of the Company may vary at the time that any actual market movement occurs or be mitigated by management’s actions to reduce exposure to risks. Other limitations in the above sensitivity analyses includes the use
of hypothetical market movements to demonstrate potential risk that only represent the Company’s view of possible near term market changes that cannot be predicted with any certainty; and the assumption that all interest rates move in an identical fashion.
28. Fair valuesThe following table presents the carrying amount and the fair value of the Company’s financial assets and liabilities. Amortized cost is calculated using the effective interest rate method. Fair value is based on quoted market prices when available. However, when financial instruments lack an available trading market, fair value is determined using management’s estimates and is calculated using market factors for instruments with similar characteristics and risk profiles. These amounts represent point-in-time estimates and may not reflect fair value in the future. These calculations are subjective in nature, involve uncertainties and are a matter of significant judgment.
Held for tradingLoans & receivablesLoans & receivablesLoans & receivables
Held for tradingOther liabilitiesOther liabilitiesOther liabilitiesOther liabilities
Other liabilitiesOther liabilities
Assets/ (Liabilities)Carried at Cost / Amortized Cost Financial Instruments Category
Fair value $ (704)
17,689 191 14 101
(7,352)(11,566)
(60) (167) (270)
(8,186) (800)
Carrying value
$ (704)17,689
19114
101(7,352)
(11,566)(60)
(167)(270)
(8,376)(4,004)
As of December 31, 2010
Cash and cash equivalentsAccounts receivableReceivable from related partyIncome taxes recoverableForeign exchange hedge contractsBank operating linesAccounts payable and accrued liabilitiesConvertible debenturesIncome taxes payableNotes payableLong-term debtNotes payable – subordinated
The fair values of the Company’s financial assets and liabilities, included in net working capital (accounts receivable, receivable from a related party, income taxes recoverable, bank operating lines, income taxes payable, and accounts payable and accrued liabilities), approximate their recorded values as at December 31, 2010 due to their short-term nature.
The debt component of convertible debentures is convertible into equity at a fixed exchange rate, therefore the fair value
has been determined to approximate its recorded value. The carrying value of the notes payable approximates fair value as the notes are due on demand and are secured by a general security agreement. The Company’s long-term debt bears interest at fixed and variable rates. The fair value of long-term debt with fixed interest rates has been estimated based on the current market rates for mortgages with similar terms and conditions. The carrying value of long-term debt with variable interest rates approximates fair value.

Notes to the Consolidated Financial Statements continued...
Empire Industries Ltd. 2010 Annual Report 68
Assets and liabilities recorded at fair value in the balance sheet are measured and classified in a hierarchy consisting of three levels for disclosure purposes; the three levels are based on the priority of the inputs to the respective valuation technique. The fair value hierarchy gives the highest priority to quoted prices in active markets for identical assets or liabilities (Level 1) and the lowest priority to unobservable inputs (Level 3). An asset or liability’s classification within the fair value hierarchy is based on the lowest level of significant input to its valuation. The assets recorded at fair value include cash (level 1) and foreign exchange hedge contracts (level 2). There were no assets transferred between levels during the year.
29. Business divestures and disposal of assets:During 2010a. The gain on sale of $1,153 consists of the sale of patents for cash proceeds of $1,200 resulting in a gain on sale of $1,193 and sale or disposal of various assets during the year resulting in a net loss of $40. The proceeds were applied to reduce the Company’s draw on its CW Bank overdraft facility.
During 2009b. On October 5, 2009, the Company’s wholly-owned subsidiary, Petrofield Industries Inc., concluded the sale of its combustion business assets for $10,169, effective September 30, 2009. The transaction resulted in a net loss of $2,585 in the Company’s Specialty Engineered Products segment comprised of a gain on disposal of property, plant and equipment and other assets of $2,114, a loss on disposal of goodwill of $4,672 (Note 13) and a loss on disposal of intangible assets of $27and a sale of various assets during the year for a net gain of $46. Subsequent to the closing date, the Company applied the proceeds of the sale to retire both short and long-term debt of the Bank of Montreal and to reduce short-term debt of other lenders.
30. Subsequent eventThe following events transpired after December 31, 2010:a. On February 14, 2011 the Company completed a private placement of 40,000,000 units at price of $0.05 per share for proceeds of $2,000 and placed $660 principal amount of a 10% secured subordinated convertible debenture. Each private placement unit consisted of one common share and one half common share purchase warrant. Each whole common
share purchase warrant entitles the holder to purchase one common share at an exercise price of $0.10. The secured subordinated convertible debentures have an annual coupon of 10% for a period of 5 years. The debenture will initially be convertible at $0.10 per common share, however, in the event the Company obtains shareholder approval for a share consolidation, the conversion price can be lowered to $0.065 on a pre-consolidation basis.
b. On April 15, 2011, the Company announced that it will issue up to 60 million units at a price of $0.05 per unit for gross proceeds of $3.0 million with each share consisting of one common share and one warrant. The Company anticipates closing the private placement on May 31, 2011.
c. The Company has entered into an agreement effective March 18, 2011 between the Company and Quiguang where the Company will have a 45% interest in a newly incorporated entity and Quiguang will have the remaining 55% interest. The intention of this new business relationship is to provide Quiguang with the technical know-how to increase business opportunities in China.
d. On April 4, 2011, the Company sold the assets held for sale (Note 12) to a related party. As a result of the sale, $800 of the subordinated notes payable (Note 16) were extinguished.
31. Comparative figuresCertain of the 2009 amounts presented for comparative purposes have been restated to conform to the presentation adopted in the current year.


2010 Annual Report
Head Office717 Jarvis Avenue
Winnipeg, MB CanadaR2W 3B4
Phone: 204.589.9300Fax: 204.582.8057
www.empireindustriesltd.com