20.1 falco presentation may 2017
49
THE NEXT GREAT UNDERGROUND MINE IN CANADA Corporate Presentation ROADSHOW - MAY 2017 WWW.FALCORES.COM | FPC:TSXV
-
Upload
falcocorporate -
Category
Investor Relations
-
view
738 -
download
2
Transcript of 20.1 falco presentation may 2017
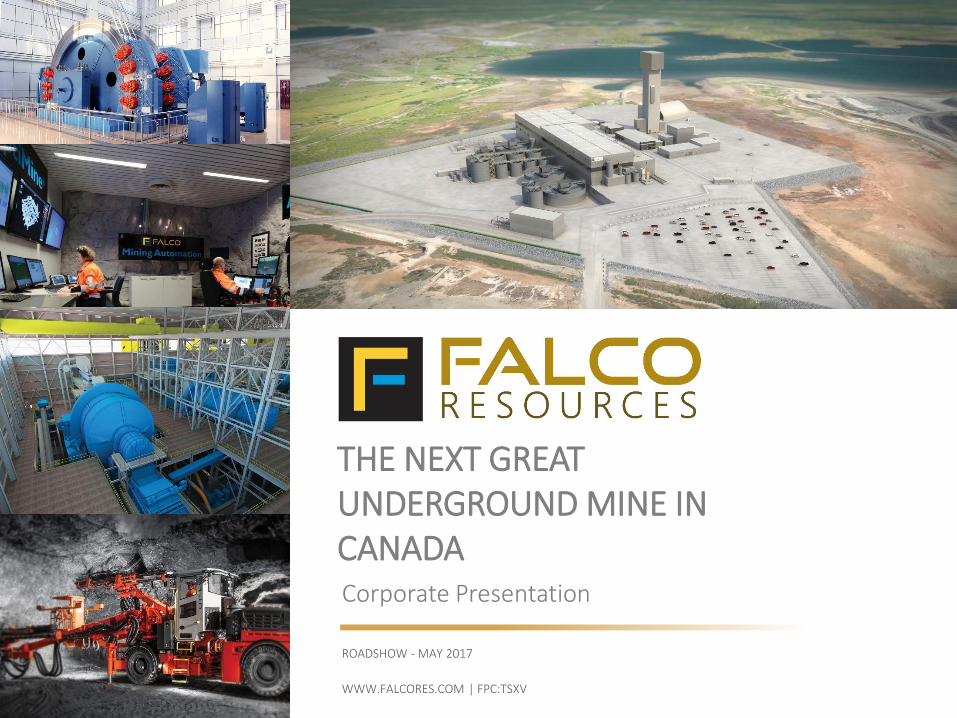
THE NEXT GREAT UNDERGROUND MINE IN CANADACorporate Presentation
ROADSHOW - MAY 2017
WWW.FALCORES.COM | FPC:TSXV
Disclaimer
This presentation contains a review of the Company’s properties in Canada. Viewers are cautioned that the projects are at an early stage of exploration and that estimates and projectionscontained herein are based on limited and incomplete data. More work is required before the mineralization on the projects and their economic aspects can be confidentaly modeled.Therefore, the work results and estimates herein may be considered to be generally indicative only of the nature and quality of the projects. No representation or prediction is intended as tothe results of future work, nor can there be any promise that the estimates herein will be confirmed by future exploration or analysis, or that the projects will otherwise prove to beeconomic.
The TSX Venture Exchange has not reviewed and does not accept responsibility for the accuracy or adequacy of this presentation, which has been prepared by management. There can beno assurance that any of the assumptions in the resource estimates will be supported by a Pre-feasibility or Feasibility Study or that any forward looking event will come to pass. The data isincomplete and considerable additional work will be required to complete further evaluation, including but not limited to drilling, engineering and socio-economic studies and investment.
Past performance is no guarantee of future performance and all investors are urged to consult their investment professionals before making an investment decision. Investors are furthercautioned that past performance is no guarantee of future performance
Forward-Looking Statements
Certain information included in this presentation constitutes forward-looking statements, including any information as to our projects, plans and future performance. All statements, otherthan statements of historical fact, are forward-looking statements. The words “expect”, “believe”, “anticipate”, “will”, “intend”, “estimate”, “forecast”, “budget”, “schedule” and similarexpressions identify forward-looking statements. Forward-looking statements are necessarily based upon a number of factors and assumptions that, while considered reasonable bymanagement, are inherently subject to significant business, economic and competitive uncertainties and contingencies. Known and unknown factors could cause actual results to differmaterially from those projected in the forward-looking statements.
Such factors include, but are not limited to: changes to current estimates of mineral resources; labour availability; litigation; availability of and increased costs associated with contractorsand exploration equipment; the speculative nature of mineral exploration and development, including the risks of obtaining necessary licenses and permits; contests over title to properties;uncertainty with the Company’s ability to secure capital to execute its business plans; changes in national and local government legislation in Canada; risk of loss due to sabotage and civildisturbances; risks arising from holding derivative instruments; and business opportunities that may be pursued by the Company. Many of these uncertainties and contingencies can affectour actual results and could cause actual results to differ materially from those expressed or implied in any forward-looking statements made by, or on behalf of, us. Readers are cautionedthat forward-looking statements are not guarantees of future performance.
The Company disclaims any intention or obligation to update or revise any forward-looking statements whether as a result of new information, future events or otherwise, except asrequired by applicable law.
Cautionary Note to U.S Investors Concerning Measured, Indicated and Inferred Resources
This presentation uses the terms “measured,” “indicated” and “inferred resources. We advise investors that while those terms are recognized and required by Canadian regulations, theUnited States Securities and Exchange commission does not recognize them. Under Canadian rules, estimates of inferred mineral resources may not form the basis of feasibility or othereconomic studies. United States investors are cautioned not to assume that all or any part of measured or indicated mineral resources will ever be converted into mineral reserves. UnitedStates investors are also cautioned not to assume that all or any part of an inferred mineral resource exists, or is economically or legally mineable.
CAUTIONARY STATEMENT
TSXV: FPC | WWW.FALCORES.COM | 3
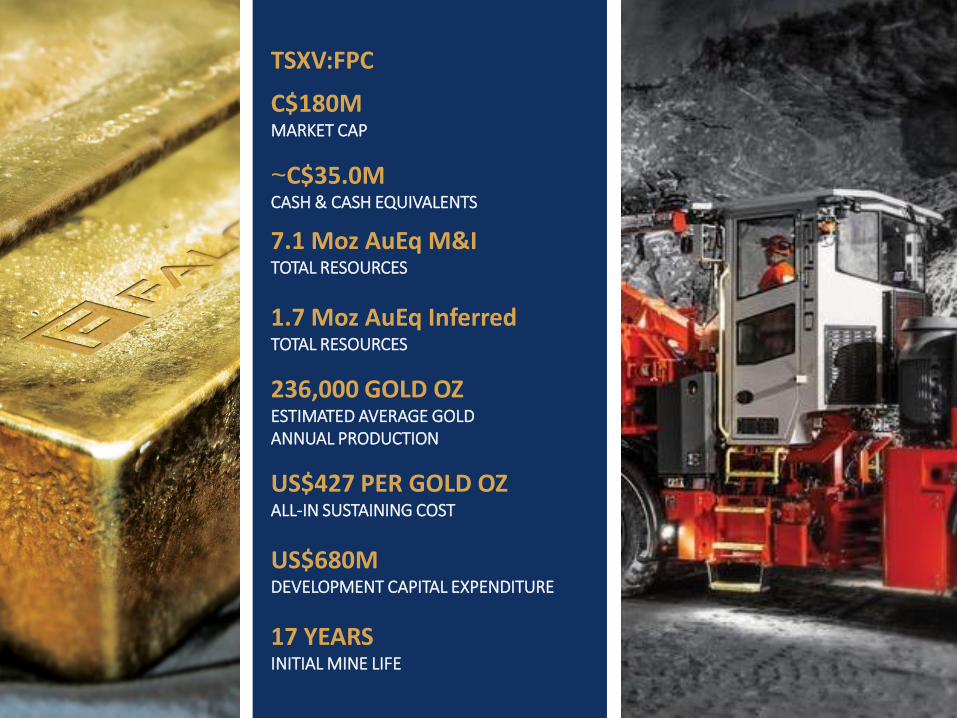
TSXV:FPC
C$180MMARKET CAP
~C$35.0M CASH & CASH EQUIVALENTS
7.1 Moz AuEq M&ITOTAL RESOURCES
1.7 Moz AuEq InferredTOTAL RESOURCES
236,000 GOLD OZESTIMATED AVERAGE GOLD ANNUAL PRODUCTION
US$427 PER GOLD OZALL-IN SUSTAINING COST
US$680MDEVELOPMENT CAPITAL EXPENDITURE
17 YEARS INITIAL MINE LIFE
TSXV: FPC | WWW.FALCORES.COM | 4
FALCO RESOURCES –EXPERIENCED SENIOR LEADERSHIP TEAM
OFFICERS & TECHNICAL TEAM BOARD OF DIRECTORS
Sean Roosen, Chairman
Mario Caron, Lead Director
Luc Lessard, President & CEO, Director
Bryan Coates, Director
Paola Farnesi, Director
Claude Ferron, Director
Paul Henri-Girard, Director
Luc Lessard, President & CEO, Director
Vincent Metcalfe, CFO
Claude Léveillée, Vice-President Community Relations & HR
Claude Bernier, Exploration Manager
Sylvain Doire, Environment
Claude Pilote, Senior Geologist
TECHNICAL TEAM
Helene Cartier, VP – Environment
Francois Vezina, VP – Mining
Christian Laroche, VP – Processing
John-Paul McGrath – Project Manager
Daniel Mathieu – Mechanical Designer
Iain Farmer – Project Engineer
TSXV: FPC | WWW.FALCORES.COM | 5
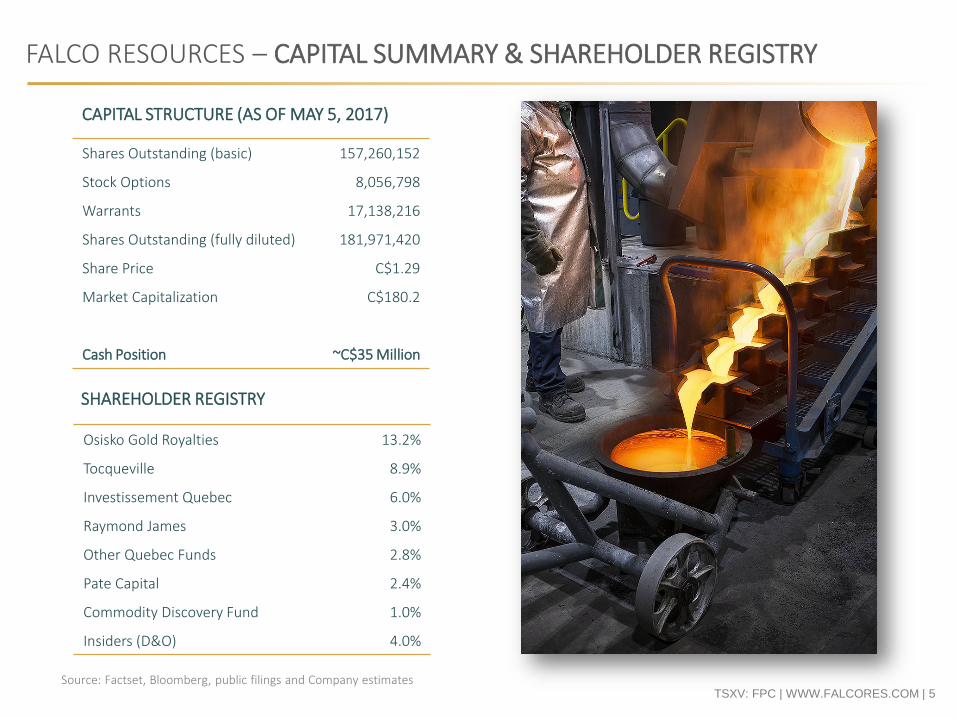
FALCO RESOURCES – CAPITAL SUMMARY & SHAREHOLDER REGISTRY
CAPITAL STRUCTURE (AS OF MAY 5, 2017)
SHAREHOLDER REGISTRY
Osisko Gold Royalties 13.2%
Tocqueville 8.9%
Investissement Quebec 6.0%
Raymond James 3.0%
Other Quebec Funds 2.8%
Pate Capital 2.4%
Commodity Discovery Fund 1.0%
Insiders (D&O) 4.0%
Shares Outstanding (basic) 157,260,152
Stock Options 8,056,798
Warrants 17,138,216
Shares Outstanding (fully diluted) 181,971,420
Share Price C$1.29
Market Capitalization C$180.2
Cash Position ~C$35 Million
Source: Factset, Bloomberg, public filings and Company estimates
TSXV: FPC | WWW.FALCORES.COM | 6
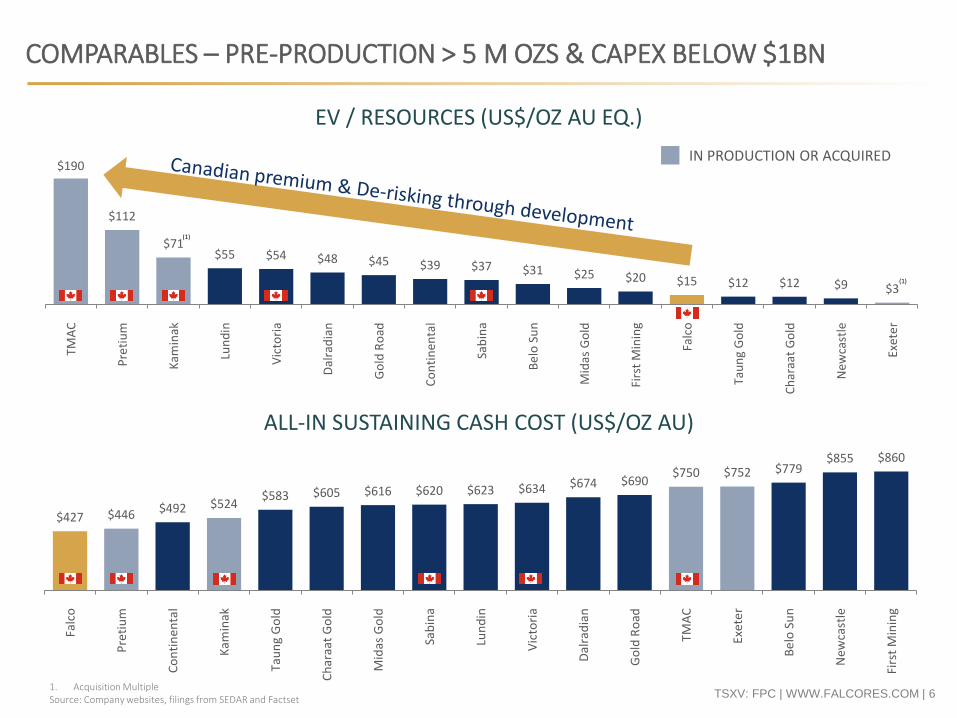
$15
$190
$112
$71
$3
$55 $54 $48 $45 $39 $37 $31 $25 $20 $12 $12 $9
TMA
C
Pre
tiu
m
Kam
inak
Lun
din
Vic
tori
a
Dal
rad
ian
Go
ld R
oad
Co
nti
nen
tal
Sab
ina
Be
lo S
un
Mid
as G
old
Firs
t M
inin
g
Falc
o
Tau
ng
Go
ld
Ch
araa
t G
old
New
cast
le
Exet
er
(1)
(1)
COMPARABLES – PRE-PRODUCTION > 5 M OZS & CAPEX BELOW $1BN
EV / RESOURCES (US$/OZ AU EQ.)
ALL-IN SUSTAINING CASH COST (US$/OZ AU)
$427 $446$524
$750 $752
$492$583 $605 $616 $620 $623 $634 $674 $690
$779$855 $860
Falc
o
Pre
tiu
m
Co
nti
ne
nta
l
Kam
inak
Tau
ng
Go
ld
Ch
araa
t G
old
Mid
as G
old
Sab
ina
Lun
din
Vic
tori
a
Dal
rad
ian
Go
ld R
oad
TMA
C
Exe
ter
Be
lo S
un
Ne
wca
stle
Firs
t M
inin
g
IN PRODUCTION OR ACQUIRED
1. Acquisition MultipleSource: Company websites, filings from SEDAR and Factset
TSXV: FPC | WWW.FALCORES.COM | 7
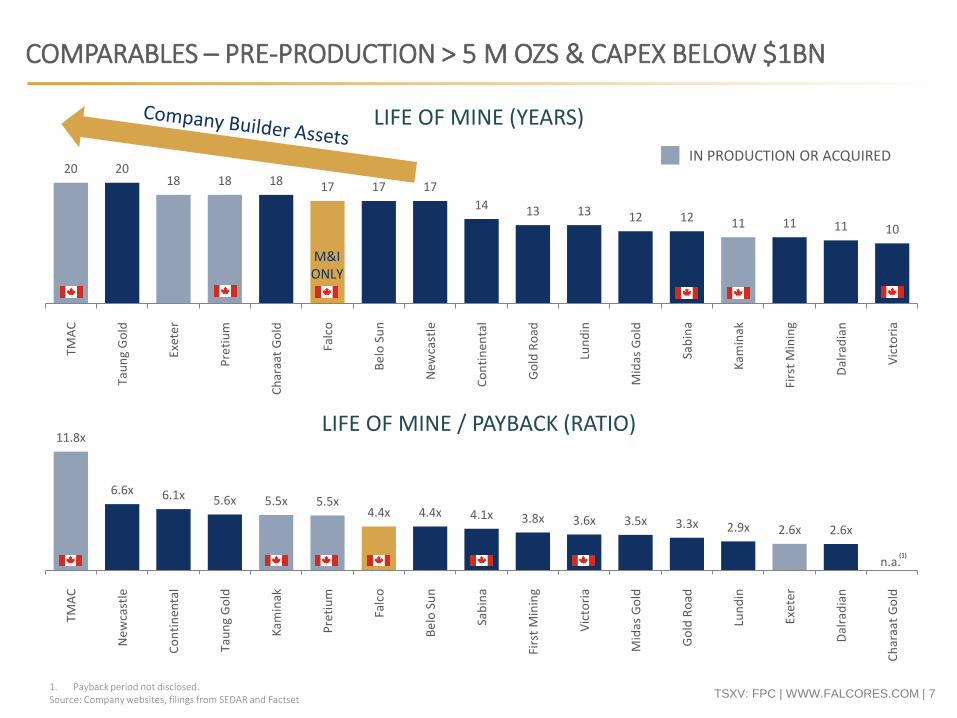
17
2018 18
11
2018 17 17
14 13 13 12 12 11 11 10
TM
AC
Tau
ng
Go
ld
Exe
ter
Pre
tiu
m
Ch
araa
t G
old
Falc
o
Be
lo S
un
Ne
wca
stle
Co
nti
ne
nta
l
Go
ld R
oad
Lun
din
Mid
as G
old
Sab
ina
Kam
inak
Firs
t M
inin
g
Dal
rad
ian
Vic
tori
a
LIFE OF MINE (YEARS)
COMPARABLES – PRE-PRODUCTION > 5 M OZS & CAPEX BELOW $1BN
4.4x
11.8x
5.5x 5.5x
2.6x
6.6x 6.1x 5.6x4.4x 4.1x 3.8x 3.6x 3.5x 3.3x 2.9x 2.6x
TM
AC
Ne
wca
stle
Co
nti
ne
nta
l
Tau
ng
Go
ld
Kam
inak
Pre
tiu
m
Falc
o
Be
lo S
un
Sab
ina
Firs
t M
inin
g
Vic
tori
a
Mid
as G
old
Go
ld R
oad
Lun
din
Exe
ter
Dal
rad
ian
Ch
araa
t G
old
n.a.(1)
LIFE OF MINE / PAYBACK (RATIO)
1. Payback period not disclosed.Source: Company websites, filings from SEDAR and Factset
IN PRODUCTION OR ACQUIRED
M&IONLY
TSXV: FPC | WWW.FALCORES.COM | 8
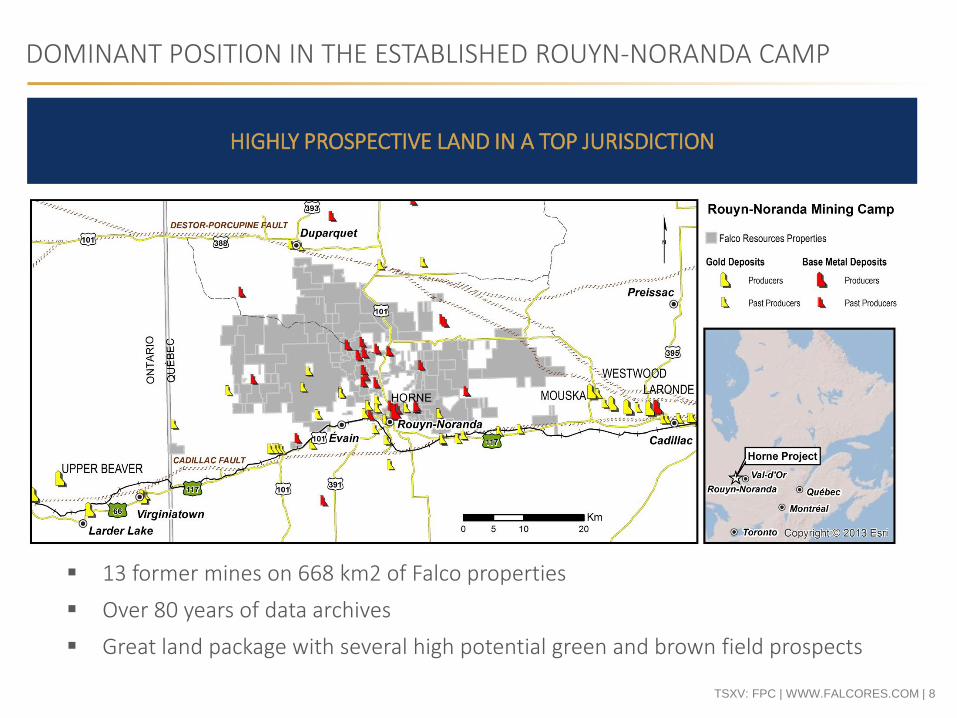
DOMINANT POSITION IN THE ESTABLISHED ROUYN-NORANDA CAMP
HIGHLY PROSPECTIVE LAND IN A TOP JURISDICTION
13 former mines on 668 km2 of Falco properties
Over 80 years of data archives
Great land package with several high potential green and brown field prospects
TSXV: FPC | WWW.FALCORES.COM | 9
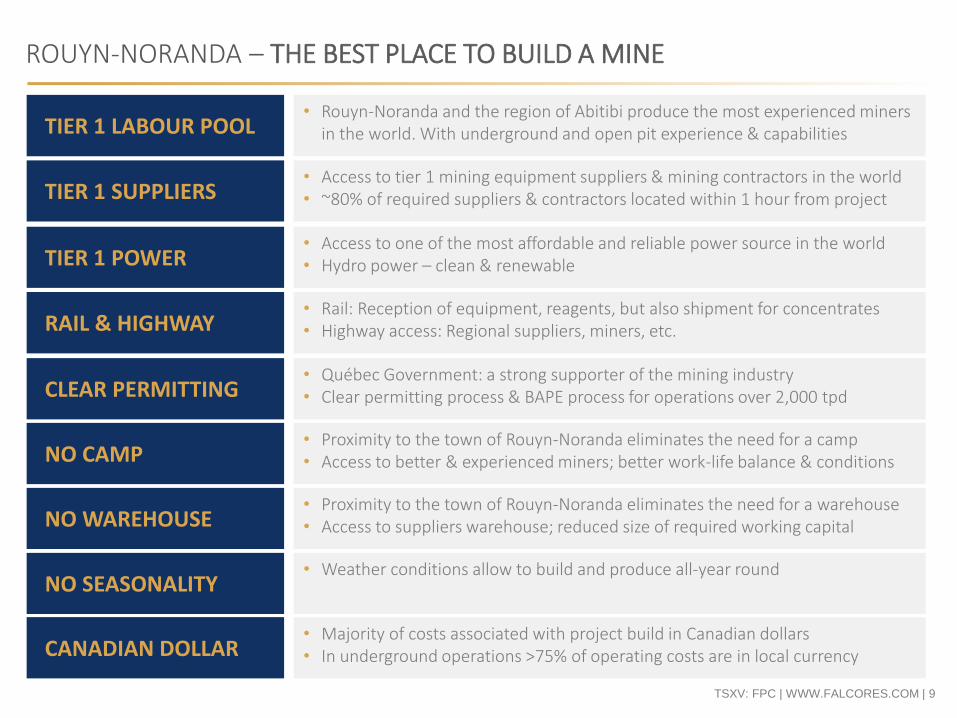
ROUYN-NORANDA – THE BEST PLACE TO BUILD A MINE
TIER 1 LABOUR POOL
TIER 1 SUPPLIERS
TIER 1 POWER
RAIL & HIGHWAY
CLEAR PERMITTING
NO CAMP
NO WAREHOUSE
NO SEASONALITY
• Rouyn-Noranda and the region of Abitibi produce the most experienced miners in the world. With underground and open pit experience & capabilities
• Access to tier 1 mining equipment suppliers & mining contractors in the world• ~80% of required suppliers & contractors located within 1 hour from project
• Access to one of the most affordable and reliable power source in the world • Hydro power – clean & renewable
• Rail: Reception of equipment, reagents, but also shipment for concentrates• Highway access: Regional suppliers, miners, etc.
• Québec Government: a strong supporter of the mining industry• Clear permitting process & BAPE process for operations over 2,000 tpd
• Proximity to the town of Rouyn-Noranda eliminates the need for a camp• Access to better & experienced miners; better work-life balance & conditions
• Proximity to the town of Rouyn-Noranda eliminates the need for a warehouse• Access to suppliers warehouse; reduced size of required working capital
• Weather conditions allow to build and produce all-year round
CANADIAN DOLLAR• Majority of costs associated with project build in Canadian dollars• In underground operations >75% of operating costs are in local currency
TSXV: FPC | WWW.FALCORES.COM | 10
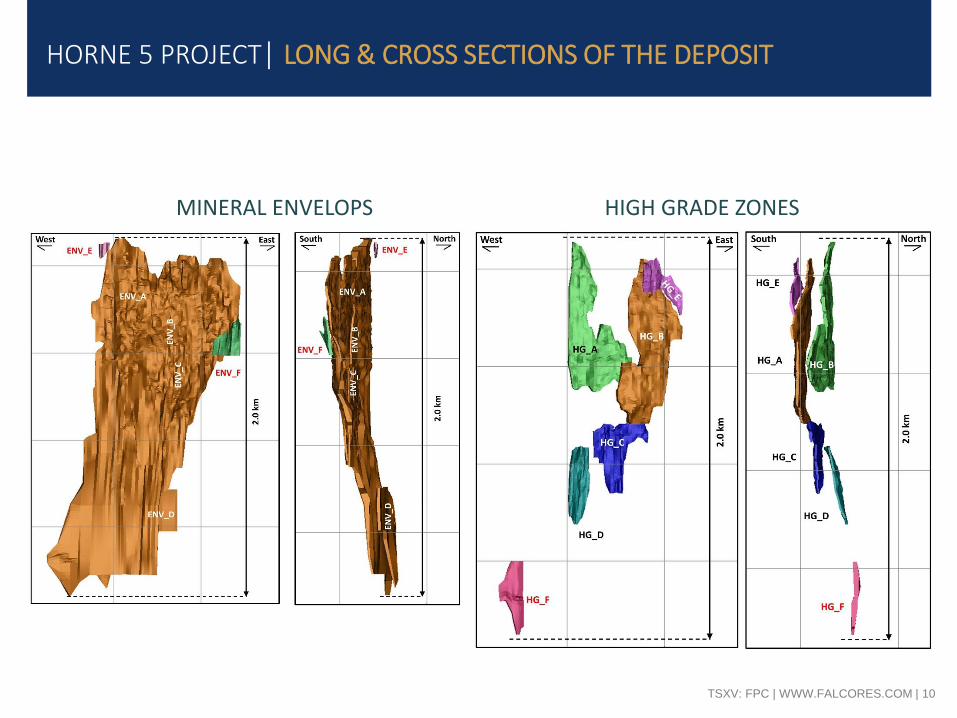
HIGH GRADE ZONES
HORNE 5 PROJECT| LONG & CROSS SECTIONS OF THE DEPOSIT
MINERAL ENVELOPS
TSXV: FPC | WWW.FALCORES.COM | 11
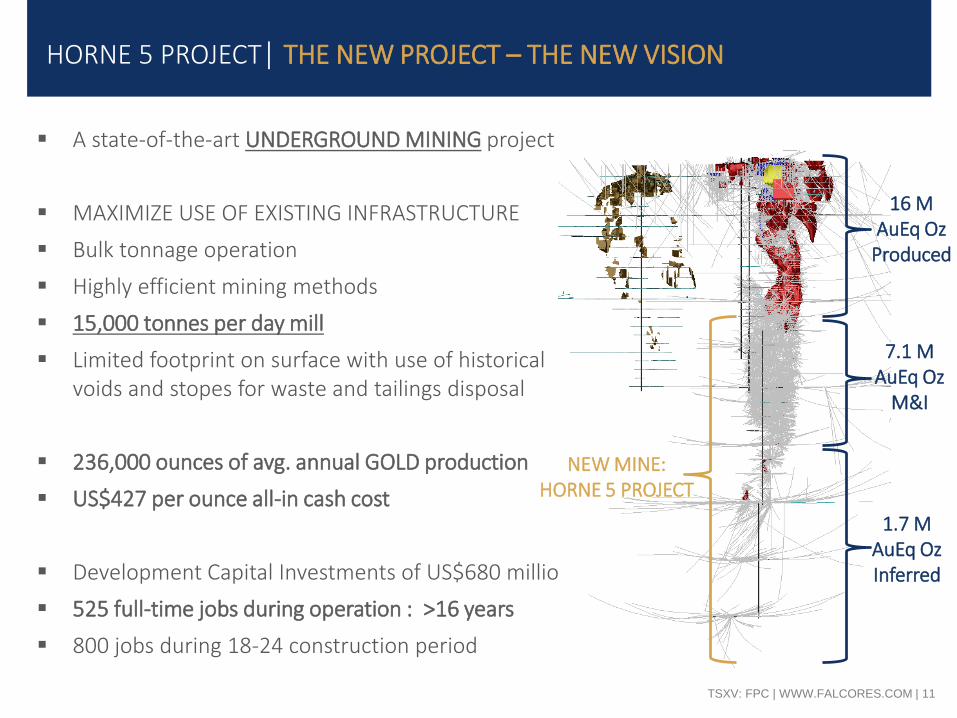
HORNE 5 PROJECT| THE NEW PROJECT – THE NEW VISION
A state-of-the-art UNDERGROUND MINING project
MAXIMIZE USE OF EXISTING INFRASTRUCTURE
Bulk tonnage operation
Highly efficient mining methods
15,000 tonnes per day mill
Limited footprint on surface with use of historical voids and stopes for waste and tailings disposal
236,000 ounces of avg. annual GOLD production
US$427 per ounce all-in cash cost
Development Capital Investments of US$680 million
525 full-time jobs during operation : >16 years
800 jobs during 18-24 construction period
NEW MINE: HORNE 5 PROJECT
16 M AuEq Oz
Produced
7.1 M AuEq Oz
M&I
1.7 M AuEq Oz Inferred
TSXV: FPC | WWW.FALCORES.COM | 12
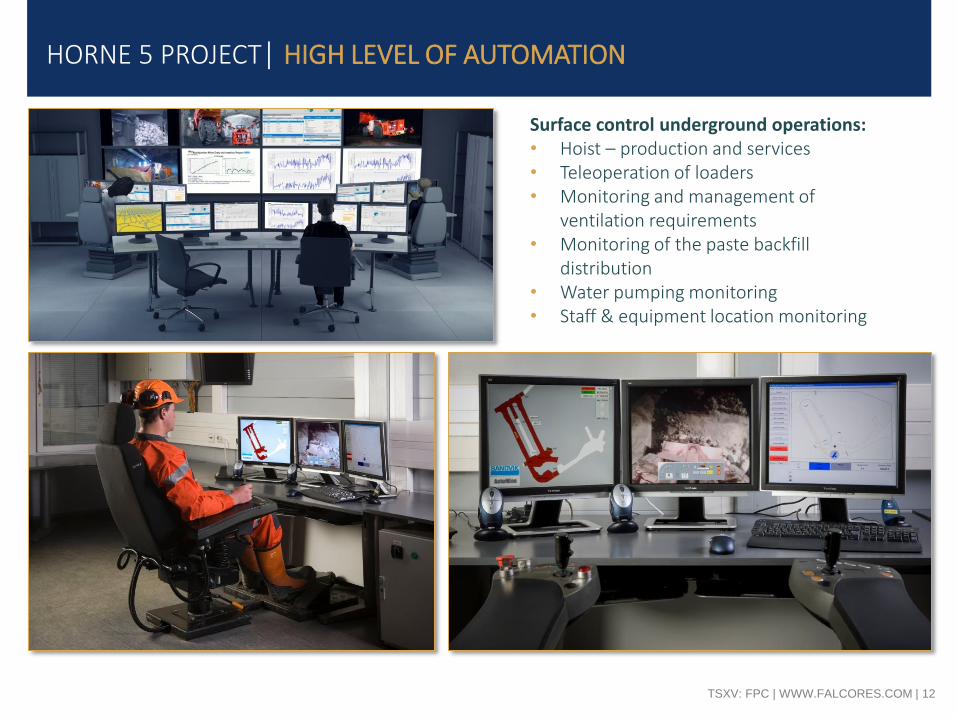
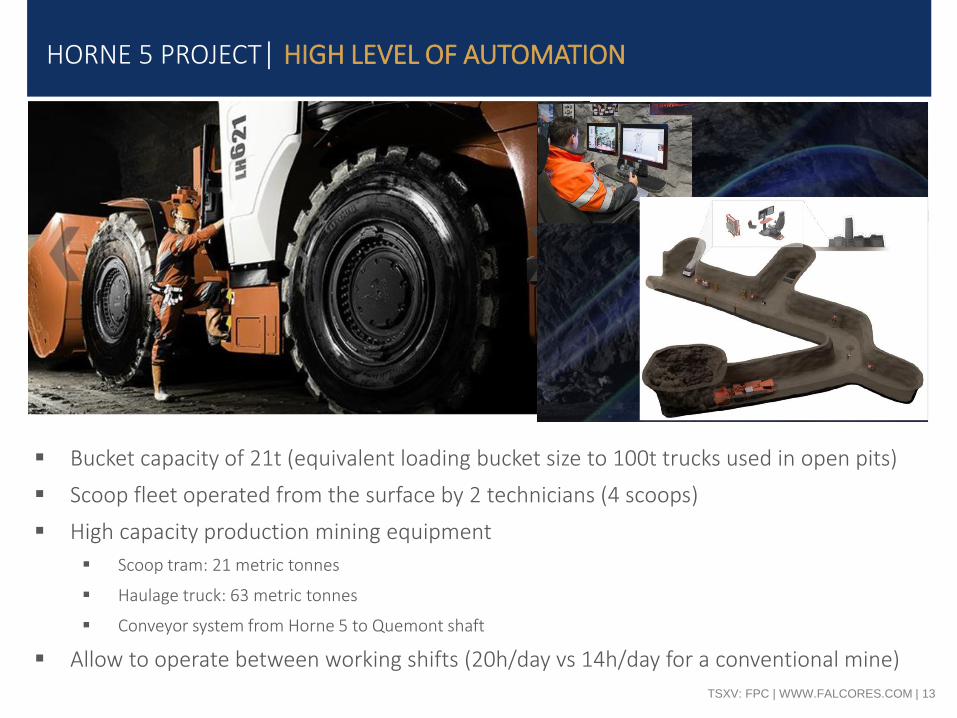
Surface control underground operations:• Hoist – production and services• Teleoperation of loaders• Monitoring and management of
ventilation requirements• Monitoring of the paste backfill
distribution • Water pumping monitoring• Staff & equipment location monitoring
HORNE 5 PROJECT| HIGH LEVEL OF AUTOMATION
TSXV: FPC | WWW.FALCORES.COM | 13
HORNE 5 PROJECT| HIGH LEVEL OF AUTOMATION
Bucket capacity of 21t (equivalent loading bucket size to 100t trucks used in open pits)
Scoop fleet operated from the surface by 2 technicians (4 scoops)
High capacity production mining equipment
Scoop tram: 21 metric tonnes
Haulage truck: 63 metric tonnes
Conveyor system from Horne 5 to Quemont shaft
Allow to operate between working shifts (20h/day vs 14h/day for a conventional mine)
TSXV: FPC | WWW.FALCORES.COM | 14
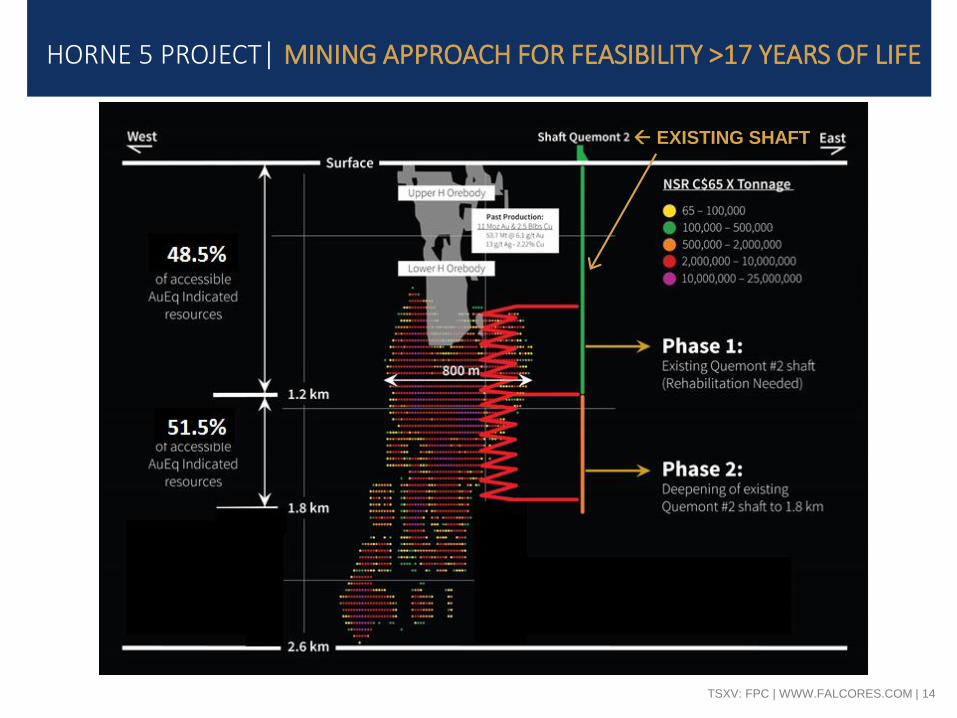
HORNE 5 PROJECT| MINING APPROACH FOR FEASIBILITY >17 YEARS OF LIFE
EXISTING SHAFT
TSXV: FPC | WWW.FALCORES.COM | 15
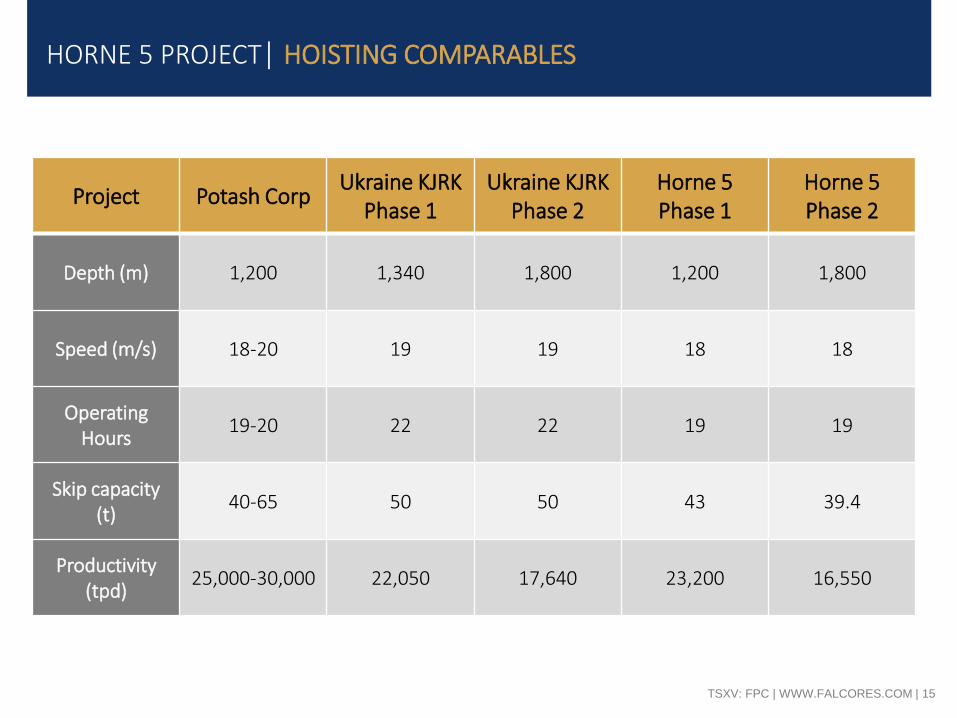
Project Potash CorpUkraine KJRK
Phase 1Ukraine KJRK
Phase 2Horne 5Phase 1
Horne 5Phase 2
Depth (m) 1,200 1,340 1,800 1,200 1,800
Speed (m/s) 18-20 19 19 18 18
OperatingHours
19-20 22 22 19 19
Skip capacity(t)
40-65 50 50 43 39.4
Productivity(tpd)
25,000-30,000 22,050 17,640 23,200 16,550
HORNE 5 PROJECT| HOISTING COMPARABLES
TSXV: FPC | WWW.FALCORES.COM | 16
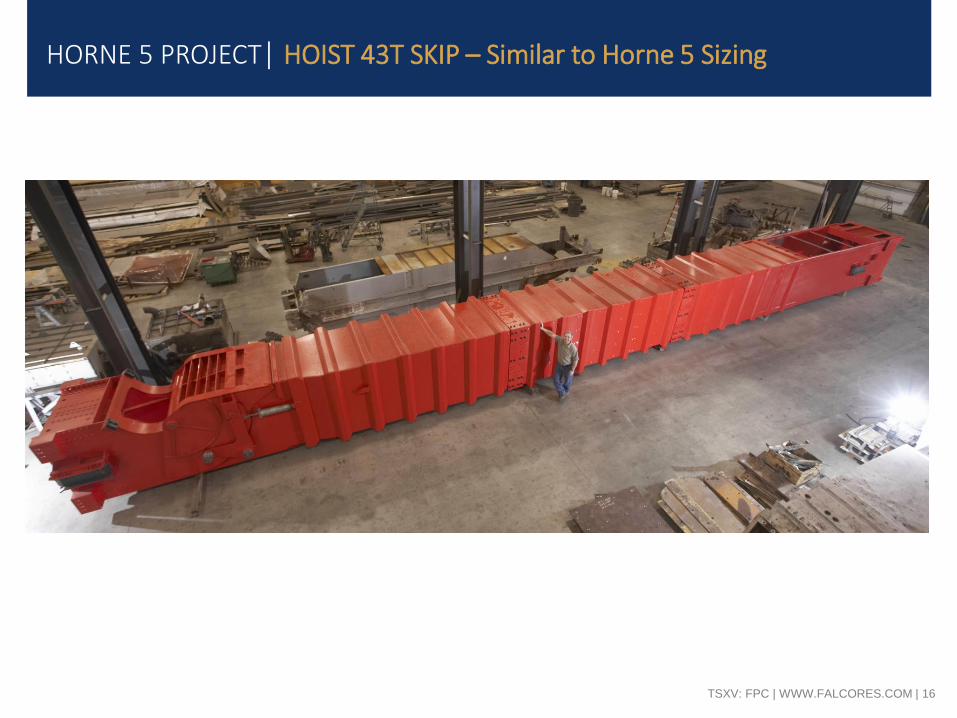
HORNE 5 PROJECT| HOIST 43T SKIP – Similar to Horne 5 Sizing
TSXV: FPC | WWW.FALCORES.COM | 17
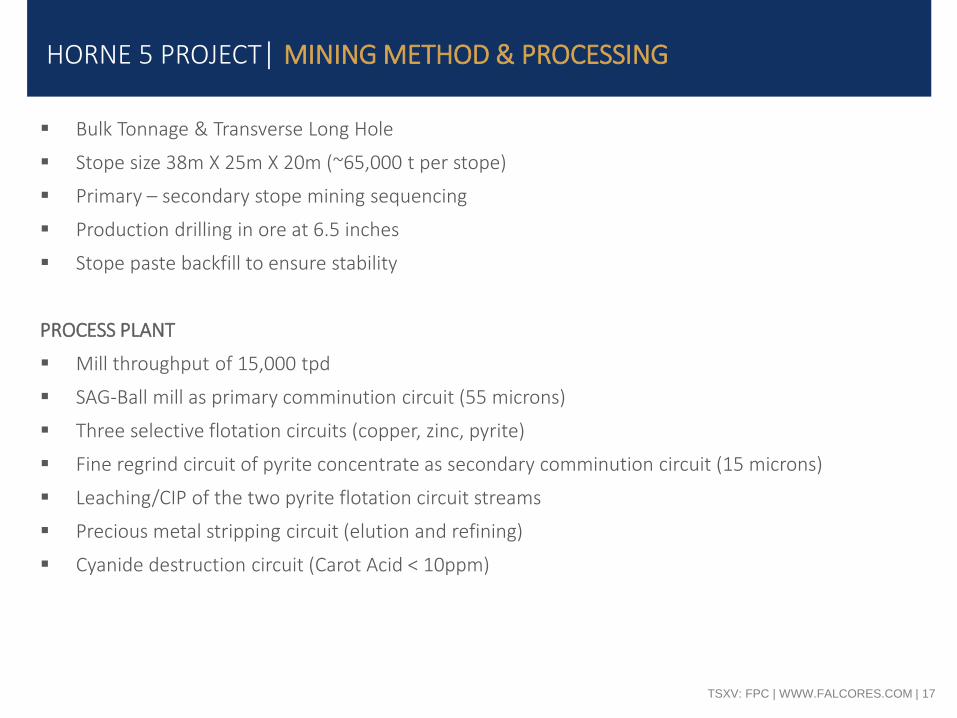
HORNE 5 PROJECT| MINING METHOD & PROCESSING
Bulk Tonnage & Transverse Long Hole
Stope size 38m X 25m X 20m (~65,000 t per stope)
Primary – secondary stope mining sequencing
Production drilling in ore at 6.5 inches
Stope paste backfill to ensure stability
PROCESS PLANT
Mill throughput of 15,000 tpd
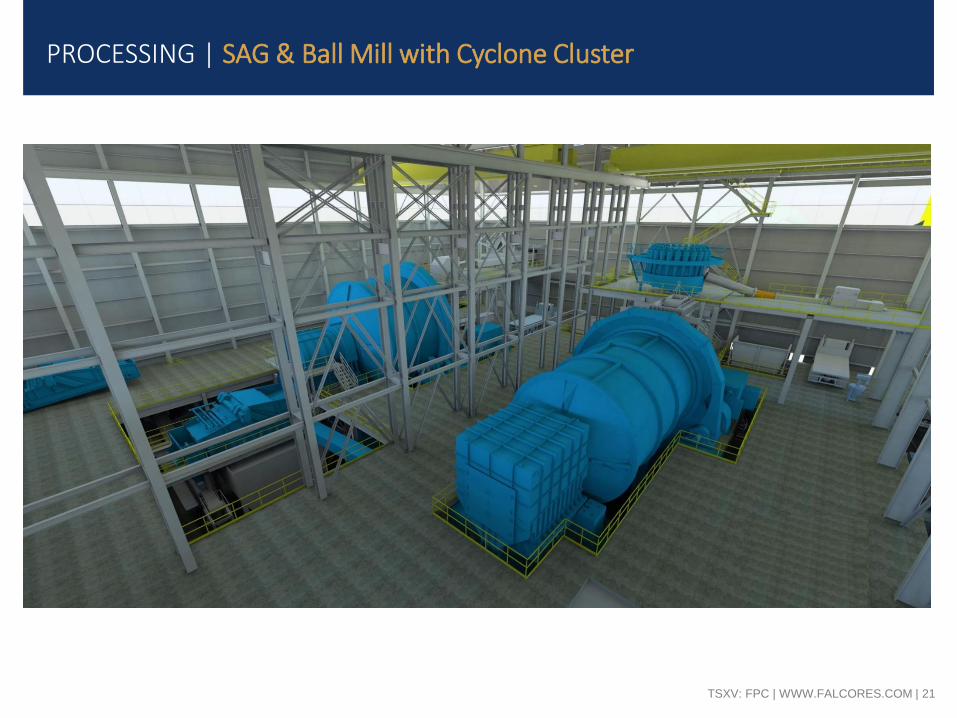
SAG-Ball mill as primary comminution circuit (55 microns)
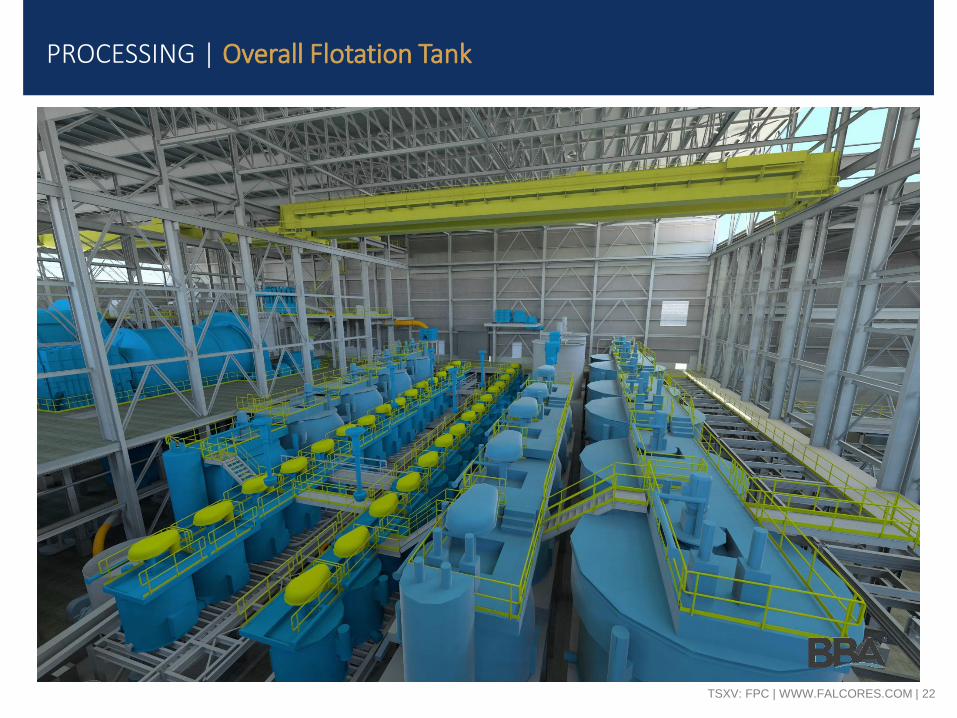
Three selective flotation circuits (copper, zinc, pyrite)
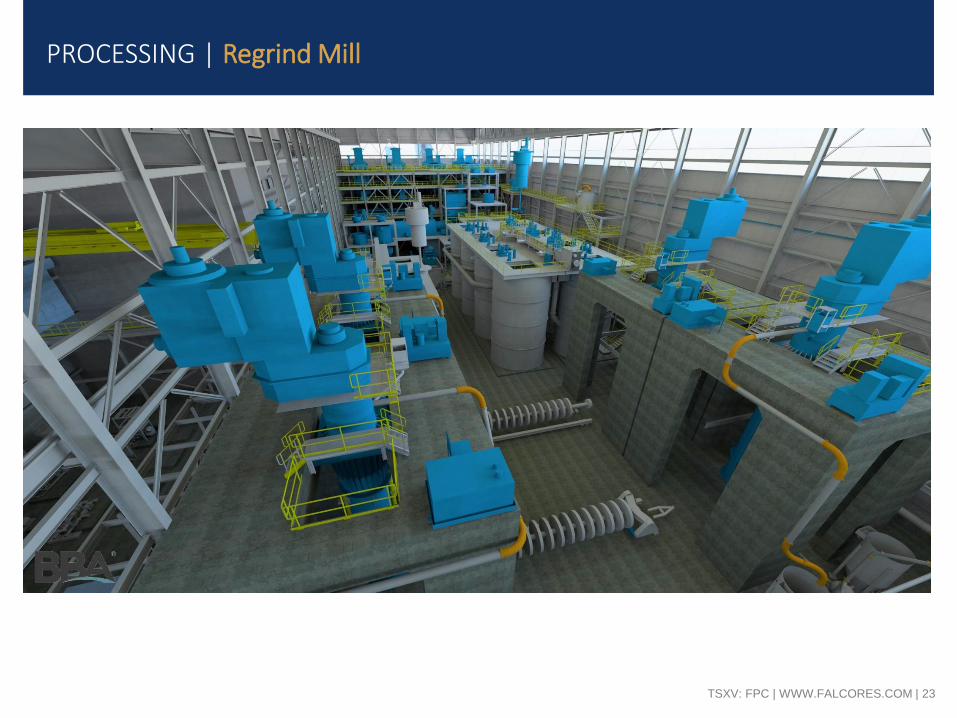
Fine regrind circuit of pyrite concentrate as secondary comminution circuit (15 microns)
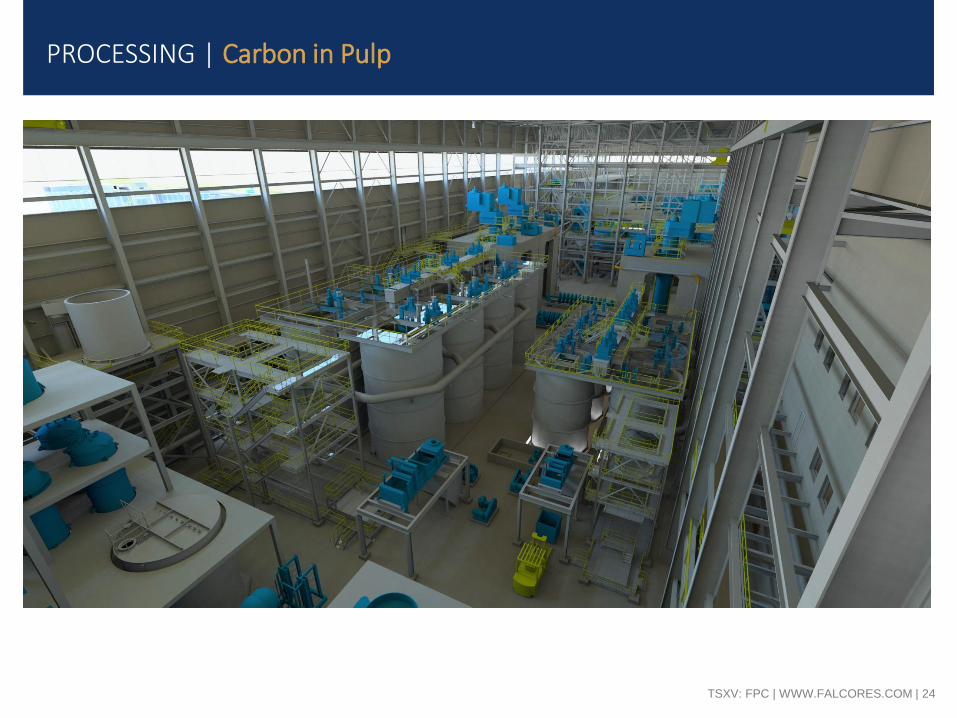
Leaching/CIP of the two pyrite flotation circuit streams
Precious metal stripping circuit (elution and refining)
Cyanide destruction circuit (Carot Acid < 10ppm)
TSXV: FPC | WWW.FALCORES.COM | 18
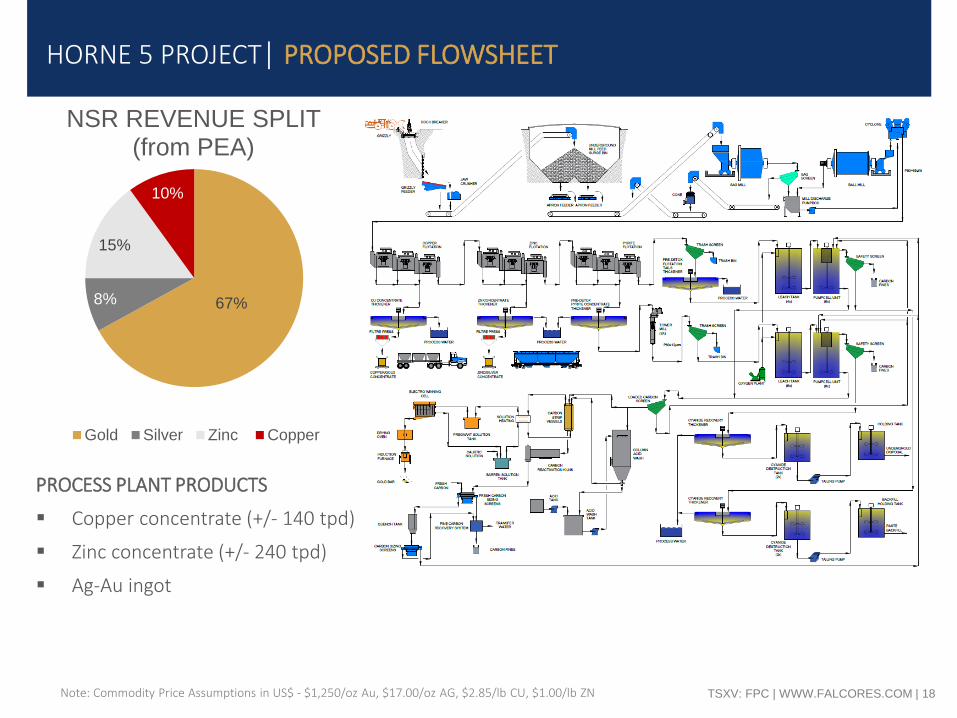
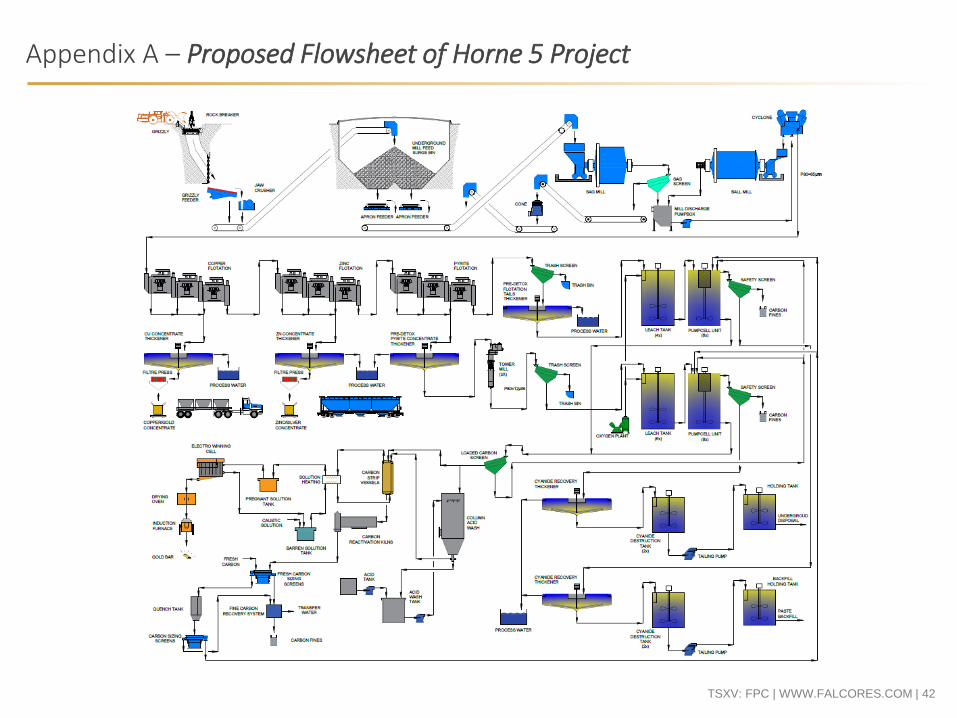
HORNE 5 PROJECT| PROPOSED FLOWSHEET
67%8%
15%
10%
NSR REVENUE SPLIT (from PEA)
Gold Silver Zinc Copper
Note: Commodity Price Assumptions in US$ - $1,250/oz Au, $17.00/oz AG, $2.85/lb CU, $1.00/lb ZN
PROCESS PLANT PRODUCTS
Copper concentrate (+/- 140 tpd)
Zinc concentrate (+/- 240 tpd)
Ag-Au ingot
TSXV: FPC | WWW.FALCORES.COM | 19
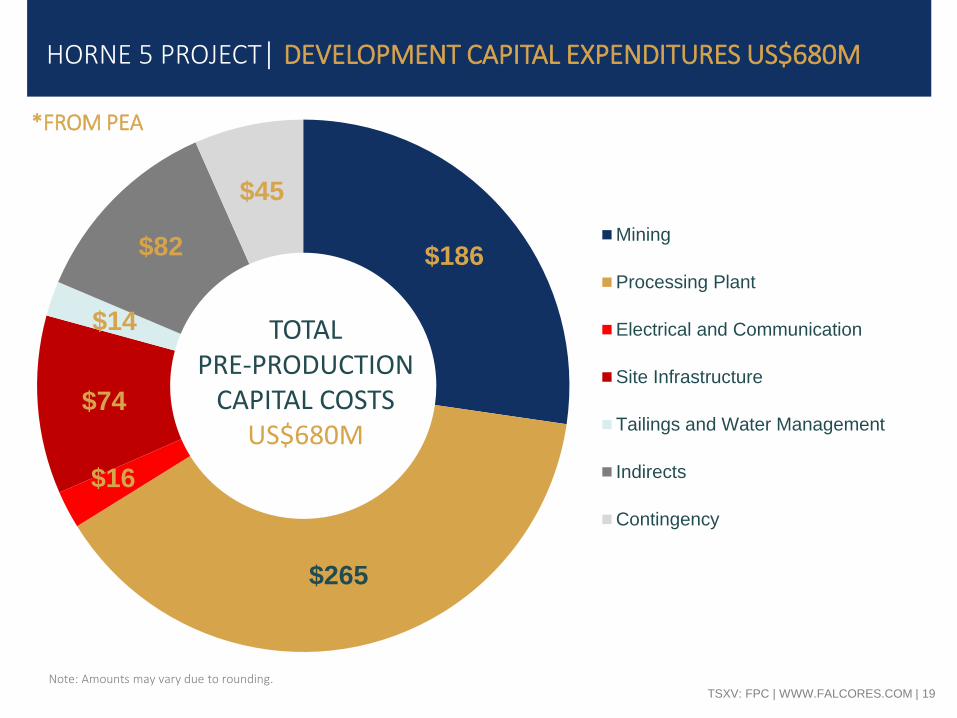
HORNE 5 PROJECT| DEVELOPMENT CAPITAL EXPENDITURES US$680M
$186
$265
$16
$74
$14
$82
$45
Mining
Processing Plant
Electrical and Communication
Site Infrastructure
Tailings and Water Management
Indirects
Contingency
TOTAL PRE-PRODUCTION
CAPITAL COSTS US$680M
Note: Amounts may vary due to rounding.
*FROM PEA
TSXV: FPC | WWW.FALCORES.COM | 20
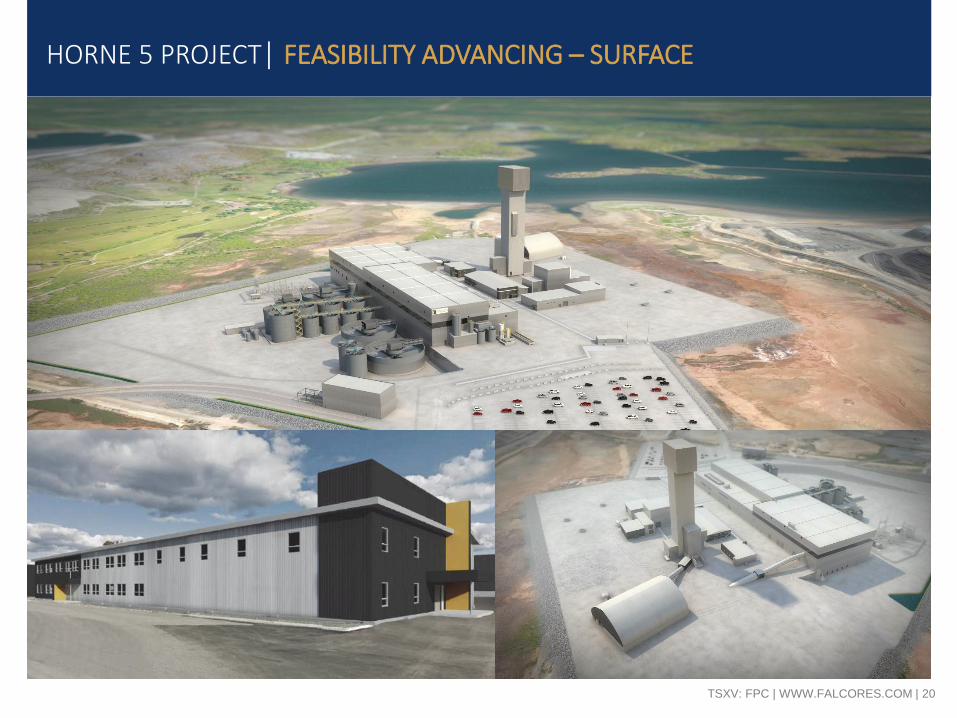
HORNE 5 PROJECT| FEASIBILITY ADVANCING – SURFACE
TSXV: FPC | WWW.FALCORES.COM | 21
PROCESSING | SAG & Ball Mill with Cyclone Cluster
TSXV: FPC | WWW.FALCORES.COM | 22
PROCESSING | Overall Flotation Tank
TSXV: FPC | WWW.FALCORES.COM | 23
PROCESSING | Regrind Mill
TSXV: FPC | WWW.FALCORES.COM | 24
PROCESSING | Carbon in Pulp
TSXV: FPC | WWW.FALCORES.COM | 25
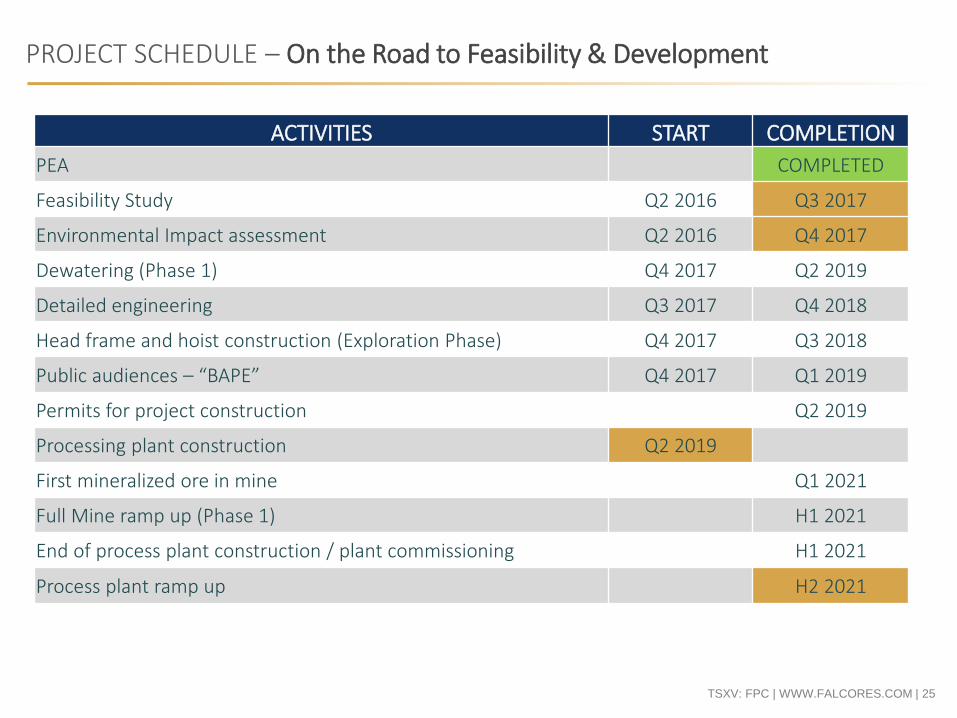
PROJECT SCHEDULE – On the Road to Feasibility & Development
ACTIVITIES START COMPLETION
PEA COMPLETED
Feasibility Study Q2 2016 Q3 2017
Environmental Impact assessment Q2 2016 Q4 2017
Dewatering (Phase 1) Q4 2017 Q2 2019
Detailed engineering Q3 2017 Q4 2018
Head frame and hoist construction (Exploration Phase) Q4 2017 Q3 2018
Public audiences – “BAPE” Q4 2017 Q1 2019
Permits for project construction Q2 2019
Processing plant construction Q2 2019
First mineralized ore in mine Q1 2021
Full Mine ramp up (Phase 1) H1 2021
End of process plant construction / plant commissioning H1 2021
Process plant ramp up H2 2021
TSXV: FPC | WWW.FALCORES.COM | 26
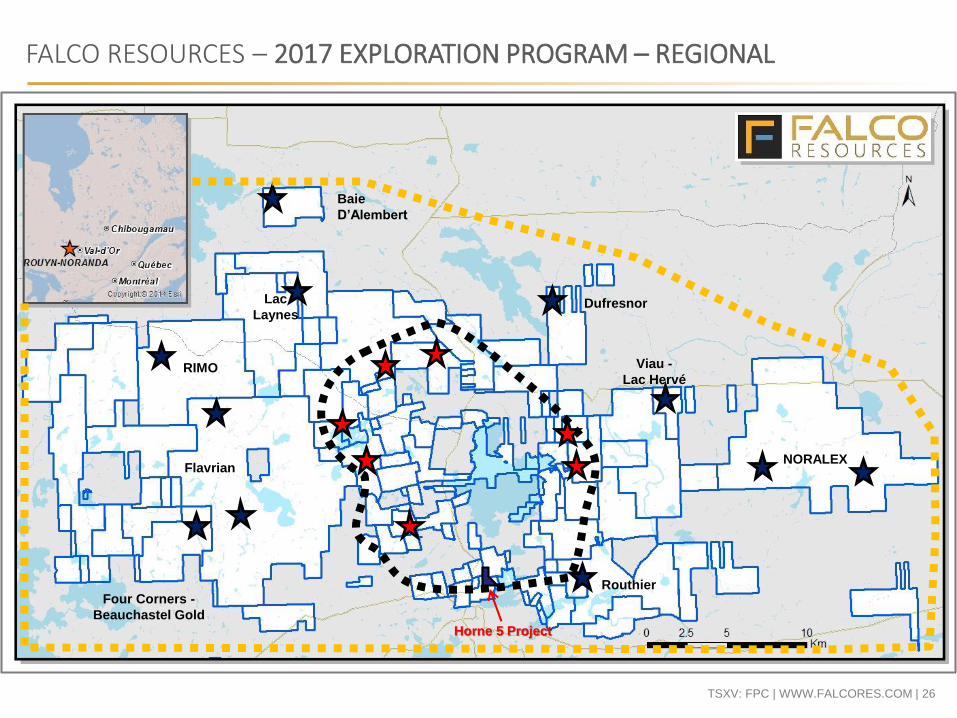
FALCO RESOURCES – 2017 EXPLORATION PROGRAM – REGIONAL
RIMO
Lac
Laynes
Routhier
NORALEX
Dufresnor
Baie
D’Alembert
Four Corners -
Beauchastel Gold
Viau -
Lac Hervé
Horne 5 Project
Flavrian
TSXV: FPC | WWW.FALCORES.COM | 27
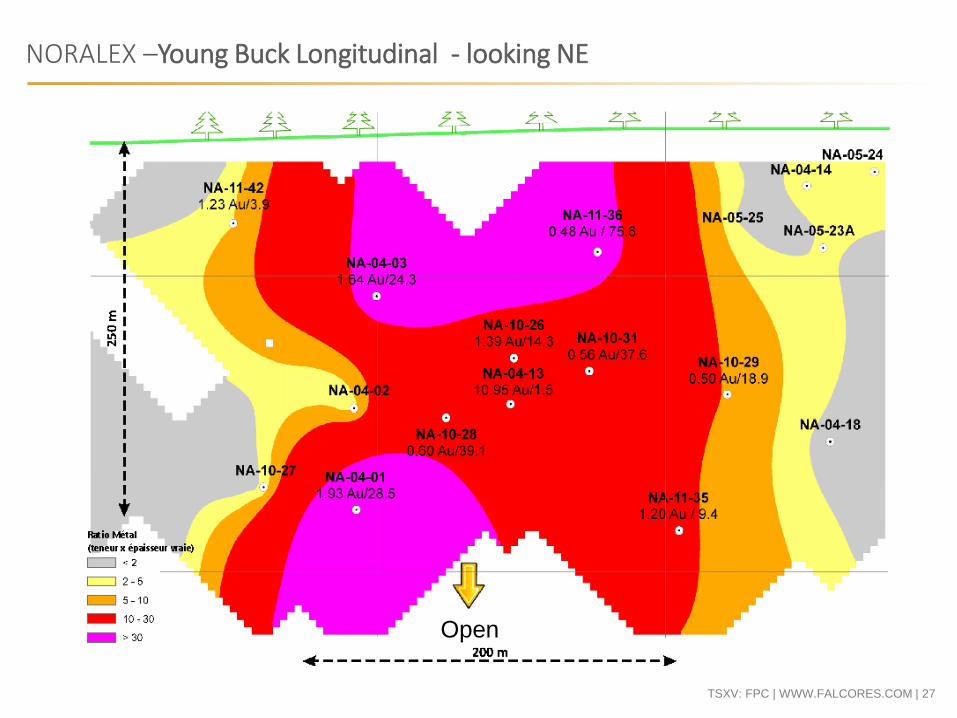
NORALEX –Young Buck Longitudinal - looking NE
Open
TSXV: FPC | WWW.FALCORES.COM | 28
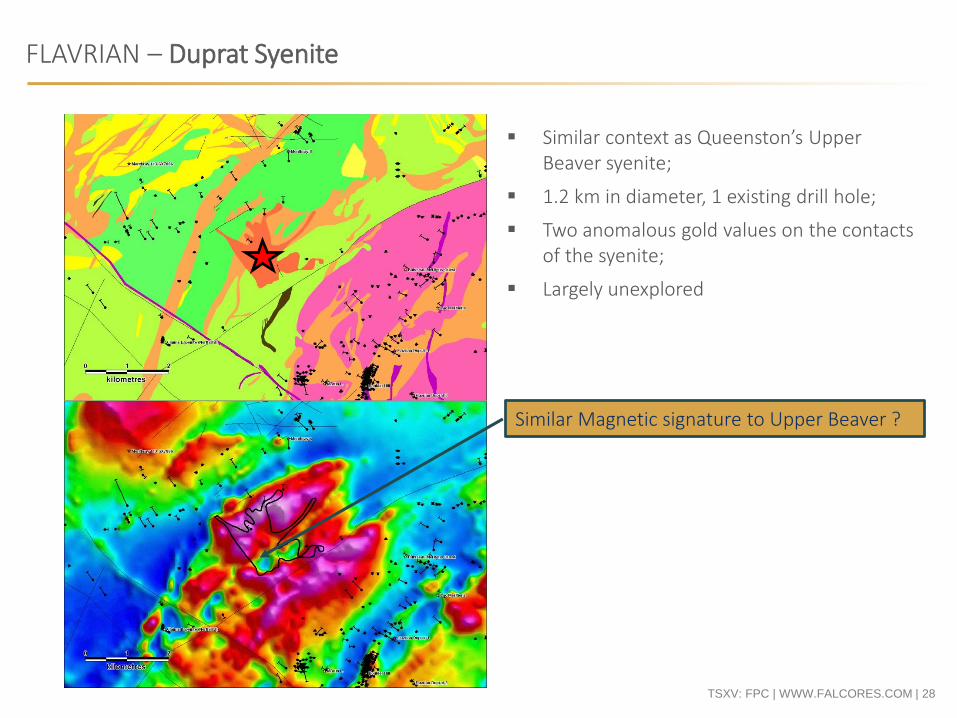
FLAVRIAN – Duprat Syenite
Similar Magnetic signature to Upper Beaver ?
Similar context as Queenston’s Upper Beaver syenite;
1.2 km in diameter, 1 existing drill hole;
Two anomalous gold values on the contacts of the syenite;
Largely unexplored
TSXV: FPC | WWW.FALCORES.COM | 29
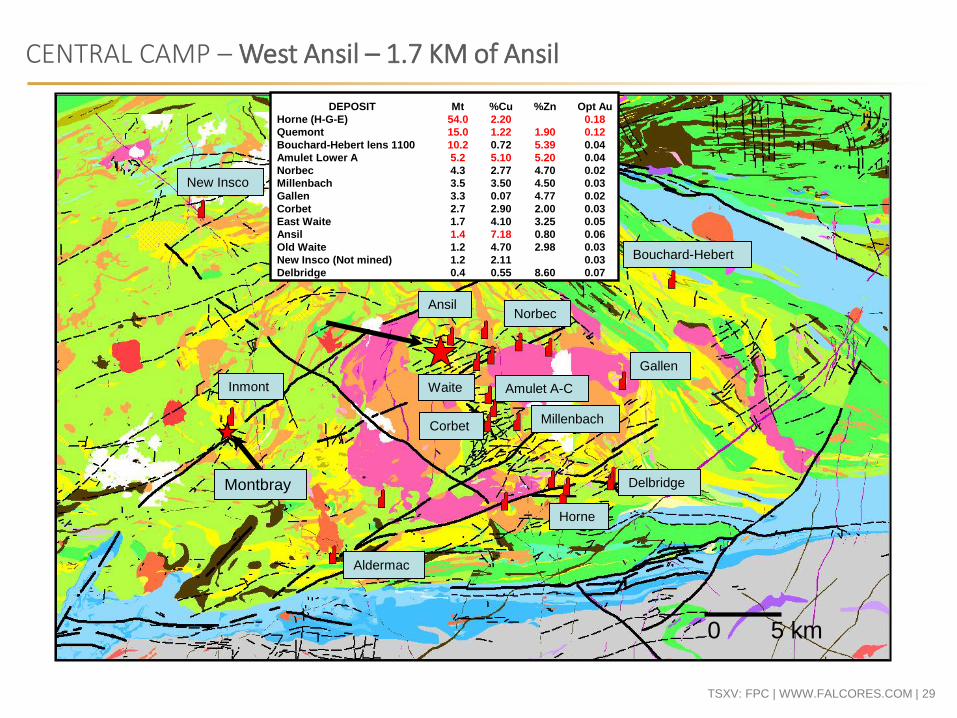
CENTRAL CAMP – West Ansil – 1.7 KM of Ansil
Inmont
New Insco
Bouchard-Hebert
Horne
Ansil
Gallen
Aldermac
CorbetMillenbach
0 5 km
Montbray
Norbec
Delbridge
Amulet A-CWaite
DEPOSIT Mt %Cu %Zn Opt Au
Horne (H-G-E) 54.0 2.20 0.18
Quemont 15.0 1.22 1.90 0.12
Bouchard-Hebert lens 1100 10.2 0.72 5.39 0.04
Amulet Lower A 5.2 5.10 5.20 0.04
Norbec 4.3 2.77 4.70 0.02
Millenbach 3.5 3.50 4.50 0.03
Gallen 3.3 0.07 4.77 0.02
Corbet 2.7 2.90 2.00 0.03
East Waite 1.7 4.10 3.25 0.05
Ansil 1.4 7.18 0.80 0.06
Old Waite 1.2 4.70 2.98 0.03
New Insco (Not mined) 1.2 2.11 0.03
Delbridge 0.4 0.55 8.60 0.07
TSXV: FPC | WWW.FALCORES.COM | 30
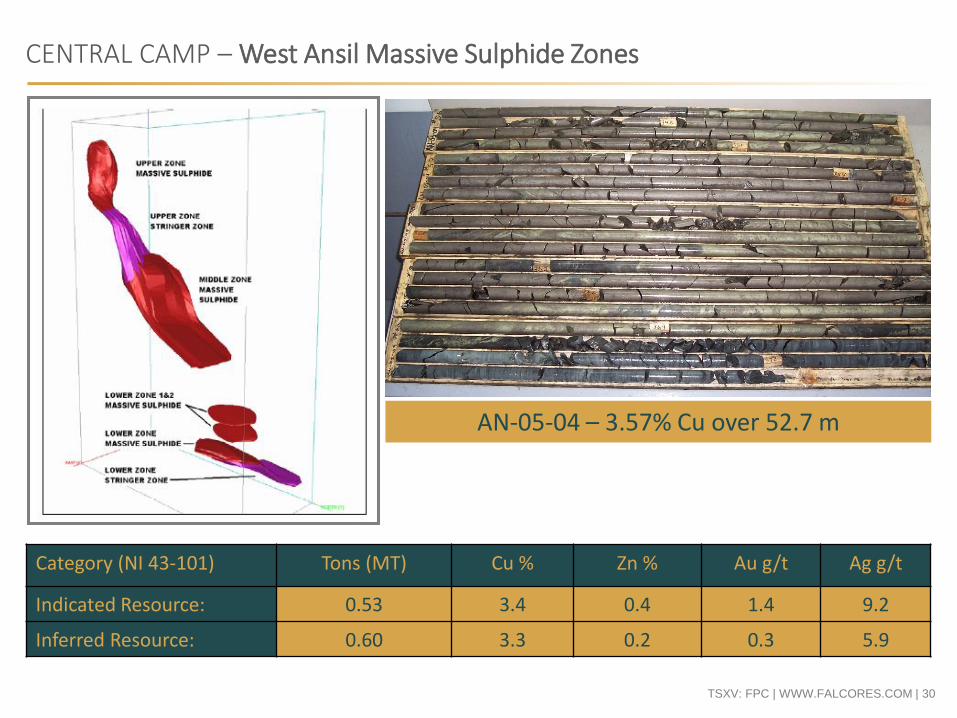
CENTRAL CAMP – West Ansil Massive Sulphide Zones
Category (NI 43-101) Tons (MT) Cu % Zn % Au g/t Ag g/t
Indicated Resource: 0.53 3.4 0.4 1.4 9.2
Inferred Resource: 0.60 3.3 0.2 0.3 5.9
AN-05-04 – 3.57% Cu over 52.7 m
TSXV: FPC | WWW.FALCORES.COM | 31
Head Office
Falco Resources Ltd.
1100, avenue des
Canadiens-de-Montréal
Bureau 300
Montréal, QC H3B 2S2
Tél. : +1.514.905.3162
Toll Free : +1.888.915.2009
Courriel : [email protected]
Investor Inquiries
Vincent Metcalfe, CFO
Tel: +1.514.905.3162
Email: [email protected]
CONTACT US
TSXV: FPC | WWW.FALCORES.COM | 32
APPENDIXAppendix A – PEA Additional InformationAppendix B – Resource & Modeling NotesAppendix C – Research Coverage
TSXV: FPC | WWW.FALCORES.COM | 33
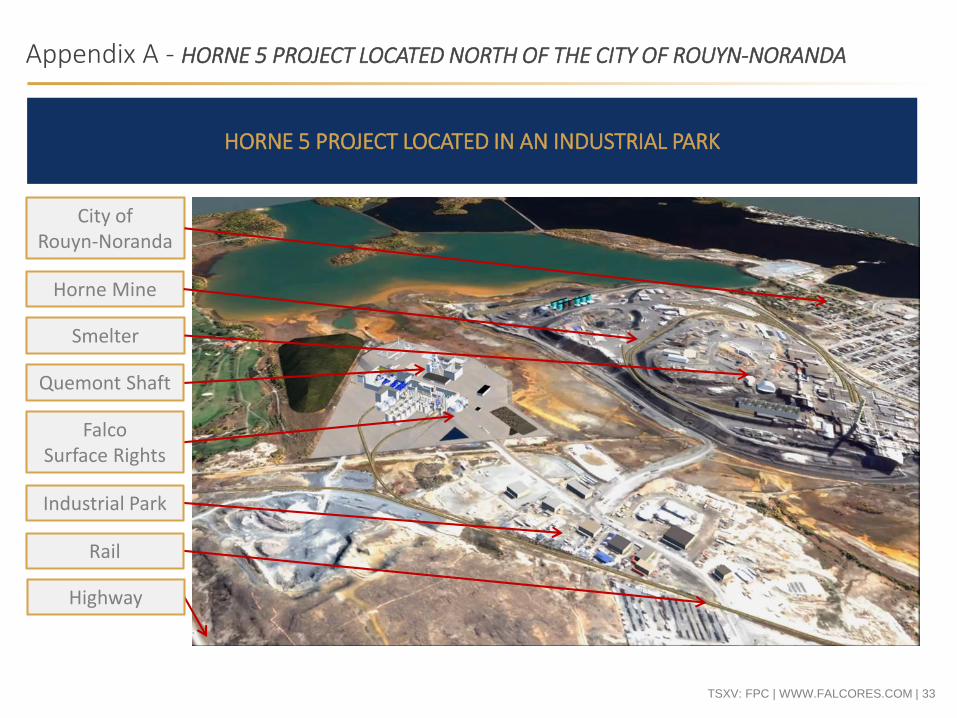
Appendix A - HORNE 5 PROJECT LOCATED NORTH OF THE CITY OF ROUYN-NORANDA
HORNE 5 PROJECT LOCATED IN AN INDUSTRIAL PARK
City of Rouyn-Noranda
Smelter
Horne Mine
Quemont Shaft
Falco Surface Rights
Industrial Park
Rail
Highway
TSXV: FPC | WWW.FALCORES.COM | 34
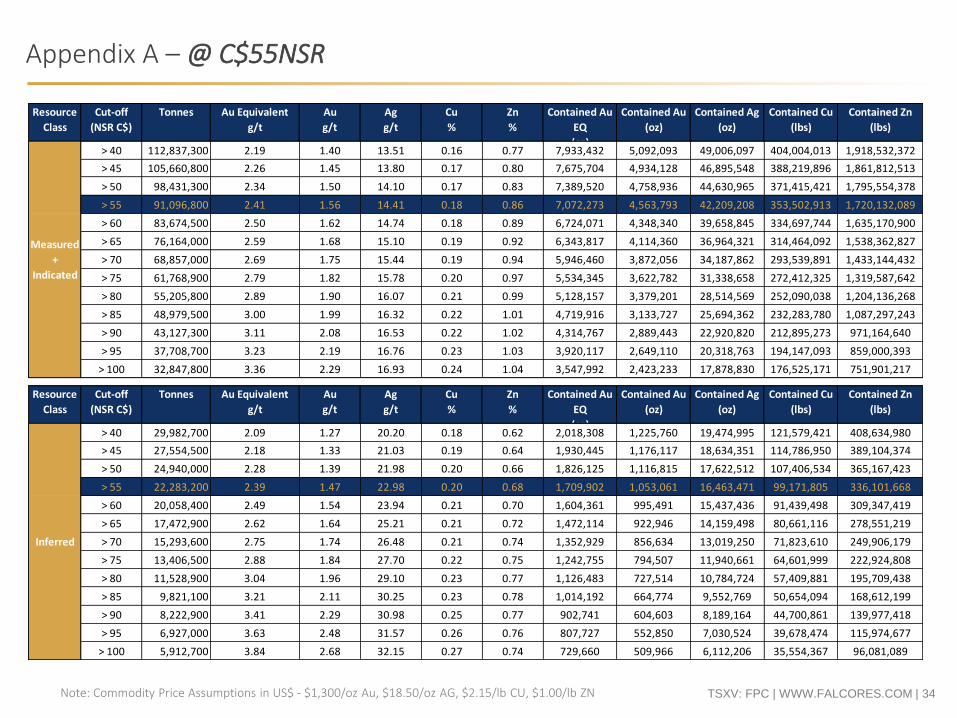
Appendix A – @ C$55NSR
Note: Commodity Price Assumptions in US$ - $1,300/oz Au, $18.50/oz AG, $2.15/lb CU, $1.00/lb ZN
Resource
Class
Cut-off
(NSR C$)
Tonnes Au Equivalent
g/t
Au
g/t
Ag
g/t
Cu
%
Zn
%
Contained Au
EQ
(oz)
Contained Au
(oz)
Contained Ag
(oz)
Contained Cu
(lbs)
Contained Zn
(lbs)
> 40 112,837,300 2.19 1.40 13.51 0.16 0.77 7,933,432 5,092,093 49,006,097 404,004,013 1,918,532,372
> 45 105,660,800 2.26 1.45 13.80 0.17 0.80 7,675,704 4,934,128 46,895,548 388,219,896 1,861,812,513
> 50 98,431,300 2.34 1.50 14.10 0.17 0.83 7,389,520 4,758,936 44,630,965 371,415,421 1,795,554,378
> 55 91,096,800 2.41 1.56 14.41 0.18 0.86 7,072,273 4,563,793 42,209,208 353,502,913 1,720,132,089
> 60 83,674,500 2.50 1.62 14.74 0.18 0.89 6,724,071 4,348,340 39,658,845 334,697,744 1,635,170,900
> 65 76,164,000 2.59 1.68 15.10 0.19 0.92 6,343,817 4,114,360 36,964,321 314,464,092 1,538,362,827
> 70 68,857,000 2.69 1.75 15.44 0.19 0.94 5,946,460 3,872,056 34,187,862 293,539,891 1,433,144,432
> 75 61,768,900 2.79 1.82 15.78 0.20 0.97 5,534,345 3,622,782 31,338,658 272,412,325 1,319,587,642
> 80 55,205,800 2.89 1.90 16.07 0.21 0.99 5,128,157 3,379,201 28,514,569 252,090,038 1,204,136,268
> 85 48,979,500 3.00 1.99 16.32 0.22 1.01 4,719,916 3,133,727 25,694,362 232,283,780 1,087,297,243
> 90 43,127,300 3.11 2.08 16.53 0.22 1.02 4,314,767 2,889,443 22,920,820 212,895,273 971,164,640
> 95 37,708,700 3.23 2.19 16.76 0.23 1.03 3,920,117 2,649,110 20,318,763 194,147,093 859,000,393
> 100 32,847,800 3.36 2.29 16.93 0.24 1.04 3,547,992 2,423,233 17,878,830 176,525,171 751,901,217
Resource
Class
Cut-off
(NSR C$)
Tonnes Au Equivalent
g/t
Au
g/t
Ag
g/t
Cu
%
Zn
%
Contained Au
EQ
(oz)
Contained Au
(oz)
Contained Ag
(oz)
Contained Cu
(lbs)
Contained Zn
(lbs)
> 40 29,982,700 2.09 1.27 20.20 0.18 0.62 2,018,308 1,225,760 19,474,995 121,579,421 408,634,980
> 45 27,554,500 2.18 1.33 21.03 0.19 0.64 1,930,445 1,176,117 18,634,351 114,786,950 389,104,374
> 50 24,940,000 2.28 1.39 21.98 0.20 0.66 1,826,125 1,116,815 17,622,512 107,406,534 365,167,423
> 55 22,283,200 2.39 1.47 22.98 0.20 0.68 1,709,902 1,053,061 16,463,471 99,171,805 336,101,668
> 60 20,058,400 2.49 1.54 23.94 0.21 0.70 1,604,361 995,491 15,437,436 91,439,498 309,347,419
> 65 17,472,900 2.62 1.64 25.21 0.21 0.72 1,472,114 922,946 14,159,498 80,661,116 278,551,219
> 70 15,293,600 2.75 1.74 26.48 0.21 0.74 1,352,929 856,634 13,019,250 71,823,610 249,906,179
> 75 13,406,500 2.88 1.84 27.70 0.22 0.75 1,242,755 794,507 11,940,661 64,601,999 222,924,808
> 80 11,528,900 3.04 1.96 29.10 0.23 0.77 1,126,483 727,514 10,784,724 57,409,881 195,709,438
> 85 9,821,100 3.21 2.11 30.25 0.23 0.78 1,014,192 664,774 9,552,769 50,654,094 168,612,199
> 90 8,222,900 3.41 2.29 30.98 0.25 0.77 902,741 604,603 8,189,164 44,700,861 139,977,418
> 95 6,927,000 3.63 2.48 31.57 0.26 0.76 807,727 552,850 7,030,524 39,678,474 115,974,677
> 100 5,912,700 3.84 2.68 32.15 0.27 0.74 729,660 509,966 6,112,206 35,554,367 96,081,089
Inferred
Measured
+
Indicated
TSXV: FPC | WWW.FALCORES.COM | 35
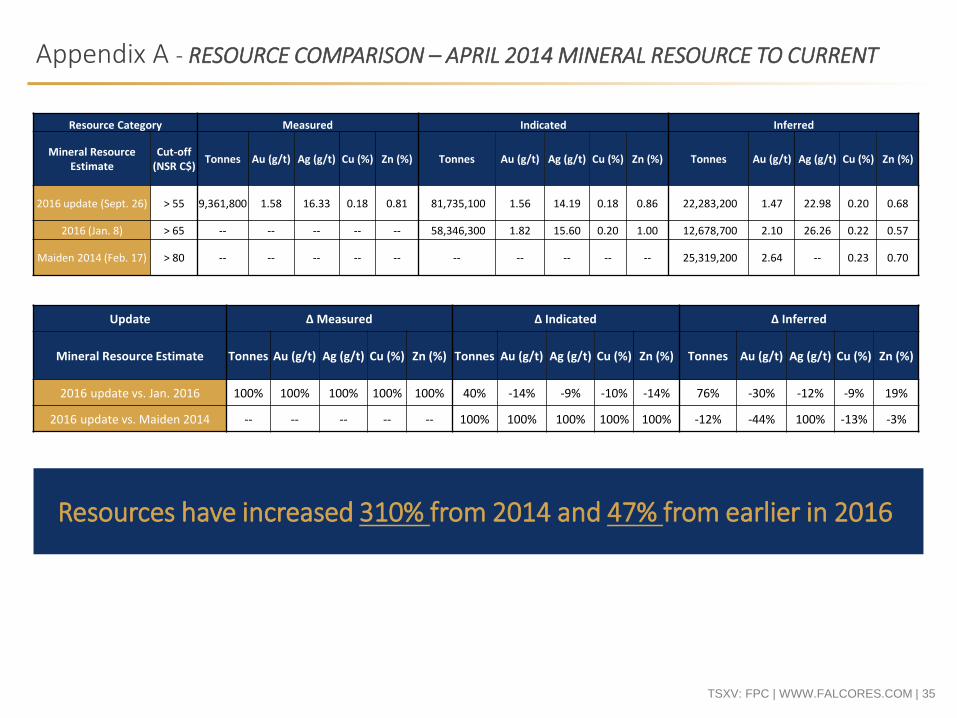
Appendix A - RESOURCE COMPARISON – APRIL 2014 MINERAL RESOURCE TO CURRENT
Resource Category Measured Indicated Inferred
Mineral Resource Estimate
Cut-off (NSR C$)
Tonnes Au (g/t) Ag (g/t) Cu (%) Zn (%) Tonnes Au (g/t) Ag (g/t) Cu (%) Zn (%) Tonnes Au (g/t) Ag (g/t) Cu (%) Zn (%)
2016 update (Sept. 26) > 55 9,361,800 1.58 16.33 0.18 0.81 81,735,100 1.56 14.19 0.18 0.86 22,283,200 1.47 22.98 0.20 0.68
2016 (Jan. 8) > 65 -- -- -- -- -- 58,346,300 1.82 15.60 0.20 1.00 12,678,700 2.10 26.26 0.22 0.57
Maiden 2014 (Feb. 17) > 80 -- -- -- -- -- -- -- -- -- -- 25,319,200 2.64 -- 0.23 0.70
Update ∆ Measured ∆ Indicated ∆ Inferred
Mineral Resource Estimate Tonnes Au (g/t) Ag (g/t) Cu (%) Zn (%) Tonnes Au (g/t) Ag (g/t) Cu (%) Zn (%) Tonnes Au (g/t) Ag (g/t) Cu (%) Zn (%)
2016 update vs. Jan. 2016 100% 100% 100% 100% 100% 40% -14% -9% -10% -14% 76% -30% -12% -9% 19%
2016 update vs. Maiden 2014 -- -- -- -- -- 100% 100% 100% 100% 100% -12% -44% 100% -13% -3%
Resources have increased 310% from 2014 and 47% from earlier in 2016
TSXV: FPC | WWW.FALCORES.COM | 36
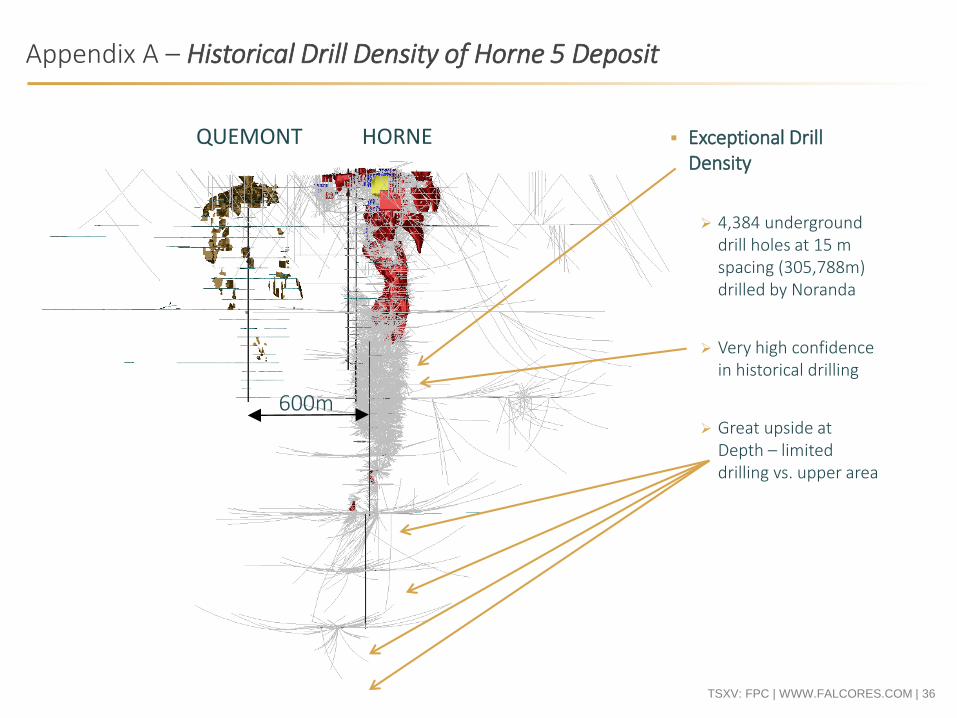
Appendix A – Historical Drill Density of Horne 5 Deposit
600m
HORNEQUEMONT Exceptional Drill Density
4,384 underground drill holes at 15 m spacing (305,788m) drilled by Noranda
Very high confidence in historical drilling
Great upside at Depth – limited drilling vs. upper area
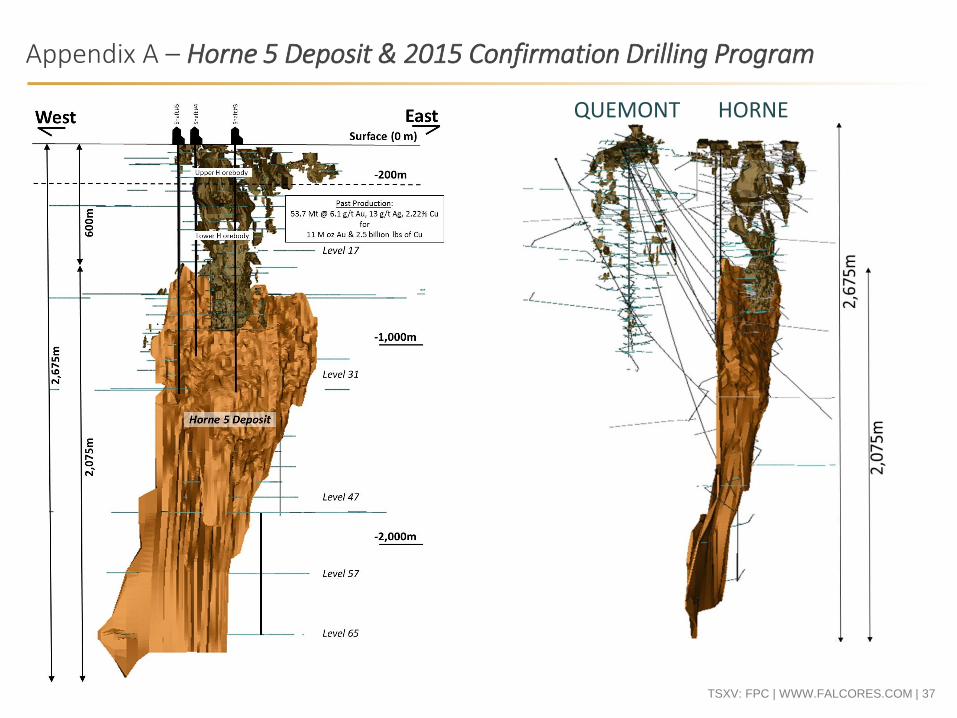
TSXV: FPC | WWW.FALCORES.COM | 37
Appendix A – Horne 5 Deposit & 2015 Confirmation Drilling Program
HORNEQUEMONT
TSXV: FPC | WWW.FALCORES.COM | 38
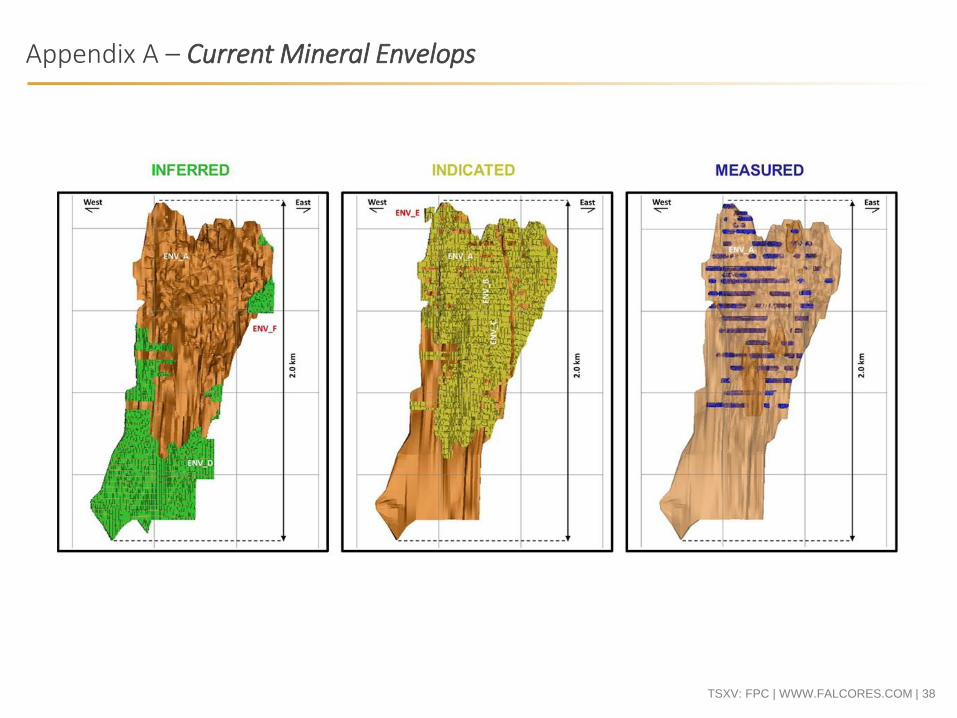
Appendix A – Current Mineral Envelops
TSXV: FPC | WWW.FALCORES.COM | 39
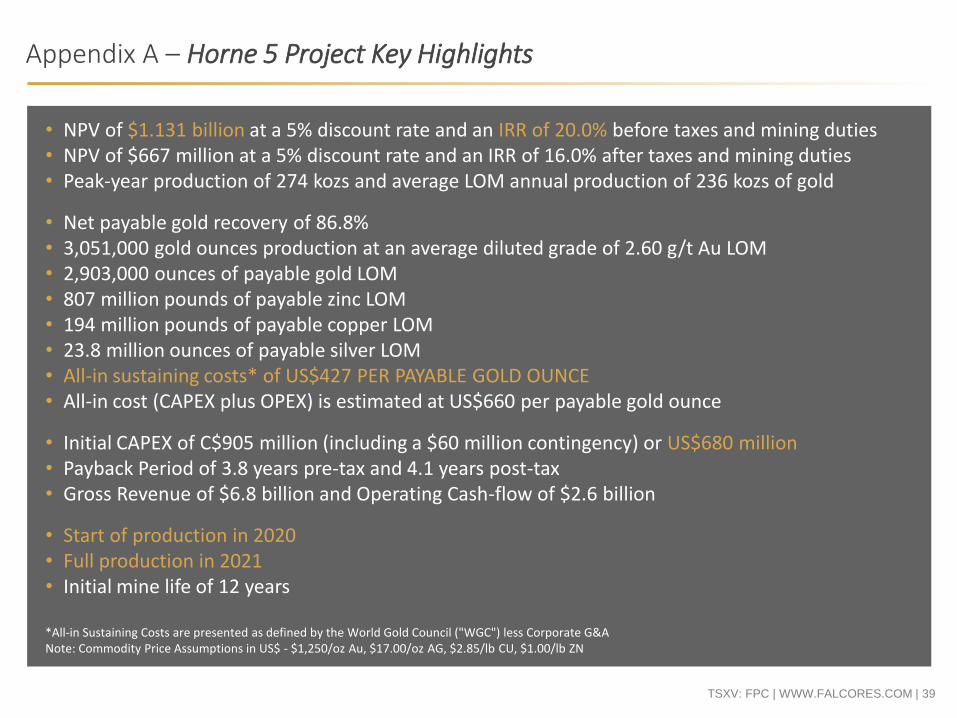
• NPV of $1.131 billion at a 5% discount rate and an IRR of 20.0% before taxes and mining duties• NPV of $667 million at a 5% discount rate and an IRR of 16.0% after taxes and mining duties• Peak-year production of 274 kozs and average LOM annual production of 236 kozs of gold
• Net payable gold recovery of 86.8%• 3,051,000 gold ounces production at an average diluted grade of 2.60 g/t Au LOM• 2,903,000 ounces of payable gold LOM• 807 million pounds of payable zinc LOM• 194 million pounds of payable copper LOM• 23.8 million ounces of payable silver LOM• All-in sustaining costs* of US$427 PER PAYABLE GOLD OUNCE• All-in cost (CAPEX plus OPEX) is estimated at US$660 per payable gold ounce
• Initial CAPEX of C$905 million (including a $60 million contingency) or US$680 million• Payback Period of 3.8 years pre-tax and 4.1 years post-tax• Gross Revenue of $6.8 billion and Operating Cash-flow of $2.6 billion
• Start of production in 2020• Full production in 2021• Initial mine life of 12 years
*All-in Sustaining Costs are presented as defined by the World Gold Council ("WGC") less Corporate G&ANote: Commodity Price Assumptions in US$ - $1,250/oz Au, $17.00/oz AG, $2.85/lb CU, $1.00/lb ZN
Appendix A – Horne 5 Project Key Highlights
TSXV: FPC | WWW.FALCORES.COM | 40
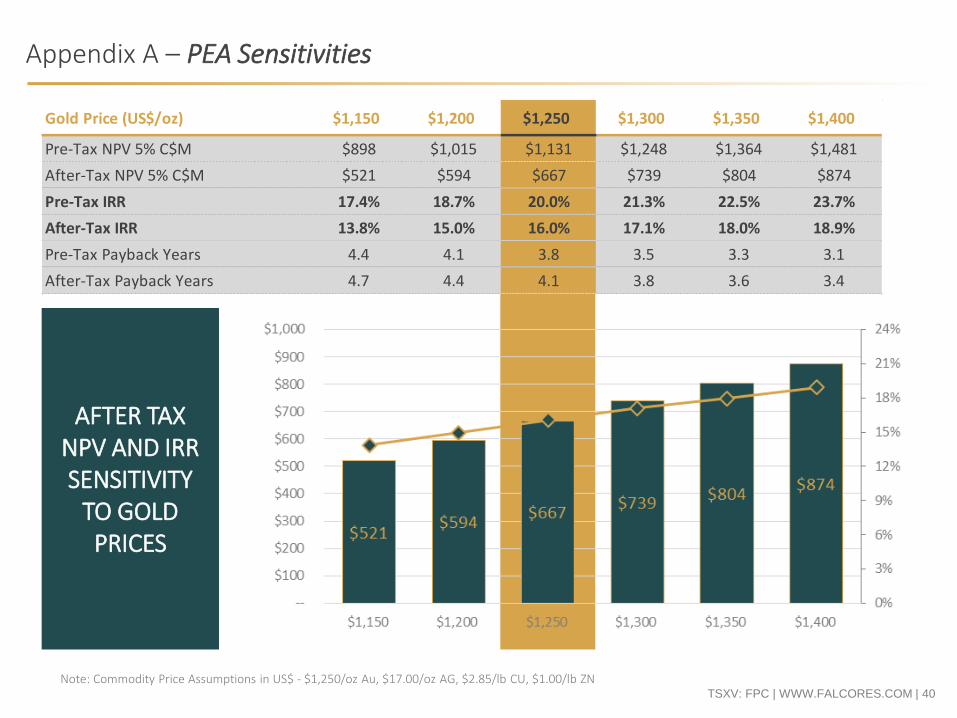
AFTER TAX NPV AND IRR SENSITIVITY
TO GOLD PRICES
Gold Price (US$/oz) $1,150 $1,200 $1,250 $1,300 $1,350 $1,400
Pre-Tax NPV 5% C$M $898 $1,015 $1,131 $1,248 $1,364 $1,481
After-Tax NPV 5% C$M $521 $594 $667 $739 $804 $874
Pre-Tax IRR 17.4% 18.7% 20.0% 21.3% 22.5% 23.7%
After-Tax IRR 13.8% 15.0% 16.0% 17.1% 18.0% 18.9%
Pre-Tax Payback Years 4.4 4.1 3.8 3.5 3.3 3.1
After-Tax Payback Years 4.7 4.4 4.1 3.8 3.6 3.4
Note: Commodity Price Assumptions in US$ - $1,250/oz Au, $17.00/oz AG, $2.85/lb CU, $1.00/lb ZN
Appendix A – PEA Sensitivities
TSXV: FPC | WWW.FALCORES.COM | 41
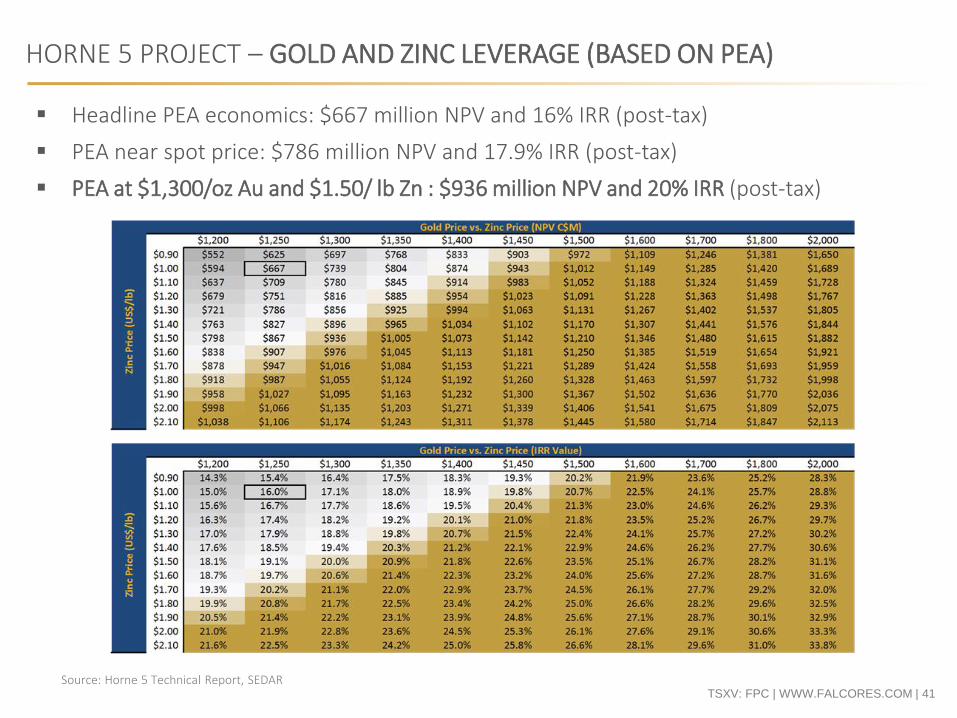
HORNE 5 PROJECT – GOLD AND ZINC LEVERAGE (BASED ON PEA)
Source: Horne 5 Technical Report, SEDAR
Headline PEA economics: $667 million NPV and 16% IRR (post-tax)
PEA near spot price: $786 million NPV and 17.9% IRR (post-tax)
PEA at $1,300/oz Au and $1.50/ lb Zn : $936 million NPV and 20% IRR (post-tax)
TSXV: FPC | WWW.FALCORES.COM | 42
Appendix A – Proposed Flowsheet of Horne 5 Project
TSXV: FPC | WWW.FALCORES.COM | 43
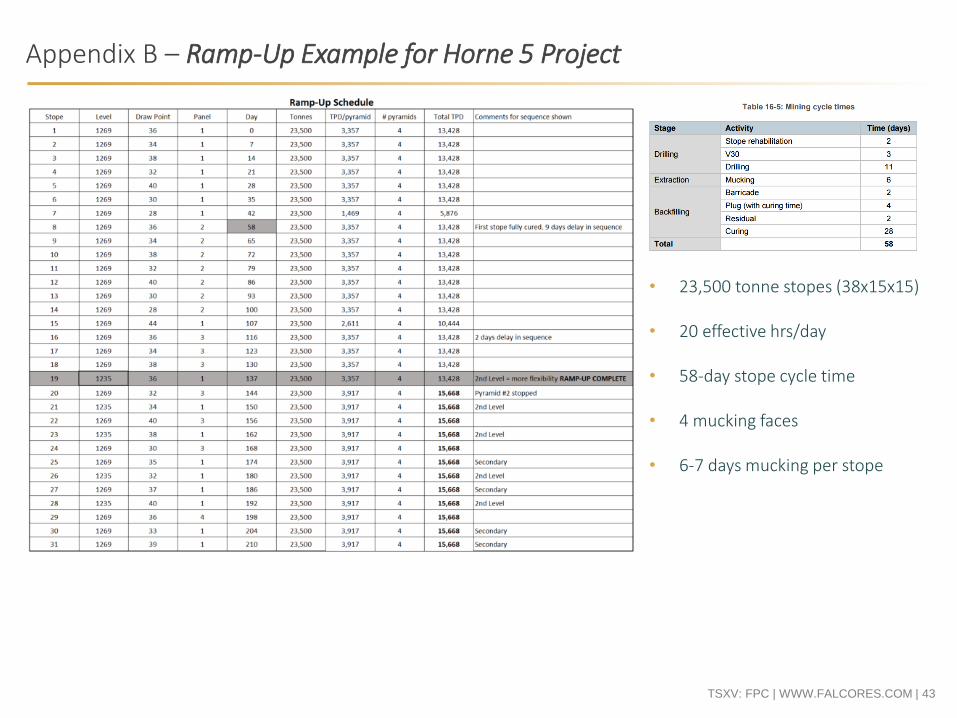
Appendix B – Ramp-Up Example for Horne 5 Project
• 23,500 tonne stopes (38x15x15)
• 20 effective hrs/day
• 58-day stope cycle time
• 4 mucking faces
• 6-7 days mucking per stope
TSXV: FPC | WWW.FALCORES.COM | 44
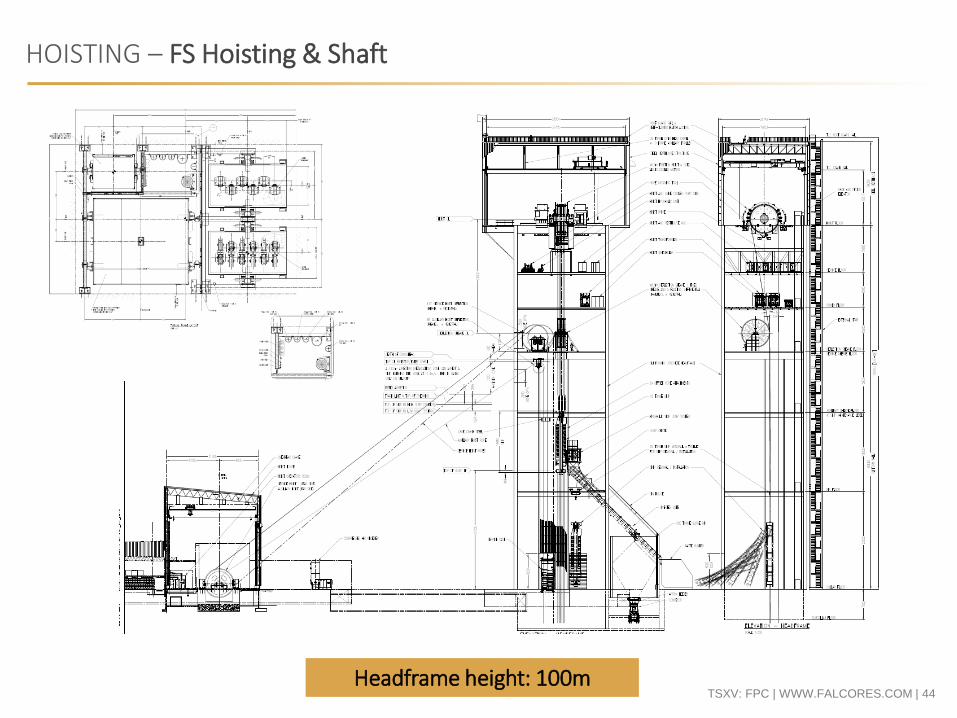
HOISTING – FS Hoisting & Shaft
Headframe height: 100m
TSXV: FPC | WWW.FALCORES.COM | 45
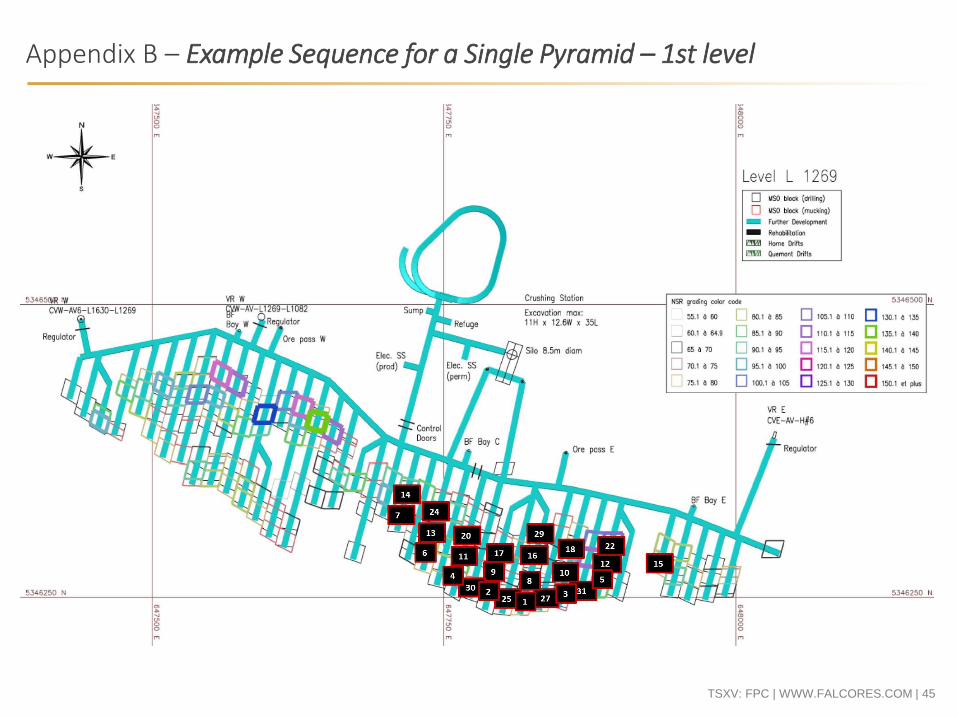
Appendix B – Example Sequence for a Single Pyramid – 1st level
TSXV: FPC | WWW.FALCORES.COM | 46
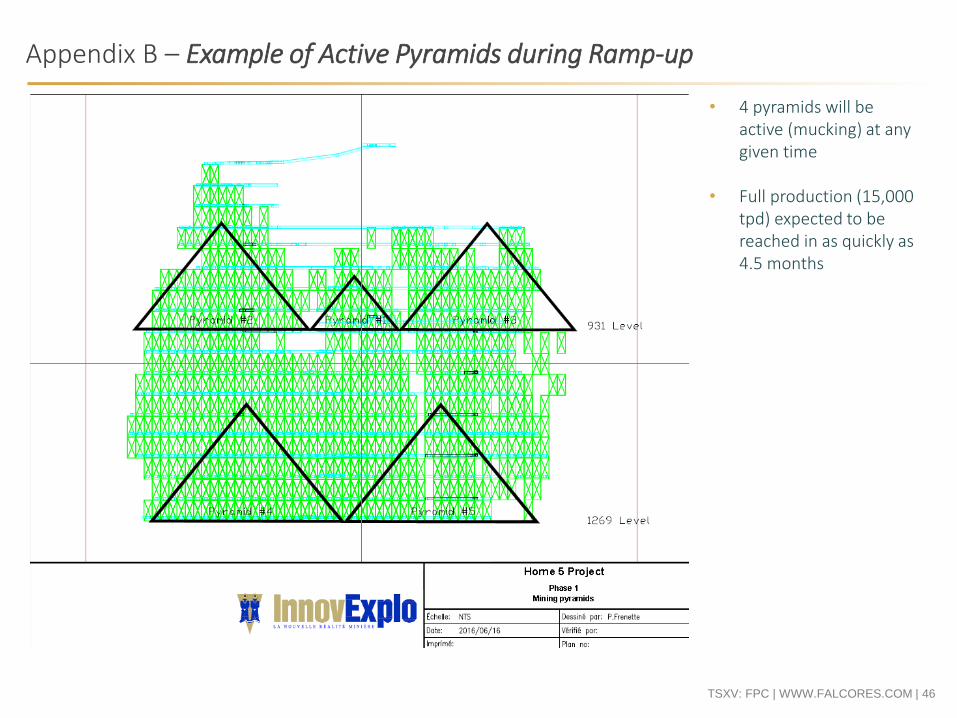
Appendix B – Example of Active Pyramids during Ramp-up
• 4 pyramids will be active (mucking) at any given time
• Full production (15,000 tpd) expected to be reached in as quickly as 4.5 months
TSXV: FPC | WWW.FALCORES.COM | 47
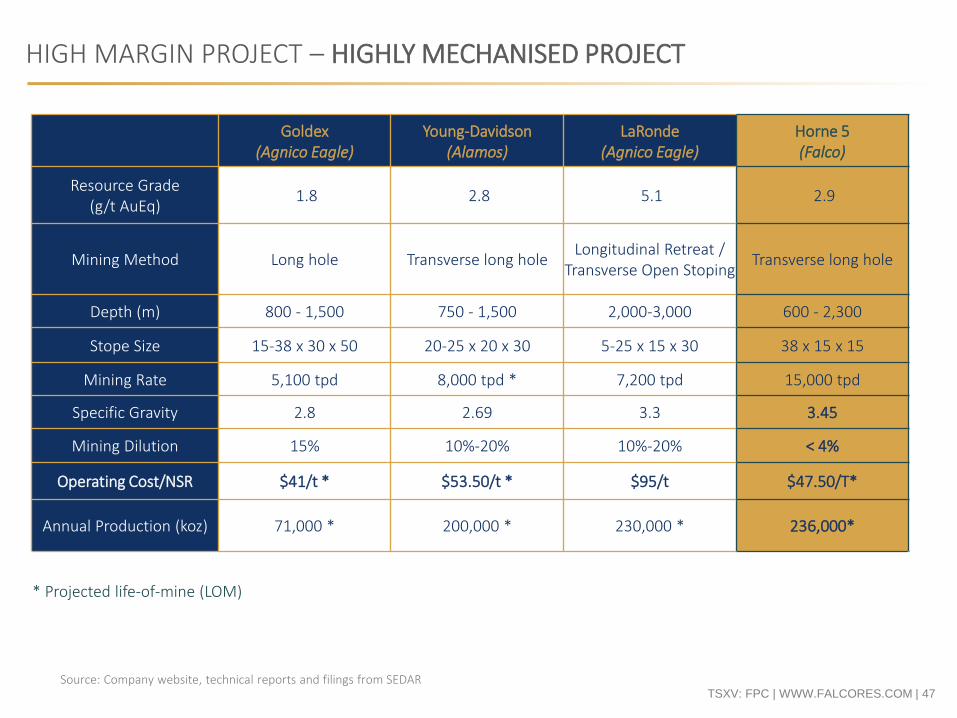
HIGH MARGIN PROJECT – HIGHLY MECHANISED PROJECT
Goldex(Agnico Eagle)
Young-Davidson(Alamos)
LaRonde(Agnico Eagle)
Horne 5(Falco)
Resource Grade (g/t AuEq)
1.8 2.8 5.1 2.9
Mining Method Long hole Transverse long holeLongitudinal Retreat /
Transverse Open StopingTransverse long hole
Depth (m) 800 - 1,500 750 - 1,500 2,000-3,000 600 - 2,300
Stope Size 15-38 x 30 x 50 20-25 x 20 x 30 5-25 x 15 x 30 38 x 15 x 15
Mining Rate 5,100 tpd 8,000 tpd * 7,200 tpd 15,000 tpd
Specific Gravity 2.8 2.69 3.3 3.45
Mining Dilution 15% 10%-20% 10%-20% < 4%
Operating Cost/NSR $41/t * $53.50/t * $95/t $47.50/T*
Annual Production (koz) 71,000 * 200,000 * 230,000 * 236,000*
* Projected life-of-mine (LOM)
Source: Company website, technical reports and filings from SEDAR
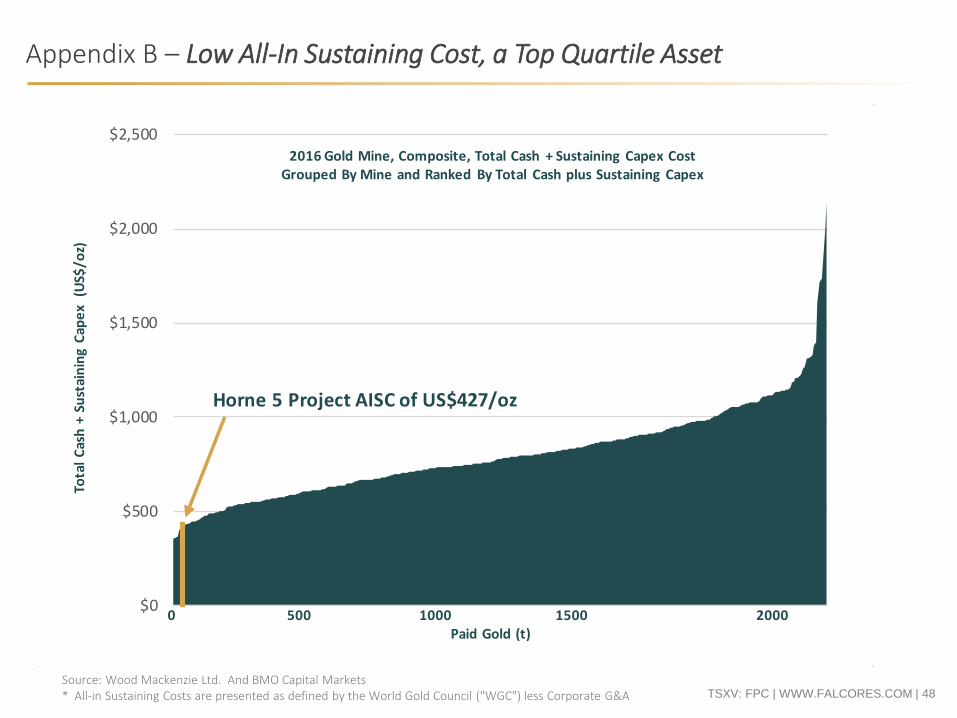
TSXV: FPC | WWW.FALCORES.COM | 48Source: Wood Mackenzie Ltd. And BMO Capital Markets* All-in Sustaining Costs are presented as defined by the World Gold Council ("WGC") less Corporate G&A
$0
$500
$1,000
$1,500
$2,000
$2,5002016 Gold Mine, Composite, Total Cash + Sustaining Capex Cost
Grouped By Mine and Ranked By Total Cash plus Sustaining Capex
Tota
l C
ash
+ S
ust
ain
ing
Cap
ex
(U
S$/o
z)
0 500 1000 1500 2000Paid Gold (t)
Horne 5 Project AISC of US$427/oz
Appendix B – Low All-In Sustaining Cost, a Top Quartile Asset
TSXV: FPC | WWW.FALCORES.COM | 49
Appendix B – Mineral Resource Estimates & Modeling Notes
1. The effective date of the resource estimate is September 26, 2016. The Independent and Qualified Persons for the Mineral Resource Estimate as required by National Instrument 43-101 are Carl Pelletier, P. Geo., B.Sc. and Guilhem Servelle, P.Geo., M.Sc., both employees of InnovExplo Inc.
2. Mineral Resources are not Mineral Reserves and have not demonstrated economic viability. 3. While the results are presented undiluted and in situ, the reported mineral resources are considered by the Qualified Persons to have reasonable prospects for economic extraction. 4. These estimates include six (6) low grade gold-bearing mineralized zones.5. The principal low-grade gold-bearing mineralized zone includes six (6) high-grade gold-bearing zones, one (1) high-grade copper-bearing zone, one (1) high grade zinc-bearing zone, three (3)
high-grade silver-bearing zones. Note that these high-grade zones may overlap each other.6. Resources were compiled at NSR cut-offs of C$40, C$45, C$50, C$55, C$60, C$65, C$70, C$75, C$80, C$85, C$90, C$95, and C$100 per tonne for sensitivity purposes.7. The official base case resource is reported at a C$55 per tonne NSR cut-off. 8. The appropriate NSR cut-off will vary depending on prevailing economic and operational parameters to be determined.9. NSR estimates are based on the following assumptions: exchange rate of $C1.30/$US, metal prices of (all $US): gold $1,300/oz, silver $18.50, copper $2.15/lb, zinc $1.00/lb (Long term
analyst consensus price forecast study). Net recoveries of 86.8% for gold, 74.9% for silver, 67.3% for zinc and 74.0% for copper. Smelting cost (including transportation) C$6.52 per tonne (based on the Cost Mine service as well as on non-public smelter contract obtained from one of the proposed destinations and on talks with transport providers).
10. Gold equivalent calculations assume these same metal prices.11. Inferred resources are separate from Indicated Resources12. The quantity and grade of reported Inferred Resources in this estimate are uncertain in nature and there has not been sufficient work to define these Inferred Resources as Indicated or
Measured Resources. It is uncertain if further work will result in upgrading them to an Indicated or Measured mineral resource category.13. The resource was estimated using Geovia GEMS 6.7. The estimate is based on 5,977 diamond drill holes (478,281m) of which 4,138 crosscut mineralized zones for a total of 177,996m of core
within these zones. For silver the estimate also uses the results of an exhaustive metallurgical test comprising 2,112 diamond drill holes assayed for silver over a total length of 75,540 meters. A minimum true thickness of 7.0 m was applied, using the grade of the adjacent material when assayed, or a value of zero when not assayed. Only the silver interpolation in the Inferred resources does not use the material when not assayed.
14. The estimate database contains also 14,799 channel samples for a total of 23,791m from drifts historically sampled. Channel sample data was only used for distance to composite criterion for resource classification purposes.
15. 91% of density values were estimated using historical drill hole iron assays data and Falco density data for an average of 3.41 g/cm3. Interpolation method use 3 pass ID2 for the ENV_A and HG_A to HG_F zones. 8% of density values were fixed at 2.88 g/cm3 for ENV_B to ENV_E zones due to the scarcity of the data. 2.88 g/cm3 representing the median of the available data. 1% of density values were fixed at 2.67 g/cm3 for ENV_F zone due to the scarcity of the date and to adequately characterise this quartz-rich zone.
16. Compositing was done on drill hole sections falling within the mineralized zones (composite = 3.0 metres). Tails shorter than 0.75 m were not created.17. Resources were evaluated from drill holes using an ID2 interpolation method in a block model (block size = 5 x 5 x 5 m).18. High grade capping was done on raw assay data and established on a per zone basis for gold (Au g/t): (HG_A: 35; HG_B: 35; HG_C: 25; HG_D: 35; HG_E: 25; HG_F: 35; ENV_A: 35; ENV_B: 25;
ENV_C: 25; ENV_D: 20; ENV_E: 35; ENV_F: 25) and for silver (Ag g/t): SG_HG:100; HG_D: 165; HG_F: 165; ENV_A_SG_Low: 110; ENV_B: 100; ENV_C: 100; ENV_D: 100. Capping grade selection is supported by statistical analysis. No capping was applied to the Cu and Zn data based on statistical analysis.
19. The Mineral Resources presented herein are categorized as Measured, Indicated and Inferred. The Inferred category is only defined within the areas where blocks were interpolated during pass 1 or pass 2 in areas where continuity is sufficient to avoid isolated blocks. The Indicated category is only defined by blocks interpolated in areas where the maximum distance to the closest drill hole composite is less than 25m for blocks interpolated in passes 1 and 2. The Measured category is only defined by blocks classified as indicated and in sufficient proximity to sampled drifts (< 15m). The average distance to the nearest composite is 6.97 meters for the Measured resources, 10.01 meters for the Indicated resources and 40.10 meters for the Inferred resources.
20. Tonnage estimates were rounded to the nearest hundred tonnes. Any discrepancies in the totals are due to rounding effects. Rounding practice follows the recommendations set out in Form 43-101F1.
21. CIM definitions and guidelines were followed in estimating mineral resources. 22. InnovExplo is not aware of any known environmental, permitting, legal, title-related, taxation, socio-political, marketing or other relevant issue that could materially affect the mineral resource
estimate. 23. Metal contained in ounces (troy) = metric tonnes x grade / 31.10348. Calculations used metric units (metres, tonnes and g/t). Metal contents are presented in ounces and pounds .
RESOURCE ESTIMATE NOTES