201 Annual Report - Utah
110
201 Annual Report CHANGING young lives CHANGING young lives DIVISION OF JUVENILE JUSTICE SERVICES
Transcript of 201 Annual Report - Utah

201 Annual Report
CHANGING y o u n g l i v e sCHANGING y o u n g l i v e s
D I V I S I O N O F J U V E N I L E J U S T I C E S E R V I C E S

Pictures on the front cover provide a glimpse at the multitude of activities carried out to support Utah families and youth. From left to right, across each row, they represent:
Row 1.
Picture 1. High school graduates from Slate Canyon Youth Center.
Picture 2. Residents and staff of Central Utah Youth Center tending the facility’s garden.
Picture 3. A youth from the Davis Area Youth Center diversion program participating in a work project on Antelope Island.
Picture 4. Wasatch Music Academy recital presented to youth at Decker Lake Youth Center and their families.
Row 2.
Picture 1. Detention youth at Farmington Bay Youth Center enjoying a summer activity.
Picture 2. Youth from Southwest Utah Youth Center and Slate Canyon Youth Center competing in the annual basketball tournament held for secure facility youth.
Picture 3. Salt Lake and Utah County youth participating in Utah Indigenous Day.
Picture 4. Breaking ground for the new multi purpose center in Ogden.
Row 3.
Picture 1. Youth participating in a Wasatch Music Academy recital at Slate Canyon Youth Center.
Picture 2. Annual softball game between the Division’s State Offi ce and youth and staff from Salt Lake Observation and Assessment.
Picture 3. Cache Valley Youth Center Wishing Tree ceremony for the facility’s new chapel opening.
Picture 4. Youth at Split Mountain Youth Center painting mural as part of the Emanuel Project.
Row 4.
Picture 1. Youth competing in the annual fl ag football tournament for secure facility youth held at Southwest Utah Youth Center.
Picture 2. Youth at Southwest Youth Center participating in a yoga class.
Picture 3. Youth at Genesis Youth Center learning about the Utah Valley University Clothesline Project.
Picture 4. Sand art at Wasatch Youth Center created and designed by youth and community artist Roger Whiting.

DIVISION OF JUVENILE JUSTICE SERVICES ANNUAL REPORT 2016
The Division of Juvenile Justice Services serves youths with a comprehensive array of programs, including home detention, locked detention, receiving centers, case management, community services, observation & assessment, secure facilities, and transition. Work components and ser-vice projects are incorporated into many Division programs. Collectively these programs provide a continuum that serves the diverse needs of Utah’s youths. Relevant facts about the Division are summarized below.
Executive Summary
• Division funding in FY 2016 was $94,778,600;authorized funding in FY 2017 is $102,430,100.Federal collections account for $3,218,900 of thetotal FY 2016 revenue (pages 13-15).
• Admissions to locked detention fell over the last3 years. Overcrowding rarely was a problem atany of the Division’s 11 detention centers duringFY 2016 (page 41).
• Of all youths in custody on a typical day, about45.4% were in community based programs andabout 22% were in locked programs (page 50).
• Delinquency histories for youths admitted toobservation and assessment, community programs,and secure care facilities have been stable or declin-ing over the last 10 years (pages 57, 63, 69).
• Across many years, the census of all programsrefl ects a disproportionate number of minorityyouths and boys (pages 27, 32, 35, 40, 46, 58, 64,70).
• The Offi ce of Early Intervention Services nowprovides In-Home Observation and Assessmentservices in the 2nd, 3rd, and 4th District JuvenileCourts. Expansion of this program is planned forother areas of the state. (page 53).
• The Youth Parole Authority held 552 hearings inFY 2016 (page 71).
• The average daily number of custody youth as-signed to Division case managers was 736 duringFY 2016 (page 49).
• The Observation and Assessment, CommunityPrograms, and Secure Facility sections show trendsacross the last 10 years for Population, Budget, andDelinquency History (pages 57, 63, 69).
• During FY 2016, volunteers contributed a total of51,900 hours of service. At a rate of $14.00 perhour, this represents a donation of over $726,600 tothe Division. Also, a total of over $246,985 mon-etary and in-kind donations were collected (page77).
• Overall, in FY 2016, the Division supported 753training sessions on mandatory topics and 288in-service training events for a total of over 74,400hours of individual training (page 75).
• Performance measures are included for diversion,work program, case management, observation andassessment, and secure facilities (34, 39, 51, 58, 70).
• During FY 2016, the Division and other agencieswithin the Department of Human Services partici-pated in the development of the Strategic Plan ofthe Utah Model of Care (pages 16-17).


JJSAnnual Report
2016
Prepared byJohn R. DeWitt, Ph.D., Director, Research & Evaluation Bureau
Robbi Poulson, M.S., Senior Research Analyst Jacqueline Chamberlain, B.S., Public Information Offi cer
Susan Burke, DirectorDivision of Juvenile Justice Services
Department of Human Services195 North 1950 West
Salt Lake City, Utah 84116

Design by Modern 8, Salt Lake City
v
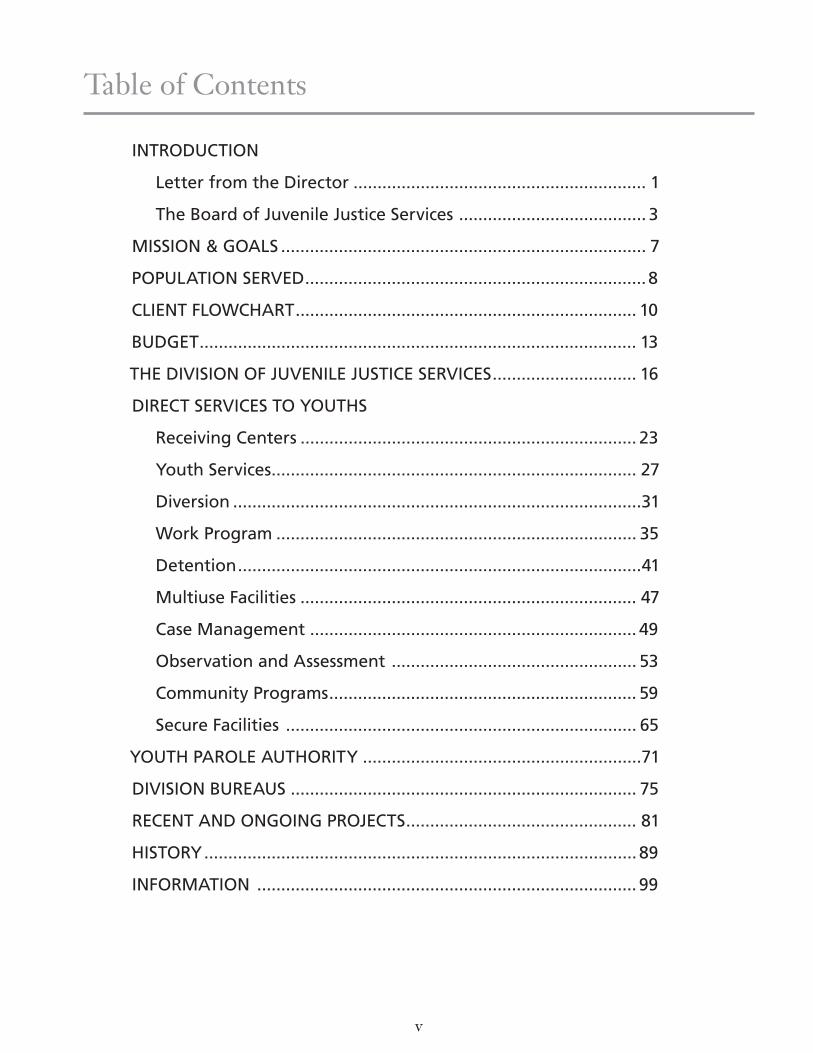
Table of Contents
INTRODUCTION
Letter from the Director ............................................................. 1
The Board of Juvenile Justice Services ....................................... 3
MISSION & GOALS ............................................................................ 7
POPULATION SERVED .......................................................................8
CLIENT FLOWCHART ....................................................................... 10
BUDGET ........................................................................................... 13
THE DIVISION OF JUVENILE JUSTICE SERVICES .............................. 16
DIRECT SERVICES TO YOUTHS
Receiving Centers ...................................................................... 23
Youth Services ............................................................................ 27
Diversion .....................................................................................31
Work Program ........................................................................... 35
Detention ....................................................................................41
Multiuse Facilities ...................................................................... 47
Case Management .................................................................... 49
Observation and Assessment ................................................... 53
Community Programs ................................................................ 59
Secure Facilities ......................................................................... 65
YOUTH PAROLE AUTHORITY ..........................................................71
DIVISION BUREAUS ........................................................................ 75
RECENT AND ONGOING PROJECTS ................................................ 81
HISTORY .......................................................................................... 89
INFORMATION ............................................................................... 99


DEPARTMENT OF HUMAN SERVICES
ANN SILVERBERG WILLIAMSON Executive Director
DIVISION OF JUVENILE JUSTICE SERVICES
SUSAN V. BURKE Director
DEBBIE WHITLOCK Deputy Director
State of Utah
GARY R. HERBERT Governor
SPENCER J. COX Lieutenant Governor
195 North 1950 West, Salt Lake City, Utah 84116 telephone (801) 538-4330 facsimile (801) 538-4334 www.hs.utah.gov
January 2017
To the Citizens of Utah,
It is my privilege to present to you the 2016 Annual Report for the Division of Juvenile Justice Services. Early in the year I challenged employees to work toward a common vision to “boldly go where we have not gone before.” Our Division’s Executive Management Team (EMT) took that challenge to heart, and has actively pursued not only moving the Mission of the Division forward, but remaining open to change in the process.
In June 2016, the Governor’s Office asked the Commission on Criminal and Juvenile Justice (CCJJ) to partner with the Pew Charitable Trust Foundation to conduct an in-depth review of Utah’s juvenile justice system. Working Groups comprised of leaders in the juvenile justice system across the state were formed; focus groups with community partners, parents, youths, and employees were held; questions were raised and satisfied. Subsequently, recommendations were developed and presented to CCJJ and the Governor’s Office. Findings proved that the system as a whole was sound, but areas to make the system even better were identified. JJS will work closely with its partners to create sound legislation as a result of those findings.
Many of the buildings that house JJS programs are aging, and in some cases are unsafe. The Weber Valley Multi-Use Youth Center is well on its way to a brand new look and feel that will better meet the needs of those in the system. The structure brings early intervention services, case management, a transition living center, and a long term secure care unit into a single carefully designed, innovative, juvenile service delivery facility. The target date for opening the new facility is February 2018. Additionally, the Division has submitted a plan to replace the aging Wasatch Youth Center/Case Management/Training Bureau facility in Salt Lake, using the model and design used in the Weber County facility.
Under the direction of the Department of Human Services, the Division developed a compensation growth plan this year for specific job classifications, and were given approval to implement a proactive plan to invest further in JJS staff where it was sustainable. The result was a certification program for Case Managers, Supervisors and Assistant Program Directors, and increases for other identified positions. The Division continues to refine its compensation plan for the future.
Lastly, the Division completed a remodel project on a portion of the Washington County Youth Crisis Center. The space created, appropriately named New Hope, is a five-bed program which aims to provide a second chance for youths with high behavioral needs. It was developed in partnership with all Divisions within the Department of Human Services. Any new program has its share of hurdles to overcome, but it is our hope that launching New Hope will provide a fresh approach and a successful balance to youths who have failed out of other placements.
This has been a year full of challenge, a year full of anticipated change, and a year of which I am proud to have been a part. I am constantly amazed at the level of commitment and engagement of our JJS employees. Without them as part of our team, the Division could not move forward. It is with an increased level of enthusiasm that I look forward to making our next year even better.
Sincerely,
Susan BurkeDirector


3The Board of Juvenile Justice Services
The Board of Juvenile Justice Services
RUSSELL VAN VLEET - CHAIRMr. Van Vleet is currently serving a second term as Chair of the Board of Juvenile Justice Services. During his career he was
an Auxiliary Professor at the University of Utah College of Social Work; Court Administrator of the 3rd District Juvenile Court;
Founder and Director of the Utah Criminal Justice Center, and the Adolescent Residential Treatment and Education Center
(ARTEC); former Director of the Division of Youth Corrections (now Juvenile Justice Services); Codirector of the Center For
the Study of Youth Policy, University of Michigan and University of Pennsylvania; and juvenile justice expert with the U. S.
Department of Justice, Civil Rights Division.
MARCY KORGENSKI - VICE CHAIRMs. Korgenski is currently serving as Vice Chair of the Board of Juvenile Justice Services, and is retired from the Ogden Police
Department (OPD). Her career included a variety of supervisory positions, serving most recently as Assistant Chief of the OPD.
She has been recognized by the community with awards from the Ogden Chamber of Commerce, Weber State University,
and a variety of other notable foundations and groups over the years. Overall, she has enhanced the lives of youth through
involvement on the Youth Services Bureau, the Ogden Weber Metro Gang Unit, and Crimes Against Children, to name a few.
H. CRAIG HALLMr. Hall was appointed in March 2016 to the Board of Juvenile Justice Services. He had recently returned from an LDS Mission
in Brazil, where he served as Associate Area Legal Counsel in Sao Paulo. Prior to that he was the City Attorney for the cities
of Holladay and Midvale Utah; Partner at Chapman and Cutler, LLP; City Attorney for South Salt Lake Corporation and Murray
City Corporation; and was an Adjunct Professor at Salt Lake Community College. Mr. Hall is active in the Boy Scouts of
America, and has received numerous awards during his service to that organization.
DR. DAVID HARPERDr. Harper was recently reappointed to a second term on the Board of Juvenile Justice Services. He taught Special Education
in the Boulder Valley Schools, was a Probation Supervisor in the Colorado juvenile justice system, and taught Secondary
Education/Special Education in Massachusetts. Today, he is a teacher in Salt Lake City schools, working with High Risk, Honors
and ESL youths at West High School.
SHARON MCCULLYSharon McCully was appointed to the Third District Juvenile Court in 1983 by Governor Scott Matheson, where she served for
over 27 years. She has served in national, state and local leadership positions. She has twice been the recipient of the Utah
State Bar Association's Judge of the Year Award. Since retiring from the bench in September 2010, Judge McCully has been
an adjunct professor at the University of Utah, teaching at both the Graduate School of Social Work and at the S.J. Quinney
School of Law.
DAVID OGDENMr. Ogden, appointed to the Board of Juvenile Justice Services in March 2016, currently serves as the 35th Mayor of the City
of Richfi eld, Utah. He was raised in Richfi eld and attended school in Richfi eld, St. George and Cedar City. Through the years
he has been involved in a variety of service organizations including the Rotary Club of Richfi eld and the Sons of Utah Pioneers.
He has also served in leadership roles at the community level and beyond. In addition to his mayoral duties, Mr. Ogden serves
on the Boards of the Six County Association of Governments and the Sevier Valley Medical Center.

4 The Board of Juvenile Justice Services

January 21, 2017
Dear Citizens:
The Board of Juvenile Justice Services continues to actively assist the Division in its mandate to serve troubled youth. This past year has been challenging in that the Division is faced with the need for some major changes in itsservice delivery system. Facilities have been added and some may need to be replaced. Front-end services that offer greater opportunity for diversion from the juvenile justice system are also being considered for implementation.
Two new members were added to the Board. David Ogden, the Mayor of Richfield; and Craig Hall, a distinguishedattorney. Both of these new members will bring much-needed depth and expertise to the Board. The appointments are timely since it is expected that 2017 will see changes in the system that will require considerable deliberation bythe Board.
With the decision to move the adult prison from its Draper site there is a renewed interest from the legislature in criminal justice issues. The PEW Trust was invited to the state and in conjunction with the Commission on Criminal and Juvenile Justice (CCJJ) working groups were created that developed recommendations for improvement to both systems.
2017 will see some or all of these recommendations implemented. The impact of cost to local governments as well as community impact are always major considerations when changes are made to service delivery systems.
The Board recognizes the responsibility it has to represent the citizens of this state and it will continue to work withDirector Burke and other government leaders as needed changes are made to the Juvenile Justice System.
Sincerely,
Russell K. Van Vleet Chair Board of Juvenile Justice Services
Department of Human Services
ANN SILVERBERG WILLIAMSON Executive Director
Division of Juvenile Justice Services
SUSAN V. BURKE Director
Board of Juvenile Justice Services
RUSSELL K. VAN VLEET Chair
State of Utah
GARY R. HERBERT Governor
SPENCER J. COX Lieutenant Governor

6

7Mission and Goals
MISSION STATEMENT
The mission of the Division of Juvenile Justice Services is to be a leader in the fi eld of juvenile justice by chang-ing young lives, supporting families and keeping communities safe.
BALANCED AND RESTORATIVE JUSTICE MODEL
The Division of Juvenile Justice Services subscribes to the Balanced and Restorative Justice (BARJ) Model that outlines a philosophy of restorative justice that places equal importance on the principles of Accountability, Community Protection, and Competency Development.
• Accountability means that when a crime occurs, a debt is incurred. Justice requires that every effort bemade by offenders to restore losses suffered by victims. The Division enables offenders to make amends totheir victims and community and take responsibility for their actions.
• Competency Development requires that offenders leave the system more capable of productive participa-tion in conventional society than when they entered. Youths in Division care are given the opportunity tolearn skills to become self-suffi cient, competent members of the community.
• Community Protection means that the public has a right to a safe and secure community. The Divisionworks to protect the public through processes which include individual victims, the community, and of-fenders as active participants.
Collectively, these three components form a comprehensive approach that not only addresses the immediate consequences of delinquency, but also provides long-term solutions for restoring victims, the community, and the offender.
DIVISION GOALS
The Division has outlined three broad goals for all of its programs and operations.
• Improve short-term and long-term outcomes for our youths.
• Support families in the rehabilitation process.
• Improve the safety, security and morale of JJS youths and employees.
Mission and Goals

8 Population Served
During 2016, Utah’s population of 10 to 17 year old youths numbered 399,262, a 2.2% increase over 2015. Continuing a trend that began in 2003, the group is expected to grow substantially over the next several years and exceed 433,000 by 2020 (see chart at top right; source: Utah State Governor’s Offi ce of Management and Budget, 2012). During FY 2016, the majority of Utah's youths (74.8%) lived in four urban counties along the Wasatch Front (Weber, Davis, Salt Lake, and Utah). Another 10.8% lived in three of the state’s fastest grow-ing counties (Cache, Washington, and Iron). Based on an analysis of individuals who turned 18 during the 2015 calendar year, 23.4% of Utah’s youths will have contact with Utah's juvenile justice system by age 18; 2.6% of Utah's youths will be found to be victims of dependency, neglect, or abuse; and 17.9% will be charged with a felony- or misdemeanor-type offense. For some youths, these events will lead to supervision by Juvenile Court Probation or custody to the Division of Juvenile Justice Services or the Division of Child and Family Services. Other predictions are presented below.
BY AGE 18
OFFENDING 1
1 IN 6.3 YOUTHS WILL BE FOUND TO HAVE COMMITTED AT LEAST ONE FELONY- OR MISDEMEANOR-TYPE OFFENSE:• 1 IN 29.6 - OFFENSE AGAINST A PERSON (1 IN 168.7 A FELONY-TYPE OFFENSE AGAINST PERSON).• 1 IN 10.2 - OFFENSE AGAINST PROPERTY.• 1 IN 11.5 - OFFENSE AGAINST THE PUBLIC ORDER.
A RELATIVELY SMALL PROPORTION OF ALL YOUTHS (5.1%) WILL BE RESPONSIBLE FOR THE MAJORITY OF IDENTIFIED YOUTH CRIME (66.3%).
CUSTODY AND SUPERVISION
1 IN 21.2 YOUTHS WILL SPEND TIME IN LOCKED DETENTION.
1 IN 38.8 YOUTHS WILL BE PLACED ON FORMAL SUPERVISION WITH JUVENILE COURT PROBATION.
1 IN 33.0 YOUTHS WILL BE COMMITTED TO DIVISION OF CHILD AND FAMILY SERVICES’ CUSTODY OR SUPERVISION.
1 IN 71.4 YOUTHS WILL BE COMMITTED TO DIVISION OF JUVENILE JUSTICE SERVICES’ CUSTODY:• 1 IN 110.5 - COMMUNITY PLACEMENT.• 1 IN 93.7 - OBSERVATION AND ASSESSMENT.• 1 IN 463.2 - SECURE FACILITY.
Population Served
1 Felony-type offenses are the most serious followed by misdemeanor-type offenses. Felony- and misdemeanor-type offenses are distinguished further by their object: person offenses (e.g., assault); property offenses (e.g., car theft); and public order offenses (e.g., gambling).
UTAH’S 10 to 17 YEAR OLD YOUTHS
0
100,000
200,000
300,000
400,000
500,000
2000 2002 2004 2006 2008 2010 2012 2014 2016 2018 2020
YOUTHS

9Population Served
During 2016, 10-year olds represented 13.5% of Utah's population of
10 to 17 year olds; 17 year olds represented 12.0% (source: Utah State
Governor’s Offi ce of Management and Budget; 2012).
The majority of youths in Division programs are between ages of 15
and 17.
During 2016, boys held a slight majority (51.5%) of Utah’s population
of 10 to 17 year olds (source: Utah State Governor’s Offi ce of Man-
agement and Budget, 2012).
Boys are overrepresented at all levels of the Division’s programming.
During 2016, the majority of Utah’s youths were Caucasian (75.0%).
Hispanics represented about 16.8% of the group; Blacks 1.4%; Native
Americans 1.1%; Pacifi c Islanders 1.6%; and Asian Americans 1.7%
(source: Utah State Offi ce of Education, fall enrollment for the 2016 -
2017 school year).
Minority youths are overrepresented at all levels of the Division’s
programming.
AGES
GENDER
RACE & ETHNICITY
0%
20%
40%
60%
80%
100%
10 11 12 13 14 15 16 17
YOUTHS
0%
20%
40%
60%
80%
100%
Girls Boys
YOUTHS
0% 20% 40% 60% 80% 100%
Black
Caucasian
Hispanic
Native American
Asian American
Pacific Islander
Multiracial
Unknown
YOUTHS

10 Client Flowchart
Client Flowchart
Though the Division operates youth services programs which may serve non-delinquent youths, the great ma-jority of Division clients are delinquent youths who have the following experience: A youth who is arrested and charged with an offense is referred to a Juvenile Court intake worker. Depending on the seriousness of the offense and other factors, such
as danger to the community, the child may be held in a detention center operated by the Division. There is a range of sanctions for charges found true. Juvenile Court sentencing alternatives include (1) levy-ing fi nes, (2) ordering payment of restitution to victims, (3) placing the offender on probation under the continu-ing jurisdiction of the Juvenile Court, and (4) placing the
State Supervision
Custody to Fa mily
Services
Probation
Custody toJuvenile Justice
Services
Serious Y outh Offender
Adult Certification
Offense
Fi eld Card No Action Receiving Center
Detentio n Inta ke
Home
Lock ed or Home Detention
Home or Referral for Services
Non-Judicial Closure
CustodyTerminated
Arrest
Ordered toDetention/Diversion
Restitution or Fi ne
Juvenile Court Inta ke
Juvenile Court Hearing
Work Camp

11Client Flowchart
youth in the custody of the Division. Traditionally, granting custody to the Division has been reserved for the most serious or chronic offend-ers. Several of the Division’s programming options are represented in the chart. Community programs are the least restrictive of these; secure facilities the most re-strictive. Programs follow the principles of the Balanced
and Restorative Justice Model (BARJ): competency development, accountability, and community protection. If a youth cannot be properly cared for by juvenile justice agencies, procedures are available for transfer of the youth to the jurisdiction of adult courts and the adult correctional system. Youths found guilty in the adult system serve adult sanctions.
Secure Care
Community Program
Observ ation & Assessment
Juvenile Court Review
Pa role Authorit y Review
P arol e Authority Review
Adult Court
P arol e
Custody T erminated
Shading represents programs and functions delivered by the Division of Juvenile Justice Services.

12 Client Flowchart
13Budget
Personnel63.0%
Other0.3%
Current Expense13.3%
Data Processing
1.6%
Payments to Providers
21.7%
0
25
50
75
100
125
1992 1994 1996 1998 2000 2002 2004 2006 2008 2010 2012 2014 2016
0% 10% 20% 30% 40% 50%
Detention Facilities
Community Programs
Secure Facilities
Administration
Observation & Assessment
Case Management
Youth Services & Shelter
Diversion
Work Camps
Receiving Centers
Home Detention
Other
EXPENDITURES
FUNCTION
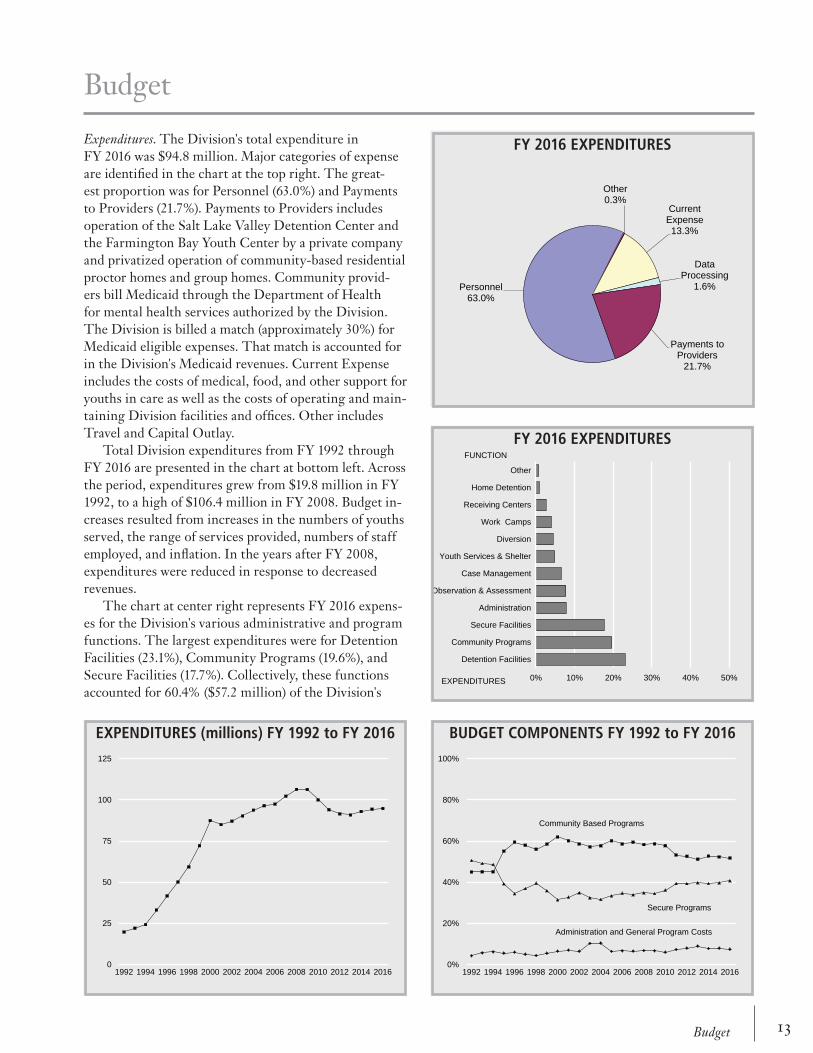
Expenditures. The Division's total expenditure in FY 2016 was $94.8 million. Major categories of expense are identifi ed in the chart at the top right. The great-est proportion was for Personnel (63.0%) and Payments to Providers (21.7%). Payments to Providers includes operation of the Salt Lake Valley Detention Center and the Farmington Bay Youth Center by a private company and privatized operation of community-based residential proctor homes and group homes. Community provid-ers bill Medicaid through the Department of Health for mental health services authorized by the Division. The Division is billed a match (approximately 30%) for Medicaid eligible expenses. That match is accounted for in the Division's Medicaid revenues. Current Expense includes the costs of medical, food, and other support for youths in care as well as the costs of operating and main-taining Division facilities and offi ces. Other includes Travel and Capital Outlay. Total Division expenditures from FY 1992 through FY 2016 are presented in the chart at bottom left. Across the period, expenditures grew from $19.8 million in FY 1992, to a high of $106.4 million in FY 2008. Budget in-creases resulted from increases in the numbers of youths served, the range of services provided, numbers of staff employed, and infl ation. In the years after FY 2008, expenditures were reduced in response to decreased revenues. The chart at center right represents FY 2016 expens-es for the Division's various administrative and program functions. The largest expenditures were for Detention Facilities (23.1%), Community Programs (19.6%), and Secure Facilities (17.7%). Collectively, these functions accounted for 60.4% ($57.2 million) of the Division's
Budget
0%
20%
40%
60%
80%
100%
1992 1994 1996 1998 2000 2002 2004 2006 2008 2010 2012 2014 2016
Administration and General Program Costs
Secure Programs
Community Based Programs
FY 2016 EXPENDITURES
FY 2016 EXPENDITURES
EXPENDITURES (millions) FY 1992 to FY 2016 BUDGET COMPONENTS FY 1992 to FY 2016

14 Budget
OPERATING BUDGETS.
OFFICE / FUNCTIONACTUAL
FY 2016 1AUTHORIZEDFY 2017 2
BASE BUDGETFY 2018
STATE OFFICE ADMINISTRATION 4,502,100 6,720,300 4,768,500
OFFICE OF COMMUNITY PROGRAMS
GENERAL PROGRAM COSTS 1,383,900 1,529,800 1,384,600 CASE MANAGEMENT 4,786,400 5,291,000 4,788,900 COMMUNITY PROGRAMS 14,450,600 15,974,100 14,458,100 TRANSITION 649,600 718,100 649,900 WORK CAMP 2,656,800 2,936,900 2,658,200
SUB TOTAL 23,927,300 26,449,900 23,939,700
OFFICE OF CORRECTIONAL FACILITIES
GENERAL PROGRAM COSTS 404,000 445,500 443,000 SECURE FACILITIES 15,526,300 17,120,000 17,023,200
SUB TOTAL 15,930,300 17,565,500 17,466,200
OFFICE OF EARLY INTERVENTION SERVICES
GENERAL PROGRAM COSTS 278,700 279,700 278,900 DETENTION FACILITIES 13,137,500 13,184,500 13,146,800 DIVERSION 4,067,000 4,081,500 4,069,900 HOME DETENTION 551,700 553,700 552,100OBSERVATION & ASSESSMENT 4,865,900 4,883,300 4,869,400 RECEIVING CENTERS 843,600 846,600 844,200 YOUTH SERVICES 1,501,900 1,507,300 1,503,000
SUB TOTAL 25,246,300 25,336,600 25,264,300
OFFICE OF RURAL PROGRAMS
GENERAL PROGRAM COSTS 493,300 516,500 515,800 CASE MANAGEMENT 1,430,600 1,497,900 1,495,800 COMMUNITY PROGRAMS 4,135,700 4,330,300 4,324,100 DETENTION FACILITIES 8,748,200 9,159,900 9,146,800 DIVERSION 156,400 163,800 163,500 HOME DETENTION 269,700 282,400 282,000 OBSERVATION & ASSESSMENT 2,483,200 2,600,100 2,596,300 RECEIVING CENTERS 1,642,700 1,720,000 1,717,500 SECURE FACILITIES 1,229,400 1,287,200 1,285,500 SHELTER & YOUTH SERVICES 3,082,700 3,227,800 3,223,200 WORK CAMP 1,140,000 1,193,700 1,191,900
SUB TOTAL 24,811,900 25,979,600 25,942,400
YOUTH PAROLE AUTHORITY 360,700 378,200 375,500
TOTAL 94,778,600 102,430,100 97,756,600
1 Actual FY 2016 includes $2,408,000 non-lapsing dollars from FY 2015.2 Authorized FY 2017 includes $3,935,000 non-lapsing dollars from FY 2016.

15Budget
General Funds94.5%
Federal Collections
3.2% Other Collections
2.3%
REVENUES.
SOURCEACTUAL
FY 2016 1AUTHORIZEDFY 2017 2
BASE BUDGETFY 2018
GENERAL FUND 3 94,322,100 96,614,100 92,170,400 FEDERAL COLLECTIONS 4 3,218,900 4,529,600 4,529,600 OTHER COLLECTIONS 5 2,268,000 1,286,400 1,056,600
Total 99,809,000 102,430,100 97,756,600
1 Fiscal Year 2016 General Funds includes $2,408,000 non-lapsing dollars from the previous year and $1,486,700 in one time General Funds. It does not reflect $1,094,900 in budget transfers to other state agencies.
2 Fiscal Year 2017 Authorized includes $3,935,000 non-lapsing dollars from the previous year and $508,700 in one-time General Funds.3 Fiscal Year 2018 Requested is less than FY 2017 Authorized due to one-time funds not in base and assumes no non-lapse from FY 2017.4 Federal Revenues include Title IV-E, Title XX, and other Federal grants.5 Other Collections includes Dedicated Credits (e.g. parental support collected by the Office of Recovery Services), Transfers (e.g. Child Nutrition Program
revenues and other grants) and is offset by Medicaid match payments..
overall expenditure. Relatively small expenditures were made for Receiving Centers (2.6%), Work Camps (4.0%), and Diversion (4.5%). Other includes transition pro-grams and the Youth Parole Authority. The chart at the bottom right of the fi rst page of this Chapter compares relative expenditures for (1) Secure Programs (locked detention and secure facilities), (2) Community Based Programs, and (3) Administration and General Program Costs. Administrative and Gen-eral Program Costs was a relatively small portion of the overall expense for each of the years of the 24-year pe-riod. In each of the last 9 years, total Administrative and General Program Costs has been between 6% and 9% of all expenditures. During FY 2016, administrative costs of the Division's State Offi ce was approximately 4.8% of all expenditures. Percentages for secure programs was (50.6%) in FY 1992, the highest value of the period, and was 40.8% in FY 2016. Expenditures for community based programs was 45.0% in FY 1992 before increas-ing to as high as 60.0% in FY 2000. The percentage for FY 2016 was 51.8%. Budget reductions and changes in Medicaid billing requirements over the past 8 years have disproportionately reduced funds available of this category of expense. As a result, relative expenditures for Administration and Secure Programs have increased even though funding has changed very little. A detailed listing of the Division's expenditures by offi ce and function is provided in the table on the prior page. The table identifi es actual expenditures during FY 2016 (Actual FY 2016), expenditures authorized for FY 2017 (Authorized FY 2017), and the expenditures base for 2018 (Base Budget 2018).
Revenues. The Division's revenues for FY 2016 are identi-fi ed in the chart at top right. The great majority of rev-enues came from Utah's General Fund (94.5%). Other Collections (2.3%) includes funds received through the Offi ce of Recovery Services (ORS) from parents who pay a portion of their children’s cost of care, the Child Nutrition Programs (School Lunch), and other smaller revenue sources. Additional details about the Division's sources of funding for fi scal years 2016, 2017, and base 2018 are provided in the table and notes below. The base for FY 2018 is reduced as it does not refl ect continued one-time funding from the authorized FY 2017 budget or any non-lapsing revenues from FY 2017.
FY 2016 REVENUES

16 The Division of Juvenile Justice Services
The Division of Juvenile Justice Services (Division) is a major provider of services for Utah's juvenile justice system. Other contributing agencies are Juvenile Court Probation and the Division of Child and Family Ser-vices. Services provided by these three agencies form a continuum of care that allows the Juvenile Court to make graduated responses to youths in proportion to the severity of their behavior and their needs for treatment. More specifi cally, the Division of Child and Family Services provides services for dependent and neglected children and is responsible for youths under the age of 12 found to be delinquent. Probation provides supervi-sion and other services to youthful offenders who remain in the homes of their parents or are in the custody of the Division of Child and Family Services. The Division of Juvenile Justice Services provides residential care and
rehabilitative services for the most serious delinquent youths who require removal from home for extended periods. In addition, the Division provides a variety of residential and non-residential services, including youth services, receiving center, and observation and assess-ment for youths at earlier stages of delinquency. Juvenile Justice Services is a division of the Depart-ment of Human Services. Other divisions and offi ces include the Executive Director’s Offi ce, the Division of Substance Abuse and Mental Health, the Division of Aging and Adult Services, the Division of Services for People with Disabilities, the Offi ce of Recovery Ser-vices, and the Division of Child and Family Services. The Department's Divisions and Offi ces are united in their support of the Utah Model of Care (hs.utah.gov/modelofcare). The Model provides a
The Division of Juvenile Justice Services
DirectIndirect
Administrative AuthorityLEGEND
|--------------------- DIRECT SERVICES TO CLIENTS ---------------------|
Departmentof HumanServices
YouthParole
Authority
Board ofJuvenileJustice
Services
DirectorJuvenileJustice
Services
ClinicalServicesBureau
Clinicians
TrainingBureau
Trainers
AdminstrativeServices
FederalRevenue
Management
Finance
ContractManagement
Research &Evaluation
Bureau
Research
QualityAssurance
QualityServiceReview
ServiceDeliveryOffi ces
Offi ce ofCommunityPrograms
Offi ce ofCorrectional
Facilities
Offi ce ofEarly
Int Services
Offi ce ofRural
Programs

17The Division of Juvenile Justice Services
(see “Letter From the Director,” page 1). The Division receives guidance and policy approval from the Board of Juvenile Justice Services, a group of citizen volunteers appointed by the state's Governor. The Division’s Director provides statewide policy leadership and administrative oversight. This includes direct authority over four service delivery offi ces and three bureaus. The Director also has indirect authority over the Youth Parole Authority. Direct services to clients are provided by four service delivery offi ces (Community Programs, Correctional Facilities, Early Intervention Services, and Rural Pro-grams) and the Division's Clinical Services Bureau. The fi rst three of the service delivery offi ces serve the ten counties corresponding to the 2nd, 3rd, and 4th Judicial Districts of Utah’s Juvenile Court. Most facilities and programs are located on the Wasatch Front, a narrow urban corridor that runs from Weber County in the north to Utah County in the south. The Offi ce of Rural Programs operates facilities and programs in the state’s remaining nineteen counties and fi ve Judicial Districts. Though the service delivery offi ces specialize in different ways, they must work closely with one another. This is particularly important to ensure continuity of care when an individual youth moves from a program operated by one service delivery offi ce to a program operated by another. Close cooperation also is critical for youths who concurrently receive services from two different offi ces. For example, a youth in a secure facility operated by the Offi ce of Correctional Facilities will have a case manager provided by either the Offi ce of Community Programs or the Offi ce of Rural Programs. Coordination is greatly facilitated by Division-wide sup-port of the Division’s Mission Statement, the Balanced And Restorative Justice (BARJ) Model, and utilization of a common case planning model.
State Administrative Offi ce
The Division’s State Administrative Offi ce is located in Salt Lake City and houses the Youth Parole Authority (see “Youth Parole Authority,” page 71) and the Divi-sion's three bureaus. Bureaus provide a variety of ad-ministrative services through different work groups that include investigations, research, training, budgeting, and contract management. In addition, the Bureau of Clini-cal Services provides direct clinical services to Division clients (see “Division Bureaus,” page 75). The State Of-fi ce also coordinates Division efforts with federal, state,
strategic framework that helps Department agencies work together toward the common purpose of strength-ening lives by providing children, youth, families, and adults the individualized services they need to thrive in their homes, schools and communities. Within this framework, there are fi ve Strategic Pillars, or focus areas, that guide the work and decision making to suc-cessfully reach collective outcomes: (1) Prevention, (2) Self-Reliance, (3) Partnership, (4) Operational Excel-lence, and (5) People and Culture. The Department’s 2016-2017 Strategic Plan identifi es benchmarks related for each Pillar to measure actions taken and progress made as Department agencies work together for better outcomes. For example, for the Self-Reliance Pillar, the Division sets goals of reducing secure detention re-entry and increasing the high school graduation rate of youths in care. The Model and its Pillars are consistent with the Division's Mission and Goals (see “Mission and Goals,” page 7) and have helped the agency enhance its early intervention services. Since implementing the Model of Care, the Division also has made important changes in detention, residential care, and case management
DAVIS
SALT LAKE
SUMMIT
TOOELE
WEBER
BOX ELDER
CACHE
WASATCH DUCHESNE
DAGGETT
UINTAH
JUAB
EMERY
CARBON
GRANDMILLARD
PIUTE
SEVIER
IRON
WAYNE
KANE
SAN JUAN
WASHINGTON
UTAH
RICH
BEAVER
GARFIELD
SANPETE
MORGAN
COURT DISTRICT 8
COURT DISTRICT 1
COURT DISTRICT 2
COURT DISTRICT 3
COURT DISTRICT 4
COURT DISTRICT 5
COURT DISTRICT 6
COURT DISTRICT 7
Utah Counties and Juvenile Court Districts.

18 The Division of Juvenile Justice Services
and local agencies such as the Offi ce of Juvenile Justice and Delinquency Prevention, the Governor’s Offi ce, the Utah Legislature, the Utah Commission on Criminal and Juvenile Justice, and Utah's city and county govern-ments.
Offi ce of Community Programs
The Offi ce of Community Programs provides com-munity based services to youths committed to Division custody from along the Wasatch Front. Most youths served by the Offi ce have extensive histories of services with other Division programs and with other juvenile justice agencies. These programs are often a last stop prior to secure care or the adult system.
Case Management. Each youth committed to Division custody is assigned a case manager (see "Case Manage-ment," page 49). This includes youths in custody for community placement and secure care. On a daily basis, a case manager makes placement decisions, monitors progress, helps determine consequences for noncompli-ance with rules, shoulders responsibility for the docu-mentation required for the Division to collect federal entitlement payments, coordinates with providers, com-municates with the youth's family, and represents the Division in court.
Community Based Services. The Division directly pro-vides or contracts with private providers for residential and nonresidential services for youths committed to the Division for community placement (see "Community
Offi ce of Community Programs.
QUICK FACTSCOMMUNITY PROGRAMS
FULL-TIME STAFF ........................................... 110
PRIMARY SERVICE AREA ................. WASATCH FRONT
PROGRAMS CASE MANAGEMENT ......................................3 TRANSITION .................................................3 WORK CAMP...............................................1
FY 2016 BUDGET .......................... $23,927,300
DAVIS
SALT LAKE
SUMMIT
TOOELE
WEBER
BOX ELDER
CACHE
WASATCH DUCHESNE
DAGGETT
UINTAH
JUAB
EMERY
CARBON
GRANDMILLARD
PIUTE
SEVIER
IRON
WAYNE
KANE
SAN JUAN
WASHINGTON
UTAH
RICH
BEAVER
GARFIELD
SANPETE
MORGAN
Case Management OfficeCTransitionT
W
T
T
T
C
C
C
Work CampW
QUICK FACTSSTATE ADMINISTRATIVE OFFICE
FULL-TIME STAFF .............................................. 36
WORK GROUPS ADMINISTRATION ............................................. 4 CLINICAL SERVICES .......................................... 2 CONTRACTING ................................................ 2 FEDERAL REVENUE MANAGEMENT ....................... 2 FINANCE ....................................................... 7 QUALITY ASSURANCE ....................................... 7 RESEARCH ..................................................... 3 SUPPORT STAFF .............................................. 3 TRAINING ...................................................... 6
FY 2016 BUDGET ..............................$4,502,100
19The Division of Juvenile Justice Services
Programs," page 59). A wide range of services is avail-able to meet the diverse needs of these youths, including (1) counseling, (2) group home placements, (3) family based proctor placements, and (4) residential placements specialized to address the needs of sex offenders, youths with mental health issues, and substance users.
Transition Services. Transition services are provided to help guide and support youths returning to the com-munity following secure care. Moving back home or to independent living after an extended stay in secure care can be a very diffi cult process. Transition workers actu-ally begin their work with youths long before they leave secure care. The goal is to help youths make progress in completing their correctional plans and ensure they have proper skills and support to be successful once they return to the community. Ideally, these efforts include active participation of parents or guardians. Transition workers continue to supervise, guide, and mentor youths once they leave secure care to ensure their success.
Work Camp. The Genesis Youth Center is a 32-bed, residential work camp for boys and girls. While in the program, youths work on community service projects to reduce court obligations (see “Work Program,” page 35).
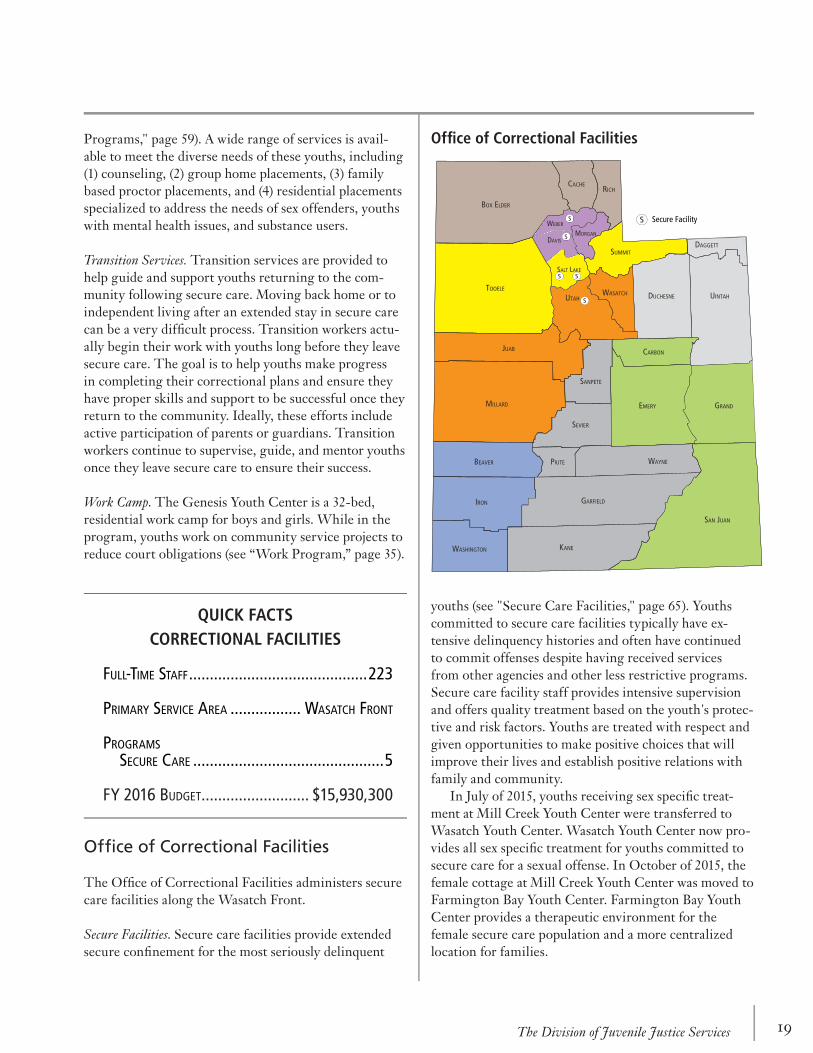
Offi ce of Correctional Facilities
The Offi ce of Correctional Facilities administers secure care facilities along the Wasatch Front.
Secure Facilities. Secure care facilities provide extended secure confi nement for the most seriously delinquent
DAVIS
SALT LAKE
SUMMIT
TOOELE
WEBER
BOX ELDER
CACHE
WASATCH DUCHESNE
DAGGETT
UINTAH
JUAB
EMERY
CARBON
GRANDMILLARD
PIUTE
SEVIER
IRON
WAYNE
KANE
SAN JUAN
WASHINGTON
UTAH
RICH
BEAVER
GARFIELD
SANPETE
MORGAN
Secure Facility
Offi ce of Correctional Facilities
youths (see "Secure Care Facilities," page 65). Youths committed to secure care facilities typically have ex-tensive delinquency histories and often have continued to commit offenses despite having received services from other agencies and other less restrictive programs. Secure care facility staff provides intensive supervision and offers quality treatment based on the youth's protec-tive and risk factors. Youths are treated with respect and given opportunities to make positive choices that will improve their lives and establish positive relations with family and community. In July of 2015, youths receiving sex specifi c treat-ment at Mill Creek Youth Center were transferred to Wasatch Youth Center. Wasatch Youth Center now pro-vides all sex specifi c treatment for youths committed to secure care for a sexual offense. In October of 2015, the female cottage at Mill Creek Youth Center was moved to Farmington Bay Youth Center. Farmington Bay Youth Center provides a therapeutic environment for the female secure care population and a more centralized location for families.
QUICK FACTSCORRECTIONAL FACILITIES
FULL-TIME STAFF ...........................................223
PRIMARY SERVICE AREA ................. WASATCH FRONT
PROGRAMS SECURE CARE ..............................................5
FY 2016 BUDGET .......................... $15,930,300

20 The Division of Juvenile Justice Services
Offi ce of Early Intervention Services
The Offi ce of Early Intervention Services administers a variety of services and programs for youths at early stages of delinquency and problem development. Its primary objective is to prevent youths from penetrating further into the juvenile justice system and to keep them at home or return them home as soon as possible.
Receiving Center and Youth Services Functions. These programs (see "Youth Services," page 27 and “Receiving Centers,” page 23) are collocated at several facilities to provide fi ve essential services to local communities:
1. The Receiving Center function is provided totake responsibility for youths brought in by law enforcement after arrest for status offenses or delinquent acts that do not meet guidelines for admission to a locked detention facility.
2. Crisis Intervention provides immediate counsel-ing and other support for runaway, homeless and ungovernable youths and their families.
3. 60-day Counseling is a series of counseling ses-sions provided to youths and families in crisis who need extended support.
4. Crisis Residential provides a bed and othersupport for youths who cannot immediately be returned home.
5. Division of Child and Family Services (DCFS)Shelter Beds are available for youths in foster care
who have run away from or disrupted their cur-rent placement or are waiting for a new placement.
Home Detention. Home Detention provides an alternative to secure detention for youths awaiting a court hearing for a new delinquent offense (see “Detention,” page 41). Youths remain at home but are given daily supervision by Division staff.
Locked detention: Youths typically enter a locked deten-tion program (1) pending Juvenile Court adjudication, (2) awaiting transfer to another jurisdiction or agency, or (3) serving a short-term commitment to detention ordered by a Juvenile Court Judge. While in deten-tion, youths have access to medical and dental services. Families are encouraged to visit their sons and daughters and give them positive support. Religious services are available to youths who wish to participate. Educational services are provided 5 days each week by teachers from local school districts through the Utah State Board of Education's Youth In Custody Program.
QUICK FACTSEARLY INTERVENTION SERVICES
FULL TIME STAFF ..........................................302
PRIMARY SERVICE AREA ................. WASATCH FRONT
PROGRAMS DIVERSION ..................................................3 HOME DETENTION .........................................3 LOCKED DETENTION .......................................4 OBSERVATION AND ASSESSMENT ........................3 RECEIVING CENTER ........................................4 YOUTH SERVICES ...........................................4
FY 2016 BUDGET ..........................$25,246,300
DAVIS
SALT LAKE
SUMMIT
TOOELE
WEBER
BOX ELDER
CACHE
WASATCH DUCHESNE
DAGGETT
UINTAH
JUAB
EMERY
CARBON
GRANDMILLARD
PIUTE
SEVIER
IRON
WAYNE
KANE
SAN JUAN
WASHINGTON
UTAH
RICH
BEAVER
GARFIELD
SANPETE
MORGAN
Home DetentionH
DiversionV
V
V
V
Youth ServicesY
Receiving Centers
H
H
H
Y
Y
Y
O&AO
O
O
O
Y
Locked Detention
Offi ce of Early Intervention Services

21The Division of Juvenile Justice Services
Diversion Services. Diversion programs provide daily programming for adjudicated youths under a short-term commitment order (usually 30 days) of the Juvenile Court (see “Diversion,” page 31). Programming includes intensive supervision and competency development through a variety of educational groups and activities. Youths often are involved in community service projects that help make amends to victims and the community.
Observation and Assessment (O&A): Youths are committed to O&A by Juvenile Court Judges for a 45-day evalu-ation designed to identify their needs for supervision and services (see "Observation & Assessment," page 53). During this time, they receive extensive psychological, educational, physical, behavioral, risk, and social as-sessments. At the conclusion of each youth's O&A stay, a formal report of the program's fi ndings and recom-mendations is presented to the Juvenile Court to aid the Court in making decisions about the case. Historically, O&A programs along the Wasatch Front were managed by the Offi ce of Community Programs. In FY 2013, these programs were transferred to the Offi ce of Early Intervention Services. The original arrangement made sense when the majority of youths leaving the program were next ordered to Division custody. However, in recent years the majority of O&A graduates have been returned home, often with probation services.
In-Home Observation and Assessment (In-Home O&A): Youths are committed to In-Home O&A by Juvenile Court Judges for a 45-day evaluation as an alternative to residential O&A for those youths who can remain in their homes. This program began as a pilot project in the 3rd District Juvenile Court with two Juvenile Court judges and now has been implemented more broadly in the 2nd, 3rd, and 4th Districts.
Offi ce of Rural ProgramsThe Offi ce of Rural Programs provides Utah's rural areas with the same range of residential and nonresi-dential services available in urban areas. The majority of these services are offered through multiuse facili-ties (see "Multiuse Facilities," page 47) operated in fi ve rural communities: (1) Split Mountain Youth Center in Vernal; (2) Central Utah Youth Center in Richfi eld; (3) Canyonlands Youth Center in Blanding, (4) Cache Valley Youth Center in Logan; and (5) Castle Country Youth Center in Price.
QUICK FACTSRURAL PROGRAMS
FULL-TIME STAFF ...........................................286
*-PRIMARY SERVICE AREA .............. RURAL COUNTIES
PROGRAMS CASE MANAGEMENT ......................................7 HIGH BEHAVIORAL RESIDENTIAL ........................1 HOME DETENTION .........................................5 LOCKED DETENTION .......................................7 OBSERVATION & ASSESSMENT ..........................4 RECEIVING CENTERS .......................................7 SECURE CARE ..............................................1 SHELTER .....................................................7 WORK CAMP...............................................1 YOUTH SERVICES ...........................................7
FY 2016 BUDGET .......................... $24,811,900
DAVIS
SALT LAKE
SUMMIT
TOOELE
WEBER
BOX ELDER
CACHE
WASATCH DUCHESNE
DAGGETT
UINTAH
JUAB
EMERY
CARBON
GRANDMILLARD
PIUTE
SEVIER
IRON
WAYNE
KANE
SAN JUAN
WASHINGTON
UTAH
RICH
BEAVER
GARFIELD
SANPETE
MORGAN
Observation & AssessmentO
O
Locked Detention
Secure Facility
O
OReceiving Centers
Youth ServicesY
Y
Y
Y
Y
Y
Y
Y
Home DetentionH
H
H
H
H
H
ShelterC
C
CC
C
C
C
CR
R
O
Work CampW
W
Offi ce of Rural Programs

22 The Division of Juvenile Justice Services
Multiuse facilities are equipped with both secure and non secure beds and include programming areas for a variety of purposes. Non secure beds can be used for functions such as observation and assessment and shelter. Three additional facilities supplement services pro-vided through multiuse facilities: (1) in Hurricane, the Dixie Area Detention Center provides locked detention;
and the Gateway Work Program; (2) in Cedar City, the Southwest Utah Youth Center provides locked detention and secure care, while the Iron County Youth Center provides receiving center and youth services; and (3) in St. George, the Washington County Youth Crisis Center provides receiving center, youth services, and home detention services and has a non secure residential program for high risk youths.

23Receiving Centers
Receiving Centers
Youths typically enter Utah’s juvenile justice system when arrested and charged with an offense by a law enforcement offi cer, county deputy sheriff, or a member of the Highway Patrol (see “Client Flowchart,” page 10). When a youth is accused of a serious offense that falls within the admitting guidelines for locked detention, he or she may be taken to a locked detention center. However, when guidelines are not met, an offi cer may struggle to fi nd a parent or guardian to take responsibil-ity for the youth or to fi nd another suitable placement.
Receiving centers were developed across the state to minimize such diffi culties. These centers operate in partnership between Juvenile Justice Services (Division), the Division of Child and Family Services (DCFS), law enforcement, the Juvenile Court, and local communi-ties. On receiving a youth, center workers immediately attempt to contact the youth’s parents or guardians. They evaluate the youth’s immediate needs for security and care and make referrals for services when appropri-ate. Additional details of the receiving center process are presented in the entitled Receiving Center Service Model at the bottom of this page.
The Offi ce of Early Intervention Services admin-isters four receiving centers along the Wasatch Front. The Offi ce directly operates the center at the Archway Youth Service Center in Ogden, contracts with Salt Lake County Youth Services for two centers in Salt Lake County, and contracts with Wasatch Mental Health Services for one center in Provo. In rural areas, the Of-fi ce of Rural Programs provides receiving centers at fi ve multiuse facilities (see “Multiuse Facilities,” page 47) and the programs in Cedar City and St. George. Statewide, during FY 2016, there were 2,836 admis-sions to receiving centers; 60.8% of admitted youths were boys, and the majority of admissions (66.2%) were to centers in urban areas. Reasons for referral ranged from truancy to delinquent offenses. Median length of stay was 4.0 hours. In many cases, youths were released to their parents or guardians. However, substantial
QUICK FACTSRECEIVING CENTERS
NUMBER OF PROGRAMS.................................... 11
ADMISSIONS .............................................2,836
DIFFERENT YOUTHS SERVED ........................... 2,121
MEDIAN LENGTH OF STAY .......................4.0 HOURS
MONTHLY ADMISSIONS
0
100
200
300
400
500
Jul | Jan2014
Jul | Jan2015
Jul | Jan2016
Jul |
Admissions
YOUTHS
Receiving Center Service Model
Law enforcement admits youth to receiving center
Center worker interviews and assesses youth
Center workers discuss problem
areas with youth's parent or
guardian
Center worker reviews interven-tion options with
parent orguardian
Referrals are made (e.g., par-enting classes, youth services,and community
resources)
24 Receiving Centers
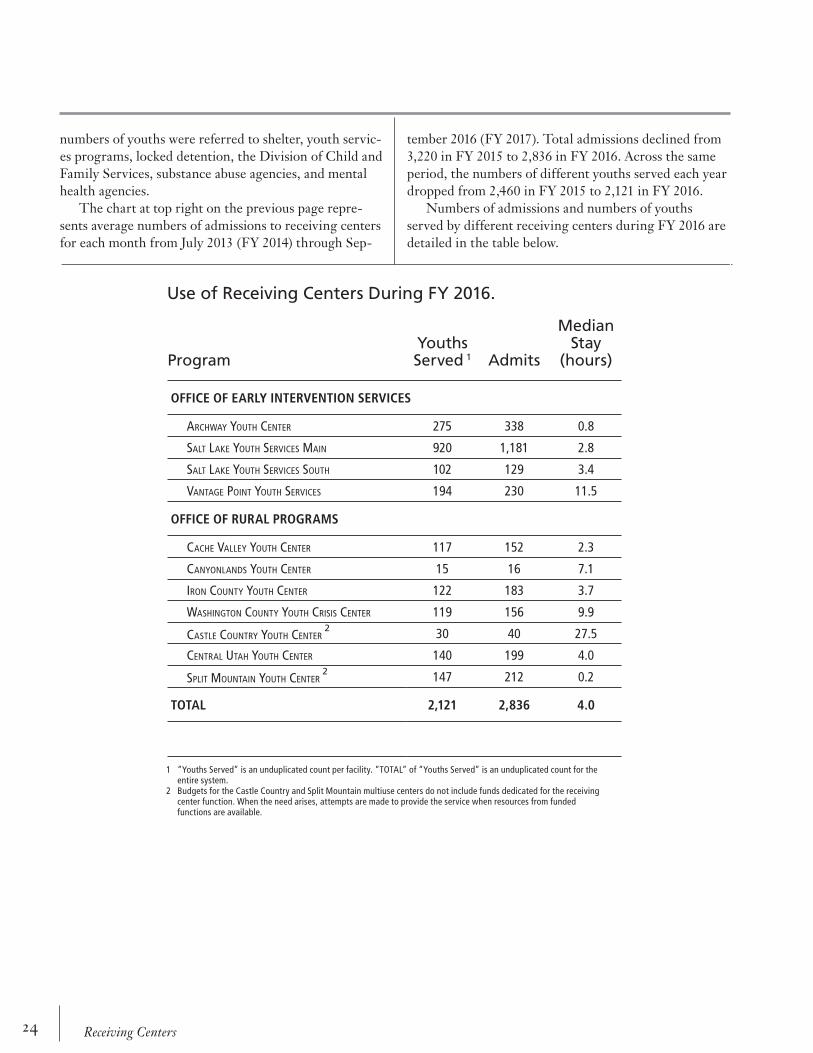
numbers of youths were referred to shelter, youth servic-es programs, locked detention, the Division of Child and Family Services, substance abuse agencies, and mental health agencies. The chart at top right on the previous page repre-sents average numbers of admissions to receiving centers for each month from July 2013 (FY 2014) through Sep-
tember 2016 (FY 2017). Total admissions declined from 3,220 in FY 2015 to 2,836 in FY 2016. Across the same period, the numbers of different youths served each year dropped from 2,460 in FY 2015 to 2,121 in FY 2016. Numbers of admissions and numbers of youths served by different receiving centers during FY 2016 are detailed in the table below.
Use of Receiving Centers During FY 2016.
ProgramYouths Served 1 Admits
Median Stay
(hours)
OFFICE OF EARLY INTERVENTION SERVICES
ARCHWAY YOUTH CENTER 275 338 0.8
SALT LAKE YOUTH SERVICES MAIN 920 1,181 2.8
SALT LAKE YOUTH SERVICES SOUTH 102 129 3.4
VANTAGE POINT YOUTH SERVICES 194 230 11.5
OFFICE OF RURAL PROGRAMS
CACHE VALLEY YOUTH CENTER 117 152 2.3
CANYONLANDS YOUTH CENTER 15 16 7.1
IRON COUNTY YOUTH CENTER 122 183 3.7
WASHINGTON COUNTY YOUTH CRISIS CENTER 119 156 9.9
CASTLE COUNTRY YOUTH CENTER 2 30 40 27.5
CENTRAL UTAH YOUTH CENTER 140 199 4.0
SPLIT MOUNTAIN YOUTH CENTER 2 147 212 0.2
TOTAL 2,121 2,836 4.0
1 “Youths Served” is an unduplicated count per facility. “TOTAL” of “Youths Served” is an unduplicated count for the entire system.
2 Budgets for the Castle Country and Split Mountain multiuse centers do not include funds dedicated for the receivingcenter function. When the need arises, attempts are made to provide the service when resources from funded functions are available.

25Receiving Centers
The great majority of youths admitted to receiving centers during
FY 2016 had little or no prior experience with other Division pro-
grams. Only 18.8%, fewer than one in every fi ve youths, had previ-
ously been admitted to a locked detention and only 5.5% had been
admitted to a home detention program.
Though not shown on the chart, a number of these youths had re-
ceived services from other juvenile justice agencies: 7.7% had been on
probation, 8.8% had been in the custody or under supervision of the
Division of Child and Family Services, and 14.1% previously had one or
both of these types of care.
DELINQUENCY HISTORY
PLACEMENT HISTORY
During FY 2016, fewer than half of youths admitted to a receiving
center (42.2%) had previously received a conviction for a felony- or
misdemeanor-type offense. Overall, admitted youths had an average
of 1.1 prior convictions. Most of these convictions (76.2%) were for
offenses against property and public order. Offenses against persons
represented only 23.8% of the total.
Though not shown on the chart, those youths with prior convictions
were fi rst found delinquent at an average age of 13.5; 77.0% of them
were between 10 and 14 at the time of their fi rst delinquency.
0% 20% 40% 60% 80% 100%
AWOL
Jail
Secure Facility
Community Program
O & A
Home Detention
Locked Detention
YOUTHS
0
2
4
6
8
10
Person Property Public Order
CONVICTIONS
Iron County Youth Center (ICYC) in Cedar City.

26 Receiving Centers
Minorities were overrepresented in receiving centers. Collectively, they
accounted for 40.7% of all admissions, though they represent 25.0%
of Utah’s youth population.
Overrepresentation was most extreme for Black youths who were
admitted 4.5 times more frequently than would be expected from
their proportion in the population at large; Native Americans were
admitted 3.4 times more frequently; and Hispanics were admitted 1.5
times more frequently.
Girls accounted for 39.2% of all admissions to receiving centers dur-
ing FY 2016.
Youths admitted to receiving centers during FY 2016 ranged in age
from under 10 to over 17 years old. Average age was 15.0; 53.0%
were between 15 and 17 years old.
AGES
GENDER
RACE & ETHNICITY
0%
20%
40%
60%
80%
100%
<=10 11 12 13 14 15 16 17 >17
YOUTHS
0%
20%
40%
60%
80%
100%
Girls Boys
YOUTHS
0% 20% 40% 60% 80% 100%
Black
Caucasian
Hispanic
Native American
Asian American
Pacific Islander
Multiracial
Unknown
YOUTHS

27Youth Services
Youth Services
Youth services centers provide crisis counseling and other services to runaway, homeless, and ungovernable youths and their families. The primary goals are to help keep families intact and to divert youths from further involvement with the juvenile justice system. Youths typically are brought to the centers by law enforcement, family members, or other concerned individuals. Cen-ters also accept self-referrals and referrals from receiving centers.
Youths served by youth services centers typically are at a very early stage of delinquency relative to youths in other Division programs. Most have little or no history of delinquency and have not previously received services from other Division programs. Historically, this popula-tion was served by the Division of Child and Family Ser-vices (DCFS). The 2002 Utah Legislature transferred the program to the Division of Juvenile Justice Services. The Offi ce of Early Intervention Services adminis-ters four youth services centers along the Wasatch Front. The Offi ce directly operates Archway Youth Service Center in Ogden, contracts with Salt Lake County Youth Services for two programs in Salt Lake County, and contracts with Wasatch Mental Health Services for one program in Provo. In rural areas, the Offi ce of Rural Programs provides youth services programs at fi ve multiuse facilities (see “Multiuse Facilities,” page 47) and at stand alone programs in Cedar City and St. George.
Crisis Intervention. Crisis intervention programs provide a crucial “safety valve” for youths and families in crisis. Youth services workers help runaway, homeless, un-governable and dependent youths and their families by providing immediate assessment and crisis counseling.
60-day Counseling. Extended counseling is offered to youths and families that need additional support to man-age acute crises. This service is provided on an outpatient basis and can continue up to 60 days. Typically, counsel-ing occurs for one hour each week over the course of a number of weeks. Frequency and duration of interven-tion are dependent on the nature of the problem and a family's level of functioning. Youths and families that need more extensive support are referred to providers in the family's home community.
Crisis Residential. The crisis residential program provides a safe and structured environment for youths with prob-lems that cannot be resolved through crisis intervention and who cannot immediately be returned home. Gener-ally, a youth’s stay does not exceed 72 hours. During this time, counseling and more thorough assessments of the youth and his or her family are provided. Many situa-tions are resolved without additional services.
The chart at top right represents statewide numbers of admissions to youth services programs for each month from July 2013 (FY 2014) through September 2016 (FY 2017). Overall yearly admissions were 5,760 in FY 2014 and 5,641 in FY 2015 and 5,418 in FY 2016. During the same period, the numbers of different youths served were 3,084 in FY 2014, 3,039 in FY 2015, and 2,764 in FY 2016.
QUICK FACTSYouth Services
PROGRAMS ................................................... 11
ADMISSIONS ............................................. 5,418 CRISIS INTERVENTION................................1,863 CRISIS RESIDENTIAL ................................. 3,156 60-DAY COUNSELING .................................399
DIFFERENT YOUTHS SERVED ........................... 2,764
MONTHLY ADMISSIONS
0
100
200
300
400
500
600
700
Jul | Jan2014
Jul | Jan2015
Jul | Jan2016
Jul |
Admissions
YOUTHS

28 Youth Services
During FY 2016, programs at the Archway Youth Ser-vices Center participated in the Department of Human Services' System of Care initiative. System of Care is a coordinated approach to service delivery for children, youth and families with complex behavioral, medical and mental health needs. This collaborative approach strives to keep children and youth safely in their homes,
DELINQUENCY HISTORY
PLACEMENT HISTORY
0% 20% 40% 60% 80% 100%
AWOL
Jail
Secure Facility
Community Program
O & A
Home Detention
Locked Detention
YOUTHS
0
2
4
6
8
10
Person Property Public Order
CONVICTIONS
A minority (35.7%) of youths admitted to a youth services program
during FY 2016 had previously received at least one conviction for
a felony- or misdemeanor-type offense. The average for all admis-
sions was 0.9 prior convictions. The great majority of these offenses
(75.6%) were offenses against property and public order. Offenses
against persons represented only 24.4% of the total.
Though not shown on the chart, those youths with prior convictions
were fi rst found delinquent at an average age of 13.6; 75.8% of them
were between 10 and 14 at the time of their fi rst delinquency.
A minority of youths (17.3%) admitted to a youth services program
during FY 2016 had previously been admitted to a locked detention
program; 5.9% had been in a home detention placement; and 2.9%
previously had been placed in observation and assessment (O&A).
Though not shown on the chart, some of these youths also had re-
ceived services from other juvenile justice agencies: 6.1% had been on
probation, 8.2% had been in the custody or under supervision of the
Division of Child and Family Services, and 12.6% previously had one or
both of these types of care.
schools and communities through service delivery that is family driven, youth guided, strength and community-based, trauma informed and culturally competent. System of Care will be implemented statewide by June 2017. More information is available on the process at the initiative's website: at systemofcare.utah.gov.
29Youth Services
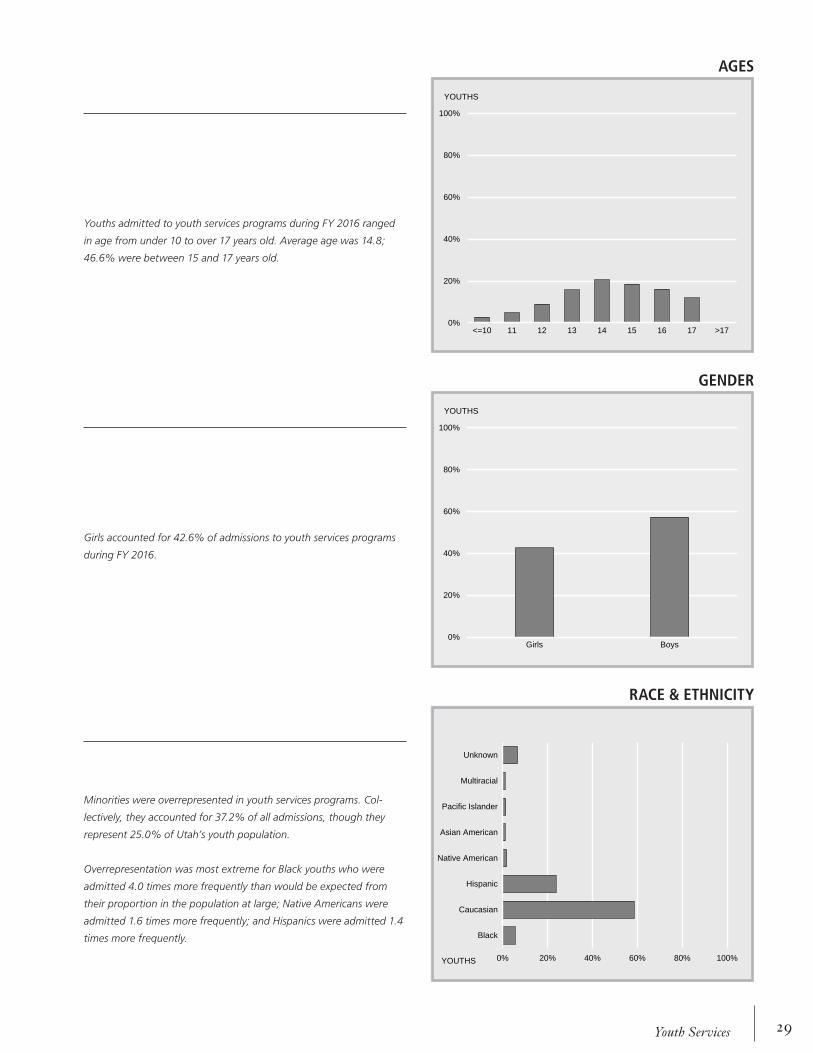
Minorities were overrepresented in youth services programs. Col-
lectively, they accounted for 37.2% of all admissions, though they
represent 25.0% of Utah’s youth population.
Overrepresentation was most extreme for Black youths who were
admitted 4.0 times more frequently than would be expected from
their proportion in the population at large; Native Americans were
admitted 1.6 times more frequently; and Hispanics were admitted 1.4
times more frequently.
Girls accounted for 42.6% of admissions to youth services programs
during FY 2016.
Youths admitted to youth services programs during FY 2016 ranged
in age from under 10 to over 17 years old. Average age was 14.8;
46.6% were between 15 and 17 years old.
AGES
GENDER
RACE & ETHNICITY
0%
20%
40%
60%
80%
100%
<=10 11 12 13 14 15 16 17 >17
YOUTHS
0%
20%
40%
60%
80%
100%
Girls Boys
YOUTHS
0% 20% 40% 60% 80% 100%
Black
Caucasian
Hispanic
Native American
Asian American
Pacific Islander
Multiracial
Unknown
YOUTHS

30 Youth Services
31Diversion
Diversion
Diversion programs serve youths who have been adjudi-cated for a delinquent offense and ordered to participate in the program for up to 30 days as an alternative to serving an equivalent time in locked detention. Diver-sion programs have the general objective of holding youths accountable for their delinquent behavior in a way that avoids the negative consequences of removing them from home, schools, and other community sup-ports. They have proved to be cost effective and safe alternatives to locked detention.
During FY 2016, the Division's Offi ce of Early Inter-vention operated diversion programs in Salt Lake City, Roy, and Provo. The programs primarily serve youths
from Davis, Salt Lake, Utah, and Weber Counties. Youths enrolled in diversion programs, receive daily supervision and participate in structured, constructive activities. Youths are tracked during the day through face-to-face interactions, collateral contacts, including school and parents, and by telephone. Tracking extends to weekends and holidays. Diversion youths also have opportunities to attend educational groups covering a variety of subjects and may take part in skill building and community service activities. While school is in session, program attendance is required at the end of normal classes each day. When school is not in session,
AVERAGE DAILY PARTICIPANTS
0
30
60
90
120
150
Jul | Jan2014
Jul | Jan2015
Jul | Jan2016
Jul |
Daily Participant Count
YOUTHS
Use of Diversion Programs During FY 2016.
ProgramYouths Served 1 Admits
Nightly Count
Mean Length of Stay 2
OFFICE OF EARLY INTERVENTION SERVICES
DAVIS AREA YOUTH CENTER 272 283 36.9 56.0
SALT LAKE INTERVENTION SERVICES 209 203 14.9 29.6
LIGHTNING PEAK YOUTH CENTER 151 175 13.1 32.7
TOTAL 631 661 64.9 35.9
1 “Youths Served” is an unduplicated count per facility. “TOTAL” of “Youths Served” is an unduplicated count for the entire system. 2 “Length of Stay” estimated using Stock / Flow Ratio: ([Nightly Bed Count]/[Admits])*([Days per Fiscal Year]); Butts, J. & Adams, W.
Anticipating space needs in juvenile detention and correctional facilities. OJJDP Juvenile Justice Bulletin, March 2001, Washington, DC: Office of Juvenile Justice and Delinquency Prevention, US Department of Justice.
QUICK FACTSDIVERSION PROGRAMS
PROGRAMS .....................................................3
ADMISSIONS ................................................661
DIFFERENT YOUTHS SERVED .............................631
AVERAGE DAILY PARTICIPANTS .........................64.9
AVERAGE LENGTH OF STAY ...................... 35.9 DAYS
DAILY COST PER PARTICIPANT ....................$170.87

32 Diversion
During FY 2016, the large majority of youths admitted to diversion
programs (98.9%) had previously received at least one conviction for
a felony- or misdemeanor-type offense. The average youth was admit-
ted with 2.9 prior convictions. The great majority of these offenses
(87.9%) were offenses against property and public order. Offenses
against persons represented only about 11.8% of the total.
Though not shown on the chart, those youths with prior convictions
were fi rst found delinquent at an average age of 14.0; 71.6% of them
were between 10 and 14 at the time of their fi rst delinquency.
DELINQUENCY HISTORY
PLACEMENT HISTORY
The majority of youths (59.0%) admitted to diversion programs dur-
ing FY 2016 previously had been admitted to locked detention; 23.1%
had previously been placed in home detention; and 6.4% had been
admitted to O&A.
Though not shown on the chart, many of these youths also had re-
ceived services from other juvenile justice agencies: 26.2% had been
on probation, 9.7% had been in the custody or under supervision of
the Division of Child and Family Services, and 32.1% previously had
one or both of these types of care.
0% 20% 40% 60% 80% 100%
AWOL
Jail
Secure Facility
Community Program
O & A
Home Detention
Locked Detention
YOUTHS
0
2
4
6
8
10
Person Property Public Order
CONVICTIONS
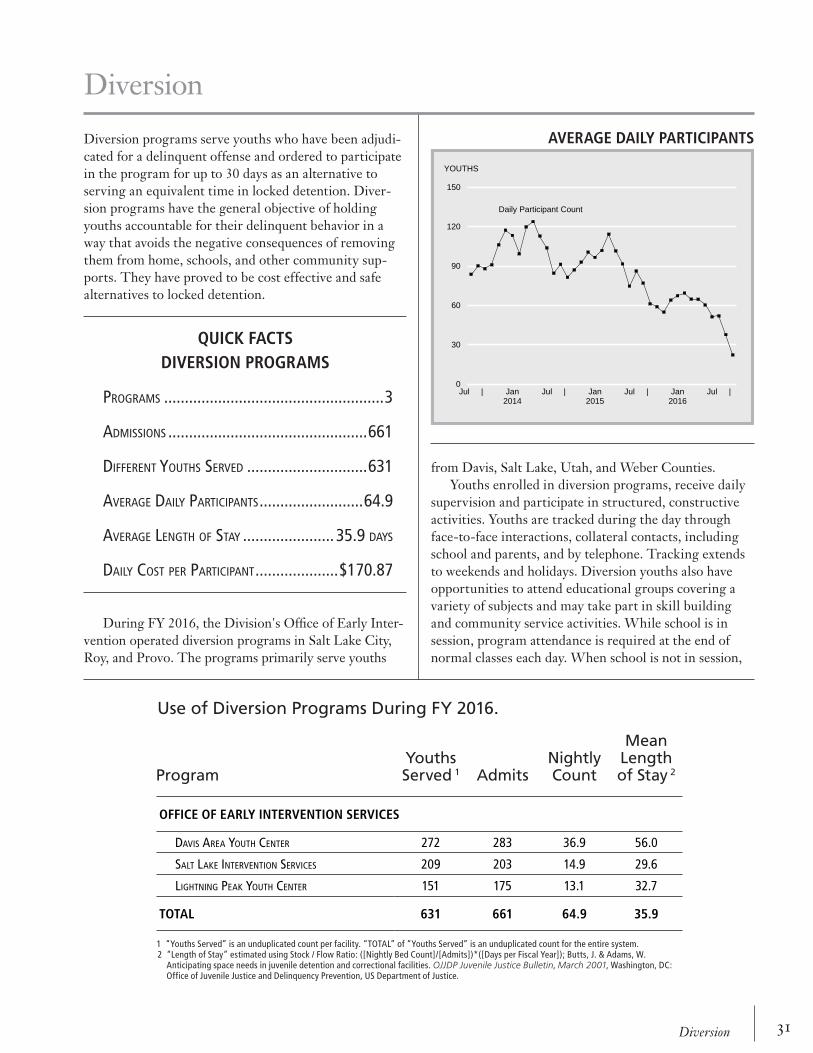
activities are arranged at earlier times as well. In some areas, in-home support is provided and referrals can be made to other agencies for additional services when needed. The chart at top right of the previous page represents statewide average daily numbers of participants for each month from July 2013 (FY 2014) through September
2016 (FY 2017). Yearly average daily participation was 104.1 in FY 2014, 93.2 in FY 2015, and 64.9 in FY 2016. During the same period, the number of different youths served was 1,065 in FY 2014, 934 in FY 2015, and 631 in FY 2016. Average time in the program per admission was 33.6 days in FY 2014, 35.4 days in FY 2015, and 35.9 days in FY 2016.

33Diversion
Minorities were overrepresented in diversion programs. Collectively,
they accounted for 53.4% of all admissions, though they represent
25.0% of Utah’s youth population.
Overrepresentation was most extreme for Black youths who were
admitted 3.4 times more frequently than would be expected from
their proportion in the population at large; Hispanics youths were
admitted 2.5 times more frequently; and Pacifi c Islanders were
admitted 1.2 times more frequently.
Girls accounted for 23.8% of all admissions to diversion programs
during FY 2016.
Youths admitted to diversion programs during FY 2016 ranged in
age from 11 to over 17 years old. Average age was 15.7; 69.1% were
between 15 and 17 years old.
AGES
GENDER
RACE & ETHNICITY
0%
20%
40%
60%
80%
100%
<=10 11 12 13 14 15 16 17 >17
YOUTHS
0%
20%
40%
60%
80%
100%
Girls Boys
YOUTHS
0% 20% 40% 60% 80% 100%
Black
Caucasian
Hispanic
Native American
Asian American
Pacific Islander
Multiracial
Unknown
YOUTHS

34 Diversion
Performance Measures
All Division programs participate in an ongoing process of performance measurement. Measures are indicators of a program's successes and failures in meeting expecta-tions about the services it provides (Output Measures) and in achieving positive results for the clients it serves (Outcome Measures). Measures are developed from a basic goal statement. The shared goal for the Division's diversion programs is to provide an alternative to locked detention for youths serving a sentence ordered by a Juvenile Court Judge to protect the youth and the community and increase the youth’s competence.
Output measures document a program's service delivery efforts. This includes workload measures for numbers of youths served and average length of stay listed on previous pages. In addition, the chart at top left identi-fi es the percentages of youths leaving the program who successfully completed the program during each of the fi ve quarters between April of 2015 (2015Q2) and June of 2016 (2016Q2). Overall, 79.8% successfully completed during the reporting period. The highest percentage for an individual quarter was 82.6% for the third quarter of 2015 (2015Q3). The lowest percentage was 77.1% for the second quarter of 2016 (2016Q2).
Outcome measures include both short- and long-term indicators of whether a program is achieving desired results. The chart at center left identifi es the percent-ages of youths who remained free of new felony- or misdemeanor-type charges while enrolled in a diversion program during specifi ed quarters. Overall, 90.3% of youths remained free of new charges. Percentages for individual quarters ranged from a low of 83.7% in the fourth quarter of 2015 (2015Q4) to a high of 94.8% in the third quarter of 2015 (2015Q3). Though not shown, percentages of youths free of any felonly-type charges while enrolled in the program were much higher. Overall, 99.0% of youths avoided collecting a new felony charge during specifi ed quarters.
The chart at bottom left shows the percentages of youths who remained free of new felony- or misdemeanor-type charges in the 90 days following release from diver-sion programming. Overall, 81.5% of youths remained charge free. Percentages ranged from a low of 78.7% for the fourth quarter of 2015 (2015Q4) to a high of 84.3% for the second quarter of 2015 (2015Q2). Though not shown, the overall percentage of youths free of a new felony-type charge was 97.1%.
YOUTHS SUCCESSFULLY COMPLETING PROGRAM
FREE OF CHARGES DURING PROGRAM
FREE OF CHARGES AFTER PROGRAM
0%
20%
40%
60%
80%
100%
2015Q2 2015Q3 2015Q4 2016Q1 2016Q2
PERCENT OF YOUTHS
0%
20%
40%
60%
80%
100%
2015Q2 2015Q3 2015Q4 2016Q1 2016Q2
PERCENT OF YOUTHS
0%
20%
40%
60%
80%
100%
2015Q2 2015Q3 2015Q4 2016Q1 2016Q2
PERCENT OF YOUTHS

35Work Program
Work Program
During FY 2016, the Division operated two residential work programs. The Genesis Youth Center, which is collocated with the Salt Lake Valley Detention Center, d is a coeducational, residential work program for juve-nile offenders. The program opened in 1994 and serves youths from all parts of the state. It is administered by the Offi ce of Community Programs. For many years, this was the only residential work program operated by the Division. In March of 2015, the Gateway program was opened as a second residential work program. The Gateway program is collocated with the Dixie Area Detention Center in Hurricane. It has capacity for up to eight male residents utilizing an unused section of the Dixie Area Detention Center.
Residential work programs help youths make amends for their delinquent behavior by giving them opportuni-ties to work off court ordered restitution owed to their victims and service hours owed to the community. Par-ticipants in the programs typically work 6 days a week on projects that are either on site at the centers or off site at non-profi t agencies in the community. The chart at top right represents the combined aver-age nightly count of youths served by Genesis Youth Center and the Gateway program each month between July of 2013 (FY 2014) through of September 2016 (FY 2017). Average nightly counts were 33.0 in FY 2014, 32.4 in FY 2015, and 23.8 in FY 2016. During the same period, the number of different youths served was 253 in FY 2014, 243 in FY 2015, and 182 in FY 2016. Average length of time in the program for each admission was
52.6 days in FY 2014, 53.0 days in FY 2015, and 49.1 days in FY 2016. A major priority for the Division's two work pro-grams is to arrange work projects that have real value and result in positive experiences for center youths, staff, and community members. Work sites have included Head Start, Ronald McDonald House, Utah Food Bank, Switchpoint Homeless Shelter, Habitat for Humanity, the US Forest Service, Camp Williams, Life Care, Heri-tage Park, State Parks and University of Utah campus. Prior to participating in work projects and vocational programs, youths learn job skills that keep them safe on work projects and may help them obtain employment after release from the program. For example, Genesis youths who elect to participate in vocational projects are taught basic safety rules and must demonstrate profi cien-cy in the use of all appropriate equipment before they are allowed to use them. Importantly, these opportuni-ties are available both to boys and girls. Programming at the Genesis and Gateway centers goes beyond involvement in work projects. All resi-dents are expected to make educational progress while enrolled in the program. They attend school on site in classrooms operated by the local school district Youth In Custody program (see "Educational Services," page 83). Local school districts provide experienced class-room teachers and offer vocational services, guidance counseling, and special education programs. Genesis recently brought in three relocatable build-
QUICK FACTSWORK PROGRAMS
BEDS (16 FEMALE, 24 MALE)..........................40
ADMISSIONS ................................................177 GIRLS ......................................................54 BOYS .....................................................123
DIFFERENT YOUTHS SERVED .............................182
AVERAGE NIGHTLY BED COUNT .......................23.8
AVERAGE LENGTH OF STAY ...................... 49.1 DAYS
AVERAGE NIGHTLY BED COUNT
0
15
30
45
60
75
Jul | Jan2014
Jul | Jan2015
Jul | Jan2016
Jul |
Nightly Bed Count
Capacity
YOUTHS

36 Work Program
ings so the youths can learn marketable vocational skills. For example, youths at Genesis are now able to partici-pate in basic woodworking, silk screening, art, and an IT certifi cation program. Current plans are to make several additional certifi cation programs available to all pro-gram participants through a partnership with Granite School District. When not working or in school, residents may par-ticipate in a number of programs and activities designed to address the factors that lead to their delinquent behav-ior and may lower their risk to reoffend. For example, during FY 2016, Seeking Safety, Adapt, Why Try, Girls Circle, and Strengthening Families were taught. In ad-dition, volunteers from the community regularly visit to provide residents with additional opportunities. Among
other things, they make arrangements for church services at the facility, bring in special meals on holidays, and ar-range for outside speakers. Complementing its residential program, the Genesis Youth Center initiated non-residential, day programs for girls and boys in February of 2015. Participants travel to the facility each day to participate in school, evidence based programing, and work projects. They return to their homes at the end of each day's activities. During FY 2016, the program served 37 different youths (22 girls, 15 boys) and had 45 different admissions. Daily counts during the year ranged from a low of 2 youths to a high of 16 youths. Enrollment averaged 7.3 youths per day. Average time in the program was about 58 days.
Use of Residential Work Programs During FY 2016.
Facility CapacityYouths Served 1 Admits
Nightly Bed
Count
Nights Over
Capacity 2
MeanLength of Stay 3
OFFICE OF COMMUNITY PROGRAMS
GENESIS YOUTH CENTER 32 153 143 19.9 0.0% 51.0
OFFICE OF RURAL PROGRAMS
GATEWAY YOUTH CENTER 8 29 34 3.8 0.0% 41.1
TOTAL 40 182 177 23.8 - 49.1
1 “Youths Served” is an unduplicated count per facility. “TOTAL” of “Youths Served” is an unduplicated count for the entire system.2 “Nights Over Capacity” is based on the actual numbers of beds available each night.3 “Length of Stay” estimated using Stock / Flow Ratio: ([Nightly Bed Count]/[Admits])*([Days per Fiscal Year]); Butts, J. & Adams, W. Anticipating space needs in juvenile detention
and correctional facilities. OJJDP Juvenile Justice Bulletin, March 2001, Washington, DC: Office of Juvenile Justice and Delinquency Prevention, US Department of Justice.

37Work Program
Nearly all youths (99.1%) admitted to work programs during FY 2015
had previously been admitted to locked detention; 41.3% had previ-
ously been placed in O&A; and 27.8% had been in a home detention
placement.
Though not shown on the chart, a large majority of these youths also
had received services from other juvenile justice agencies: 78.0% had
been on probation, 21.1% had been in the custody or under supervi-
sion of the Division of Child and Family Services, and 84.3% previously
had one or both of these types of care.
0
2
4
6
8
10
Person Property Public Order
CONVICTIONS
0% 20% 40% 60% 80% 100%
AWOL
Jail
Secure Facility
Community Program
O & A
Home Detention
Locked Detention
YOUTHS
All youths (100.0%) admitted to work programs during FY 2015
had previously received at least one conviction for a felony- or
misdemeanor-type offense. The average youth was admitted with 6.7
prior convictions. The great majority of these offenses (88.7%) were
offenses against property and public order. Offenses against persons
represented only about 11.3% of prior convictions.
Though not shown on the chart, those youths with prior convictions
were fi rst found delinquent at an average age of 13.6; 75.3% of them
were between 10 and 14 at the time of their fi rst delinquency.
DELINQUENCY HISTORY
PLACEMENT HISTORY
Youth at Genesis Youth Center learning about the Utah Valley University Closesline Project.

38 Work Program
0%
20%
40%
60%
80%
100%
<=10 11 12 13 14 15 16 17 >17
YOUTHS
Minorities were overrepresented in work programs. Collectively, they
accounted for 51.4% of all admissions, though they represent 25.0%
of Utah’s youth population.
Overrepresentation was most extreme for Native Americans youths,
who were admitted 7.3 times more frequently than would be expect-
ed from their proportion in the population at large; Pacifi c Islander
youths and Hispanics were admitted 2.2 times more frequently; Black
youths were admitted 2.0 times more frequently.
Girls accounted for 30.5% of all admissions to work programs during
FY 2016.
Youths admitted to work programs during FY 2016 ranged in age
from 14 to over 17 years old. Average age was 16.4; 79.1% were
between 15 and 17 years old.
AGES
GENDER
RACE & ETHNICITY
0% 20% 40% 60% 80% 100%
Black
Caucasian
Hispanic
Native American
Asian American
Pacific Islander
Multiracial
Unknown
YOUTHS
0%
20%
40%
60%
80%
100%
Girls Boys
YOUTHS

39Work Program
Performance Measures
All Division programs participate in an ongoing process of performance measurement. Measures are indicators of a program's successes and failures in meeting expecta-tions about the services it provides (Output Measures) and in achieving positive results for the clients it serves (Outcome Measures). Measures are developed from a ba-sic goal statement. The work program's goal is to provide work opportunities to youths with substantial court-ordered obligations to allow them to demonstrate accountability by working off court ordered restitution and service owed to their victims and the community. The analysis that follows is based on youths participating in the Division's Genesis and Gateway work programs.
Output measures document the program's service delivery efforts. This includes the workload measures for number of youths served and average length of stay described on previous pages of this Chapter.
Outcome measures include both short- and long-term indicators whether a program is achieving desired results. One measure of this type is the percentage of youths leaving the program who completed at least 85% of their court-ordered obligations. Overall, during FY 2016, 83.3% of youths met the objective.
The chart at top right identifi es percentages of youths who remained free of new felony- or misdemeanor-type charges while enrolled in the program during specifi ed quarters. Overall, 95.6% of youths avoided new charg-es. Values ranged from a low of 91.3% in the second quarter of 2015 (2015Q2 ) and the fi rst quarter of 2016 (2016Q1) to a high of 100.0% in the second quarter of 2016 (2016Q2). Though not shown, 97.9% avoided a new felony-type charge while in the program.
The chart at center right shows the percentages of youths who were free from new felony- or misdemeanor-type charges in the 90 days following release from the program. Overall, 76.7% of youths met this objective. Values ranged from a low of 67.4% in the fi rst quarter of 2016 (2016Q1) to a high of 88.4% in the second quarter of 2016 (2016Q2).
The chart at bottom right shows the percentages of youths who were free from new felony-type charges in the 90 days following release from the program. Overall, 90% of all youths avoided a new fellony-type charge in the follow up period.
FREE OF CHARGES DURING PROGRAM
FREE OF CHARGES DURING PROGRAM
FREE OF CHARGES AFTER PROGRAM
0%
20%
40%
60%
80%
100%
2015Q2 2015Q3 2015Q4 2016Q1 2016Q2
PERCENT OF YOUTHS
0%
20%
40%
60%
80%
100%
2015Q2 2015Q3 2015Q4 2016Q1 2016Q2
PERCENT OF YOUTHS
0%
20%
40%
60%
80%
100%
2015Q2 2015Q3 2015Q4 2016Q1 2016Q2
PERCENT OF YOUTHS

40 Work Program

41Detention
Detention
Locked Detention facilities provide short-term confi ne-ment for youths awaiting adjudication or placement or serving a sentence ordered by the Juvenile Court. These programs often are a youth’s fi rst point of contact with Utah’s juvenile justice system. While in residence, youths participate in structured programming, receive educational services, and are given a medical screening.
Locked detention programs function within the framework of the BARJ Model (see “Mission and Goals,” page 7) to provide secure custody, recreational activities, some restitution opportunities, and cognitive behavioral skill building groups. Programs also attempt to help youths keep in contact with their families and community. Family visitation is encouraged and non-denominational church services are held at all centers. In addition, Youth in Custody educational programs (YIC; see “Educational Services,” page 83) operate every week-day at each facility. Youths entering locked detention facilities are evaluated and classifi ed according to risk for behavioral problems. This informs decisions about hous-ing and grouping to limit chances that high-risk youths will misbehave and to protect the safety of youths and staff members. Statewide, the Division operates 11 separate locked detention programs: 7 programs are administered by the Offi ce of Rural Programs in rural areas and 4 ad-ditional programs are operated by the Offi ce of Early Intervention Services along the Wasatch Front. Histori-cally, detention programs along the Wasatch Front were
managed by the Offi ce of Correctional Facilities. In May 2015, these programs were transferred to the Offi ce of Early Intervention Services. In addition, as part of the state’s justice reform and quality oversight of at-risk youth, the Division assumed management of two private facilities to accomplish the following goals: (1) imple-ment early-intervention assessment and planning, (2) in-crease cost-effectiveness of taxpayer investment, (3) pro-tect the safety of detention residents and the community, and (4) provide comprehensive and sustainable services for our youths and their families. The chart at top right represents statewide average nightly bed count of locked detention for each month from July of 2013 (FY 2014) through September of 2016 (FY 2017). Over the period, average nightly bed count fell steadily from 179.8 in FY 2014, to 162.3 in FY 2015, to 150.8 in FY 2016. The average nightly bed count for the fi rst 3 months of FY 2016 was 125.5. During the same period, the numbers of different youths served dropped from 3,897 in FY 2014, 3,493 in FY 2015, and 3,112 in FY 2016. Additional details about the numbers of youths served, during FY 2016, are provided in the table on the following page. As may be seen, average "Nightly Bed Count" was well below capacities of individual facilities. It should be noted that it is much more diffi cult to en-sure safety of youths and staff when facilities are over or even at capacity. It is for this reason that locked deten-tion facilities attempt to keep at least 10% of beds open to provide fl exibility.
QUICK FACTSLOCKED DETENTION
NUMBER OF PROGRAMS.................................... 11
BEDS .........................................................296
ADMISSIONS ............................................. 6,740
DIFFERENT YOUTHS SERVED ............................3,112
AVERAGE NIGHTLY BED COUNT ..................... 150.8
LENGTH OF STAY PER ADMISSION .................8.2 DAYS
DAILY COST PER BED .............................. $202.02
AVERAGE NIGHTLY BED COUNT
0
100
200
300
400
500
Jul | Jan2014
Jul | Jan2015
Jul | Jan2016
Jul |
Nightly Bed Count
Capacity
YOUTHS

42 Detention
Use of Locked Detention Centers During FY 2016.
Facility CapacityYouths Served 1 Admits 2
Nightly Bed
Count
Nights Over
Capacity 3
MeanLength of Stay 4
OFFICE OF EARLY INTERVENTION SERVICES
FARMINGTON BAY YOUTH CENTER 32 302 653 15.0 0.0% 8.4
WEBER VALLEY DETENTION CENTER 24 350 903 16.5 2.2% 6.7
SALT LAKE VALLEY DETENTION 80 1,249 2,506 59.3 0.0% 8.7
SLATE CANYON YOUTH CENTER 38 622 930 25.0 2.2% 9.8
OFFICE OF RURAL PROGRAMS
CACHE VALLEY YOUTH CENTER 16 249 430 6.9 0.0% 5.8
CANYONLANDS YOUTH CENTER 16 77 137 2.5 0.0% 6.7
SOUTHWEST UTAH YOUTH CENTER 10 122 189 4.5 1.9% 8.8
DIXIE AREA DETENTION CENTER 32 153 280 5.8 0.0% 7.5
CASTLE COUNTRY YOUTH CENTER 16 118 259 4.7 0.5% 6.7
CENTRAL UTAH YOUTH CENTER 16 129 205 4.2 0.0% 7.5
SPLIT MOUNTAIN YOUTH CENTER 16 161 248 6.5 0.0% 9.5
TOTAL 296 3,112 6,740 150.8 - 8.2
1 “Youths Served” is an unduplicated count per facility. “TOTAL” of “Youths Served” is an unduplicated count for the entire system.2 Changes in a youth’s status during a single episode in detention are counted as separate admissions. For example, a youth placed in detention for a delinquent offense who attends
court and is then ordered to a 10-day commitment to detention would accumulate two admissions based on a change of status while in detention.3 “Nights Over Capacity” is based on the numbers of youths in residence at 12:00 AM (midnight) each night in a specified facility.4 “Length of Stay” estimated using Stock / Flow Ratio: ([Nightly Bed Count]/[Admits])*([Days per Fiscal Year]); Butts, J. & Adams, W. Anticipating space needs in juvenile detention
and correctional facilities. OJJDP Juvenile Justice Bulletin, March 2001, Washington, DC: Office of Juvenile Justice and Delinquency Prevention, US Department of Justice.
Detention youth at Farmington Bay Youth Center enjoying a summper activity.
Breaking ground for the new multi purpose center in Ogden.

43Detention
Two categories of admission reason, [1] Orders To Detention and [2]
Warrant/Admin Hold, accounted for 60.5% of all admissions to locked
detention during FY 2016.
Collectively, delinquent offenses [1] against people (Person Offenses),
[2] property (Property Offenses), and [3] public order (Public Order
Offenses) accounted for 23.2% of all admissions.
Admissions for youths [1] waiting for a Juvenile Justice Services’ place-
ment (Waiting JJS), [2] Division of Child and Family Services’ place-
ment (Waiting DCFS), and [3] another agency’s placement (Waiting
OTH) accounted for 6.7% of all admissions.
* Other includes [1] infractions, [2] motor vehicle offenses, and [3]
admissions not identifi ed with an admitting offense.
The large majority (90.3%) of youths admitted to locked detention
during FY 2016 had previously received at least one conviction for
a felony- or misdemeanor-type offense. The average for all admis-
sions was 4.1 prior convictions. The great majority of these offenses
(83.6%) were offenses against property and public order. Offenses
against persons represented only 16.4% of the total.
Though not shown on the chart, those youths with prior convictions
were fi rst found delinquent at an average age of 13.6; 74.4% of them
were between 10 and 14 at the time of their fi rst delinquency.
ADMITTING OFFENSES
DELINQUENCY HISTORY
PLACEMENT HISTORY
The majority of youths (74.1%) admitted to locked detention during
FY 2016 had previously been admitted to the program; 16.5% had
previously been placed in an out-of-home, community residential
program (Community Program); and 21.1% had been in a home
detention placement.
Though not shown on the chart, a majority of these youths also had
received services from other juvenile justice agencies: 49.1% had been
on probation, 19.7% had been in the custody or under supervision of
the Division of Child and Family Services, and 57.5% previously had
one or both of these types of care.
0% 20% 40% 60% 80% 100%
Warrant/Admin.Hold
Orders To Detention
Person Offenses
Property Offenses
Other *
Waiting JJS
Public OrderOffenses
Waiting DCFS
Waiting OTH
YOUTHS
0% 20% 40% 60% 80% 100%
AWOL
Jail
Secure Facility
Community Program
O & A
Home Detention
Locked Detention
YOUTHS
0
2
4
6
8
10
Person Property Public Order
CONVICTIONS

44 Detention
Minorities were overrepresented in locked detention. Collectively, they
accounted for 46.8% of all admissions, though they represent 25.0%
of Utah’s youth population.
Overrepresentation was most extreme for Black youths who were ad-
mitted 4.4 times more frequently than would be expected from their
proportion in the population at large; Native American youths were
admitted 3.4 times more frequently; and Hispanics were admitted 1.9
times more frequently.
Girls accounted for 23.0% of all admissions to locked detention dur-
ing FY 2016.
AGES
GENDER
RACE & ETHNICITY
0%
20%
40%
60%
80%
100%
<=10 11 12 13 14 15 16 17 >17
YOUTHS
0%
20%
40%
60%
80%
100%
Girls Boys
YOUTHS
0% 20% 40% 60% 80% 100%
Black
Caucasian
Hispanic
Native American
Asian American
Pacific Islander
Multiracial
Unknown
YOUTHS
Youths admitted to locked detention during FY 2016 ranged in age
from 10 to over 17 years old. Average age was 16.1; 76.2% were
between 15 and 17 years old.

45Detention
Admissions by County
Statewide, there were 6,740 admissions to Utah’s locked detention programs during FY 2016. Shad-ing and numbers in the map at top right represent the percentages of these admissions involving youths from Utah’s 29 counties. For example, 3.1% of admissions involved youths from Carbon County.
• Salt Lake County, the state’s most populouscounty, had the largest value, accounting for33.9% all admissions. At the other extreme, noyouths were admitted to detention from Rich orDaggett Counties.
• Rural counties served by the Offi ce of RuralPrograms contributed 25.0% of all admissions.These counties are home to 19% of Utah’s 10 to17 year olds.
• Four urban counties (Salt Lake, Davis, Weber,and Utah) accounted for 68.3% of all detentionadmissions. These counties are home to 74.8%of the state’s 10 to 17 year olds.
• 2.3% of admissions were out-of-state youths.
Admission Rates by County
The map at bottom right represents the rates of admission to locked detention for each of Utah’s 29 counties. Shading and numbers represent numbers of admissions for each 100 youths aged 10 to 17 in the population. For example, there were 2.5 admis-sions for every 100 youths aged 10 to 17 in Box Elder County.
• Overall, there were 1.6 admissions for each 100of Utah's 10 to 17 year old youths.
• Rates of detention admission were highest inGrand (8.3) and Carbon (8.7) Counties.
• Salt Lake County, the state’s most populouscounty, had an admission rate of 1.7 for every100 10 to 17 year old youths.
• Rural counties had a rate of 2.2 admissions per100 youths; the four largest urban counties (SaltLake, Davis, Weber, and Utah) had a rate of 1.5.
• Overall rates of admission to detention were 1.6for counties that have a detention center and(1.8) and for those that do not.
UNKNOWN COUNTY
0.8
OUT OF STATE
10.9
2.3
0.5
1.7
TOOELE
2.8
BOX ELDER 3.5
CACHE
0
RICH
0.6SUMMIT
2.6
UINTAH
1.5
DUCHESNEWASATCH
UTAH
0.3JUAB
0.8
SANPETE
0.8
EMERY
1.2
GRAND
3.1CARBON
0.3MILLARD
0.9SEVIER
0.3BEAVER <.1WAYNE
2.0IRONGARFIELD
3.9
WASHINGTON0.5KANE
1.0
SAN JUAN
14.3WEBER
DAVIS
MORGAN
9.1
SALT LAKE
33.9
DAGGETT0
PIUTE
0.3
<.1
<.1
1.4
0.9
1.1
TOOELE
2.5
BOX ELDER 1.5
CACHE
0
RICH
0.8SUMMIT
3.5
UINTAH
3.3
DUCHESNEWASATCH
UTAH
1.1JUAB
1.3
SANPETE
3.5
EMERY
8.3
GRAND
8.7CARBON
1.1MILLARD
2.2SEVIER
2.0BEAVER 0.5WAYNE
2.1IRON0.1GARFIELD
1.3
WASHINGTON4.4KANE
2.8
SAN JUAN
3.2WEBER
DAVIS
MORGAN
1.3 1.0
SALT LAKE
1.7
DAGGETT0
PIUTE
0.5

46 Detention

47Multiuse Facilities
Multiuse Facilities
The Division’s multiuse facilities are designed to provide a variety of residential and non residential services for youths in rural communities. These facilities are integral parts of local juvenile justice efforts. During FY 2016, multiuse facilities operated in fi ve rural com-munities: (1) Split Mountain Youth Center, in Vernal; (2) Central Utah Youth Center, in Richfi eld; (3) Canyon-lands Youth Center, in Blanding; (4) Cache Valley Youth Center, in Logan; and (5) Castle Country Youth Center, in Price. An additional facility, the Washington County Youth Crisis Center, in St. George, functioned as a multiuse facility until the center's detention function was moved to a separate facility, the Dixie Area Deten-tion Center. The Washington County facility continues to provide shelter, receiving center, and youth services programming. In addition, the facility operates a 6-bed, non secure residential program for high risk youths. Collectively, rural facilities, including the Dixie Area Detention Center, provide 122 beds of locked deten-tion and 70 beds for non secure programs. Non secure beds may be used for a variety of residential programs including observation and assessment (O&A), shelter, and youth services crisis residential. Centers also have programming space for educational activities, receiving center functions, and work projects. Average nightly count of youths in locked detention for each month between July 2013 (FY 2014) through September 2016 (FY 2017) is presented in the chart at bottom left. During FY 2016, rural locked deten-tion averaged a nightly bed count of 30.5 and served
LOCKED DETENTION USE
970 different youths. Average nightly count of youths in non secure beds is presented in the chart at bottom right. During FY 2016, 22.4 youths were in residence each night, including 6.6 youths in shelter, at fi ve different facilities, and 12.3 youths in O&A at four different centers. Additional details about numbers of youths served by multiuse centers may be found in other chapters (see "Receiving Centers," page 23, “Detention,” page 41, "Observation and Assessment," page 53).
0
30
60
90
120
150
Jul | Jan2014
Jul | Jan2015
Jul | Jan2016
Jul |
Nightly Bed Count
Capacity
YOUTHS
NON SECURE BED USE
0
30
60
90
120
150
Jul | Jan2014
Jul | Jan2015
Jul | Jan2016
Jul |
Nightly Bed Count
YOUTHS
Capacity
Central Utah Youth Center youths and staff tending the facility's garden

48 Multiuse Facilities

49Case Management
Case Management
The Juvenile Court assigns the most serious and chronic juvenile offenders to the custody of the Division of Juvenile Justice Services (Division) for extended care. These youths often have continued to offend while in less structured programs than those provided by the Division and pose serious risk to themselves or the community. Each youth committed to the Division for community placement or secure care is assigned to an individual case manager. Case management is admin-istered through the Division’s Offi ce of Community Programs and the Offi ce of Rural Programs.
Case managers evaluate a youth’s needs for services based on (1) the youth’s personal history, (2) information from other workers, (3) the risk assessment process and other assessments, and (4) directions and orders from the Juvenile Court. Findings are interpreted within the framework of the Division’s Mission Statement and the BARJ Model (see “Mission and Goals,” page 7) to develop the Needs Assessment Service Plan, an indi-vidualized correctional plan. The plan documents (1) the youth’s strengths and weaknesses, (2) identifi es appropri-ate services, and (3) sets goals for completion. Once a service plan is in place, case managers ar-range and monitor delivery of services and document the youth’s progress in meeting goals of the correc-tional plan. Case managers also coordinate with staff in residential programs and facilities to support youths and help prepare them for the time return to the community.
On a regular basis, case managers meet with the Juvenile Court or the Youth Parole Authority to review progress of individual youths and make recommendations for future interventions. A key resource for case managers is the Protective and Risk Assessment, Utah's standardized risk assess-ment tool developed in collaboration with Juvenile Court Probation (see “Protective and Risk Assessment,” page 86). The assessment is used to identify protec-tive and risk factors known to be associated with future delinquency and other problems. Reassessments are used to document progress and identify continuing issues. Risk assessment information is managed by the CARE information system (see “Court & Agencies’ Record Ex-change [CARE],” page 87) and is immediately available to other workers associated with a youth. CARE also includes data-collection and reporting tools that facili-tate development of the youth’s service plan, documenta-tion of progress, and sharing information with court and Division staff working with the youth. In FY 2016, the Division established a comprehen-sive certifi cation process for all of the Division's case managers. The certifi cation requirement is designed to ensure that case managers develop and maintain profi -ciency in the skills necessary for them to provide high quality case management services that are evidence based and delivered with fi delity. Certifi cation is based on four criteria: (1) successful completion of the Divi-sion's Case Manager Training Orientation; (2) successful completion of all stages of the Division's Case Planning
QUICK FACTSCASE MANAGEMENT
NUMBER OF WORKERS .....................................70
SERVICE AREA ...................................... STATEWIDE
NEW COMMITMENTS OBSERVATION & ASSESSMENT .......................417 COMMUNITY PLACEMENT ............................386 SECURE CARE ..........................................113
DIFFERENT YOUTHS SERVED ..........................1,489
AVERAGE DAILY ASSIGNMENTS ......................735.7
DAILY COST PER YOUTH .............................$23.09
Case manager service project in Springville.

50 Case Management
On a typical day, during FY 2016, the majority of youths assigned
to Division case managers (70.1%) were in community placements,
home placements, observation and assessment (O&A) programs, or
on trial placement.
21.8% of the youths were in locked secure facilities or locked deten-
tion.
Home12.8%
Other *1.3%
Detention * *8.4%
O & A6.5%
Secure Facility13.4%
AWOL6.7%
Community Placement
45.4%
Secure Facility trial
place5.4%
AVERAGE DAILY POPULATION
0
300
600
900
1,200
1,500
Jul | Jan2014
Jul | Jan2015
Jul | Jan2016
Jul |
Daily Population
YOUTHS
TYPICAL PLACEMENTS
An average of 735.7 youths were under case management supervi-
sion each day during FY 2016. The average was 962.1 in FY 2014 and
859.6 in FY 2015.
* Other includes youths in jail or hospital. * * Youths in detention who also are in Division custody.
Training (1, 2, and 3); (3) demonstration of knowledge and understanding of the Division's Case Management Program Manual, and (4) demonstration of mastery of the case planning process. Mastery is evaluated through a combination of written tests and in-person demonstra-tions to a panel of case management supervisors and case management assistant program directors. By the end of the 2016 calendar year, most case man-agers successfully completed the certifi cation process. Beginning in 2017, case managers must take part in an-
nual recertifi cation process to maintain their certifi ca-tion. Candidates will need to demonstrate their contin-ued profi ciency by successfully completing the full case planning process while being observed and evaluated by case management supervisors and assistant program directors. This includes developing documentation of (1) the conceptualization process, (2) a Needs Assessment Service Plan, and (3) a Court report. To be successful, a case manager must score 100% on each item.

51Case Management
Performance Measures
All Division programs participate in an ongoing process of performance measurement. Measures are indicators of a program's successes and failures in meeting expecta-tions about the services it provides (Output Measures) and in achieving positive results for the clients it serves (Outcome Measures). Measures are developed from a ba-sic goal statement. The goal for the Division's case man-agement is to coordinate interventions and supervision that address criminogenic needs of adjudicated youths who require removal from home to curtail further delinquent activity.
Output measures document the program's service de-livery efforts. This includes the workload measures for number of youths served and average length of stay de-scribed on previous pages of this Chapter. The chart at top right shows results of an additional service measure, monthly, face-to-face meetings with youths. Overall, 78.9% of youths received monthly visits. Percentages ranged from a low of 74.7% in the second quarter of 2015 (2015Q2) to a high of 81.9% in the fi rst quarter of 2016 (2016Q1).
Outcome measures include both short- and long-term indicators of whether a program is having its desired im-pacts. The chart at center right identifi es the percentages of youths who remained free of new felony- or misde-meanor-type charges while under case management supervision during specifi ed quarters. Overall, an aver-age of 90.6% of youths avoided new charges. Percentages ranged from a low of 88.8% in the third quarter of 2015 (2015Q3) to a high of 90.7% in the fi rst quarter of 2016 (2016Q1). Though not shown, percentages of youths free of felony-type charges while under case manage-ment supervision were much higher. Overall, an average of 96.7% of youths avoided new felony charges during specifi ed quarters.
The chart at bottom right shows the percentages of youths who avoided new felony- or misdemeanor-type charges in the 360 days following release from case man-agement supervision. Overall, 54.0% of youths avoided receiving new felony- or misdemeanor-type charges in the year after leaving case management supervision. The lowest percentage was 52.3% in the fourth quarter of 2014 (2014Q4). The highest was 56.2% for the third quarter of 2014 (2014Q3). Though not shown, overall, 88.2% of youths avoided a new felony-type charge in the year after release from supervision.
MONTHLY FACE-TO-FACE VISITS
FREE OF CHARGES DURING PROGRAM
FREE OF CHARGES AFTER PROGRAM
0%
20%
40%
60%
80%
100%
2015Q2 2015Q3 2015Q4 2016Q1 2016Q2
PERCENT OF YOUTHS
0%
20%
40%
60%
80%
100%
2015Q2 2015Q3 2015Q4 2016Q1 2016Q2
PERCENT OF YOUTHS
0%
20%
40%
60%
80%
100%
2014Q1 2014Q2 2014Q3 2014Q4 2015Q1
PERCENT OF YOUTHS

52 Case Management

53Observation and Assessment
0
30
60
90
120
150
Jul | Jan2014
Jul | Jan2015
Jul | Jan2016
Jul |
YOUTHS
Nightly Bed Count
Capacity
AVERAGE NIGHTLY BED COUNT
Observation and Assessment
Observation and assessment (O&A) is a 45-day residen-tial program that provides comprehensive evaluation, treatment planning, and recommendations. Youths receive extensive psychological, behavioral, social, edu-cational, and physical assessments to identify their needs for services. Evaluation results are interpreted within the framework of the Division of Juvenile Justice Services' (Division) Mission Statement and the principles of the BARJ Model (see “Mission and Goals,” page 7). Find-ings form the basis for recommendations made to the Juvenile Court and case management.
During FY 2016, the Offi ce of Early Intervention Services provided O&A services through four facilities along the Wasatch Front. O&A services also were pro-vided by the Offi ce of Rural Programs through multiuse facilities in Blanding, Logan, Richfi eld, and Vernal. An additional O&A program, the Farmington Bay Youth Center O&A, was operated under contract with a private provider until September 2015, when the contract and the facility's O&A services were discontinued. As in other residential programs, youths in O&A receive educational services through Youth in Custody programs (YIC; see “Educational Services,” page 83). YIC teachers, provided by local school districts, hold classes each weekday for all youths. Work fi nished in O&A classrooms may be credited to a youth’s regular academic record. Complementing these activities, O&A
centers have developed work opportunities for youths to meet court-ordered obligations for community service and victim restitution. During FY 2016, 47 different youths (8.8% of all youths served) received O&A services while remain-ing at home in a program called In-Home O&A. The program started as a pilot in October 2012, in the 3rd District Juvenile Court. In-Home O&A is now operat-ing in the 2nd, 3rd, and 4th District Juvenile Courts. While in the program, youths are required to attend day treatment programming based on their needs and those of their families. Division workers actively en-gage families and youths and are involved in the youth’s educational efforts. Division clinicians conduct compre-hensive mental health evaluations and may contract for additional assessments if needed. Youths can complete the O&A at a residential O&A if they become a risk to themselves or the community. At the conclusion of each youth's In-Home O&A stay, a formal report of the program's fi ndings and recommendations is presented to the Juvenile Court to aid the Court in making decisions about the case. The chart at top right represents statewide average nightly bed count of observation and assessment for each month from July of 2013 (FY 2014) through September of 2016 (FY 2017). Counts include youths in the In-Home O&A program. Average nightly bed count was 68.5 in FY 2014, 65.3 in FY 2015, and 50.1 in FY 2016. Average length of stay per admission was 41.4 days in FY 2014, 43.4 days in FY 2015, and 39.1 in FY 2016.
QUICK FACTSOBSERVATION AND ASSESSMENT
NUMBER OF PROGRAMS O&A FACILITIES ..........................................5 MULTIUSE FACILITIES ......................................4
O&A BEDS ..................................................80
ADMISSIONS ................................................469
DIFFERENT YOUTHS SERVED ..............................485
AVERAGE NIGHTLY BED COUNT ....................... 50.1
AVERAGE LENGTH OF STAY ...................... 39.1 DAYS
DAILY COST PER BED .............................. $209.16

54 Observation and Assessment
Use of Observation and Assessment Centers During FY 2016.
Facility CapacityYouths Served 1 Admits
Nightly Bed
Count
Nights Over
Capacity 2
MeanLength of Stay 3
OFFICE OF CORRECTIONAL FACILITIES
FARMINGTON BAY YOUTH CENTER - O&A 4 16 19 8 6.2 0.0 44.8
OFFICE OF EARLY INTERVENTION SERVICES
OGDEN O&A 16 103 105 10.0 1.6% 37.9
SALT LAKE O&A 16 128 129 12.5 18.0% 37.9
SALT LAKE GIRLS O&A 8 60 52 6.5 0.0% 45.2
SPRINGVILLE O&A 16 64 61 7.1 0.0% 43.4
OFFICE OF RURAL PROGRAMS
CACHE VALLEY YOUTH CENTER 6 36 31 3.4 0.8% 39.2
CANYONLANDS YOUTH CENTER 6 23 22 2.5 0.0% 39.4
CENTRAL UTAH YOUTH CENTER 6 37 35 3.9 17.8% 42.0
SPLIT MOUNTAIN YOUTH CENTER 6 26 26 2.5 0.0% 34.7
TOTAL 96 485 469 50.1 - 39.1
1 “Youths Served” is an unduplicated count per facility. “TOTAL” of “Youths Served” is an unduplicated count for the entire system.2 “Nights Over Capacity” is based on the actual numbers of beds available each night.3 “Length of Stay” estimated using Stock / Flow Ratio: ([Nightly Bed Count]/[Admits])*([Days per Fiscal Year]); Butts, J. & Adams, W. Anticipating space needs in juvenile detention
and correctional facilities. OJJDP Juvenile Justice Bulletin, March 2001, Washington, DC: Office of Juvenile Justice and Delinquency Prevention, US Department of Justice.4 Farmington Bay Youth Center O&A was discontinued in August of 2015. Mean Length of Stay is based on the facility's FY 2015 Length of Stay.
Craft activity involving O&A Youth from Cache Valley Youth Center.Youths engaged in school activities at Cache Valley Youth Center.

55Observation and Assessment
Youths admitted to O&A during FY 2016 had an average of 4.5
felony- and misdemeanor-type convictions. The great majority of prior
convictions (84.5%) were for offenses against property or public or-
der. Only 15.5% were misdemeanor- and felony-type offenses against
people.
Though not shown on the chart, youths admitted to O&A were fi rst
found delinquent at an average age of 13.7; 74.7% of them were
between 10 and 14 years old at the time of their fi rst delinquency.
PLACEMENT HISTORY
0% 20% 40% 60% 80% 100%
AWOL
Jail
Secure Facility
Community Program
O & A
Home Detention
Locked Detention
YOUTHS
DELINQUENCY HISTORY
0
2
4
6
8
10
Person Property Public Order
CONVICTIONS
Nearly all youths admitted to O&A (96.4%) had previously been
admitted to locked detention: 6.0% had previously been placed in an
out-of-home, community residential program (Community Program);
and over 28.6% had been under home detention.
Though not shown on the chart, a majority of these youths also had
received services from other juvenile justice agencies: 51.2% had been
on probation, 16.4% had been in the custody or under supervision of
the Division of Child and Family Services, and 58.6% previously had
one or both of these types of care.
Annual softball game between Division State Offi ce and youths from Salt Lake Observation and Assessment.

56 Observation and Assessment
AGES
GENDER
RACE & ETHNICITY
0% 20% 40% 60% 80% 100%
Black
Caucasian
Hispanic
Native American
Asian American
Pacific Islander
Multiracial
Unknown
YOUTHS
0%
20%
40%
60%
80%
100%
Girls Boys
YOUTHS
0%
20%
40%
60%
80%
100%
<=10 11 12 13 14 15 16 17 >17
YOUTHS
Youths admitted to O&A during FY 2016 ranged in age from 12 to
over 17 years old. Average age was 15.8; 73.1% were between the
ages of 15 and 17.
Girls accounted for 20.9% of all admissions to O&A during FY 2016.
All O&A programs admitted girls during FY 2016. Girls in Salt Lake
City were served in the eight-bed Salt Lake Girls O&A program. Col-
lectively, this program served 53.1% of the statewide number of girls
admitted to O&A during FY 2016. Other programs provided beds for
girls on an as needed basis.
Minorities were overrepresented in O&A. Collectively, they accounted
for 47.2% of all admissions, though they only represent 25.0% of
Utah’s youths.
Overrepresentation was most extreme for Black youths who were
admitted 4.7 times more frequently than would be expected from
their proportion in the population at large; Native Americans were
admitted 3.2 times more frequently; and Hispanics were admitted 2.0
times more frequently.

57Observation and Assessment
10-Year Trends (FY 2007 - FY 2016)
Demographics• Nightly Bed Count. The yearly average number
of youths in O&A each night trended downward across the 10-year period (see chart at top right). The high was 75.9 in FY 2007; the low was 50.1 in FY 2016. Average counts dropped by 25.8 between the fi rst and last years of the 10-year period. Utah's population of 10 to 17 year olds increased by 18.2% over that same time.
• Age. Yearly average age of youths admitted toO&A programs was stable across the period. Aver-age ages ranged between 15.8 and 16.0.
• Gender. Relative numbers of girls admitted toO&A each year varied from one year to the nextduring the period. The high for the period was27.3% in FY 2013; the low was 20.6% in FY 2010.Relative numbers of girls dropped by 6.2% be-tween the fi rst and last years of the period.
• Race & Ethnicity. The relative number of mi-nority youths admitted to O&A trended upwardacross the period. The low for the period was33.2% in FY 2007; the high was 47.2% in FY2016. The percentage of minority youths admit-ted increased by 42.3% between the fi rst and lastyears of the period. Minority youths accounted for25.0% of Utah's 10-17 year old youths in 2016.
Budget• Expenditures. O&A expenditures trended upward
over the period (see chart at center right). Expen-ditures increased by 15.5% between the fi rst and last years of the period. The Division's overall expenditures declined by 7.3% over that same period.
Delinquency• Overall offenses. Yearly average number of felony-
and misdemeanor-type convictions at the time of admission to O&A were relatively stable for most of the 10-year period (see chart at bottom right). Numbers ranged between 5.6 and 6.0 for each of the fi rst 7 years of the period before dropping to 5.0 in FY 2014, 4.9 in FY 2015 and 4.5 in FY 2016.
AVERAGE NIGHTLY BED COUNT
BUDGET
DELINQUENCY HISTORY
0
30
60
90
120
150
2007 2008 2009 2010 2011 2012 2013 2014 2015 2016
Nightly Bed Count
Capacity
YOUTHS
0
25
50
75
100
125
2007 2008 2009 2010 2011 2012 2013 2014 2015 2016
Observation and Assessment
MILLIONS ($)
All Division Programs
0
5
10
15
20
25
2007 2008 2009 2010 2011 2012 2013 2014 2015 2016
CONVICTIONS

58 Observation and Assessment
Performance Measures
All Division programs participate in an ongoing process of performance measurement. Measures are indicators of a program's successes and failures in meeting expecta-tions about the services it provides (Output Measures) and in achieving positive results for the clients it serves (Outcome Measures). Measures are developed from a basic goal statement. The shared goal for the Division's observation and assessment programs is to provide Juve-nile Court judges with individualized placement and treat-ment recommendations, for adjudicated youths, that identify and address the youths’ criminogenic issues.
Output measures document the program's service delivery efforts. This includes the workload measures for number of youths served and average length of stay described on previous pages of this Chapter.
Outcome measures include both short- and long-term indicators of whether a program is achieving desired results. The chart at top left represents the percentages of youths whose O&A recommendation was accepted by the Juvenile Court. Overall, 90.6% of O&A recom-mendations matched the Court decision during the fi ve quarters from April 2015 through June 2016. Percent-ages ranged from a low of 83.0% in the second quarter of 2016 (2016Q2) to a high of 93.7% in the third quarter of 2015 (2015Q3).
The chart at center left identifi es the percentages of youths who remained free of new felony- or misdemean-or-type charges while enrolled in the program during specifi ed quarters. Overall, 97.9% of youths remained free of charges. Values ranged from a low of 95.2% in the fourth quarter of 2015 (2015Q4) to a high of 100.0% in the third quarter of 2015 (2015Q3). Though not shown, a much higher percentage of youths (99.8%) remained free of felony-type charges while enrolled in the program during specifi ed quarters.
The chart at bottom left shows the percentages of youths who remained free of new felony- or misdemeanor-type charges in the 90 days following release from O&A. The overall rate for the fi ve-quarter reporting period was 76.8%. Rates ranged from a low of 68.5% in the third quarter of 2015 (2015Q3) to a high of 82.0% in the second quarter of 2015 (2015Q2). Though not shown, a much higher percentage of youths (94.7%) avoided a new felony-type charge.
O&A RECOMMENDATIONS
FREE OF CHARGES DURING PROGRAM
FREE OF CHARGES AFTER PROGRAM
0%
20%
40%
60%
80%
100%
2015Q2 2015Q3 2015Q4 2016Q1 2016Q2
PERCENT OF YOUTHS
0%
20%
40%
60%
80%
100%
2015Q2 2015Q3 2015Q4 2016Q1 2016Q2
PERCENT OF YOUTHS
0%
20%
40%
60%
80%
100%
2015Q2 2015Q3 2015Q4 2016Q1 2016Q2
PERCENT OF YOUTHS
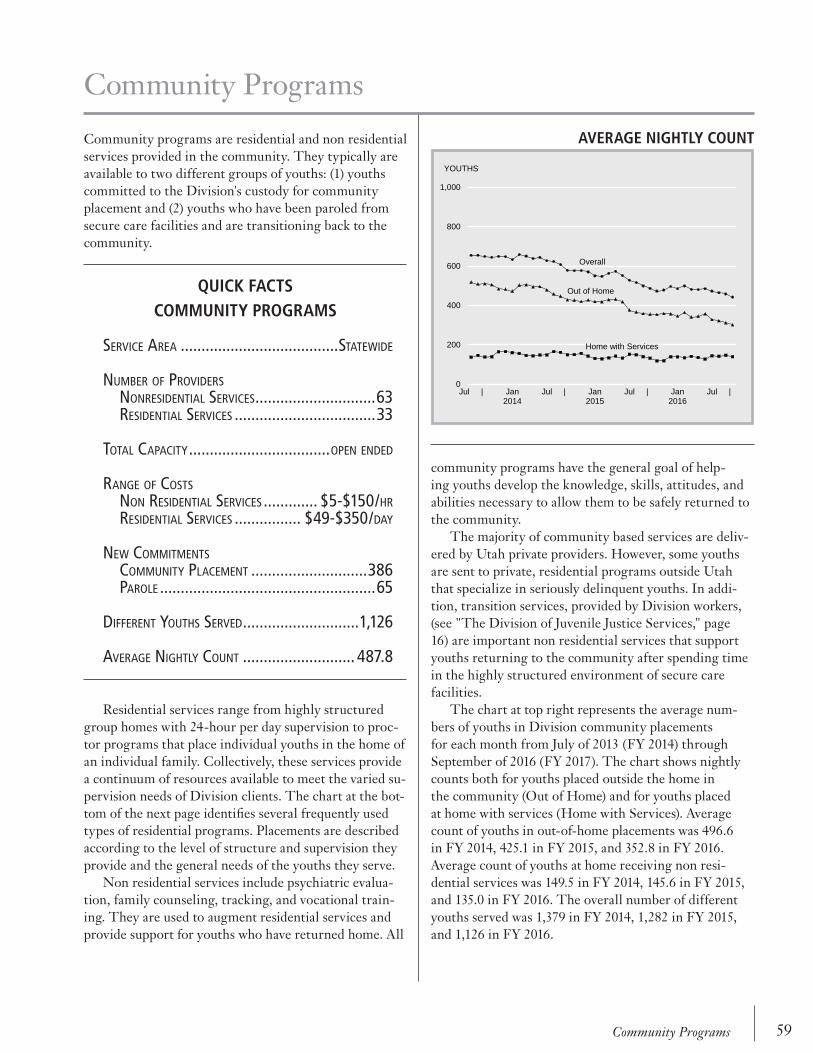
59Community Programs
Community programs are residential and non residential services provided in the community. They typically are available to two different groups of youths: (1) youths committed to the Division's custody for community placement and (2) youths who have been paroled from secure care facilities and are transitioning back to the community.
Residential services range from highly structured group homes with 24-hour per day supervision to proc-tor programs that place individual youths in the home of an individual family. Collectively, these services provide a continuum of resources available to meet the varied su-pervision needs of Division clients. The chart at the bot-tom of the next page identifi es several frequently used types of residential programs. Placements are described according to the level of structure and supervision they provide and the general needs of the youths they serve. Non residential services include psychiatric evalua-tion, family counseling, tracking, and vocational train-ing. They are used to augment residential services and provide support for youths who have returned home. All
Community Programs
community programs have the general goal of help-ing youths develop the knowledge, skills, attitudes, and abilities necessary to allow them to be safely returned to the community. The majority of community based services are deliv-ered by Utah private providers. However, some youths are sent to private, residential programs outside Utah that specialize in seriously delinquent youths. In addi-tion, transition services, provided by Division workers, (see "The Division of Juvenile Justice Services," page 16) are important non residential services that supportyouths returning to the community after spending time in the highly structured environment of secure care facilities. The chart at top right represents the average num-bers of youths in Division community placements for each month from July of 2013 (FY 2014) through September of 2016 (FY 2017). The chart shows nightly counts both for youths placed outside the home in the community (Out of Home) and for youths placed at home with services (Home with Services). Average count of youths in out-of-home placements was 496.6 in FY 2014, 425.1 in FY 2015, and 352.8 in FY 2016. Average count of youths at home receiving non resi-dential services was 149.5 in FY 2014, 145.6 in FY 2015, and 135.0 in FY 2016. The overall number of different youths served was 1,379 in FY 2014, 1,282 in FY 2015, and 1,126 in FY 2016.
AVERAGE NIGHTLY COUNT
0
200
400
600
800
1,000
Jul | Jan2014
Jul | Jan2015
Jul | Jan2016
Jul |
Out of Home
Home with Services
YOUTHS
Overall
QUICK FACTSCOMMUNITY PROGRAMS
SERVICE AREA ......................................STATEWIDE
NUMBER OF PROVIDERS NONRESIDENTIAL SERVICES .............................63 RESIDENTIAL SERVICES ..................................33
TOTAL CAPACITY ..................................OPEN ENDED
RANGE OF COSTS NON RESIDENTIAL SERVICES ............. $5-$150/HR RESIDENTIAL SERVICES ................ $49-$350/DAY
NEW COMMITMENTS COMMUNITY PLACEMENT ............................386 PAROLE ....................................................65
DIFFERENT YOUTHS SERVED ............................1,126
AVERAGE NIGHTLY COUNT ........................... 487.8

60 Community Programs
Low
H
igh
STR
UC
TUR
E
HOME WITH SERVICES
PROCTOR PLACEMENTS
RESIDENTIAL GROUP CARE
INTENSIVE RESIDENTIALGROUP CARE
SECURE CARE
Youths who pose a minimal risk to themselves and others are placed at home, on
independent living, or with a relative.
Intensive group homes serve youths with severe behavioral problems who are a mod-
erate risk to themselves or others. These programs are similar to group homes but
provide 24-hour-a-day awake supervision and additional treatment services.
Group homes are appropriate for youths with moderate behavioral problems and
delinquency records, and who present a minimal risk to themselves and others. The
programs are staffed with full time trained staff who have the primary responsibility
for providing behavior management, general guidance, and supervision.
Youths with mild behavioral problems and/or minimal delinquent records are candi-
dates for this level. Proctor homes are staffed by a trained couple or individual, age
21 or older, who have primary responsibility for providing room, board, and guidance
to a single youth.
CONTINUUM OF RESIDENTIAL CARE
Common area of Compass Academy Group Home..The Journey Impact Ranch Group Home.

61Community Programs
DELINQUENCY HISTORY
PLACEMENT HISTORY
Youths admitted to community programs during FY 2016 had an
average of 6.9 felony- and misdemeanor-type convictions. The great
majority of prior offenses (83.2%) were offenses against property or
public order. Offenses against people represented only 16.8% of of-
fenses in the youths’ histories.
Though not shown on the chart, these youths were fi rst found to be
delinquent at an average age of 13.3; 78.6% were between 10 and
14 years old at the time of their fi rst delinquency.
Youths placed in community programs during FY 2016 had previously
received a wide range of services: nearly all (98.7%) had a history of
placement in locked detention; 72.3% had previously been placed in
an out-of-home community program (Community Program); 68.5%
had been placed in observation and assessment (O&A); and 7.7% had
been in a secure facility.
Though not shown on the chart, most of these youths also had re-
ceived services from other juvenile justice agencies: 69.4% had been
on probation, 22.8% had been in the custody or supervision of the
Division of Child and Family Services, and 75.2% previously had one
or both of these types of care.
0
2
4
6
8
10
Person Property Public Order
CONVICTIONS
0% 20% 40% 60% 80% 100%
AWOL
Jail
Secure Facility
Community Program
O & A
Home Detention
Locked Detention
YOUTHS
Community placement youths on an outdoor activity.

62 Community Programs
AGES
GENDER
RACE & ETHNICITY
0%
20%
40%
60%
80%
100%
<=10 11 12 13 14 15 16 17 >17
YOUTHS
0%
20%
40%
60%
80%
100%
Girls Boys
YOUTHS
0% 20% 40% 60% 80% 100%
Black
Caucasian
Hispanic
Native American
Asian American
Pacific Islander
Multiracial
Unknown
YOUTHS
Youths admitted to community programs during FY 2016 ranged in
age from 12 to over 17 years old. Average age was 16.8; 70.7% were
between 15 and 17 years old.
Girls accounted for 14.2% of all admissions to community programs
during FY 2016.
Minorities were overrepresented in community programs. Collectively,
they accounted for 41.5% of all admissions, though they only repre-
sent about 25.0% of Utah’s youths.
Overrepresentation was most extreme for Black youths who were
admitted 3.0 times more frequently than would be expected from
their proportion in the population at large; Native Americans were
admitted 2.7 times more frequently; and Hispanics were represented
1.8 times more frequently.

63Community Programs
10-Year Trends (FY 2007 - FY 2016)
Demographics• Nightly Bed Count. The yearly average number of
youths receiving community services each night trended downward across the 10-year period (see chart at top right). The high was 739.4 in FY 2007; the low was 486.4 in FY 2016. The yearly average dropped by 34.0% between the fi rst and last years of the 10-year period. Utah's population of 10 to 17 year olds increased by 18.2% over that same time.
• Age. Average age of youths admitted to communi-ty programs was stable across the period. Averageage was between 16.8 and 17.0 each year.
• Gender. Relative number of girls admitted tocommunity programs trended downward acrossthe period. The high for the period was 19.0% inFY 2007; the low was 12.9% in FY 2012. Relativenumbers of girls dropped by 25.4% between thefi rst and last years of the period.
• Race & Ethnicity. The relative number of mi-nority youths admitted to community programstrended upward across the period. The lowestproportion was 36.8% in FY 2008; the highest was43.4% in FY 2015. Between the fi rst and last yearsof the period there was an increase of 11.0%. Mi-nority youths account for about 25.0% of Utah's10-17 year old youths.
Budget• Expenditures. Community program expendi-
tures declined by 44.0% across the period (see chart at center right). In part, this was the result of changes in Medicaid billing requirements over the past 7 years (see "Budget," page 13). Over the same period, the Division's overall expenditures declined by 7.3%.
Delinquency History• Overall offenses. Yearly average number of felony-
and misdemeanor-type convictions at the time of admission trended downward across the period (see chart at bottom right). The high was 9.0 in FY 2007; the low was 6.9 in FY 2016. Between the fi rst and last years of the period there was a decrease of 22.6%.
AVERAGE NIGHTLY BED COUNT
BUDGET
DELINQUENCY HISTORY
0
200
400
600
800
1,000
2007 2008 2009 2010 2011 2012 2013 2014 2015 2016
YOUTHS
Nightly Count
0
25
50
75
100
125
2007 2008 2009 2010 2011 2012 2013 2014 2015 2016
Community Programs
MILLIONS ($)
All Division Programs
0
5
10
15
20
25
2007 2008 2009 2010 2011 2012 2013 2014 2015 2016
CONVICTIONS

64 Community Programs

65Secure Facilities
Secure Facilities
Secure care facilities provide long-term confi nement for the most serious youth offenders. Youths are commit-ted to secure care for an indeterminate period by order of the Juvenile Court. After commitment, oversight passes to the Youth Parole Authority (see “Youth Parole Authority,” page 71). The Authority (1) reviews and orders treatment plans; (2) determines requirements for release, including length of stay; (3) conducts regular progress reviews; (4) grants permission for short-term "trial placements" back into the community near the end of secure placement; and (5) authorizes termination of custody for youths who complete programming.
The overall goal of secure care is the successful reintegration of youths in the community. Case manag-ers work with facility and transition workers to provide quality treatment grounded in evidence based principles. Youths are given the opportunity to change their lives by developing skills to address the social, educational, and other criminogenic factors identifi ed as contributing to their delinquency. Specialized programming also is available for girls, youths with substance use problems, and youths who have offended sexually. Youths may also participate in work projects for wages that are used to pay restitution to their victims. All youths also are required to attend school or participate in a vocational program. Educational ser-vices are provided through Youth in Custody programs (YIC; see “Educational Services,” page 83). YIC teachers hold classes on weekdays in the facilities. During the
2015 - 2016 school year, 63 youths from the Divisions six secure facilities graduated from high school. Through the collaborative work effort and funding with YIC/Ne-glected and Delinquent Grant all youth and graduates have the opportunity to earn certifi cates in (1) Alive at 25, (2) Fire Extinguisher, (3) First Aid/CPR, (4) Flagger, (5) Food Handling, (6) ServSafe, (7) OSHA, (8) Work-Keys, (9) Bike Collective Repair, (10) ACT 90-Hour Basic Construction Course, and (11) various courses pro-vided by Weber State University. Youths also have the opportunity to learn a musical instrument. A number of important efforts are made to provide normal adolescent development opportunities for youths in secure care. For example, all six facilities participate in a competitive athletic league. Youths who wish to compete as part of their facility's team must meet educa-tion and behavior standards set by the league. The team mascots are Mill Creek Mavericks, Southwest Immor-tals, Slate Canyon Spartans, Wasatch Wolves, Decker Lake Ducks, and Farmington Blitz. The experience has been extremely well received by youths, their families, and staff. During FY 2016, teams competed in basket-ball, fl ag football, volleyball, and table tennis. Additional support for youths is provided by community volunteers who provide religious services and programming from a variety of denominations to youth who wish to partici-pate. Volunteers are also trained to provide tutoring to youths with a low reading level. The chart at top right represents the statewide aver-age nightly bed count in secure facilities for each month
QUICK FACTSSECURE FACILITIES
NUMBER OF PROGRAMS......................................6
BEDS (10 FEMALE, 176 MALE) .......................186
NEW COMMITMENTS...................................... 113
DIFFERENT YOUTHS SERVED ..............................232
AVERAGE NIGHTLY BED COUNT ..................... 102.8
AVERAGE STAY (PER ADMISSION) ...................5.0 MO
DAILY COST PER BED .............................. $246.13
AVERAGE NIGHTLY BED COUNT
0
60
120
180
240
300
Jul | Jan2014
Jul | Jan2015
Jul | Jan2016
Jul |
Nightly Bed Count
Capacity
YOUTHS

66 Secure Facilities
between July of 2013 (FY 2014) through September of 2016 (FY 2017). The capacity line identifi es the number of available secure beds during the same period. Yearly average nightly count was 144.5 in FY 2014, 120.9 in FY 2015, and 102.8 in FY 2016. It should be noted that attempts are made to keep a minimum of 10% of beds open for safety reasons. Open beds allow rapid placement back to the facility when
youths who have been on trial placement are returned to the facility. This sometimes happens because youths struggle adhering to their transition plans as a result of substance use relapse, tension with families, and prob-lems with employment or school. The strategy also provides fl exibility for managing diverse populations. Youths at high risk can more easily be housed in ways that protect youths, staff, and the community.
Use of Secure Care Facilities During FY 2016.
Facility CapacityYouths Served 1 Admits
Nightly Bed
Count
Nights Over
Capacity
MeanLength of Stay 2
OFFICE OF CORRECTIONAL FACILITIES
FARMINGTON BAY YOUTH CENTER 3 10 12 15 5.5 0.0% 134.5
MILL CREEK YOUTH CENTER 3 58 82 98 32.4 0.0% 121.2
WASATCH YOUTH CENTER 46 54 40 21.6 0.0% 197.3
DECKER LAKE YOUTH CENTER 30 47 52 17.5 0.0% 123.1
SLATE CANYON YOUTH CENTER 32 40 29 18.0 0.0% 226.7
OFFICE OF RURAL PROGRAMS
SOUTHWEST UTAH YOUTH CENTER 10 21 13 7.9 0.0% 221.6
TOTAL 186 232 247 102.9 - 152.4
1 “Youths Served” is an unduplicated count per facility. “TOTAL” of “Youths Served” is an unduplicated count for the entire system.2 “Length of Stay” estimated using Stock / Flow Ratio: ([Nightly Bed Count]/[Admits])*([Days per Fiscal Year]); Butts, J. & Adams, W. Anticipating space needs in juvenile detention
and correctional facilities. OJJDP Juvenile Justice Bulletin, March 2001, Washington, DC: Office of Juvenile Justice and Delinquency Prevention, US Department of Justice.3 Mill Creek Youth center closed a 16-bed unit on 1/15/2015; the 10-bed girls unit was moved from Mill Creek Youth Center to Farmington Bay Youth Center on 10/9/2015.
0
200
400
600
800
1,000
1,200
1,400
0 200 400 600 800 1,000 1,200 1,400
GUIDELINE DAYS
ACTUAL DAYS
Youths committed to secure care receive a suggested guideline
that targets their likely length of stay (Guideline). The chart at left
represents Guidelines for incarceration compared to actual days in
incarceration for 110 youths released from secure care during FY 2015
and FY 2016.
“Actual Days” includes time in a secure placement (secure facility and/
or locked detention), but excludes time in the community on trial
placement.
The majority (81.8%) of Actual Days were as long or longer than
Guidelines. Overall average guideline was 8.8 months; average time in
secure confi nement was 12.6 months.
GUIDELINE VERSUS SECURE STAY

67Secure Facilities
Youths placed in secure care had extensive histories of interventions
and placements in Division programs. All (100.0%) had been placed in
locked detention; 68.8% had been placed in observation and assess-
ment (O&A); and 73.7% had been placed in a community residential
program (Community Program). Further, 66.0% had previously been
AWOL from one or more Division placements.
Though not shown on the chart, most of these youths also had
received services from other agencies in Utah’s juvenile justice system:
70.4% had been on probation supervision, 32.8% had been in the
custody or under supervision of the Division of Child and Family Ser-
vices, and 82.2% previously had one or both of these types of care.
Youths admitted to secure care had an average of 11.8 felony- and
misdemeanor-type convictions. The great majority of these (81.3%)
were offenses against property or public order. Only 18.7% of prior
offenses were misdemeanor- and felony-type offenses against people.
Though not shown on the chart, these youths were fi rst found delin-
quent at an average age of 12.7; 79.4% of them were between 10
and 14 at the time of their fi rst delinquency.
DELINQUENCY HISTORY
PLACEMENT HISTORY
0
2
4
6
8
10
Person Property Public Order
CONVICTIONS
0% 20% 40% 60% 80% 100%
AWOL
Jail
Secure Facility
Community Program
O & A
Home Detention
Locked Detention
YOUTHS
Youths at Mill Creek Youth Center paraticipating in a Post Secondary Education project.
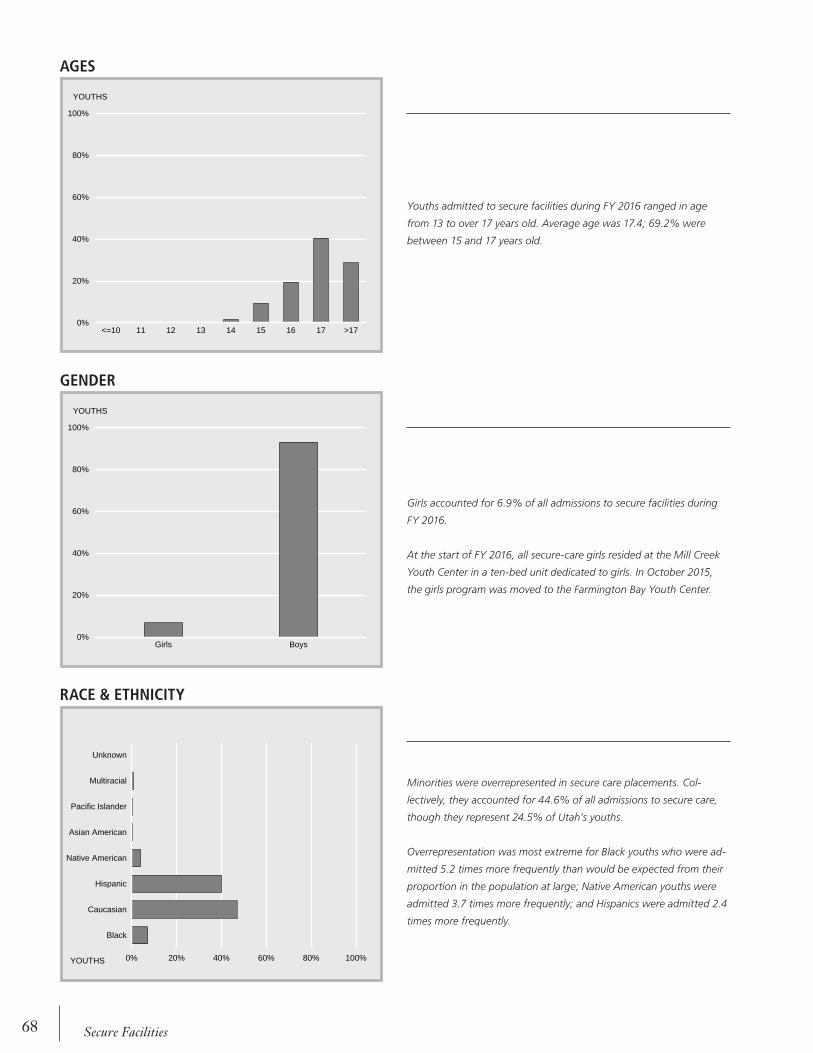
68 Secure Facilities
Youths admitted to secure facilities during FY 2016 ranged in age
from 13 to over 17 years old. Average age was 17.4; 69.2% were
between 15 and 17 years old.
Girls accounted for 6.9% of all admissions to secure facilities during
FY 2016.
At the start of FY 2016, all secure-care girls resided at the Mill Creek
Youth Center in a ten-bed unit dedicated to girls. In October 2015,
the girls program was moved to the Farmington Bay Youth Center.
Minorities were overrepresented in secure care placements. Col-
lectively, they accounted for 44.6% of all admissions to secure care,
though they represent 24.5% of Utah’s youths.
Overrepresentation was most extreme for Black youths who were ad-
mitted 5.2 times more frequently than would be expected from their
proportion in the population at large; Native American youths were
admitted 3.7 times more frequently; and Hispanics were admitted 2.4
times more frequently.
AGES
GENDER
RACE & ETHNICITY
0%
20%
40%
60%
80%
100%
<=10 11 12 13 14 15 16 17 >17
YOUTHS
0%
20%
40%
60%
80%
100%
Girls Boys
YOUTHS
0% 20% 40% 60% 80% 100%
Black
Caucasian
Hispanic
Native American
Asian American
Pacific Islander
Multiracial
Unknown
YOUTHS

69Secure Facilities
AVERAGE NIGHTLY BED COUNT
BUDGET
DELINQUENCY HISTORY
10-Year Trends (FY 2007 - FY 2016)
Demographics• Nightly Bed Count. The yearly average number of
youths in secure care each night fell across the 10-year period (see chart at top right). The high was 196.9 in FY 2008; the low was 113.8 in FY 2016. The yearly average dropped by 32.0% between the fi rst and last years of the 10-year period Utah's population of 10 to 17 year olds increased by 18.2% over the same time.
• Age. The average age of youths admitted to securecare was stable across the period. Average age wasbetween 17.1 and 17.4 each year.
• Gender. Relative numbers of girls admitted tosecure care dropped over the period. The highfor the period was 13.1% in FY 2007; the lowwas 6.9% in FY 2012. Relative numbers of girlsdropped by 47.5% between the fi rst and last yearsof the period.
• Race & Ethnicity. The relative number of minor-ity youths admitted to secure facilities trendedslightly upward across the period. The lowest pro-portion was 43.2% in FY 2007; the highest 59.3%in FY 2010. Between the fi rst and last years of theperiod there was an increase of 22.8%. Minorityyouths account for about 25.0% of Utah's 10-17year old youths.
Budget• Expenditures. Overall, secure facility expendi-
tures rose over the period (see chart at center right). Between the fi rst and last years of the period there was an increase of 8.3%. Over the same period, the Division's overall expenditures declined by 7.3%.
Delinquency• Overall offenses. The yearly average total number
of felony- and misdemeanor-type convictions at the time of admission varied from year to year, but ended about where it began (see chart at bottom right). Numbers were relatively stable over the fi rst 5 years of the period, ranging between 11 and 12 convictions each year. Total convictions dropped to a low of 10.0 in FY 2012 then rose to 11.9 in FY 2015 and 11.8 FY 2016.
0
60
120
180
240
300
2007 2008 2009 2010 2011 2012 2013 2014 2015 2016
Nightly Bed Count
YOUTHS
Capacity
0
25
50
75
100
125
2007 2008 2009 2010 2011 2012 2013 2014 2015 2016
Secure Care
MILLIONS ($)
All Division Programs
0
5
10
15
20
25
2007 2008 2009 2010 2011 2012 2013 2014 2015 2016
CONVICTIONS

70 Secure Facilities
0%
20%
40%
60%
80%
100%
2014Q2 2014Q3 2014Q4 2015Q1 2015Q2
PERCENT OF YOUTHS
0%
20%
40%
60%
80%
100%
2014Q2 2014Q3 2014Q4 2015Q1 2015Q2
PERCENT OF YOUTHS
0%
20%
40%
60%
80%
100%
2015Q2 2015Q3 2015Q4 2016Q1 2016Q2
PERCENT OF YOUTHS Performance Measures
All Division programs participate in an ongoing process of performance measurement. Measures are indicators of a program's successes and failures in meeting expecta-tions about the services it provides (Output Measures) and in achieving positive results for the clients it serves (Outcome Measures). Measures are developed from a basic goal statement. The shared goal for the Division's secure facilities, is to provide long-term locked confi ne-ment and services that address criminogenic needs of serious habitual delinquent youths who require removal from the community to curtail further delinquent activity and help them prepare to reintegrate to the community.
Output measures document the program's service delivery efforts. This includes the workload measures for number of youths served and average length of stay described on previous pages of this Chapter. Other mea-sures under development include the number of oppor-tunities provided to youths to help them meet restitution and community service obligations and efforts made to address youths' criminogenic issues.
Outcome measures include both short- and long-term indicators of whether a program is achieving desired results. The chart at top left represents the percentages of youths who were free from a new felony- or misde-meanor-type charge while enrolled in a secure facility during specifi ed quarters. Overall, 97.2% of youths avoided a new charge. Percentages ranged from a low of 95.1% in the fi rst quarter of 2016 (2016Q1) to a high of 98.8% in the third quarter of 2015 (2015Q3). Though not shown, overall, 98.1% of youths enrolled in a secure facility avoided receiving a new felony-type charge dur-ing specifi ed quarters.
The chart at center left identifi es the percentages of youths who remained free of a new felony- or misde-meanor-type charge during the 360 days following re-lease from a secure facility. Overall, an average of 43.3% of youths were free of new charge. Values ranged from a low of 35.1% in the fourth quarter of 2014 (2014Q4) to 55.9% in the fi rst quarter of 2015 (2015Q1).
The chart at bottom left identifi es the percentages of youths who were free of a new felony-type charge dur-ing the 360 days following release from a secure facil-ity. Overall, 78.9% avoided a new felony charge. Values ranged from a low of 71.9% in the fourth quarter of 2014 (2014Q1) to 86.8% in the fi rst quarter of 2015 (2015Q1).
FREE OF CHARGES DURING PROGRAM
FREE OF CHARGES AFTER PROGRAM
FREE OF FELONIES AFTER PROGRAM

71Youth Parole Authority
The Authority's face-to-face contact with a youth be-gins at an initial hearing scheduled within 3 months of commitment. At this hearing, a suggested length of stay is established and other requirements and expectations are set for the youth's period of confi nement. Length of stay is set at a minimum of 4 to 8 months, but may be longer based on a youth’s delinquency history and the types of offenses leading to the commitment. Histori-cally, the Authority has held progress hearings at least once every 6 months with each youth to review progress and determine whether standards for confi nement were being met. A youth meeting confi nement standards is eligible for a parole hearing. As part of this process, a tentative date is set for release on parole. In addition, the youth typically is placed on a trial placement for up to 120 days outside the secure facility. During this time, the Youth Parole Authority may rescind the parole date and return the youth to a secure facility for violating the conditions of the trial placement. A youth who success-fully completes trial placement and signs a parole agree-ment is paroled. During parole, the Youth Parole Authority has statutory responsibility to review allegations when a youth is suspected of violating conditions of parole. A youth who violates terms of parole may have his or her parole revoked and be returned to a secure facility. A youth successfully completing parole is discharged from Division custody. At any point along the way, a youth who is charged with new offenses will again come under jurisdiction of the court system. Depending on the exact circumstances, he or she may be recommitted to secure
Initial19.0%Progress
33.7%
Parole Review21.7%
Revocation2.0% Rescission
4.7%
Discharge18.8%
YOUTH PAROLE AUTHORITY HEARINGS
Youth Parole Authority
Youths committed to the Division by the Juvenile Court for secure care come under the jurisdiction of the Youth Parole Authority (Authority; UCA 62A-7-502(1)). The Authority provides an objective hearing process for youthful offenders to ensure fairness to the youth and provide protection for the community.
Authority members are citizens appointed by the Governor and confi rmed by the Utah Senate. Members represent the diversity of Utah’s population and speak on behalf of stakeholders across the state. Currently, three Authority members are assigned for each hearing and decisions are made by majority vote. The Authority is authorized by statute to have ten full members and fi ve pro tempore members. An Administrative Offi cer, who is a Division employee, acts as a resource to Authority members, manages the Authority’s administrative offi ce, and supervises two hearing offi cers and one executive secretary. Prior to hearings, Youth Parole Authority Members are provided with information collected from Division staff, police, and the Juvenile Court. The Youth Parole Authority provides a formal hear-ing procedure that defi nes a youth’s obligations during secure care and parole. Hearings are held at each of the Division’s six secure care facilities. The chart at top right identifi es the types of hearings and the percentage held for each during FY 2016. Overall, the Authority con-ducted 552 hearings during the year, a decrease from 567 in FY 2015.
YOUTH PAROLE AUTHORITY MEMBERS
RICK WESTMORELAND CHAIR ............ OGDENSHARLENE CHRISTENSEN VICE CHAIR ... OREMMYRON BENSON ........................... NEWTONALVIN EMERY, ............................. DRAPERFERRIS GROLL ............................... PROVIDENCEMARGARET JACKSON ...................... LAYTONBEATRICE MARTINEZ ....................... LAYTON LYNN STEWART, ............................ MIDVALEATHELIA WOOLLEY ......................... HOLLADAY (ONE VACANT POSITION)
MEMBERS PRO TEMPOREMITCHELL SIX ............................... ST. GEORGE (FOUR VACANT POSITIONS)
Percentages are based on 552 hearings held during FY 2016.
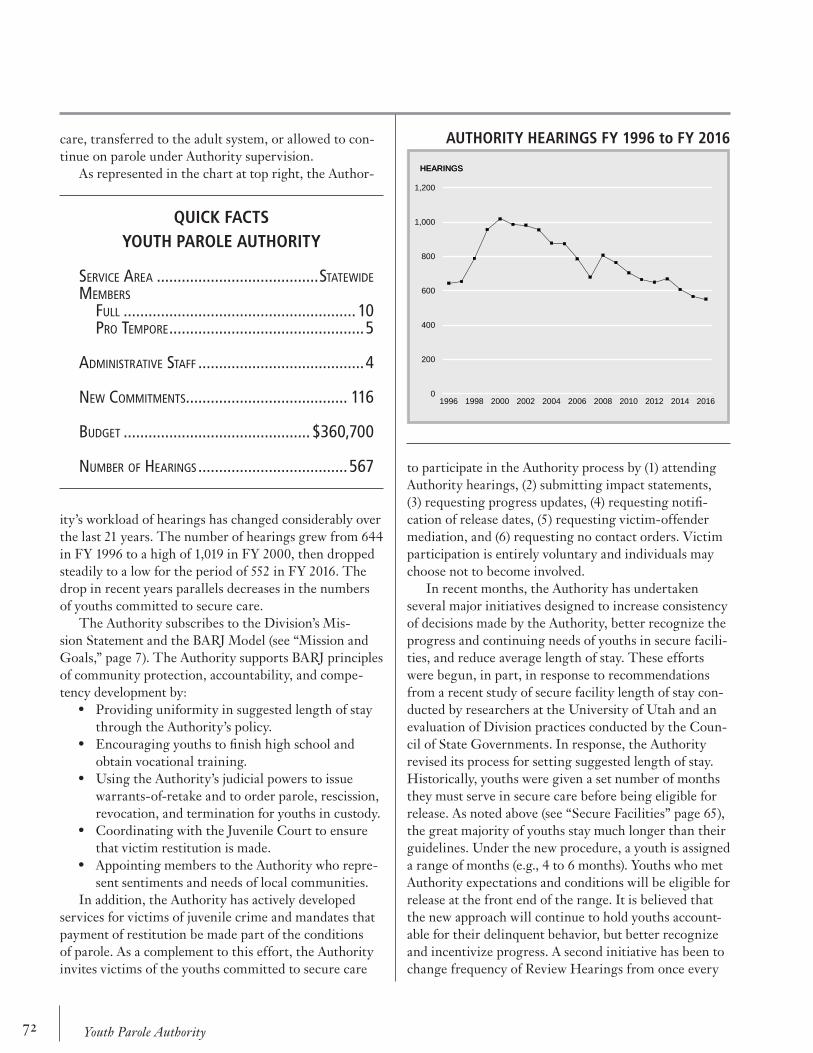
72 Youth Parole Authority
care, transferred to the adult system, or allowed to con-tinue on parole under Authority supervision.
As represented in the chart at top right, the Author-
ity’s workload of hearings has changed considerably over the last 21 years. The number of hearings grew from 644 in FY 1996 to a high of 1,019 in FY 2000, then dropped steadily to a low for the period of 552 in FY 2016. The drop in recent years parallels decreases in the numbers of youths committed to secure care. The Authority subscribes to the Division’s Mis-sion Statement and the BARJ Model (see “Mission and Goals,” page 7). The Authority supports BARJ principles of community protection, accountability, and compe-tency development by:
• Providing uniformity in suggested length of staythrough the Authority’s policy.
• Encouraging youths to fi nish high school andobtain vocational training.
• Using the Authority’s judicial powers to issuewarrants-of-retake and to order parole, rescission, revocation, and termination for youths in custody.
• Coordinating with the Juvenile Court to ensurethat victim restitution is made.
• Appointing members to the Authority who repre-sent sentiments and needs of local communities.
In addition, the Authority has actively developed services for victims of juvenile crime and mandates that payment of restitution be made part of the conditions of parole. As a complement to this effort, the Authority invites victims of the youths committed to secure care
to participate in the Authority process by (1) attending Authority hearings, (2) submitting impact statements, (3) requesting progress updates, (4) requesting notifi -cation of release dates, (5) requesting victim-offender mediation, and (6) requesting no contact orders. Victim participation is entirely voluntary and individuals may choose not to become involved. In recent months, the Authority has undertaken several major initiatives designed to increase consistency of decisions made by the Authority, better recognize the progress and continuing needs of youths in secure facili-ties, and reduce average length of stay. These efforts were begun, in part, in response to recommendations from a recent study of secure facility length of stay con-ducted by researchers at the University of Utah and an evaluation of Division practices conducted by the Coun-cil of State Governments. In response, the Authority revised its process for setting suggested length of stay. Historically, youths were given a set number of months they must serve in secure care before being eligible for release. As noted above (see “Secure Facilities” page 65), the great majority of youths stay much longer than their guidelines. Under the new procedure, a youth is assigned a range of months (e.g., 4 to 6 months). Youths who met Authority expectations and conditions will be eligible for release at the front end of the range. It is believed that the new approach will continue to hold youths account-able for their delinquent behavior, but better recognize and incentivize progress. A second initiative has been to change frequency of Review Hearings from once every
AUTHORITY HEARINGS FY 1996 to FY 2016
0
200
400
600
800
1,000
1,200
1996 1998 2000 2002 2004 2006 2008 2010 2012 2014 2016
HEARINGSHEARINGS
QUICK FACTSYOUTH PAROLE AUTHORITY
SERVICE AREA .......................................STATEWIDEMEMBERS FULL ........................................................ 10 PRO TEMPORE ...............................................5
ADMINISTRATIVE STAFF ........................................4
NEW COMMITMENTS....................................... 116
BUDGET ............................................. $360,700
NUMBER OF HEARINGS ....................................567

73Youth Parole Authority
6 months to once every 3 months. It is believed that this will make the Authority more responsive to the prog-ress youths are making and their continuing needs for service. A third initiative supported by the Authority is the adoption of a new rating model to be used by staff in secure care facilities to better evaluate the progress youths are making in meeting their programming goals.
The new approach is expected to provide a more objec-tive basis for measuring progress and help standardize approaches used in different secure facilities. Staff will be better able to match the youth’s progress based on concrete criteria, and all secure facilities will rate youths in a similar manner.

74 Youth Parole Authority

75Division Bureaus
The Division's three Bureaus are attached to the State Administrative Offi ce in Salt Lake City and super-vised by the Division Director. Bureaus work with one another and the Division's four service delivery offi ces to enhance service delivery to youths in care. All are guid-ed by the Division's Mission and its three primary goals of (1) improving short-term and long-term outcomes for our youths; (2) supporting families in the rehabilitation process; and (3) improving the safety, security and mo-rale of Division employees and youths in Division care (see “Mission and Goals,” page 7).
Training Bureau
The Training Bureau directly provides and arranges training events that help staff develop the professional-ism and skills necessary for proper care of youths in the Division’s programs and facilities. Training Bureau staff includes a Director, four training specialists, a Family Engagement Specialist (TANF funded) and an adminis-trative assistant. During FY 2016, the Bureau supported 751 training sessions on mandatory topics, 288 in-service training events and 5 outside conferences. Collectively these courses provided over 74,422 hours of individual train-ing. Details of mandatory training held in FY 2016 are described in the table on the following page. Training was directly provided by a variety of groups includ-ing Bureau staff members, other Division employees, the Department of Human Services, state and national
Division Bureaus
organizations, local colleges and universities, and private vendors.
Mandatory Training. New, full-time employees are re-quired to complete the Division’s 40 hour, BasicOrientation Academy during their fi rst year of employ-ment. During FY 2016, 4 academies were held and 125 new employees trained. Following their fi rst year of employment, employees who provide services to youths are required to complete mandatory in-service train-ing each year including online training. Other full- and part-time employees receive training that is appropriate to their duties.
Family Engagement Specialist. For 10 months during this fi scal year, funding has been available through a TANF grant that allowed the Bureau to hire a Family Engage-ment Specialist. One of the Division's primary goals is to Support youth and families in the rehabilitation process. Efforts of the Family Engagement Specialist have been instrumental in enhancing the Division's efforts in this area. The Specialist provided training in how to conduct Child and Family Team Meetings and on the Strength-ening Families Curriculum across the state. The Specialist also spent looking at policies and orientation materials for youths and families in an effort to make these documents easier to understand to help families navigate the system more successfully.Cache Valley Youth Center Wishing Tree ceremony for the facility’s new
chapel opening.
Nondenominational chapel at Decker Lake Youth Center supported by volunteer efforts.
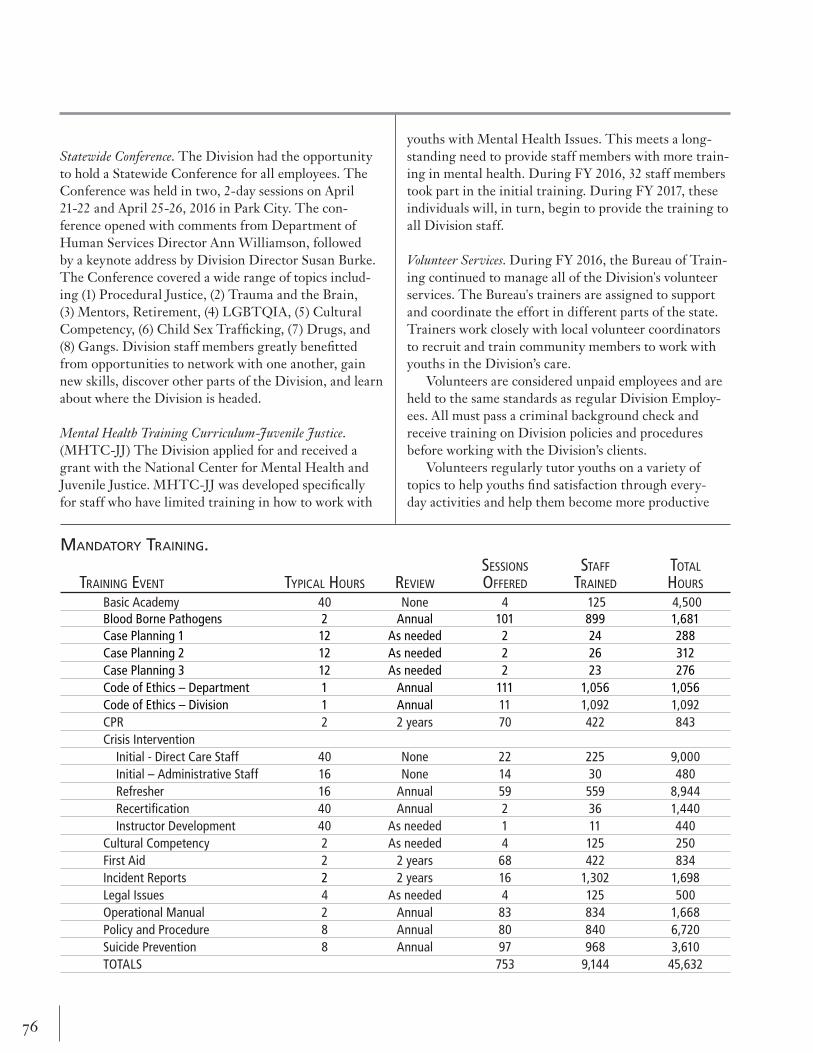
76 Division Bureaus
Statewide Conference. The Division had the opportunity to hold a Statewide Conference for all employees. The Conference was held in two, 2-day sessions on April 21-22 and April 25-26, 2016 in Park City. The con-ference opened with comments from Department of Human Services Director Ann Williamson, followed by a keynote address by Division Director Susan Burke. The Conference covered a wide range of topics includ-ing (1) Procedural Justice, (2) Trauma and the Brain, (3) Mentors, Retirement, (4) LGBTQIA, (5) Cultural Competency, (6) Child Sex Traffi cking, (7) Drugs, and (8) Gangs. Division staff members greatly benefi tted from opportunities to network with one another, gain new skills, discover other parts of the Division, and learn about where the Division is headed.
Mental Health Training Curriculum-Juvenile Justice. (MHTC-JJ) The Division applied for and received a grant with the National Center for Mental Health and Juvenile Justice. MHTC-JJ was developed specifi cally for staff who have limited training in how to work with
youths with Mental Health Issues. This meets a long-standing need to provide staff members with more train-ing in mental health. During FY 2016, 32 staff members took part in the initial training. During FY 2017, these individuals will, in turn, begin to provide the training to all Division staff.
Volunteer Services. During FY 2016, the Bureau of Train-ing continued to manage all of the Division's volunteer services. The Bureau's trainers are assigned to support and coordinate the effort in different parts of the state. Trainers work closely with local volunteer coordinators to recruit and train community members to work with youths in the Division’s care. Volunteers are considered unpaid employees and are held to the same standards as regular Division Employ-ees. All must pass a criminal background check and receive training on Division policies and procedures before working with the Division’s clients. Volunteers regularly tutor youths on a variety of topics to help youths fi nd satisfaction through every-day activities and help them become more productive
MANDATORY TRAINING.
TRAINING EVENT TYPICAL HOURS REVIEWSESSIONSOFFERED
STAFFTRAINED
TOTALHOURS
Basic Academy 40 None 4 125 4,500Blood Borne Pathogens 2 Annual 101 899 1,681Case Planning 1 12 As needed 2 24 288Case Planning 2 12 As needed 2 26 312Case Planning 3 12 As needed 2 23 276Code of Ethics – Department 1 Annual 111 1,056 1,056Code of Ethics – Division 1 Annual 11 1,092 1,092CPR 2 2 years 70 422 843Crisis Intervention Initial - Direct Care Staff 40 None 22 225 9,000 Initial – Administrative Staff 16 None 14 30 480 Refresher 16 Annual 59 559 8,944 Recertifi cation 40 Annual 2 36 1,440 Instructor Development 40 As needed 1 11 440Cultural Competency 2 As needed 4 125 250First Aid 2 2 years 68 422 834Incident Reports 2 2 years 16 1,302 1,698Legal Issues 4 As needed 4 125 500Operational Manual 2 Annual 83 834 1,668Policy and Procedure 8 Annual 80 840 6,720Suicide Prevention 8 Annual 97 968 3,610TOTALS 753 9,144 45,632

77Division Bureaus
citizens when they return to the community. Volunteers also provide opportunities for youths to attend Sunday worship services, participate in scouting activities and serve as mentors for youths who are returning to the community. During FY 2016, volunteers made over 21,289 visits to Division facilities and programs and con-tributed over 51,900 hours of service. At a rate of $14.00 per hour, this represents a contribution of over $726,609 to the Division. The volunteer services effort also helps identify work projects within the community that can involve youths in Division care. Participation in such projects allows youths to give back to the community and demonstrate accountability for their actions. Projects also provide opportunities for youths to develop skills and knowledge that will increase the likelihood of their becoming law-abiding and productive citizens. During FY 2016, youths participating in work projects completed over 67,776 hours of community service and restitution. Based on minimum wage ($7.25/hr), this represents a return to the community of over $491,376. Volunteer services also managed monetary donations to the Division. During FY 2016, community members made monetary and in-kind donations valued at over $246,985.
Speaker's Bureau. The Training Bureau also administers the Division's Speakers Bureau. The Speakers Bureau arranges for Division staff members to present to groups in the community interested in learning more about Utah's juvenile justice system and the Division's pro-grams. Presentations typically last an hour and may in-clude a period for interaction with the audience. Speaker Bureau presentations can be arranged for groups any-where in Utah.
Research and Evaluation Bureau
The Research and Evaluation Bureau was developed to promote closer working relationships between existing workgroups for Research, Quality Assurance (QA), and Quality Service Review (QSR). During, FY 2015, the Bureau took responsibility for an additional function. The Investigations Bureau was merged with the Bureau's Quality Assurance workgroup.
Research. The Research workgroup includes a staff of two individuals. The function directly supports the
Division's goal of improving short- and long-term outcomes for youth. Research has responsibility for conducting and overseeing research and program evaluation involving Division clients, programs, and staff. A key part of this responsibility has been the maintenance and development of Utah’s centralized juvenile justice database (see “Court & Agencies’ Record Exchange (CARE),” page 87). During FY 2016, Research also helped the Division meet a variety of other service, research, and informa-tion needs. On a daily basis, the group supplied Division staff with reports, answers to queries, technical support, and research. The Research workgroup also produced the Division’s Annual Report. Members of the group served on (1) the Division's Case Planning Tool Com-mittee, (2) the Department's Institutional Review Board (IRB), (3) the Division's CARE User Group, (4) the De-partment of Human Services Information Technol-ogy Committee, and (5) the Department of Workforce Services Intergenerational Poverty Data Committee. Further, the group assisted numerous researchers from local colleges and universities, other government agen-cies, and private individuals with information regarding Utah’s juvenile justice system. Notably, during FY 2016, the Research workgroup collaborated with research-ers at the Juvenile Court to conduct a re-validation of Utah's risk assessment tools (see "Protective and Risk Assessment," page 86). In a second signifi cant collabora-tion with the Juvenile Court, Bureau researchers helped collect much of the delinquency history and service data used by the Utah Juvenile Justice Workgroup during it's review of Utah's juvenile justice system (see "Juvenile Justice Workgroup," page 81).
Quality Assurance (QA). The Division is dedicated to providing comprehensive and quality services for Utah's youths within the framework of the Division's Mission. The QA unit's staff of one audit manager and four audi-tors helps meet this goal by monitoring youth programs to ensure that youths are placed appropriately without compromising the safety and the health of the commu-nity or the youth. A major part of the QA unit's work involves monitor-ing contracts to determine whether providers are meet-ing the requirements of Division contracts for services. Overall, during FY 2016, the QA conducted 176 audits. This includes 28 audits for residential programs, 46 au-dits for proctor providers, 65 audits for outpatient mental

78 Division Bureaus
(3) service planning, (4) plan implementation, and (5) discharge planning.
Internal Investigations. The Investigations workgroup analyzes, records, and conducts follow up review when notifi ed of incidents involving Division staff or youths under Division care. Practices are governed by the Divi-sion's incident reporting policy and procedure and the Incident Report Reference Guide. All Division employees and contracted providers are required to fi le incident re-ports for any unusual, non-routine, or potentially threat-ening event. An incident report that appears to involve violations of the Division's Code of Ethics or Policy and Procedure or federal, state or local laws are forwarded to Division Administration and, on direction from Admin-istration, will result in an internal investigation. When internal investigations are necessary, a report of fi ndings provides factual support for a determination of whether the case is true.
As a complement to these activities the Investigations workgroup takes an active part in providing regular training on the requirements for incident reporting. During the year, the workgroup conducted multiple training sessions for Division staff and contracted pro-viders. Beginning in FY 2015, in collaboration with the De-partment's Division of Technology Services, the work-group helped deploy a centralized information system to manage the incident reporting process. The project is based on an electronic form that can be accessed by workers in any of the Division's offi ces, programs, and facilities. Reports submitted by a worker are automati-cally forwarded to that worker's supervisor for review and approval. In addition, fi nalized reports are stored in a database that is available to workgroup staff members and Division administration. Work with the system continued during FY 2016. The resource has been a signifi cant aid making the Bureau's work more effi cient and is leading to better understanding of problem situations involving Division staff and youths in Division care.
Clinical Services Bureau
The Clinical Services Bureau has been in operation since July of 2004. It was developed as part of the Divi-sion’s efforts to upgrade the quality of services in locked detention and secure facilities. Clinicians deliver services including mental health, substance abuse assessments,
health services, and 37 audits for vendors. The QA unit also has responsibility for monitoring programs and facilities directly operated by the Division. Evaluations assess program compliance with the Division's written standards, policies, and procedures. Auditors review personnel fi les, training records, pro-gram services, control logs, and other local documents to make their determinations. Recommendations are made for improving facility operations and programs. During FY 2016, 9 facility audits were completed. During FY 2016, one quality assurance staff member was responsible for monitoring facilities in Utah such as juvenile detention centers, juvenile correctional facilities, adult jails, and adult lockups that might securely hold juveniles pursuant to public authority to ensure Utah’s compliance with the Juvenile Justice and Delinquency Prevention Act (JJDP Act). The core requirements of the JJDP Act are (1) deinstitutionalization of status offenders and non offenders, (2) removal of juveniles from adult jails and adult lockups, and (3) sight and sound separa-tion of juvenile detainees from adult offenders. Intensive monitoring efforts have helped Utah achieve compliance with these obligations. Success in this effort enhances protection of youths and the community and makes Utah eligible for federal grants that assist in the development and operation of many essential programs for youths.
Quality Service Review (QSR). The QSR work group performs regular assessments of the quality of service delivery for case managed youths. Annually, a single case is randomly selected from the case loads of each of the Division's 70 case managers. The process includes in-depth reviews of these individual cases to assess how well service systems address the needs of the client and how the youth and family benefi t from services they receive. Input for each case is sought from multiple stakeholders, including the youth, parents, case managers, therapists, contracted service providers, and providers from other agencies. Reports developed from the process provide an overview of current client status, strengths to build on, and weaknesses that should be addressed. Evaluations are guided by a case review instru-ment that covers a number of client status and system performance indicators. Client status indicators in-clude (1) safety, (2) accountability, (3) youth well-being (emotional and physical health, and learning progress), (4) stability, and (5) family functioning. System perfor-mance indicators include (1) teaming, (2) assessment,
79Division Bureaus
and crisis intervention to youths and their families, provide clinical consultation, and train Division staff about mental health issues. This helps to develop mental health, gender responsive, and gender-specifi c programs and treatment services. Clinicians work to create trauma informed environments in all Division programs. Secure facilities have increased therapeutic services and now have eleven mental health therapists working in these facilities. Bureau staff members work with case manag-ers to identify and reduce criminogenic risks that lead to recidivism and respond to the needs of individual youth
and their families. In the 12 years since the Bureau was created, its ac-tivities have been extended to non-secure programs op-erated by the Offi ce of Early Intervention Services and the Offi ce of Rural Programs. To help meet growing obligations for clinical services, an additional therapist position was added, during FY 2016, bringing the total to nine clinicians assigned to non-secure programs. Bureau clinicians also serve on the Division’s Evi-dence Based Practices Committee and other Division and Department work groups.

80 Division Bureaus
81Recent and Ongoing Projects
Recent and Ongoing Projects
Utah Juvenile Justice Working Group
At the request of the Governor Gary Herbert, Chief Jus-tice Matthew Durrant, House Speaker Gregory Hughes, and Senate President Wayne Niederhauser, in June 2016, the Utah Juvenile Justice Working Group undertook a data-driven, research-based assessment of the Utah's juvenile justice system. This assessment included an extensive review of court and juvenile service data, an examination of current research on reducing recidivism, and feedback from 32 stakeholder roundtables held across the state. The Working Group consisted of 19 members representing judges, prosecutors, defense attorneys, law enforcement, the Administrative Offi ce of the Courts, the Department of Human Services' Divisions of Ju-venile Justice Services (JJS), Child and Family Services (DCFS), and Substance Abuse and Mental Health, Utah legislators from both chambers, and other juvenile justice stakeholders. The Group reached consensus on 55 policy recommendations. If adopted, recommendations would (1) promote public safety, (2) continue to hold juvenile offenders accountable, (3) control costs, and (4) improve recidivism and other outcomes for youths, families, and communities. The policies were later approved by the Utah Commission on Criminal and Juvenile Justice.
Key Findings. • A lack of statewide standards leads to inconsistent
responses and disparate outcomes. Disparities by race and geography persist at every stage of the system and are most pronounced for youth removed from their homes.
• Most youth who enter the system are low-level of-fenders. The majority of referrals into the juvenile justice system are for misdemeanor offenses, and more than 80 percent of youth entering the court system for the fi rst time present a low risk to reof-fend.
• Lower-level offenses drive most fi rst-time, out-of-home placements. A high proportion of youth removed from the home for the fi rst time only have misdemeanor or status offense charges in their histories. Research shows that out-of-home placement does not reduce recidivism for most youth and may increase it for youth at a low risk to public safety.
• Youth remain stalled in the system for long periods
due to court-ordered conditions such as fi nan-cial obligations. Youth placed on probation or in custody spend approximately three years on aver-age monitored by the court. Stakeholders report that youth face excessive fi nancial obligations despite research showing that such obligations can extend length of stay, increase recidivism, and contribute to racial disparities.
• Affordable, accessible services that keep familiesintact and effectively hold youth accountable are largely unavailable to the courts across the state. Judges, probation offi cers, and other stakeholders reported that high-quality, affordable services for youth living at home that reduce reoffending and strengthen families are not available or accessible across the state.
• Out-of-home placement costs up to 17 times morethan community supervision, but results in similar rates of re-offending. Community supervision costs up to $7,500 per youth per year compared to as much as $127,750 per year for some JJS out-of-home placements, but the rates of re-offense are very similar (more than 50% are convicted of another crime within 2 years).
• Youth often do not have defense representationwhen their liberty is at stake. Judges reported that most youth in the court system do not have legal representation through every stage of the court process.
Policy Recommendations. • Prevent deeper involvement in the juvenile justice
system for lower-level youth. 0 Expand effective early interventions to
strengthen families and improve outcomes by (1) increasing options for schools and law enforcement through investment in pre-court interventions and (2) establishing standards and criteria for pre-court diversions to ensure youth are held accountable through consistent and proportionate responses.
0 Target pre-adjudication detention to higher risk youth and develop local alternatives statewide by (1) focusing the use of secure detention on youth who pose the highest risk to public safety and incentivize the develop-ment and (2) using local alternatives for youth living at home.

82 Recent and Ongoing Projects
0 Ensure all youth receive legal counsel at every stage of the court process.
• Protect public safety by focusing system resources. 0 Prioritize use of state custody beds for youth
who pose the highest risk to public safety by (1) tailoring eligibility for removal from the home and establishing presumptions to limit the length of time youth may spend both out of home and under the court's jurisdiction, and (2) removing mandatory control-oriented probation conditions and allow courts to or-der special probation conditions in accordance with youths' individualized risk and needs.
0 Strengthen community supervision to keep families united and hold youth accountable at home by (1) expanding access in every judicial district to evidence based practices shown to strengthen families and reduce reoffending and (2) increasing the use of structured deci-sion making to ensure the right youth receive the right level of supervision and services for the right amount of time.
• Sustain improved outcomes through reinvestmentand increased accountability
0 Adopt performance based contracting by establishing a system to incentivize evidence-based programs and timelines, including incentives for programming in rural areas.
0 Increase effective training and ensure greater system accountability by (1) expanding train-ing to increase consistency and reduce racial disparities across the system, (2) enhancing data collection and streamline reporting of appropriate performance measures, and (3) es-tablishing an inter-branch oversight entity to monitor policy implementation, develop performance measures, and review and report performance data to state leadership
0 Reinvest in evidence based alternatives to strengthen families and improve outcomes.
Impact of Policy Recommendations. If enacted, the policies will yield an estimated $58 million in averted costs from JJS and DCFS over fi ve years for reinvestment into a continuum of evidence based options that will enable the courts to effectively hold youth accountable with-out separating them from their families . The Working Group recommends that all of the averted costs from
reductions in out-of-home placement be reinvested into evidence based practices to reduce victimization, make Utah families stronger, and help youth become law-abid-ing, productive citizens.
JJS reform and adjustments to service delivery. The Divi-sion is proposing to advance the Juvenile Justice Working Group’s recommendations through reinvestment of funds to help youths and families achieve better outcomes by (1) reducing reliance on out-of-home care, (2) prioritiz-ing use of evidence based practices, (3) expanding youth services programs, receiving centers, and early interven-tion day treatment programs statewide, and (4) expand-ing home detention services and diversion to detention services to all judicial districts in the state. The Division is committed to providing opportuni-ties for employees to apply their skills in new settings and to build upon best practices for sustainable results with the aim of (1) enhancing the skills of staff for the better-ment of youths, families and communities, (2) phasing out residential observation and assessment and residential work program and reinvesting staff and resources into other Division programs and services, (3) improving programming for the continuum of services we provide by expanding our array of specialized services, including transition and aftercare services, and (4) expanding the Division's clinical capacity so that all facilities are able to address complex mental health issues for youths in care.
High school graduation ceremony at Slate Canyon Youth Center.

83Recent and Ongoing Projects
Computers, (8) Career Technical Education (CTE), and (9) Fine Arts. These schools also provide credit recovery options, special education services, basic skills remedia-tion in math and reading, tutoring, behavioral supports, and transition services with the assistance of Education Transition Career Advocates (ETCAs). If necessary, support also is provided to students who elect to ob-tain a GED while residing in a Division facility. Stu-dents receive regular standardized tests throughout the school year to assess student needs and academic gains. These assessments include Test of Adult Basic Educa-tion (TABE), and Student Assessment of Growth and Excellence (SAGE) tests, and other district required or approved measures. Students also have opportunities to prepare for and take the ACT college entrance exam. Youth in Care (YIC) school programs in secure settings offer all of the required classes necessary for graduation, blending both a traditional classroom setting with other district approved online, independent study and credit recovery study programs. Teachers use current evidenced based teaching strategies and interventions in collaboration with other therapeutic supports provided by the Division's treatment staff. Students placed in these facilities generally are not on track for graduation and have a variety of learning and skill defi ciencies. By the end of their stay in Division programs, most students leave with a high school diploma or are on track for graduation. Throughout the system, all YIC educational settings are staffed by highly qualifi ed and committed educators who strive to assist all students to fulfi ll their academic and social potential in a school and classroom setting that provides a variety of engaging learning opportunities found in a traditional public school setting. Professional and personalized supports promote a positive learn-ing environment that helps prepare students for success and life-long learning as they transition back to public schools or other post-secondary educational and training programs.
Center for Educational Excellence in Alternative Settings (CEEAS). CEEAS conducted a school climate survey in the Utah secure care facilities this year. This assessment provides objective data regarding student perceptions of the quality of their educational experience in facil-ity programs. The majority of students indicated posi-tive rankings in areas related to: feeling safe, respected and welcomed in school; understanding, helpful and caring teachers; the need to work hard and to do well
Educational Services
This school has answered many questions about things pertaining to my future plans and career. (Division Student)
The teachers are the best I’ve ever known. (Division Student)
I love interacting with the teachers here at this school.(Division Student)
The Utah State Board of Education (USBE) contracts with local school districts to provide educational services to all students in Division custody. The Utah Coordinat-ing Council for Youth in Care (UCCYIC), under the direction of the Department of Human Services and the USBE, has oversight responsibilities to ensure that high quality education is provided for all youths in state care. This includes providing (1) compulsory education that meets core curriculum and state graduation require-ments, (2) career and technical learning opportunities, (3) college and career readiness preparation, and (4) post-secondary studies and advancement. School funding is appropriated by the Legislature to provide free and appropriate education that meets all state and federal legal regulations and policies. This includes a provision for special education and other ser-vices for students with disabilities. Students in Division care receive a continuum of school services through their local school districts that provide teachers, administra-tive, and support staff in secure and residential treatment settings. Youths participating in mainstream school set-tings also have support from Check & Connect Mentors. The Check & Connect Mentor program is a nation-ally recognized mentoring program for at-risk students that encourages and supports educational success. Each school district that receives state funding is required to meet national accreditation standards. Compliance with these requirements is assessed on a regular basis by the USBE. These programs also are bound by statute to hold quarterly local interagency council meetings for strategic planning and fi scal oversight. School districts that have Division facilities or resi-dential treatment centers within their boundaries provide school for the students in those settings. School services include small group and individual instruction in core subject areas of (1) Math, (2) English, (3) Science, (4) Social Studies, (5) Health, (6) Physical Ed, (7) Use of

84 Recent and Ongoing Projects
academically; active participation and meaningful educa-tional activities that are interesting to the students; clarity regarding graduation requirements; and staff expecta-tions, encouragement and support that students continue their education after leaving the facility. Overall, 96% of the students in the Division's secure care facilities responded positively to the statement “I respect my class-mates when they work hard at school.”
Post-Secondary School Program. During the 2015 – 2016 school year, 63 students in secure care facilities earned high school diplomas. Students that remain incarcerated after earning a high school diploma or GED can partici-pate in post-secondary studies. Options include taking online college courses, participating in classes taught by a local applied technology college (ATC) instructor, and work-based, skill training opportunities that lead to in-dustry recognized certifi cations with the possibility of job placement (e.g., OSHA, Construction Trades, Lift Truck Operator, ServSafe, First Aid/CPR, Microsoft, & the ACT National Career Readiness Certifi cate). During FY 2016, 421 industry recognized certifi cates were earned by students in secure care facilities. An Education Transition Career Advocate expressed the important connection between these job related pre-sentations and industry-recognized certifi cation classes with future job placements in this way:
I have had presenters from the Forestry and Fire Departments talk to the youth about career options and bring the fi re truck. Two of the youth now want to go into Forestry and Firefi ghting and have plans to attend Job Corp for their courses. Four of our youth gained employment at restaurants who had their food handler permits and one of our youth is working at a solar wind mill farm. I have had a youth attend a well-known Barber school and two others are interested in getting their barber/cosmetology license. I just helped register one of our youth to attend Dixie University in St. George to study Computers/Web Design. I wish all these youth success and hope my ideas and presentations help send them in a good direction.
An Assistant Program Director at a secure care facil-ity stated "Job Certifi cations are good for building resumes and increasing youth confi dence.” This facility leader also indicated that staff “...loves the increases in reading that they are seeing with the U of U Reading Program.”
Collaborative Efforts – Working Together. The USBE and the Division work closely together and have established integrated programs, services and oversight to expand educational services and career training opportunities for students in Division care. This has encouraged a more productive and enriching learning environment for youths in care. More specifi cally, during FY 2016, this collaborative effort helped maintain and enhance many existing initiatives as well as establish the following new programs and community partnerships this year:
• Bicycle Mechanic Training and Certifi cation Part-nership
• Music Instruction and Performance Program• Digital Equity Pilot Project• U of U STEM Ambassadors Programs• Film SPARK Documentaries Curriculum• Wages: Working at Gaining Employability Skills
Training• SPARK Curriculum Implementation and Health
& Wellness Study for Youth in Secure CareFacilities
• Writing and Art Competitions Statewide - UntoldStories, Words Unlocked, YIC Art Show and theEmanuel Project.
A major focus of the collaboration between USBE and the Division this year has been on the development of a multi-agency alignment of transition services and the development of a data monitoring system to track the successful achievements of youths as they prepare re-enter the community. It is anticipated through this co-ordination of services that more students will experience the feeling of success and hope that was expressed by this student in transition:
I applied for a Dental Assistant Program at the Applied College, one of the careers we discussed. I was accepted this morning. Yes, my future is looking good, I hope. Thank you for helping me with resumes and career options. YOU ARE THE REASON WHY I AM ON THIS ROAD TO SUCCESS!! I wouldn’t have ever known how or why without your help. Thanks.
Quality Improvement
The Division's fi rst goal is to "Improve short-term and long-term outcomes for our youth." In FY 2012, the Division chartered the Evidence Based Practices

85Recent and Ongoing Projects
Committee to help meet this challenge. The Commit-tee's overall objective is to create an Evidence Based Practices Service Delivery Model. One of the Com-mittee's fi rst recommendations was to adopt a standard terminology to help foster meaningful debate and promote a shared understanding of the concepts related to evidence based programming. The Committee recommended a broad defi nition of "practice" to include a precise intervention, a procedure, or a larger program with multiple components that is expected to result in some measurable behavioral, social, educational, or physical benefi t. Examples include (1) a curriculum, (2) a behavioral intervention, (3) a systems change, or (4) an educational approach. Further, the Committee determined that to qualify as "evidence based," a practice must be supported by the following: • Research results document the practice is func-
tionally related to change in the targeted behavior, for the target population.
• Where appropriate, the use of a practice should be guided by a standardized risk assessment to deter-mine risk factors and set individualized goals.
• Practices should be concretely defi ned in terms that are readily understandable by practitioners.
• Training must be provided to ensure staff are qualifi ed to administer the practice, and program manuals and protocols should be readily available to ensure the practice is consistently applied.
• Accurate, reliable, and valid data should be col-lected on a regular basis to support improvement in the practice over time.
Improving outcomes for the Division's clients also requires that programs serving youths regularly re-ceive a variety of different kinds of feedback on their activities. This feedback includes information about the clients served, the nature and levels of services provided, and the clients' short- and long-term outcomes. Several complementary audit processes are in place to provide this information: (1) Quality Assurance (QA), (2) Quality Service Review (QSR), (3) Performance-based Standards (PbS), and (4) Correctional Program Checklist (CPC).
Quality Assurance (QA). QA audits focus on a program's adherence to Division policies and procedures and, in the case of contracted programs, the terms of the con-tract. Regular audits are made of programs and facilities directly operated by the Division and those operated under contract. Program performance is judged against
the Division's written standards, operations manuals, and policies. During reviews, auditors consult personnel fi les, training records, documentation of service delivery, and control logs. Audit reports summarize fi ndings and make recommendations for program improvement. Reviews of contracted providers additionally determine whether providers are meeting the requirements of Division contracts. This typically includes assessment of (1) specifi c program requirements, (2) fi scal account-ability; (3) compliance with standard contract terms and conditions, and (4) adherence to federal requirements.
Quality Service Review (QSR). QSR reviews focus on the quality of service delivery for youths under case manage-ment supervision. The process includes in-depth reviews of individual cases to determine how well service sys-tems address the needs of the client and how the youth and family benefi t from services they receive. Input is sought for each case reviewed from multiple stakehold-ers, including the youth, parents, case managers, thera-pists, contracted service providers, and providers from other agencies. Reports developed from the process provide an overview of current client status, strengths to build on, and weaknesses to be addressed. QSR evaluations are guided by a case review instru-ment that covers a number of client status and system performance indicators. Client status indicators in-clude (1) safety, (2) accountability, (3) youth well being (emotional and physical health, and learning progress), (4) stability, (5) family functioning. System performance indicators include (1) teaming, (2) assessment, (3) service planning, (4) plan implementation, and (5) discharge planning.
Performance-based Standards (PbS). The Division's secure care and locked detention facilities have committed to participate in the PbS process (http://pbstandards.org/). The approach provides a system for programs to identi-fy, monitor, and improve treatment services provided to incarcerated youths. Performance benchmarks are based on the American Correctional Association Performance-based Standards (PbS). Participating programs collect and analyze data to target specifi c areas for improve-ment. The general approach has been used widely across the country and currently is being utilized in more than 200 facilities in 32 states. The Division's involvement with PbS began in 2010 with two facilities. The effort has since been ex-panded several times and now includes all eleven of the

86 Recent and Ongoing Projects
Division's locked detention facilities and all six of the Division's secure facilities.
Correctional Program Checklist (CPC). The goal of the Division's use of the CPC is to implement a continuous approach for evaluating and improving the program-ming youths receive while in Division care. The effort examines whether programs and services are following best practices and utilizing evidence based practices. Technical assistance is provided to increase the use of best practices and evidence based practices. Programs participating in the project are able to show empirically the impact their work has on reducing offending. For each program, the project staff fi rst measure the degree to which youths entering the program match the target population for which the program is effec-tive. The next step is to determine the degree to which the program follows evidenced based practices. This is assessed using the Correctional Program Checklist (CPC). The CPC was developed at the University of Cincinnati to determine the degree to which programs use best practices and evidence based practices and may be used as part of a larger process for determining the effectiveness of programs in changing offender attitudes, behaviors, and rates of recidivism (https://www.uc.edu/corrections/services/program_evaluation.html). The instrument is divided into basic areas of capacity and content. Evaluation of capacity measures whether a cor-rectional program has the capability of providing youths with evidence based interventions and services. There are three areas of concern: (1) Leadership and Develop-ment, (2) Staff, and (3) Quality Assurance. Evaluation of content focuses on program processes for assessment, treatment, and adherence to principles of risk, need, and responsivity. Following this preliminary assessment, outcomes for youths are assessed by measuring the self-reported changes in attitudes and behaviors and rates of re-offense during the year following program comple-tion. Once this information has been gathered, efforts are focused on increasing the effectiveness of Division programming by providing intensive technical as-sistance to guide the program in increasing the use of evidence based practices. Consultation is provided after each CPC evaluation to ensure that recommendations are understood and followed. Written resources, such as “how-to-guides”, and in-person training are provided when needed. An internet based reporting system shows up-to-date and easy to understand snapshots of the cur-
rent functioning of each program. This program “dash-board” allows Division and program staff to quickly identify and respond to areas that need improvement. The Division's participation in the project began during FY 2012. The evaluation effort is being carried out with the help of a team of seasoned evaluators work-ing under a Division contract with the Social Research Institute at the University of Utah. For most of FY 2016, eight different programs were involved in the project. This included six programs operated directly by the Di-vision and the Division's case management program in Salt Lake City. Each program or facility is being evalu-ated twice. Initial evaluations are followed up a with a report that identifi es areas that are performing well, ar-eas that are in need of improvement, and recommenda-tions for improving performance in each of the targeted areas. A second evaluation is scheduled approximately one year after the fi rst to measure progress and identify new or continuing problem areas. More information about the approach may be found at http://sri.utah.edu. During FY 2016, the contract with SRI that sup-ports this project was expanded to cover an additional 6 programs for a total of 14. CPC evaluators from the Social Research Institute also assisted the Division in additional ways. Evaluators helped the Division's Train-ing Bureau develop processes for training evidence based practices. In addition, CPC evaluators worked with the Division's Quality Assurance workgroup to begin the process of incorporating additional elements of evidence based practice in its annual audits of Division programs.
Protective and Risk Assessment
In 1999, the Division joined the Juvenile Court in de-veloping a systematic assessment process for identifying the strengths and weaknesses of delinquent youths. The Risk Assessment Committee was established to oversee the project. The Committee had equal representation from the Juvenile Court and the Division. After review-ing a number of possibilities, the Committee selected two assessment tools originally developed in Washing-ton State. Both instruments have been used on a regular basis since January of 2003. The Prescreen Risk Assess-ment (PSRA) is a relatively short assessment that had been validated to predict reoffending of juvenile proba-tioners in Washington State. The assessment collects information on a variety of youth characteristics such as past delinquency, drug and alcohol problems, cur-rent home environment, and peer group. Currently, the

87Recent and Ongoing Projects
PSRA is being given to youths scheduled to have a hear-ing before a Juvenile Court judge as a result of a charge for a misdemeanor- or felony-type offense. The second assessment tool is the Protective and Risk Assessment (PRA). This evaluation is a longer and more comprehensive assessment that includes informa-tion from each of 10 different domains: (1) delinquency history, (2) school, (3) use of free time, (4) employment, (5) relationships, (6) living environment, (7) alcohol and drug use, (8) mental health, (9) attitudes and behavior, and (10) skills. The PRA is being given to youths or-dered by the Juvenile Court to probation supervision or into Division custody. Information from the PRA is used to construct specifi c goals for the youth’s service plan. The PRA is updated, at a minimum of every 180 days, to measure progress and identify new and continuing issues. Assessment results are managed by the CARE information system (see below) as part of an individual youth’s electronic case record. As a result, Division and Juvenile Court workers assigned to a case have im-mediate access to a youth’s current and past assessment results. The PSRA and PRA share the same items used to calculate a youth's risk to reoffend. Results from the risk items are used to calculate a Risk Level of low, moderate, or high. In FY 2008, a validation study was conducted by researchers from the Juvenile Court and the Division to validate risk level results [(DeWitt, J., & Lizon, R. (2008). The Utah Pre-Screen Risk Assessment (PSRA) and the Protective and Risk Assessment (PRA) valida-tion study. Salt Lake City, UT: Department of Human Services, Juvenile Justice Services.]. The study deter-mined that low-risk youths were signifi cantly less likely to reoffend than were moderate- or high-risk youths. Further, moderate-risk youths were signifi cantly less likely to reoffend than were high-risk youths. Patterns were similar for males and females, youths over or under 14 years of age, minority and non-minority youths. During FY 2016, researchers from the Juvenile Court and the Division replicated the 2008 validation study. Overall results confi rmed fi ndings of the earlier study. Once again, it was determined that low-risk youths were signifi cantly less likely to reoffend than were moderate- or high-risk youths and that moderate-risk youths were signifi cantly less likely to reoffend than were high-risk youths. Results from the PSRA also demonstrated that same relationship between risk level and likelihood of reoffending for males and females, minority and non-
minority youths, urban and rural youths, and youths over or under 14 years of age. Overall results for risk level calculated from the PRA were similar, however, Risk Level from the PRA did not reliably predict reof-fending for females or for minority members. Additional research is planned to explore why PRA results did not generalize to those two groups.
Court & Agencies’ Record Exchange
The Courts & Agencies' Record Exchange (CARE) information system is Utah's juvenile justice database. The full system, implemented on November 28, 2005, was the result of a joint effort by the Juvenile Court and the Division that began in 1999. Working objectives for the project were to (1) design and create a useful case management system, (2) enhance communication and cooperation between agencies responsible for juvenile justice and child welfare in Utah, and (3) allow for the sharing of case information in a user friendly and readily accessible digital environment. Components of the CARE system currently in place include the (1) demographics module which manages personal characteristics of youths and their families; (2) services module which tracks residential and nonresi-dential services delivered to youths in Division and Pro-bation care and allows assignments of individual workers to individual youths; (3) incidents module which docu-ments delinquency charges, hearings, dispositions and other interactions between individual youths and the Juvenile Court; (4) calendaring module which organizes activities of individual youths, Juvenile Court judges, and Juvenile Court courtrooms; and (5) e-mail notifi -cation, which alerts workers attached to an individual youth about the youth’s new court hearings, dispositions, admission to detention, and application of new critical messages. CARE includes two additional features of particular note. The assessment module, brought online during FY 2002, was the fi rst component to be completed. This function collects, scores, manages, and reports on results of user defi ned questionnaires and assessments. The module has been used successfully to collect a wide variety of information about individual youths includ-ing behavioral ratings, progress notes, work hours, and school performance. It also has proved to be an invalu-able resource for the Protective and Risk Assessment project (see above) and other data-collection processes.
A second notable component of CARE is the
88 Recent and Ongoing Projects
Minutes Module. In production since FY 2003, this module can collect information in real time during Juve-nile Court and Youth Parole Authority hearings. Court minutes, dispositions, orders, and other court docu-ments immediately become a part of a youth's electronic case fi le.
Victim Services
The Division recognizes the need to hold juvenile of-fenders accountable for their delinquent behavior and to respond to the needs of their victims. To help meet these objectives, treatment programs have been developed to heighten youths’ empathy for victims. In addition, op-portunities for youths to earn funds to repay victims of
their delinquent behavior have been created at all levels of the continuum of care. Substantial restitution payments have been made by youths in Division care to victims of juvenile crime. During FY 2016, the payments exceeded $90,000. For the 10-year period ending in FY 2015, total payments exceeded $2,000,000. Funds for this effort come from support payments that parents of youths in custody make to the state through the Offi ce of Recovery Ser-vices. The Division received permission from the 1983 Legislature to use a portion of these receipts for restitu-tion to victims of juvenile crime. Youths participate in community service projects in exchange for credited wages that are paid to victims through the Juvenile Court.

89History
Juvenile Justice Services was created in 1981 under the mission “...to provide a continuum of supervision and rehabilitation programs which meets the needs of the youthful offender in a manner consistent with public safety. These services and programs will individualize treatment and control the youthful offender for the ben-efi t of the youth and the protection of society.” The Division’s philosophical roots can be traced to the late 1800s and the Utah Territorial Reform School which opened in Ogden in 1889. The original intent was “...to make the school as near like a home as possible.” A century ago, increases in delinquent and violent behavior were seen as results of a changing society. The remedy for Utah’s troubled youths was seen as the concerted support of competent individuals, caring families, and communities. This remains true today.
Organizational Highlights
1889 The Territorial Reform School opens in Ogden with dormitories for 100 children.
1896 Utah receives statehood and the Territorial Reform School becomes the Utah State Industrial School.
1905 The Utah Juvenile Court is created as the primary court for juvenile offenders.
1946 A National Probation Association study of the Utah State Industrial School fi nds that “Most of the buildings along with their equipment fall far short of requirements for the proper care, education and treatment of boys and girls.”
1974 The Federal Juvenile Justice and Delinquency Prevention Act is created, establishing a new national tone for juvenile corrections reform by advocating: (1) removal of juvenile status offenders and non offenders from locked facilities; (2) separation of juvenile offenders from adult offenders; and (3) removal of juveniles from adult jails, municipal lockups, and adult correctional facilities.
1975 A class action lawsuit, Manning v. Matheson, is fi led in Federal District Court. The conditions of confi nement at the State Industrial School are brought into question by the lawsuit’s allegation that a resident’s extended stay in solitary confi nement either precipitated or exacerbated his mental illness.
1977 The Blue Ribbon Task Force is appointed by Governor Scott Matheson. A major recommendation is that youths should be placed in the “least restrictive setting” that is consistent with public safety.
1978 Governor Matheson meets with leaders of the juvenile justice community concerning the ability of the State Industrial School to securely hold serious offenders and protect the safety of less serious offenders. A consultant is hired by Governor Matheson to make recommendations for settlement of Manning v. Matheson.
The Utah State Industrial School becomes the Utah State Youth Development Center (YDC).
History
Utah Territorial Reform School in Ogden circa 1889 (photo courtesy of the Utah State Historical Society).

90 History
1980 The Governor’s Juvenile Justice Task Force, with representation from concerned agencies and the community, is created to examine Utah’s juvenile corrections system. The Juvenile Justice Task Force creates a Master Plan, inspired by the Massachusetts juvenile correctional model, to provide direction for the development of Utah’s juvenile justice system. Key tenets of the model are: (1) most juvenile offenders cannot be treated within a training school setting because treatment and rehabilitation are not consistent with the security issues; (2) young offenders must be provided opportunities for rehabilitation, but not at the expense of public safety; and (3) commitment guidelines should be developed and fi nancial resources should be used to develop community services rather than for the construction and maintenance of secure beds.
1981 The Division of Youth Corrections is created by statute (UCA 62A-7-102) based on the Master Plan developed by the Juvenile Justice Task Force. The Division is placed within the Department of Social Services. The Division is organized into three geographical regions, each delivering secure care, community based services, detention, case management, and observation and assessment. Utah’s detention centers receive fi nancial support from the state, but are operated by county governments.
1986 The Youth Parole Authority is created by statute (UCA 62A-7-501(1)) to take responsibility for review of all parole requests and for oversight of youths on parole from secure care.
1987 The Division takes over operation of 9 of the state’s 10 county operated detention centers. The exception, the multiuse center in Blanding, is operated by the Division of Child and Family Services.
1995 Serious youth offender legislation is enacted to expedite transfer of violent and chronic juvenile offenders to the jurisdiction of the adult courts and correctional system.
The Division Director appoints a task force to review and update the 1980 Master Plan.
Appointment of Youth Parole Authority Members becomes an executive appointment by the Governor rather than by the Board of Youth Corrections.
1996 The Juvenile Justice Task Force is appointed by the Utah State Legislature. The group has the mandate to examine all aspects of Utah’s juvenile justice system.
Findings of the 1995 Master Plan Task Force are presented to the Board of Youth Corrections. Primary recommendations are to change the Division’s Mission Statement to refl ect a greater concern for public safety and the principles of the Balanced and Restorative Justice (BARJ) Model. Another recommendation is to reorganize the Division’s structure of service delivery.
1997 The Utah Sentencing Commission promulgates a new set of sentencing guidelines for juvenile offenders. The aim is to reduce delinquency through application of earlier and more intensive sanctions. In addition, a new dispositional option for the Juvenile Court known as “State Supervision” is created. The sanction combines a range of nonresidential interventions directed by Juvenile Court Probation. If needed, the Division of Youth Corrections and the Division of Child and Family Services will provide out-of-home residential placements.
2001 The Division’s service delivery is reorganized. The traditional regional organization based on geography is replaced with the Offi ces of Community Programs, Correctional Facilities, and Rural Programs. Statewide administrative services also are realigned to match this change.
The Juvenile Court and the Division adopt standardized risk and needs assessments. The instruments

91History
are to be given to youths at probation intake, under probation supervision, and in Division custody. The assessments will be used to identify risk of reoffending, needs for services, and progress made during programming.
2002 Oversight of youth services is transferred to the Division of Youth Corrections from the Division of Child and Family Services. As a result, the Division of Youth Corrections creates the Offi ce of Early Intervention Services to manage the functions of youth services, home detention, diversion, and state supervision along the Wasatch Front. Youth services functions in rural areas are managed by the Offi ce of Rural Programs.
The Division launches the Program Enhancement Process (PEP). The focus of this initiative is to develop outcomes-based services within the framework of BARJ.
The legislature expands the DNA database to include juveniles over age 14 found to have committed any felony (UCA 53-10-403-405).
2003 The Utah Legislature changes the Division’s name to the Division of Juvenile Justice Services.
2006 The Adam Walsh Child Protection and Safety Act (Pub.L.109-248) is signed into law by Congress. The Act is named for Adam Walsh who was a youth murdered 16 days after his abduction. The Act organizes sex offenders into three categories or tiers, and mandates that they register their whereabouts. The law does apply to some convicted juvenile sex offenders (UCA 77-41-104).
2008 As a cost-cutting measure, the Division no longer produces hardcopy Division of Juvenile Justice Services Annual Reports and moves to online versions instead.
2009 Along with other Divisions in the Department of Human Services and the Department of Environmental Quality, the Division's administrative offi ce moves into the new Multi-Agency State Offi ce Building located in Salt Lake City.
2013 The Division receives a one-year grant to develop a comprehensive, statewide plan for improving and expanding services for children and their families called a System of Care.
2015 Operation of the Salt Lake Valley Detention Center and the Farmington Bay Youth Centers is taken over by the Division. Previously, both facilities were operated by a private provider under contract with the Division.
Administration of the Division's Investigations Bureau is moved under the Quality Assurance unit in the Research and Evaluation Bureau.
2016 At the request of Utah's Governor Gary Herbert, Chief Justice Matthew Durrant, House Speaker Gregory Hughes, and Senate President Wayne Niederhauser the Utah Juvenile Justice Working Group undertakes a data-driven, research-based assessment of the Utah's juvenile justice system. Recommendations from the effort will be reviewed by the 2017 Legislature.

92 History
Community Programs: Case Management, Observation and Assessment, Aftercare
1979 The Federal Offi ce of Juvenile Justice and Delinquency Prevention awards Utah an $800,000 grant to begin developing a network of privately operated residential programs in the community.
1981 An observation and assessment center opens in Salt Lake City in addition to an existing program in Ogden.
1984 An observation and assessment center opens in Provo.
1995 Farmington Bay Youth Center, the fi rst state-owned, privately run facility opens. The 60-bed facility provides observation and assessment services, short-term detention, and long-term secure care in three separate wings.
1997 A 6-bed, observation and assessment program, specialized for females, is opened in Salt Lake City.
The privately operated Copper Hills Youth Center opens in Salt Lake City, providing the Division with an additional 24 beds for observation and assessment.
The Intensive Community Aftercare Program (ICAP) is founded. The program, which is housed at the Wasatch Youth Center (a secure facility), provides youths with supervision and other services as they transition from secure care back to the community.
1998 The privately operated North Bay Youth Center opens in Brigham City, providing the Division with an additional 10 beds for observation and assessment.
1999 The Legislature reduces observation and assessment programming time from 90 days to 45 days. A single extension of 15 days can be authorized by the Division Director (UCA 78-3a-118(2)(e)).
Refl ections, a community day-treatment program for girls, opens in Layton.
2000 North Bay Youth Center in Brigham City discontinues operation.
2001 Copper Hills Youth Center in Salt Lake City discontinues operation.
2002 The Intensive Community Aftercare Program (ICAP) moves from the Wasatch Youth Center to a separate residential facility with 8 beds for youths transitioning from secure care or other structured programs.
2002 HB 154 expands the DNA database to include juveniles found to have committed a felony. Upon the order of a Juvenile Court Judge, probation offi cers or Juvenile Justice Service case managers collect a sample using a saliva test kit. The juvenile is assessed a fi ne to pay for the test and replace the kits. Once taken, samples are sent to the Utah Department of Public Safety, Bureau of Forensic Services.
2003 The Division opens the Utah County Aftercare Program (UCAP) to provide nonresidential transition services for youths in the Utah County area. The program is being funded by a 3-year Federal grant.
2006 Federal Funding for the Utah County Aftercare Program (UCAP) expires and the program is closed.

93History
2007 Development of the Graduated Sanctions Model is completed. The model is fully implemented on July 1, 2007.
2008 The Refl ections Program for girls, which provided day programing for girls in Division custody, closes as the result of budget constraints.
The residential components of the Project Paramount and ICAP transition programs close as the result of budget constraints.
2009 The Division receives Federal funds to open the In-Community Services program in Orem to provide non residential, transition services for youths leaving secure care and other highly structured residential programs.
2012 Administration of observation and assessment centers in Ogden, Salt Lake, and Springville is moved from the Offi ce of Community Programs to the Offi ce of Early Intervention Services.
2015 Administration of the Genesis Youth Center, a residential work camp, is moved from the Offi ce of Early Intervention Services to the Offi ce of Community Programs. Originally located in Draper, the facility is moved and now is collocated with the Salt Lake Valley Detention Center.
Correctional Facilities: Locked Detention, Secure Care
1981 Utah’s locked detention centers receive fi nancial support from the state, but are operated by county governments.
1983 The Youth Development Center (YDC) is closed. In its place Decker Lake and Mill Creek Youth Centers are opened. Each facility provides 30 beds for long-term secure care.
1987 The Division takes over operation of 9 of the state’s 10 county operated detention centers. The exception, the multiuse center in Blanding, is operated by the Division of Child and Family Services.
The Southwest Utah Youth Center, a combination 10-bed secure facility and 6-bed detention center, is opened in Cedar City.
1989 Statutes passed by the Utah Legislature allow the Juvenile Court to order youths into detention for up to 30 days (UCA 78-3a-118(2)(f)) as a sentence or for up to 10 days for contempt of court (UCA 78-3a-39).
1990 The average daily population of the three secure facilities reaches the system’s capacity of 70 youths.
1992 An additional 10 secure-care beds are added to Decker Lake Youth Center bringing the statewide capacity to 80 beds. The new beds are fi lled within a month and once again the system is at its capacity.
1995 Farmington Bay Youth Center, the fi rst state-owned, privately run facility opens. The 60-bed facility provides observation and assessment services, short-term detention, and long-term secure care in three separate wings.

94 History
1997 Construction of the 70-bed Slate Canyon Youth Center in Provo is completed. The facility has 38 detention and 32 secure-care beds and replaces outdated and unsafe Provo Youth Detention Center.
The aging 56-bed Salt Lake Detention Center is replaced by the 160-bed Salt Lake Valley Detention Center.
The old Salt Lake Detention Center is renovated and renamed the Wasatch Youth Center. The building provides secure care for up to 56 youths. Specialized programs are developed to meet the unique needs of sex offenders, girls, and youths preparing for transition back to the community.
2001 The expansion of Mill Creek Youth Center by 72 beds is completed. Facility capacity is now 102 beds.
2008 Farmington Bay Youth Center converts its 18 beds for secure care to beds for locked detention.
2015 Administration of detention centers in Salt Lake City, Roy, Farmington, and Provo is moved from the Offi ce of Correctional Facilities to the Offi ce of Early Intervention Services.
A 16-bed unit at Mill Creek Youth Center is closed because of low census.
The 10-bed girls unit at Mill Creek Youth Center is moved to a vacant unit at the Famington Bay Youth Center.
The 16-bed sex offender unit at Decker Lake Youth Center is switched with a 16-bed unit at Wasatch Youth Center.
Early Intervention: Receiving Centers, Shelters, Work Camps, Diversion
1994 Day/Night reporting and receiving centers are opened across the state to facilitate monitoring of youths.
Genesis Work Program, a community based program, is opened at the direction of Governor Michael Leavitt.
1996 A partnership between the Division and the US Forest Service establishes a seasonal program at Strawberry Work Camp.
The Genesis Work Program receives a Peace Pole donated by the people of Japan. The pole is installed on Genesis grounds and a time capsule is buried in its base.
1998 Archway Youth Services Center opens as the fi rst youth services program operated directly by the Division.
The old Provo detention center is converted to a day program for community services and work projects.
2004 Operation of the Genesis Work Program is placed under the Offi ce of Early Intervention Services.
2009 The Division suspends its state supervision programing as a cost-cutting measure.
2012 Capacity of the Genesis Work Program is reduced from 50 beds to 40 as a cost cutting measure

95History
Administration of observation and assessment centers in Ogden, Salt Lake, and Springville is moved from the Offi ce of Community Programs to the Offi ce of Early Intervention Services.
2015 Administration of detention centers in Salt Lake City, Roy, Farmington, and Provo is moved from the Offi ce of Correctional Facilities to the Offi ce of Early Intervention Services.
Administration of the Genesis Youth Center, a residential work camp, is moved from the Offi ce of Early Intervention Services to the Offi ce of Community Programs.
Rural Programs: Full Range of Programming
1981 Utah’s rural detention centers receive fi nancial support from the state, but are operated by county governments.
1983 Multiuse centers are opened in Vernal, Richfi eld, and Blanding to provide detention resources in rural areas. Each facility has four beds for detention and six beds for shelter care.
1987 The Southwest Utah Youth Center, a combination 10-bed secure facility and 6-bed detention center, is opened in Cedar City.
The Division takes over operation of 9 of the state’s 10 county operated detention centers. The exception, the multiuse center in Blanding, is operated by the Division of Child and Family Services.
1993 The Division assumes responsibility for operation of Canyonlands Multiuse Youth Home in Blanding.
1995 The Washington County Youth Crisis Center, a new multiuse center, opens in St. George with 10 beds for detention and 8 beds for shelter care.
2000 Construction is completed on multiuse facilities in Logan, Vernal, and Price. Each has 16 beds for locked detention and additional beds for shelter care and observation and assessment.
2001 Construction is completed on a multiuse facility in Richfi eld. The center has 16 beds for detention and 16 beds that may be used for shelter and observation and assessment.
2003 Construction is completed on a multiuse facility in Blanding. The center has 16 beds for detention and 16 beds that may be used for shelter and observation and assessment. The new center opens under the name Canyonlands Youth Center.
2004 Construction is completed on the Dixie Area Detention Center in St. George. The center’s 48 detention beds replace 10 detention beds at the Washington County Youth Crisis Center. Existing beds at the Washington County facility are retained for shelter, and other non secure programs. As a part of the completion of the Center a time capsule is placed in the Center’s monument.
2009 The Division suspends its state supervision programing as a cost-cutting measure.
2012 An observation and assessment program was opened at the Canyonlands Youth Center in Blanding.

96 History
2015 The Gateway program is opened in Hurricane as a residential work camp. The program occupies an unused portion of the Dixie Detention Center and has 8 residential beds. Residents work on projects to work off court-ordered obligations
2016 The New Hope Behavioral program, a non secure, high behavior, residential placement is opened in at the Washington County Youth Crisis Center. The program is the result of a collaboration between the Division, and the Division's of Child and Family Services and Substance Abuse and Mental Health.
Youth Parole Authority
1981 By law (UCA 62A-7-502(1)) the Division of Youth Corrections becomes the sole authority in matters of parole, revocation, and discharge involving youthful offenders committed to secure confi nement. Prior to this, the juvenile parole release process was informal and generally conducted by the superintendent of the secure facility.
1982 The Division of Youth Corrections appoints a Parole Review Committee to study constitutional rights of incarcerated juveniles, community safety, and quality of care. The committee recommends that youths should have increased accountability, that staff should have representation, and that hearings should be cost effi cient.
1983 Following the recommendations of a citizen review committee, the Youth Parole Authority is established. The Authority begins operations in October, 1983.
1985 A committee is appointed to develop a better method for determining lengths of stay for youths in secure confi nement. The Board of Youth Corrections adopts the new guideline methods and the Authority implements them.
1986 The Youth Parole Authority is created statutorily by the 1986 Legislature. The Authority has fi ve citizen volunteers appointed by the Board of Youth Corrections to serve for three-year terms (UCA 62A-7-501).
1991 In an attempt to deal with the increased work load of the Authority, legislation is passed to increase the number of members from fi ve to seven citizen members (UCA 62A-7-501(2)(a)).
1995 Appointment of members to the Authority comes under the direction of the Governor with the advice and consent of the Senate ( UCA 62A-7-501(2)(a)). The number of members is increased to 10.
Recognizing the needs for enhanced public protection and competency development, the Authority extends the length of stay in secure care to a minimum of 6 months. Prolonging stay is expected to allow youths to take greater advantage of the rehabilitative opportunities offered in secure care.
1997 The Authority implements a victims program. Victims of youths in secure care are notifi ed of Initial Hearings and provided with information about the policies and practices of the Youth Parole Authority.
1999 The Authority is expanded by statute to add fi ve pro tempore members to help meet increasing work loads (UCA 62A-7-501(2)(a)).
2003 The Authority begins the process of conversion to the new CARE record keeping system.

97History
2005 CARE is fully implemented for YPA record keeping operations.
2012 YPA Members are provided with devices enabling them to receive hearing fi les electronically.
2014 YPA Members receive training on the Division's Case Planning Model.
2015 In collaboration with the Offi ce of Correctional Facilities and the Research and Evaluation Bureau, the YPA develops a rating model intended to be used by direct care workers in all fi ve of the Division's secure facilities. Implementation is planned during 2016.
YPA Length of Stay Guidelines are revised. New guidelines include a range of months. Youths who meet YPA expectations and other standards will be eligible for release at the low end of the range.
Legislation
1995 Utah’s Serious Youth Offender law (UCA 78A-6-702), is enacted by the 1995 Legislature to move some youths beyond the Juvenile Justice System. The law is intended to provide more severe sanctions for the most serious juvenile offenders and to remove them from costly juvenile programs that appeared to be having little impact. To qualify as a serious youth offender, a youth must be at least 16 years of age at the time of an offense and charged with at least one of ten serious felony offenses (aggravated arson, aggravated assault resulting in serious injury to another, aggravated kidnapping, aggravated burglary, aggravated robbery, aggravated sexual assault, felony discharge of a fi rearm, attempted aggravated murder, attempted murder, or a felony offense involving the use of a dangerous weapon after having previously been found to have committed a felony-type offense involving the use of a dangerous weapon). Juveniles charged with one of the serious felony offenses are initially given a hearing in Juvenile Court. If the state meets its burden to establish probable cause to believe that the juvenile committed one of the specifi ed crimes, the Juvenile Court may bind the juvenile over to the adult court system. In determining whether to transfer the juvenile to adult court, the Court may consider (1) whether the juvenile has previously been adjudicated delinquent for a felony offense involving the use of a dangerous weapon; (2) whether the offense was committed with one or more other persons and the youth appears to have a lesser degree of culpability than the codefendants; (3) whether the juvenile used violence, aggression, or premeditation and, if so, to what degree; (4) the number and nature of the juvenile's prior adjudications in the juvenile court; and (5) whether public safety and the best interest of the minor is better served by adjudicating the juvenile in the Juvenile Court or in the District Court.
1997 The Juvenile Judges - Short Term Commitment of Youth (UCA 78A-6-117(2)(f)) allows Juvenile Court Judges to order youths found to have committed felony-type or misdemeanor-type offenses to a stay of up to 30 days in a locked detention facility or in a diversion program.
The Juvenile Court Powers (UCA 78A-6-1101(3)(a), ) extends the sanctions available for youths found in contempt of court. The new legislation allows Juvenile Court Judges to sentence youths found in contempt to any sanction except secure care. This includes short-term sanctions such as orders to detention and long-term sanctions such as community placement.
The Utah Legislature (UCA 78A-6-605(2)) requires that sentencing guidelines be considered by any agency making a dispositional report to the Juvenile Court. Sentencing guidelines and procedures for using them are described in the Sentencing Guidelines Manual 1997. Application of sanctions is based on (1) the severity of a
98 History
juvenile’s current offense(s), (2) the juvenile’s delinquency history, and (3) any circumstances that would make the behavior seem more serious (aggravating factors) or less serious (mitigating factors).
1999 The Utah State Legislature reduces observation and assessment programming time from 90 days to 45 days. A single extension of 15 days can be authorized by the Division director (UCA 78A-6-117(2)(c)).
2002 The 2002 Utah State Legislature transfers administration of Youth Services to the Division of Juvenile Justice Services from the Division of Child and Family Services (UCA 62A-7-601).
2003 Legislation (UCA 62A-7-102) changes the Division’s name from the Division of Youth Corrections to the Division of Juvenile Justice Services.
2006 The Adam Walsh Child Protection and Safety Act of 2006 (Pub.L.109-248) is signed into law by Congress. The Act classifi es individuals convicted of a sex offense into three categories or tiers, and mandates that they register their whereabouts. Registration information is entered by each state into a publicly accessible, national database. The decision is made in Utah to require registration of juveniles adjudicated delinquent for registerable offenses who have remained in the state's custody until their 21st birthday and who have been determined to pose a continued risk to public safety (UCA 77-41-102).
2011 Legislation (UCA 78A-6-1104) requires Division detention centers to collect fi ngerprints and photographs of all 14 year-old or older youths admitted to locked detention for a felony-type offense. In addition, the Juvenile Court is directed to order 14 year-old or older youths to have their fi ngerprints taken at a Division detention center if they were adjudicated for a felony-type offense or a class A misdemeanor-type offense and their fi ngerprints have not previously been obtained. The legislation directs that fi ngerprints be sent to the Utah Bureau of Criminal Identifi cation (BCI) for possible inclusion in its fi ngerprint archives.
2014 The 2014 Utah State Legislature passes HB 185 which allows minors bound over to District Court to be held in juvenile detention facilities until the time of the trial.

Information 99
Division Programs and Offi ces.STATE ADMINISTRATIONDIRECTOR SUSAN BURKE (801) 538-8224 195 N 1950 W fax (801) 538-4334 Salt Lake City, UT 84116DEPUTY DIRECTOR DEBBIE WHITLOCK (801) 538-4323 195 N 1950 W fax (801) 538-4334 Salt Lake City, UT 84116DIRECTOR ADMIN SERVICES CECIL ROBINSON (801) 538-9843 195 N 1950 W fax (801) 538-4334 Salt Lake City, UT 84116
YOUTH PAROLE AUTHORITYADMINISTRATIVE OFFICER CHRIS PACKARD (801) 538-4627 195 N 1950 W fax (801) 538-4334 Salt Lake City, UT 84116
OFFICE of COMMUNITY PROGRAMSPROGRAM DIRECTOR MIKE BUTKOVICH (801) 538-4311 195 N 1950 W fax (801) 538-4334 Salt Lake City, UT 84116
CASE MANAGEMENTOGDEN CASE MANAGEMENT Rachel Edwards (801) 627-0322
145 N Monroe Blvd fax (801) 393-7813Ogden, UT 84404
OGDEN CASE MANAGEMENT 2 Franz Bryner (801) 626-34472540 Washington fax (801) 626-3187Ogden, UT 84401
OREM CASE MANAGEMENT April Graham (801) 426-7430237 S Mountainland Dr fax (801) 426-7455Orem, UT 84058
SALT LAKE CASE MNGMNT Kenyatta Green (801) 265-75003522 S 700 W fax (801) 265-7599Salt Lake City, UT 84119
(A list of contractors providing community services may be obtained from the State Administration (Attention: Contract Administrator)
WORK CAMPGENESIS YOUTH CENTER Kyle Goudie (801) 269-5106
3450 South 900 West fax (801) 266-1034Salt Lake City, UT 84119
OFFICE of CORRECTIONAL FACILITIESPROGRAM DIRECTOR DORIE FARAH (801) 538-4312
195 N 1950 W fax (801) 538-4334 Salt Lake City, UT 84116
SECURE FACILITIESDECKER LAKE YTH CTR Trent Clements (801) 954-9200
2310 W 2770 S fax (801) 954-9255 West Valley City, UT 84119FARMINGTON BAY YTH CTR DeAnn Mason (801) 451-8620
907 W Clark Ln fax (801) 451-7395Farmington, UT 84025
MILL CREEK YTH CTR Mike Shaw (801) 334-0210 790 W 12th St fax (801) 334-0287 Ogden, UT 84404SLATE CANYON YTH CTR Larry Mendez (801) 342-7840
1991 S State St fax (801) 342-7873 Provo, UT 84606WASATCH YTH CTR Stephanie Sinju (801) 265-5830
3534 S 700 W fax (801) 265-5846Salt Lake City, UT 84119
OFFICE of EARLY INTERVENTION SERVICESPROGRAM DIRECTOR DONOVAN BERGSTROM (801) 538-3988
195 N 1950 W fax (801) 538-4334Salt Lake City, UT 84116
DETENTION FACILITIESFARMINGTON BAY YTH CTR DeAnn Mason (801) 451-8620
907 W Clark Ln fax (801) 451-7395Farmington, UT 84025
SALT LAKE VALLEY DT CTR Lisa St. Louis (801) 269-51003450 S 900 W fax (801) 266-1034
Salt Lake City, UT 84119SLATE CANYON YTH CTR Larry Mendez (801) 342-7840 1991 S State St fax (801) 342-7873
Provo, UT 84606WEBER VALLEY DT CNTR Tracy Hart (801) 825-2794 5470 S 2700 W fax (801) 525-8350Roy, UT 84067
DIVERSION PROGRAMSDAVIS AREA YTH CTR Vacant (801) 774-8767
2465 N Main, Suite 13- A & B fax (801) 776-2954 Sunset, UT 84015LIGHTNING PEAK Annette Garcia (801) 491-0100
205 West 900 North fax (801) 491-0136Provo, UT 84663
SALT LAKE EARLY INTERVENTION Siosifa Tafi si (801) 685-57123570 S West Temple fax (801) 685-5707Salt Lake City, UT 84115
OBSERVATION AND ASSESSMENTOGDEN O&A Jim Miller (801) 627-0326
145 N Monroe Blvd fax (801) 393-7813 Ogden, UT 84404SALT LAKE O&A Nathan Cruz (801) 284-0230
61 W 3900 S fax (801) 266-7591Salt Lake City, UT 84107
SPRINGVILLE O&A Annette Garcia (801) 491-0133205 W 900 N fax (801) 491-0136Springville, UT 84663
RECEIVING CENTERSARCHWAY YTH SRVC CTR Tracy Hart (801) 778-6500
2660 Lincoln Ave fax (801) 778-6520 Ogden, UT 84401SALT LAKE YTH SRVCS NORTH Caroline Hansen (385) 468-4500
177 W Price Ave fax (385) 468-4461Salt Lake City, UT 84115
SALT LAKE YTH SRVCS SOUTH Caroline Hansen (385) 468-46101292 W 12700 S fax (385) 468-4661
Riverton, UT 84065 TOOELE YOUTH SERVICES Brent Westover (435) 566-5727
27 S Main fax (435) 566-0132Tooele, UT 84074
VANTAGE POINT Janene Candalot (801) 373-22151185 E 300 N fax (801) 852-4520Provo, UT 84604
OFFICE of RURAL PROGRAMSPROGRAM DIRECTOR REG GARFF (801) 538-3989
195 N 1950 W fax (801) 538-4334Salt Lake City, UT 84116
CASE MANAGEMENTBOX ELDER CASE MANAGEMENT Peter Smith (435) 723-2031
1050 Medical Dr #B fax (435) 734-0811 Brigham City, UT 84302CACHE VALLEY CASE MGMT Peter Smith (435) 787-3500
115 W Golf Course Rd, Ste E fax (435) 787-3519Logan, UT 84321
DETENTION FACILITIESDIXIE AREA DETENTION CTR Sterling Cabana (435) 627-2800
330 S 5300 W fax (435) 627-2801 Hurricane, UT 84737SW UTAH YTH CTR Jill McKinlay (435) 867-2500
270 E 1600 N fax (435) 867-2525Cedar City, UT 84720
MULTIUSE FACILITIES(Most multiuse facilities provide locked detention, shelter, case management, deten-tion diversion, and receiving center services; three also provide observation and assessment.)CACHE VALLEY YTH CTR Peter Smith (435) 713-6260
2051 N 600 W fax (435) 713-6276 Logan, UT 84321CANYONLANDS YTH CTR Shawn Ivins (435) 678-3140
244 W Old Ruin Rd fax (435) 678-3079Blanding, UT 84511
Information
100 Information
CASTLE COUNTRY YTH CTR Angela McCourt (435) 636-47201395 S Carbon Ave fax (435) 636-4737
Price, UT 84501CENTRAL UTAH YTH CTR Glen Ames (435) 893-2340
449 N SR 118 fax (435) 896-8177Richfi eld, UT 84701
SPLIT MOUNTAIN YTH CTR Lynn Whitman (435) 789-2045830 E Main St fax (435) 789-2245
Vernal, UT 84078WASH CO YTH CRISIS CTR Tami Fullerton (435) 656-6100
251 E 200 N fax (435) 656-6139St. George, UT 84770
OTHERDUCHESNE CO RCVG CTR Lynn Whitman (435) 722-3226
28 W Lagoon fax (435) 781-0840 Roosevelt, UT 84066Iron County Youth Center (ICYC) Jill McKinlay (435) 586-1704
1692 W Harding Ave fax (435) 586-6696Cedar City, UT 84720
SECURE FACILITIESSW UTAH YTH CTR Jill McKinlay (435) 867-2500
270 E 1600 N fax (435) 867-2525Cedar City, UT 84720


UTAH DEPARTMENT OF HUMAN SERVICES