2009 TZ Limited Annual Reporttz.net/wp-content/uploads/2014/12/TZL-2009-Annual-Report.pdfannual...
72
2009 annual report
Transcript of 2009 TZ Limited Annual Reporttz.net/wp-content/uploads/2014/12/TZL-2009-Annual-Report.pdfannual...

2009annual report

DIRECTORY
TZ Limited
1 Directors’ Report & Controlled Entities
ABN 26 073 979 272
19 Declaration of IndependenceDIRECTORS
20 Income Statement Mr. Mark Bouris
Mr. Kenneth Ting
21 Balance Sheet Mr. Willem de Vlugt
22 Statement of Changes in Equity COMPANY SECRETARY
Mr. Kenneth Ting
24 Cash Flow StatementREGISTERED OFFICE
25 Notes to the Financial Statements Level 11, 1 Chifley Square
Sydney NSW 2000
62 Directors’ Declaration Telephone +61 2 9222 8890
63 Independent Auditor’s Report Website: www.tz.net
Email: [email protected]
66 Corporate GovernanceBANKERS
67 Stock Exchange Information St George Bank Limited
Level 3, 1 Chifley Square
Sydney NSW 2000
CONTENTS
Sydney NSW 2000
AUDITORS
BDO
Level 19, 2 Market Street
Sydney NSW 2000
SOLICITORS
Landerer & Company
Level 31, 133 Castlereagh Street
SYDNEY NSW 2000
SHARE REGISTRY
Computershare Investor Services Pty Limited
452 Johnston Street
Abbotsford VIC 3067
Tel: +61 3 9415 5000
Fax: +61 3 9473 2500
STOCK EXCHANGE
Australian Securities Exchange
Code: TZL
Directors
The details of Directors of the Company during the year, and to the date of this report are:
Executive Chairman - Appointed 18 June 2009
Executive Director & Company Secretary - Appointed 18 June 2009
Non–Executive Director - Appointed 18 June 2009
Appointed 2 June 2009; Resigned 11 June 2009
Resigned 2 June 2009
Resigned 18 June 2009
Resigned 18 June 2009
Principal Activities
The principal activities of the consolidated entity during the financial year were:
DIRECTORS’ REPORT
The Directors of TZ Limited present their report together with the financial reports of the parent entity and its controlled entities for the financial year ended 30 June 2009.
(i) The development and commercialisation of intellectual property, particularly TZ MicroSecurity™ product solutions through Telezygology Inc (TZI).
(ii) Providing a full service capability in product development Services through PDT Group.
W de Vlugt
P Casey
A Sigalla
J Falconer
M Otten
M Bouris
K Ting
All of the operations of the consolidated entity are based in the United States of America, United Kingdom and
1
Operating Results
Directors commentary on operating results:
In the face of this turmoil the incoming Directors took quick and decisive steps to stabilize the Group, obtain interim funding to continue operations, rebuild relationships with the company’s customers, financiers and creditors and refocus remaining resources on a sustainable plan centered on developed products and immediate opportunities.
The operating loss after income tax for the year ended 30 June 2009 for the consolidated entity was $34,574,410 (2008: $14,370,704).
Ukraine.
When the new board of directors took charge of TZL in the last month of the 2009 fiscal year the Group was in a perilous state.
(i) It had defaulted on its payment obligations to QVT triggering a recall of $26.4 m of debt and accrued interest that could not be repaid.
(ii) Available cash reserves were significantly less than previously reported at around $0.6m.
(iii) Creditors and employee salaries exceeded available cash with several creditors threatening recovery action.
(iv) Existing customers and distribution partners threatened to terminate their contracts with the Company.
(v) The majority of activities and resources fundamental to the 2009 TZI revenue plan had either been suspended or terminated in an attempt to conserve remaining cash reserves.
1

Operating Results Commentary (continued)
Preparation of Financial Reports
(i) the conversion of A$18.6 million of debt comprising convertible notes, interest and other debt owed by TZL to QVT into at least 18.6 million ordinary shares which will be issued to QVT at a maximum conversion price of A$1. The $18.6 million in debt to be converted into equity is comprised of A$12.0 million in principal owing to QVT under half (12,000) of the 24,000 convertible notes held by QVT, approximately A$4.8 million in interest owing to QVT for the 2008 and 2009 calendar years and approximately A$1.8 million legal and advisory fees that QVT has guaranteed and paid for on behalf of TZL.
DIRECTORS’ REPORT
Within two weeks of being appointed the new Board raised approximately A$1.5 million in short term funding to re-capitalise the company, and entered into a payment moratorium with QVT Fund LP and Quintessence Fund LP (together known as "QVT"). As of the date of this report, approximately A$3.3 million has been raised to re-capitalise the Group. After intense negotiation the Group successfully entered into a workout plan for repayment of the debt owed to QVT which shareholders will be asked to vote on. The main terms of the workout plan are:
(ii) the amendment to the conversion price of the remaining 12,000 convertible notes held by QVT at no more than A$1.20 per TZL share, being a 20% premium to the maximum conversion price in (i) above. All other terms of the convertible notes will remain the same. That is, interest at 10% per annum will be payable, with the next interest payment being due on 31 December 2010. If not converted to ordinary shares, the principal of $12 million will need to be repaid on 19 February 2013.
The Directors key priority was to remove the company from danger and set a course to being cash flow positive in the shortest time as it is only from this position that a longer term growth strategy, consistent with past expectations, can be implemented.
As part QVT’s payment moratorium, the Directors were required to appoint an independent forensic accountant to investigate and report on the financial position of TZL. The Group appointed Ernst & Young to prepare the report,
d th t i l fi di f ll
2
and the material findings are as follows:
Because of findings by Ernst & Young, and the lack of availability of financial records of TZL, the process of reconstructing the financial accounts of TZL from source documents for the year ended 2009 has been very slow. Adding to this, the Company has commenced an action in the Supreme Court of New South Wales for the recovery of some of the items mentioned in the Ernst & Young report. In the interest of completing the 2009 financial accounts and audit in a timely manner the Directors have elected to create an impairment allowance where an impairment has been clearly determined. The majority of the items mentioned in (i) – (iv) have had a provision for impairment recognised in the 2009 Financial Report and adjustments will be made in future financial years where amounts are recovered or substantiated.
(i) The actual cash reserves of TZL and its subsidiaries as at 31 March 2009 differed materially from the approximately $8 million reported in the ASX Appendix 4C Quarterly report lodged with the ASX on 28 April 2008.
(ii) The ASX Appendix 4C lodged by TZL with the ASX on 28 April 2009 showed that $2.4 million in interest and other costs of finance had been paid by TZL during the quarter ended 31 March 2009 but none of this money was paid to QVT.
(iii) The Audited financial accounts of TZL for the year ended 30 June 2008 showed Sundry Debtors of approximately A$6.5 million. To 23 December 2009 only $324,379 in accrued interest has been received, with the balance of those Sundry Debtors still outstanding.
(iv) Substantial transactions between TZL, former directors and related parties, occurred during the twelve months ended 30 June 2009. The nature of these transaction is not clear, and will be determined in court proceedings scheduled for 2010.
2
Review of Operations
DIRECTORS’ REPORT (continued)
TZI has been focused squarely on three main objectives; completing development of a core set of commercial grade products, establishing contract manufacturing, and securing credible distribution and sales partners. Early in FY2009 significant cost cutting by the previous Board resulted in a number of product development projects being suspended and the majority of sales personnel terminated resulting in a significant reduction in sales activity. Additionally, an anticipated acquisition which would have provided the company with an important network component did not proceed to completion. These issues resulted in lost time and sales.
Due to cash constraints and the global recession, a decision was made to make volume product sales a priority rather than to pursue licensing opportunities which take longer to generate revenue. TZI delivered a number of positives in 2009 and beyond, with the first significant revenue generated from delivering a variety of production volume products. For the year ended 30 June 2009, and six months thereafter, the company has rolled out a range of new products including several models of the second generation TZ Radial Electronic Locking Device and USB interconnect modules, software and accessories and a suite of products that form the TZ Praetorian data center system. As at December 2009, the Group is in the process of completing new solutions for the data center and the Accountable Package logistics market.
The global recession impacted on the development spending of PDT’s customers, but despite this, PDT put in a very solid performance achieving approximately 65 per cent of their EBITDA goal. PDT had a strong finish to the year that has continued into the 2010 Financial Year with PDT currently ahead of plan. PDT’s presence in the medical device category strengthened, in particular, with a number of large scale programs in the fast-growing market for telemedicine applications. Telemedicine is one of the fastest growing product segments among medical device manufacturers, and PDT’s unique mix of consumer electronics and medical device experience positions them well to capitalise on this growing trend.
Additional highlights during the year and in the time leading up to this report can be summarized as follows;
3
Anixter
Dell
TZ Inbox
The recently released Dell Adamo XPS, the world’s thinnest laptop, features the new TZ Tube Actuator to provide electronic unlatching at extremely small size. Although the Adamo XPS is targeted at the high end of the market with relatively low volumes, the company believes there are many other volume applications for this commercially proven TZ actuator. PDT played a significant part in the development of both the Adamo and the Adamo XPS.
In 2009 development work commenced on TZ Inbox, a software Application that integrates with standard TZ hardware, designed for installation into standard milled storage furniture and lockers. The solution targets the Package delivery and logistics Industry and provides significant cost savings over the next best alternative through automation of accountable package delivery. The first working prototype attracted significant interest which lead to the development of a full commercial version now in the final stages of testing and anticipated to be ready for release to customers in late January 2010. The company has received orders for initial systems from its value added reseller, IOPC (International Office Products Cooperative), who have recently commenced production of a 30 bank locker design, incorporating the TZ Inbox system, which they anticipate shipping late January to several of their large corporate customers. These initial locker systems will be trialed and if successful will lead to additional orders. In February 2010, IPOC will launch TZ Inbox to their national reseller Network.
Four new product models were developed to form the TZ Praetorian™ electronic locking system targeting data centers. The first stocking order was delivered in August 2009, the system was commercially launched in September 2009, and it has been well received with several small pilot installations complete, and a significant pipeline developing. Supporting Anixter’s strong sales force and distribution with demand and lead generation is a national network of commissioned manufacturer representatives which TZI has appointed.
3

Review of Operations (continued)
Larson Manufacturing
Cardinal Health
PDT receives IDEA Silver Award
Additional Distribution
DIRECTORS’ REPORT (continued)
TZI has shipped nearly 50,000 units of the 96105L Keyless Electronic Lock Set over the last year to Larson Manufacturing. TZI has received positive comments from individual buyers however, sales for the storm door product offered through Lowe’s have been below expectation (the Lock Set is only sold as part of a premium door, not as a separate or after market item). Low sales have led to high TZI component inventory at Larson, so TZI production has been stopped for the foreseeable future. Given current economic conditions, Lowe’s have chosen to focus marketing efforts on lower cost products, therefore premium door products have not received the anticipated marketing promotion. TZI doesn’t anticipate further revenue from Larson in FY2010.
Designed and engineered by PDT as part of a significant consulting contract, Cardinal Health recently launched the FDA approved Cardinal ORwell™, the next generation in surgical fluid collection and disposal systems. The ORwell™ system features the TZ Intevia® Radial electronic lock to allow the disposal station to detect when the unit has been docked and initiate the disposal process.
The Perkins Brailler, redesigned by PDT, received the prestigious Business Week IDEA Silver Award, citing its sensitivity to social responsibility. The IDEA program is the premier international competition honoring design excellence. PDT was featured in the news on several occasions during the year.
The channel to market for TZ products is through established distributors that service specialized industries. TZ has broadened its distribution by signing a distribution agreement with AVAD, a leading distributor of custom home technology products and has appointed International Office Products Cooperative (IOPC) as a
4
Intellectual Property (IP)
New Product Development
Significant progress has been made during the year on the IP portfolio. TZ currently has forty three (43) pending patent families consisting of one hundred and fifty nine (159) worldwide applications. The portfolio currently holds forty seven (47) granted patents which includes ten (10) recent grants in Fixing and Release Systems, Bolt Assembly, Further Improvements in Fixing and Release Systems, Fastener Networks (US grant), Smart Memory Alloy Control (US grant), Tracks Power and Data Tracks, and Fasteners and Other Assemblies (US grant).
Throughout FY2009, TZ closely examined the portfolio for areas to trim expenses. As a result of this process IP costs were reduced by 40% from the budget by reallocating work to in house counsel, delaying prosecution on certain applications, and trimming applications that were determined to be not core to the business agenda. Further to this, TZ has contracted with an external party to examine remaining Application IP for possible licensing or sale to third parties.
Value Added Reseller of its TZ InBox™ solution platform. Additionally Hafele, a global manufacturer of architectural and furniture hardware distributes TZ products through its catalogues.
TZI has several new products, including software applications, currently in Beta testing that will further target the Data Center and Intelligent Enclosures markets. The release of these new products early in 2010 will better equip the company to meet its sales objectives in the target segments. Two Product Managers have been added to the team to develop value based business cases, undertake market needs analysis and in depth research to ensure Product Development activity is properly targeted and economically justified.
4

Review of Operations (continued)
Moving Forward
DIRECTORS’ REPORT (continued)
The Directors have evaluated the Group, its products and opportunities. Despite the downward pressure of the past year they consider the core technology to be sound and commercially viable. They have worked closely with management on the Group's near term business strategy; taking corrective action where needed to ensure the team is properly equipped to attack their sales objectives in 2010.
Restoring shareholder value starts by getting to a cash positive position, which the Directors are targeting for early FY2011. The objective of generating near term sales must be pursued with intensity and in the past few months this has been the main focus of the Board.
Accordingly, the business plan for 2010 is directed on three specific market segments where TZ’s product set is well differentiated and the value proposition clear. These market segments are outlined in more detail later in this section.
With the Group stabilised, sights are now turning to the definition of longer term growth plans that will underpin the company’s future success. It is recognized that a more structured approach to product commercialization is a key part of these plans. The Group’s original strategy of licensing its technology to established manufacturers had merit, but this is only effective if strong demand exists for the product or technology. TZ’s disruptive technology and Intellectual Property (IP) is still at a relatively early stage of adoption and the company must prove there is a market need for it. This stage is about market validation and building customer demand. The plans currently being executed along with the recent commercial successes will move TZ to the next step where the objective is to enter into OEM relationships with large companies that integrate TZ products with their own, successful execution at this stage then leads to the third step where licensing and selling of IP rights to others, on favorable terms to TZ, will be possible.
5
Target Markets
The Directors believe following these “3 steps” and executing plans that reflect the requirements of each step to be the most expedient and practical way to drive growth and expand market access.
Additionally, future plans will place a greater emphasis on software development as there are significant opportunities to increase revenue through a broader set of TZ software applications - expanding software development capability is an immediate priority.
Traditional access control systems have mainly focused on securing the entrance doors of buildings. TZ’s intelligent security and sensing products extend access control systems beyond the entrance door to other objects that must be secured. It also provides networked access control, monitoring, and audit traceability for objects that are typically secured with a physical key, if at all. These applications can collectively be described as opportunities for “TZ MicroSecurity™”.
TZ’s past work has resulted in products that are now ready, or materially ready for market. Distribution and sales partners are in place and the favorable response from customers for TZ Praetorian are all encouraging indicators of success in 2010.
Increasingly there is a need to provide security at the object or “microsecurity” level such as a data storage rack or filing cabinet. Companies that must be compliant with security requirements such as PCI DSS (Payment Card Industry Data Security Standard), HIPAA (Health Insurance Portability and Accountability Act) and Sarbanes Oxley must have auditable systems in place to prove compliance.
TZ technology creates “Intelligent Enclosures” at the very edge of these access control networks and enables storage of any access event in a central database. There are millions of cabinets, equipment racks, drawers, lockers, closets, access and service panels that increasingly must be secured and monitored. TZ MicroSecurity™ addresses that need.
5

Review of Operations (continued)
Data Centers
Intelligent Secure Enclosures
An Intelligent Secure Enclosure is any storage repository or enclosure having the following characteristics:
TZ MicroSecurity™ products have been designed so that it can integrate with third party access control systems or act as a standalone solution to provide for a wide range of TZ MicroSecurity™ applications in a number of vertical and horizontal target markets.
TZ is targeting the $2B data center market. Pilot installations have validated the value of TZ products in this segment and the benefits of TZ MicroSecurity are readily cost justified. TZ systems provide cost effective electronic audit trail and cabinet level security. The joint development partnership with Anixter has resulted in TZ Praetorian™, the first open architecture cabinet locking system that can be integrated with existing Enterprise level access controllers and standard cabling infrastructure.
TZ is nearing completion of a complimentary solution that combines control software and hardware into a standalone product. These integrated solutions represent extensions to the product line targeted at customers that do not need/want Enterprise level control. TZ Praetorian Express and Centurion systems will allow for simple setup and monitoring of smaller standalone local TZ networks along with all auxiliary sensing options available from TZ hardware. The addition of standard software allows TZ to capture a greater share of the system revenue stream while allowing a new level of partnerships with 3rd party software through the TZ API (Application Programming Interface).
- The need to secure and monitor items placed within the storage enclosure
DIRECTORS’ REPORT (continued)
6
Custom Installation
- The need to restrict, control and record access to openings of the enclosure in order to secure the stored items
- The need to detect, record and respond to environmental factors within or surrounding the enclosure such as tamper events, temperature, humidity, detection of an object, presence of liquids, gases and other compounds
For many market segments outside of data centers, TZ products can provide the same benefits of electronic audit trails and physical security to meet specific problems that are not being solved cost effectively by existing enclosure suppliers. Custom TZ software in combination with standard TZ hardware can address targeted markets in goods delivery and storage for the so-called logistical “last mile”. TZ InBox™, for the Accountable Mail market, is the first example of TZ software and hardware manufactured into physical lockers. Similar software applications will be developed that extend the TZ Inbox concept into numerous other market segments.
As noted earlier, TZ has signed a distribution agreement with AVAD, a leading distributor of custom home technology products. AVAD distributes TZ components that tie into 3rd party control systems in their product line such as RTI, Universal Remote Control, and Phillips. TZ also continues to work with other controller manufacturers such as Crestron and AMX to create software modules that will allow TZ products, sold through AVAD, to be integrated in the home and commercial markets. This market has been hit hard by the recent economic crisis and while this channel doesn’t typically sell physical security products, the technology integrators are looking for new products to offer their clients.
p g
- Examples of Intelligent Enclosures include networked electronic lockers, evidence storage cabinets, blood and bio assay storage, next generation overhead bins and vertical storage systems in public transportation and next generation of mail and automated package delivery boxes.
6

Review of Operations (continued)
OEM Relationships
Licensing Across Vertical Markets
Conclusion
DIRECTORS’ REPORT (continued)
As TZ products gain validation in these markets, TZ will establish credibility and enable agreements to be established with OEM’s (Original Equipment Manufacturers) for TZ products to be sold through other distribution channels. Fortune 500 companies with brands that span the general industrial security market are of particular interest. TZ is preparing to extend its existing products to fit this large market and is investigating several OEM partnerships for the TZ Intevia® Radial and other new hardware and software products. The wider general Security market is only now beginning to understand the benefits and growth possibilities of the type of cabinet-level and object security covered by TZ MicroSecurity
It remains an important longer term objective to license TZ intellectual property and products in market segments that have onerous product qualification requirements and other high barriers to entry. TZ continues to pursue IP coverage for technology that will provide value for the Company. The last year has seen more focus on near-term development although several new IP-generating projects have continued in the background. The turmoil of the last year, both in the world and at TZ, has been a setback for making favorable agreements in these areas, however attractive deal opportunities will return once TZ’s business validation has demonstrated the value of TZ technology.
PDT is an integral part of Intellectual Property development and further growth is planned in the next year by expanding the funding available for PDT to develop ideas and revenue opportunities that are generated outside of normal client consulting work. PDT’s growing expertise in the medical device industry and telemedicine category connects PDT to a wide network of innovative companies actively involved in developing and licensing new technology.
7
Conclusion
The management and directors of TZL appreciate the contributions from all stakeholders in the Company who are responsible for the progress made to reach this point. We stand closer than ever before to turning the original founding vision into positive returns.
TZ is committed to bringing game changing and innovative solutions to market through PDT service offerings and TZ MicroSecurity™ products that will grow revenues and ultimately fulfill the company vision of providing intelligent fastening of objects in thousands of applications.
The directors would like to thank the TZ and PDT operations team lead by John Freese and Mark Schwartz for their dedicated contributions under difficult circumstances. It is hard to exaggerate the negative effect and distraction to the business caused by the issues of FY2009 but the company has weathered the storm and is now on an even keel to head into the new year.
A special thanks is extended to our shareholders for their support and patience so the Directors could to do what was absolutely required to secure and stabilize the company.
7

Significant Changes in State of Affairs
Likely Developments
(ii) the amendment to the conversion price of the remaining 12,000 convertible notes held by QVT at no more than A$1.20 per TZL share, being a 20% premium to the maximum conversion price in (i) above. All other terms of the convertible notes will remain the same. That is, interest at 10% per annum will be payable, with the next interest payment being due on 31 December 2010. If not converted to ordinary shares, the principal of $12 million will need to be repaid on 19 February 2013.
The Group defaulted on its payment obligations to QVT triggering a default notice to be issued by QVT demanding payment of $26.4 m of debt and accrued interest that could not be repaid. After intense negotiation the Group successfully entered into a workout plan with QVT which shareholders will be asked to vote on. The main terms of the workout plan are:
(i) the conversion of A$18.6 million of debt comprising convertible notes, interest and other debt owed by TZL to QVT into at least 18.6 million ordinary shares which will be issued to QVT at a maximum conversion price of A$1.00. The 18.6 million debt to be converted in equity is comprised of A$12.0 million in principal owing to QVT under half (12,000) of the 24,000 convertible notes held by QVT, approximately A$4.8 million in interest owing to QVT for the 2008 and 2009 calendar years and approximately A$1.8 million legal and advisory fees that QVT has guaranteed and paid for on behalf of TZL.
DIRECTORS’ REPORT (continued)
During the year the Group issued 1,000,000 fully paid ordinary shares at a price of $1.00 each to raise a $1,000,000. As part of the terms of that placement, the Company also issued 1,000,000 options which are exercisable at $0.75 at any time before 15 June 2010.
8
Dividends
The particular information required by s299 (1) of the Corporations Act (2002) has not been included in this report, as the inclusion of such information is likely to result in unreasonable prejudice to the Company.
No dividend has been paid or declared since the commencement of the financial year. The Directors do not recommend the payment of a dividend.
8
Information on Directors
Mr Mark BourisChairman and Executive Director
Mr Bouris is the founder and Chairman of Yellow Brick Road, a financial advisory firm. The primary function of YBR is in its accounting division. Yellow Brick Road (YBR) owns a number of accountancy practices and legal practices.
Mr Bouris has been involved in the finance and property sectors for over 25 years. In 1996 he founded Wizard Home Loans – Australia's largest non-bank lender. From1996 to 2004 Mr Bouris introduced three substantial capital partners to his business, raising in excess of $150,000,000 ($150M). That money was raised with subscriptions from Publishing and Broadcasting Ltd, Deutsche Asset Management Ltd (representing the largest industry funds in Australia) and ABN Amro Bank. All of these entities became equal shareholders in the group holding company Australian Financial Investments Group Ltd. Each of the above shareholders had two board seats and Mr Bouris was executive chairman.
Australian Financial Investments Group Ltd made a major acquisition in 2002 from ABN Amro Bank when it acquired Australian Mortgage Securities Ltd (AMS). AMS was a global leader in issuance of Residential Mortgage Backed Securities raising in excess of $10,000,000,000 ($10BN) throughout its business life. Mr Bouris chaired that part of the business and attended the global road shows in raising those funds.
In 2004, General Electric acquired the Australian Financial Investments Group Ltd, and its subsidiary company Wizard Home Loans Ltd, from companies associated with Mr Bouris, Publishing and Broadcasting Ltd, Deutsche Asset Management Ltd, and ABN Amro Ltd. Mr Bouris was retained as non-executive chairman by General Electric until February 2009 when his tenure terminated.
In July 2004 Mr Bouris was appointed Adjunct Professor (Banking & Finance and Business Law & Tax) at the University of NSW and also sits on the Australian School of Business Advisory Council Board. He is also an industry leader on consumer protection issues, having chaired the Federal Government's enquiry into E-Commerce and consumer protection in 2001.
DIRECTORS’ REPORT (continued)
9
Interests in Shares & Options
Ordinary Shares Nil Options Nil
Mr Kenneth TingExecutive Director and Company Secretary
Interests in Shares & Options
Ordinary Shares 72,725 Options Nil
is in its accounting division. Yellow Brick Road (YBR) owns a number of accountancy practices and legal practices. In addition, it owns financial planning businesses and insurance broking businesses. YBR advises a range of clients from small business to large business in most aspects of finance, tax, fund raising, accounting standards, audit, forensic research, equity and share market activity. Mr Bouris is a fellow of the Institute of Chartered Accountants and YBR has 40 professionally qualified staff in its Sydney Head Office.
Mr Ting has a passion for technology and has worked with technology companies throughout his career. He has been involved in the completion of over $5 Billion in M&A, private equity and IPO assignments in Austalia, USA and Europe. His industry specialisation is in the electronics manufacturing, software, IT services, telecom and Internet sector.
Mr Ting holds a Bachelor of Commerce and Bachelor of Law with First Class Honors from Adelaide University and is a member of the Institute of Chartered Accountants. Mr Ting is currently an Associate Director of Nextec Strategic Capital, a Technology Investment Banking firm based in Sydney. He is also a director of an international telecoms company which he founded in 2002.
Mr Kenneth Ting has a background in accounting, law and investment banking with a focus on the commercialisation of technology and public and private equity raisings. Mr Ting joined Deutsche Bank in 1997 after 4 years at PricewaterhouseCoopers Corporate Finance and Tax division. He was Vice President of Technology Investment Banking at Deutsche Bank and worked in Deutsche Bank's Sydney, San Francisco and London offices.
9
Information on Directors (continued)
Willem de VlugtNon Executive Director
Interests in Shares & Options
Ordinary Shares Nil Options Nil
Directors Meetings
DIRECTORS’ REPORT (continued)
Mr Willem de Vlugt is an experienced Industrialist. Apart from a few years at Akso Nobel, he worked most of his life for Royal Packaging Industries Van Leer NV (17,000 people and 42 countries), which he listed on the Amsterdam Stock Exchange in 1996. For 17 years he worked in the USA, France, Argentina and Brazil. In 1988 he was promoted to the Executive Board and in 1991 to Chairman and CEO.
Mr de Vlugt took early retirement in 1999 and with some friends started Linx Telecom, a small data transfer and co-location company which, after an initial difficult start, is now very successful and has expanded all over Eastern Europe. Customers include Boeing, Microsoft, Deutsche Bank, and HP.
Mr de Vlugt is the Chairman of Holland Venture BV and Chairman of ICT Automation NV, a public company which is listed on the Amsterdam Stock Exchange. He graduated in Law from Free University Amsterdam and attended various courses in Corporate Strategy at INSEAD and the Advanced Management Program at Harvard University.
The number of Directors’ meetings and number of meetings attended by each of the Directors of the Company during the financial year were:
10
M. Bouris 1 1
K. Ting 1 1
W. de Vlugt 1 1
Minute books prior to the appointment of the new Board of Directors were not made available by the previous Company Secretary. Therefore, no details of previous Directors Meetings can be provided at this time.
during the financial year were:
No. of Meetings
Held
No. of Meetings Attended
10

Remuneration Report
The Remuneration Report is set out under the following mainheadings:
1. Principles used to determine the nature and amount of remuneration
2. Details of remuneration
3. Services agreements
4. Share–based compensation
1. Principles Used To Determine The Nature And Amount Of Remuneration
Set competitive remuneration packages to attract and retain high calibre employees;
Link executive rewards to shareholder value creation; and
Establish appropriate demanding performance hurdles for variable executive remuneration.
The Board reviews and is responsible for the Group’s remuneration policies, procedures and practices.
The remuneration report has been prepared using the limited books and records that were available at the time of preparation.
DIRECTORS’ REPORT (continued)
The information provided under headings 1 to 4 includes remuneration disclosures that are required under Accounting Standard AASB 124 Related Party Disclosures. These disclosures have been transferred from the financial report.
The performance of the consolidated Group depends upon the quality of the Directors and Executives. The philosophy of the Directors in determining remuneration levels is to:
11
p p p , p p
The structure of Non–Executive Director and Executive remuneration is separate and distinct as follows:
(a) Non–Executive Directors’ Remuneration
Fixed remuneration
Variable Remuneration:
The constitution provides that the remuneration of Non– Executive Directors will not be more than the aggregate fixed sum determined by a general meeting of shareholders. The aggregate remuneration has been set at an amount of $500,000 per annum, which had been set at the annual general meeting of shareholders held on 30 November 2006.
The ASX Listing Rules specify that the aggregate remuneration of Non–Executive Directors shall be determined from time-to-time by a general meeting. The amount of aggregate remuneration sought to be approved by shareholders and the manner in which it is apportioned amongst Directors is reviewed annually. The Board considers advice from shareholders, and takes into account the fees paid to Non–Executive Directors of comparable companies, when undertaking the annual review process.
The Board seeks to set aggregate remuneration at a level that provides the Group with the ability to attract and retain Directors of a high calibre, whilst incurring a cost that is acceptable to shareholders.
The Group provides Directors with incentives designed to align their remuneration with the interests of shareholders. This is done through issuing options to acquire ordinary shares in the Group. The number and the terms of the options issued are determ ined by the Directors and approved by shareholders in a general meeting of members.
11

Remuneration Report (continued)
Fixed Remuneration
Variable Remuneration
Long–Term Incentives
DIRECTORS’ REPORT (continued)
(b) Group Executive and Executive Director remuneration
Remuneration consists of fixed remuneration and variable remuneration, which comprises short–term and long–term incentive schemes.
Fixed remuneration is reviewed annually by the Directors. The process consists of a review of relevant comparative remuneration in the employment market and within the Group and, where appropriate, external independent advice on policies and practices is obtained by the Board.
Senior managers are given the opportunity to receive their fixed (primary) remuneration in a variety of forms and are offered the opportunity to enter into “salary sacrifice” arrangements with the Group where appropriate. It is intended that the manner of payment chosen will be optimal for the recipient without creating additional cost for the Group.
The Group provides long–term incentives to senior Executives in a manner that aligns this element of remuneration with the creation of shareholder value. Executives and other employees can be issued with options to acquire shares in the Group. The number and the terms of the options issued are determined by the Directors after consideration of the employee’s performance and their ability to contribute to the achievement of the Group’s objectives.
12
��
2. Details of Remuneration
The Key Management Personnel of TZ Limited, including the Directors and the following consolidated Group Executives, have authority and responsibility for planning, directing and controlling the activities of the Group:
These Executives comprise the Group Executives who make or participate in making decisions that affect the whole, or a substantial part, of the business or who have the capacity to affect significantly the Group’s financial standing.
As the options confer a right but not an obligation on the recipient of the options, the Directors do not consider it necessary to establish a policy in relation to the person limiting his or her exposure to risk as a consequence of owning the options.
Details of the remuneration of the Key Management Personnel (as defined in AASB 124 Related Party Disclosures) are set out in Table 1 which follows.
12

Rem
un
erat
ion
Rep
ort
(co
nti
nu
ed)
Tab
le 1
: D
etai
ls o
f R
emu
ner
atio
n -
Dir
ecto
rs a
nd
Key
Per
son
nel
The
follo
win
g ta
ble
has
been
pre
pare
d on
the
basi
s of
info
rmat
ion
avai
labl
e at
the
time
of p
repa
ring
thes
e F
inan
cial
Rep
orts
(R
efer
to N
ote
1 -
Bas
is o
f Pre
para
tion)
:
Po
st E
mp
loym
ent
Ben
efit
sS
har
e B
ased
P
aym
ents
Cas
h S
alar
y, F
ees
&
Allo
wan
ces
Cas
h B
on
use
sS
up
erP
resc
rib
ed B
enef
its
Op
tio
ns
Tota
l
% P
erfo
rman
ce
Bas
ed B
on
us
Pay
men
ts%
Sh
are
Op
tio
n
Bas
ed P
aym
ents
Yea
r en
ded
30
Jun
e 20
09
No
n-E
xecu
tive
Dir
ecto
rsM
icha
el O
tten
(res
igne
d 18
Jun
e 20
09)
212,
336
-
-
-
-
212,
336
0.
00%
0.00
%
Will
em d
e V
lugt
-
-
-
-
-
-
-
-
Exe
cuti
ve D
irec
tors
And
rew
Sig
alla
(res
igne
d 2
June
200
9)86
4,77
6
-
10
,098
-
-
874,
874
0.
00%
0.00
%
John
Fal
cone
r (r
esig
ned
18 J
une
2009
)11
0,09
2
-
-
-
-
11
0,09
2
0.00
%0.
00%
Mar
k B
ouris
-
-
-
-
-
-
-
-
Ken
neth
Tin
g-
-
-
-
-
-
-
-
Oth
er K
ey M
anag
emen
t P
erso
nn
elC
hris
Kel
liher
(res
igne
d 5
May
200
9)34
7,96
6
-
-
-
-
34
7,96
6
0.00
%0.
00%
Mar
k S
chw
artz
430,
854
131,
389
-
11,8
29
-
574,
072
22
.89%
0.00
%
Dic
kory
Rud
duck
357,
283
-
-
-
-
357,
283
0.
00%
0.00
%
John
Fre
ese
210,
832
-
-
5,27
1
-
21
6,10
3
0.00
%0.
00%
Tim
othy
Koe
hler
157,
010
-
-
3,92
6
-
16
0,93
5
0.00
%0.
00%
Rob
ert P
agor
ek (
resi
gned
10
Aug
ust 2
009)
337,
316
-
-
4,43
4
-
34
1,75
0
0.00
%0.
00%
Dav
id F
eber
(cea
sed
11 N
ovem
ber
2008
)35
6,98
7
-
-
3,
025
-
360,
012
0.
00%
0.00
%
Yea
r en
ded
30
Jun
e 20
08
No
n-E
xecu
tive
Dir
ecto
rs
Mic
hael
Otte
n60
,000
-
-
-
71
,570
131,
570
0.
00%
54.4
0%
Exe
cuti
ve D
irec
tors
And
rew
Sig
alla
110,
092
-
9,90
8
-
12
0,00
0
0.00
%0.
00%
John
Fal
cone
r11
0,09
2
-
9,
908
-
71,5
70
19
1,57
0
0.00
%37
.36%
Oth
er K
ey M
anag
emen
t P
erso
nn
el
Chr
is K
ellih
er50
2,87
8
-
-
-
-
50
2,87
8
0.00
%0.
00%
Dav
id F
eber
409,
267
66,7
07
-
8,
617
36
0,00
7
84
4,59
8
7.90
%42
.62%
Dic
kory
Rud
duck
342,
005
55,5
89
-
-
-
39
7,59
4
13.9
8%0.
00%
Mar
k S
chw
artz
300,
180
-
-
7,07
2
-
30
7,25
2
0.00
%0.
00%
DIR
EC
TO
RS
’ RE
PO
RT
(co
nti
nu
ed) S
ho
rt T
erm
Ben
efit
s
13
Remuneration Report (continued)
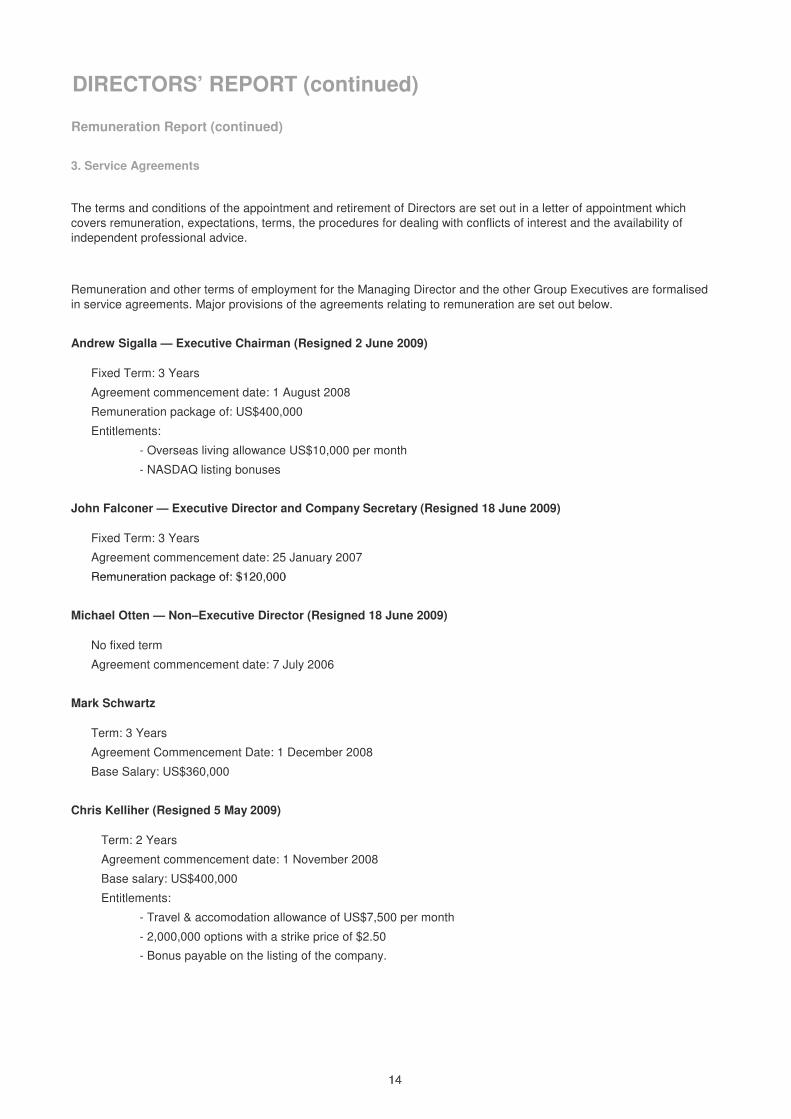
3. Service Agreements
Andrew Sigalla — Executive Chairman (Resigned 2 June 2009)
Fixed Term: 3 Years
Agreement commencement date: 1 August 2008
Remuneration package of: US$400,000
Entitlements:
- Overseas living allowance US$10,000 per month
- NASDAQ listing bonuses
John Falconer — Executive Director and Company Secretary (Resigned 18 June 2009)
Fixed Term: 3 Years
Agreement commencement date: 25 January 2007
Remuneration package of: $120 000
DIRECTORS’ REPORT (continued)
The terms and conditions of the appointment and retirement of Directors are set out in a letter of appointment which covers remuneration, expectations, terms, the procedures for dealing with conflicts of interest and the availability of independent professional advice.
Remuneration and other terms of employment for the Managing Director and the other Group Executives are formalised in service agreements. Major provisions of the agreements relating to remuneration are set out below.
14
Remuneration package of: $120,000
Michael Otten — Non–Executive Director (Resigned 18 June 2009)
No fixed term
Agreement commencement date: 7 July 2006
Mark Schwartz
Term: 3 Years
Agreement Commencement Date: 1 December 2008
Base Salary: US$360,000
Chris Kelliher (Resigned 5 May 2009)
Term: 2 Years
Agreement commencement date: 1 November 2008
Base salary: US$400,000
Entitlements:
- Travel & accomodation allowance of US$7,500 per month
- 2,000,000 options with a strike price of $2.50
- Bonus payable on the listing of the company.
14

Remuneration Report (continued)
Dickory Rudduck
Term: 1 Year with continuous renewal terms of 1 Year increments.
Agreement commencement date: 1 February 2008
Base salary: US$280,000
Entitlements:
- Signing bonus of $50,000.
- Salary increases to $320,000 if listed on the NASDAQ.
- Options based upon financial performance.
David Feber - Ceased 11 November 2008
Term: 3 Years
Agreement commencement date: 11 February 2008
Base salary: US$400,000
Entitlements:
- Financial performance–based bonuses as well as a bonus based on the sale/listing of the Company.
Robert Pagorek - Resigned 10 August 2009
Term: No expiry date
Agreement commencement date: 6 August 2008
Base salary: US$300,000
DIRECTORS’ REPORT (continued)
15
Entitlements:
- Signing bonus of $50,000.
- Salary increases to $320,000 if listed on the NASDAQ.
- Options based upon financial performance.
(i) Options to Acquire Shares
The issue of options is at the Board’s sole discretion. For each option issue, the Board specifies the vesting period, exercise price and exercise period in accordance with the provisions of the scheme. The exercise price must not be less than 100% of the share price immediately preceding the date of the invitation to participate in the scheme. The exercise period cannot exceed five years.
Options are issued to Directors and Executives as part of their remuneration. The options are issued based on performance criteria or to increase goal congruence between Executives, Directors and shareholders.
Each option entitles the holder to subscribe for one fully paid ordinary share in the Group at the issue price specified, at any time from the issue date until the expiry of the options subject to any vesting requirements. The option holders are not entitled as a matter of course to participate in any share issues of the Group. Options carry no dividend rights or voting rights and are issued for nil consideration.
Options issued to Non–Executive Directors are issued on terms that are approved by shareholders in a General Meeting.
No options have been issued to Key Management Personnel, including Directors, as remuneration during or since the end of the financial year.
15

Rem
un
erat
ion
Rep
ort
(co
nti
nu
ed)
The
num
ber
of o
ptio
ns h
eld
by a
ll K
ey M
anag
emen
t Per
sonn
el in
clud
ing
Dire
ctor
s an
d th
e m
ost h
ighl
y re
mun
erat
ed G
roup
Exe
cutiv
es, a
re a
s fo
llow
s (a
):
Op
enin
g B
alan
ceG
ran
ted
as
Co
mp
ensa
tio
nO
pti
on
s E
xpir
edO
pti
on
s E
xerc
ised
Clo
sin
g B
alan
ceV
este
d a
nd
E
xerc
isab
leU
nve
sted
2009
Mic
hael
Otte
n (r
esig
ned
18 J
une
2009
)20
0,00
0
-
-
-
2
00,0
00
2
00,0
00
-
Will
em d
e V
lugt
-
-
-
-
Exe
cuti
ve D
irec
tors
And
rew
Sig
alla
(res
igne
d 2
June
200
9)-
-
-
-
-
-
-
John
Fal
cone
r (r
esig
ned
18 J
une
2009
)20
0,00
0
-
-
-
2
00,0
00
2
00,0
00
-
Mar
k B
ouris
-
-
-
-
-
-
-
Ken
neth
Tin
g-
-
-
-
-
-
-
Dav
id F
eber
(cea
sed
11 N
ovem
ber
2008
)60
0,00
0
-
-
-
6
00,0
00
6
00,0
00
-
Dic
kory
Rud
duck
-
-
-
-
-
-
-
Mar
k S
chw
artz
75
,000
-
-
-
7
5,00
0
7
5,00
0
-
Tim
othy
Koe
hler
20,0
00
-
-
-
20,
000
10,
000
10,
000
John
Fre
ese
30,0
00
-
-
-
30,
000
15,
000
15,
000
1,12
5,00
0
-
-
-
1,
125,
000
1,
100,
000
25
,000
2008
No
n–E
xecu
tive
Dir
ecto
rs
Mic
hael
Otte
n 20
0,00
0
-
-
-
2
00,0
00
1
00,0
00
1
00,0
00
Exe
cuti
ve D
irec
tors
And
rew
Sig
alla
-
-
-
-
-
-
-
John
Fal
cone
r20
0,00
0
-
-
-
2
00,0
00
1
00,0
00
1
00,0
00
Key
Man
agem
ent
Per
son
nel
Chr
is K
ellih
er10
0,00
0
-
(10
0,00
0)
-
-
-
-
Dav
id F
eber
600,
000
-
-
-
600
,000
300
,000
300
,000
Dic
kory
Rud
duck
-
-
-
-
-
-
-
Mar
k S
chw
artz
-
75,
000
-
-
75,
000
-
7
5,00
0
Tim
othy
Koe
hler
-
20
,000
-
-
20,0
00
-
20,0
00
John
Fre
ese
-
30
,000
-
-
30,0
00
-
30,0
00
1,10
0,00
0
125,
000
100,
000
-
-
1,
125,
000
50
0,00
0
62
5,00
0
DIR
EC
TO
RS
’ RE
PO
RT
(co
nti
nu
ed)
No
n–E
xecu
tive
Dir
ecto
rs
Key
Man
agem
ent
Per
son
nel
(a)
Thi
s re
port
has
bee
n pr
epar
ed u
sing
info
rmat
ion
avai
labl
e at
the
time
of p
repa
ring
the
2009
Fin
anci
al R
epor
t (N
ote
1 -
Bas
is o
f Pre
para
tion)
16

Indemnification and Insurance of Directors and Officers
Significant After Balance Date Events
Share Options
At the date of this report, options over unissued shares or interests of the Company are as follows:
Expiry DateExercise
PriceNumber of
Options
24-Jan-10 $3.75 600,000
23-Jan-10 $3.00 300,000
23-Jan-10 $3.75 300,000
31-Dec-09 $3.75 200,000
DIRECTORS’ REPORT (continued)
The Group has not taken out an insurance policy indemnifying Directors and officers for the financial year nor has the Group provided any indemnification during the year.
Matters or circumstances that have arisen since the end of the financial year which significantly affected or may significant affect the operations of the economic entity, the results of those operations, or the state of affairs of the economic entity in future financial years are disclosed in Note 24.
17
31-Dec-09 $5.00 200,000
23-Oct-09 $4.50 2,665,500
18-Jan-11 $3.75 100,000
19-Jan-11 $3.75 195,000
20-Jan-11 $3.00 149,000
19-Feb-13 $4.00 3,000,000
15-Jun-10 $0.75 1,000,000
8,709,500
Environmental Issues
Corporate Governance
The consolidated entity’s operations are not regulated by any significant environmental regulation under a law of the Commonwealth or of a State or Territory.
The Directors are responsible for the corporate governance practices of the Company. The main corporate governance practices that were in operation during the financial year are set out in the Corporate Governance section of these financial statements.
17

Proceedings on Behalf of Company
Auditor’s Independence Declaration
Signed at Sydney this 23rd day of December 2009 in accordance with a resolution of the Board of Directors.
Mark Bouris Kenneth Ting
Director Director
DIRECTORS’ REPORT (continued)
No person has applied for leave of Court to bring proceedings on behalf of the Company or intervene in any proceedings to which the Company is a party for the purpose of taking responsibility on behalf of the Company for all or any part of those proceedings.
The Group was not a party to any such proceedings during the year.
The Company’s independent auditor has provided an independence declaration for the year ended 30 June 2009, a copy of the declaration is attached to and forms part of the Directors’ report.
1818


FOR THE FINANCIAL YEAR ENDED 30 JUNE 2009
2009 2008 2009 2008Note $ $ $ $
Revenue 2 18,219,905 15,975,275 507,126 913,758 Cost of sales 3 (12,747,645) (9,745,273) - -
Gross profit 5,472,260 6,230,002 507,126 913,758
Other income 2 585,265 155,432 562,709 176,555 Doubtful debts and impairment losses 3 (16,236,418) (1,920,017) (28,496,926) (9,762,078) Employment related expenses (8,894,986) (7,536,321) (690,983) (1,420,485) Occupancy expenses (609,368) (340,858) (86,439) (94,339) Communications expenses (377,513) (332,764) (47,713) (51,936) Depreciation (977,515) (568,580) (27,813) (6,354) Amortisation of intangibles (1,062,171) (716,518) - - Professional & corporate servcies (2,540,002) (2,352,535) (1,201,167) (1,671,853) Travel and accomodation (2,077,942) (2,298,495) (988,171) (1,011,136) Due dilligence and related costs - (1,145,094) - (1,145,094) Development costs (2,964,131) - - - Finance costs (2,991,840) (2,434,275) (2,949,414) (2,339,434) Other expenses (1,614,904) (1,127,315) (80,872) (78,391)
INCOME STATEMENT
Consolidated Entity Parent Entity
20
Loss before income tax 3 (34,289,265) (14,387,338) (33,499,661) (16,490,787)
Income tax expense (benefit ) 5 285,145 (16,634) (160,692) (55,252)
Loss from continuing operations (34,574,410) (14,370,704) (33,338,969) (16,435,535) Loss from discontinued operations after related income tax expense - - - -
Net loss for the year (34,574,410) (14,370,704) (33,338,969) (16,435,535)Loss attributable to members of the parent entity (34,574,410) (14,370,704) (33,338,969) (16,435,535)
Continued operationsBasic loss per share (cents) 6 (71.26) (33.84)Diluted loss per share (cents) 6 (71.26) (33.84)
* The above Income Statements should be read in conjunction with the accompanying notes.
20

BALANCE SHEETFOR THE FINANCIAL YEAR ENDED 30 JUNE 2009
2009 2008 2009 2008Note $ $ $ $
CURRENT ASSETSCash and cash equivalents 19 565,818 23,909,009 468,018 23,316,941 Trade and other receivables 7 2,834,539 9,455,904 35,669 6,543,950 Work in progress 8 687,106 56,794 - -
TOTAL CURRENT ASSETS 4,087,463 33,421,707 503,688 29,860,891
NON-CURRENT ASSETSTrade and other receivables 7 - - - - Other financial assets 9 - - 50,209,695 50,209,695 Property, plant and equipment 10 3,027,185 2,586,200 - 24,554 Intangible assets 11 53,594,220 51,989,189 - - Deferred tax asset 408,095 113,332 - -
TOTAL NON-CURRENT ASSETS 57,029,500 54,688,721 50,209,695 50,234,249
TOTAL ASSETS 61,116,964 88,110,428 50,713,383 80,095,140
CURRENT LIABILITIESTrade and other payables 12 6,242,164 3,152,038 3,857,995 1,142,577 Provisions 13 390,812 499,101 - - Borrowings 14 22,486,759 973,969 21,194,292 -
Consolidated Entity Parent Entity
21
Borrowings 14 22,486,759 973,969 21,194,292
TOTAL CURRENT LIABILITIES 29,119,735 4,625,108 25,052,287 1,142,577
NON-CURRENT LIABILITIESProvisions 13 791,782 763,574 - - Borrowings 14 - 20,791,804 - 20,791,804 Deferred tax liabilities 1,581,598 1,426,354 799,082 959,775
TOTAL NON-CURRENT LIABILITIES 2,373,380 22,981,732 799,082 21,751,579
TOTAL LIABILITIES 31,493,114 27,606,840 25,851,369 22,894,156
NET ASSETS 29,623,850 60,503,589 24,862,014 57,200,984
EQUITYIssued capital 15 115,948,325 114,948,325 115,948,325 114,948,325Reserves 16 (801,167) (3,495,838) 1,754,588 1,754,588Accumulated losses (85,523,308) (50,948,898) (92,840,899) (59,501,929)
TOTAL EQUITY 29,623,850 60,503,589 24,862,014 57,200,984
* The above Balance Sheets should be read in conjunction with the accompanying notes.
21

STATEMENT OF CHANGES IN EQUITYFOR THE FINANCIAL YEAR ENDED 30 JUNE 2009
Consolidated EntityOrdinary
Convertible Notes
Equity-Based Payment
Foreign Currency
Translation
Accumulated losses
Total
$ $ $ $ $ $
Balance at 1 July 2007 84,095,416 - 934,854 (604,769) (36,578,194) 47,847,307 Foreign currency translation reserve differences - - - (4,645,657) - (4,645,657) Total income & expenses for the year recognised directly in equity - - - (4,645,657) - (4,645,657) Loss for the year - - - - (14,370,704) (14,370,704)
Total income & expenses for the year - - - (4,645,657) (14,370,704) (19,016,361) Issue of capital during the period 32,020,997 2,368,394 - - - 34,389,391 Share issue cost (3,536,482) - - - - (3,536,482) Dividends paid - - - - - - Share buy back excess - - - - - - Share-based payment expense - - 819,734 - - 819,734
Balance at 30 June 2008 112,579,931 2,368,394 1,754,588 (5,250,426) (50,948,898) 60,503,589
Balance at 1 July 2008 112,579,931 2,368,394 1,754,588 (5,250,426) (50,948,898) 60,503,589 Foreign currency translation reserve differences - - - 2,694,671 - 2,694,671 Total income & expenses for the year recognised directly in equity - - - 2,694,671 - 2,694,671 Loss for the year - - - - (34,574,410) (34,574,410)
Total income & expenses for the year - - - 2,694,671 (34,574,410) (31,879,739) Issue of capital during the period 1,000,000 - - - 1,000,000 Share issue cost - - - - - - Dividends paid - - - - - - Share buy back excess - - - - - - Share-based payment expense - - - - - -
Balance at 30 June 2009 113,579,931 2,368,394 1,754,588 (2,555,755) (85,523,308) 29,623,850
ReservesShare Capital
22

STATEMENT OF CHANGES IN EQUITYFOR THE FINANCIAL YEAR ENDED 30 JUNE 2009
Parent Entity OrdinaryConvertible
NotesEquity-Based
PaymentAccumulated
lossesTotal
$ $ $ $ $
Balance at 1 July 2007 84,095,416 - 934,854 (43,066,394) 41,963,876 Foreign currency translation reserve differences - - - - - Total income & expenses for the year recognised directly in equity - - - - - Loss for the year - - - (16,435,535) (16,435,535)
Total income & expenses for the year - - - (16,435,535) (16,435,535) Issue of capital during the period 32,020,997 2,368,394 - - 34,389,391 Share issue cost (3,536,482) - - - (3,536,482)
Dividends paid - - - - - Share buy back excess - - - - - Share-based payment expense - - 819,734 - 819,734 Balance at 30 June 2008 112,579,931 2,368,394 1,754,588 (59,501,929) 57,200,984
Balance at 1 July 2008 112,579,931 2,368,394 1,754,588 (59,501,929) 57,200,984 Foreign currency translation reserve differences - - - - - Total income & expenses for the year recognised directly in equity - - - - - Loss for the year - - (33,338,969) (33,338,969)
Total income & expenses for the year - - - (33,338,969) (33,338,969) Issue of capital during the period 1,000,000 - - - 1,000,000 Share issue cost - - - - -
Dividends paid - - - - - Share buy back excess - - - - - Share-based payment expense - - - - - Balance at 30 June 2009 113,579,931 2,368,394 1,754,588 (92,840,898) 24,862,015
Share Capital Reserves
23

CASHFLOW STATEMENTFOR THE FINANCIAL YEAR ENDED 30 JUNE 2009
2009 2008 2009 2008
Note $ $ $ $
Receipts from customers 18,040,779 16,229,851 - -
(32,454,302) (23,184,306) (2,930,920) (5,556,847)
Interest received 898,372 614,069 831,506 589,378
(60,404) (1,524,950) (17,977) (1,430,108)
Deposit paid - (3,000) - (3,000)
Income tax paid (197,458) (5,336) - (622)
Net Cash Flows Used in Operating Activities 19(b) (13,773,012) (7,873,672) (2,117,391) (6,401,199)
(1,027,156) (1,694,436) (3,259) (12,057)
Payment for intangible assets (510,924) (5,900,035) - -
Loan to controlled entity - - (12,746,929) (9,762,079)
Net Cash Used in Investing Activities (1,538,080) (7,594,471) (12,750,188) (9,774,136)
Share issues 1,000,000 11,994,750 1,000,000 11,994,750
Share issue costs - (3,536,482) - (3,536,482)
Repayment of borrowing (366,441) (726,156) - -
Payment to former directors' related entities (9,544,052) - (9,544,052) -
Proceeds from line of credit borrowing 538,694 - - -
Proceeds from convertible note issue - 24,000,000 - 24,000,000
Net Cash Flows (Used in) / from Financing Activities (8,371,799) 31,732,112 (8,544,052) 32,458,268
Net (decrease) / increase in cash held (23,682,891) 16,263,969 (23,411,632) 16,282,933
Cash at beginning of the year 23,909,009 7,596,124 23,316,941 6,856,209
Effects of exchange rate fluctuations on the balances of cash held in foreign currencies 339,699 48,916 562,709 177,799
Cash at the End of Period 19(a) 565,818 23,909,009 468,019 23,316,941
* The above Cash Flow Statements should be read in conjunction with the accompanying notes.
Payment for plant and equipment
CASH FLOWS FROM OPERATING ACTIVITIES
CASH FLOWS FROM FINANCING ACTIVITIES
CASH FLOWS FROM INVESTING ACTIVITIES
Consolidated Entity Parent Entity
Payments to suppliers and employees
Interest paid
24

NOTES TO THE FINANCIAL STATEMENTSFOR THE FINANCIAL YEAR ENDED 30 JUNE 2009
1. SUMMARY OF ACCOUNTING POLICIES
Statement of Compliance
Basis of Preparation
(a) Principles of Consolidation
All inter-group balances and transactions between entities in the consolidation group, including any unrealised profits or losses, have been eliminated on consolidation. Accounting policies of subsidiaries have been changed where necessary to ensure consistency with those policies adopted by the parent entity.
Where controlled entities have entered or left the economic entity during the year, their operating results have been included/ excluded from the date control was obtained or until the date control ceased.
The consolidated financial statements comprise the financial statements of TZ Limited and all its controlled entities (refer note 9).
This financial report includes the consolidated financial statements and notes of TZ Limited and controlled entities (‘Consolidated Group' or ‘Group'), and the separate financial statements and notes of TZ Limited as an individual parent entity (‘Parent Entity’). TZ Limited is a public listed Company whose shares are quoted on the Australian Securities Exchange and is incorporated and is domiciled in Australia.
Except for the the above issues identified above, the financial report is a general purpose financial report that has been prepared in accordance with Australian Accounting Standards, Australian Accounting Standard Interpretations, other authoritative pronouncements of the Australian Accounting Standards Board and the Corporations Act 2001.
Australian Accounting Standards set out accounting policies that the AASB has concluded would result in a financial report containing relevant and reliable information about transactions, events and conditions to which they apply. Compliance with Australian Accounting Standards ensures that the financial statements and notes also comply with International Financial Reporting Standards. Material accounting policies adopted in the preparation of this financial report are presented below. They have been consistently applied unless otherwise stated.
The financial report has been prepared on an accruals basis and is based on historical costs, modified, where applicable, by the measurement at fair value of selected non–current assets, financial assets and financial liabilities.
A controlled entity is any entity controlled by TZ Limited whereby the Company has the power to control the financial and operating policies so as to obtain benefits from its activities. In assessing the power to govern, the existence and effect of holdings of actual and potential voting rights are considered. A list of controlled entities is contained in Note 8 to the financial statements.
The current Board and Management are in the process of reconstructing the financial records of the group. Limited books and records are available to support the various balances and further work will be required so that a level of comfort can be achieved. The Board has been reluctant to write down the value of the company unless an impairment has been clearly determined. The current Board and Management are committed to getting all anomolies identified and corrected in order to provide shareholders accurate and timely financial reporting going forward. The 2009 Financial Reports are presented based on the information available at the time of issuance, and adjustments may be required at the time of preparing the 2010 Financial Reports.
25

NOTES TO THE FINANCIAL STATEMENTS (CONTINUED)FOR THE FINANCIAL YEAR ENDED 30 JUNE 2009
1. SUMMARY OF ACCOUNTING POLICIES (continued)
(b) Going Concern
(c) Business Combinations
Business combinations occur where control over another business is obtained and results in the consolidation of its assets and liabilities. All business combinations, including those involving entities under common control, are accounted for by applying the purchase method.
The purchase method requires an acquirer of the business to be identified and for the cost of the acquisition and fair values of identifiable assets, liabilities and contingent liabilities to be determined as at acquisition date, being the date that control is obtained. Cost is determined as the aggregate of fair values of assets given, equity issued and liabilities assumed in exchange
Prior to 30 June 2009 the company was in default of certain conditions associated with its convertible note deed and in accordance with its rights under the deed, on 1 June 2009 the lender issued a notice requiring the company to redeem the convertible notes amounting to $24,000,000 plus any accrued interest. As detailed in notes 14 and 24 to the financial report, the company has subsequently reached an agreement with the lender in order to remedy the default and renegotiate the terms of the convertible note deed, subject to approval by the company’s shareholders at the annual general meeting scheduled for 18 February 2010.
The consolidated entity has continued support from QVT and investors, both of whom have contributed additional funds to the group, by way of convertible notes issued totalling $3,311,000, subsequent to balance date (Refer Note 24).
The group has favourable forecasts and, without the extraordinary cash draw downs that were experienced during the 2009 Financial Year, the Directors are hopeful that the consolidated entity will strengthen.
The ability of the company and the consolidated entity to continue as a going concern is dependent on shareholder approval and finalisation of the agreement reached between the company and its lender in respect of the convertible notes deed, the continued support of the group’s lenders and shareholders and the ability to generate future profits and positive cash flows.
The financial report has been prepared on a going concern basis. At 30 June 2009 the company’s and consolidated entity’s current liabilities exceeded current assets by $24,548,599 and $25,032,272 respectively. For the year ended 30 June 2009 the company and consolidated entity incurred losses after income tax of $33,338,969 and $34,574,410 respectively and net cash outflows from operating activities of $2,117,391 and $13,773,012 respectively.
(d) Income Tax
Deferred income tax expense reflects movements in deferred tax asset and deferred tax liability balances during the year as well unused tax losses.
obtained. Cost is determined as the aggregate of fair values of assets given, equity issued and liabilities assumed in exchange for control together with costs directly attributable to the business combination. Any deferred consideration payable is discounted to present value using the entity’s incremental borrowing rate.
Goodwill is recognised initially at the excess of cost over the acquirer’s interest in the net fair value of the identifiable assets, liabilities and contingent liabilities recognised. If the fair value of the acquirer’s interest is greater than cost, the surplus is immediately recognised in profit or loss.
The income tax expense (benefit) for the year comprises current income tax expense (benefit) and deferred tax expense (benefit).
Current income tax expense charged to the profit or loss is the tax payable on taxable income calculated using applicable income tax rates enacted, or substantially enacted, as at reporting date. Current tax liabilities (assets) are therefore measured at the amounts expected to be paid to (recovered from) the relevant taxation authority.
Current and deferred income tax expense (benefit) is charged or credited directly to equity instead of the profit or loss when the tax relates to items that are credited or charged directly to equity.
Deferred tax assets and liabilities are ascertained based on temporary differences arising between the tax bases of assets and liabilities and their carrying amounts in the financial statements. Deferred tax assets also result where amounts have been fully expensed but future tax deductions are available. No deferred income tax will be recognised from the initial recognition of an asset or liability, excluding a business combination, where there is no effect on accounting or taxable profit or loss.
26

NOTES TO THE FINANCIAL STATEMENTS (CONTINUED)FOR THE FINANCIAL YEAR ENDED 30 JUNE 2009
1. SUMMARY OF ACCOUNTING POLICIES (continued)
(d) Income Tax (continued)
(e) Cash and Cash Equivalents
(f) Property, Plant and Equipment
Deferred tax assets relating to temporary differences and unused tax losses are recognised only to the extent that it is probable that future taxable profit will be available against which the benefits of the deferred tax asset can be utilised.
Where temporary differences exist in relation to investments in subsidiaries, branches, associates, and joint ventures, deferred tax assets and liabilities are not recognised where the timing of the reversal of the temporary difference can be controlled and it is not probable that the reversal will occur in the foreseeable future.
Current tax assets and liabilities are offset where a legally enforceable right of set–off exists and it is intended that net settlement or simultaneous realisation and settlement of the respective asset and liability will occur. Deferred tax assets and liabilities are offset where a legally enforceable right of set–off exists, the deferred tax assets and liabilities relate to income taxes levied by the same taxation authority on either the same taxable entity or different taxable entities where it is intended that net settlement or simultaneous realisation and settlement of the respective asset and liability will occur in future periods in which significant amounts of deferred tax assets or liabilities are expected to be recovered or settled.
Cash and cash equivalents include cash on hand, deposits held at call with banks, other short-term highly liquid investments with original maturities of three months or less, and bank overdrafts. Bank overdrafts are shown within short-term borrowings in current liabilities on the balance sheet.
Property, plant and equipment is included at cost, less where applicable, any accumulated depreciation or amortisation. The carrying amount of property plant and equipment is reviewed annually by Directors to ensure it does not exceed the
Deferred tax assets and liabilities are calculated at the tax rates that are expected to apply to the period when the asset is realised or the liability is settled, based on tax rates enacted or substantively enacted at reporting date. Their measurement also reflects the manner in which management expects to recover or settle the carrying amount of the related asset or liability.
Office Furniture and Equipment 13% - 50%
Leasehold Improvement 20% - 33%
Motor Vehicle 20% - 25%
Plant & Equipment 20%
The depreciation rates used for each class of depreciable assets are:
carrying amount of property, plant and equipment is reviewed annually by Directors to ensure it does not exceed the recoverable amount.
The depreciable amount of all fixed assets is depreciated on a straight-line basis over the asset's useful life to the consolidated group commencing from the time the asset is held ready for use. Leasehold improvements are depreciated over the shorter of either the unexpired period of the lease or the estimated useful lives of the improvements.
27

NOTES TO THE FINANCIAL STATEMENTS (CONTINUED)FOR THE FINANCIAL YEAR ENDED 30 JUNE 2009
1. SUMMARY OF ACCOUNTING POLICIES (continued)
(g) Trade Receivables
(h) Accounts payable
(i) Employee entitlements
(j) Leases
The provisions for employee entitlements to wages, salaries and annual leave represent the amount which the consolidated entity has a present obligation to pay resulting from employees’ services provided up to balance date. The provision has been calculated at nominal amounts and includes related on-costs.
Trade receivables are recognised at original invoice amounts less an allowance for uncollectible amounts and have repayment terms between 30 and 90 days. Collectibility of trade receivables is assessed on an ongoing basis. Debts which are known to be uncollectible are written off. An allowance is made for doubtful debts where there is objective evidence that the Group will not be able to collect all amounts due according to the original terms. Objective evidence of impairment include financial difficulties of the debtor, default payments or debts more than 180 days overdue. On confirmation that the trade receivable will not be collectible the gross carrying value of the asset is written off against the associated provision.
The liability for employee entitlements to long service leave represents the present value of the estimated future cash outflows to be made by the employer resulting from employees’ services provided up to the balance date.
From time to time, the Group elects to renegotiate the terms of trade receivables due from customers with which it has previously had a good trading histroy. Such renegotiations will lead to changes in the timing of payments rather than changes to the amounts owed and are not, in the view of the directors, sufficient to require the derecognition of the original instrument.
Trade payables and other accounts payable are recognised when the Company becomes obliged to make future payments resulting from the purchase of goods and services. These amounts are unsecured and have 30 - 60 day payment terms
(k) Foreign Currency Transactions and Balances
Functional and Presentation Currency
Lease payments under operating leases, where substantially all the risks and benefits remain with the lessor, are charged as expenses in the period in which they are incurred. Lease incentives under operating leases are recognised as a liability and amortised on a straight-line basis over the life of the lease term.
Where assets are acquired by means of finance leases, the present value of minimum lease payments is established as an asset at the beginning of the lease term and amortised on a straight line basis over the expected economic life. A corresponding liability is also established and each lease payment is allocated between such liability and interest expense.
The functional currency of each of the Group’s entities is measured using the currency of the primary economic environment in which that entity operates. The consolidated financial statements are presented in Australian dollars which is the parent entity’s functional and presentation currency.
28

NOTES TO THE FINANCIAL STATEMENTS (CONTINUED)FOR THE FINANCIAL YEAR ENDED 30 JUNE 2009
1. SUMMARY OF ACCOUNTING POLICIES (continued)
Transaction and Balances
Group Companies
(l) Revenue Recognition
Exchange differences arising on the translation of non-monetary items are recognised directly in equity to the extent that the gain or loss is directly recognised in equity, otherwise the exchange difference is recognised in the income statement.
The financial results and position of foreign operations whose functional currency is different from the Group’s presentation currency are translated as follows:
- Assets and liabilities are translated at exchange rates prevailing at that reporting date;
Foreign currency transactions are translated into functional currency using the exchange rates prevailing at the date of the transaction. Foreign currency monetary items are translated at the year-end exchange rate. Non-monetary items measured at historical cost continue to be carried at the exchange rate at the date of the transaction. Non-monetary items measured at fair value are reported at the exchange rate at the date when fair values were determined.
Exchange differences arising on the translation of monetary items are recognised in the income statement, except where deferred in equity as a qualifying cash flow or net investment hedge.
- Income and expenses are translated at average exchange rates for the period; and
- Retained earnings and other equity are translated at the exchange rates prevailing at the date of the transaction.
Exchange differences arising on translation of foreign operations are transferred directly to the Group’s foreign currency translation reserve in the balance sheet. These differences are recognised in the income statement in the period in which the operation is disposed.
(l) Revenue Recognition
Sale of Goods
Rendering of Services
Interest and Dividend Income
Revenue from the sale of goods is recognised at the point of delivery as this corresponds to the transfer of significant risks and rewards of ownership of the goods and the cessation of all involvement in those goods.
Interest revenue is recognised using the effective interest rate method, which, for floating rate financial assets is the rate inherent in the instrument.
Revenue from engineering design services is recognised in accordance with the percentage of completion method. The stage of completion is measured by reference to total costs incurred to date as a percentage of estimated total costs for each contract. Where the contract outcome cannot be reliably measured, revenue is recognised only to the extent of the expenses recognised that are recoverable.
Revenue is measured at the fair value of the consideration received or receivable after taking into account any trade discounts and volume rebates allowed.
Dividend revenue is recognised when the right to receive a dividend has been established.
All revenue is stated net of the amount of goods and services tax (GST).
29

NOTES TO THE FINANCIAL STATEMENTS (CONTINUED)FOR THE FINANCIAL YEAR ENDED 30 JUNE 2009
1. SUMMARY OF ACCOUNTING POLICIES (continued)
(m) Goods and Services Tax
(n) Impairment of Assets
(o) Contributed Equity
(p) Share-Based Payments
Revenues, expenses and assets are recognised net of the amount of GST, except where the amount of GST incurred is not recoverable from the Tax Office. In these circumstances the GST is recognised as part of the cost of acquisition of the asset or as part of an item of the expense. Receivables and payables in the balance sheet are shown inclusive of GST.
Cash flows are presented in the cash flow statement on a gross basis, except for the GST component of investing and financing activities, which are disclosed as operating cash flows.
At each reporting date, the Group reviews the carrying values of its tangible and intangible assets to determine whether there is any indication that those assets have been impaired. If such an indication exists, the recoverable amount of the asset, being the higher of the asset’s fair value less costs to sell and value in use, is compared to the asset’s carrying value. Any excess of the asset’s carrying value over its recoverable amount is expensed to the income statement.
Where it is not possible to estimate the recoverable amount of an individual asset, the group estimates the recoverable amount of the cash-generating unit to which the asset belongs.
Ordinary shares are classified as equity.
Costs directly attributable to the issue of new shares or options are shown as a deduction from the equity proceeds, net of any income tax benefit. Costs directly attributable to the issue of new shares or options associated with the acquisition of a business are included as part of the purchase consideration.
The Group provides benefits to employees (including directors) of the Group in the form of share-based payment transactions
(q) Fair Values
The fair value of financial instruments not traded in an active market are determined using valuation techniques.
The Group provides benefits to employees (including directors) of the Group in the form of share-based payment transactions, whereby employees render services in exchange for shares or options over shares ("equity-settled transactions").
Fair values may be used for financial asset and liability measurement as well as for sundry disclosures.
Assumptions used are based on observable market prices and rates at balance date. Estimated discounted cashflows are used to determine fair value of the remaining financial instruments.
The carrying value less impairment provision of trade receivables and payables are assumed to approximate their fair values due to their short-term nature. The fair value of financial liabilities for disclosure purposes is estimated by discounting the future contractual cash flows at the current market interest rate that is available to the group for similar financial instruments.
30

NOTES TO THE FINANCIAL STATEMENTS (CONTINUED)FOR THE FINANCIAL YEAR ENDED 30 JUNE 2009
1. SUMMARY OF ACCOUNTING POLICIES (continued)
(r) Earnings Per Share
(i) Basic Earnings Per Share
(ii) Diluted Earnings Per Share
(s) Intangible Assets
(i) Goodwill
(ii) Trademarks and Licences
Goodwill represents the excess of the cost of the business combination over the Group's share of the net fair value of the identifiable assets, liabilities and contingent liabilities. Goodwill is not amortised but is measured at cost less any accumulated impairment losses. Goodwill is reviewed for impairment annually, or more frequently if events or changes in circumstances indicate that the carrying value may be impaired. Gains and losses on the disposal of an entity include the carrying amount of goodwill relating to the entity sold.
Goodwill acquired is allocated to each of the cash-generating units expected to benefit from the combination's synergies. Impairment is determined by assessing the recoverable amount of the cash-generating unit to which the goodwill relates. Impairment losses on goodwill cannot be reversed.
Earnings used to calculate diluted earnings per share are calculated by adjusting the basic earnings by the after-tax effect of dividends and interest associated with dilutive potential ordinary shares. The weighted average number of shares used is adjusted for the weighted average number of ordinary shares that would be issued on the conversion of all the dilutive potential ordinary shares into ordinary shares.
Basic earnings per share is determined by dividing the operating profit/ (loss) after income tax by the weighted average number of ordinary shares outstanding during the financial year.
( ) ade a s a d ce ces
(iii) Patents
(t) Investments and Other Financial Assets
Investments in subsidiaries are accounted for in the consolidated financial statements as described in note 1(a) and in the parent entity financial statements at cost in accordance with the cost alternative permitted in separate financial statements under AASB 127 Consolidated and Separate Financial Statements.
Trademarks and licences have an indefinite useful life and are carried at cost less accumulated impairment losses. Trademarks and licences are reviewed for impairment annually, or more frequently if events or changes in circumstances indicate that the carrying value may be impaired.
Intellectual property and customer relationships acquired as part of a business combination are recognised separately from goodwill and are carried at their fair value at date of acquisition less accumulated amortisation and impairment losses. Amortisation is calculated based on a straight line basis over the estimated useful life.
(iv) Intellectual Property & Customer Relationships
Expenditure directly attributable to the registration of patents is capitalised at cost and is amortised over the useful life of the patent. The carrying value of patents is reviewed annually for impairment.
31

NOTES TO THE FINANCIAL STATEMENTS (CONTINUED)FOR THE FINANCIAL YEAR ENDED 30 JUNE 2009
1. SUMMARY OF ACCOUNTING POLICIES (continued)
(u) Interest-bearing liabilities
(w) Critical Accounting Estimates and Judgements
The key estimates and judgements made by the directors include:
i) Impairment of related party loans, other advances and sundry debtors.
The preparation of a financial report in conformity with Australian Accounting Standards requires management to make estimates, judgements and assumptions based on historical knowledge and best available current information. Estimates assume a reasonable expectation of future events and are based on current trends and economic data obtained both externally and within the group. Actual results may differ from the estimates.
All loans and borrowings are initially recognised at fair value, net of transaction costs incurred. Borrowings are subsequently measured at amortised cost. Any difference between the proceeds (net of transaction costs) and the redemption amount is recognised in the income statement over the period of the loans and borrowings using the effective interest method.
The fair value of a liability portion of a convertible note is determined using a market rate of interest for an equivalent non-convertible note and stated on an amortised cost basis until conversion or maturity of the notes. The remainder of the proceeds is allocated to the conversion option and is shown as equity. Issue costs are apportioned between the liability and equity components based on the allocation of proceeds to the liability and equity components when the instruments are first recognised.
All borrowings are classified as current liabilities unless the Group has an unconditional right to defer settlement of the liability for at least 12 months after the balance sheet date.
As disclosed in Notes 3 and 7, during the 2009 financial year, significant loans were made to former directors and related parties. In addition, included in Sundry Debtors for the year ended 30 June 2008 were receivables relating to former directors.
ii) Non-impairment of intangibles
The Directors are currently undergoing a process together with an independent expert, to value the Group for the purposes of the QVT work out. As a part of this process, the value attributed to the intangible assets of the Group was considered, and given the outcomes of the review, the Directors do not consider that an impairment provision is required at this time.
These loans and receivables have been fully provided against for the purposes of the 2009 Financial Report as their recoverability is unknown at the time of preparing this report. Litigation has commenced in relation to the recovery of $13.2m of these loans and receivables, and a Contingent Asset has been disclosed in Note 21.
Further details can not be provided at this time due to the sensitivity surrounding the Supreme Court hearing scheduled for early 2010.
32

NOTES TO THE FINANCIAL STATEMENTS (CONTINUED)FOR THE FINANCIAL YEAR ENDED 30 JUNE 2009
1. SUMMARY OF ACCOUNTING POLICIES (continued)
(x) New Accounting Standards for Application in Future Periods
The AASB has issued new, revised and amended standards and interpretations that have mandatory application dates for future reporting periods. The Group has decided against early adoption of these standards. A discussion of those future requirements and their impact on the Group is as follows:
� AASB 3 “Business Combinations”, AASB 127 “Consolidated and Separate Financial Statements”, AASB 2008-3 “Amendments to Australian Accounting Standards arising from AASB 3 and AASB 127 [AASBs 1,2,4,5,7,101,107, 112, 114, 116, 121, 128, 131, 132, 133, 134, 136, 137, 138 & 139 and Interpretations 9 & 107] (applicable for annual reporting periods commencing from 1 July 2009) and AASB 2008-7 Amendments to Australian Accounting Standards – Cost of an Investment in a Subsidiary, Jointly Controlled Entity or Associate [ AASB 1, AASB 118, AASB 121, AASB 127 & AASB 136] (applicable for annual reporting periods commencing from 1 January 2009). These standards are applicable prospectively and so will only affect relevant transactions and consolidations occurring from the date of application. In this regard, its impact on the Group is not able to be determined.
� AASB 8 “Operating Segments” and AASB 2007-3 “Amendments to Australian Accounting Standards arising from AASB 8 [AASB 5, AASB 6, AASB 102, AASB 107, AASB 119, AASB 127, AASB 134, AASB 136, AASB 1023 & AASB 1038 (applicable for annual reporting periods commencing from 1 January 2009). This standard replaces AASB 114 and requires identification of operating segments on the basis of internal reports that are regularly reviewed by the group’s board for the purposes of decision making. Whilst the impact of this standard cannot be assessed at this stage, there is the potential for more segments to be identified. Given the lower economic level at which segments may be defined, and the fact that cash generating units cannot be bigger than operating segments, impairment calculations may be affected. Management presently does not believe impairment will result however.
� AASB 101 “Presentation of Financial Statements”, AASB 2007-8 “Amendments to Australian Accounting Standards arising from AASB 101”, and AASB 2007-10 “Further Amendments to Australian Accounting Standards arising from AASB 101” (all applicable to annual reporting periods commencing from 1 January 2009). The revised AASB 101 and amendments supersede the previous AASB 101 and redefines the composition of financial statements including the inclusion of a statement of comprehensive income. There will be no measurement or recognition impact on the Group. If an entity has made a prior period adjustment or reclassification, a third balance sheet as at the beginning of the comparative period will be required
� AASB 123 “Borrowing Costs” and AASB 2007-6 “Amendments to Australian Accounting Standards arising from AASB 123 [AASB 1, AASB 101, AASB 107, AASB 111, AASB 116 & AASB 138 and Interpretations 1 & 12]” (applicable for annual reporting periods commencing from 1 January 2009). The revised AASB 123 has removed the option to expense all borrowing costs and will therefore require the capitalisation of all borrowing costs directly attributable to the acquisition, construction or production of a qualifying asset. Management has determined that there will be no effect on the Group as a policy of capitalising qualifying borrowing costs has been maintained by the Group.
� AASB 2008-1 “Amendments to Australian Accounting Standard – Share Based Payments: Vesting Conditions and Cancellations [AASB 2]” (applicable for annual reporting periods commencing from 1 January 2009). This amendment to AASB 2 clarifies that vesting conditions consist of service and performance conditions only. Other elements of a share based payment transaction should therefore be considered for the purposes of determining fair value. Cancellations are also required to be treated in the same manner whether cancelled by the entity or by another party.
The Group does not anticipate early adoption of any of the above reporting requirements and does not expect them to have any material effect on the Group’s financial statements.
period will be required.
33
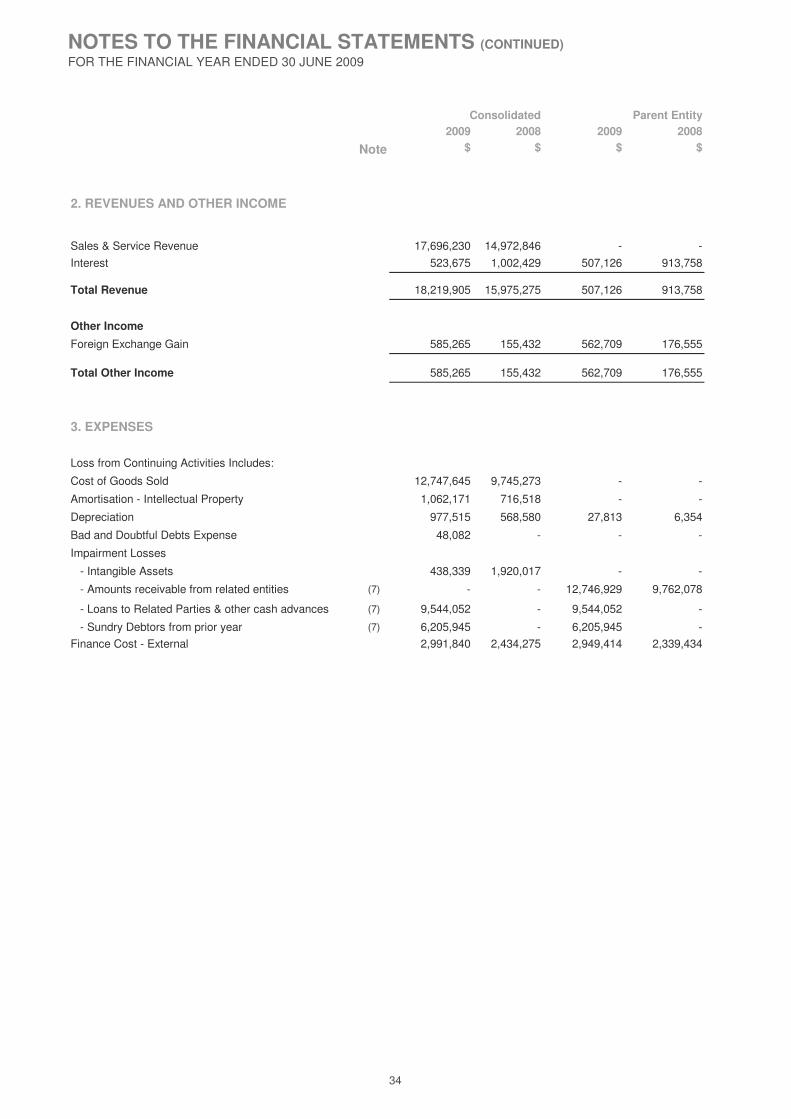
NOTES TO THE FINANCIAL STATEMENTS (CONTINUED)FOR THE FINANCIAL YEAR ENDED 30 JUNE 2009
2009 2008 2009 2008$ $ $ $
Sales & Service Revenue 17,696,230 14,972,846 - -
Interest 523,675 1,002,429 507,126 913,758
Total Revenue 18,219,905 15,975,275 507,126 913,758
Other Income
Foreign Exchange Gain 585,265 155,432 562,709 176,555
Total Other Income 585,265 155,432 562,709 176,555
3. EXPENSES
Loss from Continuing Activities Includes:
Cost of Goods Sold 12,747,645 9,745,273 - -
Amortisation - Intellectual Property 1,062,171 716,518 - -
Depreciation 977,515 568,580 27,813 6,354
Bad and Doubtful Debts Expense 48,082 - - -
Impairment Losses
- Intangible Assets 438,339 1,920,017 - -
- Amounts receivable from related entities (7) - - 12,746,929 9,762,078
- Loans to Related Parties & other cash advances (7) 9,544,052 - 9,544,052 -
- Sundry Debtors from prior year (7) 6,205,945 - 6,205,945 -
Finance Cost - External 2,991,840 2,434,275 2,949,414 2,339,434
Note
2. REVENUES AND OTHER INCOME
Parent EntityConsolidated
34

NOTES TO THE FINANCIAL STATEMENTS (CONTINUED)FOR THE FINANCIAL YEAR ENDED 30 JUNE 2009
4. CORRECTION OF ERRORS
The error has been corrected by restating each of the affected financial statement line items for the previous year.
There was no impact upon Basic and diluted earnings per share for the previous year as a result of this adjustment.
(ii) Correction of error relating to capitalised patent costs in previous financial year
(i) Correction of error relating to accounting for convertible notes in previous financial year
Basic and diluted earnings per share for the previous year have also been restated. The amount of the correction for both basic and diluted earnings per share was a decrease of 0.28 cents per share.
Basic and diluted earnings per share for the previous year have also been restated. The amount of the correction for both basic and diluted earnings per share was a decrease of 4.5 cents per share.
As at the previous financial year end, an amount of $2,654,765 was included within intangible assets which related to foreign exchange revaluations in respect of the group's overseas subsidiaries and therefore should have been allocated to the foreign currency translation reserve, resulting in intellectual property assets being overstated by $2,654,765 and foreign currency translation reserve credit balance being overstated by $2,654,765.
The error has been corrected by restating each of the affected financial statement line items for the previous year.
The error has been corrected by restating each of the affected financial statement line items for the previous year.
(iii) Correction of error relating to foreign exchange differences in previous financial year
(iv) Correction of error relating to impairment of amounts receivable by TZ Limited from subsidiaries in previous financial year
At the previous financial year end, there existed amounts receivable from Telezygology Inc. of $22,927,763. Significant doubts exist over the recoverability of this asset due to the financial position of Telezygology Inc. and it is therefore considered impaired. Consequently, adjustments have been made to trade and other receivables and either the prior period income statement or accumulated losses, as appropriate, to re-state these balances. These adjustments resulted in trade and other receivables for the parent company being overstated by $22,927,763, accumulated losses being understated by $13,165,685 and impairment expenses being understated by $9,762,078.
There was no impact upon Basic and diluted earnings per share for the previous year as a result of the adjustment.
As at the previous financial year end, certain capitalised costs were included within intangible assets which either had been capitalised incorrectly and not in accordance with AASB 138, had been capitalised correctly but subsequently should have been impaired as pertaining to patents which were later abandoned, or related to legacy assets which could no longer be substanciated and therefore were impaired. Consequently adjustments have been made to intangible assets and either the prior period Income Statement or Accumulated Losses, as appropriate, to re-state these balances. These adjustments in 2008 resulted in intellectual property assets being overstated by $6,851,413, accumulated losses being understated by $4,931,396 and impairment expenses being understated by $1,920,017.
During the previous financial year, convertible notes issued by the company were not correctly accounted for in accordance with AASB 132, resulting in borrowings being overstated by $3,208,196, deferred tax expense being overstated by $55,252, interest expense being understated by $175,225, issued capital being understated by $2,368,694 and deferred tax liability being understated by $959,775, with a net impact on profit after tax being an overstatement of $119,973.
The error has been corrected by restating each of the affected financial statement line items for the previous year.
35

NOTES TO THE FINANCIAL STATEMENTS (CONTINUED)FOR THE FINANCIAL YEAR ENDED 30 JUNE 2009
2009 2008 2009 2008
$ $ $ $
5. INCOME TAX
Current tax expense
Current tax expense 294,896 3,974 - -
Total current tax expense 294,896 3,974 - -
Deferred tax expense
Origination and reversal of temporary differences 150,941 34,644 - -
Deferred tax on convertible notes (160,692) (55,252) (160,692) (55,252)
Total income tax expense in the income statement 285,145 (16,634) (160,692) (55,252)
Prima facie income tax on the operating result before income tax at 30% (2008: 30%) (10,286,780) (4,316,201) (10,049,898) (4,947,236)
Tax Effect:
Tax losses not recognised 10,478,064 4,291,437 9,889,206 4,891,984
Difference in overseas tax rates 93,860 8,130 - -
Income Tax Expense attributable to result 285,145 (16,634) (160,692) (55,252)
The deferred tax asset arising from tax losses and timing differences has not been recognised as an asset because recovery of tax losses is not probable. 20,584,424 10,106,360 14,405,496 4,516,290
The taxation benefits of tax losses and timing differences not brought to account and will only be obtained if:
(b) conditions for deductibility imposed by the law are complied with; and
(c) no changes in tax legislation adversely affect the realisation of the benefit from the deductions.
(a) assessable income is derived of a nature and of amount sufficient to enable the benefit from the deductions to be realised;
Consolidated Parent Entity
The amount provided in respect of income tax differs from the amount prima facie payable on the operating result. The difference is reconciled as follows:
36
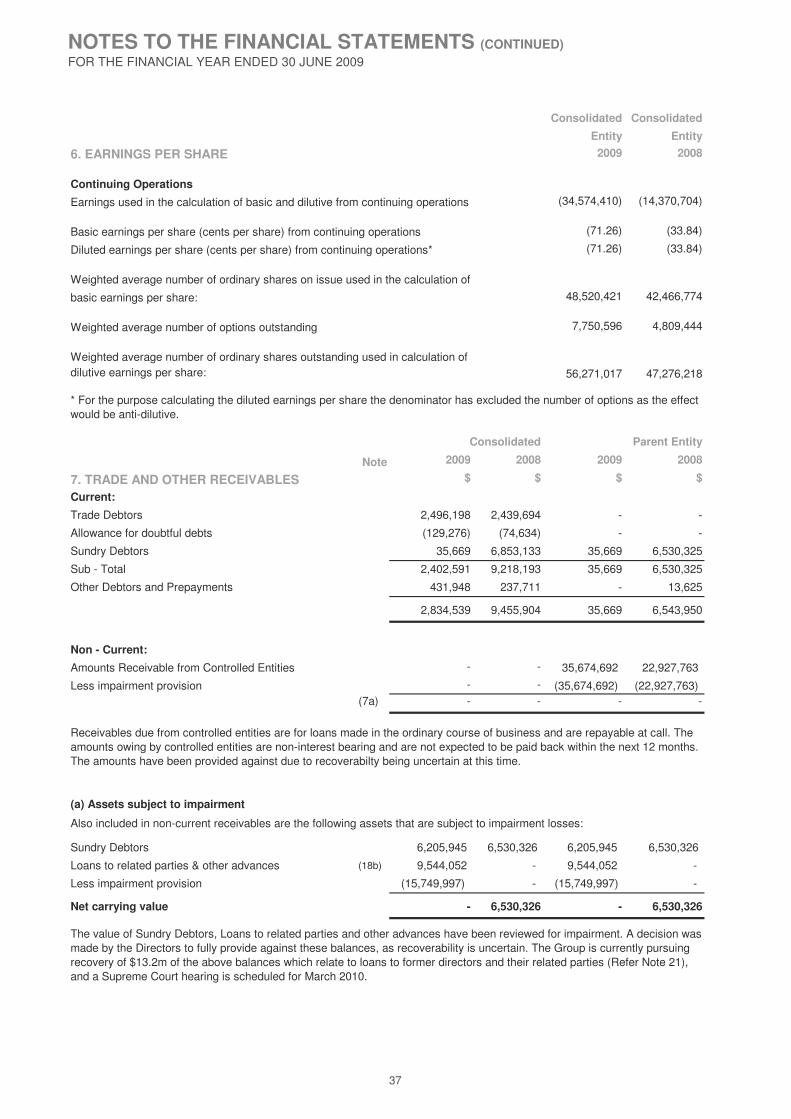
NOTES TO THE FINANCIAL STATEMENTS (CONTINUED)FOR THE FINANCIAL YEAR ENDED 30 JUNE 2009
Consolidated Consolidated
Entity Entity
6. EARNINGS PER SHARE 2009 2008
Continuing Operations
Earnings used in the calculation of basic and dilutive from continuing operations (34,574,410) (14,370,704)
Basic earnings per share (cents per share) from continuing operations (71.26) (33.84)
Diluted earnings per share (cents per share) from continuing operations* (71.26) (33.84)
Weighted average number of ordinary shares on issue used in the calculation of
basic earnings per share: 48,520,421 42,466,774
Weighted average number of options outstanding 7,750,596 4,809,444
Weighted average number of ordinary shares outstanding used in calculation ofdilutive earnings per share: 56,271,017 47,276,218
2009 2008 2009 2008
7. TRADE AND OTHER RECEIVABLES $ $ $ $
Current:
Trade Debtors 2,496,198 2,439,694 - -
Allowance for doubtful debts (129,276) (74,634) - -
Sundry Debtors 35,669 6,853,133 35,669 6,530,325
Sub - Total 2,402,591 9,218,193 35,669 6,530,325
Other Debtors and Prepayments 431,948 237,711 - 13,625
2,834,539 9,455,904 35,669 6,543,950
Non - Current:
Amounts Receivable from Controlled Entities - - 35,674,692 22,927,763
Less impairment provision - - (35,674,692) (22,927,763) (7a) - - - -
(a) Assets subject to impairment
Sundry Debtors 6,205,945 6,530,326 6,205,945 6,530,326
Loans to related parties & other advances (18b) 9,544,052 - 9,544,052 -
Less impairment provision (15,749,997) - (15,749,997) -
Net carrying value - 6,530,326 - 6,530,326
Consolidated Parent Entity
Receivables due from controlled entities are for loans made in the ordinary course of business and are repayable at call. The amounts owing by controlled entities are non-interest bearing and are not expected to be paid back within the next 12 months. The amounts have been provided against due to recoverabilty being uncertain at this time.
* For the purpose calculating the diluted earnings per share the denominator has excluded the number of options as the effect would be anti-dilutive.
Note
Also included in non-current receivables are the following assets that are subject to impairment losses:
The value of Sundry Debtors, Loans to related parties and other advances have been reviewed for impairment. A decision was made by the Directors to fully provide against these balances, as recoverability is uncertain. The Group is currently pursuing recovery of $13.2m of the above balances which relate to loans to former directors and their related parties (Refer Note 21), and a Supreme Court hearing is scheduled for March 2010.
37

NOTES TO THE FINANCIAL STATEMENTS (CONTINUED)FOR THE FINANCIAL YEAR ENDED 30 JUNE 2009
2009 2008 2009 2008
8. WORK IN PROGRESS $ $ $ $
Uncompleted / Unbilled Jobs - at Cost 687,106 56,794 - -
9. OTHER FINANCIAL ASSETS
Shares in Controlled Entities - at Cost - - 50,209,695 50,209,695
Controlled Entities Country of
IncorporationClass of Shares
2009 2008
Parent Entity
TZ Limited Australia Ordinary
Subsidiaries of TZ Limited
Telezygology, Inc. USA Ordinary 100 100
PDT Holdings, Inc. USA Ordinary 100 100
Product Development Technologies, Inc. USA Ordinary 100 100
PDT Tooling, Inc. USA Ordinary 100 100
PDT Southeast Limited Liability Company (LLC)** USA Ordinary 100 100
CJSC PDT Ukraine Ukraine Ordinary 90 90
Consolidated Parent Entity
**(An LLC is treated as a partnership for US purposes)
% Owned
38

NOTES TO THE FINANCIAL STATEMENTS (CONTINUED)FOR THE FINANCIAL YEAR ENDED 30 JUNE 2009
Consolidated Parent Entity
2009 2008 2009 2008
$ $ $ $
Property, Plant and Equipment
Office Furniture and Equipment 456,164 558,446 - 24,554
Leasehold Improvements 1,444,782 1,173,248 - -
Motor Vehicle 5,657 24,337 - -
Plant & Equipment 1,120,581 830,169 - -
Total Property, Plant & Equipment 3,027,184 2,586,199 - 24,554
Total Cost 6,626,737 4,924,571 34,615 31,356
Accumulated Depreciation (3,599,551) (2,338,371) (34,615) (6,802)
Total Property, Plant & Equipment 3,027,185 2,586,200 - 24,554
Movements During the Year
Office Furniture and Equipment
Beginning of Year 558,446 996,027 24,554 19,299
Additions 152,420 164,173 3,259 11,609
Disposals (2,782) - - -
Depreciation Expense (363,983) (513,363) (27,813) (6,353)
Net Foreign Currency Adjustment on Translation 112,063 (88,391) - -
End of Year 456,164 558,446 - 24,554
Leasehold Improvements
Beginning of Year 1,173,248 292,305 - -
Additions 367,763 1,196,832 - -
Disposals - (52,829) - -
Depreciation Expense (310,796) (172,693) - -
Net Foreign Currency Adjustment on Translation 214,566 (90,366) - -
End of Year 1,444,782 1,173,248 - -
Motor Vehicle
Beginning of Year 24,337 56,007 - -
Additions - - - -
Disposals - - - -
Depreciation Expense (24,465) (26,998) - -
Net Foreign Currency Adjustment on Translation 5,786 (4,671) - -
End of Year 5,657 24,337 - -
Plant & Equipment
Beginning of Year 830,170 718,645 - -
Additions 420,533 397,051 - -
Disposals - - - -
Depreciation Expense (278,271) (192,923) - -
Net Foreign Currency Adjustment on Translation 148,149 (92,603) - -
End of Year 1,120,581 830,170 - -
10. PROPERTY, PLANT AND EQUIPMENT
39
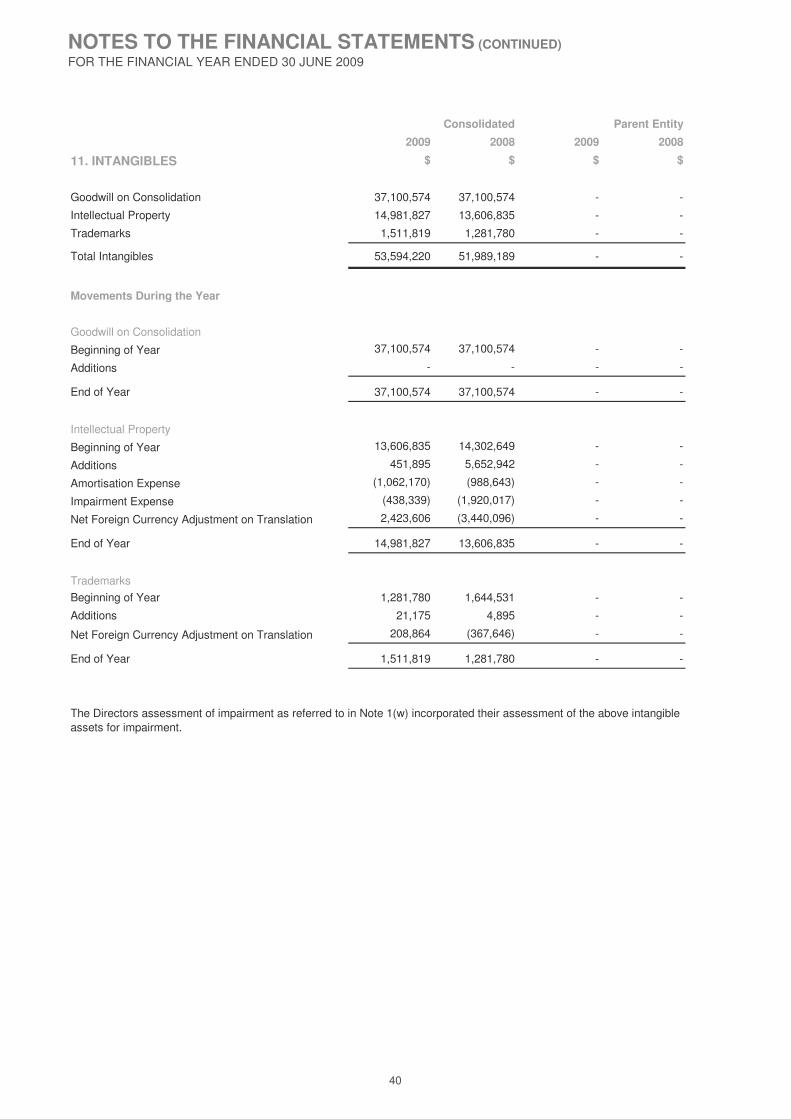
NOTES TO THE FINANCIAL STATEMENTS (CONTINUED)FOR THE FINANCIAL YEAR ENDED 30 JUNE 2009
Consolidated Parent Entity
2009 2008 2009 2008
11. INTANGIBLES $ $ $ $
Goodwill on Consolidation 37,100,574 37,100,574 - -
Intellectual Property 14,981,827 13,606,835 - -
Trademarks 1,511,819 1,281,780 - -
Total Intangibles 53,594,220 51,989,189 - -
Movements During the Year
Goodwill on Consolidation
Beginning of Year 37,100,574 37,100,574 - -
Additions - - - -
End of Year 37,100,574 37,100,574 - -
Intellectual Property
Beginning of Year 13,606,835 14,302,649 - -
Additions 451,895 5,652,942 - -
Amortisation Expense (1,062,170) (988,643) - -
Impairment Expense (438,339) (1,920,017) - -
Net Foreign Currency Adjustment on Translation 2,423,606 (3,440,096) - -
End of Year 14,981,827 13,606,835 - -
Trademarks
Beginning of Year 1,281,780 1,644,531 - -
Additions 21,175 4,895 - -
Net Foreign Currency Adjustment on Translation 208,864 (367,646) - -
End of Year 1,511,819 1,281,780 - -
The Directors assessment of impairment as referred to in Note 1(w) incorporated their assessment of the above intangible assets for impairment.
40
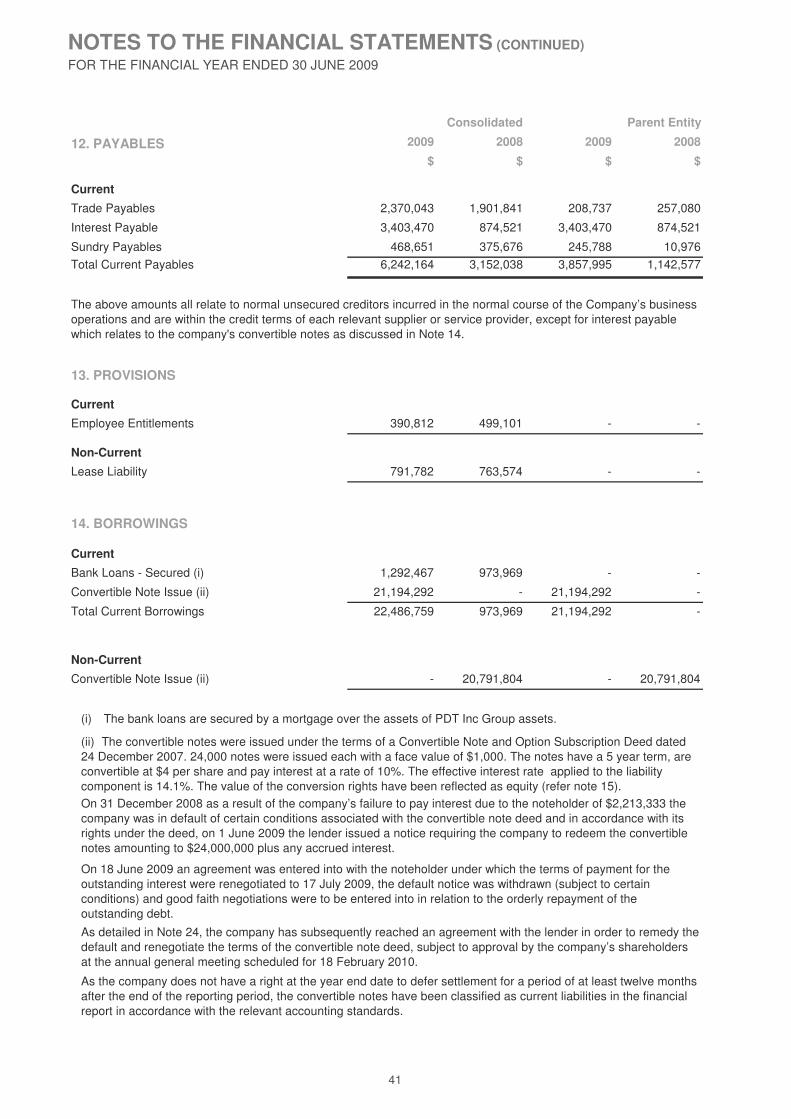
NOTES TO THE FINANCIAL STATEMENTS (CONTINUED)
FOR THE FINANCIAL YEAR ENDED 30 JUNE 2009
Consolidated Parent Entity
12. PAYABLES 2009 2008 2009 2008
$ $ $ $
Current
Trade Payables 2,370,043 1,901,841 208,737 257,080
Interest Payable 3,403,470 874,521 3,403,470 874,521
Sundry Payables 468,651 375,676 245,788 10,976
Total Current Payables 6,242,164 3,152,038 3,857,995 1,142,577
13. PROVISIONS
Current
Employee Entitlements 390,812 499,101 - -
Non-Current
Lease Liability 791,782 763,574 - -
14. BORROWINGS
Current
Bank Loans - Secured (i) 1,292,467 973,969 - -
Convertible Note Issue (ii) 21,194,292 - 21,194,292 -
Total Current Borrowings 22,486,759 973,969 21,194,292 -
Non-Current
Convertible Note Issue (ii) - 20,791,804 - 20,791,804
As detailed in Note 24, the company has subsequently reached an agreement with the lender in order to remedy the default and renegotiate the terms of the convertible note deed, subject to approval by the company’s shareholders at the annual general meeting scheduled for 18 February 2010.
As the company does not have a right at the year end date to defer settlement for a period of at least twelve months after the end of the reporting period, the convertible notes have been classified as current liabilities in the financial report in accordance with the relevant accounting standards.
The above amounts all relate to normal unsecured creditors incurred in the normal course of the Company’s business operations and are within the credit terms of each relevant supplier or service provider, except for interest payable which relates to the company's convertible notes as discussed in Note 14.
(i) The bank loans are secured by a mortgage over the assets of PDT Inc Group assets.
(ii) The convertible notes were issued under the terms of a Convertible Note and Option Subscription Deed dated 24 December 2007. 24,000 notes were issued each with a face value of $1,000. The notes have a 5 year term, are convertible at $4 per share and pay interest at a rate of 10%. The effective interest rate applied to the liability component is 14.1%. The value of the conversion rights have been reflected as equity (refer note 15). On 31 December 2008 as a result of the company’s failure to pay interest due to the noteholder of $2,213,333 the company was in default of certain conditions associated with the convertible note deed and in accordance with its rights under the deed, on 1 June 2009 the lender issued a notice requiring the company to redeem the convertible notes amounting to $24,000,000 plus any accrued interest.
On 18 June 2009 an agreement was entered into with the noteholder under which the terms of payment for the outstanding interest were renegotiated to 17 July 2009, the default notice was withdrawn (subject to certain conditions) and good faith negotiations were to be entered into in relation to the orderly repayment of the outstanding debt.
41

NOTES TO THE FINANCIAL STATEMENTS (CONTINUED)FOR THE FINANCIAL YEAR ENDED 30 JUNE 2009
Consolidated Parent Entity
2009 2008 2009 2008
15. ISSUED CAPITAL $ $ $ $
Issued & Paid Up Capital (i) 113,579,931 112,579,931 113,579,931 112,579,931
Convertible Note Issues (ii) 2,368,394 2,368,394 2,368,394 2,368,394
115,948,325 114,948,325 115,948,325 114,948,325
(i) Issued & Paid Up Capital
Movements During the Year:
Opening Balance 112,579,931 84,095,416 112,579,931 84,095,416
Shares Issued During the Year:
23 October & 6 November 2007 (a) - 11,994,750 - 11,994,750
To 30 June 2008 (b) - 20,026,247 - 20,026,247
16 June 2009 (c) 1,000,000 - 1,000,000 -
Share Issue Costs - (3,536,482) - (3,536,482)
Closing Balance 113,579,931 112,579,931 113,579,931 112,579,931
No. No. No. No.
Opening Balance 48,479,325 38,725,276 48,479,325 38,725,276
23 October & 6 November 2007 (a) - 2,665,500 - 2,665,500
To 30 June 2008 (b) - 7,088,549 - 7,088,549
16 June 2009 (c) 1,000,000 - 1,000,000 -
Closing Balance 49,479,325 48,479,325 49,479,325 48,479,325
(a) The Company placed a total of 2,665,500 fully paid ordinary shares at a price of $4.50 per share to raise a total of $11,994,750
42
(ii) Convertible Note Issue
Movements During the Year:
Opening Balance 2,368,394 - 2,368,394 -
Convertible Notes Issued During the Year:
24 December 2007 ����������������������� � 2,368,394 ����������������������� � 2,368,394
Closing Balance 2,368,394 2,368,394 2,368,394 2,368,394
This equity component relates to the value of the conversion rights relating to the company's convertible notes as discussed in Note 14.
( ) p y p , , y p y p p , ,before costs.
(b) The Company issued a total of 7,088,549 fully paid ordinary shares on the conversion of $20,000,000 Convertible notes pursuant to the terms and conditions of the Convertible notes issued.(c) The Company issued 1,000,000 fully paid ordinary shares for $1.00 each.
42

NOTES TO THE FINANCIAL STATEMENTS (CONTINUED)FOR THE FINANCIAL YEAR ENDED 30 JUNE 2009
Consolidated Parent Entity
2009 2008 2009 2008
15. ISSUED CAPITAL (continued) No. No. No. No.
(iii) Share Unquoted Options
Opening Balance 7,709,500 1,800,000 7,709,500 1,800,000
Options Issued
23 October & 6 November 2007 (d) - 2,665,500 - 2,665,500
18 January 2008 (e) - 444,000 - 444,000
19 February 2008(f) - 3,000,000 - 3,000,000
17 June 2009 (g) 1,000,000 - 1,000,000 -
Options Exercised
Up to 30 June 2009 - - - -
Options Expired
31 December 2007 - (200,000) - (200,000)
Up to 30 June 2009 - - -
Closing Balance 8,709,500 7,709,500 8,709,500 7,709,500
(d) The Company issued 2,665,500 free options that were attached to 2,665,500 fully paid shares placed during the year . Each option on issue entitles the holder to one fully paid ordinary share by the payment of the exercise price $4.50 per option at any time before the expiry date of 23 October 2009.
(e) The Company issued 444,000 options to acquire 444,000 fully paid shares in the Company to staff of the Group on the competition and successful achievement of their 2007 calendar targets. Of the 444,000 options issued, 295,000 options entitle the holder to one fully paid ordinary share by the payment of the exercise price $3.75 per options at any time before the expiry date of 19 January 2011, the balance 149,000 options are exercisable at $3.00 per share at any time before 20 January 2011.
(f) The Company issued 3,000,000 options to acquire 3,000,000 fully paid shares in the Company on the $24 million dollar Convertible t l t d t th C l ti h ld th 4 F b 2008 Th ti h ld titl d t f ll
43
note placement as approved at the Company general meeting held on the 4 February 2008. The options holders are entitled to one fully paid ordinary share by the payment of the exercise price $4.00 per option at any time before the expiry date of 19 February 2013.
(g) The Company issued 1,000,000 options to subscribe for 1,000,000 fully paid ordinary shares at an exercise price of $0.75 at any time before the expiry date of 15 June 2010.
43

NOTES TO THE FINANCIAL STATEMENTS (CONTINUED)FOR THE FINANCIAL YEAR ENDED 30 JUNE 2009
15. ISSUED CAPITAL (continued)
(iii) Employee Share Option Plan
(iv) Uncalled Capital
(v) Terms and Conditions of Unquoted Options
(vi) Capital Management
Management controls the capital of the Group in order to ensure that the Group can fund its operations and continue as a going concern. Its capital includes ordinary share capital; share options and reserves; and financial liabilities, supported by financial assets.
No shares have been issued by virtue of an exercise of an option during the year or to the date of this report.
No calls are outstanding at year end. All issued shares are fully paid.
In managing its capital, the Group’s primary objective is to ensure its continued ability to provide a consistent return for its equity shareholders through a combination of capital growth and distributions through payment of dividends to its shareholders. In order to achieve this objective, the Group seeks to maintain a gearing ratio that balances risks and returns at an acceptable level and also to maintain a sufficient funding base to enable the Group to meet its working capital and strategic investment needs. In making decisions to adjust its capital structure to achieve these aims, either through altering its dividend policy, new share issues, or the reduction of debt, the Group considers not only its short-term position but also its long-term operational and strategic objectives .
The Group’s gearing ratio at the balance sheet date is shown below :
All unquoted options are held by the group's lenders, prior or current Directors, employees and consultants to the Company or their associates. Each option entitles the holder to subscribe for one fully paid share in the Company at the exercise price per share at any time from the date of issue until expiry of the options subject to various vesting dates.
44
Consolidated Parent
Gearing Ratios 2009 2008 2009 2008
$ $ $ $
Net debt 22,486,759 21,765,773 21,194,292 20,791,804
Total equity 29,623,850 60,503,589 24,862,014 57,200,984
Total capital 52,110,609 82,269,362 46,056,306 77,992,788 Gearing Ratio 43% 26% 46% 27%
The Group’s gearing ratio at the balance sheet date is shown below :
44

NOTES TO THE FINANCIAL STATEMENTS (CONTINUED)FOR THE FINANCIAL YEAR ENDED 30 JUNE 2009
Consolidated Parent Entity
2009 2008 2009 2008
16. RESERVES $ $ $ $
Foreign Currency Translation Reserve (2,555,755) (5,250,426) - -
Share-Based Payment Reserve 1,754,588 1,754,588 1,754,588 1,754,588
Total Reserves (801,167) (3,495,838) 1,754,588 1,754,588
Movements During the Year:
Foreign Currency Translation Reserve
Opening Balance (5,250,426) (604,769) - -
Adjustment Arising from the Translation of Foreign Controlled Entities’ Financial Statements 2,694,671 (4,645,657) - -
Closing Balance (2,555,755) (5,250,426) - -
Share Based Payment Reserve
Opening Balance 1,754,588 934,854 1,754,588 934,854
Share Based Payment - 819,734 - 819,734
Closing Balance 1,754,588 1,754,588 1,754,588 1,754,588
The foreign currency translation reserve is used to record exchange differences on translation of foreign controlled subsidiaries. The reserve is recognised in the income statement when the investment is disposed of.
45
g
The share-based payments reserve is used to recognise the fair value of options issued to employees. This reserve can be transferred to retained earnings if options lapse and subsequently be declared as a dividend.
45

NOTES TO THE FINANCIAL STATEMENTS (CONTINUED)FOR THE FINANCIAL YEAR ENDED 30 JUNE 2009
17. KEY MANAGEMENT PERSONNEL DISCLOSURES
(a) Directors
The names of persons who were Directors of the Company at any time during the year are:
(i) Non–Executive Director Mr. Willem de Vlug Appointed 18 June 2009Mr. Michael Otten Resigned 18 June 2009
(ii) Executive Directors Mr. Mark Bouris Appointed 18 June 2009Mr. Kenneth Ting Appointed 18 June 2009Mr. Paul Casey Appointed 2 June 2009. Resigned 15 June 2009Mr. Andrew Sigalla Resigned 2 June 2009Mr. John Falconer Resigned 18 June 2009
(b) Other Key Management Personnel
Mr. Dickory Rudduck TZ Inc. Chief Technical OfficerMr. Mark Schwartz PDT Inc. President and CEOMr. David Feber CEO TZ Inc. (Resigned on 11 November 2008)Mr. Chris Kelliher CEO TZ Inc. (Resigned on 5 May 2009)Mr. Timoth Koehler CFO TZ Inc. Mr. John Freese CEO TZ Inc.
Consolidated Parent (c) Key Management Personnel Compensation 2009 2008 2009 2008
$ $ $ $
Short–Term Benefits 3,555,423 1,956,810 824,582 280,184Other Benefits - 35,505 - 19,816
The following persons also had authority and responsibility for planning, directing and controlling the activities of the Group, directly or indirectly, during the financial year:
46
Other Benefits - 35,505 - 19,816Share–Based Payments - 503,147 - 143,140
Total 3,555,423 2,495,462 824,582 443,140
46
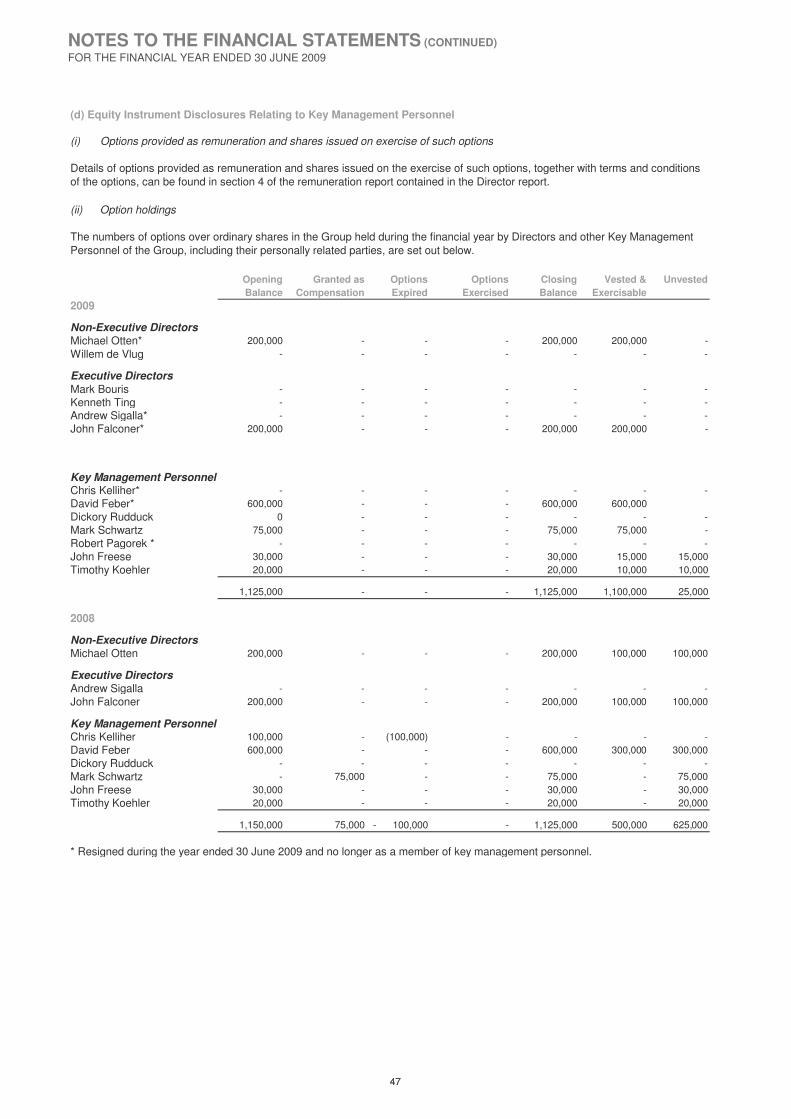
NOTES TO THE FINANCIAL STATEMENTS (CONTINUED)FOR THE FINANCIAL YEAR ENDED 30 JUNE 2009
(d) Equity Instrument Disclosures Relating to Key Management Personnel
(i) Options provided as remuneration and shares issued on exercise of such options
(ii) Option holdings
Opening Granted as Options Options Closing Vested & UnvestedBalance Compensation Expired Exercised Balance Exercisable
2009
Non-Executive DirectorsMichael Otten* 200,000 - - - 200,000 200,000 - Willem de Vlug - - - - - - -
Executive DirectorsMark Bouris - - - - - - - Kenneth Ting - - - - - - - Andrew Sigalla* - - - - - - - John Falconer* 200,000 - - - 200,000 200,000 -
Key Management PersonnelChris Kelliher* - - - - - - - David Feber* 600,000 - - - 600,000 600,000Dickory Rudduck 0 - - - - - - Mark Schwartz 75,000 - - - 75,000 75,000 - Robert Pagorek * - - - - - - - John Freese 30,000 - - - 30,000 15,000 15,000Timothy Koehler 20,000 - - - 20,000 10,000 10,000
1,125,000 - - - 1,125,000 1,100,000 25,000
2008
Details of options provided as remuneration and shares issued on the exercise of such options, together with terms and conditions of the options, can be found in section 4 of the remuneration report contained in the Director report.
The numbers of options over ordinary shares in the Group held during the financial year by Directors and other Key Management Personnel of the Group, including their personally related parties, are set out below.
47
2008
Non-Executive DirectorsMichael Otten 200,000 - - - 200,000 100,000 100,000
Executive DirectorsAndrew Sigalla - - - - - - - John Falconer 200,000 - - - 200,000 100,000 100,000
Key Management PersonnelChris Kelliher 100,000 - (100,000) - - - - David Feber 600,000 - - - 600,000 300,000 300,000 Dickory Rudduck - - - - - - - Mark Schwartz - 75,000 - - 75,000 - 75,000 John Freese 30,000 - - - 30,000 - 30,000Timothy Koehler 20,000 - - - 20,000 - 20,000
1,150,000 75,000 - 100,000 - 1,125,000 500,000 625,000
* Resigned during the year ended 30 June 2009 and no longer as a member of key management personnel.
47

NOTES TO THE FINANCIAL STATEMENTS (CONTINUED)FOR THE FINANCIAL YEAR ENDED 30 JUNE 2009
(e) Shareholdings
Opening Granted as Other Closing
Balance Compensation Changes Balance2009
Non–Executive DirectorsMichael Otten* 38,640 - - 38,640 Willem de Vlug - - - -
Executive Directors - Mark Bouris - - - - Kenneth Ting - - 72,725 72,725 Andrew Sigalla* 1,362,950 - 696,589 2,059,539 John Falconer* 395,273 - 213,000 608,273
Key Management PersonnelChris Kelliher* 413,035 - - 413,035 David Feber* - - - - Dickory Rudduck 1,340,000 - (240,000) 1,100,000 Mark Schwartz 126,016 - (46,000) 80,016 John Freese - 5,000 5,000
3,675,914 - 701,314 4,377,228
2008
Non–Executive DirectorsMichael Otten 38,640 - - 38,640
Executive DirectorsAndrew Sigalla 1,266,450 - 96,500 1,362,950 John Falconer 395,273 - - 395,273
Key Management PersonnelChris Kelliher 413,035 - - 413,035
The numbers of shares in the Group held during the financial year by Directors and other Key Management Personnel of the Group, including their personally related parties, are set out below. There were no shares granted during the reporting period as compensation.
48
, ,David Feber - - - - Dickory Rudduck 1,340,000 - - 1,340,000 Mark Schwartz 251,016 - (125,000) 126,016
3,704,414 - (28,500) 3,675,914
* Resigned during the year ended 30 June 2009 and no longer as a member of key management personnel.
48

NOTES TO THE FINANCIAL STATEMENTS (CONTINUED)FOR THE FINANCIAL YEAR ENDED 30 JUNE 2009
18. RELATED PARTY TRANSACTIONS
(a) Subsidiary
TZ Limited is the ultimate parent entity of the group.
Interests in subsidiaries are set out in Note 9.
Loan granted to Controlled Entities - Non-Current
2009 2008
$ $
Opening Balance 22,927,763 13,165,685
Loan granted during the year 12,746,929 9,762,078
Closing Balance 35,674,692 22,927,763
These loans are interest free, repayable at call, but not expected to be repaid within 12 months.
(b) Transactions with Related Parties
i) Accounting Services
Accounting fees charged by Dunbar Associates Pty Limited (John Falconer) for the year ended 30 June
2009 were $322,720 (2008: $249,111).
ii) Consultancy Services
Consultancy fees charged by No Compromises Pty Limited (Michael Otten) for the year ended 30 June
2009 were $160,000 (2008: $36,833).
iii) Loans to former directors and related parties
iv) Undeterminable Amounts
As disclosed in Notes 3 and 7, during the 2009 financial year, significant loans of approximately $9.5 million were made to former directors and related parties. In addition, included in Sundry Debtors for the year ended 30 June 2008 were receivables directly relating to former directors of approximately $3.7million.
These loans and receivables have been fully provided against for the purposes of the 2009 Financial Report as their recoverability is unknown at the time of preparing this report. Litigation has commenced in relation to the recovery of $13.2m of these loans and receivables, and a Contingent Asset has been disclosed in Note 21.
Further details can not be provided at this time due to the sensitivity surrounding the Supreme Court hearing scheduled for early 2010.
The directors advise that due to the lack of books and records, some transactions with related parties may not be identified in Note 18.
49

NOTES TO THE FINANCIAL STATEMENTS (CONTINUED)FOR THE FINANCIAL YEAR ENDED 30 JUNE 2009
Consolidated Parent Entity2009 2008 2009 2008
$ $ $ $
19. NOTES TO THE CASH FLOW STATEMENT
(a) Reconciliation of Cash
For the purpose of the cash and cash equivalents in the balance sheet and cash flow statement, cash includes:Cash at Bank 232,254 2,598,317 134,454 2,006,248
Deposit on Call 333,564 21,310,692 333,564 21,310,693
565,818 23,909,009 468,018 23,316,941
with ‘Net Loss from Continuing Operations’
Loss after Income Tax (34,574,410) (14,370,704) (33,338,969) (16,435,535)
Non-Cash Flows in Loss
Depreciation 430,250 568,580 27,813 6,354
Amortisation of Intangibles 1,062,171 716,518 - -
Unrealised Exchange Loss/(Gain) (22,796) (155,432) (1,855) (176,555)
Share-Based Payments - 819,735 - 819,735
Employee Entitlements (108,289) 120,720 - -
Doubtful Debts and Impairment Losses 16,236,418 2,015,428 28,496,926 9,762,078
Changes in Assets and Liabilities
(Increase)/Decrease in Trade Debtors (1,862) 290,579 - -
(Increase)/Decrease in Prepayments and Other Debtors (194,236) 58,455 324,380 (898,454)
(I )/D i W k i P (630 312) 702 035
(b) Reconciliation of ‘Net Cash Flow used in Operating Activities’
50
(Increase)/Decrease in Work in Process (630,312) 702,035 - -
(Decrease)/Increase in Creditors and Accruals 3,788,259 1,240,441 2,132,519 401,207
Non-cash interest charged on convertible notes 402,488 175,225 402,488 175,225
(Decrease)/Increase in Deferred Tax Liability (160,692) (55,252) (160,692) (55,252)
Cash Flows Used in Operations (13,773,012) (7,873,672) (2,117,391) (6,401,199)
50

NOTES TO THE FINANCIAL STATEMENTS (CONTINUED)FOR THE FINANCIAL YEAR ENDED 30 JUNE 2009
2009 2008 2009 2008
$ $ $ $
20. SEGMENT INFORMATION
Segment Revenues and Results
Engineering and Design 18,242,461 15,040,394 (1,235,441) (5,777,230)
Head Office / Unallocated 562,709 1,090,313 (33,338,969) (6,553,484)
Consolidated 18,805,170 16,130,707 (34,574,410) (12,330,714)
Assets Liabilities
2009 2008 2009 2008
Segment Assets and Liabilities$ $ $ $
Engineering and Design (2,654,760) 67,617,830 (9,266) 4,246,405
Head Office / Unallocated 35,669 29,885,445 799,082 25,142,577
Consolidated (2,619,090) 97,503,275 789,816 29,388,982
Accounting Policies
Business and Geographical Segments
Segment Revenues Segment Results
All sales were to customers outside the consolidated entity
Segment revenues and expenses are to external customers/suppliers and those directly attributable to the segments and include any joint revenue and expenses where a reasonable basis of allocation exists. Segment assets include all assets used by a segment and consist principally of cash, receivables, intangible assets and property, plant and equipment, net of allowances and accumulated depreciation and amortisation. While most of such assets can be directly attributed to individual segments, the carrying amount of certain assets used jointly by two or more segments is allocated to the segments on a reasonable basis. Segment liabilities consist principally of borrowings, payables, employee benefits, accrued expenses, and provisions. Segment assets and liabilities do not include deferred income taxes.
51
The Consolidated entity’s predominant activities are the licensing of its patented intellectual property and operating software, as well as providing application engineering and technology development services to manufacturers in the automotive, aerospace and construction industries.
The Consolidated entity operates its engineering and design division predominantly in the USA, while maintaining a presence in the UK and the Ukraine. The Consolidated entity operates these geographical locations with the USA operation and is not significant to be reported separately. The Consolidated entity's head office is in Australia.
51

NOTES TO THE FINANCIAL STATEMENTS (CONTINUED)FOR THE FINANCIAL YEAR ENDED 30 JUNE 2009
Consolidated Parent Entity
2009 2008 2009 2008
21. CONTINGENT LIABILITIES & ASSETS $ $ $ $
Contingent Assets
Litigation proceedings - Australia (a) 13,940,236 - 13,940,236 -
Net Contingent Asset 13,940,236 - 13,940,236 -
Contingent Liabilities
(i) A Sigalla Claim
(ii) Bombard Technologies Inc. claim
A claim was received by the Group from former director Andrew Sigalla in the amount of A$1,160,000 plus health care and related Visa costs which Mr Sigalla claims is owing to him and ZMS Investments Pty Limited. The claim is made in respect of Mr Sigalla's resignation as an employee in June 2009. A statement of claim has been received from the plaintiffs and the Group has filed a defence denying liability for the claim. The matter will be heard in the Supreme Court of New South Wales in a hearing which has been set down for two weeks starting 8 March 2010.
(a) A hearing is scheduled in the Supreme Court of New South Wales for March 2010. The group is seeking to recover $13,230,536 loans to and receivables from directors and related entities, plus costs to 31 October 2009 of $709,699. Due to the sensitive nature of the proceedings, further details can not be disclosed at this time. It is anticipated that significant additional costs will be incured between now and the completion of the Supreme Court Hearing. The costs are undetermined at this point in time.
PDT had commenced recovery action against Bombard Technologies Inc (Bombard) for unpaid work owing (included in (b) above). Bombard filed a counterclaim for damages of USD$1,300,000 claiming that PDT had failed to meet specifications required by Bombard for the development of a recreational watercraft. PDT has chosen to defend the allegations, and Andreou & Casson Ltd, Illinois is the attorney appointed to the matter.
52
22. FINANCIAL INSTRUMENTS
Financial Risk Management Policies
Treasury Risk Management
Financial Risk Exposures and Management
The Group’s financial instruments consist mainly of borrowings (including convertible notes), current accounts with banks, accounts receivable and payable and loans to and from subsidiaries.
Management considers on a regular basis the financial risk exposures and evaluates treasury management strategies in the context of the most recent economic conditions and forecasts.
The overall risk management strategy seeks to meet the Group’s financial targets, whilst minimising potential adverse effects on financial performance.
The main risks the Group are exposed to through its financial instruments are market risk (interest rate risk & foreign currency risk), credit risk and liquidity risk.
Management operates under policies approved by the Board of Directors who approve and review risk management policies on a regular basis. These include future cash flow requirements.
52

NOTES TO THE FINANCIAL STATEMENTS (CONTINUED)FOR THE FINANCIAL YEAR ENDED 30 JUNE 2009
a) Market Risk
i) Fair Values
ii) Interest Rate Risk
Sensitivity Analysis
The group monitors its interest rate exposure continuously
Sensitivity analysis of reasonable possible variances of +/- 100 basis points in the above risks is disclosed in the following table, all other variables held constant, the estimated impact on the post - tax profit and equity would have been:
Market risk arises from the use of interest bearing, tradable and foreign currency financial instruments. It is the risk that the fair value or future cash flows of a financial instrument will fluctuate because of changes in interest rates (interest rate risk), foreign exchange rates (currency risk) or other market factors (other price risk).
The fair value of financial assets and financial liabilities must be estimated for recognition and measurement or for disclosure purposes.
(a) The net fair values of cash and cash equivalents and non–interest bearing monetary financial assets and liabilities approximate their carrying values as disclosed in the statement of financial position and the notes to the financial statements.
The Group is exposed to interest rate risk through financial assets and financial liabilities. It is the Group’s policy to eliminate interest rate risk over the cash flows on its long-term debt finance through the use of fixed rate instruments.
The Group invests surplus cash in term deposits with fixed returns. The Board makes investment decisions after considering advice received from professional advisors.
53
Consolidated Parent Entity
2009 2008 2009 2008
$ $ $ $
Change in Net Profit
Increase in interest rate by 10% (1,639) (129,633) 925 (145,045)
Decrease in interest rate by 10% 1,639 129,633 (925) 105,045
Change in Equity
Increase in interest rate by 10% (1,639) (129,633) 925 (145,045)
Decrease in interest rate by 10% 1,639 129,633 (925) 105,045
53
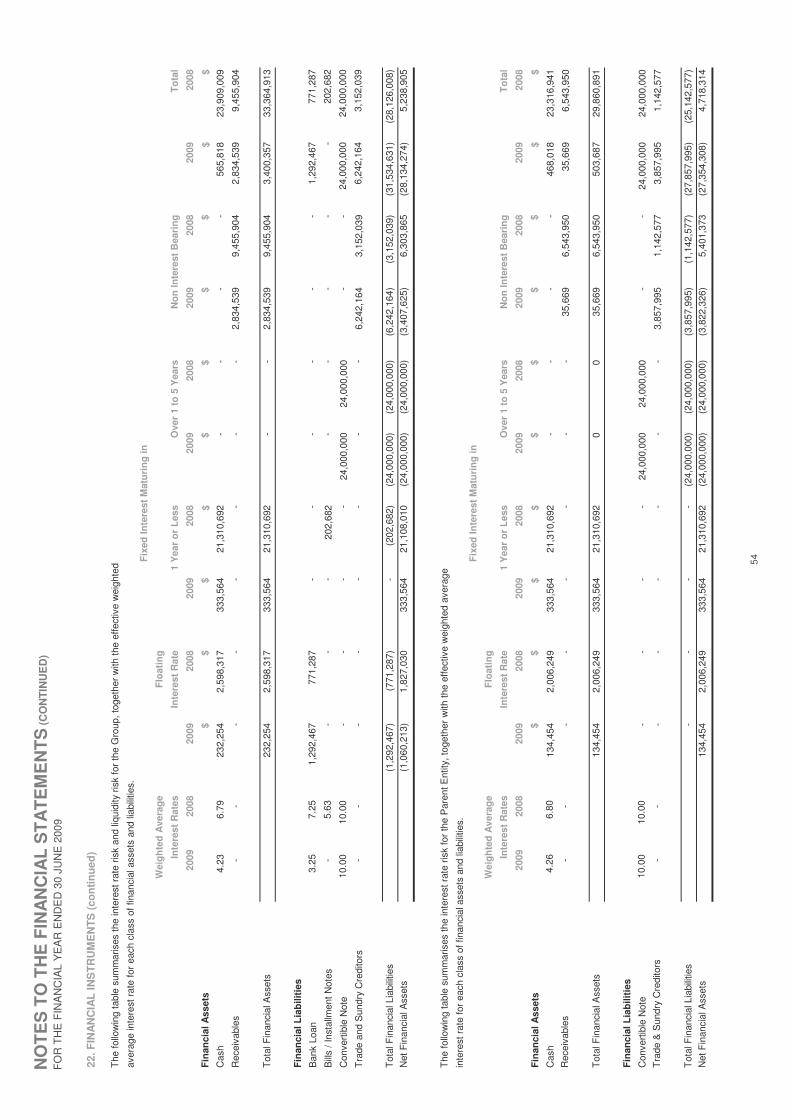
NO
TE
S T
O T
HE
FIN
AN
CIA
L S
TA
TE
ME
NT
S (
CO
NT
INU
ED
)F
OR
TH
E F
INA
NC
IAL
YE
AR
EN
DE
D 3
0 JU
NE
200
9
22. F
INA
NC
IAL
INS
TR
UM
EN
TS
(co
nti
nu
ed)
The
follo
win
g ta
ble
sum
mar
ises
the
inte
rest
rat
e ris
k an
d liq
uidi
ty r
isk
for
the
Gro
up, t
oget
her
with
the
effe
ctiv
e w
eigh
ted
aver
age
inte
rest
rat
e fo
r ea
ch c
lass
of f
inan
cial
ass
ets
and
liabi
litie
s.
Flo
atin
g
2009
2008
2009
2008
2009
2008
2009
2008
2009
2008
2009
2008
Fin
anci
al A
sset
s$
$$
$$
$$
$$
$
Cas
h
4.2
3
6.7
9 23
2,25
42,
598,
317
333,
564
21,3
10,6
92
-
-
-
-
56
5,81
823
,909
,009
Rec
eiva
bles
-
-
-
-
-
-
-
-
2,83
4,53
99,
455,
904
2,83
4,53
99,
455,
904
Tot
al F
inan
cial
Ass
ets
232,
254
2,59
8,31
733
3,56
421
,310
,692
-
-
2,83
4,53
99,
455,
904
3,40
0,35
733
,364
,913
Fin
anci
al L
iab
iliti
es
Ban
k Lo
an
3.2
5
7.2
5 1,
292,
467
771,
287
-
-
-
-
-
-
1,29
2,46
777
1,28
7
Bill
s / I
nsta
llmen
t Not
es
-
5.6
3
-
-
-
202,
682
-
-
-
-
-
20
2,68
2
Con
vert
ible
Not
e
1
0.00
1
0.00
-
-
-
-
24
,000
,000
24,0
00,0
00
-
-
24
,000
,000
24,0
00,0
00
Tra
de a
nd S
undr
y C
redi
tors
-
-
-
-
-
-
-
-
6,24
2,16
43,
152,
039
6,24
2,16
43,
152,
039
Tot
al F
inan
cial
Lia
bilit
ies
(1,2
92,4
67)
(771
,287
)
-
(202
,682
)(2
4,00
0,00
0)(2
4,00
0,00
0)(6
,242
,164
)(3
,152
,039
)(3
1,53
4,63
1)(2
8,12
6,00
8)
Net
Fin
anci
al A
sset
s(1
,060
,213
)1,
827,
030
333,
564
21,1
08,0
10(2
4,00
0,00
0)(2
4,00
0,00
0)(3
,407
,625
)6,
303,
865
(28,
134,
274)
5,23
8,90
5
The
follo
win
g ta
ble
sum
mar
ises
the
inte
rest
rat
e ris
k fo
r th
e P
aren
t Ent
ity, t
oget
her
with
the
effe
ctiv
e w
eigh
ted
aver
age
inte
rest
rat
e fo
r ea
ch c
lass
of f
inan
cial
ass
ets
and
liabi
litie
s.
Flo
atin
g
2009
2008
2009
2008
2009
2008
2009
2008
2009
2008
2009
2008
Fin
anci
al A
sset
s$
$$
$$
$$
$$
$
Cas
h
4.2
6
6.8
0 13
4,45
42,
006,
249
333,
564
21,3
10,6
92
-
-
-
-
46
8,01
823
,316
,941
Rec
eiva
bles
-
-
-
-
-
-
-
-
35,6
696,
543,
950
35,6
696,
543,
950
Tot
al F
inan
cial
Ass
ets
134,
454
2,00
6,24
933
3,56
421
,310
,692
00
35,6
696,
543,
950
503,
687
29,8
60,8
91
Fin
anci
al L
iab
iliti
es
Con
vert
ible
Not
e
1
0.00
1
0.00
-
-
-
-
24
,000
,000
24,0
00,0
00
-
-
24
,000
,000
24,0
00,0
00
Tra
de &
Sun
dry
Cre
dito
rs
-
-
-
-
-
-
-
-
3,
857,
995
1,14
2,57
73,
857,
995
1,14
2,57
7
Tot
al F
inan
cial
Lia
bilit
ies
-
-
-
-
(24,
000,
000)
(24,
000,
000)
(3,8
57,9
95)
(1,1
42,5
77)
(27,
857,
995)
(25,
142,
577)
Net
Fin
anci
al A
sset
s13
4,45
42,
006,
249
333,
564
21,3
10,6
92(2
4,00
0,00
0)(2
4,00
0,00
0)(3
,822
,326
)5,
401,
373
(27,
354,
308)
4,71
8,31
4
Ove
r 1
to 5
Yea
rsN
on
Inte
rest
Bea
rin
g
Fix
ed In
tere
st M
atu
rin
g in
Wei
gh
ted
Ave
rag
e
Inte
rest
Rat
esIn
tere
st R
ate
1 Y
ear
or
Les
sO
ver
1 to
5 Y
ears
To
tal
No
n In
tere
st B
eari
ng
To
tal
Fix
ed In
tere
st M
atu
rin
g in
Wei
gh
ted
Ave
rag
e
Inte
rest
Rat
esIn
tere
st R
ate
1 Y
ear
or
Les
s
54
NOTES TO THE FINANCIAL STATEMENTS (CONTINUED)FOR THE FINANCIAL YEAR ENDED 30 JUNE 2009
22. FINANCIAL INSTRUMENTS (continued)
iii) Currency Risk
(b) Credit Risk Exposure
Management monitors credit risk by actively assessing the rating quality and liquidity of counter parties:
(i) Only banks and financial institutions with an ‘A’ rating are utilised; and
The maximum exposure to credit risk, excluding the value of any collateral or other security, at balance date to recognised financial assets, is the carrying amount, net of any provisions for impairment of those assets, as disclosed in the balance sheet and notes to the financial statements.
The Group’s policy is, where possible, to allow group entities to settle liabilities denominated in their functional currency with the cash generated from their own operations in that currency. Where group entities have liabilities denominated in a currency other than their functional currency (and have insufficient reserves of that currency to settle them) cash already denominated in that currency will, where possible, be transferred from elsewhere within the Group .
Foreign exchange risk arises from recognised assets and liabilities denominated in a currency that is not the entity’s functional currency and net investment in foreign operations. The risk is measured using sensitivity analysis and future cash flow requirement.
The Group's foreign exchange risk is managed to ensure sufficient funds are available to meet US financial commitments in a timely and cost-effective manner. The Group will continually monitor this risk and consider entering into forward foreign exchange, foreign currency swap and foreign currency option contracts if appropriate.
Creditors and debtors as at 30 June 2009 were reviewed to assess currency risk at year end. The value of transactions denominated in a currency other than the functional currency was insignifcant and therefore the risk was determined as immaterial.
Credit risk is the potential that the Group will suffer a financial loss due to the unwillingness or inability of the counterparty to fully meet their contractual debts and obligations. Credit risk arises from both lending and trading activities.
In respect of the parent entity it does not have any material credit risk exposure to any single debtor or group of debtors under financial instruments entered into by the Company.
(ii) All potential customers are rated for credit worthiness taking into account their size, market position and financial standing;
Receivables due from major debtors are not normally secured by collateral, however the credit worthiness of debtors is monitored.
In the US, trade receivables are monitored monthly and credit worthiness of customers are continually assessed to determine the credit risk exposed, bad debts are written off to the income statement only when all possibility of collection and enforcement been undertaken.
55
NOTES TO THE FINANCIAL STATEMENTS (CONTINUED)FOR THE FINANCIAL YEAR ENDED 30 JUNE 2009
(c) Liquidity Risk
Liquidity risk is the inability to access funds, both anticipated and unforeseen, which may lead to the Group being unable to meet its obligations in an orderly manner as they arise.
The Group liquidity position is managed to ensure sufficient funds are available to meet financial commitments in a timely and cost-effective manner. The Group is primarily funded through on-going cash flow, debt funding and capital raisings, as and when required.
The Group raised $24 million on 24 December 2007 by issuing convertible notes, with a fixed interest rate of 10% pa. Refer to notes 14 and 24 for details regarding the year end position of these notes and their subsequent renegotiation.
Subsequent to balance date, the Group has raised a further $3,311,000 by issuing convertible notes with a fixed interest rate of 10% pa. (Note 24)
56

NOTES TO THE FINANCIAL STATEMENTS (CONTINUED)FOR THE FINANCIAL YEAR ENDED 30 JUNE 2009
2009 2008 2009 2008
23. COMMITMENTS FOR EXPENDITURE $ $ $ $
Operating Lease Commitments Payable:
Not Later Than One Year 1,009,732 1,107,323 - -
Later Than One Year but Not Later Than Five Years 2,323,601 2,105,692 - -
Later Than Five Years 450,122 849,392 - -
3,783,455 4,062,407 - -
24. EVENTS SUBSEQUENT TO REPORTING DATE
(i) the operations of the Company;
(ii) the results of those operations; or
(iii) the state of affairs of the Company.
Agreement between QVT Fund and Quintessance Fund L.P (together "QVT") and TZ Limited
Consolidated Parent Entity
Circumstances have arisen since the end of the financial year which have not been dealt with in the financial statements that may have significant effect on:
The Group leases various premises under non-cancellable operating leases expiring between one and six years. All leases have annual CPI escalation clauses. The above commitments do not include any turnover rentals which are contingent upon the various Group companies achieving defined sales levels. Nor do they include commitments for any renewal options on leases. Lease terms usually run for 5 years with a 5 year renewal option. Lease conditions do not impose any restrictions on the ability of TZ Limited and its subsidiaries from borrowing further funds or paying dividends.
These terms are conditional upon and subject to various conditions being satisfied including the company obtaining all shareholder and other regulatory approvals that are required. Consequently shareholders will be asked at the next Annual General Meeting to vote on a proposal included in the Terms Sheet. Acceptance of the proposal is critical to the viability of the Group (refer Note 1 (b))
In connection with the default event relating to the Convertible Note and Option Subscription Deed originally agreed on 24 December 2007 as disclosed in Note 14, on 14 September 2009 the company entered into a binding term sheet with the noteholder pursuant to which the company and the noteholder have agreed a workout plan for the repayment of the interest that was payable on 31 December 2008, the interest that will be payable on 31 December 2009 and part of the outstanding principal owing under the Convertible Note and Option Subscription Deed.
The effect of the term sheet is that the noteholder has waived its right to claim any penalty interest which may have been payable in respect of the non-payment of the 2008 and 2009 interest payments. In addition the company and the noteholder have agreed that the noteholder will convert 12,000 convertible notes (with a face vale of $12m) into equity at a conversion price equal to the lesser of $1 and the lowest issue price of any new issue of shares made by the company prior to the conversion (First Conversion Price). The remaining 12,000 convertible notes will remain on issue under the original terms except that the conversion price will be at a 20% premium to the First Conversion Price. The company will issue the noteholder with equity equal to the aggregate of the 2008 and 2009 interest payments as well as amounts payable to the noteholder relating to expenses paid by the noteholder on behalf of the company.
Included in the conditions of the term sheet, the company has agreed to raise up to $1.5m in new Convertible Notes by 30 November 2009 and at least $5m in equity (for cash or through the conversion into equity of new convertible notes) by 28 February 2010.
57
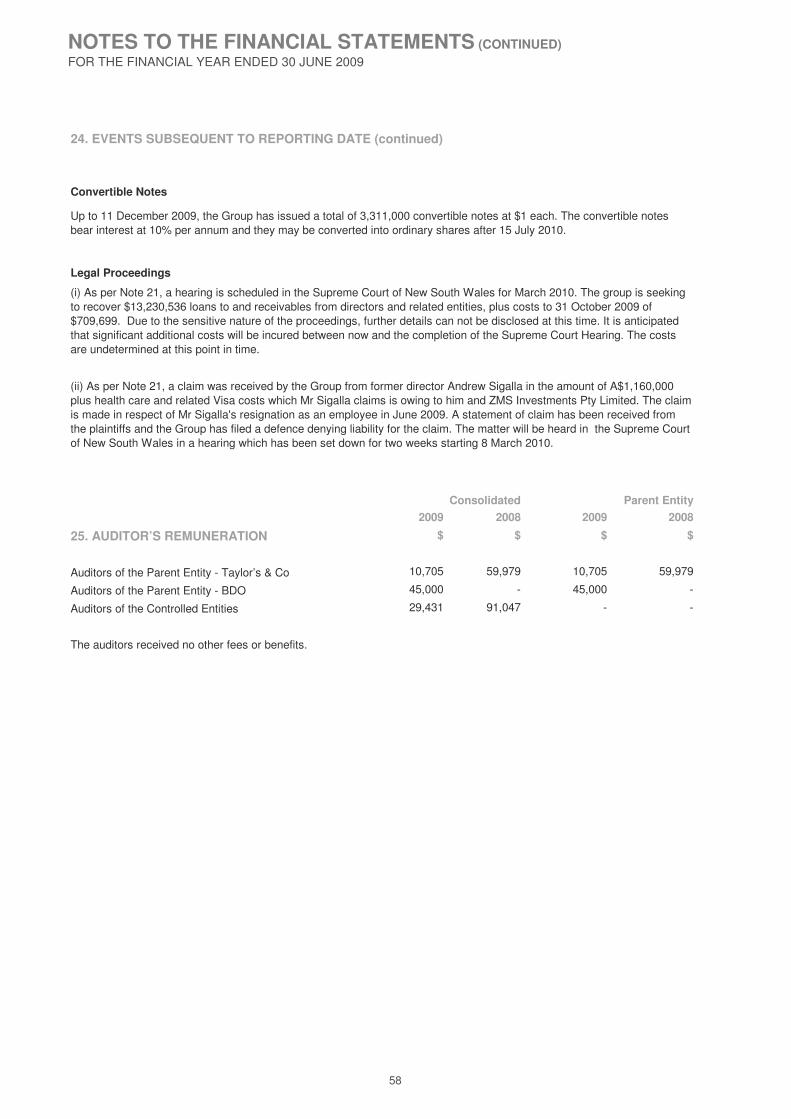
NOTES TO THE FINANCIAL STATEMENTS (CONTINUED)FOR THE FINANCIAL YEAR ENDED 30 JUNE 2009
24. EVENTS SUBSEQUENT TO REPORTING DATE (continued)
Convertible Notes
Legal Proceedings
2009 2008 2009 2008
25. AUDITOR’S REMUNERATION $ $ $ $
Auditors of the Parent Entity - Taylor’s & Co 10,705 59,979 10,705 59,979
Auditors of the Parent Entity - BDO 45,000 - 45,000 -
Auditors of the Controlled Entities 29,431 91,047 - -
The auditors received no other fees or benefits.
Consolidated Parent Entity
Up to 11 December 2009, the Group has issued a total of 3,311,000 convertible notes at $1 each. The convertible notes bear interest at 10% per annum and they may be converted into ordinary shares after 15 July 2010.
(ii) As per Note 21, a claim was received by the Group from former director Andrew Sigalla in the amount of A$1,160,000 plus health care and related Visa costs which Mr Sigalla claims is owing to him and ZMS Investments Pty Limited. The claim is made in respect of Mr Sigalla's resignation as an employee in June 2009. A statement of claim has been received from the plaintiffs and the Group has filed a defence denying liability for the claim. The matter will be heard in the Supreme Court of New South Wales in a hearing which has been set down for two weeks starting 8 March 2010.
(i) As per Note 21, a hearing is scheduled in the Supreme Court of New South Wales for March 2010. The group is seeking to recover $13,230,536 loans to and receivables from directors and related entities, plus costs to 31 October 2009 of $709,699. Due to the sensitive nature of the proceedings, further details can not be disclosed at this time. It is anticipated that significant additional costs will be incured between now and the completion of the Supreme Court Hearing. The costs are undetermined at this point in time.
58

NOTES TO THE FINANCIAL STATEMENTS (CONTINUED)FOR THE FINANCIAL YEAR ENDED 30 JUNE 2009
26. SHARE - BASED PAYMENTS
The following share-based payment arrangements existed at 30 June 2009:
The following share-based payment arrangements were in existence during the period:
Options Number Grant Date Expiry Date Exercise Fair Value at
Series Price $ Grant Date $
1 200,000 15/07/2004 31/12/2007 5.00 0.15
2 200,000 30/11/2006 22/12/2009 3.75 0.83
3 200,000 30/11/2006 22/12/2009 5.00 0.64
4 300,000 29/01/2007 23/01/2010 3.00 1.09
5 300,000 29/01/2007 23/01/2010 3.75 0.92
6 600,000 29/01/2007 24/01/2010 3.75 0.92
7 34,000 18/01/2008 18/01/2011 3.75 1.05
8 33,000 18/01/2008 18/01/2011 3.75 1.79
9 33,000 18/01/2008 18/01/2011 3.75 1.89
10 97,500 18/01/2008 19/01/2011 3.75 1.61
11 97,500 18/01/2008 19/01/2011 3.75 1.53
12 20,000 18/01/2008 20/01/2011 3.00 2.35
On 18 January 2008, 315,000 share options were granted to a selected number of the Group employees on the completion of their 2007 objectives, as part of a long-term employee incentive offered by the Group. Of the total 315,000 options issued 295,000 are exercisable at $3.75 per share option at any time prior to their expiry on 19 January 2011. The balance of 20,000 options is exercisable at $3.75 per share option at any time prior to their expiry on 20 January 2011. The options hold no voting or rights to any dividend and are not transferable. At reporting date, none of the vested options had been exercised.
On 22 December 2006, 2,000,000 pre consolidation share options were granted to Directors or their associates as approved by shareholders at the annual general meeting held on 30 November 2006. The first 1,000,000 (200,000 consolidated) of these options vested on 22 December 2007 and are exercisable at 75 cents ($3.75 dollars consolidated) per share option at any time after the vesting date until their expiry on 22 December 2009. The other 1,000,000 (200,000 consolidated) options vested on 22 December 2008 and are exercisable at $1.00 dollar ($5.00 dollars consolidated) per share option at any time after the vesting date until their expiry on 22 December 2009. The options hold no voting or rights to any dividend and are not transferable. At balance date, the both tranches of options have vested and at reporting date none of the vested options had been exercised.
On 29 January 2007, 3,000,000 pre consolidation share options were granted to the David Feber on his appointment as CEO of TZ Inc by a way of two tranches. 1,500,000 options (300,000 consolidated) are exercisable at 60 cents ($3.00 dollars consolidated) and the balance of 1,500,000 options (300,000 consolidated) are exercisable at 75 cents ($3.75 dollars consolidated) per share option at any time prior to their expiry on 23 January 2010, half of both tranches vested on the 23 January 2008 and the balance of both half vested on the 23 July 2008. The options hold no voting or rights to any dividend and are not transferable. At balance date, the both tranches of options have vested, but none of the options have been exercised.
On 29 January 2007, 3,000,000 pre consolidation share options were granted to the Company consultants in lieu of final payment in relation to the convertible note issue and acquisition of the Intevia Business unit. The 3,000,000 options (600,000 consolidated) are exercisable at 75 cents ($3.75 dollars consolidated) per share option at any time prior to their expiry on 24 January 2010. The options hold no voting or rights to any dividend and are not transferable. At reporting date, none of the vested options had been exercised.
59

NOTES TO THE FINANCIAL STATEMENTS (CONTINUED)FOR THE FINANCIAL YEAR ENDED 30 JUNE 2009
26. SHARE–BASED PAYMENTS (continued)
The following reconciles the outstanding share options granted at the beginning and end of the financial year:
Number of Weighted Average Number of Weighted Average
Options Exercise Price $ Options Exercise Price $
7,709,500 4.10 1,800,000 4.22
- - 6,109,500 4.18
- - (200,000) (5.00)
- - - -
7,709,500 4.10 7,709,500 4.10
7,709,500 4.10 7,346,000 4.08
Exercised During the Year
No share options were exercised during the financial year.
Recognition of Share - Based Payments Expense
No options were issued or vested as remuneration for the financial year. Consequently no option expense (2008: $819,735) was recongnised directly in the income statment for the year ended 30 June 2009.
2009 2008
Exercisable at End of the Financial Year
Balance at Beginning of Financial Year
Granted During the Financial Year
Lapsed During the Financial Year
Exercised During the Financial Year
Balance at End of the Financial Year
60

NOTES TO THE FINANCIAL STATEMENTS (CONTINUED)FOR THE FINANCIAL YEAR ENDED 30 JUNE 2009
27. GROUP DETAILS
The registered office of the Group is:
TZ Limited (TZL)
Level 11, 1 Chifley Square
Sydney NSW 2000
Australia
The principal place of business is:
Telezygology Inc. (TZI)
520 W. Erie Street 2900 W. Maple Rd.
Suite 210 Suite 210
Chicago, Illinois 60654 Troy, Michigan 48084
USA USA
PDT Holdings, Inc. (PDT Group)
One Corporate Drive 520 W. Erie Street 9701 Wilshire Boulevard
Suite 110 Suite 100 Suite 900
Lake Zurich, Illinois 60047 Chicago, Illinois 60654 Beverly Hills, California 90212
USA USA USA
3021 Harbor Lane 71 Chuprynky Street Ives Gate Lane
Suite 205 Lviv 79044 Great Milton
Plymouth, Minnesota 55447 Ukraine Oxford, OX44 7NJ
61
USA United Kingdom
4661 Johnson Road 503 Neches Street
Suite 3 Austin, Texas 78701
Coconut Creek, Florida 33073 USA
USA
61

TZ LIMITED AND ITS CONTROLLED ENTITIESABN 26 073 979 272
DECLARATION BY DIRECTORS
Subject to Note 1, the directors of the company declare that:
1.
(a) comply with Accounting Standards and the Corporations Regulations 2001; and
(b) give a true and fair view of the financial position as at 30 June 2009 and of the performance for the year ended on that date of the company and the consolidated entity.
2.
3.
The financial statements, comprising the income statement, balance sheet, cash flow statement, statement of changes in equity, accompanying notes, are in accordance with the Corporations Act 2001 and:
In the directors’ opinion, there are reasonable grounds to believe that the company will be able to pay its debts as and when they become due and payable.
The remuneration disclosures included in pages 13 to 18 of the directors’ report (as part of the Remuneration Report), for the year ended 30 June 2009, comply with section 300A of the Corporations Act 2001.
This declaration is made in accordance with a resolution of the Board of Directors and is signed for and on behalf of the directors by:
62
Mark Bouris
Director
Kenneth Ting
Director
Sydney, Australia
23 December 2009
62


CORPORATE GOVERNANCE STATEMENTFOR THE FINANCIAL YEAR ENDED 30 JUNE 2009
����������� ������������������������������������
The previous Board formally reviewed the ASX Corporate Governance paper entitled "Principles of Good Corporate Governance and Best Practice Recommendations" which was published in March 2003. There is no information available as to whether the former Board reviewed the revised "Corporate Governance Principles and Recommendations (Second Edition Corporate Governance Guidlines)" that were released by the ASX on 2 August 2007.
The current Board, all of whom were appointed on 18 June 2009, have not yet formally reviewed the ASX's guidelines and their application to the Group, however, they plan to do so as prior to the preparation of the Financial Reports for the year ended 30 June 2010. The Board supports good corporate governance practices and would like to express to stakeholders that, although a formal review is not yet complete, they are in the process of ensuring the ASX's guidelines are followed.
66

STOCK EXCHANGE INFORMATION
Statement of Quoted Securities as at 30 November 2009
There are 2,902 shareholders holding a total of 49,479,325 ordinary fully paid shares.
The twenty largest shareholders between them hold 51.54% of the total shares on issue.
Distribution of Quoted Shares and Options as at 30 November 2009
Shares Range Number of Holders
1 - 1,000 1,097
1,001 - 5,000 1,078
5,001 - 10,000 295
10,001 - 100,000 370
100,001 - and over 62
Total holders 2,902
Substantial Shareholdings as at 30 November 2009
Substantial Total Relevant % of Total Voting Rights
Shareholder Interest at 30 Novement 2009
Acument Global Technologies INC 3,61 3,637 ordinary shares 7.30
Directors’ Shareholdings
Ordinary Unquoted
Director Shares Options
M Bouris Nil Nil
K Ting 72,725 Nil
W de Vlugt Nil Nil
On-Market Buy-Backs
There is no on - market buy back currently in place.
Voting rights are that on a show of hands each member present in person or by proxy or attorney or representative shall have one vote and upon a poll every member so present shall have one vote for every fully paid share held and for each partly paid share held shall have a fraction of a vote pro–rata to the amount paid up on each partly paid share relative to its issue price.
There were 607 shareholders whose total holding had a market value of less than $500 at 31 October 2009.
The following shareholders have notified the Company that, pursuant to the provisions of section 671 B of the Corporations Act 2001, they are substantial shareholders.
As at 30 November 2009, Directors of the Company held a relevant interest in the following securities on issue by the Company.
67
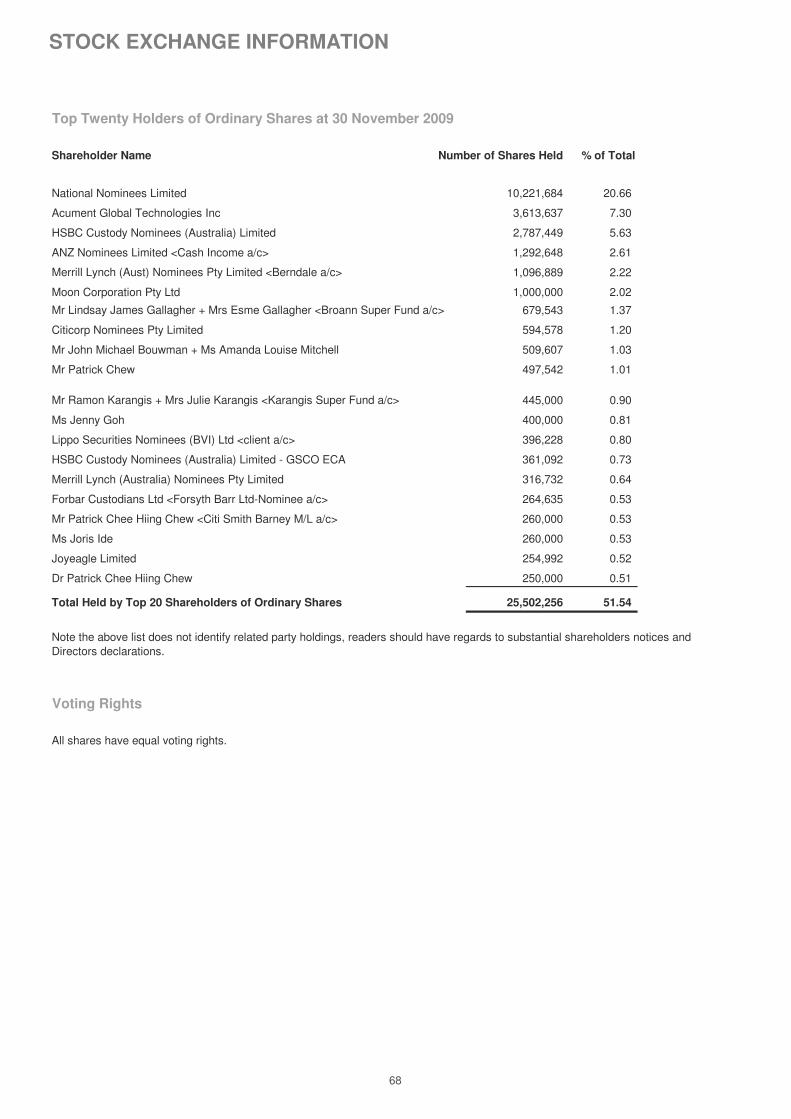
STOCK EXCHANGE INFORMATION
Top Twenty Holders of Ordinary Shares at 30 November 2009
Shareholder Name Number of Shares Held % of Total
National Nominees Limited 10,221,684 20.66
Acument Global Technologies Inc 3,613,637 7.30
HSBC Custody Nominees (Australia) Limited 2,787,449 5.63
ANZ Nominees Limited <Cash Income a/c> 1,292,648 2.61
1,096,889 2.22
Moon Corporation Pty Ltd 1,000,000 2.02
679,543 1.37
Citicorp Nominees Pty Limited 594,578 1.20
Mr John Michael Bouwman + Ms Amanda Louise Mitchell 509,607 1.03
Mr Patrick Chew 497,542 1.01
445,000 0.90
Ms Jenny Goh 400,000 0.81
Lippo Securities Nominees (BVI) Ltd <client a/c> 396,228 0.80
HSBC Custody Nominees (Australia) Limited - GSCO ECA 361,092 0.73
Merrill Lynch (Australia) Nominees Pty Limited 316,732 0.64
Forbar Custodians Ltd <Forsyth Barr Ltd-Nominee a/c> 264,635 0.53
Mr Patrick Chee Hiing Chew <Citi Smith Barney M/L a/c> 260,000 0.53
Ms Joris Ide 260,000 0.53
Joyeagle Limited 254,992 0.52
Dr Patrick Chee Hiing Chew 250,000 0.51
Total Held by Top 20 Shareholders of Ordinary Shares 25,502,256 51.54
Voting Rights
All shares have equal voting rights.
Note the above list does not identify related party holdings, readers should have regards to substantial shareholders notices and Directors declarations.
Merrill Lynch (Aust) Nominees Pty Limited <Berndale a/c>
Mr Lindsay James Gallagher + Mrs Esme Gallagher <Broann Super Fund a/c>
Mr Ramon Karangis + Mrs Julie Karangis <Karangis Super Fund a/c>
68

INTENTIONALLY BLANK

INTENTIONALLY BLANK