2009 Tax Increment Financing in Vermont - Home | … Tax Increment...2009 Tax Increment Financing in...
52
2009 Tax Increment Financing in Vermont Prepared in accordance with Sec. 65 of Act No. 190
-
Upload
trinhtuyen -
Category
Documents
-
view
225 -
download
6
Transcript of 2009 Tax Increment Financing in Vermont - Home | … Tax Increment...2009 Tax Increment Financing in...

2009 Tax Increment Financing in Vermont
Prepared in accordance with Sec. 65 of Act No. 190

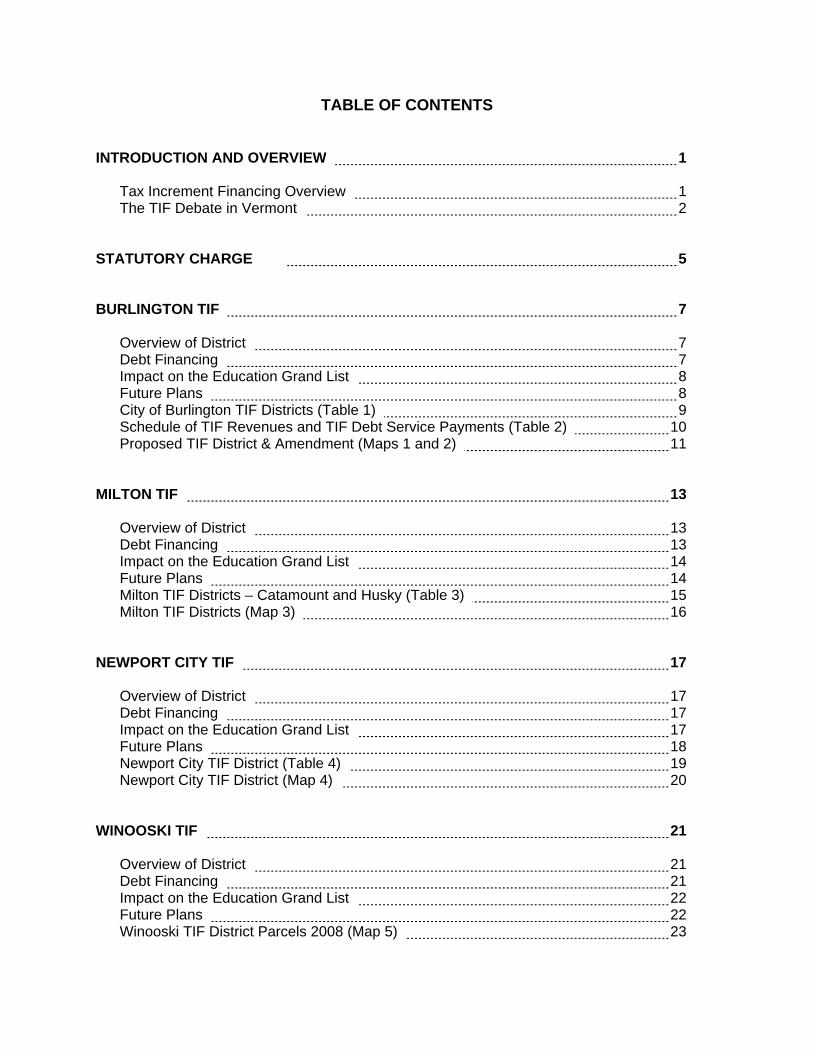
TABLE OF CONTENTS
INTRODUCTION AND OVERVIEW 1 Tax Increment Financing Overview 1
The TIF Debate in Vermont 2 STATUTORY CHARGE 5 BURLINGTON TIF 7 Overview of District 7 Debt Financing 7 Impact on the Education Grand List 8 Future Plans 8 City of Burlington TIF Districts (Table 1) 9 Schedule of TIF Revenues and TIF Debt Service Payments (Table 2) 10 Proposed TIF District & Amendment (Maps 1 and 2) 11 MILTON TIF 13
Overview of District 13
Debt Financing 13 Impact on the Education Grand List 14 Future Plans 14 Milton TIF Districts – Catamount and Husky (Table 3) 15 Milton TIF Districts (Map 3) 16 NEWPORT CITY TIF 17
Overview of District 17
Debt Financing 17 Impact on the Education Grand List 17 Future Plans 18 Newport City TIF District (Table 4) 19 Newport City TIF District (Map 4) 20 WINOOSKI TIF 21
Overview of District 21
Debt Financing 21 Impact on the Education Grand List 22 Future Plans 22 Winooski TIF District Parcels 2008 (Map 5) 23

ECONOMIC DEVELOPMENT THROUGH TAX INCREMENT FINANCING 25 An Overview of Tax Increment Financing in Practice Nationally 26 The Local-State Debate 28 Evaluating the Success of TIF in Vermont 29
• Grand List Growth 29 • Job Creation and Economic Development 32 • Financial Stability 33 • Achieving Land Use Goals 34
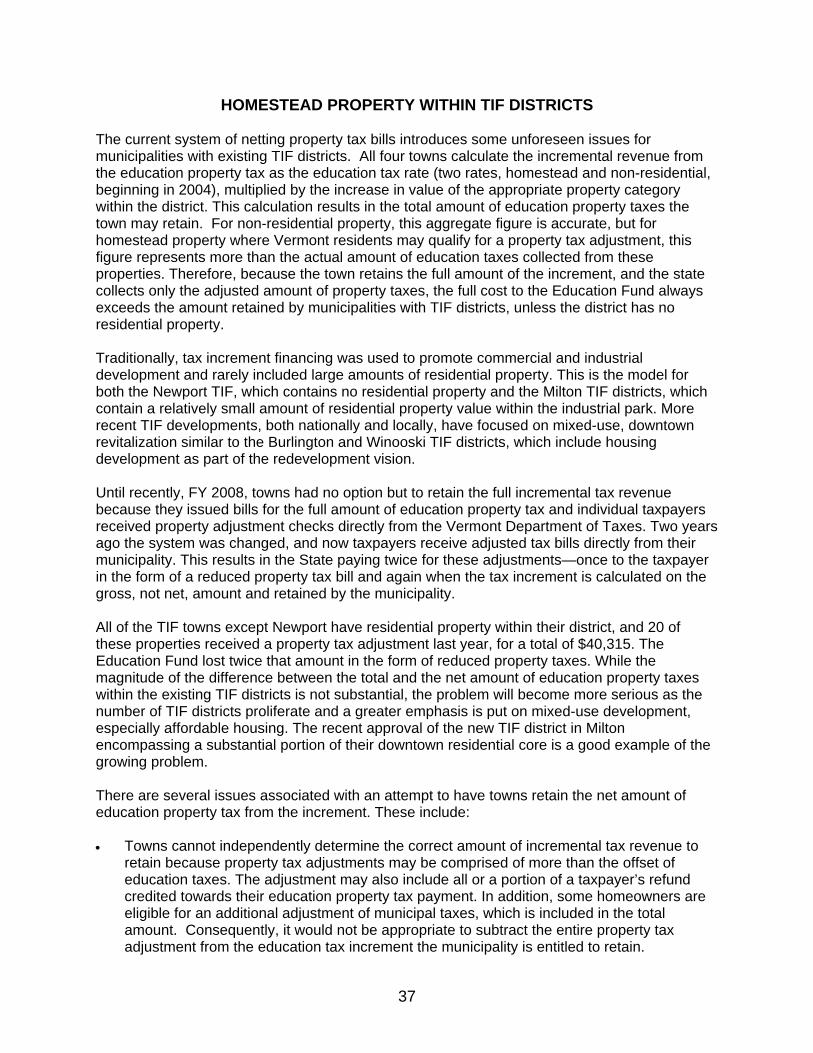
Alternatives to TIF 36 HOMESTEAD PROPERTY WITHIN TIF DISTRICTS 37
CLA CALCULATION AND TIF DISTRICTS 39 EVALUATION OF OTHER FINANCING INSTRUMENTS 43
CONCLUSIONS 45 APPENDIX A – MATRIX 47

1
INTRODUCTION AND OVERVIEW
Section 65 of Act 190 of 2008 requested the Department of Taxes and the Legislative Joint Fiscal Office to analyze the characteristics of the four existing Tax Increment Finance (TIF) districts in Vermont and examine some related issues, such as the types of financing used for TIF and treatment of incremental value for property equalization purposes. This report is our response to that request. Tax Increment Financing Overview Tax increment financing has been around since the 1950s as an economic development tool. The theory and practice is, on its face, simple: an area that has been blighted or is otherwise in need of an economic boost is analyzed for its development potential and then designated by a municipality as a tax increment finance district, which is then targeted for publicly financed infrastructure investment. These improvements are commonly paid for through bonding or grants and loans from federal and state agencies. Any indebtedness incurred in the process is repaid by using a portion of property tax revenues from the designated area. The taxable value of the district is frozen at the time of its creation, and it is called the original taxable value (OTV) or simply “base.” Improvements to the district are undertaken by the municipality to prepare the area for development. As the TIF district matures, the municipality retains the incremental taxes generated above the base from the increase in property values due to the resulting private development. The annual “tax increment” is then used to pay off the public expenditures on improvements in the district. The length of time over which municipalities may retain the tax increment varies across the country, but either at the end of a designated period or when all of the public investment costs are paid off, the taxable property value above the base is released back to all of the taxing jurisdictions. California invented TIF, and it is still more widely used there than anywhere else in the nation. Currently, 48 states and the District of Columbia have enabling legislation for TIF, and their use has become more widespread in the last two decades. Tax increment financing allows a jurisdiction to designate a geographical area for development and then dedicate the growth, or increment, in tax revenues (usually property taxes) to finance public infrastructure improvements. Typically these investments include water supply, sewer expansion and repair, storm drainage, street and sidewalk construction, street lighting, park improvements, and parking structures. In addition, municipalities use TIF for land acquisition, demolition, utility improvements, and environmental remediation. These improvements are intended to encourage economic development by reducing the costs for private developers. Considerable study of TIF has been undertaken in the last several decades, and the empirical evidence has been mixed in assessing its success. One measure of success is whether the increase in property value from private development as a result of public investment in infrastructure is adequate to pay the debt incurred by the public. TIF districts are now being widely employed across the country to fund public projects that might otherwise be unaffordable to localities. But as they remove more property from the taxable base, TIF projects have come under scrutiny as to whether they merit the diversion of public tax dollars for periods of at least 10 years and sometimes up to 40 years.

2
The expansion of TIF in Vermont and elsewhere raises questions about its overall value as an effective tool for economic development and, in particular, for guiding the location of development to foster “smart growth.” Smart growth encourages the revitalization of downtown areas and features mixed-use development that is pedestrian- and commuter-friendly, as well as incorporating green space. The TIF Debate in Vermont Aside from questions about the effectiveness of TIF, which are also present in Vermont, the implementation of a statewide education property tax in 1997 introduced issues not present in other states, where all property taxes are local taxes. In other states, any additional taxes raised from properties in the district from increased assessment flows back to the municipality for repayment of debt incurred for improvements. Here in Vermont, there is no dispute that the Education Fund is deprived of those revenues for a period of 20 years (or more in the case of the Burlington district), but advocates and critics disagree on whether the development would have happened in the absence of TIF; if not in that exact place, then somewhere else in the state. Tax increment financing has existed as a development tool for Vermont municipalities since the enabling legislation was passed in 19851, a time when federal aid to cities and towns for public infrastructure and economic development began a long decline. More than ten years elapsed after the passage of enabling legislation before a TIF district was created anywhere in the state, and after nearly 25 years, TIF has seen only limited application. Vermont is made up mostly of small towns and villages without significant areas of urban decay, which has proved a limiting factor in the growth of TIF. An additional unique feature in Vermont is the nature of the state’s education funding system, which introduces complexities not faced by communities in other states pursuing and implementing a TIF district. If a Vermont municipality had created a TIF district prior to 1997, any effects of foregone revenue would have been felt only by that community. This is similar to how TIF operates in most jurisdictions nationally. With the passage of Act 60 that year, the two streams of property tax revenue—for education and municipal budgets—were separated into a statewide education property tax and local municipal taxes. Education funding moved to a statewide balance sheet, which accounted for all the education taxes collected and spent in communities across the state. The change meant that the revenue loss from diverting education property taxes in one community would affect the larger balance sheet. Because of this, the Legislature grandfathered preexisting TIF districts in Newport and Burlington and provided a brief window for expansion of those districts. In the following year, No. 71 of the Acts of 1998 gave the Vermont Economic Progress Council (VEPC) authority to authorize additional TIF districts as part of a larger package of tax credits in the EATI program. The Milton TIF was approved under that authorization, and Winooski received authorization in special legislation (Act No. 159 of 2000). No additional TIF districts have been created since 2000. Each of these TIF districts has distinctive features, and each has played a role in shaping its community. The state education property tax accounts for about 70 percent of total property tax collections in Vermont, and municipalities continue to bill and collect for both state education and local 1 Subchapter 5 of chapter 53, of Title 24 was added by No. 87 of the Acts of 1985.

3
municipal taxes. Once the state took responsibility for setting education tax rates and distributing the revenue to local school districts, TIF had statewide implications. Against that backdrop, the state has worked to establish a process that balances state policy objectives and local (re)development needs. The TIF program continued to undergo changes with the passage of No. 68 of the Acts of 2003, which split the grand list into homestead and nonresidential properties taxed at different rates, and both No.184 of the Acts of 2006 and No. 190 of the Acts of 2008, which significantly modified the TIF enabling statutes in Titles 24 and 32. Current law allows for authorization of up to six new TIF districts over a five-year period upon application and approval by the Vermont Economic Progress Council. Tax increment financing has seen limited use in Vermont and been a recurring theme for a number of legislative sessions, often marked by contentious debate. With all the attention given to them in the past, the need for an independent review of this increasingly popular economic development tool in Vermont became more apparent. More specifically, the unusual nature of TIF in the context of a statewide education tax system and the impact on the Education Fund requires greater understanding by the Legislature and the public at large. This report provides some project history and description for each of the four TIF districts in Vermont, as well as information on how the municipalities have financed those projects and the impact on the Education Fund. Questions regarding TIF as an economic development tool and possible alternatives are addressed separately. Three additional TIF-related issues pertaining to the method of equalization in towns with TIF districts, the treatment of homestead property tax adjustments within TIF districts, and information pertaining to financing are addressed in separate parts of this study.
To gather data and supporting materials for this study, staff from the Joint Fiscal Office and Department of Taxes met with local officials from each of the four municipalities hosting a tax increment finance (TIF) district—Burlington, Milton, Newport, and Winooski—as well as with the Treasurer’s Office and representatives of the organizations specified in Sec. 65(b) of Act No.190 (2008).

4

5
STATUTORY CHARGE
Sec. 65. 2008 Act. No. 190 TAX INCREMENT FINANCING DATA
(a) The joint fiscal office and the department of taxes shall analyze:
(1) Fiscal aspects of the four existing tax increment financing districts (TIFs). The study shall assemble the details of each TIF’s financial components since their inception and analyze the fiscal impact on the state level.
(2) The best option for addressing how tax increment financing property should be included in the determination of the host town’s common level of appraisal, and what provisions may need to be added to tax increment financing laws to address the possibility of changes to the state education financing structure.
(3) How existing tax increment financing districts meet the goals of economic development, whether they provide municipalities with more useful development tools than possible alternatives, and how they affect the state’s education fund stability.
(4) Homestead property within tax increment financing districts and whether the education tax revenue retained by the municipality is net or gross of property tax adjustments; and shall propose language and a method to ensure that the actual amount of education tax increment retained is net of property tax adjustments.
(5) The following types of financing instruments: conventional loans, certificates of participation, lease-purchase, revenue anticipation notes, and bank loans.
(b) In collecting and analyzing data on the issues in subdivisions (a)(1) through (3) of this section, the joint fiscal office and the department of taxes shall consult with the Vermont League of Cities and Towns, the Vermont Economic Progress Council, Smart Growth Vermont, the Lake Champlain Regional Chamber of Commerce, and the Vermont chapter of the National Education Association.
(c) The joint fiscal office and the department of taxes shall report their findings to the house committee on ways and means and the senate committee on finance by January 15, 2009.

6
7
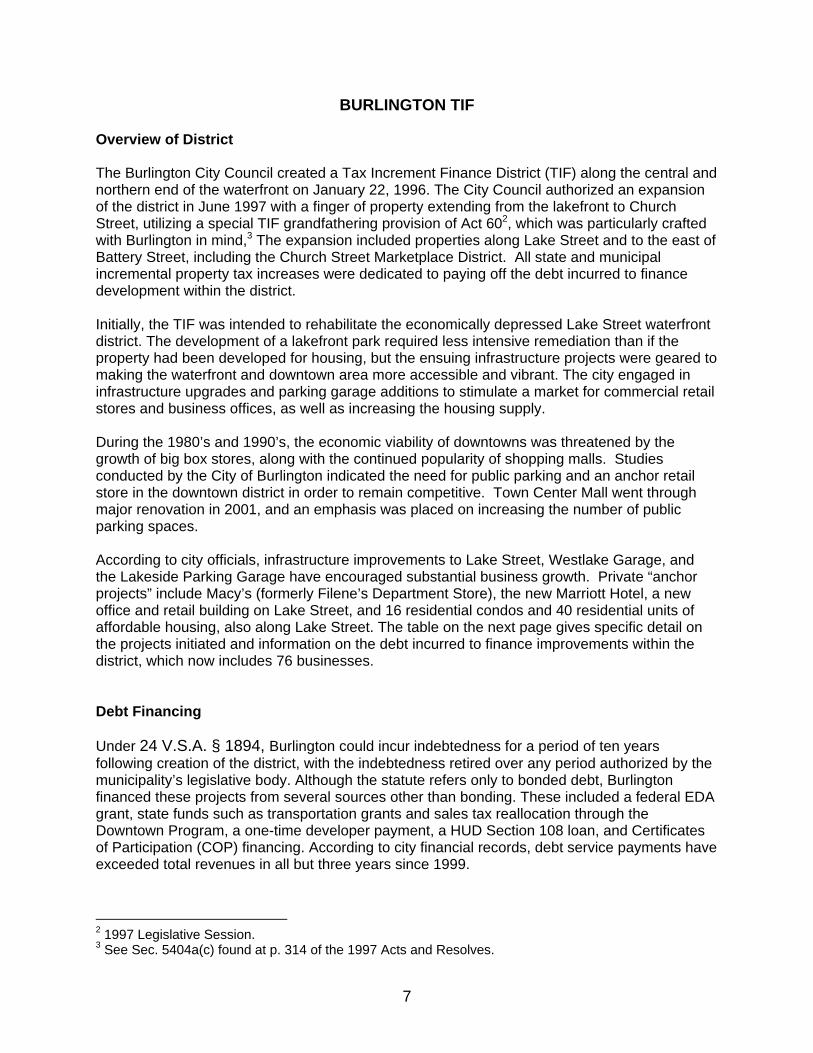
BURLINGTON TIF Overview of District The Burlington City Council created a Tax Increment Finance District (TIF) along the central and northern end of the waterfront on January 22, 1996. The City Council authorized an expansion of the district in June 1997 with a finger of property extending from the lakefront to Church Street, utilizing a special TIF grandfathering provision of Act 602, which was particularly crafted with Burlington in mind,3 The expansion included properties along Lake Street and to the east of Battery Street, including the Church Street Marketplace District. All state and municipal incremental property tax increases were dedicated to paying off the debt incurred to finance development within the district. Initially, the TIF was intended to rehabilitate the economically depressed Lake Street waterfront district. The development of a lakefront park required less intensive remediation than if the property had been developed for housing, but the ensuing infrastructure projects were geared to making the waterfront and downtown area more accessible and vibrant. The city engaged in infrastructure upgrades and parking garage additions to stimulate a market for commercial retail stores and business offices, as well as increasing the housing supply. During the 1980’s and 1990’s, the economic viability of downtowns was threatened by the growth of big box stores, along with the continued popularity of shopping malls. Studies conducted by the City of Burlington indicated the need for public parking and an anchor retail store in the downtown district in order to remain competitive. Town Center Mall went through major renovation in 2001, and an emphasis was placed on increasing the number of public parking spaces. According to city officials, infrastructure improvements to Lake Street, Westlake Garage, and the Lakeside Parking Garage have encouraged substantial business growth. Private “anchor projects” include Macy’s (formerly Filene’s Department Store), the new Marriott Hotel, a new office and retail building on Lake Street, and 16 residential condos and 40 residential units of affordable housing, also along Lake Street. The table on the next page gives specific detail on the projects initiated and information on the debt incurred to finance improvements within the district, which now includes 76 businesses. Debt Financing Under 24 V.S.A. § 1894, Burlington could incur indebtedness for a period of ten years following creation of the district, with the indebtedness retired over any period authorized by the municipality’s legislative body. Although the statute refers only to bonded debt, Burlington financed these projects from several sources other than bonding. These included a federal EDA grant, state funds such as transportation grants and sales tax reallocation through the Downtown Program, a one-time developer payment, a HUD Section 108 loan, and Certificates of Participation (COP) financing. According to city financial records, debt service payments have exceeded total revenues in all but three years since 1999. 2 1997 Legislative Session. 3 See Sec. 5404a(c) found at p. 314 of the 1997 Acts and Resolves.

8
Impact on the Education Grand List Total foregone revenues in FY 2008 from the state education tax were $932,656, and the cumulative amount since FY 2002, when the district first generated incremental tax revenue, is $3,871,151. With respect to grand list property values, the unequalized value of the TIF exemption from the education grand list in FY 2008 was $70,184,495, of which homestead property accounts for 14% of the TIF incremental value. The total TIF property value was $112,771,895, which includes the original taxable value of $42,587,400. The incremental value accounted for 2% of Burlington’s total education grand list. The district also includes $46.1 million of exempt properties, and city officials emphasized the need to maintain a balance between public (and therefore nontaxable) property, such as parking garages and the Urban Reserve lakefront park, and commercial or residential property subject to taxation. Future Plans The city considers the TIF district a highly successful economic development tool and anticipates more redevelopment. Future plans include an additional hotel on Cherry Street and a mixed use development on Battery Street. It also intends to develop several vacant lots on Lake Street and to redevelop the Moran Plant.
Project DescriptionDate & Tpe of Financing
Amount of TIF Debt
Length of Debt
Lake St. Reconstruction
Reconstruction of roadway and infrastructure with pedestrian improvements along Lake St.
1999; HUD Section 109 Financing $ 1,148,350 18 years
300 Lake St. HousingExtension and upgrade of Lake St. to Depot Triangle Housing development
1999; HUD Section 109 Financing $ 495,000 15 years
Urban Reserve Acquisition
45 acres of railroad property along Lake Champlain acquired and now public trust land
1999; Certificates of Participation $ 1,390,000 19 years
Lakeview Parking Garage
Construction of 401 space parking facility; done in conjunction with Burlington Square Mall redevelopment
1999; Certificates of Participation $ 5,500,000 19 years
Waterfront Fishing Pier
Public fishing space behind the water plant built; upland and shoreside improvements added
2000; Certificates of Participation $ 407,000 20 years
Lakeview, Westlake & College Garage
Construction of two additional levels of parking on existing Lakeview Garage; improvements to College St. Garage
2005; Certificates of Participation $ 7,870,000 20 years
TOTAL 16,810,350$
Burlington TIF District Improvements and Financing
9
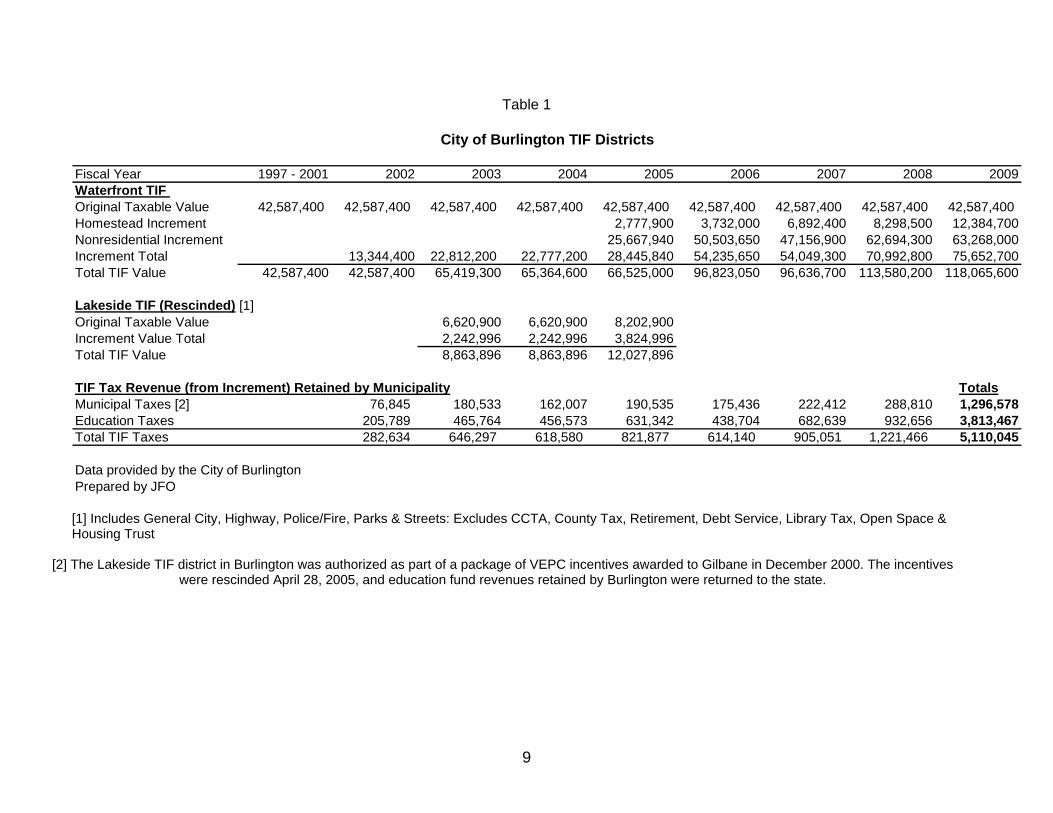
Table 1
Fiscal Year 1997 - 2001 2002 2003 2004 2005 2006 2007 2008 2009Waterfront TIF Original Taxable Value 42,587,400 42,587,400 42,587,400 42,587,400 42,587,400 42,587,400 42,587,400 42,587,400 42,587,400 Homestead Increment 2,777,900 3,732,000 6,892,400 8,298,500 12,384,700Nonresidential Increment 25,667,940 50,503,650 47,156,900 62,694,300 63,268,000Increment Total 13,344,400 22,812,200 22,777,200 28,445,840 54,235,650 54,049,300 70,992,800 75,652,700Total TIF Value 42,587,400 42,587,400 65,419,300 65,364,600 66,525,000 96,823,050 96,636,700 113,580,200 118,065,600
Lakeside TIF (Rescinded) [1]Original Taxable Value 6,620,900 6,620,900 8,202,900Increment Value Total 2,242,996 2,242,996 3,824,996Total TIF Value 8,863,896 8,863,896 12,027,896
TIF Tax Revenue (from Increment) Retained by Municipality TotalsMunicipal Taxes [2] 76,845 180,533 162,007 190,535 175,436 222,412 288,810 1,296,578Education Taxes 205,789 465,764 456,573 631,342 438,704 682,639 932,656 3,813,467Total TIF Taxes 282,634 646,297 618,580 821,877 614,140 905,051 1,221,466 5,110,045
Data provided by the City of BurlingtonPrepared by JFO
City of Burlington TIF Districts
[1] Includes General City, Highway, Police/Fire, Parks & Streets: Excludes CCTA, County Tax, Retirement, Debt Service, Library Tax, Open Space & Housing Trust
[2] The Lakeside TIF district in Burlington was authorized as part of a package of VEPC incentives awarded to Gilbane in December 2000. The incentives were rescinded April 28, 2005, and education fund revenues retained by Burlington were returned to the state.

10
Table 2
FY 1999 FY 2000 FY 2001 FY 2002 FY 2003 FY 2004 FY 2005 FY 2006 FY 2007 TotalREVENUES:
TIF Revenue - - - 282,634 646,294 618,581 821,877 614,141 905,051 3,888,578 Returned TIF to VT (Gilbane) (163,177) (163,177) Vt Trans. Revenue 500,000 250,000 250,000 - 750,000 250,000 250,000 2,250,000 Vt Sales Tax Reallocation 159,653 69,845 229,498 Developer's Payments 144,037 144,037
Revenue Subtotal - 500,000 409,653 532,634 716,139 762,618 1,571,877 864,141 991,874 6,348,936
DEBT SERVICE:Section 108 Lake St Recon 20,000 90,948 95,856 93,432 110,167 116,518 107,893 108,847 100,049 843,710 Sect 108 Lake St Housing 12,765 26,410 26,446 26,411 92,032 COPS Urban Reserve 25,304 104,943 103,367 106,680 104,855 102,980 105,957 106,470 106,470 867,026 COPS Lakeview Garage 98,423 236,216 476,316 505,716 523,559 535,131 535,884 545,816 540,031 3,997,092 COP Fishing Pier 22,329 33,924 34,250 34,040 33,802 33,537 33,247 225,129 COPS Lakeview & Westlake Garages 330,194 330,194
Debt Subtotal 143,727 432,107 697,868 739,752 772,831 801,434 809,946 821,116 1,136,402 6,355,183
Net (Revenue less Expense) (143,727) 67,893 (288,215) (207,118) (56,692) (38,816) 761,931 43,025 (144,528) (6,247) Cumulative Net Revenue (143,727) (75,834) (364,049) (571,167) (627,859) (666,675) 95,256 138,281 (6,247)
Debt Service includes the following: Portions of HUD Section 108 and Certificates of Participation debt service in TIF DistrictPrepared by the City of Burlington
City of Burlington Tax Increment Finance(TIF) DistrictSchedule of TIF Revenues and TIF Debt Service payments


13
MILTON TIF Overview of District Of the four existing tax increment finance districts in the state, only the Milton TIF was authorized by the Vermont Economic Progress Council as part of the Economic Advancement Tax Incentive (EATI) program.4 The Milton TIF actually represents two separate areas with two sets of different conditions. The Catamount TIF was created around an existing industrial park, and TIF financing was intended to improve the infrastructure so that additional growth could take place. The Husky TIF was a greenfield development to encourage Husky Injection Molding Systems to move to the area. In November 1998, the town of Milton and Husky Injection Molding Systems were awarded a package of incentives by VEPC that included payroll, R&D, and capital investment credits, as well as TIF. The town was allowed to retain education tax revenues to pay for improvements for a period of ten years.5 The goal of the program in making dual awards was to create a partnership between towns and businesses wishing to locate or expand and provide state incentives to both parties to foster economic development. In addition, the Town of Milton authorized, a 10-year tax stabilization agreement with Husky in 1997. At the time of application to the Council, Husky stated its intention to create approximately 1,100 new full-time jobs at the facility and construct five buildings. Despite the incentives and obtaining permits for all five buildings, only one building was built and actual employment fell well short of the target. Husky utilized a fraction of the tax credits authorized and the reduction in the scale of development resulted in smaller-than-anticipated TIF revenues. The town encountered a number of difficulties that delayed projects and increased costs, including demands for a wastewater plant rather than a smaller impact decentralized system, increased wastewater connection fees, and permitting delays. Total project costs grew from an estimated $8.7 million to $17.6 million. This includes some future improvements on the drawing board, and not all costs will be paid through incremental tax revenues. See the next table for a list of specific projects and information on debt incurred to finance improvements. Debt Financing Milton worked closely with GBIC and the state in its development plans and secured an EDA grant to construct a water collection system for the Catamount TIF. The Town of Milton used town funds initially (such as their sewer fund) to pay for some improvements and then reimbursed town accounts from the TIF fund. Due to unanticipated delays in making improvements, the town retained and escrowed TIF revenues, where they accrued interest. As a result of this, it is somewhat difficult to determine whether the TIF revenues were adequate to meet debt obligations in the years since the TIF was created.
4 See No. 71 of the Acts of 1998, Sec. 47, § 5404a(f) found at p. 63 of the 1998 Acts and Resolves. 5 There are two districts—not contiguous and accounted for separately by the Town of Milton as the Catamount and Husky TIF Districts—but they were treated as one district by the Council for purposes of the award. Nine parcels in the Catamount district are owned by Greater Burlington Industrial Corporation (GBIC)/Cynosure; the remaining lots are owned privately. The tax stabilization agreement expired March 31, 2008.
14
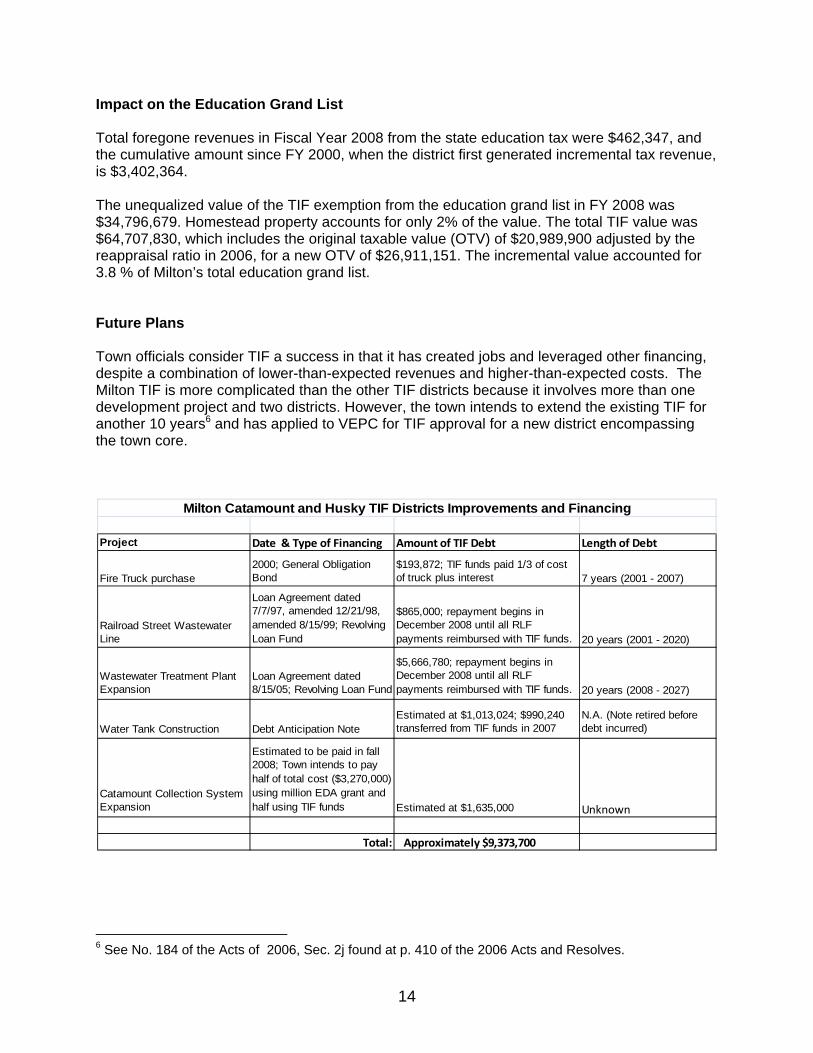
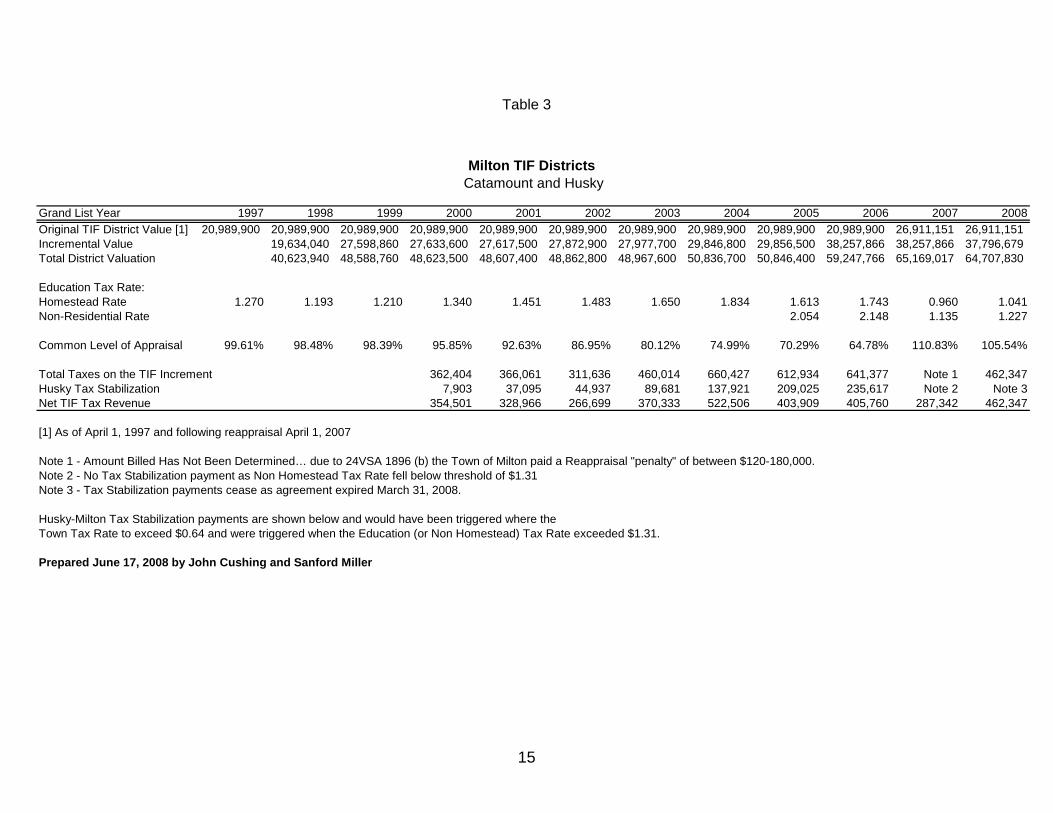
Impact on the Education Grand List Total foregone revenues in Fiscal Year 2008 from the state education tax were $462,347, and the cumulative amount since FY 2000, when the district first generated incremental tax revenue, is $3,402,364. The unequalized value of the TIF exemption from the education grand list in FY 2008 was $34,796,679. Homestead property accounts for only 2% of the value. The total TIF value was $64,707,830, which includes the original taxable value (OTV) of $20,989,900 adjusted by the reappraisal ratio in 2006, for a new OTV of $26,911,151. The incremental value accounted for 3.8 % of Milton’s total education grand list. Future Plans Town officials consider TIF a success in that it has created jobs and leveraged other financing, despite a combination of lower-than-expected revenues and higher-than-expected costs. The Milton TIF is more complicated than the other TIF districts because it involves more than one development project and two districts. However, the town intends to extend the existing TIF for another 10 years6 and has applied to VEPC for TIF approval for a new district encompassing the town core.
Project Date & Type of Financing Amount of TIF Debt Length of Debt
Fire Truck purchase2000; General Obligation Bond
$193,872; TIF funds paid 1/3 of cost of truck plus interest 7 years (2001 - 2007)
Railroad Street Wastewater Line
Loan Agreement dated 7/7/97, amended 12/21/98, amended 8/15/99; Revolving Loan Fund
$865,000; repayment begins in December 2008 until all RLF payments reimbursed with TIF funds. 20 years (2001 - 2020)
Wastewater Treatment Plant Expansion
Loan Agreement dated 8/15/05; Revolving Loan Fund
$5,666,780; repayment begins in December 2008 until all RLF payments reimbursed with TIF funds. 20 years (2008 - 2027)
Water Tank Construction Debt Anticipation NoteEstimated at $1,013,024; $990,240 transferred from TIF funds in 2007
N.A. (Note retired before debt incurred)
Catamount Collection System Expansion
Estimated to be paid in fall 2008; Town intends to pay half of total cost ($3,270,000) using million EDA grant and half using TIF funds Estimated at $1,635,000 Unknown
Total: Approximately $9,373,700
Milton Catamount and Husky TIF Districts Improvements and Financing
6 See No. 184 of the Acts of 2006, Sec. 2j found at p. 410 of the 2006 Acts and Resolves.
15
Table 3
Grand List Year 1997 1998 1999 2000 2001 2002 2003 2004 2005 2006 2007 2008Original TIF District Value [1] 20,989,900 20,989,900 20,989,900 20,989,900 20,989,900 20,989,900 20,989,900 20,989,900 20,989,900 20,989,900 26,911,151 26,911,151Incremental Value 19,634,040 27,598,860 27,633,600 27,617,500 27,872,900 27,977,700 29,846,800 29,856,500 38,257,866 38,257,866 37,796,679Total District Valuation 40,623,940 48,588,760 48,623,500 48,607,400 48,862,800 48,967,600 50,836,700 50,846,400 59,247,766 65,169,017 64,707,830
Education Tax Rate:Homestead Rate 1.270 1.193 1.210 1.340 1.451 1.483 1.650 1.834 1.613 1.743 0.960 1.041Non-Residential Rate 2.054 2.148 1.135 1.227
Common Level of Appraisal 99.61% 98.48% 98.39% 95.85% 92.63% 86.95% 80.12% 74.99% 70.29% 64.78% 110.83% 105.54%
Total Taxes on the TIF Increment 362,404 366,061 311,636 460,014 660,427 612,934 641,377 Note 1 462,347Husky Tax Stabilization 7,903 37,095 44,937 89,681 137,921 209,025 235,617 Note 2 Note 3Net TIF Tax Revenue 354,501 328,966 266,699 370,333 522,506 403,909 405,760 287,342 462,347
[1] As of April 1, 1997 and following reappraisal April 1, 2007
Note 1 - Amount Billed Has Not Been Determined… due to 24VSA 1896 (b) the Town of Milton paid a Reappraisal "penalty" of between $120-180,000.Note 2 - No Tax Stabilization payment as Non Homestead Tax Rate fell below threshold of $1.31 Note 3 - Tax Stabilization payments cease as agreement expired March 31, 2008.
Husky-Milton Tax Stabilization payments are shown below and would have been triggered where the Town Tax Rate to exceed $0.64 and were triggered when the Education (or Non Homestead) Tax Rate exceeded $1.31.
Prepared June 17, 2008 by John Cushing and Sanford Miller
Milton TIF Districts Catamount and Husky


17
NEWPORT CITY TIF Overview of District The TIF district in Newport is more commonly known as the City Center Industrial Park, located on Route 5, approximately 2.0 miles from the center of the city. The industrial park was created prior to creation of the tax increment finance district, though no development could take place without substantial investment in water, sewer, and access improvements to the property. A 47-acre area of undeveloped land, it was owned by a developer and zoned for commercial and industrial uses. The TIF district was created at the Newport town meeting in March 1997.7 The City worked with the developer in making the necessary improvements with the goal of encouraging industrial development and creating jobs. The major work involved building a waterline connecting Newport’s reservoir to Derby’s waterline as the elevation of the properties within the industrial park was too high to be serviced by the Newport reservoir. The sewer line was also extended to another industrial park, which is not part of the existing TIF district. City officials cited the need to become more competitive with other towns in the region and the difficulty in encouraging development in small towns with high tax rates. Since the TIF district was created and the new infrastructure completed, three industrial buildings have been constructed and over 100 jobs have been created. Two businesses share one structure—MSA Gillette and Fastenal—and John Deere is located in a second building. One building is not yet occupied. MSA Gillette and John Deere were both new companies to Newport City following the creation of the TIF district. Debt Financing At the annual town meeting in 1997, the voters authorized up to $300,000 in bond financing for the necessary improvements in the tax finance district. The amount of incremental municipal and education property incremental tax revenue raised has covered the bond payments on a 25-year bond in all except the first two years of the TIF (2000 and 2001) and the year of reappraisal (2004). In those years, the shortfall was paid for out of the city’s sewer and water fund. Newport has also pursued other forms of funding, including a federal EDA grant and working with the Economic Development Council to obtain CDBG financing. Impact on the Education Grand List The value of all of the property within the TIF district has increased from the $48,500 in original taxable value in 1998 to $2,954,200 in 2007, an increase of $2.9 million. The incremental value accounted for only 1.2% of Newport’s’s total education grand list. The property, originally one parcel, has been subdivided, and currently there are eight parcels within the district, ranging in value from $700 to $1.1 million. There is no homestead property within the district.
7 Newport’s TIF was grandfathered by No. 60 of the Acts of 1997. See Sec. 5404a(c) found at p. 314 of the 1997 Acts and Resolves.
18
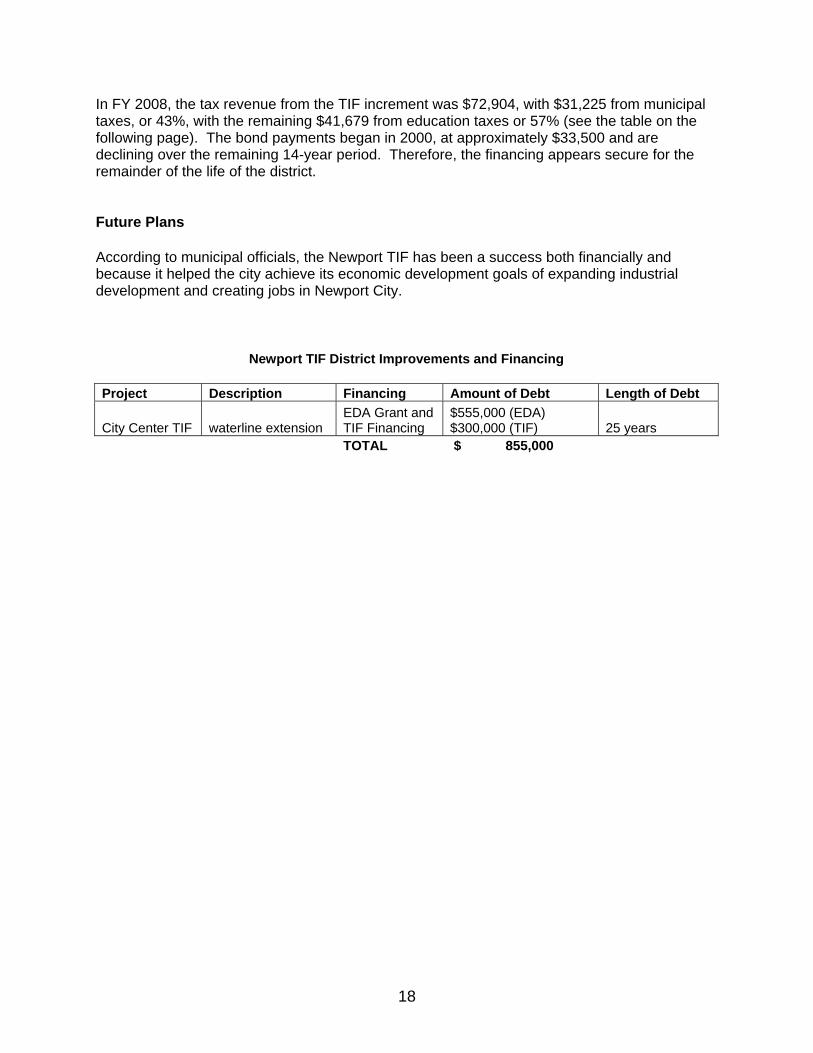
In FY 2008, the tax revenue from the TIF increment was $72,904, with $31,225 from municipal taxes, or 43%, with the remaining $41,679 from education taxes or 57% (see the table on the following page). The bond payments began in 2000, at approximately $33,500 and are declining over the remaining 14-year period. Therefore, the financing appears secure for the remainder of the life of the district. Future Plans According to municipal officials, the Newport TIF has been a success both financially and because it helped the city achieve its economic development goals of expanding industrial development and creating jobs in Newport City.
Newport TIF District Improvements and Financing Project Description Financing Amount of Debt Length of Debt
City Center TIF waterline extension EDA Grant and TIF Financing
$555,000 (EDA) $300,000 (TIF) 25 years
TOTAL $ 855,000

19
Table 4
Grand List Year 1998 1999 2000 2001 2002 2003 2004 2005 2006 2007Original TIF District Value [1] 48,500 48,500 48,500 48,500 48,500 48,500 48,500 48,500 48,500 48,500Incremental Value 0 0 44,000 1,068,400 1,701,300 1,732,600 1,810,500 2,905,700 2,905,700 2,905,700Total TIF District Value 48,500 48,500 92,500 1,116,900 1,749,800 1,781,100 1,859,000 2,954,200 2,954,200 2,954,200
Municipal Tax Rate 1.183 1.181 1.179 1.197 0.921 0.950 0.989 1.075Education Tax Rate (Non-Residential) 1.357 1.390 1.603 1.666 1.238 1.410 1.430 1.434Total Tax Rate 2.540 2.571 2.782 2.863 2.159 2.360 2.419 2.509
Taxes on the TIF Increment TotalsMunicipal Taxes 521 12,618 20,058 20,739 16,677 27,604 28,749 31,225 158,190Education Taxes 597 14,851 27,272 28,865 22,419 40,970 41,552 41,679 218,205Total TIF Taxes 1,118 27,469 47,330 49,604 39,096 68,575 70,301 72,904 376,396
Actual Bond Payments 33,481 32,726 31,911 31,076 30,220 29,339 28,434 27,509 244,692Difference [2] (32,363) (5,257) 15,420 18,529 8,876 39,236 41,867 45,396
[1] As of April 1, 1997[2] In 2000 and 2001 the taxes collected from the TIF District iwere not sufficient to fully cover the bond payment, and the difference was paid from the City's sewer and water fund.Source: City of Newport
Note: The City of Newport conducted a City wide reappraisal in 2004, but due to the fact that the TIF increase already exceeded the amount needed to make the bond payment the increase due to the reappraisal has never been calculated.
Newport City TIF District

DRIVE
IND
USTR
IAL
241.5'259'
486'486.92'
151.
94'
682.9'
98'
50.5
'
142.9'19
8.8'
225'
325'
225'
128.53 Ac
270.4'
44220
4'
376.
4'
200.1'
786.6'
204'
201.
4'
171.7'
222.2'
170'
442'
279.24'
5.99
'
50.01'
119.
19'
254.62'
1B
EASEMENTUTILITYVERIZON
71.41'
3.99 Ac
331.4'
0.73 Ac
71.85'
79.2
8'
148'
210' 27.58'
148.52'
133.
56'
103.51'
22.0190.79 Ac
ECITY OF NEWPORT
124.26'
335.88'
150'
259.13' 159.13'
65.16'
188.42'
106.69'
50'
154.5'
95.9 '16.5 '140.6'
227.7'
337.5'
151.5'
145.
2'
47.8
'16
4'
30' R
/W41.66 Ac
31.62 Ac
22.002
167'
510'
25'
555'
22.010
22.015
22.009
22.006
22.016
22.007
22.008
288.36'
1.75 Ac
7.84'
106.8'
115.77'
22.00594.42'
266.85' 22.0111.51 Ac
156.03'
22.017
22.004
22.003
22.001
70.6'
222'
48.27'
139.42'
0.42 Ac22.014
130.5
5'
230'
79.2
'57
.8'
22.0132.52 Ac
374.35'
119.89'
22.018
159.35'
36.9
1'
73.39'
86.39'
22.12
223.
32'
80.3
1'
R/W
13.32'
240.84'
60.2 '
2.8 AcC
741.5'
684.8'
21.6 '
569.15'
201.
48'
267.18'
125'
300'
377.6'
300'
95.49'250.
3'
75.2
'
274.5'274.6'
350'
172.
3'
129.1'
350'
350'
268.
8'
574.
7'703'
378.
3'
0.53 AcC
300'
350'
150.49'
283'100'
350'
17'
268.8'
378.
3'
2021
0.960 Ac
3.122 Ac
125'45'
425'
R/W
325'
425'
45'125'
275'
R/W
367.
5'
359.4'1077.7'
22.8 '
423.82'
57'
341'
366.
1'
EAST MAIN STREET
61'
267.18'
59.88'
200'
376.
39'
203.
9'
R/W
400'S
ECITY OF NEWPORT
RESERVOIR
337.
9'
-W--W-
5
15
16
17
18
19
23
ROUTES 5
& 105
2.6 AcC
2.1 AcC
1.6 AcC
2.14 Ac
1.6 AcC
312'
312'
100'
150'
197.01'
209.
62'
86.6
3'
132'
66'
193'S
189.75'
86.6
3'
97'
164.
58'
165.
04'
65.88'
50'
92.07'
167.75'
182.01'
243.66'
73.9 '
49.1
'
337.
9'
257.4'
111.
5'
CLYDE
R/W
200'
1113
14
15
16
17
18
20
0.51 AcC
0.73 AcC
0.47 AcC
0.42 AcC
0.32 AcC
6.4 AcC
147'S
ABEL
ST
REET
(P
VT R
/W)
581.3'594'
67'S
135'S
254.
9'15
5.8'
159.3'
60'200'
93'
70'
120.1'127.6'
105'
24.72'
177.18'
67.3
1'
97.5
'
196.
38'
188.
4'
280.2'
143'118.38'
137.
75'
118.89'
11.86'148.78'
129.
25'
147.
26'
149.
39'
112.93'
89'
231'
61.4 'CLYDE RIVER
338.9'
131.9'
19
2122
2324
62
6364
0.347 Ac
0.27 AcC 0.56 AcC
0.48 AcC
0.48 AcC
0.2 Ac
0.61 AcC5.34 Ac CITIZENS UTILITIES TRANSMISSION EASEMENT
100'S
296'S
165'STREET
0.25AcC CITIZENS UTILITIES TRANSMISSION E
ASEMENT
®This is copy of a portion of Newport City's Tax Maps.Newport City's Tax Maps were produced for Assessment Purposes Only.
Newport City's Tax Maps are not valid for legal description or conveyance.
0 400 800Feet
Newport City TIF District - Industrial Drive
2/8/2007

21
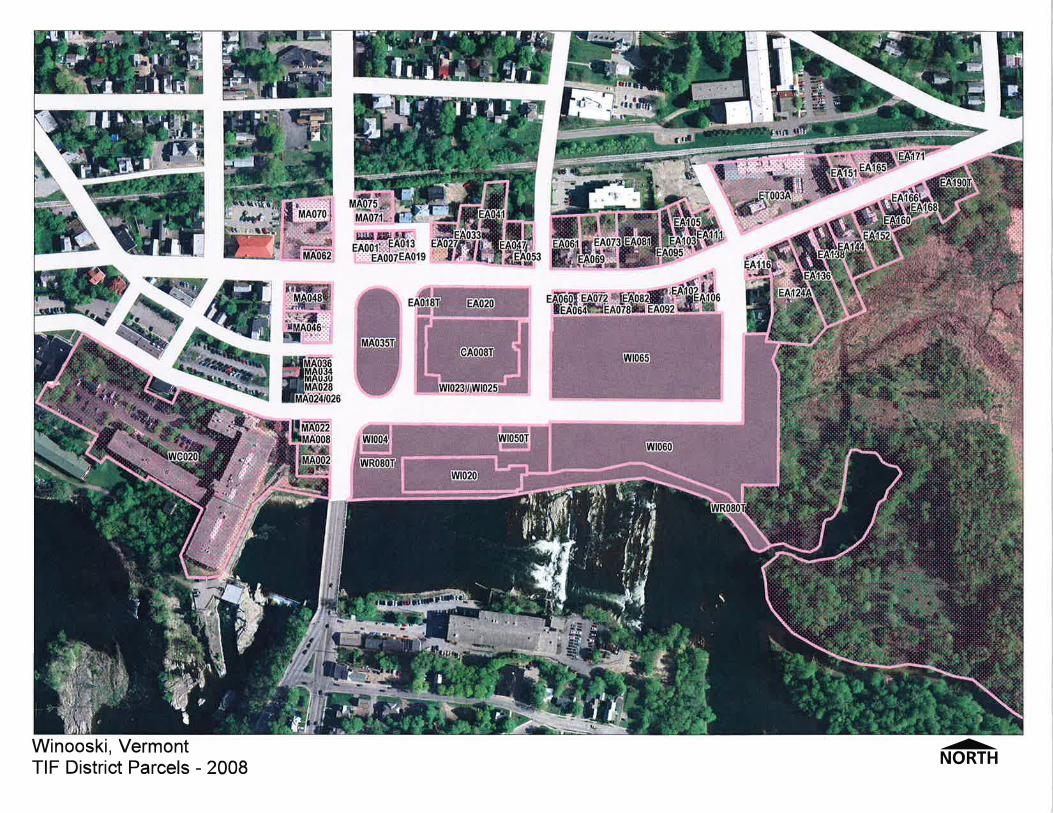
WINOOSKI TIF Overview of District Winooski has worked on a variety of redevelopment plans, and in 1999, the city began to outline a downtown revitalization plan that envisioned mixed use development in the historic downtown area and incorporated principles of “smart growth.” Unlike the other tax increment finance districts in Vermont, the Winooski TIF was authorized in special legislation, which deemed that the redevelopment and rehabilitation of the Champlain Mill area had significant public benefits and therefore should be granted the means to finance various improvements.8 Winooski voters approved the creation of the district in November 2000, but the entire project was delayed the following year by the events of 9/11, which made it difficult to find developers to partner with the project. Work did not begin in earnest until 2004, when the City began working with an out-of state developer. In order to carry out its plans after receiving legislative authorization, the city, in partnership with Winooski Community Development Corporation, purchased some property and acquired other parcels through condemnation. Improvements were made both within the district and outside the area, including expansion of sewer and water, rebuilding roads and sidewalks, work on the electrical substation and removing all overhead wires, installing traffic control devices, and reconfiguring the Main Street/E. Allen Street intersection. The Winooski TIF represents the largest TIF project in the state in terms of public commitment of funds and the scale of the redevelopment plans. At the center of the downtown revitalization plan are several housing projects—Keen’s Crossing, The Cascades riverfront condominiums, and Spinner Place, which contains student housing leased by UVM and Champlain College. The repositioning of the Champlain Mill away from a retail focus to an emergent media center, in partnership with Champlain College, is intended to spur new growth, and a new building for the Vermont Student Assistance Corporation retains an important employer. In addition, a large municipal parking garage has been built with commercial and retail space. More than 100 acres of public open space are also retained. The results to-date have been modified significantly from what was originally envisioned because of the changing economic situation and the need for private developers to assist in a portion of the plan. Debt Financing The legislation was quite specific in laying out the terms of debt, citing only bonding and the use of incremental education tax revenues for a maximum of 20 years. It also specified that 100% of municipal incremental taxes on parcels within the district be “pledged and appropriated solely for debt service on the bonds.” Winooski has bonded for $25.9 million to finance the plan and began making debt service payments in 2006; their first payment of principal will be this year. The city sought additional funding sources, including a federal grant of $40 million and a HUD Section 108 loan for $24 million, among other financing options. The city also received state funds granted through the
8 See Act 159 of the 20006 Legislative Session, Sec. 37-38 found at p.700 of the 2000 Acts and Resolves.

22
sales tax reallocation program administered by the Downtown Board, although not as much as initially anticipated. Impact on the Education Grand List Total incremental education tax revenues in FY 2008 from the Winooski TIF were $476,068, of which only 3% was from homestead properties. This was the first year that tax revenue was generated from the incremental value in the district. Winooski dedicates both municipal and education property taxes from the TIF for repayment of the debt. A provision of Act 159 required that “5 percent of the education taxes imposed annually on the excess valuation of the residential property within the district” be paid to the Education Fund. The wording presented difficulties for the Property Valuation and Review Division in implementation and was amended in 2008 to be 2% of the total value. In FY08, that resulted in a reduction in net incremental education tax revenue of $9,521. The unequalized property value of the TIF exemption was $36,397,800. The original taxable base value is $24,822,900, for a total TIF property value in FY 2008 of $61,220,700. The incremental value accounted for 8.3% of Winooski’s total education grand list. Future Plans Winooski considers the TIF a success overall and future plans include the creation of more residential and retail spaces. City officials expressed concern, however, about the impact of the economic downturn on new housing units coming onto the market. The city’s reappraisal in 2007 led to questions regarding the treatment of the original taxable value in calculating the common level of appraisal in TIF towns when the new value showed that the original properties had lost value. The legislature provided a one-year “fix” and directed the Tax Department and Legislative Joint Fiscal Office to examine the issue more thoroughly.

24

25
ECONOMIC DEVELOPMENT THROUGH TAX INCREMENT FINANCING Tax increment financing is sometimes referred to as a financing tool and sometimes as an economic development tool. It is both. As explained in the introductory section of the report, the concept is straightforward. It allows municipalities to dedicate future property tax revenues from resulting private development in a specified geographic area to finance current improvements to infrastructure associated with the new development. Other types of financing are available for infrastructure improvements, but cutbacks in federal and state aid over the last two decades have increased the popularity of tax increment financing. TIF has strong advocates and detractors, and considerable effort and ink have been expended over the years defending those positions. In this report we do not side with either position but attempt to provide guidance on evaluating the claims that are often made. Assessing the results of any economic development program is a challenge for two reasons. First, success in economic development can be measured in a wide variety of ways. New jobs, higher wages, increased tax revenues and property value, decreased need for social services, attractiveness to private investors, and population growth are all signs of economic development, but each measure may grow at a different rate and is subject to regional and national economic influences. How to separate the effects of job growth and increased property values from larger economic forces, particularly in the few population areas in the state that are dependent on several engines of economic growth? The second challenge stems from the substantial differences between types and development goals of projects, making comparisons more challenging. Should the measures of success for a new industrial park constructed on vacant land be the same as the revitalization of a downtown district? Economic redevelopment in a blighted or stagnant urban area where infrastructure is crumbling and property values are decreasing is different from economic development in an undeveloped area. The figure on the following page depicts the former scenario, a classic but now atypical example of TIF. The terms of success for an urban revitalization project may be to repay the bond used to finance the infrastructure improvements, to retain jobs, improve infrastructure, and prevent dislocation. Success in projects that utilize green field areas may be measured as increases in property value, new jobs, and local population growth. The four municipalities in Vermont that have implemented TIF display a mix of revitalization and green field development and, thus, are difficult to compare. In Vermont, as in most areas of the country, TIF is a mechanism that utilizes future property tax revenue to finance current expenditures, so one important measure of success is the change in property value. The governing concept of TIF is that public infrastructure investments will lead to private sector investment in areas that would otherwise see no growth or even negative growth. By leveraging public dollars to encourage development, a municipality is able to spur growth and expand the tax base. The figure below illustrates the TIF concept, which shows how development resulting from infrastructure improvements increases property values, producing incremental valuation that provides for repayment of the incurred municipal debt. The x axis represents the years before and after creation of the district; the y axis represents the total assessed value for this imaginary TIF district.

26
An Overview of Tax Increment Finance in Practice Nationally Expanded use of TIF in recent decades has generated greater debate and study, some to evaluate TIF generally but more often to analyze particular TIF programs. The focus of these studies varies—some concentrate on its value in meeting economic development goals, others on the question of whether TIF projects indeed pay for themselves. In part because the measures of success are not uniform and in part because the underlying economic conditions are different, these studies do not offer any clear judgment on whether TIF is a successful tool for economic development. Some of the factors that influence the “success” of TIF implementation are the design, oversight, and administrative structure of the program. Michigan’s enabling TIF legislation was designed to “prevent urban deterioration and encourage economic development and activity and to encourage neighborhood revitalization and historic preservation.” TIF has proven to be very successful, according to the Michigan Land Use Institute, particularly because TIF has been used to “level the playing field between greenfield site development, which has no environmental costs, and brownfield site development, which can have high environmental and other special costs.”9 Rather than typical bond financing to pay for the initial redevelopment, Michigan has developed a three-part financing mechanism: a redevelopment grant, a loan for cleanup, and a loan for demolition and site preparation. The two loan programs are designed to work with TIF as it features flexible repayment terms.
9 “Brownfield Tax Increment Financing.” Michigan Land Use Institute. November 2005, p. 1. 10 March 2009. <http://www.mlui.org/growthmanagement/fullarticle.asp?fileid=16943>

27
Utah has also had great success with TIF. Through the Redevelopment Agencies Act, enacted in 2001, local governments are required to use TIF to provide affordable housing. For projects that generate $100,000 in annual tax increments, a minimum of 20 percent must be allocated for the development of affordable housing. Two major affordable housing efforts have been conducted since the beginning of the act.10 In Illinois, the measure of success for TIF in one study was based on the rate of growth in TIF municipalities. A conclusion from that analysis suggests that in Illinois some TIF districts have hindered growth. The case study examined 235 cities between the years 1984 and 1996 (81 were TIF districts, 154 were not). The fundamental finding was that municipalities utilizing TIF grew more slowly than the districts that had not incorporated TIF. An additional finding was that growth was even slower in areas directly outside the designated TIF district. Overall job losses in areas surrounding each TIF district more than offset the increase in jobs within the district.11 A study published by Iowa State University focused on benefits and costs of TIF growth in that state. Iowa currently has more than 2,000 designated TIF districts, with more than a quarter of the state’s recent real tax base growth sequestered in TIF districts. 12 There has been a subsequent shift in school financing from the local to the state level as state aid substitutes for the erosion of the local tax base. A further finding, of concern to states like Vermont with large rural areas, is that the benefits were highly concentrated in and around the Iowa’s metropolitan counties. California, which invented tax increment financing, maintains hundreds of TIF districts and leads the nation in debt issued through TIF.13 Study results from the Public Policy Institute of California suggest that the TIF system in that state, at least as it existed prior to legislative changes restricting its application, was not an effective way to finance redevelopment.14 The study distinguishes between redevelopment and development in its observation that those projects that came closest to generating enough increase in assessed value to account for their share of revenue defined blight broadly and included significant amounts of vacant land. Success as measured in the Michigan and Utah studies was highly dependent on a single variable—the cost effectiveness of providing, respectively, development in brownfields or creating affordable housing with limited public investment. The studies in Illinois and Iowa focused on the proliferation of TIF districts in those states and the effects of a balkanized economic development strategy. The California study looked more broadly at the subject of TIF as a tool for economic development and concluded that success was highly contingent on a 10 Infrastructure Solutions. 2006. National Association of Home Builders. 03 June 2008 <http://www.realtor.org/smart_growth.nsf/docfiles/Infrastructure_solutions.pdf/$FILE/Infrastructure_solutions.pdf>. 11 Dye, Richard F., and David F. Merriman. TIF Districts Hinder Growth. 2000. Institute of Government and Public Affairs. 09 June 2008 <http://www.igpa.uiuc.edu/lib/data/pdf/PF13-4_tiff.pdf>; Dye and Merriman. “Tax Increment Financing: A Tool for Economic Development.” Land Lines 18:1 (Jan. 2006). 08 March 2009. <http://www.lincolninst.edu/pubs/PubDetail.aspx?pubid=1078> 12 Eathington, Liesl and Dave Swenson. Tax Increment Financing Growth in Iowa. Dept. of Economics, Iowa State University. Apr. 2006, p. 33. 10 March 2009 <http://www.econ.iastate.edu/research/webpapers/paper_12586.pdf>. 13 “Tax Increment Financing and Economic Development: Uses, Structures, and Impact.” (Book Review). David Merriman. National Tax Journal 55:4 (Dec. 2002), p. 839-43. 14 Dardia, Michael. Subsidizing Redevelopment in California. 1998. Public Policy Institute of California. 08 March 2009 http://www.ppic.org/main/publication.asp?i=70
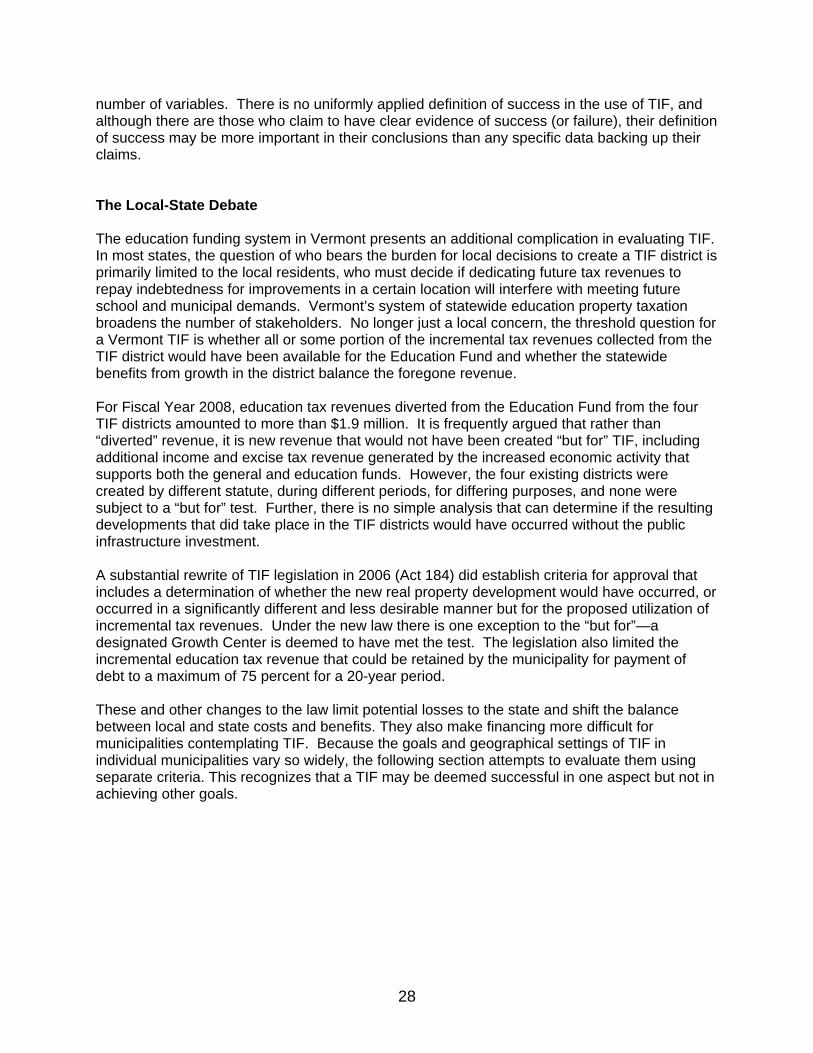
28
number of variables. There is no uniformly applied definition of success in the use of TIF, and although there are those who claim to have clear evidence of success (or failure), their definition of success may be more important in their conclusions than any specific data backing up their claims. The Local-State Debate The education funding system in Vermont presents an additional complication in evaluating TIF. In most states, the question of who bears the burden for local decisions to create a TIF district is primarily limited to the local residents, who must decide if dedicating future tax revenues to repay indebtedness for improvements in a certain location will interfere with meeting future school and municipal demands. Vermont’s system of statewide education property taxation broadens the number of stakeholders. No longer just a local concern, the threshold question for a Vermont TIF is whether all or some portion of the incremental tax revenues collected from the TIF district would have been available for the Education Fund and whether the statewide benefits from growth in the district balance the foregone revenue. For Fiscal Year 2008, education tax revenues diverted from the Education Fund from the four TIF districts amounted to more than $1.9 million. It is frequently argued that rather than “diverted” revenue, it is new revenue that would not have been created “but for” TIF, including additional income and excise tax revenue generated by the increased economic activity that supports both the general and education funds. However, the four existing districts were created by different statute, during different periods, for differing purposes, and none were subject to a “but for” test. Further, there is no simple analysis that can determine if the resulting developments that did take place in the TIF districts would have occurred without the public infrastructure investment. A substantial rewrite of TIF legislation in 2006 (Act 184) did establish criteria for approval that includes a determination of whether the new real property development would have occurred, or occurred in a significantly different and less desirable manner but for the proposed utilization of incremental tax revenues. Under the new law there is one exception to the “but for”—a designated Growth Center is deemed to have met the test. The legislation also limited the incremental education tax revenue that could be retained by the municipality for payment of debt to a maximum of 75 percent for a 20-year period. These and other changes to the law limit potential losses to the state and shift the balance between local and state costs and benefits. They also make financing more difficult for municipalities contemplating TIF. Because the goals and geographical settings of TIF in individual municipalities vary so widely, the following section attempts to evaluate them using separate criteria. This recognizes that a TIF may be deemed successful in one aspect but not in achieving other goals.

29
Evaluating the Success of TIF in Vermont There are several measures that may be used to evaluate the success of TIF in Vermont including 1) grand list growth; 2) job creation and economic development; 3) financial stability; and 4) achieving land use goals. It is useful to analyze each of these measures separately because some of them are at odds with others. For example, the goal of maximizing grand list growth may conflict with the goals of smart growth. Likewise, a focus on rapid economic development may prove incompatible with locating new jobs in a designated downtown because of space, travel, or building and zoning constraints. It is also important when measuring success to consider whether the government could utilize the tax revenue more efficiently to meet these policy goals. Grand List Growth Growth in property values is the most obvious and easiest measure to analyze in determining the success of a TIF. The table below shows the amount of total public financing invested in each TIF district for improvements and the increase in property values within the district.
Vermont TIF Districts
TIF District Total Public Financing for TIF Districts
Increase in Property Value in TIF Districts
(% change from pre-improvement value)
Total Increase in Property Value in Town for TIF Period
Burlington $16,810,350 $70,184,493 165% 103%
Milton $9,373,700 $34,796,679 166% 112%
Newport $300,000 $2,905,700 5,991% 62%
Winooski $25,900,000 $36,397,800 147% 93%
Burlington, Milton, and Winooski have experienced similar growth in property values. Newport’s dramatic increase in property values over 10 years is due to the fact that this small project was created in a green field and the development was strictly industrial. Although Milton did not experience the same growth in property value, the development in one of the Milton TIF districts is similar to that in Newport. The Catamount Industrial Park, Milton’s southern TIF district, was a redevelopment project that ran into significant delays and, as a result, experienced very little growth in property values. However, Milton’s northern TIF district, the new manufacturing site for Husky Injection Molding, encompassed undeveloped land and was where most of the
30
increase in property values in Milton occurred. Because growth is measured calculated on the total original taxable base of both districts and the Catamount district comprises 93 percent of the original value, the large property value increase in the Husky district is diluted. The largest increase in TIF district property values is achieved by development on previously undeveloped land, and the least growth in property values occurs on in-fill or redevelopment projects. The amount of public financing provided in the second column of the table does not include debt service, so the figures underestimate the overall debt burden. However, a ratio of the increase in property value to the level of public financing for improvements provides some perspective. Despite significant differences in the type of development, Burlington and Milton have a similar relationship of property value increase to public financing relationship—a ratio of roughly four to one. Newport is again the outlier, showing a return of almost ten to one. Winooski’s relatively poor showing of about 1.4 to 1 reflects the upfront public costs for improvements in newer districts that have yet to see the return from subsequent economic development. The last column in the table compares TIF-influenced property value changes within the districts to overall growth in each of the municipalities over the relevant time period. In every case, the growth in the district was greater than the municipality as a whole, and by this measure all four TIF districts are successful. Although the extreme difference in Newport between TIF district growth and total municipal growth could be encouragement to develop green fields, the Michigan and Iowa studies emphasize that other factors must be considered, particularly when comparing districts with green field development to districts designed to redevelop downtown areas. The success of tax increment financing in Vermont as measured by the growth in property values must be considered in the context of larger economic factors, most notably the unprecedented growth in real property values statewide, both from new construction and appreciation. The following chart illustrates the increase in the equalized education grand list from 1980 to 2007 with projections through 2012. There were two significant periods of increase, first during the late 1980s and then after 2000. The provisions in Act 60 and Act 68 that grandfathered the two existing TIF districts in 1997 occurred just prior to a substantial and sustained increase in property values, both in Vermont and the country as a whole. Between 1997 and 2007, the Vermont grand list grew by 74.6 percent and had an annual compound growth rate of 5.7 percent. TIF alone cannot fully explain increased property values within the districts or municipalities. Other market and economic forces unrelated to TIF certainly affected property values even while the TIF district was active.

31
Vermont Real Adjusted Equalized Education Grand List
0
10,000
20,000
30,000
40,000
50,000
60,000
70,000
1980
1981
1982
1983
1984
1985
1986
1987
1988
1989
1990
1991
1992
1993
1994
1995
1996
1997
1998
1999
2000
2001
2002
2003
2004
2005
2006
2007
2008
2009
2010
2011
2012
Fiscal Year (2008 - 2012 are projections)
($ M
illio
ns)
TIF Implementation/Evaluation Period

32
Job Creation and Economic Development Broadly speaking, economic development is fundamentally about improving economic vitality and increasing high quality employment opportunities, with secondary and tertiary effects on tax revenues. As part of this study, data from the departments of Labor and Taxes was analyzed to determine whether there has been a positive return on investment based on a number of measures of economic development.15 Labor data on number of establishments, number of employees, average wage, and total wages was analyzed, both in nominal terms and real terms (where applicable), as was tax data from the sales and use tax, income tax and, in the case of Burlington, meals and rooms tax. The data sets represent the entire municipality rather than just the TIF district, due in part to confidentiality concerns and in part to the difficulty and limitations of district-level measures (e.g., income tax data would be meaningless if measured by district because it relates to residency, not employment). The data have not been normalized over the period analyzed, and it is important to note that the sales tax rate increased 20 percent, from 5 to 6 percent, effective October 1, 2003.
• Burlington: From 1997-2006, the number of businesses decreased 11 percent, but the number of employees increased 10 percent. The city experienced a 1.6 percent annual increase in the average real wage, with a slightly higher average wage increase than in Chittenden County as a whole. From 2000 through 2006, adjusting for inflation, receipts from sales and use tax rose nearly 11 percent, meals and rooms tax receipts increased 5 percent, while income tax was flat.
• Milton: From 1997 through 2006, there was a significant increase in both the number of
businesses and the number of employees. Businesses increased by 15 percent and employees increased by 41 percent, and the average real wage increased about 2.5 percent annually. During the period from 2002-2006, annual sales and use tax receipts grew nearly 9 percent and income tax receipts by 2.5 percent, adjusted for inflation.
• Newport: The data show a negligible gain in the number of businesses between 1997-
2006 period but a 16 percent increase in the number of employees. The average real wage increased just one percent on an annualized basis during the period. Nominal retail sales tax collections increased less than 6 percent over the period, which translates into a loss of revenue after adjusting for inflation. Annually, income tax receipts rose 2 percent in real terms.
• Winooski: Results for Winooski are more negative. However, only six years of labor
data were analyzed, which does not include most of the post-improvement period. Both the number of businesses and employees declined, but the average real wage increased 2.3 percent on an annualized basis. Sales tax receipts declined substantially, and income taxes were essentially flat after adjusting for inflation.
15 Brett Serafin, a 2008 summer intern at the Lake Champlain Regional Chamber of Commerce, was very helpful in collecting and analyzing the data. Data from DOL were examined for the period 1997-2006 in Burlington, Milton and Newport; Winooski from 2000-2006. Tax department data was only for the period 2000-2006.

33
These results offer some initial benchmarks, but the problems in utilizing town-wide data to represent changes in the much more limited geographical area of a TIF district are considerable and cannot be considered conclusive. Financial Stability Private investment in real property that leads to greater economic activity and therefore higher assessed property values is the most important factor in debt affordability for a municipality considering whether a TIF project is viable. In the three older TIF districts, which were created prior to 2000, none were able to depend solely on the revenue generated from the property tax increment to meet all of their debt obligations. • The Newport TIF did not generate enough revenue in the first two years to make the bond
payments and had to rely on other funds to make up the difference. In subsequent years, after industrial development was completed, the TIF revenue more than met the demands of its bond payments and is expected to do so until the bond is retired. Newport also used a federal EDA grant and CDGB funding to offset the total costs of the project.
• The Burlington TIF was designed utilizing several other sources of revenue (transportation revenue, sales tax reallocation and developer lease payments) to meet its debt obligations. The first two years, during the initial development phase of the district, Burlington relied exclusively on alternative revenue sources, which accounted for 41 percent of the total TIF revenue between FY99 and FY07. Additionally, in only three of those nine fiscal years did all the revenue from all sources associated with the TIF exceed debt service on the district.
• Milton used an EDA grant and initially some municipal funds to pay for improvements. This payment was later reimbursed from TIF revenues. Due to unanticipated permitting problems that delayed improvements, Milton retained and escrowed TIF revenues in the early years after creation of the district, where they accrued interest. As a result, it is difficult to determine whether the TIF revenues were sufficient to meet debt obligations in the years since the TIF was created.
Two of the three municipalities with older tax increment financing districts have requested extensions of their TIF district. In the case of Milton, which was authorized for a 10-year TIF district as part of a VEPC package of awards, they lobbied for 10 year extension to achieve their financial goals. Burlington, one of the grandfathered districts, had 10 years to incur debt and a retention period sufficient to retire the debt, in this case until 2025. However, the city has approached VEPC and the General Assembly in an effort to extend the period in which they can incur additional debt for further improvements in the area. Any project requiring indebtedness over a 20-year time horizon involves uncertainty and risk, and larger economic conditions are one factor that can affect the dependability of tax revenues. The recession in the early part of this decade forced Winooski officials to reconsider the size and scale of the original TIF proposal. Additionally, the volatility of the property tax market in the last several years has been both a boon and a worry to municipal officials who depend on property tax revenues to retire TIF debt. Vermont’s system of a statewide property tax adds an additional dimension to the question of financial stability since a large portion of the revenue retained by the municipality is generated

34
by education property taxes, approximately 70 percent. Success of a TIF district thus affects the state’s ability to fund education. A shift from funding education with property taxes to an alternative source, such as the income tax, would disrupt anticipated revenues and likely have a disastrous effect on existing TIF districts without additional legislative action to hold municipalities harmless. From this limited TIF experience, it appears that financial stability is partially dependent on access to secondary funding sources, especially in the early years of development. Success, by this measure, also seems contingent on conservative projections that anticipate economic cycles over the life of the district, placing those municipalities in a better position to meet financial challenges as they arise. Achieving Land Use Goals Tax increment finance districts may be more effective than most other economic development tools in effecting land use objectives because the boundaries of a TIF district are determined in advance and may be drawn to achieve land use objectives specified in municipal plans. Although proponents of TIF have often touted smart growth as a TIF objective, it is only in recent legislation that location and land use criteria became explicit requirements for approval of a TIF when they were added in 2006 (Act 184).
TIF Location Criteria 32 V.S.A. §5404a.
(3) Location criteria. Determine that each application meets one of the following criteria:
(A) The development or redevelopment is compact, high density, and located in or near existing industrial areas.
(B) The proposed district is within an approved growth center, designated downtown, designated village center, or new town center.
(C) The development will occur in an area that is economically distressed, which for the purposes of this subdivision means that the area has experienced patterns of increasing unemployment, a drop in average wages, or a decline in real property values.
Subdivision (h)(3)(D) repealed effective July 1, 2009.
(D) The development or redevelopment is compact, high density, and located in or near existing commercial or residential areas.
Subdivision (h)(3)(D) allows development in or near existing commercial and residential areas. This exception was included, and extended an additional year, to allow Milton’s application for a new TIF in the downtown core. In May 2009, Milton became the first municipality to be approved for a new TIF using these criteria. It is too early to know whether the new criteria for evaluating proposed districts will be effective in targeting TIF development in a desirable manner.
The four TIFs reviewed in this report were not subject to an approval process that involved location criteria, but for purposes of evaluation may be grouped into two main land use categories--downtown redevelopment and industrial development. The TIF districts in both

35
Burlington and Winooski are located in downtown areas where both redevelopment and new infill development are components of their policy objectives. The TIF districts in Milton and Newport are designed primarily for new industrial development.
• The Burlington TIF includes a substantial portion of the lakeshore property closest to the city center and a strip in the heart of the downtown area. Most of the revitalization of the downtown waterfront is encompassed by the TIF district. This project has not centered around one particular employer or project but rather the major commercial and recreational area of the city. By all appearances, Burlington has been successful in retaining the vitality of its urban core despite numerous pressures from surrounding suburban development.
• Like Burlington, the Winooski TIF is designed to redevelop the downtown, revitalize the
community, and incorporate the riverfront. The Winooski TIF substantially changed the downtown area of the city and required a large amount of public investment ($25.9 million) in new infrastructure to facilitate the redevelopment. Winooski’s TIF is anticipated to be the largest in scope of all of the existing TIF proposals in Vermont to-date and will correspondingly utilize the most resources.
• The Milton TIF is made up of two unconnected districts. At the southern edge of the
Milton community the town’s industrial park is one portion of the TIF, while the Husky facility was constructed in a green field to the north of the town. Both portions of the TIF were focused on new industrial development. The industrial park existed prior to the creation of the TIF and new utilities were planned to entice additional businesses to the vacant sites. The property containing the Husky facility was never fully developed and other than bringing that particular business to the state, does not appear to have fulfilled the original promise of a multi-phase facility with potential ancillary businesses on one large industrial campus.
• The Newport City TIF, although within the city limits, was located on a previously
undeveloped parcel. The resulting development appears to be the typical industrial construction utilizing large areas of land that occurs frequently and does not appear to meet land use goals of compact or high density development. One of the industrial buildings is not occupied and the original project vision is not complete.
In summary, while none of the TIF districts discussed in this report were required to meet any state land use goals, they are of two results: those that contributed to downtown redevelopment efforts undertaken by the respective municipalities; and those that did not change or improve the typical pattern of industrial development already present in each community. The TIF criteria developed for future approvals may help steer more desirable development, but TIFs in Vermont continue to attempt to meet at least two goals that are often not compatible; new job creation, and revitalization of urban downtowns. Alternatives to TIF Tax increment financing has become increasingly popular as local needs for job creation and improvements to or expansion of aging infrastructure meet state and federal fiscal pressures that make access to financing more difficult. Until those needs are adequately addressed, it is unlikely that TIF will disappear. There are, however, some tools available to help Vermont

36
communities address their infrastructure needs, either in conjunction with TIF or instead of it.
• HUD Section 108 loans • EDA and USDA grants • Community Development Block Grants • Municipal Planning Grants • Vermont State Infrastructure Bank (SIB) • Drinking Water State Revolving Loan Fund • Brownfield Revitalization Fund (BRF) Loan Program • State water and wastewater programs; watershed grants
Additionally, there are numerous programs in the state that directly assist businesses and work with communities to promote local economic development. TIF should be seen—and evaluated—within this larger economic development picture.
37
HOMESTEAD PROPERTY WITHIN TIF DISTRICTS The current system of netting property tax bills introduces some unforeseen issues for municipalities with existing TIF districts. All four towns calculate the incremental revenue from the education property tax as the education tax rate (two rates, homestead and non-residential, beginning in 2004), multiplied by the increase in value of the appropriate property category within the district. This calculation results in the total amount of education property taxes the town may retain. For non-residential property, this aggregate figure is accurate, but for homestead property where Vermont residents may qualify for a property tax adjustment, this figure represents more than the actual amount of education taxes collected from these properties. Therefore, because the town retains the full amount of the increment, and the state collects only the adjusted amount of property taxes, the full cost to the Education Fund always exceeds the amount retained by municipalities with TIF districts, unless the district has no residential property. Traditionally, tax increment financing was used to promote commercial and industrial development and rarely included large amounts of residential property. This is the model for both the Newport TIF, which contains no residential property and the Milton TIF districts, which contain a relatively small amount of residential property value within the industrial park. More recent TIF developments, both nationally and locally, have focused on mixed-use, downtown revitalization similar to the Burlington and Winooski TIF districts, which include housing development as part of the redevelopment vision. Until recently, FY 2008, towns had no option but to retain the full incremental tax revenue because they issued bills for the full amount of education property tax and individual taxpayers received property adjustment checks directly from the Vermont Department of Taxes. Two years ago the system was changed, and now taxpayers receive adjusted tax bills directly from their municipality. This results in the State paying twice for these adjustments—once to the taxpayer in the form of a reduced property tax bill and again when the tax increment is calculated on the gross, not net, amount and retained by the municipality. All of the TIF towns except Newport have residential property within their district, and 20 of these properties received a property tax adjustment last year, for a total of $40,315. The Education Fund lost twice that amount in the form of reduced property taxes. While the magnitude of the difference between the total and the net amount of education property taxes within the existing TIF districts is not substantial, the problem will become more serious as the number of TIF districts proliferate and a greater emphasis is put on mixed-use development, especially affordable housing. The recent approval of the new TIF district in Milton encompassing a substantial portion of their downtown residential core is a good example of the growing problem. There are several issues associated with an attempt to have towns retain the net amount of education property tax from the increment. These include: • Towns cannot independently determine the correct amount of incremental tax revenue to
retain because property tax adjustments may be comprised of more than the offset of education taxes. The adjustment may also include all or a portion of a taxpayer’s refund credited towards their education property tax payment. In addition, some homeowners are eligible for an additional adjustment of municipal taxes, which is included in the total amount. Consequently, it would not be appropriate to subtract the entire property tax adjustment from the education tax increment the municipality is entitled to retain.

38
• Calculating the net amount of incremental tax revenue poses timing problems. The
Department of Taxes issues the first file of property tax adjustments to the towns in July, the second in September, and changes are submitted until late December. This poses accounting difficulties in calculating the increment to be retained by the town. One possible way to adjust the tax increment retained by the town would be with one year’s lag time. The Tax Department would need to notify the town of the total education property tax adjustment amount for the TIF district from the prior year, which could then be subtracted from the current year’s tax increment
• Requiring towns to calculate the net incremental tax revenue would add another layer of
complexity and uncertainty for towns to estimate how much revenue they can anticipate to service the debt incurred from TIF projects. It could also discourage mixed-use redevelopment projects.
These issues complicate the task of finding a solution, but a solution will need to be found to rectify the problem before the population of TIF districts grows larger and the cost to the Education Fund greater.

39
CLA CALCULATION AND TIF DISTRICTS Towns with TIF districts exclude the “excess valuation” or the incremental value from the education grand list.16 The “original taxable value” (OTV), which is the value of the parcels at the time the TIF district is created, remains taxable on the grand list.17 All TIF properties are in fact taxed, but the tax revenue generated from the increment is retained by the municipality rather than remitted directly to the local school district or to the State for distribution for education payments. In addition to removing the incremental values for the purpose of calculating the state education property tax liability, the excess valuation is also eliminated from the equalization study in determining a town’s common level of appraisal (CLA). In 2007, Winooski conducted a town-wide reappraisal. That happened to coincide with a temporary drop in the taxable property values in the district, which created an anomalous situation in which the OTV on the education grand list was negative. The situation led to questions regarding the effects of the statutory requirement to remove the incremental property values for purposes of equalizing the education grand list. The equalization study is conducted each year to estimate the full fair market value of all property in the state. This is necessary because towns only reappraise every few years. The equalization study is an estimate of how far assessments are from actual fair market values and results in a CLA for each town in the state. The CLA is applied indirectly to equalize all grand lists in the state as if they were at the same level of appraisal. Therefore, the CLA adjustment for a town with a TIF that is not included in the study is not a true reflection of the full fair market value of all of the property within that community. If a TIF district is the primary focus of development or redevelopment within a community, then it is possible the town’s taxpayers will suffer from this omission, which could result in a lower CLA and therefore a higher tax rate. Data from Burlington and Milton were analyzed to compare the results of both excluding and including the incremental value in the equalization study and CLA calculation. The analysis first looked at the effect of the exemption in non-reappraisal years for Burlington and Milton (see table below).18 In the case of Burlington, the Tax Department examined the year immediately prior to equalization and two years beyond; for Milton, only the prior year. Some assumptions regarding the classification of properties within the TIF district were made to calculate an alternate CLA, as the Department lacked all the necessary detailed data for all the properties. The results showed that excluding the tax increment value in the equalization study resulted in a slightly lower CLA in the non-reappraisal years. In both cases, the difference was minimal—less than a full point—and varied according to the proportion of the incremental value to the total grand list value. The table shows that in both towns the proportion of the TIF value to the total is quite small—and therefore the impact of including (or excluding) the incremental value from the equalization minimal—but the relative proportion is about three and a half times larger in Milton than in Burlington, accounting for the CLA difference.
16 24 V.S.A. §1896(b); 32 V.S.A. §5401 (10)(E) 17 Legislation was added in 2006 to adjust the OTV upon reappraisal. See Act 184 of the 2006 Legislative Session, Sec. 2d. Milton is subject to the reappraisal provision, but the other three TIF districts are not. 18 Burlington reappraised in 2005; Milton reappraised in 2006
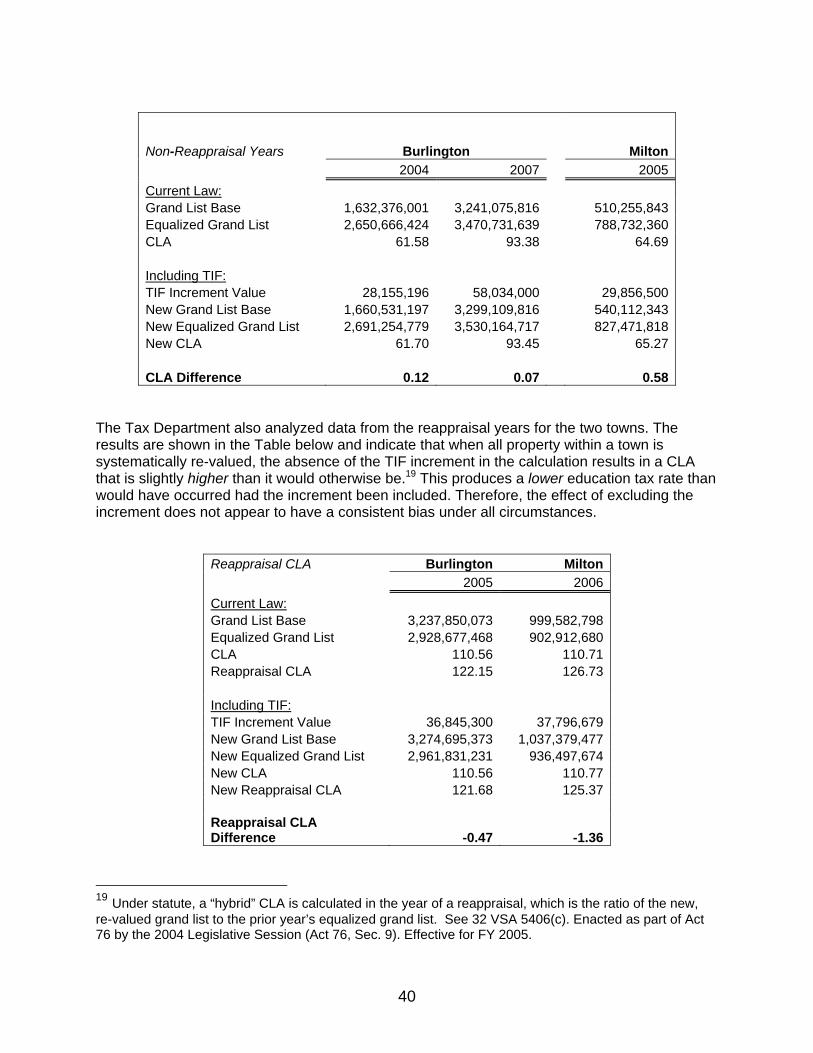
40
Non-Reappraisal Years
Burlington Milton 2004 2007 2005Current Law: Grand List Base 1,632,376,001 3,241,075,816 510,255,843Equalized Grand List 2,650,666,424 3,470,731,639 788,732,360CLA 61.58 93.38 64.69 Including TIF: TIF Increment Value 28,155,196 58,034,000 29,856,500New Grand List Base 1,660,531,197 3,299,109,816 540,112,343New Equalized Grand List 2,691,254,779 3,530,164,717 827,471,818New CLA 61.70 93.45 65.27 CLA Difference 0.12 0.07 0.58
The Tax Department also analyzed data from the reappraisal years for the two towns. The results are shown in the Table below and indicate that when all property within a town is systematically re-valued, the absence of the TIF increment in the calculation results in a CLA that is slightly higher than it would otherwise be.19 This produces a lower education tax rate than would have occurred had the increment been included. Therefore, the effect of excluding the increment does not appear to have a consistent bias under all circumstances.
Reappraisal CLA Burlington Milton 2005 2006 Current Law: Grand List Base 3,237,850,073 999,582,798 Equalized Grand List 2,928,677,468 902,912,680 CLA 110.56 110.71 Reappraisal CLA 122.15 126.73 Including TIF: TIF Increment Value 36,845,300 37,796,679 New Grand List Base 3,274,695,373 1,037,379,477 New Equalized Grand List 2,961,831,231 936,497,674 New CLA 110.56 110.77 New Reappraisal CLA 121.68 125.37 Reappraisal CLA Difference -0.47 -1.36
19 Under statute, a “hybrid” CLA is calculated in the year of a reappraisal, which is the ratio of the new, re-valued grand list to the prior year’s equalized grand list. See 32 VSA 5406(c). Enacted as part of Act 76 by the 2004 Legislative Session (Act 76, Sec. 9). Effective for FY 2005.

41
It is difficult to draw any solid conclusions from the analysis above and the limited data available, beyond the obvious fact that TIF districts create difficulties for both the towns and the Tax Department in equalizing the education grand list. The analysis indicates that the current system of excluding the incremental value slightly disadvantages towns with TIFs and that including the incremental value would slightly work to the towns’ advantage, except during the periodic occurrence of a reappraisal where the opposite is true. While the impact to the CLA appears to be relatively minor, the current system artificially limits the Tax Department’s ability to measure assessment practices within a town by removing the TIF increment from the equalization analysis. Also, there is a larger conceptual problem with equalizing only the base value. Over time, the base value no longer represents “real” properties but is a vestige of properties that were “frozen” as they once existed at the time of the establishment of the TIF district. The distortion disappears when the entire value of the district is included. Lastly, a recent legislative change in the TIF program increases the likelihood that more TIFs will be created in the near future, which compounds the distortion statewide. In light of the distortions inherent in the current system and the unknown effect the distortions might have over the long life of these districts (20 years), the Tax Department and Joint Fiscal Office recommend that statutory changes be made to include the increment on the education grand list strictly for purposes of equalization but to continue to remove the incremental value for the process of determining a municipality’s education property tax liability.

42

43
TIF FINANCING INSTRUMENTS Municipalities have a broad array of financing instruments available to them, but each comes with certain advantages and disadvantages that must be weighed in the context of the need for debt financing to make improvements in a TIF district and the expected flow of tax revenue to repay the debt.20 GO/ Revenue Bonds General obligation bonds are the predominant municipal bonding type and are secured by “the full faith and credit” of the local or state government that issued the bond. They allow the cheapest rate of financing among the bond issues but count against any statutory debt limits. Revenue bonds are characterized by a guarantee of repayment solely from a designated revenue source, rather than the full faith and credit of the issuer, and do not count against debt limits. Specifically, enterprise revenue bonds finance projects that are expected to generate revenues to repay the debt. Revenue bonds would seem an ideal form of bonding for TIF improvements, but they generally require more complex financial arrangements and may incur significantly higher interest rates and insurance costs than GO bonds because of their limited security. They also carry a requirement to maintain a debt service reserve. Other bonds that are utilized less frequently but may be available to finance TIF improvements include “double barrel” bonds, which are backed by a special tax or a specific source of revenue, as well as by the full faith and credit of the issuer; private activity bonds, which are issued by or on behalf of a local government to provide debt financing for projects used most often by a private user; and grant anticipation bonds, which leverage revenue streams related to future federal or state funding. As changes to the laws governing tax increment financing districts was being considered in 2006, the Treasurer’s office voiced concerns with the use of revenue bonds, and in fact any non-GO bond structure. Officials testified as to the impact on the Bond Bank’s reserves and the State’s moral obligation if a project financed by Bank- issued bonds were to fail. Legislative changes in 2006 attempted to address these concerns by amending T. 24 §1897 to place full responsibility for repayment of debt upon the municipality in cases where the increment was insufficient to pay the principal and interest. One additional issue that has not received as much attention is the tax-exempt status of bonds. If the intent is to maintain these as tax-exempt issues, public ownership and control of the infrastructure needs to be made explicit. It is critical, to both the issuer and the bond-holders, that the tax-exempt status not be put into question, and provisions should be considered that the use of the infrastructure improvements be generally open to the public. Certificates of Participation (COPs) Also referred to as “lease-purchase agreements,” the COP is an alternative financing mechanism to cash purchases or bonded debt utilized by governmental entities. Lease purchases are structured as a series of one-year renewable obligations spread out over the life of the asset. A certificate of participation, the most commonly used form, creates a tax-exempt lease to finance capital improvement projects. Generally, a COP is a lease-purchase 20 The Tax Department and Joint Fiscal Office owe a considerable debt (no pun intended) to Beth Pearce, Deputy State Treasurer, for her considerable efforts in providing us information for this section.

44
agreement that is divided and sold to multiple investors like shares, with proportional interest based on the shares. Most COPs receive investment ratings from a rating agency and each certificate represents a proportional interest in the payments that will be made by the local government. COPs are not legally backed by full faith and credit. If the issuer defaults, the structure or asset is forfeited based on the terms of the contract. The security of the instrument is the expectation that the government will choose not to forgo use of the structure or asset on which the agreement is based. COPS are popular because they are considered a secure form of financing but have a flexible structure, because they need no voter approval and adapt well to a quick time schedule, and can be used for a wide variety of capital projects, as long as they fit the “leasing concept” of physical capital suitable for collateral. Disadvantages include a higher cost of capital and greater complexity than GO bonds and the likelihood that agreements will be considered in net tax supported debt. Revenue Anticipation Notes (RANs) Revenue anticipation notes are one type of short-term debt financing instruments. RANs provide interim or bridge financing prior to the collection of revenues that will be generated once a project is completed. Other types of short-term instruments include Tax Anticipation Notes, Bond Anticipation Notes, Grant Anticipation Notes, Commercial Paper, and Lines of Credit. Bank Loans Municipalities may take out short-term bank loans in anticipation of future revenues or access longer term credit financing through commercial loans. Commercial bank loans can be less expensive than some of the other options, easier to arrange and less time-consuming than a bond issuance, and they do not require a public vote. There is little public data available on how widespread their use is and for what purpose. Risk Issues and Mitigation Strategies Aside from development risks, such as the failure to complete the project or disruptions to the schedule of improvements, credit risks stem from fluctuations in tax rates over a long time horizon and changes in assessed valuation. Milton has already encountered the latter problem, and municipalities considering a TIF should evaluate strategies to mitigate against the risks, such as requiring a developer or owner to waive the right to appeal assessed valuation of the property or building into the financing structure sufficient excess coverage to insulate against variances in assessed valuation. The current list of financing instruments available to municipalities using TIF, which was expanded last year, is somewhat arbitrary and should be revisited to add other types of funding discussed here. The question of oversight is important, and the Legislature must assure that VEPC has the resources needed to “assure the viability and reasonableness of any proposed financing other than bonding and least-cost financing.”

45
CONCLUSIONS There is a good deal to be learned from studying the existing tax increment financing districts in Vermont and gaining some background on studies of TIF utilization around the country. As this report emphasizes, however, there is wide variation in the goals, legal construction, and implementation of TIF programs from state to state, and even from district to district, as seen in these four studies. In summary, here are the major conclusions from our study:
• Equalization — A recent dispute over the CLA calculated for Winooski after their reappraisal highlights the potential distortion in the equalization study caused by including only the base value (OTV), which becomes more and more disconnected over time to any real value in the district. We recommend that statutory changes be made to include the increment on the education grand list strictly for purposes of equalization but to continue to remove the incremental value for the process of determining a municipality’s education property tax liability.
• Net billing of property taxes — Under current practice, the property tax revenues to the Education Fund are reduced by twice the amount of property tax adjustments paid to homeowners within a TIF district—once when the taxpayer’s property tax bill is reduced and again when the tax increment is calculated on the gross, not net, amount and retained by the municipality. Although the effect has been relatively small to date, we recommend that statutory changes be made to insure that municipalities are allowed to retain only the net amount of property taxes paid on homestead properties and that the change be made retroactive to include any TIF approved by VEPC under the new law.
• Indebtedness — We recommend that Title 24 §1891(7) be amended to include other types of financing instruments. The 2009 legislative session made available to Milton additional financing instruments, subject to approval by the Treasurer, and these changes should be extended to all future municipal TIF districts by codifying session law. The 2009 legislative session also allowed VEPC to charge a fee to municipalities in order to assure that new TIF plans have a sound financial basis. Additionally, municipalities should consider strategies to mitigate risks associated with changes in assessed valuation of properties within a TIF district, such as requiring a developer or owner to waive the right to appeal assessed valuation of the property or building into the financing structure sufficient excess coverage to insulate against variances in assessed valuation.
• Economic development —Studies indicate a mixed record of success for TIF as a strategy for economic development, and the measures of success are often very selective and not comparable. The wide variation in measurement criteria such as stated development goals, green field development versus downtown redevelopment, and presence of a “but for” test add to the complexity in analyzing TIF programs. Proponents and critics of TIF differ widely on whether and to what extent the benefits outweigh the costs, and the various studies have done little to silence the debate. Vermont, in an effort to weigh costs and benefits, has made substantial revisions to the statutes governing TIF to establish a “but for” test and oversight of financing plans; specific criteria for approval that favors “smart growth” mixed-use development; consideration of state development interests; and limit on retention of incremental tax revenues to a maximum of 75%.

46
• Future of TIF in Vermont — At least four factors may cause an increase in the size of future tax increment financing districts, a trend that local officials and state policy makers will want to follow. These include: 1) the requirement that 25 percent of incremental tax revenue be dedicated to the Education Fund; 2) the limitation of only one TIF district in any municipality; and 3) the inclusion of tax exempt properties in new TIF districts, as municipalities pursue downtown, mixed-use redevelopment plans; and 4) the projected decline in grand list growth. These limitations may diminish the expected tax revenues from an area’s development plan and thereby force a municipality to broaden the scope of its TIF district proposal to assure financial viability.

47
APPENDIX A
Type of TIF Statutory Authority Duration
Allocation of Increment with the EF AND
Municipal Tax Allocation
Conditions of ApprovalTypes of Financing;
and uses of TIF Revenue Allowed
ReappraisCLA Calcul
Grandfathered by Act 60 (Burlington, Newport City)
Original TIF law passed in 1987; Grandfathered in 1997 (Acts 60 and 71)
Any period authorized for indebtedness incurred w/in 10 years of creation of district
100% to TIF0 to EF
Muni Tax - not specified
Established prior to June 10, 1997
BondsImprovments and related costs defined [8]
OTV [2] not affreappraisal
VEPC under EATI Program(Milton) Act 71 of 1998
10 Years (may extend an additional 10 years) [3]
100% to TIF0 to EF Approval by VEPC
BondsImprovments and related costs defined [8]
OTV increasedmultiplier in firsfollowing reappamount to EF nthan prior year
Special Authorization(Winooski) Act 159 of 2000 20 Years
98% to TIF2% to EF
100% Muni Tax on increment to pay bonds
Legislative Authorization Bonds; internal financing OTV not affectreappraisal
VEPC under Act 184(None to-date)
Act 184 of 2006andAct 190 of 2008
20 Years
75% to TIF25% to EF
Muni Tax in same proportion to Ed Tax
VEPC approval with Criteria specified [7] special allowance for growth centers; 6 districts allowed in 5 fiscal years
Bonds
OTV increasedmultiplier in firsfollowing reappamount to EF nthan prior year
Tax Increment Financing Districts in Vermont - Matrix of Details
[1] Same for all = OTV [1] Same for all = OTV included on Education GL and included in calculation of CLA (24 VSA §1895 and 32 VSA §5401 (10)(E)) [2] OTV = Original Taxable Value [3] Act 184 of 2006 Sec. 2j [6] 32 VSA §5404a (i) [4] Act 190 of 2008 Sec. 71 [7] 32 VSA §5404a (h) [5] Act 184 of 2006 [8] 24 VSA §1891 (4) and (6) Prepared by Tax and JFO

48