
2009 Summer Outlook and Sable Island Offshore Energy Project Planned Outage
23
2009 Summer Outlook and Sable Island Offshore Energy Project Planned Outage RC Meeting July 21, 2009 Michael Taniwha Director of Operations
-
Upload
farrah-newman -
Category
Documents
-
view
33 -
download
0
description
2009 Summer Outlook and Sable Island Offshore Energy Project Planned Outage. RC Meeting July 21, 2009 Michael Taniwha Director of Operations. Overview. Summer 2008 Review Major Transmission Projects 2009 Summer Action Plan 2009 Summer Operable Capacity Analysis - PowerPoint PPT Presentation
Transcript of 2009 Summer Outlook and Sable Island Offshore Energy Project Planned Outage

2009 Summer Outlook and Sable Island Offshore Energy Project Planned Outage
RC MeetingJuly 21, 2009
Michael TaniwhaDirector of Operations

Overview
• Summer 2008 Review
• Major Transmission Projects
• 2009 Summer Action Plan
• 2009 Summer Operable Capacity Analysis
• Sable Offshore Energy Project (SOEP) Planned Outage
2
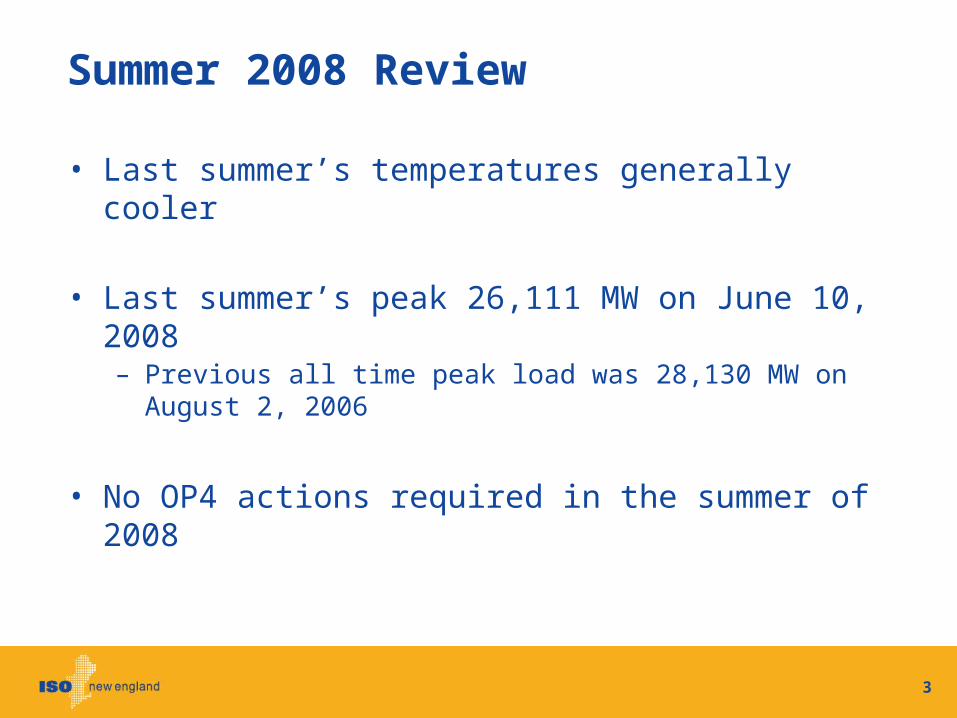
Summer 2008 Review
• Last summer’s temperatures generally cooler
• Last summer’s peak 26,111 MW on June 10, 2008– Previous all time peak load was 28,130 MW on August 2, 2006
• No OP4 actions required in the summer of 2008
3

Major Transmission Projects
• Middletown - Norwalk 345 kV loop– Beseck – East Devon– East Devon – Singer– Singer – Norwalk– New 345/115 kV autos at Norwalk, Singer & East Devon
• 1385 (Northport - Norwalk Cables)• 3163 Stoughton - K Street cable (3rd Boston cable)• Short-term Lower SEMA project upgrades
– Carver substation reconfiguration– 2nd 345/115 kV auto transformer– Looping 355 Pilgrim – Bridgewater 345 kV line into Carver
4

2009 Summer Capacity Action Plan
• Summer Capacity Outlook Communications– Transmission Owners (TOs)
• Master/Local Control Center (M/LCC) Heads
– OP4 Contacts• Utilities, State Regulators, State Emergency Mgmt, FERC & NERC
– NPCC/NERC
• System Readiness– Verified with Local Control Centers (LCCs) Critical Transmission
Inspection/Maintenance Being Performed by Transmission Owners• Review Long-Term Outage Schedule
– Review/Monitor Generation Maintenance Schedules– Coordinating with regional gas transmission companies– Coordinating with NBSO on SOEP planned outage
5
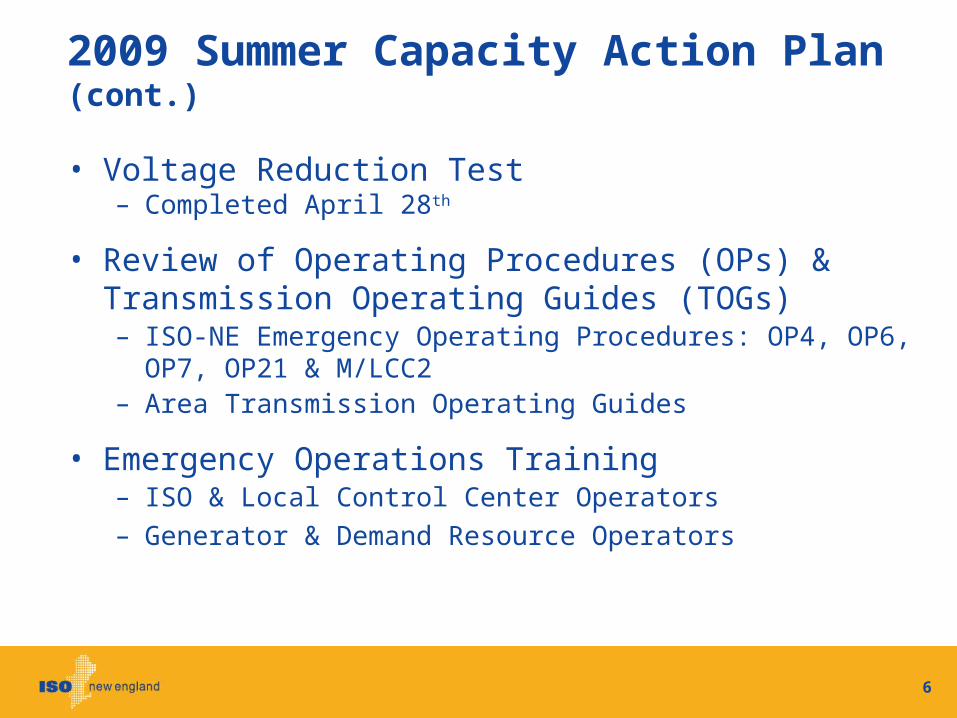
2009 Summer Capacity Action Plan (cont.)
• Voltage Reduction Test– Completed April 28th
• Review of Operating Procedures (OPs) & Transmission Operating Guides (TOGs)– ISO-NE Emergency Operating Procedures: OP4, OP6, OP7,
OP21 & M/LCC2– Area Transmission Operating Guides
• Emergency Operations Training– ISO & Local Control Center Operators– Generator & Demand Resource Operators
6

ISO-NE Daily System Peak Load
7

What is this Summer Looking Like?
• Summer 2009 Peak Load Exposure Forecast– Summer 50/50 peak load forecast 27,369 MW– Summer 90/10 peak load forecast 29,274 MW
• Forecast includes 2009 adjustment for other passive demand resources (ODRs) ~ 500 MW.
– Negative operable capacity margins are projected for all peak load exposure weeks during the summer months of July and August at 90/10 load levels
• June 2009 average temperature third coolest in 50 years– June peak load of 18,534 MW on June 26th
• Lowest June peak load in 13 years
8

Summer 2009 Operable Capacity Analysis
9
August-09*50/50 Forecast
(Reference Load )
August-09*90/10 Forecast (Extreme Load)
Installed Resources(Based on the July Seasonal Claimed Capability (SCC) Report)
31,169 SAME
Net ICAP Purchases 318 SAME
New Generation 0 SAME
Net Resources*** 31,490 SAME
Assumed Outages** 2,100 SAME
Generation at Risk Due to Gas Supply 0 SAME
Peak Load Exposure (adjusted for Other Demand Resources) 27,369 29,274 (+1,905)
Reserve Requirement 1,800 SAME
Operable Capacity Required 29,169 31,074 (+1,905)
Operable Capacity Margin*** 220 -1,690 (-1,910)
•Based on weeks with lowest Operable Capacity Margin, weeks beginning August 1st, 8th, 15th, and 22nd. Mystic 8 & 9 limited to 1,200 MW. Does not include Settlement Only Resources (approx. 250 MW) and Demand Response Resources (2,100 MW)** Assumed Outages include 2,100 MW of Unplanned Outages, 0 MW of Planned Outages*** Rounded to the nearest ten

Possible Relief Actions Under OP4
10
Note: OP-4 Actions based on a 28,048 MW system load* Total Demand Response MW, including voluntary price response = 2,100 MW (voluntary price response = 81 MW)
OP 4Action
Number Action Description
Amount Assumed Obtainable Under
OP 4 (MW)
3 Interrupt 2-hour and Profile DR Resources* 212
6 Reduce 30-minute Operating Reserves 600
9 Interrupt 30-minute DR Resources* 750
11 Schedule Emergency Energy Transactions 1,000
12 Interrupt Additional DR Resources*Voltage Reduction requiring > 10 minutes
1,057 82
13 Voltage Reduction requiring < 10 minutes 366
15 Radio and TV Appeal 200
Total 4,267
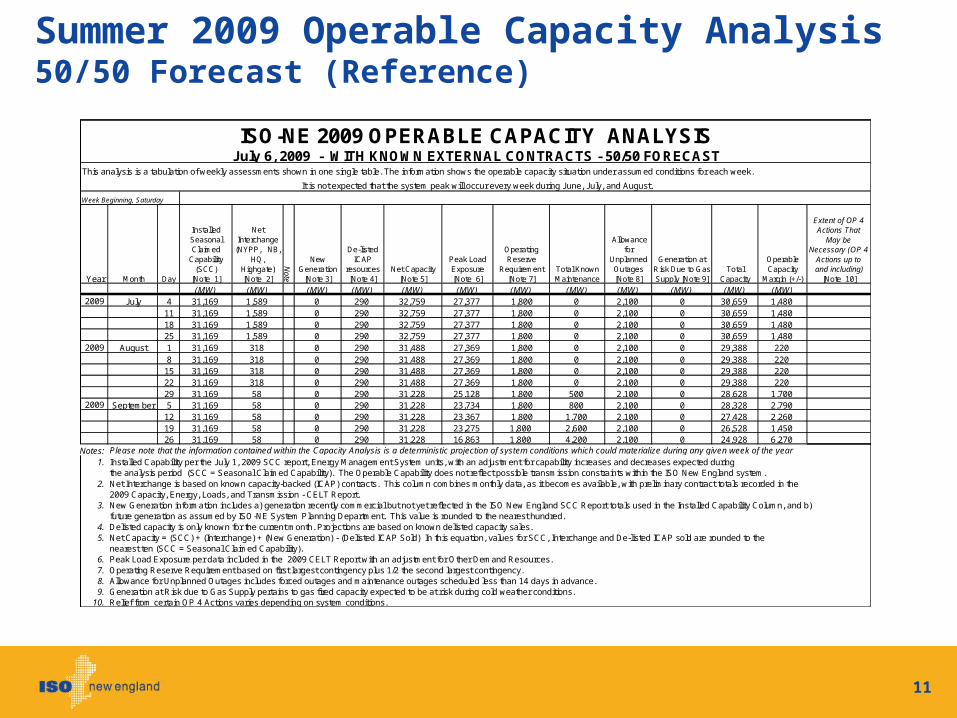
Summer 2009 Operable Capacity Analysis 50/50 Forecast (Reference)
11
Week Beginning, Saturday
Year Month Day
Installed Seasonal Claimed
Capability (SCC)
[Note 1]
Net Interchange
(NYPP, NB, HQ,
Highgate) [Note 2]
Note
New Generation
[Note 3]
De-listed ICAP
resources [Note 4]
Net Capacity [Note 5]
Peak Load Exposure [Note 6]
Operating Reserve
Requirement [Note 7]
Total Known Maintenance
Allowance for
Unplanned Outages [Note 8]
Generation at Risk Due to Gas Supply [Note 9]
Total Capacity
Operable Capacity
Margin (+/-)
Extent of OP 4 Actions That
May be Necessary (OP 4
Actions up to and including)
[Note 10]
(MW) (MW) (MW) (MW) (MW) (MW) (MW) (MW) (MW) (MW) (MW) (MW) 2009 July 4 31,169 1,589 0 290 32,759 27,377 1,800 0 2,100 0 30,659 1,480
11 31,169 1,589 0 290 32,759 27,377 1,800 0 2,100 0 30,659 1,480 18 31,169 1,589 0 290 32,759 27,377 1,800 0 2,100 0 30,659 1,480
25 31,169 1,589 0 290 32,759 27,377 1,800 0 2,100 0 30,659 1,480 2009 August 1 31,169 318 0 290 31,488 27,369 1,800 0 2,100 0 29,388 220
8 31,169 318 0 290 31,488 27,369 1,800 0 2,100 0 29,388 220 15 31,169 318 0 290 31,488 27,369 1,800 0 2,100 0 29,388 220 22 31,169 318 0 290 31,488 27,369 1,800 0 2,100 0 29,388 220
29 31,169 58 0 290 31,228 25,128 1,800 500 2,100 0 28,628 1,700 2009 September 5 31,169 58 0 290 31,228 23,734 1,800 800 2,100 0 28,328 2,790
12 31,169 58 0 290 31,228 23,367 1,800 1,700 2,100 0 27,428 2,260 19 31,169 58 0 290 31,228 23,275 1,800 2,600 2,100 0 26,528 1,450
26 31,169 58 0 290 31,228 16,863 1,800 4,200 2,100 0 24,928 6,270 Notes: Please note that the information contained within the Capacity Analysis is a deterministic projection of system conditions which could materialize during any given week of the year
1. Installed Capability per the July 1, 2009 SCC report, Energy Management System units, with an adjustment for capability increases and decreases expected duringthe analysis period (SCC = Seasonal Claimed Capability). The Operable Capability does not reflect possible transmission constraints within the ISO New England system.
2. Net Interchange is based on known capacity-backed (ICAP) contracts. This column combines monthly data, as it becomes available, with preliminary contract totals recorded in the 2009 Capacity, Energy, Loads, and Transmission - CELT Report.
3. New Generation information includes a) generation recently commercial but not yet reflected in the ISO New England SCC Report totals used in the Installed Capability Column, and b)future generation as assumed by ISO-NE System Planning Department. This value is rounded to the nearest hundred.
4. Delisted capacity is only known for the current month. Projections are based on known delisted capacity sales.5. Net Capacity = (SCC) + (Interchange) + (New Generation) - (Delisted ICAP Sold) In this equation, values for SCC, Interchange and De-listed ICAP sold are rounded to the
nearest ten (SCC = Seasonal Claimed Capability).6. Peak Load Exposure per data included in the 2009 CELT Report with an adjustment for Other Demand Resources.7. Operating Reserve Requirement based on first largest contingency plus 1/2 the second largest contingency.8. Allowance for Unplanned Outages includes forced outages and maintenance outages scheduled less than 14 days in advance.9. Generation at Risk due to Gas Supply pertains to gas fired capacity expected to be at risk during cold weather conditions.
10. Relief from certain OP 4 Actions varies depending on system conditions.
ISO-NE 2009 OPERABLE CAPACITY ANALYSISJuly 6, 2009 - WITH KNOWN EXTERNAL CONTRACTS - 50/50 FORECAST
This analysis is a tabulation of weekly assessments shown in one single table. The information shows the operable capacity situation under assumed conditions for each week.
It is not expected that the system peak will occur every week during June, July, and August.

Summer 2009 Operable Capacity Analysis 90/10 Forecast (Extreme)
12
Week Beginning, Saturday
Year Month Day
Installed Seasonal Claimed
Capability (SCC)
[Note 1]
Net Interchange
(NYPP, NB, HQ,
Highgate) [Note 2]
Note
New Generation
[Note 3]
De-listed ICAP
resources [Note 4]
Net Capacity [Note 5]
Peak Load Exposure [Note 6]
Operating Reserve
Requirement [Note 7]
Total Known Maintenance
Allowance for
Unplanned Outages [Note 8]
Generation at Risk Due to Gas Supply [Note 9]
Total Capacity
Operable Capacity
Margin (+/-)
Extent of OP 4 Actions That
May be Necessary (OP 4
Actions up to and including)
[Note 10]
(MW) (MW) (MW) (MW) (MW) (MW) (MW) (MW) (MW) (MW) (MW) (MW) 2009 July 4 31,169 1,589 0 290 32,759 29,282 1,800 0 2,100 0 30,659 (420) Action 6
11 31,169 1,589 0 290 32,759 29,282 1,800 0 2,100 0 30,659 (420) Action 6 18 31,169 1,589 0 290 32,759 29,282 1,800 0 2,100 0 30,659 (420) Action 6
25 31,169 1,589 0 290 32,759 29,282 1,800 0 2,100 0 30,659 (420) Action 62009 August 1 31,169 318 0 290 31,488 29,274 1,800 0 2,100 0 29,388 (1,690) Action 11
8 31,169 318 0 290 31,488 29,274 1,800 0 2,100 0 29,388 (1,690) Action 11 15 31,169 318 0 290 31,488 29,274 1,800 0 2,100 0 29,388 (1,690) Action 11 22 31,169 318 0 290 31,488 29,274 1,800 0 2,100 0 29,388 (1,690) Action 11
29 31,169 58 0 290 31,228 26,880 1,800 500 2,100 0 28,628 (50) Action 32009 September 5 31,169 58 0 290 31,228 25,392 1,800 800 2,100 0 28,328 1,140
12 31,169 58 0 290 31,228 24,999 1,800 1,700 2,100 0 27,428 630 19 31,169 58 0 290 31,228 24,900 1,800 2,600 2,100 0 26,528 (170) Action 3
26 31,169 58 0 290 31,228 17,453 1,800 4,200 2,100 0 24,928 5,680 Notes: Please note that the information contained within the Capacity Analysis is a deterministic projection of system conditions which could materialize during any given week of the year
1. Installed Capability per the July 1, 2009 SCC report, Energy Management System units, with an adjustment for capability increases and decreases expected duringthe analysis period (SCC = Seasonal Claimed Capability). The Operable Capability does not reflect possible transmission constraints within the ISO New England system.
2. Net Interchange is based on known capacity-backed (ICAP) contracts. This column combines monthly data, as it becomes available, with preliminary contract totals recorded in the 2009 Capacity, Energy, Loads, and Transmission - CELT Report.
3. New Generation information includes a) generation recently commercial but not yet reflected in the ISO New England SCC Report totals used in the Installed Capability Column, and b)future generation as assumed by ISO-NE System Planning Department. This value is rounded to the nearest hundred.
4. Delisted capacity is only known for the current month. Projections are based on known delisted capacity sales.5. Net Capacity = (SCC) + (Interchange) + (New Generation) - (Delisted ICAP Sold) In this equation, values for SCC, Interchange and De-listed ICAP sold are rounded to the
nearest ten (SCC = Seasonal Claimed Capability).6. Peak Load Exposure per data included in the 2009 CELT Report with an adjustment for Other Demand Resources.7. Operating Reserve Requirement based on first largest contingency plus 1/2 the second largest contingency.8. Allowance for Unplanned Outages includes forced outages and maintenance outages scheduled less than 14 days in advance.9. Generation at Risk due to Gas Supply pertains to gas fired capacity expected to be at risk during cold weather conditions.
10. Relief from certain OP 4 Actions varies depending on system conditions.
ISO-NE 2009 OPERABLE CAPACITY ANALYSISJuly 6, 2009 - WITH KNOWN EXTERNAL CONTRACTS - 90/10 FORECAST
This analysis is a tabulation of weekly assessments shown in one single table. The information shows the operable capacity situation under assumed conditions for each week.
It is not expected that the system peak will occur every week during June, July, and August.

Sable Offshore Energy Project (SOEP) Planned Outage

Sable Offshore Energy Project (SOEP) Planned Outage
• SOEP commenced production in December 1999– Regulatory & safety permits require 10 year re-inspection
• Maritimes & Northeast (M&N) Pipeline posted publically on April 21st information on the SOEP outage in August– Start date is early August 2009– SOEP outage is scheduled for approximately 20 day duration
14

Sable Offshore Energy Project (SOEP) Planned Outage (cont’d)
• M&N Pipeline is encouraging its customers to confirm alternate gas supply arrangements from the other three supply points available on the M&N system
– Corridor Resource Supply – via McCully Pipeline interconnect– Portland Natural Gas Transmission System – direct interconnect– Canaport LNG supply – via Brunswick Pipeline interconnect
• Repsol (Canaport Owner/Operator) has confirmed supplemental gas sales to regional gas markets (power generators) during the SOEP outage
• ISO is seeing gas nominations coming from the Brunswick Pipeline into the M&N system (see slide 17)
15

Sable Offshore Energy Project (SOEP) Planned Outage (cont’d)
• On June 27, 2009, the LNG tanker Bilbao Knutsen delivered the first (cool-down) cargo of LNG to the Canaport LNG terminal in Saint John, New Brunswick
• Canaport flaring gas from cool down LNG ‘boil off’
• 2nd LNG tanker delivery scheduled for July 20th
16

17

18
M&N Pipeline System Map

SOEP Outages – not the first time
• M&N Pipeline (and SOEP) scheduled major planned outages last summer, to tie-in the M&N Phase IV Upgrades– June 2, 2008 – June 7, 2008– August 14, 2008 – August 20, 2008
• Over the last two years, SOEP has experienced numerous planned and unplanned outages, with some outages over multiple days
19
Planning Actions by ISO-NE
• ISO-NE has been in close communication with the regional interstate pipeline operators regarding the SOEP outage
• ISO-NE has had discussions with the SOEP operator, ExxonMobil, regarding the planned outage and the possibility of moving the SOEP outage
• ISO-NE has been in contact with Repsol, the operator of the Canaport LNG facility, to confirm the commercialization date of the new LNG import and storage terminal
• ISO-NE has been in close communication with NBSO regarding the SOEP outage and to ensure maximum NB-NE tie line availability
20

Impact of SOEP Outage
• Based on this summer’s Operable Capacity Analysis, the impact from the temporary loss of all gas-only generation supplied from the M&N Pipeline is manageable from a system-wide New England perspective
21
Impact of SOEP Outage (cont.)
• Based on this summer’s Generation Requirements for Transmission (GRT) analysis, it is likely that the impact from the temporary loss of all gas-only generation supplied from the M&N Pipeline is also manageable, from a Maine import perspective– The GRT analysis does not address localized concerns that may
arise due to on-going reliability issues in Maine
• Failure of generation to perform at their Seasonal Claimed Capability (SCC) may lead to larger capacity deficiencies and additional operating concerns – OP4 actions would be required, possibly up to Action 12, under
90/10 peak load conditions to maintain both system and sub-area reliability
22

23
Questions?