2009 - mitsui-kinzoku.co.jp
24
for Investors 2009年6月発行(June 2009) 2009 MITSUI MINING & SMELTING CO., LTD. CODE : 5706 投資家の方のための 財務データ集
Transcript of 2009 - mitsui-kinzoku.co.jp

for Investors2009年6月発行(June 2009) 2009
MITSUI MINING & SMELTING CO., LTD.
CODE : 5706
投資家の方のための
財務データ集

注 Notes
1. 本冊子記載の財務数値は日本の会計基準に基づいて作成された各決算期の監査済み有価証券報告書および
英文アニュアルレポート等に基づいております。
なお、本冊子自体は監査法人等の監査を受けておりません。
Not audited but based on audited financial statements prepared in accordance with accounting principlesthat were generally accepted in Japan when original statements were prepared.
2. 該当する数値が原資料に記載されていない場合は N/A と表示しております。
N/A means that an appropriate figure was not available in original statements.
3. 単位未満の金額は原則として切り捨てで表示してあります。
Amounts less than a unit are principally rounded down.

世界有数の非鉄金属メーカーとして技術力を蓄積してきた三井金属は、
いまや亜鉛のトップメーカーであるにとどまらず、
その「マテリアルの知恵」を
電子材料・自動車用機能部品・資源リサイクル等の
様々な分野で開花させています。
特に電子材料分野の成長は著しく、
プリント配線板用電解銅箔やIC実装用テープをはじめとする当社製品が
パソコンや薄型テレビ・携帯電話など最新電子機器の性能向上に
大きな役割を果たしています。
目次 Contents
page 事業内容 2 Business Areas
近10年間の動き(連結) 4 Ten-year Review (Consolidated) 要約財務情報(連結) 6 Financial Summary (Consolidated)
連結貸借対照表 8 Consolidated Balance Sheets 連結損益計算書 10 Consolidated Statements of Income
連結キャッシュフロー計算書 12 Consolidated Statements of Cash Flows 事業別セグメント情報 14 Business Segment Information 設立以来の業績推移 16 Performance since Establishment
経営体制 17 Directors, Auditors and Executive Officers 主要事業所・関係会社 18 Major Plants and Offices
会社と株式の情報 20 Corporate Data and Shareholders
Mitsui Kinzoku is now one of the key suppliers of nonferrous metal derivativeswhich play a key role in high-tech industries. Its electronics-related materials ,including copper foil (for printed wiring boards) and semiconductor packagingtapes, are indispensable for PCs, flat-panel TVs, mobile phones, and other cutting-edge electronics devices.
Since its establishment in 1950, Mitsui Kinzoku has been a leading supplier ofsuch nonferrous metals as zinc and copper, and has been one of the world’slargest zinc producers. To take full advantage of its expertise in materialprocessing, Mitsui Kinzoku has diversified its profit sources to include automotiveparts production and recycling & environmental businesses .
1 Financial Data Book MITSUI KINZOKU

事業内容 Business Areas
事業区分 主要製品・サービス
Business segment (用途例)
鉱山・基礎素材 亜鉛・亜鉛合金 (メッキ鋼板、ダイカスト)
Mining and 銅 (電線、伸銅品)
Fundamental Materials 金・銀 (電子工業材料、感光材料)
地熱蒸気 (発電)
中間素材 電子材料
Intermediate Materials 電解銅箔 (電子機器用プリント配線板)
半導体実装材料 (液晶駆動用IC等の連続実装)
(TAB・COFテープ)
電池材料 (乾電池、ハイブリッド車向け電池)
薄膜材料 (液晶画面、磁気記憶装置)
金属機能粉 (電子部品、複写機トナー)
レアメタル化合物 (電子部品、ガラス研磨、レンズ)
セラミックス製品 (炉材、溶融金属濾過)
パーライト (建築材料、湿式濾過)
伸銅品・亜鉛板 (電気部品、電極材、屋根材)
研削砥石 (機械研削)
希土類
単結晶 (検出器、レンズ)
組立加工 自動車用機能部品 (ドアロック、ドア電動開閉装置)
Parts Manufacturing ダイカスト製品 (自動車、産業機器、家電製品)
and Assembly 触媒 (排ガス浄化装置)
計測機器
環境・リサイクル 鉛 (蓄電池、無機薬品)
Environmental Engineering 酸化亜鉛・酸化鉛 (ガラス・ゴム等の添加物)
and Metals Recycling パーライト (乾式濾過、土壌改良)
産業廃棄物処理
人工軽量骨材 (軽量コンクリート)
エンジニアリング エンジニアリング (各種設備の設計・施工)
サービス等Engineering / 非鉄金属・電子材料等の販売
Services 情報処理システム
2 Financial Data Book MITSUI KINZOKU
事業内容 Business Areas
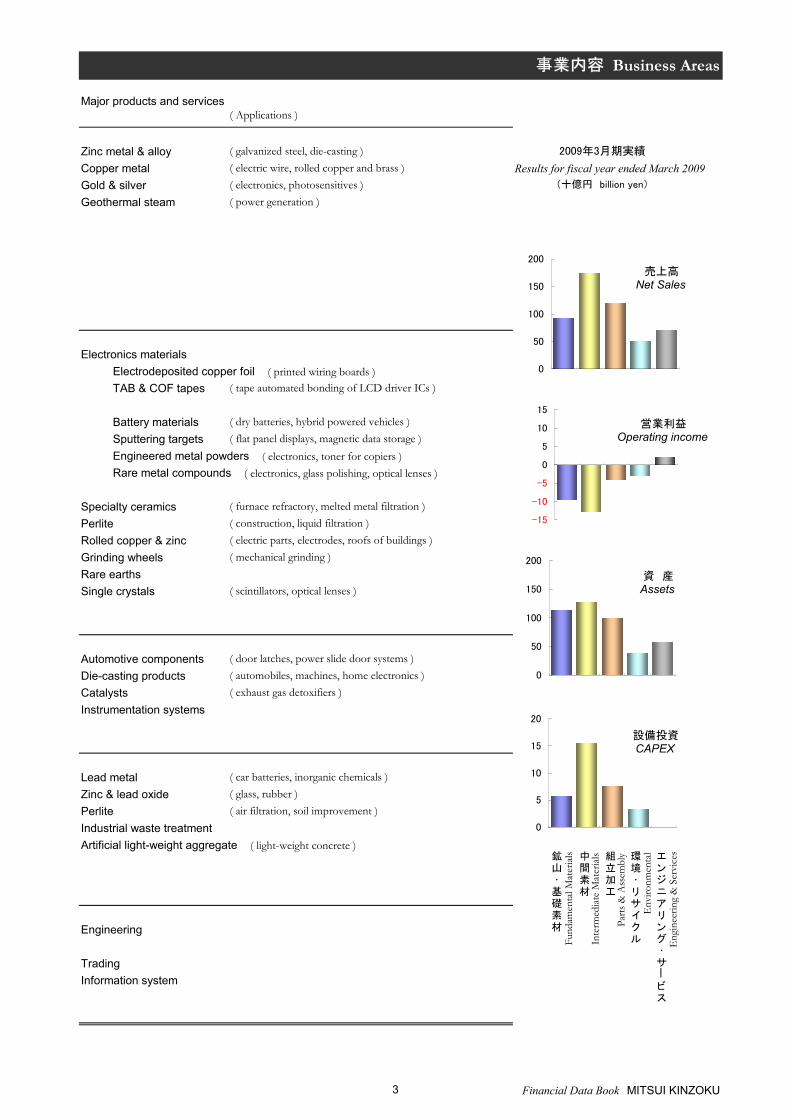
Major products and services( Applications )
Zinc metal & alloy ( galvanized steel, die-casting ) 2009年3月期実績
Copper metal ( electric wire, rolled copper and brass ) Results for fiscal year ended March 2009Gold & silver ( electronics, photosensitives ) (十億円 billion yen)
Geothermal steam ( power generation )
Electronics materials Electrodeposited copper foil ( printed wiring boards ) TAB & COF tapes ( tape automated bonding of LCD driver ICs )
Battery materials ( dry batteries, hybrid powered vehicles ) Sputtering targets ( flat panel displays, magnetic data storage ) Engineered metal powders ( electronics, toner for copiers ) Rare metal compounds ( electronics, glass polishing, optical lenses )
Specialty ceramics ( furnace refractory, melted metal filtration )Perlite ( construction, liquid filtration )Rolled copper & zinc ( electric parts, electrodes, roofs of buildings )Grinding wheels ( mechanical grinding )Rare earthsSingle crystals ( scintillators, optical lenses )
Automotive components ( door latches, power slide door systems )Die-casting products ( automobiles, machines, home electronics )Catalysts ( exhaust gas detoxifiers )Instrumentation systems
Lead metal ( car batteries, inorganic chemicals )Zinc & lead oxide ( glass, rubber )Perlite ( air filtration, soil improvement )Industrial waste treatmentArtificial light-weight aggregate ( light-weight concrete )
Engineering
TradingInformation system
0
5
10
15
20
0
50
100
150
200
-15
-10
-5
0
5
10
15
0
50
100
150
200売上高
Net Sales
営業利益Operating income
資 産Assets
設備投資CAPEX
Inte
rmed
iate
Mat
erial
s
Parts
& A
ssem
bly
Eng
inee
ring
& S
ervi
ces
Fund
amen
tal M
ater
ials
Env
ironm
enta
l中間素材
組立加工
エンジニアリング・サービス
鉱山・基礎素材
環境・リサイクル
3 Financial Data Book MITSUI KINZOKU
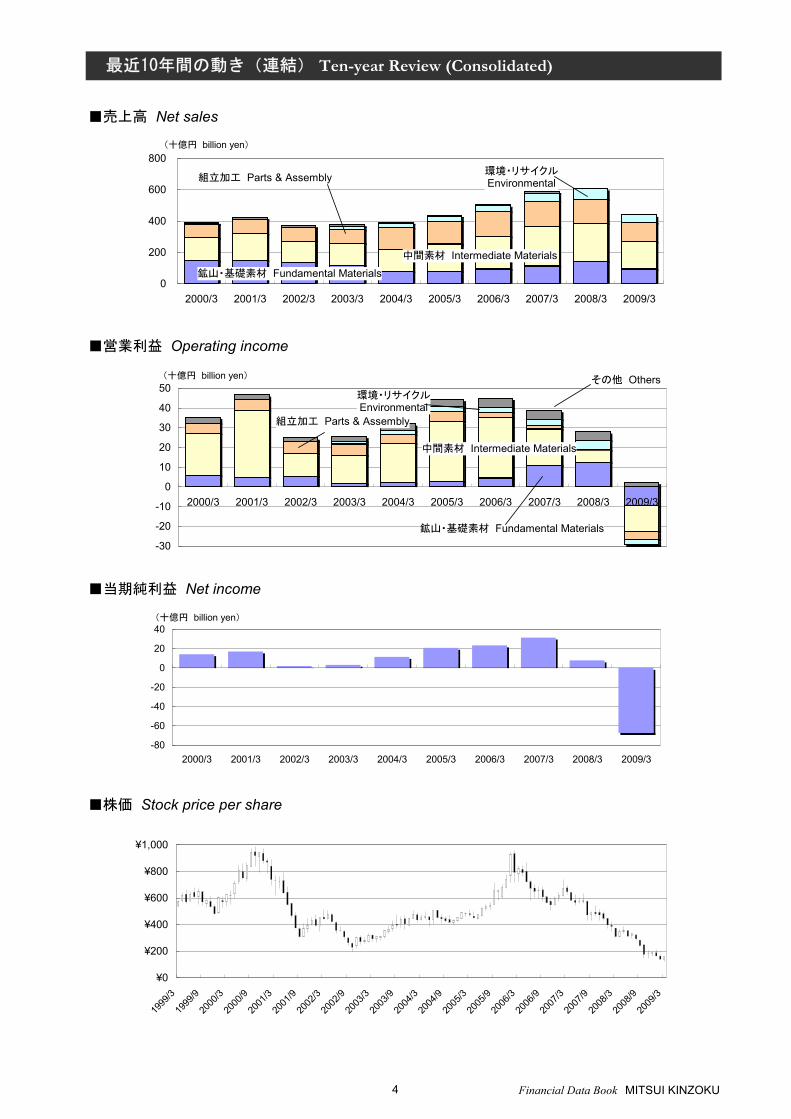
最近10年間の動き(連結) Ten-year Review (Consolidated)
■売上高 Net sales
■営業利益 Operating income
■当期純利益 Net income
■株価 Stock price per share
(十億円 billion yen)
0
200
400
600
800
2000/3 2001/3 2002/3 2003/3 2004/3 2005/3 2006/3 2007/3 2008/3 2009/3
(十億円 billion yen)
-30
-20
-10
0
10
20
30
40
50
2000/3 2001/3 2002/3 2003/3 2004/3 2005/3 2006/3 2007/3 2008/3 2009/3
鉱山・基礎素材 Fundamental Materials
中間素材 Intermediate Materials
鉱山・基礎素材 Fundamental Materials
組立加工 Parts & Assembly
中間素材 Intermediate Materials
組立加工 Parts & Assembly
その他 Others
(十億円 billion yen)
-80
-60
-40
-20
0
20
40
2000/3 2001/3 2002/3 2003/3 2004/3 2005/3 2006/3 2007/3 2008/3 2009/3
¥0
¥200
¥400
¥600
¥800
¥1,000
1999
/3
1999
/9
2000
/3
2000
/9
2001
/3
2001
/9
2002
/3
2002
/9
2003
/3
2003
/9
2004
/3
2004
/9
2005
/3
2005
/9
2006
/3
2006
/9
2007
/3
2007
/9
2008
/3
2008
/9
2009
/3
環境・リサイクルEnvironmental
環境・リサイクルEnvironmental
4 Financial Data Book MITSUI KINZOKU

最近10年間の動き(連結) Ten-year Review (Consolidated)
■財政状態 Financial position
■設備投資・減価償却 Capital expenditures and depreciation
■資本効率 ROA and ROE
2000/32001/3 2002/3 2003/3 2004/3 2005/3 2006/3 2007/3 2008/3 2009/3
0
100
200
300
400
500
(十億円 billion yen)
(十億円 billion yen)
0
10
20
30
40
50
2000/3 2001/3 2002/3 2003/3 2004/3 2005/3 2006/3 2007/3 2008/3 2009/3
減価償却費 Depreciation
設備投資 Capital expenditures
-50%-40%-30%-20%-10%
0%10%20%30%
2000/3 2001/3 2002/3 2003/3 2004/3 2005/3 2006/3 2007/3 2008/3 2009/3
総資産営業利益率 Operating income to total assets
自己資本当期純利益率 Net income to total shareholders' equity
自己資本 Total Shareholders' equity
総資産 Total assets
有利子負債 Interest-bearing debt
5 Financial Data Book MITSUI KINZOKU

要約財務情報(連結) Financial Summary (Consolidated)(百万円 Millions of yen) 決算期 for fiscal years ended 2009/3 2008/3 2007/3 2006/3
売上高・損益 Sales and profit/loss売上高 Net sales 427,191 595,463 591,518 503,370
営業利益 Operating income (27,031) 27,993 38,865 45,052
経常利益 Recurring income (30,310) 41,780 56,585 50,487
当期純利益 Net income (67,256) 7,830 31,370 23,374
EBITDAEarnings before interest, taxes,depreciation and amortization (19,801) 53,069 77,446 65,738
財政状況(期末) Financial position at fiscal year-end総資産 Total assets 410,258 486,238 483,397 460,225
自己資本 Total shareholders' equity 94,145 184,995 185,513 159,772
有利子負債残高 Interest-bearing debt 202,468 151,924 143,220 151,834
D/E レシオ D/E ratio 2.15 0.82 0.77 0.95
自己資本比率 Shareholders' equity ratio 22.9% 38.0% 38.4% 34.7%
発行済株式総数(千株) Shares issued (thousand shares) 572,966 572,966 572,966 572,966
自己株式を除く発行済株式数 Outstanding shares excluding treasury stock 571,523 572,683 572,713 572,748
1株当たり情報 Per share data1株当たり純資産 Total shareholders' equity ¥164.7 ¥323.0 ¥323.9 ¥278.6
1株当たり当期純利益 Net income (¥117.6) ¥13.6 ¥54.7 ¥40.5潜在株式調整後 1株当たり当期純利益
Net income [ diluted ] (¥117.6) ¥13.6 ¥54.7 ¥40.5
1株当たり配当額 Cash dividends applicable to the year - ¥12.0 ¥12.0 ¥10.0
収益性比率 Profitability ratios売上高営業利益率 Operating income to net sales (6.3%) 4.7% 6.6% 9.0%
総資産営業利益率 Operating income to *total assets (6.0%) 5.8% 8.2% 10.4%
総資産当期純利益率 Net income to *total assets (15.0%) 1.6% 6.6% 5.4%
株主資本当期純利益率 Net income to *total shareholders' equity (48.2%) 4.2% 18.2% 15.9%
* Average of beginning and end of fiscal year
キャッシュフロー Cash flows営業活動によるキャッシュフロー Net cash from operating activities 30,038 41,657 34,077 44,800
投資活動によるキャッシュフロー Net cash from investing activities (36,922) (38,049) (30,021) (43,039)
減価償却費(連結調整勘定を含む) Depreciation and amortization 32,281 27,361 25,617 24,686
資本的支出 Capital expenditures 32,424 39,248 40,309 45,176
その他 Others研究開発費(調査探鉱費を含む) Research and development expenses 8,232 8,616 7,359 6,351
期末従業員数(人) Number of employees 11,189 11,369 10,403 9,965
金属価格及び外国為替相場(期中平均) Metal prices and foreign exchange rates (average of fiscal year )
ロンドン金属取引所 亜鉛 LME Zinc (SHG) ($/t) 1,560 2,986 3,579 1,613
同上 銅 LME Copper (AG) ($/t) 5,864 7,584 6,970 4,097 (c/lb) 266.0 344.0 316.2 185.8
日本円対米ドル相場(TTM) JPY rate per US dollar ¥100.7 ¥114.3 ¥117.0 ¥113.3
同上 期末相場 JPY rate at fiscal year-end ¥98.2 ¥100.2 ¥118.1 ¥117.5
株価 Stock price per share
期中 高株価 Highest price of fiscal year ¥385 ¥646 ¥868 ¥958
期中 低株価 Lowest price of fiscal year ¥122 ¥303 ¥506 ¥438
年度末株価 Price at fiscal year-end ¥162 ¥312 ¥647 ¥824
6 Financial Data Book MITSUI KINZOKU
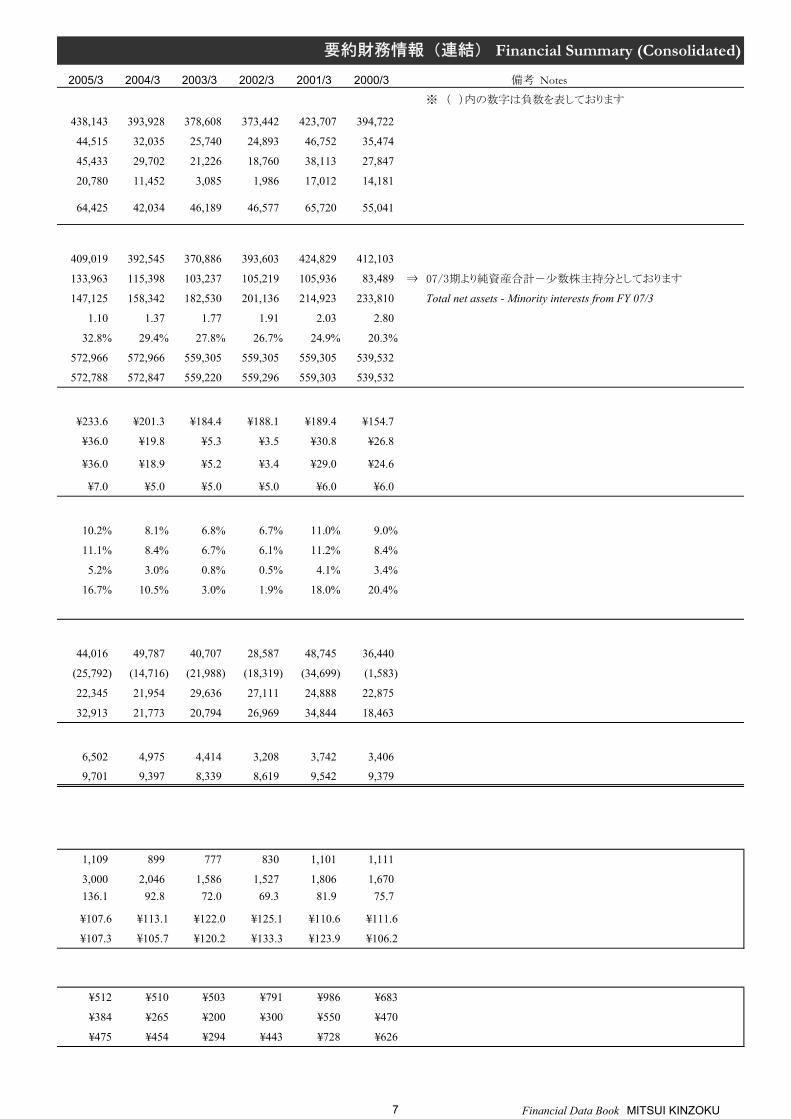
要約財務情報(連結) Financial Summary (Consolidated)
2005/3 2004/3 2003/3 2002/3 2001/3 2000/3 備考 Notes
※ ( )内の数字は負数を表しております
438,143 393,928 378,608 373,442 423,707 394,722
44,515 32,035 25,740 24,893 46,752 35,474
45,433 29,702 21,226 18,760 38,113 27,847
20,780 11,452 3,085 1,986 17,012 14,181
64,425 42,034 46,189 46,577 65,720 55,041
409,019 392,545 370,886 393,603 424,829 412,103
133,963 115,398 103,237 105,219 105,936 83,489 ⇒ 07/3期より純資産合計-少数株主持分としております
147,125 158,342 182,530 201,136 214,923 233,810 Total net assets - Minority interests from FY 07/3
1.10 1.37 1.77 1.91 2.03 2.80
32.8% 29.4% 27.8% 26.7% 24.9% 20.3%
572,966 572,966 559,305 559,305 559,305 539,532
572,788 572,847 559,220 559,296 559,303 539,532
¥233.6 ¥201.3 ¥184.4 ¥188.1 ¥189.4 ¥154.7
¥36.0 ¥19.8 ¥5.3 ¥3.5 ¥30.8 ¥26.8
¥36.0 ¥18.9 ¥5.2 ¥3.4 ¥29.0 ¥24.6
¥7.0 ¥5.0 ¥5.0 ¥5.0 ¥6.0 ¥6.0
10.2% 8.1% 6.8% 6.7% 11.0% 9.0%
11.1% 8.4% 6.7% 6.1% 11.2% 8.4%
5.2% 3.0% 0.8% 0.5% 4.1% 3.4%
16.7% 10.5% 3.0% 1.9% 18.0% 20.4%
44,016 49,787 40,707 28,587 48,745 36,440
(25,792) (14,716) (21,988) (18,319) (34,699) (1,583)
22,345 21,954 29,636 27,111 24,888 22,875
32,913 21,773 20,794 26,969 34,844 18,463
6,502 4,975 4,414 3,208 3,742 3,406
9,701 9,397 8,339 8,619 9,542 9,379
1,109 899 777 830 1,101 1,111
3,000 2,046 1,586 1,527 1,806 1,670136.1 92.8 72.0 69.3 81.9 75.7
¥107.6 ¥113.1 ¥122.0 ¥125.1 ¥110.6 ¥111.6
¥107.3 ¥105.7 ¥120.2 ¥133.3 ¥123.9 ¥106.2
¥512 ¥510 ¥503 ¥791 ¥986 ¥683
¥384 ¥265 ¥200 ¥300 ¥550 ¥470
¥475 ¥454 ¥294 ¥443 ¥728 ¥626
7 Financial Data Book MITSUI KINZOKU

連結貸借対照表 Consolidated Balance Sheets(百万円 Millions of yen) 決算期 as of the ends of 2009/3 2008/3 2007/3 2006/3
資産の部 AssetsⅠ 流動資産 I Current assets - - - - - - - - - - - - - - - - - - - - - - - - - - - - - - - 181,415 227,923 218,436 208,754
現金及び預金 Cash and time deposits - - - - - - - - - - - - - - - - - - - - - - - - - - - - - - - - - - - - - - - - - - - - - -52,915 20,645 17,306 16,944受取手形及び売掛金 Notes and accounts receivable - - - - - - - - - - - - - - - - - - - - - - - - - - - - - - - -47,534 98,149 92,828 83,496有価証券 Marketable securities - - - - - - - - - - - - - - - - - - - - - - - - - - - - - - - - - - - - - - - - -- - - - たな卸資産 Inventories - - - - - - - - - - - - - - - - - - - - - - - - - - - - - - - - - - - - - - - - - - -63,976 92,719 88,560 79,165繰延税金資産 Deferred tax assets - - - - - - - - - - - - - - - - - - - - - - - - - - - - - - - - - - - - - - - - -1,138 3,755 6,486 5,677その他 Others - - - - - - - - - - - - - - - - - - - - - - - - - - - - - - - - - - - - - - - - - - - - - -16,351 13,293 13,904 23,995貸倒引当金 Allowance for doubtful accounts - - - - - - - - - - - - - - - - - - - - - - - - - - - - - - - -(500) (640) (649) (525)
Ⅱ 固定資産 II Fixed assets - - - - - - - - - - - - - - - - - - - - - - - - - - - - - - - - - - - - - - - - - - - 228,842 258,315 264,960 251,471(1)有形固定資産 (1) Property, plant and equipment - - - - - - - - - - - - - - - - - - - - - - - - - - - - - - - - - - - - - - - - - - - 169,299 184,168 195,604 203,906
建物及び構築物 Buildings and structures, net - - - - - - - - - - - - - - - - - - - - - - - - - - - - - - - - - - - - - - - - - - - - - -54,223 61,130 68,078 65,880機械装置及び運搬具 Machinery and equipment, net - - - - - - - - - - - - - - - - - - - - - - - - - - - - - - - - - - - - - - - - - - - - - -66,488 73,415 74,687 82,044土地 Land, net - - - - - - - - - - - - - - - - - - - - - - - - - - - - - - - - - - - - - - - - - - - - - -34,280 34,348 34,773 38,190リース資産 Lease assets - - - - - - - - - - - - - - - - - - - - - - - - - - - - - - - - - - - - - - - - - - - - - -3,575 - - - 建設仮勘定 Construction in progress - - - - - - - - - - - - - - - - - - - - - - - - - - - - - - - - - - - - - - - - - - - - - -5,716 6,604 9,295 8,843その他 Others, net - - - - - - - - - - - - - - - - - - - - - - - - - - - - - - - - - - - - - - - - - - - - - -5,015 8,669 8,769 8,947
(2)無形固定資産 (2) Intangible fixed assets - - - - - - - - - - - - - - - - - - - - - - - - - - - - - - - - - - - - - - - - - - - 3,605 3,014 2,222 2,194
(3)投資その他の資産 (3) Investments and long-term receivables - - - - - - - - - - - - - - - - - - - - - - - - - - - - - - - - - - - - - - - - - - - 55,936 71,132 67,133 45,370投資有価証券 Investment securities - - - - - - - - - - - - - - - - - - - - - - - - - - - - - - - - - - - - - - - - - - - - - -42,852 55,653 51,781 32,425長期貸付金 Long-term loans receivable - - - - - - - - - - - - - - - - - - - - - - - - - - - - - - - - - - - - - - - - - - - - - -779 914 954 4,775繰延税金資産 Deferred tax assets - - - - - - - - - - - - - - - - - - - - - - - - - - - - - - - - - - - - - - - - - - - - - -7,236 8,490 8,046 5,762その他 Others - - - - - - - - - - - - - - - - - - - - - - - - - - - - - - - - - - - - - - - - - - - - - -5,696 6,262 6,592 6,291貸倒引当金 Allowance for doubtful accounts - - - - - - - - - - - - - - - - - - - - - - - - - - - - - - - - - - - - - - - - - - - - - -(628) (188) (241) (3,883)
為替換算調整勘定 Foreign currency translation adjustments - - - - - - - - - - - - - - - - - - - - - - - - - - - - - - - - - - - - - - - - - - -- - - -
資 産 合 計 Total assets 410,258 486,238 483,397 460,225負債の部 LiabilitiesⅠ 流動負債 I Current liabilities - - - - - - - - - - - - - - - - - - - - - - - - - - - - - - - - - - - - - - - - - - - 152,542 154,782 160,847 162,170
支払手形及び買掛金 Notes and accounts payable - - - - - - - - - - - - - - - - - - - - - - - - - - - - - - - - - - - - - - - - - - - - - -26,630 52,436 48,064 46,896短期借入金 Short-term bank loans - - - - - - - - - - - - - - - - - - - - - - - - - - - - - - - - - - - - - - - - - - - - - -61,325 52,172 58,843 63,623コマーシャルペーパー Commercial paper - - - - - - - - - - - - - - - - - - - - - - - - - - - - - - - - - - - - - - - - - - - - - -20,000 - - - 社債(一年以内償還) Current portion of bonds - - - - - - - - - - - - - - - - - - - - - - - - - - - - - - - - - - - - - - - - - - - - - -10,000 10,000 1,000 - 転換社債(一年以内償還) Current portion of convertible bonds - - - - - - - - - - - - - - - - - - - - - - - - - - - - - - - - - - - - - - - - - - - - - -- - - - リース債務 Lease obligations - - - - - - - - - - - - - - - - - - - - - - - - - - - - - - - - - - - - - - - - - - - - - -1,159 - - - 未払法人税等 Accrued income taxes - - - - - - - - - - - - - - - - - - - - - - - - - - - - - - - - - - - - - - - - - - - - - -1,032 4,652 8,106 9,221賞与引当金 Accrued bonuses - - - - - - - - - - - - - - - - - - - - - - - - - - - - - - - - - - - - - - - - - - - - - -4,374 5,713 6,067 5,567その他 Others - - - - - - - - - - - - - - - - - - - - - - - - - - - - - - - - - - - - - - - - - - - - - -28,020 29,807 38,766 36,861
Ⅱ 固定負債 II Long-term liabilities - - - - - - - - - - - - - - - - - - - - - - - - - - - - - - - - - - - - - - - - - - - 153,084 131,911 124,658 126,558社債 Bonds - - - - - - - - - - - - - - - - - - - - - - - - - - - - - - - - - - - - - - - - - - - - - -40,000 40,000 40,000 31,000転換社債 Convertible bonds - - - - - - - - - - - - - - - - - - - - - - - - - - - - - - - - - - - - - - - - - - - - - -- - - - 長期借入金 Long-term loans - - - - - - - - - - - - - - - - - - - - - - - - - - - - - - - - - - - - - - - - - - - - - -71,142 49,750 43,376 57,210リース債務 Lease obligations - - - - - - - - - - - - - - - - - - - - - - - - - - - - - - - - - - - - - - - - - - - - - -2,357 - - - 繰延税金負債 Deferred tax liabilities - - - - - - - - - - - - - - - - - - - - - - - - - - - - - - - - - - - - - - - - - - - - - -4,362 1,777 1,895 1,326退職給付(給与)引当金 Allowance for employees' retirement benefits - - - - - - - - - - - - - - - - - - - - - - - - - - - - - - - - - - - - - - - - - - - - - -28,655 33,382 30,151 28,405環境対策引当金 Allowance for environmental remediation - - - - - - - - - - - - - - - - - - - - - - - - - - - - - - - - - - - - - - - - - - - - - -2,577 2,559 3,074 - 負ののれん/連結調整勘定 Consolidation differences - - - - - - - - - - - - - - - - - - - - - - - - - - - - - - - - - - - - - - - - - - - - - -122 245 3,217 6,209その他 Others - - - - - - - - - - - - - - - - - - - - - - - - - - - - - - - - - - - - - - - - - - - - - -3,865 4,194 2,942 2,406
負 債 合 計 Total liabilities 305,626 286,693 285,506 288,729
純資産の部 Net assets
Ⅰ 資本金 Ⅰ Common stock - - - - - - - - - - - - - - - - - - - - - - - - - - - - - - - - - - - - - - - - - - - - - -42,129 42,129 42,129 42,129Ⅱ 資本剰余金 Ⅱ Capital surplus - - - - - - - - - - - - - - - - - - - - - - - - - - - - - - - - - - - - - - - - - - - - - -22,557 22,557 22,557 22,557Ⅲ 利益剰余金 Ⅲ Retained earnings - - - - - - - - - - - - - - - - - - - - - - - - - - - - - - - - - - - - - - - - - - - - - -43,659 117,548 117,181 91,275Ⅳ 自己株式 Ⅳ Treasury stock - - - - - - - - - - - - - - - - - - - - - - - - - - - - - - - - - - - - - - - - - - - - - -(503) (131) (116) (93)
Ⅴ その他有価証券評価差額金 Ⅴ Net unrealized gains on securities - - - - - - - - - - - - - - - - - - - - - - - - - - - - - - - - - - - - - - - - - - - - - -842 2,743 5,081 5,914Ⅵ 繰延ヘッジ損益 Ⅵ Loss on deferred hedge - - - - - - - - - - - - - - - - - - - -(4,370) 2,354 (1,160) - Ⅶ 為替換算調整勘定 Ⅶ Foreign currency translation adjustments - - - - - - - - - - - - - - - - - - - - - - - - - - - - - - - - - - - - - - - - - - - - - -(10,169) (2,206) (160) (2,011)
自 己 資 本(旧基準:資本合計) Total shareholders' equity 94,145 184,995 185,513 159,772少数株主持分 Minority interests 10,485 14,550 12,377 11,724
純 資 産 合 計 Total net assets 104,631 199,545 197,890 171,496
Total liabilities and net assets 410,258 486,238 483,397 460,225 負債、純資産 合計
8 Financial Data Book MITSUI KINZOKU
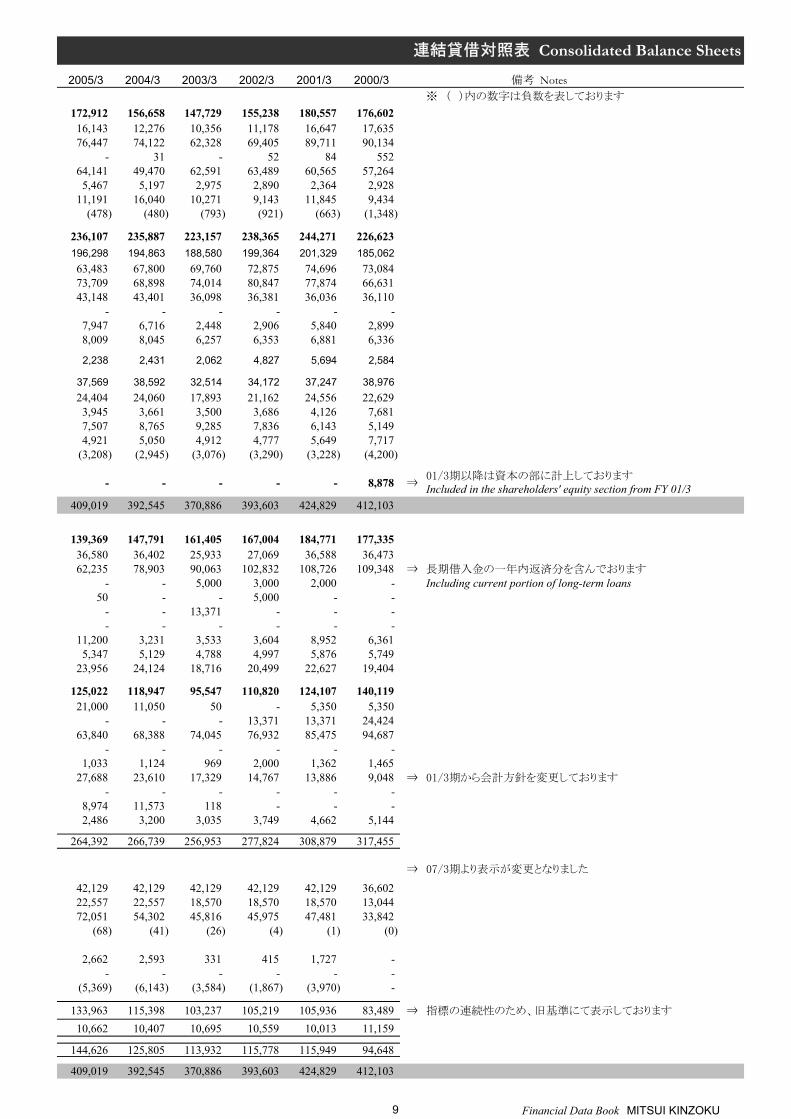
連結貸借対照表 Consolidated Balance Sheets
2005/3 2004/3 2003/3 2002/3 2001/3 2000/3 備考 Notes※ ( )内の数字は負数を表しております
172,912 156,658 147,729 155,238 180,557 176,60216,143 12,276 10,356 11,178 16,647 17,63576,447 74,122 62,328 69,405 89,711 90,134
- 31 - 52 84 55264,141 49,470 62,591 63,489 60,565 57,2645,467 5,197 2,975 2,890 2,364 2,928
11,191 16,040 10,271 9,143 11,845 9,434(478) (480) (793) (921) (663) (1,348)
236,107 235,887 223,157 238,365 244,271 226,623196,298 194,863 188,580 199,364 201,329 185,06263,483 67,800 69,760 72,875 74,696 73,08473,709 68,898 74,014 80,847 77,874 66,63143,148 43,401 36,098 36,381 36,036 36,110
- - - - - - 7,947 6,716 2,448 2,906 5,840 2,8998,009 8,045 6,257 6,353 6,881 6,336
2,238 2,431 2,062 4,827 5,694 2,584
37,569 38,592 32,514 34,172 37,247 38,97624,404 24,060 17,893 21,162 24,556 22,6293,945 3,661 3,500 3,686 4,126 7,6817,507 8,765 9,285 7,836 6,143 5,1494,921 5,050 4,912 4,777 5,649 7,717
(3,208) (2,945) (3,076) (3,290) (3,228) (4,200)
- - - - - 8,878 ⇒01/3期以降は資本の部に計上しておりますIncluded in the shareholders' equity section from FY 01/3
409,019 392,545 370,886 393,603 424,829 412,103
139,369 147,791 161,405 167,004 184,771 177,33536,580 36,402 25,933 27,069 36,588 36,47362,235 78,903 90,063 102,832 108,726 109,348 ⇒ 長期借入金の一年内返済分を含んでおります
- - 5,000 3,000 2,000 - Including current portion of long-term loans50 - - 5,000 - -
- - 13,371 - - - - - - - - -
11,200 3,231 3,533 3,604 8,952 6,3615,347 5,129 4,788 4,997 5,876 5,749
23,956 24,124 18,716 20,499 22,627 19,404
125,022 118,947 95,547 110,820 124,107 140,11921,000 11,050 50 - 5,350 5,350
- - - 13,371 13,371 24,42463,840 68,388 74,045 76,932 85,475 94,687
- - - - - - 1,033 1,124 969 2,000 1,362 1,465
27,688 23,610 17,329 14,767 13,886 9,048 ⇒ 01/3期から会計方針を変更しております- - - - - -
8,974 11,573 118 - - - 2,486 3,200 3,035 3,749 4,662 5,144
264,392 266,739 256,953 277,824 308,879 317,455
⇒ 07/3期より表示が変更となりました
42,129 42,129 42,129 42,129 42,129 36,60222,557 22,557 18,570 18,570 18,570 13,04472,051 54,302 45,816 45,975 47,481 33,842
(68) (41) (26) (4) (1) (0)
2,662 2,593 331 415 1,727 - - - - - - -
(5,369) (6,143) (3,584) (1,867) (3,970) -
133,963 115,398 103,237 105,219 105,936 83,489 ⇒ 指標の連続性のため、旧基準にて表示しております
10,662 10,407 10,695 10,559 10,013 11,159
144,626 125,805 113,932 115,778 115,949 94,648
409,019 392,545 370,886 393,603 424,829 412,103
9 Financial Data Book MITSUI KINZOKU
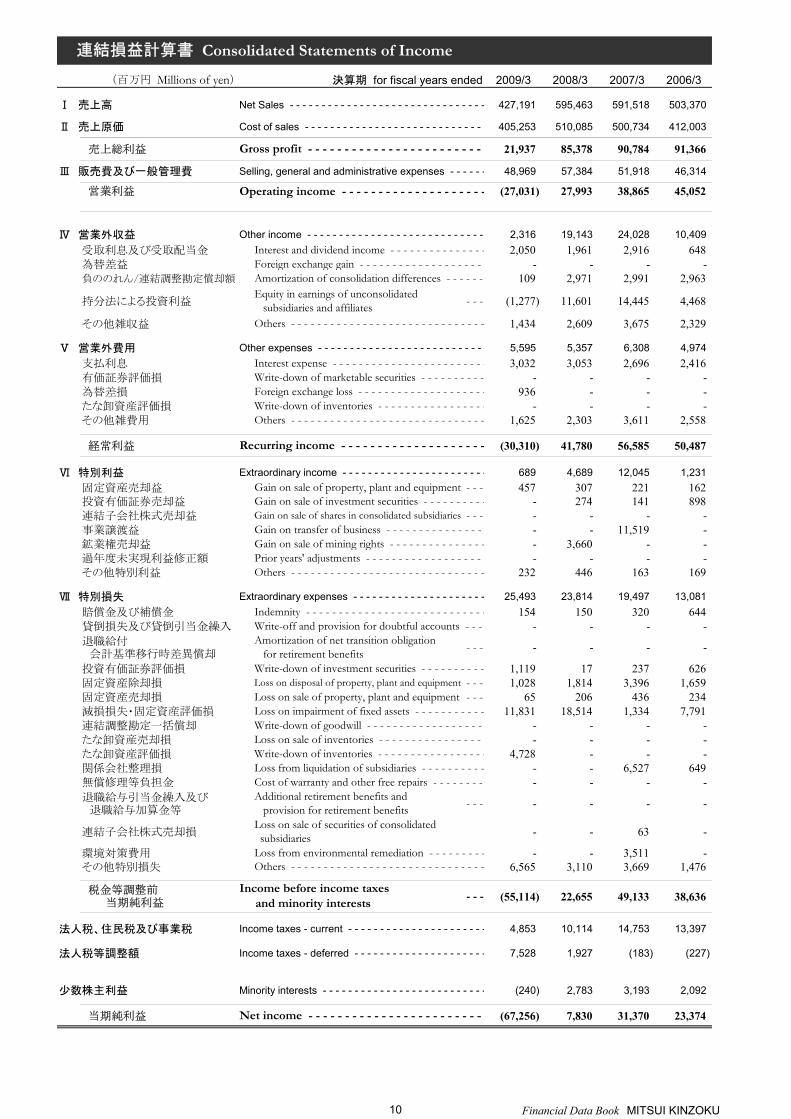
連結損益計算書 Consolidated Statements of Income(百万円 Millions of yen) 決算期 for fiscal years ended 2009/3 2008/3 2007/3 2006/3
Ⅰ 売上高 Net Sales - - - - - - - - - - - - - - - - - - - - - - - - - - - - - - - - - - - - - - - - - - - 427,191 595,463 591,518 503,370
Ⅱ 売上原価 Cost of sales - - - - - - - - - - - - - - - - - - - - - - - - - - - - - - - - - - - - - - - - - - - 405,253 510,085 500,734 412,003
売上総利益 Gross profit - - - - - - - - - - - - - - - - - - - - - - - - - - - - - - - - - - - - - - - - - - - 21,937 85,378 90,784 91,366
Ⅲ 販売費及び一般管理費 Selling, general and administrative expenses - - - - - - - - - - - - - - - - - - - - - - - - - - - - - - - - - - - - - - - - - - - 48,969 57,384 51,918 46,314
営業利益 Operating income - - - - - - - - - - - - - - - - - - - - - - - - - - - - - - - - - - - - - - - - - - - (27,031) 27,993 38,865 45,052
Ⅳ 営業外収益 Other income - - - - - - - - - - - - - - - - - - - - - - - - - - - - - - - - - - - - - - - - - - - 2,316 19,143 24,028 10,409受取利息及び受取配当金 Interest and dividend income - - - - - - - - - - - - - - - - - - - - - - - - - - - - - - - - - - - - - - - - - - - - - -2,050 1,961 2,916 648為替差益 Foreign exchange gain - - - - - - - - - - - - - - - - - - - - - - - - - - - - - - - - - - - - - - - - - - - - - -- - - - 負ののれん/連結調整勘定償却額 Amortization of consolidation differences - - - - - - - - - - - - - - - - - - - - - - - - - - - - - - - - - - - - - - - - - - - - - -109 2,971 2,991 2,963
持分法による投資利益Equity in earnings of unconsolidated subsidiaries and affiliates - - - - - (1,277) 11,601 14,445 4,468
その他雑収益 Others - - - - - - - - - - - - - - - - - - - - - - - - - - - - - - - - - - - - - - - - - - - - - - - - - - - - - - - - - - - - - - - - - - - - - - - - - - - - -1,434 2,609 3,675 2,329
Ⅴ 営業外費用 Other expenses - - - - - - - - - - - - - - - - - - - - - - - - - - - - - - - - - - - - - - - - - - - 5,595 5,357 6,308 4,974支払利息 Interest expense - - - - - - - - - - - - - - - - - - - - - - - - - - - - - - - - - - - - - - - - - - - - - -3,032 3,053 2,696 2,416有価証券評価損 Write-down of marketable securities - - - - - - - - - - - - - - - - - - - - - - - - - - - - - - - - - - - - - - - - - - - - - -- - - - 為替差損 Foreign exchange loss - - - - - - - - - - - - - - - - - - - - - - - - - - - - - - - - - - - - - - - - - - - - - -936 - - - たな卸資産評価損 Write-down of inventories - - - - - - - - - - - - - - - - - - - - - - - - - - - - - - - - - - - - - - - - - - - - - -- - - - その他雑費用 Others - - - - - - - - - - - - - - - - - - - - - - - - - - - - - - - - - - - - - - - - - - - - - - - - - - - - - - - - - - - - - - - - - - - - - - - - - - - - -1,625 2,303 3,611 2,558
経常利益 Recurring income - - - - - - - - - - - - - - - - - - - - - - - - - - - - - - - - - - - - - - - - - - - (30,310) 41,780 56,585 50,487
Ⅵ 特別利益 Extraordinary income - - - - - - - - - - - - - - - - - - - - - - - - - - - - - - - - - - - - - - - - - - - 689 4,689 12,045 1,231固定資産売却益 Gain on sale of property, plant and equipment - - - - - 457 307 221 162投資有価証券売却益 Gain on sale of investment securities - - - - - - - - - - - - - - - - - - - - - - - - - - - - - - - - - - - - - - - - - - - - - -- 274 141 898連結子会社株式売却益 Gain on sale of shares in consolidated subsidiaries - - - - - - - - - 事業譲渡益 Gain on transfer of business - - - - - - - - - - - - - - - - - - - - - - - - - - - - - - - - - - - - - - - - - - - - - -- - 11,519 - 鉱業権売却益 Gain on sale of mining rights - - - - - - - - - - - - - - - - - - - - - - - - - - - - - - - - - - - - - - - - - - - - - -- 3,660 - - 過年度未実現利益修正額 Prior years' adjustments - - - - - - - - - - - - - - - - - - - - - - - - - - - - - - - - - - - - - - - - - - - - - -- - - - その他特別利益 Others - - - - - - - - - - - - - - - - - - - - - - - - - - - - - - - - - - - - - - - - - - - - - - - - - - - - - - - - - - - - - - - - - - - - - - - - - - - - -232 446 163 169
Ⅶ 特別損失 Extraordinary expenses - - - - - - - - - - - - - - - - - - - - - - - - - - - - - - - - - - - - - - - - - - - 25,493 23,814 19,497 13,081賠償金及び補償金 Indemnity - - - - - - - - - - - - - - - - - - - - - - - - - - - - - - - - - - - - - - - - - - - - - -154 150 320 644貸倒損失及び貸倒引当金繰入 Write-off and provision for doubtful accounts - - - - - - - - - - - - - - - - - - - - - - - - - - - - - - - - - - - - - - - - - - - - - -- - - - 退職給付 会計基準移行時差異償却
Amortization of net transition obligation for retirement benefits - - - - - - - - -
投資有価証券評価損 Write-down of investment securities - - - - - - - - - - - - - - - - - - - - - - - - - - - - - - - - - - - - - - - - - - - - - -1,119 17 237 626固定資産除却損 Loss on disposal of property, plant and equipment - - - - - 1,028 1,814 3,396 1,659固定資産売却損 Loss on sale of property, plant and equipment - - - - - 65 206 436 234減損損失・固定資産評価損 Loss on impairment of fixed assets - - - - - - - - - - - - - - - - - - - - - - - - - - - - - - - - - - - - - - - - - - - - - -11,831 18,514 1,334 7,791連結調整勘定一括償却 Write-down of goodwill - - - - - - - - - - - - - - - - - - - - - - - - - - - - - - - - - - - - - - - - - - - - - -- - - - たな卸資産売却損 Loss on sale of inventories - - - - - - - - - - - - - - - - - - - - - - - - - - - - - - - - - - - - - - - - - - - - - -- - - - たな卸資産評価損 Write-down of inventories - - - - - - - - - - - - - - - - - - - - - - - - - - - - - - - - - - - - - - - - - - - - - -4,728 - - - 関係会社整理損 Loss from liquidation of subsidiaries - - - - - - - - - - - - - - - - - - - - - - - - - - - - - - - - - - - - - - - - - - - - - -- - 6,527 649無償修理等負担金 Cost of warranty and other free repairs - - - - - - - - - - - - - - - - - - - - - - - - - - - - - - - - - - - - - - - - - - - - - -- - - - 退職給与引当金繰入及び 退職給与加算金等
Additional retirement benefits and provision for retirement benefits - - - - - - - - -
連結子会社株式売却損Loss on sale of securities of consolidated subsidiaries - - 63 -
環境対策費用 Loss from environmental remediation - - - - - - - - - - - - - - - - - - - - - - - - - - - - - - - - - - - - - - - - - - - - - -- - 3,511 - その他特別損失 Others - - - - - - - - - - - - - - - - - - - - - - - - - - - - - - - - - - - - - - - - - - - - - - - - - - - - - - - - - - - - - - - - - - - - - - - - - - - - -6,565 3,110 3,669 1,476
- - - - - (55,114) 22,655 49,133 38,636
法人税、住民税及び事業税 Income taxes - current - - - - - - - - - - - - - - - - - - - - - - - - - - - - - - - - - - - - - - - - - - - 4,853 10,114 14,753 13,397
法人税等調整額 Income taxes - deferred - - - - - - - - - - - - - - - - - - - - - - - - - - - - - - - - - - - - - - - - - - - 7,528 1,927 (183) (227)
少数株主利益 Minority interests - - - - - - - - - - - - - - - - - - - - - - - - - - - - - - - - - - - - - - - - - - - (240) 2,783 3,193 2,092
当期純利益 Net income - - - - - - - - - - - - - - - - - - - - - - - - - - - - - - - - - - - - - - - - - - - (67,256) 7,830 31,370 23,374
税金等調整前 当期純利益
Income before income taxes and minority interests
10 Financial Data Book MITSUI KINZOKU
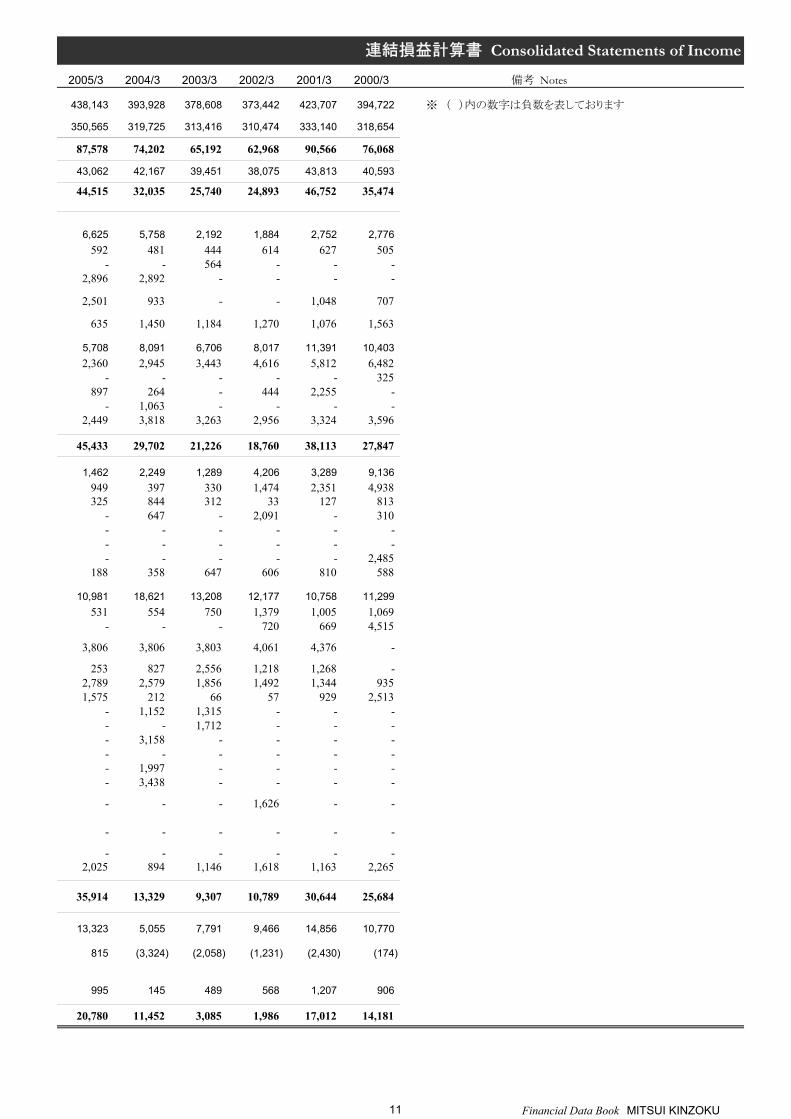
連結損益計算書 Consolidated Statements of Income
2005/3 2004/3 2003/3 2002/3 2001/3 2000/3 備考 Notes
438,143 393,928 378,608 373,442 423,707 394,722 ※ ( )内の数字は負数を表しております
350,565 319,725 313,416 310,474 333,140 318,654
87,578 74,202 65,192 62,968 90,566 76,068
43,062 42,167 39,451 38,075 43,813 40,593
44,515 32,035 25,740 24,893 46,752 35,474
6,625 5,758 2,192 1,884 2,752 2,776592 481 444 614 627 505
- - 564 - - - 2,896 2,892 - - - -
2,501 933 - - 1,048 707
635 1,450 1,184 1,270 1,076 1,563
5,708 8,091 6,706 8,017 11,391 10,4032,360 2,945 3,443 4,616 5,812 6,482
- - - - - 325897 264 - 444 2,255 -
- 1,063 - - - - 2,449 3,818 3,263 2,956 3,324 3,596
45,433 29,702 21,226 18,760 38,113 27,847
1,462 2,249 1,289 4,206 3,289 9,136949 397 330 1,474 2,351 4,938325 844 312 33 127 813
- 647 - 2,091 - 310- - - - - - - - - - - - - - - - - 2,485
188 358 647 606 810 588
10,981 18,621 13,208 12,177 10,758 11,299531 554 750 1,379 1,005 1,069
- - - 720 669 4,515
3,806 3,806 3,803 4,061 4,376 -
253 827 2,556 1,218 1,268 - 2,789 2,579 1,856 1,492 1,344 9351,575 212 66 57 929 2,513
- 1,152 1,315 - - - - - 1,712 - - - - 3,158 - - - - - - - - - - - 1,997 - - - - - 3,438 - - - -
- - - 1,626 - -
- - - - - -
- - - - - - 2,025 894 1,146 1,618 1,163 2,265
35,914 13,329 9,307 10,789 30,644 25,684
13,323 5,055 7,791 9,466 14,856 10,770
815 (3,324) (2,058) (1,231) (2,430) (174)
995 145 489 568 1,207 906
20,780 11,452 3,085 1,986 17,012 14,181
11 Financial Data Book MITSUI KINZOKU

連結キャッシュフロー計算書 Consolidated Statements of Cash Flows(百万円 Millions of yen) 決算期 for fiscal years ended 2009/3 2008/3 2007/3 2006/3
Ⅰ 営業活動によるキャッシュフロー Cash flows from operating activities
税金等調整前当期純利益Income before income taxes and minority interests - - - - - (55,114) 22,655 49,133 38,636
減価償却費(連結調整勘定を含む) Depreciation and amortization - - - - - - - - - - - - - - - - - - - - - - - - - - - - - - - - - - - - - - - - - - - - - -32,281 27,361 25,617 24,686減損損失・固定資産評価損 Loss on impairment of fixed assets - - - - - - - - - - - - - - - - - - - - - - - - - - - - - - - - - - - - - - - - - - - - - -11,831 18,514 1,334 7,791退職給付 会計基準移行時差異償却
Amortization of net transition obligation for retirement benefits - - - - - - - - -
事業譲渡益 Gain on transfer of business - - - - - - - - - - - - - - - - - - - - - - - - - - - - - - - - - - - - - - - - - - - - - -- - (11,519) - 鉱業権売却益 Gain on sale of mining rights - - - - - - - - - - - - - - - - - - - - - - - - - - - - - - - - - - - - - - - - - - - - - -- (3,660) - -
環境対策費用引当金繰入Loss on provision for environmental remediation 977 156 3,074 -
為替差損益 Foreign exchange loss(gain) - - - - - - - - - - - - - - - - - - - - - - - - - - - - - - - - - - - - - - - - - - - - - -99 59 (159) (39)
持分法による投資損益Equity in loss(earnings) of unconsolidated subsidiaries and affiliates - - - - - 1,277 (11,601) (14,445) (4,468)
支払利息 Interest expense - - - - - - - - - - - - - - - - - - - - - - - - - - - - - - - - - - - - - - - - - - - - - -3,032 3,053 2,696 2,416
売上債権の増減額Decrease(increase) in notes and accounts receivable - - - - - 46,114 (6,210) (11,221) (5,345)
たな卸資産の増減額 Decrease(increase) in inventories - - - - - - - - - - - - - - - - - - - - - - - - - - - - - - - - - - - - - - - - - - - - - -25,384 (4,479) (13,508) (13,751)仕入債務の増減額 Increase(decrease) in notes and accounts payable - - - - - (22,706) 1,128 2,460 9,567その他 Others - - - - - - - - - - - - - - - - - - - - - - - - - - - - - - - - - - - - - - - - - - - - - - - - - - - - - - - - - - - - - - - - - - - - - - - - - - -(7,394) 4,833 12,137 915 小計 Subtotal 35,784 51,811 45,600 60,409利息及び配当金の受取額 Interest and dividends received - - - - - - - - - - - - - - - - - - - - - - - - - - - - - - - - - - - - - - - - - - - - - -5,504 6,477 7,143 2,700利息の支払額 Interest paid - - - - - - - - - - - - - - - - - - - - - - - - - - - - - - - - - - - - - - - - - - - - - -(2,900) (2,946) (2,712) (2,389)保証債務の履行による支払額 Payment for execution of a guarantee - - - - - - - - - - - - - - - - - - - - - - - - - - - - - - - - - - - - - - - - - - - - - -- - - - 賠償金及び補償金の支払額 Indemnity paid - - - - - - - - - - - - - - - - - - - - - - - - - - - - - - - - - - - - - - - - - - - - - -(154) (150) (320) (644)事業撤退費用の支払額 Payment for dissolution of discontinued business - - - - - - - - - 合理化退職金の支出 Payment for retirement benefit for rationalization - - - - - - - - - 法人税等の支払額 Income taxes paid - - - - - - - - - - - - - - - - - - - - - - - - - - - - - - - - - - - - - - - - - - - - - -(8,191) (13,533) (15,634) (15,275)その他 Others - - - - - - - - - - - - - - - - - - - - - - - - - - - - - - - - - - - - - - - - - - - - - - - - - - - - - - - - - - - - - - - - - - - - - - - - - - -(3) - - -
営業活動によるキャッシュフロー Net cash provided by operating activities 30,038 41,657 34,077 44,800
Ⅱ 投資活動によるキャッシュフロー Cash flows from investing activities有価証券の取得による支出 Purchase of securities - - - - - - - - - - - - - - - - - - - - - - - - - - - - - - - - - - - - - - - - - - - - - -(2,389) (1,760) (13,717) (2,165)有価証券の売却による収入 Sale of securities - - - - - - - - - - - - - - - - - - - - - - - - - - - - - - - - - - - - - - - - - - - - - -102 372 242 1,571連結子会社株式の売却に よる収入(支出)
Sale of shares in consolidated subsidiaries - - - - - - - - - - - - - - - - - - - - - - - - - - - - - - - - - - - - - - - - - - - - - -- - 231 285
連結の範囲の変更を伴う 子会社株式の取得による支出
Disbursements for acquisition of newly consolidated subsidiaries - - - - - - - - -
株式の交換による子会社資金の受入額 Net of cash acquired through stock exchange - - - - - - - - - - - - - - - - - - - - - - - - - - - - - - - - - - - - - - - - - - - - - -- - - - 有形固定資産の取得による支出 Acquisition of property, plant and equipment - - - - - - - - - - - - - - - - - - - - - - - - - - - - - - - - - - - - - - - - - - - - - -(33,821) (39,510) (38,900) (41,461)有形固定資産の売却による収入 Sale of property, plant and equipment - - - - - - - - - - - - - - - - - - - - - - - - - - - - - - - - - - - - - - - - - - - - - -449 1,640 2,046 2,402鉱業権売却による収入 Proceeds from sale of mining rights - - - - - - - - - - - - - - - 502 3,936 - - 長期貸付金の貸付による支出 Disbursement for long-term loans receivable - - - - - - - - - - - - - - - - - - - - - - - - - - - - - - - - - - - - - - - - - - - - - -(9) (462) (863) (1,247)長期貸付金の回収による収入 Collection of long-term loans receivable - - - - - - - - - - - - - - - - - - - - - - - - - - - - - - - - - - - - - - - - - - - - - -143 159 167 3事業譲渡による収入 Proceeds from transfer of business - - - - - - - - - - - - - - - - - 22,337 - その他 Others - - - - - - - - - - - - - - - - - - - - - - - - - - - - - - - - - - - - - - - - - - - - - - - - - - - - - - - - - - - - - - - - - - - - - - - - - - - - -(1,900) (2,425) (1,565) (2,428)
投資活動によるキャッシュフロー Net cash used in investing activities (36,922) (38,049) (30,021) (43,039)
Ⅲ 財務活動によるキャッシュフロー Cash flows from financing activities短期借入金の増減額 Net increase(decrease) in short-term bank loans - - - - - 10,340 4,751 (6,915) (2,285)コマーシャルペーパーの増減額 Net increase(decrease) in commercial paper - - - - - - - - - - - - - - - - - - - - - - - - - - - - - - - - - - - - - - - - - - - - - -20,000 - - - 長期借入による収入 Proceeds from long-term debt - - - - - - - - - - - - - - - - - - - - - - - - - - - - - - - - - - - - - - - - - - - - - -32,594 17,414 16,393 12,511長期借入金の返済による支出 Repayment of long-term debt - - - - - - - - - - - - - - - - - - - - - - - - - - - - - - - - - - - - - - - - - - - - - -(10,301) (23,543) (17,569) (16,920)社債及び転換社債の発行による収入 Issuance of bonds and convertible bonds - - - - - - - - - - - - - - - - - - - - - - - - - - - - - - - - - - - - - - - - - - - - - -10,000 10,000 10,000 10,000社債及び転換社債の償還による支出 Redemption of bonds and convertible bonds - - - - - - - - - - - - - - - - - - - - - - - - - - - - - - - - - - - - - - - - - - - - - -(10,000) (1,000) - (50)配当金の支払額 Payment for cash dividends to shareholders - - - - - - - - - - - - - - - - - - - - - - - - - - - - - - - - - - - - - - - - - - - - - -(6,872) (6,872) (5,727) (4,009)少数株主への配当金支払額 Payment for cash dividends to minority interests - - - - - (1,324) (1,344) (838) (417)その他 Others - - - - - - - - - - - - - - - - - - - - - - - - - - - - - - - - - - - - - - - - - - - - - - - - - - - - - - - - - - - - - - - - - - - - - - - - - - - - -(2,068) (150) (87) (107)
財務活動によるキャッシュフロー Net cash used in financing activities 42,367 (744) (4,744) (1,278)
Effect of exchange rate changes on cash and cash equivalents (3,213) 149 529 319
Ⅴ 現金及び現金同等物の増減額Net increase(decrease) in cash and cash equivalents 32,270 3,012 (159) 801
Ⅵ 現金及び現金同等物の期首残高 Cash and cash equivalents at beginning of year 20,645 17,304 16,944 16,143
Effect of additions of consolidated subsidiaries - 328 520 -
Ⅷ 現金及び現金同等物の期末残高 Cash and cash equivalents at end of year 52,915 20,645 17,304 16,944
Ⅳ 現金及び現金同等物に係る 換算差額
Ⅶ 新規連結子会社の現金及び 現金同等物の期首残高
12 Financial Data Book MITSUI KINZOKU

連結キャッシュフロー計算書 Consolidated Statements of Cash Flows
2005/3 2004/3 2003/3 2002/3 2001/3 2000/3 備考 Notes
※ ( )内の数字は負数を表しております
35,914 13,329 9,307 10,789 30,644 25,684
22,345 21,954 29,636 27,111 24,888 22,875- 1,152 1,315 - - -
3,806 3,806 3,803 4,061 4,376 -
- - - - - - - - - - - -
- - - - - -
(144) 155 (325) 465 2,571 (651)
(2,501) (933) 77 31 (1,048) (707)
2,360 2,945 3,443 4,616 5,812 6,482
(2,284) (3,987) 6,898 17,191 3,471 (5,470)
(14,376) 15,337 640 (4,176) (2,095) 3,06819 3,956 (1,452) (9,493) (1,065) 5,071
5,748 320 (1,041) (566) 226 (649)50,887 58,036 52,303 50,030 67,781 55,7031,251 597 553 666 686 587
(2,517) (2,923) (3,489) (4,776) (5,814) (6,490)- - - - - (2,779)
(531) (554) (750) (1,379) (1,005) (1,094)- - - - (457) (262)- - - (1,221) - -
(5,074) (5,368) (7,910) (14,731) (12,444) (9,223)- - - - - -
44,016 49,787 40,707 28,587 48,745 36,440
(236) (2,240) (2,710) (657) (1,632) (1,958)461 3,011 1,139 560 358 2,640
- 885 (43) 5,333 - 747
- - - - (6,213) (192)
- 3,166 - - - - (32,528) (21,263) (20,344) (26,604) (34,182) (18,101)
6,495 1,261 1,285 2,779 3,894 14,771- - - - - -
(129) (207) (25) (122) (332) (908)107 106 138 295 3,051 1,277
- - - - - - 37 564 (1,427) 96 357 142
(25,792) (14,716) (21,988) (18,319) (34,699) (1,583)
(14,492) (10,950) (12,566) (2,347) 12,364 (23,809)- (5,000) 2,000 1,000 2,000 -
13,207 20,818 21,808 19,067 23,786 26,306(20,289) (31,486) (23,484) (29,996) (49,803) (46,932)10,000 10,000 - - - 10,000
- (13,371) (5,000) - - - (2,864) (2,870) (2,796) (3,355) (3,237) (2,544)
(403) (125) (132) (248) (339) (333)(105) (3) 18 33 5 993
(14,947) (32,989) (20,152) (15,846) (15,224) (36,320)
115 (119) (250) 117 (19) (336)
3,391 1,962 (1,684) (5,461) (1,197) (1,800)
12,274 10,312 11,230 16,692 17,663 19,463
476 - 766 - 227 -
16,143 12,274 10,312 11,230 16,692 17,663
13 Financial Data Book MITSUI KINZOKU
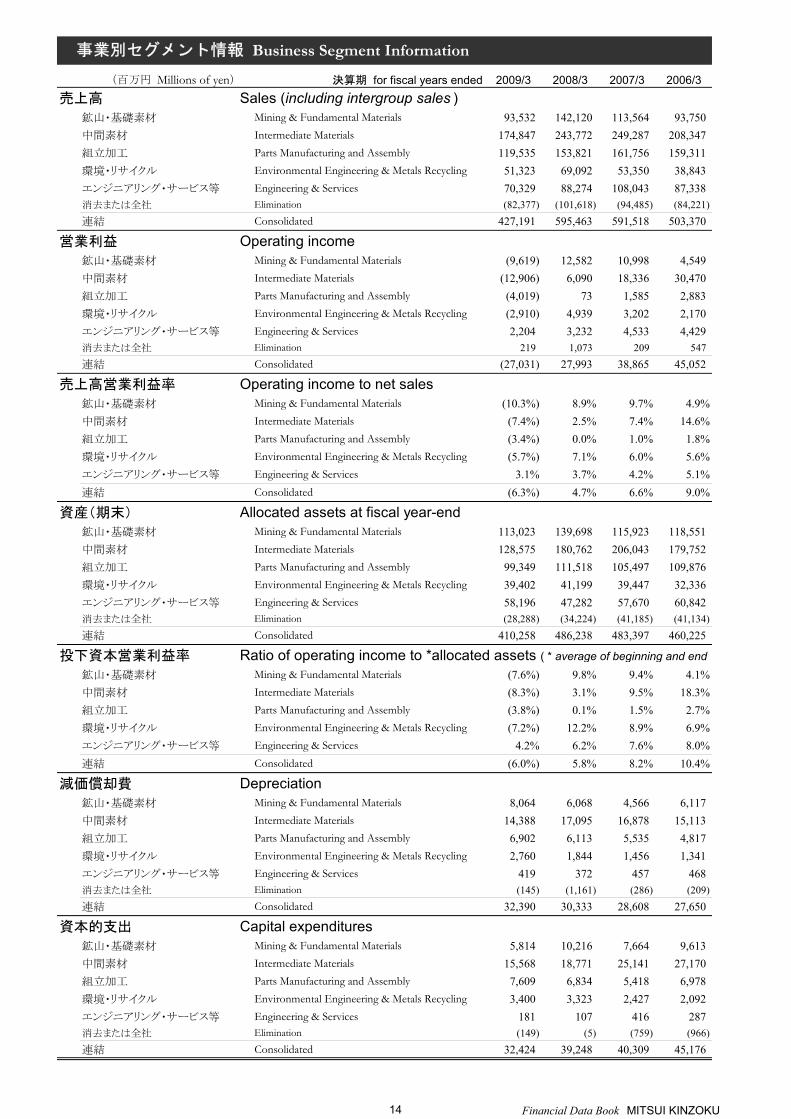
事業別セグメント情報 Business Segment Information(百万円 Millions of yen) 決算期 for fiscal years ended 2009/3 2008/3 2007/3 2006/3
売上高 Sales (including intergroup sales )鉱山・基礎素材 Mining & Fundamental Materials 93,532 142,120 113,564 93,750中間素材 Intermediate Materials 174,847 243,772 249,287 208,347組立加工 Parts Manufacturing and Assembly 119,535 153,821 161,756 159,311環境・リサイクル Environmental Engineering & Metals Recycling 51,323 69,092 53,350 38,843エンジニアリング・サービス等 Engineering & Services 70,329 88,274 108,043 87,338消去または全社 Elimination (82,377) (101,618) (94,485) (84,221)
連結 Consolidated 427,191 595,463 591,518 503,370
営業利益 Operating income鉱山・基礎素材 Mining & Fundamental Materials (9,619) 12,582 10,998 4,549中間素材 Intermediate Materials (12,906) 6,090 18,336 30,470組立加工 Parts Manufacturing and Assembly (4,019) 73 1,585 2,883環境・リサイクル Environmental Engineering & Metals Recycling (2,910) 4,939 3,202 2,170エンジニアリング・サービス等 Engineering & Services 2,204 3,232 4,533 4,429消去または全社 Elimination 219 1,073 209 547
連結 Consolidated (27,031) 27,993 38,865 45,052
売上高営業利益率 Operating income to net sales鉱山・基礎素材 Mining & Fundamental Materials (10.3%) 8.9% 9.7% 4.9%中間素材 Intermediate Materials (7.4%) 2.5% 7.4% 14.6%組立加工 Parts Manufacturing and Assembly (3.4%) 0.0% 1.0% 1.8%環境・リサイクル Environmental Engineering & Metals Recycling (5.7%) 7.1% 6.0% 5.6%エンジニアリング・サービス等 Engineering & Services 3.1% 3.7% 4.2% 5.1%連結 Consolidated (6.3%) 4.7% 6.6% 9.0%
資産(期末) Allocated assets at fiscal year-end鉱山・基礎素材 Mining & Fundamental Materials 113,023 139,698 115,923 118,551中間素材 Intermediate Materials 128,575 180,762 206,043 179,752組立加工 Parts Manufacturing and Assembly 99,349 111,518 105,497 109,876環境・リサイクル Environmental Engineering & Metals Recycling 39,402 41,199 39,447 32,336エンジニアリング・サービス等 Engineering & Services 58,196 47,282 57,670 60,842消去または全社 Elimination (28,288) (34,224) (41,185) (41,134)
連結 Consolidated 410,258 486,238 483,397 460,225
投下資本営業利益率 Ratio of operating income to *allocated assets ( * average of beginning and end of fiscal year鉱山・基礎素材 Mining & Fundamental Materials (7.6%) 9.8% 9.4% 4.1%中間素材 Intermediate Materials (8.3%) 3.1% 9.5% 18.3%組立加工 Parts Manufacturing and Assembly (3.8%) 0.1% 1.5% 2.7%環境・リサイクル Environmental Engineering & Metals Recycling (7.2%) 12.2% 8.9% 6.9%エンジニアリング・サービス等 Engineering & Services 4.2% 6.2% 7.6% 8.0%連結 Consolidated (6.0%) 5.8% 8.2% 10.4%
減価償却費 Depreciation鉱山・基礎素材 Mining & Fundamental Materials 8,064 6,068 4,566 6,117中間素材 Intermediate Materials 14,388 17,095 16,878 15,113組立加工 Parts Manufacturing and Assembly 6,902 6,113 5,535 4,817環境・リサイクル Environmental Engineering & Metals Recycling 2,760 1,844 1,456 1,341エンジニアリング・サービス等 Engineering & Services 419 372 457 468消去または全社 Elimination (145) (1,161) (286) (209)
連結 Consolidated 32,390 30,333 28,608 27,650
資本的支出 Capital expenditures鉱山・基礎素材 Mining & Fundamental Materials 5,814 10,216 7,664 9,613中間素材 Intermediate Materials 15,568 18,771 25,141 27,170組立加工 Parts Manufacturing and Assembly 7,609 6,834 5,418 6,978環境・リサイクル Environmental Engineering & Metals Recycling 3,400 3,323 2,427 2,092エンジニアリング・サービス等 Engineering & Services 181 107 416 287消去または全社 Elimination (149) (5) (759) (966)
連結 Consolidated 32,424 39,248 40,309 45,176
14 Financial Data Book MITSUI KINZOKU

事業別セグメント情報 Business Segment Information
2005/3 2004/3 2003/3 2002/3 2001/3 2000/3 備考 Notes※ ( )内の数字は負数を表しております
78,077 77,442 116,453 134,294 147,768 146,304176,008 143,179 142,193 135,252 169,768 145,861145,657 136,007 85,455 86,664 93,111 88,58131,574 26,922 22,247 ⇒ 03/3期に新設しております
66,595 55,263 52,687 58,943 77,547 60,270 Newly established in FY 03/3.(59,770) (44,889) (40,428) (41,712) (64,489) (46,294)
438,143 393,928 378,608 373,442 423,707 394,722
2,677 2,032 1,638 5,449 4,834 5,78030,583 20,030 14,443 11,495 34,087 21,2214,981 4,440 5,700 6,054 5,274 5,2952,378 1,896 1,1763,173 2,752 1,876 1,582 2,102 3,029
721 883 904 310 453 14844,515 32,035 25,740 24,893 46,752 35,474
3.4% 2.6% 1.4% 4.1% 3.3% 4.0%17.4% 14.0% 10.2% 8.5% 20.1% 14.5%3.4% 3.3% 6.7% 7.0% 5.7% 6.0%7.5% 7.0% 5.3%4.8% 5.0% 3.6% 2.7% 2.7% 5.0%
10.2% 8.1% 6.8% 6.7% 11.0% 9.0%
105,980 98,703 118,853 149,415 150,869 150,673152,626 146,832 155,531 168,371 188,937 161,076102,591 100,172 53,562 56,433 65,127 68,01930,288 27,822 20,21149,316 52,183 49,602 54,742 52,611 56,787(31,784) (33,169) (26,875) (35,360) (32,716) (24,454)
409,019 392,545 370,886 393,603 424,829 412,103
average of beginning and end of fiscal year )2.6% 1.9% 1.4% 3.6% 3.2% 3.8%
20.4% 13.2% 8.9% 6.4% 19.5% 13.0%4.9% 5.8% 10.6% 10.0% 7.9% 7.8%8.2% 7.9% 5.8%6.3% 5.4% 3.6% 2.9% 3.8% 4.8%
11.1% 8.4% 6.7% 6.1% 11.2% 8.4%
5,952 6,110 8,038 8,465 8,233 8,63213,161 12,472 14,915 13,753 11,207 9,4494,537 4,731 2,871 3,325 4,092 3,5981,223 1,097 885
590 674 746 808 848 901(222) (240) (250) (70) (153) (208)
25,242 24,846 27,207 26,283 24,228 22,372
7,523 4,899 4,855 7,840 8,772 4,75317,236 10,009 11,278 16,365 21,507 9,6695,936 4,841 3,546 2,977 4,744 3,7432,054 1,755 953
284 267 258 293 372 296(121) - (99) (508) (552) -
32,913 21,773 20,794 26,969 34,844 18,463
15 Financial Data Book MITSUI KINZOKU
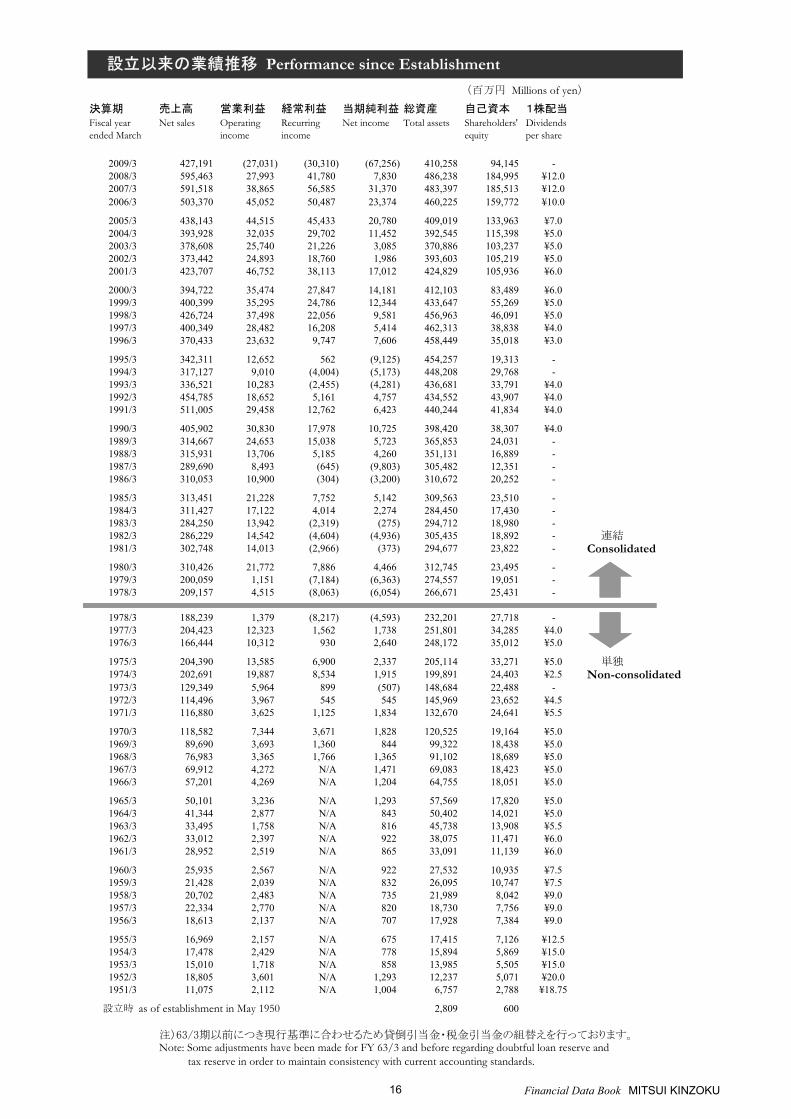
設立以来の業績推移 Performance since Establishment(百万円 Millions of yen)
決算期 売上高 営業利益 経常利益 当期純利益 総資産 自己資本 1株配当Fiscal yearended March
Net sales Operatingincome
Recurringincome
Net income Total assets Shareholders'equity
Dividendsper share
2009/3 427,191 (27,031) (30,310) (67,256) 410,258 94,145 - 2008/3 595,463 27,993 41,780 7,830 486,238 184,995 ¥12.02007/3 591,518 38,865 56,585 31,370 483,397 185,513 ¥12.02006/3 503,370 45,052 50,487 23,374 460,225 159,772 ¥10.0
2005/3 438,143 44,515 45,433 20,780 409,019 133,963 ¥7.02004/3 393,928 32,035 29,702 11,452 392,545 115,398 ¥5.02003/3 378,608 25,740 21,226 3,085 370,886 103,237 ¥5.02002/3 373,442 24,893 18,760 1,986 393,603 105,219 ¥5.02001/3 423,707 46,752 38,113 17,012 424,829 105,936 ¥6.0
2000/3 394,722 35,474 27,847 14,181 412,103 83,489 ¥6.01999/3 400,399 35,295 24,786 12,344 433,647 55,269 ¥5.01998/3 426,724 37,498 22,056 9,581 456,963 46,091 ¥5.01997/3 400,349 28,482 16,208 5,414 462,313 38,838 ¥4.01996/3 370,433 23,632 9,747 7,606 458,449 35,018 ¥3.0
1995/3 342,311 12,652 562 (9,125) 454,257 19,313 - 1994/3 317,127 9,010 (4,004) (5,173) 448,208 29,768 - 1993/3 336,521 10,283 (2,455) (4,281) 436,681 33,791 ¥4.01992/3 454,785 18,652 5,161 4,757 434,552 43,907 ¥4.01991/3 511,005 29,458 12,762 6,423 440,244 41,834 ¥4.0
1990/3 405,902 30,830 17,978 10,725 398,420 38,307 ¥4.01989/3 314,667 24,653 15,038 5,723 365,853 24,031 - 1988/3 315,931 13,706 5,185 4,260 351,131 16,889 - 1987/3 289,690 8,493 (645) (9,803) 305,482 12,351 - 1986/3 310,053 10,900 (304) (3,200) 310,672 20,252 -
1985/3 313,451 21,228 7,752 5,142 309,563 23,510 - 1984/3 311,427 17,122 4,014 2,274 284,450 17,430 - 1983/3 284,250 13,942 (2,319) (275) 294,712 18,980 - 1982/3 286,229 14,542 (4,604) (4,936) 305,435 18,892 - 連結1981/3 302,748 14,013 (2,966) (373) 294,677 23,822 - Consolidated1980/3 310,426 21,772 7,886 4,466 312,745 23,495 - 1979/3 200,059 1,151 (7,184) (6,363) 274,557 19,051 - 1978/3 209,157 4,515 (8,063) (6,054) 266,671 25,431 -
1978/3 188,239 1,379 (8,217) (4,593) 232,201 27,718 - 1977/3 204,423 12,323 1,562 1,738 251,801 34,285 ¥4.01976/3 166,444 10,312 930 2,640 248,172 35,012 ¥5.0
1975/3 204,390 13,585 6,900 2,337 205,114 33,271 ¥5.0 単独1974/3 202,691 19,887 8,534 1,915 199,891 24,403 ¥2.5 Non-consolidated1973/3 129,349 5,964 899 (507) 148,684 22,488 - 1972/3 114,496 3,967 545 545 145,969 23,652 ¥4.51971/3 116,880 3,625 1,125 1,834 132,670 24,641 ¥5.5
1970/3 118,582 7,344 3,671 1,828 120,525 19,164 ¥5.01969/3 89,690 3,693 1,360 844 99,322 18,438 ¥5.01968/3 76,983 3,365 1,766 1,365 91,102 18,689 ¥5.01967/3 69,912 4,272 N/A 1,471 69,083 18,423 ¥5.01966/3 57,201 4,269 N/A 1,204 64,755 18,051 ¥5.0
1965/3 50,101 3,236 N/A 1,293 57,569 17,820 ¥5.01964/3 41,344 2,877 N/A 843 50,402 14,021 ¥5.01963/3 33,495 1,758 N/A 816 45,738 13,908 ¥5.51962/3 33,012 2,397 N/A 922 38,075 11,471 ¥6.01961/3 28,952 2,519 N/A 865 33,091 11,139 ¥6.0
1960/3 25,935 2,567 N/A 922 27,532 10,935 ¥7.51959/3 21,428 2,039 N/A 832 26,095 10,747 ¥7.51958/3 20,702 2,483 N/A 735 21,989 8,042 ¥9.01957/3 22,334 2,770 N/A 820 18,730 7,756 ¥9.01956/3 18,613 2,137 N/A 707 17,928 7,384 ¥9.0
1955/3 16,969 2,157 N/A 675 17,415 7,126 ¥12.51954/3 17,478 2,429 N/A 778 15,894 5,869 ¥15.01953/3 15,010 1,718 N/A 858 13,985 5,505 ¥15.01952/3 18,805 3,601 N/A 1,293 12,237 5,071 ¥20.01951/3 11,075 2,112 N/A 1,004 6,757 2,788 ¥18.75
設立時 as of establishment in May 1950 2,809 600
注)63/3期以前につき現行基準に合わせるため貸倒引当金・税金引当金の組替えを行っております。Note: Some adjustments have been made for FY 63/3 and before regarding doubtful loan reserve and tax reserve in order to maintain consistency with current accounting standards.
16 Financial Data Book MITSUI KINZOKU

経営体制 Directors, Auditors and Executive Officers
■取締役 Board of Directors
代表取締役社長 竹 林 義 彦 CEO( 高経営責任者)、COO( 高業務執行責任者)
PresidentRepresentative Director
TAKEBAYASHI, Yoshihiko Chief Executive OfficerChief Operating Officer
代表取締役 城 後 知 明 専務執行役員
Representative Director JOGO, Tomoharu Senior Managing Executive Officer
取締役 平 野 一 夫 常務執行役員Directors HIRANO, Kazuo
蓮 尾 充 彦 常務執行役員
HASUO, Mitsuhiko
樋 口 修 常務執行役員、CRO( 高危機管理責任者)
HIGUCHI, Osamu
樋 口 徹 常務執行役員、CFO( 高財務責任者)
HIGUCHI, Toru Senior Executive OfficerChief Financial Officer
仙 田 貞 雄 常務執行役員
SENDA, Sadao Senior Executive Officer
宮 村 眞 平 相談役
MIYAMURA, Shimpei Senior Adviser
社外取締役 柴 田 裕 通Outside Director SHIBATA, Hiromichi
■監査役 Corporate Auditors
常勤監査役 髙 井 龍 彦 小 佐 野 明Standing Auditors TAKAI, Tatsuhiko OSANO, Akira
社外監査役 鎌 田 吉 郎 佐 藤 順 哉Outside Auditors KAMATA, Yoshiro SATO, Junya
■上席執行役員 Senior Executive Officers
三 森 繁 CTO( 高技術責任者)
MITSUMORI, Shigeru Chief Technology Officer
上 川 満UEKAWA, Mitsuru
■執行役員 Executive Officers
桜 井 若 葉 黒 田 英 男 福 田 誠 佐 藤 敬SAKURAI, Wakaba KURODA, Hideo FUKUDA, Makoto SATO, Takashi
渡 辺 浩 介 隅 田 洋 藤 井 純 渋 江 隆 雄WATANABE, Kosuke SUMIDA, Hiroshi FUJII, Jun SHIBUE, Takao
坂 井 治 文 住 伸 一 田 中 順一郎 森 田 正 久SAKAI, Harufumi SUMI, Shinichi TANAKA, Junichiro MORITA, Masahisa
中 村 博 道 原 川 誠 一 名 井 肇NAKAMURA, Hiromichi HARAKAWA, Seiichi MYOI, Hajime
2009年6月26日現在
as of June 26, 2009
Senior Executive Officer
Senior Executive OfficerChief Risk Management Officer
Senior Executive Officer
17 Financial Data Book MITSUI KINZOKU
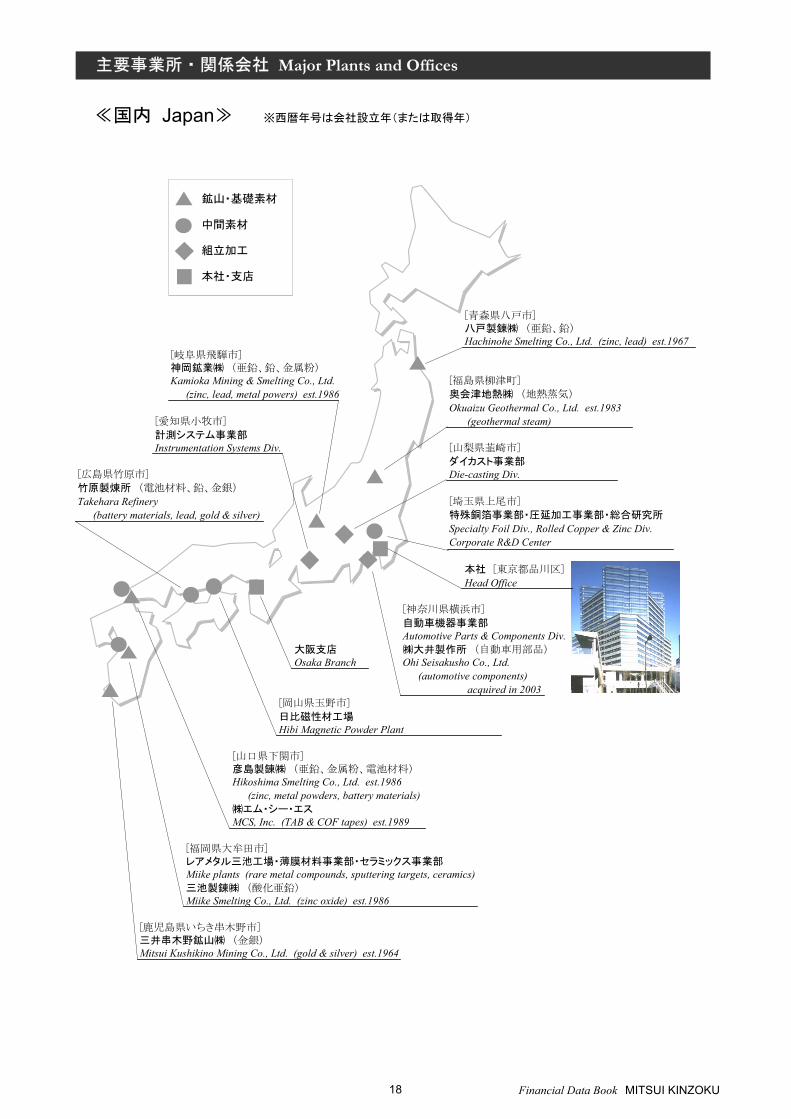
主要事業所・関係会社 Major Plants and Offices
≪国内 Japan≫ ※西暦年号は会社設立年(または取得年)
鉱山・基礎素材
中間素材
組立加工
本社・支店
[青森県八戸市]八戸製錬㈱ (亜鉛、鉛)Hachinohe Smelting Co., Ltd. (zinc, lead) est.1967
[岐阜県飛騨市]神岡鉱業㈱ (亜鉛、鉛、金属粉)Kamioka Mining & Smelting Co., Ltd. [福島県柳津町]
(zinc, lead, metal powers) est.1986 奥会津地熱㈱ (地熱蒸気)
Okuaizu Geothermal Co., Ltd. est.1983[愛知県小牧市] (geothermal steam)計測システム事業部 Instrumentation Systems Div. [山梨県韮崎市]
ダイカスト事業部 [広島県竹原市] Die-casting Div.竹原製煉所 (電池材料、鉛、金銀)
Takehara Refinery [埼玉県上尾市]
(battery materials, lead, gold & silver) 特殊銅箔事業部・圧延加工事業部・総合研究所
Specialty Foil Div., Rolled Copper & Zinc Div.Corporate R&D Center
本社 [東京都品川区]
Head Office
[神奈川県横浜市]
自動車機器事業部Automotive Parts & Components Div.
大阪支店 ㈱大井製作所 (自動車用部品)Osaka Branch Ohi Seisakusho Co., Ltd.
(automotive components) acquired in 2003
[岡山県玉野市]
日比磁性材工場Hibi Magnetic Powder Plant
[山口県下関市]彦島製錬㈱ (亜鉛、金属粉、電池材料)Hikoshima Smelting Co., Ltd. est.1986
(zinc, metal powders, battery materials)㈱エム・シー・エスMCS, Inc. (TAB & COF tapes) est.1989
[福岡県大牟田市]レアメタル三池工場・薄膜材料事業部・セラミックス事業部 Miike plants (rare metal compounds, sputtering targets, ceramics)三池製錬㈱ (酸化亜鉛)Miike Smelting Co., Ltd. (zinc oxide) est.1986
[鹿児島県いちき串木野市]三井串木野鉱山㈱ (金銀)Mitsui Kushikino Mining Co., Ltd. (gold & silver) est.1964
18 Financial Data Book MITSUI KINZOKU

主要事業所・関係会社 Major Plants and Offices
≪海外 Overseas≫
三井華陽汽車配件有限公司 (自動車用部品) 無錫大昌機械工業有限公司 (自動車用部品)
Mitsui-Huayang Automotive Components Co., Ltd. est.1995 Wuxi Da Chong Industry Co., Ltd. acquired in 2003(automotive components)
広東三井汽車配件有限公司 (自動車用部品)
Mitsui Components Guangdong Co., Ltd. est.2002Mitsui Components Europe Ltd. est.1999 (automotive components)
(自動車用部品 automotive components ) 三井銅箔(蘇州)有限公司
Mitsui Copper Foil (Suzhou) Co., Ltd. est.1999株式会社 三井金属韓国 (薄膜材料)Mitsui Kinzoku Korea Co., Ltd. est.2006
(sputtering targets)
三井金属貿易(上海)有限公司Mitsui Kinzoku Trading
(Shanghai) Co., Ltd. est.2005上海三井鑫云貴稀金属循環利用Shanghai Mitsui Xin Yun Precious and
Rare Metal Recycle Co., Ltd. est.2007台湾銅箔股份有限公司Taiwan Copper Foil Co., Ltd. est.1980台湾特格股份有限公司 (薄膜材料)Mitsui Electronic Materials Co., Ltd. est.2000
(sputtering targets)台湾微電股份有限公司 (TAB & COF tapes )
Mitsui Micro Circuits Taiwan Co., Ltd. est.2002
三井銅箔(香港)有限公司Mitsui Copper Foil (Hong Kong) Co., Ltd. est.1998
Mitsui Kinzoku Components 三井銅箔(広東)有限公司
India Pvt. Ltd. est.2005 Mitsui Copper Foil (Guangdong) Co., Ltd. est.2001(自動車用触媒 catalysts ) 三井金属(珠海)環境技術有限公司
Mitsui Kinzoku Catalyst Zhuhai Co., Ltd. est.2006Mitsui Copper Foil (Malaysia) Sdn. Bhd. (銅箔) est.1989
Mitsui Siam Components Co., Ltd. est.1995(自動車用部品 automotive components )
Mitsui Grinding Technology (Thailand) Co., Ltd. est.1994(研削砥石 grinding wheels )
Oak-Mitsui Technologies LLC est.2003
Oak-Mitsui Inc. est.1976GECOM Corp. est.1987 (銅箔 copper foil )
(自動車用部品 automotive components )
Mitsui Mining & Smelting Co., Ltd.,Sucursal del Peru
Compania Minera Santa Luisa S.A.Huanzala Mine est.1964Pallca Mine
Mining & Fundamental Materials (亜鉛・鉛鉱石 zinc & lead ore )
Intermediate Materials
Parts Manufacturing & Assembly
Offices
Taiwan
China
MalaysiaThailand
United Kingdom
U.S.A.
Peru
IndiaKorea
19 Financial Data Book MITSUI KINZOKU

会社と株式の情報 Corporate Data and Shareholders
■前史Prehistory
養老年間 神岡地域で初めて銅山が開坑されたといわれるIt is said that a copper mine was developed in the Kamioka area in the early eighth century.
明治7年 三井組が神岡で鉱山経営を開始In 1874, the Mitsui Clan began mining operations in Kamioka.
明治44年 三井鉱山株式会社設立In 1911, Mitsui Mining Co., Ltd. was established
昭和25年 三井鉱山株式会社の金属部門が神岡鉱業株式会社として分離 (昭和27年に三井金属鉱業株式会社と改称)
In 1950, the metals division of Mitsui Mining Co. was separated as Kamioka Mining & Smelting Co., Ltd. (renamed Mitsui Mining & Smelting Co., Ltd. in 1952)
■設立 昭和25年5月1日Established May 1, 1950
■資本金 42,129百万円Paid-in capital JPY 42,129 million
■従業員数(連結) 11,189名Number of employees
■発行済株式総数 572,966,166株Total number of shares issued
■上場取引所 東京・大阪証券取引所Stock listings Tokyo and Osaka domestic stock exchanges
■株主数 65,596名Number of shareholders
■株主構成Distribution of shareholders
■主要株主Principal shareholders 持株比率
Percentage of shares held日本トラスティ・サービス信託銀行株式会社(信託口4G) 6.79%Japan Trustee Services Bank, Ltd. (Held in trust account 4G)
日本トラスティ・サービス信託銀行株式会社(信託口) 6.30%Japan Trustee Services Bank, Ltd. (Held in trust account)
日本マスタートラスト信託銀行株式会社(信託口) 4.07%The Master Trust Bank of Japan, Ltd. (Held in trust account)
1.42%The Employees' Shareholding Association
メロン バンク エヌエー アズ エージェント フォー イッツ クライアント 1.41%メロン オムニバス ユーエス ペンションMellon Bank, N.A. as Agent for its Client Mellon Omnibus US Pension
三井生命保険株式会社 1.39%Mitsui Life Insurance Company, Limited
日本トラスティ・サービス信託銀行株式会社(信託口4) 1.37%Japan Trustee Services Bank, Ltd. (Held in trust account 4)
アイリスオーヤマ株式会社 1.27%IRISOHYAMA Inc.
オーディ05 オムニバス チャイナ トリーティ 808150 0.95%SSBT OD05 OMNIBUS ACCOUNT CHINA TREATY CLIENTS
0.87%Citibank Hong Kong S/A Fund 115
2009年3月31日現在as of March 31, 2009
シティバンク ホンコン エス/エイ ファンド 115
三井金属社員持株会
23
3431
39
20
3632
39
29
324
530
34
295
428
41
226
229
0%
20%
40%
60%
80%
100%
2005/3 2006/3 2007/3 2008/3 2009/3
金融機関 Japanese financial institutions
証券会社 Japanese securities companies
その他法人 Other Japanese corporations
外国法人等 Non-Japanese investors
個人その他 Individual investors and others
20 Financial Data Book MITSUI KINZOKU

mitui

お問合せ先
三井金属鉱業株式会社 経営企画部広報室
〒141-8584 東京都品川区大崎一丁目11番1号
03-5437-8028 ファックス 03-5437-8029
電子メール [email protected]
http://www.mitsui-kinzoku.co.jp/
Contact :
Investor & Public RelationsMITSUI MINING & SMELTING CO., LTD.
1-11-1 Osaki, Shinagawa-ku, Tokyo 141-8584 JapanPhone 81-3-5437-8028 Facsimile 81-3-5437-8029E-mail [email protected] http://www.mitsui-kinzoku.co.jp/
電 話
ホームページ