2009 Drug Law Changes, June 2012 Update - New … · Drug Law Series Report No. 4 2009 Drug Law...
55
Drug Law Series Report No. 4 2009 Drug Law Changes June 2012 Update Division of Criminal Justice Services Criminal Justice Interim Update Andrew M. Cuomo Michael C. Green Governor Executive Deputy Commissioner The 2009 changes to New York’s drug laws included a requirement to study the impact of the changes (see Section 837, (4) (b-1) of the Executive Law). The Division of Criminal Justice Services (DCJS) coordinates this effort in partnership with other state agencies, including the Office of Court Administration (OCA), the Office of Alcoholism and Substance Abuse Services (OASAS), and the Department of Corrections and Community Supervision (DOCCS). DCJS also works with New York City agencies, district attorneys’ offices, and Alternative to Incarceration (ATI) programs to obtain additional data not available at the State level. This report presents an update of trends in felony drug case processing and participation in treatment diversion programs before and after implementation of the 2009 drug law changes. Office of Justice Research and Performance Theresa Salo, Deputy Commissioner
Transcript of 2009 Drug Law Changes, June 2012 Update - New … · Drug Law Series Report No. 4 2009 Drug Law...
Drug Law Series Report No. 4
2009 Drug Law Changes
June 2012 Update
Division of Criminal Justice Services
Criminal Justice Interim Update Andrew M. Cuomo Michael C. Green
Governor Executive Deputy Commissioner
The 2009 changes to New York’s drug laws included a requirement to study the impact of the changes (see Section 837, (4) (b-1) of the Executive Law). The Division of Criminal Justice Services (DCJS) coordinates this effort in partnership with other state agencies, including the Office of Court Administration (OCA), the Office of Alcoholism and Substance Abuse Services (OASAS), and the Department of Corrections and Community Supervision (DOCCS). DCJS also works with New York City agencies, district attorneys’ offices, and Alternative to Incarceration (ATI) programs to obtain additional data not available at the State level.
This report presents an update of trends in felony drug case processing and participation in treatment diversion programs before and after implementation of the 2009 drug law changes.
Office of Justice Research and Performance Theresa Salo, Deputy Commissioner
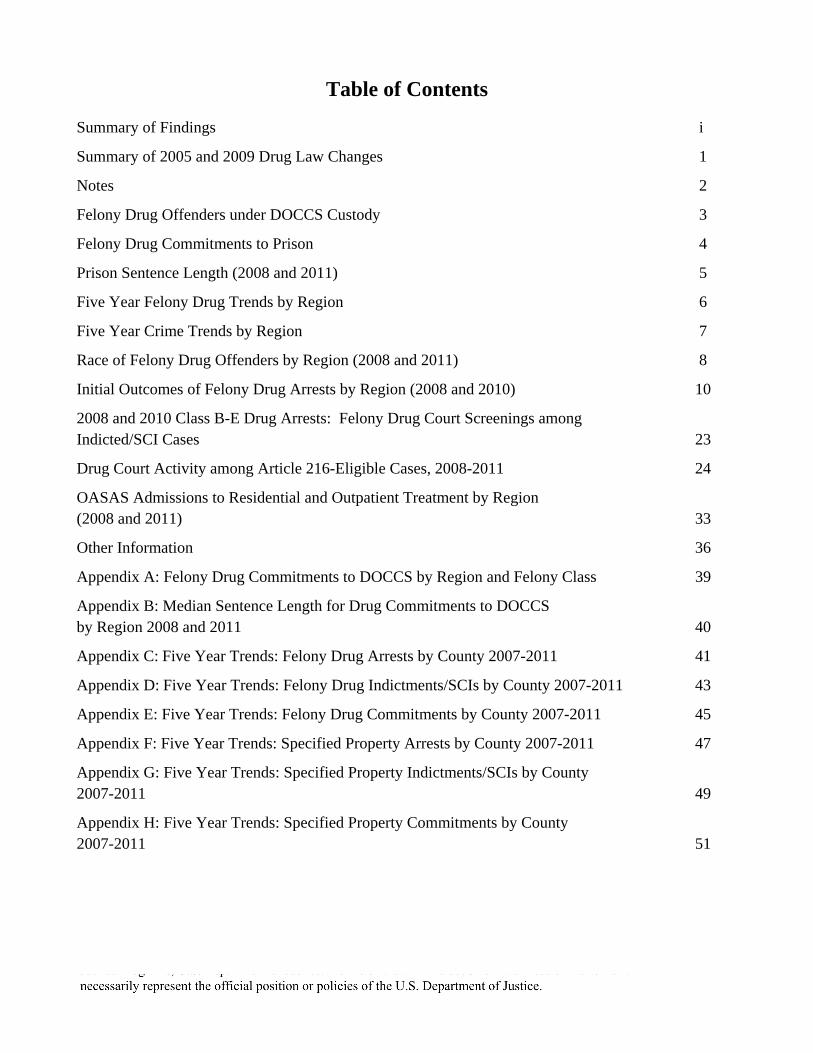
Table of Contents
Summary of Findings i
Summary of 2005 and 2009 Drug Law Changes 1
Notes 2
Felony Drug Offenders under DOCCS Custody 3
Felony Drug Commitments to Prison 4
Prison Sentence Length (2008 and 2011) 5
Five Year Felony Drug Trends by Region 6
Five Year Crime Trends by Region 7
Race of Felony Drug Offenders by Region (2008 and 2011) 8
Initial Outcomes of Felony Drug Arrests by Region (2008 and 2010) 10
2008 and 2010 Class B-E Drug Arrests: Felony Drug Court Screenings among Indicted/SCI Cases 23
Drug Court Activity among Article 216-Eligible Cases, 2008-2011 24
OASAS Admissions to Residential and Outpatient Treatment by Region (2008 and 2011) 33
Other Information 36
Appendix A: Felony Drug Commitments to DOCCS by Region and Felony Class 39
Appendix B: Median Sentence Length for Drug Commitments to DOCCS by Region 2008 and 2011 40
Appendix C: Five Year Trends: Felony Drug Arrests by County 2007-2011 41
Appendix D: Five Year Trends: Felony Drug Indictments/SCIs by County 2007-2011 43
Appendix E: Five Year Trends: Felony Drug Commitments by County 2007-2011 45
Appendix F: Five Year Trends: Specified Property Arrests by County 2007-2011 47
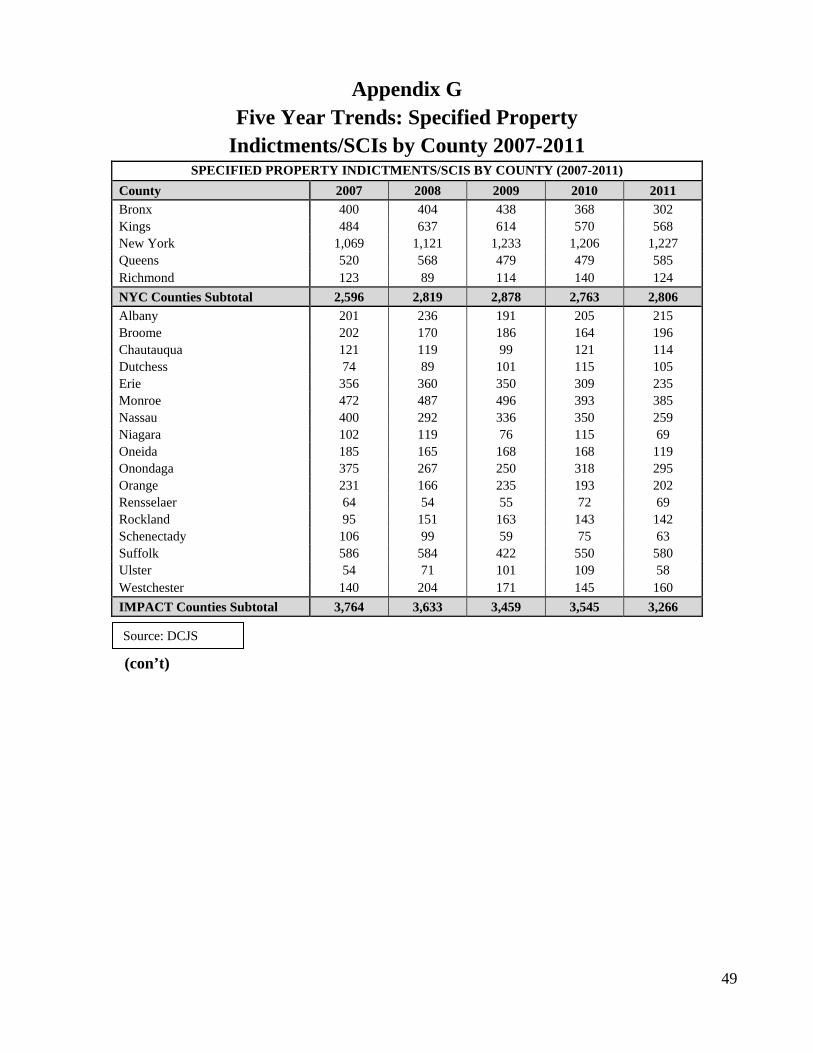
Appendix G: Five Year Trends: Specified Property Indictments/SCIs by County 2007-2011 49
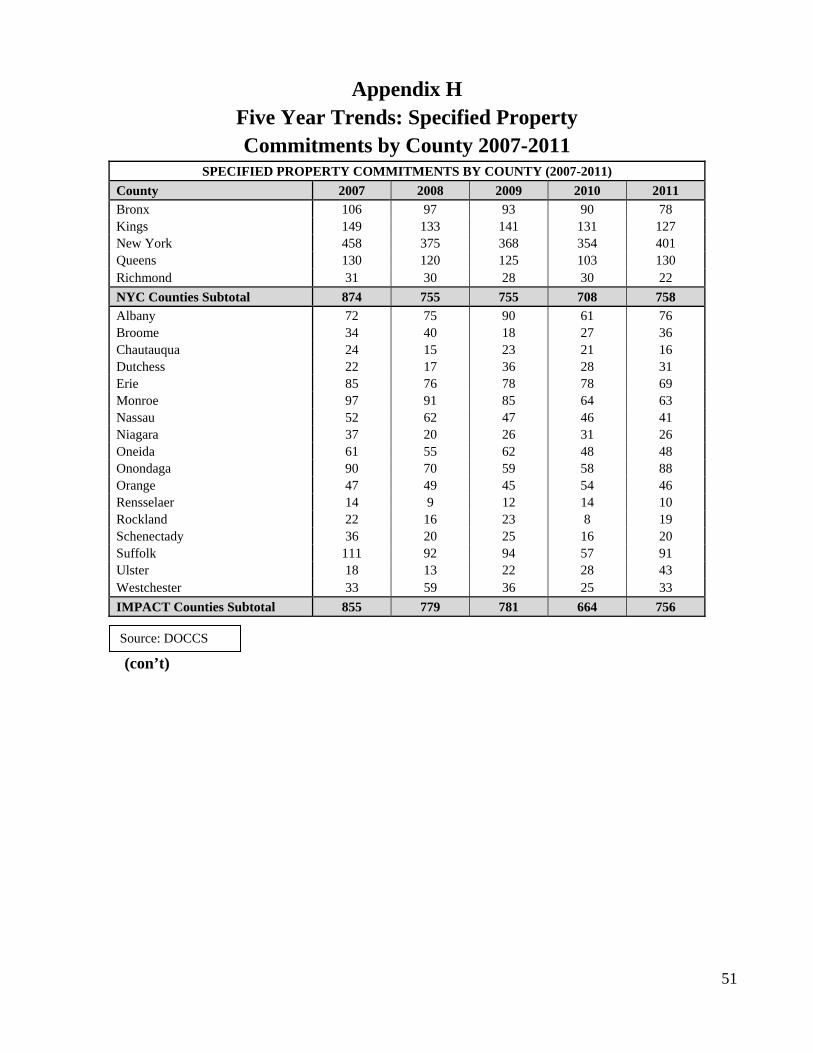
Appendix H: Five Year Trends: Specified Property Commitments by County 2007-2011 51
dcjsrdimond
Text Box
This project was supported by Grant No. 2011-BJ-CX-K042 awarded by the Bureau of Justice Statistics, Office of Justice Programs, U.S. Department of Justice. Points of view in this document are those of the author and do not necessarily represent the official position or policies of the U.S. Department of Justice.
i
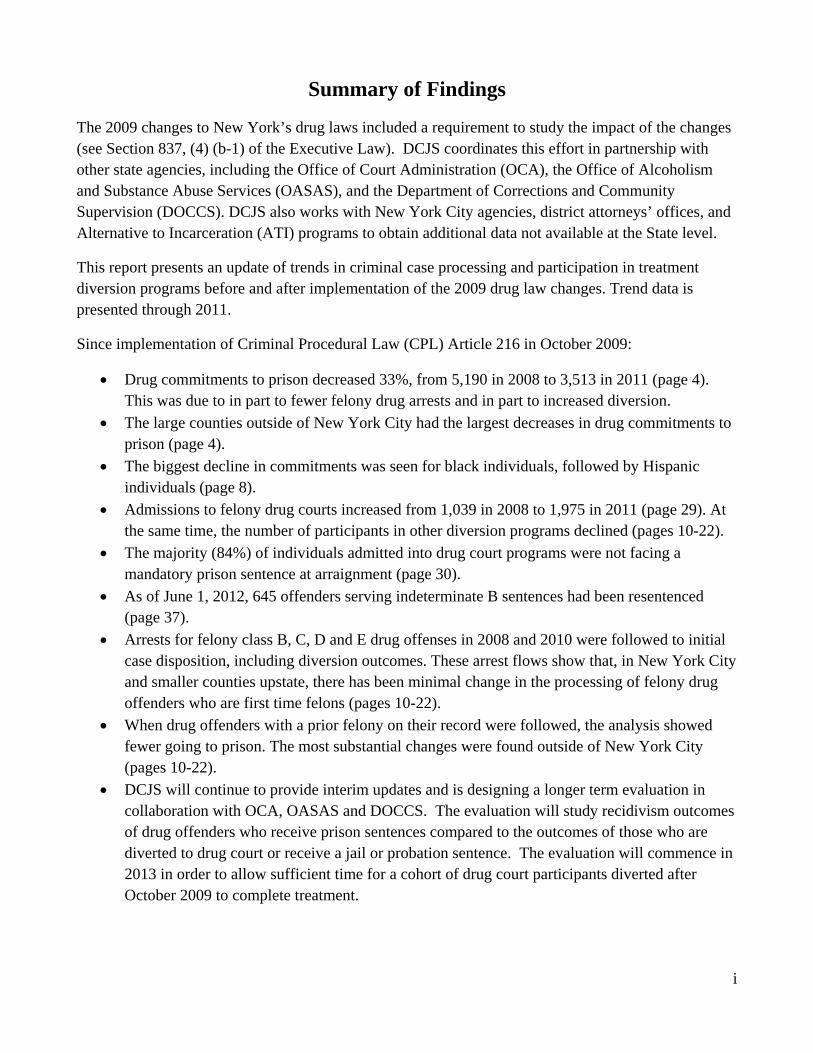
Summary of Findings
The 2009 changes to New York’s drug laws included a requirement to study the impact of the changes (see Section 837, (4) (b-1) of the Executive Law). DCJS coordinates this effort in partnership with other state agencies, including the Office of Court Administration (OCA), the Office of Alcoholism and Substance Abuse Services (OASAS), and the Department of Corrections and Community Supervision (DOCCS). DCJS also works with New York City agencies, district attorneys’ offices, and Alternative to Incarceration (ATI) programs to obtain additional data not available at the State level.
This report presents an update of trends in criminal case processing and participation in treatment diversion programs before and after implementation of the 2009 drug law changes. Trend data is presented through 2011.
Since implementation of Criminal Procedural Law (CPL) Article 216 in October 2009:
• Drug commitments to prison decreased 33%, from 5,190 in 2008 to 3,513 in 2011 (page 4). This was due to in part to fewer felony drug arrests and in part to increased diversion.
• The large counties outside of New York City had the largest decreases in drug commitments to prison (page 4).
• The biggest decline in commitments was seen for black individuals, followed by Hispanic individuals (page 8).
• Admissions to felony drug courts increased from 1,039 in 2008 to 1,975 in 2011 (page 29). At the same time, the number of participants in other diversion programs declined (pages 10-22).
• The majority (84%) of individuals admitted into drug court programs were not facing a mandatory prison sentence at arraignment (page 30).
• As of June 1, 2012, 645 offenders serving indeterminate B sentences had been resentenced (page 37).
• Arrests for felony class B, C, D and E drug offenses in 2008 and 2010 were followed to initial case disposition, including diversion outcomes. These arrest flows show that, in New York City and smaller counties upstate, there has been minimal change in the processing of felony drug offenders who are first time felons (pages 10-22).
• When drug offenders with a prior felony on their record were followed, the analysis showed fewer going to prison. The most substantial changes were found outside of New York City (pages 10-22).
• DCJS will continue to provide interim updates and is designing a longer term evaluation in collaboration with OCA, OASAS and DOCCS. The evaluation will study recidivism outcomes of drug offenders who receive prison sentences compared to the outcomes of those who are diverted to drug court or receive a jail or probation sentence. The evaluation will commence in 2013 in order to allow sufficient time for a cohort of drug court participants diverted after October 2009 to complete treatment.
1
Summary of 2005 and 2009 Drug Law Changes
January 2005 • Determinate sentencing provisions for drug offenses took effect. • Resentencing authorized for A-I felony drug offenders in prison custody who were serving an
indeterminate sentence.
October 2005 • Resentencing authorized for A-II felony drug offenders in prison custody who were serving an
indeterminate sentence.
April 2009 • Eliminated mandatory minimum prison sentences for 1st B drug convictions (can now be
sentenced to local jail time or probation). • Reduced minimum prison sentence for 2nd B drug convictions from 3½ years to 2 years. • Eliminated mandatory minimum prison sentences for 2nd C, D, and E drug convictions (jail or
probation now an option). • Expanded eligibility for Shock participation: age limit increased to 49; B 2nd drug offenders
now eligible; “aging in” authorized – inmates in general confinement facilities otherwise eligible for Shock can now be approved for Shock when they are within three years of parole eligibility (for indeterminately sentenced inmates) or conditional release (for those who are determinately sentenced).
• Expanded eligibility to Willard Drug Treatment Campus for those convicted of 1st felony B drug offenses, 2nd felony C drug offenses, and Burglary 3rd.
• Division of Parole authorized to discharge nonviolent drug offenders prior to their maximum expiration date.
June 2009 • Conditional sealing (CPL 160.58) provisions took effect: Upon successful completion of a
judicial diversion program, the court may conditionally seal the instant offense and up to three prior misdemeanors. If the defendant is re-arrested, the records are unsealed.
October 2009 • Judicial diversion statute took effect with B, C, D, and E drug offenders and specified property
offenders eligible. • Resentencing authorized for indeterminately sentenced B felony drug offenders in State
DOCCS custody.
November 2009 • New crimes in effect: B Felony Sale to a Child, A-I Operating as a Major Trafficker.

2
Notes County Categories
• Information is often presented separately for New York City, Operation IMPACT and Other Counties due to significant differences between these categories.
• New York City Counties include Bronx, Kings, New York, Queens and Richmond. • Operation IMPACT Counties are 17 counties outside of NYC that account for 80% of index crime
reported: Albany, Broome, Chautauqua, Dutchess, Erie, Monroe, Nassau, Niagara, Oneida, Onondaga, Orange, Rensselaer, Rockland, Schenectady, Suffolk, Ulster and Westchester.
• Other Counties are: Allegany, Cattaraugus, Cayuga, Chemung, Chenango, Clinton, Columbia, Cortland, Delaware, Essex, Franklin, Fulton, Genesee, Greene, Hamilton, Herkimer, Jefferson, Lewis, Livingston, Madison, Montgomery, Ontario, Orleans, Oswego, Otsego, Putnam, St. Lawrence, Saratoga, Schoharie, Schuyler, Seneca, Steuben, Sullivan, Tioga, Tompkins, Warren, Washington, Wayne, Wyoming and Yates.
Plans for Outcome Evaluation • DCJS is collaborating with the Office of Court Administration (OCA), the Office of Alcoholism
and Substance Abuse Services (OASAS) and the Department of Corrections and Community Supervision (DOCCS) on a research design that will include assessments of treatment and criminal justice outcomes.
• Analyses show that a sufficient number of drug court cases can be linked to an OASAS database using the TRS-49 Consent Form to include OASAS treatment data in the research.
• Timeline: The follow-up period will begin in 2013 to allow sufficient time for drug court participants to complete treatment, which usually lasts for at least 18 months.
Race and Ethnicity • The information on race (white, black, other) and ethnicity (Hispanic vs. non-Hispanic) is
collected at DOCCS. This analysis presents a combination of race and ethnicity. Any individual with an ethnicity of Hispanic, regardless of reported race, is classified as Hispanic.
Location of Additional Information • The following documents can be accessed at http://www.criminaljustice.ny.gov/drug-law-
reform/index.html – Felony Drug Court Activity Among Offenders Eligible Under 2009 Drug Law Changes,
2008-2010 – Felony Drug Arrest, Indictment and Commitment Trends, 1973-2008 – Profile of Felony Drug Offenders Committed to New York State Prison 2008 – Preliminary Impact of 2009 Drug Law Reform October 2009-September 2010 – PowerPoints of updates to stakeholders in February 2010, June 2010, and June 2011 – Monthly Resentencing Summary
• DOCCS includes many informative reports on its website. Reports on the following topics can be accessed at http://www.doccs.ny.gov/Research/Research.html
– Shock Incarceration Program – Alcohol and Substance Abuse Treatment – Recidivism Research – Statistical Reports on Offender Population

3
Felony Drug Offenders under DOCCS Custody
Drug Offenders In Prison Peaked in 1996, Overall Prison Population Peaked in 1999
1Source: DOCCS
0
10,000
20,000
30,000
40,000
50,000
60,000
70,000
80,000
1973
1974
1975
1976
1977
1978
1979
1980
1981
1982
1983
1984
1985
1986
1987
1988
1989
1990
1991
1992
1993
1994
1995
1996
1997
1998
1999
2000
2001
2002
2003
2004
2005
2006
2007
2008
2009
2010
2011
Drug Offenders and Total Offenders Under Custody in DOCCS, 1973-2011
Drug Offenders Under Custody Non-Drug
Drug Offenders in Prison Declined 68% Since Peak in 1996; Down (-37%) since 2008
2
23,51122,266
15,48614,249
11,93610,319
8,6617,509
0
5,000
10,000
15,000
20,000
25,000
1996 1999 2004 2005 2008 2009 2010 2011
Drug Offenders Under DOCCS Custody(Year End)
Source: DOCCS
• The number of drug offenders in prison peaked in 1996 at 23,511, contributing to an overall prison population that topped 70,000 for several years.
• The black line approximates the effective date of the 2005 drug law changes. The red line marks the effective date of the 2009 drug law changes.
• By the end of 2011, the number of drug offenders in prison had decreased 68% from its peak of 23,511 in 1996 to 7,509.
• There were 4,427 fewer drug offenders in prison at year end 2011 than there were in 2008, the year before the 2009 drug law changes. This is a decline of 37%.
4
Felony Drug Commitments to Prison
Felony Drug Commitments to DOCCS Peaked in 1992; down (-33%) since 2008
3
11,225
9,841
5,667 5,8395,190
4,3193,755 3,513
0
2,000
4,000
6,000
8,000
10,000
12,000
1992 1996 2004 2005 2008 2009 2010 2011
Felony Drug Commitments to DOCCS
Source: DOCCS
2008-2011 Drug Commitments to Prison
4Source: DOCCS
NYC IMPACT Other Counties 2008 2,484 2,143 5632011 1,813 1,178 522
-27%
-45%
-7%
0
500
1,000
1,500
2,000
2,500
2008 and 2011 Drug Commitments to Prison
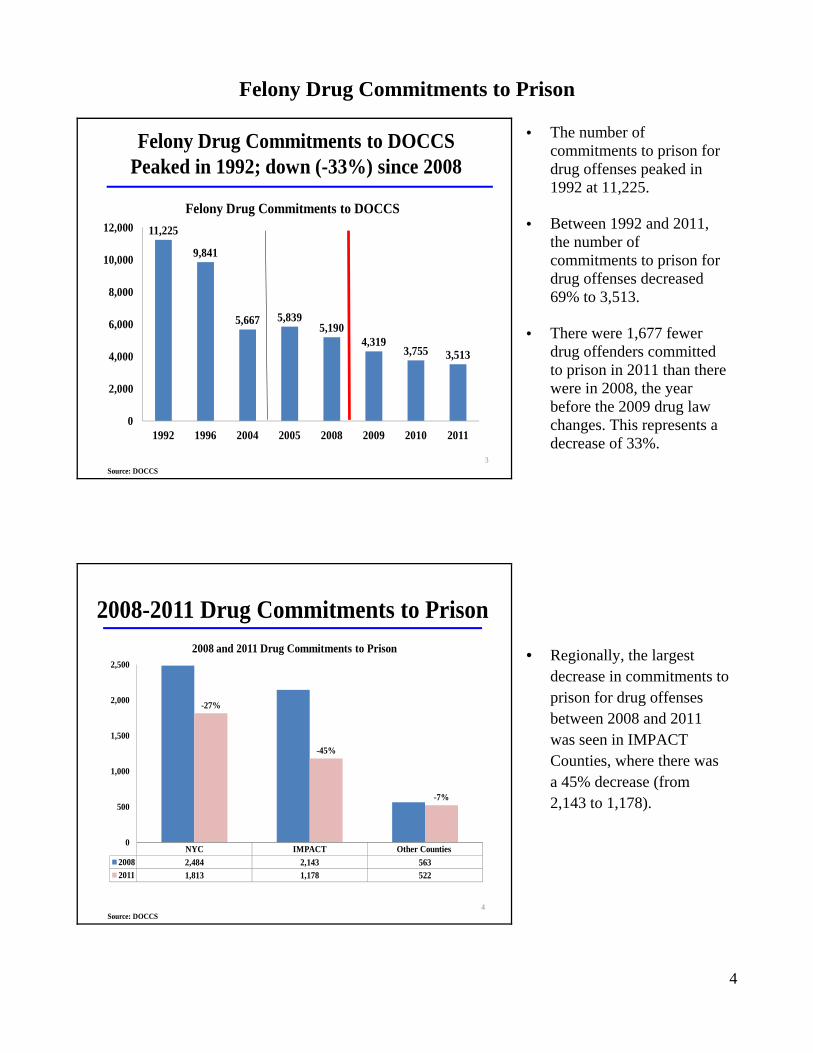
• The number of commitments to prison for drug offenses peaked in 1992 at 11,225.
• Between 1992 and 2011, the number of commitments to prison for drug offenses decreased 69% to 3,513.
• There were 1,677 fewer drug offenders committed to prison in 2011 than there were in 2008, the year before the 2009 drug law changes. This represents a decrease of 33%.
• Regionally, the largest decrease in commitments to prison for drug offenses between 2008 and 2011 was seen in IMPACT Counties, where there was a 45% decrease (from 2,143 to 1,178).
5
Prison Sentence Length (2008 and 2011)
1st B Felony Prison Sentences
75Source: DOCCS
1st Felony B Drug Prison Sentences
Sentence 2008 2011 % chg
Minimum Sentence 419 177 -58%
Above Minimum 682 637 -7%
Total 1,101 814 -26%
Median Sentence Length for 1st Felony B-E Drug Commitments to DOCCS
1Source: DOCCS
18
24 2424 24 24
0
5
10
15
20
25
30
NYC IMPACT Other Counties
Sent
ence
Len
gth
in M
onth
s
Median Sentence Length for 1st Felony B-E Drug Offenders Sentenced to Prison
2008 2011
Median Sentence Length for 2nd Felony B-E Drug Commitments to DOCCS
2Source: DOCCS
30
36
42
30
36
42
0
5
10
15
20
25
30
35
40
45
NYC IMPACT Other Counties
Sent
ence
Len
gth
in M
onth
s
Median Sentence Length for 2nd Felony B-E Drug Offenders Sentenced to Prison
2008 2011
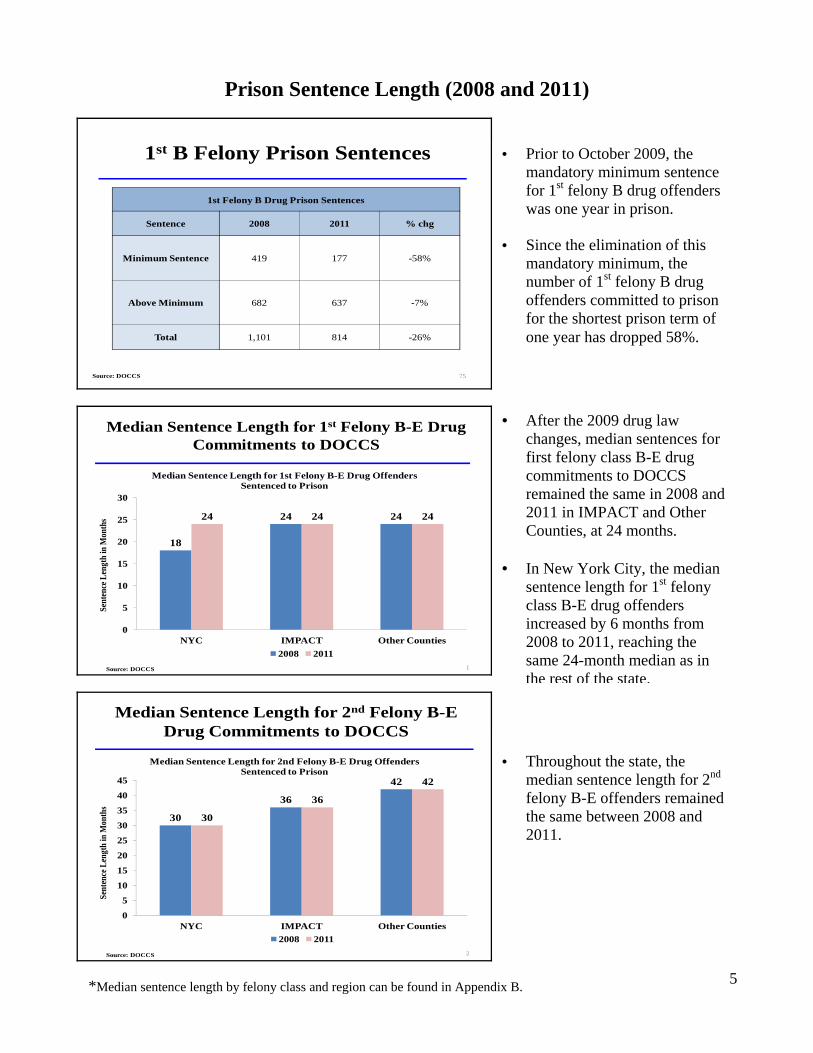
• After the 2009 drug law changes, median sentences for first felony class B-E drug commitments to DOCCS remained the same in 2008 and 2011 in IMPACT and Other Counties, at 24 months.
• In New York City, the median sentence length for 1st felony class B-E drug offenders increased by 6 months from 2008 to 2011, reaching the same 24-month median as in the rest of the state.
• Throughout the state, the
median sentence length for 2nd felony B-E offenders remained the same between 2008 and 2011.
• Prior to October 2009, the mandatory minimum sentence for 1st felony B drug offenders was one year in prison.
• Since the elimination of this mandatory minimum, the number of 1st felony B drug offenders committed to prison for the shortest prison term of one year has dropped 58%.
*Median sentence length by felony class and region can be found in Appendix B.
6
Five Year Felony Drug Trends by Region
New York City Felony Drug Trends
9Source: DCJS, DOCCS
2007 2008 2009 2010 2011Arrests 31,351 28,892 26,047 22,878 21,284Indictments/SCIs 9,103 7,828 7,634 6,709 5,744Commitments 3,241 2,484 2,339 2,019 1,813
31,351
21,284
9,103
5,7443,241
1,8130
5,000
10,000
15,000
20,000
25,000
30,000
35,0005 Year Felony Drug Trends: NYC
IMPACT Counties Felony Drug Trends
10Source: DCJS, DOCCS
2007 2008 2009 2010 2011Arrests 10,804 9,404 8,646 8,607 7,924Indictments/SCIs 5,858 5,301 4,335 4,246 3,729Commitments 2,302 2,143 1,437 1,205 1,178
10,804
7,924
5,858
3,729
2,3021,178
0
2,000
4,000
6,000
8,000
10,000
12,0005 Year Felony Drug Trends: IMPACT
Other Counties Felony Drug Trends
11Source: DCJS, DOCCS
2007 2008 2009 2010 2011Arrests 2,053 2,065 2,226 2,139 2,213Indictments/SCIs 1,434 1,348 1,514 1,467 1,397Commitments 605 563 543 531 522
2,0532,213
1,434 1,397
605522
0
500
1,000
1,500
2,000
2,5005 Year Felony Drug Trends: Other Counties
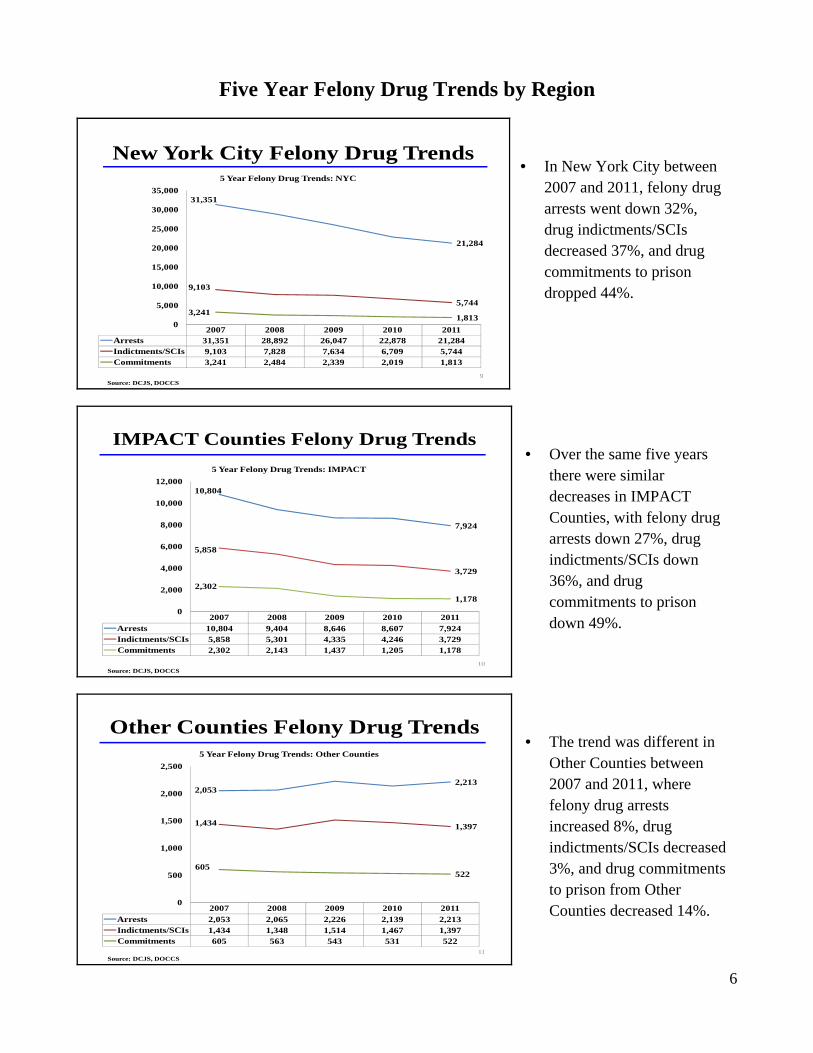
• In New York City between 2007 and 2011, felony drug arrests went down 32%, drug indictments/SCIs decreased 37%, and drug commitments to prison dropped 44%.
• Over the same five years there were similar decreases in IMPACT Counties, with felony drug arrests down 27%, drug indictments/SCIs down 36%, and drug commitments to prison down 49%.
• The trend was different in Other Counties between 2007 and 2011, where felony drug arrests increased 8%, drug indictments/SCIs decreased 3%, and drug commitments to prison from Other Counties decreased 14%.
7
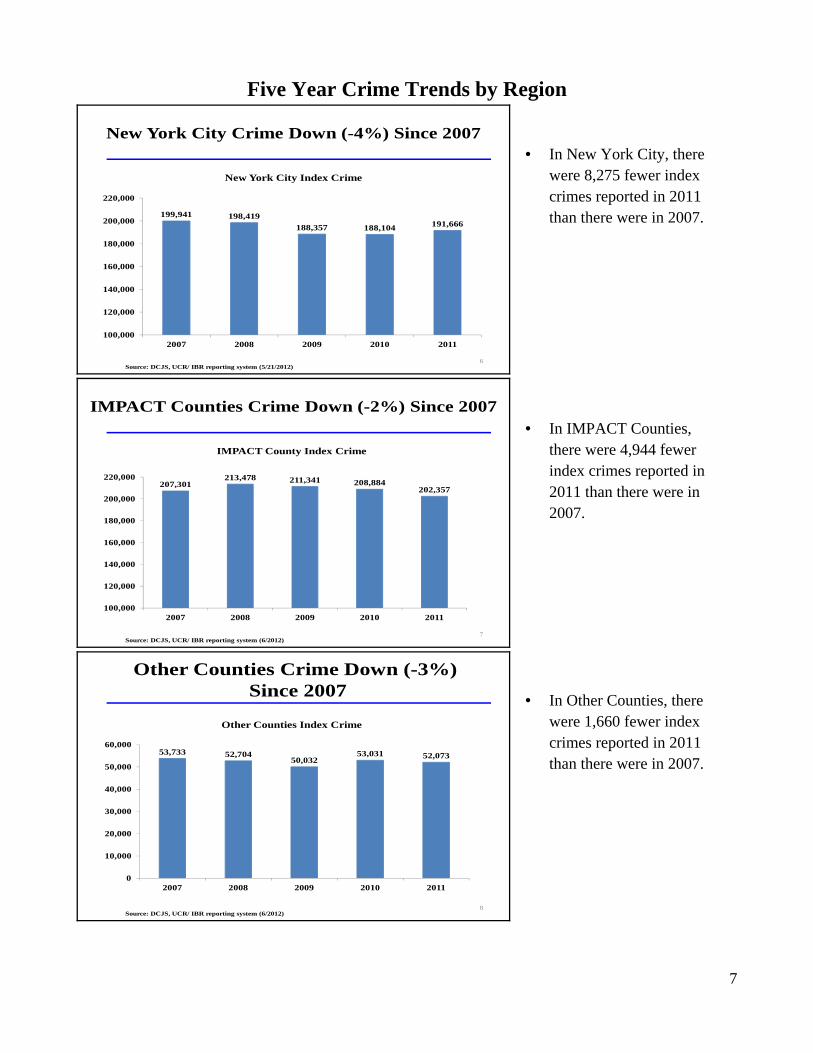
Five Year Crime Trends by Region
Source: DCJS, UCR/ IBR reporting system (5/21/2012)
New York City Crime Down (-4%) Since 2007
6
199,941 198,419188,357 188,104 191,666
100,000
120,000
140,000
160,000
180,000
200,000
220,000
2007 2008 2009 2010 2011
New York City Index Crime
Source: DCJS, UCR/ IBR reporting system (6/2012)
IMPACT Counties Crime Down (-2%) Since 2007
7
207,301213,478 211,341 208,884
202,357
100,000
120,000
140,000
160,000
180,000
200,000
220,000
2007 2008 2009 2010 2011
IMPACT County Index Crime
Other Counties Crime Down (-3%)
Since 2007
Source: DCJS, UCR/ IBR reporting system (6/2012)8
53,733 52,70450,032
53,031 52,073
0
10,000
20,000
30,000
40,000
50,000
60,000
2007 2008 2009 2010 2011
Other Counties Index Crime
• In New York City, there were 8,275 fewer index crimes reported in 2011 than there were in 2007.
• In IMPACT Counties, there were 4,944 fewer index crimes reported in 2011 than there were in 2007.
• In Other Counties, there were 1,660 fewer index crimes reported in 2011 than there were in 2007.
8
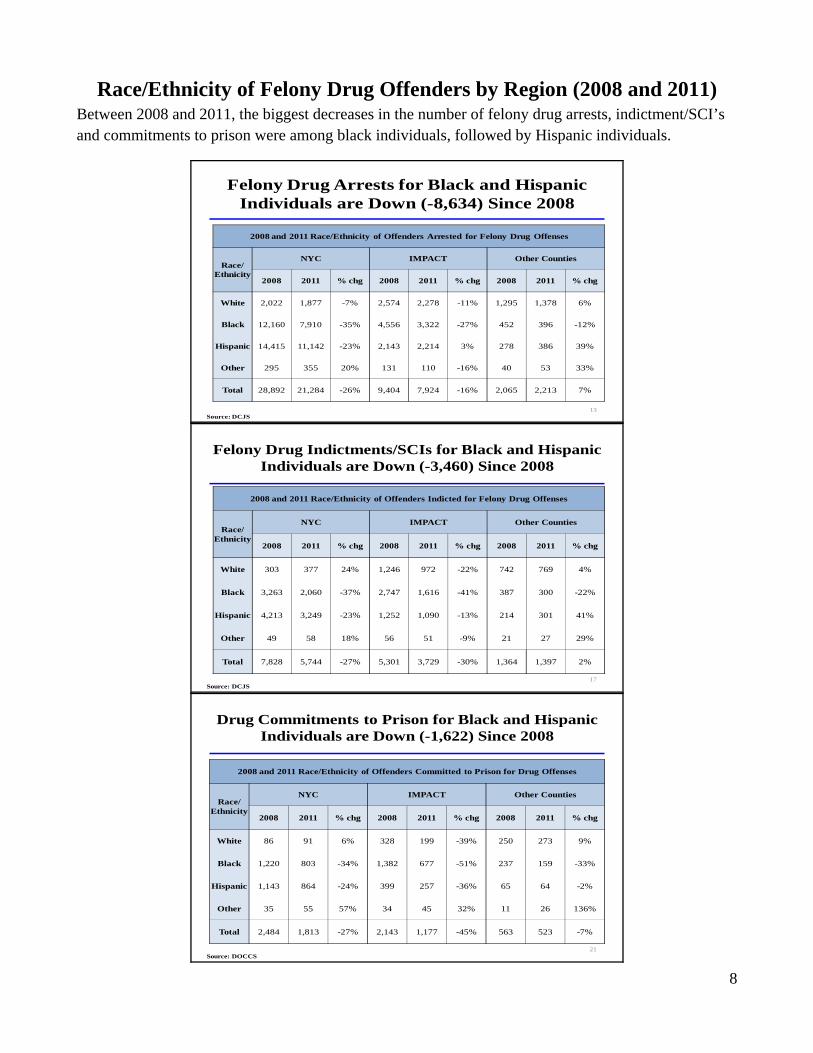
Race/Ethnicity of Felony Drug Offenders by Region (2008 and 2011) Between 2008 and 2011, the biggest decreases in the number of felony drug arrests, indictment/SCI’s and commitments to prison were among black individuals, followed by Hispanic individuals.
Felony Drug Arrests for Black and Hispanic Individuals are Down (-8,634) Since 2008
13Source: DCJS
2008 and 2011 Race/Ethnicity of Offenders Arrested for Felony Drug Offenses
Race/ Ethnicity
NYC IMPACT Other Counties
2008 2011 % chg 2008 2011 % chg 2008 2011 % chg
White 2,022 1,877 -7% 2,574 2,278 -11% 1,295 1,378 6%
Black 12,160 7,910 -35% 4,556 3,322 -27% 452 396 -12%
Hispanic 14,415 11,142 -23% 2,143 2,214 3% 278 386 39%
Other 295 355 20% 131 110 -16% 40 53 33%
Total 28,892 21,284 -26% 9,404 7,924 -16% 2,065 2,213 7%
Felony Drug Indictments/SCIs for Black and Hispanic Individuals are Down (-3,460) Since 2008
17Source: DCJS
2008 and 2011 Race/Ethnicity of Offenders Indicted for Felony Drug Offenses
Race/ Ethnicity
NYC IMPACT Other Counties
2008 2011 % chg 2008 2011 % chg 2008 2011 % chg
White 303 377 24% 1,246 972 -22% 742 769 4%
Black 3,263 2,060 -37% 2,747 1,616 -41% 387 300 -22%
Hispanic 4,213 3,249 -23% 1,252 1,090 -13% 214 301 41%
Other 49 58 18% 56 51 -9% 21 27 29%
Total 7,828 5,744 -27% 5,301 3,729 -30% 1,364 1,397 2%
Drug Commitments to Prison for Black and Hispanic Individuals are Down (-1,622) Since 2008
21Source: DOCCS
2008 and 2011 Race/Ethnicity of Offenders Committed to Prison for Drug Offenses
Race/ Ethnicity
NYC IMPACT Other Counties
2008 2011 % chg 2008 2011 % chg 2008 2011 % chg
White 86 91 6% 328 199 -39% 250 273 9%
Black 1,220 803 -34% 1,382 677 -51% 237 159 -33%
Hispanic 1,143 864 -24% 399 257 -36% 65 64 -2%
Other 35 55 57% 34 45 32% 11 26 136%
Total 2,484 1,813 -27% 2,143 1,177 -45% 563 523 -7%
9
NYC Drug Commitments by Race/Ethnicity 2008 and 2011
White4%
Black49%
Hispanic 46%
Other1%
2008 NYC Drug Commitments by Race/Ethnicity
White5%
Black44%
Hispanic48%
Other3%
2011 NYC Drug Commitments by Race/Ethnicity
22
N=2,484 N=1,813
Source: DOCCS
IMPACT Drug Commitments by Race/Ethnicity 2008 and 2011
White15%
Black64%
Hispanic19%
Other2%
2008 IMPACT Drug Commitments by Race/Ethnicity
White17%
Black57%
Hispanic22%
Other4%
2011 IMPACT Drug Commitments by Race/Ethnicity
23
N=1,953 N=1,079
Source: DOCCS
Other Counties Drug Commitments by Race/Ethnicity 2008 and 2011
White37%
Black49%
Hispanic12%
Other2%
2008 Other Counties Drug Commitments by Race/Ethnicity
White45%
Black37%
Hispanic14%
Other4%
2011 Other Counties Drug Commitments by Race/Ethnicity
24
N=753 N=661
Source: DOCCS
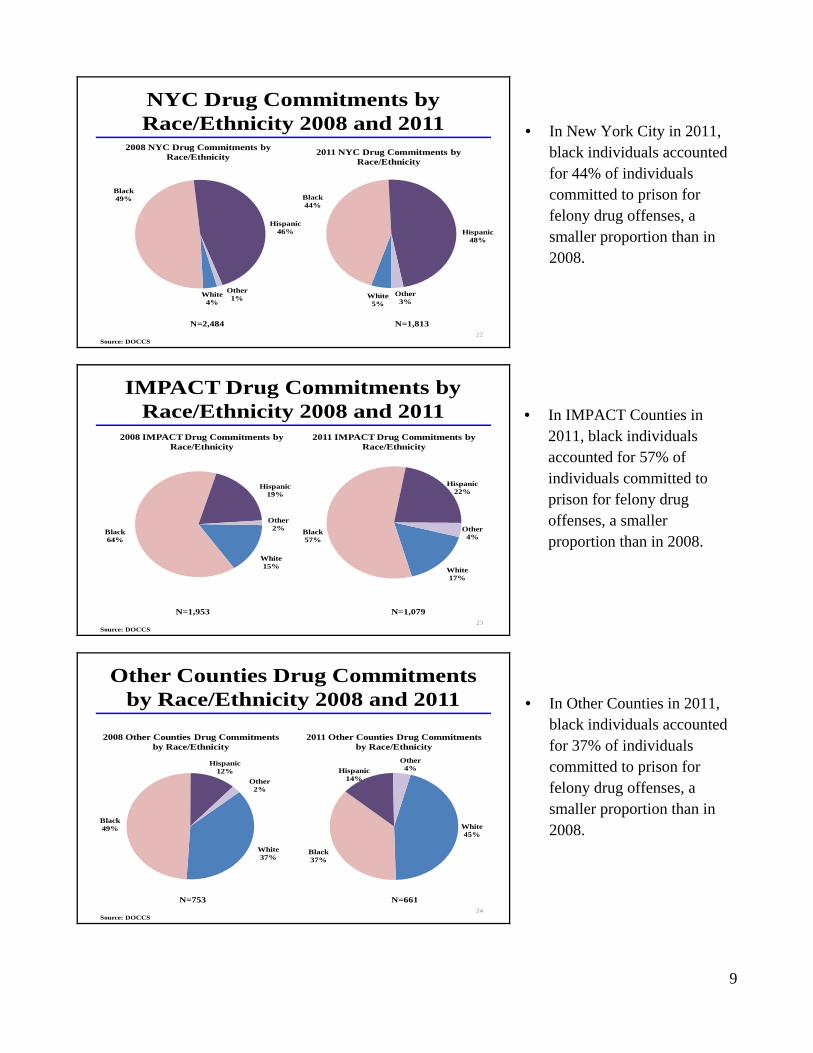
• In New York City in 2011, black individuals accounted for 44% of individuals committed to prison for felony drug offenses, a smaller proportion than in 2008.
• In IMPACT Counties in 2011, black individuals accounted for 57% of individuals committed to prison for felony drug offenses, a smaller proportion than in 2008.
• In Other Counties in 2011, black individuals accounted for 37% of individuals committed to prison for felony drug offenses, a smaller proportion than in 2008.
10
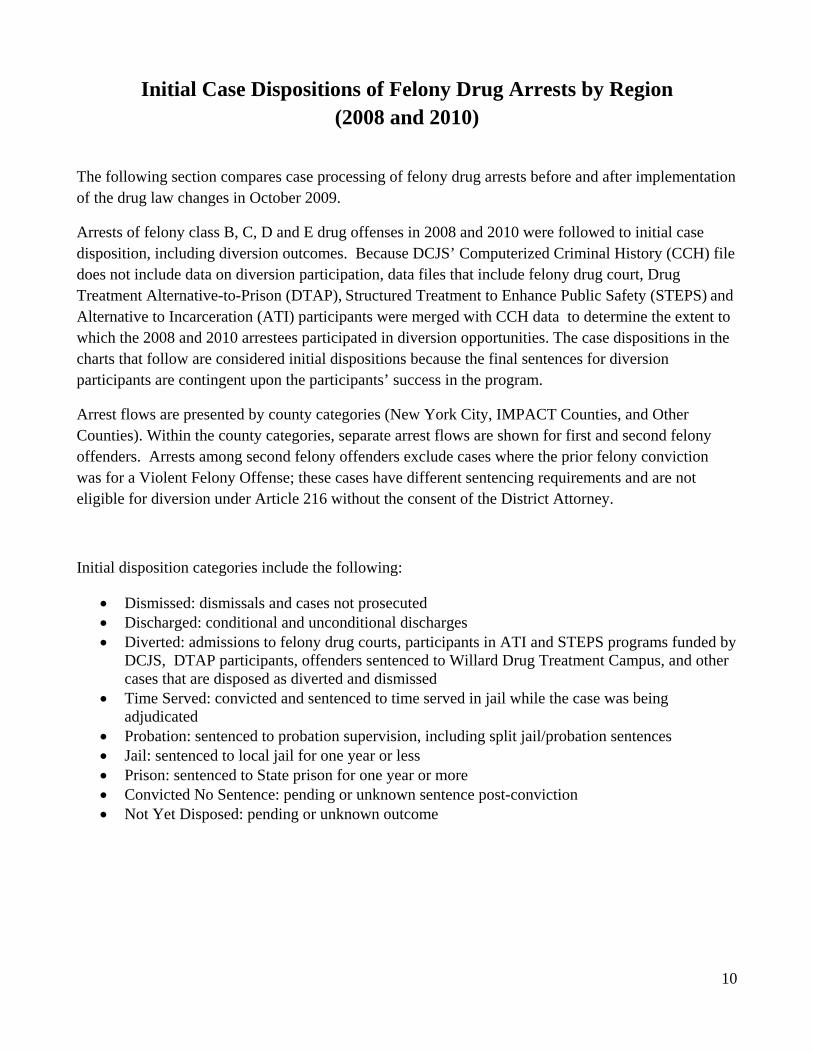
Initial Case Dispositions of Felony Drug Arrests by Region (2008 and 2010)
The following section compares case processing of felony drug arrests before and after implementation of the drug law changes in October 2009.
Arrests of felony class B, C, D and E drug offenses in 2008 and 2010 were followed to initial case disposition, including diversion outcomes. Because DCJS’ Computerized Criminal History (CCH) file does not include data on diversion participation, data files that include felony drug court, Drug Treatment Alternative-to-Prison (DTAP), Structured Treatment to Enhance Public Safety (STEPS) and Alternative to Incarceration (ATI) participants were merged with CCH data to determine the extent to which the 2008 and 2010 arrestees participated in diversion opportunities. The case dispositions in the charts that follow are considered initial dispositions because the final sentences for diversion participants are contingent upon the participants’ success in the program.
Arrest flows are presented by county categories (New York City, IMPACT Counties, and Other Counties). Within the county categories, separate arrest flows are shown for first and second felony offenders. Arrests among second felony offenders exclude cases where the prior felony conviction was for a Violent Felony Offense; these cases have different sentencing requirements and are not eligible for diversion under Article 216 without the consent of the District Attorney.
Initial disposition categories include the following:
• Dismissed: dismissals and cases not prosecuted • Discharged: conditional and unconditional discharges • Diverted: admissions to felony drug courts, participants in ATI and STEPS programs funded by
DCJS, DTAP participants, offenders sentenced to Willard Drug Treatment Campus, and other cases that are disposed as diverted and dismissed
• Time Served: convicted and sentenced to time served in jail while the case was being adjudicated
• Probation: sentenced to probation supervision, including split jail/probation sentences • Jail: sentenced to local jail for one year or less • Prison: sentenced to State prison for one year or more • Convicted No Sentence: pending or unknown sentence post-conviction • Not Yet Disposed: pending or unknown outcome
11
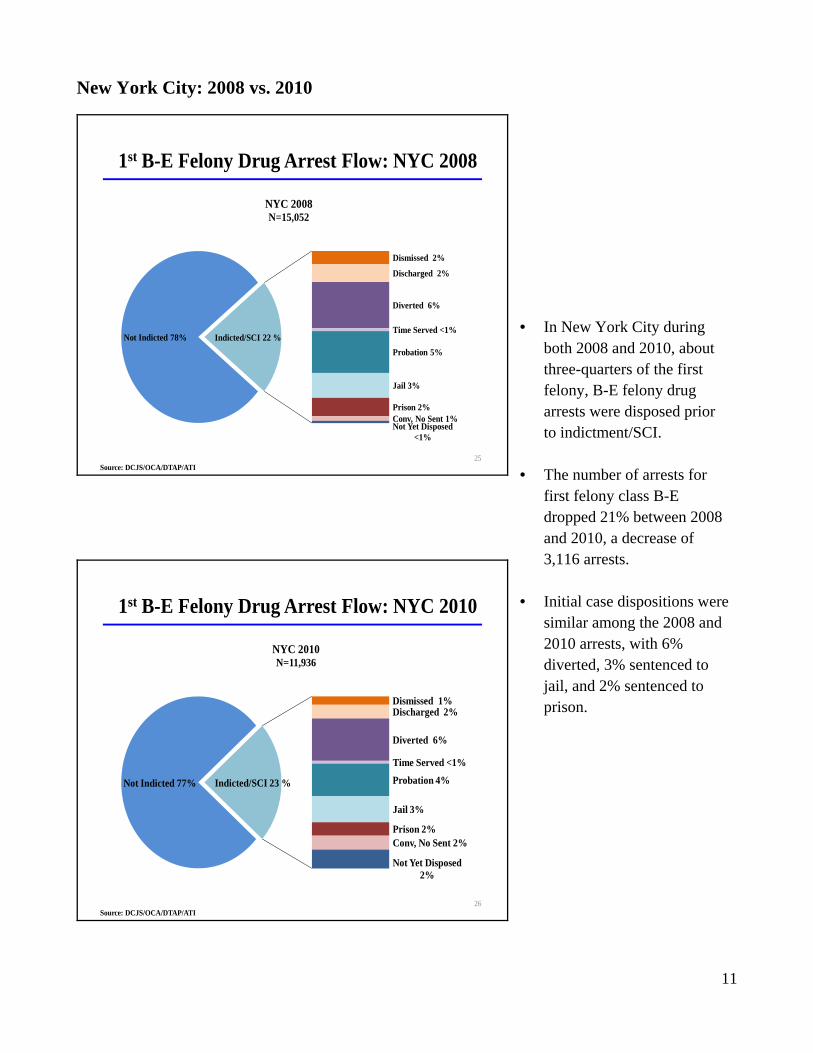
New York City: 2008 vs. 2010
1st B-E Felony Drug Arrest Flow: NYC 2008
25
Not Indicted 78%
Dismissed 2%
Discharged 2%
Diverted 6%
Time Served <1%
Probation 5%
Jail 3%
Prison 2%Conv, No Sent 1%Not Yet Disposed
<1%
Indicted/SCI 22 %
NYC 2008 N=15,052
Source: DCJS/OCA/DTAP/ATI
1st B-E Felony Drug Arrest Flow: NYC 2010
26
Not Indicted 77%
Dismissed 1%Discharged 2%
Diverted 6%
Time Served <1%
Probation 4%
Jail 3%
Prison 2%Conv, No Sent 2%
Not Yet Disposed 2%
Indicted/SCI 23 %
NYC 2010 N=11,936
Source: DCJS/OCA/DTAP/ATI
• In New York City during both 2008 and 2010, about three-quarters of the first felony, B-E felony drug arrests were disposed prior to indictment/SCI.
• The number of arrests for first felony class B-E dropped 21% between 2008 and 2010, a decrease of 3,116 arrests.
• Initial case dispositions were similar among the 2008 and 2010 arrests, with 6% diverted, 3% sentenced to jail, and 2% sentenced to prison.
12
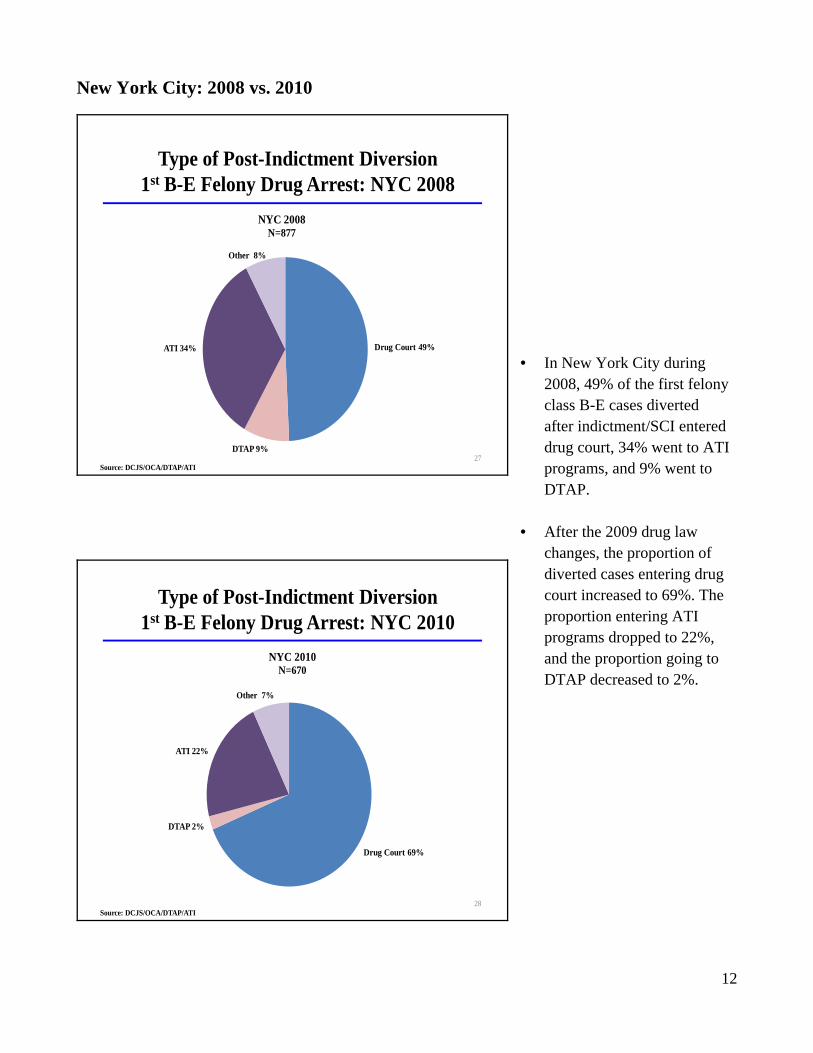
New York City: 2008 vs. 2010
Type of Post-Indictment Diversion 1st B-E Felony Drug Arrest: NYC 2008
27
Drug Court 49%
DTAP 9%
ATI 34%
Other 8%
NYC 2008 N=877
Source: DCJS/OCA/DTAP/ATI
Type of Post-Indictment Diversion 1st B-E Felony Drug Arrest: NYC 2010
28
Drug Court 69%
DTAP 2%
ATI 22%
Other 7%
NYC 2010 N=670
Source: DCJS/OCA/DTAP/ATI
• In New York City during 2008, 49% of the first felony class B-E cases diverted after indictment/SCI entered drug court, 34% went to ATI programs, and 9% went to DTAP.
• After the 2009 drug law changes, the proportion of diverted cases entering drug court increased to 69%. The proportion entering ATI programs dropped to 22%, and the proportion going to DTAP decreased to 2%.
13
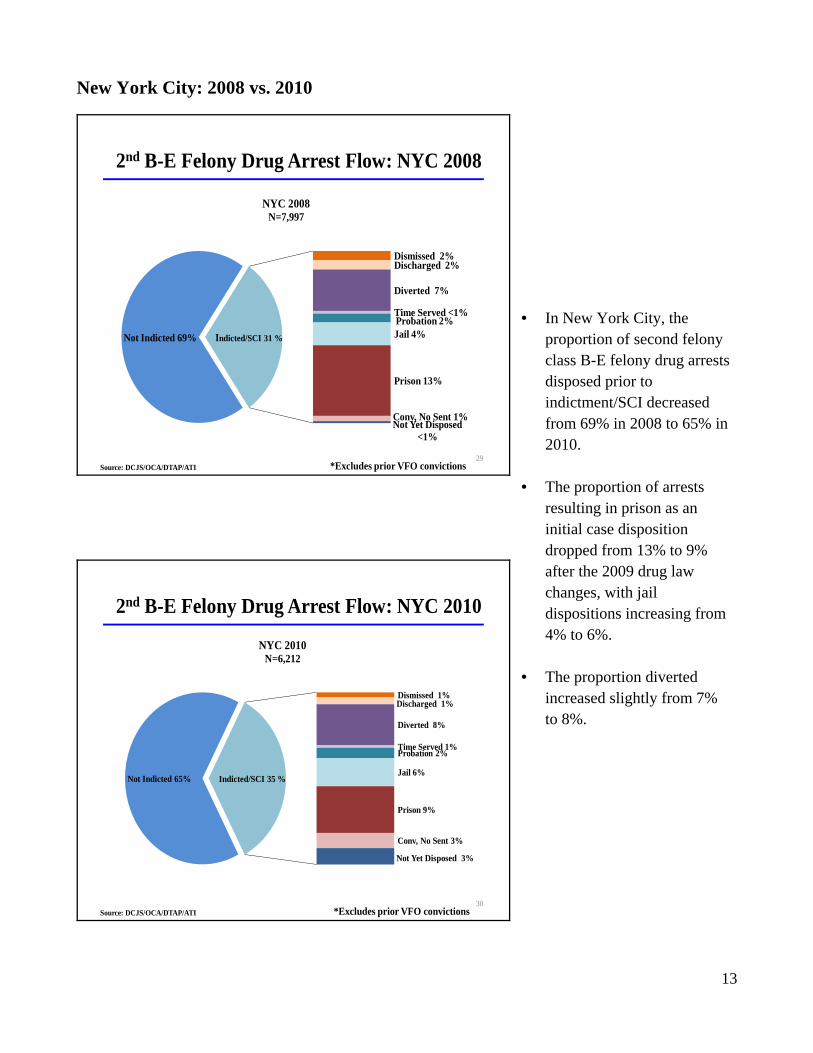
New York City: 2008 vs. 2010
2nd B-E Felony Drug Arrest Flow: NYC 2008
29
Not Indicted 69%
Dismissed 2%Discharged 2%
Diverted 7%
Time Served <1%Probation 2%Jail 4%
Prison 13%
Conv, No Sent 1%Not Yet Disposed
<1%
Indicted/SCI 31 %
NYC 2008 N=7,997
Source: DCJS/OCA/DTAP/ATI *Excludes prior VFO convictions
2nd B-E Felony Drug Arrest Flow: NYC 2010
30
Not Indicted 65%
Dismissed 1%Discharged 1%
Diverted 8%
Time Served 1%Probation 2%
Jail 6%
Prison 9%
Conv, No Sent 3%
Not Yet Disposed 3%
Indicted/SCI 35 %
NYC 2010 N=6,212
Source: DCJS/OCA/DTAP/ATI *Excludes prior VFO convictions
• In New York City, the proportion of second felony class B-E felony drug arrests disposed prior to indictment/SCI decreased from 69% in 2008 to 65% in 2010.
• The proportion of arrests resulting in prison as an initial case disposition dropped from 13% to 9% after the 2009 drug law changes, with jail dispositions increasing from 4% to 6%.
• The proportion diverted increased slightly from 7% to 8%.
14
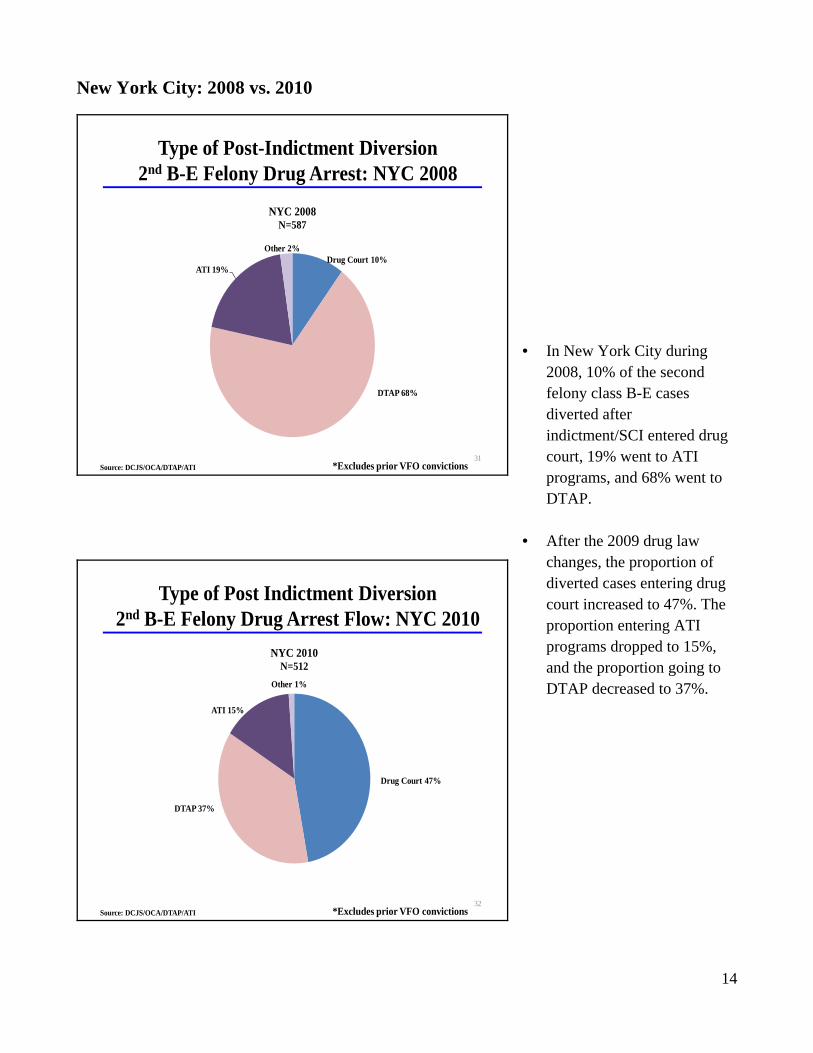
New York City: 2008 vs. 2010
Type of Post-Indictment Diversion2nd B-E Felony Drug Arrest: NYC 2008
31
Drug Court 10%
DTAP 68%
ATI 19%
Other 2%
NYC 2008 N=587
Source: DCJS/OCA/DTAP/ATI *Excludes prior VFO convictions
Type of Post Indictment Diversion2nd B-E Felony Drug Arrest Flow: NYC 2010
32
Drug Court 47%
DTAP 37%
ATI 15%
Other 1%
NYC 2010 N=512
Source: DCJS/OCA/DTAP/ATI *Excludes prior VFO convictions
• In New York City during 2008, 10% of the second felony class B-E cases diverted after indictment/SCI entered drug court, 19% went to ATI programs, and 68% went to DTAP.
• After the 2009 drug law changes, the proportion of diverted cases entering drug court increased to 47%. The proportion entering ATI programs dropped to 15%, and the proportion going to DTAP decreased to 37%.
15
IMPACT Counties: 2008 vs. 2010
1st B-E Felony Drug Arrest Flow: IMPACT 2008
33
Not Indicted, 50%
Dismissed , 5%
Discharged , 2%Diverted , 7%
Time Served, 1%
Probation, 20%
Jail, 5%Prison, 9%Conv, No Sent,
<1%Not Yet Disposed,
<1%
Indicted/SCI, 50 %
IMPACT 2008N=5,792
Source: DCJS/OCA/STEPS/ATI
1st B-E Felony Drug Arrest Flow: IMPACT 2010
34
Not Indicted, 54%
Dismissed , 4%Discharged , 3%
Diverted , 13%
Time Served, 1%
Probation, 13%
Jail, 5%Prison, 5%Conv, No Sent,
1%Not Yet Disposed ,
2%
Indicted/SCI, 46 %
IMPACT 2010 N=5,129
Source: DCJS/OCA/STEPS/ATI
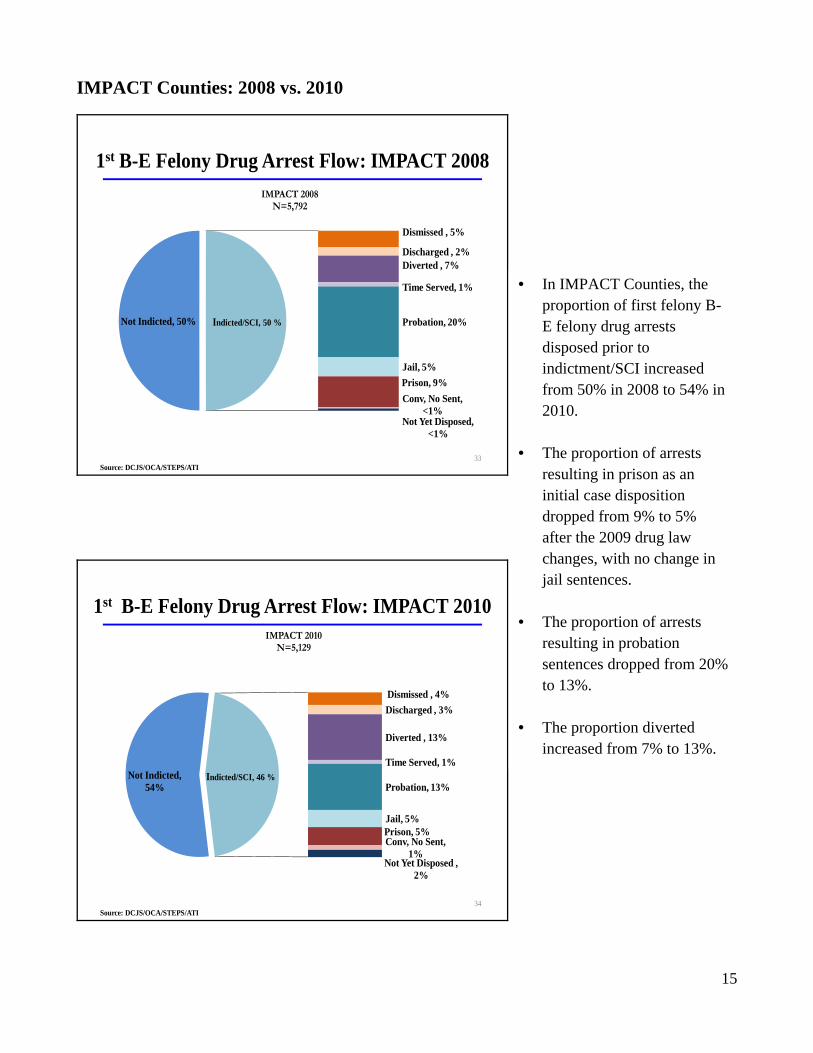
• In IMPACT Counties, the proportion of first felony B-E felony drug arrests disposed prior to indictment/SCI increased from 50% in 2008 to 54% in 2010.
• The proportion of arrests resulting in prison as an initial case disposition dropped from 9% to 5% after the 2009 drug law changes, with no change in jail sentences.
• The proportion of arrests resulting in probation sentences dropped from 20% to 13%.
• The proportion diverted increased from 7% to 13%.
16
IMPACT Counties: 2008 vs. 2010
Type of Post-Indictment Diversion1st B-E Felony Drug Arrest: IMPACT 2008
35
Drug Court, 41%
DTAP/STEPS, 6%
ATI, 51%
Willard, 1% Other , 1%
IMPACT 2008 N=425
Source: DCJS/OCA/STEPS/ATI
Type of Post-Indictment Diversion1st B-E Felony Drug Arrest: IMPACT 2010
36
Drug Court, 77%
DTAP/STEPS, 4%
ATI, 18%Willard, 1%
IMPACT 2010N=654
* Other Diversion is less than 1%
Source: DCJS/OCA/STEPS/ATI
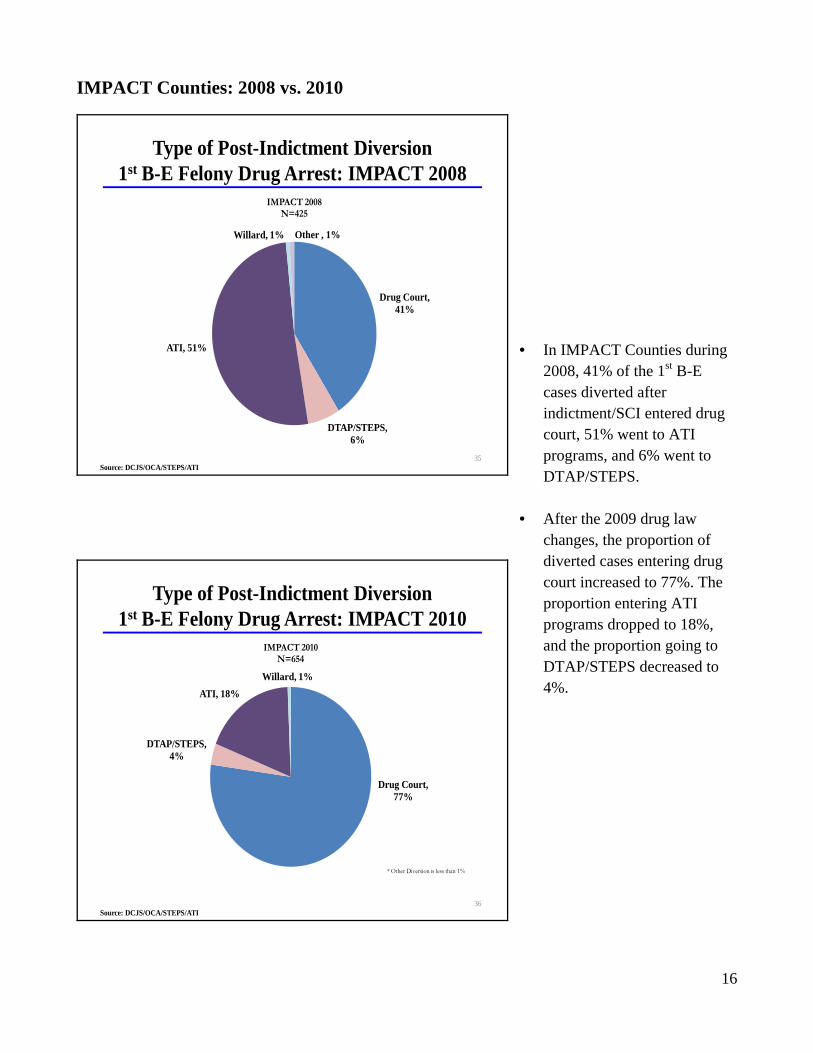
• In IMPACT Counties during 2008, 41% of the 1st B-E cases diverted after indictment/SCI entered drug court, 51% went to ATI programs, and 6% went to DTAP/STEPS.
• After the 2009 drug law changes, the proportion of diverted cases entering drug court increased to 77%. The proportion entering ATI programs dropped to 18%, and the proportion going to DTAP/STEPS decreased to 4%.
17
IMPACT Counties: 2008 vs. 2010
2nd B-E Felony Drug Arrest Flow: IMPACT 2008
37
Not Indicted, 35%
Dismissed , 5%Discharged , 2%Diverted , 8%
Time Served, 2%
Probation, 6%Jail, 6%
Prison, 36%
Conv, No Sent, <1%
Not Yet Disposed , <1%
Indicted/SCI, 65 %
IMPACT 2008 N=2,282
*Excludes prior VFO convictionsSource: DCJS/OCA/STEPS/ATI
2nd B-E Felony Drug Arrest Flow: IMPACT 2010
38
Not Indicted, 41%
Dismissed , 4%Discharged , 1%
Diverted , 13%
Time Served, 2%Probation, 4%Jail, 8%
Prison, 24%
Conv, No Sent, 1%
Not Yet Disposed , 2%
Indicted/SCI, 59 %
IMPACT 2010 N=2,189
*Excludes prior VFO convictionsSource: DCJS/OCA/STEPS/ATI
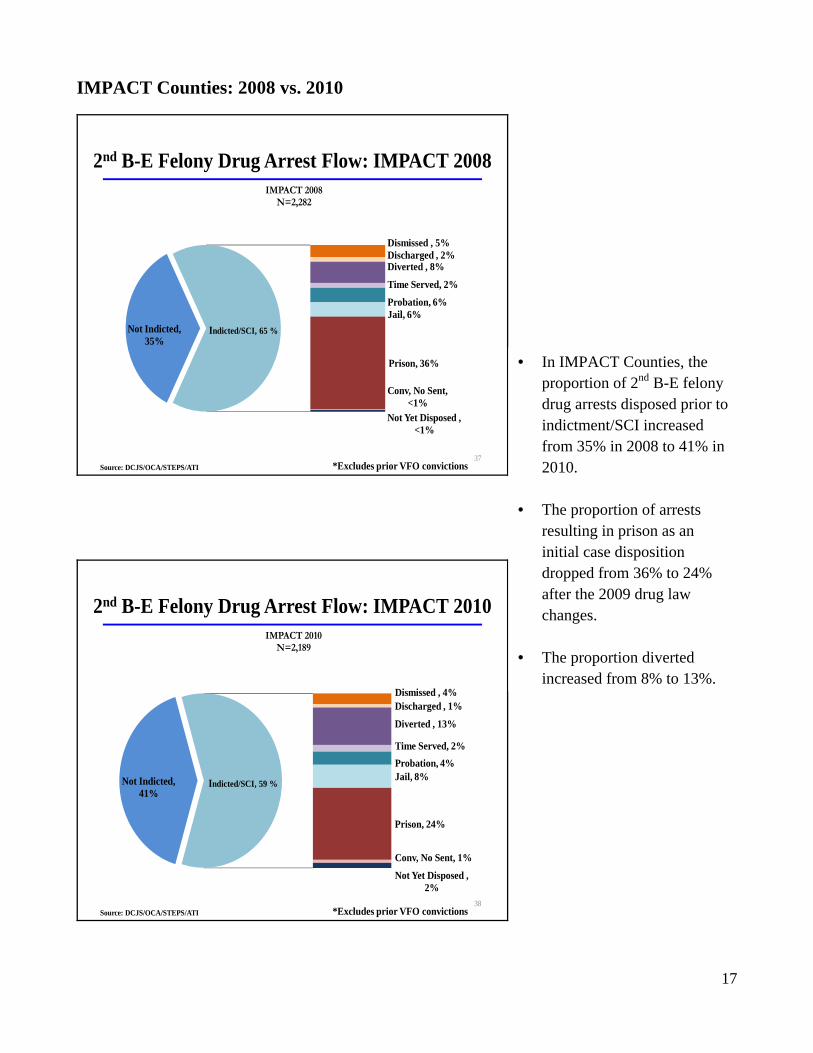
• In IMPACT Counties, the proportion of 2nd B-E felony drug arrests disposed prior to indictment/SCI increased from 35% in 2008 to 41% in 2010.
• The proportion of arrests resulting in prison as an initial case disposition dropped from 36% to 24% after the 2009 drug law changes.
• The proportion diverted increased from 8% to 13%.
18
IMPACT Counties: 2008 vs. 2010
Type of Post-Indictment Diversion2nd B-E Felony Drug Arrest: IMPACT 2008
39
Drug Court, 17%
DTAP/STEPS, 22%
ATI, 31%
Willard, 29%
Other, 1%
IMPACT 2008 N=189
*Excludes prior VFO convictionsSource: DCJS/OCA/STEPS/ATI
Type of Post-Indictment Diversion2nd B-E Felony Drug Arrest: IMPACT 2010
40
Drug Court, 53%
DTAP/STEPS, 12%
ATI, 22%
Willard, 12%Other, 1%
IMPACT 2010 N=277
*Excludes prior VFO convictionsSource: DCJS/OCA/STEPS/ATI
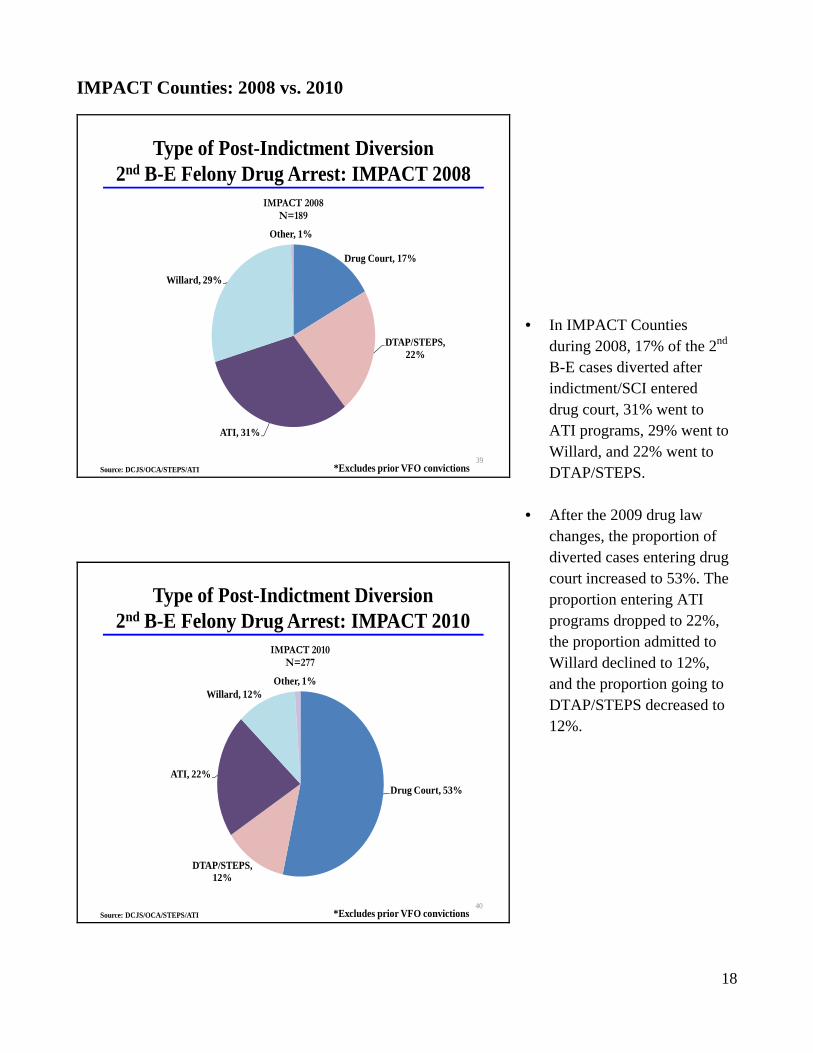
• In IMPACT Counties during 2008, 17% of the 2nd B-E cases diverted after indictment/SCI entered drug court, 31% went to ATI programs, 29% went to Willard, and 22% went to DTAP/STEPS.
• After the 2009 drug law changes, the proportion of diverted cases entering drug court increased to 53%. The proportion entering ATI programs dropped to 22%, the proportion admitted to Willard declined to 12%, and the proportion going to DTAP/STEPS decreased to 12%.
19
Other Counties: 2008 vs. 2010
1st B-E Felony Drug Arrest Flow: Other Counties 2008
41
Not Indicted, 38%
Dismissed , 7%
Discharged , 4%Diverted , 4%Time Served, <1%
Probation, 22%
Jail, 4%
Prison, 18%Conv, No Sent,
<1%Not Yet Disposed,
1%
Indicted/SCI, 62 %
Other Counties 2008 N=1,494
Source: DCJS/OCA/STEPS/ATI
1st B-E Felony Drug Arrest Flow: Other Counties 2010
42
Not Indicted, 34%
Dismissed , 4%Discharged , 3%Diverted , 9%Time Served, <1%
Probation, 23%
Jail, 4%
Prison, 17%
Conv, No Sent, <1%
Not Yet Disposed, 4%
Indicted/SCI, 66 %
Other Counties 2010 N=1,592
Source: DCJS/OCA/STEPS/ATI
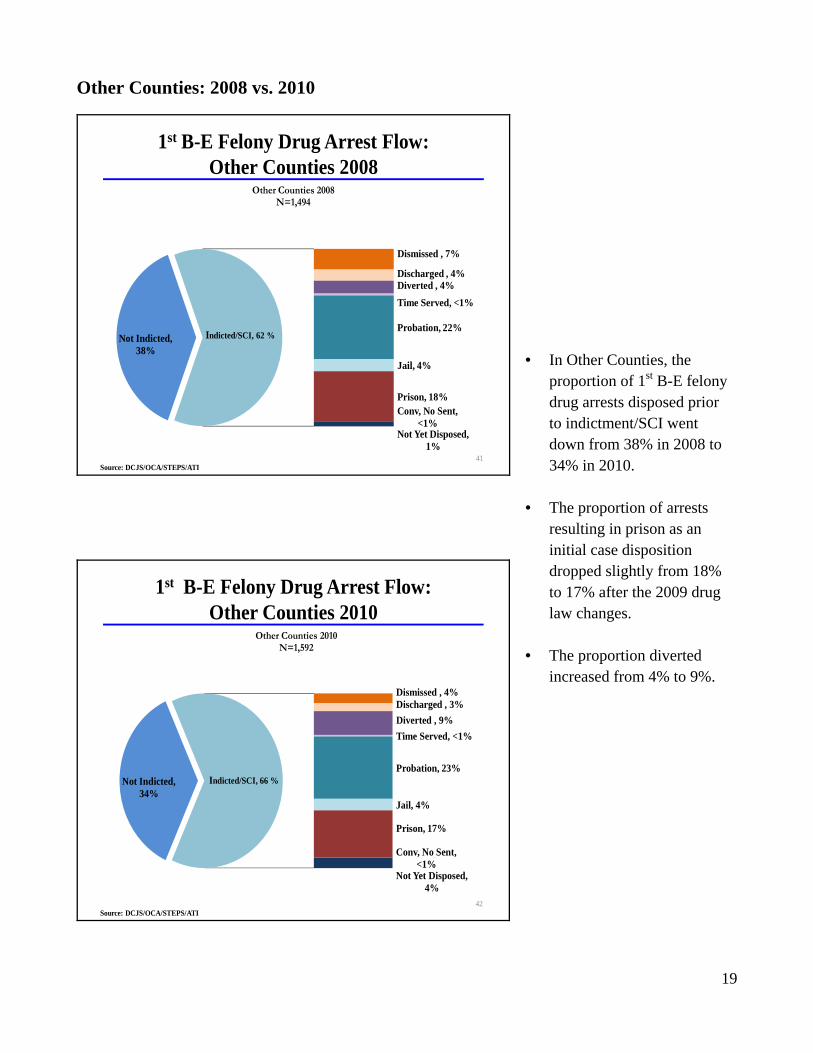
• In Other Counties, the proportion of 1st B-E felony drug arrests disposed prior to indictment/SCI went down from 38% in 2008 to 34% in 2010.
• The proportion of arrests resulting in prison as an initial case disposition dropped slightly from 18% to 17% after the 2009 drug law changes.
• The proportion diverted increased from 4% to 9%.

20
Other Counties: 2008 vs. 2010
Type of Post-Indictment Diversion1st B-E Felony Drug Arrest: Other Counties 2008
43
Drug Court, 67%
STEPS, 12%
ATI, 18%
Other , 3%
Other Counties 2008 N=66
Source: DCJS/OCA/STEPS/ATI
Type of Post-Indictment Diversion1st B-E Felony Drug Arrest: Other Counties 2010
44
Drug Court, 82%
STEPS, 4%
ATI, 9%Willard, 5%
Other Counties 2010 N=132
* Other Diversion is less than 1%
Source: DCJS/OCA/STEPS/ATI
• In Other Counties during 2008, 67% of the 1st B-E cases diverted after indictment/SCI entered drug court, 18% went to ATI programs, and 12% went to STEPS.
• After the 2009 drug law changes, the proportion of diverted cases entering drug court increased to 82%. The proportion entering ATI programs dropped to 9%, and the proportion going to STEPS decreased to 4%.
21
Other Counties: 2008 vs. 2010
2nd B-E Felony Drug Arrest Flow: Other Counties 2008
45
Not Indicted, 28%
Dismissed , 6%Discharged , 2%Diverted , 4%Time Served, <1%Probation, 5%Jail, 1%
Prison, 51%
Conv, No Sent, <1%Not Yet Disposed, 2%
Indicted/SCI, 72 %
Other Counties 2008 N=414
*Excludes prior VFO convictionsSource: DCJS/OCA/STEPS/ATI
2nd B-E Felony Drug Arrest Flow: Other Counties 2010
46
Not Indicted, 23%
Dismissed , 7%Discharged , <1%Diverted , 10%Time Served, <1%Probation, 7%Jail, 3%
Prison, 47%
Conv, No Sent, <1%
Not Yet Disposed, 3%
Indicted/SCI, 77 %
Other Counties 2010 N=433
*Excludes prior VFO convictionsSource: DCJS/OCA/STEPS/ATI
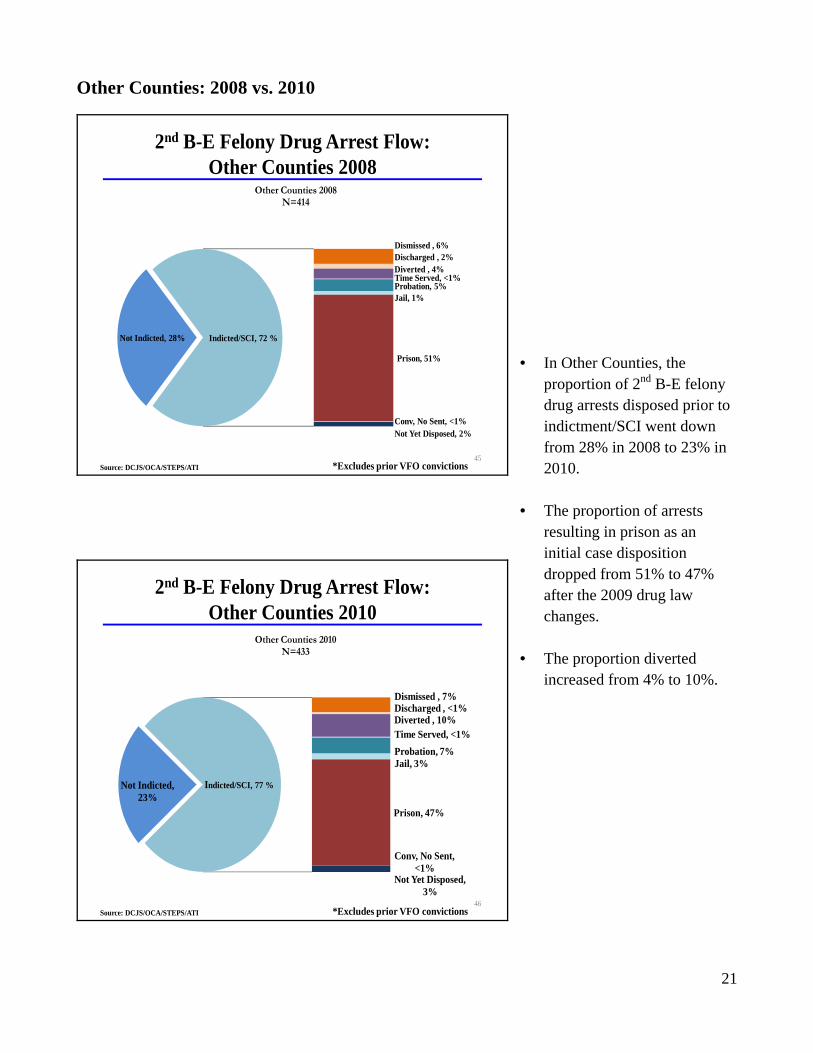
• In Other Counties, the proportion of 2nd B-E felony drug arrests disposed prior to indictment/SCI went down from 28% in 2008 to 23% in 2010.
• The proportion of arrests resulting in prison as an initial case disposition dropped from 51% to 47% after the 2009 drug law changes.
• The proportion diverted increased from 4% to 10%.
22
Other Counties: 2008 vs. 2010
Type of Post-Indictment Diversion2nd B-E Felony Drug Arrest: Other Counties 2008
47
Drug Court, 53%
ATI, 24%
Willard, 24%
Other Counties 2008 N=17
* STEPS and Other diversion less than 1%.
*Excludes prior VFO convictionsSource: DCJS/OCA/STEPS/ATI
Type of Post-Indictment Diversion2nd B-E Felony Drug Arrest: Other Counties 2010
48
Drug Court, 49%
ATI, 19%
Willard, 33%
Other Counties 2010 N=43
* STEPS and Other diversion less than 1%.
*Excludes prior VFO convictionsSource: DCJS/OCA/STEPS/ATI
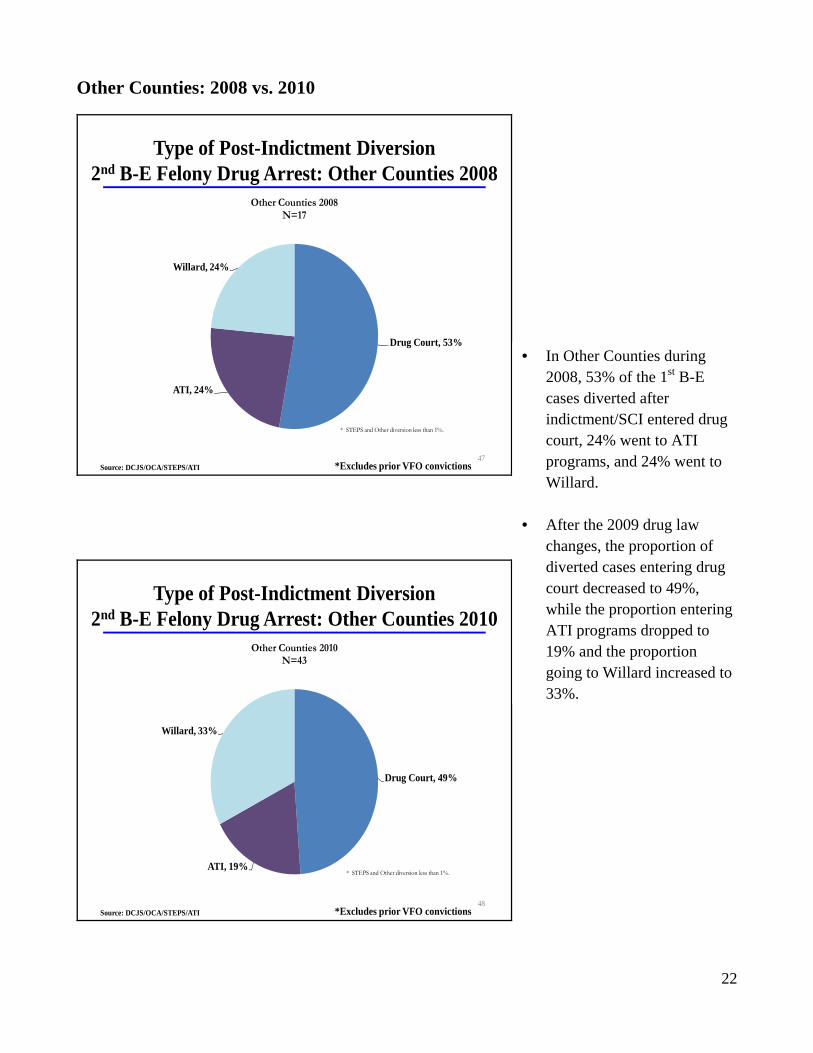
• In Other Counties during 2008, 53% of the 1st B-E cases diverted after indictment/SCI entered drug court, 24% went to ATI programs, and 24% went to Willard.
• After the 2009 drug law changes, the proportion of diverted cases entering drug court decreased to 49%, while the proportion entering ATI programs dropped to 19% and the proportion going to Willard increased to 33%.
23
2008 and 2010 Class B-E Drug Arrests: Felony Drug Court Screenings among Indicted/SCI Cases
Proportion of 1nd Felony B-E Drug Indictments Who Were Screened for Drug Court Increased Statewide from
2008 to 2010
49
29%
8% 8%
33% 34%
16%
0%
5%
10%
15%
20%
25%
30%
35%
40%
NYC IMPACT OTHER
Percentage of 1st Felony B-E Drug Indictments Screened for Felony Drug Court by Arrest Year: 2008 and 2010
2008 2010
Proportion of 2nd Felony B-E Drug Indictments Who Were Screened for Drug Court Increased Statewide from
2008 to 2010
50
10%
4%8%
25%28%
13%
0%
5%
10%
15%
20%
25%
30%
35%
40%
NYC IMPACT OTHER
Percentage of 2nd Felony B-E Drug Indictments Screened for Felony Drug Court by Arrest Year: 2008 and 2010
2008 2010
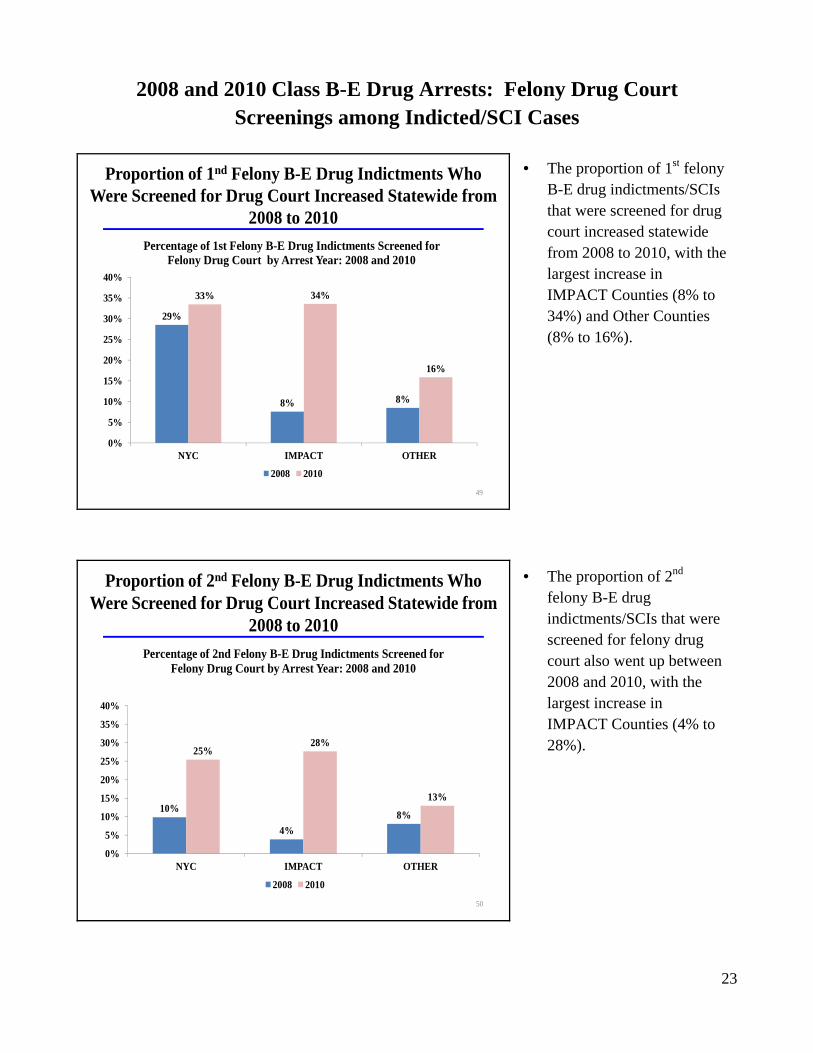
• The proportion of 1st felony B-E drug indictments/SCIs that were screened for drug court increased statewide from 2008 to 2010, with the largest increase in IMPACT Counties (8% to 34%) and Other Counties (8% to 16%).
• The proportion of 2nd felony B-E drug indictments/SCIs that were screened for felony drug court also went up between 2008 and 2010, with the largest increase in IMPACT Counties (4% to 28%).

24
Drug Court Activity among Article 216-Eligible Cases, 2008-2011 The following section updates trends that were initially presented in a report produced by DCJS and the Office of Court Administration (OCA) (see http://www.criminaljustice.ny.gov/drug-law-reform/documents/drug-court-activity-report.pdf ). The trends in felony drug court screenings and admissions are now updated through 2011. Cases include screenings and admissions among offenders eligible for judicial diversion under CPL Article 216. Eligible offenses include felony level B, C, D, or E drug offenses and property offenses specified in Article 216 (Burglary 3rd, Criminal Mischief 2nd and 3rd, Grand Larceny 3rd and 4th - excluding firearms, Criminal Possession of Stolen Property 3rd and 4th - excluding firearms, Forgery 2nd, Possession of Forged Instrument 2nd, Unauthorized Use of Motor Vehicle 2nd, and Unlawfully Using Slugs 1st).
Judicial Diversion: How DCJS Defines Cases Eligible under Article 216 • Cases are considered Article 216-eligible based on their offense charge; this allows for
comparisons of similar cases before and after the drug law changes. • Counts include cases involving felony class B-E drug offenses and property offenses specified
in Article 216 of the Criminal Procedure Law. • Cases from OCA’s Universal Treatment Application (UTA) are matched to the DCJS
Computerized Criminal History File (CCH) to determine indictment/SCI offense. • Extensive validation is done at DCJS to ensure accuracy. • Cases are counted regardless of the court part. • Only cases that remain in felony court are counted as Article 216-eligible. • Eligible cases include many felony drug charges that do not require a prison sentence upon
conviction. • Eligible cases also include property offenses that do not require a prison sentence upon
conviction.
25
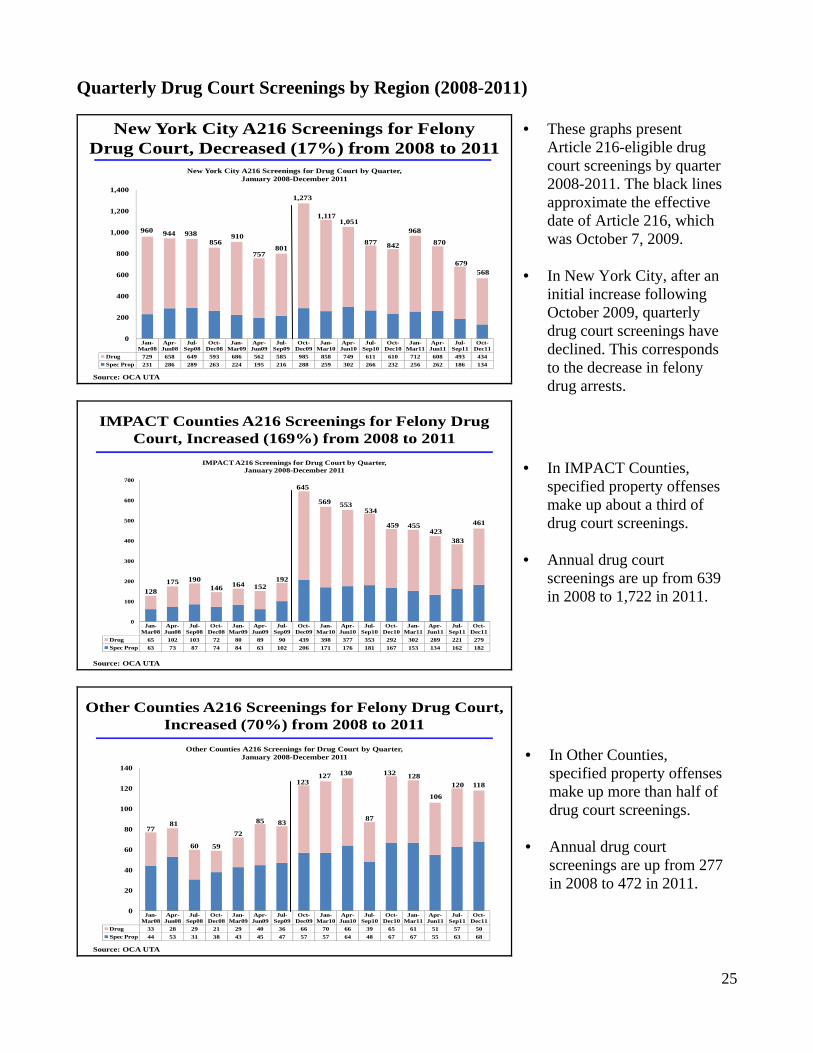
Quarterly Drug Court Screenings by Region (2008-2011)
New York City A216 Screenings for Felony Drug Court, Decreased (17%) from 2008 to 2011
Jan-Mar08
Apr-Jun08
Jul-Sep08
Oct-Dec08
Jan-Mar09
Apr-Jun09
Jul-Sep09
Oct-Dec09
Jan-Mar10
Apr-Jun10
Jul-Sep10
Oct-Dec10
Jan-Mar11
Apr-Jun11
Jul-Sep11
Oct-Dec11
Drug 729 658 649 593 686 562 585 985 858 749 611 610 712 608 493 434Spec Prop 231 286 289 263 224 195 216 288 259 302 266 232 256 262 186 134
960 944 938856
910
757801
1,273
1,1171,051
877 842
968
870
679568
0
200
400
600
800
1,000
1,200
1,400
New York City A216 Screenings for Drug Court by Quarter, January 2008-December 2011
Source: OCA UTA
IMPACT Counties A216 Screenings for Felony Drug Court, Increased (169%) from 2008 to 2011
Jan-Mar08
Apr-Jun08
Jul-Sep08
Oct-Dec08
Jan-Mar09
Apr-Jun09
Jul-Sep09
Oct-Dec09
Jan-Mar10
Apr-Jun10
Jul-Sep10
Oct-Dec10
Jan-Mar11
Apr-Jun11
Jul-Sep11
Oct-Dec11
Drug 65 102 103 72 80 89 90 439 398 377 353 292 302 289 221 279Spec Prop 63 73 87 74 84 63 102 206 171 176 181 167 153 134 162 182
128175 190
146 164 152192
645
569 553534
459 455423
383
461
0
100
200
300
400
500
600
700
IMPACT A216 Screenings for Drug Court by Quarter,January 2008-December 2011
Source: OCA UTA
Other Counties A216 Screenings for Felony Drug Court, Increased (70%) from 2008 to 2011
Jan-Mar08
Apr-Jun08
Jul-Sep08
Oct-Dec08
Jan-Mar09
Apr-Jun09
Jul-Sep09
Oct-Dec09
Jan-Mar10
Apr-Jun10
Jul-Sep10
Oct-Dec10
Jan-Mar11
Apr-Jun11
Jul-Sep11
Oct-Dec11
Drug 33 28 29 21 29 40 36 66 70 66 39 65 61 51 57 50Spec Prop 44 53 31 38 43 45 47 57 57 64 48 67 67 55 63 68
7781
60 59
72
85 83
123127 130
87
132 128
106
120 118
0
20
40
60
80
100
120
140
Other Counties A216 Screenings for Drug Court by Quarter, January 2008-December 2011
Source: OCA UTA
• These graphs present Article 216-eligible drug court screenings by quarter 2008-2011. The black lines approximate the effective date of Article 216, which was October 7, 2009.
• In New York City, after an initial increase following October 2009, quarterly drug court screenings have declined. This corresponds to the decrease in felony drug arrests.
• In IMPACT Counties, specified property offenses make up about a third of drug court screenings.
• Annual drug court screenings are up from 639 in 2008 to 1,722 in 2011.
• In Other Counties, specified property offenses make up more than half of drug court screenings.
• Annual drug court screenings are up from 277 in 2008 to 472 in 2011.
26
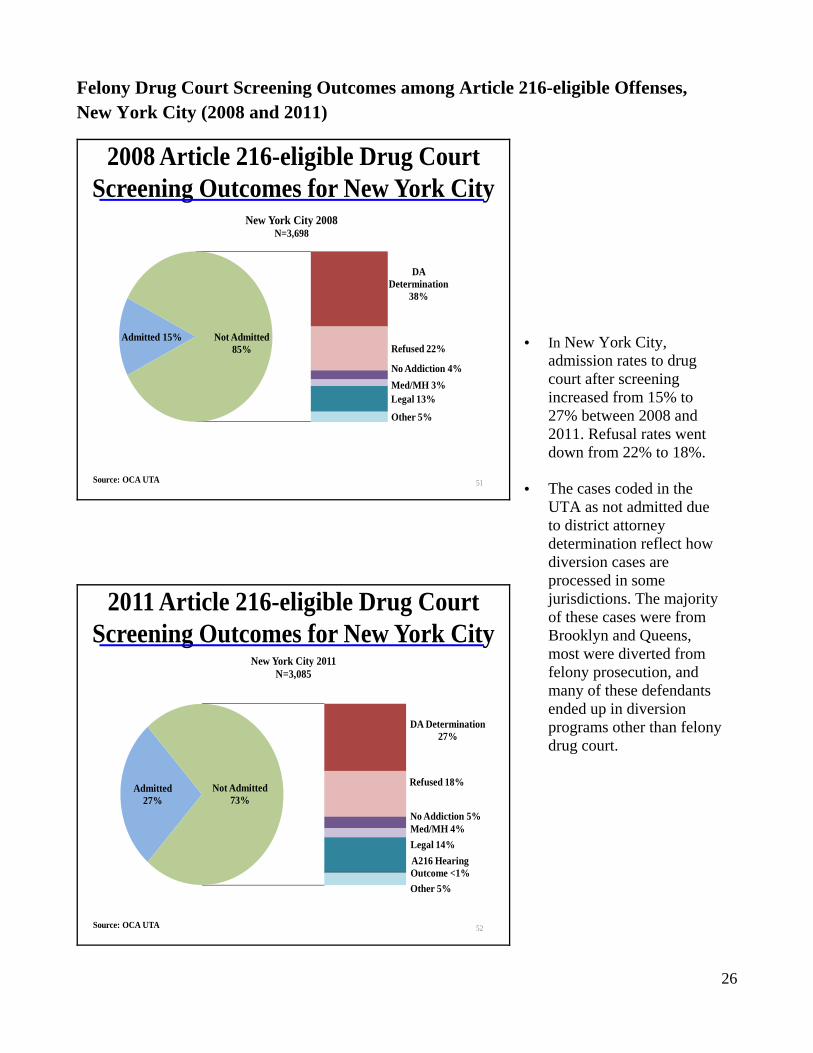
Felony Drug Court Screening Outcomes among Article 216-eligible Offenses, New York City (2008 and 2011)
2008 Article 216-eligible Drug Court Screening Outcomes for New York City
Source: OCA UTA 51
Admitted 15%
DA Determination
38%
Refused 22%
No Addiction 4%Med/MH 3%Legal 13%
Other 5%
Not Admitted 85%
New York City 2008N=3,698
2011 Article 216-eligible Drug Court Screening Outcomes for New York City
Source: OCA UTA 52
Admitted27%
DA Determination 27%
Refused 18%
No Addiction 5%Med/MH 4%Legal 14%A216 Hearing Outcome <1%Other 5%
Not Admitted73%
New York City 2011N=3,085
• In New York City, admission rates to drug court after screening increased from 15% to 27% between 2008 and 2011. Refusal rates went down from 22% to 18%.
• The cases coded in the
UTA as not admitted due to district attorney determination reflect how diversion cases are processed in some jurisdictions. The majority of these cases were from Brooklyn and Queens, most were diverted from felony prosecution, and many of these defendants ended up in diversion programs other than felony drug court.
27
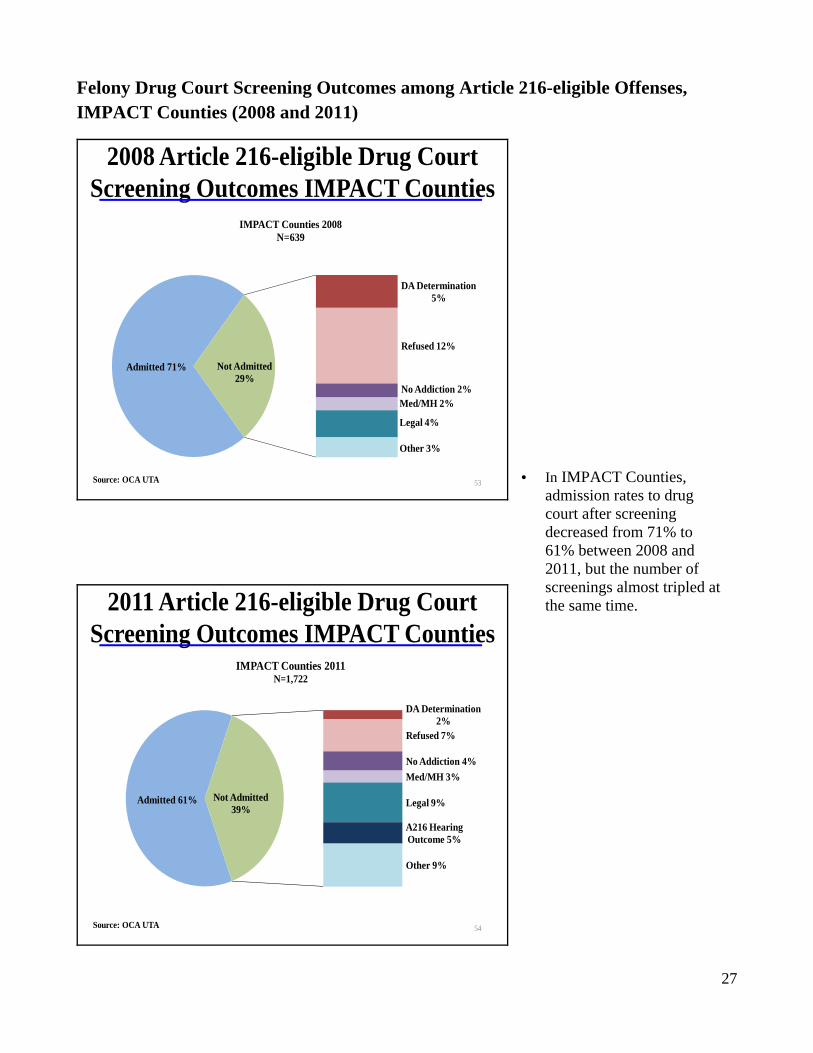
Felony Drug Court Screening Outcomes among Article 216-eligible Offenses, IMPACT Counties (2008 and 2011)
2008 Article 216-eligible Drug Court Screening Outcomes IMPACT Counties
Source: OCA UTA 53
Admitted 71%
DA Determination 5%
Refused 12%
No Addiction 2%Med/MH 2%
Legal 4%
Other 3%
Not Admitted 29%
IMPACT Counties 2008N=639
2011 Article 216-eligible Drug Court Screening Outcomes IMPACT Counties
Source: OCA UTA 54
Admitted 61%
DA Determination 2%
Refused 7%
No Addiction 4%Med/MH 3%
Legal 9%
A216 Hearing Outcome 5%
Other 9%
Not Admitted 39%
IMPACT Counties 2011N=1,722
• In IMPACT Counties, admission rates to drug court after screening decreased from 71% to 61% between 2008 and 2011, but the number of screenings almost tripled at the same time.
28
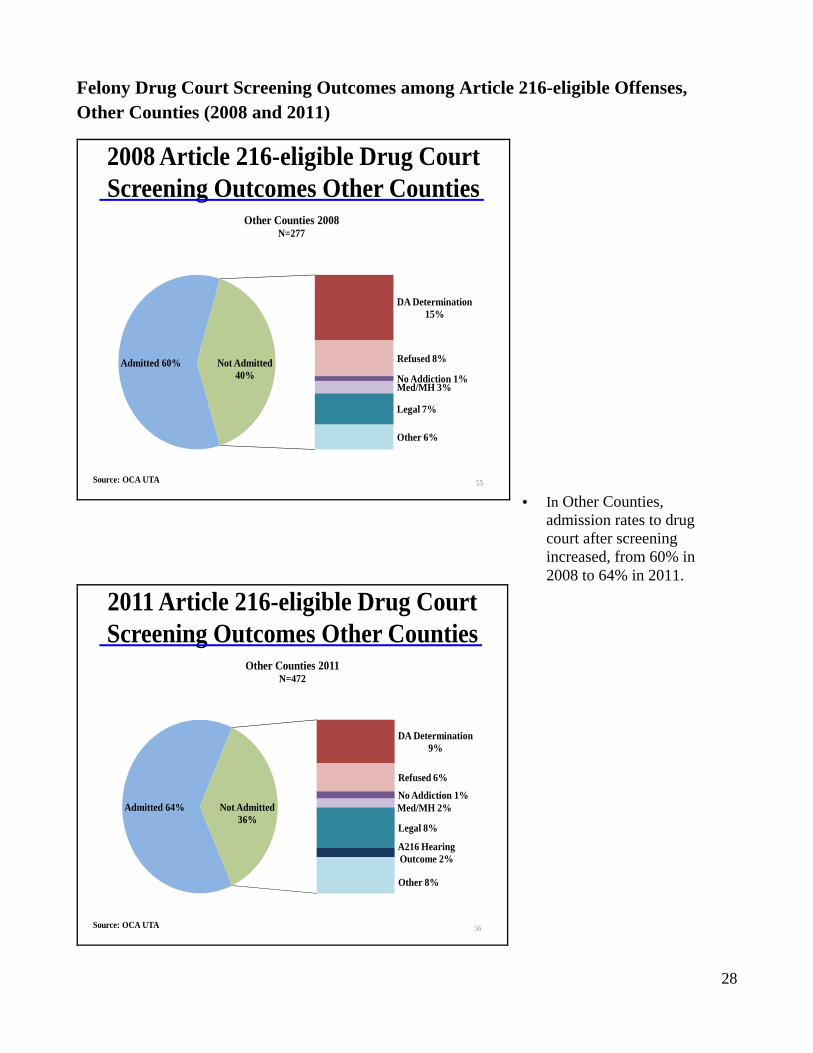
Felony Drug Court Screening Outcomes among Article 216-eligible Offenses, Other Counties (2008 and 2011)
2008 Article 216-eligible Drug Court Screening Outcomes Other Counties
Source: OCA UTA 55
Admitted 60%
DA Determination 15%
Refused 8%
No Addiction 1%Med/MH 3%
Legal 7%
Other 6%
Not Admitted 40%
Other Counties 2008N=277
2011 Article 216-eligible Drug Court Screening Outcomes Other Counties
Source: OCA UTA 56
Admitted 64%
DA Determination 9%
Refused 6%
No Addiction 1%Med/MH 2%
Legal 8%
A216 Hearing Outcome 2%
Other 8%
Not Admitted 36%
Other Counties 2011N=472
• In Other Counties, admission rates to drug court after screening increased, from 60% in 2008 to 64% in 2011.
29
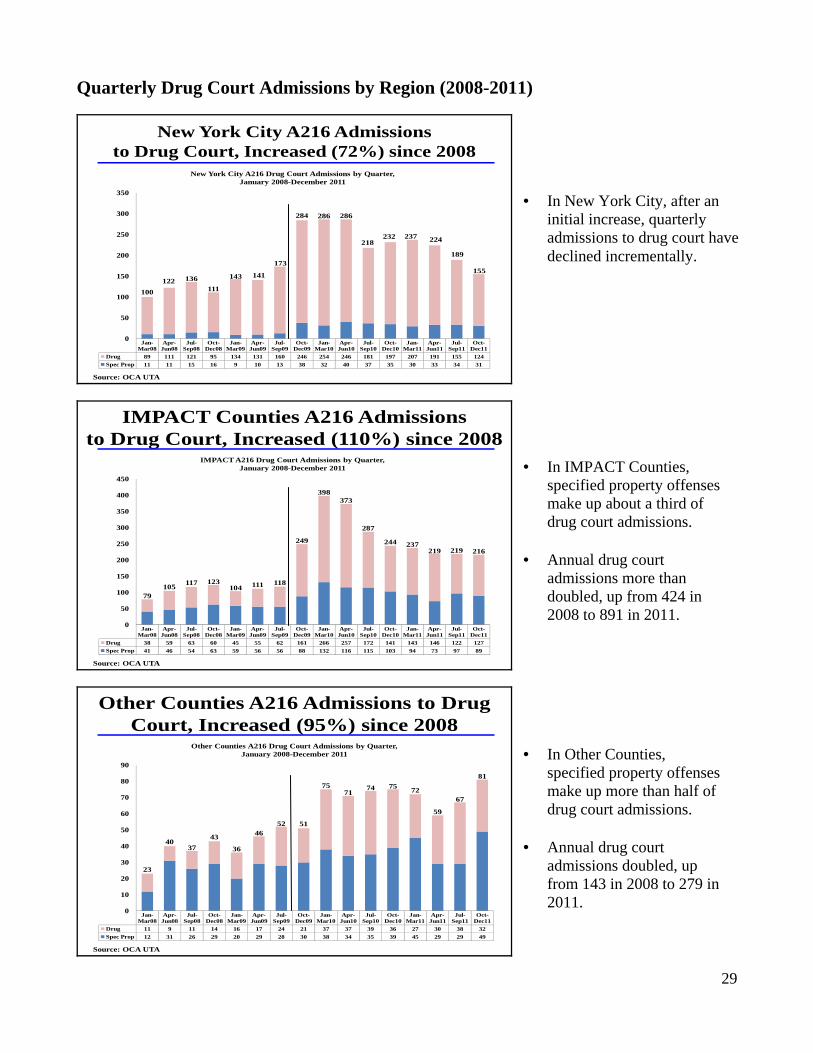
Quarterly Drug Court Admissions by Region (2008-2011)
New York City A216 Admissions to Drug Court, Increased (72%) since 2008
Jan-Mar08
Apr-Jun08
Jul-Sep08
Oct-Dec08
Jan-Mar09
Apr-Jun09
Jul-Sep09
Oct-Dec09
Jan-Mar10
Apr-Jun10
Jul-Sep10
Oct-Dec10
Jan-Mar11
Apr-Jun11
Jul-Sep11
Oct-Dec11
Drug 89 111 121 95 134 131 160 246 254 246 181 197 207 191 155 124Spec Prop 11 11 15 16 9 10 13 38 32 40 37 35 30 33 34 31
100122 136
111
143 141
173
284 286 286
218232 237 224
189
155
0
50
100
150
200
250
300
350
New York City A216 Drug Court Admissions by Quarter, January 2008-December 2011
Source: OCA UTA
IMPACT Counties A216 Admissions to Drug Court, Increased (110%) since 2008
Jan-Mar08
Apr-Jun08
Jul-Sep08
Oct-Dec08
Jan-Mar09
Apr-Jun09
Jul-Sep09
Oct-Dec09
Jan-Mar10
Apr-Jun10
Jul-Sep10
Oct-Dec10
Jan-Mar11
Apr-Jun11
Jul-Sep11
Oct-Dec11
Drug 38 59 63 60 45 55 62 161 266 257 172 141 143 146 122 127Spec Prop 41 46 54 63 59 56 56 88 132 116 115 103 94 73 97 89
79105 117 123
104 111 118
249
398373
287
244 237219 219 216
0
50
100
150
200
250
300
350
400
450
IMPACT A216 Drug Court Admissions by Quarter, January 2008-December 2011
Source: OCA UTA
Other Counties A216 Admissions to Drug Court, Increased (95%) since 2008
Jan-Mar08
Apr-Jun08
Jul-Sep08
Oct-Dec08
Jan-Mar09
Apr-Jun09
Jul-Sep09
Oct-Dec09
Jan-Mar10
Apr-Jun10
Jul-Sep10
Oct-Dec10
Jan-Mar11
Apr-Jun11
Jul-Sep11
Oct-Dec11
Drug 11 9 11 14 16 17 24 21 37 37 39 36 27 30 38 32Spec Prop 12 31 26 29 20 29 28 30 38 34 35 39 45 29 29 49
23
4037
43
36
4652 51
7571
74 75 72
59
67
81
0
10
20
30
40
50
60
70
80
90
Other Counties A216 Drug Court Admissions by Quarter, January 2008-December 2011
Source: OCA UTA
• In New York City, after an initial increase, quarterly admissions to drug court have declined incrementally.
• In IMPACT Counties, specified property offenses make up about a third of drug court admissions.
• Annual drug court admissions more than doubled, up from 424 in 2008 to 891 in 2011.
• In Other Counties, specified property offenses make up more than half of drug court admissions.
• Annual drug court admissions doubled, up from 143 in 2008 to 279 in 2011.
30
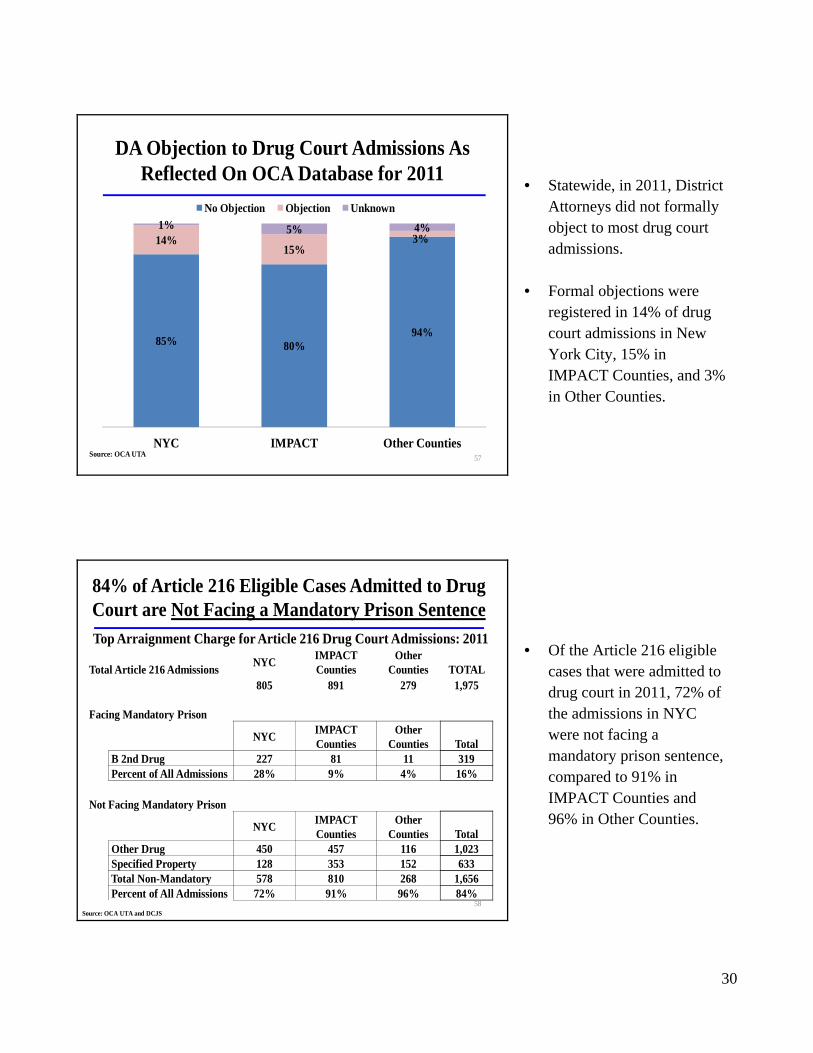
DA Objection to Drug Court Admissions As Reflected On OCA Database for 2011
85% 80%94%
14%15%
3%1% 5% 4%
NYC IMPACT Other Counties
No Objection Objection Unknown
Source: OCA UTA 57
84% of Article 216 Eligible Cases Admitted to Drug Court are Not Facing a Mandatory Prison SentenceTop Arraignment Charge for Article 216 Drug Court Admissions: 2011
Total Article 216 Admissions NYC IMPACT Counties
Other Counties TOTAL
805 891 279 1,975
Facing Mandatory Prison
NYC IMPACT Counties
Other Counties Total
B 2nd Drug 227 81 11 319Percent of All Admissions 28% 9% 4% 16%
Not Facing Mandatory Prison
NYC IMPACT Counties
Other Counties Total
Other Drug 450 457 116 1,023Specified Property 128 353 152 633Total Non-Mandatory 578 810 268 1,656Percent of All Admissions 72% 91% 96% 84%
Source: OCA UTA and DCJS58
• Statewide, in 2011, District
Attorneys did not formally object to most drug court admissions.
• Formal objections were registered in 14% of drug court admissions in New York City, 15% in IMPACT Counties, and 3% in Other Counties.
• Of the Article 216 eligible cases that were admitted to drug court in 2011, 72% of the admissions in NYC were not facing a mandatory prison sentence, compared to 91% in IMPACT Counties and 96% in Other Counties.
31
Article 216 Hearings
CPL Article 216 provides that a defendant or prosecutor may request a judicial hearing on the defendant’s eligibility and suitability for participation in a substance abuse treatment program. After the proceeding, the court makes findings of fact regarding the defendant’s eligibility under the statute, the likelihood that treatment will be effective, and how public safety is served by the decision.
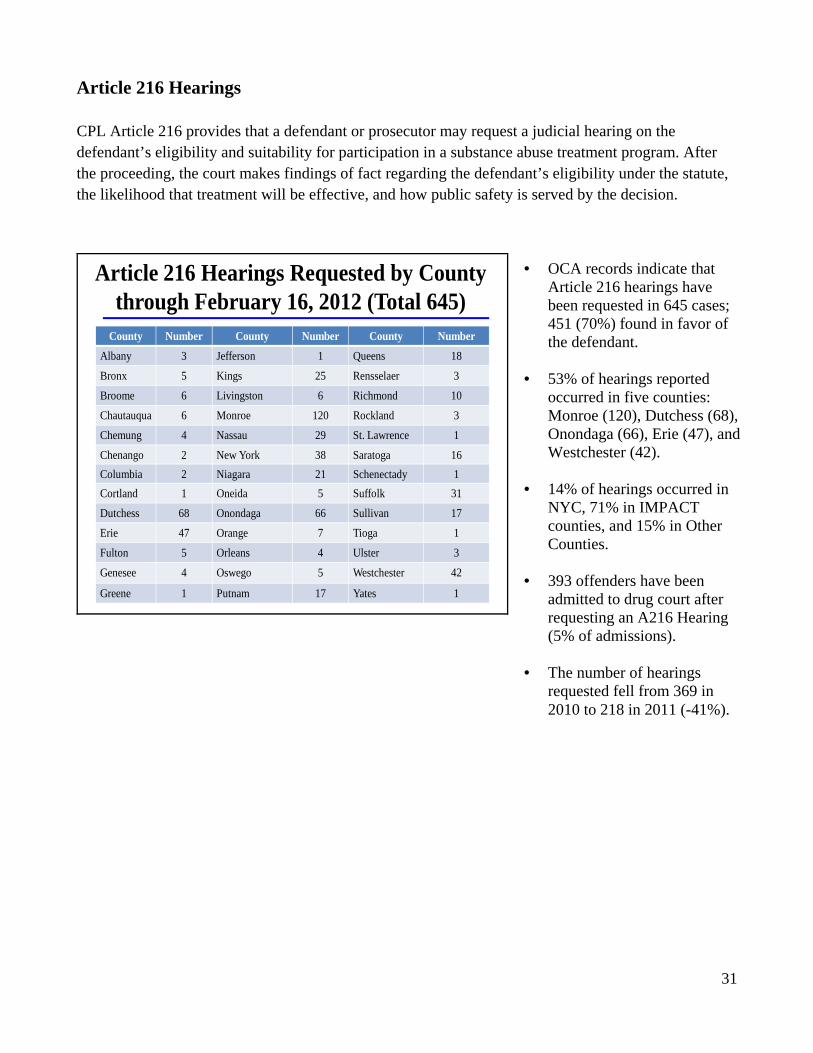
Article 216 Hearings Requested by County through February 16, 2012 (Total 645)
60
County Number County Number County Number
Albany 3 Jefferson 1 Queens 18
Bronx 5 Kings 25 Rensselaer 3
Broome 6 Livingston 6 Richmond 10
Chautauqua 6 Monroe 120 Rockland 3
Chemung 4 Nassau 29 St. Lawrence 1
Chenango 2 New York 38 Saratoga 16Columbia 2 Niagara 21 Schenectady 1Cortland 1 Oneida 5 Suffolk 31
Dutchess 68 Onondaga 66 Sullivan 17
Erie 47 Orange 7 Tioga 1
Fulton 5 Orleans 4 Ulster 3
Genesee 4 Oswego 5 Westchester 42
Greene 1 Putnam 17 Yates 1
• OCA records indicate that Article 216 hearings have been requested in 645 cases; 451 (70%) found in favor of the defendant.
• 53% of hearings reported occurred in five counties: Monroe (120), Dutchess (68), Onondaga (66), Erie (47), and Westchester (42).
• 14% of hearings occurred in NYC, 71% in IMPACT counties, and 15% in Other Counties.
• 393 offenders have been admitted to drug court after requesting an A216 Hearing (5% of admissions).
• The number of hearings
requested fell from 369 in 2010 to 218 in 2011 (-41%).
32
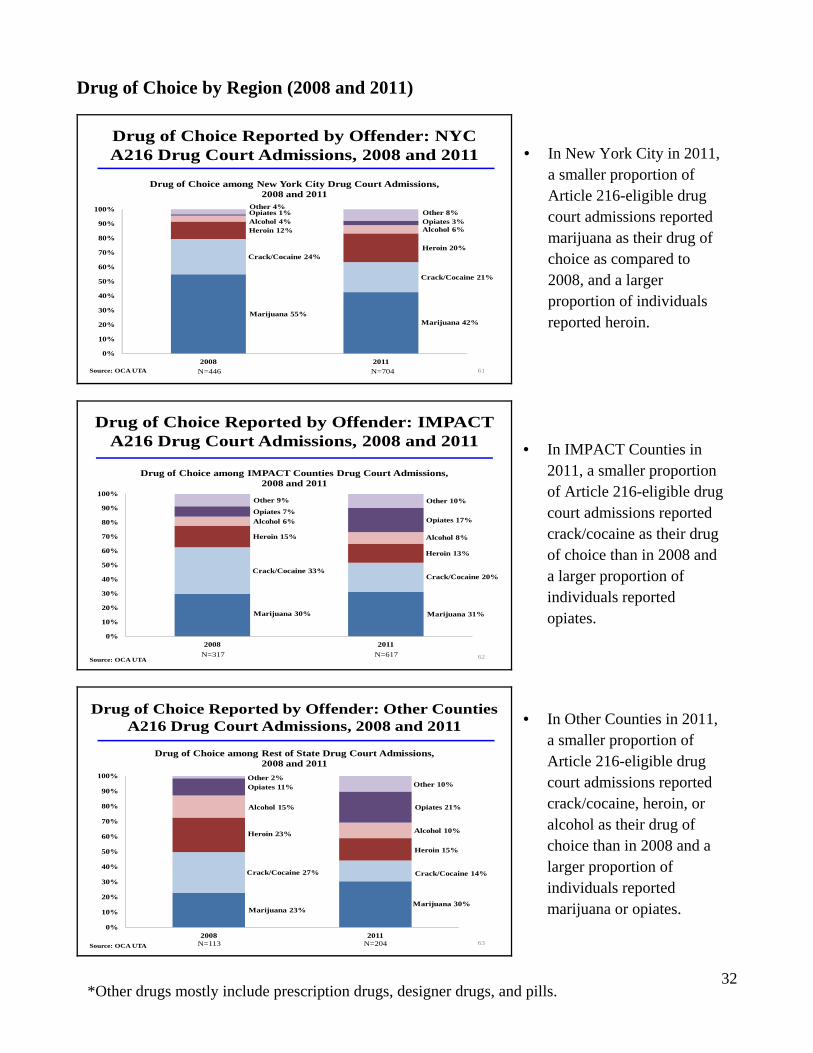
Drug of Choice by Region (2008 and 2011)
Drug of Choice Reported by Offender: NYC A216 Drug Court Admissions, 2008 and 2011
61
Marijuana 55%Marijuana 42%
Crack/Cocaine 24%
Crack/Cocaine 21%
Heroin 12%
Heroin 20%
Alcohol 4%Alcohol 6%
Opiates 1%Opiates 3%
Other 4%Other 8%
0%
10%
20%
30%
40%
50%
60%
70%
80%
90%
100%
2008 2011
Drug of Choice among New York City Drug Court Admissions, 2008 and 2011
Source: OCA UTA N=446 N=704
Drug of Choice Reported by Offender: IMPACT A216 Drug Court Admissions, 2008 and 2011
62
Marijuana 30% Marijuana 31%
Crack/Cocaine 33%Crack/Cocaine 20%
Heroin 15%
Heroin 13%
Alcohol 6%
Alcohol 8%
Opiates 7%Opiates 17%
Other 9% Other 10%
0%
10%
20%
30%
40%
50%
60%
70%
80%
90%
100%
2008 2011
Drug of Choice among IMPACT Counties Drug Court Admissions, 2008 and 2011
Source: OCA UTAN=317 N=617
Drug of Choice Reported by Offender: Other Counties A216 Drug Court Admissions, 2008 and 2011
63
Marijuana 23%Marijuana 30%
Crack/Cocaine 27% Crack/Cocaine 14%
Heroin 23%
Heroin 15%
Alcohol 15%
Alcohol 10%
Opiates 11%
Opiates 21%
Other 2%Other 10%
0%
10%
20%
30%
40%
50%
60%
70%
80%
90%
100%
2008 2011
Drug of Choice among Rest of State Drug Court Admissions, 2008 and 2011
Source: OCA UTA N=113 N=204
• In New York City in 2011, a smaller proportion of Article 216-eligible drug court admissions reported marijuana as their drug of choice as compared to 2008, and a larger proportion of individuals reported heroin.
• In IMPACT Counties in 2011, a smaller proportion of Article 216-eligible drug court admissions reported crack/cocaine as their drug of choice than in 2008 and a larger proportion of individuals reported opiates.
• In Other Counties in 2011, a smaller proportion of Article 216-eligible drug court admissions reported crack/cocaine, heroin, or alcohol as their drug of choice than in 2008 and a larger proportion of individuals reported marijuana or opiates.
*Other drugs mostly include prescription drugs, designer drugs, and pills.
33
OASAS Admissions to Residential and Outpatient Treatment by Region (2008 and 2011)
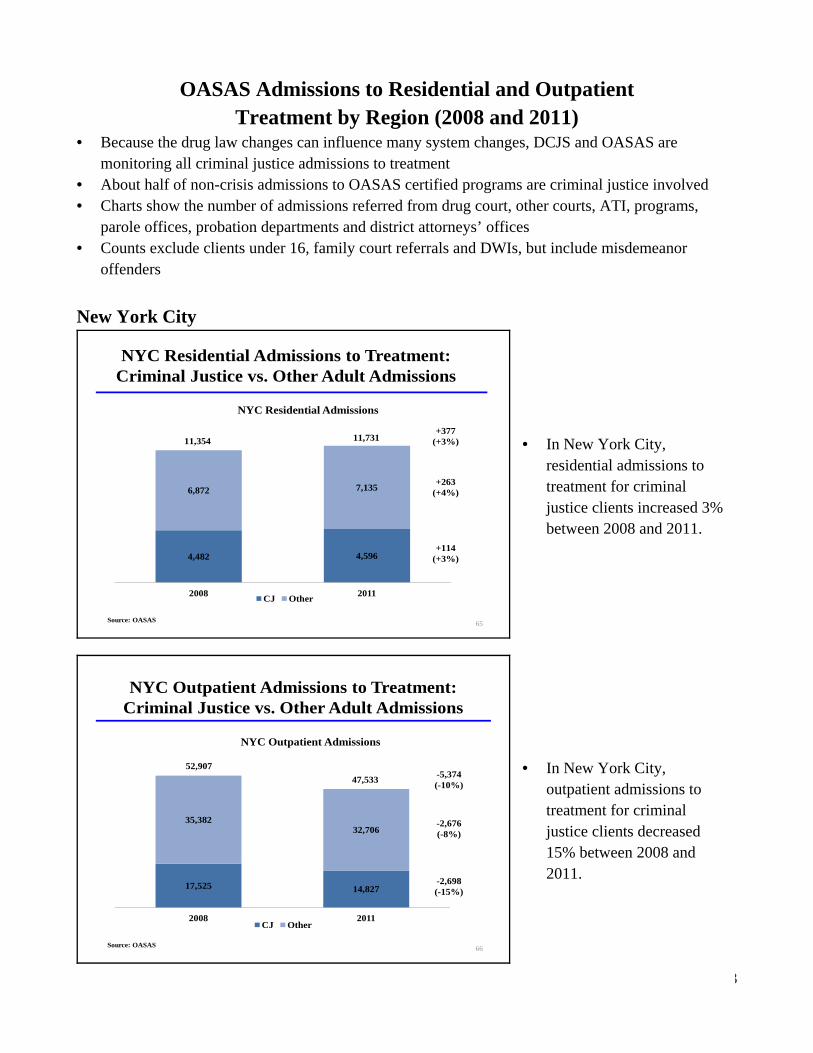
• Because the drug law changes can influence many system changes, DCJS and OASAS are monitoring all criminal justice admissions to treatment
• About half of non-crisis admissions to OASAS certified programs are criminal justice involved • Charts show the number of admissions referred from drug court, other courts, ATI, programs,
parole offices, probation departments and district attorneys’ offices • Counts exclude clients under 16, family court referrals and DWIs, but include misdemeanor
offenders New York City
NYC Residential Admissions to Treatment: Criminal Justice vs. Other Adult Admissions
65Source: OASAS
4,482 4,596
6,872 7,135
2008 2011
NYC Residential Admissions
CJ Other
11,354 11,731+377
(+3%)
+263(+4%)
+114(+3%)
NYC Outpatient Admissions to Treatment: Criminal Justice vs. Other Adult Admissions
66Source: OASAS
17,525 14,827
35,38232,706
2008 2011
NYC Outpatient Admissions
CJ Other
52,90747,533
-2,698(-15%)
-2,676(-8%)
-5,374(-10%)
• In New York City, residential admissions to treatment for criminal justice clients increased 3% between 2008 and 2011.
• In New York City, outpatient admissions to treatment for criminal justice clients decreased 15% between 2008 and 2011.
34
IMPACT Counties
IMPACT Counties Residential Admissions to Treatment: Criminal Justice vs. Other Adult Admissions
67Source: OASAS
1,552 1,789
3,4813,849
2008 2011
IMPACT Residential Admissions
CJ Other
5,0335,638
+368(+11%)
+237(+15%)
+605(+12%)
IMPACT Counties Outpatient Admissions to Treatment: Criminal Justice vs. Other Adult Admissions
68Source: OASAS
26,541 27,486
41,152 39,448
2008 2011
IMPACT Outpatient Admissions
CJ Other
66,934-759
(-1%)
-1,704(-4%)
+945(+4%)
67,693
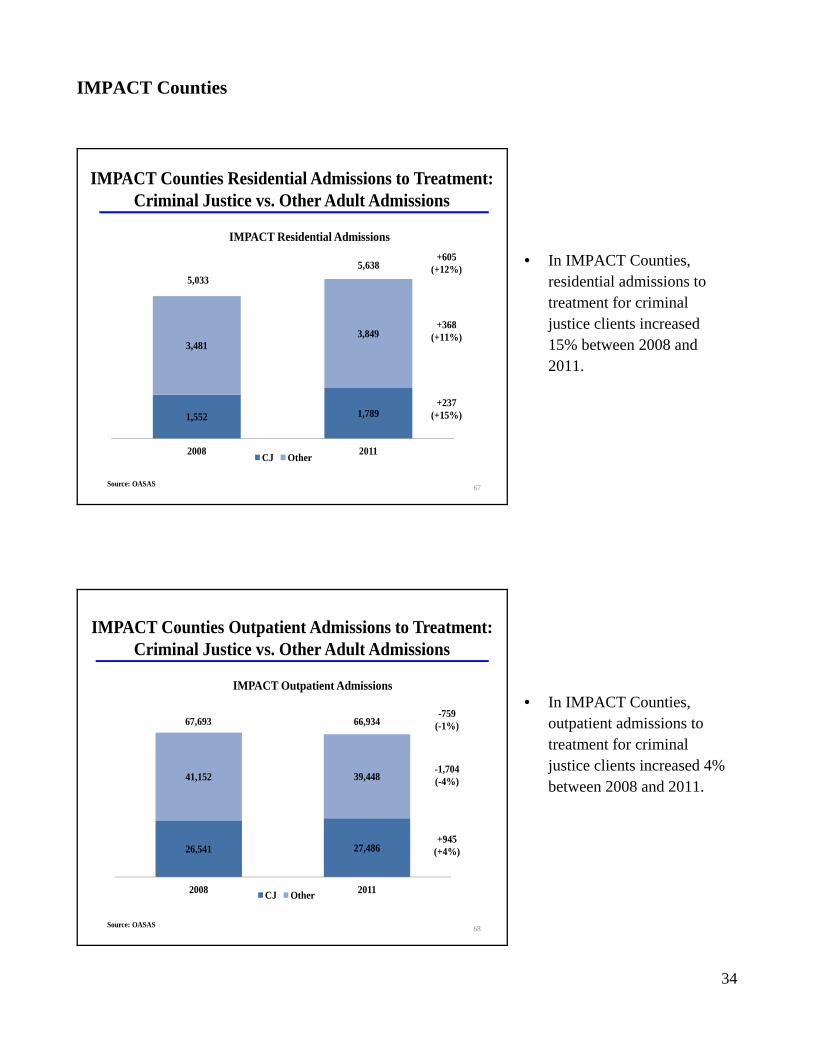
• In IMPACT Counties, residential admissions to treatment for criminal justice clients increased 15% between 2008 and 2011.
• In IMPACT Counties, outpatient admissions to treatment for criminal justice clients increased 4% between 2008 and 2011.
35
Other Counties
Other Counties Residential Admissions to Treatment: Criminal Justice and Other Adult Admissions
69Source: OASAS
501 549
1,1711,381
2008 2011
Other Counties Residential Admissions
CJ Other
1,930
+48(+10%)
+210(+18%)
+258(+15%)
1,672
Other Counties Outpatient Admissions to Treatment: Criminal Justice vs. Other Adult Admissions
70Source: OASAS
7,927 8,237
11,480 11,155
2008 2011
Other Counties Outpatient Admissions
CJ Other
19,407 19,392 -15(<1%)
-325(-3%)
+310(+4%)
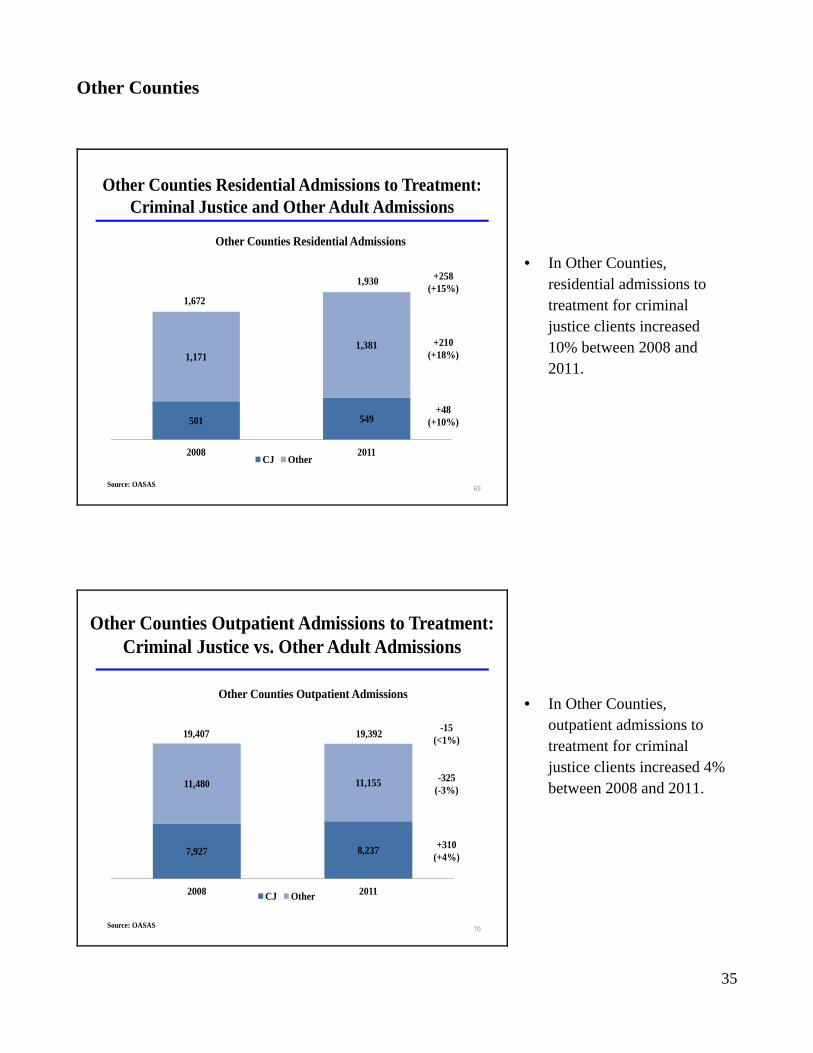
• In Other Counties, residential admissions to treatment for criminal justice clients increased 10% between 2008 and 2011.
• In Other Counties, outpatient admissions to treatment for criminal justice clients increased 4% between 2008 and 2011.
36
Other Information
Criminal Justice Populations Down
71Source: DCJS
NYS Criminal Justice Populations
Region Dec-99 Dec-08 Dec-11 % chg 2011 vs. 1999
% chg 2011 vs. 2008
New York City
Jails 15,959 12,692 11,998 -25% -5%
Probation 48,898 44,022 39,415 -19% -10%
Prison 46,798 30,201 26,108 -44% -14%
Parole 33,733 23,383 20,661 -39% -12%
Total 145,388 110,298 98,182 -32% -11%
Rest of State
Jails 15,787 16,385 16,748 6% 2%
Probation 87,631 78,142 78,376 -11% 0%
Prison 24,674 29,880 28,948 17% -3%
Parole 17,373 18,372 16,904 -3% -8%
Total 145,465 142,779 140,976 -3% -1%
Felony Drug Sentences to Probation Decreased
Source: DCJS 73
Felony Drug Sentences to Probation
RegionYear
% chg 2011 vs. 2008
2008 2009 2010 2011
NYC 1,409 1,123 907 789 -44%
IMPACT 1,353 1,229 1,038 965 -29%
Other Counties 380 404 448 444 17%
Statewide 3,142 2,756 2,393 2,198 -30%
NYC Felony Drug Offender Jail Census Down
321 314 250
-
500
1,000
1,500
2,000
2,500
2009 2010 2011
Sentenced
2,1401,887
1,559
0
500
1,000
1,500
2,000
2,500
2009 2010 2011
Unsentenced
NYC Rikers IslandFelony Drug Offenders (As of December 2011/Average)
74Source: NYCDOC
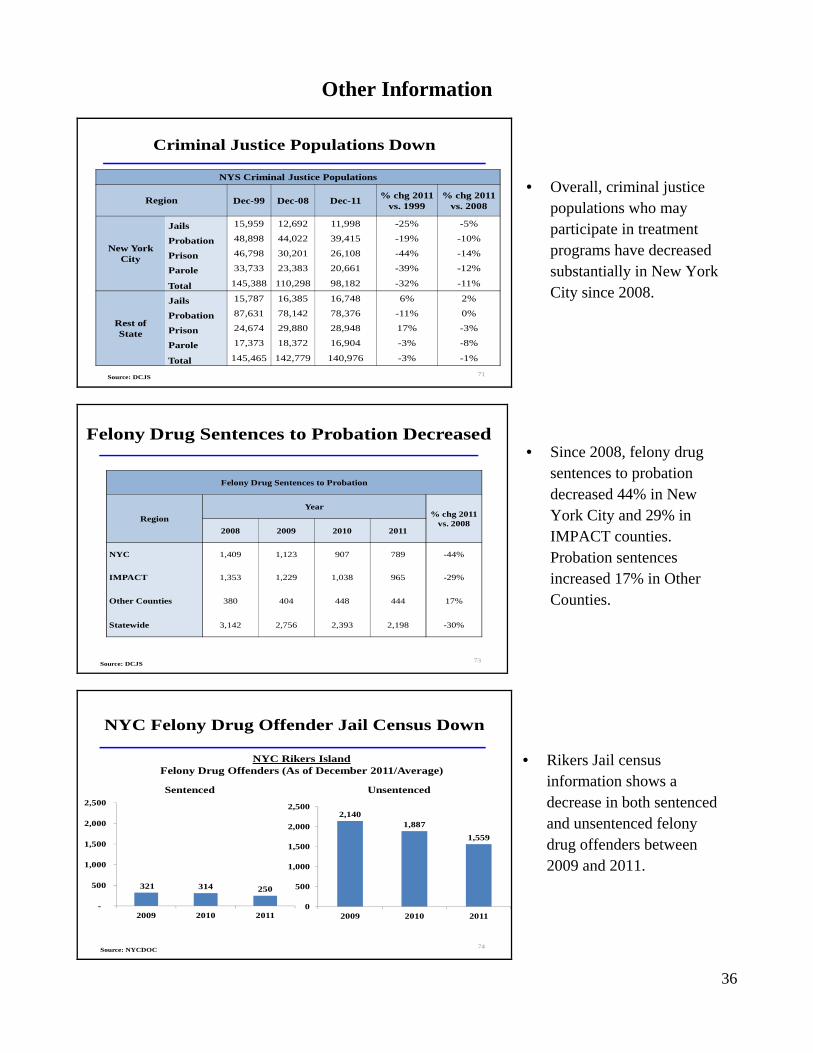
• Overall, criminal justice
populations who may participate in treatment programs have decreased substantially in New York City since 2008.
• Since 2008, felony drug sentences to probation decreased 44% in New York City and 29% in IMPACT counties. Probation sentences increased 17% in Other Counties.
• Rikers Jail census
information shows a decrease in both sentenced and unsentenced felony drug offenders between 2009 and 2011.
37
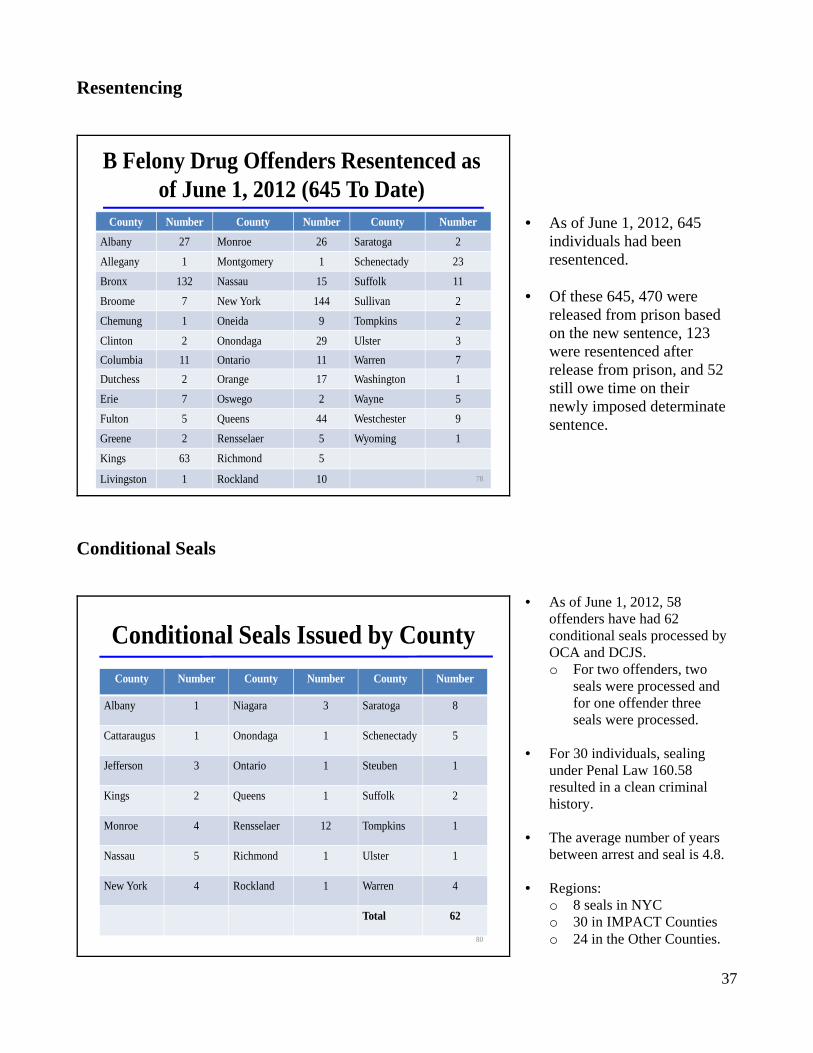
Resentencing
B Felony Drug Offenders Resentenced as of June 1, 2012 (645 To Date)
County Number County Number County Number
Albany 27 Monroe 26 Saratoga 2
Allegany 1 Montgomery 1 Schenectady 23
Bronx 132 Nassau 15 Suffolk 11
Broome 7 New York 144 Sullivan 2
Chemung 1 Oneida 9 Tompkins 2
Clinton 2 Onondaga 29 Ulster 3Columbia 11 Ontario 11 Warren 7Dutchess 2 Orange 17 Washington 1
Erie 7 Oswego 2 Wayne 5
Fulton 5 Queens 44 Westchester 9
Greene 2 Rensselaer 5 Wyoming 1
Kings 63 Richmond 5
Livingston 1 Rockland 10 78
Conditional Seals
County Number County Number County Number
Albany 1 Niagara 3 Saratoga 8
Cattaraugus 1 Onondaga 1 Schenectady 5
Jefferson 3 Ontario 1 Steuben 1
Kings 2 Queens 1 Suffolk 2
Monroe 4 Rensselaer 12 Tompkins 1
Nassau 5 Richmond 1 Ulster 1
New York 4 Rockland 1 Warren 4
Total 62
Conditional Seals Issued by County
80
• As of June 1, 2012, 645 individuals had been resentenced.
• Of these 645, 470 were released from prison based on the new sentence, 123 were resentenced after release from prison, and 52 still owe time on their newly imposed determinate sentence.
• As of June 1, 2012, 58 offenders have had 62 conditional seals processed by OCA and DCJS. o For two offenders, two
seals were processed and for one offender three seals were processed.
• For 30 individuals, sealing under Penal Law 160.58 resulted in a clean criminal history.
• The average number of years between arrest and seal is 4.8.
• Regions: o 8 seals in NYC o 30 in IMPACT Counties o 24 in the Other Counties.
38
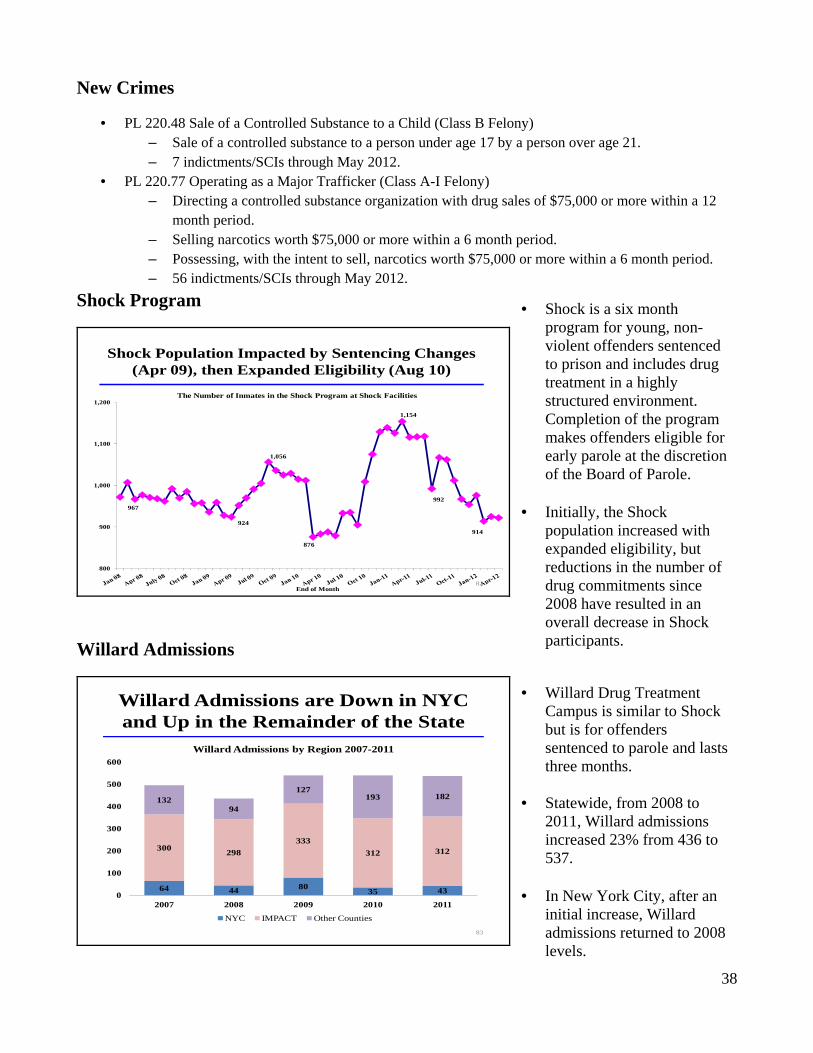
New Crimes
• PL 220.48 Sale of a Controlled Substance to a Child (Class B Felony) – Sale of a controlled substance to a person under age 17 by a person over age 21. – 7 indictments/SCIs through May 2012.
• PL 220.77 Operating as a Major Trafficker (Class A-I Felony) – Directing a controlled substance organization with drug sales of $75,000 or more within a 12
month period. – Selling narcotics worth $75,000 or more within a 6 month period. – Possessing, with the intent to sell, narcotics worth $75,000 or more within a 6 month period. – 56 indictments/SCIs through May 2012.
Shock Program
Shock Population Impacted by Sentencing Changes (Apr 09), then Expanded Eligibility (Aug 10)
967
924
1,056
876
1,154
992
914
800
900
1,000
1,100
1,200
End of Month
The Number of Inmates in the Shock Program at Shock Facilities
82
Willard Admissions
Willard Admissions are Down in NYC and Up in the Remainder of the State
83
64 44 80 35 43
300 298333
312 312
13294
127193 182
0
100
200
300
400
500
600
2007 2008 2009 2010 2011
Willard Admissions by Region 2007-2011
NYC IMPACT Other Counties
• Willard Drug Treatment Campus is similar to Shock but is for offenders sentenced to parole and lasts three months.
• Statewide, from 2008 to
2011, Willard admissions increased 23% from 436 to 537.
• In New York City, after an initial increase, Willard admissions returned to 2008 levels.
• Shock is a six month program for young, non-violent offenders sentenced to prison and includes drug treatment in a highly structured environment. Completion of the program makes offenders eligible for early parole at the discretion of the Board of Parole.
• Initially, the Shock population increased with expanded eligibility, but reductions in the number of drug commitments since 2008 have resulted in an overall decrease in Shock participants.
39
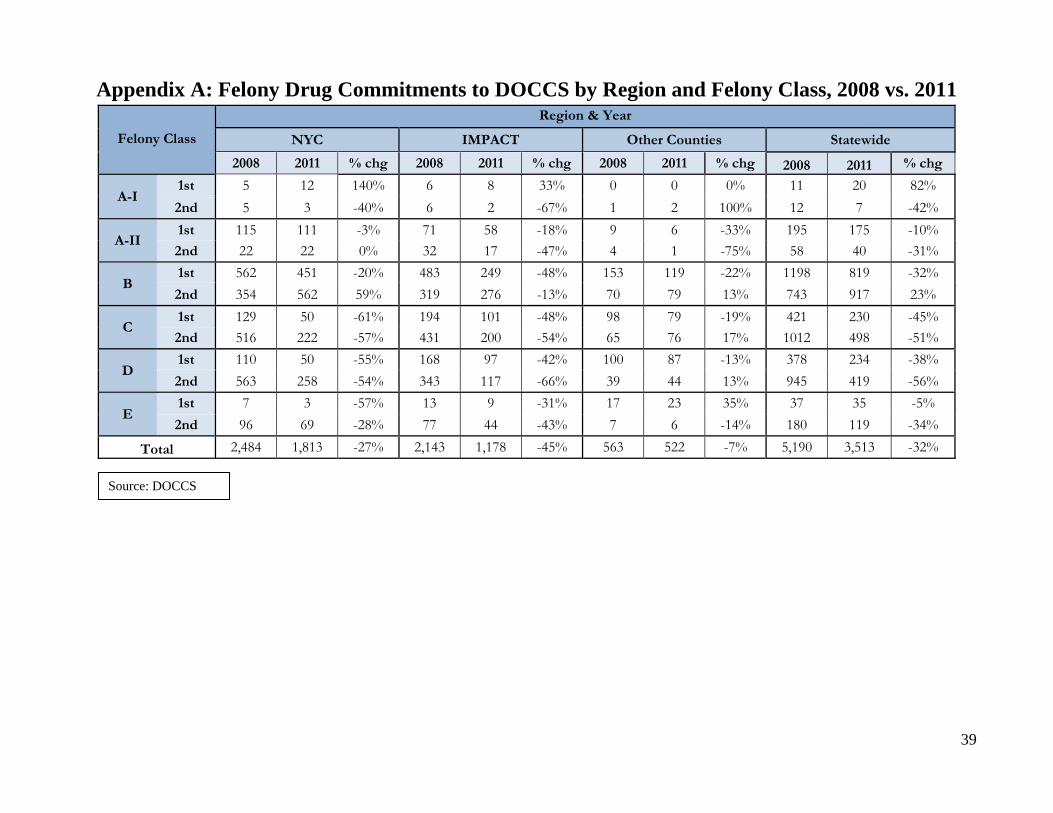
Appendix A: Felony Drug Commitments to DOCCS by Region and Felony Class, 2008 vs. 2011
Felony Class
Region & Year
NYC IMPACT Other Counties Statewide
2008 2011 % chg 2008 2011 % chg 2008 2011 % chg 2008 2011 % chg
A-I 1st 5 12 140% 6 8 33% 0 0 0% 11 20 82% 2nd 5 3 -40% 6 2 -67% 1 2 100% 12 7 -42%
A-II 1st 115 111 -3% 71 58 -18% 9 6 -33% 195 175 -10% 2nd 22 22 0% 32 17 -47% 4 1 -75% 58 40 -31%
B 1st 562 451 -20% 483 249 -48% 153 119 -22% 1198 819 -32% 2nd 354 562 59% 319 276 -13% 70 79 13% 743 917 23%
C 1st 129 50 -61% 194 101 -48% 98 79 -19% 421 230 -45% 2nd 516 222 -57% 431 200 -54% 65 76 17% 1012 498 -51%
D 1st 110 50 -55% 168 97 -42% 100 87 -13% 378 234 -38% 2nd 563 258 -54% 343 117 -66% 39 44 13% 945 419 -56%
E 1st 7 3 -57% 13 9 -31% 17 23 35% 37 35 -5% 2nd 96 69 -28% 77 44 -43% 7 6 -14% 180 119 -34%
Total 2,484 1,813 -27% 2,143 1,178 -45% 563 522 -7% 5,190 3,513 -32%
Source: DOCCS
40
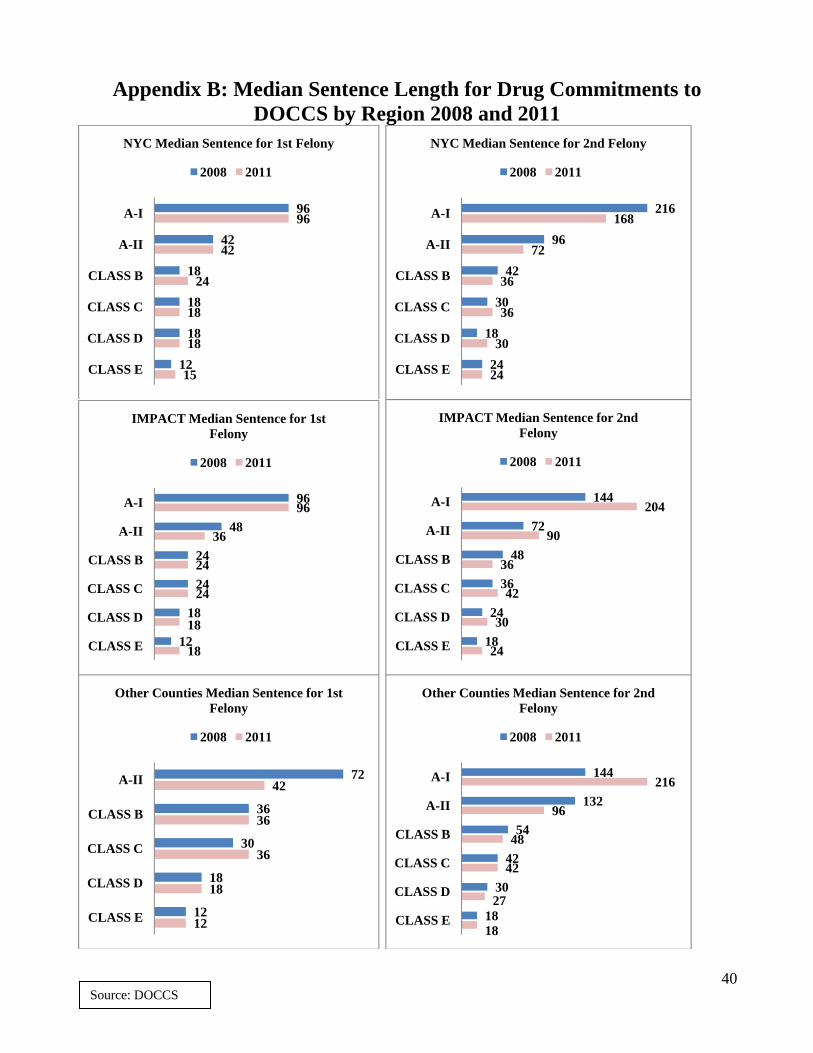
Appendix B: Median Sentence Length for Drug Commitments to DOCCS by Region 2008 and 2011
96
42
18
18
18
12
96
42
24
18
18
15
A-I
A-II
CLASS B
CLASS C
CLASS D
CLASS E
NYC Median Sentence for 1st Felony
2008 2011
216
96
42
30
18
24
168
72
36
36
30
24
A-I
A-II
CLASS B
CLASS C
CLASS D
CLASS E
NYC Median Sentence for 2nd Felony
2008 2011
96
48
24
24
18
12
96
36
24
24
18
18
A-I
A-II
CLASS B
CLASS C
CLASS D
CLASS E
IMPACT Median Sentence for 1st Felony
2008 2011
144
72
48
36
24
18
204
90
36
42
30
24
A-I
A-II
CLASS B
CLASS C
CLASS D
CLASS E
IMPACT Median Sentence for 2nd Felony
2008 2011
72
36
30
18
12
42
36
36
18
12
A-II
CLASS B
CLASS C
CLASS D
CLASS E
Other Counties Median Sentence for 1st Felony
2008 2011
144
132
54
42
30
18
216
96
48
42
27
18
A-I
A-II
CLASS B
CLASS C
CLASS D
CLASS E
Other Counties Median Sentence for 2nd Felony
2008 2011
Source: DOCCS
41
Appendix C Five Year Trends: Felony Drug Arrests by County 2007-2011
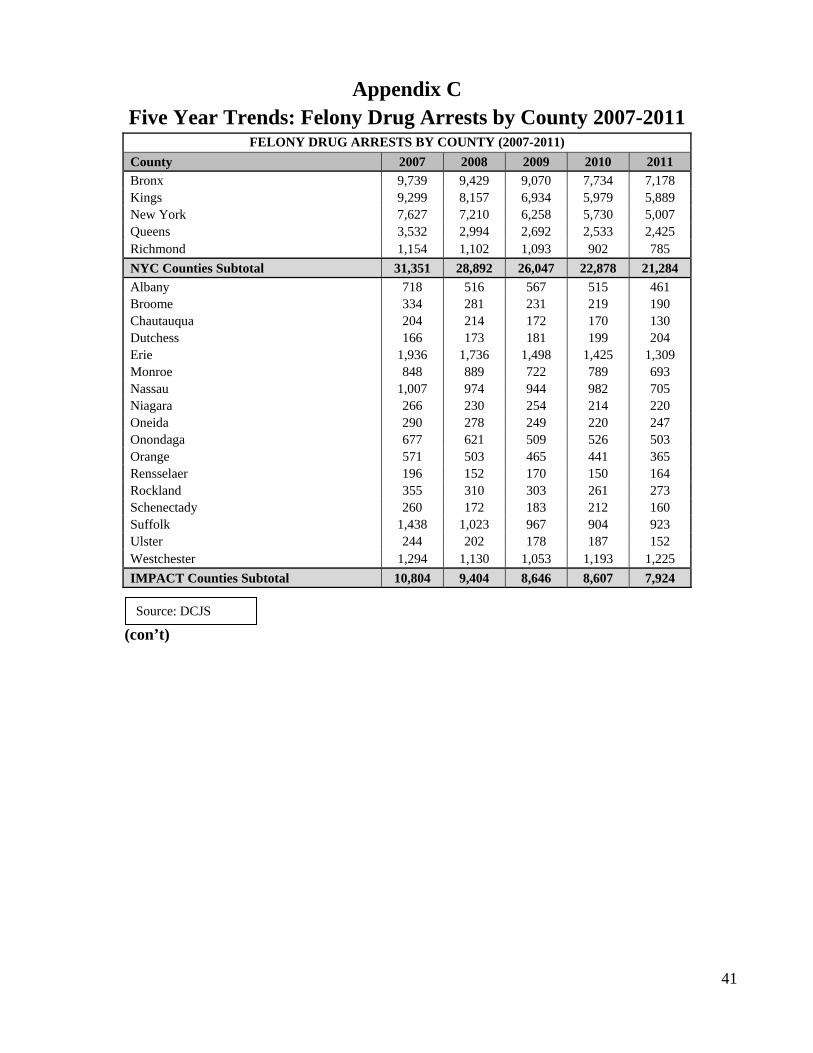
FELONY DRUG ARRESTS BY COUNTY (2007-2011) County 2007 2008 2009 2010 2011 Bronx 9,739 9,429 9,070 7,734 7,178 Kings 9,299 8,157 6,934 5,979 5,889 New York 7,627 7,210 6,258 5,730 5,007 Queens 3,532 2,994 2,692 2,533 2,425 Richmond 1,154 1,102 1,093 902 785 NYC Counties Subtotal 31,351 28,892 26,047 22,878 21,284 Albany 718 516 567 515 461 Broome 334 281 231 219 190 Chautauqua 204 214 172 170 130 Dutchess 166 173 181 199 204 Erie 1,936 1,736 1,498 1,425 1,309 Monroe 848 889 722 789 693 Nassau 1,007 974 944 982 705 Niagara 266 230 254 214 220 Oneida 290 278 249 220 247 Onondaga 677 621 509 526 503 Orange 571 503 465 441 365 Rensselaer 196 152 170 150 164 Rockland 355 310 303 261 273 Schenectady 260 172 183 212 160 Suffolk 1,438 1,023 967 904 923 Ulster 244 202 178 187 152 Westchester 1,294 1,130 1,053 1,193 1,225 IMPACT Counties Subtotal 10,804 9,404 8,646 8,607 7,924
(con’t)
Source: DCJS
42
Appendix C (cont’d) Five Year Trends: Felony Drug Arrests by County 2007-2011
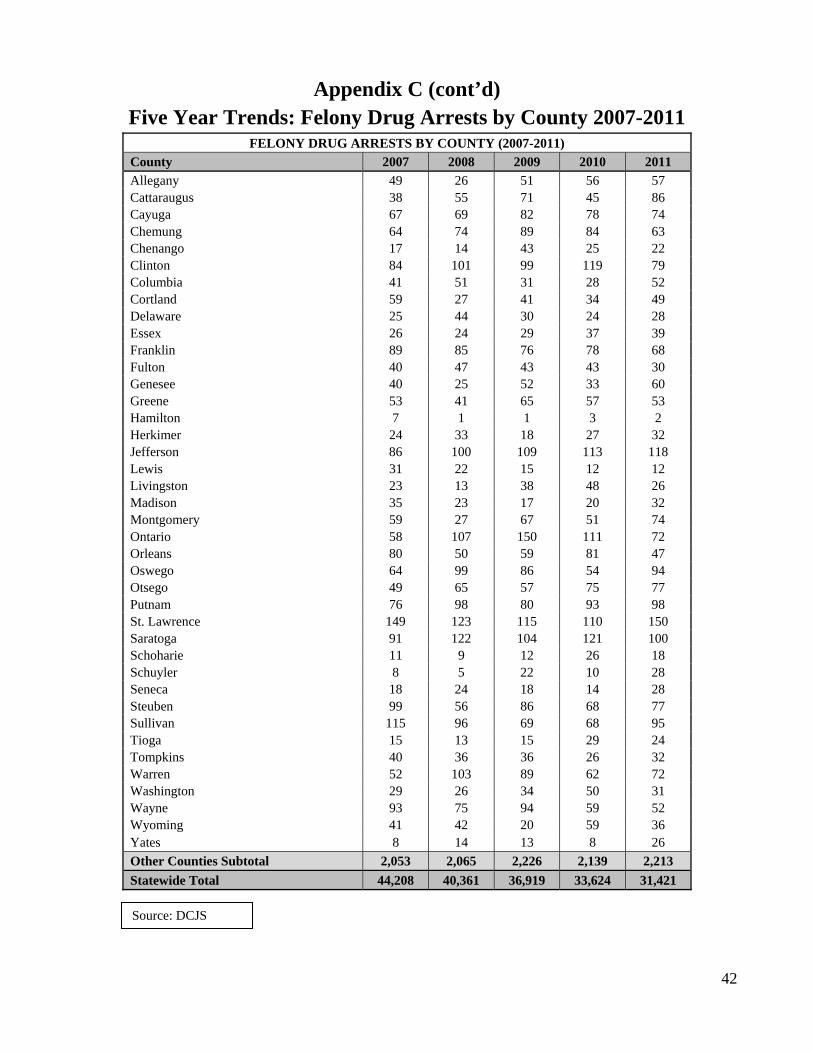
FELONY DRUG ARRESTS BY COUNTY (2007-2011) County 2007 2008 2009 2010 2011 Allegany 49 26 51 56 57 Cattaraugus 38 55 71 45 86 Cayuga 67 69 82 78 74 Chemung 64 74 89 84 63 Chenango 17 14 43 25 22 Clinton 84 101 99 119 79 Columbia 41 51 31 28 52 Cortland 59 27 41 34 49 Delaware 25 44 30 24 28 Essex 26 24 29 37 39 Franklin 89 85 76 78 68 Fulton 40 47 43 43 30 Genesee 40 25 52 33 60 Greene 53 41 65 57 53 Hamilton 7 1 1 3 2 Herkimer 24 33 18 27 32 Jefferson 86 100 109 113 118 Lewis 31 22 15 12 12 Livingston 23 13 38 48 26 Madison 35 23 17 20 32 Montgomery 59 27 67 51 74 Ontario 58 107 150 111 72 Orleans 80 50 59 81 47 Oswego 64 99 86 54 94 Otsego 49 65 57 75 77 Putnam 76 98 80 93 98 St. Lawrence 149 123 115 110 150 Saratoga 91 122 104 121 100 Schoharie 11 9 12 26 18 Schuyler 8 5 22 10 28 Seneca 18 24 18 14 28 Steuben 99 56 86 68 77 Sullivan 115 96 69 68 95 Tioga 15 13 15 29 24 Tompkins 40 36 36 26 32 Warren 52 103 89 62 72 Washington 29 26 34 50 31 Wayne 93 75 94 59 52 Wyoming 41 42 20 59 36 Yates 8 14 13 8 26 Other Counties Subtotal 2,053 2,065 2,226 2,139 2,213 Statewide Total 44,208 40,361 36,919 33,624 31,421
Source: DCJS
43
Appendix D Five Year Trends: Felony Drug Indictments/SCIs by County 2007-2011
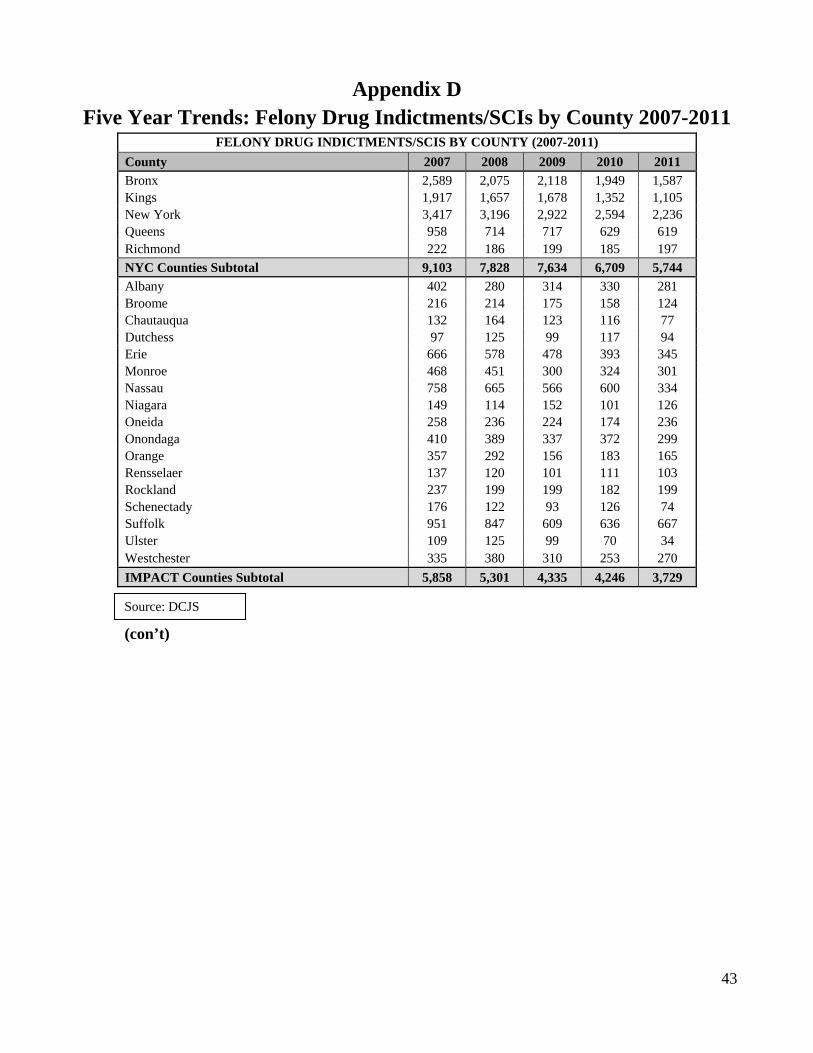
FELONY DRUG INDICTMENTS/SCIS BY COUNTY (2007-2011) County 2007 2008 2009 2010 2011 Bronx 2,589 2,075 2,118 1,949 1,587 Kings 1,917 1,657 1,678 1,352 1,105 New York 3,417 3,196 2,922 2,594 2,236 Queens 958 714 717 629 619 Richmond 222 186 199 185 197 NYC Counties Subtotal 9,103 7,828 7,634 6,709 5,744 Albany 402 280 314 330 281 Broome 216 214 175 158 124 Chautauqua 132 164 123 116 77 Dutchess 97 125 99 117 94 Erie 666 578 478 393 345 Monroe 468 451 300 324 301 Nassau 758 665 566 600 334 Niagara 149 114 152 101 126 Oneida 258 236 224 174 236 Onondaga 410 389 337 372 299 Orange 357 292 156 183 165 Rensselaer 137 120 101 111 103 Rockland 237 199 199 182 199 Schenectady 176 122 93 126 74 Suffolk 951 847 609 636 667 Ulster 109 125 99 70 34 Westchester 335 380 310 253 270 IMPACT Counties Subtotal 5,858 5,301 4,335 4,246 3,729
(con’t)
Source: DCJS
44
Appendix D (cont’d)
Five Year Trends: Felony Drug Indictments/SCIs by County 2007-2011 FELONY DRUG INDICTMENTS/SCIS BY COUNTY (2007-2011)
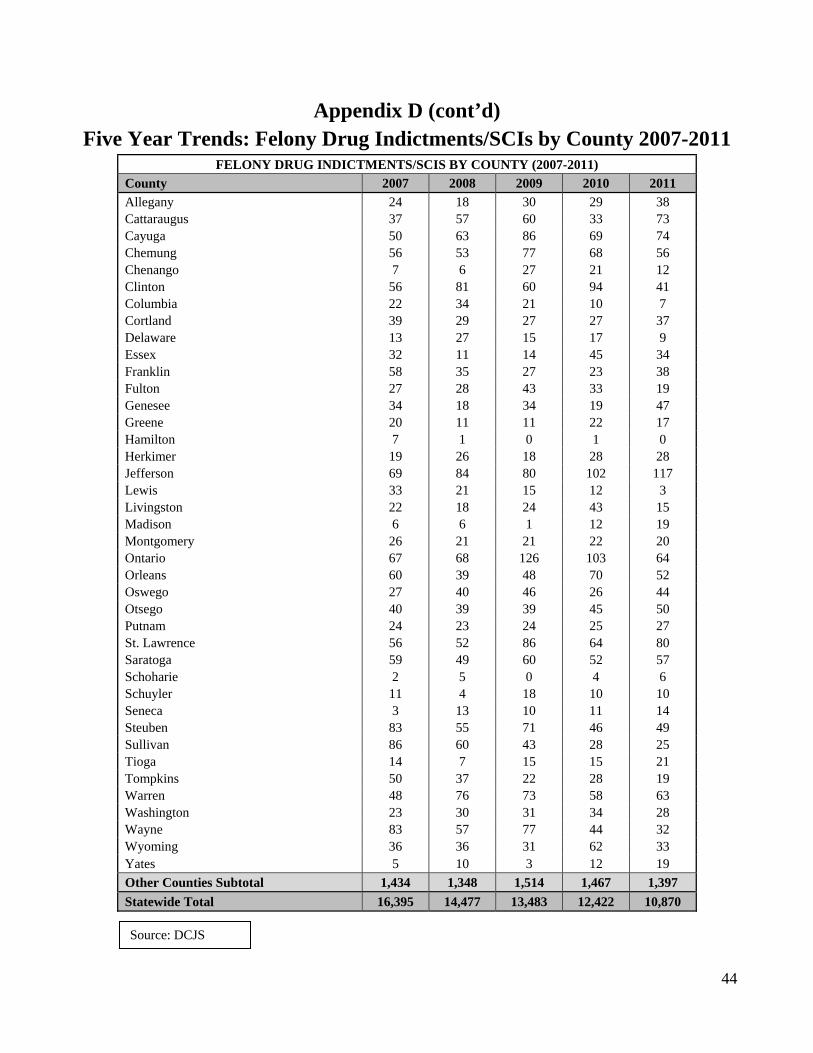
County 2007 2008 2009 2010 2011 Allegany 24 18 30 29 38 Cattaraugus 37 57 60 33 73 Cayuga 50 63 86 69 74 Chemung 56 53 77 68 56 Chenango 7 6 27 21 12 Clinton 56 81 60 94 41 Columbia 22 34 21 10 7 Cortland 39 29 27 27 37 Delaware 13 27 15 17 9 Essex 32 11 14 45 34 Franklin 58 35 27 23 38 Fulton 27 28 43 33 19 Genesee 34 18 34 19 47 Greene 20 11 11 22 17 Hamilton 7 1 0 1 0 Herkimer 19 26 18 28 28 Jefferson 69 84 80 102 117 Lewis 33 21 15 12 3 Livingston 22 18 24 43 15 Madison 6 6 1 12 19 Montgomery 26 21 21 22 20 Ontario 67 68 126 103 64 Orleans 60 39 48 70 52 Oswego 27 40 46 26 44 Otsego 40 39 39 45 50 Putnam 24 23 24 25 27 St. Lawrence 56 52 86 64 80 Saratoga 59 49 60 52 57 Schoharie 2 5 0 4 6 Schuyler 11 4 18 10 10 Seneca 3 13 10 11 14 Steuben 83 55 71 46 49 Sullivan 86 60 43 28 25 Tioga 14 7 15 15 21 Tompkins 50 37 22 28 19 Warren 48 76 73 58 63 Washington 23 30 31 34 28 Wayne 83 57 77 44 32 Wyoming 36 36 31 62 33 Yates 5 10 3 12 19 Other Counties Subtotal 1,434 1,348 1,514 1,467 1,397 Statewide Total 16,395 14,477 13,483 12,422 10,870
Source: DCJS
45
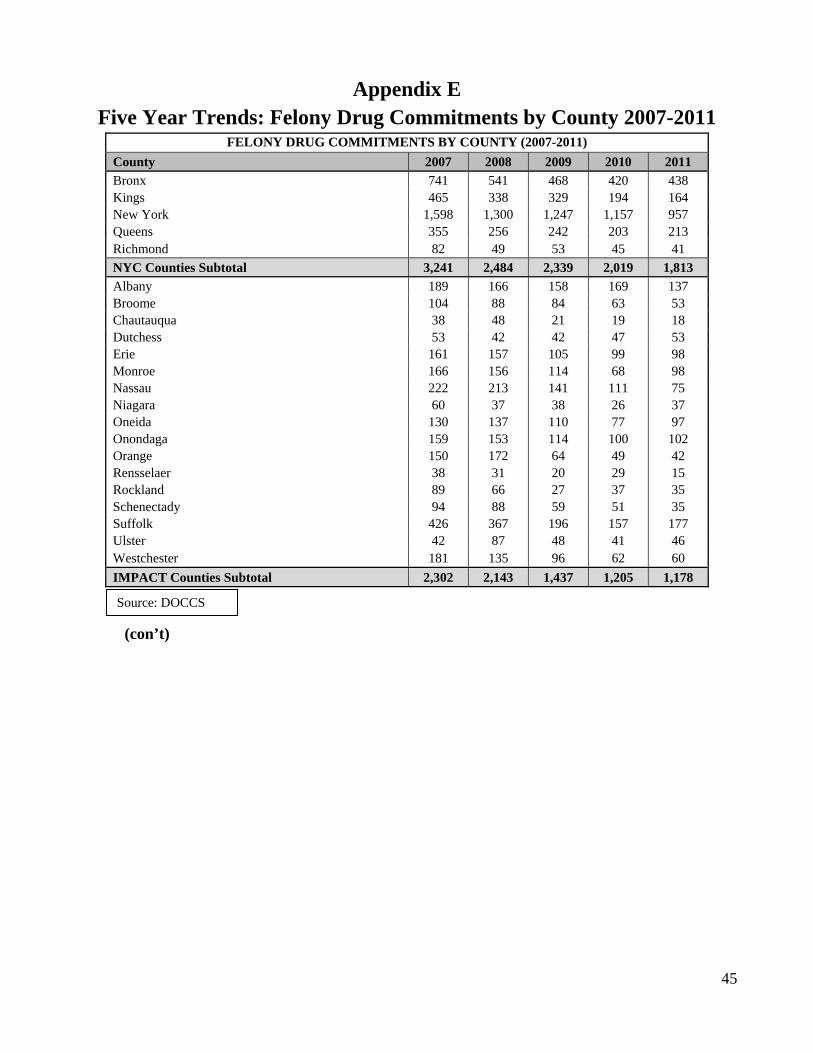
Appendix E Five Year Trends: Felony Drug Commitments by County 2007-2011
FELONY DRUG COMMITMENTS BY COUNTY (2007-2011) County 2007 2008 2009 2010 2011 Bronx 741 541 468 420 438 Kings 465 338 329 194 164 New York 1,598 1,300 1,247 1,157 957 Queens 355 256 242 203 213 Richmond 82 49 53 45 41 NYC Counties Subtotal 3,241 2,484 2,339 2,019 1,813 Albany 189 166 158 169 137 Broome 104 88 84 63 53 Chautauqua 38 48 21 19 18 Dutchess 53 42 42 47 53 Erie 161 157 105 99 98 Monroe 166 156 114 68 98 Nassau 222 213 141 111 75 Niagara 60 37 38 26 37 Oneida 130 137 110 77 97 Onondaga 159 153 114 100 102 Orange 150 172 64 49 42 Rensselaer 38 31 20 29 15 Rockland 89 66 27 37 35 Schenectady 94 88 59 51 35 Suffolk 426 367 196 157 177 Ulster 42 87 48 41 46 Westchester 181 135 96 62 60 IMPACT Counties Subtotal 2,302 2,143 1,437 1,205 1,178
(con’t)
Source: DOCCS
46
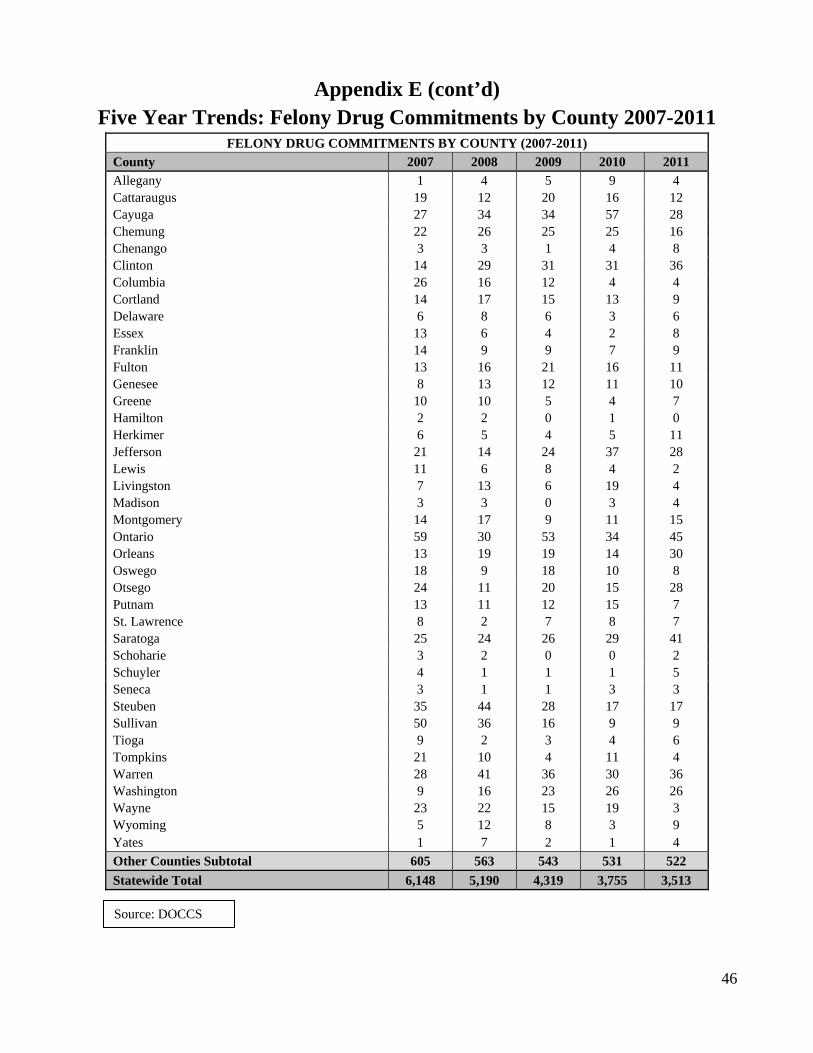
Appendix E (cont’d) Five Year Trends: Felony Drug Commitments by County 2007-2011
FELONY DRUG COMMITMENTS BY COUNTY (2007-2011) County 2007 2008 2009 2010 2011 Allegany 1 4 5 9 4 Cattaraugus 19 12 20 16 12 Cayuga 27 34 34 57 28 Chemung 22 26 25 25 16 Chenango 3 3 1 4 8 Clinton 14 29 31 31 36 Columbia 26 16 12 4 4 Cortland 14 17 15 13 9 Delaware 6 8 6 3 6 Essex 13 6 4 2 8 Franklin 14 9 9 7 9 Fulton 13 16 21 16 11 Genesee 8 13 12 11 10 Greene 10 10 5 4 7 Hamilton 2 2 0 1 0 Herkimer 6 5 4 5 11 Jefferson 21 14 24 37 28 Lewis 11 6 8 4 2 Livingston 7 13 6 19 4 Madison 3 3 0 3 4 Montgomery 14 17 9 11 15 Ontario 59 30 53 34 45 Orleans 13 19 19 14 30 Oswego 18 9 18 10 8 Otsego 24 11 20 15 28 Putnam 13 11 12 15 7 St. Lawrence 8 2 7 8 7 Saratoga 25 24 26 29 41 Schoharie 3 2 0 0 2 Schuyler 4 1 1 1 5 Seneca 3 1 1 3 3 Steuben 35 44 28 17 17 Sullivan 50 36 16 9 9 Tioga 9 2 3 4 6 Tompkins 21 10 4 11 4 Warren 28 41 36 30 36 Washington 9 16 23 26 26 Wayne 23 22 15 19 3 Wyoming 5 12 8 3 9 Yates 1 7 2 1 4 Other Counties Subtotal 605 563 543 531 522 Statewide Total 6,148 5,190 4,319 3,755 3,513
Source: DOCCS
47
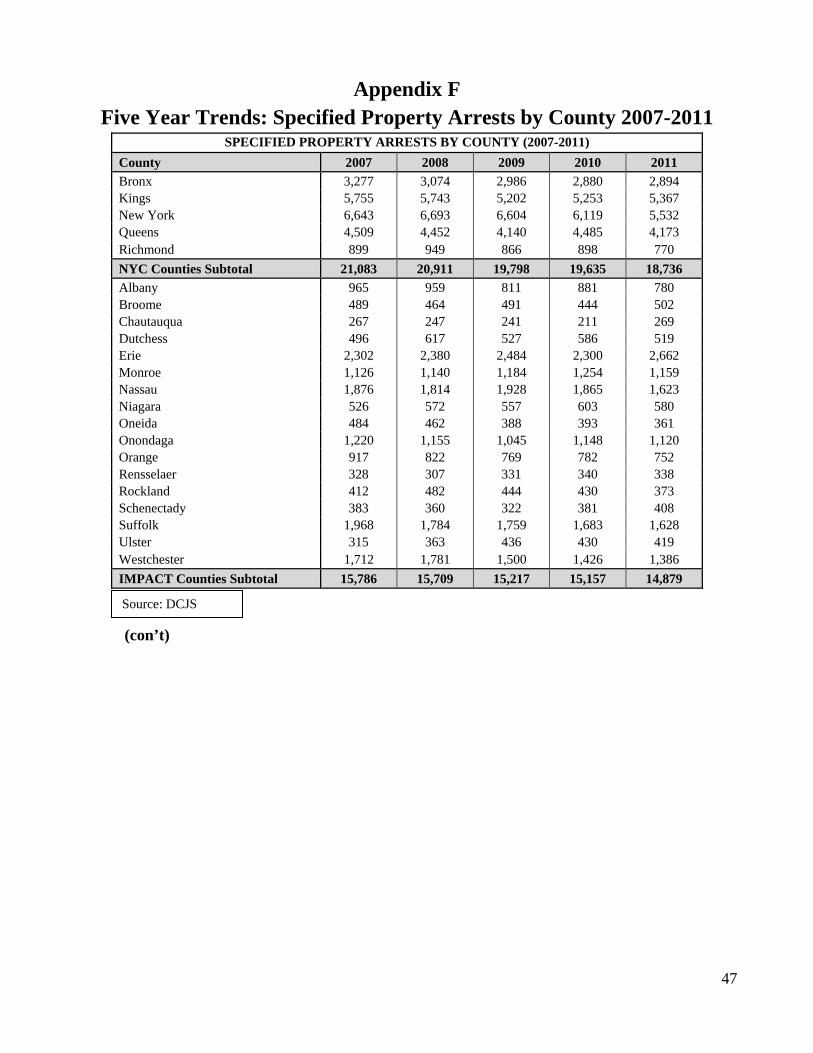
Appendix F Five Year Trends: Specified Property Arrests by County 2007-2011
SPECIFIED PROPERTY ARRESTS BY COUNTY (2007-2011) County 2007 2008 2009 2010 2011 Bronx 3,277 3,074 2,986 2,880 2,894 Kings 5,755 5,743 5,202 5,253 5,367 New York 6,643 6,693 6,604 6,119 5,532 Queens 4,509 4,452 4,140 4,485 4,173 Richmond 899 949 866 898 770 NYC Counties Subtotal 21,083 20,911 19,798 19,635 18,736 Albany 965 959 811 881 780 Broome 489 464 491 444 502 Chautauqua 267 247 241 211 269 Dutchess 496 617 527 586 519 Erie 2,302 2,380 2,484 2,300 2,662 Monroe 1,126 1,140 1,184 1,254 1,159 Nassau 1,876 1,814 1,928 1,865 1,623 Niagara 526 572 557 603 580 Oneida 484 462 388 393 361 Onondaga 1,220 1,155 1,045 1,148 1,120 Orange 917 822 769 782 752 Rensselaer 328 307 331 340 338 Rockland 412 482 444 430 373 Schenectady 383 360 322 381 408 Suffolk 1,968 1,784 1,759 1,683 1,628 Ulster 315 363 436 430 419 Westchester 1,712 1,781 1,500 1,426 1,386 IMPACT Counties Subtotal 15,786 15,709 15,217 15,157 14,879
(con’t)
Source: DCJS
48
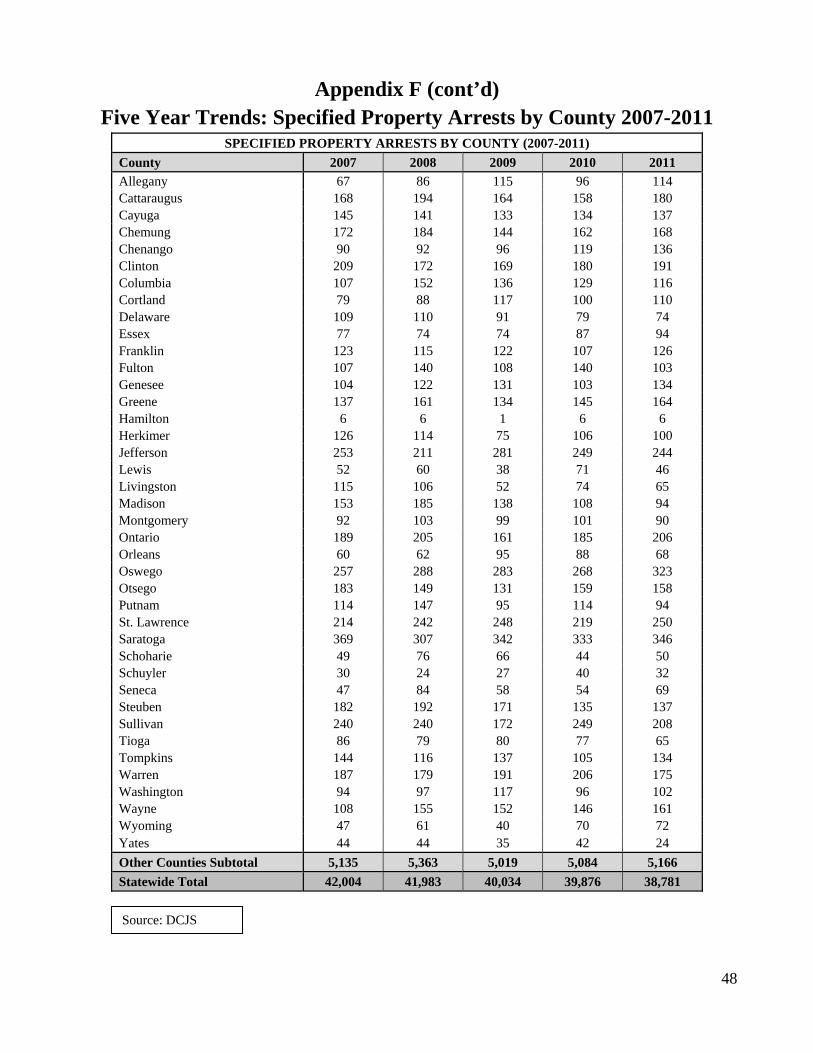
Appendix F (cont’d) Five Year Trends: Specified Property Arrests by County 2007-2011
SPECIFIED PROPERTY ARRESTS BY COUNTY (2007-2011) County 2007 2008 2009 2010 2011 Allegany 67 86 115 96 114 Cattaraugus 168 194 164 158 180 Cayuga 145 141 133 134 137 Chemung 172 184 144 162 168 Chenango 90 92 96 119 136 Clinton 209 172 169 180 191 Columbia 107 152 136 129 116 Cortland 79 88 117 100 110 Delaware 109 110 91 79 74 Essex 77 74 74 87 94 Franklin 123 115 122 107 126 Fulton 107 140 108 140 103 Genesee 104 122 131 103 134 Greene 137 161 134 145 164 Hamilton 6 6 1 6 6 Herkimer 126 114 75 106 100 Jefferson 253 211 281 249 244 Lewis 52 60 38 71 46 Livingston 115 106 52 74 65 Madison 153 185 138 108 94 Montgomery 92 103 99 101 90 Ontario 189 205 161 185 206 Orleans 60 62 95 88 68 Oswego 257 288 283 268 323 Otsego 183 149 131 159 158 Putnam 114 147 95 114 94 St. Lawrence 214 242 248 219 250 Saratoga 369 307 342 333 346 Schoharie 49 76 66 44 50 Schuyler 30 24 27 40 32 Seneca 47 84 58 54 69 Steuben 182 192 171 135 137 Sullivan 240 240 172 249 208 Tioga 86 79 80 77 65 Tompkins 144 116 137 105 134 Warren 187 179 191 206 175 Washington 94 97 117 96 102 Wayne 108 155 152 146 161 Wyoming 47 61 40 70 72 Yates 44 44 35 42 24 Other Counties Subtotal 5,135 5,363 5,019 5,084 5,166 Statewide Total 42,004 41,983 40,034 39,876 38,781
Source: DCJS
49
Appendix G Five Year Trends: Specified Property
Indictments/SCIs by County 2007-2011 SPECIFIED PROPERTY INDICTMENTS/SCIS BY COUNTY (2007-2011)
County 2007 2008 2009 2010 2011 Bronx 400 404 438 368 302 Kings 484 637 614 570 568 New York 1,069 1,121 1,233 1,206 1,227 Queens 520 568 479 479 585 Richmond 123 89 114 140 124 NYC Counties Subtotal 2,596 2,819 2,878 2,763 2,806 Albany 201 236 191 205 215 Broome 202 170 186 164 196 Chautauqua 121 119 99 121 114 Dutchess 74 89 101 115 105 Erie 356 360 350 309 235 Monroe 472 487 496 393 385 Nassau 400 292 336 350 259 Niagara 102 119 76 115 69 Oneida 185 165 168 168 119 Onondaga 375 267 250 318 295 Orange 231 166 235 193 202 Rensselaer 64 54 55 72 69 Rockland 95 151 163 143 142 Schenectady 106 99 59 75 63 Suffolk 586 584 422 550 580 Ulster 54 71 101 109 58 Westchester 140 204 171 145 160 IMPACT Counties Subtotal 3,764 3,633 3,459 3,545 3,266
(con’t)
Source: DCJS

50
Appendix G (cont’d) Five Year Trends: Specified Property
Indictments/SCIs by County 2007-2011 SPECIFIED PROPERTY INDICTMENTS/SCIS BY COUNTY (2007-2011)
County 2007 2008 2009 2010 2011 Allegany 23 37 33 34 19 Cattaraugus 45 83 75 60 61 Cayuga 18 52 59 44 52 Chemung 69 106 81 78 94 Chenango 21 25 31 43 70 Clinton 86 55 55 48 56 Columbia 20 51 48 41 27 Cortland 27 28 43 45 48 Delaware 16 24 16 22 24 Essex 9 36 16 15 25 Franklin 52 42 40 18 38 Fulton 35 55 41 56 45 Genesee 49 59 69 67 71 Greene 28 21 34 27 39 Hamilton 2 0 0 0 1 Herkimer 48 69 42 50 66 Jefferson 125 83 84 119 87 Lewis 92 97 23 43 25 Livingston 77 66 42 52 46 Madison 20 25 31 76 53 Montgomery 45 32 34 36 30 Ontario 116 141 121 110 122 Orleans 32 20 26 33 23 Oswego 92 112 61 106 127 Otsego 25 27 23 25 25 Putnam 14 21 21 22 25 St. Lawrence 88 76 70 56 86 Saratoga 66 60 70 62 70 Schoharie 11 16 35 9 8 Schuyler 16 15 18 22 21 Seneca 20 20 17 16 24 Steuben 90 94 64 66 67 Sullivan 121 82 65 71 89 Tioga 41 45 47 48 38 Tompkins 39 55 55 60 70 Warren 68 69 60 73 59 Washington 28 51 38 36 40 Wayne 66 52 51 60 57 Wyoming 35 32 27 35 34 Yates 26 27 15 27 17 Other Counties Subtotal 1,901 2,061 1,781 1,911 1,979 Statewide Total 8,261 8,513 8,118 8,219 8,051
Source: DCJS
51
Appendix H Five Year Trends: Specified Property Commitments by County 2007-2011
SPECIFIED PROPERTY COMMITMENTS BY COUNTY (2007-2011) County 2007 2008 2009 2010 2011 Bronx 106 97 93 90 78 Kings 149 133 141 131 127 New York 458 375 368 354 401 Queens 130 120 125 103 130 Richmond 31 30 28 30 22 NYC Counties Subtotal 874 755 755 708 758 Albany 72 75 90 61 76 Broome 34 40 18 27 36 Chautauqua 24 15 23 21 16 Dutchess 22 17 36 28 31 Erie 85 76 78 78 69 Monroe 97 91 85 64 63 Nassau 52 62 47 46 41 Niagara 37 20 26 31 26 Oneida 61 55 62 48 48 Onondaga 90 70 59 58 88 Orange 47 49 45 54 46 Rensselaer 14 9 12 14 10 Rockland 22 16 23 8 19 Schenectady 36 20 25 16 20 Suffolk 111 92 94 57 91 Ulster 18 13 22 28 43 Westchester 33 59 36 25 33 IMPACT Counties Subtotal 855 779 781 664 756
(con’t)
Source: DOCCS
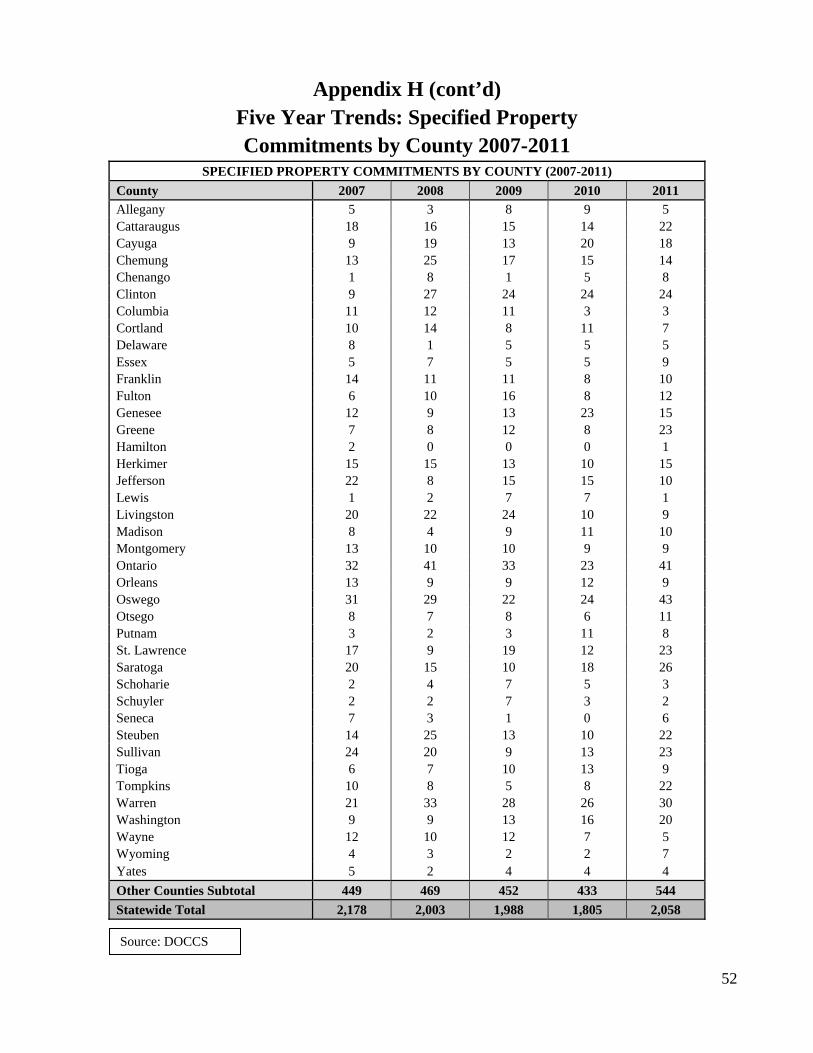
52
Appendix H (cont’d) Five Year Trends: Specified Property Commitments by County 2007-2011
SPECIFIED PROPERTY COMMITMENTS BY COUNTY (2007-2011) County 2007 2008 2009 2010 2011 Allegany 5 3 8 9 5 Cattaraugus 18 16 15 14 22 Cayuga 9 19 13 20 18 Chemung 13 25 17 15 14 Chenango 1 8 1 5 8 Clinton 9 27 24 24 24 Columbia 11 12 11 3 3 Cortland 10 14 8 11 7 Delaware 8 1 5 5 5 Essex 5 7 5 5 9 Franklin 14 11 11 8 10 Fulton 6 10 16 8 12 Genesee 12 9 13 23 15 Greene 7 8 12 8 23 Hamilton 2 0 0 0 1 Herkimer 15 15 13 10 15 Jefferson 22 8 15 15 10 Lewis 1 2 7 7 1 Livingston 20 22 24 10 9 Madison 8 4 9 11 10 Montgomery 13 10 10 9 9 Ontario 32 41 33 23 41 Orleans 13 9 9 12 9 Oswego 31 29 22 24 43 Otsego 8 7 8 6 11 Putnam 3 2 3 11 8 St. Lawrence 17 9 19 12 23 Saratoga 20 15 10 18 26 Schoharie 2 4 7 5 3 Schuyler 2 2 7 3 2 Seneca 7 3 1 0 6 Steuben 14 25 13 10 22 Sullivan 24 20 9 13 23 Tioga 6 7 10 13 9 Tompkins 10 8 5 8 22 Warren 21 33 28 26 30 Washington 9 9 13 16 20 Wayne 12 10 12 7 5 Wyoming 4 3 2 2 7 Yates 5 2 4 4 4 Other Counties Subtotal 449 469 452 433 544 Statewide Total 2,178 2,003 1,988 1,805 2,058
Source: DOCCS