2008 SPE Progressing Cavity Pumping - ALRDC - Home · 2008 SPE Progressing Cavity Pumping...
28
2008 SPE Progressing Cavity Pumping Conference and Exhibition Houston, Texas April 27 – 29, 2008 Value of Real-Time Data From Automated and Integrated Well Monitoring Systems in a Venezuelan Heavy Oil Project Ivan Prado – Production Engineer – PDVSA PetroPiar Lee Zabel – Product Line Manager - Weatherford
-
Upload
duongthuan -
Category
Documents
-
view
231 -
download
1
Transcript of 2008 SPE Progressing Cavity Pumping - ALRDC - Home · 2008 SPE Progressing Cavity Pumping...
2008 SPE Progressing Cavity Pumping Conference and Exhibition
Houston, Texas April 27 – 29, 2008
Value of Real-Time Data From Automated and Integrated Well Monitoring Systems in a Venezuelan Heavy Oil Project
Ivan Prado – Production Engineer – PDVSA PetroPiar
Lee Zabel – Product Line Manager - Weatherford
April 27 - 29, 2008 2008 Progessing Cavity Pumping Conference
2
Agenda
• Geographic Location and Operational Environment• Architecture• Workflow and Analysis• Operation Improvements• Benefits and Conclusions
April 27 - 29, 2008 2008 Progessing Cavity Pumping Conference
3
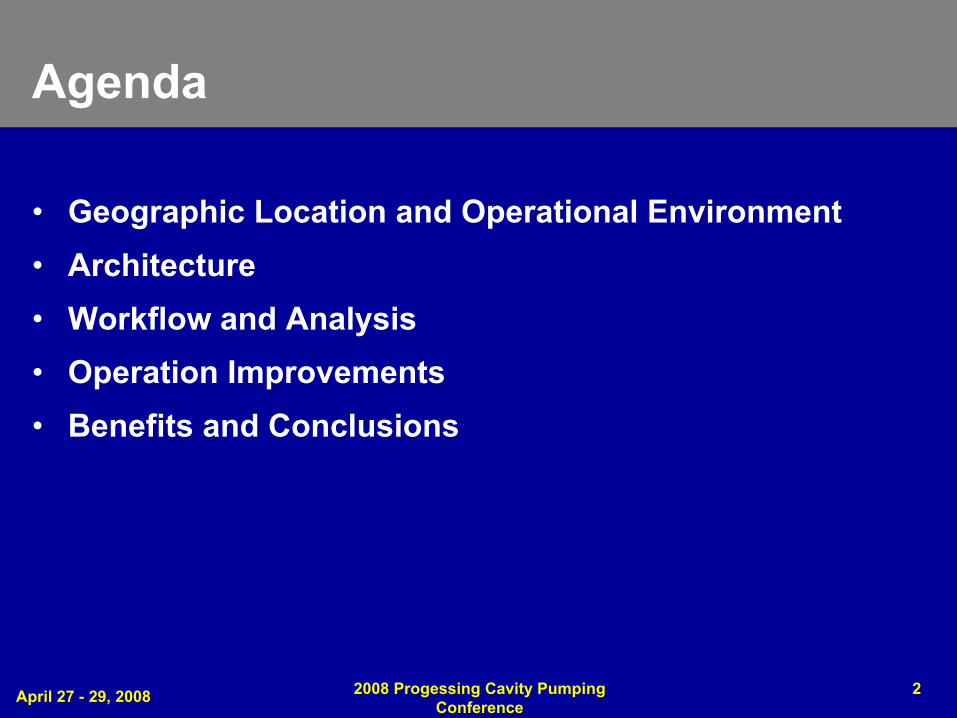
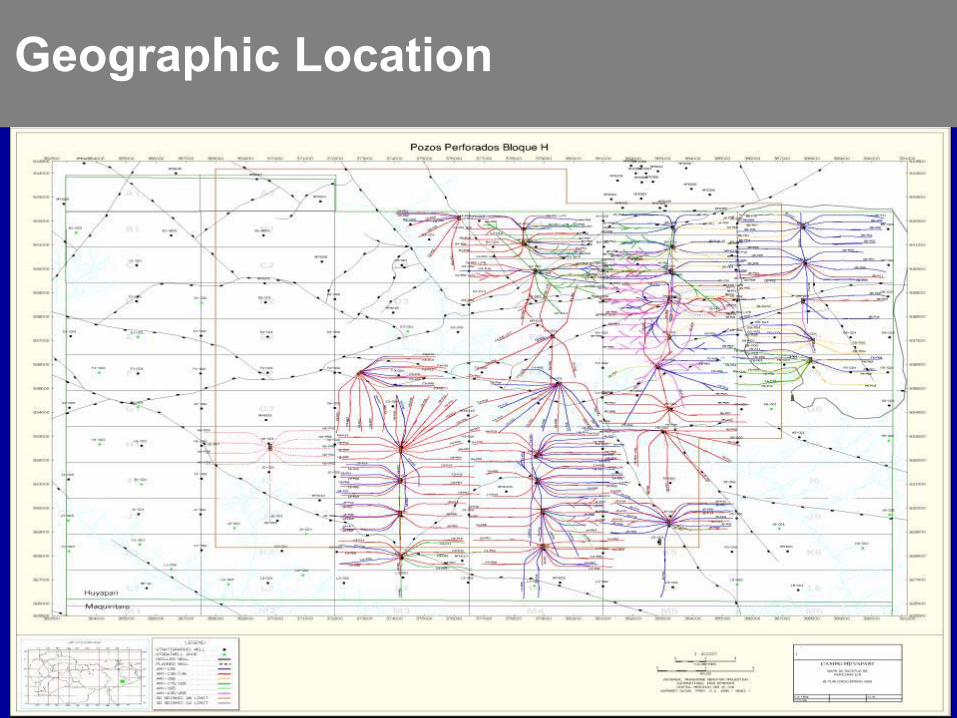
Geographic Location
Puerto La CruzPuerto La Cruz
Junin
Carabobo
BoyacáAyacucho
JoseJose
152 KmPDVSA PETROPIAR
PDVSA 70%
Chevron 30%
PETROECEDEÑO PETROANZOATEGUIPETROMONAGAS
CaracasCaracas
ORINOCO OIL BELTORINOCO OIL BELT
52 Km
VENEZUELA
ORINOCO OIL BELT
April 27 - 29, 2008 2008 Progessing Cavity Pumping Conference
4
Geographic Location
April 27 - 29, 2008 2008 Progessing Cavity Pumping Conference
5
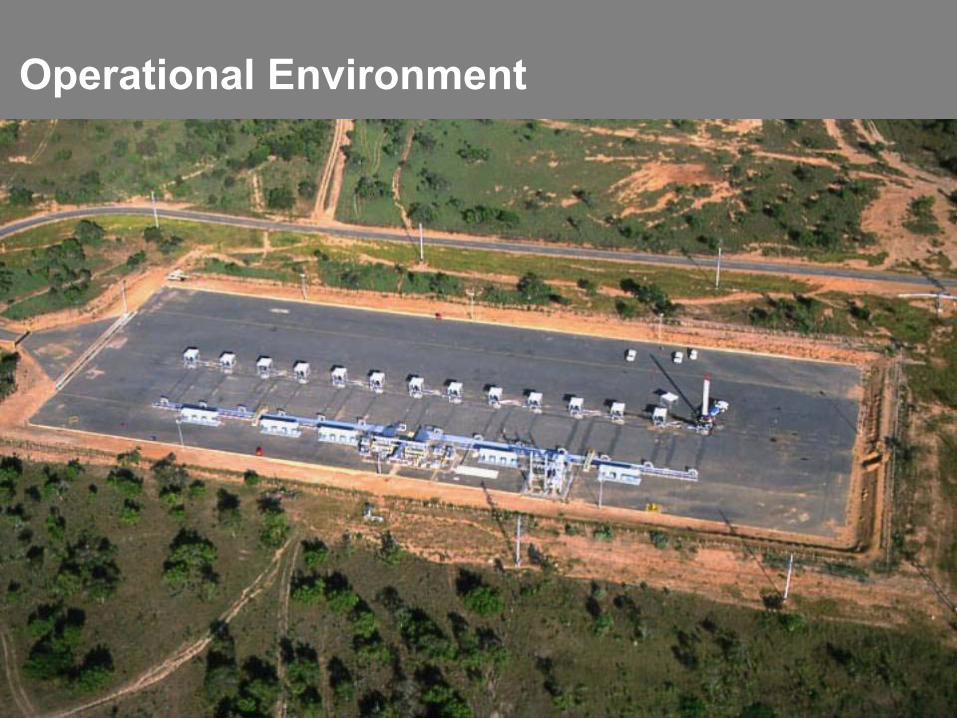
Operational Environment

April 27 - 29, 2008 2008 Progessing Cavity Pumping Conference
6
Operational Environment

April 27 - 29, 2008 2008 Progessing Cavity Pumping Conference
7
Operational Overview•• In the Faja area, PCPs are the artificial lift In the Faja area, PCPs are the artificial lift
system of choice. system of choice.
•• Most PCP systems around the world are Most PCP systems around the world are controlled by surface parameter controlled by surface parameter interpretation (Torque, Speed, Flow Rate)interpretation (Torque, Speed, Flow Rate)
•• To effectively operate and maximixe the To effectively operate and maximixe the run life of the large high capacity PCPrun life of the large high capacity PCP’’s, s, there is a necessity to know bottomhole there is a necessity to know bottomhole operating conditions (pressures and operating conditions (pressures and temperatures). temperatures).
•• This information helps to optimize This information helps to optimize operating, reservoir performance, operating, reservoir performance, simulation and forecastingsimulation and forecasting
•• Data adquisitation system have been Data adquisitation system have been implementedimplemented

April 27 - 29, 2008 2008 Progessing Cavity Pumping Conference
8
Architecture
• SCADA Host– csLIFT host server located at COB– Collects data from pressure sensors, VFDs, PLCs Wellpad
Manager Systems, XPIOs, and CS7X well test controllers.– Communication through fiber optic from well pads to COB– Communication from COB to Puerto La Cruz office– Provides monitoring and remote control of the field in COB– Provides monitoring access to all users at COB and Puerto
La Cruz office– Interfaces with main data base system (ORACLE)

April 27 - 29, 2008 2008 Progessing Cavity Pumping Conference
9
Architecture
• Wellpads– Data loggers collect the downhole information from
subsurface sensors and VFD readings.– Two different models of data loggers - CS7X and XPIO.– PLC controllers set and maintain diluent injection rates, and
collect well test data from the multiphase flow meters.– Data loggers and VFDs are skid mounted with one data
logger and three VFDs per skid.

April 27 - 29, 2008 2008 Progessing Cavity Pumping Conference
10
Oracle Database
DH Gauges
Well PadVariable
Well

April 27 - 29, 2008 2008 Progessing Cavity Pumping Conference
11
Work Flow Diagram
MONITORINGWells & MPPsMONITORINGWells & MPPs
Field Data
csPCP (Short Term)
csPCP (Short Term)
PHDPHD
Daily Production Report
Daily Production Report
Daily Production Plan
Daily Production Plan
Monthly Production&
Official Rep.
Monthly Production&
Official Rep.
Data Storage
Welltest (csWelltest)
Welltest (csWelltest)
OFM(Long Term)
OFM(Long Term)ORACLEORACLE
Simulation & Well Planing
Simulation & Well Planing
• Cum. Oil • Failure Analysis & Workovers• Maintenance• PI Decline Forecast
• Cum. Oil • Failure Analysis & Workovers• Maintenance• PI Decline Forecast
ExperionExperion

April 27 - 29, 2008 2008 Progessing Cavity Pumping Conference
12
Workflow and Analysis CASE
Monitoring(csPCP)
Alarm messages to easily detect problems
Daily monitoring of parameters to identify operationalconditions out of range, which allow prompt operator response to protect equipment

April 27 - 29, 2008 2008 Progessing Cavity Pumping Conference
13
Operation Improvements: Daily Production Plan
Production Plan takes intake pressure, torque and welltest data from CASE to update operations conditions and flowrates for next 24 hours
Intake Pressure and Torque from CASE
April 27 - 29, 2008 2008 Progessing Cavity Pumping Conference
14
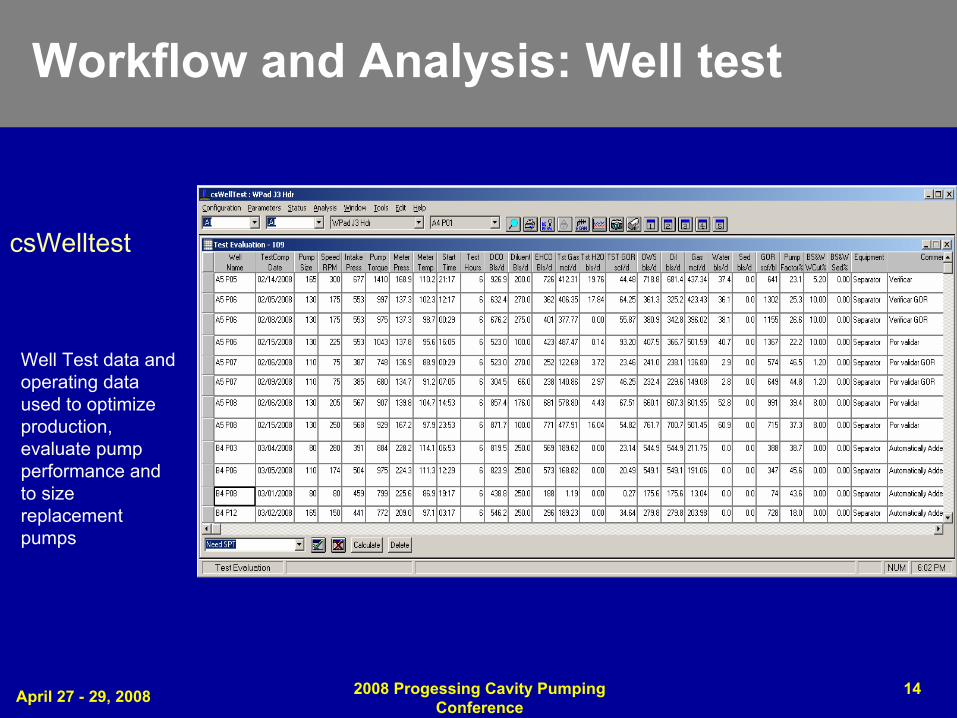
Workflow and Analysis: Well test
csWelltest
Well Test data and operating data used to optimize production, evaluate pump performance and to size replacement pumps
April 27 - 29, 2008 2008 Progessing Cavity Pumping Conference
15
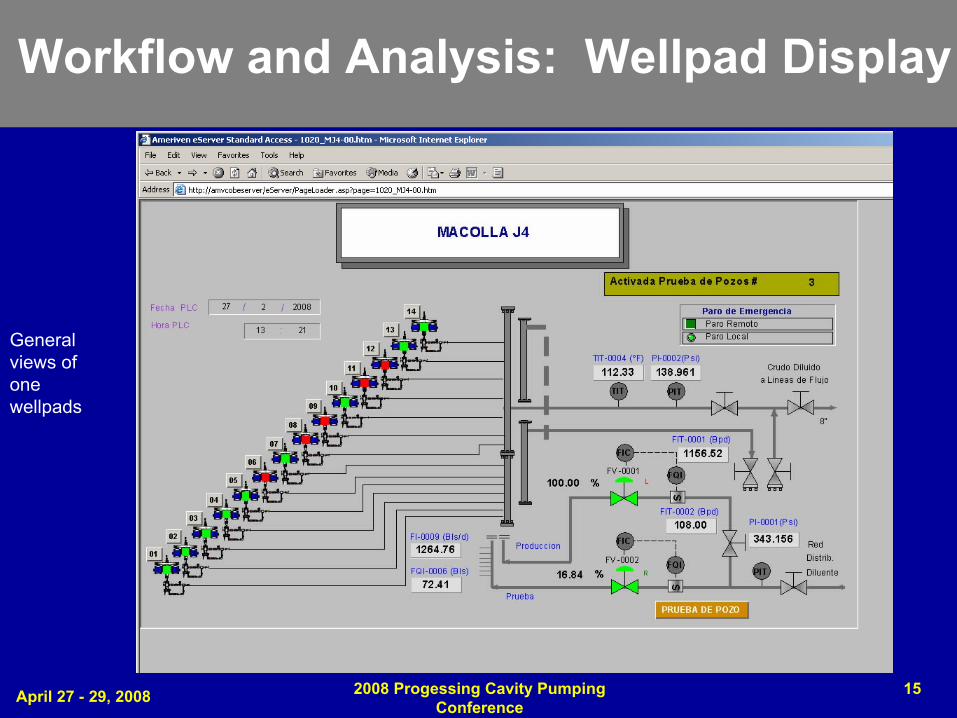
Workflow and Analysis: Wellpad Display
General views of one wellpads

April 27 - 29, 2008 2008 Progessing Cavity Pumping Conference
16
Workflow and Analysis: Wellbore Display
520.4 540.7
150.3 150.3
April 27 - 29, 2008 2008 Progessing Cavity Pumping Conference
17
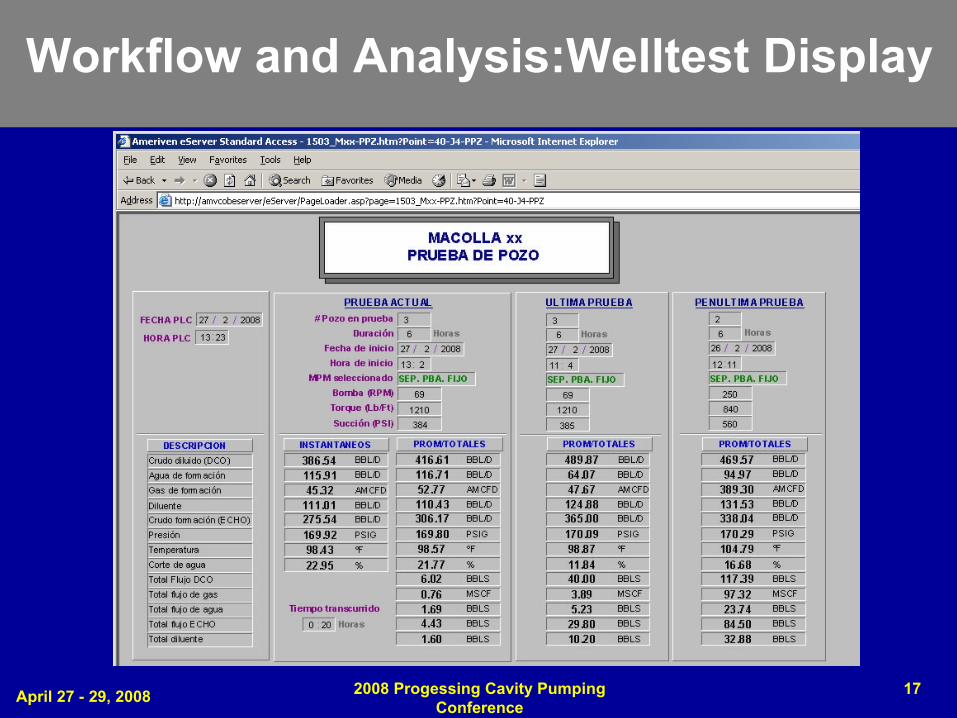
Workflow and Analysis:Welltest Display

April 27 - 29, 2008 2008 Progessing Cavity Pumping Conference
18
PHD – MPP Monitoring Graph

April 27 - 29, 2008 2008 Progessing Cavity Pumping Conference
19
Operation Improvements
Automated daily production reporting to operations and management

April 27 - 29, 2008 2008 Progessing Cavity Pumping Conference
20
Operation Improvements
•Automated monthly production reporting, including allocation factors and allocation of individual well production to reservoirs.
•Automated reporting to meet government requirements.
April 27 - 29, 2008 2008 Progessing Cavity Pumping Conference
21
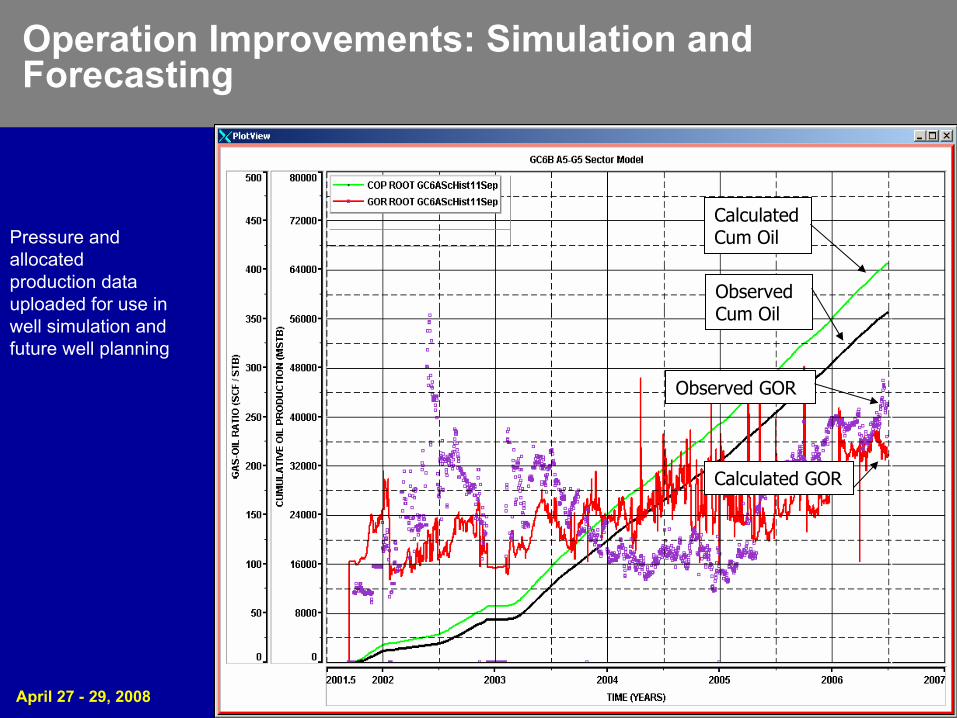
Operation Improvements: Simulation and Forecasting
Calculated Cum Oil
Observed Cum Oil
Observed GOR
Calculated GOR
Pressure and allocated production data uploaded for use in well simulation and future well planning

April 27 - 29, 2008 2008 Progessing Cavity Pumping Conference
22
Operation Improvements: Simulation and Forecasting
FIELD POTENTIAL
0
10000
20000
30000
40000
50000
60000
70000
80000
90000
100000
110000
120000
130000
140000
150000
160000
170000
180000
190000
200000
210000
220000
230000
240000
250000
7.7
7.75
7.8
7.85
7.9
7.95
8
8.05
8.1
8.15
8.2
8.25
8.3
POTENTIALPad J2 (38)Pad K2 (37)Pad L3 (36)Pad L4 (35)Pad G2 (34)Pad F2 (33)Pad G6 (32)Pad K5 (31)Pad H2 (30)Pad E6 (29)Pad C3 (28)Pad J5 (27)Pad F6 (26)Pad K4 (25)Pad K3 (24)Pad F3 (23)Pad J3 (22)Pad I3 (21)Pad H3 (20)Pad D6(19)Pad C6(18)Pad B6(17)Pad J4Pad I4Pad H4Pad H5Pad G5Pad E4Pad F5Pad B4(addn)Pad F4Pad E5Pad D5Pad C4Pad C5Pad B4(exist)Pad A4Pad B5Pad A5P90P50P10Field API
Historic PI decline trends (data from pressure gauges and production allocation) used to evaluate individual well capacity, total field capacity and for future field development plans
PRODUCTIVITY INDEX RATIO DECLINE
0.00
0.50
1.00
1.50
2.00
2.50
3.00
3.50
4.00
0 50 100 150 200 250 300 350
CUMULATIVE ALLOCATED OIL PRODUCTION (MSTB)
P.I.
Adjusted PI Match

April 27 - 29, 2008 2008 Progessing Cavity Pumping Conference
23
Operation Improvements: Failures
Daily monitoring of data and trends to identify new or impending pump failures
Short TermCs PCP GRAPH: F3 P02
TorqueRPMIntake PressureDescharge Pressure

April 27 - 29, 2008 2008 Progessing Cavity Pumping Conference
24
Operation Improvements: Failures
Daily monitoring of data and trends to identify new or impending pump failures
H3-P13 esta mostrando un incremento de presión de entrada y disminución de la presión de descarga sin haber variaciones de velocidad en un período de tiempo. Esto puede ser el inicio de una falla de la BCP. De ser este el caso la producción de este pozo sería cero 0 y se tendria que esperar a ser intervenido. Se recomienda ajustar a 250 RPM y realizar una prueba de flujo para determinar factor de bomba.
RPMIntake PressureDescharge Pressure
Torque

April 27 - 29, 2008 2008 Progessing Cavity Pumping Conference
25
2005 06 07 080
300
600
900
1200
1500
0
50
100
150
200
250
Date
Well Name: B5-P09
Operation Improvements: History
Pum
p Sp
eed
(RPM
)
OFM GRAPH
Middle and Long Term
Torq
ue (l
b.ft)
–In
take
Pre
ssur
e (p
si) –
Dis
char
ge P
ress
ure
(psi
)

April 27 - 29, 2008 2008 Progessing Cavity Pumping Conference
26
Benefits and Conclusions
• Real-Time Data from Automated and Integrated Monitoring System provides the following added value:
– Real time access to current operating conditions, as well as short-term, long-term historic data for trending, identifying failures
– Easy programming provides alarm conditions, quick operator response
– Allows proactive versus reactive decisions, reduces downtime anddeferred production
– Continuous PCP performance evaluation and production optimization
– Automated report generation
– Reduced operating cost , reduced manpower requirements
– Improved Reservoir Management and future field development planning
April 27 - 29, 2008 2008 Progessing Cavity Pumping Conference
27
SPECIAL THANKS
SPECIAL THANKS TO:PDVSA-PETROPIAR MANAGEMENTSHAMACA PRODUCTION ENGINEER STAFF
• Luisana Peraza• Maria Rodriguez• Javier Sanchez• Rafael Medina
Jack English - ChevronDavid Watts

April 27 - 29, 2008 2008 Progessing Cavity Pumping Conference
28
Questions...


![Electrochemical Hydrogen Pumping - Benicewicz Group€¦ · Electrochemical hydrogen pumping was first reported by Maget [4] while developing the SPE (Solid Polymer Electrolyte,](https://static.fdocuments.in/doc/165x107/5e97ed39bcca42041472d3db/electrochemical-hydrogen-pumping-benicewicz-group-electrochemical-hydrogen-pumping.jpg)