2008 305(b) Report - TN.gov
110
i 2012 305(b) Report The Status of Water Quality in Tennessee Division of Water Resources Tennessee Department of Environment and Conservation
Transcript of 2008 305(b) Report - TN.gov

i
2012 305(b) Report
The Status of Water Quality in Tennessee
Division of Water Resources
Tennessee Department of Environment and Conservation

ii

iii
The 2012 305(b) Report is dedicated
to the long and productive careers of:
Paul E. Davis and
Garland P. Wiggins
Director and Deputy Director
(1988-2012)
of the
Tennessee Division of Water
Pollution Control
1988 - 2012

iv
v
2012 305(b) Report
The Status of Water Quality in Tennessee
December 2012
Prepared by:
Gregory M. Denton
Michael H. Graf
Deborah H. Arnwine
Linda K. Cartwright
Geo-Indexing of Water Quality Information by:
Richard E. Cochran
Tennessee Department of Environment and Conservation
Division of Water Resources
401 Church Street
L&C Annex, 6th Floor
Nashville, Tennessee 37243-1534
615-532-0625
Cover Photo: Cummins Falls on the Blackburn Fork State Scenic River. Photo courtesy of Jim
McCullough.

vi
Table of Contents
2012 305(b) Report Page
Introduction to Tennessee’s Water Quality............................................. 1
Acknowledgments................................................................................... 2
Executive Summary................................................................................ 3
Statutory Requirements........................................................................... 5
Tennessee at a Glance............................................................................. 6
Cost of Water Pollution........................................................................... 8
Chapter 1 - Water Quality Assessment Process......................................................... 9
Chapter 2 - Water Quality Standards Attainment Status........................................... 33
Chapter 3 - Causes of Water Pollution....................................................................... 40
Chapter 4 - Sources of Water Pollution..................................................................... 54
Chapter 5 - Posted Streams, Rivers, and Reservoirs.................................................. 68
Chapter 6 - Success Stories….................................................................................... 82
Chapter 7 - Special Projects....................................................................................... 86
Chapter 8 - Public Participation................................................................................. 92
Definitions and Acronyms...................................................................... 96
References............................................................................................... 100
List of Tables Page Table 1: Outstanding National Resource Waters........................................................ 14
Table 2: Watershed Groups and Monitoring Schedule............................................... 18
Table 3: Data Submitted to the Division for Consideration in the 2012 Assessment
Process.........................................................................................................
23
Table 4: Assessed Stream Miles................................................................................. 33
Table 5: Individual Classified Use Support for Rivers and Streams.......................... 34
Table 6: Assessed Reservoir and Lake Acres............................................................. 35
Table 7: Individual Classified Use Support for Reservoirs and Lakes....................... 37
Table 8: Causes of Impairment in Assessed Rivers and Reservoirs........................... 52
Table 9: Sources of Pollutants in Assessed Rivers and Reservoirs............................ 55
Table 10: Bacteriological Advisories in Tennessee...................................................... 70
Table 11: Fish Tissue Advisories in Tennessee............................................................ 77
List of Figures Page Figure 1: Watershed Cycle............................................................................................. 16
Figure 2: Watershed Monitoring Groups....................................................................... 19
Figure 3: Percent of River and Stream Miles Monitored and Assessed........................ 32
Figure 4: Percent of Reservoir and Lake Acres Monitored and Assessed..................... 32
Figure 5: Percent of Rivers and Streams in Each Category........................................... 34
Figure 6: Percent Use Support for Individual Classified Uses in Assessed Rivers and
Streams............................................................................................................
35
Figure 7: Percent of Reservoir and Lake Acres in Each Category................................ 36
vii
Figure 8: Percent Use Support for Individual Uses in Assessed Reservoirs and
Lakes...............................................................................................................
37
Figure 9: Relative Impacts of Pollution in Impaired Rivers and Streams..................... 40
Figure 10: Relative Impacts of Pollution in Impaired Reservoir and Lake Acres........... 47
Figure 11: Percent Contribution of Pollution Sources in Impaired Rivers and Streams. 54
Figure 12: Sources of Agricultural Pollution in Impaired Rivers and Streams............... 58
Figure 13: Sources of Hydrologic Impairment in Rivers and Streams............................ 59
Figure 14: Percent Contribution of Pollution Sources in Impaired Reservoirs and
Lakes...............................................................................................................
65
Figure 15: Sources of Legacy Pollutants in Reservoirs and Lakes.................................. 66
Figure 16: Percent Contribution of Stream Miles Posted for Pathogen Contamination.. 69
Figure 17: Stream Miles Contaminated by Various Pathogen Sources........................... 69
Figure 18: Percent Contribution of Reservoir Acres Posted for Fish Tissue
Contamination.................................................................................................
73
Figure 19: Percent Contribution of Stream Miles Posted for Fish Tissue
Contamination.................................................................................................
73

viii
1
2012 305(b) Report
Status of Water Quality in Tennessee
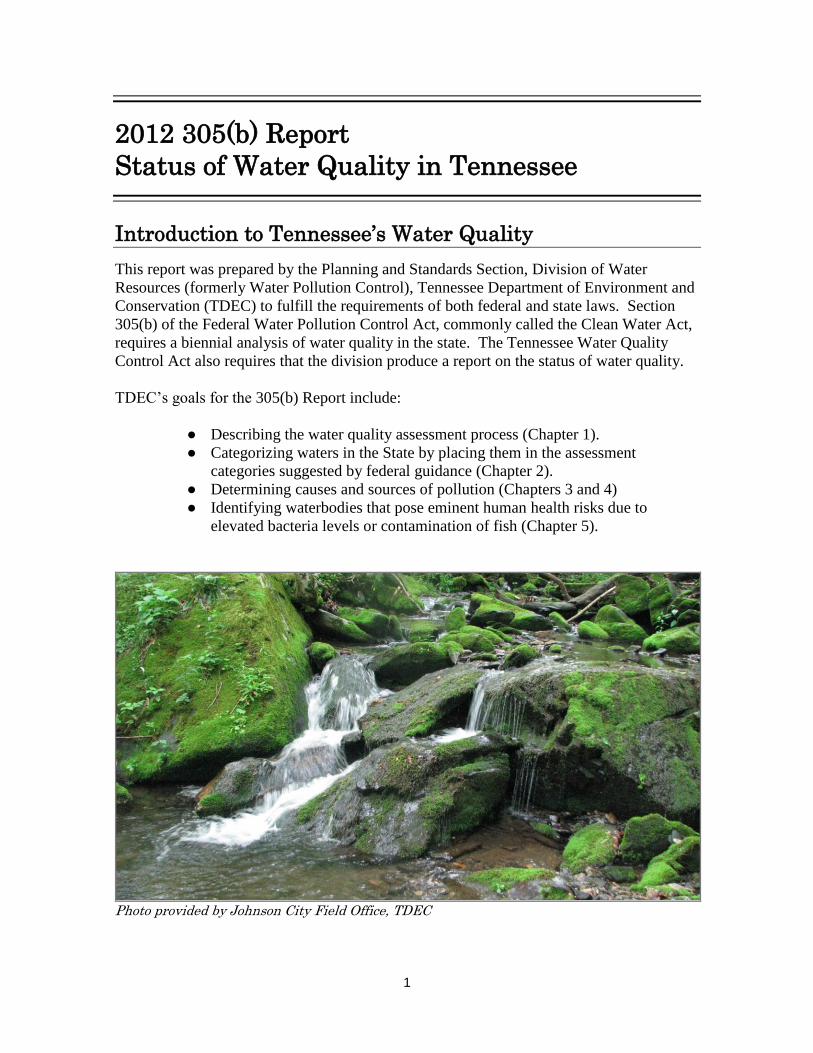
Introduction to Tennessee’s Water Quality
This report was prepared by the Planning and Standards Section, Division of Water
Resources (formerly Water Pollution Control), Tennessee Department of Environment and
Conservation (TDEC) to fulfill the requirements of both federal and state laws. Section
305(b) of the Federal Water Pollution Control Act, commonly called the Clean Water Act,
requires a biennial analysis of water quality in the state. The Tennessee Water Quality
Control Act also requires that the division produce a report on the status of water quality.
TDEC’s goals for the 305(b) Report include:
● Describing the water quality assessment process (Chapter 1).
● Categorizing waters in the State by placing them in the assessment
categories suggested by federal guidance (Chapter 2).
● Determining causes and sources of pollution (Chapters 3 and 4)
● Identifying waterbodies that pose eminent human health risks due to
elevated bacteria levels or contamination of fish (Chapter 5).
Photo provided by Johnson City Field Office, TDEC

2
Acknowledgments
The authors would like to express appreciation to the Division of Water Resources staff of
TDEC’s regional Environmental Field Offices (EFOs) who collected stream, river, and
reservoir data documented in this report. The managers of the staff in these offices during
the period covered by this report were:
Terry Templeton Memphis EFO
Pat Patrick (retired 6/12) Jackson EFO
Joey Holland (retired 12/12) Nashville EFO
Dick Urban Chattanooga EFO
Paul Schmierbach (retired 11/12) Knoxville EFO
Jeff Horton Johnson City EFO
Ryan Owens Columbia EFO
Bill Hall Cookeville EFO
The division acknowledges the support of the Department of Health, Environmental
Laboratories which performed the majority of chemical and biological analysis associated
with this report. Dr. Bob Read is the laboratory director.
The information compiled in this 2012 water quality assessment document included data
provided by many state and federal agencies. These agencies include Tennessee
Department of Health (TDH), Tennessee Valley Authority (TVA), U. S. Environmental
Protection Agency (EPA), Tennessee Wildlife Resources Agency (TWRA), U.S. Army
Corps of Engineers (USACE), and U.S. Geological Survey (USGS). The division is
grateful for their assistance and cooperation.
Photo provided by Nashville Environmental Field Office, TDEC

3
Executive Summary
The Clean Water Act, Section 305(b) (US Congress, 2002) and the Tennessee Water
Quality Control Act (Tennessee Secretary of State, 1999) both require a biennial report
about the status of water quality in the state. This report satisfies those requirements.
The Division of Water Resources is entrusted with protecting the people’s right to enjoy
clean water. In order to reach this goal, the division works to establish clean water
objectives, monitor surface water, and determine if the waters of the state support their
intended uses.
Water Quality Standards
There are seven designated uses for the waterways of the state. Those uses are defined in
Rules of Tennessee Department of Environment and Conservation, Division of Water
Pollution Control Chapter 1200-4-4. A different rule, Chapter 1200-4-3 identifies specific
water quality criteria, both numeric and narrative, and establishes the state’s
antidegradation policy, which deals with prevention of future damage to water quality.
Water quality standards are established for individual streams by identifying the most
stringent criteria for each assigned use, considering the streams antidegradation status.
These rules can be reviewed at http://tn.gov/sos/rules/1200/1200.htm.
Monitoring Programs
Tennessee has an abundance of water resources with over 60,000 miles of rivers and streams
and over 570,000 lake and reservoir acres. However, this vast system of streams, rivers,
reservoirs and wetlands requires efficient use of Tennessee’s monitoring resources.
TDEC’s watershed approach serves as an organizational framework for systematic
assessment of the state’s water quality. By viewing the entire drainage area or watershed
as a whole, the department is better able to schedule water quality monitoring, assessment,
and permitting activities, plus and stream restoration efforts. This unified approach affords
a more in-depth study of each watershed and encourages coordination of public and
governmental organizations. The watersheds are assessed on a five-year cycle that
coincides with permit issuance.
In addition to systematic watershed monitoring, sample data fulfill other information needs
within the division. Some of these other needs include continuation of the ecoregion
reference stream monitoring, Total Maximum Daily Load (TMDL) generation, complaint
investigation, antidegradation evaluations, trend analysis, compliance monitoring, and
special studies.
4
Assessment Process
Using a standardized assessment methodology, monitoring data from individual streams
are compared to water quality standards. Violations of water quality standards are
identified and the degree to which each individual waterbody meets its designated uses is
determined. Assessment categories recommended by EPA are used to characterize water
quality.
Assessment results are compiled and reported to the public periodically. The principal
vehicles for this water quality assessment reporting are the 305(b) Report and the 303(d)
List.
Water Quality
Over half of the stream miles and almost all the large reservoirs have recently been
monitored and assessed. Waters without data collected within the last five years are
usually identified as not assessed unless previously identified as impaired. About 58
percent of assessed streams and 68 percent of assessed reservoir acres are found to be fully
supporting of designated uses. The remainder of the assessed waterbodies are impaired to
some degree and therefore, not supporting of all designated uses.
Causes and Source of Pollution
Once it has been determined that a stream, river, or reservoir is not fully supporting of its
designated uses, it is necessary to determine what the pollutant is (cause) and where it is
coming from (source). The most common causes of pollution in rivers and streams are
sediment/silt, habitat alteration, pathogens, and nutrients. The main sources of these
pollutants are agriculture, hydrologic modification, municipal dischargers, and
construction. The leading causes of pollution in reservoirs and lakes are metals, low
dissolved oxygen, and organic substances, like PCBs, dioxins, and chlordane. The
principal sources of problems in reservoirs and lakes are the historical discharge of
pollutants that have accumulated in sediment and fish flesh, plus atmospheric deposition.
Other sources include agriculture, hydrologic modifications, municipal dischargers, and
construction.
Advisories
When streams or reservoirs are found to have significantly elevated bacteria levels or when
fish tissue contaminant levels exceed risk-based criteria, it is the responsibility of the
Department of Environment and Conservation to post warning signs so that people will be
aware of the potential threat to their health. In Tennessee, the most common reason for a
stream or river to be posted is mercury in fish tissue, followed by the presence of high
levels of bacteria. In lakes and reservoirs, the most common reason is accumulated PCBs,
chlordane, dioxins, or mercury in fish tissue.

5
Statutory Requirements
Tennessee first created a water pollution regulatory organization in 1927. In 1929, the
scope of that agency was expanded to include stream pollution studies to protect potential
water supplies. A Stream Pollution Study Board charged with evaluating all available
water quality data in Tennessee and locating the sources of pollution was appointed in
1943. The stream pollution study was completed and submitted to the General Assembly
in 1945. Subsequently, the General Assembly enacted Chapter 128, Public Acts of 1945.
The 1945 law was in effect until the Water Pollution Control Act of 1971 was passed. In
1972, the Federal Clean Water Act was enacted into law. According to the Act, states are
required to assess water quality and report the results to EPA and the public biennially.
The Tennessee General Assembly revised the Water Quality Control Act in 1977 and the
Department began statewide stream monitoring that same year.
In 1985, the Division of Water Quality Control was divided into the Divisions of Water
Pollution Control and Water Supply. In 2012, the Divisions of Water Pollution Control,
Ground Water Protection, and Water Supply merged into the Division of Water Resources.
The division monitors, analyzes, and reports on the quality of Tennessee's water. It is also
responsible for the non-coal surface mining program, permitting of wastewater discharges,
review of wastewater construction plans, facility inspections, compliance monitoring, and
enforcement of regulations. Stream channel modifications, wetland alterations or gravel
dredging are also regulated.
Other duties of the Division of Water Resources are to ensure that public drinking water
supplies are safe. The division also regulates the construction of non-federal dams,
enforces the Water Resources Act, monitors water withdrawals, approves on-site
wastewater treatment systems, and regulates the licensing of well drillers and pump setters.
In addition to the federal
requirements, the Tennessee
Water Quality Control Act of
1977 requires the Division of
Water Resources to produce a
report to the governor and the
general assembly on the status
of water quality in the state. The
2012 305(b) Report serves to
fulfill the requirements of both
the federal and state laws, which
emphasize the identification and
restoration of impaired waters.
This report covers only surface waters in Tennessee. Another document Tennessee
Ground Water 305(b) Water Quality Report is available online at
http://www.tn.gov/environment/water.
Recognizing that the waters of Tennessee are
the property of the state and are held in public
trust for the use of the people of the state, it is
declared to be the public policy of Tennessee
that the people of Tennessee, as beneficiaries of
this trust, have a right to unpolluted waters. In
the exercise of its public trust over the waters of
the state, the government of Tennessee has an
obligation to take all prudent steps to secure,
protect, and preserve this right. (The Tennessee
Water Quality Control Act, 1999)
6
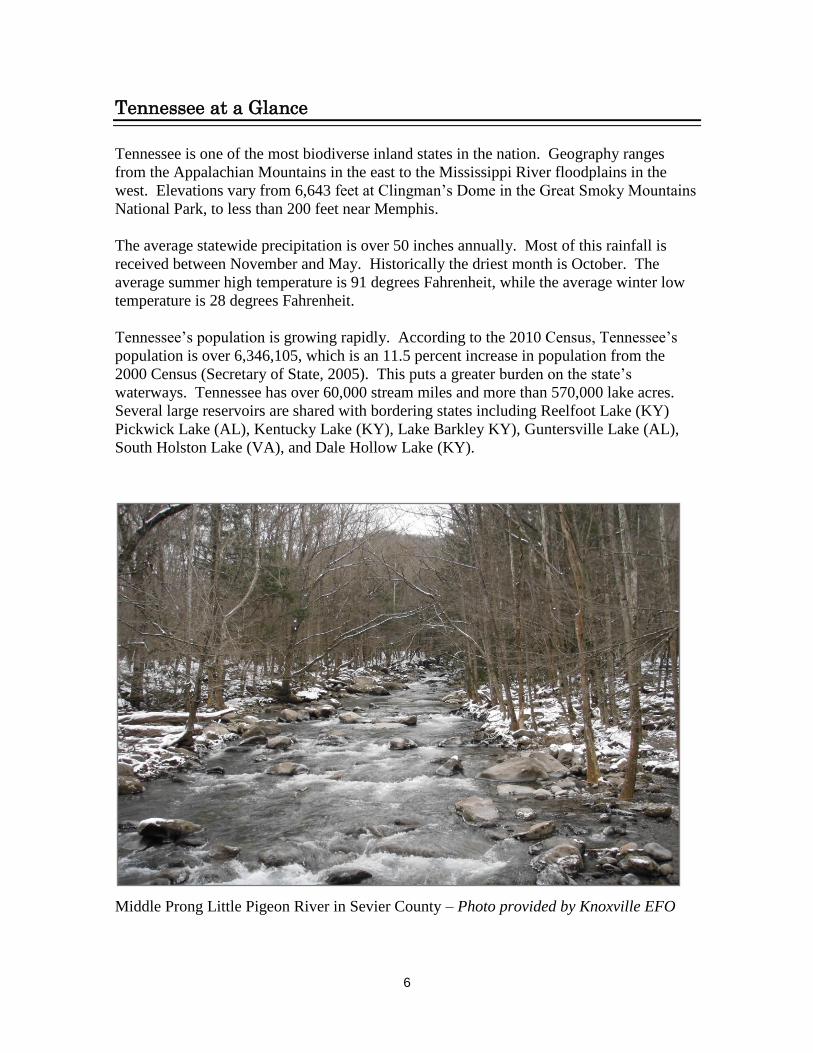
Tennessee at a Glance
Tennessee is one of the most biodiverse inland states in the nation. Geography ranges
from the Appalachian Mountains in the east to the Mississippi River floodplains in the
west. Elevations vary from 6,643 feet at Clingman’s Dome in the Great Smoky Mountains
National Park, to less than 200 feet near Memphis.
The average statewide precipitation is over 50 inches annually. Most of this rainfall is
received between November and May. Historically the driest month is October. The
average summer high temperature is 91 degrees Fahrenheit, while the average winter low
temperature is 28 degrees Fahrenheit.
Tennessee’s population is growing rapidly. According to the 2010 Census, Tennessee’s
population is over 6,346,105, which is an 11.5 percent increase in population from the
2000 Census (Secretary of State, 2005). This puts a greater burden on the state’s
waterways. Tennessee has over 60,000 stream miles and more than 570,000 lake acres.
Several large reservoirs are shared with bordering states including Reelfoot Lake (KY)
Pickwick Lake (AL), Kentucky Lake (KY), Lake Barkley KY), Guntersville Lake (AL),
South Holston Lake (VA), and Dale Hollow Lake (KY).
Middle Prong Little Pigeon River in Sevier County – Photo provided by Knoxville EFO

7
Tennessee Facts State population (2010 Census)……………………………………… 6,346,105
Largest Cities (2010 Census)
Memphis………………………………………………….….. 646,889
Nashville……………………………………………………... 601,222
Knoxville…………………………………………………….. 178,874
Chattanooga………………………………………………….. 167,674
Clarksville……………………………………………………. 132,929
Murfreesboro………………………………………………… 108,755
Jackson……………………………………………………….. 65,211
Johnson City…………………………………………………. 63,152
Number of Counties………………………………………………….. 95
State Surface Area (square miles)…………………………………… 42,244
Number of Major Basins…………………………………………….. 13
Number of Level III Ecoregions……………………………………... 8
Number of Level IV Ecoregions…………………………………….. 31
Number of Watersheds (HUC8)………………………………….….. 55
Number of Stream Miles Forming State Border…………………….. 213
(The Mississippi River forms most of the stream miles shared by another state.)
Stream Miles Statewide (NHD)………………………………….…... 60,394
Largest Rivers at Low Flow (7Q10 in ft3/sec.)
Mississippi River at Memphis……………………………….. 109,000
Tennessee River at South Pittsburg………………………….. 12,500
Cumberland River at Dover………………………………….. 2,280
Hiwassee River above Charleston…………………………… 1,220
Little Tennessee River at Calderwood……………………….. 1,200
Holston River at Surgoinsville………………………………. 762
French Broad River near Knoxville…………………………. 722
South Fork Holston River at Kingsport………………….…... 550
Duck River above Hurricane Mills…………………………... 477
Obion River at Megelwood………………………………….. 357
Lake Acres Statewide……………………………………………….. 572,063
Largest Lakes (size in acres)
Kentucky Reservoir (Tennessee portion)……………………. 117,500
Watts Bar Reservoir…………………………………………. 39,000
Barkley Reservoir (Tennessee portion)……………………… 37,000
Chickamauga Reservoir………………………………….…... 35,400
Estimated Acres of Wetlands…………………………………….….. 787,000

8
Cost of Water Pollution
Water pollution is a problem for everyone. The average American uses 140 to 160 gallons
of water per day for sanitation, drinking, and many other human needs, such as recreation,
transportation, and irrigation. Polluted water must be purified before it can be used for
these purposes.
On average, treatment and delivery of tap water costs between $4 and $10 per 1,000
gallons. The more polluted water is, the more it costs per gallon to treat. There are other
costs associated with water pollution as well.
When the water is no longer safe for recreational activities, the community loses an
important resource. Two of the most obvious costs of water pollution are the expenses of
health care and loss of productivity while people are ill. The biggest health risks
encountered in polluted waters are from pathogens and contaminated fish. Individuals who
swim in waters polluted by pathogens can become sick. People, especially children and
pregnant women, who eat contaminated fish are at a higher risk for cancer and other health
problems than those who do not eat contaminated fish. Subsistence fishermen are faced
with the loss of their primary protein source.
When people can no longer eat fish from rivers, streams, and lakes, there is a potential for
economic loss in the community. Commercial fishermen lose income when it is no longer
legal to sell the fish they catch. As the fishermen move out of the community to find
another place to fish, local business can decline.
Another cost of water pollution is the expense associated with keeping waters navigable.
Commercial navigation as a means to move goods and services around the country is one
of the most economical methods of transportation. As channels fill with sediment from
upland erosion, commercial navigation becomes less practical. Silt deposits also reduce
the useful lifespan of lakes and reservoirs. They become filled with silt, which decreases
the depth of the water until dredging is required or the lake or reservoir is completely
filled.
Clean water is
important to
everyone.
Photo provided
by Jimmy Smith,
TDEC, Nashville
EFO
9
Chapter 1
Water Quality Assessment Process
Using a standardized assessment methodology, existing monitoring data from individual
streams are compared to water quality standards in order to categorize the degree of use
support (Chapter 2). Violations of water quality standards are identified. Individual
assessments are stored in an electronic format, assessment information is compiled into
reports such as the 305(b), and geographic referencing tools are used to prepare interactive
maps that can be accessed by the public. Since the 2010 305(b) report was published,
Group 3 and 4 watersheds have been assessed.
A. Water Quality Standards
The Tennessee Water Quality Control Act (Tennessee Secretary of State, 1999) identifies
the Water Quality, Oil & Gas Board as the entity responsible for the promulgation of clean
water goals. Federal law requires that the water quality standards be revisited at least
every three years. Division staff provide technical assistance to the board in the
development of criteria and the identification of appropriate use-classifications. Public
participation is a vital part of the goal-setting process.
The specific water quality standards are established in Rules of Tennessee Department of
Environment and Conservation Division of Water Pollution Control, Chapter 1200-4-3,
General Water Quality Criteria and Chapter 1200-4-4, Use Classifications for Surface
Water (Tennessee Department of Environment and Conservation, Water Quality, Oil &
Gas Board, 2007).
Water quality standards have three sections. The first section establishes seven designated
uses for Tennessee waterways: Fish and Aquatic Life, Recreation, Irrigation, Livestock
Watering and Wildlife, Domestic Water Supply, Navigation, and Industrial Water Supply.
The second section identifies numeric or narrative water quality criteria to protect each of
the designated uses. The final section is an antidegradation policy designated to protect
existing water uses and prevent future damage to water quality.
All waterbodies are classified for multiple uses and may have several criteria for each
substance or condition (pollutants). When multiple criteria are assigned for different uses
on a stream, the regulation states that the most stringent criterion must be met. The
combination of classified uses, the most stringent criterion for those uses, and the
requirements of the antidegradation policy create the water quality standard for each
pollutant in a waterbody segment.
10
1. Stream Use Classifications
The Tennessee Water Quality, Oil & Gas Board is
responsible for the designation of beneficial uses of
waterbodies. All streams, rivers, lakes, and
reservoirs in Tennessee are classified for at least
two public uses: protection of fish and aquatic life
and recreation. These minimum use classifications
comply with the goals of the federal act, which
requires that all waters provide for the “protection
and propagation of a balanced population of …fish
and wildlife, and allow recreational activities in
and on the water” (U.S. Congress, 2000).
Most waterbodies are also classified for
irrigation and livestock watering and wildlife.
Three additional classifications apply to specific
waterbodies. The drinking water supply
designation is assigned to waterbodies currently
or likely to be used as domestic water sources in
the future. The navigation and industrial water
supply classifications are usually limited to
waters currently being used for those purposes,
but can be expanded to other waters as needed.
a. Fish and Aquatic Life (FAL) – This use classification is assigned to all
waterbodies for the protection of fish and other aquatic life such as aquatic insects,
snails, clams, and crayfish. While Tennessee does not currently have a system that
creates tiers of aquatic life protection (e.g., warm water vs. cold water fisheries),
the state has developed regional interpretations of some criteria such as nutrients
and biological integrity. Additionally, trout waters have more stringent criteria for
dissolved oxygen and temperature.
b. Recreation – All waterbodies in Tennessee are classified for the protection of the
public’s ability to swim, wade, and fish. Threats to recreational uses of streams
include the loss of aesthetic values due to algae or turbidity, elevated pathogen
levels, and the accumulation of dangerous levels of metals or organic compounds in
fish tissue.
c. Irrigation - This use classification is assigned to most waterways to protect the
ability of farmers to use streams or reservoirs as a source of water to irrigate crops.
d. Livestock Watering and Wildlife – This use classification protects waters to be
used as an untreated drinking water source for livestock and wildlife.
e. Drinking Water Supply –This use classification is assigned to waterbodies that
are currently or are likely to be used for domestic water supply.
Tennessee’s
Current Stream-Use
Classifications:
1. Fish and aquatic life
2. Recreation
3. Irrigation
4. Livestock watering
and wildlife
5. Drinking water supply
6. Navigation
7. Industrial water supply

11
f. Navigation – This classification is designated to protect navigational rivers and
reservoirs from any alterations that would adversely affect commercial transport of
goods by barges or other large boats.
g. Industrial Water Supply - This classification is assigned to waters currently used
for industrial purposes. If needed, additional waters may be designated as
industrial water supplies.
Designated uses are goals, not necessarily a documentation of the current use of that
waterbody. Even if a stream or reservoir is not currently used for a given activity, if
classified, it should be protected for that use in the future. All streams that are not
specifically listed in 1200-4-4 are classified for fish and aquatic life, recreation, irrigation,
and livestock watering and wildlife. This regulation can be viewed or downloaded from
the Tennessee Secretary of State’s webpage, at http://www.tn.gov/sos/rules/1200/1200-
04/1200-04-04.pdf.
2. Water Quality Criteria
The Tennessee Water Quality, Oil & Gas Board has assigned specific water quality
criteria to each designated use. These criteria establish the water quality needed to
support each use. Since every waterbody has multiple uses, it may have multiple
applicable criteria. The standard for each stream is based on the most stringent
criterion for the uses assigned to it. The most stringent criteria are for the protection
of fish and aquatic life, recreation, or drinking water.
a. Fish and Aquatic Life (FAL) – FAL criteria are designed to protect aquatic
life from acute and chronic toxicity. Acute toxicity refers to the level of
contaminant that causes death in an organism in a relatively short period of
time. Chronic toxicity refers to a lower level of contamination that causes
death or other ill effects (such as reproductive failure) over a longer period of
time. Since Tennessee does not perform primary research into the toxic effects
of pollutants, reliance is placed on EPA’s published national criteria, which are
based on the following types of research:
● Toxicity tests performed on lab animals.
● The number of cancer incidences in animals after exposure to a substance.
● A substance’s tendency to concentrate in the food chain.
FAL have the most protective numeric criteria for many parameters including:
dissolved oxygen, pH, temperature, many toxic substances, and flow. FAL also
have narrative criteria with regional numeric interpretations for nutrients, biological
integrity and habitat.

12
b. Recreation – These criteria are established to protect the public’s ability to
swim and wade in Tennessee waters and to safely eat fish they catch. If fish
tissue have dangerous levels of metals or organic substances, or if streams are
found to have elevated bacteria levels, warning signs are posted to inform the
public concerning the potential health risk. See Chapter 5 for additional
information on advisories.
For two parameter categories, pathogens and carcinogens, recreational criteria
tend to be the most protective. E. coli is used as the primary indicator of risk
due to pathogens. Criteria for carcinogens are designed to prevent the
accumulation of dangerous levels of metals or organic compounds in the water
or sediment that may ultimately accumulate in fish tissue. The criteria also
identify the procedure to be used when evaluating fish tissue contamination
and for the decision process for stream posting.
c. Irrigation – These criteria protect waters to be used for agricultural irrigation
purposes. Most of the irrigation criteria are narrative.
d. Livestock Watering and Wildlife – These criteria protect waters to be used as
untreated drinking water sources for livestock and wildlife. Most of the livestock
watering and wildlife criteria are narrative.
e. Drinking Water Supply – These criteria protect waters used as domestic
water supplies from substances that might cause a public health threat, if not
removed by conventional water treatment. Since many contaminants are
difficult and expensive to remove, it is more cost effective to keep pollutants
from entering the water supply in the first place. For this purpose, the surface
water criteria adopt the Maximum Contaminant Levels (MCLs) suggested by
EPA for finished water as goals for surface waters used for source waters.
f. Navigation – These criteria protect waterways used for commercial navigation.
Navigation criteria are narrative.
g. Industrial Water Supply- These criteria protect waters used as water supplies for
industrial purposes. Criteria for pH, total dissolved solids, and temperature are
numerical. The remaining industrial water supply criteria are narrative.
General Water Quality Criteria for surface waters in Tennessee are listed in Rules
of TDEC, Chapter 1200-4-3 (TDEC-WQOGB, 2007). A copy of these regulations
can be viewed or downloaded at the Tennessee Secretary of State’s home page at
http://tn.gov/sos/rules/1200/1200-04/1200-04-03.20110531.pdf

13
3. Antidegradation Policy
The third section of Tennessee water quality standards contains the antidegradation policy,
which protects existing uses of all surface waters and provides a process for authorizing
degradation in waters identified as high quality. Measureable degradation in impaired
waters cannot be authorized for parameters of concern. In high quality waters, degradation
can only be allowed if it is in the public interest and there are no other reasonable options.
In 2006, the antidegradation statement was revised and the Tier designations were replaced
by the categories below. Additional adjustments to this language were proposed in 2009,
but have not yet been finalized.
a. “Unavailable” conditions exist where water quality is at, or fails to meet, the
criterion for one or more parameters. In unavailable conditions, new or increased
discharges of a substance that would contribute to a condition of impairment will
not be allowed.
b. “Available” conditions exist where water quality is better than the applicable
criterion for a specific parameter. In available conditions, new or additional
degradation for that parameter will only be allowed if the applicant has
demonstrated that the reasonable alternatives to degradation are not feasible.”
Additionally, the degradation must be in the public interest.
c. Exceptional Tennessee Waters are waters where no degradation will be allowed
unless that change is justified due to necessary economic or social development and
will not interfere with or become injurious to any classified uses existing in such
waters.
Exceptional Tennessee Waters are:
Waters within state or national parks, wildlife refuges, wilderness areas or
natural areas.
State Scenic Rivers or Federal Wild and Scenic Rivers.
Federally-designated critical habitat or other waters with documented non-
experimental populations of state or federally-listed threatened or
endangered aquatic or semi-aquatic plants or animals.
Waters within areas designated Lands Unsuitable for Mining (as long as
water resources were part of the justification for the designation).
Streams with naturally reproducing trout.
Waters with exceptional biological diversity as evidenced by a score of 40
or 42 on the Tennessee Macroinvertebrate Index (TMI) (or a score of 28 or
30 in subregion 73a), if the sample is considered representative of overall
stream conditions.
Other waters with outstanding ecological or recreational value as
determined by the department.

14
d. Outstanding National Resource Waters (ONRWs) - These exceptional
Tennessee waters constitute an outstanding national resource due to their
exceptional recreational or ecological significance (Table 1).
Table 1: Outstanding National Resource Waters
Waterbody Portion Designated as ONRW Little River Portion within Great Smoky Mountains National Park
Abrams Creek Portion within Great Smoky Mountains National Park
West Prong Little Pigeon
River
Portion within Great Smoky Mountains National Park
upstream of Gatlinburg
Little Pigeon River From headwaters within Great Smoky Mountains
National Park downstream to the confluence of Mill
Branch
Big South Fork Cumberland
River
Portion within Big South Fork National River and
Recreation Area
Reelfoot Lake Tennessee portion of the lake and its associated wetlands
According to the regulation, the portion of the Obed River designated as a federal wild
and scenic river as of June 22, 1999 is an ONRW. However, if the current search for a
regional water supply by the Cumberland Plateau Regional Water Authority results in a
determination that it is necessary to use the Obed River as its source of drinking water,
for that purpose the Obed shall be designated as an Exceptional Tennessee Water and
any permit issued for that project, whether state, federal, or otherwise, shall be
considered under the requirements for Exceptional Tennessee Waters.
A current list of known high quality waters, which includes both Exceptional Waters
and Outstanding National Resource Waters is available on the state’s website at
http://tn.gov/environment/water.shtml. Additional high quality waters will be added to
the list as they are identified.
Big South Fork
Cumberland
River is an
Outstanding
National
Resource
Water.
Photo provided by
Michael Graf,
PAS.

15
B. Water Quality Resource Management
In the early 1970’s, the USGS delineated 55 hydrologic watershed boundaries within
Tennessee. A watershed is the entire land area that drains into a particular watercourse or
body of water. In 1996, the division adopted a watershed approach that reorganized
existing programs and focused on place-based water quality management.
The watershed approach is a decision making process
that reflects a common strategy for information
collection and analysis as well as a common
understanding of the roles, priorities and
responsibilities of all stakeholders within a
watershed. Traditional activities like permitting,
planning and monitoring are coordinated. A
significant change from the past is that the watershed
approach encourages integration of tradition
regulatory (point source pollution) and non-
regulatory (nonpoint source pollution) programs.
When all pollution sources are considered together, agencies are better able to focus on
those controls necessary to produce measurable improvements in water quality. This also
results in a more efficient process. It encourages agencies to focus staff and financial
resources on prioritized geographic location and makes it easier to coordinate between
agencies and individuals with an interest in solving water quality problems.
Four main features are typical of the watershed approach:
Identifying and prioritizing water quality problems in the watershed.
Developing increased public involvement.
Coordinating activities with other agencies
Measuring success through increased and more efficient monitoring and data
gathering.
The 55 watersheds in Tennessee have been divided into five groups based on the year of
implementation in a five year cycle (Figure 1). Each group contains between 9 and 16
watersheds (Table 2 and figure 2). In 2012, adjustments were made in five watersheds to
more evenly distribute monitoring resources.
Pickwick Lake from cycle 2 to 1.
Upper Cumberland (Cordell Hull) from cycle 4 to 5.
Stones River from cycle 1 to 2.
Collins River from cycle 2 to 3.
Upper Duck River from cycle 3 to 4.
It is important that watersheds
are not confused with
ecoregions. The watershed
approach is an organizational
monitoring framework.
Ecoregions serve as a
geographical framework for
establishing water quality
expectations.

16
Activities for each group are based on its position in the cycle. One of the following six
key activities is occurring in each of the five watershed group each year.
1. Planning and Existing Data Review. Existing data and reports from appropriate
federal, state, and local agencies and citizen-based organizations are compiled and used
to describe the current conditions and status of reservoirs, lakes, rivers and streams.
Review of all exiting data and comparison of agency workplans guide the development
of an effective monitoring strategy.
2. Monitoring. Field data are collected from reservoirs, lakes, rivers and streams. Three
standard operating procedures (SOPs) have been developed to guide sampling
techniques and quality control for macroinvertebrate surveys (TDEC, 2011), chemical
and bacteriological sampling (TDEC,
2011), and periphyton sampling
(TDEC, 2010). Watershed groups 1
and 5 have been monitored since the
2010 305(b) report was published.
3. Assessment. Monitoring data are
used to determine if the streams,
rivers, lakes, reservoirs, and wetlands
support their designated uses based
on stream classifications and water
quality criteria. Causes and sources
of impairment are identified for
waterbodies that do not meet their
designated uses. Following the
assessment, a public meeting is
conducted to inform the public of the
most recent results. Watershed
groups 3 and 4 have been assessed
since the 2010 305(b) report was
published. These assessments are included in this report.
4. Total Maximum Daily Load (TMDL) Development/Source Allocation. TMDLs are
studies that determine the point and nonpoint source contributions of a pollutant in the
watershed. The TMDL program locates, quantifies and identifies continuing pollution
problems in impacted waters and then proposes solutions. Monitoring data are used to
determine pollutant effluent limits for permitted dischargers releasing wastewater to
watersheds. Limits are set to assure that water quality is protected. TMDL
documents may recommend regulatory or other actions required to resolve pollution
problems.
Figure 1: Watershed Cycle

17
The five steps of the TMDL process are:
Identify water quality problems in a waterbody.
Prioritize water quality problems.
Develop TMDL plan to control sources.
Implement water quality improvement actions.
Assess water quality improvement efforts.
5. Permits. Expiration and issuance of all discharge permits are synchronized to the five-
year watershed cycle.
6. Watershed Management Plans. Each existing watershed plan contains a general
description, management strategies, and information relevant to water quality. Future
plans will focus on TMDL implementation.
More details may be found on the Watershed Management home page.
http://www.tn.gov/environment/water/watershed/.
Streams in the Lower Duck River Watershed were assessed for the 2012 report. Photo
provided by Nashville EFO.

18
Table 2: Watershed Groups and Monitoring Schedule
Monitoring
Years West Tennessee Middle Tennessee East Tennessee
Group
1
1996
2001
2006
2011
2016
Nonconnah
South Fork of the
Forked Deer
Harpeth
Wheeler Res.^
Pickwick Res.^
Upper Tennessee (Watts
Bar Res.*)†
Ocoee
Emory*
Watauga
Conasauga
Group
2
1997
2002
2007
2012
2017
Loosahatchie
North Fork Forked
Deer
Forked Deer
Stones
Caney Fork
Upper Elk
Lower Elk
Hiwassee
Upper Tennessee (Fort
Loudoun Res.*)†
South Fork Holston
(part)†
Group
3
1998
2003
2008
2013
2018
Wolf
TN Western
Valley (KY Lake)
TN Western
Valley (Beech)
Clarks
Collins ^
Lower Duck
Buffalo
Lower Tennessee
(Chickamauga Res.)†
Little Tennessee*
Lower Clinch*
North Fork Holston
South Fork Holston
(part)†
Group
4
1999
2004
2009
2014
2019
Upper Hatchie
Lower Hatchie
Red
Barren
Cumberland
(Old Hickory)
Obey
Upper Duck^
South Fork
Cumberland*
Upper Cumberland*
Powell*
Upper Clinch*
Holston*
Clear Fork
Lower Tennessee
(Nickajack Res.)†
Group
5
2000
2005
2010
2015
2020
Mississippi
Obion
South Fork Obion
Barkley Reservoir
Cheatham Reservoir
Guntersville
Reservoir
Upper Cumberland
(Cordell Hull)^
Sequatchie
Upper French Broad*
Lower French Broad*
Pigeon*
Nolichucky
*These watersheds are monitored the following year.
†These watersheds have been split into two watershed groups.
^ These watersheds were moved into a different group in 2012.

19
Nolichucky06010108
Caney Fork05130108
Lower Duck06040003
Upper Elk06030003
Red05130206
Lower Cumberland(Lake Barkley)
05130205
Stones05130203
Emory06010208
Obey05130105
Upper Cumberland(Cordell Hull)
05130106
Upper Duck06040002
Hiwassee06020002
Harpeth05130204
Collins05130107
Buffalo06040004
Cumberland (Old Hickory)
05130201
Loosahatchie08010209
Wolf08010210
North Fork Obion08010202
Watts Bar06010201
Watauga06010103
Barren 05110002
Holston06010104
Lower Hatchie08010208
TN Westen Valley(Beech)
06040001
South Fork Obion08010203
Lower Elk06030004
Pickwick Lake06030005
TN Western Valley(KY Lake)
06040005
Lower Cumb.(Cheatham Lake)
05130202
Upper Clinch 06010205
Ft. Loudoun06010201
Mississippi08010100
South Fork Forked Deer
08010205
Little TN06010204
Seq
uat
chie
060
2000
4
Lower Clin
ch
06010207
South Fork Cumberland
05130104
Lower TN06020001
North ForkForked Deer
08010204
Powell 06010206
Lower French Broad
06010107
Upper Hatchie
08010207
Guntersville Lake06030001
Lower TN06020001
Ocoee06020003
South Fork Holston06010102
Pigeon06010106
Nonconnah08010211
Clear Fork05130101
Upper French Broad
06010105
Conasauga03150101
Middle ForkForked Deer
08010206
Wheeler Lake06030002
Upper Cumberland05130103
North Fork Holston06010101
Clarks06040106
Watershed Groups
Group 1
Group 2
Group 3
Group 4
Group 5
Figure 2: Watershed Monitoring Groups 2012
1996-2011
20
C. Types of Monitoring
The Division of Water Resources has developed a monitoring strategy based on the need to
collect data for various program responsibilities. Biological, chemical, bacteriological, and
physical data are collected to supply information for the activities listed below. Additional
information concerning the monitoring strategy can be found in the in the Division of
Water Resources Monitoring and Assessment Program Plan posted on the TDEC webpage
(TDEC 2011).
1. Watershed Monitoring
Consistent with the division’s watershed approach, as many additional stations as possible
are monitored in order to collect information on waterbody segments that have not
previously been assessed. If possible, sampling locations are located near the mouth of
each tributary. Minimally, macroinvertebrate biorecons, habitat assessments, and field
measurements of DO, conductivity, pH, and temperature are conducted at these sites.
If impairment is observed, and time and priorities allow, additional sites are located
upstream of the impaired water reach to define the impairment length. Chemical samples
are collected as needed to determine pollutant causes. Bacteriological samples are
collected to determine recreational use support.
2. 303(d) Monitoring
During each watershed cycle, 303(d) listed streams are monitored. At a minimum, 303(d)
stations are sampled three times for the pollutants of concern and a macroinvertebrate
biological sample is collected. Additional monitoring is required for confirmation if water
quality appears to have improved.
3. Long-Term Trend Station Monitoring
Approximately 60 long-term trend stations are monitored quarterly for chemical and
bacteriological quality. These data are used to check for changes in water quality over
time.
4. Antidegradation Monitoring
Before activities that degrade water quality can be authorized, a stream’s proper status
under the antidegradation policy must be determined. The division uses a standardized
evaluation procedure for this purpose. These activities are difficult to plan, because
waterbodies are evaluated as needed - generally in response to requests for new or
expanded NPDES and Aquatic Resource Alteration Permit (ARAP) permits. The type of
monitoring utilized for this purpose is the more intensive biological survey since the
biological integrity of a stream is an important consideration.

21
5. Ecoregional Reference Stream Monitoring
Established reference stations are monitored in conjunction with the watershed cycle.
Each station is sampled quarterly for chemistry and pathogens as well as in the spring and
fall for macroinvertebrates. Semi-quantitative single habitat and biorecon samples are
collected to establish biocriteria and biorecon guidelines. In 2007, the division also began
collecting periphyton at these sites. If watershed screening results indicate a potential new
reference site, more intensive reference stream monitoring protocols are used to evaluate
potential inclusion in the reference database.
6. Permit Compliance/Complaint Investigation
Monitoring is undertaken each year to insure that facilities or other entities are in
compliance with permit conditions. These monitoring efforts typically have one of the
following designs:
Above/Below Surveys – Samples are collected above and below an activity to
determine the immediate effect the activity is having on the stream.
Trend Determination – Samples are collected over time downstream of an activity
to document if conditions are getting better or worse.
Reference Approach - Data collected below an activity are compared to a suitable
reference stream. This technique is particularly helpful when the activity is in a
headwater reach or where the stream is also impacted upstream of the activity.
Additionally, the department receives numerous water quality complaints each year from
citizens. These are handled as a priority activity and any data collected at these streams
can be used to assess the waterbody.
7. Probabilistic Monitoring
Statistical survey designs have been used for many years to characterize the condition of
large populations based on a representative sample of a relatively few members or sites
within the population. The ability of these designs to provide accurate estimates, with
documented confidence levels, of the condition of populations of interest is well
documented. These surveys are used in a variety of fields including election polls, monthly
labor estimates, forest inventory analysis, and the national wetlands inventory.
In 2001, the division began incorporating probabilistic survey design into its monitoring
strategy. Probabilistic monitoring means that sites are selected using a random sample
design. Every site in the target population has an equal chance of being selected for
sampling can be extrapolated to the entire population of waterbodies represented by the
subsample. Because of its consistent methods and sampling framework, probabilistic
monitoring is useful as a baseline for trend analysis.

22
8. Fish Tissue Monitoring
Fish tissue samples are often the best way to document chronic low levels of persistent
contaminants. Discovery of elevated levels of certain contaminants in fish tissue can lead
to use advisories, which are discussed in greater detail in Chapter 5.
Fish tissue monitoring in Tennessee is planned by a workgroup consisting of TDEC staff
(Water Resources and DOE-Oversight), TVA (Tennessee Valley Authority), TWRA
(Tennessee Wildlife Resources Agency), and ORNL (Oak Ridge National Laboratory).
The workgroup meets annually to discuss fish tissue monitoring needs for the following
year. Data from these surveys help the division assess water quality and guide the issuance
of fishing advisories.
TVA routinely collects fish tissue from reservoirs they manage. ORNL collects fish tissue
samples from rivers and reservoirs that receive drainage from the Department of Energy
Property in Oak Ridge. TWRA provides fish tissue samples to TDEC that are collected
during population surveys.
TDEC contracts other needed fish sampling and analyses to the Aquatic Biology Section,
Tennessee Department of Health. Targeted fish are five game fish, five rough fish, and
five catfish of the same species. Samples are generally composited, although large fish
may be analyzed individually. Only fillets (including belly flap) are analyzed for routine
monitoring although wholebody fish may be used for special projects.
9. Sediment Monitoring
Although it is not commonly done, samples of the sediment at the bottom of a creek or
lake can be collected to determine the presence of harmful amounts of metals or
carcinogens. One of the reasons this type of monitoring is not frequently a part of
monitoring plans is that few criteria exist to reliably assess the degree of harm to the
waterbody.
Recent examples of sediment monitoring in Tennessee include documenting the extent of
mercury contamination in Beech Creek in Wayne County, assessing levels of metals in
coal ash spilled into the Emory River near Kingston, and looking for pesticides in Cypress
Creek in Memphis.
As with all monitoring, field and laboratory staff use standardized procedures for the
collection and analysis of sediment samples. Although Tennessee has no numeric
sediment criteria, EPA literature and guidance developed by the National Oceanographic
and Atmospheric Administration (NOAA) are used to assist in data interpretation.

23
D. Water Quality Data
1. Data Sources
The division used all reliable data that were readily available for the assessment of
Tennessee’s waterways. This included data from TDEC, other state and federal agencies,
universities, NPDES permit holders, citizens, and the private sector (Table 3). In July
2008, January 2009, January 2010, and January 2011, the division issued public notices
requesting water quality data for use in the statewide water quality assessment.
Agency information regarding Tennessee’s water quality was received from the
Environmental Protection Agency, Tennessee Valley Authority, U.S. Geological Survey,
Tennessee Wildlife Resource Agency, and U.S. Army Corps of Engineers. Biological and
pathogen data submitted by NPDES dischargers as part of permit requirements were used.
Universities and watershed groups also supplied data.
All submitted data were considered in the assessment process. If data reliability could not
be established, submitted data were used to screen waters for future studies. In situations
where data from the division and another source did not agree, more weight was given to
the division’s data unless the other data were significantly more recent.
Table 3: Data Submitted to the Division for Consideration in the
2012 Assessment Process
Agency Physical
Data
Biological
Data
Chemical
Data
Bact.
Data
US Army Corp of Engineers X X
Tennessee Valley Authority X X X X
US Geological Survey X X X X
Tennessee Wildlife Resources
Agency
X X
Phase II MS4 permittees X X X X
NPDES permittees (mining,
municipalities, industries, other
point source dischargers)
X X X X
Universities X X X X
24
2. Data Quality Objectives
To assure the highest confidence in the assessment results, all data must be of reliable
quality. As part of this goal, a Quality Assurance Project Plan for 106 Monitoring has
been compiled by the division TDEC, 2011). This document defines monitoring, analyses,
quality control, and assessment procedures.
In order to specify collection techniques within the state, standard procedures have been
developed for collection of water quality samples. The procedures also identify
appropriate quality control measures. The QSSOP for Macroinvertebrate Stream Surveys
(TDEC, 2011) was first published in March of 2002 and revised in November 2003,
October 2006, and July 2011. The QSSOP for Chemical and Bacteriological Sampling of
Surface Waters (TDEC, 2011) was first published in March 2004 and revised in 2008,
2009, and 2011. The QSSOP for Periphyton Stream Surveys was published in 2010. These
documents are reviewed annually and revised as needed. TDEC staff are trained annually
on proper collection techniques.
3. Data Management
The division has several tools that have increased the efficiency, accuracy, and
accessibility of assessments. Software programs, combined with increased computer
capabilities have expanded the ability to organize, store, and retrieve monitoring and
assessment information. These improvements have helped not only with the organization
of large quantities of information, but also analysis of specific waterbodies.
a. STORET and WQX
Due to the large amount of data collected in monitoring activities, it was paramount
for the division to utilize an electronic database to store and easily retrieve data for
analyses and assessment. In the early 1970s, EPA developed the national water
quality STOrage and RETrieval database called STORET. This database allowed
for easy access to bacteriological and chemical information collected throughout
the state and nation. TDEC Water Resources station locations and chemical and
bacteriological data were uploaded into the database quarterly. In September 2009,
EPA ceased support of the current format that the data is uploaded to STORET.
The last upload of TDEC Water Pollution Control data was sent to EPA the end of
September 2009. The data can be located at STORET at
http://www.epa.gov/STORET.
Currently, the Division of Water Resources is working with EARTHSOFT to
utilize the software EQuiS to upload data to the EPA WQX database. The Water
Quality Exchange (WQX) is a new framework that makes it easier for States,
Tribes, and others to submit and share water quality monitoring data over the
Internet.

25
b. Water Quality Database
Tennessee’s Water Quality Database (WQDB) is an interim storage database for
chemical, biological, habitat and fish tissue data prior to upload to WQX. This
database is updated and made available to Water Resources staff quarterly.
Retrievals are made available to the public upon request.
c. Assessment Database
The Assessment Database (ADB) was developed by EPA to store assessment
results for streams, rivers, and reservoirs. The ADB allows for specific analysis of
small stream segments, as well as overall assessment of total watersheds. All
waters are assigned a unique identification number based on the National
Hydrology Database (NHD). All waterbody IDs begin with Tennessee’s
abbreviation (TN). The next 8 digits represent the numerical Hydrological Unit
Code (HUC) assigned to each watershed by the U.S. Geological Survey (USGS).
The next 3 digits represent a specific reach or subdivision of the waterbody. The
final 4 digits specify a unique segment number. The resulting 15-digit waterbody
ID is a unique identification number specific to a precise portion of a waterbody.
d. Geographic Information Systems
The ADB system is linked to the division’s Geographic Information System
(GIS). The combination of these technologies allow for easy access to information
on specific waterbodies by locating them on GIS maps.
e. Reach Indexing Tool and National Hydrography Dataset
EPA also developed the Reach Indexing Tool (RIT) and National Hydrography
Dataset (NHD). These software are linked to the ADB and GIS allowing quick
georeferencing of assessment information.
f. Online Water Quality Assessment
An interactive map called Tennessee’s Online Water Quality Assessment links the
ADB and GIS through the RIT. This site allows the user to select a specific
waterbody and read water quality assessment information. This site is reached
through the division’s home page at: http://tnmap.tn.gov/wpc/
g. Water Pollution Information Management System
The division also has an online database available to division employees. This
database contains assessment data, plus lists of Exceptional Tennessee Waters and
those waters that have been evaluated and are not Exceptional Tennessee Waters.
This information is updated monthly. Water Resources is also developing on-line
mapping for this information.

26
E. Water Quality Assessment Methodology
Water quality assessments are completed by comparing water quality data to the
appropriate criteria to determine if waters are supportive of designated uses. To facilitate
this process, several provisions have been made:
● Criteria have been refined to help evaluate data. The ecoregion project has
dramatically reduced the uncertainty associated with the application of statewide
narrative and numerical criteria. Guidance documents have been developed to
assist in the interpretation of biological, nutrient, habitat, and periphyton data.
● Critical periods have been determined for various criteria. Certain collection
seasons and types of data have proven more important for the protection of
specific water uses. For instance, the critical period for parameters like toxic
metals or organics is the low flow season of late summer and early fall. Likewise,
most water contact, like swimming and wading, occurs in the summer. Therefore,
that is the season when pathogen results are considered most significant.
● To ensure defensible assessments, data quality objectives have been set. For some
parameters, a minimum number of observations are needed to assure confidence in
the accuracy of the assessment.
● Provisions in the water quality criteria instruct staff to determine whether
violations are caused by man-induced or natural conditions. Natural conditions
are not considered pollution.
● The magnitude, frequency, and duration of violations are considered in the
assessment process.
● Streams in some ecoregions naturally go dry or historically have only subsurface
flow during prolonged periods of low flow. Evaluations of biological integrity
attempt to differentiate whether waters have been recently dry or have been
affected by man-induced conditions.
● Ecoregion reference sites are re-evaluated and data are statistically tested annually.
New sites are added when possible. Existing sites are dropped if data show the
water quality has degraded, the site is not typical of the region, or does not reflect
the best attainable conditions. Data from bordering states that share the same
ecoregions are used to test suitability of reference sites and augment the dataset.
Currently the state is reviewing river, lakes, headwaters, and reservoir data to
identify reference conditions in these systems.
27
1. Application Methodology for Specific Criteria
There are two types of criteria: numeric and narrative. Both types offer challenges.
Numeric criteria provide a specific level that should not be exceeded. The regulation
instructs staff to consider the frequency, magnitude, and duration of numeric criteria
violations and to determine whether the appearance of pollution might be due to natural
causes.
Narrative criteria are written descriptions of water quality. These descriptions
generally state that the waters should be “free from” particular types or effects of
pollution. The division’s long-standing position is that narrative criteria should have a
regional basis for interpretation. To help provide regional information for narrative
criteria, guidance documents based on reference stream data have been developed for
biological integrity (Arnwine and Denton, 2001), habitat (Arnwine and Denton, 2001),
and nutrients (Denton et al., 2001). Guidelines for biological criteria and habitat are
re-calibrated every three years and are published in the department’s QSSOP for
Macroinvertebrate Stream Surveys (TDEC, 2011).
a. Toxic Substances (Numeric)
● Metals data are appropriately “translated” according to the water quality
standards before comparison to criteria. For example, toxicity of metals can be
altered by the waterbody’s hardness and the amount of total suspended solids in
the water. Widely accepted methodologies are used to translate toxicity data.
● If more than ten percent of the observations of a specific metal is above chronic
criteria, the stream is assessed as impaired by that metal.
b. Pathogen Criteria (Numeric)
● Waterbodies are not assessed as impaired due to high bacteria levels with less
than four water samples. The only waters assessed with one or two
observations are waterbodies previously listed due to elevated bacteria levels or
streams with obviously gross conditions, such as failing animal waste lagoons.
● Tennessee utilizes E. coli as our indicator since this group is generally
considered more reflective of true risk than are fecal coliform data.
● If flow data are available, low flow, dry season data are considered more
meaningful than high flow, wet season data. In the absence of flow data,
samples collected in late summer and fall are considered low flow or dry season
samples. It is important to note that wet season pathogen samples are not
disregarded.
28
c. Dissolved Oxygen (Numeric) ● Dissolved oxygen levels in streams are measured in flowing water. Data
collected at extreme low flows must be interpreted with caution as any
violations may be due to natural stagnation rather than pollution.
● If the source of the low DO is a natural condition such as ground water, spring,
or wetland, then the low DO is considered a natural condition and not pollution.
d. Nutrient Criteria (Narrative)
● The only designated uses that have nutrient criteria are fish and aquatic life and
recreation. A specific nutrient response criterion based on chlorophyll a has
been adopted for Pickwick Lake.
● Regional nutrient goals (Denton et al., 2001) were used as guidance during this
assessment cycle.
● Waters are not assessed as impaired by nutrients unless biological or aesthetic
impacts, or downstream problems are also documented.
● At least four nutrient observations are needed for a valid assessment, unless
biological impairment is also observed.
e. Turbidity/Suspended Solids Criteria (Narrative)
● Historically, silt has been one of the primary pollutants in Tennessee
waterways. The division has experimented with multiple ways to determine if a
stream, river, or reservoir is impaired due to silt. These methods include visual
observations, chemical analysis (total suspended solids), and macroinvertebrate/
habitat surveys. The most satisfactory method for identification of impairment
due to silt has been biological surveys that include habitat assessments.
● Ecoregions vary in the amount of silt that can be tolerated before aquatic life is
impacted. Through work at reference streams, staff found that the appearance
of sediment/silt in the water is often, but not always, associated with loss of
biological integrity. Thus, for water quality assessment purposes, it is
important to establish whether or not aquatic life is being impaired. For those
streams where loss of biological integrity can be documented, the habitat
assessment can determine if this loss is due to excessive silt deposits.
29
f. Biological Integrity Criteria (Narrative)
● Biological integrity criteria are designed to protect fish and aquatic life.
● Biological surveys using macroinvertebrates as the indicator organisms are the
preferred method for assessing use support. Two standardized biological
methods, biorecons and semi-quantitative samples, are used to produce a
biological index score. These methods are described in Quality System
Standard Operating Procedure for Macroinvertebrate Stream Surveys (TDEC,
2011) and are referenced in the water quality criteria.
● The most commonly utilized biological survey method is the biorecon.
Biological scores are compared to the metric values obtained in ecoregion
reference streams. Three metrics are examined: taxa richness, number of
families or genera of caddisflies, mayflies, and stoneflies (EPT), and number of
intolerant families or genera.
● If a more definitive assessment is needed, a single habitat, semi-quantitative
sample is collected. Organisms are identified to genus and an index based on
seven biological metrics is used for comparison to reference streams. Streams
are considered impaired if the biological integrity falls below the target score
for that region.
● If both biorecon and single habitat semi-quantitative data are available and the
results do not agree, more weight is given to the single habitat semi-quantitative
results. If data from the division and another agency do not agree, more weight
is given to the state’s data unless the other agency’s data are considerably more
recent.
● To be comparable to ecoregions guidance, streams must be similar size (order)
and drainage as the reference streams in the ecoregion and must have at least 80
percent of the upstream drainage within that ecoregion.
g. pH (Numeric)
● The pH criterion range for wadeable streams is 6.0 - 9.0. For nonwadeable
rivers, streams, reservoirs, and wetlands, the pH range is 6.5 – 9.0.
● A complicating factor is that increased acidity causes some metals to become
more toxic. In many waterbodies assessed as impaired by acidity, it is difficult
to discern whether the harm was caused by the reduced pH or the resulting
metal toxicity, especially in areas with historical or active mining present.
Conversely, increased alkalinity makes ammonia more toxic.

30
h. Habitat Data (Narrative)
● Habitat alteration is one of the major causes in stream impairment in the state.
● Division staff use a standardized scoring system developed by EPA to rate the
habitat in a stream (Barbour, et al., 1999). The QSSOP for Macroinvertebrate
Stream Surveys (TDEC, 2011) provides guidance for completing a habitat
assessment and evaluating the results.
● Habitat scores calculated by division biologists are compared to the ecoregion
reference stream database. Streams with habitat scores less than 75 percent of
the median reference score for the ecoregion are considered impaired, unless
biological integrity meets expectations.
● The habitat goals are referenced in the 2007 General Water Quality Criteria,
(TDEC-WQOGB, 2007).
2. Assessment Rates for 2012
The division maintains a statewide monitoring system of approximately 7,000 stations
(not all stations are monitored in each cycle). In addition, new stations are created every
year to increase the number of assessed waterbodies. Data from approximately 1700
Group 3 and Group 4 stations monitored July 2007 – December 2011 were used for this
report.
Chapter 3 of this report summarizes water
quality in Tennessee’s streams, rivers,
reservoirs, and lakes. In order to determine
use support, it must be decided if the
waterbody meets the most protective water
quality criterion for its assigned uses.
Generally, the most stringent criteria are
associated with recreational use and support
of fish and aquatic life.
With available resources, it is not possible to monitor all of Tennessee’s waterbodies. A
strategy based on watershed cycles has been designed and implemented to systematically
sample and monitor as many waterbodies as possible. Some waterbodies are difficult to
access or are very small. Other streams have intermittent flows. During periods of low
flow, some of these streams go dry or flow underground.
For this report, almost half (28,422 miles) of the stream miles (Figure 3) and almost all
(565,595 acres) of the reservoir and lake acres (Figure 4) in the state were monitored and
assessed. Fifty-three percent (31,996 miles) of Tennessee’s streams and rivers were not
assessed during this cycle. Only one percent (6,468 acres) of Tennessee’s reservoir and
lake acres have not been assessed.
Waterbodies were assessed
using current (less than five
years old) data, including
biological and chemical
results, field observations,
and any other available
information.

31
3. Data Application – Categorization of Use Support
Waterbodies are assessed by comparing monitored water conditions to water quality
standards for the waterbody’s designated uses. Data that meet state quality control
standards and collection techniques are used to generate assessments. After use support is
determined, waterbodies are placed in one of the five categories recommended by EPA.
Use Support Categories
Category 1 waters are fully supporting of all designated uses. These streams, rivers,
and reservoirs have been monitored and meet the most stringent water
quality criteria for all designated uses for which they are classified. The
biological integrity of Category 1 waters is favorably comparable with
reference streams in the same subecoregion and pathogen concentrations are
at acceptable levels.
Category 2 waters are fully supporting of some designated uses, but have not been
assessed for all uses. In many cases, these waterbodies have been
monitored and are fully supporting of fish and aquatic life, but have not
been assessed for recreational use.
Category 3 waters are not assessed for any use due to insufficient or outdated data.
However, streams previously identified as impaired are not moved to this
category simply because data are old.
Category 4 waters are impaired, but a TMDL has been completed or is not required.
Category 4 has been further subdivided into three subcategories.
Category 4a impaired waters that have already had all necessary TMDLs
approved by EPA.
Category 4b impaired waters do not require TMDL development since
“other pollution control requirements required by local, State
or Federal authority are expected to address all water-quality
pollutants” (EPA, 2003). An example of a 4b stream might
be where a discharge point will be moved in the near future
to another waterbody with more assimilative capacity.
Category 4c impaired waters in which the impacts are not caused by a
pollutant (e.g., flow alterations).
Category 5 waters have been monitored and found to not meet one or more water
quality standards. These waters have been identified as not supporting one
or more designated uses. Category 5 waterbodies are moderately to highly
impaired by pollution and need to have TMDLs developed. These waters
are included in the 303(d) List. The current 303(d) list may be viewed at
http://www.tn.gov/environment/water.

32
Figure 3: Percent of River and Stream Miles Monitored and
Assessed
Figure 4: Percent of Reservoir and Lake Acres Monitored and
Assessed

33
Table 4: Assessed Stream
Miles
Category
Assessment
Miles
Total Miles 60,418
Total Assessed Miles 28,422
Category 1 6,391
Category 2 8,394
Category 3 31,996
Category 4a 3,605
Category 4b 0
Category 4c 186
Category 5 9,847
Chapter 2
Water Quality Standards Attainment Status
Consistent with the rotating watershed approach, the 12 watersheds in Group 3 and 14
watersheds in Group 4 have been assessed since the last 305(b) report was published in
2010. The assessment process considers existing water quality data to place each
waterbody into one of the five categories.
A. Streams and Rivers
According to USGS’s National Hydrography Dataset (NHD) at the 1:100,000 scale there
are 60,418 miles of streams and rivers in Tennessee. The division was able to assess
almost half (28,423 miles) of the stream miles in the state (Table 4 and Figure 5). Of the
assessed streams, 52 percent are fully supporting of the designated uses for which they
have been assessed.
1. 6,391 of the total stream miles (11%) are Category 1, fully supporting all
designated uses.
2. 8,394 of the total stream miles (14%) are Category 2, which is fully supporting of
some uses, but not assessed for others. Many of these streams and rivers have been
assessed as fully supporting of fish and aquatic life, but have not been assessed for
recreational uses.
3. 31,996 of the total stream miles (53%)
are in Category 3. These waters have
insufficient data to determine if
classified uses are met.
4. 3,791 of the total stream miles (6.3%)
have been identified as Category 4,
impaired but TMDLs are not needed.
3,605 stream miles (6%) are Category
4a, which have had TMDLs for all
impairments approved by EPA. Zero
miles are Category 4b, which are
impaired waters that do not require a
TMDL. 186 stream miles (0.3%) are
Category 4c where it has been
determined that the cause of
impairment is not a pollutant.
5. 9,847 of the total stream miles (16%) are in Category 5, waters that are impaired or
threatened and need TMDLs for the identified pollutants.

34
Figure 5: Percent of Rivers and Streams in Each Category
About 47 percent of the stream miles assessed for recreational use failed to meet the
criteria assigned to that use. Approximately 38 percent of the assessed stream miles failed
to meet fish and aquatic life criteria. Most or all waters classified for domestic water
supply, irrigation, navigation, and industrial water supply uses were found to be fully
supporting (Table 5 and Figure 6).
Table 5: Individual Classified Use Support for Rivers and Streams
Designated Uses
Miles Of
Streams
Classified
Classified
Miles
Assessed
Miles
Meeting
Use
Percentage Of
Assessed Miles
Meeting Use*
Fish and Aquatic Life
Protection
60,418 27,496 17,084** 62%
Recreation 60,418 16,716 8,926 53%
Irrigation 60,418 27,919 27,918 100%
Livestock Watering and
Wildlife
60,418 27,907 27,905 99.99%
Domestic Water Supply 3,696 3,218 3,152 98%
Navigation 1,307 1,307 1,307 100%
Industrial Water Supply 3,381 3,094 3,092 99.9%
*Note: All waters are classified for more than one use, but may or may not have all uses fully
supporting. Thus, this table cannot be used to derive percentages for overall use support in
Tennessee. In addition, assessment rates for individual uses may not match overall use assessment
rates.
** Note: 50 miles are threatened for the protection of fish and aquatic life.

35
Figure 6: Percent Use Support for Individual Classified Uses in
Assessed Rivers and Streams
B. Reservoirs and Reelfoot Lake
Overall Use Support
Tennessee has over 90 public reservoirs or
lakes with a total size over 572,000 acres (Table
6). For the purpose of this report, a reservoir or
lake is publicly accessible and larger than five
acres.
Most lakes in Tennessee are reservoirs that
were created by the impoundment of a stream
or river. The only large natural lake is Reelfoot
Lake, thought to have been formed by a series
of earthquakes in 1811 and 1812. For the
purposes of this report, the generic term “lake
acre” refers to both reservoirs and lakes.
Table 6: Assessed Reservoir
and Lake Acres
Category
Assessment
Support
Assessment
Total Acres 572,063
Total Assessed
Acres
565,595
Category 1 383,630
Category 2 141
Category 3 6,468
Category 4 62,522
Category 5 119,302

36
By using available data, the Division of Water Resources was able to assess 565,595 lake
acres. This means that 98.9 percent of the lake acres in Tennessee have been assessed. Of
the assessed lake acres, 68 percent are fully supporting of the designated uses for which
they have been assessed. All lake acres were placed into one of five use categories. The
majority of lake acres were assessed as Category 1 (Figure 7).
1. 383,630 of the total lake acres (67.1%) are Category 1, fully supporting of all
designated uses.
2. 141 of the total lake acres (0.02%) are Category 2, fully supporting of some uses,
but without sufficient data to determine if other uses are being met.
3. 6,468 of the total lake acres (1.1%) are placed in Category 3, not assessed due to
insufficient data to determine if uses are being met.
4. 62,522 of the total lake acres (10.9%) are assessed as Category 4, impaired for one
or more uses, but a TMDL is not required.
5. 119,302 of the total lake acres (20.9%) are assessed as Category 5, impaired for one
or more uses and needing a TMDL. These reservoirs and lakes are placed on the
303(d) List of impaired waters in Tennessee.
Figure 7: Percent of Reservoir and Lake Acres in Each Category (Category 2 has less than 1 percent.)
Support of Individual Uses
The two most common use classifications not supported in lakes are fish and aquatic life
and recreation (Table 7). Seventy percent of assessed reservoir/lake acres support
recreational uses. Almost 93 percent of assessed reservoir/lake acres support fish and
aquatic life uses. All other designated uses, with the exception of 455 acres classified for
domestic water supply, were fully supporting for all assessed acres (Figure 8).

37
Table 7: Individual Classified Use Support for Reservoirs and
Lakes
Designated Uses Acres
Classified
Classified
Acres
Assessed
Acres
Meeting
Use
Percentage of
Assessed Acres
Meeting Use*
Fish and Aquatic Life
Protection
572,063 563,694 522,480 93%
Recreation 572,063 564,924 396,834 70%
Irrigation 572,063 563,634 563,634 100%
Livestock Watering and
Wildlife
572,063 563,634 563,634 100%
Domestic Water Supply 529,081 526,637 526,182 99.9%
Navigation 1,971 1,971 1,971 100%
Industrial Water Supply 428,890 428,815 428,815 100%
*Note: Reservoirs are classified for more than one use, but may or may not have all uses
fully supporting. Thus, this table cannot be used to derive percentages for overall use
support in Tennessee. Also, assessment rates for individual uses may not match overall
use assessment rates.
Figure 8: Percent Use Support for Individual Uses in Assessed
Reservoirs and Lakes
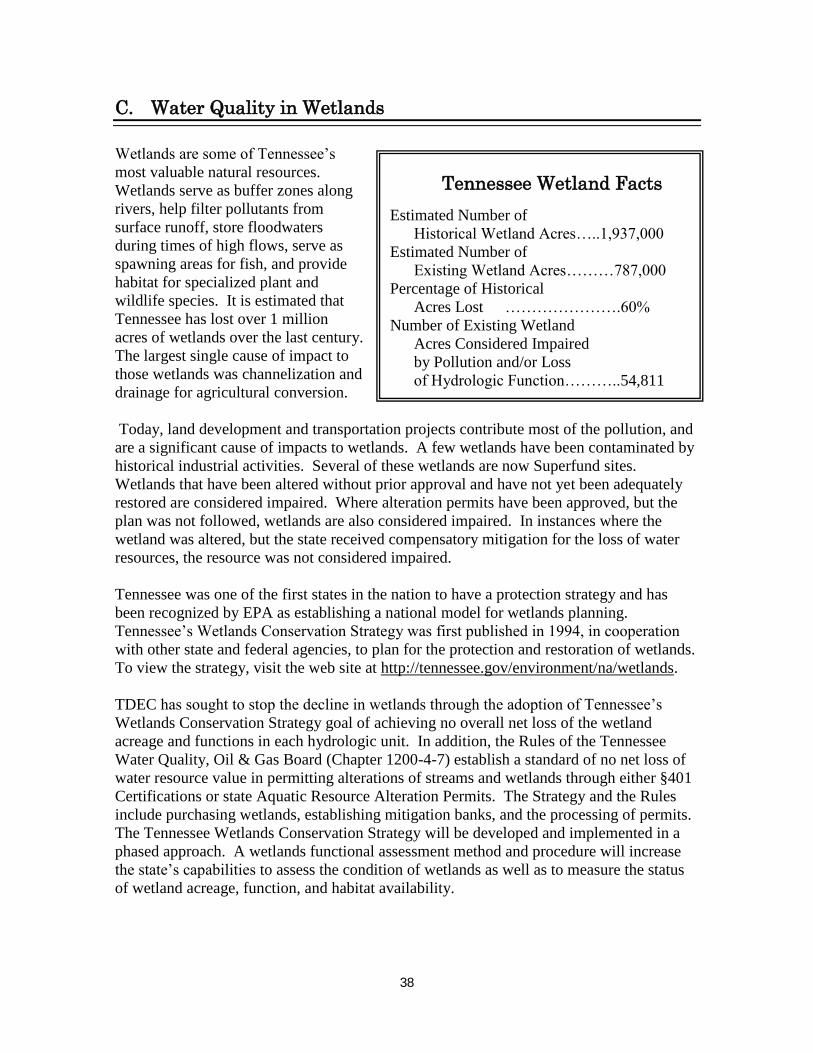
38
C. Water Quality in Wetlands
Wetlands are some of Tennessee’s
most valuable natural resources.
Wetlands serve as buffer zones along
rivers, help filter pollutants from
surface runoff, store floodwaters
during times of high flows, serve as
spawning areas for fish, and provide
habitat for specialized plant and
wildlife species. It is estimated that
Tennessee has lost over 1 million
acres of wetlands over the last century.
The largest single cause of impact to
those wetlands was channelization and
drainage for agricultural conversion.
Today, land development and transportation projects contribute most of the pollution, and
are a significant cause of impacts to wetlands. A few wetlands have been contaminated by
historical industrial activities. Several of these wetlands are now Superfund sites.
Wetlands that have been altered without prior approval and have not yet been adequately
restored are considered impaired. Where alteration permits have been approved, but the
plan was not followed, wetlands are also considered impaired. In instances where the
wetland was altered, but the state received compensatory mitigation for the loss of water
resources, the resource was not considered impaired.
Tennessee was one of the first states in the nation to have a protection strategy and has
been recognized by EPA as establishing a national model for wetlands planning.
Tennessee’s Wetlands Conservation Strategy was first published in 1994, in cooperation
with other state and federal agencies, to plan for the protection and restoration of wetlands.
To view the strategy, visit the web site at http://tennessee.gov/environment/na/wetlands.
TDEC has sought to stop the decline in wetlands through the adoption of Tennessee’s
Wetlands Conservation Strategy goal of achieving no overall net loss of the wetland
acreage and functions in each hydrologic unit. In addition, the Rules of the Tennessee
Water Quality, Oil & Gas Board (Chapter 1200-4-7) establish a standard of no net loss of
water resource value in permitting alterations of streams and wetlands through either §401
Certifications or state Aquatic Resource Alteration Permits. The Strategy and the Rules
include purchasing wetlands, establishing mitigation banks, and the processing of permits.
The Tennessee Wetlands Conservation Strategy will be developed and implemented in a
phased approach. A wetlands functional assessment method and procedure will increase
the state’s capabilities to assess the condition of wetlands as well as to measure the status
of wetland acreage, function, and habitat availability.
Tennessee Wetland Facts
Estimated Number of
Historical Wetland Acres…..1,937,000
Estimated Number of
Existing Wetland Acres………787,000
Percentage of Historical
Acres Lost ………………….60%
Number of Existing Wetland
Acres Considered Impaired
by Pollution and/or Loss
of Hydrologic Function………..54,811

39
Tennessee received a grant from EPA to develop a protocol for wetland assessment and to
apply the state's antidegradation rules to wetlands permitting issues. Tennessee has
completed its development of a rapid assessment methodology for wetlands. The
Tennessee Rapid Assessment Methodology (TRAM) is based on models developed as part
of the Hydrogeomorphic (HGM) approach for assessing wetland function in Tennessee.
Tennessee has now developed HGM models for depressional, riverine, flat and slope
wetlands.
The TRAM will allow for the identification of exceptional wetlands, impaired wetlands,
aid in assessing the ecological consequences of §401 and ARAP permitting decisions, and
assist in implementation the state's antidegradation rules. The Division of Water
Resources’ WaterLog database will enable the permitting program to track compliance and
provide a source of wetland impact and mitigation data for use by agencies involved in
wetland's monitoring and research.
In 2010 Tennessee partnered with U.S. Army Corps of Engineers (COE) and The Nature
Conservancy to undertake one pilot watershed approach project in Tennessee to fulfill the
requirements of the 2008 COE/ EPA Compensatory Mitigation Rule. The pilot Watershed
Approach project in Tennessee is targeted for completion by the end of calendar year 2012.
The end product of this project will be 1) a watershed plan that identifies viable/potential
wetland and stream restoration and preservation priorities in the selected 8-digit watershed;
and 2) a report that summarizes the methodology utilized to apply the Watershed Approach
in development of the plan. The report will be designed to serve as a guide for the
application of the Watershed Approach in the region.
Tennessee Tech University was awarded an EPA grant to assess wetland mitigation in
Tennessee and updated their previous study from the late 1990’s. The division is assisting
in this assessment.
Today, approximately
787,000 acres of
wetlands remain in
Tennessee, a 60%
loss from historic
acreage. Pictured is a
wetland in the South
Fork Forked Deer
River Bottom in the
west Tennessee
Coastal Plains.
Picture provided by Amy
Fritz, JEFO.

40
Chapter 3
Causes of Water Pollution
Pollution is an alteration of the physical, chemical, biological, bacteriological, or
radiological properties of water that results in an impairment of designated uses. To assess
the causes of pollution in streams, rivers and reservoirs, the division follows the guidance
provided by EPA. In order to help standardize the names of impairment causes across the
country, EPA has provided a list of potential pollutants in the ADB.
A. Causes of Pollution in Streams and Rivers
Pollutants such as sediment/silt, habitat alteration, pathogens, and nutrients are the leading
causes of impairment in Tennessee streams and rivers. Other frequent pollutants in
streams and rivers include toxic substances, such as metals and organic pollutants. Flow
alteration, pH changes, and low dissolved oxygen are other common causes of pollution
(Figure 9 and Table 8).
Figure 9: Relative Impacts of Pollution in Impaired Rivers
and Streams (Stream Miles)

41
1. Habitat Alteration
Many streams in Tennessee
appear to have impaired
biological communities in the
absence of obvious chemical
pollutants. Often the cause is
physical alteration of the stream
which results in a loss of habitat.
Habitat alteration is the physical
modification of a stream within
the channel or along the banks.
Common types of habitat
alteration include loss of riparian
habitat such as cutting trees or
mowing along stream banks,
destabilization of the banks from
riparian grazing or
channelization, gravel dredging or filling, culverting or directing streams through pipes,
and upstream modifications such as dams.
Riparian habitat (streamside vegetation) is very important to help maintain a healthy
aquatic environment. Optimal riparian habitat is a mature vegetation zone at least 60 feet
wide on both banks. Riparian vegetation is important because it:
Provides a buffer zone that prevents sediment in runoff from entering the water.
Provides roots to hold banks in place, preventing erosion.
Provides habitat for fish and other aquatic life.
Provides canopy that shades the stream or river. This shading keeps water
temperatures down and prevents excessive algal growth, which in turn prevents
large fluctuations in dissolved oxygen levels.
Provides a food source for aquatic invertebrates that eat fallen leaves and for fish that
eat insects that fall from trees.
The division uses an EPA method to score the stream or river habitat by evaluating ten
components of habitat stability (Barbour, et al., 1999). This is a standardized way to
identify and quantify impacts to stream habitat. In 2001 Tennessee developed regional
guidance based on reference data to evaluate habitat (Arnwine and Denton, 2001).
Guidelines are recalibrated approximately every three years with the most current values
published in the macroinvertebrate monitoring QSSOP (TDEC 2011).
An Aquatic Resources Alteration Permit (ARAP) is required to modify a stream or river in
Tennessee. The permit will not be issued unless the water resources can be protected.
Additional information can be found at
http://www.tn.gov/environment/permits/whoami.shtml.
Types of Habitat Alterations
Habitat Alteration
Stream
Miles
Impaired
Alteration in stream-side or littoral
vegetative cover…………….....
2,623
Other anthropogenic substrate
alterations……………...………
425
Physical substrate habitat
alterations………….………….
4,212
Note: Streams can be impaired by more than one
type of habitat alteration. Totals are not additive.
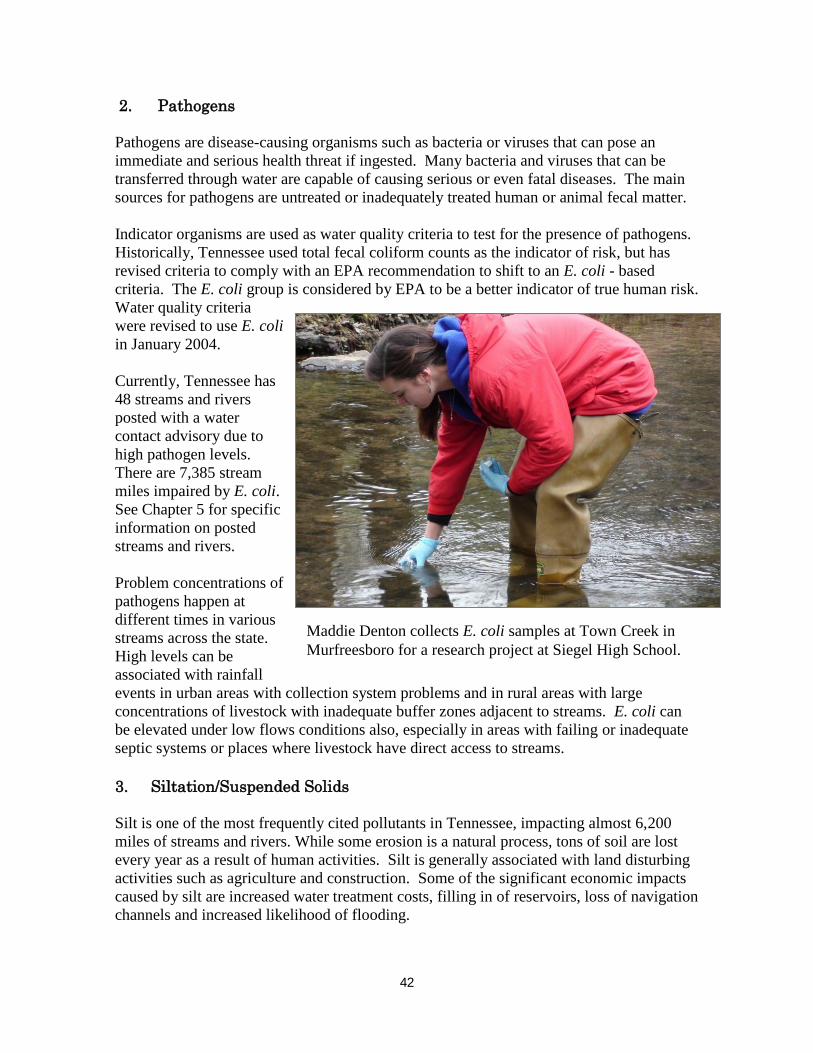
42
Maddie Denton collects E. coli samples at Town Creek in
Murfreesboro for a research project at Siegel High School.
2. Pathogens
Pathogens are disease-causing organisms such as bacteria or viruses that can pose an
immediate and serious health threat if ingested. Many bacteria and viruses that can be
transferred through water are capable of causing serious or even fatal diseases. The main
sources for pathogens are untreated or inadequately treated human or animal fecal matter.
Indicator organisms are used as water quality criteria to test for the presence of pathogens.
Historically, Tennessee used total fecal coliform counts as the indicator of risk, but has
revised criteria to comply with an EPA recommendation to shift to an E. coli - based
criteria. The E. coli group is considered by EPA to be a better indicator of true human risk.
Water quality criteria
were revised to use E. coli
in January 2004.
Currently, Tennessee has
48 streams and rivers
posted with a water
contact advisory due to
high pathogen levels.
There are 7,385 stream
miles impaired by E. coli.
See Chapter 5 for specific
information on posted
streams and rivers.
Problem concentrations of
pathogens happen at
different times in various
streams across the state.
High levels can be
associated with rainfall
events in urban areas with collection system problems and in rural areas with large
concentrations of livestock with inadequate buffer zones adjacent to streams. E. coli can
be elevated under low flows conditions also, especially in areas with failing or inadequate
septic systems or places where livestock have direct access to streams.
3. Siltation/Suspended Solids
Silt is one of the most frequently cited pollutants in Tennessee, impacting almost 6,200
miles of streams and rivers. While some erosion is a natural process, tons of soil are lost
every year as a result of human activities. Silt is generally associated with land disturbing
activities such as agriculture and construction. Some of the significant economic impacts
caused by silt are increased water treatment costs, filling in of reservoirs, loss of navigation
channels and increased likelihood of flooding.

43
Off-Highway vehicles can cause siltation problems in
streams. Photo provided by Chad Augustin, CLEFO.
Siltation affects biological properties of waters by:
Smothering eggs and nests of fish.
Transporting other pollutants, in possibly toxic amounts, or providing a
reservoir of toxic substances that may become concentrated in the food chain.
Clogging the gills of fish and other forms of aquatic life.
Covering substrate that provides habitat for aquatic insects, a main food
source of fish.
Reducing biological diversity by altering habitats to favor burrowing species.
Accelerating growth of submerged aquatic plants and algae by providing
more favorable substrate.
Chemical properties of waters are affected by:
Interfering with photosynthesis.
Decreasing available oxygen due to decomposition of organic matter.
Increasing nutrient levels that accelerate eutrophication in reservoirs.
Transporting organic chemicals and metals into the water column (especially
if the original disturbed site was contaminated).
Physical properties of waters are affected by:
Reducing or preventing light penetration.
Changing temperature patterns.
Decreasing the depth of pools or lakes.
Changing flow
patterns.
Preventive planning in land
development projects can
protect streams from silt and
protect valuable topsoil. Best
Management Practices (BMPs)
such as the installation of silt
fences and maintenance of trees
and undergrowth as buffer
zones along creek banks can
prevent soil from entering the
creek. Farming practices that
minimize land disturbance, such
as fencing livestock out of
creeks and no-till practices not
only protect water quality but also
prevent the loss of topsoil.
A growing concern in Tennessee is the use of Off-Highway Vehicles (OHV) in or near
streams. TDEC is working with commercial operators to design trail systems that
minimize erosion and are protective of aquatic systems.

44
4. Nutrients
A common problem in Tennessee waterways
is elevated nutrient concentrations. The main
sources for nutrient enrichment are livestock,
municipal wastewater systems, urban runoff,
and improper application of fertilizers.
Nutrients stimulate algae growth that
produces oxygen during daylight hours, but
uses oxygen at night, leading to significant
diurnal fluctuations in oxygen levels. Waters
with elevated nutrients often have floating
algal mats and clinging filamentous algae.
Elevated nutrients cause the aquatic life to
shift towards groups that eat algae and can
tolerate dramatic dissolved oxygen
fluctuations. Nutrient pollution is difficult to
control. Restrictions on point source
dischargers alone may not solve this problem.
Some states have banned the use of laundry detergents containing phosphates. As a result,
most commercially available detergents do not contain phosphates. Many fertilizers for
crops or lawn application contain both nitrogen and phosphorus. If fertilizers are applied
in heavy concentrations, rain will carry the fertilizer into nearby waterways.
Monitoring data from ecoregion reference streams has increased understanding of the
natural distribution of nutrients throughout the state. Using this information, regional
goals have been identified as part of the narrative nutrient criteria (Denton et al., 2001).
5. Low Dissolved Oxygen
Depleted dissolved oxygen in water will restrict or eliminate aquatic life. The water
quality standard for dissolved oxygen in most non-trout streams is 5 mg/L. While some
species of fish and aquatic insects can tolerate lower levels of oxygen for short periods,
prolonged exposure will affect biological diversity and in extreme cases, cause massive
fish kills. Over 1,800 stream miles in Tennessee have been impaired by low dissolved
oxygen levels.
Low dissolved oxygen levels are usually caused by the decay of organic material. This
condition can be improved by reducing the amount of organic matter entering a stream or
river. Streams and rivers that receive substantial amounts of ground water inflow, or have
very sluggish flow rates, can have naturally low dissolved oxygen levels.
The division commonly measures dissolved oxygen during daylight hours in conjunction
with biological or chemical monitoring. When diurnal fluctuations are expected,
continuous monitoring probes are deployed.
Types of Nutrients
Nutrient
Stream
Miles
Impaired
Nutrient/Eutrophication
Biological Indicators……
281
Total phosphorus............ 2,260
Nitrate/Nitrite…………... 1,600
Ammonia (un-ionized)… 47
Note: Streams can be impaired by
more than one type of nutrient.
These totals are not additive.

45
6. Metals
The most common metals impacting
Tennessee waters include mercury,
iron, manganese, arsenic, and lead.
Zinc, copper, and chromium levels can
also violate water quality standards.
The major concern regarding metal
contamination is toxicity to fish and
aquatic life, plus the danger mercury
poses to people who come in contact
with the water or eat fish from the
contaminated waterbody. The
precipitation of metals such as iron and
manganese streams can affect habitat.
Sections of ten rivers have been posted for elevated levels of mercury in fish tissue.
Chapter 5 discusses this in more detail. Occasionally, metals are elevated in streams and
rivers due to natural conditions. For example, elevated manganese levels in east Tennessee
streams and rivers may be naturally occurring in the groundwater. However, it is relatively
rare for waterbodies to violate criteria for metals simply based on natural conditions.
7. Organic Contaminants
Organic contaminants are man-made chemicals containing the element carbon. These
include chemicals like PCBs, DDT, chlordane, and dioxins, which are listed by EPA as
priority pollutants and classified as probable human carcinogens (cancer causing agents).
In some waterbodies, these substances have accumulated in sediment and pose a health
threat to those that consume fish or shellfish.
Some organic pollutants in very low
concentrations can pose a threat to human
health. Many of these compounds have
been banned from use for several decades.
However, organic pollution that occurred
decades ago still poses a serious threat,
because these substances tend to remain in
the environment for an extremely long time.
Dioxins are man-made by-products of
herbicide manufacturing, certain historical
paper mill manufacturing processes, and the
incineration of chlorine-based chemicals.
Dioxins are considered among the most
toxic substances released into the
Types of Metals
Stream
Miles
Metal Impaired
Stream
Miles
Metal Impaired
Mercury 272 Copper 25
Iron 252 Lead 24
Manganese 204 Strontium 7
Arsenic 90 Chromium 6
Zinc 47 Cesium 5
Aluminum 35
Types of Organic Contaminants
Organic
Contaminant
Stream Miles
Impaired
PCBs..……… 320
Dioxin……….. 256
Chlordane.…… 256
RDX….……… 63
PAHs…………. 17
Creosote…….. 16
Toluene……. 0.5
Note: Streams can be impaired by
more than one type of organic
contaminant. These totals are not
additive.

46
environment. EPA has not found a safe exposure level. In fact, EPA has determined that
dioxins, in addition to being probable human carcinogens, can cause reproductive and
developmental problems.
One problem in identifying organic pollution is that water quality criteria are often below
current detection levels. Detection of these substances is generally made either by
analyzing fish tissue levels and/or by use of sediment screening values provided by EPA.
Since organic contaminants can bioaccumulate in fish, it is important to make sure catfish
and other species consumed by people are safe to eat. Children and pregnant or nursing
women are the most sensitive populations.
8. pH
Low pH, elevated alkalinity, or a significant change in the pH or acidity of the water over a
relatively short period of time, can greatly impact aquatic life. A common reason for a
change in pH is acidic runoff from active or abandoned mine sites. Currently, 394 stream
miles are listed as impaired by low pH, most in areas with historical mining activities.
Disturbance of certain rock formations during road construction can also release acidity to
streams. Excessive amounts of algae can cause streams and rivers to violate standards on
the alkaline side, but this phenomenon more commonly occurs in lakes.
The pH level also plays an important role in the toxicity of metals, with pH levels below
5.5 generally increasing toxic effects. On the other hand, ammonia toxicity is increased in
the presence of high pH. The statewide fish and aquatic life pH criterion for large rivers,
reservoirs, and wetlands is 6.5 to 9.0. The pH criterion for wadeable streams and rivers is
6.0 – 9.0.
9. Flow Alteration
Four hundred sixty five (465) stream miles are currently assessed as impaired by flow
alteration. Flow alteration is a change to the flow that leads to a loss of instream habitat.
Impoundments and channelization are common sources of flow alteration. Increased water
velocities also cause extreme down-cutting of stream and river channels, plus increase the
sediment transported downstream. In extreme cases, flow alterations cause stream
channels to be dry.

47
B. Causes of Pollution in Reservoirs and Lakes
Some of the same types of pollutants that occur in rivers and streams impact reservoirs,
although in different magnitudes. The main pollutants in Tennessee reservoirs are toxic
organics such as PCBs and dioxins. Other pollutants include mercury, nutrients,
sediment/silt, low DO, and pesticides such as chlordane (Figure 10 and Table 8). The
effects of most of these pollutants are the same as in flowing water, however, persistent
substances are more likely to accumulate and remain in reservoirs for a very long time.
Figure 10: Relative Impacts of Pollution in Impaired Reservoir
and Lake Acres
1. Organic Substances
Priority organic substances such as PCBs and dioxins are the cause of pollution in over
a third of the impaired lake acres. Reservoirs serve as sediment traps and once a
pollutant gets into the sediment it is very difficult to remove. These materials move
through the food chain and can become concentrated in fish tissue. People eating fish
from the waterbody may also concentrate these toxic substances in their bodies, which
can lead to health problems. Currently, 95,438 lake acres are posted for organic
contamination. Chapter 5 has specific information on posted reservoirs and the health
hazards associated with eating contaminated fish.

48
Types of Organic
Contaminants
Organic
Contaminant
Lake Acres
Impaired
PCBs…………. 95,438
Dioxins………. 10,370
Note: Lakes can be impaired by
more than one organic substance.
These totals are not additive.
Types of Metals
Metal
Lake Acres
Impaired
Mercury……… 67,562
Copper……….. 2,254
Iron…………… 2,254
Zinc…………...
Aluminum…….
Arsenic..............
2,254
455
455
Note: Reservoirs can be impaired
by more than one metal. These
totals are not additive.
PCBs were extensively used in the U.S. for industrial and commercial uses until they
were banned in 1976. Unfortunately, over 1.5 billion pounds of PCBs were produced
before the ban. It is not known how many tons ended up in waterways in Tennessee.
Elevated levels of PCBs have been found
in fish tissue collected from the following
reservoirs:
Fort Loudoun Reservoir
Boone Reservoir
Tellico Reservoir
Watts Bar Reservoir
Nickajack Reservoir
Melton Hill Reservoir
Woods Reservoir
2. Metals
As in rivers and streams, metals can pose a serious health threat in reservoirs and lakes.
The concerns with metals contamination include the danger it poses to people who eat fish
from contaminated reservoirs as well as toxicity to fish and aquatic life.
The reservoirs in Tennessee assessed as
impaired by metals have been impacted by
legacy activities, atmospheric deposition, or
industrial discharges. The copper, iron, and
zinc found in three Ocoee River Reservoirs are
from historical mining operations.
Mercury in the Clinch River section of Watts
Bar Reservoir is from legacy activities at the
Department of Energy (DOE) Reservation.
Additional reservoirs or embayments impacted
by mercury include upper Fort Loudoun, upper
Cherokee, Beech, Watauga, South Holston,
Tellico, Norris, and the Hiwassee embayment
of Chickamauga Reservoir.
3. Temperature
The most stringent criterion for temperature is for the protection of fish and aquatic life.
This criterion states:
The maximum water temperature change shall not exceed 3C° relative to an
upstream control point. The temperature of the water shall not exceed 30.5°C and
the maximum rate of change shall not exceed 2C° per hour.
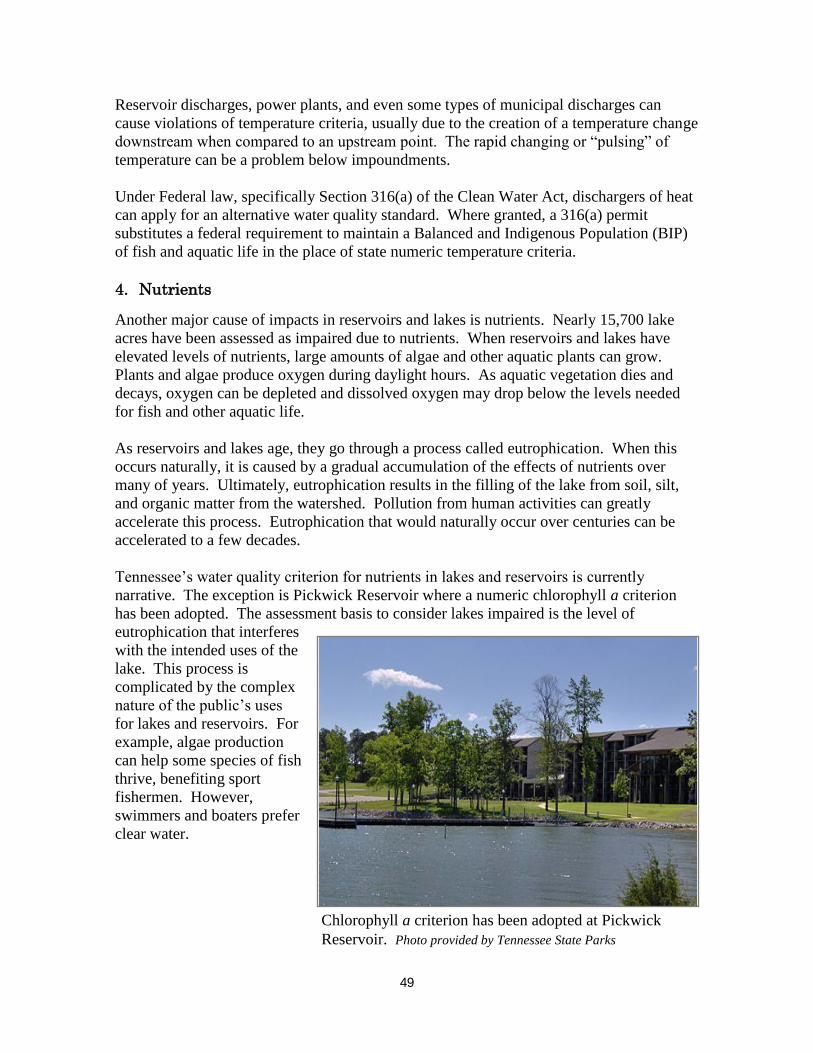
49
Reservoir discharges, power plants, and even some types of municipal discharges can
cause violations of temperature criteria, usually due to the creation of a temperature change
downstream when compared to an upstream point. The rapid changing or “pulsing” of
temperature can be a problem below impoundments.
Under Federal law, specifically Section 316(a) of the Clean Water Act, dischargers of heat
can apply for an alternative water quality standard. Where granted, a 316(a) permit
substitutes a federal requirement to maintain a Balanced and Indigenous Population (BIP)
of fish and aquatic life in the place of state numeric temperature criteria.
4. Nutrients
Another major cause of impacts in reservoirs and lakes is nutrients. Nearly 15,700 lake
acres have been assessed as impaired due to nutrients. When reservoirs and lakes have
elevated levels of nutrients, large amounts of algae and other aquatic plants can grow.
Plants and algae produce oxygen during daylight hours. As aquatic vegetation dies and
decays, oxygen can be depleted and dissolved oxygen may drop below the levels needed
for fish and other aquatic life.
As reservoirs and lakes age, they go through a process called eutrophication. When this
occurs naturally, it is caused by a gradual accumulation of the effects of nutrients over
many of years. Ultimately, eutrophication results in the filling of the lake from soil, silt,
and organic matter from the watershed. Pollution from human activities can greatly
accelerate this process. Eutrophication that would naturally occur over centuries can be
accelerated to a few decades.
Tennessee’s water quality criterion for nutrients in lakes and reservoirs is currently
narrative. The exception is Pickwick Reservoir where a numeric chlorophyll a criterion
has been adopted. The assessment basis to consider lakes impaired is the level of
eutrophication that interferes
with the intended uses of the
lake. This process is
complicated by the complex
nature of the public’s uses
for lakes and reservoirs. For
example, algae production
can help some species of fish
thrive, benefiting sport
fishermen. However,
swimmers and boaters prefer
clear water.
Chlorophyll a criterion has been adopted at Pickwick
Reservoir. Photo provided by Tennessee State Parks

50
5. Sediment/Suspended Solids
Sediment and silt cause significant problems in reservoirs as well as flowing water. Over
18,100 lake acres have been assessed as impaired by sediment and silt. Since reservoirs
and lakes serve as sediment traps, once sediment enters a lake it tends to settle out, initially
in embayment and headwater
areas, but ultimately
throughout the reservoir. It is
difficult and expensive to
remove sediment from
reservoirs. Three reservoirs,
Ocoee #3, Ocoee #2, and
Davy Crockett, have almost
filled in with sediment
caused by historic mining
activity. Parksville Lake has
significant delta formation in
its upper reaches. Reelfoot
Lake has also been impaired
by sediment.
Reelfoot Lake has been impaired by sediment. Photo provided by Jackson EFO
Stages of Eutrophication:
1. Oligotrophic lakes are young lakes with relatively low levels of nutrients and
high levels of dissolved oxygen. Since these lakes have low nutrient levels,
they also have less algae and aquatic vegetation.
2. Mesotrophic lakes have moderate amounts of nutrients, but maintain a high
level of dissolved oxygen. This results in more algae and aquatic vegetation
that serve as a good food source for other aquatic life, yielding a high
biological diversity.
3. Eutrophic lakes have high levels of nutrients and therefore, high amounts of
algae. Often, in the summer, an algae bloom will occur which can cause the
dissolved oxygen levels to drop in the lake’s lower layer.
4. Hypereutrophic lakes have extremely high nutrient levels. The algae at this
stage are so thick it can cause the lake to resemble pea soup. The dissolved
oxygen in the lower layer of the lake may drop to the point where fish and other
aquatic life cannot survive. Lakes that are hypereutrophic do not typically
support the uses for which they are designated.
51
6. Dissolved Oxygen
The dissolved oxygen (DO) minimum water quality standard for reservoirs and lakes is 5
mg/L measured at a depth of five feet unless the lake is less than ten feet deep. If the lake
is less than ten feet deep, the DO criterion is applied at mid-depth. In eutrophic reservoirs,
the DO can be much lower than 5 mg/L. Even in reservoirs that have a DO of 5 mg/L at
the prescribed depth, the dissolved oxygen levels can be near zero at greater depths.
The most common reason lakes and reservoirs have fish kills due to low DO is
eutrophication. Overproduction of algae raises oxygen levels in sunshine, but on cloudy
days and at night the resulting algae die-off can cause DO levels to plummet.
Additionally, high levels of biomass will restrict light penetration to a few feet or even
inches. Below the depth where light can penetrate, DO levels will be very low.
Lakes that are eutrophic often strongly stratify, which means that there is a layer of warm,
well-oxygenated water on top of a cold, poorly oxygenated layer. Stratification limits the
dissolved oxygen available to fish and other aquatic life. Currently, almost 38,000 lake
acres are listed as impaired by oxygen depletion.
DO levels in lakes and reservoirs can also be affected by discharges from upstream dams.
Water released from the bottom of the reservoir may have very low dissolved oxygen
levels. Low dissolved oxygen in Barkley Reservoir is caused by the discharge of heat
from TVA’s Cumberland Steam Plant, combined with low flows due to drought and
repairs to upstream reservoirs.
7. Pesticides
Pesticides, if used improperly, can cause harm to humans, animals, and the environment.
Many pesticides have been banned in the U.S. but pollution that occurred decades ago still
poses a serious threat, because they tend to remain in the environment for an extremely
long time. In some waterbodies, these substances have accumulated in sediment and pose
a health threat to those that consume fish or shellfish.
Although banned in 1988, nearly 14,000 acres are impaired by chlordane. Boone
Reservoir has fish consumption advisories due to chlordane levels found in carp and
catfish. Pesticides are more likely to bioaccumulate in these fish species since them tend
to accumulate more in fattier fish.
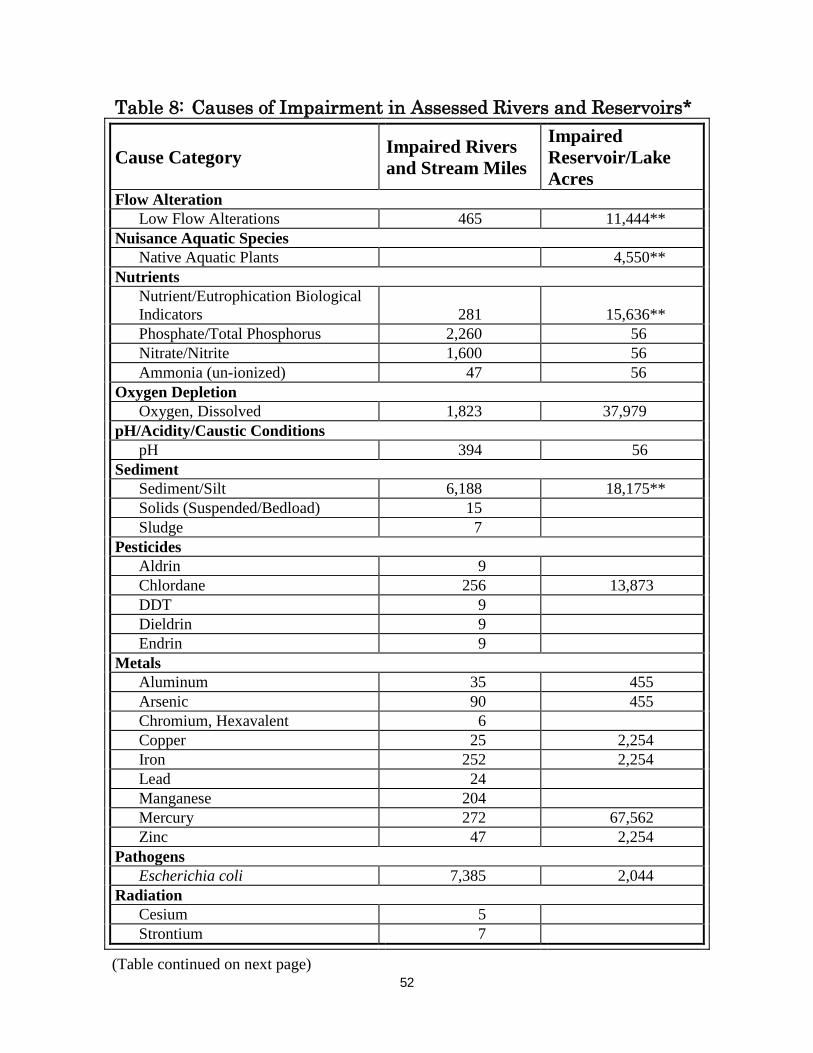
52
(Table continued on next page)
Table 8: Causes of Impairment in Assessed Rivers and Reservoirs*
Cause Category Impaired Rivers
and Stream Miles
Impaired
Reservoir/Lake
Acres Flow Alteration
Low Flow Alterations 465 11,444**
Nuisance Aquatic Species
Native Aquatic Plants 4,550**
Nutrients
Nutrient/Eutrophication Biological
Indicators
281
15,636**
Phosphate/Total Phosphorus 2,260 56
Nitrate/Nitrite 1,600 56
Ammonia (un-ionized) 47 56
Oxygen Depletion
Oxygen, Dissolved 1,823 37,979
pH/Acidity/Caustic Conditions
pH 394 56
Sediment
Sediment/Silt 6,188 18,175**
Solids (Suspended/Bedload) 15
Sludge 7
Pesticides
Aldrin 9
Chlordane 256 13,873
DDT 9
Dieldrin 9
Endrin 9
Metals
Aluminum 35 455
Arsenic 90 455
Chromium, Hexavalent 6
Copper 25 2,254
Iron 252 2,254
Lead 24
Manganese 204
Mercury 272 67,562
Zinc 47 2,254
Pathogens Escherichia coli 7,385 2,044
Radiation
Cesium 5
Strontium 7
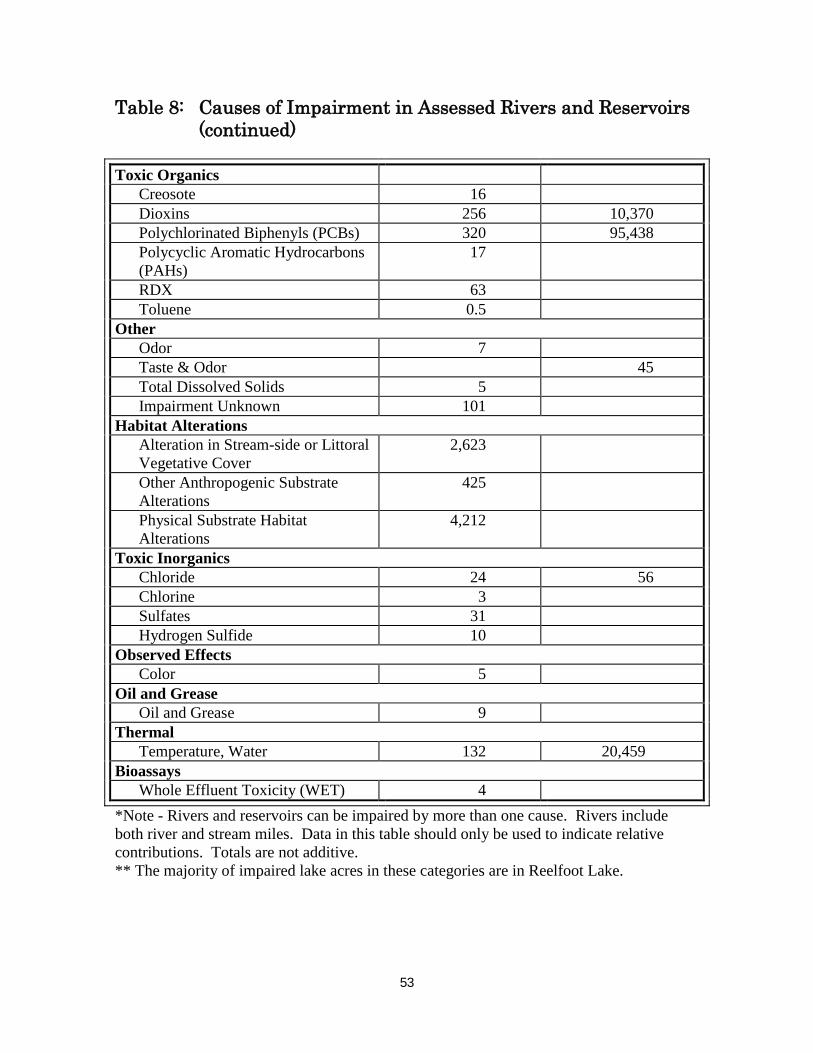
53
Table 8: Causes of Impairment in Assessed Rivers and Reservoirs
(continued)
Toxic Organics
Creosote 16
Dioxins 256 10,370
Polychlorinated Biphenyls (PCBs) 320 95,438
Polycyclic Aromatic Hydrocarbons
(PAHs)
17
RDX 63
Toluene 0.5
Other
Odor 7
Taste & Odor 45
Total Dissolved Solids 5
Impairment Unknown 101
Habitat Alterations
Alteration in Stream-side or Littoral
Vegetative Cover
2,623
Other Anthropogenic Substrate
Alterations
425
Physical Substrate Habitat
Alterations
4,212
Toxic Inorganics
Chloride 24 56
Chlorine 3
Sulfates 31
Hydrogen Sulfide 10
Observed Effects
Color 5
Oil and Grease
Oil and Grease 9
Thermal
Temperature, Water 132 20,459
Bioassays
Whole Effluent Toxicity (WET) 4
*Note - Rivers and reservoirs can be impaired by more than one cause. Rivers include
both river and stream miles. Data in this table should only be used to indicate relative
contributions. Totals are not additive.
** The majority of impaired lake acres in these categories are in Reelfoot Lake.
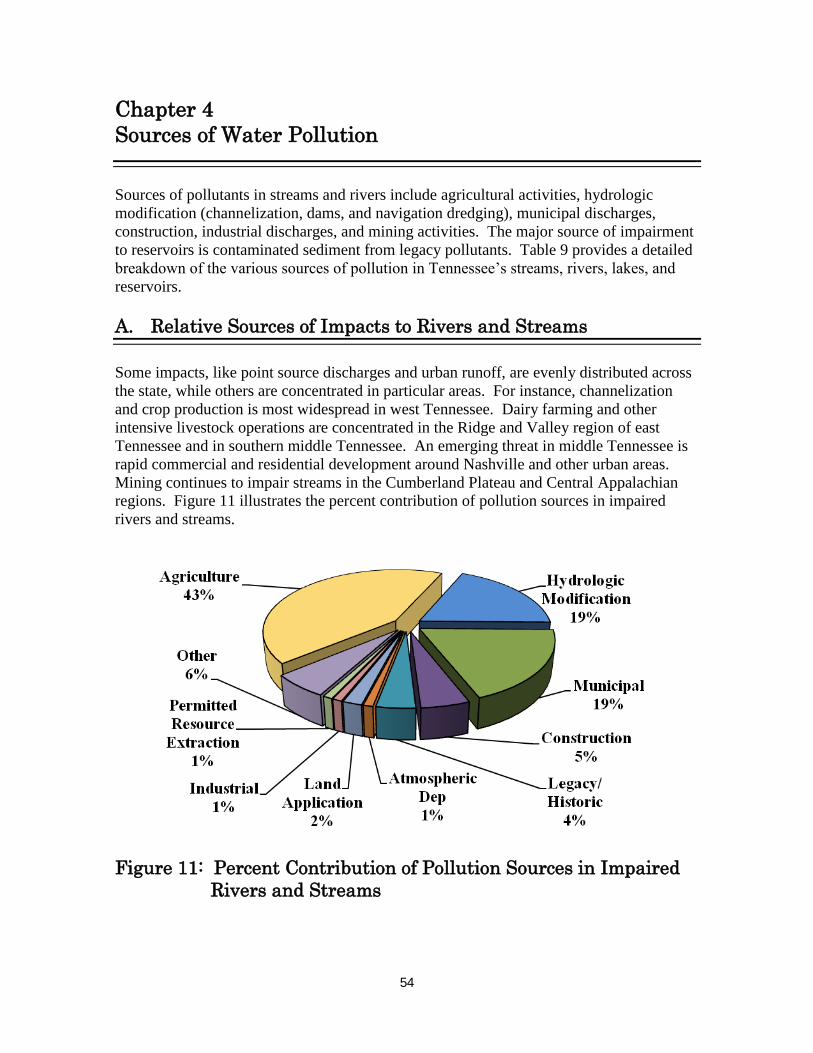
54
Chapter 4
Sources of Water Pollution
Sources of pollutants in streams and rivers include agricultural activities, hydrologic
modification (channelization, dams, and navigation dredging), municipal discharges,
construction, industrial discharges, and mining activities. The major source of impairment
to reservoirs is contaminated sediment from legacy pollutants. Table 9 provides a detailed
breakdown of the various sources of pollution in Tennessee’s streams, rivers, lakes, and
reservoirs.
A. Relative Sources of Impacts to Rivers and Streams
Some impacts, like point source discharges and urban runoff, are evenly distributed across
the state, while others are concentrated in particular areas. For instance, channelization
and crop production is most widespread in west Tennessee. Dairy farming and other
intensive livestock operations are concentrated in the Ridge and Valley region of east
Tennessee and in southern middle Tennessee. An emerging threat in middle Tennessee is
rapid commercial and residential development around Nashville and other urban areas.
Mining continues to impair streams in the Cumberland Plateau and Central Appalachian
regions. Figure 11 illustrates the percent contribution of pollution sources in impaired
rivers and streams.
Figure 11: Percent Contribution of Pollution Sources in Impaired
Rivers and Streams

55
Table 9: Sources of Pollutants in Assessed Rivers and
Reservoirs*
Sources Category Total Impaired
River Miles
Total Impaired
Reservoir/Lake
Acres
Industrial Permitted Discharge
RCRA Hazardous Waste Sites 100
Industrial Point Source 60 7,791
Stormwater Discharge 30
Petroleum/Natural Gas 1
Industrial Thermal Discharges 20,459
Municipal Permitted Dischargers
Separate Storm Sewer (MS4) 2,439 994
Package Plants 38
Combined Sewer Overflows 10 994
Sanitary Sewer Overflows 715
Urbanized (High Density Area) 448 45
Municipal Point Source 629
Spills and Unpermitted Discharges
Above Ground Storage Tank Leaks 0.5
Other Spill Related Impacts 455
Agriculture
Specialty Crop Production 59
CAFOs 32
Unrestricted Cattle Access 304
Dairies (Outside Milk Parlor Areas) 15
Irrigated Crop Production 47
Grazing in Riparian or Shoreline Zones 6,057 481
Animal Feeding Operations (NPS) 240 34
Livestock (grazing or feeding) 7
Aquaculture (permitted) 4
Non-irrigated Crop Production 3,026 15,587**
Manure Run-off 1
Permitted Resource Extraction
Surface Mining 12 56
Subsurface/Hardrock 9
Sand/Gravel/Rock 92
Dredge Mining 50
Coal Mining Discharge (permitted) 64
Hydrologic Modification
Channelization 3,506
Dredging (Navigation Channel) 207
Upstream Impoundment 622 2,469
Flow Regulation/Modification 15
(Table continued on next page.)
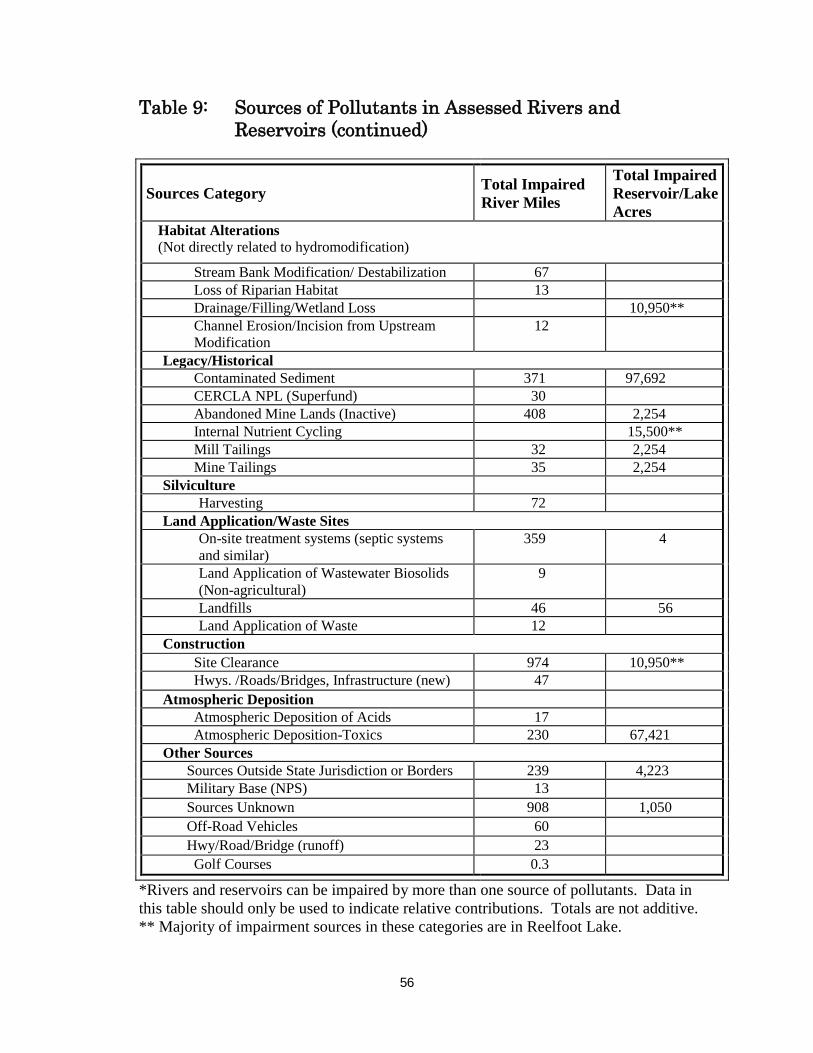
56
Table 9: Sources of Pollutants in Assessed Rivers and
Reservoirs (continued)
Sources Category Total Impaired
River Miles
Total Impaired
Reservoir/Lake
Acres
Habitat Alterations
(Not directly related to hydromodification)
Stream Bank Modification/ Destabilization 67
Loss of Riparian Habitat 13
Drainage/Filling/Wetland Loss 10,950**
Channel Erosion/Incision from Upstream
Modification
12
Legacy/Historical
Contaminated Sediment 371 97,692
CERCLA NPL (Superfund) 30
Abandoned Mine Lands (Inactive) 408 2,254
Internal Nutrient Cycling 15,500**
Mill Tailings 32 2,254
Mine Tailings 35 2,254
Silviculture
Harvesting 72
Land Application/Waste Sites
On-site treatment systems (septic systems
and similar)
359 4
Land Application of Wastewater Biosolids
(Non-agricultural)
9
Landfills 46 56
Land Application of Waste 12
Construction
Site Clearance 974 10,950**
Hwys. /Roads/Bridges, Infrastructure (new) 47
Atmospheric Deposition
Atmospheric Deposition of Acids 17
Atmospheric Deposition-Toxics 230 67,421
Other Sources
Sources Outside State Jurisdiction or Borders 239 4,223
Military Base (NPS) 13
Sources Unknown 908 1,050
Off-Road Vehicles 60
Hwy/Road/Bridge (runoff) 23
Golf Courses 0.3
*Rivers and reservoirs can be impaired by more than one source of pollutants. Data in
this table should only be used to indicate relative contributions. Totals are not additive.
** Majority of impairment sources in these categories are in Reelfoot Lake.

57
Sources of Agricultural Impairment
Agricultural Source
Stream Miles
Impaired
Grazing in Riparian Zone……... 6,057
Non-irrigated Crop Production.. 3,026
Unrestricted Cattle Access........ 304
Animal Feeding Operations…... 240
Specialty Crop Production……. 59
Irrigated Crop Production…….. 47
CAFOs………………………... 32
Dairies (Outside Milk Parlor
Areas)………………………….
15
Livestock (grazing or feeding)... 7
Aquaculture (permitted)………. 4
Manure Run-off………………. 1
Note: Pollutants in streams can come from
more than one source. These totals are not
additive.
1. Agriculture
Almost half of the land in
Tennessee is used for agriculture.
These activities contribute
approximately 43 percent of the
impaired stream miles in the state.
Statewide, the largest single source
of impacts is grazing of livestock,
followed by crop production. In
west Tennessee, tons of soil are
lost annually due to erosion from
crop production (mostly cotton and
soybean). In middle Tennessee,
cattle grazing and hog farms are
the major agricultural activity and
result in bank erosion, plus
elevated bacteria and nutrient
levels. In east Tennessee, runoff
from feedlots and dairy farms
greatly impact some waterbodies.
Figure 12 illustrates the relative
contributions of the primary
agricultural sources.
The Tennessee Water Quality Control Act does not give the division authority to regulate
water runoff originating from normal agricultural activities such as plowing fields, tending
animals and crops, and cutting trees. However, agricultural activities that may result in
significant point source of pollution, such as animal waste system discharges from
concentrated livestock operations, are regulated.
Tennessee has made great strides in recent years to prevent agricultural and forestry
impacts. Educational and cost-sharing projects promoted by the Department of
Agriculture, Natural Resource Conservation Service (NRCS) and University of Tennessee
Agricultural Extension Service have helped farmers install Best Management Practices
(BMP’s) all over the state. Farmers have voluntarily helped to decrease erosion rates and
protect streams and rivers by increasing riparian habitat zones and setting aside
conservation reserves.
The division has a memorandum of understanding with the Tennessee Department of
Agriculture (TDA). Under this agreement, the division and TDA will continue to jointly
resolve complaints about water pollution from agricultural activities. When a problem is
found or a complaint has been filed, TDA has the lead responsibility to contact the farmer
or logger. Technical assistance is offered to correct the problem. TDEC and TDA
coordinate on water quality monitoring, assessment, 303(d) list development, TMDL
generation, and control strategy implementation.
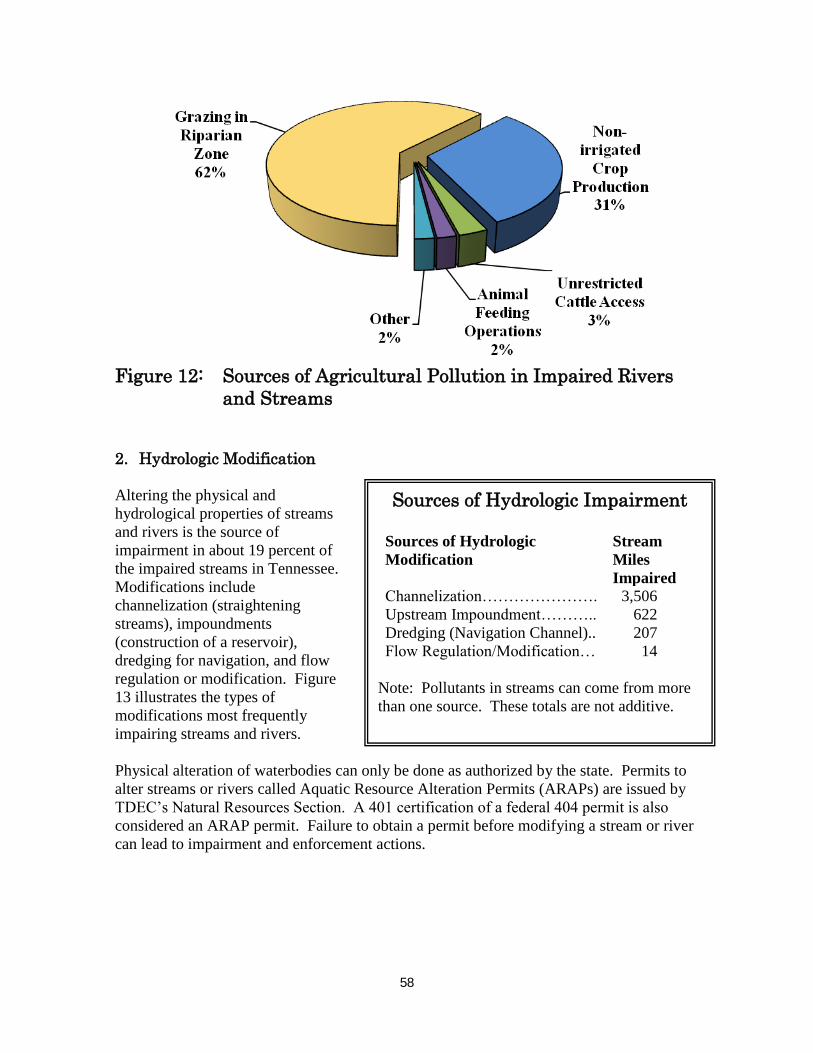
58
Sources of Hydrologic Impairment
Sources of Hydrologic
Modification
Stream
Miles
Impaired
Channelization…………………. 3,506
Upstream Impoundment……….. 622
Dredging (Navigation Channel).. 207
Flow Regulation/Modification… 14
Note: Pollutants in streams can come from more
than one source. These totals are not additive.
Figure 12: Sources of Agricultural Pollution in Impaired Rivers
and Streams
2. Hydrologic Modification
Altering the physical and
hydrological properties of streams
and rivers is the source of
impairment in about 19 percent of
the impaired streams in Tennessee.
Modifications include
channelization (straightening
streams), impoundments
(construction of a reservoir),
dredging for navigation, and flow
regulation or modification. Figure
13 illustrates the types of
modifications most frequently
impairing streams and rivers.
Physical alteration of waterbodies can only be done as authorized by the state. Permits to
alter streams or rivers called Aquatic Resource Alteration Permits (ARAPs) are issued by
TDEC’s Natural Resources Section. A 401 certification of a federal 404 permit is also
considered an ARAP permit. Failure to obtain a permit before modifying a stream or river
can lead to impairment and enforcement actions.

59
Figure 13: Sources of Hydrologic Impairment in Rivers and
Streams. (Flow regulation and modification represent less
than one percent of the impairments.)
a. Channelization
Channelization is the source of impairment for 81 percent of the streams and rivers
assessed as impacted by habitat alteration. Originally, channelization was
implemented to control flooding and protect croplands along rivers. In West
Tennessee, channelization was used extensively to drain wetlands to create
cropland. Throughout Tennessee, streams continue to be impaired by
channelization and bank destabilization from vegetation removal.
Costs associated with channelization include:
Increased erosion rates and soil loss.
Elimination of valuable fish and wildlife habitat by draining wetlands and
clearing riparian areas.
Destruction of bottomland hardwood forests.
Magnification of flooding problems downstream.
“Down-cutting” of streambeds as the channel tries to regain stability.
In recent years, no large-scale channelization projects have been approved.
Tennessee is working with the Corps of Engineers to explore methods to reverse
some of the historical damage to water quality caused by channelization.
Some streams and rivers continue to be channelized by landowners. However,
stream alteration without proper authorization is a violation of the Water Quality
Control Act subject to enforcement.

60
b. Stream and River Impoundment
Problems associated with the impoundment of streams and rivers are increasing as
more free flowing streams are dammed. It has been the experience of the division
that very few of these impoundments can be managed in such a way as to avoid
water quality problems.
Problems often associated with stream and river impoundment include:
Erosion during dam construction.
Loss of stream or river for certain kinds of recreational use.
Changes in the flow downstream of the dam.
Elevated metals downstream of the dam.
Low dissolved oxygen levels in tailwaters, which decrease biological
diversity downstream and threaten aquatic life, including endangered
species.
Habitat change resulting in loss of aquatic organisms.
Barriers to fish migration.
c. Dredging
Dredging or removing substrate from a stream or river is done to deepen river
channels for navigation or to mine sand or gravel for construction. Dredging can
cause habitat disruption, substrate alteration, sedimentation, and erosion.
Unfortunately, dredging is sometimes done without authorization.
Impoundments
often result in
altered flow
patterns,
erosion and loss
of instream and
riparian habitat.
Photo provided by
Aquatic Biology
Section, TDH.

61
3. Municipal Discharges
a. Municipal Stormwater Discharges
As stormwater drains through urban areas, it picks up pollutants from yards, streets,
and parking lots and deposits them into nearby waterways. The runoff can be laden
with silt, bacteria, metals, and nutrients. Following heavy rains, streams can
contain various pollutants at elevated levels for several days. Water quality
standards violations have been documented in Tennessee’s four largest cities:
Memphis, Nashville, Chattanooga, and Knoxville, plus many other smaller towns.
The federal National Pollutant Discharge Elimination System (NPDES) program
regulates stormwater runoff. Industries and large commercial operations must
operate under the state’s general NPDES permit for industrial stormwater
discharge. This permit requires site-specific stormwater pollution prevention plans
and mandatory installation of pollution control measures.
Under Tennessee Municipal Separate Storm Sewer Systems (MS4) permits, cities
must develop stormwater programs and regulate sources at a local level. In
addition to Tennessee’s four MS4 Phase I cities (Memphis, Nashville, Chattanooga,
and Knoxville) that are covered under individual NPDES permits, 78 other cities
and counties are now covered by the MS4 Phase II general permits.
There are six Phase II MS4 program elements designed to further reduce pollutants
from stormwater. The elements include public education and outreach, along with
public participation and involvement. Further, a plan must be implemented to
detect and eliminate illicit discharges to the storm sewer system.
Construction sites must obtain coverage under the state’s general NPDES permit
for construction stormwater runoff if clearing, grading or excavating is planned on
any site larger than one acre or any disturbance of less than one acre if it is part of a
larger common plan of development or sale. Sites receiving coverage under the
permit are required to control erosion as well as address post-construction
stormwater runoff.
b. Combined Sewer Overflows
In Tennessee, only three cities (Nashville, Chattanooga, and Clarksville) have
combined sewers (sanitary waste and storm water carried in the same sewer).
Permits require that when these sewers overflow during large storm events,
monitoring must be conducted. Several water contact advisories are due to
combined sewer overflows.
62
c. Municipal Point Source Discharges
Municipal sewage treatment plants have permits designed to prevent impacts to the
receiving waterbody. On rare occasions, sewage treatment systems fail to meet
permit requirements. Sometimes, a waterbody downstream of a facility is found to
not meet biological criteria and the upstream facility is listed as a potential source
of the pollutant of concern, even if permit limits are being met. In those cases,
permit requirements must be adjusted along with other watershed improvements to
address water quality concerns.
d. Sanitary Sewer Overflows
Collection systems convey raw sewage to treatment plants through a series of pipes
and pump stations. Unfortunately, these systems occasionally malfunction or
become overloaded, which can result in the discharge of high volumes of untreated
sewage to a stream or river. A serious concern near urban areas is children being
exposed to elevated bacteria levels while playing in streams and rivers after heavy
rains.
Sanitary sewer collection systems are monitored by municipalities to insure that
they are not leaking. NPDES permits contain provisions that prohibit overflows
and require that they be reported to TDEC. Enforcement action must be taken
against cities that fail to report and correct sewage system problems.
4. Construction
The populations of many Tennessee communities have rapidly expanded in the last decade.
The construction of subdivisions, shopping malls, and highways can harm water quality if
the sites are not properly stabilized. The impacts most frequently associated with land
development are silt and habitat alteration. Construction sites must obtain coverage under
the state’s general NPDES permit for construction stormwater runoff if clearing, grading or
excavating is planned on any site larger than one acre or any disturbance of less than one
acre if it is part of a larger common plan of development or sale.
In addition, local stormwater control programs and regulations have been helpful in
controlling water quality impacts from land development. MS4 Phase I cities (Memphis,
Nashville, Chattanooga, and Knoxville) already have construction stormwater control
programs in effect. The 78 cities and counties covered under the Phase II MS4 general
permit have developed construction stormwater control programs. In these cities, local
staff help identify sources of stormwater runoff and develop control strategies.
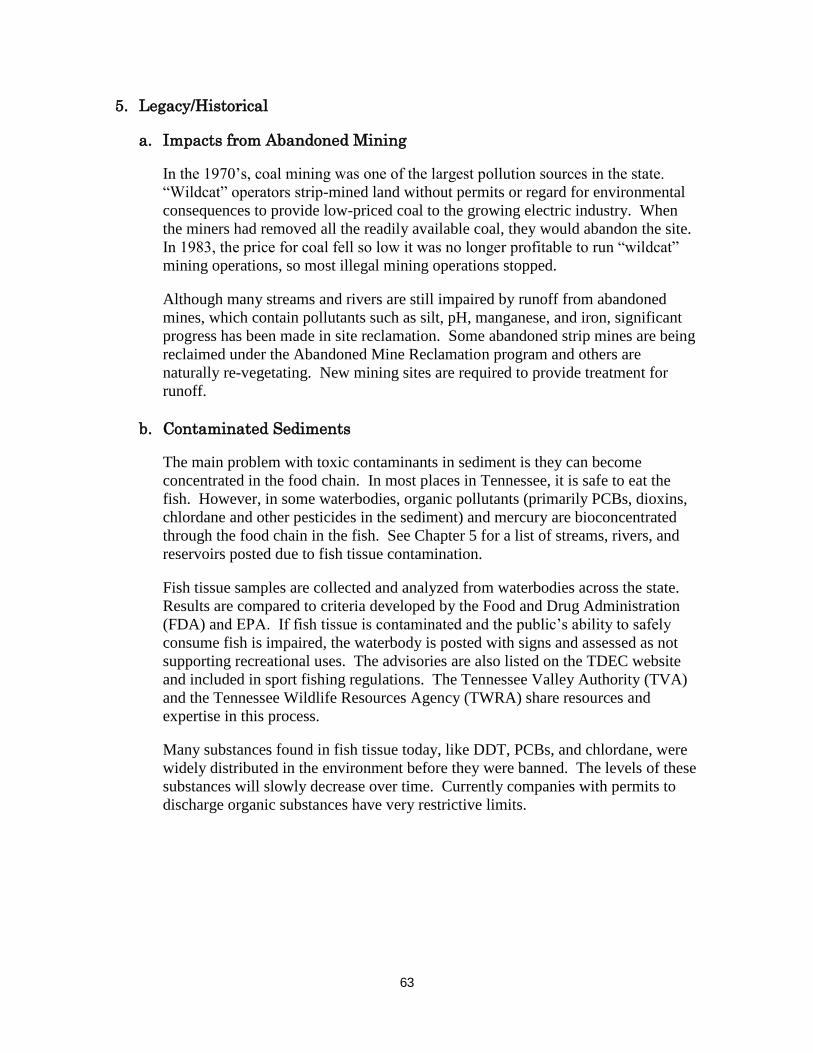
63
5. Legacy/Historical
a. Impacts from Abandoned Mining
In the 1970’s, coal mining was one of the largest pollution sources in the state.
“Wildcat” operators strip-mined land without permits or regard for environmental
consequences to provide low-priced coal to the growing electric industry. When
the miners had removed all the readily available coal, they would abandon the site.
In 1983, the price for coal fell so low it was no longer profitable to run “wildcat”
mining operations, so most illegal mining operations stopped.
Although many streams and rivers are still impaired by runoff from abandoned
mines, which contain pollutants such as silt, pH, manganese, and iron, significant
progress has been made in site reclamation. Some abandoned strip mines are being
reclaimed under the Abandoned Mine Reclamation program and others are
naturally re-vegetating. New mining sites are required to provide treatment for
runoff.
b. Contaminated Sediments
The main problem with toxic contaminants in sediment is they can become
concentrated in the food chain. In most places in Tennessee, it is safe to eat the
fish. However, in some waterbodies, organic pollutants (primarily PCBs, dioxins,
chlordane and other pesticides in the sediment) and mercury are bioconcentrated
through the food chain in the fish. See Chapter 5 for a list of streams, rivers, and
reservoirs posted due to fish tissue contamination.
Fish tissue samples are collected and analyzed from waterbodies across the state.
Results are compared to criteria developed by the Food and Drug Administration
(FDA) and EPA. If fish tissue is contaminated and the public’s ability to safely
consume fish is impaired, the waterbody is posted with signs and assessed as not
supporting recreational uses. The advisories are also listed on the TDEC website
and included in sport fishing regulations. The Tennessee Valley Authority (TVA)
and the Tennessee Wildlife Resources Agency (TWRA) share resources and
expertise in this process.
Many substances found in fish tissue today, like DDT, PCBs, and chlordane, were
widely distributed in the environment before they were banned. The levels of these
substances will slowly decrease over time. Currently companies with permits to
discharge organic substances have very restrictive limits.

64
6. Industrial Discharges
Although the number of waters impaired by industrial pollution is lower than it was a few
decades ago, industrial facilities impact some streams and rivers in Tennessee. Streams
impaired by industrial discharges include East Fork Poplar Creek, Pigeon River, North
Fork Holston River, and Russell Branch. See the current 303(d) list of impaired waters for
all waterbodies assessed as impacted by industrial discharges.
Industrial impacts include sporadic spills, temperature alterations, and historical discharge
of substances that can concentrate in the food chain. Occasionally, industrial dischargers
fail to meet permit requirements. Industries and large commercial operations such as
junkyards are
required to
operate under the
state’s general
NPDES permit
for industrial
stormwater
discharge. This
permit requires
the development
of site-specific
stormwater
pollution
prevention plans
and mandatory
installation of
pollution control
measures.
Water samples are routinely collected downstream of permitted discharges. Photo provided by Nashville EFO.
7. Land Application/Waste Sites
Solid waste and septic systems contribute to water quality problems in various ways. Solid
waste in landfills can leach into groundwater and surface water if not prevented.
Wastewater in failing septic tanks can leak into the ground causing water contamination.
Treated wastewater and sludge are applied to land as fertilizers and can be washed into
streams causing nutrient loading. Another concern is the use and maintenance of
underground storage tanks that can contain substances like petroleum products, solvents,
and other hazardous chemicals and wastes. These can leak into the groundwater and may
reach the surface water.
Photo provided by Columbia EFO

65
B. Distribution of Sources of Impacts to Reservoirs
Like streams and rivers, reservoirs are impaired by many sources of pollution. However,
the dominant pollutant impacting reservoirs is sediment contaminated by legacy toxic
organic substances. Other significant sources are atmospheric deposition of mercury,
industry, agricultural activities, hydrologic modification, and construction (Figure 14).
Figure 14: Percent Contribution of Pollution Sources in Impaired
Reservoirs and Lakes
1. Legacy Pollutants
Legacy or historical pollutants are the number one source of contamination in reservoirs
and lakes. These are pollutants that were introduced into the waterbodies prior to the
enactment of water quality regulations or before EPA banned their use. Legacy pollutants
include contaminated sediments, superfund sites, and abandoned mine lands (Figure 15).
a. Contaminated Sediments
The biggest problem with legacy pollutants is contaminated sediments. Two
organic substances banned in the 1970’s, chlordane and PCBs, are responsible for
most of the continuing problem of sediment contamination today. These substances
bind with the sediment and remain in the environment for a long time. Once in the
sediment, they become part of the aquatic food chain. Bioaccumulation in fish
tissue has resulted in consumption advisories in several reservoirs (Chapter 5). The
levels of these substances will slowly decrease over time.

66
Figure 15: Sources of Legacy Pollutants in Reservoirs and Lakes
b. Internal Nutrient Cycling
Internal nutrient cycling is the release and recapture of nutrients from the sediment
of a lake or reservoir, which functions to accelerate eutrophication. Reelfoot Lake
in west Tennessee accounts for all the lake acres assessed as impaired by nutrient
cycling. This lake is in an advanced state of eutrophication due to sediment and
nutrients.
Eutrophication is a natural process that will occur in any lake. It becomes pollution
when it is accelerated by human activities, interferes with the desired uses of the
lake, or causes water quality standards to be violated in the reservoir or receiving
stream. For additional information on eutrophication, see Chapter 3.
c. Abandoned Mines/Mine Tailings/Mill Tailings
The Copper Basin in the tri-state area of Tennessee, Georgia, and North Carolina
was extensively mined beginning in 1843. Before 1900, this was the largest metal
mining area in the southeast. The last mine closed in 1987. Runoff from disturbed
areas has contaminated three downstream reservoirs on the Ocoee River. Much of
the area has been reforested. Due to CERCLA activities, water quality in the
Ocoee River has improved. Although much work remains to be done before water
quality goals are met, the transport of pollutants to the Ocoee River appears to have
diminished.

67
2. Agriculture
Similar to streams and rivers, reservoirs can be greatly impacted by agricultural activities.
Plowing and fertilizing croplands can result in the runoff of tons of soil and nutrients
annually. Over 16,000 lake acres in Tennessee are listed as impaired by farming activities.
Most of these acres are represented by Reelfoot Lake, which is listed as impaired due to
erosion from agricultural activities. Sources of agricultural impacts include non-irrigated
crop production and livestock grazing.
3. Other Modifications
Loss of wetlands in Reelfoot Lake accounts for the majority of lake/reservoir acres
impaired due to habitat modification. A small percentage of habitat impairment is due to
hydrostructure flow modification and upstream impoundments.
4. Construction
Almost 100 percent of the lake acres assessed as impaired by construction are land
development around Reelfoot Lake. Clearing land for development results in increased
sedimentation, nutrient runoff, drainage, filling, and loss of wetlands.
5. Industrial and Municipal
Impairment to lakes and reservoirs from municipal sources includes discharges from
separate storm sewer systems, collection system failures, and combined sewer overflows.
Industrial sources include point source discharges, such as mercury to the Hiwassee
embayment and upper Cherokee Reservoir, plus heat in Barkley Reservoir.
6. Atmospheric Deposition
Atmospheric deposition occurs when air pollutants are deposited to land or water. Primary
anthropogenic sources of pollutants include burning fossil fuels, agricultural activities, and
emissions from industrial operations. Tennessee currently has over 67,000 lake acres
impaired by atmospheric deposition of mercury, most found in east Tennessee. The effects
of mercury pollution are discussed in detail in Chapter 5.
In 2009, the division began a probabilistic study of fish tissue to test a model that may
predict mercury air deposition (Chapter 7). The mercury levels found in fish tissue did not
correlate with the REMSAD air deposition model that was used to model mercury
deposition. Several fish taken from areas with predicted high levels of mercury air
deposition contained relatively low levels of contamination. Other fish that had higher
concentrations of mercury came from areas with low predicted depositional mercury.

68
Chapter 5
Posted Streams, Rivers, and Reservoirs
When streams or reservoirs are found to have significantly elevated bacteria levels or when
fish tissue contaminant levels exceed risk-based criteria, it is the responsibility of the
Department of Environment and Conservation to post warning signs so that people will be
aware of the threat to public health. In Tennessee, the most common reasons for a river
or reservoir to be posted are the presence of high levels of bacteria in the water or PCBs,
chlordane, dioxins, or mercury in fish tissue. Currently 77 streams, rivers, and reservoirs
in Tennessee have been posted due to a public health threat. A current list of advisories is
posted on the department’s home page at
http://tn.gov/environment/wpc/publications/pdf/advisories.pdf.
Consistent with EPA guidance, any stream or
reservoir in Tennessee with an advisory is
assessed as not meeting the recreational
designated use and therefore, included in the
biennial 303(d) list of impaired waters.
Clearly, if the fish cannot be safely eaten, the
waterbody is not fully supporting its goal to be
fishable. Likewise, streams, rivers, and
reservoirs with high levels of bacteria are not
suitable for recreational activities such as
swimming or wading.
A. Bacteriological Contamination
About 176 river miles are posted due to bacterial contamination (Table 10). No reservoirs
or lakes are posted due to bacterial contamination. The presence of pathogens, disease-
causing organisms, affects the public's ability to safely swim, wade, and fish in streams,
rivers and reservoirs. Bacteria, viruses, and protozoa are the primary water-borne
pathogens in Tennessee. Improperly treated human wastes from such sources as failing
septic tanks, collection system overflows and improper connection to sewer or sewage
treatment plants are the reasons behind 62 percent of the posted river miles (Figure 16).
The remaining stream miles are posted due to other sources such as failing animal waste
systems or urban runoff (Figure 17).
The division’s current water quality criterion for bacteria is based on levels of E. coli.
While this test is not considered direct proof of human health threats, it can indicate the
presence of water-borne diseases. Research is underway to find better indicators of risk
and to differentiate between human and animal sources of bacteria. The presence of
prescription medicines, caffeine, and hormones in water has been suggested as potential
markers for contamination by human waste.
The Commissioner shall have
the power, duty, and
responsibility to…post or cause
to be posted such signs as
required to give notice to the
public of the potential or actual
dangers of specific uses of such
waters. Tennessee Water Quality Control Act

69
Figure 16: Percent Contribution of Stream Miles Posted for
Pathogen Contamination
0
20
40
60
80
100
120
Stre
am M
iles
Sept
ic T
anks
STP
Urb
an R
unof
f /
Stor
n Se
wer
Col
lect
ion
Syst
em
/ Lea
king
sew
er
Agr
icul
ture
Out
-of-
stat
e
sour
ces
Source of Bacteriological Advisory
Figure 17: Stream Miles Contaminated by Various Pathogen
Sources. (The same stream may be impaired by more than one source of pollution. Totals are not additive.)

70
Table 10: Bacteriological Advisories in Tennessee
For additional information: http://www.tn.gov/environment/wpc/publications/pdf/advisories.pdf.
East Tennessee
Waterbody Portion County Comments Beaver Creek (Bristol) TN/VA line to Boone
Lake (20.0 miles)
Sullivan Nonpoint sources in
Bristol and Virginia
Cash Hollow Creek Mile 0.0 to 1.4 Washington Septic tank failures.
Coal Creek STP to Clinch R.
(4.7 miles)
Anderson Lake City STP.
East Fork Poplar Creek Mouth to Mile 15.0 Roane,
Anderson
Oak Ridge area.
First Creek Mile 0.2 to 1.5 Knox Knoxville urban
runoff.
Goose Creek Entire Stream (4.0
miles)
Knox Knoxville urban
runoff.
Leadvale Creek Douglas Lake to
headwaters
(1.5 miles)
Jefferson White Pine STP.
Little Pigeon River Mile 0.0 to 4.7 Sevier Improper connections
to storm sewers,
leaking sewers, and
failing septic tanks.
Pine Creek Mile 0.0 to 10.1 Scott Oneida STP and
collection system. Litton Fork of Pine Creek Mile 0.0 to 1.0
South Fork of Pine Creek Mile 0.0 to 0.7
East Fork of Pine Creek Mile 0.0 to 0.8
North Fork of Pine
Creek
Entire Stream
(1.5 Miles)
Second Creek Entire Stream
(2.9) Miles
Knox Knoxville urban
runoff.
Sinking Creek Mile 0.0 to 2.8 Washington Agriculture & urban
runoff.
Sinking Creek Embayment
of Ft. Loudoun Res.
1.5 miles from head
of embayment to
cave
Knox Knoxville Urban
Runoff
Third Creek Mile 0.0 to 1.4,
Mile 3.3
Knox Knoxville urban
runoff.
East Fork of Third Creek Mile 0.0 to 0.8 Knox Knoxville urban
runoff.
(Table continued on the next page)
71
Table 10: Bacteriological Advisories in Tennessee (Continued from previous page)
East Tennessee (continued)
Waterbody Portion County Comments
Johns Creek Downstream portion
(5.0 miles)
Cocke Failing septic tanks.
Baker Creek Entire stream (4.4 miles) Cocke Failing septic tanks.
Turkey Creek Mile 0.0 to 5.3 Hamblen Morristown
collection system.
West Prong of Little
Pigeon River
Mile 0.0 to 17.3 Sevier Improper connections
to storm sewers,
leaking sewers, and
failing septic tanks. Beech Branch Entire stream (1.0 mile)
King Branch Entire stream (2.5 miles)
Gnatty Branch Entire stream (1.8 miles)
Holy Branch Entire stream (1.0 mile)
Baskins Branch Entire stream (1.3 miles)
Roaring Creek Entire stream (1.5 miles)
Dudley Creek Entire stream (5.7 miles)
Southeast Tennessee
Waterbody Portion County Comments
Chattanooga Creek Mouth to GA line (7.7 mi.) Hamilton Chattanooga
collection system.
Little Fiery Gizzard Upstream natural area to
Grundy Lake
(3.7 miles).
Grundy Failing septic tanks
in Tracy City.
Clouse Hill Creek Entire Stream (1.9 miles)
Hedden Branch Entire Stream (1.5 miles)
Oostanaula Creek Mile 28.4 -31.2 (2.8 miles) McMinn Athens STP and
upstream dairies.
Stringers Branch Mile 0.0 to 5.4 Hamilton Red Bank collection
system.
Citico Creek Mouth to headwaters
(7.3 miles)
Hamilton Chattanooga urban
runoff and collection
system.
(Table continued on the next page)

72
Table 10: Bacteriological Advisories in Tennessee (Continued from previous page)
Middle Tennessee
Waterbody Portion County Comments
Duck River Old Stone Fort State Park
(0.2 mile)
Coffee Manchester
collection system.
Little Duck River Old Stone Fort State Park
(0.2 mile)
Mine Lick Creek Mile 15.3 to 15.8
(0.5 mile)
Putnam Baxter STP.
Nashville Area Davidson Metro Nashville
collection system
overflows and
urban runoff.
Brown’s Creek Main Stem (4.3 miles)
Dry Creek Mile 0.0 to 0.1
Gibson Creek Mile 0.0 to 0.2
McCrory Creek Mile 0.0 to 0.2
Tributary to
McCrory Creek
Mile 0.0 to 0.1
Richland Creek Mile 0.0 to 2.2
Whites Creek Mile 0.0 to 2.1
Cumberland River Bordeaux Bridge (Mile
185.7) to Woodland
Street Bridge (Mile
190.6)
West Tennessee
Waterbody Portion County Comments
Cypress Creek Entire Stream (7.7 miles) Shelby Urban stormwater
runoff.

73
B. Fish Tissue Contamination
Approximately 124,200 reservoir acres and 282 river miles are currently posted due to
contaminated fish (Table 11). The contaminants most frequently found at elevated levels
in fish tissue are PCBs, mercury, and chlordane (Figure 18 and 19).
The list of waterbodies with advisories is on the TDEC website and in TWRA fishing
regulations given to sports fisherman when they purchase a fishing license. Signs are also
mounted at public access points to posted waterbodies. There are two types of
consumption advisories. The no consumption advisory targets the general population and
warns that no one should eat specific fish from this body of water. The precautionary
advisory specifies that children, pregnant women, and nursing mothers should not consume
the fish species named, while all other people should limit consumption to one meal per
month. If needed, TWRA can enforce a fishing ban.
Figure 18: Percent Contribution of Reservoir Acres Posted for
Fish Tissue Contamination
Figure 19: Percent Contribution of Stream Miles Posted for Fish
Tissue Contamination
74
1. Organic contaminants
The majority of the lake reservoirs and about half of the stream miles posted for fish tissue
contamination are affected by organic contaminants (Figures 18 and 19). These organic
substances tend to bind with the sediment, settle out of the water, and persist in the
environment for a very long time. In the sediment, they become part of the aquatic food
chain and over time, bioconcentrate in fish tissue. Contaminants can be found in fish
tissue even if the substance has not been used or manufactured in decades. A brief
synopsis of the effects of some of these specific carcinogens and/or toxic substances
appears below.
a. PCBs - PCBs were used in hundreds of commercial and industrial processes
including electrical insulation, pigments for plastics, and plasticizers in paints.
Over 1.5 billion pounds of PCBs were produced in the U.S. prior to the ban on the
manufacture and distribution of PCBs in 1976.
Once PCBs enter a river or reservoir, they tend to bind with sediment particles.
Over time, they enter the food chain and are concentrated in fish tissue. When
people eat contaminated fish, PCBs are stored in the liver, fat tissue, and even
excreted in breast milk. EPA has determined that PCBs are a probable human
carcinogen (cancer causing agent). Additionally, in high enough concentrations,
PCBs are likely to damage the stomach, liver, thyroid gland, and kidneys and cause
a severe skin disorder.
b. Chlordane - Chlordane is a pesticide that was used on crops, lawns, and for
fumigation from 1948 to 1978 when EPA banned all above ground use. For the
next decade, termite control was the only approved usage of chlordane. In 1988, all
use of chlordane in the U.S. was banned.
Like PCBs, chlordane bioconcentrates in the food chain and is detected in fish
throughout Tennessee. In people, chlordane is stored in the liver and fat tissue.
EPA has determined that chlordane is a probable human carcinogen. Other
possible effects to people are damage to the liver, plus nervous and digestive
system disorders.
c. Dioxins - Dioxins are the by-product of certain industrial processes and the
combustion of chlorine-based chemicals. Dioxins refer to a class of compounds
with a similar structure and toxic action. Most of these chemicals are produced
from the incineration of chlorinated waste, the historical production of herbicides,
the production of PVC plastics, and the bleaching process historically used by
paper mills.
Like many other organic contaminants, dioxins are concentrated in fish. Even at
extraordinarily low levels (i.e. parts per quadrillion), dioxins can exert a toxic effect
on larval fish. Dioxins are classified as a probable human carcinogen. Other likely
effects in people are changes in hormone levels and developmental harm to
children.

75
2. Mercury
Mercury is a naturally occurring element found in air, water and soil. It exists in several
forms: elemental or metallic mercury, inorganic mercury compounds, and organic mercury
compounds. Natural sources of mercury include volcanoes, geysers, weathering of rocks,
and forest fires. However, there are significant anthropogenic sources of mercury.
Mercury is found in many rocks including coal. When coal is burned, mercury is released
into the environment. According to the EPA 2005 national emissions inventory, coal-
burning power plants are the largest human-caused source of mercury air emissions in the
United States, accounting for over 50 percent of all domestic human-caused mercury
emissions.
There is a well-documented link to human health impacts. Exposures to mercury can
affect the human nervous system and harm the brain, heart, kidneys, lungs, and immune
system. In pregnant women, ingested mercury is readily carried throughout the body by
the bloodstream and easily migrates through the placenta to a developing fetus. The
consumption of contaminated fish is considered to be the major pathway of mercury
exposure for most people.
In 2007, the FDA and EPA issued a joint federal advisory of 0.3 ppm as the appropriately
protective level for mercury in locally-consumed freshwater fish. Prior to 2007, TDEC
used the FDA Action Level for fish sold in interstate commerce (0.5 ppm) as a trigger for
considering advisories. The department considers the evidence compelling that fish tissue
mercury levels over 0.3 ppm have a potentially detrimental effect on the health of
Tennesseans and now uses this level as a trigger point for fishing advisories (Denton,
2007).
The type of advisory
considered appropriate
when mercury levels are
over 0.3 ppm, but not
above 1.0 ppm will be a
“precautionary advisory”
which advises pregnant or
nursing mothers, plus
children, to avoid any
consumption of fish. All
other persons will be
advised to limit fish
consumption to one or
one meal per month. If
1.0 ppm is exceeded, all
persons will be advised to
avoid consumption in any
amount. Fish are collected to check contaminant levels. Photo provided
by Aquatic Biology Section, TDH.

76
Reducing Risks from Contaminated Fish
The best way to protect yourself and your family from eating contaminated fish is by
following the advice provided by the Department of Environment and Conservation.
Cancer risk is accumulated over a lifetime of exposure to a carcinogen (cancer-causing
agent). For that reason, eating an occasional fish, even from an area with a fishing
advisory, will not measurably increase your cancer risk.
At greatest risk are children and people who eat contaminated fish for years, such as
recreational or subsistence fishermen. People with a previous occupational exposure to a
contaminant should also limit exposure to that pollutant. Studies have shown that
contaminants can cross the placental barrier in pregnant women to enter the baby’s body,
thereby increasing the risk of developmental problems. These substances are also
concentrated in breast milk.
The Division’s goal in issuing fishing advisories is to provide the information necessary
for people to make informed choices about their health. People concerned about their
health will likely choose not to eat fish from contaminated sites. If you choose to eat fish
in areas with elevated contaminant levels, here is some advice on how to reduce this risk:
1. Throw back the big ones. Smaller fish generally have lower concentrations of
contaminants.
2. Avoid fatty fish. Organic carcinogens such as DDT, PCBs, and dioxins accumulate
in fatty tissue. In contrast, however, mercury tends to accumulate in muscle tissue.
Large carp and catfish tend to have more fat than gamefish. Moreover, the feeding
habits of carp, sucker, buffalo, and catfish tend to expose them to the sediments,
where contaminants are concentrated.
3. Broil or grill your fish. These cooking techniques allow the fat to drip away.
Frying seals the fat and contaminants into the food.
4. Throw away the fat if the pollutant is PCBs, dioxins, chlordane, or other
organic contaminants. Organic pesticides tend to accumulate in fat tissue, so
cleaning the fish so the fat is discarded will provide some protection from these
contaminants.
5. If the pollutant is mercury, children in particular should not eat the fish. Fish
from the posted waterbodies (see Table 11) are likely to be contaminated with
mercury, which is concentrated in the muscle tissue. It is very important that
children not eat fish contaminated with mercury, as developmental problems have
been linked to mercury exposure.
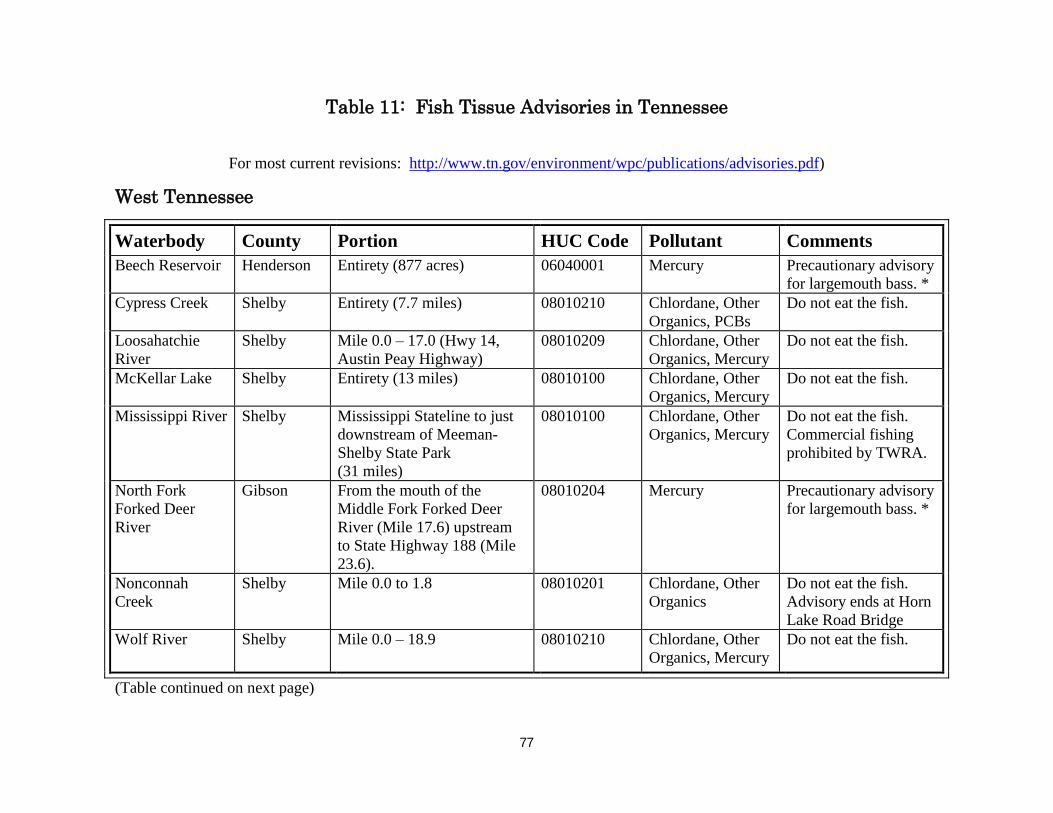
77
Table 11: Fish Tissue Advisories in Tennessee
For most current revisions: http://www.tn.gov/environment/wpc/publications/advisories.pdf)
West Tennessee
Waterbody County Portion HUC Code Pollutant Comments
Beech Reservoir Henderson Entirety (877 acres) 06040001 Mercury Precautionary advisory
for largemouth bass. *
Cypress Creek Shelby Entirety (7.7 miles) 08010210 Chlordane, Other
Organics, PCBs
Do not eat the fish.
Loosahatchie
River
Shelby Mile 0.0 – 17.0 (Hwy 14,
Austin Peay Highway)
08010209 Chlordane, Other
Organics, Mercury
Do not eat the fish.
McKellar Lake Shelby Entirety (13 miles) 08010100 Chlordane, Other
Organics, Mercury
Do not eat the fish.
Mississippi River Shelby Mississippi Stateline to just
downstream of Meeman-
Shelby State Park
(31 miles)
08010100 Chlordane, Other
Organics, Mercury
Do not eat the fish.
Commercial fishing
prohibited by TWRA.
North Fork
Forked Deer
River
Gibson From the mouth of the
Middle Fork Forked Deer
River (Mile 17.6) upstream
to State Highway 188 (Mile
23.6).
08010204 Mercury Precautionary advisory
for largemouth bass. *
Nonconnah
Creek
Shelby Mile 0.0 to 1.8 08010201 Chlordane, Other
Organics
Do not eat the fish.
Advisory ends at Horn
Lake Road Bridge
Wolf River Shelby Mile 0.0 – 18.9 08010210 Chlordane, Other
Organics, Mercury
Do not eat the fish.
(Table continued on next page)

78
Table 11: Fish Tissue Advisories in Tennessee
(continued from previous page)
Middle Tennessee
Waterbody County Portion HUC Code Pollutant Comments
Beech Creek Wayne From mouth to origin (Mile
16.7) including Tennessee
River Embayment
06040001 Mercury Do not eat the fish or
wade/swim. Avoid contact
with sediment between
Leatherwood Branch and
Smith Branch.
Buffalo River Humphreys,
Perry
From the mouth upstream to
Highway 438 (Mile 31.6)
06040004 Mercury Precautionary advisory for
smallmouth bass. *
Duck River Humphreys,
Hickman
From mouth of Buffalo River
(Mile 15.8) upstream to
Interstate 40 (Mile 31.8).
06040003 Mercury Precautionary advisory for
largemouth, smallmouth,
and spotted bass. *
Woods Reservoir Franklin Entirety (3,908 acres) 06030003 PCBs Catfish should not be eaten.
East Tennessee
Waterbody County Portion HUC Code Pollutant Comments
Boone Reservoir Sullivan,
Washington
Entirety
(4,400 acres)
06010102 PCBs, chlordane Precautionary advisory for
carp and catfish. *
Chattanooga
Creek
Hamilton Mouth to Georgia Stateline
(11.9 miles)
06020001 PCBs, chlordane Fish should not be eaten.
Also, avoid contact with
water.
(Table continued on next page.)
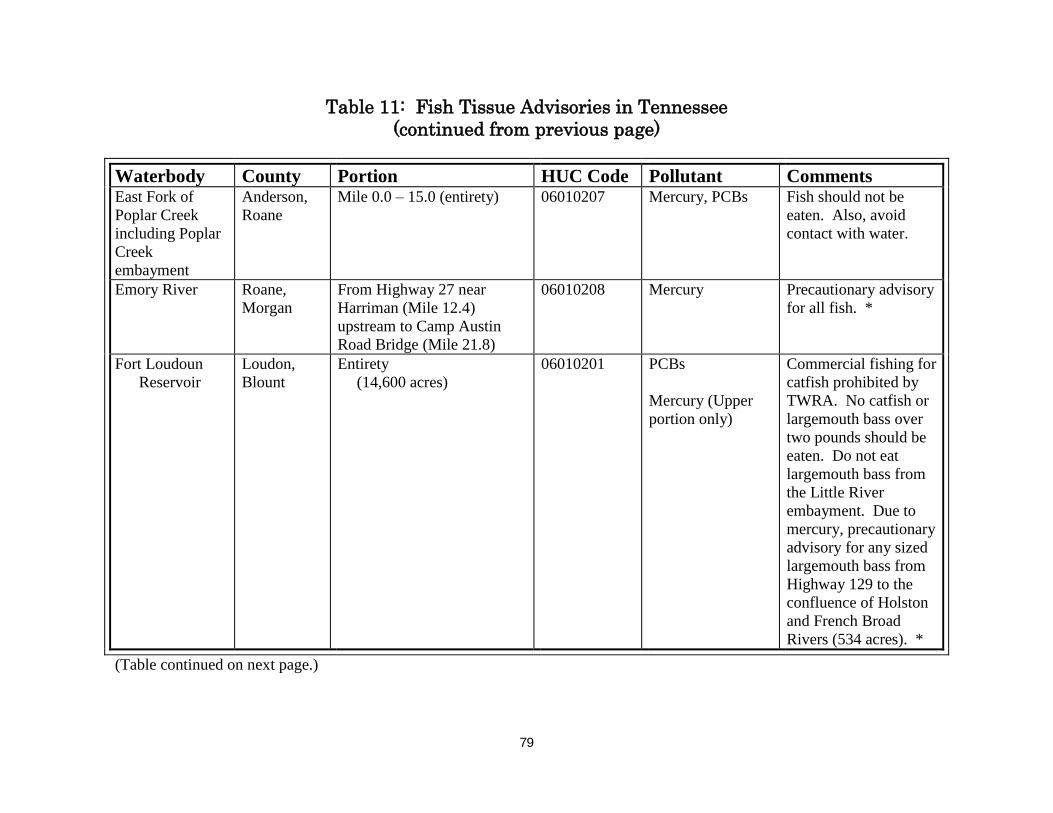
79
Table 11: Fish Tissue Advisories in Tennessee
(continued from previous page)
Waterbody County Portion HUC Code Pollutant Comments East Fork of
Poplar Creek
including Poplar
Creek
embayment
Anderson,
Roane
Mile 0.0 – 15.0 (entirety) 06010207 Mercury, PCBs Fish should not be
eaten. Also, avoid
contact with water.
Emory River Roane,
Morgan
From Highway 27 near
Harriman (Mile 12.4)
upstream to Camp Austin
Road Bridge (Mile 21.8)
06010208 Mercury Precautionary advisory
for all fish. *
Fort Loudoun
Reservoir
Loudon,
Blount
Entirety
(14,600 acres)
06010201 PCBs
Mercury (Upper
portion only)
Commercial fishing for
catfish prohibited by
TWRA. No catfish or
largemouth bass over
two pounds should be
eaten. Do not eat
largemouth bass from
the Little River
embayment. Due to
mercury, precautionary
advisory for any sized
largemouth bass from
Highway 129 to the
confluence of Holston
and French Broad
Rivers (534 acres). *
(Table continued on next page.)

80
Table 11: Fish Tissue Advisories in Tennessee
(continued from previous page)
Waterbody County Portion HUC Code Pollutant Comments
French Broad
River
Cocke From Rankin Bridge (mile
71.4) to Hwy 321 near
Newport (Mile 77.5)
06010105 Mercury Precautionary advisory
for largemouth bass. *
Hiwassee River Meigs,
McMinn,
Bradley
From Highway 58 (Mile 7.4)
upstream to the railroad
bridge just upstream of U. S.
Highway 11 (Mile 18.9)
06020002 Mercury Precautionary advisory
for largemouth bass. *
Holston River Hawkins,
Sullivan
From the mouth of Poor
Valley Creek Embayment
(Mile 89.0) upstream to the
confluence of the North and
South Forks of the Holston
near Kingsport (Mile 142.3).
06010104 Mercury Precautionary advisory
for all fish *
Melton Hill
Reservoir
Knox,
Anderson
Entirety
(5,690 acres)
06010207 PCBs Catfish should not be
eaten.
Nickajack
Reservoir
Hamilton,
Marion
Entirety
(10,370 acres)
06020001 PCBs Precautionary advisory
for catfish. *
Norris Reservoir Campbell,
Anderson,
Union,
Claiborne,
Grainger
Clinch River Portion (Powell
River embayment not
included in advisory.)
(15,213 acres)
06010205 Mercury Precautionary advisory
for largemouth bass,
striped bass,
smallmouth bass, and
sauger. *
North Fork
Holston River
Sullivan,
Hawkins
Mile 0.0 - 6.2
(VA stateline)
06010101 Mercury Do not eat the fish.
Advisory goes to
TN/VA line.
(Table continued on next page.)
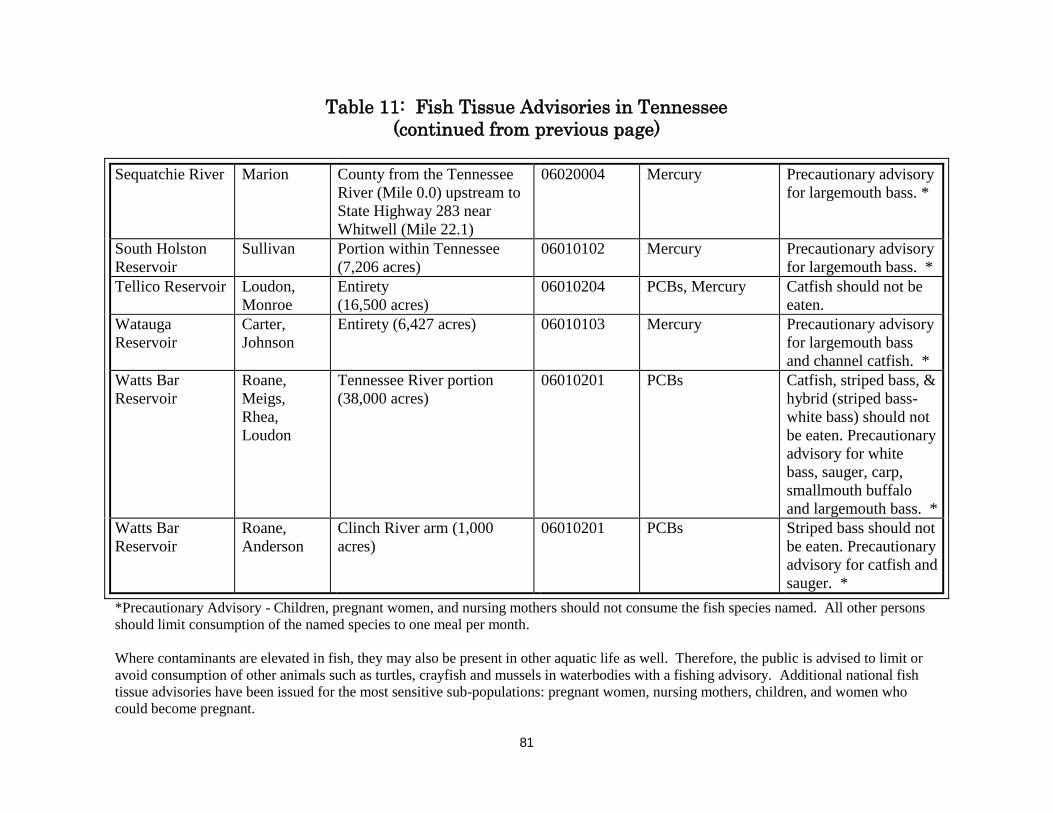
81
Table 11: Fish Tissue Advisories in Tennessee
(continued from previous page)
Sequatchie River Marion County from the Tennessee
River (Mile 0.0) upstream to
State Highway 283 near
Whitwell (Mile 22.1)
06020004 Mercury Precautionary advisory
for largemouth bass. *
South Holston
Reservoir
Sullivan Portion within Tennessee
(7,206 acres)
06010102 Mercury Precautionary advisory
for largemouth bass. *
Tellico Reservoir Loudon,
Monroe
Entirety
(16,500 acres)
06010204 PCBs, Mercury Catfish should not be
eaten.
Watauga
Reservoir
Carter,
Johnson
Entirety (6,427 acres) 06010103 Mercury Precautionary advisory
for largemouth bass
and channel catfish. *
Watts Bar
Reservoir
Roane,
Meigs,
Rhea,
Loudon
Tennessee River portion
(38,000 acres)
06010201 PCBs Catfish, striped bass, &
hybrid (striped bass-
white bass) should not
be eaten. Precautionary
advisory for white
bass, sauger, carp,
smallmouth buffalo
and largemouth bass. *
Watts Bar
Reservoir
Roane,
Anderson
Clinch River arm (1,000
acres)
06010201 PCBs Striped bass should not
be eaten. Precautionary
advisory for catfish and
sauger. *
*Precautionary Advisory - Children, pregnant women, and nursing mothers should not consume the fish species named. All other persons
should limit consumption of the named species to one meal per month.
Where contaminants are elevated in fish, they may also be present in other aquatic life as well. Therefore, the public is advised to limit or
avoid consumption of other animals such as turtles, crayfish and mussels in waterbodies with a fishing advisory. Additional national fish
tissue advisories have been issued for the most sensitive sub-populations: pregnant women, nursing mothers, children, and women who
could become pregnant.

82
Chapter 6 SUCCESS STORIES
A. Ocoee River
The section of the Ocoee from the mouth of Davis Mill Creek to Parksville Reservoir has
been polluted by extensive copper mining activities for over 150 years. Mining operations
ceased in 1987, and sulfuric acid production was discontinued in 2000. Over the past 25
years, various government agencies and private parties have taken steps to stabilize and re-
vegetate this large area.
The historic pollutants include acid, heavy metals, and sediment. According to the EPA,
Davis Mill Creek makes up about one percent of the flow of the Ocoee, but is the largest
single source of acidity and heavy metals (EPA 2005).
In November 2002, a wastewater treatment plan on Davis Mill Creek was refurbished by
Glenn Spring Holding under agreement with EPA and TDEC to more efficiently treat the
acid and metal laden waters of the creek, underground mine waters and contaminated
stream water. The treatment plant has removed over 16 million pounds of metals (iron,
zinc, manganese, copper, lead, cadmium) and neutralized approximately 28 million pounds
of acid from the creek that would have otherwise flowed into the Ocoee River.
Other clean-up activities in the Davis Creek watershed include Belltown Creek and
Gypsum Pond diversion system which routes clean water around the most contaminated
parts of the watershed and reduces the volume of water requiring treatment. Three existing
dams have been upgraded and modified to detain contaminated stormwater for treatment.
These activities have dramatically
reduced the loading of metals to
the Ocoee and monitoring
downstream of the mouth of Davis
Mill Creek indicates that water
quality criteria are now being met.
This is a historic success story
with the credit for water quality
improvements being shared by
many state and federal agencies
More information related to the
copper mining cleanup and
ongoing efforts in the area can be
found on EPA’s website:
http://www.epa.gov/aml/tech/copperbasin.pdf
http://www.epa.gov/region4/superfund/sites/npl/tennessee/copbastn.html
Some waste materials were historically deposited directly
into, or very close to, Davis Mill Creek. Photo from EPA
website.

83
B. Burra Burra Creek Restoration Project
A second example of a successful treatment activity in the Copper Basin area is the Burra
Burra Creek restoration. Glenn Springs Holdings, TDEC and EPA have been working in
partnership on the restoration and remediation of North Potato Creek watershed since
2001. One of the projects included the restoration of Burra Burra Creek, a tributary to
North Potato Creek in Polk County.
The Burra Burra Creek watershed was the primary site of sulfide ore processing for over
one hundred years. This watershed was utilized as a waste treatment system with various
dams built to dewater tailings and process ore sludge, as a conduit for the transport of
wastewater away from the processing facilities, and the recipient of water leaching through
overburden placed within the watershed. All of the alterations and uses yielded highly
polluted waters resulting in Burra Burra Creek being devoid of aquatic life. Consequently,
remediation and restoration of Burra Burra Creek became a central element in the
restoration of the North Potato Creek watershed. The restoration of the 5,300 linear feet of
Burra Burra Creek included:
1. Removal of 200,000 cubic yards of contaminated soil within the stream corridor;
2. Placement of 150, 000 cubic yards of clean soil within the stream corridor, creating
a new channel alignment and floodplain;
3. Construction of a geomorphically stable stream channel;
4. Placement of 1,100 cubic yards of clean river rock for aquatic habitat in the new
channel; and
5. Planted the riparian zones with native plants and trees.
The stream restoration project was completed on June 12, 2012, nineteen months after it
was started.
Scientists are currently
monitoring the development of
the various biological
communities in the newly
restored Burra Burra Creek. To
date, tadpoles and occasional
fish have been documented to
be living in the new stream.
Monitoring the expansion and
diversification of the aquatic
communities is an integral part
of the remedial actions for the
Copper Basin Restoration
Project.
Photo provided by Dave Turner, KEFO.
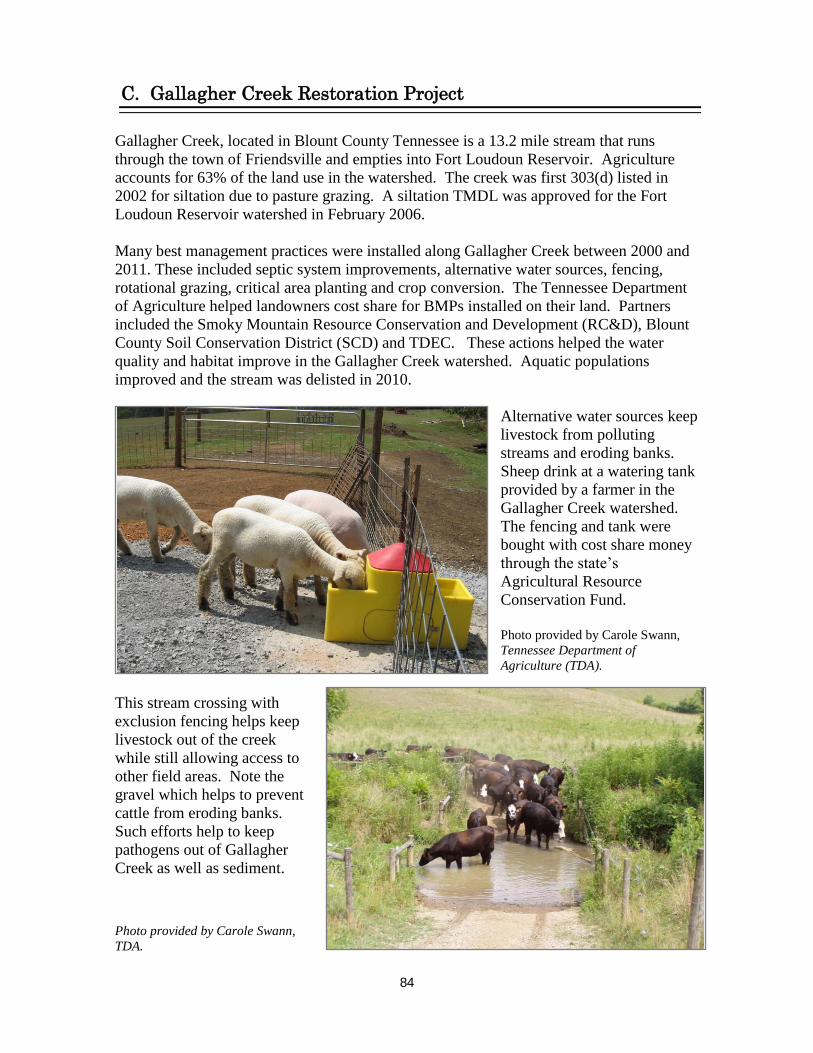
84
C. Gallagher Creek Restoration Project
Gallagher Creek, located in Blount County Tennessee is a 13.2 mile stream that runs
through the town of Friendsville and empties into Fort Loudoun Reservoir. Agriculture
accounts for 63% of the land use in the watershed. The creek was first 303(d) listed in
2002 for siltation due to pasture grazing. A siltation TMDL was approved for the Fort
Loudoun Reservoir watershed in February 2006.
Many best management practices were installed along Gallagher Creek between 2000 and
2011. These included septic system improvements, alternative water sources, fencing,
rotational grazing, critical area planting and crop conversion. The Tennessee Department
of Agriculture helped landowners cost share for BMPs installed on their land. Partners
included the Smoky Mountain Resource Conservation and Development (RC&D), Blount
County Soil Conservation District (SCD) and TDEC. These actions helped the water
quality and habitat improve in the Gallagher Creek watershed. Aquatic populations
improved and the stream was delisted in 2010.
Alternative water sources keep
livestock from polluting
streams and eroding banks.
Sheep drink at a watering tank
provided by a farmer in the
Gallagher Creek watershed.
The fencing and tank were
bought with cost share money
through the state’s
Agricultural Resource
Conservation Fund.
Photo provided by Carole Swann,
Tennessee Department of
Agriculture (TDA).
This stream crossing with
exclusion fencing helps keep
livestock out of the creek
while still allowing access to
other field areas. Note the
gravel which helps to prevent
cattle from eroding banks.
Such efforts help to keep
pathogens out of Gallagher
Creek as well as sediment.
Photo provided by Carole Swann,
TDA.
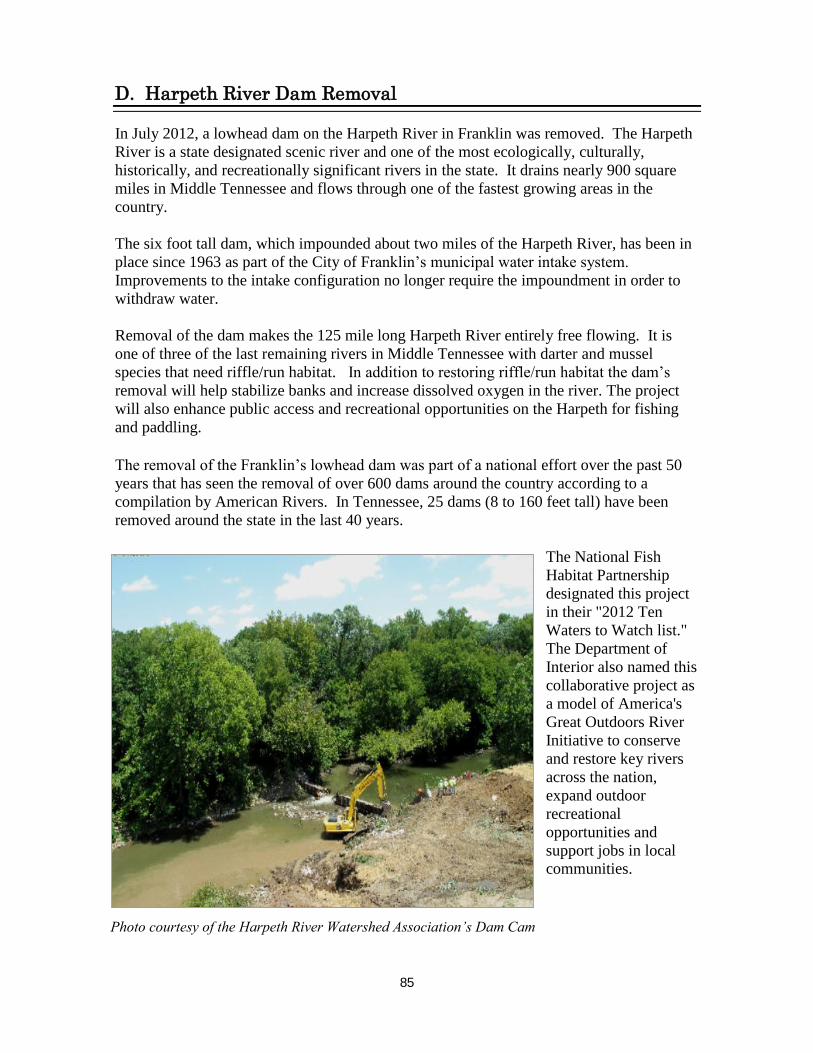
85
D. Harpeth River Dam Removal
In July 2012, a lowhead dam on the Harpeth River in Franklin was removed. The Harpeth
River is a state designated scenic river and one of the most ecologically, culturally,
historically, and recreationally significant rivers in the state. It drains nearly 900 square
miles in Middle Tennessee and flows through one of the fastest growing areas in the
country.
The six foot tall dam, which impounded about two miles of the Harpeth River, has been in
place since 1963 as part of the City of Franklin’s municipal water intake system.
Improvements to the intake configuration no longer require the impoundment in order to
withdraw water.
Removal of the dam makes the 125 mile long Harpeth River entirely free flowing. It is
one of three of the last remaining rivers in Middle Tennessee with darter and mussel
species that need riffle/run habitat. In addition to restoring riffle/run habitat the dam’s
removal will help stabilize banks and increase dissolved oxygen in the river. The project
will also enhance public access and recreational opportunities on the Harpeth for fishing
and paddling.
The removal of the Franklin’s lowhead dam was part of a national effort over the past 50
years that has seen the removal of over 600 dams around the country according to a
compilation by American Rivers. In Tennessee, 25 dams (8 to 160 feet tall) have been
removed around the state in the last 40 years.
The National Fish
Habitat Partnership
designated this project
in their "2012 Ten
Waters to Watch list."
The Department of
Interior also named this
collaborative project as
a model of America's
Great Outdoors River
Initiative to conserve
and restore key rivers
across the nation,
expand outdoor
recreational
opportunities and
support jobs in local
communities.
Photo courtesy of the Harpeth River Watershed Association’s Dam Cam
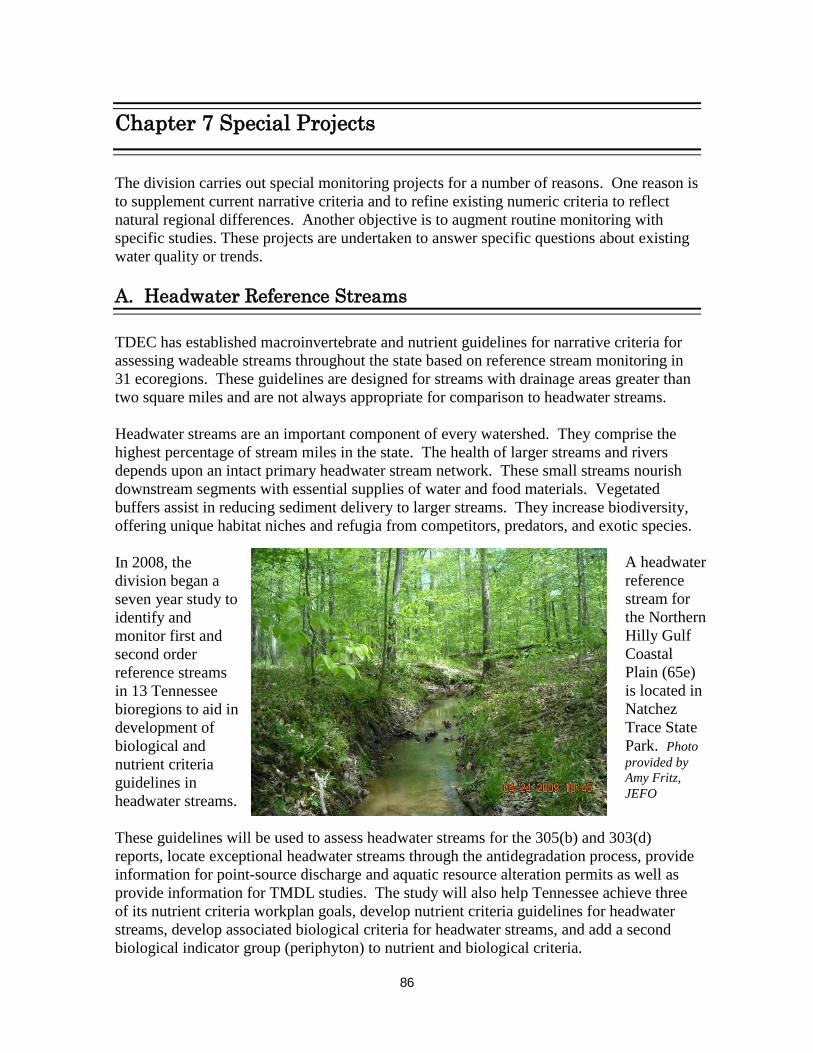
86
Chapter 7 Special Projects
The division carries out special monitoring projects for a number of reasons. One reason is
to supplement current narrative criteria and to refine existing numeric criteria to reflect
natural regional differences. Another objective is to augment routine monitoring with
specific studies. These projects are undertaken to answer specific questions about existing
water quality or trends.
A. Headwater Reference Streams
TDEC has established macroinvertebrate and nutrient guidelines for narrative criteria for
assessing wadeable streams throughout the state based on reference stream monitoring in
31 ecoregions. These guidelines are designed for streams with drainage areas greater than
two square miles and are not always appropriate for comparison to headwater streams.
Headwater streams are an important component of every watershed. They comprise the
highest percentage of stream miles in the state. The health of larger streams and rivers
depends upon an intact primary headwater stream network. These small streams nourish
downstream segments with essential supplies of water and food materials. Vegetated
buffers assist in reducing sediment delivery to larger streams. They increase biodiversity,
offering unique habitat niches and refugia from competitors, predators, and exotic species.
In 2008, the
division began a
seven year study to
identify and
monitor first and
second order
reference streams
in 13 Tennessee
bioregions to aid in
development of
biological and
nutrient criteria
guidelines in
headwater streams.
These guidelines will be used to assess headwater streams for the 305(b) and 303(d)
reports, locate exceptional headwater streams through the antidegradation process, provide
information for point-source discharge and aquatic resource alteration permits as well as
provide information for TMDL studies. The study will also help Tennessee achieve three
of its nutrient criteria workplan goals, develop nutrient criteria guidelines for headwater
streams, develop associated biological criteria for headwater streams, and add a second
biological indicator group (periphyton) to nutrient and biological criteria.
A headwater
reference
stream for
the Northern
Hilly Gulf
Coastal
Plain (65e)
is located in
Natchez
Trace State
Park. Photo
provided by
Amy Fritz,
JEFO

87
B. Mercury Air Deposition
Not all pollutants enter waterbodies directly from point source discharges or surface run-
off. Some, such as air-borne mercury, can be carried by rain. In summer 2009 the division
conducted a study to test fish and water from 33 waterbodies to test the accuracy of an air
deposition model for predicting mercury contamination (Arnwine and Graf, 2010).
The study was designed to field test the Regional Modeling System for Aerosols and
Deposition (REMSAD) model’s ability to accurately predict waterbody and fish tissue
contamination from air deposition of mercury in Tennessee. Thirty-three sites were
targeted for this study in areas where the model predicted various levels of mercury
deposition. Additional sites were located in areas where the model did not predict elevated
mercury, but where potential sources of airborne mercury were located in the vicinity.
Fish tissue and water samples were collected at each site.
Sampling results indicate the REMSAD model for air deposition of mercury does not
appear to be a useful tool for predicting mercury contamination in Tennessee waterbodies.
The mercury levels found in fish tissue did not correlate with the air deposition model.
Several fish taken from areas with predicted high levels of mercury air deposition
contained relatively low levels of contamination. Other fish that had higher concentrations
of mercury came from areas with low predicted depositional mercury.
Several variables may account for the discrepancy between predicted air deposition and
mercury concentrations in fish tissue. This may be in part because the top emitters
according to the Tennessee Division of Air Pollution were not tagged as top emitters by the
model, although they were probably included in the collective sources. Another factor is
that the REMSAD model does not simulate all of the processes that occur as part of the
mercury cycle, such as methylation and bioaccumulation. There may also be unknown
sources of non-depositional mercury contributing to elevated levels in some areas.
The study does demonstrate that smaller waterbodies in isolated areas should be checked
for mercury contamination particularly if largemouth bass are routinely consumed by the
public.
The study also indicates that selenium levels in water and fish throughout the state are
generally low. Fish concentrations were slightly elevated at two sites according to 2004
EPA draft guidance which is currently under revision. Both sites have large scale land
disturbance through historic mining activities. Selenium was not detected in any of the
water samples. The existing selenium criterion is based on water.
The full report is available online at:
http://tn.gov/environment/wpc/publications/pdf/air_deposition_rpt.pdf

88
C. 2010 Probabilistic Monitoring of Wadeable Streams
In 2010, the Division of Water Pollution Control conducted a statewide probabilistic
monitoring study of 90 wadeable streams to supplement the traditional targeted watershed
monitoring (Arnwine et al. 2011). This is a follow-up to a study initiated in 2007. Since
this is only the second period of monitoring, it is too early to evaluate trends. However, it
is possible to compare 2007 data, when most of the state was in a severe drought, to 2010
conditions.
In 2010 there was a 23% increase in sites meeting macroinvertebrate guidelines in west
Tennessee. It is likely the severe drought affected 2007 scores in this part of the state. Passing
scores decreased 13 % in middle Tennessee possibly due to effects of record spring floods.
There was little change in the eastern division.
Overall habitat scores have fallen statewide in Tennessee. Large scale weather conditions and
refinements to the habitat assessment protocol since the last study has probably affected
scoring. Future habitat assessments will show if the lowering of scores this year was due to
weather conditions, new protocols, or indicate a downward trend.
Statewide, the number of stations that met ecoregional guidelines for narrative criteria in
summer for total phosphorus increased, while the number that met nitrate + nitrite criteria
guidelines decreased. In 2010, mean and median phosphorus concentrations across the
state were a little more than half the 2007 levels.
The 2010 study included the analysis of nine metals which were not in the previous study.
Most of the metals, with the exception of chromium, mercury and zinc, were highest in
west Tennessee and lowest in the middle division. Cadmium and selenium were not
detected at any site. Mercury was only detected at one site, which has a historic source.
The toxicity of certain metals on fish and aquatic life can vary based on the total hardness
of the water and the level of total suspended solids. All metal exceedances of water quality
criteria were in west Tennessee, where low hardness was often a factor.
It is important to realize that probabilistic monitoring is a useful tool for trend analysis and
for statewide comparisons due to the consistency of methodology at every site. However,
the 2007 and 2010 probabilistic studies were not intended to replace the more extensive
targeted monitoring program designed for water quality assessments. The probabilistic
study reports the percentage of criteria violations for individual parameters based on a
single sample event at randomly selected sites. Assessments used for 305(b)/303(d)
reporting are based on multiple samples from multiple sites within a single reach as well as
evaluations of land-use and field observations.
The full report is available online at:
http://tn.gov/environment/wpc/publications/pdf/wsa2010.pdf

89
D. Coalfields Fish Tissue Monitoring
Tennessee has a history of surface coal mining in the Cumberland Plateau and
Cumberland Mountain regions. Many of the streams draining these regions are on
the 303(d) list for active or abandoned mining based on macroinvertebrate samples
and appear to be improving. Fish tissue samples have not been collected at the
majority of these sites. TDEC partnered with the Tennessee Valley Authority
(TVA), to collect fish tissue samples of native game fish (preferably piscivores)
between September 2011 and December 2011 to check for biological accumulation
of metals in fillets.
Forty-three sites were targeted for sampling. Fifteen sites had active mining in the
watershed. Twenty five were in areas of historic mining. One site drained an area
with historic large scale copper mining, one was downstream of mica mines and
one site had no history of mining. Three of the sites with historic mining were
considered reference sites due to recovery and/or small area of disturbance.
Game fish were successfully collected fish at 22 of the 43 sites. Of the remaining
21 sites, two sites were dry, three sites had no fish present, and 16 sites either did
not contain fish species targeted for study or the targeted species present were
smaller than desired. Sufficient fish ovaries were collected at 15 sites and were
analyzed for selenium in accordance with EPA’s draft criteria guidance.
Physical and chemical water quality samples (metals, nutrients, temperature, dissolved
oxygen, flow, etc.) were
collected at 42 of the 43
study sites. Although
two sites (Hicks and
Woodcock) were
observed to be dry during
several site visits, TVA
was able to collect
samples at Woodcock
following a period of
substantial rainfall.
Data are currently being
analyzed and a final
report should be
available by the end of
the year.
Tackett Creek in Claiborne County is one of the streams with
active mining sampled for the study. Photo provided by Dave
Turner, TDEC Mining Section.

90
E. Study of Pharmaceuticals and Personal Care Products (PPCP)
Pharmaceutical and personal care products (PPCP) include prescription and over-the-
counter drugs, diagnostic agents, dietary supplements, fragrances, soaps, conditioners,
sunscreens, cosmetics, caffeine, and nicotine. PPCPs also include antibiotics used
prophylactically to prevent disease in livestock production (feedlot) operations (many
water-soluble compounds). The most common mechanism for their entry into the
environment is through wastewater discharges (municipal and septic drainage), land
application of sewage sludge and manure, and landfill leachate.
Over the past decade, water quality surveys have indicated that numerous areas of the
United States, including Tennessee, have pharmaceuticals and steroid hormones in their
waterways. Additional studies have linked the exposure of fish and amphibians to natural
and synthetic steroids to harmful effects such as reproductive and endocrine disruption
(estrogen and/or androgen).
Building upon work done by the Division of Water Supply (DWS) and the University of
Tennessee, the Division of Water Resources began a study to test the presence of PCPPs in
wastewater treatment plant (WWTP) effluents. Starting in July 2012, effluent samples
began collecting from 115 actively discharging major WWTPs (once during high-flow and
once during low-flow). Pharmaceutical compounds selected for monitoring include:
caffeine, nicotine, antidepressants, anticonvulsants, insect repellants such as DEET,
antibacterials, 17α-ethinyl estradiol, fluoxetine, estrogen and ibuprofen.
The University of Tennessee - Knoxville will analyze the sample and provide the division
with a report detailing the results of the study in late 2013.
Photo provided by Planning and Standards Section, TDEC
In urban areas
where many
people are
concentrated,
personal care
products such as
pain medications,
antidepressants,
and hormones,
may be passed into
the collection
system, through
treatment plants
not designed to
remove them, then
ultimately into
surface waters.
Photo provided by
Planning and
Standards Section,
TDEC.

91
F. Southeast Climate Change and Reference Monitoring Network
During the annual meeting of the Southeastern Water Pollution Biologist Association
(SWPBA) in November 2011, the potential for stream community changes resulting from
variations in hydrology and termperature as a result of changing climate was a main focus.
The result was the creation of an interagency workgroup consisting of freshwater
biologists from the eight EPA region IV states and the Tennessee Valley Authority (TVA)
interested in developing a joint reference stream monitoring network. Staff from EPA,
USFS and USGS are also on the committee to provide technical support and advice.
Although two main goals of the group are to assess existing responses to climate change
and identify climate-sensitive indicators, it was agreed that a reference network with
consistent sampling methodology would be useful for establishing regional reference
conditions and consistency in assessments of shared watersheds and ecoregions.
Each of the region IV states and TVA agreed to target and monitor reference streams
beginning in 2013 and continue annual monitoring indefinitely. Existing monitoring
programs will be adjusted at key reference sites to include additional parameters so that
monitoring will be consistent for all sites in the network. At a minimum, sampling will
include macroinvertebrates, habitat assessments, field parameters, flow and continuous
temperature monitoring. Some agencies, including TDEC intend to add periphyton, water
quality, channel profiles and continuous flow. TVA has agreed to sample fish at sites
draining into the Tennessee River. Protocols and selection of vulnerable streams were
based on studies done by the Northeast Climate Change Monitoring group.
The goal is to establish a minimum of 30 reference sites in protected watersheds where
land-use is not expected to change significantly for at least 20 years. Tennessee has agreed
to monitor 10 sites in ecoregions 66, 67, 68 and 71. Ten sites will enable some statistical
determinations using state data in addition to analysis of grouped data.
Project Objectives
Establish annual monitoring at 10 reference streams consistent with protocols
agreed upon by Southeast Monitoring Network.
Develop a formal interagency partnership to develop a monitoring program that is
done consistently over the long-term and can withstand changes in staff.
Combine data with other Southeastern states for statistical interpretation of current
reference condition and changes over time in undisturbed systems.
Determine whether stream communities are being affected by climate associated
variables such as changes in hydrology, temperature or riparian vegetation species.
Distinguish potential climate change effects from natural variation and other
stressors.
Isolate biometrics/taxa that would be reliable indicators of climate change.
Detect potential climate-related changes early in a way that informs management
strategies such as restoration and adaption.

92
Chapter 8
Public Participation
Everyone contributes pollution in large or small ways. Often a careless or thoughtless act
results in far reaching damage. By understanding how pollution impacts our planet and
what each of us can do to reduce pollution, collectively we can make a difference in
Tennessee and the world.
Get Involved
Environmental laws encourage public participation. Ask that environmental issues be
considered in the local planning process.
Find out which watershed you live in and attend TDEC’s watershed meetings. Watershed
meetings are held in the third and fifth years of the watershed cycle. The meeting dates
and times are posted on the TDEC website at: http://tn.gov/environment/ppo/.
Sharon Kington uses a model “wetland” sponge to demonstrate the effects of
groundwater pollution. Photo provided by Sharon Kington, CKEFO.
93
Reduce, Reuse, and Recycle
Whenever possible recycle metal, plastic, cardboard, and paper, so it can be reused to make
new products. Always dispose of toxic materials properly. Most auto parts stores and
many service stations collect used motor oil and auto batteries for recycling. Most
counties have annual toxic waste collection days for old paints, pesticides, and other toxic
chemicals. Check with your local waste management service for specific dates and times.
Conserve water and electricity both at home and at work. Every gallon of water that enters
the sewer must be treated. The production of energy uses natural resources and produces
pollution. You will not only prevent pollution, but also save money. For further
information on pollution prevention please see the website.
http://tennessee.gov/environment/ea/tp3/
Be Part of the Solution, Not Part of the Problem
1. Dispose of chemicals properly
Always dispose of toxic chemicals properly.
Never pour oil, paint, or other leftover toxic
chemicals on the ground, in a sinkhole, or
down a drain. If you have a septic system,
check it periodically to make sure it is
functioning correctly to protect surface and
ground water.
2. Use chemicals properly
Use all chemicals, especially lawn chemicals,
exactly as the label instructs. Every year
millions of pounds of fertilizer and pesticides
are applied to crops and lawns and some
portion is carried by runoff to streams, rivers,
and reservoirs. Over-application of fertilizers
and pesticides wastes money, risks damage to
vegetation, and pollutes waterways.
Therefore, use all chemicals, especially lawn
chemicals, cautiously.
3. Prevent erosion and runoff
It is important for farmers and loggers to work
closely with the Department of Agriculture
(TDA) personnel to prevent erosion and runoff
pollution. TDA can recommend Best
Management Practices (BMP’s) to reduce soil
loss and prevent pollution of waterbodies.
If you see any of the following problems, please call.
More than just a few dead fish in a stream or lake.
Someone pumping a liquid from a truck into a stream (especially at night).
Unusual colors, odors, or sheen in a stream or lake.
Construction activities without proper erosion control (silt fences, hay bales, matting).
Bulldozers or backhoes in a stream removing gravel or rocks.
Groups of people removing rocks from streams, especially on the Cumberland Plateau.
Sewage pumping stations discharging directly or indirectly into a stream. Manholes overflowing.
94
4. Obtain a permit
Contractors wishing to alter a stream, river, or wetland need to obtain a permit from the
TDEC, Natural Resources Section. Additionally, construction sites must be covered
under a General Permit for the Discharge of Stormwater for a Construction Activity.
Coverage can be obtained by contacting the local TDEC Environmental Field Office
(EFO) at 1-888-891-TDEC. Never buy gravel or rocks that were illegally removed
from streams or rivers.
A work site must be properly stabilized to avoid erosion. All silt retention devices
must be properly installed to protect a site from soil loss and waterbodies from
siltation. If you hire a contractor to do any work around a stream or river, make sure
they obtain the proper permits and know how to protect the waterbody. The landowner
is ultimately responsible for any work done on his land.
Report Pollution
The public is an important source of information on pollution. Call your local Water
Resources office if you see a water pollution problem. A map of Tennessee’s
Environmental Field Offices (EFO) appears on the next page (Figure 22). If your EFO is
not a local call, please use our toll free number that will connect you to your nearest office.
Call your local Environmental Field Office.
See Figure 28 on the next page.
or
If your local EFO is a long distance phone call,
please call toll free.
1-888-891-TDEC
1-888-891-8332
You may also contact the division by leaving a message on our website.
http://www.tn.gov/environment/
When a call is received from a citizen, division staff investigates the complaint and attempt
to identify the source of pollution. If the polluter is identified, enforcement action can be
taken.
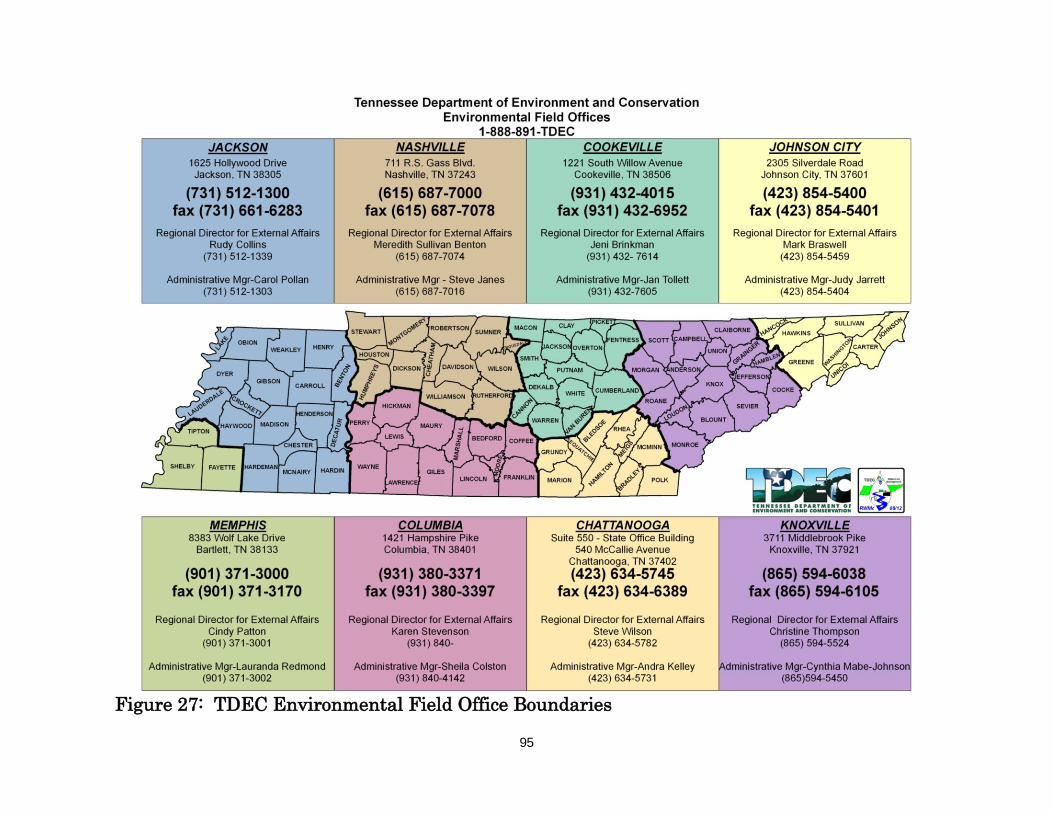
95
Figure 27: TDEC Environmental Field Office Boundaries

96
Definitions and Acronyms
Definitions
Acute Toxicity: An adverse effect (usually death) resulting from short-term exposure to a toxic
substance.
Benthic Community: Animals living on the bottom of the stream.
Biocriteria: Numerical values or narrative expressions that describe the reference biological
condition of aquatic communities and set goals for biological integrity. Biocriteria are
benchmarks for water resources evaluation and management decisions.
Biometric: A calculated value representing some aspect of the biological population’s structure,
function or other measurable characteristic that changes in a predictable way with increased
human influence.
Bioregion: An ecological subregion, or group of ecological subregions, with similar aquatic
macroinvertebrate communities that have been grouped for assessment purposes.
Chronic Toxicity: Sublethal or lethal effects resulting from repeated or long-term exposure to
low doses of a toxic substance.
Diurnal: Having a daily cycle, with periodic fluctuation relating to day and night
Ecoregion: A relatively homogenous area defined by similarity of climate, landform, soil,
potential natural vegetation, hydrology, and other ecologically relevant variables.
Ecological Subregion (or subecoregion): A smaller area that has been delineated within an
ecoregion that has even more homogenous characteristics than does the original ecoregion.
Ecoregion Reference: Least impacted, yet representative, waters within an ecoregion that have
been monitored to establish a baseline to which alteration of other waters can be compared.
Habitat: The instream and riparian physical features such as stones, roots, or woody debris, that
influence the structure and function of the aquatic community in a stream.
Macroinvertebrate: Animals without backbones that are large enough to be seen by the unaided
eye and which can be retained by a U.S. Standard No. 30 sieve (28 meshes/inch, 0.595 mm).
Periphyton: Benthic algae that are attached to surfaces such as rock or other plants.
Pathogens: Disease causing microorganisms.

97
Definitions (continued)
Regulated Sources: Pollution originating from sources governed by state or federal permitting
requirements. These sources are typically from discrete conveyances, but also include stream
alterations, urban runoff, and stormwater runoff from construction sites.
Non-Point Source Pollution: Pollution from diffuse sources as a result of rainfall or snowmelt
moving over and through the ground into lakes, reservoirs, rivers, streams, wetlands, and
aquifers.
Non-Regulated Sources: Activities exempted from state or federal permitting requirements. In
Tennessee, these sources are agricultural and forestry activities which utilize appropriate
management practices. Further, sources like atmospheric deposition might be considered
unregulated sources, since they are not controllable through the water program.
Point Source Pollution: Waste discharged into receiving waters from a single source such as a
pipe or drain.
Riparian Zone: An area that borders a waterbody.
Water Pollution: Alteration of the biological, physical, chemical, bacteriological or radiological
properties of water resulting in loss of use support.
Watershed: A geographic area, which drains to a common outlet, such as a point on a larger
lake, underlying aquifer, estuary, wetland, or ocean.
Acronyms
ADB: Assessment Database
ARAP: Aquatic Resource Alteration Permit
ATV: All Terrain Vehicle
BMP: Best Management Practices
CAFO: Confined Animal Feeding Operation
CERCLA: Comprehensive Environmental Response, Compensation, and Liability Act
CHEFO: Chattanooga Environmental Field Office
CKEFO: Cookeville Environmental Field Office
CLEFO: Columbia Environmental Field Office
CWSRF: Clean Water State Revolving Fund
DDT: Dichloro-diphenyl-trichloroethane
DO: Dissolved Oxygen
DOE: Department of Energy
DIOSM: U.S. Department of Interior Office of Surface Mining
EFO: Environmental Field Office
EMAP: Environmental Monitoring and Assessment Program

98
Acronyms (continued)
EPA: United States Environmental Protection Agency
EPT: Ephemeroptera (Mayflies)
Plecoptera (Stoneflies)
Trichoptera (Caddisflies)
ETW: Exceptional Tennessee Waters
FAL: Fish and Aquatic Life
FDA: Food and Drug Administration
GIS: Geographic Information System
GPS: Global Positioning System
HGM: Hydrogeomorphic
HUC: Hydrological Unit Code (Watershed Code)
JEFO: Jackson Environmental Field Office
JCEFO: Johnson City Environmental Field Office
KEFO: Knoxville Environmental Field Office
MCL: Maximum Contaminant Level
MEFO: Memphis Environmental Field Office
MS4: Municipal Separate Storm Sewer Systems
NHD: National Hydrography Dataset
NEFO: Nashville Environmental Field Office
NPDES: National Pollutant Discharge Elimination System
NPL: National Priorities List
NPS: Non-point Source
NRCS: Natural Resource Conservation Service
OHV: Off Highway Vehicle
ONRW: Outstanding Natural Resource Waters
ORNL: Oak Ridge National Laboratory
OSM: Office of Surface Mining
PCB: Polychlorinated Biphenyls
PAH: Polycyclic Aromatic
PAS: Planning and Standards Section
QAPP: Quality Assurance Project Plan
QSSOP: Quality System Standard Operating Procedure
PPM: Parts Per Million
RDX: Cyclotrimethylenetrinitramine
RIT: Reach Indexing Tools
SOP: Standard Operating Procedure
STORET: EPA’s STOrage and RETrieval Database
STP: Sewage Treatment Plant
TDEC: Tennessee Department of Environment and Conservation
TDA: Tennessee Department of Agriculture
TDH: Tennessee Department of Health

99
Acronyms (continued)
TKN: Total Kjeldahl Nitrogen
TMDL: Total Maximum Daily Load
TMI: Tennessee Macroinvertebrate Index
TVA: Tennessee Valley Authority
TWRA: Tennessee Wildlife Resource Agency
USACE: U.S. Army Corps of Engineers
USGS: U.S. Geological Survey
USFWS: U.S. Fish and Wildlife Service
WET: Whole Effluent Toxicity
WPC: Water Pollution Control
WSA: Wadeable Streams Assessment
WQOGB: Water Quality, Oil & Gas Board
WQDB: Water Quality Database
WQX: Water Quality Exchange
WWTP: Waste Water Treatment Plant
Cummins Falls in Jackson County is the newest Tennessee State Park designated May 22,
2012. Photo from TDEC Field Explorer.

100
References
Arnwine, D.H., J.I. Broach, L.K. Cartwright and G.M. Denton. 2000. Tennessee Ecoregion
Project. Tennessee Department of Environment and Conservation, Division of Water Pollution
Control. Nashville, Tennessee.
Arnwine, D.H. and G.M. Denton. 2001. Development of Regionally-Based Numeric
Interpretations of Tennessee’s Narrative Biological Integrity Criterion. Tennessee Department
of Environment and Conservation, Division of Water Pollution Control. Nashville, Tennessee.
Arnwine, D.H. and M.H. Graf. 2010. Mercury Air Deposition and Selenium Levels in Tennessee
Fish and Surface Water. Tennessee Department of Environment and Conservation, Division of
Water Pollution Control. Nashville, Tennessee.
Arnwine, D.H., M.H. Graf and A.L. Whitley. 2011. Probablilistic Monitoring of Wadeable
Streams in Tennessee. Tennessee Department of Environment and Conservation, Division of
Water Pollution Control. Nasvhille, Tennessee.
Barbour, M.T., J. Gerritsen, B.D. Snyder, and J.B. Stribling. 1999. Rapid Bioassessment
Protocols for Use in Streams and Wadeable Rivers. EPA 841-B-99-002. U.S. Environmental
Protection Agency, Office of Water, Washington D.C.
Denton, G.M. 2007. Mercury Levels in Tennessee Fish. Tennessee Department of Environment
and Conservation. Division of Water Pollution Control. Nashville, TN.
Denton, G.M., D.H. Arnwine and S.H. Wang. 2001. Development of Regionally-Based
Interpretations of Tennessee’s Narrative Nutrient Criterion. Tennessee Department of
Environment and Conservation, Division of Water Pollution Control. Nashville, Tennessee.
Denton, G.M., C.J. Brame, D.H. Arnwine, and L.K. Cartwright. 2008. 2008 305(b) Report -
The Status of Water Quality in Tennessee. Tennessee Department of Environment and
Conservation, Division of Water Pollution Control. Nashville, Tennessee.
Griffith, G.E., J.M. Omernik, and S.H. Azenedo. 1997. Ecoregions of Tennessee. EPA/600-R-
97-022. U.S. EPA, National Health and Environmental Effects Research Laboratory. Corvallis,
OR.
Tennessee Department of Environment and Conservation. 2011 . Quality Assurance Project
Plan for 106 Monitoring in the Division of Water Pollution Control. Volume I. Revision 3.
Tennessee Department of Environment and Conservation, Division of Water Pollution Control.
Nashville, Tennessee.
101
References (continued)
Tennessee Department of Environment and Conservation. 2011. Quality Systems Standard
Operating Procedures for Chemical and Bacteriological Sampling of Surface Water. Tennessee
Department of Environment and Conservation, Division of Water Pollution Control. Nashville,
Tennessee
Tennessee Department of Environment and Conservation. 2009. Tennessee Division of Water
Pollution Control Monitoring and Assessment Program Plan, Including Fiscal Year 2009 - 2010
Section 604(b) Information. Tennessee Department of Environment and Conservation, Division
of Water Pollution Control. Nashville, Tennessee.
Tennessee Department of Environment and Conservation. 2010. Final Version Year 2010
303(d) List. Tennessee Department of Environment and Conservation, Division of Water
Pollution Control. Nashville, Tennessee.
Tennessee Department of Environment and Conservation. 2010. Tennessee Ground Water 305b
Water Quality Report. Ground Water Management Section, Tennessee Department of
Environment and Conservation, Division of Water Supply. Nashville, Tennessee.
Tennessee Department of Environment and Conservation. 2011. Quality System Standard
Operating Procedure for Macroinvertebrate Stream Surveys. Tennessee Department of
Environment and Conservation, Division of Water Pollution Control. Nashville, Tennessee.
Tennessee Department of Environment and Conservation, Water Quality Control, Oil & Gas
Board. 2007. Rules of the Tennessee Department of Environment and Conservation Division of
Water Pollution Control, Chapter 1200-4-3, General Water Quality Criteria. Tennessee
Department of Environment and Conservation. Nashville, Tennessee.
Tennessee Department of Environment and Conservation, Water Quality, Oil & Gas Board.
2007. Rules of the Tennessee Department of Environment and Conservation Division of Water
Pollution Control, Chapter 1200-4-4, Use Classifications for Surface Waters. Tennessee
Department of Environment and Conservation. Nashville, Tennessee.
Tennessee Secretary of State. 1999. The Tennessee Water Quality Control Act of 1977
including the 1998 amendments. Secretary of State, Division of Publications. Nashville,
Tennessee.
United States Congress. 2000. Federal Water Pollution Control Act As Amended Through P.L.
109-308. 33 U.S.C. 1251 et. seq. Washington D.C.
United States Environmental Protection Agency. 2005. Copper Basin Mining District Case
Study. Superfund Abandoned Mine Lands Program.
http://www.epa.gov/aml/tech/copperbasin.pdf
102
Pursuant to the State of Tennessee’s policy of non-discrimination, the Tennessee
Department of Environment and Conservation does not discriminate on the basis of
race, sex, religion, color, national or ethnic origin, age, disability, or military service
in its policies, or in the admission or access to, or treatment or employment in its
programs, services or activities. Equal Employment Opportunity/Affirmative Action
inquiries or complaints should be directed to the EEO/AA Coordinator, Office of
General Counsel, 401 Church Street, 20th
Floor L & C Tower, Nashville, TN 37243, 1-
888-867-7455. ADA inquiries or complaints should be directed to the ADA
Coordinator, Human Resources Division, 401 Church Street, 12th Floor L & C
Tower, Nashville, TN 37243, 1-866-253-5827. Hearing impaired callers may use the
Tennessee Relay Service (1-800-848-0298).
To reach your local
ENVIRONMENTAL FIELD OFFICE
Call 1-888-891-8332 or 1-888-891-TDEC