2007 State Physician Workforce Data Book - Michigan€¦ · The 2007 State Physician Workforce Data...
39
2007 State Physician Workforce Data Book Center for Workforce Studies November 2007 Association of American Medical Colleges
Transcript of 2007 State Physician Workforce Data Book - Michigan€¦ · The 2007 State Physician Workforce Data...

2007 State Physician Workforce Data Book
Center for Workforce Studies November 2007
Association of American Medical Colleges

2007 State Physician Workforce Data Book
| ii | Association of American Medical Colleges 2007
Table of Contents
Introduction .............................................................................................................................1
Key Definitions and Acronyms ................................................................................................4
Section 1: Active Physicians ....................................................................................................5 Number of Active Physicians by State and Degree Type Per 100,000 Population
Figure 1 ..........................................................................................................................5 Table 1 ...........................................................................................................................6
Number and Percentage of Active Physicians by State Who Graduated from an International Medical School
Figure 2 ..........................................................................................................................7 Table 2 ...........................................................................................................................8
Number of Active Primary Care Physicians by State and Degree Type Per 100,000 Population
Figure 3 ..........................................................................................................................9 Table 3 .........................................................................................................................10
Number and Percentage of Active Physicians in Each State Who Completed Undergraduate Medical Education (UME) In the State
Figure 4 ........................................................................................................................11 Table 4 .........................................................................................................................12
Number and Percentage of Active Physicians in Each State Who Completed an ACGME-accredited Residency or Fellowship in the State
Figure 5 ........................................................................................................................13 Table 5 .........................................................................................................................14
Number and Percentage of Active Physicians Age 60 or Older by State
Figure 6 ........................................................................................................................15 Table 6 .........................................................................................................................16
Section 2: Medical and Osteopathic School Enrollment .....................................................17
Number of Students Enrolled in Medical or Osteopathic School for the 2007-08 Academic Year Per 100,000 Population by State
Figure 8 ........................................................................................................................17 Table 7 .........................................................................................................................18
Number of Students Enrolled in Public Medical or Osteopathic School for the 2007-08 Academic Year Per 100,000 Population by State
Figure 9 ........................................................................................................................19 Table 8 .........................................................................................................................20

2007 State Physician Workforce Data Book
| iii | Association of American Medical Colleges 2007
Number and Percentage of New In-state Medical Students Who Matriculated to an In-state Medical School for the 2006-07 Academic Year by State
Figure 10 ......................................................................................................................21 Table 9 .........................................................................................................................22
Section 3: Graduate Medical Education ..............................................................................23
Number of Physicians in ACGME-accredited Residencies and Fellowships Per 100,000 Population by State
Figure 11 ......................................................................................................................23 Table 10 .......................................................................................................................24
Number and Percentage of Residents/Fellows in ACGME-accredited Programs Who are International Medical Graduates (IMGs) by State
Figure 12 ......................................................................................................................25 Table 11 .......................................................................................................................26
Percent Change in Number of Residents/Fellows in ACGME-accredited Programs from 1997-2006 by State
Figure 13 ......................................................................................................................27 Table 12 .......................................................................................................................28
Section 4: In-State Retention ................................................................................................29
Number and Percentage of Active Physicians Who Graduated from an In-state Medical or Osteopathic School Who are Active In-state
Figure 14 ......................................................................................................................29 Table 13 .......................................................................................................................30
Number and Percentage of Active Physicians Who Graduated from an In-state Public Medical or Osteopathic School Who are Active In-state
Figure 15 ......................................................................................................................31 Table 14 .......................................................................................................................32
Number and Percentage of Active Physicians Who Completed Graduate Medical Education (GME) In-state Who are Active In-state
Figure 16 ......................................................................................................................33 Table 15 .......................................................................................................................34
Number and Percentage of Active Physicians Who Graduated from an In-state Medical or Osteopathic School and Completed Graduate Medical Education (GME) In-state Who are Active In-state
Figure 17 ......................................................................................................................35 Table 16 .......................................................................................................................36

2007 State Physician Workforce Data Book
| 1 | Association of American Medical Colleges 2007
Introduction The 2007 State Physician Workforce Data Book is an update and expansion of the 2006 Key Physician Data by State report, examining the active physician supply in each state, as well as current medical school enrollment and physicians in graduate medical education (GME) programs. An important addition to the report is a set of tables with the actual numbers that are presented visually in the figures. The Data Book is divided into four sections:
Section 1: Active Physicians by State. This section includes data on active physicians in each state, including overall and primary care physician-to-population ratios, age distribution, and active physicians by location and type of medical education. This section also contains figures and data on active physicians within each state who completed their undergraduate medical education (UME) and/or GME in the same state where they are active.
Example: Percentage of Physicians in California who Completed Medical School in California
Section 2: Medical and Osteopathic School Enrollment. This section provides information on medical school enrollment for both allopathic and osteopathic schools, as well as data on the percentage of new medical school students from each state who entered medical school in their state. Section 3: Graduate Medical Education. This section presents tables and figures showing physicians in residency and fellowship positions accredited by the Accreditation Council for Graduate Medical Education (ACGME). This includes both M.D.’s and D.O.’s training in an ACGME-accredited program. In some cases, the data are shown for M.D.’s and D.O.’s separately. The report does not include data on the number of physicians in GME training programs that are approved by the American Osteopathic Association. More than half of all D.O.’s are training in ACGME-accredited programs.
All Active Physicians
21,912 of 89,398 (24.5%) active physicians in California also graduated UME in California
All physicians practicing in
California (N=89,398)
Active physicians graduated
UME in California
(N=35,139)
21,912

2007 State Physician Workforce Data Book
| 2 | Association of American Medical Colleges 2007
Section 4: In-state Retention. This section presents data on retention by states of the physicians they educate and train in medical schools, GME, or both. For each state, we present the number of physicians who completed their UME in the state and show the proportion who remained in or returned to the state to practice. The same analysis is shown for the number of physicians who completed their GME in each state, and the number of physicians who completed both their UME and GME in the state.
Example: Of Active Physicians Who Completed Medical School in California, the Percentage Who are Active in California
The key difference from section 1 is in the universe being examined. Section 1 looks at all active physicians within the state as the universe of interest (i.e., the denominator). Section 4 looks at physicians who completed their UME and/or GME in a state as the universe (i.e., the denominator).
Each section of the Data Book contains figures with bar graphs ranking the states on each measure and tables showing the detailed data. Every bar graph includes the U.S. average and the median for all states. The U.S. average, as well as the data tables, include the District of Columbia. However, the District of Columbia is not included in the state ranking as it is inappropriate to compare physician supply in a city with physician supply in entire states. The state median is based on the 50 states unless otherwise noted. That is, half the states are above the median and half are below. The District of Columbia is excluded from the state median. The primary data sources for this report include:
• The American Medical Association (AMA) Physician Masterfile (January 2007); • Population estimates from the U.S. Census Bureau; • The AAMC Student Record System; • The American Association of Colleges of Osteopathic Medicine; and
All Active Physicians
21,912 of 35,139 (62.4%) of the physicians who graduated UME in California are active in California
All physicians practicing in
California (N=89,398)
Active physicians graduated
UME in California
(N=35,139)
21,912

2007 State Physician Workforce Data Book
| 3 | Association of American Medical Colleges 2007
• The National GME Census, which is jointly conducted by the AAMC and the AMA. We would like to express our appreciation to the AMA for making the Masterfile data available to the AAMC for purposes of data analysis. The Center for Workforce Studies welcomes your comments and suggestions for future editions of this report. Please send comments, suggestions, or questions to: Kerri L. Rivers [email protected]

2007 State Physician Workforce Data Book
| 4 | Association of American Medical Colleges 2007
Key Definitions Active physicians: Physicians who are licensed by a state are considered active, provided they are working at least 20 hours per week. Physicians who are retired, semi-retired, temporarily not in practice, not active for other reasons, or who have not completed their graduate medical education are excluded. The total number of active physicians may differ between tables in this report, as a result of missing information in the data file. For example, to determine the percentage of active physicians who are female, the total number of active physicians excludes people whose gender was not reported in the data file. Medical school: For the purposes of this report, medical schools in the United States and Canada that confer the M.D. degree and are accredited by the Liaison Committee on Medical Education (LCME) are medical schools. Osteopathic school: Schools of osteopathic medicine that confer the D.O. degree and are accredited by the American Osteopathic Association (AOA) are osteopathic schools. International Medical Graduate: An individual with an M.D. or related degree who graduated from a medical school outside the United States or Canada is considered an international medical graduate, or IMG. They are occasionally referred to as foreign medical graduates, or FMGs. To be eligible for licensure and practice in the United States, they must complete accredited graduate training in the United States or its equivalent. Primary care physicians: A physician is considered a primary care physician if his or her primary specialty is adolescent medicine, family medicine, general practice, geriatric medicine, internal medicine, internal medicine/pediatrics, or pediatrics. This information is from the AMA Masterfile and is self reported by the physician. Total population: Commonly Used Acronyms AACOM American Association of Colleges of Osteopathic Medicine AAMC Association of American Medical Colleges ACGME Accreditation Council for Graduate Medical Education AOA American Osteopathic Association D.O. Doctor of Osteopathy GME Graduate medical education IMG International medical graduate M.D. Doctor of Medicine UME Undergraduate medical education

Section 1: Active Physicians 2007 State Physician Workforce Data Book
| 5 | Association of American Medical Colleges 2007
Figure 1. Active Physicians by Degree Type Per 100,000 Population
0 25 50 75 100 125 150 175 200 225 250 275 300 325 350 375 400
Mississippi (50)
Idaho (49)
Arkansas (48)
Wyoming (47)Oklahoma (46)
Nevada (45)
Utah (44)
Alabama (43)
Texas (42)Iowa (41)
Georgia (40)
Kansas (39)
Nebraska (38)South Carolina (37)
Kentucky (36)
Indiana (35)
South Dakota (34)
Arizona (33)New Mexico (32)
North Dakota (31)
Montana (30)
North Carolina (29)
West Virginia (28)Louisiana (27)
Tennessee (26)
Missouri (25)
Wisconsin (24)
Alaska (23)Virginia (22)
Illinois (21)
Florida (20)
California (19)
Michigan (18)U.S. Average
Ohio (17)
Washington (16)
Colorado (15)
Minnesota (14)Oregon (13)
Delaware (12)
New Hampshire (11)
Pennsylvania (10)New Jersey (9)
Maine (8)
Hawaii (7)
Vermont (6)
Rhode Island (5)Connecticut (4)
New York (3)
Maryland (2)
Massachusetts (1)
Number per 100,000 Population
Allopathic
Osteopathic
State Median = 236.6
Sources: July 1, 2006 Population Estimates, U.S. Census Bureau. Physician data are from the AMA Physician Masterfile (January 2007). Definitions: Active physicians include physicians who graduated from a U.S. medical school, U.S. osteopathic school, or an international medical school. M.D.’s and D.O.’s who are residents, fellows, retired, semi-retired, temporarily not in practice, or not active for other reasons are excluded from this figure. Physicians whose degree type was unknown were also excluded from this analysis. See Table 1 for detailed data.

Section 1: Active Physicians 2007 State Physician Workforce Data Book
| 6 | Association of American Medical Colleges 2007
Table 1. Active Physicians by Degree Type
Total Active Physicians Active M.D.’s* Active D.O.’s
Total
Population Number
Rate Per
100,000 Rank Number
Rate Per
100,000 Number
Rate Per
100,000 United States 299,398,484 747,581 249.7 N.R. 700,129 233.8 47,452 15.8
Alabama 4,599,030 9,030 196.3 43 8,703 189.2 327 7.1 Alaska 670,053 1,611 240.4 23 1,485 221.6 126 18.8 Arizona 6,166,318 13,177 213.7 33 11,753 190.6 1,424 23.1 Arkansas 2,810,872 5,311 188.9 48 5,083 180.8 228 8.1 California 36,457,549 89,388 245.2 19 86,523 237.3 2,865 7.9 Colorado 4,753,377 12,076 254.1 15 11,192 235.5 884 18.6 Connecticut 3,504,809 11,161 318.4 4 10,877 310.3 284 8.1 Delaware 853,476 2,250 263.6 12 2,005 234.9 245 28.7 District of Columbia 581,530 5,084 874.2 N.R. 5,003 860.3 81 13.9 Florida 18,089,888 44,263 244.7 20 40,719 225.1 3,544 19.6 Georgia 9,363,941 19,143 204.4 40 18,457 197.1 686 7.3 Hawaii 1,285,498 3,770 293.3 7 3,619 281.5 151 11.7 Idaho 1,466,465 2,645 180.4 49 2,437 166.2 208 14.2 Illinois 12,831,970 31,245 243.5 21 29,441 229.4 1,804 14.1 Indiana 6,313,520 13,393 212.1 35 12,616 199.8 777 12.3 Iowa 2,982,085 5,937 199.1 41 4,972 166.7 965 32.4 Kansas 2,764,075 5,660 204.8 39 5,116 185.1 544 19.7 Kentucky 4,206,074 8,906 211.7 36 8,565 203.6 341 8.1 Louisiana 4,287,768 9,960 232.3 27 9,873 230.3 87 2.0 Maine 1,321,574 3,847 291.1 8 3,327 251.7 520 39.3 Maryland 5,615,727 19,938 355.0 2 19,423 345.9 515 9.2 Massachusetts 6,437,193 25,342 393.7 1 24,881 386.5 461 7.2 Michigan 10,095,643 25,186 249.5 18 20,587 203.9 4,599 45.6 Minnesota 5,167,101 13,157 254.6 14 12,806 247.8 351 6.8 Mississippi 2,910,540 5,031 172.9 50 4,768 163.8 263 9.0 Missouri 5,842,713 13,857 237.2 25 12,157 208.1 1,700 29.1 Montana 944,632 2,160 228.7 30 2,045 216.5 115 12.2 Nebraska 1,768,331 3,705 209.5 38 3,588 202.9 117 6.6 Nevada 2,495,529 4,791 192.0 45 4,354 174.5 437 17.5 New Hampshire 1,314,895 3,490 265.4 11 3,292 250.4 198 15.1 New Jersey 8,724,560 25,080 287.5 9 22,680 260.0 2,400 27.5 New Mexico 1,954,599 4,421 226.2 32 4,199 214.8 222 11.4 New York 19,306,183 65,877 341.2 3 63,308 327.9 2,569 13.3 North Carolina 8,856,505 20,294 229.1 29 19,718 222.6 576 6.5 North Dakota 635,867 1,452 228.3 31 1,397 219.7 55 8.6 Ohio 11,478,006 28,904 251.8 17 25,578 222.8 3,326 29.0 Oklahoma 3,579,212 6,867 191.9 46 5,476 153.0 1,391 38.9 Oregon 3,700,758 9,636 260.4 13 9,121 246.5 515 13.9 Pennsylvania 12,440,621 35,565 285.9 10 30,763 247.3 4,802 38.6 Rhode Island 1,067,610 3,392 317.7 5 3,209 300.6 183 17.1 South Carolina 4,321,249 9,100 210.6 37 8,790 203.4 310 7.2 South Dakota 781,919 1,662 212.6 34 1,587 203.0 75 9.6 Tennessee 6,038,803 14,258 236.1 26 13,821 228.9 437 7.2 Texas 23,507,783 46,432 197.5 42 43,519 185.1 2,913 12.4 Utah 2,550,063 4,926 193.2 44 4,713 184.8 213 8.4 Vermont 623,908 1,918 307.4 6 1,865 298.9 53 8.5 Virginia 7,642,884 18,510 242.2 22 17,872 233.8 638 8.3 Washington 6,395,798 16,243 254.0 16 15,574 243.5 669 10.5 West Virginia 1,818,470 4,204 231.2 28 3,648 200.6 556 30.6 Wisconsin 5,556,506 13,346 240.2 24 12,710 228.7 636 11.4 Wyoming 515,004 980 190.3 47 914 177.5 66 12.8
Sources: July 1, 2006 Population Estimates, U.S. Census Bureau. Physician data are from the AMA Physician Masterfile (January 2007). N.R. = Not Ranked *These numbers include U.S. M.D.’s and IMGs.
Section 1: Active Physicians 2007 State Physician Workforce Data Book
| 7 | Association of American Medical Colleges 2007
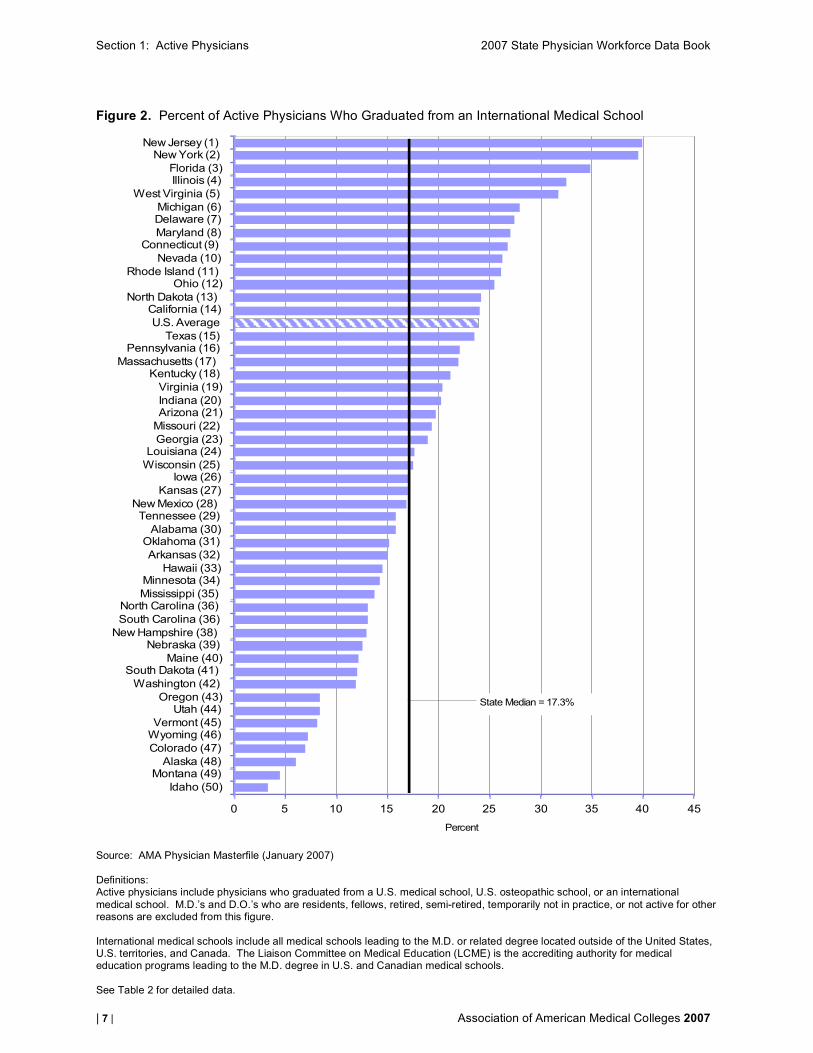
Figure 2. Percent of Active Physicians Who Graduated from an International Medical School
0 5 10 15 20 25 30 35 40 45
Idaho (50)
Montana (49)Alaska (48)
Colorado (47)
Wyoming (46)Vermont (45)
Utah (44)Oregon (43)
Washington (42)
South Dakota (41)Maine (40)
Nebraska (39)New Hampshire (38)
South Carolina (36)
North Carolina (36)Mississippi (35)
Minnesota (34)Hawaii (33)
Arkansas (32)
Oklahoma (31)Alabama (30)
Tennessee (29)New Mexico (28)
Kansas (27)
Iowa (26)Wisconsin (25)
Louisiana (24)Georgia (23)
Missouri (22)
Arizona (21)Indiana (20)
Virginia (19)
Kentucky (18)Massachusetts (17)
Pennsylvania (16)Texas (15)
U.S. Average
California (14)North Dakota (13)
Ohio (12)Rhode Island (11)
Nevada (10)
Connecticut (9)Maryland (8)
Delaware (7)Michigan (6)
West Virginia (5)
Illinois (4)Florida (3)
New York (2)New Jersey (1)
Percent
State Median = 17.3%
Source: AMA Physician Masterfile (January 2007) Definitions: Active physicians include physicians who graduated from a U.S. medical school, U.S. osteopathic school, or an international medical school. M.D.’s and D.O.’s who are residents, fellows, retired, semi-retired, temporarily not in practice, or not active for other reasons are excluded from this figure. International medical schools include all medical schools leading to the M.D. or related degree located outside of the United States, U.S. territories, and Canada. The Liaison Committee on Medical Education (LCME) is the accrediting authority for medical education programs leading to the M.D. degree in U.S. and Canadian medical schools. See Table 2 for detailed data.

Section 1: Active Physicians 2007 State Physician Workforce Data Book
| 8 | Association of American Medical Colleges 2007
Table 2. Active Physicians by Degree Type and International Status of School
Active U.S. M.D.’s Active D.O.’s Active IMGs
Total Active
Physicians Number Percent Number Percent Number Percent Rank United States 747,581 522,017 69.8% 47,452 6.3% 178,112 23.8% N.R.
Alabama 9,030 7,283 80.7% 327 3.6% 1,420 15.7% 30 Alaska 1,611 1,388 86.2% 126 7.8% 97 6.0% 48 Arizona 13,177 9,166 69.6% 1,424 10.8% 2,587 19.6% 21 Arkansas 5,311 4,287 80.7% 228 4.3% 796 15.0% 32 California 89,388 65,051 72.8% 2,865 3.2% 21,472 24.0% 14 Colorado 12,076 10,364 85.8% 884 7.3% 828 6.9% 47 Connecticut 11,161 7,890 70.7% 284 2.5% 2,987 26.8% 9 Delaware 2,250 1,389 61.7% 245 10.9% 616 27.4% 7 District of Columbia 5,084 3,864 76.0% 81 1.6% 1,139 22.4% N.R. Florida 44,263 25,344 57.3% 3,544 8.0% 15,375 34.7% 3 Georgia 19,143 14,832 77.5% 686 3.6% 3,625 18.9% 23 Hawaii 3,770 3,075 81.6% 151 4.0% 544 14.4% 33 Idaho 2,645 2,349 88.8% 208 7.9% 88 3.3% 50 Illinois 31,245 19,294 61.8% 1,804 5.8% 10,147 32.5% 4 Indiana 13,393 9,910 74.0% 777 5.8% 2,706 20.2% 20 Iowa 5,937 3,956 66.6% 965 16.3% 1,016 17.1% 26 Kansas 5,660 4,154 73.4% 544 9.6% 962 17.0% 27 Kentucky 8,906 6,684 75.1% 341 3.8% 1,881 21.1% 18 Louisiana 9,960 8,122 81.5% 87 0.9% 1,751 17.6% 24 Maine 3,847 2,861 74.4% 520 13.5% 466 12.1% 40 Maryland 19,938 14,052 70.5% 515 2.6% 5,371 26.9% 8 Massachusetts 25,342 19,323 76.2% 461 1.8% 5,558 21.9% 17 Michigan 25,186 13,551 53.8% 4,599 18.3% 7,036 27.9% 6 Minnesota 13,157 10,942 83.2% 351 2.7% 1,864 14.2% 34 Mississippi 5,031 4,076 81.0% 263 5.2% 692 13.8% 35 Missouri 13,857 9,492 68.5% 1,700 12.3% 2,665 19.2% 22 Montana 2,160 1,948 90.2% 115 5.3% 97 4.5% 49 Nebraska 3,705 3,122 84.3% 117 3.2% 466 12.6% 39 Nevada 4,791 3,098 64.7% 437 9.1% 1,256 26.2% 10 New Hampshire 3,490 2,841 81.4% 198 5.7% 451 12.9% 38 New Jersey 25,080 12,684 50.6% 2,400 9.6% 9,996 39.9% 1 New Mexico 4,421 3,456 78.2% 222 5.0% 743 16.8% 28 New York 65,877 37,305 56.6% 2,569 3.9% 26,003 39.5% 2 North Carolina 20,294 17,083 84.2% 576 2.8% 2,635 13.0% 36 North Dakota 1,452 1,046 72.0% 55 3.8% 351 24.2% 13 Ohio 28,904 18,223 63.0% 3,326 11.5% 7,355 25.4% 12 Oklahoma 6,867 4,436 64.6% 1,391 20.3% 1,040 15.1% 31 Oregon 9,636 8,312 86.3% 515 5.3% 809 8.4% 43 Pennsylvania 35,565 22,945 64.5% 4,802 13.5% 7,818 22.0% 16 Rhode Island 3,392 2,323 68.5% 183 5.4% 886 26.1% 11 South Carolina 9,100 7,609 83.6% 310 3.4% 1,181 13.0% 36 South Dakota 1,662 1,388 83.5% 75 4.5% 199 12.0% 41 Tennessee 14,258 11,563 81.1% 437 3.1% 2,258 15.8% 29 Texas 46,432 32,646 70.3% 2,913 6.3% 10,873 23.4% 15 Utah 4,926 4,303 87.4% 213 4.3% 410 8.3% 44 Vermont 1,918 1,709 89.1% 53 2.8% 156 8.1% 45 Virginia 18,510 14,096 76.2% 638 3.4% 3,776 20.4% 19 Washington 16,243 13,650 84.0% 669 4.1% 1,924 11.8% 42 West Virginia 4,204 2,314 55.0% 556 13.2% 1,334 31.7% 5 Wisconsin 13,346 10,374 77.7% 636 4.8% 2,336 17.5% 25 Wyoming 980 844 86.1% 66 6.7% 70 7.1% 46
Source: AMA Physician Masterfile (January 2007) N.R. = Not Ranked

Section 1: Active Physicians 2007 State Physician Workforce Data Book
| 9 | Association of American Medical Colleges 2007
Figure 3. Active Primary Care Physicians by Degree Type Per 100,000 Population
0 10 20 30 40 50 60 70 80 90 100 110 120 130 140 150
Mississippi (50)
Utah (49)
Idaho (48)Texas (47)
Nevada (46)
Alabama (45)Georgia (44)
Oklahoma (43)
Wyoming (41)South Carolina (41)
Arkansas (40)Arizona (39)
Indiana (38)
Kentucky (37)Louisiana (36)
Iowa (35)
North Carolina (34)Kansas (33)
Nebraska (32)
Missouri (31)Florida (30)
South Dakota (28)
Tennessee (28)Montana (27)
California (26)
Virginia (25)U.S. Average
New Mexico (23)
Ohio (23)Illinois (22)
Colorado (21)
Wisconsin (20)West Virginia (19)
Delaware (18)
North Dakota (17)Michigan (16)
Washington (15)
Pennsylvania (14)Oregon (13)
New Jersey (12)
New Hampshire (11)Minnesota (10)
Connecticut (9)
Alaska (8)Rhode Island (7)
New York (6)
Hawaii (5)Maryland (4)
Maine (3)
Vermont (2)Massachusetts (1)
Number per 100,000 Population
Allopathic
Osteopathic
State Median = 87.6
Sources: July 1, 2006 Population Estimates, U.S. Census Bureau. Physician data are from the AMA Physician Masterfile (January 2007). Definitions: Primary care physicians include M.D.’s and D.O.’s whose primary specialty is adolescent medicine, family medicine, geriatric medicine, general practice, internal medicine, internal medicine/pediatrics, or pediatrics. M.D.’s and D.O.’s who are residents, fellows, retired, semi-retired, temporarily not in practice, or not active for other reasons are excluded from this figure. See Table 3 for detailed data.

Section 1: Active Physicians 2007 State Physician Workforce Data Book
| 10 | Association of American Medical Colleges 2007
Table 3. Active Primary Care Physicians by Degree Type
Total Primary Care
Physicians Primary Care
M.D.’s Primary Care
D.O.’s
Total
Population Number
Rate Per
100,000 Rank Number Rate Per 100,000 Number
Rate Per
100,000 United States 299,398,484 263,815 88.1 N.R. 240,601 80.4 23,214 7.8
Alabama 4,599,030 3,271 71.1 45 3,100 67.4 171 3.7 Alaska 670,053 690 103.0 8 616 91.9 74 11.0 Arizona 6,166,318 4,719 76.5 39 4,031 65.4 688 11.2 Arkansas 2,810,872 2,127 75.7 40 1,981 70.5 146 5.2 California 36,457,549 31,766 87.1 26 30,185 82.8 1,581 4.3 Colorado 4,753,377 4,284 90.1 21 3,830 80.6 454 9.6 Connecticut 3,504,809 3,567 101.8 9 3,444 98.3 123 3.5 Delaware 853,476 793 92.9 18 676 79.2 117 13.7 District of Columbia 581,530 1,444 248.3 N.R. 1,419 244.0 25 4.3 Florida 18,089,888 15,092 83.4 30 13,459 74.4 1,633 9.0 Georgia 9,363,941 6,834 73.0 44 6,496 69.4 338 3.6 Hawaii 1,285,498 1,441 112.1 5 1,363 106.0 78 6.1 Idaho 1,466,465 974 66.4 48 863 58.8 111 7.6 Illinois 12,831,970 11,497 89.6 22 10,657 83.1 840 6.5 Indiana 6,313,520 4,856 76.9 38 4,503 71.3 353 5.6 Iowa 2,982,085 2,361 79.2 35 1,771 59.4 590 19.8 Kansas 2,764,075 2,236 80.9 33 1,916 69.3 320 11.6 Kentucky 4,206,074 3,271 77.8 37 3,111 74.0 160 3.8 Louisiana 4,287,768 3,348 78.1 36 3,310 77.2 38 0.9 Maine 1,321,574 1,531 115.8 3 1,225 92.7 306 23.2 Maryland 5,615,727 6,368 113.4 4 6,154 109.6 214 3.8 Massachusetts 6,437,193 8,084 125.6 1 7,858 122.1 226 3.5 Michigan 10,095,643 9,435 93.5 16 7,456 73.9 1,979 19.6 Minnesota 5,167,101 5,169 100.0 10 4,995 96.7 174 3.4 Mississippi 2,910,540 1,850 63.6 50 1,691 58.1 159 5.5 Missouri 5,842,713 4,841 82.9 31 3,978 68.1 863 14.8 Montana 944,632 819 86.7 27 762 80.7 57 6.0 Nebraska 1,768,331 1,441 81.5 32 1,386 78.4 55 3.1 Nevada 2,495,529 1,763 70.6 46 1,553 62.2 210 8.4 New Hampshire 1,314,895 1,299 98.8 11 1,183 90.0 116 8.8 New Jersey 8,724,560 8,556 98.1 12 7,487 85.8 1,069 12.3 New Mexico 1,954,599 1,743 89.2 23 1,625 83.1 118 6.0 New York 19,306,183 21,586 111.8 6 20,323 105.3 1,263 6.5 North Carolina 8,856,505 7,130 80.5 34 6,862 77.5 268 3.0 North Dakota 635,867 593 93.3 17 568 89.3 25 3.9 Ohio 11,478,006 10,244 89.2 23 8,812 76.8 1,432 12.5 Oklahoma 3,579,212 2,660 74.3 43 1,968 55.0 692 19.3 Oregon 3,700,758 3,595 97.1 13 3,320 89.7 275 7.4 Pennsylvania 12,440,621 11,974 96.2 14 9,639 77.5 2,335 18.8 Rhode Island 1,067,610 1,177 110.2 7 1,065 99.8 112 10.5 South Carolina 4,321,249 3,240 75.0 41 3,087 71.4 153 3.5 South Dakota 781,919 662 84.7 28 623 79.7 39 5.0 Tennessee 6,038,803 5,115 84.7 28 4,866 80.6 249 4.1 Texas 23,507,783 15,926 67.7 47 14,442 61.4 1,484 6.3 Utah 2,550,063 1,675 65.7 49 1,566 61.4 109 4.3 Vermont 623,908 749 120.0 2 724 116.0 25 4.0 Virginia 7,642,884 6,724 88.0 25 6,442 84.3 282 3.7 Washington 6,395,798 6,146 96.1 15 5,782 90.4 364 5.7 West Virginia 1,818,470 1,671 91.9 19 1,329 73.1 342 18.8 Wisconsin 5,556,506 5,092 91.6 20 4,746 85.4 346 6.2 Wyoming 515,004 386 75.0 41 353 68.5 33 6.4
Sources: July 1, 2006 Population Estimates, U.S. Census Bureau. Physician data are from the AMA Physician Masterfile (January 2007). N.R. = Not Ranked

Section 1: Active Physicians 2007 State Physician Workforce Data Book
| 11 | Association of American Medical Colleges 2007
Figure 4. Percent of Active Physicians In Each State Who Completed Undergraduate Medical Education (UME) In The State
0 10 20 30 40 50 60 70
New Hampshire (45)
Maine (44)
Rhode Island (43)
Nevada (42)
Arizona (41)
Connecticut (40)
New Jersey (39)
Florida (38)
Washington (37)
Colorado (36)
New Mexico (34)
Maryland (34)
Oregon (33)
Vermont (32)
Hawaii (31)
Virginia (30)
Massachusetts (29)
California (28)
North Carolina (27)
North Dakota (26)
Georgia (25)
U.S. Average
South Dakota (24)
Utah (23)
Wisconsin (22)
South Carolina (21)
Tennessee (20)
New York (19)
Indiana (18)
Minnesota (16)
Alabama (16)
Kansas (14)
Michigan (14)
Ohio (12)
Pennsylvania (12)
Missouri (11)
Illinois (10)
West Virginia (9)
Kentucky (8)
Mississippi (7)
Texas (6)
Iowa (5)
Arkansas (4)
Oklahoma (3)
Louisiana (2)
Nebraska (1)
Percent
State Median = 30.4%
Source: AMA Physician Masterfile (January 2007) Definitions: Active physicians include physicians who graduated from a U.S. medical school, U.S. osteopathic school, or an international medical school. M.D.’s and D.O.’s who are residents, fellows, retired, semi-retired, temporarily not in practice, or not active for other reasons are excluded from this figure. State median is based on 45 states because five states (Alaska, Delaware, Idaho, Montana, and Wyoming) do not have a medical or osteopathic school. See Table 4 for detailed data.

Section 1: Active Physicians 2007 State Physician Workforce Data Book
| 12 | Association of American Medical Colleges 2007
Table 4. Percent of Active Physicians In Each State Who Completed Undergraduate Medical Education (UME) In The State, by Type of School
Total Active Physicians Within Each State Who Completed
UME in the State
Active Physicians Within Each State Who Completed
UME at a Public Medical or Osteopathic
School in the State
Active Physicians Within Each State Who Completed
UME at a Private Medical or Osteopathic
School in the State
Total Active
Physicians Number Percent Rank Number Percent Number Percent United States 747,589 214,001 28.6% N.R. 143,196 19.2% 70,805 9.5%
Alabama 9,030 3,381 37.4% 16 3,381 37.4% --- --- Alaska 1,611 --- --- --- --- --- --- --- Arizona 13,178 1,290 9.8% 41 1,225 9.3% 65 0.5% Arkansas 5,311 2,543 47.9% 4 2,543 47.9% --- --- California 89,389 21,912 24.5% 28 13,308 14.9% 8,604 9.6% Colorado 12,076 1,850 15.3% 36 1,850 15.3% --- --- Connecticut 11,161 1,108 9.9% 40 713 6.4% 395 3.5% Delaware 2,250 --- --- --- --- --- --- --- District of Columbia 5,084 1,024 20.1% N.R. --- --- 1,024 20.1% Florida 44,263 6,354 14.4% 38 2,929 6.6% 3,425 7.7% Georgia 19,143 5,107 26.7% 25 3,035 15.9% 2,072 10.8% Hawaii 3,770 822 21.8% 31 822 21.8% --- --- Idaho 2,645 --- --- --- --- --- --- --- Illinois 31,246 12,181 39.0% 10 4,982 15.9% 7,199 23.0% Indiana 13,393 4,895 36.5% 18 4,895 36.5% --- --- Iowa 5,937 2,523 42.5% 5 1,810 30.5% 713 12.0% Kansas 5,660 2,154 38.1% 14 2,154 38.1% --- --- Kentucky 8,906 3,572 40.1% 8 3,510 39.4% 62 0.7% Louisiana 9,961 5,553 55.7% 2 4,587 46.0% 966 9.7% Maine 3,847 264 6.9% 44 --- --- 264 6.9% Maryland 19,938 3,173 15.9% 34 2,493 12.5% 680 3.4% Massachusetts 25,342 5,894 23.3% 29 1,248 4.9% 4,646 18.3% Michigan 25,186 9,588 38.1% 14 9,588 38.1% --- --- Minnesota 13,157 4,926 37.4% 16 4,555 34.6% 371 2.8% Mississippi 5,031 2,033 40.4% 7 2,033 40.4% --- --- Missouri 13,857 5,356 38.7% 11 2,275 16.4% 3,081 22.2% Montana 2,160 --- --- --- --- --- --- --- Nebraska 3,705 2,138 57.7% 1 1,708 46.1% 430 11.6% Nevada 4,791 415 8.7% 42 415 8.7% --- --- New Hampshire 3,490 178 5.1% 45 --- --- 178 5.1% New Jersey 25,080 3,251 13.0% 39 3,251 13.0% --- --- New Mexico 4,421 703 15.9% 34 703 15.9% --- --- New York 65,877 23,164 35.2% 19 8,562 13.0% 14,602 22.2% North Carolina 20,294 5,149 25.4% 27 3,002 14.8% 2,147 10.6% North Dakota 1,452 382 26.3% 26 382 26.3% --- --- Ohio 28,904 11,035 38.2% 12 9,639 33.3% 1,396 4.8% Oklahoma 6,867 3,323 48.4% 3 3,323 48.4% --- --- Oregon 9,636 1,645 17.1% 33 1,645 17.1% --- --- Pennsylvania 35,566 12,707 35.7% 12 1,058 3.0% 11,649 32.8% Rhode Island 3,392 256 7.5% 43 --- --- 256 7.5% South Carolina 9,100 3,014 33.1% 21 3,014 33.1% --- --- South Dakota 1,662 482 29.0% 24 482 29.0% --- --- Tennessee 14,258 4,946 34.7% 20 3,901 27.4% 1,045 7.3% Texas 46,433 19,370 41.7% 6 16,979 36.6% 2,391 5.1% Utah 4,926 1,497 30.4% 23 1,497 30.4% --- --- Vermont 1,918 377 19.7% 32 377 19.7% --- --- Virginia 18,510 4,234 22.9% 30 3,500 18.9% 734 4.0% Washington 16,244 2,459 15.1% 37 2,459 15.1% --- --- West Virginia 4,204 1,650 39.2% 9 1,220 29.0% 430 10.2% Wisconsin 13,347 4,123 30.9% 22 2,143 16.1% 1,980 14.8% Wyoming 980 --- --- --- --- --- --- ---
Source: AMA Physician Masterfile (January 2007) N.R. = Not Ranked --- Indicates that the data are not applicable. Some states do not have a public medical or osteopathic school.

Section 1: Active Physicians 2007 State Physician Workforce Data Book
| 13 | Association of American Medical Colleges 2007
Figure 5. Percent of Active Physicians In Each State Who Completed an ACGME-Accredited Residency or Fellowship in the State
0 10 20 30 40 50 60 70 80
Montana (50)
Alaska (49)Idaho (48)
Nevada (47)
Wyoming (46)New Hampshire
South Dakota (44)Delaware (43)
Maine (42)North Dakota (41)
Vermont (40)
New Mexico (39)Arizona (38)
Florida (37)Oregon (36)
Virginia (35)
Hawaii (34)Mississippi (33)
Washington (32)New Jersey (31)
North Carolina (30)Georgia (29)
West Virginia (28)
South CarolinaColorado (26)
Utah (25)Maryland (24)
Kentucky (23)
Kansas (22)Iowa (21)
Rhode Island (20)Indiana (19)
Wisconsin (18)
Tennessee (17)Oklahoma (16)
Alabama (15)Connecticut (14)
Nebraska (13)Arkansas (12)
Missouri (11)
U.S. AverageTexas (10)
Ohio (9)Minnesota (8)
Louisiana (7)
California (6)Massachusetts (4)
Pennsylvania (4)Michigan (3)
Illinois (2)New York (1)
Percent
State Median = 33.9%
Source: AMA Physician Masterfile (January 2007) Definitions: Active physicians include physicians who graduated from a U.S. medical school, U.S. osteopathic school, or an international medical school. M.D.’s and D.O.’s who are residents, fellows, retired, semi-retired, temporarily not in practice, or not active for other reasons are excluded from this figure. See Table 5 for detailed data.

Section 1: Active Physicians 2007 State Physician Workforce Data Book
| 14 | Association of American Medical Colleges 2007
Table 5. Percent of Active Physicians In Each State Who Completed an ACGME-Accredited Residency or Fellowship In The State
Total Active Physicians In Each State
Who Completed GME in the State
Total Active Physicians Number Percent Rank
United States 747,589 334,640 44.8% N.R. Alabama 9,030 3,551 39.3% 15 Alaska 1,611 37 2.3% 49 Arizona 13,178 3,230 24.5% 38 Arkansas 5,311 2,289 43.1% 12 California 89,389 49,054 54.9% 6 Colorado 12,076 4,059 33.6% 26 Connecticut 11,161 4,422 39.6% 14 Delaware 2,250 443 19.7% 43 District of Columbia 5,084 2,263 44.5% N.R. Florida 44,263 11,425 25.8% 37 Georgia 19,143 6,236 32.6% 29 Hawaii 3,770 1,066 28.3% 34 Idaho 2,645 142 5.4% 48 Illinois 31,246 18,940 60.6% 2 Indiana 13,393 5,131 38.3% 19 Iowa 5,937 2,128 35.8% 21 Kansas 5,660 2,005 35.4% 22 Kentucky 8,906 3,144 35.3% 23 Louisiana 9,961 5,455 54.8% 7 Maine 3,847 819 21.3% 42 Maryland 19,938 6,897 34.6% 24 Massachusetts 25,342 14,003 55.3% 4 Michigan 25,186 14,081 55.9% 3 Minnesota 13,157 7,119 54.1% 8 Mississippi 5,031 1,520 30.2% 33 Missouri 13,857 6,012 43.4% 11 Montana 2,160 29 1.3% 50 Nebraska 3,705 1,572 42.4% 13 Nevada 4,791 423 8.8% 47 New Hampshire 3,490 387 11.1% 45 New Jersey 25,080 8,035 32.0% 31 New Mexico 4,421 1,043 23.6% 39 New York 65,877 48,647 73.8% 1 North Carolina 20,294 6,544 32.2% 30 North Dakota 1,452 315 21.7% 41 Ohio 28,904 15,621 54.0% 9 Oklahoma 6,867 2,675 39.0% 16 Oregon 9,636 2,513 26.1% 36 Pennsylvania 35,566 19,655 55.3% 4 Rhode Island 3,392 1,220 36.0% 20 South Carolina 9,100 3,031 33.3% 27 South Dakota 1,662 272 16.4% 44 Tennessee 14,258 5,536 38.8% 17 Texas 46,433 22,875 49.3% 10 Utah 4,926 1,687 34.2% 25 Vermont 1,918 440 22.9% 40 Virginia 18,510 5,070 27.4% 35 Washington 16,244 4,949 30.5% 32 West Virginia 4,204 1,376 32.7% 28 Wisconsin 13,347 5,166 38.7% 18 Wyoming 980 88 9.0% 46
Source: AMA Physician Masterfile (January 2007) N.R. = Not Ranked

Section 1: Active Physicians 2007 State Physician Workforce Data Book
| 15 | Association of American Medical Colleges 2007
Figure 6. Percent of Active Physicians Age 60 or Older
0 5 10 15 20 25 30 35 40
Minnesota (50)North Carolina (49)
Nebraska (47)South Dakota (47)
Wisconsin (46)
Iowa (45)Georgia (44)
Indiana (43)New Hampshire (42)
Utah (41)
Tennessee (38)North Dakota (38)
South Carolina (38)Kentucky (34)
Nevada (34)
Idaho (34)Ohio (34)
Arkansas (32)Alabama (32)
Colorado (28)
Mississippi (28)Delaware (28)
Alaska (28)Missouri (27)
Texas (26)
Kansas (24)Washington (24)
Arizona (23)Pennsylvania (18)
Virginia (18)Illinois (18)
Oregon (18)
Rhode Island (18)Oklahoma (17)
Michigan (15)Massachusetts (15)
U.S. Average
Vermont (14)Maine (13)
New Mexico (12)Louisiana (11)
Connecticut (10)
Montana (9)Wyoming (7)
Hawaii (7)Maryland (6)
Florida (4)
West Virginia (4)New Jersey (3)
New York (2)California (1)
Percent
State Median = 22.1%
Source: AMA Physician Masterfile (January 2007) Definitions: Active physicians include physicians who graduated from a U.S. medical school, U.S. osteopathic school, or an international medical school. M.D.’s and D.O.’s who are residents, fellows, retired, semi-retired, temporarily not in practice, or not active for other reasons are excluded from this figure. Physicians whose age was unknown were also excluded from this analysis. See Table 6 for detailed data.

Section 1: Active Physicians 2007 State Physician Workforce Data Book
| 16 | Association of American Medical Colleges 2007
Table 6. Active Physicians by Selected Age Groups
Active Physicians
Under Age 40 Active Physicians Age 60 or Older
Total Active Physicians Number Percent Number Percent Rank
United States 747,589 140,586 18.8% 174,113 23.3% N.R. Alabama 9,030 1,588 17.6% 1,926 21.3% 32 Alaska 1,611 295 18.3% 345 21.4% 28 Arizona 13,178 2,576 19.5% 2,961 22.5% 23 Arkansas 5,311 1,018 19.2% 1,129 21.3% 32 California 89,389 16,618 18.6% 24,595 27.5% 1 Colorado 12,076 2,357 19.5% 2,579 21.4% 28 Connecticut 11,161 1,881 16.9% 2,716 24.3% 10 Delaware 2,250 436 19.4% 481 21.4% 28 District of Columbia 5,084 1,012 19.9% 1,530 30.1% N.R. Florida 44,263 6,849 15.5% 11,231 25.4% 4 Georgia 19,143 3,894 20.3% 3,747 19.6% 44 Hawaii 3,770 650 17.2% 943 25.0% 7 Idaho 2,645 467 17.7% 548 20.7% 34 Illinois 31,246 6,661 21.3% 7,059 22.6% 18 Indiana 13,393 2,599 19.4% 2,633 19.7% 43 Iowa 5,937 1,153 19.4% 1,132 19.1% 45 Kansas 5,660 1,094 19.3% 1,266 22.4% 24 Kentucky 8,906 1,826 20.5% 1,841 20.7% 34 Louisiana 9,961 1,932 19.4% 2,407 24.2% 11 Maine 3,847 607 15.8% 904 23.5% 13 Maryland 19,938 3,747 18.8% 5,030 25.2% 6 Massachusetts 25,342 5,096 20.1% 5,875 23.2% 15 Michigan 25,186 4,918 19.5% 5,838 23.2% 15 Minnesota 13,157 2,637 20.0% 2,372 18.0% 50 Mississippi 5,031 910 18.1% 1,075 21.4% 28 Missouri 13,857 2,741 19.8% 2,984 21.5% 27 Montana 2,160 270 12.5% 529 24.5% 9 Nebraska 3,705 780 21.1% 677 18.3% 47 Nevada 4,791 999 20.9% 991 20.7% 34 New Hampshire 3,490 586 16.8% 698 20.0% 42 New Jersey 25,080 4,107 16.4% 6,442 25.7% 3 New Mexico 4,421 747 16.9% 1,062 24.0% 12 New York 65,877 11,410 17.3% 17,758 27.0% 2 North Carolina 20,294 4,318 21.3% 3,693 18.2% 49 North Dakota 1,452 264 18.2% 297 20.5% 38 Ohio 28,904 6,026 20.8% 5,997 20.7% 34 Oklahoma 6,867 1,248 18.2% 1,560 22.7% 17 Oregon 9,636 1,737 18.0% 2,181 22.6% 18 Pennsylvania 35,566 6,409 18.0% 8,031 22.6% 18 Rhode Island 3,392 694 20.5% 768 22.6% 18 South Carolina 9,100 1,871 20.6% 1,865 20.5% 38 South Dakota 1,662 282 17.0% 304 18.3% 47 Tennessee 14,258 2,583 18.1% 2,916 20.5% 38 Texas 46,433 9,597 20.7% 10,109 21.8% 26 Utah 4,926 992 20.1% 1,001 20.3% 41 Vermont 1,918 287 15.0% 448 23.4% 14 Virginia 18,510 3,569 19.3% 4,180 22.6% 18 Washington 16,244 2,879 17.7% 3,641 22.4% 24 West Virginia 4,204 754 17.9% 1,069 25.4% 4 Wisconsin 13,347 2,482 18.6% 2,504 18.8% 46 Wyoming 980 133 13.6% 245 25.0% 7
Source: AMA Physician Masterfile (January 2007) N.R. = Not Ranked

Section 2: Medical and Osteopathic School Enrollment 2007 State Physician Workforce Data Book
| 17 | Association of American Medical Colleges 2007
Figure 7. Students Enrolled in Medical or Osteopathic School for the 2007-2008 Academic Year Per 100,000 Population*
0 10 20 30 40 50 60 70 80 90
Washington (45)
Colorado (44)
Oregon (43)
Mississippi (42)
New Mexico (41)
California (40)
Utah (39)
Indiana (38)
Arizona (37)
Florida (36)
Hawaii (35)
Georgia (34)
New Jersey (33)
Nevada (32)
Alabama (31)
Minnesota (29)
South Carolina (29)
Arkansas (28)
North Carolina (27)
Connecticut (26)
Texas (25)
New Hampshire (24)
Kansas (23)
South Dakota (22)
Wisconsin (21)
Oklahoma (20)
U.S. Average
Kentucky (19)
Virginia (18)
Michigan (17)
Tennessee (16)
Maryland (15)
Maine (14)
Rhode Island (13)
Ohio (12)
North Dakota (11)
Illinois (10)
Louisiana (9)
Massachusetts (8)
New York (7)
Iowa (6)
Pennsylvania (5)
Nebraska (4)
West Virginia (3)
Missouri (2)
Vermont (1)
Number per 100,000 Population
Allopathic
Osteopathic
State Median = 25.9
Sources: Population estimates were obtained from the U.S. Census Bureau. Students enrolled in medical school were obtained from the AAMC Student database. Students enrolled in osteopathic schools were obtained from the American Association of Colleges of Osteopathic Medicine, accessed online at www.aacom.org on September 26, 2007. *The enrollment figures are for the 2007-2008 academic year and represent maximum enrollment, including people who are on leave of absence. The population estimates correspond to July 1, 2006, as those were the most recent state level population estimates available at the time of printing. State median is based on 45 states because five states (Alaska, Delaware, Idaho, Montana, and Wyoming) do not have a medical or osteopathic school. See Table 7 for detailed data.

Section 2: Medical and Osteopathic School Enrollment 2007 State Physician Workforce Data Book
| 18 | Association of American Medical Colleges 2007
Table 7. Students Enrolled in Medical or Osteopathic Schools for the 2007-2008 Academic Year*
Total Students Enrolled in
Medical or Osteopathic Schools Students Enrolled in
Medical Schools Students Enrolled in Osteopathic Schools
Total
Population Number Rate Per 100,000 Rank Number
Rate Per 100,000 Number
Rate Per 100,000
United States 299,398,484 87,300 29.2 N.R. 72,973 24.4 14,327 4.8 Alabama 4,599,030 994 21.6 31.0 994 21.6 --- --- Alaska 670,053 --- --- --- --- --- --- --- Arizona 6,166,318 1,181 19.2 37.0 507 8.2 674 10.9 Arkansas 2,810,872 621 22.1 28.0 621 22.1 --- --- California 36,457,549 6,100 16.7 40.0 4,883 13.4 1,217 3.3 Colorado 4,753,377 632 13.3 44.0 632 13.3 --- --- Connecticut 3,504,809 858 24.5 26.0 858 24.5 --- --- Delaware 853,476 --- --- --- --- --- --- --- District of Columbia 581,530 2,007 345.1 N.R. 2,007 345.1 --- --- Florida 18,089,888 3,485 19.3 36.0 2,082 11.5 1,403 7.8 Georgia 9,363,941 1,920 20.5 34.0 1,750 18.7 170 1.8 Hawaii 1,285,498 251 19.5 35.0 251 19.5 --- --- Idaho 1,466,465 --- --- --- --- --- --- --- Illinois 12,831,970 5,429 42.3 10.0 4,789 37.3 640 5.0 Indiana 6,313,520 1,173 18.6 38.0 1,173 18.6 --- --- Iowa 2,982,085 1,433 48.1 6.0 633 21.2 800 26.8 Kansas 2,764,075 717 25.9 23.0 717 25.9 --- --- Kentucky 4,206,074 1,312 31.2 19.0 1,037 24.7 275 6.5 Louisiana 4,287,768 1,829 42.7 9.0 1,829 42.7 --- --- Maine 1,321,574 455 34.4 14.0 0.0 455 34.4 Maryland 5,615,727 1,906 33.9 15.0 1,906 33.9 --- --- Massachusetts 6,437,193 2,786 43.3 8.0 2,786 43.3 --- --- Michigan 10,095,643 3,208 31.8 17.0 2,461 24.4 747 7.4 Minnesota 5,167,101 1,135 22.0 29.0 1,135 22.0 --- --- Mississippi 2,910,540 439 15.1 42.0 439 15.1 --- --- Missouri 5,842,713 3,673 62.9 2.0 2,073 35.5 1,600 27.4 Montana 944,632 --- --- --- --- --- --- --- Nebraska 1,768,331 989 55.9 4.0 989 55.9 --- --- Nevada 2,495,529 528 21.2 32.0 225 9.0 303 12.1 New Hampshire 1,314,895 330 25.1 24.0 330 25.1 --- --- New Jersey 8,724,560 1,803 20.7 33.0 1,421 16.3 382 4.4 New Mexico 1,954,599 322 16.5 41.0 322 16.5 --- --- New York 19,306,183 8,988 46.6 7.0 7,683 39.8 1,305 6.8 North Carolina 8,856,505 1,975 22.3 27.0 1,975 22.3 --- --- North Dakota 635,867 250 39.3 11.0 250 39.3 --- --- Ohio 11,478,006 4,279 37.3 12.0 3,846 33.5 433 3.8 Oklahoma 3,579,212 991 27.7 20.0 639 17.9 352 9.8 Oregon 3,700,758 509 13.8 43.0 509 13.8 --- --- Pennsylvania 12,440,621 6,760 54.3 5.0 4,834 38.9 1,926 15.5 Rhode Island 1,067,610 389 36.4 13.0 389 36.4 --- --- South Carolina 4,321,249 952 22.0 29.0 952 22.0 --- --- South Dakota 781,919 209 26.7 22.0 209 26.7 --- --- Tennessee 6,038,803 1,927 31.9 16.0 1,777 29.4 150 2.5 Texas 23,507,783 5,861 24.9 25.0 5,360 22.8 501 2.1 Utah 2,550,063 435 17.1 39.0 435 17.1 --- --- Vermont 623,908 439 70.4 1.0 439 70.4 --- --- Virginia 7,642,884 2,414 31.6 18.0 1,814 23.7 600 7.9 Washington 6,395,798 827 12.9 45.0 827 12.9 --- --- West Virginia 1,818,470 1,081 59.4 3.0 687 37.8 394 21.7 Wisconsin 5,556,506 1,498 27.0 21.0 1,498 27.0 --- --- Wyoming 515,004 --- --- --- --- --- --- ---
Sources: July 1, 2006 Population Estimates, U.S. Census Bureau. Students enrolled in medical school were obtained from the AAMC Student database. Students enrolled in osteopathic schools were obtained from the American Association of Colleges of Osteopathic Medicine, accessed online at www.aacom.org on September 26, 2007. N.R. = Not Ranked --- Indicates that the data are not applicable. Some states do not have a medical or osteopathic school. *The enrollment figures are for the 2007-2008 academic year and represent maximum enrollment, including people who are on leave of absence. The population estimates correspond to July 1, 2006, as those were the most recent state level population estimates available at the time of printing.

Section 2: Medical and Osteopathic School Enrollment 2007 State Physician Workforce Data Book
| 19 | Association of American Medical Colleges 2007
Figure 8. Students Enrolled in Public Medical or Osteopathic School for the 2007-2008 Academic Year Per 100,000 Population*
0 10 20 30 40 50 60 70 80
Pennsylvania (42)
Massachusetts (41)
Florida (40)
California (39)
Georgia (38)
Arizona (37)
Nevada (36)
Connecticut (35)
North Carolina (34)
Wisconsin (33)
Washington (32)
New York (31)
Colorado (30)
Illinois (28)
Missouri (28)
Oregon (27)
Tennessee (26)
Mississippi (25)
U.S. Average
New Mexico (24)
Utah (23)
Virginia (22)
Minnesota (21)
Indiana (20)
Hawaii (19)
New Jersey (18)
Iowa (17)
Alabama (16)
Texas (15)
South Carolina (14)
Arkansas (13)
Maryland (12)
Kentucky (11)
Kansas (10)
South Dakota (9)
Louisiana (8)
Nebraska (7)
Oklahoma (6)
Ohio (5)
Michigan (4)
West Virginia (3)
North Dakota (2)
Vermont (1)
Number per 100,000 Population
Allopathic
Osteopathic
State Median = 18.1
Sources: Population estimates were obtained from the U.S. Census Bureau. Students enrolled in medical school were obtained from the AAMC Student database. Students enrolled in osteopathic schools were obtained from the American Association of Colleges of Osteopathic Medicine, accessed online at www.aacom.org on September 26, 2007. *The enrollment figures are for the 2007-2008 academic year and represent maximum enrollment, including people who are on leave of absence. The population estimates correspond to July 1, 2006, as those were the most recent state level population estimates available at the time of printing. State median is based on 42 states because eight states (Alaska, Delaware, Idaho, Maine, Montana, New Hampshire, Rhode Island, and Wyoming) do not have a public medical or osteopathic school. See Table 8 for detailed data.

Section 2: Medical and Osteopathic School Enrollment 2007 State Physician Workforce Data Book
| 20 | Association of American Medical Colleges 2007
Table 8. Students Enrolled in Public Medical or Osteopathic Schools for the 2007-2008 Academic Year*
Total Students Enrolled in Public Medical or Osteopathic Schools
Students Enrolled in Public Medical Schools
Students Enrolled in Public Osteopathic
Schools
Total Population Number
Rate Per 100,000 Rank Number
Rate Per 100,000 Number
Rate Per 100,000
United States 299,398,484 45,716 15.3 N.R. 43,301 14.5 2,415 0.8 Alabama 4,599,030 994 21.6 16 994 21.6 --- --- Alaska 670,053 --- --- --- --- --- --- --- Arizona 6,166,318 507 8.2 37 507 8.2 --- --- Arkansas 2,810,872 621 22.1 13 621 22.1 --- --- California 36,457,549 2,806 7.7 39 2,806 7.7 --- --- Colorado 4,753,377 632 13.3 30 632 13.3 --- --- Connecticut 3,504,809 351 10.0 35 351 10.0 --- --- Delaware 853,476 --- --- --- --- --- --- --- District of Columbia 581,530 --- --- N.R. --- --- --- --- Florida 18,089,888 1,359 7.5 40 1,359 7.5 --- --- Georgia 9,363,941 755 8.1 38 755 8.1 --- --- Hawaii 1,285,498 251 19.5 19 251 19.5 --- --- Idaho 1,466,465 --- --- --- --- --- --- --- Illinois 12,831,970 1,732 13.5 28 1,732 13.5 --- --- Indiana 6,313,520 1,173 18.6 20 1,173 18.6 --- --- Iowa 2,982,085 633 21.2 17 633 21.2 --- --- Kansas 2,764,075 717 25.9 10 717 25.9 --- --- Kentucky 4,206,074 1,037 24.7 11 1,037 24.7 --- --- Louisiana 4,287,768 1,160 27.1 8 1,160 27.1 --- --- Maine 1,321,574 --- --- --- --- --- --- --- Maryland 5,615,727 1,347 24.0 12 1,347 24.0 --- --- Massachusetts 6,437,193 463 7.2 41 463 7.2 --- --- Michigan 10,095,643 3,208 31.8 4 2,461 24.4 747 7.4 Minnesota 5,167,101 943 18.3 21 943 18.3 --- --- Mississippi 2,910,540 439 15.1 25 439 15.1 --- --- Missouri 5,842,713 791 13.5 28 791 13.5 --- --- Montana 944,632 --- --- --- --- --- --- --- Nebraska 1,768,331 487 27.5 7 487 27.5 --- --- Nevada 2,495,529 225 9.0 36 225 9.0 --- --- New Hampshire 1,314,895 --- --- --- --- --- --- --- New Jersey 8,724,560 1,803 20.7 18 1,421 16.3 382 4.4 New Mexico 1,954,599 322 16.5 24 322 16.5 --- --- New York 19,306,183 2,515 13.0 31 2,515 13.0 --- --- North Carolina 8,856,505 1,036 11.7 34 1,036 11.7 --- --- North Dakota 635,867 250 39.3 2 250 39.3 --- --- Ohio 11,478,006 3,499 30.5 5 3,066 26.7 433 3.8 Oklahoma 3,579,212 991 27.7 6 639 17.9 352 9.8 Oregon 3,700,758 509 13.8 27 509 13.8 --- --- Pennsylvania 12,440,621 599 4.8 42 599 4.8 --- --- Rhode Island 1,067,610 --- --- --- --- --- --- --- South Carolina 4,321,249 952 22.0 14 952 22.0 --- --- South Dakota 781,919 209 26.7 9 209 26.7 --- --- Tennessee 6,038,803 872 14.4 26 872 14.4 --- --- Texas 23,507,783 5,104 21.7 15 4,603 19.6 501 2.1 Utah 2,550,063 435 17.1 23 435 17.1 --- --- Vermont 623,908 439 70.4 1 439 70.4 --- --- Virginia 7,642,884 1,368 17.9 22 1,368 17.9 --- --- Washington 6,395,798 827 12.9 32 827 12.9 --- --- West Virginia 1,818,470 687 37.8 3 687 37.8 --- --- Wisconsin 5,556,506 668 12.0 33 668 12.0 --- --- Wyoming 515,004 --- --- --- --- --- --- ---
Sources: July 1, 2006 Population Estimates, U.S. Census Bureau. Students enrolled in medical school were obtained from the AAMC Student database. Students enrolled in osteopathic schools were obtained from the American Association of Colleges of Osteopathic Medicine, accessed online at www.aacom.org on September 26, 2007. N.R. = Not Ranked --- Indicates that the data are not applicable. Some states do not have a public medical or osteopathic school. *The enrollment figures are for the 2007-2008 academic year and represent maximum enrollment, including people who are on leave of absence. The population estimates correspond to July 1, 2006, as those were the most recent state level population estimates available at the time of printing.

Section 2: Medical and Osteopathic School Enrollment 2007 State Physician Workforce Data Book
| 21 | Association of American Medical Colleges 2007
Figure 9. Proportion of New Medical Students from Each State that Matriculated to an In-State Medical School for the 2006-2007 Academic Year
0 10 20 30 40 50 60 70 80 90 100
New Hampshire (44)
Rhode Island (43)
Utah (42)
Washington (41)
Maryland (40)
Connecticut (39)
California (38)
Oregon (36)
New Jersey (36)
Colorado (35)
Arizona (34)
Massachusetts (33)
Virginia (32)
Minnesota (31)
Hawaii (30)
South Dakota (29)
U.S. Average
New Mexico (28)
Pennsylvania (27)
Michigan (26)
Georgia (25)
Florida (24)
New York (23)
Wisconsin (22)
North Carolina (21)
Iowa (20)
Kansas (19)
Missouri (18)
Nevada (17)
Indiana (16)
Illinois (15)
North Dakota (14)
Oklahoma (13)
Tennessee (12)
Vermont (11)
Ohio (10)
Mississippi (9)
Alabama (8)
West Virginia (7)
Louisiana (6)
Nebraska (5)
Texas (4)
South Carolina (3)
Kentucky (2)
Arkansas (1)
Percent
State Median = 67.1
Source: AAMC: Data Warehouse: Applicant Matriculant File as of 10/27/2006. State median is based on 44 states because six states (Alaska, Delaware, Idaho, Maine, Montana, and Wyoming) do not have a medical school. See Table 9 for detailed data.

Section 2: Medical and Osteopathic School Enrollment 2007 State Physician Workforce Data Book
| 22 | Association of American Medical Colleges 2007
Table 9. New Medical Students from Each State that Matriculated to an In-State Medical School for the 2006-2007 Academic Year
First-Year Medical Students Who Matriculated to a Medical
School in their Legal State of Residence
Legal State Residents Who are First-Year Matriculants to
Medical School Number Percent Rank United States 16,950 10,635 62.7% N.R.
Alabama 282 226 80.1% 8 Alaska 29 --- --- --- Arizona 223 110 49.3% 34 Arkansas 149 132 88.6% 1 California 1,968 808 41.1% 38 Colorado 257 117 45.5% 35 Connecticut 195 77 39.5% 39 Delaware 38 --- --- --- District of Columbia 32 15 46.9% N.R. Florida 724 477 65.9% 24 Georgia 482 315 65.4% 25 Hawaii 93 56 60.2% 30 Idaho 61 --- --- --- Illinois 843 627 74.4% 15 Indiana 330 240 72.7% 16 Iowa 137 94 68.6% 20 Kansas 215 150 69.8% 19 Kentucky 216 190 88.0% 2 Louisiana 399 341 85.5% 6 Maine 39 --- --- --- Maryland 413 147 35.6% 40 Massachusetts 433 217 50.1% 33 Michigan 606 394 65.0% 26 Minnesota 325 193 59.4% 31 Mississippi 138 110 79.7% 9 Missouri 282 199 70.6% 18 Montana 50 --- --- --- Nebraska 129 111 86.0% 5 Nevada 69 49 71.0% 17 New Hampshire 44 6 13.6% 44 New Jersey 665 302 45.4% 36 New Mexico 109 70 64.2% 28 New York 1,317 883 67.0% 23 North Carolina 394 270 68.5% 21 North Dakota 54 41 75.9% 14 Ohio 712 565 79.4% 10 Oklahoma 182 140 76.9% 13 Oregon 185 84 45.4% 36 Pennsylvania 675 438 64.9% 27 Rhode Island 39 13 33.3% 43 South Carolina 239 210 87.9% 3 South Dakota 72 44 61.1% 29 Tennessee 294 227 77.2% 12 Texas 1,334 1,160 87.0% 4 Utah 224 75 33.5% 42 Vermont 46 36 78.3% 11 Virginia 436 241 55.3% 32 Washington 290 103 35.5% 41 West Virginia 141 119 84.4% 7 Wisconsin 317 213 67.2% 22 Wyoming 24 --- --- ---
Source: AAMC Applicant Matriculant File as of 10/27/2006. N.R. = Not Ranked --- Indicates that the data are not applicable. Some states do not have a medical or osteopathic school.

Section 3: Graduate Medical Education 2007 State Physician Workforce Data Book
| 23 | Association of American Medical Colleges 2007
Figure 10. Physicians in ACGME-Accredited Residencies and Fellowships Per 100,000 Population
0 10 20 30 40 50 60 70 80 90 100
Montana (50)Idaho (49)
Alaska (48)
Wyoming (47)Nevada (46)
South Dakota (45)Mississippi (44)
Florida (43)
North Dakota (42)Oklahoma (41)
Arizona (40)
Indiana (39)Oregon (37)
Georgia (37)
Maine (36)South Carolina (35)
Colorado (34)
Arkansas (33)Kansas (31)
Kentucky (31)
Washington (30)California (29)
Utah (28)
New Mexico (27)Alabama (26)
Iowa (25)
New Hampshire (24)Texas (22)
Virginia (22)
Wisconsin (21)Delaware (20)
New Jersey (19)North Carolina (18)
Hawaii (17)
Tennessee (16)West Virginia (15)
Nebraska (14)
U.S. AverageLouisiana (13)
Minnesota (12)
Vermont (11)Missouri (10)
Michigan (9)
Ohio (8)Illinois (7)
Maryland (6)
Connecticut (5)Pennsylvania (4)
Rhode Island (3)
Massachusetts (2)New York (1)
Number per 100,000 Population
Allopathic
Osteopathic
State Median = 26.7
Source: 2006 National GME Census
Population estimates were obtained from the U.S. Census Bureau Definitions: This figure shows the number of M.D.’s and D.O.’s in an ACGME-accredited program as of August 1, 2006. This does not include training programs accredited by the AOA. The number of M.D.’s includes M.D.’s from international medical schools. Residents whose status in the ACGME program was “Matched, but not yet in the program” were excluded from this analysis. Similarly, if the state of the residency program or the degree type of the resident was unknown, the resident was excluded from this analysis. See Table 10 for detailed data.

Section 3: Graduate Medical Education 2007 State Physician Workforce Data Book
| 24 | Association of American Medical Colleges 2007
Table 10. Physicians in ACGME-Accredited Residencies and Fellowships Per 100,000 Population by Degree Type
Total Residents/Fellows in
ACGME-Accredited Programs M.D.’s in ACGME
Programs D.O.’s in ACGME
Programs
Total
Population Number Rate Per 100,000 Rank Number
Rate Per 100,000 Number
Rate Per 100,000
United States 299,398,484 106,464 35.6 N.R. 99,644 33.3 6,820 2.3 Alabama 4,599,030 1,228 26.7 26 1,190 25.9 38 0.8 Alaska 670,053 31 4.6 48 28 4.2 3 0.4 Arizona 6,166,318 1,230 19.9 40 1,066 17.3 164 2.7 Arkansas 2,810,872 680 24.2 33 651 23.2 29 1.0 California 36,457,549 9,371 25.7 29 8,816 24.2 555 1.5 Colorado 4,753,377 1,145 24.1 34 1,072 22.6 73 1.5 Connecticut 3,504,809 2,007 57.3 5 1,879 53.6 128 3.7 Delaware 853,476 256 30.0 20 208 24.4 48 5.6 District of Columbia 581,530 1,777 305.6 N.R. 1,711 294.2 66 11.3 Florida 18,089,888 3,065 16.9 43 2,894 16.0 171 0.9 Georgia 9,363,941 1,942 20.7 37 1,855 19.8 87 0.9 Hawaii 1,285,498 423 32.9 17 369 28.7 54 4.2 Idaho 1,466,465 46 3.1 49 37 2.5 9 0.6 Illinois 12,831,970 5,870 45.7 7 5,417 42.2 453 3.5 Indiana 6,313,520 1,304 20.7 39 1,226 19.4 78 1.2 Iowa 2,982,085 798 26.8 25 674 22.6 124 4.2 Kansas 2,764,075 694 25.1 31 627 22.7 67 2.4 Kentucky 4,206,074 1,057 25.1 31 1,007 23.9 50 1.2 Louisiana 4,287,768 1,546 36.1 13 1,520 35.4 26 0.6 Maine 1,321,574 285 21.6 36 217 16.4 68 5.1 Maryland 5,615,727 2,640 47.0 6 2,514 44.8 126 2.2 Massachusetts 6,437,193 4,988 77.5 2 4,804 74.6 184 2.9 Michigan 10,095,643 4,442 44.0 9 4,178 41.4 264 2.6 Minnesota 5,167,101 2,124 41.1 12 2,039 39.5 85 1.6 Mississippi 2,910,540 484 16.6 44 445 15.3 39 1.3 Missouri 5,842,713 2,519 43.1 10 2,295 39.3 224 3.8 Montana 944,632 20 2.1 50 19 2.0 1 0.1 Nebraska 1,768,331 622 35.2 14 577 32.6 45 2.5 Nevada 2,495,529 220 8.8 46 195 7.8 25 1.0 New Hampshire 1,314,895 367 27.9 24 338 25.7 29 2.2 New Jersey 8,724,560 2,688 30.8 19 2,458 28.2 230 2.6 New Mexico 1,954,599 512 26.2 27 497 25.4 15 0.8 New York 19,306,183 15,629 81.0 1 14,841 76.9 788 4.1 North Carolina 8,856,505 2,810 31.7 18 2,709 30.6 101 1.1 North Dakota 635,867 110 17.3 42 104 16.4 6 0.9 Ohio 11,478,006 5,115 44.6 8 4,713 41.1 402 3.5 Oklahoma 3,579,212 708 19.8 41 637 17.8 71 2.0 Oregon 3,700,758 765 20.7 37 729 19.7 36 1.0 Pennsylvania 12,440,621 7,226 58.1 4 6,488 52.2 738 5.9 Rhode Island 1,067,610 741 69.4 3 712 66.7 29 2.7 South Carolina 4,321,249 1,015 23.5 35 963 22.3 52 1.2 South Dakota 781,919 107 13.7 45 89 11.4 18 2.3 Tennessee 6,038,803 2,034 33.7 16 1,968 32.6 66 1.1 Texas 23,507,783 6,741 28.7 22 6,265 26.7 476 2.0 Utah 2,550,063 658 25.8 28 624 24.5 34 1.3 Vermont 623,908 261 41.8 11 259 41.5 2 0.3 Virginia 7,642,884 2,193 28.7 22 2,034 26.6 159 2.1 Washington 6,395,798 1,638 25.6 30 1,533 24.0 105 1.6 West Virginia 1,818,470 639 35.1 15 569 31.3 70 3.8 Wisconsin 5,556,506 1,652 29.7 21 1,550 27.9 102 1.8 Wyoming 515,004 41 8.0 47 34 6.6 7 1.4
Sources: July 1, 2006 Population Estimates, U.S. Census Bureau. Physicians in ACGME-accredited programs are from the 2006 National GME Census. N.R. = Not Ranked

Section 3: Graduate Medical Education 2007 State Physician Workforce Data Book
| 25 | Association of American Medical Colleges 2007
Figure 11. Percent of Residents/Fellows in ACGME-Accredited Programs Who Are International Medical Graduates (IMGs)
0 10 20 30 40 50 60 70 80
Alaska (50)
Montana (49)
Colorado (48)Idaho (47)
Washington (46)
Utah (45)Oregon (44)
North Carolina (43)Hawaii (42)
South Carolina (41)
New Hampshire (40)California (39)
Vermont (38)
Virginia (37)Mississippi (36)
Maine (35)
Massachusetts (34)Rhode Island (33)
Kansas (32)Iowa (31)
Indiana (29)
Delaware (29)Arizona (28)
Texas (27)
Minnesota (26)Kentucky (24)
Maryland (24)
Alabama (23)New Mexico (22)
Wisconsin (21)Tennessee (20)
Georgia (19)
Missouri (18)Nebraska (17)
U.S. Average
Florida (16)Ohio (15)
Louisiana (14)
Pennsylvania (13)Illinois (12)
Oklahoma (11)Arkansas (10)
South Dakota (9)
West Virginia (8)Michigan (7)
Connecticut (6)
New York (5)Nevada (4)
New Jersey (3)
Wyoming (2)North Dakota (1)
Percent
State Median = 21.3%
Source: 2006 National GME Census Definitions: A resident is considered an IMG if they graduated from a medical school leading to the M.D. or related degree located outside of the United States, U.S. territories, and Canada. The distinction between an international medical school and a non-international medical school is based solely on the accrediting authority, rather than the geographic location of the school. The Liaison Committee on Medical Education (LCME) is the accrediting authority for medical education programs leading to the M.D. degree in U.S. and Canadian medical schools. Residents whose status in the ACGME program was “Matched, but not yet in the program” were excluded from this analysis. Similarly, if the state of the residency program or the degree type of the resident was unknown, the resident was excluded from this analysis. See Table 11 for detailed data.

Section 3: Graduate Medical Education 2007 State Physician Workforce Data Book
| 26 | Association of American Medical Colleges 2007
Table 11. Residents and Fellows in ACGME-Accredited Programs by Degree Type and International Status of School
U.S. M.D.’s in
ACGME Programs D.O.’s in ACGME
Programs IMGs in ACGME Programs
Total Residents/Fellows in ACGME-Accredited
Programs Number Percent Number Percent Number Percent Rank United States 106,464 70,785 66.5% 6,820 6.4% 28,859 27.1% N.R.
Alabama 1,228 924 75.2% 38 3.1% 266 21.7% 23 Alaska 31 27 87.1% 3 9.7% 1 3.2% 50 Arizona 1,230 810 65.9% 164 13.3% 256 20.8% 28 Arkansas 680 429 63.1% 29 4.3% 222 32.6% 10 California 9,371 7,625 81.4% 555 5.9% 1,191 12.7% 39 Colorado 1,145 976 85.2% 73 6.4% 96 8.4% 48 Connecticut 2,007 1,091 54.4% 128 6.4% 788 39.3% 6 Delaware 256 158 61.7% 48 18.8% 50 19.5% 29 District of Columbia 1,777 1,325 74.6% 66 3.7% 386 21.7% N.R. Florida 3,065 2,035 66.4% 171 5.6% 859 28.0% 16 Georgia 1,942 1,387 71.4% 87 4.5% 468 24.1% 19 Hawaii 423 321 75.9% 54 12.8% 48 11.3% 42 Idaho 46 33 71.7% 9 19.6% 4 8.7% 47 Illinois 5,870 3,626 61.8% 453 7.7% 1,791 30.5% 12 Indiana 1,304 972 74.5% 78 6.0% 254 19.5% 29 Iowa 798 519 65.0% 124 15.5% 155 19.4% 31 Kansas 694 493 71.0% 67 9.7% 134 19.3% 32 Kentucky 1,057 779 73.7% 50 4.7% 228 21.6% 24 Louisiana 1,546 1,062 68.7% 26 1.7% 458 29.6% 14 Maine 285 166 58.2% 68 23.9% 51 17.9% 35 Maryland 2,640 1,944 73.6% 126 4.8% 570 21.6% 24 Massachusetts 4,988 3,861 77.4% 184 3.7% 943 18.9% 34 Michigan 4,442 2,459 55.4% 264 5.9% 1,719 38.7% 7 Minnesota 2,124 1,592 75.0% 85 4.0% 447 21.0% 26 Mississippi 484 360 74.4% 39 8.1% 85 17.6% 36 Missouri 2,519 1,667 66.2% 224 8.9% 628 24.9% 18 Montana 20 18 90.0% 1 5.0% 1 5.0% 49 Nebraska 622 416 66.9% 45 7.2% 161 25.9% 17 Nevada 220 92 41.8% 25 11.4% 103 46.8% 4 New Hampshire 367 292 79.6% 29 7.9% 46 12.5% 40 New Jersey 2,688 866 32.2% 230 8.6% 1,592 59.2% 3 New Mexico 512 384 75.0% 15 2.9% 113 22.1% 22 New York 15,629 7,881 50.4% 788 5.0% 6,960 44.5% 5 North Carolina 2,810 2,420 86.1% 101 3.6% 289 10.3% 43 North Dakota 110 34 30.9% 6 5.5% 70 63.6% 1 Ohio 5,115 3,226 63.1% 402 7.9% 1,487 29.1% 15 Oklahoma 708 410 57.9% 71 10.0% 227 32.1% 11 Oregon 765 652 85.2% 36 4.7% 77 10.1% 44 Pennsylvania 7,226 4,317 59.7% 738 10.2% 2,171 30.0% 13 Rhode Island 741 571 77.1% 29 3.9% 141 19.0% 33 South Carolina 1,015 842 83.0% 52 5.1% 121 11.9% 41 South Dakota 107 52 48.6% 18 16.8% 37 34.6% 9 Tennessee 2,034 1,491 73.3% 66 3.2% 477 23.5% 20 Texas 6,741 4,856 72.0% 476 7.1% 1,409 20.9% 27 Utah 658 558 84.8% 34 5.2% 66 10.0% 45 Vermont 261 222 85.1% 2 0.8% 37 14.2% 38 Virginia 2,193 1,673 76.3% 159 7.3% 361 16.5% 37 Washington 1,638 1,374 83.9% 105 6.4% 159 9.7% 46 West Virginia 639 323 50.5% 70 11.0% 246 38.5% 8 Wisconsin 1,652 1,166 70.6% 102 6.2% 384 23.2% 21 Wyoming 41 8 19.5% 7 17.1% 26 63.4% 2
Sources: July 1, 2006 Population Estimates, U.S. Census Bureau. Physicians in ACGME-accredited programs are from the 2006 National GME Census. N.R. = Not Ranked

Section 3: Graduate Medical Education 2007 State Physician Workforce Data Book
| 27 | Association of American Medical Colleges 2007
Figure 12. Percent Change in Number of Residents/Fellows in ACGME-Accredited Programs from 1997-2006
-20 -10 0 10 20 30 40 50
North Dakota (50)
Louisiana (49)
Wyoming (48)Hawaii (47)
Kansas (46)
Iowa (45)Mississippi (43)
Kentucky (43)South Dakota (42)
Minnesota (41)
Michigan (40)Oklahoma (38)
Virginia (38)
Maryland (37)West Virginia (36)
New York (33)
Illinois (33)Georgia (33)
Indiana (32)Delaware (31)
New Jersey (30)
Ohio (29)South Carolina (28)
U.S. Average
Wisconsin (27)California (25)
Rhode Island (25)
Missouri (24)Arkansas (23)
Tennessee (22)
Pennsylvania (21)Texas (20)
Maine (19)Connecticut (18)
Washington (17)
Idaho (16)Vermont (15)
Florida (14)
New Mexico (13)North Carolina (12)
Alabama (11)
Nebraska (10)Colorado (9)
Massachusetts (8)
Arizona (7)Oregon (6)
Nevada (5)Utah (4)
New Hampshire (3)
Montana (2)Alaska (1)
Percent
State Median = 7.8%
Alaska = 287.5%
Montana = 90%
Source: Graduate Medical Education, Appendix II, Table 2. JAMA, September 2, 1998—Vol 280, No. 9.
Graduate Medical Education, Appendix II, Table 4. JAMA, September 5, 2007—Vol 298, No. 9. See Table 12 for detailed data.

Section 3: Graduate Medical Education 2007 State Physician Workforce Data Book
| 28 | Association of American Medical Colleges 2007
Table 12. Percent Change in Number of Residents/Fellows in ACGME-Accredited Programs from 1997-2006 Total Residents/Fellows in ACGME-Accredited Programs 1997 2006 Percent Change Rank United States 97,311 104,227 7.1% N.R.
Alabama 1,050 1,214 15.6% 11 Alaska 8 31 287.5% 1 Arizona 1,032 1,223 18.5% 7 Arkansas 620 676 9.0% 23 California 8,431 9,088 7.8% 25 Colorado 960 1,121 16.8% 9 Connecticut 1,801 1,993 10.7% 18 Delaware 222 232 4.5% 31 District of Columbia 1,902 1,816 -4.5% N.R. Florida 2,646 3,028 14.4% 14 Georgia 1,852 1,930 4.2% 33 Hawaii 432 417 -3.5% 47 Idaho 41 46 12.2% 16 Illinois 5,549 5,781 4.2% 33 Indiana 1,228 1,281 4.3% 32 Iowa 774 768 -0.8% 45 Kansas 694 671 -3.3% 46 Kentucky 982 991 0.9% 43 Louisiana 1,709 1,494 -12.6% 49 Maine 250 276 10.4% 19 Maryland 2,286 2,364 3.4% 37 Massachusetts 4,264 4,998 17.2% 8 Michigan 4,185 4,300 2.7% 40 Minnesota 2,045 2,086 2.0% 41 Mississippi 461 465 0.9% 43 Missouri 2,282 2,473 8.4% 24 Montana 10 19 90.0% 2 Nebraska 523 609 16.4% 10 Nevada 169 207 22.5% 5 New Hampshire 264 364 37.9% 3 New Jersey 2,507 2,636 5.1% 30 New Mexico 434 498 14.7% 13 New York 14,841 15,458 4.2% 33 North Carolina 2,393 2,759 15.3% 12 North Dakota 126 106 -15.9% 50 Ohio 4,725 5,017 6.2% 29 Oklahoma 666 685 2.9% 38 Oregon 626 760 21.4% 6 Pennsylvania 6,484 7,110 9.7% 21 Rhode Island 678 731 7.8% 25 South Carolina 942 1,004 6.6% 28 South Dakota 104 106 1.9% 42 Tennessee 1,830 1,997 9.1% 22 Texas 6,025 6,633 10.1% 20 Utah 522 647 23.9% 4 Vermont 226 258 14.2% 15 Virginia 1,889 1,944 2.9% 38 Washington 1,458 1,626 11.5% 17 West Virginia 601 622 3.5% 36 Wisconsin 1,520 1,629 7.2% 27 Wyoming 42 39 -7.1% 48
Sources: Journal of the American Medical Association (JAMA), September 2, 1998 - Vol. 280, No. 9. Appendix II, Table 2 Journal of the American Medical Association (JAMA), September 5, 2007 - Vol. 298, No. 9. Appendix II, Table 4 N.R. = Not Ranked
Section 4: Retention 2007 State Physician Workforce Data Book
| 29 | Association of American Medical Colleges 2007
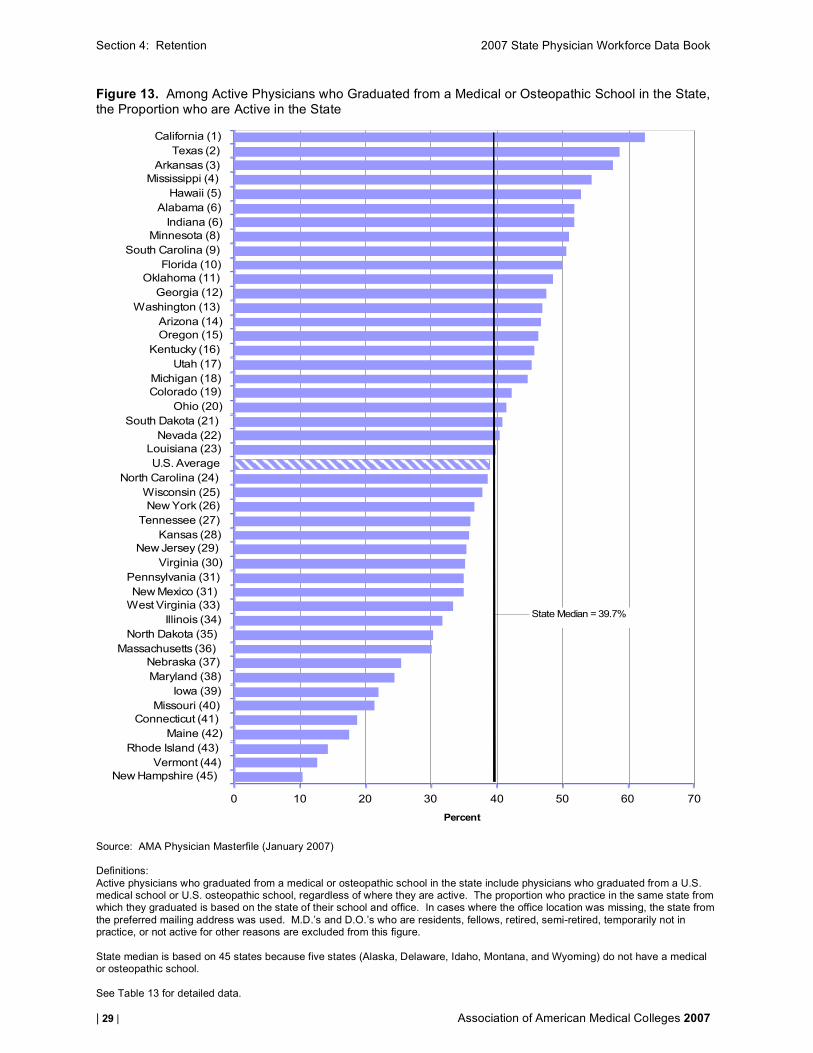
Figure 13. Among Active Physicians who Graduated from a Medical or Osteopathic School in the State, the Proportion who are Active in the State
0 10 20 30 40 50 60 70
New Hampshire (45)
Vermont (44)
Rhode Island (43)
Maine (42)
Connecticut (41)
Missouri (40)
Iowa (39)
Maryland (38)
Nebraska (37)
Massachusetts (36)
North Dakota (35)
Illinois (34)
West Virginia (33)
New Mexico (31)
Pennsylvania (31)
Virginia (30)
New Jersey (29)
Kansas (28)
Tennessee (27)
New York (26)
Wisconsin (25)
North Carolina (24)
U.S. Average
Louisiana (23)
Nevada (22)
South Dakota (21)
Ohio (20)
Colorado (19)
Michigan (18)
Utah (17)
Kentucky (16)
Oregon (15)
Arizona (14)
Washington (13)
Georgia (12)
Oklahoma (11)
Florida (10)
South Carolina (9)
Minnesota (8)
Indiana (6)
Alabama (6)
Hawaii (5)
Mississippi (4)
Arkansas (3)
Texas (2)
California (1)
Percent
State Median = 39.7%
Source: AMA Physician Masterfile (January 2007) Definitions: Active physicians who graduated from a medical or osteopathic school in the state include physicians who graduated from a U.S. medical school or U.S. osteopathic school, regardless of where they are active. The proportion who practice in the same state from which they graduated is based on the state of their school and office. In cases where the office location was missing, the state from the preferred mailing address was used. M.D.’s and D.O.’s who are residents, fellows, retired, semi-retired, temporarily not in practice, or not active for other reasons are excluded from this figure. State median is based on 45 states because five states (Alaska, Delaware, Idaho, Montana, and Wyoming) do not have a medical or osteopathic school. See Table 13 for detailed data.

Section 4: Retention 2007 State Physician Workforce Data Book
| 30 | Association of American Medical Colleges 2007
Table 13. Active Physicians who Graduated from a Medical or Osteopathic School in the State and are Active in the State
Active Physicians Who Graduated from a Medical or
Osteopathic School in the State and are Active in the State
Active Physicians Who Graduated from a Medical or
Osteopathic School in the State Number Percent Rank United States 553,602 214,916 38.8% N.R.
Alabama 6,531 3,381 51.8% 6 Alaska --- --- --- --- Arizona 2,762 1,290 46.7% 14 Arkansas 4,420 2,543 57.5% 3 California 35,139 21,912 62.4% 1 Colorado 4,392 1,850 42.1% 19 Connecticut 5,912 1,108 18.7% 41 Delaware --- --- --- --- District of Columbia 15,721 1,024 6.5% N.R. Florida 12,729 6,354 49.9% 10 Georgia 10,743 5,107 47.5% 12 Hawaii 1,557 822 52.8% 5 Idaho --- --- --- --- Illinois 38,536 12,181 31.6% 34 Indiana 9,457 4,895 51.8% 6 Iowa 11,473 2,523 22.0% 39 Kansas 6,019 2,154 35.8% 28 Kentucky 7,822 3,572 45.7% 16 Louisiana 13,983 5,553 39.7% 23 Maine 1,520 264 17.4% 42 Maryland 13,091 3,173 24.2% 38 Massachusetts 19,632 5,910 30.1% 36 Michigan 21,471 9,588 44.7% 18 Minnesota 9,662 4,926 51.0% 8 Mississippi 3,739 2,033 54.4% 4 Missouri 25,257 5,356 21.2% 40 Montana --- --- --- --- Nebraska 8,464 2,138 25.3% 37 Nevada 1,031 415 40.3% 22 New Hampshire 1,734 178 10.3% 45 New Jersey 9,198 3,251 35.3% 29 New Mexico 2,020 703 34.8% 31 New York 63,458 23,164 36.5% 26 North Carolina 13,344 5,149 38.6% 24 North Dakota 1,261 382 30.3% 35 Ohio 26,743 11,035 41.3% 20 Oklahoma 6,858 3,323 48.5% 11 Oregon 3,558 1,645 46.2% 15 Pennsylvania 39,033 13,596 34.8% 31 Rhode Island 1,801 256 14.2% 43 South Carolina 5,980 3,014 50.4% 9 South Dakota 1,185 482 40.7% 21 Tennessee 13,779 4,946 35.9% 27 Texas 33,071 19,370 58.6% 2 Utah 3,311 1,497 45.2% 17 Vermont 2,994 377 12.6% 44 Virginia 12,054 4,234 35.1% 30 Washington 5,276 2,469 46.8% 13 West Virginia 4,964 1,650 33.2% 33 Wisconsin 10,917 4,123 37.8% 25 Wyoming --- --- --- ---
Source: AMA Physician Masterfile (January 2007) N.R. = Not Ranked --- Indicates that the data are not applicable. Some states do not have a medical or osteopathic school.

Section 4: Retention 2007 State Physician Workforce Data Book
| 31 | Association of American Medical Colleges 2007
Figure 14. Among Active Physicians who Graduated from a Public Medical or Osteopathic School in the State, the Proportion who are Active in the State
0 10 20 30 40 50 60 70 80
Vermont (42)
Maryland (41)
North Dakota (40)
Iowa (39)
Connecticut (38)
West Virginia (37)
New Mexico (36)
Virginia (35)
New Jersey (34)
Kansas (33)
Nebraska (32)
Pennsylvania (31)
Missouri (30)
Nevada (29)
South Dakota (28)
Illinois (27)
New York (25)
Colorado (25)
Wisconsin (24)
Ohio (23)
Michigan (22)
Utah (21)
Kentucky (20)
Oregon (19)
Washington (18)
U.S. Average
Oklahoma (17)
Arizona (16)
North Carolina (15)
South Carolina (14)
Tennessee (13)
Florida (12)
Indiana (10)
Alabama (10)
Massachusetts (9)
Minnesota (8)
Hawaii (7)
Georgia (6)
Mississippi (5)
Louisiana (4)
Arkansas (3)
Texas (2)
California (1)
Percent
State Median = 45.2%
Source: AMA Physician Masterfile (January 2007) Definitions: Active physicians who graduated from a public medical or osteopathic school in the state include physicians who graduated from a public U.S. medical school or U.S. osteopathic school, regardless of where they are active. The proportion who practice in the same state from which they graduated is based on the state of their school and office. In cases where the office location was missing, the state from the preferred mailing address was used. M.D.’s and D.O.’s who are residents, fellows, retired, semi-retired, temporarily not in practice, or not active for other reasons are excluded from this figure. State median is based on 42 states because eight states (Alaska, Delaware, Idaho, Maine, Montana, New Hampshire, Rhode Island, and Wyoming) do not have a public medical or osteopathic school. See Table 14 for detailed data.

Section 4: Retention 2007 State Physician Workforce Data Book
| 32 | Association of American Medical Colleges 2007
Table 14. Active Physicians who Graduated from a Public Medical or Osteopathic School in the State and are Active in the State
Active Physicians Who Graduated from a Public Medical or
Osteopathic School in State and are Active in State
Total Active Physicians Who Graduated from a Public Medical or Osteopathic
School in State Number Percent Rank United States 304,654 143,196 47.0% N.R.
Alabama 6,531 3,381 51.8% 10 Alaska --- --- --- --- Arizona 2,488 1,225 49.2% 16 Arkansas 4,420 2,543 57.5% 3 California 19,707 13,308 67.5% 1 Colorado 4,392 1,850 42.1% 25 Connecticut 2,173 713 32.8% 38 Delaware --- --- --- --- District of Columbia --- --- --- --- Florida 5,679 2,929 51.6% 12 Georgia 5,735 3,035 52.9% 6 Hawaii 1,557 822 52.8% 7 Idaho --- --- --- --- Illinois 11,952 4,982 41.7% 27 Indiana 9,457 4,895 51.8% 10 Iowa 5,828 1,810 31.1% 39 Kansas 6,019 2,154 35.8% 33 Kentucky 7,671 3,510 45.8% 20 Louisiana 8,348 4,587 54.9% 4 Maine --- --- --- --- Maryland 8,774 2,493 28.4% 41 Massachusetts 2,395 1,248 52.1% 9 Michigan 21,471 9,588 44.7% 22 Minnesota 8,668 4,555 52.5% 8 Mississippi 3,739 2,033 54.4% 5 Missouri 5,694 2,275 40.0% 30 Montana --- --- --- --- Nebraska 4,566 1,708 37.4% 32 Nevada 1,031 415 40.3% 29 New Hampshire --- --- --- --- New Jersey 9,198 3,251 35.3% 34 New Mexico 2,020 703 34.8% 36 New York 20,351 8,562 42.1% 25 North Carolina 6,087 3,002 49.3% 15 North Dakota 1,261 382 30.3% 40 Ohio 21,778 9,639 44.3% 23 Oklahoma 6,858 3,323 48.5% 17 Oregon 3,558 1,645 46.2% 19 Pennsylvania 2,668 1,058 39.7% 31 Rhode Island --- --- --- --- South Carolina 5,980 3,014 50.4% 14 South Dakota 1,185 482 40.7% 28 Tennessee 7,622 3,901 51.2% 13 Texas 27,636 16,979 61.4% 2 Utah 3,311 1,497 45.2% 21 Vermont 2,994 377 12.6% 42 Virginia 9,967 3,500 35.1% 35 Washington 5,263 2,459 46.7% 18 West Virginia 3,591 1,220 34.0% 37 Wisconsin 5,031 2,143 42.6% 24 Wyoming --- --- --- ---
Source: AMA Physician Masterfile (January 2007) N.R. = Not Ranked --- Indicates that the data are not applicable. Some states do not have a public medical or osteopathic school.

Section 4: Retention 2007 State Physician Workforce Data Book
| 33 | Association of American Medical Colleges 2007
Figure 15. Among Active Physicians who Completed Graduate Medical Education (GME) in the State, the Proportion who are Active in the State
0 10 20 30 40 50 60 70 80
New Hampshire (50)
Wyoming (49)Vermont (48)
Delaware (47)
Rhode Island (46)Iowa (45)
Connecticut (44)Missouri (43)
Kansas (42)Hawaii (41)
Maryland (40)
Virginia (39)West Virginia (38)
New Mexico (37)North Carolina (36)
North Dakota (34)
Utah (34)Pennsylvania (33)
Nebraska (32)Minnesota (31)
South Dakota (30)Massachusetts (29)
Ohio (28)
Tennessee (27)Colorado (26)
Kentucky (25)South Carolina (24)
Michigan (23)
Louisiana (22)New York (21)
New Jersey (20)Wisconsin (19)
U.S. Average
Arizona (18)Washington (17)
Illinois (16)Alabama (15)
Georgia (14)Mississippi (13)
Oklahoma (11)
Maine (11)Oregon (10)
Montana (9)Idaho (8)
Texas (7)
Indiana (6)Arkansas (5)
Florida (4)Nevada (3)
California (2)Alaska (1)
Percent
State Median = 45.0%
Source: AMA Physician Masterfile (January 2007) Definitions: Active physicians who completed their graduate medical education (GME) in the state include physicians who graduated from a U.S. medical school, U.S. osteopathic school, or an international medical school and completed their graduate medical education in an ACGME-accredited GME program regardless of where they are active. The proportion who practice in the same state as their GME is based on the state of their school, GME program, and office. In cases where the office location was missing, the state from the preferred mailing address was used. M.D.’s and D.O.’s who are residents, fellows, retired, semi-retired, temporarily not in practice, or not active for other reasons are excluded from this figure. See Table 15 for detailed data.

Section 4: Retention 2007 State Physician Workforce Data Book
| 34 | Association of American Medical Colleges 2007
Table 15. Active Physicians who Completed Graduate Medical Education (GME) in the State and are Active in the State
Active Physicians Who Completed GME in State
and are Active in State
Total Active Physicians Who Completed GME in State Number Percent Rank
United States 708,403 334,640 47.2% N.R. Alabama 7,244 3,551 49.0% 15 Alaska 53 37 69.8% 1 Arizona 6,810 3,230 47.4% 18 Arkansas 3910 2289 58.5% 5 California 71939 49054 68.2% 2 Colorado 9,063 4,059 44.8% 26 Connecticut 12,643 4,422 35.0% 44 Delaware 1,443 443 30.7% 47 District of Columbia 15,455 2,263 14.6% N.R. Florida 19375 11425 59.0% 4 Georgia 12,712 6,236 49.1% 14 Hawaii 2,844 1,066 37.5% 41 Idaho 257 142 55.3% 8 Illinois 38,868 18,940 48.7% 16 Indiana 8975 5131 57.2% 6 Iowa 6,145 2,128 34.6% 45 Kansas 5,391 2,005 37.2% 42 Kentucky 6,962 3,144 45.2% 25 Louisiana 11,883 5,455 45.9% 22 Maine 1,608 819 50.9% 11 Maryland 18,360 6,897 37.6% 40 Massachusetts 32,055 14,003 43.7% 29 Michigan 30,790 14,081 45.7% 23 Minnesota 16,445 7,119 43.3% 31 Mississippi 3,092 1,520 49.2% 13 Missouri 16,610 6,012 36.2% 43 Montana 54 29 53.7% 9 Nebraska 3,710 1,572 42.4% 32 Nevada 716 423 59.1% 3 New Hampshire 1,568 387 24.7% 50 New Jersey 17,133 8,035 46.9% 20 New Mexico 2,701 1,043 38.6% 37 New York 104,806 48,647 46.4% 21 North Carolina 15,836 6,544 41.3% 36 North Dakota 756 315 41.7% 34 Ohio 35,257 15,621 44.3% 28 Oklahoma 5,256 2,675 50.9% 11 Oregon 4,887 2,513 51.4% 10 Pennsylvania 46,738 19,655 42.1% 33 Rhode Island 3,793 1,220 32.2% 46 South Carolina 6,655 3,031 45.5% 24 South Dakota 626 272 43.5% 30 Tennessee 12,455 5,536 44.4% 27 Texas 40,542 22,875 56.4% 7 Utah 4,046 1,687 41.7% 34 Vermont 1,525 440 28.9% 48 Virginia 13,348 5,070 38.0% 39 Washington 10,206 4,949 48.5% 17 West Virginia 3,602 1,376 38.2% 38 Wisconsin 10,946 5,166 47.2% 19 Wyoming 309 88 28.5% 49
Source: AMA Physician Masterfile (January 2007) N.R. = Not Ranked

Section 4: Retention 2007 State Physician Workforce Data Book
| 35 | Association of American Medical Colleges 2007
Figure 16. Among Active Physicians who Graduated from a Medical or Osteopathic School in the State and Completed Graduate Medical Education (GME) in the State, the Proportion who are Active in the State
0 10 20 30 40 50 60 70 80 90
New Hampshire (45)
Vermont (44)
Connecticut (43)
Rhode Island (42)
Maryland (41)
Missouri (40)
Kansas (38)
Nebraska (38)
Massachusetts (37)
New York (36)
Pennsylvania (35)
Iowa (34)
New Mexico (33)
North Dakota (32)
Illinois (31)
West Virginia (30)
New Jersey (29)
Virginia (28)
Tennessee (27)
North Carolina (26)
U.S. Average
Louisiana (25)
Michigan (24)
Ohio (23)
Wisconsin (22)
Utah (21)
Oregon (20)
Colorado (19)
Minnesota (18)
Washington (17)
Georgia (16)
Kentucky (14)
Oklahoma (14)
Maine (13)
Arizona (12)
Alabama (11)
Indiana (10)
Mississippi (9)
South Carolina (8)
Florida (7)
California (6)
Texas (5)
Nevada (4)
Arkansas (3)
South Dakota (2)
Hawaii (1)
Percent
State Median =
67.3%
Source: AMA Physician Masterfile (January 2007) Definitions: Active physicians who graduated from a medical or osteopathic school in the state and completed their graduate medical education (GME) in the state include physicians who graduated from a U.S. medical school or U.S. osteopathic school and completed their graduate medical education in an ACGME-accredited GME program in the same state as their medical or osteopathic school, regardless of where they are active. The proportion who practice in the same state from which they graduated and completed their GME is based on the state of their school, GME program, and office. In cases where the office location was missing, the state from the preferred mailing address was used. M.D.’s and D.O.’s who are residents, fellows, retired, semi-retired, temporarily not in practice, or not active for other reasons are excluded from this figure. State median is based on 45 states because five states (Alaska, Delaware, Idaho, Montana, and Wyoming) do not have a medical or osteopathic school. See Table 16 for detaile data.
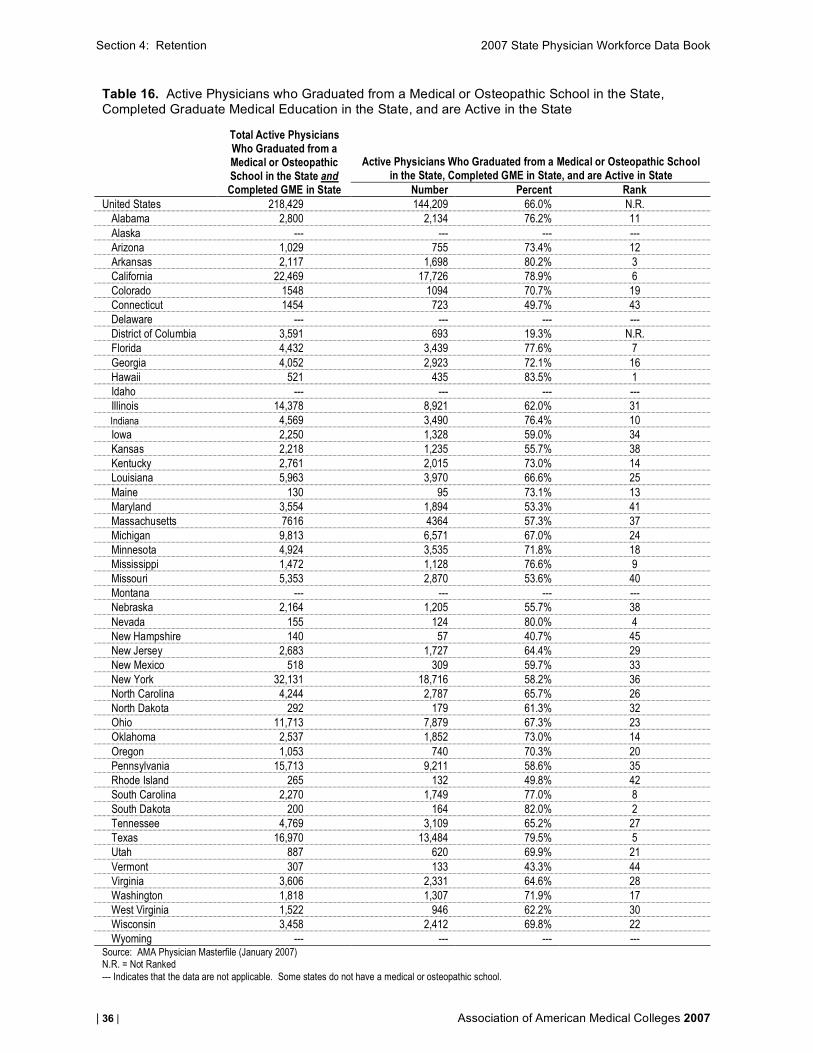
Section 4: Retention 2007 State Physician Workforce Data Book
| 36 | Association of American Medical Colleges 2007
Table 16. Active Physicians who Graduated from a Medical or Osteopathic School in the State, Completed Graduate Medical Education in the State, and are Active in the State
Active Physicians Who Graduated from a Medical or Osteopathic School
in the State, Completed GME in State, and are Active in State
Total Active Physicians Who Graduated from a Medical or Osteopathic School in the State and Completed GME in State Number Percent Rank
United States 218,429 144,209 66.0% N.R. Alabama 2,800 2,134 76.2% 11 Alaska --- --- --- --- Arizona 1,029 755 73.4% 12 Arkansas 2,117 1,698 80.2% 3 California 22,469 17,726 78.9% 6 Colorado 1548 1094 70.7% 19 Connecticut 1454 723 49.7% 43 Delaware --- --- --- --- District of Columbia 3,591 693 19.3% N.R. Florida 4,432 3,439 77.6% 7 Georgia 4,052 2,923 72.1% 16 Hawaii 521 435 83.5% 1 Idaho --- --- --- --- Illinois 14,378 8,921 62.0% 31 Indiana 4,569 3,490 76.4% 10 Iowa 2,250 1,328 59.0% 34 Kansas 2,218 1,235 55.7% 38 Kentucky 2,761 2,015 73.0% 14 Louisiana 5,963 3,970 66.6% 25 Maine 130 95 73.1% 13 Maryland 3,554 1,894 53.3% 41 Massachusetts 7616 4364 57.3% 37 Michigan 9,813 6,571 67.0% 24 Minnesota 4,924 3,535 71.8% 18 Mississippi 1,472 1,128 76.6% 9 Missouri 5,353 2,870 53.6% 40 Montana --- --- --- --- Nebraska 2,164 1,205 55.7% 38 Nevada 155 124 80.0% 4 New Hampshire 140 57 40.7% 45 New Jersey 2,683 1,727 64.4% 29 New Mexico 518 309 59.7% 33 New York 32,131 18,716 58.2% 36 North Carolina 4,244 2,787 65.7% 26 North Dakota 292 179 61.3% 32 Ohio 11,713 7,879 67.3% 23 Oklahoma 2,537 1,852 73.0% 14 Oregon 1,053 740 70.3% 20 Pennsylvania 15,713 9,211 58.6% 35 Rhode Island 265 132 49.8% 42 South Carolina 2,270 1,749 77.0% 8 South Dakota 200 164 82.0% 2 Tennessee 4,769 3,109 65.2% 27 Texas 16,970 13,484 79.5% 5 Utah 887 620 69.9% 21 Vermont 307 133 43.3% 44 Virginia 3,606 2,331 64.6% 28 Washington 1,818 1,307 71.9% 17 West Virginia 1,522 946 62.2% 30 Wisconsin 3,458 2,412 69.8% 22 Wyoming --- --- --- ---
Source: AMA Physician Masterfile (January 2007) N.R. = Not Ranked --- Indicates that the data are not applicable. Some states do not have a medical or osteopathic school.