2007 Realizing the Potential Web
202
Reconnecting America’s Center for Transit-Oriented Development April 2007 Realizing the Potential: Expanding Housing Opportunities Near Transit
Transcript of 2007 Realizing the Potential Web
Reconnecting America’s Center for Transit-Oriented Development
April 2007
Realizing the Potential: Expanding Housing Opportunities Near Transit
About this ReportREALIZING THE POTENTIAL: Expanding Housing Opportunities Near Transit was written by Reconnecting America’s Center for Transit-Oriented Development. The Center for TOD is the only national nonprofit effort dedicated to providing best practices, research and tools to support market-based transit-oriented development. We partner with both the public and private sectors to strategize about ways to encourage the development of high-performing TOD projects around transit stations and to build transit systems that maximize the development potential. The Center for TOD is a partnership of the national nonprofit Reconnecting America, the Center for Neighborhood Technology, and Strategic Economics, an urban economics firm in Berkeley.
To read the full report -- including detailed case studies of efforts to promote mixed-income TOD in Boston, Charlotte, Denver, Minneapolis and Portland – visit www.reconnectingamerica.org.
AcknowledgementsThe Center for Transit-Oriented Development would like to thank the U.S. Department of Housing and Urban Development (HUD) and the Federal Transit Administration (FTA), U.S. Department of Transportation, for their financial and technical support.
NoticeThis report was funded through a cooperative agreement between Reconnecting America and the Federal Transit Administration (FTA), U.S. Department of Transportation, and jointly funded through an interagency agreement between FTA and the U.S. Department of Housing and Urban Development (HUD). The views and policies expressed herein do not necessarily represent the views or policies of the US Department of Housing and Urban Development or the Federal Transit Administration. The United States government assumes no liability for the contents or use of this report.
i
ii
Contents
About this Report ……………………………………………………………………… iiAcknowledgements ………………………………………………………….….ii
Executive Summary……………………………………………………………………..v
Chapter One: Realizing Housing and Transportation’s Important Interconnections……1
Chapter Two: Location Matters to the Cost of Living ……………………………….....6
Chapter Three: Overview of Selected Case Study Regions …………………………..15
Chapter Four: Boston’s Fairmount/Indigo Line Commuter Rail Corridor……….........30
Chapter Five: Charlotte’s South Corridor ……………………………………………..63
Chapter Six: Denver’s West Corridor ………………………………............................89
Chapter Seven: Twin Cities’ Hiawatha Corridor ……………………………….........111
Chapter Eight: Portland’s Streetcar Corridor................................................................136
Chapter Nine: Putting It into Practice – Lessons from the Five Case Studies ……….161
Chapter Ten: Recommendations ……………………………………………………..173
Appendix A: General Transit-Oriented Development and Affordable Housing Policiesand Funding ………………………………………………………………………….184
Appendix B: Methodology Discussion ……………………………………………....187
Glossary ……………………………………………………………………………...189
iii
Executive Summary
The housing market in the U.S. has been changing as American households get older,smaller and more diverse in terms of size, age and ethnicity, and traffic makes longcommutes to the suburbs less and less appealing. Meantime, both housing andtransportation costs are on the increase. One in three American households now spendmore than 30 percent of income on housing, and one in seven households spend morethan 50 percent. While finding a cheaper house in the suburbs used to be a strategy thatresulted in savings, rising transportation costs are straining the ability of households toachieve affordable cost of living strategies.
These trends are happening concurrent with a resurgence of interest in publictransportation: The American Public Transportation Association says transit ridership isup 25 percent since 1995. Meantime there has been a transit building boom across thecountry, with more than 700 new stations under development for a total of more than4,000 stations. Add to this the fact that urban neighborhoods, especially downtowns, havebeen recognized as an important new market for infill housing and mixed-usedevelopment. The result is an opportunity unprecedented in recent history for making itpossible for families to reduce household expenditures by choosing to live inneighborhoods with lower transportation costs because they are located near transit.
Location matters a great deal. While the average family spends roughly 19 percent of thehousehold budget on transportation, households with good access to transit spend just 9percent. This savings can be critical for lower-income households that need to makeevery dollar count because transportation costs as a percentage of the total householdbudget varies greatly according to income: Transportation costs consume an average of 9percent of the household budget for high-income families, but for very-low-incomefamilies transportation costs can consume 55 percent or more of the budget.
But as the market for transit-oriented development heats up and these neighborhoodsprove popular with renters and buyers, there is an increasing need and challenge to ensurethat development includes housing for all income levels. This is due in part to the factthat cities and transit agencies have a limited understanding of the importance ofdevelopment near stations. Few tools exist to specifically direct affordable housing toneighborhoods with transit service. Existing planning and zoning often limits thedevelopment potential of station areas. Moreover, there isn’t much available land ormany ready-to-go development sites. The result is that this kind of infill development istime-consuming and expensive to build, which often forces developers to build to thehigh end of the housing market.
Obstacles to building mixed-income TOD housing• Land prices around stations are high or increase because of speculation once a
new transit line is announced.
iv
• Affordable housing developers don’t have the capital to acquire land before theprices go up and then hold it until it’s ready to develop.
• Funding for building new affordable housing is limited.• Mixed-income and mixed-use projects require complex financing structures.• Sites for TOD projects often require land assembly and rezoning, which can lead
to lengthy acquisition and permitting processes, which increase developmentcosts.
• Parking requirements for TOD are unnecessarily high, which also drives up costs.• Community opposition to density and affordable housing is hard to overcome.
One way to ease these pressures and keep rents and home prices down is to grow theoverall supply of transit-oriented development. If more mixed-income housing is builtnear transit, gentrification pressures in highly desirable neighborhoods could lessen.Otherwise this will be an enormous missed opportunity to use the market to help addressthe nation’s growing affordability crisis by tackling the escalating cost of both housingand transportation at the same time. This strategy provides the additional benefit ofaddressing the problem of traffic congestion, and expanding access to jobs, educationalopportunities and prosperity.
In order to better understand how these opportunities and challenges are playing out indifferent regions, and the effectiveness of strategies to ensure there is mixed-incomehousing near transit, this report examines five case study regions: Boston, Charlotte,Denver, Portland and the Twin Cities. Advancing the state of the practice of linkingmixed-income housing to transit investments requires greater creativity and commitmentby all levels of government. The funding strategies and tools that have been developed inthe case study regions, and the leadership that has emerged, is encouraging. But there isso much potential demand for housing near transit, and so few developable sites, thatcities and regions need to be proactive in order to accommodate income diversity inTOD. This will help ensure that as this country moves through the ups and downs of realestate market cycles people of diverse incomes will be able to take advantage of thepublic investment in transit
Proactive Strategies for Mixed-Income Housing near TransitThe five case studies demonstrate that while there are challenges to providing mixed-income housing near transit, proactive strategies can serve as a catalyst for the marketand help ensure that housing near transit serves a mix of incomes. These strategies can bebroadly characterized into five categories of action:
A. Identify and utilize TOD opportunities in the region and along transit corridors.• Target a significant percentage of regional growth into transit corridors.• Assess the potential for TOD and the station areas where displacement of existing
low-income residents could occur.• Utilize publicly-owned properties along transit corridors for mixed-income
housing.
v
B. Provide incentives that help catalyze the market for mixed-income TOD.• Create incentives for local jurisdictions to build at transit-appropriate densities.• Facilitate the use of value capture tools for affordable housing and TOD.• Create TOD land acquisition/land banking funds.• Modify low-income housing tax credits to offer greater incentives for locating
near transit.
C. Remove regulatory barriers to higher density, mixed-use development.• Removing barriers, such as outdated zoning, parking requirements, or building
codes helps reduce the cost of TOD.• Encourage proactive station area planning and zoning to support increased
intensity and mix of uses that help to achieve the community vision.
D. Coordinate housing and transportation plans and investments.• Coordinate long-range housing and transportation plans.• Target funding to support the creation and preservation of affordable housing in
transit corridors.
E. Improve local technical capacity, partnerships and data collection.• Create the capacity within housing and transportation agencies to facilitate TOD.• Utilize FTA’s Joint Development policy to emphasize construction of housing in
transit zones.• Monitor and track data on development activity, demographic trends and property
values at both the corridor and station area levels.• Encourage public-private partnerships.
In addition, there are three primary areas for further action specific to the Federalgovernment:
• HUD and FTA will examine existing policy and funding programs at each agencyin order to improve the coordination and facilitation of affordable housing andtransportation investments.
• HUD and FTA will establish an interagency working group that is responsible forcontinuing collaboration between the two agencies to maximize the opportunitiesfor coordinated HUD and FTA actions. A primary function of this group will beto develop a five-year research and action plan to support these collaborativeefforts.
• HUD and FTA will continue to study the relationships between housing marketsand transit investments: This study is the first in many years to examine thelinkages between the market, transit investments, travel patterns and developmenttrends. More analysis is needed to establish performance measures and determinethe efficacy of strategies being implemented in communities that are creatingmixed-income housing near transit
1
Chapter 1: Realizing Housing and Transportation’sImportant Inter-Connections
Increasing housing costs are challenging many American households. According tothe U.S. Census Bureau, the burden of housing costs in nearly every part of thecountry grew sharply between 2000 and 2005.1 Affordability pressures in a growingnumber of large U.S. metro areas are exceeding household incomes by a factor offour or more.2
The generally accepted definition of affordability is for a household to pay no morethan 30 percent of its annual income on housing. Families who pay more than 30percent of their income for housing are considered cost burdened and may havedifficulty affording necessities such as food, clothing, transportation and medicalcare. An estimated 12 million renter and homeowner households now pay more then50 percent of their annual incomes for housing, and a family with one full-timeworker earning the minimum wage cannot afford the local fair-market rent for a two-bedroom apartment anywhere in the United States.3
Next to housing, transportation is the second highest household cost, comprising almost20 percent of annual household expenditures. Households who use transit more, tend tohave lower overall transportation costs.4 Increased access to transit, frustration overgrowing traffic congestion, and rising transportation costs are helping to increase transitridership nationally. More than 9.7 billion trips were made by public transportation in2005. Since 1995, public transportation use has increased 25 percent. There are 3,349mass transit stations in the U.S. today, and many regions from coast to coast are buildingor planning to build new rail systems or expand existing systems. Over 700 new stationsare currently under development.5
Accompanying the increase in transit ridership is a growing desire for housing near transitthat has spurred a new real estate trend - transit-oriented development (TOD). A 2004survey by the National Association of Realtors reported that 60 percent of potentialhomebuyers would prefer to live in more mixed-use, walkable neighborhoods.6 TOD ismore than simply a project next to a transit station – it includes the whole districtsurrounding the station, which may be comprised of several distinct components and amix of uses, the streetscape and walking environment, and integrated design, land use andactivity that support transportation choice.
1 US Census Bureau, 2005 American Community Survey, Selected Characteristics.2 Joint Center for Housing Studies, The State of the Nation’s Housing 2006. Harvard Joint Center forHousing: 2006.3 U.S. Department of Housing and Urban Development, Homes and Communities Web site:http://www.hud.gov/offices/cpd/affordablehousing/index.cfm4 Scott Bernstein, Carrie Makarewicz and Kevin McCarty, “Driven to Spend: Pumping Dollars out ofour Households and Communities”, Center for Neighborhood Technology and the SurfaceTransportation Policy Project, 20055 American Public Transportation Association, 2005 Public Transportation Fact Book.6 National Association of Realtors. 2004 American Community Survey: National Survey onCommunities. Smart Growth America: Washington, DC, October 2004.
2
Transit-oriented development fosters greater use of a transit system by supportinghousing and/or commercial development within walking distance of transit stations,offering a diversity of land uses and pedestrian-oriented design. Where suchdevelopment has occurred, residents use transit five times as often as those who drive tothe station and non-auto mode shares are substantially higher than in neighborhoodswhere every trip must be made by car.7
Demand for Housing near Transit Comes from All IncomeLevelsRoughly six million American households currently live within a half-mile of anexisting fixed-guideway transit stop. A conservative estimate is that by 2030, nearlya quarter of those seeking housing, or over 16 million households, will express ademand for living near fixed-guideway transit.8 The types of households who tend toseek out TOD – singles, couples without children, the elderly and low incomeminority households – are also the types of households that are projected to grow themost over the next 25 years.
Accommodating this market demand will require substantial effort on the part oflocal governments, transit agencies and developers to reframe zoning and other localregulations, identify properties near transit stations for development, and define newhousing and mixed-use products.
A particular challenge facing local communities is to ensure that housing built withinwalking distance of transit is available to households of all income levels.Neighborhoods near transit provide housing to a greater share of their region’slower-income households. Almost half of the projected 16 million Nationalhouseholds desiring to live near transit will come from households with incomesbelow 50 percent of the area median income (AMI).9 These households areparticularly relevant as the need for affordable housing near affordable transportationservice is critical to reducing the overall cost burden on low-income householdbudgets. Considerable demand will also come from singles and couples withoutchildren with annual incomes of $60,000 to $125,000.10
An economic range of housing choices in TODs – “mixed-income TOD” – is crucialto realizing the full potential of the transit investments being made to provide greatertransportation access and housing choice to a full array of home owners and renters.The creation and preservation of mixed-income housing near transit can help local 7 Hollie M. Lund, Robert Cervero, Richard W. Willson, Travel Characteristics of Transit-OrientedDevelopment in California. Caltrans Transportation Grant "Statewide Planning Studies:" 20048 Center for Transit-Oriented Development, Hidden in Plain Sight: Capturing the Demand forHousing Near Transit, CTOD: April, 2005 (2030 update, forthcoming Spring 2007).9 Center for Neighborhood Technology (CNT) and the Center for Transit-Oriented Development,Preserving and Promoting Diverse Transit-Oriented Neighborhoods. CNT: November 2006.10 For more information on CTOD’s methodology for estimating future demand near transit, see:Center for Transit Oriented Development, Hidden in Plain Sight: Capturing the Demand for HousingNear Transit, April 2005.
3
communities respond to the growing demand for housing near transit while alsoproviding economic and environmental benefits to households, cities, and regions.Development of housing adjacent to transit presents opportunities to meaningfullyaddress the nation’s continued need for affordable housing and at the same time toexpand access to jobs, educational opportunities and prosperity for a range of incomegroups. By offering: (1) affordable housing, (2) a stable and reliable base of transitriders, (3) broader access to opportunity and (4) protection from displacement,mixed-income TOD holds the potential to address the problems of worsening trafficcongestion, the need for affordable housing in metropolitan areas and the growinggap between lower income and wealthier residents.
Several factors make it hard to deliver mixed-income housing adjacent to transit.Lack of ready-to-develop land, high land costs near transit, absence of TOD-supportive land use and rigid parking requirements, and lengthy entitlementprocesses for development all combine to push private sector developers to the highend of the housing market where there is more margin to absorb the time, uncertaintyand cost of risk inherent in TOD.
Without a more focused concentration on making it easier for development to occurnear transit and creating tools and incentives for affordable housing, there is thepotential for TOD development to be unaffordable to lower income households, todisplace existing residents or to upset the balance of what are presently diversemixed-income neighborhoods.
Study PurposeThis report is jointly sponsored by the U.S. Department of Housing and UrbanDevelopment, Office of Policy Research and Development (HUD) and the U.S.Department of Transportation, Federal Transit Administration (FTA). HUD isparticipating in the research to support its mission of increasing the availability andeffectiveness of affordable and mixed-income housing. FTA is participating in thisresearch to support its mission to provide mobility to economically disadvantagedand transit-dependent populations.
FTA and HUD undertook this particular research in part to follow-on from aprevious report, “Hidden in Plain Sight: Capturing the Demand for Housing NearTransit.” That report indicated that demographic shifts and urban developmentwould increase the demand for housing near transit over the next 20 years. Sinceaffordable housing meets its objectives more effectively when it is well-served bypublic transit, this follow-on study sought to identify the factors that help, or hinder,the co-location of affordable and mixed income housing with public transit, in thelarger context of a new product in the development market – Transit-OrientedDevelopment, or TOD.
FTA and HUD initiated a cooperative agreement with Reconnecting America’sCenter for Transit-Oriented Development (CTOD) to research this subject bystudying five case study cities. It is HUD and FTA's intent for these case studies to
4
provide examples and lessons learned to assist State and local governments as theyplan and make local decisions about housing and transportation. It is our belief thatby encouraging coordinated planning of affordable and mixed-income housing andpublic transit investments we can achieve multiple goals of improving transit serviceto economically disadvantaged persons while enhancing their ability to findaffordable housing that does not raise their cost of travel.
This study seeks to identify how to strengthen the interplay between affordable housingand TOD, with an emphasis on demand by different household types and income levels.It provides a set of recommendations to Federal, State and local policy makers andpractitioners for enhanced coordination of housing goals with transit investments. Themajority of the report focuses on the different approaches being developed andimplemented in five metropolitan areas of the United States: Boston, Charlotte, Denver,Minneapolis-St. Paul and Portland, Oregon. Each of these regions represents a differentphase of development, transit technology, and regulatory frameworks for addressinghousing and TOD.
Appendix A of this report provides a matrix of general affordable housing and transit-oriented development tools being used by many local communities. They include local,regional, State and Federal incentives, policies and programs such as waiving ofdevelopment fees for affordable housing near transit, density bonuses in exchange forproviding a certain number or percentage of affordable housing units, and provision ofpublic resources for affordable housing.
While there are significant variations between the case study regions, similaritiesremain. Each region is characterized as a “hot housing market” in that rising homeprices are outpacing increases in household incomes and affordability pressures areconfronting both low- and middle-income households. And, all regions are seekingto make increased investments in fixed-guideway transit and promoting transit-oriented development either directly through public agencies or in partnership withthe private sector.
Chapter Two describes the growing demand for housing near transit, and thepotential to focus a segment of the growing TOD market to create housing forhouseholds at all levels of the economic spectrum. Creating “mixed-income housingnear transit” can be a tool for addressing regional affordable housing and transitridership goals. Chapter Three provides an overview of the five selected regions,describing key housing and transportation trends including housing costs, transitusage and transit system size.Chapters Four through Eight each discuss one of the case study regions. Thesechapters provide greater detail on regional housing and transit trends, with aparticular focus on the selected transit corridor for each case study: demographiccomposition, land use characteristics, transit status, and the redevelopment potentialthat exists for providing and retaining housing. Local, regional and State-levelpolicies and tools for promoting transit-oriented development and affordablehousing, unique to each region, are described in terms of their application along the

5
corridor. Appendix B provides information on the methodology used in this study fordetermining underutilized parcels and capacity for new housing within each transitcorridor.Key findings and recommendations from the case studies are summarized in ChapterNine, with overall recommendations for local, regional, State and Federal partnersdiscussed in Chapter Ten.
6
Chapter 2: Location Matters to the Cost of Living
Between 2000 and 2005, the burden of housing costs increased for families in almostevery American community. Housing costs increased not only in hot housingmarkets along the east and west coasts, but also in the Midwest and in suburbsnationwide.11
Nationally, for every dollar a working family saves on housing, it spends 77 centsmore on transportation.12 For households at all income levels, the ability to savemoney on transportation means more income to spend on other important needs likehousing, health care, food, education or even leisure.
Research conducted over the past decade shows conclusively that transportation isnot only one of the two top costs of living for American households, but that forworking families, those earning $50,000 or less, transportation now costs more thanhousing in most metropolitan areas. This cost is highly dependent on the character ofthe location of housing.13
One recent study found that in the nation’s 28 largest metropolitan areas, workingfamilies are spending about 57 percent of their incomes on the combined costs ofhousing and transportation, with roughly 29 percent of income going totransportation.14 While a number of households choose, or are forced to live in moredistant suburbs where housing costs are lower, this data suggests that what they gainin cheaper housing is lost to higher transportation costs. The ability to help reducetransportation costs, and therefore lower the overall cost of living is an importantpolicy objective that can be advanced with successful TOD.15
While the average American family spends roughly 19 percent just on transportation,households with access to good transit service spend only 9 percent.16 The following 11 US Census Bureau, 2005 American Community Survey, Selected Housing Characteristics, 2005.12 Barbara J. Lipman, Something’s Gotta Give: Working Families and the Cost of Housing, Center forHousing Policy: April 2005.13 Barbara J. Lipman, A Heavy Load: The Combined Housing and Transportation Burdens of WorkingFamilies, Center for Housing Policy; October 2006.14 Ibid.15 The Center for Neighborhood Technology and the Center for Transit-Oriented Developmentdeveloped a new tool, the Affordability Index, to estimate and map the combined costs of housing andtransportation at the Census tract level. The Index is based on the observation that as people obtainaccess to information regarding local transportation choices, they (a) take those choices when itincreases convenience, and (b) they advocate for expanding choices. In the short term, the maps ofthe Index show that choice increases within the vicinity of mass transit and therefore there isincreased consumer value at those locations. For homebuyers and home owners, a recent study by theNational Association of Homebuilders corroborates this, with a typical value premium of 12 percentwithin walking distance of mass transit. By supporting this kind of focused consumer choice,consumers will benefit directly by avoiding locations that bring with them the high cost of driving,and communities and transit operators will benefit by accelerating and helping shape cost-saving landuse patterns and transit patronage.16 Avoiding the ownership of one car would preserve on average $300 per month on automobileownership costs, or 10 percent of disposable income. This savings can mean the difference betweenqualifying for a mortgage and not, especially for households making $50,000 or less.
7
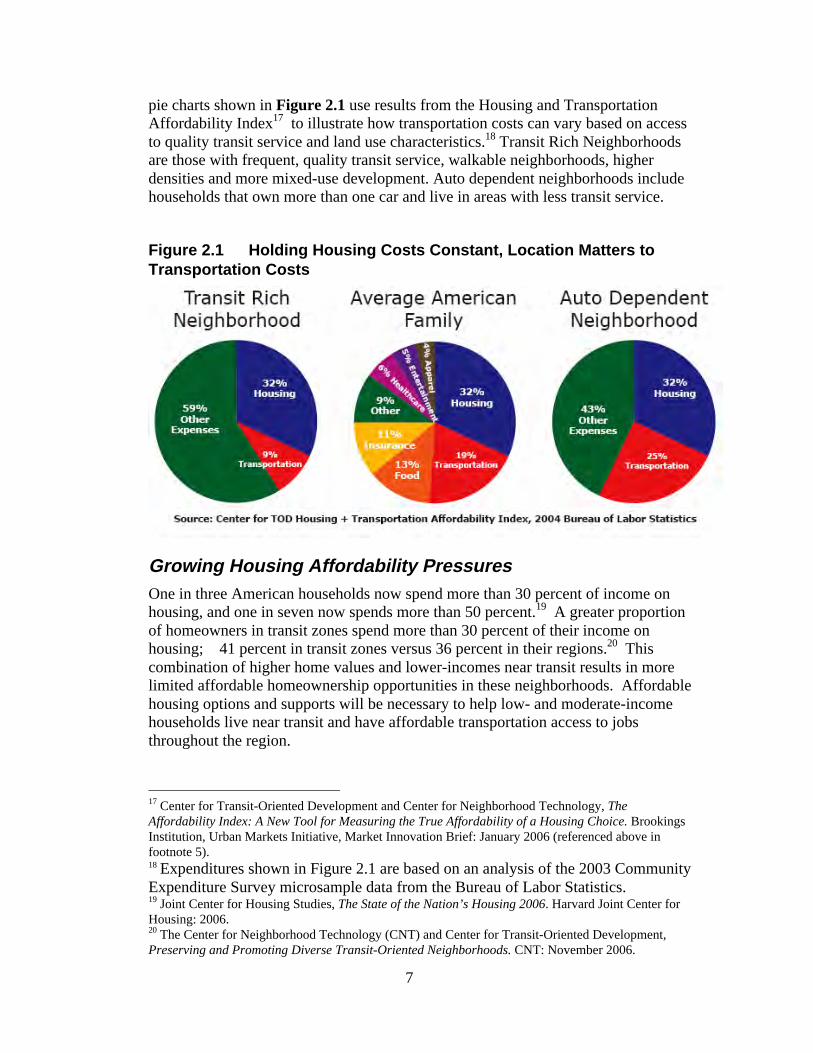
pie charts shown in Figure 2.1 use results from the Housing and TransportationAffordability Index17 to illustrate how transportation costs can vary based on accessto quality transit service and land use characteristics.18 Transit Rich Neighborhoodsare those with frequent, quality transit service, walkable neighborhoods, higherdensities and more mixed-use development. Auto dependent neighborhoods includehouseholds that own more than one car and live in areas with less transit service.
Figure 2.1 Holding Housing Costs Constant, Location Matters toTransportation Costs
Growing Housing Affordability PressuresOne in three American households now spend more than 30 percent of income onhousing, and one in seven now spends more than 50 percent.19 A greater proportionof homeowners in transit zones spend more than 30 percent of their income onhousing; 41 percent in transit zones versus 36 percent in their regions.20 Thiscombination of higher home values and lower-incomes near transit results in morelimited affordable homeownership opportunities in these neighborhoods. Affordablehousing options and supports will be necessary to help low- and moderate-incomehouseholds live near transit and have affordable transportation access to jobsthroughout the region.
17 Center for Transit-Oriented Development and Center for Neighborhood Technology, TheAffordability Index: A New Tool for Measuring the True Affordability of a Housing Choice. BrookingsInstitution, Urban Markets Initiative, Market Innovation Brief: January 2006 (referenced above infootnote 5).18 Expenditures shown in Figure 2.1 are based on an analysis of the 2003 CommunityExpenditure Survey microsample data from the Bureau of Labor Statistics.19 Joint Center for Housing Studies, The State of the Nation’s Housing 2006. Harvard Joint Center forHousing: 2006.20 The Center for Neighborhood Technology (CNT) and Center for Transit-Oriented Development,Preserving and Promoting Diverse Transit-Oriented Neighborhoods. CNT: November 2006.
8
Government at all levels is struggling to respond, with limited resources. There aresome important successes to note in many communities. The City of New Yorkrecently announced the creation of a fund to acquire lands and providepredevelopment financing to help ensure affordability throughout the city. Anumber of cities have created Affordable Housing Trust Funds, using money fromnew development to help provide new units or subsidize affordable rents. Twenty-eight states already link allocation of at least a portion of their Low-Income HousingTax Credit programs to proximity to transit.21
In 2006, HUD’s Home Investment Partnerships Program (HOME) posted recordperformance with substantial increases in the number of families assisted andaffordable homes produced. HOME is the largest Federal block grant to State andlocal governments designed exclusively to produce affordable housing for low-income families. In 2006, more than 143,000 households benefited from hundreds oflocal programs that HOME supports, a 42 percent increase over the previous year.22
Demand for Housing near Transit is Diverse and GrowingThe demand for households wanting to live near transit is projected to more thandouble in the next 25 years. Creating more housing choice near transit is neededboth in the suburbs and in central cities to meet this demand, and to increase thesupply so that new TOD housing is affordable.
In recent years, many in the development community have become enamored withTOD, including large developers and homebuilders like Trammell Crow, KBHomes, and Toll Brothers, Inc.23 New mixed-use projects are cropping up next tosubways, light rail, commuter rail and bus rapid transit stations in over 40 regionsthroughout the US. For this study, discussions about development response along theselected case study corridors is limited to October 31, 2006, as it became difficult forthe research team to keep apace with the new development proposals that arecontinually being submitted.
One of the trends underlying the large TOD market potential is a significantdemographic shift. America is an aging and more diverse country than it used to be,and the types of amenities and the quality of life that TOD promises, primarily amixture of uses available within walking distance to transit, seem to appeal to activeadults and those that wish to not drive, cannot drive or cannot afford to drive. TheAmerican Association of Retired People (AARP), for example, reports that 71percent of older households want to live within walking distance of transit –otherwise it’s hard to maintain an active lifestyle without relying on others to getaround.
21 The Low Income Housing Tax Credit national database is available athttp://www.huduser.org/datasets/lihtc.html22 US Department of Housing and Urban Development, 2006.23 The Urban Land Institute and Price Waterhouse Cooper together publish an annual report on“Emerging Trends in Real Estate.” The past several years have included proximity to transit, urbaninfill and specifically TOD as among the top attributes attracting developers.
9
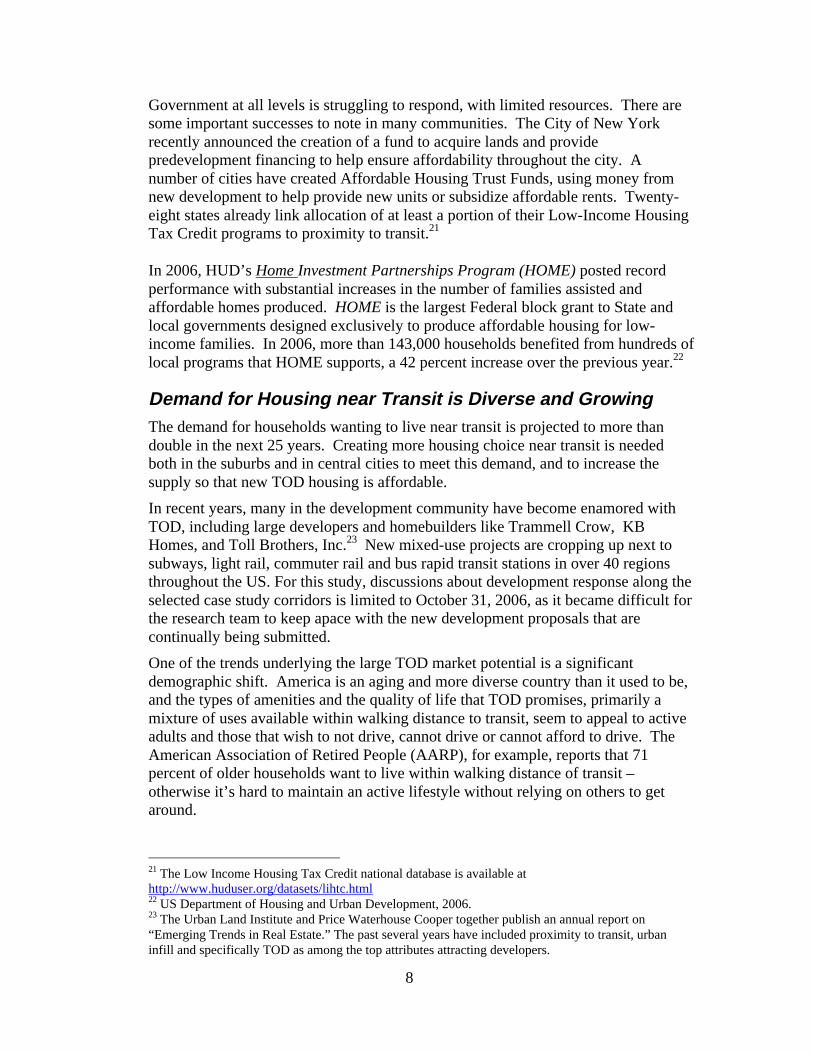
Shown in Figure 2.2, next page, American households are getting older and smaller.Married couples with children made up the vast majority of households a centuryago. Single adults will soon comprise the new majority. Average household size hasfallen in the U.S. by nearly one full person from 3.52 in 1950, to 2.60 in 2005.24 Ashousehold size and formation has shifted, the housing market has responded withincreased production in smaller, attached housing units.
The shifting demographics of new homebuyers and renters correspond withdemographic groups that have historically demonstrated a preference for urbanneighborhoods near transit. Currently, households living within transit-servedneighborhoods (those within a half-mile of a fixed-guideway station, referred tocommonly as transit zones) are more racially and economically diverse than theirsurrounding neighborhoods and overall regions. Today, nearly 60 percent ofresidents living near transit are minorities.25 Almost half the U.S. population isexpected to be non-white by 2050, and almost a third of that growth due toimmigration. Traditionally, foreign-born residents have tended to use transit morethan native residents.26
In addition to demographic trends already noted, almost two-thirds of households intransit zones are renters, compared to one-third nationally. One-person householdsaccount for the largest percentage of household type in transit zones, at 35 percent,versus 26 percent nationally.27 Four-plus person households account for 23 percentof households in transit zones.28
24 Robert Puentes and David Warren, “One Fifth of America, a Comprehensive Guide to America’sFirst Suburbs.” Brookings Institution: 2006.25 Center for Neighborhood Technology (CNT) and the Center for Transit-Oriented Development(CTOD), Preserving and Promoting Diverse Transit-Oriented Neighborhoods. CNT: November2006.26 Robert Puentes, “A Review of New Urban Demographics and Impacts on Transportation,”Brookings Institution for the Eno Foundation: December 2006.27 Center for Neighborhood Technology (CNT) and the Center for Transit-Oriented Development(CTOD), Preserving and Promoting Diverse Transit-Oriented Neighborhoods. CNT: November2006.28 Ibid.
10
Many developers understand that the combination of new housing options, transitconnectivity and placemaking work in the marketplace and create lasting value.Some transit agencies are also getting on-board, as they recognize that walk-and-riders are less expensive to attract and are more reliable patrons. Some local andregional governments are putting in place plans and zoning to facilitate TOD.
Making the Case for Mixed-Income Housing near TransitEnsuring that a portion of new housing is provided to lower-income families isimportant, as is the need to retain affordable housing near quality transit service.Increased job connectivity, affordable housing options, and other supports will benecessary to help low- and moderate-income households live near transit and itsaccess to jobs in order to increase their earnings while keeping their housing andtransportation costs low. This may not need to be accomplished at each and everytransit zone, but should be tracked at the corridor and system-wide scales to ensuretransit in each region has adequate access by all income levels.
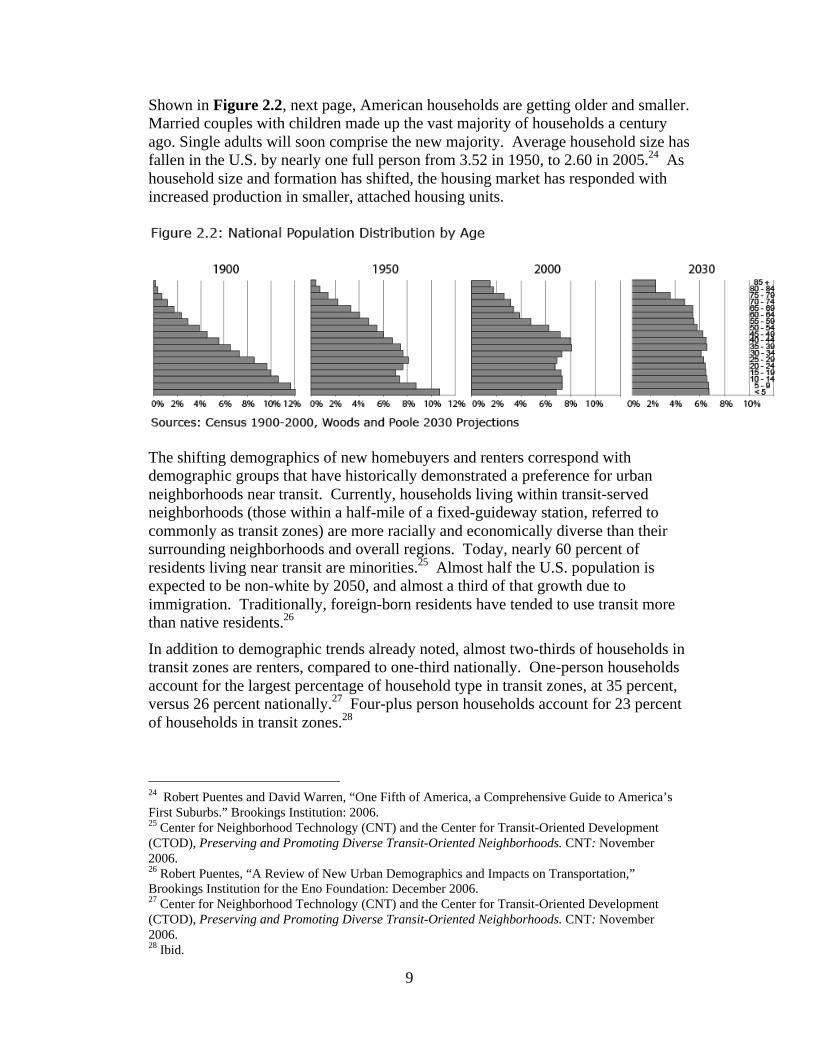
For low-income residents, many who rely on transit to get them to jobs, schools,shopping and services, transportation and housing costs are a heavy burden. Table2.1 shows that housing accounts for a higher proportion of household costs for low-income families.
Equally stunning, transportation costs vary widely from only nine percent for high-income households (who may be spending a higher dollar amount on transportationbut a lower percentage of their overall income) to 55 percent for extremely low-income households. In Table 2.1, the lowest income households can manage eitherhousing or transportation costs, but not both and will seek to reduce costs to thosethat can be met through strategies such as living in shared, overcrowded, orsubstandard housing, owning older cars, reducing number of trips, or sharing anautomobile.
Table 2.1: An Unequal BurdenAnnual Household Income <$20,000
$20,000 to $34,999
$35,000 to $49,999
$50,000 to $74,999
$75,000 to $99,000
$100,000 to $250,000
Housing 59% 33% 25% 21% 18% 14%Transportation 55% 34% 25% 18% 13% 9%Combined Housing and Transportation 100%+ 67% 50% 39% 31% 23%
Note: The percentage above 100% of income by households earning less than $20,000 can be explained in part by households living in subsidized housing or sharing household costs with others that have not reported their income as part of the household’s total income on the Census form. In other cases, the percentage greater than 100% may be a factor of “under spending” on transportation relative to what the transportation model would predict given the characteristics of the tract and typical household needs for transportation.
11
Source: Center for Neighborhood Technology and Virginia Tech, 2006. 29
Data indicates that transit is an important tool for providing affordable transportationto households, allowing residents to live with fewer cars. In three-quarters of transitzones, regardless of average household income, households have one car or less. Insome small transit systems, fully 100 percent of transit zones house a majority ofhouseholds with one car or less. This low rate of auto ownership is true for higher-income households in transit zones as well as lower-income ones.
Transit-oriented development can serve as an effective building block for tacklingaffordability and mobility challenges. While linking land use and transit may notsolve all congestion problems, TOD linked with high-quality transit service canprovide additional transportation capacity for regions. Locating daily services suchas dry cleaners, groceries, daycare, post offices, shopping and health care facilitiesnear transit provides opportunities to reduce or avoid making separate automobiletrips. Such a strategy can also help to reduce or avoid public costs associated withhaving to provide new infrastructure to accommodate new growth in a non-transit,urbanized area.30
Likewise, a transit system that links a series of walkable, mixed-use neighborhoodsalso provides affordability and convenience for residents. If residents are able towalk for some daily trips, take transit to work and use their car less, they can reducethe portion of their household budget going to transportation-related expenses, thesecond largest household expense after housing. This is particularly important forlow-income households who carry a heavy cost-of-living burden.
Benefits and Challenges of Mixed-Income TODMixed-income TOD presents opportunities to meaningfully address the nation’sgrowing affordability crisis by tackling housing and transportation costs together,while simultaneously expanding access via transit to jobs and educationalopportunities for the range of income groups living in our metropolitan regions.Helping to ensure that TOD provides housing opportunities to a wide range ofhouseholds is also important in preventing the displacement of current communities.As previously noted, neighborhoods near transit are already very diverse, and tend tohave a higher proportion of low-income households than their regional averages.
29 Center for Neighborhood Technology and Virginia Tech, “Housing and Transportation Cost Trade-Offs and Burdens of Working Households in 28 Metro Areas,” a White Paper prepared for the Centerfor Housing Policy, 2006. The expenditure percentages are based on weighted average numbersfor households for each income level in each tract for the 28 metropolitan areasanalyzed. Transportation costs are calculated based on several data sources includingthe Census 2000, Census Transportation Planning Package 2000, and local transitdata. A description of these sources and the model is provided in The Affordability Index:A New Tool for Measuring the True Affordability of a Housing Choice. Brookings Institution, UrbanMarkets Initiative, Market Innovation Brief: January 200630 Several recent studies have examined the potential benefit of transit to reduce other public costs.Todd Litman, Evaluating Public Transit Benefits and Costs. Victoria Policy Institute, 2006; RobertBurchell et al., The Costs of Sprawl – 2000 (TCRP Report74) Transportation Research Board, 2002.
12
Housing stock in neighborhoods near transit is smaller, older and mostlymultifamily.
Preserving and strengthening this diversity is a goal that can be accomplishedthrough thoughtful TOD policy that engages the full community, residents andprivate sector developers and business leaders, in partnership with transit agencies,local and regional governments to better coordinate transportation and housing.However, significant obstacles to TOD and to affordable housing exist today, andmust be addressed before progress can be made.
Current Barriers to Mixed Income Housing Adjacent toTransit1. Land prices are high. In most regions investing in new fixed guideway transit
systems, developers already pay a premium on land at many planned and existingTOD sites. This presents a formidable obstacle to providing housing products ataffordable prices. The higher the cost of the land, the more expensive is theresulting development. In cases where the transit project has not yet been built,land prices are often being driven up by speculative pressures.
2. Affordable housing developers do not have the capital to land bank. Acquiringand holding land, also known as land banking, requires considerable capital,especially when it may be five to 10 years before a rail station is built. Thispresents steep holding costs for any developer, particularly nonprofit developersthat are most likely to produce below-market-rate housing. Many traditionalfunding sources, including CDBG, HOME and other Federal housing funds,cannot be used to purchase land. Increasingly transit properties are reluctant topurchase excess land for future joint development when building new transitlines out of concern over increased project costs that may reflect negatively ontheir project rating for Federal funding.
3. Transit improvements can cause displacement of existing, low-incomeresidents. Investments near new or enhanced transit stations in existing low-income neighborhoods can displace the very residents they are designed to servebecause increased accessibility to regional jobs and services via transit tend toattract a new, more affluent population. This is particularly true in those transitzones where a majority of residents may be renters or long-term owners on fixedincomes, and home-ownership programs are limited or do not exist.31
4. Affordable housing subsidy funding is limited. State and Federal public subsidyfunding for affordable housing has dwindled dramatically in the past decade,especially for affordable rental housing and projects serving households at lessthan 50 percent of AMI. Whereas there are some successful Federal HOPE VIprojects that incorporated access to transit and mixed-income housing, thisfunding source no longer exists. Created in 1992, it sought to replace severely
31 Rising property values result in higher taxes, which families on fixed incomes often cannot afford.This forces them to sell, and move into more affordable housing often farther away from transit.
13
distressed public housing through breaking up concentrated poverty and usinginnovative urban neighborhood design.
5. Mixed-income and mixed-use projects require complex financing structures.Financing is less plentiful for housing projects in which some units are affordableand others are market rate. Underwriting criteria for housing projects do not takeinto account lower transportation costs in TODs. Different finance structuresalso relate to different uses: commercial, retail or residential with some degree ofcross subsidy often required between uses. At transit sites, this can make analready difficult project – in which land may need to be held for several yearswithout a return – even more challenging.
6. TOD sites frequently require rezoning and land assembly. This can lead tolengthy acquisition and permitting processes, which increase development costs.When developers are saddled with these costs, it can be much more difficult toalso include place making features and affordable housing in transit-orienteddevelopment. It is interesting to note that a higher level of scrutiny, or a higherstandard, may be applied to TOD projects to try and address region-wideaffordability issues. Traditional development projects are not typically held to asimilar standard, but it is worth looking at how any kind of new developmentregardless of location can provide a greater range of housing opportunities.
7. Parking requirements are unnecessarily high at TODs. Given high land pricesat TOD sites, coupled with the average cost of providing a structured parkingspace (over $20,000 per space), parking requirements can significantly affect thefinancial feasibility of TOD projects. Zoning requirements that assume alltenants will have cars add a great deal to the cost of building TOD housing.Research indicates that TOD residents of all income levels own fewer cars andthus need fewer dedicated parking spaces.
8. Community opposition to density and affordable housing is difficult toovercome. Residents of established communities may be particularly resistant tochanges that are perceived as negatively impacting their property values orcommunity character. Initial resistance and development delays can be expectedwith higher density projects, particularly without an inclusive, communityplanning process at the outset.
One way to help alleviate the pressures of price escalation is to increase the supply ofTOD overall.32 If more mixed-income neighborhoods are built, displacement oflower-income residents will hopefully lessen and new housing opportunities mayemerge. But if supply constraints persist and the TOD market responds solely withhigh-end market-rate housing, this will be an enormous missed opportunity forproponents of both TOD and mixed-income housing. However, this is a delicatebalancing act, highly dependent on market conditions. If too much TOD is built in aparticular region, oversupplying retail, commercial, or residential space, this maylower the rates of return on the development to an unsustainable level. An
32 A comprehensive set of mixed-income tools is described in an August 2006 report by DougShoemaker for the Center for Transit Oriented Development and is available athttp://www.reconnectingamerica.org/pdfs/Tools%20for%20Mixed%20Income%20TOD.pdf
14
understanding of local market conditions for different types of uses is important todetermining what the market can bear and hopefully supplementing the economy,not undermining or diluting it.
The next chapter provides an overview of the five case study regions, highlightingregional housing and transportation dynamics.
15
Chapter 3: Overview of Selected Case Study Regions
This report focuses on different opportunities for, and approaches, to creating mixed-income, transit supportive neighborhoods in five metropolitan areas: Boston,Massachusetts: Charlotte, North Carolina: Denver, Colorado: Minneapolis,Minnesota: and Portland, Oregon.
Each case study region presents a unique mix of characteristics related to: phase ofdevelopment, land use opportunity, transit technologies, and regulatory frameworksfor addressing housing and TOD.
While significant variations exist between the regions, similarities remain. Each ofthese regions is characterized as a tight housing market where rising prices areoutpacing increases in household incomes, making homeownership for low- andmiddle-income earners increasingly out of reach. Each of these regions is alsoseeking to make further investments in transit and each is eager to promote transit-oriented development, either directly through public agencies or in partnership withthe private sector.
Overview of Regional TrendsFive metropolitan regions were selected based on their transit technologies (e.g.Light Rail, Heavy Rail, Streetcar), the age of their systems, and the state of theirhousing market. Consideration of the housing markets includes housing prices,presence of programs and/or policies that support affordable housing in the region, oraffordable housing projects or developers actively working to build affordablehousing near transit.
One objective of this study is to evaluate how effectively these five regions areworking to implement policies and/or provide incentives to capture the projectedTOD demand. A different set of challenges and opportunities exist for a region likeBoston, with well-established densely populated urban neighborhoods developedalong one of the nation’s earliest transit systems; than exist in Denver, a region in themidst of building a new regional transit system to serve its fast growing auto-dependent suburban communities. This study provides snapshots in time of TODaround the country, and although the regions selected are not representative of all theTOD models in the United States they provide some insight into the diversity ofapproaches and site-specific challenges that exist.
16
Table 3.1. Comparison of Selected Case Study Regions
TransitRegion
Number ofHouseholds
in 2000Region(TransitZones)
YearRegional
RailServiceBegan
SystemSize in2005
(stations)
2000MedianIncome
Region(TransitZones)
Increase inMedianHome
Values+
2000-200533
adjusted
Householdspaying 35%or more forHousing 34
Percentageof
Region’sHousing
built 2000or later
2030Demand forTOD from
Householdsearning<$50K
ProjectedHousehold
TODDemand in
203035
Boston 1,785,552(413,528)
1855 Extensive(288)
$51,727($48,306)
81% 38% 3.9% 47%509,219
1,072,309
Charlotte 575,293(3,777)
2007 SmallExp. (10)
$46,120($40,715)
8% 35% 17.2% 62%54,101
87,097
Denver 939,971(17,373)
1994 Small(24)
$51,760($31,839)
18% 38% 12.6% 54%83,594 155,076
TwinCities
1,136,615(17,870)
2004 SmallExpanding
(17)
$54,317($30,613*)
48% 38% 10.1% 49%54,187
110,906
Portland 741,776(73,911)
1986 Large(108)
$47,061($34,899)
22% 40% 10.5% 51%156,802
308,644
U.S.** N/a n/a n/a $41,994 24% 21% 8.4% 51%8,165,322
16,007,245
+for owned housing units with a mortgage** Total TOD demand applies to 41 transit regions onlySource: Center for Transit-Oriented Development, 2000 Census Bureau Data and NationalTOD database
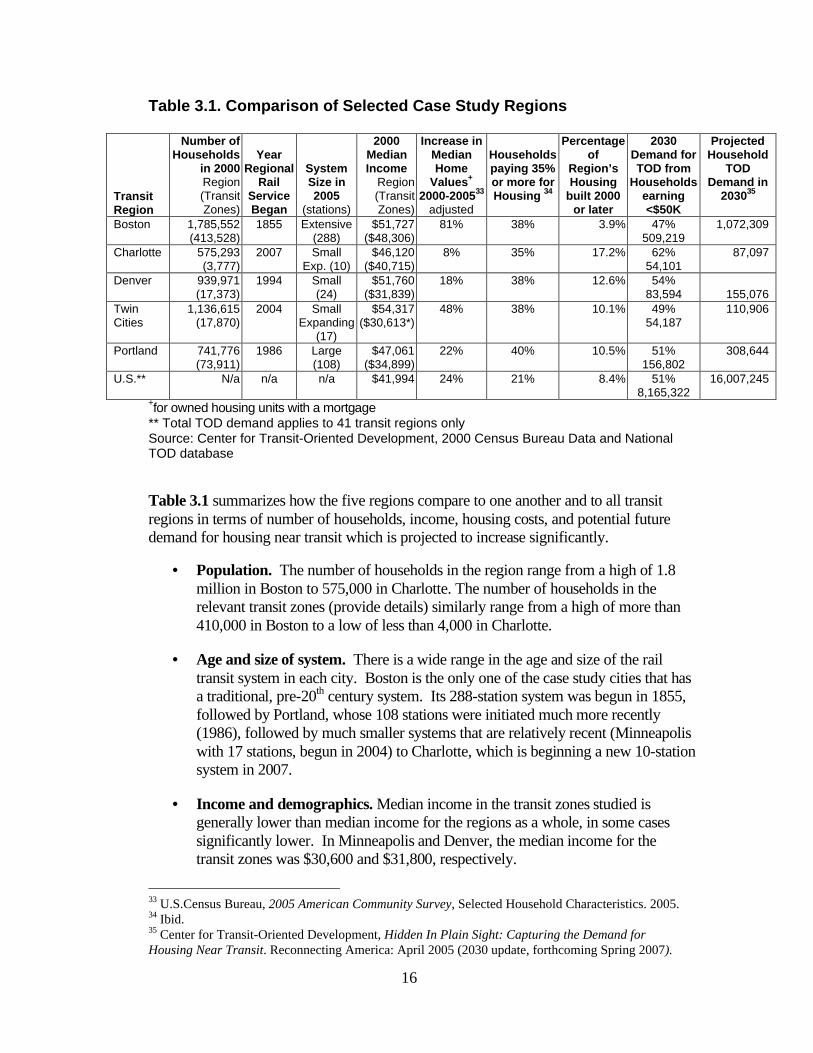
Table 3.1 summarizes how the five regions compare to one another and to all transitregions in terms of number of households, income, housing costs, and potential futuredemand for housing near transit which is projected to increase significantly.
• Population. The number of households in the region range from a high of 1.8million in Boston to 575,000 in Charlotte. The number of households in therelevant transit zones (provide details) similarly range from a high of more than410,000 in Boston to a low of less than 4,000 in Charlotte.
• Age and size of system. There is a wide range in the age and size of the railtransit system in each city. Boston is the only one of the case study cities that hasa traditional, pre-20th century system. Its 288-station system was begun in 1855,followed by Portland, whose 108 stations were initiated much more recently(1986), followed by much smaller systems that are relatively recent (Minneapoliswith 17 stations, begun in 2004) to Charlotte, which is beginning a new 10-stationsystem in 2007.
• Income and demographics. Median income in the transit zones studied isgenerally lower than median income for the regions as a whole, in some casessignificantly lower. In Minneapolis and Denver, the median income for thetransit zones was $30,600 and $31,800, respectively.
33 U.S.Census Bureau, 2005 American Community Survey, Selected Household Characteristics. 2005.34 Ibid.35 Center for Transit-Oriented Development, Hidden In Plain Sight: Capturing the Demand forHousing Near Transit. Reconnecting America: April 2005 (2030 update, forthcoming Spring 2007).
17
• Housing prices. House prices increased substantially in two of the five casestudy sites between 2000 and 2005; 81 percent in Boston and 48 percent in theTwin Cities. The remaining sites experienced more moderate price increases ofless than 25 percent, with Charlotte increasing by just 8 percent over this period.
The case studies provide detailed information on the efforts at the corridor level tocapture the demand for TOD, and place the corridor within the larger city and regionalhousing and transportation contexts.
• In Portland, where relatively strong local and regional land use and transportationcoordination exists, a flexible development framework has emerged that hasresulted in billions of dollars in new investment along its streetcar system.
• In Massachusetts, statewide concern over escalating housing prices viewed asnegatively affecting job growth and retention has led the State to taking anincentive-based approach to increasing housing production, particularly in areasalready served by transit.
• In Charlotte, a fast growing metropolitan region, the local government hasstepped forward to provide leadership and investment and to create a strategy forreinvigorating its city and channeling future growth along transit corridors.
• Denver and the Twin Cities, while different from one another, are rediscoveringthe power of transit to shape development and provide people with much neededtransportation options by linking key regional destinations.
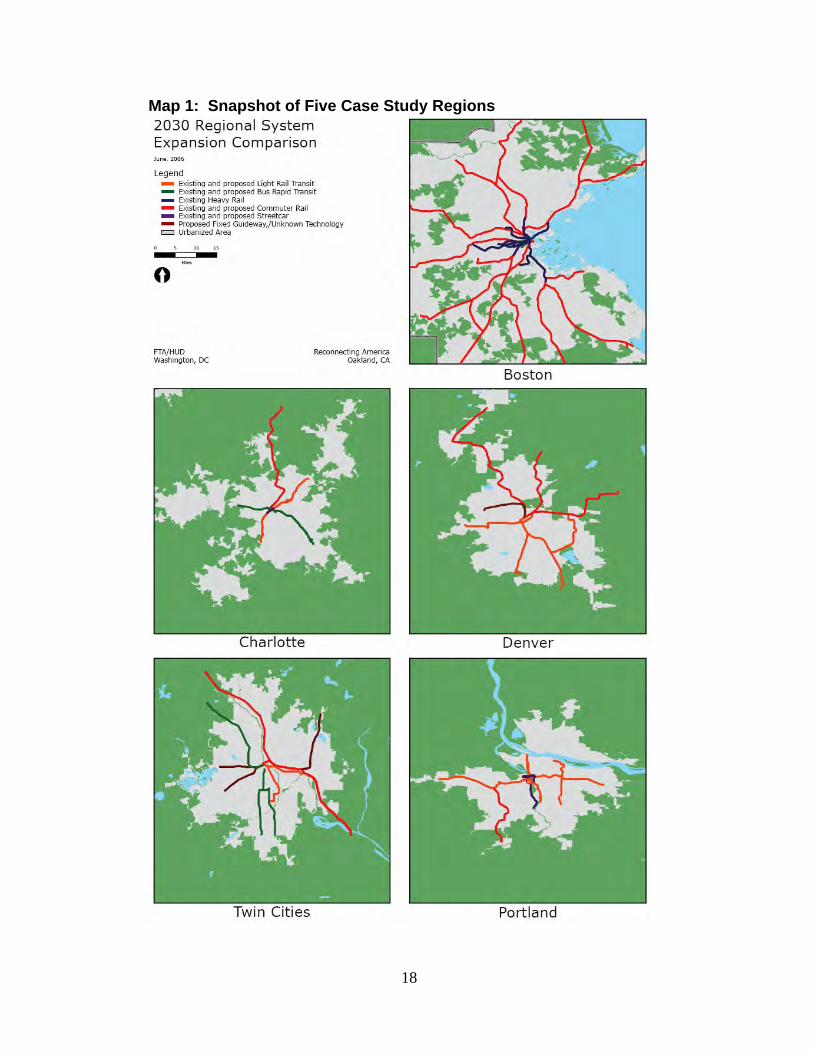
Map 1 on the following page provides a visual representation of existing andproposed transit lines in each of the case study regions.
18
Map 1: Snapshot of Five Case Study Regions
19
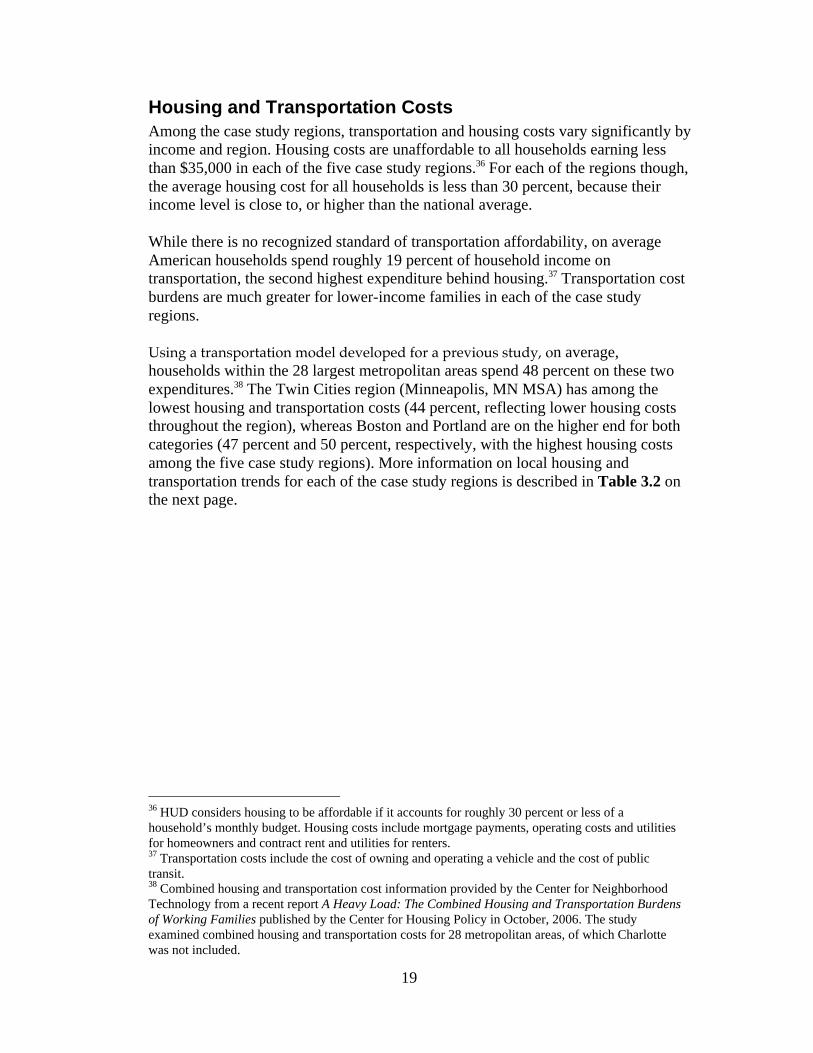
Housing and Transportation CostsAmong the case study regions, transportation and housing costs vary significantly byincome and region. Housing costs are unaffordable to all households earning lessthan $35,000 in each of the five case study regions.36 For each of the regions though,the average housing cost for all households is less than 30 percent, because theirincome level is close to, or higher than the national average.
While there is no recognized standard of transportation affordability, on averageAmerican households spend roughly 19 percent of household income ontransportation, the second highest expenditure behind housing.37 Transportation costburdens are much greater for lower-income families in each of the case studyregions.
Using a transportation model developed for a previous study, on average,households within the 28 largest metropolitan areas spend 48 percent on these twoexpenditures.38 The Twin Cities region (Minneapolis, MN MSA) has among thelowest housing and transportation costs (44 percent, reflecting lower housing coststhroughout the region), whereas Boston and Portland are on the higher end for bothcategories (47 percent and 50 percent, respectively, with the highest housing costsamong the five case study regions). More information on local housing andtransportation trends for each of the case study regions is described in Table 3.2 onthe next page.
36 HUD considers housing to be affordable if it accounts for roughly 30 percent or less of ahousehold’s monthly budget. Housing costs include mortgage payments, operating costs and utilitiesfor homeowners and contract rent and utilities for renters.37 Transportation costs include the cost of owning and operating a vehicle and the cost of publictransit.38 Combined housing and transportation cost information provided by the Center for NeighborhoodTechnology from a recent report A Heavy Load: The Combined Housing and Transportation Burdensof Working Families published by the Center for Housing Policy in October, 2006. The studyexamined combined housing and transportation costs for 28 metropolitan areas, of which Charlottewas not included.
20
Table 3.2. Comparison of Housing & Transportation Costs39
HOUSEHOLD INCOME
REGIONS <$20,000
$20,000to
<35,000
$35,000to
<50,000
$50,000to
<$75,000
$75,000to
<$99,000
$100,000to
<$250,000
Avg.All
HHS
Housing Costs as a Percentage of IncomeBoston, MA CMSA 56% 33% 25% 21% 18% 14% 28%Denver, CO CMSA 59% 33% 25% 21% 18% 14% 27%Minneapolis, MN MSA 54% 30% 23% 19% 16% 13% 25%Portland, OR CMSA 59% 32% 25% 20% 17% 14% 28%Charlotte* 47% 33% 25% 19% 18% 17% 27%Average 58% 31% 24% 20% 17% 14% 27%
Transportation Costs as a Percentage of Income Boston, MA CMSA 59% 35% 25% 18% 14% 9% 19%Denver, CO CMSA 55% 34% 25% 18% 13% 9% 19%Minneapolis, MN MSA 58% 35% 26% 19% 14% 9% 19%Portland, OR CMSA 60% 37% 27% 20% 14% 10% 22%Charlotte, NC n/a n/a n/a n/a n/a n/a n/a28 Metro Average 56% 34% 24% 18% 13% 8% 20%
Housing + Transportation Costs as a Percentage of IncomeBoston, MA CMSA 100%+ 68% 50% 39% 31% 23% 47%Denver, CO CMSA 100%+ 67% 50% 39% 31% 23% 46%Minneapolis, MN MSA 100%+ 65% 49% 38% 30% 22% 44%Portland, OR CMSA 100% 69% 51% 40% 32% 23% 50%
Charlotte, NC n/a n/a n/a n/a n/a n/a n/a28 Metro Average 100%[1] 66% 49% 38% 30% 22% 48%*Charlotte housing numbers were calculated using Census SF3, the other four regions werebased on PUMS 5% data1. The percentage above 100% of income by households earning less than $20,000 can beexplained in part by households living in subsidized housing or sharing household costs withothers that have not reported their income as part of the household’s total income on the Censusform. In other cases, the percentage greater than 100% may be a factor of “under spending” ontransportation relative to what the transportation model would predict given the characteristics ofthe tract and typical household needs for transportationSource: Center for Neighborhood Technology, 2006
The following sections discuss in more detail the specific transportation and housingcharacteristics in each of the selected case study regions.
39 The expenditure percentages are based on weighted average numbers for households for each incomelevel in each tract for the 28 metropolitan areas analyzed. Transportation costs are calculated based onseveral data sources including the Census 2000, Census Transportation Planning Package 2000, and localtransit data. A description of these sources and the model is provided in The Affordability Index: A NewTool for Measuring the True Affordability of a Housing Choice. Brookings Institution, Urban MarketsInitiative, Market Innovation Brief: January 2006
21
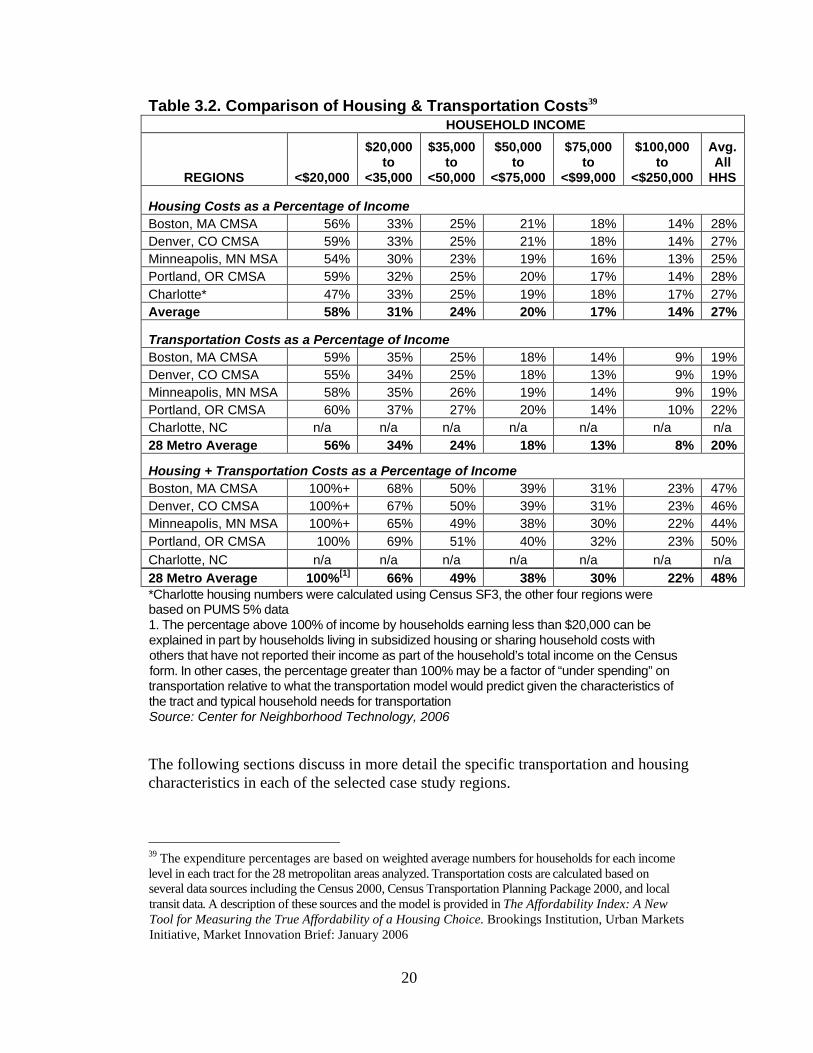
Greater Boston Metropolitan Area, MassachusettsThe Boston region is a hot housing market with roughly 50 percent single-familyhomes (a relatively low percentage) and one of the highest priced housing markets inthe country. According to the U.S. Census Bureau, from 2000 to 2005, median homevalues increased by 81 percent to $394,800. And in 2005, 38 percent of householdswere paying at least a third of their income for housing. Only 3.9 percent of the 2005housing stock was built in the last six years, compared to 8.4 percent nationally, andmore than 17 percent in fast growing markets like Charlotte and Atlanta.
The Boston transit region, covering the consolidated metropolitan statistical area,contained nearly 1.8 million households in 2000. By 2030, the region is expected togrow by 23 percent to 2.8 million households, with 38 percent of the householdsexpected to want housing near transit.
The regional transit authority, the Massachusetts Bay Transportation Authority(MBTA), operates 20 fixed rail routes, serves over 250 stations, and was America’sfirst transit system. Despite the extensive system size, slightly less than 10 percent ofresidents commute to work by transit, more than double the national average of 4.6percent but well below the average of 35 percent for metropolitan areas over 5million. Planning and transportation for the Boston region are carried out by theBoston Metropolitan Planning Organization, composed of seven agencies, sevenmunicipalities and a public advisory committee, but given the limitations on HomeRule, the State plays a significant role in funding and planning for bothtransportation and housing.
BostonStations ExistingStations 2030
288303
System Size Extensive
Transit TechnologiesCommuter Rail, HeavyRail, Light Rail, BRT
2000 TZ HH 413,5292030 TZ HH Demand 1,072,309Market Strong City/Suburb
22
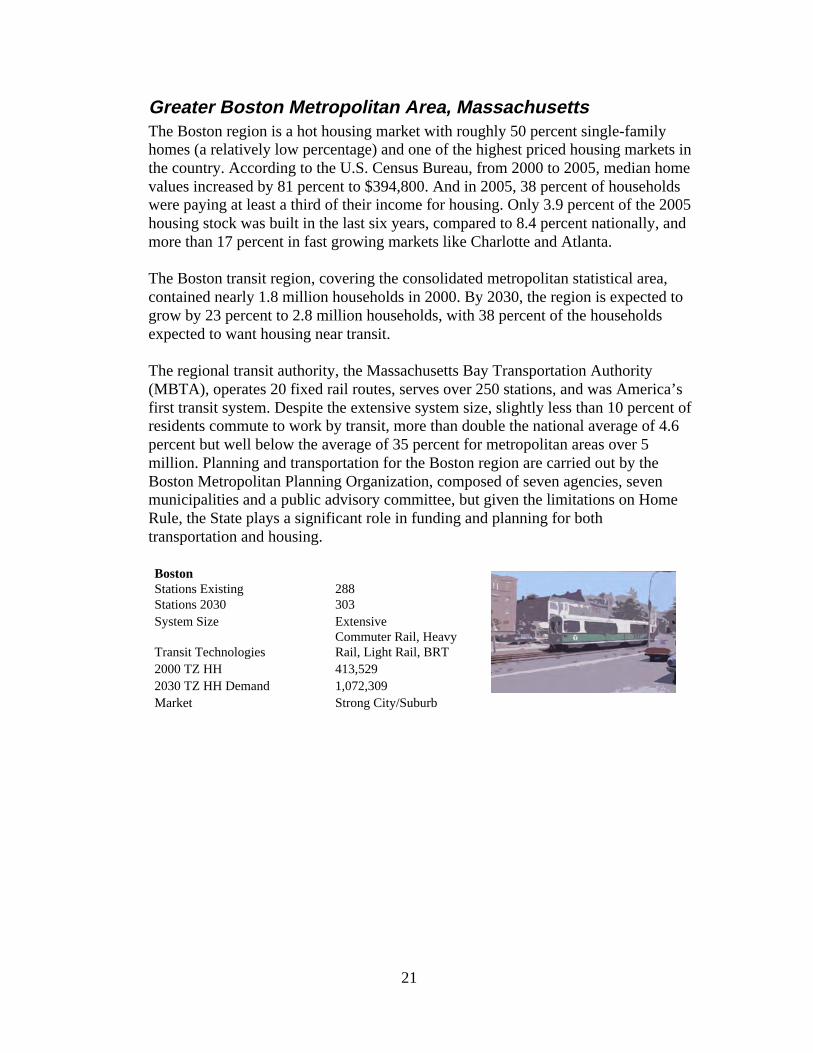
Charlotte – Mecklenburg County, North CarolinaThe Charlotte region is a rapidly growing, moderately priced, and sprawling housingmarket. Sixty-six percent of the homes were single-family detached in 2005, andover 17 percent had been built in 2000 or later.
Rapid growth is likely to keep home values from rising at the same pace as thenation. From 2000 to 2005, the region’s home prices increased by only eight percentto $150,900 compared to a 24 percent national increase during that same time period.The Charlotte transit region was home to a half million households in 2000 and isexpected to grow by 57 percent to 848,539 households, with 10.3 percent of thehouseholds expected to want housing near transit.
The City and Mecklenburg County share jurisdiction, providing a certain level ofcoordination between these two public agencies. Additionally, the regional transitagency is managed by the City, allowing for improved coordination of land use andtransit service. The future rail transit network calls for five new rapid transit lineswith a modern streetcar serving the central city. Currently though, there is a relativelack of transit options serving the region, and only one percent of residents currentlycommute to work by transit throughout the region, with higher percentages usingtransit within certain central city neighborhoods. With the investment in its first lightrail line, the South Corridor, the City hopes to increase transit’s share of trips andhelp focus a percentage of new development within transit corridors.
CharlotteStationsStations 2030
1080
System Size SmallTransit Technologies Light Rail2000 TZ HH 3,7802030 TZ HH Demand 87,097Market Strong City/Suburb
23
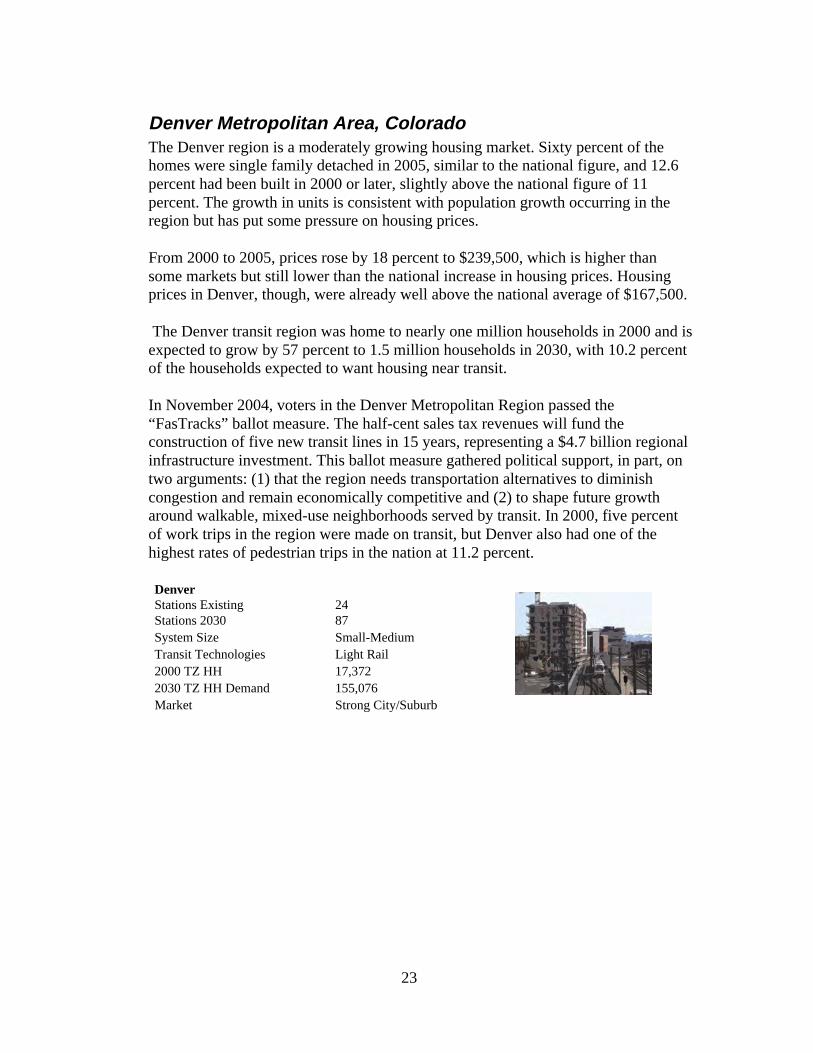
Denver Metropolitan Area, ColoradoThe Denver region is a moderately growing housing market. Sixty percent of thehomes were single family detached in 2005, similar to the national figure, and 12.6percent had been built in 2000 or later, slightly above the national figure of 11percent. The growth in units is consistent with population growth occurring in theregion but has put some pressure on housing prices.
From 2000 to 2005, prices rose by 18 percent to $239,500, which is higher thansome markets but still lower than the national increase in housing prices. Housingprices in Denver, though, were already well above the national average of $167,500.
The Denver transit region was home to nearly one million households in 2000 and isexpected to grow by 57 percent to 1.5 million households in 2030, with 10.2 percentof the households expected to want housing near transit.
In November 2004, voters in the Denver Metropolitan Region passed the“FasTracks” ballot measure. The half-cent sales tax revenues will fund theconstruction of five new transit lines in 15 years, representing a $4.7 billion regionalinfrastructure investment. This ballot measure gathered political support, in part, ontwo arguments: (1) that the region needs transportation alternatives to diminishcongestion and remain economically competitive and (2) to shape future growtharound walkable, mixed-use neighborhoods served by transit. In 2000, five percentof work trips in the region were made on transit, but Denver also had one of thehighest rates of pedestrian trips in the nation at 11.2 percent.
DenverStations ExistingStations 2030
2487
System Size Small-MediumTransit Technologies Light Rail2000 TZ HH 17,3722030 TZ HH Demand 155,076Market Strong City/Suburb
24
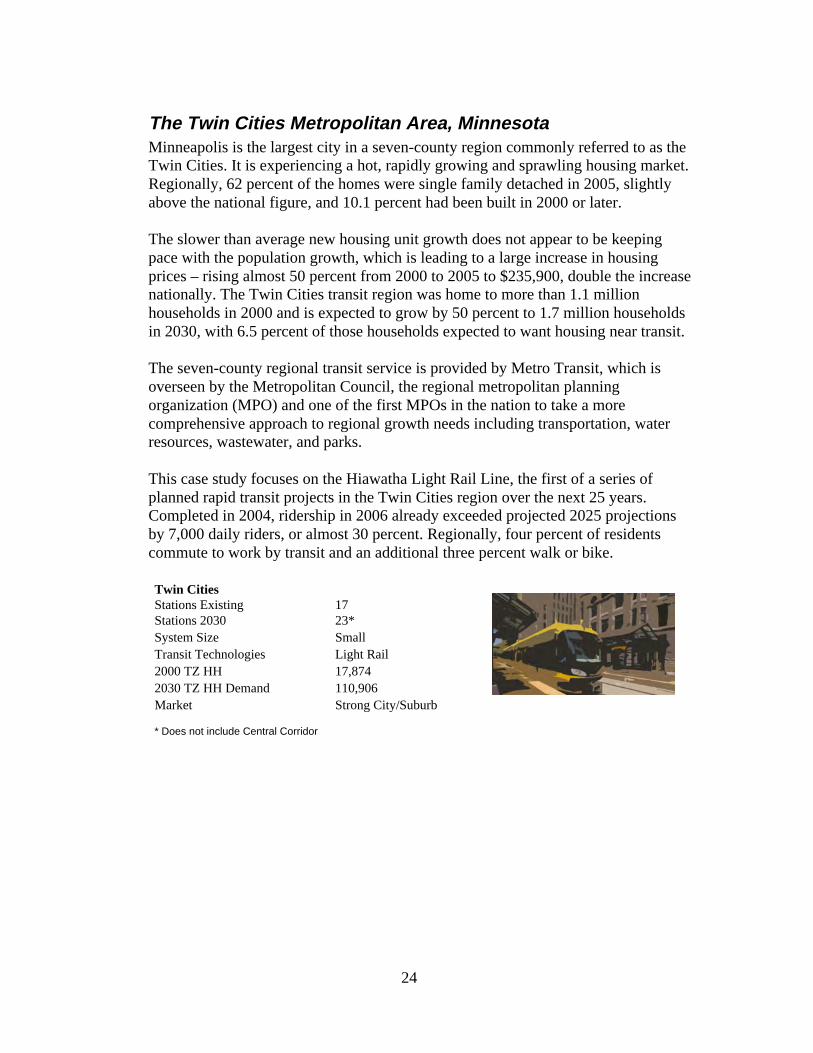
The Twin Cities Metropolitan Area, MinnesotaMinneapolis is the largest city in a seven-county region commonly referred to as theTwin Cities. It is experiencing a hot, rapidly growing and sprawling housing market.Regionally, 62 percent of the homes were single family detached in 2005, slightlyabove the national figure, and 10.1 percent had been built in 2000 or later.
The slower than average new housing unit growth does not appear to be keepingpace with the population growth, which is leading to a large increase in housingprices – rising almost 50 percent from 2000 to 2005 to $235,900, double the increasenationally. The Twin Cities transit region was home to more than 1.1 millionhouseholds in 2000 and is expected to grow by 50 percent to 1.7 million householdsin 2030, with 6.5 percent of those households expected to want housing near transit.
The seven-county regional transit service is provided by Metro Transit, which isoverseen by the Metropolitan Council, the regional metropolitan planningorganization (MPO) and one of the first MPOs in the nation to take a morecomprehensive approach to regional growth needs including transportation, waterresources, wastewater, and parks.
This case study focuses on the Hiawatha Light Rail Line, the first of a series ofplanned rapid transit projects in the Twin Cities region over the next 25 years.Completed in 2004, ridership in 2006 already exceeded projected 2025 projectionsby 7,000 daily riders, or almost 30 percent. Regionally, four percent of residentscommute to work by transit and an additional three percent walk or bike.
Twin CitiesStations ExistingStations 2030
1723*
System Size SmallTransit Technologies Light Rail2000 TZ HH 17,8742030 TZ HH Demand 110,906Market Strong City/Suburb
* Does not include Central Corridor
25
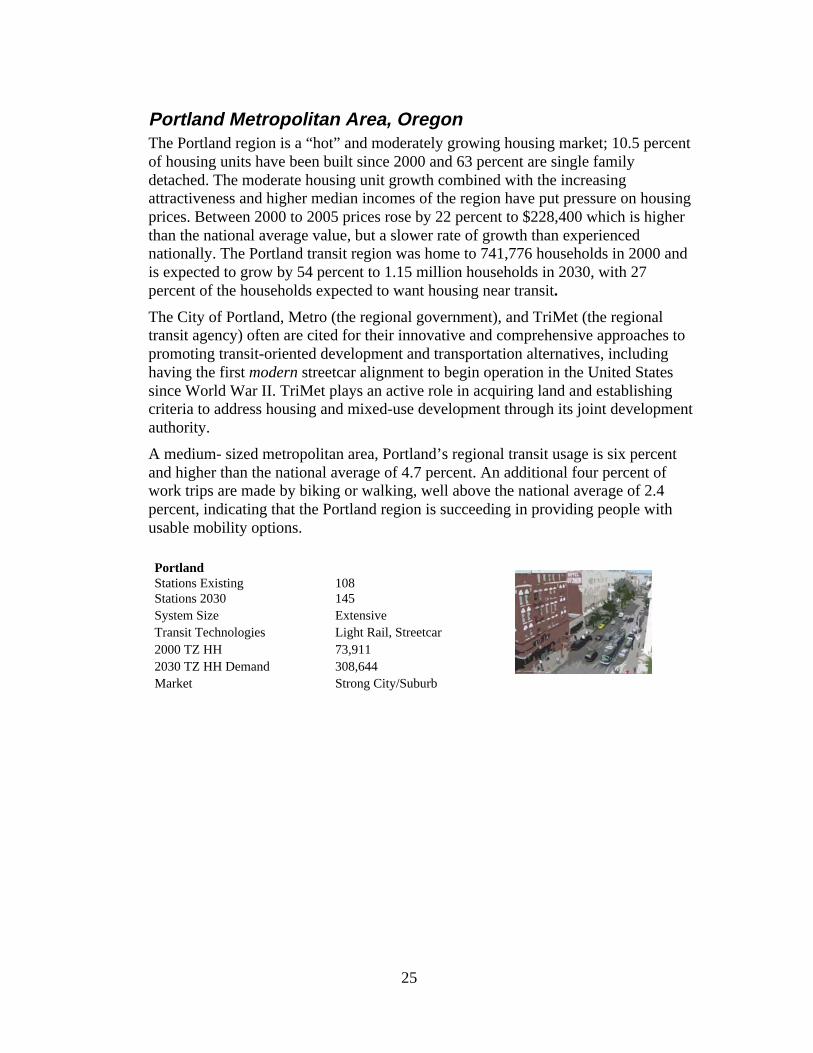
Portland Metropolitan Area, OregonThe Portland region is a “hot” and moderately growing housing market; 10.5 percentof housing units have been built since 2000 and 63 percent are single familydetached. The moderate housing unit growth combined with the increasingattractiveness and higher median incomes of the region have put pressure on housingprices. Between 2000 to 2005 prices rose by 22 percent to $228,400 which is higherthan the national average value, but a slower rate of growth than experiencednationally. The Portland transit region was home to 741,776 households in 2000 andis expected to grow by 54 percent to 1.15 million households in 2030, with 27percent of the households expected to want housing near transit.The City of Portland, Metro (the regional government), and TriMet (the regionaltransit agency) often are cited for their innovative and comprehensive approaches topromoting transit-oriented development and transportation alternatives, includinghaving the first modern streetcar alignment to begin operation in the United Statessince World War II. TriMet plays an active role in acquiring land and establishingcriteria to address housing and mixed-use development through its joint developmentauthority.A medium- sized metropolitan area, Portland’s regional transit usage is six percentand higher than the national average of 4.7 percent. An additional four percent ofwork trips are made by biking or walking, well above the national average of 2.4percent, indicating that the Portland region is succeeding in providing people withusable mobility options.
PortlandStations ExistingStations 2030
108145
System Size ExtensiveTransit Technologies Light Rail, Streetcar2000 TZ HH 73,9112030 TZ HH Demand 308,644Market Strong City/Suburb
26
Focusing in on Corridor-Level InvestmentsTo better understand the dynamics at play in each region, to see how policies arebeing used, and to see how land use, demographics and market forces influence TODdevelopment opportunity and affordability, this report focuses on a specific transitcorridor within each region.
Corridor Typology: Distinguishing FunctionsTransit corridors function very differently depending on the types of activities thatare located at various stops along the line. This preliminary Corridor Typologybegins to assess how five different corridors may provide lessons and informridership potential, development opportunities, and the likelihood that newdevelopment will stimulate gentrification or displacement.
• Urban Commuter CorridorThe commuter corridor’s primary function is to serve workers traveling fromneighborhoods within the urbanized areas of a region to downtown jobs. UrbanCommuter Corridors are often sited in abandoned or existing freight rail rights-of-way and in some cases, commuter service is shared with freight service. Service isprovided through diesel commuter cars, electrified commuter cars and/or expressbus.
Connections to other transit lines from Urban Commuter Corridors are often minimaland service frequency of these lines is often with 20 to 30 minute headways. Anumber of the nation’s larger metropolitan areas contain active commuter corridors,including Boston, Chicago, the San Francisco Bay Area, Washington, DC, and NewYork-New Jersey. Boston’s Fairmount/Indigo Line is an example of the UrbanCommuter Corridor.
• District CirculatorThe primary purpose of the District Circulator is to provide additional mobility frombusiness districts to areas that might be just beyond a reasonable walking distance orto stimulate revitalization of underutilized areas near downtowns. Commercial andmixed-uses are dominant along the alignment. District circulators were onceprovided by streetcars, but now the function is served primarily by buses, with stopsevery two to three blocks. Portland’s modern streetcar, described in this study, hasstops every two to three blocks.
Streets along the line are very walkable and mixed and commercial uses aredominant. District circulators in the form of streetcar lines exist in Portland, Oregon,Tampa, Florida, and Kenosha, Wisconsin, among other places.
• Planned Growth CorridorThe primary purposes of the planned growth corridor are to promote economicdevelopment and to provide congestion mitigation. Using any number of fixedguideway technologies, the route chosen is often on an existing abandoned right-of-
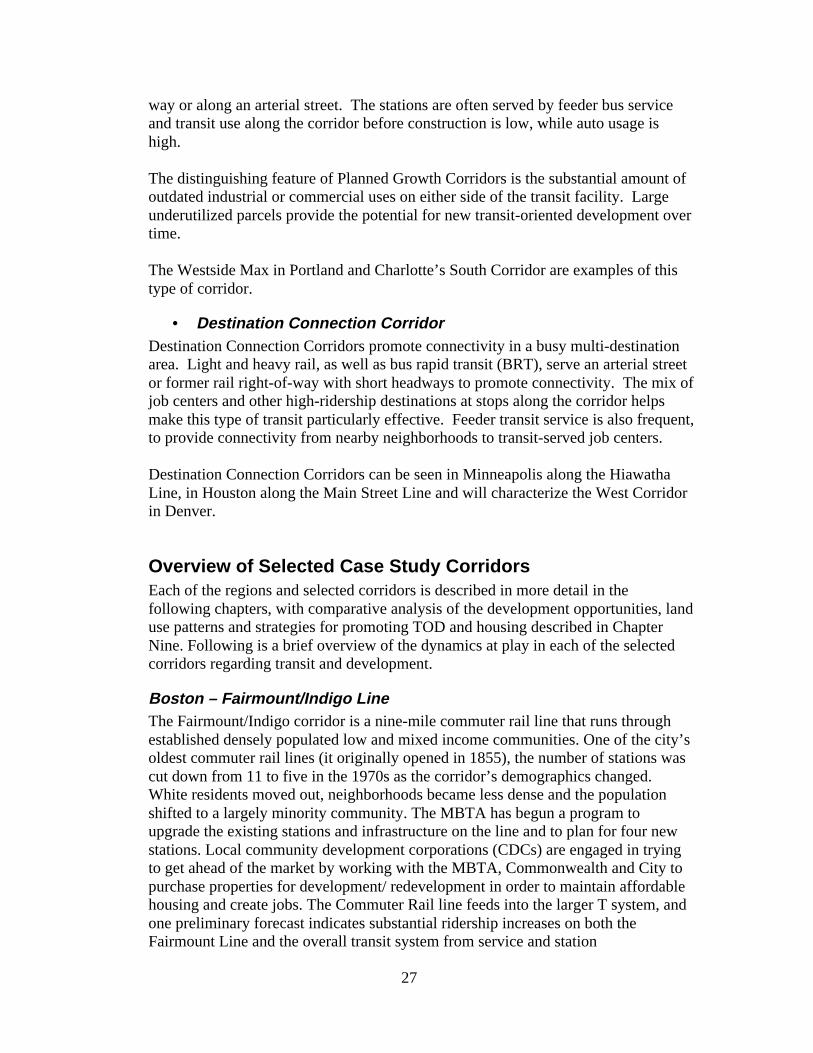
27
way or along an arterial street. The stations are often served by feeder bus serviceand transit use along the corridor before construction is low, while auto usage ishigh.
The distinguishing feature of Planned Growth Corridors is the substantial amount ofoutdated industrial or commercial uses on either side of the transit facility. Largeunderutilized parcels provide the potential for new transit-oriented development overtime.
The Westside Max in Portland and Charlotte’s South Corridor are examples of thistype of corridor.
• Destination Connection CorridorDestination Connection Corridors promote connectivity in a busy multi-destinationarea. Light and heavy rail, as well as bus rapid transit (BRT), serve an arterial streetor former rail right-of-way with short headways to promote connectivity. The mix ofjob centers and other high-ridership destinations at stops along the corridor helpsmake this type of transit particularly effective. Feeder transit service is also frequent,to provide connectivity from nearby neighborhoods to transit-served job centers.
Destination Connection Corridors can be seen in Minneapolis along the HiawathaLine, in Houston along the Main Street Line and will characterize the West Corridorin Denver.
Overview of Selected Case Study CorridorsEach of the regions and selected corridors is described in more detail in thefollowing chapters, with comparative analysis of the development opportunities, landuse patterns and strategies for promoting TOD and housing described in ChapterNine. Following is a brief overview of the dynamics at play in each of the selectedcorridors regarding transit and development.
Boston – Fairmount/Indigo LineThe Fairmount/Indigo corridor is a nine-mile commuter rail line that runs throughestablished densely populated low and mixed income communities. One of the city’soldest commuter rail lines (it originally opened in 1855), the number of stations wascut down from 11 to five in the 1970s as the corridor’s demographics changed.White residents moved out, neighborhoods became less dense and the populationshifted to a largely minority community. The MBTA has begun a program toupgrade the existing stations and infrastructure on the line and to plan for four newstations. Local community development corporations (CDCs) are engaged in tryingto get ahead of the market by working with the MBTA, Commonwealth and City topurchase properties for development/ redevelopment in order to maintain affordablehousing and create jobs. The Commuter Rail line feeds into the larger T system, andone preliminary forecast indicates substantial ridership increases on both theFairmount Line and the overall transit system from service and station
28
improvements. Housing and land prices continue to escalate throughout the region,with the cost per unit approaching $400,000. Rising home prices are being pointed toas one of the reasons for the region and state’s population decline in recent years. Inresponse, the Commonwealth has taken strong measures to try and counter thistrend.40
Charlotte -- South Corridor/Blue LineThe South Corridor, also known as the Blue Line, is anticipated to begin operation in2007 with 15 stations. The light rail line will connect Charlotte’s Uptownneighborhood to suburban Pineville. As one of the fastest growing metropolitanareas in the nation, the City has approved a comprehensive land use plan to try andmanage this growth and tie new developments to transit. Current housing stock alongthe line can be characterized as fairly low-density, serving largely working class tolower-income, auto-dependent neighborhoods. The South End area has experiencedsignificant housing revitalization efforts in recent years and will be a corridor towatch in determining the ability of land use measures and transit investment torespond to market pressures.
Denver -- West CorridorThe West Corridor is currently in the final design phase and will be the secondFasTracks line to start operating when completed in 2013. The light rail line tiestogether several sub-regional centers, including Downtown Denver, a Countyadministrative complex and the Decatur/Federal Center. Significant opportunityexists for reinvestment in established housing stock, which could help stabilize thelow-income neighborhoods along the corridor. Brickyards, junkyards and a powerplant pose environmental justice issues along the corridor that need to be addressed.Two of the planned station areas have distressed public housing sites within a 1/2-mile distance. Fear of gentrification is common among current residents. Severalstations present the opportunity to coordinate intensification of employment useswith workforce and public housing.
Twin Cities -- Hiawatha CorridorThe 12-mile Hiawatha light rail line began operation in December 2004 with 17stations. The line connects the central business district to suburban Bloomington,home of the Mall of America and the Minneapolis-St Paul International Airport.Significant TOD has started to occur along the line, concentrated mostly in thedowntown area although smaller scale projects are beginning in older, establishedneighborhoods. The corridor is an emerging and changing market with its olderurban communities offering some of the region’s most affordable housing, and a mixof income and household types. The City of Minneapolis is completing a multi-yearrezoning and station area planning effort at each of the stations within itsjurisdiction. Local neighborhood organizations and community development 40 Efforts by the Commonwealth of Massachusetts to support TOD and affordable housing aredescribed in Chapter Four of this report.
29
corporations are active in the corridor, trying to ensure that development meetscommunity goals including affordable housing and also to try and address some localbarriers to infill development.
Portland – Streetcar from Pearl District to Waterfront
In 2001, Portland completed the first phase of its new modern streetcar line. Twoadditional extensions, to Portland State University and down to the Waterfront, havesince been added, comprising 6 miles of streetcar service, and more extensions arebeing planned. Approximately $2.3 billion in private development has occurredwithin two blocks of the line, a substantial return on the $52 million project. Once anold, underutilized industrial parcel of land with rail yards located near the WillametteRiver and adjoining the Central Business District, the Pearl District is now home to anew type of urban living with a vibrant mix of high density condominiums, parksand services. Developers worked with the City and TriMet to negotiate bothinfrastructure investment assistance and affordable housing goals. While thestreetcar’s economic development impact has been well documented, there has beenlittle research on the effectiveness of the strategies used to promote mixed incomehousing.
The next chapter discusses in detail efforts that are underway in Boston to increaseservice within the Fairmount/Indigo Line, and strategies to preserve and createmixed-income and affordable housing in the corridor.
30
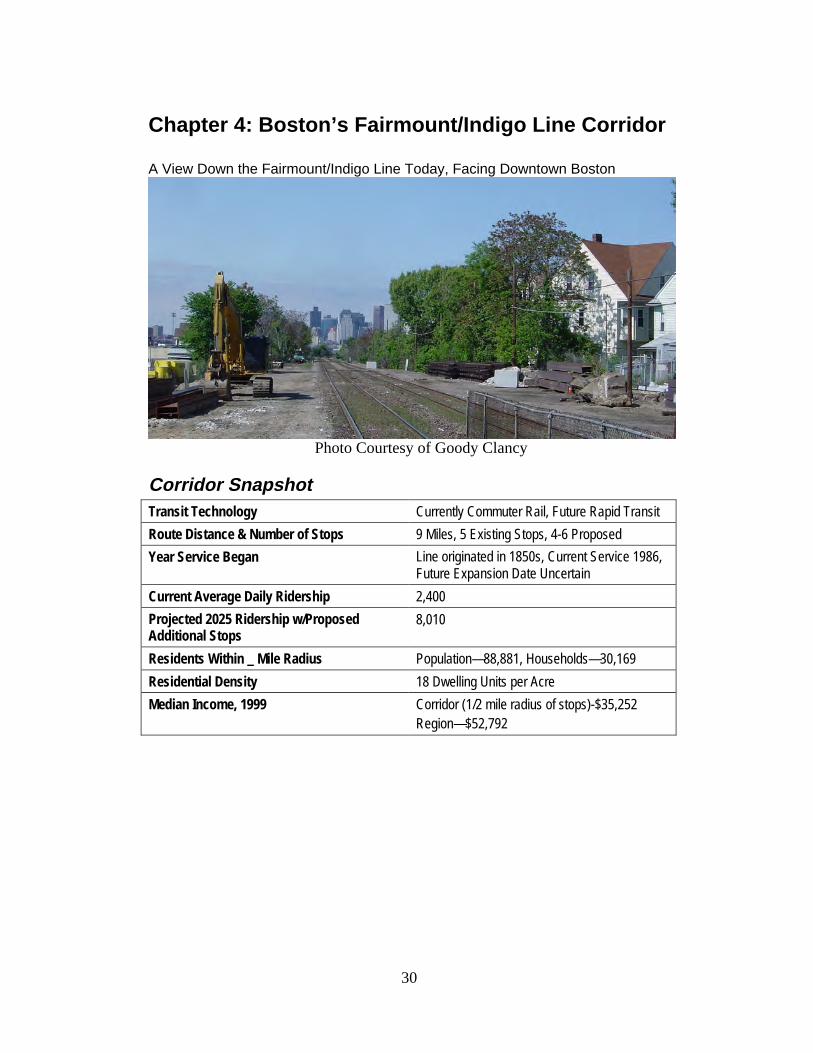
Chapter 4: Boston’s Fairmount/Indigo Line Corridor
A View Down the Fairmount/Indigo Line Today, Facing Downtown Boston
Photo Courtesy of Goody Clancy
Corridor SnapshotTransit Technology Currently Commuter Rail, Future Rapid Transit
Route Distance & Number of Stops 9 Miles, 5 Existing Stops, 4-6 Proposed
Year Service Began Line originated in 1850s, Current Service 1986,Future Expansion Date Uncertain
Current Average Daily Ridership 2,400
Projected 2025 Ridership w/ProposedAdditional Stops
8,010
Residents Within _ Mile Radius Population—88,881, Households—30,169
Residential Density 18 Dwelling Units per Acre
Median Income, 1999 Corridor (1/2 mile radius of stops)-$35,252Region—$52,792
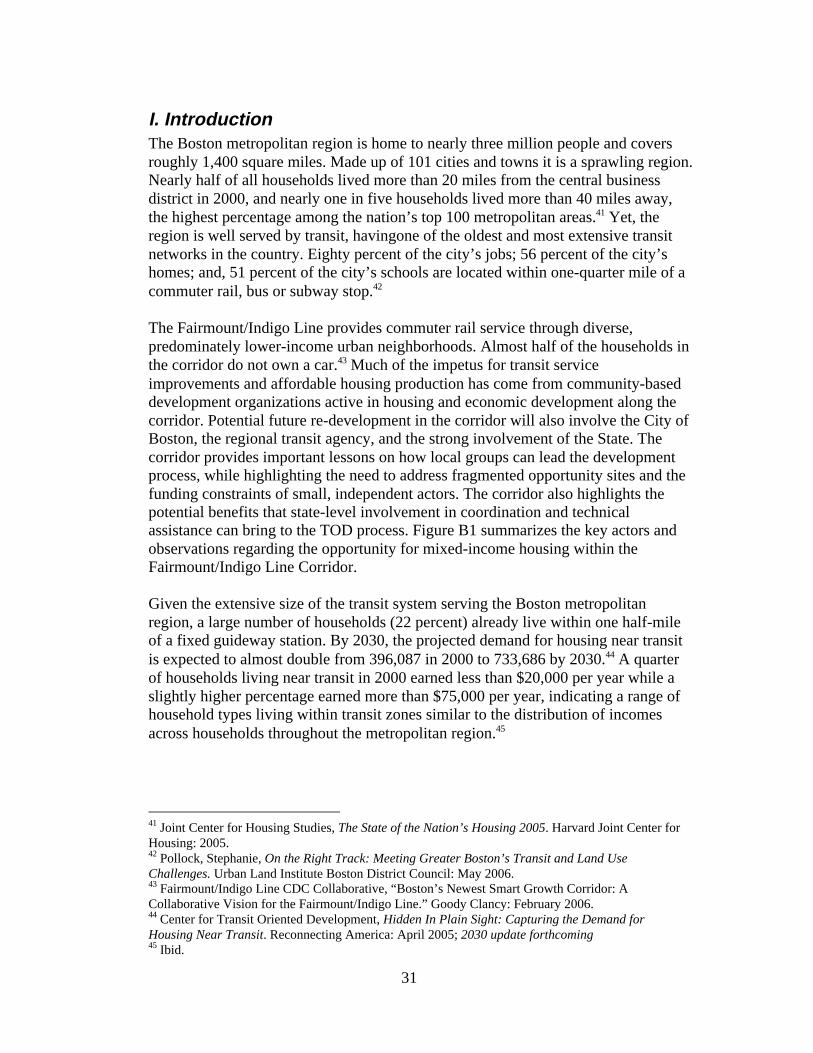
31
I. IntroductionThe Boston metropolitan region is home to nearly three million people and coversroughly 1,400 square miles. Made up of 101 cities and towns it is a sprawling region.Nearly half of all households lived more than 20 miles from the central businessdistrict in 2000, and nearly one in five households lived more than 40 miles away,the highest percentage among the nation’s top 100 metropolitan areas.41 Yet, theregion is well served by transit, havingone of the oldest and most extensive transitnetworks in the country. Eighty percent of the city’s jobs; 56 percent of the city’shomes; and, 51 percent of the city’s schools are located within one-quarter mile of acommuter rail, bus or subway stop.42
The Fairmount/Indigo Line provides commuter rail service through diverse,predominately lower-income urban neighborhoods. Almost half of the households inthe corridor do not own a car.43 Much of the impetus for transit serviceimprovements and affordable housing production has come from community-baseddevelopment organizations active in housing and economic development along thecorridor. Potential future re-development in the corridor will also involve the City ofBoston, the regional transit agency, and the strong involvement of the State. Thecorridor provides important lessons on how local groups can lead the developmentprocess, while highlighting the need to address fragmented opportunity sites and thefunding constraints of small, independent actors. The corridor also highlights thepotential benefits that state-level involvement in coordination and technicalassistance can bring to the TOD process. Figure B1 summarizes the key actors andobservations regarding the opportunity for mixed-income housing within theFairmount/Indigo Line Corridor.
Given the extensive size of the transit system serving the Boston metropolitanregion, a large number of households (22 percent) already live within one half-mileof a fixed guideway station. By 2030, the projected demand for housing near transitis expected to almost double from 396,087 in 2000 to 733,686 by 2030.44 A quarterof households living near transit in 2000 earned less than $20,000 per year while aslightly higher percentage earned more than $75,000 per year, indicating a range ofhousehold types living within transit zones similar to the distribution of incomesacross households throughout the metropolitan region.45
41 Joint Center for Housing Studies, The State of the Nation’s Housing 2005. Harvard Joint Center forHousing: 2005.42 Pollock, Stephanie, On the Right Track: Meeting Greater Boston’s Transit and Land UseChallenges. Urban Land Institute Boston District Council: May 2006.43 Fairmount/Indigo Line CDC Collaborative, “Boston’s Newest Smart Growth Corridor: ACollaborative Vision for the Fairmount/Indigo Line.” Goody Clancy: February 2006.44 Center for Transit Oriented Development, Hidden In Plain Sight: Capturing the Demand forHousing Near Transit. Reconnecting America: April 2005; 2030 update forthcoming45 Ibid.
32
Figure B1: Regional Actors and HighlightsKey Actors • Community Development Corporations (CDCs) take a large role in
affordable housing production.• State government plays an important role in coordinating TOD
activities between transit agency, City of Boston, and individualdevelopers.
• City of Boston has not taken proactive approach to planning in thecorridor.
• Massachusetts Bay Transportation Authority (MBTA) has limitedability to proactively partner in TOD given its current financial crisis.
Key Tools • State TOD Planning Manager coordinates between public and privatesector and various levels of government and provides technicalassistance on TOD implementation.
• State rewards cities for implementation of TOD districts with financialincentives through smart growth housing laws (Chapters 40R and40S).
• State TOD Infrastructure and Housing Support program providescapital funding for development projects within _ mile of transitstations.
Obstacles toMixed-Income TOD
• Large number of small, fragmented TOD sites in corridor limitsaffordable housing opportunities.
• Lack of comprehensive planning efforts at local level limits potentialfor coordinated planning.
• State home rule restrictions limit local government ability to leverageTOD opportunities.
Lessons for OtherCorridors
• State-level programs can improve intergovernmental coordination andprovide funding sources for TOD.
• CDCs can provide important capacity for developing affordablehousing and generating community support for improved transitservice, but require technical expertise and organizational capacity tobe effective.
• TOD-specific Affordable Housing Funds can increase the number offunding sources necessary to develop an affordable housing project,while TOD-specific scoring criteria for larger funding sources canprioritize affordable housing projects near transit.
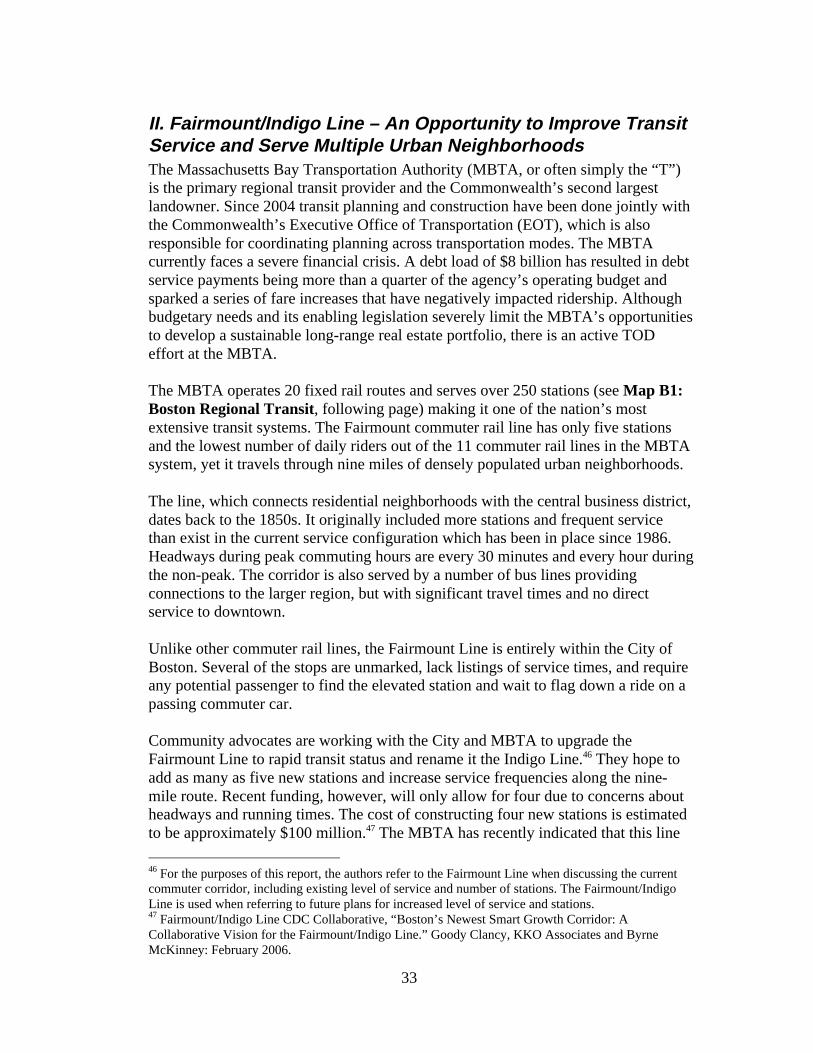
33
II. Fairmount/Indigo Line – An Opportunity to Improve TransitService and Serve Multiple Urban NeighborhoodsThe Massachusetts Bay Transportation Authority (MBTA, or often simply the “T”)is the primary regional transit provider and the Commonwealth’s second largestlandowner. Since 2004 transit planning and construction have been done jointly withthe Commonwealth’s Executive Office of Transportation (EOT), which is alsoresponsible for coordinating planning across transportation modes. The MBTAcurrently faces a severe financial crisis. A debt load of $8 billion has resulted in debtservice payments being more than a quarter of the agency’s operating budget andsparked a series of fare increases that have negatively impacted ridership. Althoughbudgetary needs and its enabling legislation severely limit the MBTA’s opportunitiesto develop a sustainable long-range real estate portfolio, there is an active TODeffort at the MBTA.
The MBTA operates 20 fixed rail routes and serves over 250 stations (see Map B1:Boston Regional Transit, following page) making it one of the nation’s mostextensive transit systems. The Fairmount commuter rail line has only five stationsand the lowest number of daily riders out of the 11 commuter rail lines in the MBTAsystem, yet it travels through nine miles of densely populated urban neighborhoods.
The line, which connects residential neighborhoods with the central business district,dates back to the 1850s. It originally included more stations and frequent servicethan exist in the current service configuration which has been in place since 1986.Headways during peak commuting hours are every 30 minutes and every hour duringthe non-peak. The corridor is also served by a number of bus lines providingconnections to the larger region, but with significant travel times and no directservice to downtown.
Unlike other commuter rail lines, the Fairmount Line is entirely within the City ofBoston. Several of the stops are unmarked, lack listings of service times, and requireany potential passenger to find the elevated station and wait to flag down a ride on apassing commuter car.
Community advocates are working with the City and MBTA to upgrade theFairmount Line to rapid transit status and rename it the Indigo Line.46 They hope toadd as many as five new stations and increase service frequencies along the nine-mile route. Recent funding, however, will only allow for four due to concerns aboutheadways and running times. The cost of constructing four new stations is estimatedto be approximately $100 million.47 The MBTA has recently indicated that this line 46 For the purposes of this report, the authors refer to the Fairmount Line when discussing the currentcommuter corridor, including existing level of service and number of stations. The Fairmount/IndigoLine is used when referring to future plans for increased level of service and stations.47 Fairmount/Indigo Line CDC Collaborative, “Boston’s Newest Smart Growth Corridor: ACollaborative Vision for the Fairmount/Indigo Line.” Goody Clancy, KKO Associates and ByrneMcKinney: February 2006.
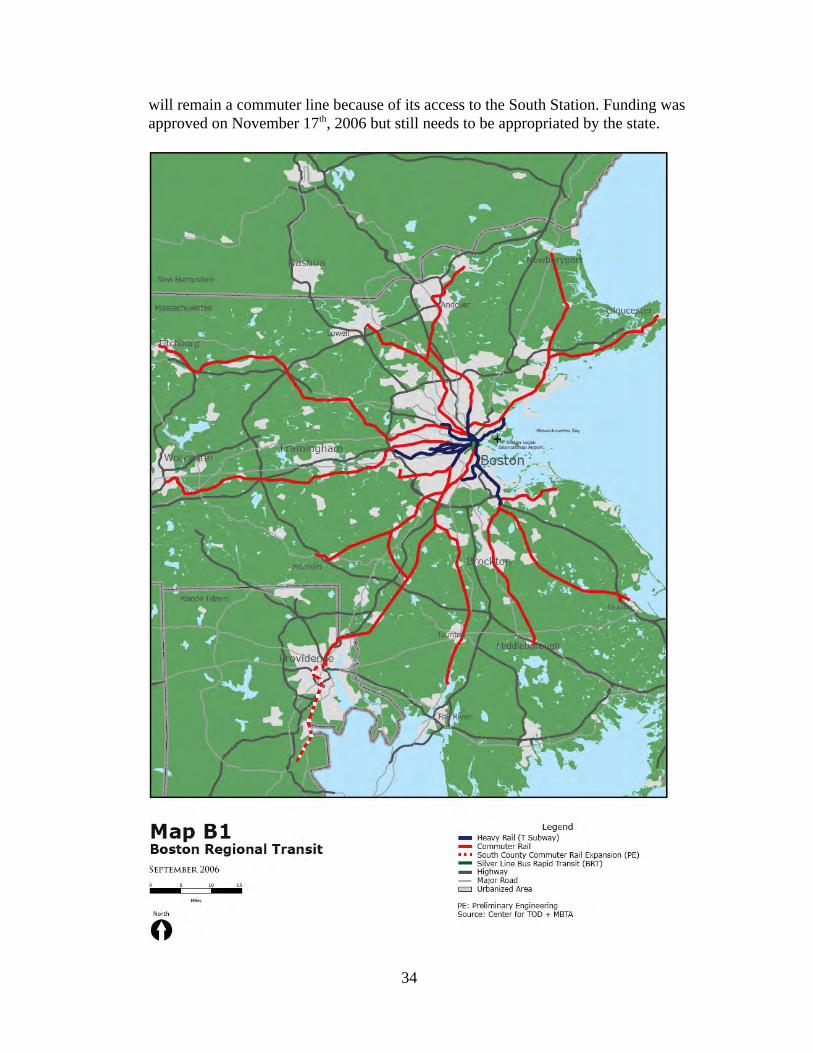
34
will remain a commuter line because of its access to the South Station. Funding wasapproved on November 17th, 2006 but still needs to be appropriated by the state.
35
Of the more than 163,000 people in the service areas of the Fairmount Line, 63percent are people of color and in the section of the corridor between Upham’sCorner and Morton Street – currently without stations, but slated for infill stations aspart of the Indigo Line – 91 percent of the population are people of color who arehighly transit-dependent, with almost half of the households not owning a car.48 Thecorridor has not seen a large amount of new development, but new market-ratecondominiums and houses are being constructed and selling at upwards of $350,000,outside of the price range of most of the current corridor residents.49
III. Regional TOD Housing Market Will Continue to GrowThe local housing market exhibits great variation across the Boston metropolitanregion, with some neighborhoods having extremely high median home values whileothers suffer from decades of underinvestment. As to be expected from an olderindustrial northeast city, the majority of housing stock (60 percent) was built prior to1940.50
Of the 253,532 housing units available in the region in 2005, almost 92 percent wereoccupied, indicating a very robust housing market with low levels of available vacantunits. The long-term regional housing production shortage has kept vacancy rateslow and prices high. In the past five years the median household price in the Bostonregion climbed dramatically from $190,600 to $ 420,40051. This movement mighthelp to explain the change in household expenditure on housing. In 2000, roughly 26percent of households in the Boston region spent 30 percent or more of their incomeon owner-occupied housing, while 40 percent of renters did the same. In 2005 thosenumbers were up, with 34 percent of household owners and 51 percent of rentersspending more than 30 percent of their income on housing52. The dramaticallyincreasing housing cost for both owners and renters makes Boston one of the mostexpensive housing markets nationally. Lower-priced neighborhoods where market-rate prices were affordable are quickly disappearing, leaving low- and moderate-income renters and homebuyers with dwindling options other than publicly assistedhousing and leaving the city.
Over the past five years, the City and Commonwealth have stepped forward toprovide new funding and policy tools to address the housing crisis. The City ofBoston has in its development pipeline more than 40 projects near T stations thatcould produce more than 9,000 new housing units. At this time an estimated 4,700units of housing are being planned or are already under construction in 22 stationarea development projects involving MBTA surplus land. Throughout the region, an
48 Fairmount/Indigo Line CDC Collaborative, Ibid.49 Ibid.50 US Census Bureau, 2005 American Community Survey, Selected Housing Characteristics.51 US Census Bureau, 2005 American Community Survey, Selected Housing Characteristics.52 Ibid.
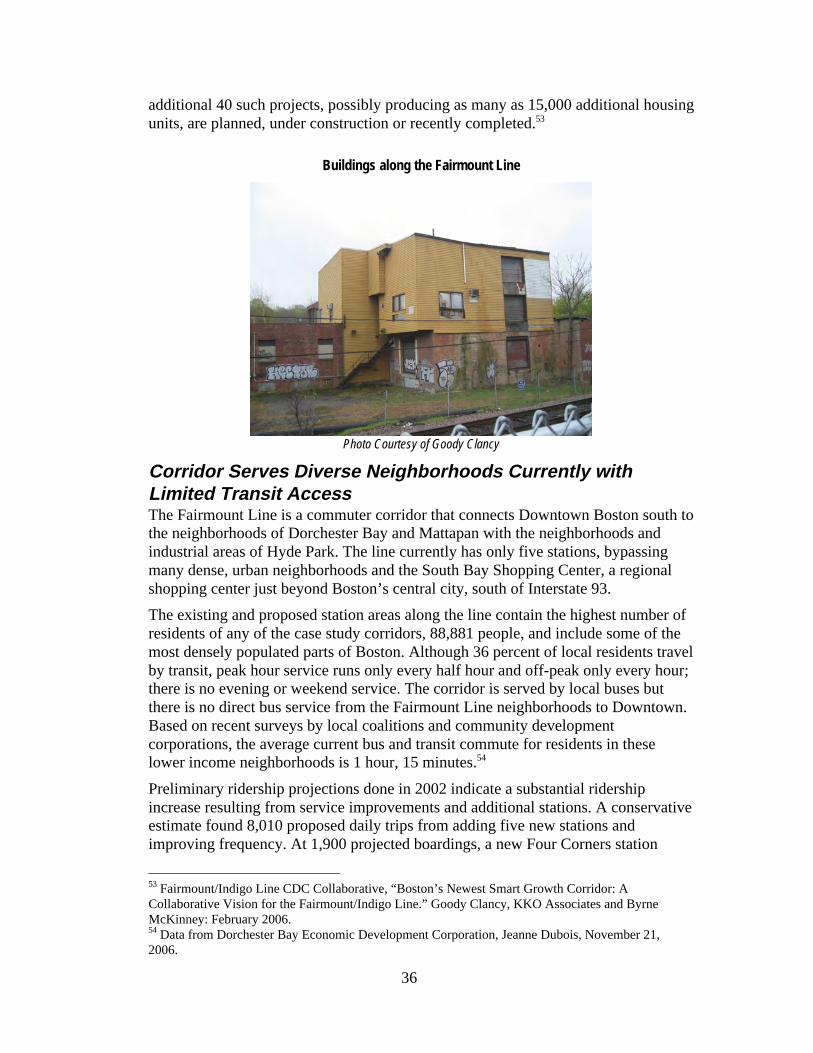
36
additional 40 such projects, possibly producing as many as 15,000 additional housingunits, are planned, under construction or recently completed.53
Buildings along the Fairmount Line
Photo Courtesy of Goody Clancy
Corridor Serves Diverse Neighborhoods Currently withLimited Transit AccessThe Fairmount Line is a commuter corridor that connects Downtown Boston south tothe neighborhoods of Dorchester Bay and Mattapan with the neighborhoods andindustrial areas of Hyde Park. The line currently has only five stations, bypassingmany dense, urban neighborhoods and the South Bay Shopping Center, a regionalshopping center just beyond Boston’s central city, south of Interstate 93.The existing and proposed station areas along the line contain the highest number ofresidents of any of the case study corridors, 88,881 people, and include some of themost densely populated parts of Boston. Although 36 percent of local residents travelby transit, peak hour service runs only every half hour and off-peak only every hour;there is no evening or weekend service. The corridor is served by local buses butthere is no direct bus service from the Fairmount Line neighborhoods to Downtown.Based on recent surveys by local coalitions and community developmentcorporations, the average current bus and transit commute for residents in theselower income neighborhoods is 1 hour, 15 minutes.54
Preliminary ridership projections done in 2002 indicate a substantial ridershipincrease resulting from service improvements and additional stations. A conservativeestimate found 8,010 proposed daily trips from adding five new stations andimproving frequency. At 1,900 projected boardings, a new Four Corners station
53 Fairmount/Indigo Line CDC Collaborative, “Boston’s Newest Smart Growth Corridor: ACollaborative Vision for the Fairmount/Indigo Line.” Goody Clancy, KKO Associates and ByrneMcKinney: February 2006.54 Data from Dorchester Bay Economic Development Corporation, Jeanne Dubois, November 21,2006.
37
would be the highest ridership station in the entire commuter rail system, outside ofNorth Station, South Station and Back Bay. Even if no additional serviceimprovements are made, a new station at Four Corners would achieve a ridership(1,350) that would rank it as the 9th highest performing station in the entire system.55
Four neighborhood economic and community development corporations (CDCs)have come together to collaborate on redevelopment, affordable housing andimproving the corridor’s transit service. Known collectively as the Fairmount/IndigoLine CDC collaborative, these groups have developed an impressive vision andstation area redevelopment plan for the neighborhoods of Dorchester Bay (NorthDorchester), Codman Square, Mattapan and Hyde Park.56 Additionally, each isacquiring property in neighborhoods near the alignment to provide more entry-leveljobs, neighborhood services and permanently affordable housing to the low-incomeresidents living in the corridor.
55 KKO and Associates produced its Fairmount Line Feasibility Study for the MBTA PlanningDepartment in October, 2002. The Report identifies six improvement packages, ranging from basic“State of Good Repair” improvements to modest expansion of service, including improved peak andoff-peak headways, as well as increased span and days of service, and five new stations, identified as“Improvement Package Five.” While Improvement Package Five falls short of the rapid transit-likelevels of service called for by neighborhood groups and area CDC’s envisioning and advocating for“Indigo Line” service in the corridor, KKO’s analysis nevertheless flags strong ridership potentialalong the line.56 Ibid.
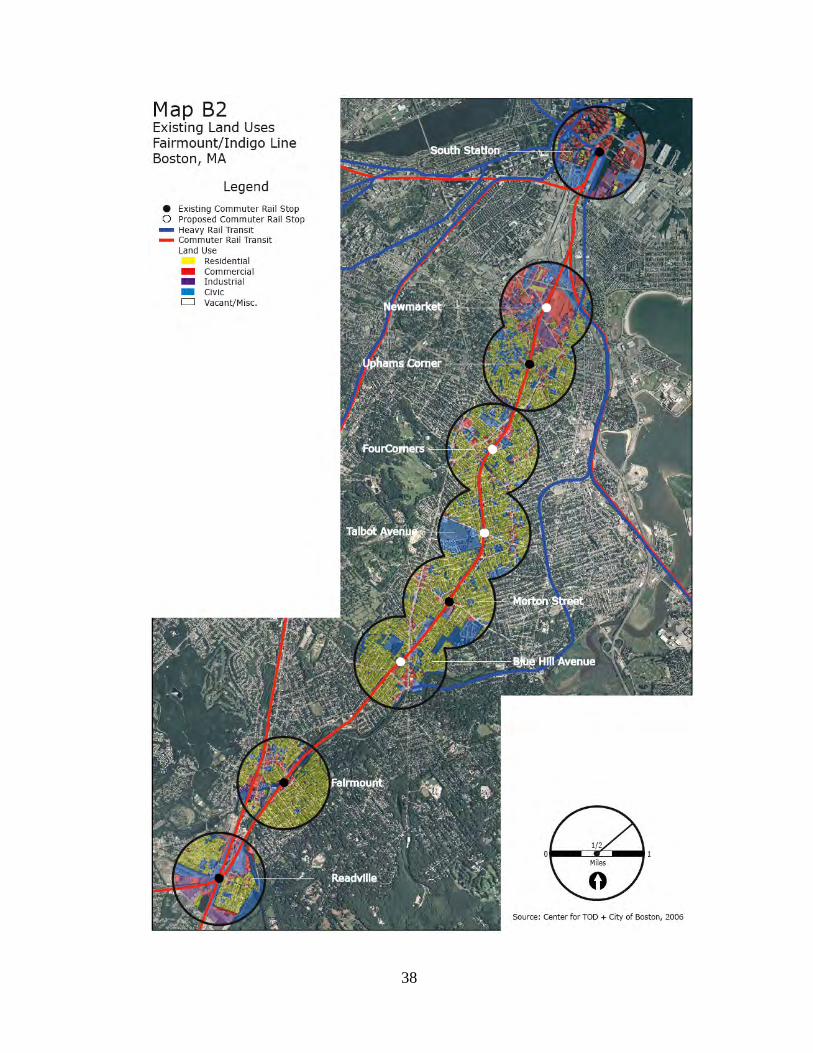
38
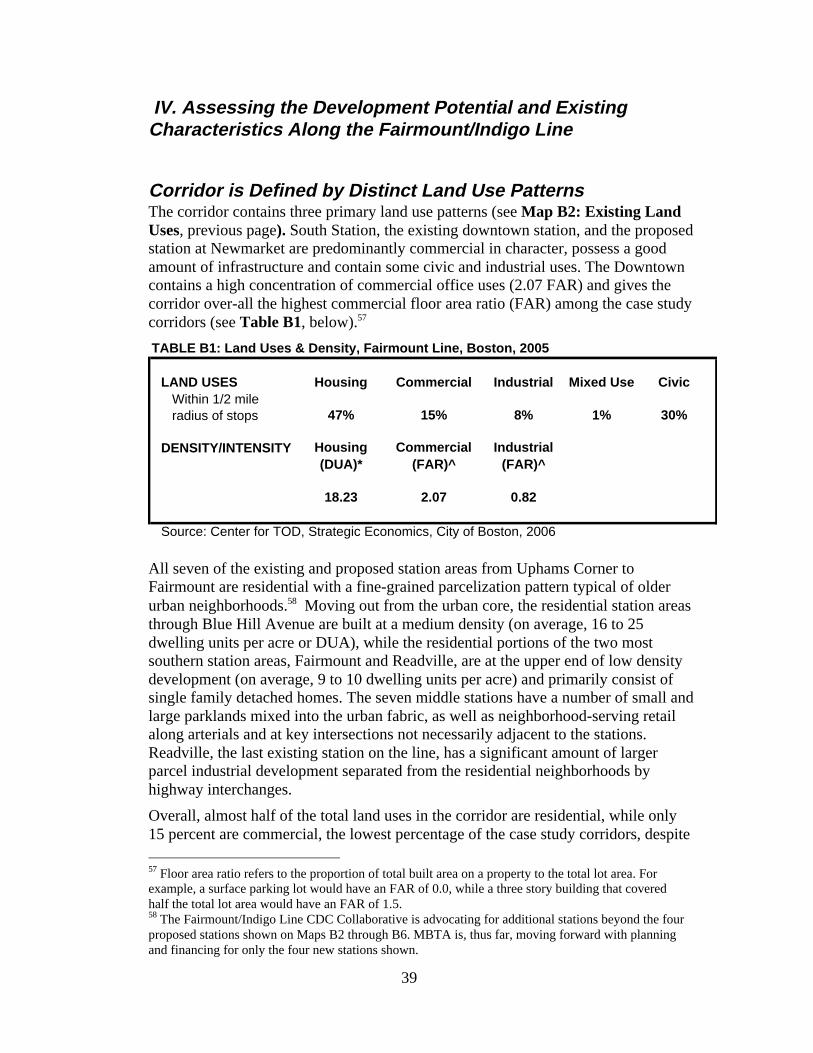
39
IV. Assessing the Development Potential and ExistingCharacteristics Along the Fairmount/Indigo Line
Corridor is Defined by Distinct Land Use PatternsThe corridor contains three primary land use patterns (see Map B2: Existing LandUses, previous page). South Station, the existing downtown station, and the proposedstation at Newmarket are predominantly commercial in character, possess a goodamount of infrastructure and contain some civic and industrial uses. The Downtowncontains a high concentration of commercial office uses (2.07 FAR) and gives thecorridor over-all the highest commercial floor area ratio (FAR) among the case studycorridors (see Table B1, below).57
All seven of the existing and proposed station areas from Uphams Corner toFairmount are residential with a fine-grained parcelization pattern typical of olderurban neighborhoods.58 Moving out from the urban core, the residential station areasthrough Blue Hill Avenue are built at a medium density (on average, 16 to 25dwelling units per acre or DUA), while the residential portions of the two mostsouthern station areas, Fairmount and Readville, are at the upper end of low densitydevelopment (on average, 9 to 10 dwelling units per acre) and primarily consist ofsingle family detached homes. The seven middle stations have a number of small andlarge parklands mixed into the urban fabric, as well as neighborhood-serving retailalong arterials and at key intersections not necessarily adjacent to the stations.Readville, the last existing station on the line, has a significant amount of largerparcel industrial development separated from the residential neighborhoods byhighway interchanges.
Overall, almost half of the total land uses in the corridor are residential, while only15 percent are commercial, the lowest percentage of the case study corridors, despite 57 Floor area ratio refers to the proportion of total built area on a property to the total lot area. Forexample, a surface parking lot would have an FAR of 0.0, while a three story building that coveredhalf the total lot area would have an FAR of 1.5.58 The Fairmount/Indigo Line CDC Collaborative is advocating for additional stations beyond the fourproposed stations shown on Maps B2 through B6. MBTA is, thus far, moving forward with planningand financing for only the four new stations shown.
TABLE B1: Land Uses & Density, Fairmount Line, Boston, 2005
LAND USES Housing Commercial Industrial Mixed Use Civic
47% 15% 8% 1% 30%
DENSITY/INTENSITY
18.23 2.07 0.82
Source: Center for TOD, Strategic Economics, City of Boston, 2006
Within 1/2 mile radius of stops
Housing (DUA)*
Commercial (FAR)^
Industrial (FAR)^
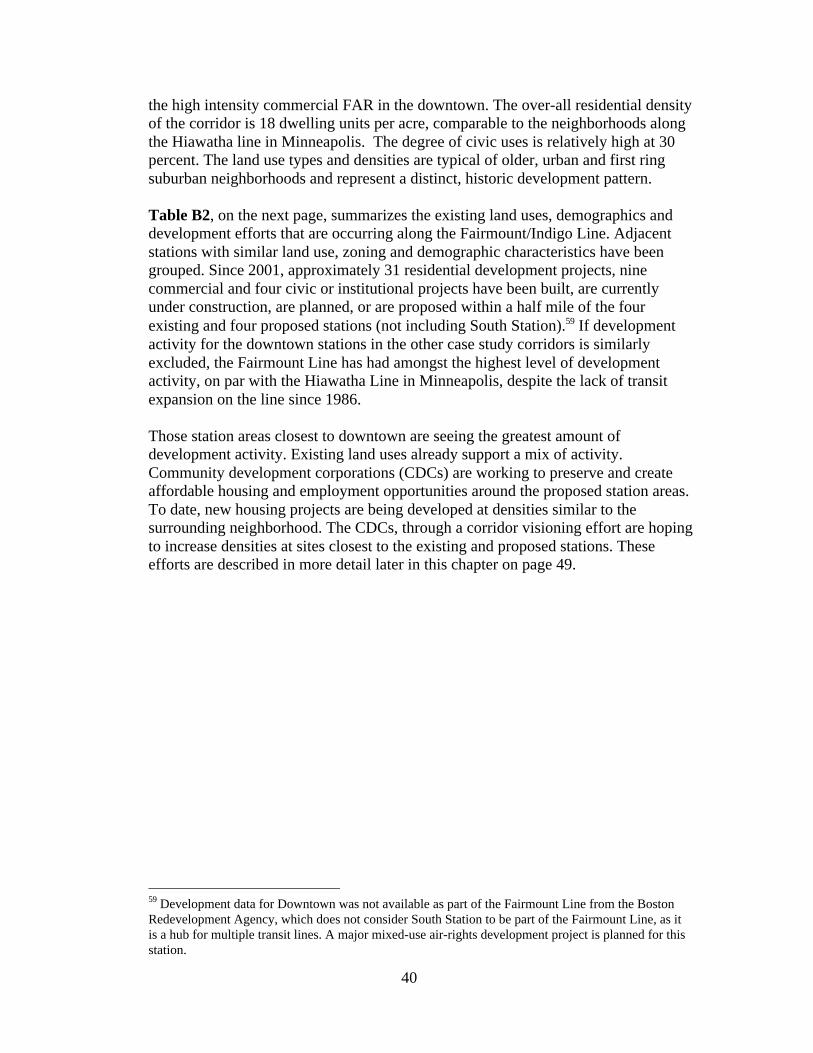
40
the high intensity commercial FAR in the downtown. The over-all residential densityof the corridor is 18 dwelling units per acre, comparable to the neighborhoods alongthe Hiawatha line in Minneapolis. The degree of civic uses is relatively high at 30percent. The land use types and densities are typical of older, urban and first ringsuburban neighborhoods and represent a distinct, historic development pattern.
Table B2, on the next page, summarizes the existing land uses, demographics anddevelopment efforts that are occurring along the Fairmount/Indigo Line. Adjacentstations with similar land use, zoning and demographic characteristics have beengrouped. Since 2001, approximately 31 residential development projects, ninecommercial and four civic or institutional projects have been built, are currentlyunder construction, are planned, or are proposed within a half mile of the fourexisting and four proposed stations (not including South Station).59 If developmentactivity for the downtown stations in the other case study corridors is similarlyexcluded, the Fairmount Line has had amongst the highest level of developmentactivity, on par with the Hiawatha Line in Minneapolis, despite the lack of transitexpansion on the line since 1986.
Those station areas closest to downtown are seeing the greatest amount ofdevelopment activity. Existing land uses already support a mix of activity.Community development corporations (CDCs) are working to preserve and createaffordable housing and employment opportunities around the proposed station areas.To date, new housing projects are being developed at densities similar to thesurrounding neighborhood. The CDCs, through a corridor visioning effort are hopingto increase densities at sites closest to the existing and proposed stations. Theseefforts are described in more detail later in this chapter on page 49.
59 Development data for Downtown was not available as part of the Fairmount Line from the BostonRedevelopment Agency, which does not consider South Station to be part of the Fairmount Line, as itis a hub for multiple transit lines. A major mixed-use air-rights development project is planned for thisstation.
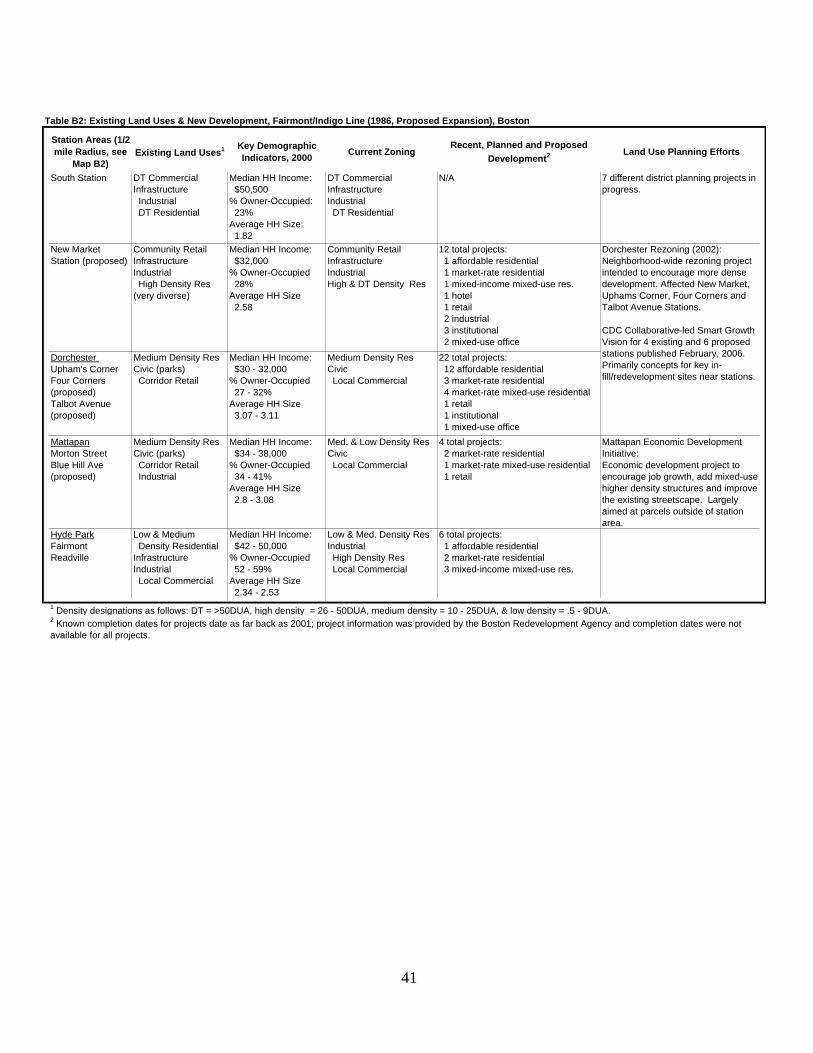
41
Table B2: Existing Land Uses & New Development, Fairmont/Indigo Line (1986, Proposed Expansion), Boston
Station Areas (1/2 mile Radius, see
Map B2)Existing Land Uses1 Key Demographic
Indicators, 2000Current Zoning
Recent, Planned and Proposed
Development2 Land Use Planning Efforts
South Station DT CommercialInfrastructure Industrial DT Residential
Median HH Income: $50,500% Owner-Occupied: 23% Average HH Size: 1.82
DT CommercialInfrastructureIndustrial DT Residential
N/A 7 different district planning projects in progress.
New Market Station (proposed)
Community RetailInfrastructureIndustrial High Density Res(very diverse)
Median HH Income: $32,000 % Owner-Occupied 28% Average HH Size 2.58
Community RetailInfrastructureIndustrialHigh & DT Density Res
12 total projects: 1 affordable residential 1 market-rate residential 1 mixed-income mixed-use res. 1 hotel 1 retail 2 industrial 3 institutional 2 mixed-use office
Dorchester Upham's Corner Four Corners (proposed) Talbot Avenue (proposed)
Medium Density ResCivic (parks) Corridor Retail
Median HH Income: $30 - 32,000% Owner-Occupied 27 - 32% Average HH Size 3.07 - 3.11
Medium Density ResCivic Local Commercial
22 total projects: 12 affordable residential 3 market-rate residential 4 market-rate mixed-use residential 1 retail 1 institutional 1 mixed-use office
MattapanMorton StreetBlue Hill Ave (proposed)
Medium Density ResCivic (parks) Corridor Retail Industrial
Median HH Income: $34 - 38,000% Owner-Occupied 34 - 41% Average HH Size 2.8 - 3.08
Med. & Low Density ResCivic Local Commercial
4 total projects: 2 market-rate residential 1 market-rate mixed-use residential 1 retail
Mattapan Economic Development Initiative: Economic development project to encourage job growth, add mixed-use higher density structures and improve the existing streetscape. Largely aimed at parcels outside of station area.
Hyde ParkFairmontReadville
Low & Medium Density ResidentialInfrastructureIndustrial Local Commercial
Median HH Income: $42 - 50,000% Owner-Occupied 52 - 59% Average HH Size 2.34 - 2.53
Low & Med. Density ResIndustrial High Density Res Local Commercial
6 total projects: 1 affordable residential 2 market-rate residential 3 mixed-income mixed-use res.
2 Known completion dates for projects date as far back as 2001; project information was provided by the Boston Redevelopment Agency and completion dates were not available for all projects.
Dorchester Rezoning (2002): Neighborhood-wide rezoning project intended to encourage more dense development. Affected New Market, Uphams Corner, Four Corners and Talbot Avenue Stations. CDC Collaborative-led Smart Growth Vision for 4 existing and 6 proposed stations published February, 2006. Primarily concepts for key in-fill/redevelopment sites near stations.
1 Density designations as follows: DT = >50DUA, high density = 26 - 50DUA, medium density = 10 - 25DUA, & low density = .5 - 9DUA.
42
Underutilized Land Opportunities are Fragmented, SmallParcelsA critical factor in determining a corridor’s ability to evolve into a more transit-supportive environment is the amount and type of underutilized or redevelopableland in proximity to stations. Given the built-out nature of the Fairmount Corridorand finely parcelized development pattern of the historic neighborhoods, only 345acres of underutilized land exist along the corridor. (See Map B3, next page.) This isthe lowest amount of identified underutilized land among the case study corridors.
Most of the redevelopment opportunity in the corridor is found in small in-fill sitesthat are challenging to develop from a financial feasibility perspective and will not,in gross, significantly alter the character of the station areas. A number of thesescattered, small parcels are publicly owned, yielding the potential for the city to playa lead role in their redevelopment or negotiating redevelopment opportunities atadjacent sites through land assembly strategies.60 At 16 to 25 dwelling units per acre,much of the urban fabric surrounding the stations can already be considered transit-supportive, does not need significant public infrastructure improvements and has anexisting population that already uses transit for over a third of all trips.
A significant question for redevelopment is to what degree station areas couldfunction as centers of neighborhood commercial and social activity. Some of theexisting stations (i.e. Morton Street) are in the heart of, or immediately adjacent, tolocal-serving retail nodes or strips. In general, neighborhoods can support a finiteamount of local-serving retail, depending on their density and walkability.61 Planningand approval of new development should consider the total amount of retail that canreasonably be supported, and strategic ways in which new, in-fill mixed usedevelopment around the stations can support and connect with existing retail, ratherthan undercutting it.
The largest potential redevelopment opportunities may exist around the proposedNewmarket station and downtown South Station, and in an underutilized industrialor low intensity commercial land around the Readville station. This analysis does nottake into account the possibility of environmental contamination which does impactredevelopment potential, but that can be surmounted with the assistance ofbrownfield redevelopment liability and financing tools, in which Massachusetts is aleader.
Given the nature of the identified underutilized sites, their redevelopment potential issomewhat limited. However, through engagement of public and private stakeholders
60 In general, parcels owned by civic organizations (i.e. cities) were excluded from theunderutilization analysis because most are open space or uses that will not change in the near future.However, in Boston, there appear to be many small (i.e. under 1 acres) sites that are owned by thecity, but are currently vacant.61 Some of the existing retail districts are specialty retail nodes, i.e. Codman Square with its Caribbeanwares, which have potential for more growth as their markets extend beyond the immediateneighborhood.
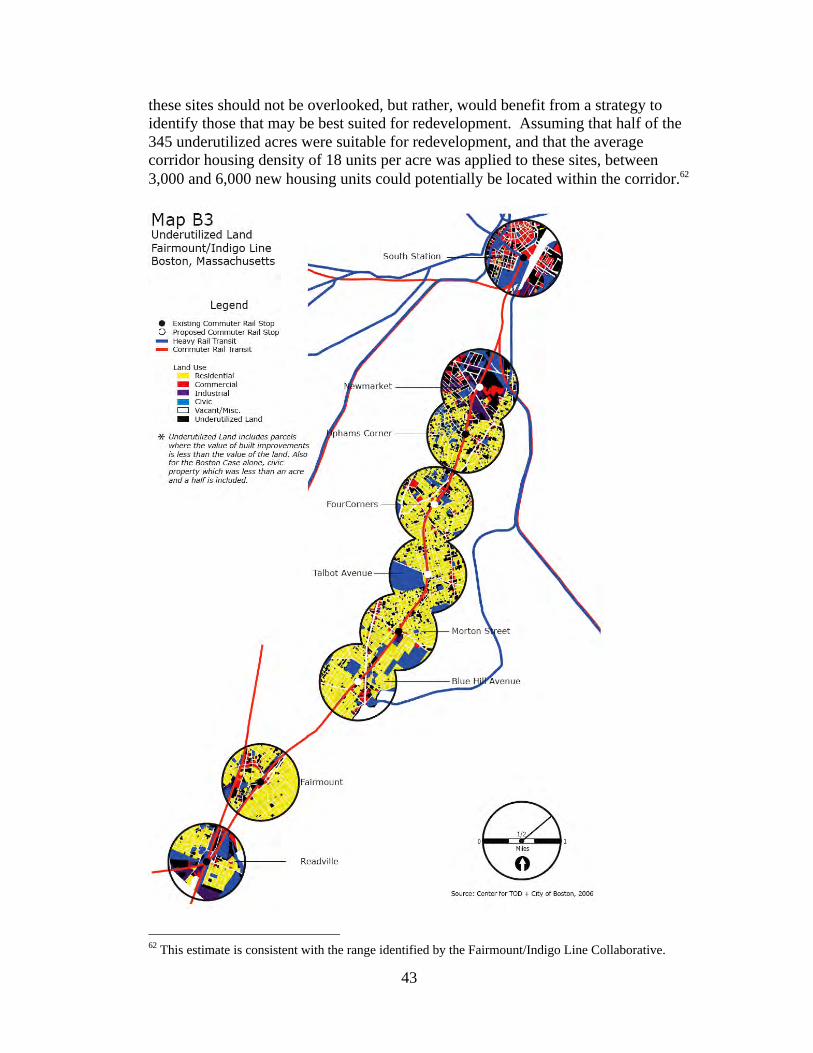
43
these sites should not be overlooked, but rather, would benefit from a strategy toidentify those that may be best suited for redevelopment. Assuming that half of the345 underutilized acres were suitable for redevelopment, and that the averagecorridor housing density of 18 units per acre was applied to these sites, between3,000 and 6,000 new housing units could potentially be located within the corridor.62
62 This estimate is consistent with the range identified by the Fairmount/Indigo Line Collaborative.
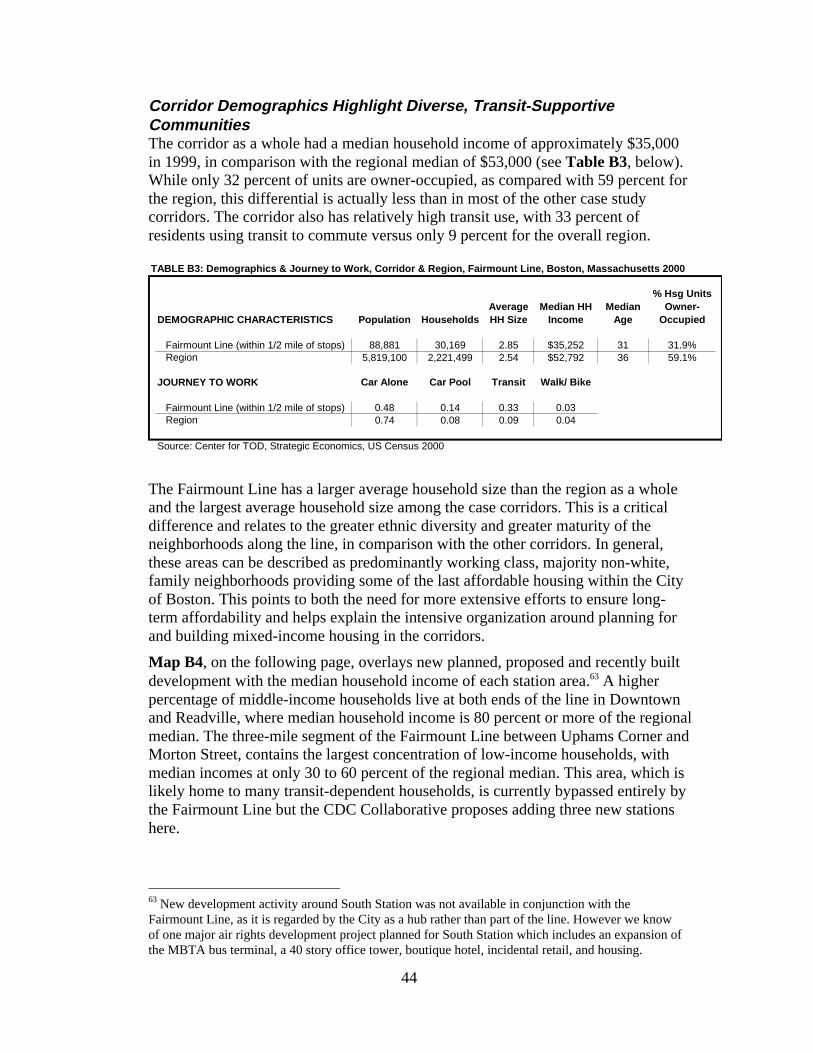
44
Corridor Demographics Highlight Diverse, Transit-SupportiveCommunitiesThe corridor as a whole had a median household income of approximately $35,000in 1999, in comparison with the regional median of $53,000 (see Table B3, below).While only 32 percent of units are owner-occupied, as compared with 59 percent forthe region, this differential is actually less than in most of the other case studycorridors. The corridor also has relatively high transit use, with 33 percent ofresidents using transit to commute versus only 9 percent for the overall region.
TABLE B3: Demographics & Journey to Work, Corridor & Region, Fairmount Line, Boston, Massachusetts 2000
DEMOGRAPHIC CHARACTERISTICS Population Households
Fairmount Line (within 1/2 mile of stops) 88,881 30,169 2.85 $35,252 31 31.9%Region 5,819,100 2,221,499 2.54 $52,792 36 59.1%
JOURNEY TO WORK Car Alone Car Pool Transit Walk/ Bike
Fairmount Line (within 1/2 mile of stops) 0.48 0.14 0.33 0.03Region 0.74 0.08 0.09 0.04
Source: Center for TOD, Strategic Economics, US Census 2000
% Hsg Units Owner-
OccupiedAverage HH Size
Median HH Income
Median Age
The Fairmount Line has a larger average household size than the region as a wholeand the largest average household size among the case corridors. This is a criticaldifference and relates to the greater ethnic diversity and greater maturity of theneighborhoods along the line, in comparison with the other corridors. In general,these areas can be described as predominantly working class, majority non-white,family neighborhoods providing some of the last affordable housing within the Cityof Boston. This points to both the need for more extensive efforts to ensure long-term affordability and helps explain the intensive organization around planning forand building mixed-income housing in the corridors.
Map B4, on the following page, overlays new planned, proposed and recently builtdevelopment with the median household income of each station area.63 A higherpercentage of middle-income households live at both ends of the line in Downtownand Readville, where median household income is 80 percent or more of the regionalmedian. The three-mile segment of the Fairmount Line between Uphams Corner andMorton Street, contains the largest concentration of low-income households, withmedian incomes at only 30 to 60 percent of the regional median. This area, which islikely home to many transit-dependent households, is currently bypassed entirely bythe Fairmount Line but the CDC Collaborative proposes adding three new stationshere.
63 New development activity around South Station was not available in conjunction with theFairmount Line, as it is regarded by the City as a hub rather than part of the line. However we knowof one major air rights development project planned for South Station which includes an expansion ofthe MBTA bus terminal, a 40 story office tower, boutique hotel, incidental retail, and housing.
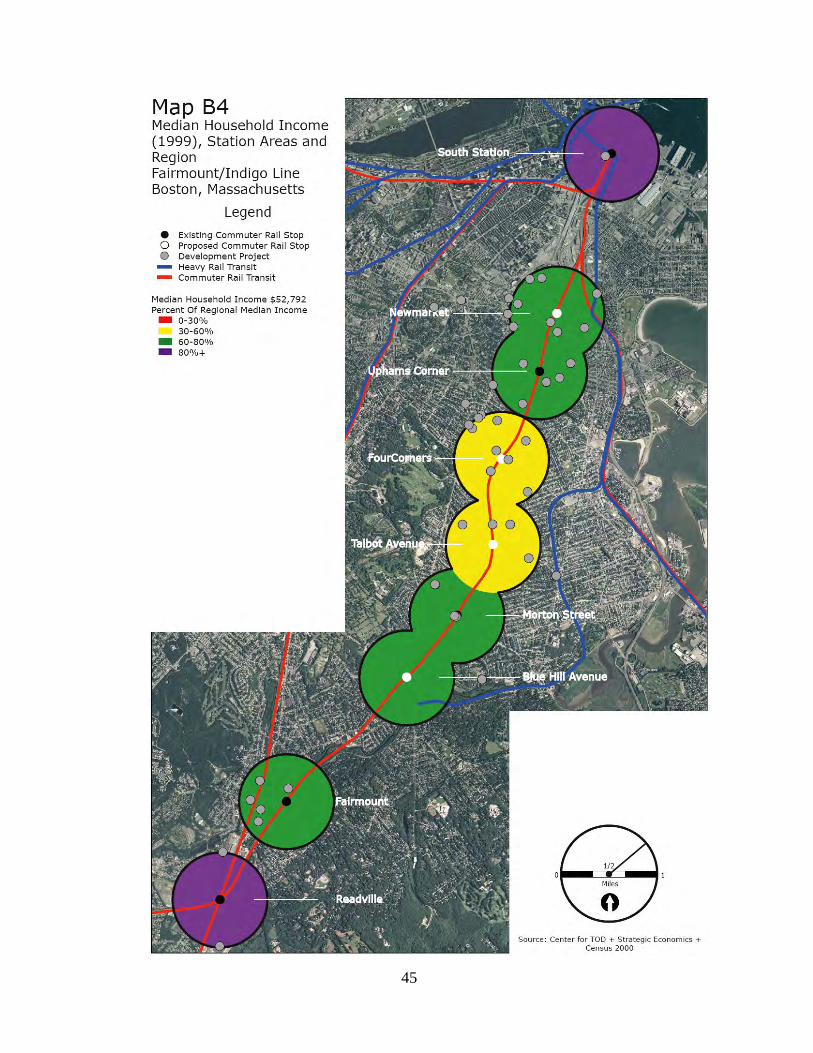
45
46
Reactive Land Use and Zoning Impedes Collaborationbetween City and NeighborhoodsStricter home rule restrictions in Massachusetts than in other states limit localdecision-making power and discourage regional cooperation.64 Massachusettsexplicitly denies local governments home rule authority over taxing or borrowing. Italso limits towns and cities from imposing impact fees or enacting a range ofaffordable housing regulations proven successful in other areas. Specific localimpacts are responses to community input within the permitting process and becausecities and towns lack adequate control over their own affairs, they often resist effortsat larger regional strategies for housing, transportation, the environment and othermatters that have a regional scope. Consequently the Commonwealth plays a criticalrole in setting policy and providing funding tools for towns and cities.
In general, land use and zoning in the corridor are consistent with the currentdensities and intensities of existing development. In 2002, the City of Bostonupdated zoning in Dorchester, including the Newmarket through Talbot Avenuestation areas and, in the Downtown area, seven different district planning efforts arecurrently in progress.
A number of local developers and practitioners are concerned by the frequentdisregard for existing zoning regulations in favor of development proposals viewedfavorably by the Boston Redevelopment Agency. Interviews suggest that variances,conditional use permits and spot re-zonings occur regularly in response todevelopment proposals and that concerted planning efforts often do not result inchanges in zoning that would guide and regulate future development. Althoughcommunity members have become wary of participating in planning processes,preferring to wait until actual projects are proposed to weigh in, community inputhas effectively informed development through the permitting process.
The inability of local government agencies and the Boston Redevelopment Authority(BRA) to rezone and consistently implement station area plans through the entiretyof the development process is a challenge for developers and local communities. Alarge amount of redevelopment is happening though through BRA support to localCDCs who are leading neighborhood-focused corridor planning and redevelopment.Map B5, next page, identifies a number of recent and proposed developmentprojects along the corridor. Development activity is particularly strong between theNew Market and Talbot stations, where local CDCs have the most developmentcapacity. The BRA’s strategy is empowering the non-profit and affordabledevelopers to direct long-term development that will meet shared community goals.While not all of these new developments are being done by CDCs, theFairmount/Indigo Line CDC Collaborative has developed a powerful vision forcorridor transformation that is being used to make the case for improved transitservice in the corridor, and to shape station area redevelopment.
64 Rappaport Institute for Greater Boston, Dispelling the Myth of Home Rule: Local Power in GreaterBoston. Kennedy School of Government, Harvard: 2004.
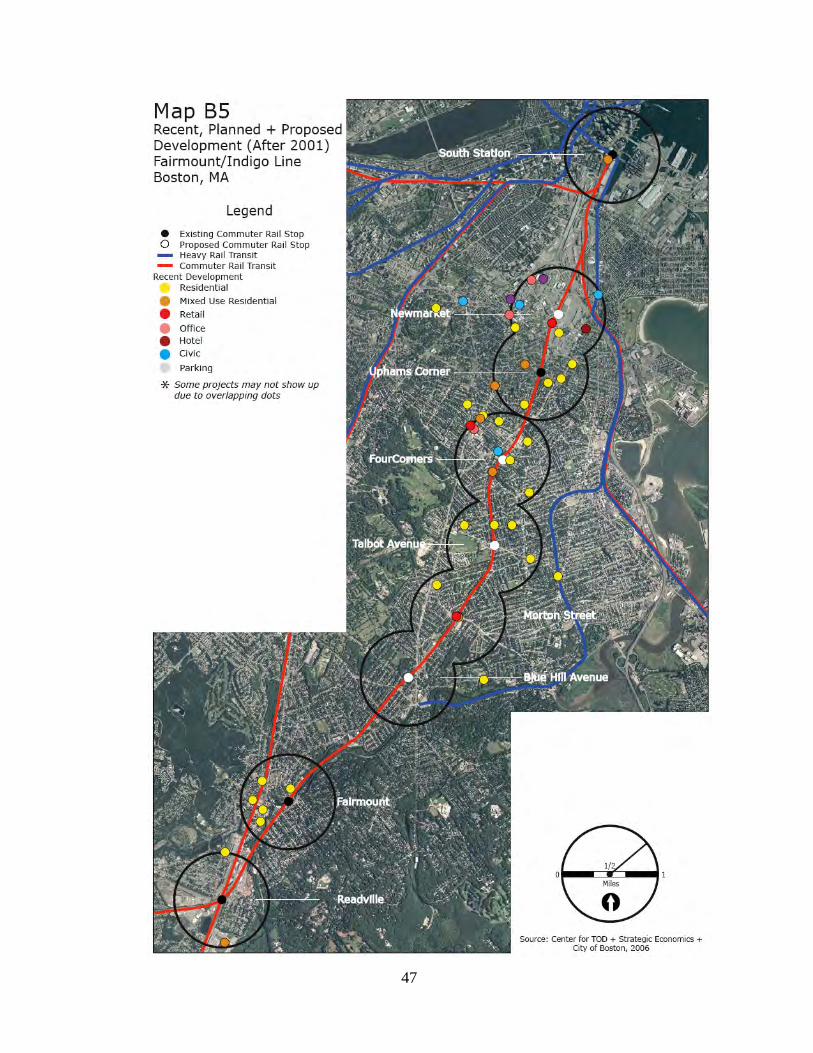
47
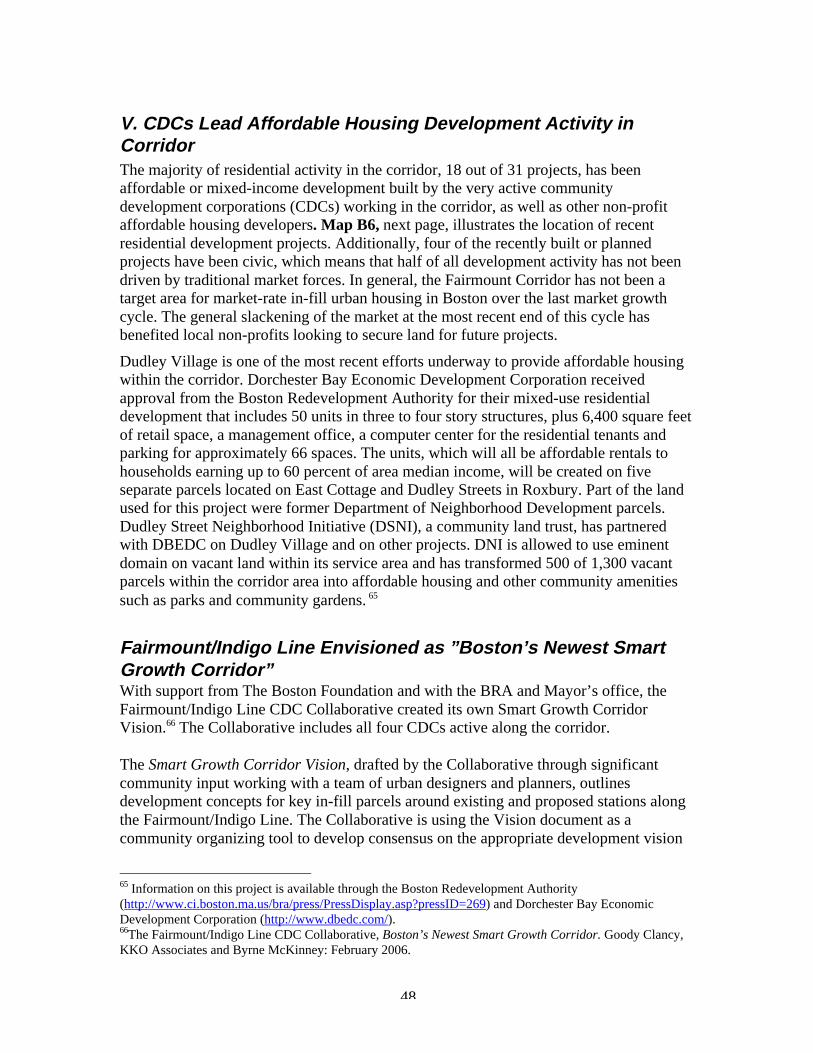
48
V. CDCs Lead Affordable Housing Development Activity inCorridorThe majority of residential activity in the corridor, 18 out of 31 projects, has beenaffordable or mixed-income development built by the very active communitydevelopment corporations (CDCs) working in the corridor, as well as other non-profitaffordable housing developers. Map B6, next page, illustrates the location of recentresidential development projects. Additionally, four of the recently built or plannedprojects have been civic, which means that half of all development activity has not beendriven by traditional market forces. In general, the Fairmount Corridor has not been atarget area for market-rate in-fill urban housing in Boston over the last market growthcycle. The general slackening of the market at the most recent end of this cycle hasbenefited local non-profits looking to secure land for future projects.
Dudley Village is one of the most recent efforts underway to provide affordable housingwithin the corridor. Dorchester Bay Economic Development Corporation receivedapproval from the Boston Redevelopment Authority for their mixed-use residentialdevelopment that includes 50 units in three to four story structures, plus 6,400 square feetof retail space, a management office, a computer center for the residential tenants andparking for approximately 66 spaces. The units, which will all be affordable rentals tohouseholds earning up to 60 percent of area median income, will be created on fiveseparate parcels located on East Cottage and Dudley Streets in Roxbury. Part of the landused for this project were former Department of Neighborhood Development parcels.Dudley Street Neighborhood Initiative (DSNI), a community land trust, has partneredwith DBEDC on Dudley Village and on other projects. DNI is allowed to use eminentdomain on vacant land within its service area and has transformed 500 of 1,300 vacantparcels within the corridor area into affordable housing and other community amenitiessuch as parks and community gardens. 65
Fairmount/Indigo Line Envisioned as ”Boston’s Newest SmartGrowth Corridor”With support from The Boston Foundation and with the BRA and Mayor’s office, theFairmount/Indigo Line CDC Collaborative created its own Smart Growth CorridorVision.66 The Collaborative includes all four CDCs active along the corridor.
The Smart Growth Corridor Vision, drafted by the Collaborative through significantcommunity input working with a team of urban designers and planners, outlinesdevelopment concepts for key in-fill parcels around existing and proposed stations alongthe Fairmount/Indigo Line. The Collaborative is using the Vision document as acommunity organizing tool to develop consensus on the appropriate development vision
65 Information on this project is available through the Boston Redevelopment Authority(http://www.ci.boston.ma.us/bra/press/PressDisplay.asp?pressID=269) and Dorchester Bay EconomicDevelopment Corporation (http://www.dbedc.com/).66The Fairmount/Indigo Line CDC Collaborative, Boston’s Newest Smart Growth Corridor. Goody Clancy,KKO Associates and Byrne McKinney: February 2006.
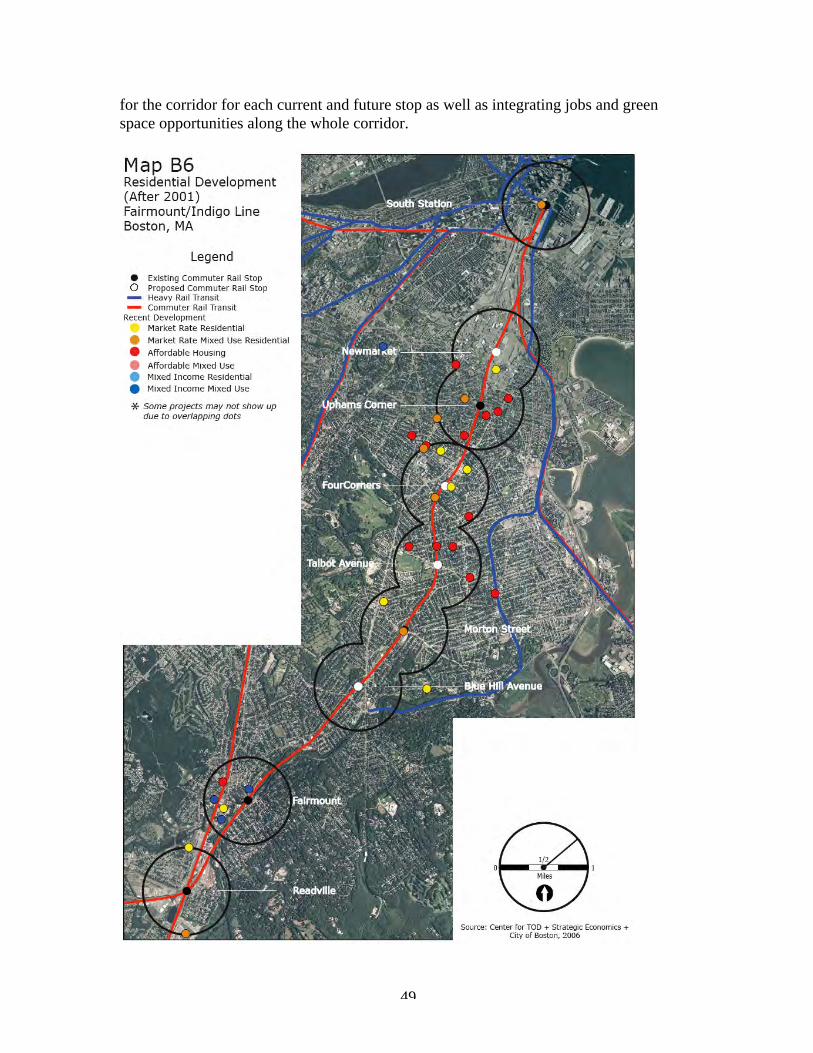
49
for the corridor for each current and future stop as well as integrating jobs and greenspace opportunities along the whole corridor.
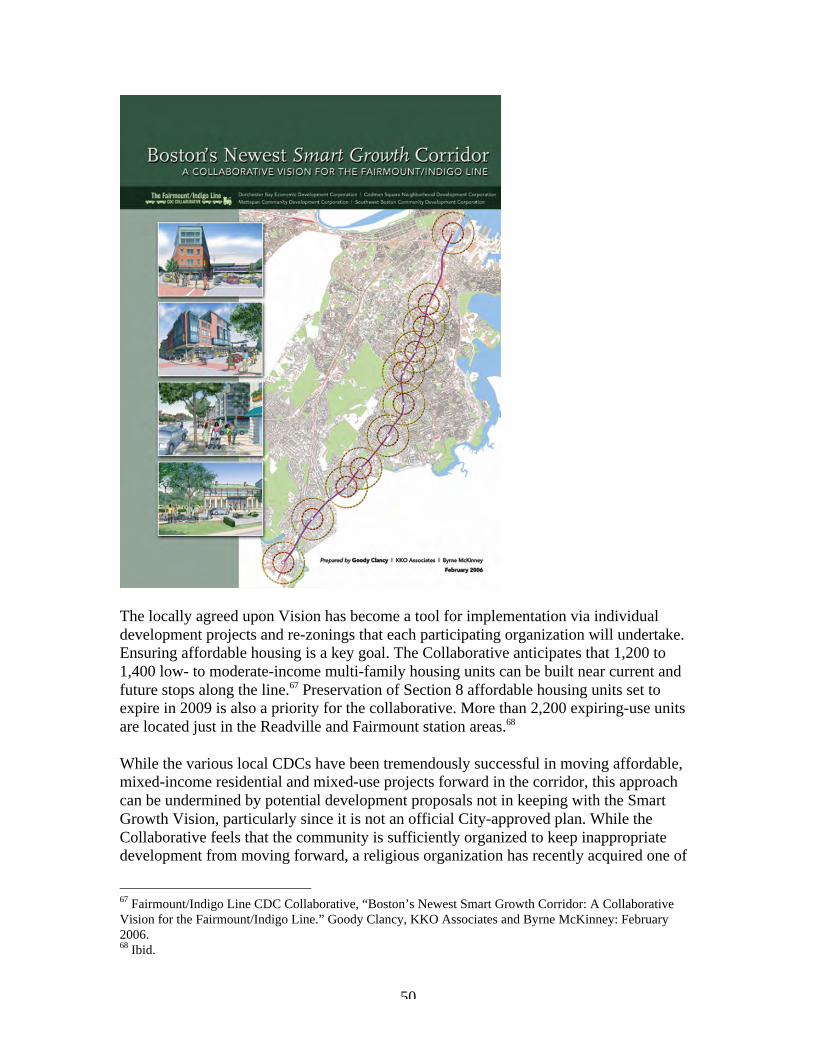
50
The locally agreed upon Vision has become a tool for implementation via individualdevelopment projects and re-zonings that each participating organization will undertake.Ensuring affordable housing is a key goal. The Collaborative anticipates that 1,200 to1,400 low- to moderate-income multi-family housing units can be built near current andfuture stops along the line.67 Preservation of Section 8 affordable housing units set toexpire in 2009 is also a priority for the collaborative. More than 2,200 expiring-use unitsare located just in the Readville and Fairmount station areas.68
While the various local CDCs have been tremendously successful in moving affordable,mixed-income residential and mixed-use projects forward in the corridor, this approachcan be undermined by potential development proposals not in keeping with the SmartGrowth Vision, particularly since it is not an official City-approved plan. While theCollaborative feels that the community is sufficiently organized to keep inappropriatedevelopment from moving forward, a religious organization has recently acquired one of
67 Fairmount/Indigo Line CDC Collaborative, “Boston’s Newest Smart Growth Corridor: A CollaborativeVision for the Fairmount/Indigo Line.” Goody Clancy, KKO Associates and Byrne McKinney: February2006.68 Ibid.
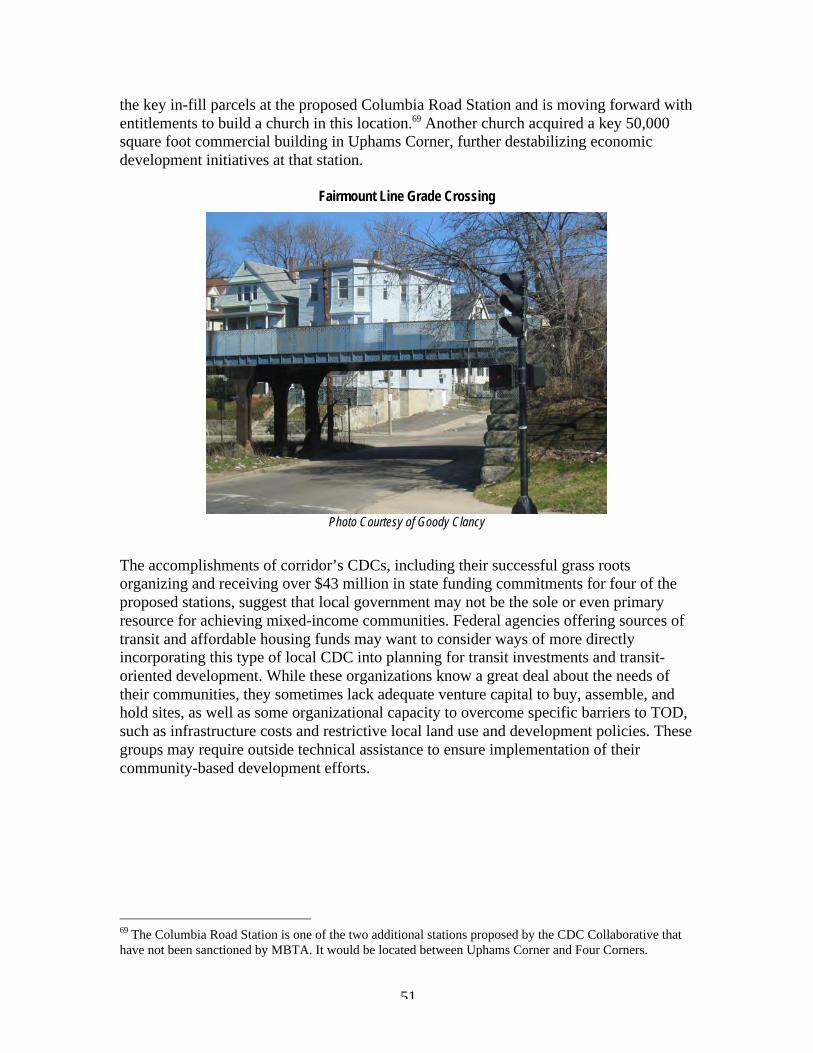
51
the key in-fill parcels at the proposed Columbia Road Station and is moving forward withentitlements to build a church in this location.69 Another church acquired a key 50,000square foot commercial building in Uphams Corner, further destabilizing economicdevelopment initiatives at that station.
Fairmount Line Grade Crossing
Photo Courtesy of Goody Clancy
The accomplishments of corridor’s CDCs, including their successful grass rootsorganizing and receiving over $43 million in state funding commitments for four of theproposed stations, suggest that local government may not be the sole or even primaryresource for achieving mixed-income communities. Federal agencies offering sources oftransit and affordable housing funds may want to consider ways of more directlyincorporating this type of local CDC into planning for transit investments and transit-oriented development. While these organizations know a great deal about the needs oftheir communities, they sometimes lack adequate venture capital to buy, assemble, andhold sites, as well as some organizational capacity to overcome specific barriers to TOD,such as infrastructure costs and restrictive local land use and development policies. Thesegroups may require outside technical assistance to ensure implementation of theircommunity-based development efforts.
69 The Columbia Road Station is one of the two additional stations proposed by the CDC Collaborative thathave not been sanctioned by MBTA. It would be located between Uphams Corner and Four Corners.
52
VI. State-Level Commitment Expands Local HousingOpportunitiesIncreasing housing production and preserving neighborhood stability are two explicitgoals shared by the City and Commonwealth. In 2002, private development in the statewas producing homes at a rate of 17,500 per year; in the past three years that rate hasincreased to 24,000 homes per year. In the same time period, the ratio of multi-family tosingle-family homes has doubled. The City has also made a strong commitment toproducing more new units of housing, and preserving existing affordable housing. From2000-2003, almost 8,000 units of new housing, of which over 2,000 were affordable,were constructed. Another 5,000 households were protected from displacement throughCity efforts to prevent subsidized housing from becoming market-rate.70 A bevy of toolsand funding sources have been developed by the City and State to achieve these results(see Table B4 on pages 53-54 for a summary of these tools and funds, also describedbelow).
The Commonwealth has emerged as a strong partner in redirecting resources and policiesto promote greater use of existing infrastructure resources. One important new tool can befound in Massachusetts’s new smart growth housing laws, Chapters 40R and 40S. UnderChapter 40R, cities and towns are encouraged to establish compact smart growth districtsand rewarded with incentives ranging from $10,000 to $600,000 plus $3,000 per homebuilt. Under Chapter 40S, cities and towns get reimbursed for the unfunded cost ofeducating new school-age children resulting from housing growth. Both tools, while stillrelatively new, may become powerful incentives for overcoming exclusionary zoningobstacles and creating new housing choice.
Given the projected doubling of demand for housing near transit, coupled with a strongstatewide desire to preserve open space and create more housing, the Commonwealth isstrongly advocating transit-oriented development as part of its toolkit. Through the TODInfrastructure and Housing Support Program more than $30 million in infrastructuregrants have been authorized to facilitate TOD and more towns have taken steps to modifyzoning, conserve open space, and diversify their housing stock using $2.1 million insmart growth grants and technical assistance.71 One of the Fairmount CDCs was an earlywinner of the maximum $2 million grant under this program. Even the MassachusettsDepartment of Transportation is supporting TOD through funding and revising roaddesign standards. The state’s 20-year transportation plan commits fully half of futurefunding to transit and requires zoning reform in all new corridors.
The MBTA, given its extensive inventory of land and air rights next to and above transitstations, is also pursuing TOD opportunities. The MBTA has examined realigningoperations as stations are rehabilitated to include TOD opportunities. Examples of thesetypes of projects include Jackson Square in Jamaica Plain, Ashmont Station inDorchester’s Peabody Square, the North Station Superstation at Canal St in the Bulfinch
70 Mayor Menino, Leading the Way II: A Report on Boston’s Housing Strategy FY 2004-07.71 Douglas I. Foy, “Turning the corner on housing crisis,” The Boston Globe, January 18, 2006.
53
Triangle, and the Mattapan Trolley Station in Mattapan Square. With the exception ofAshmont Station which is a 100 percent affordable housing project, these projects aretypically mixed-income/mixed-use developments and are often collaborations betweenCDCs and for-profit developers.
The agency does not have the mission or funds available to partner with localneighborhood non-profits that may want to pursue TOD collaboratively with the transitagency. Its finances and statutory regulations require that it sell or lease property for thehighest obtainable financial return consistent with its long-term operational needs.Despite its financial obstacles, the MBTA is showing leadership. It has entered into aMemorandum of Agreement with the Commonwealth and the BRA to encourageaffordable and mixed-income housing on targeted properties owned by the MBTA.Strategies such as providing affordable and mixed-income housing and local-servingretail and community uses to transit-dependent populations are encouraged and enabledby the MBTA’s deference to local permitting processes and its responsiveness tocommunity desires. In addition, prior to publicly offering significant TOD sites, theMBTA together with the BRA and/or other local community organizations typically runsa series of pre-development public meetings and charrettes to obtain community input fordevelopment guidelines to assist bidders in preparing proposals sensitive to communityconcerns.
Together with MassHousing, local communities are provided technical assistance andresources to help plan and develop potential TOD sites. The Fairmount/Indigo Line CDCCollaborative has benefited from this assistance. The BRA’s quick, zero percent depositsfor the CDC property acquisitions has also been a brilliant and extremely helpful tool forthe CDCs.
MassHousing, through the Priority Development Fund provides over $100 million formixed-income housing, with specific funds set aside for affordable housing located neartransit stations. The creation of a TOD Planning Manager, funded by the Office ofCommonwealth Development and the MBTA indicates the priority that Commonwealthplaces on improving the coordination between housing, development, and transit.Nationally, Massachusetts stands out as a leader in promoting TOD and mixed-incomecommunities.72 A greater degree of coordination between agencies anddevelopment/transportation policies exists in Boston than in any of the four other casestudy regions. The active engagement and success of local community developmentcooperatives at tackling affordable housing and economic redevelopment in very low-income neighborhoods also stands out as exemplary. Missing from the story thus far,however, is a shared partnership by cities and towns to provide their own sets of tools andincentives for creating TOD and mixed-income communities. This reflects, in part, theunique home rule restrictions, but also suggests a much stronger effort to do more torevise zoning and regulatory barriers that are within the control of local governmentwhich currently make compact, mixed-use development extremely difficult and timeconsuming.
72 Cambridge Systematics and Mohaddes Myer Associates, The Role of State DOTs in Support of TransitOriented Development: Requested by AASHTO. April 2006.
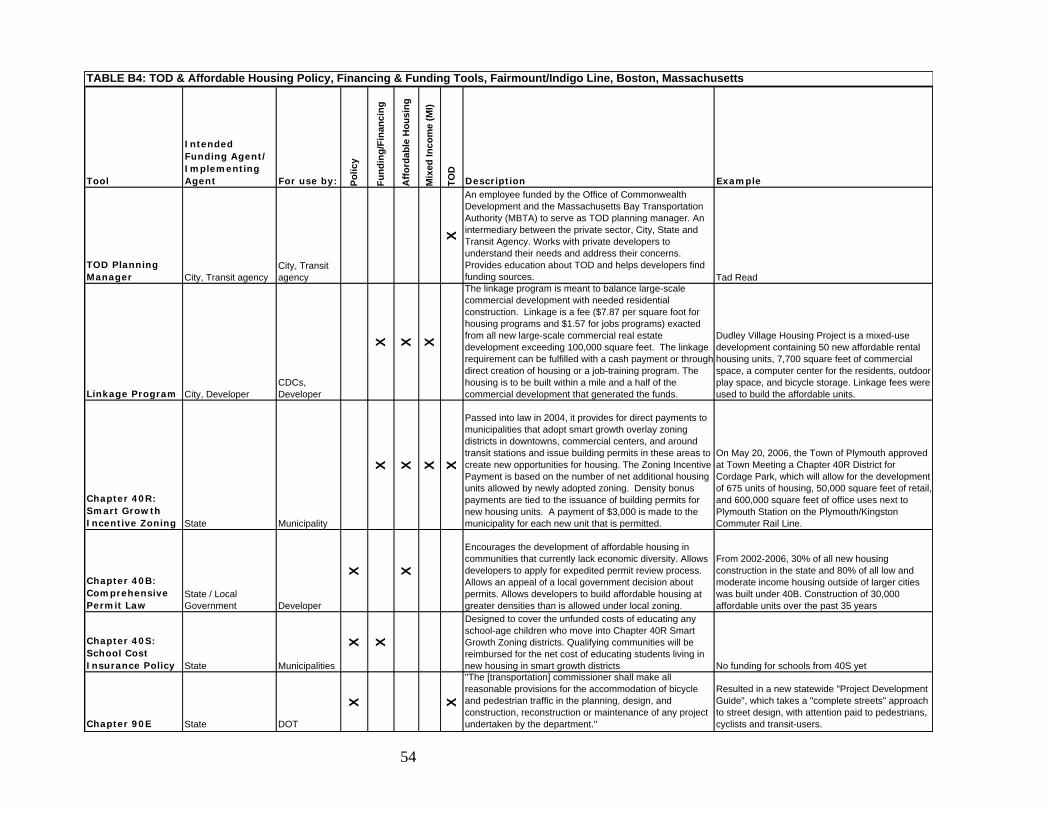
54
Tool
Intended Funding Agent/ Implementing Agent For use by: P
olic
y
Fu
nd
ing
/Fin
anci
ng
Aff
ord
able
Ho
usi
ng
Mix
ed In
com
e (M
I)
TO
D
Description Example
TOD Planning Manager City, Transit agency
City, Transit agency
X
An employee funded by the Office of Commonwealth Development and the Massachusetts Bay Transportation Authority (MBTA) to serve as TOD planning manager. An intermediary between the private sector, City, State and Transit Agency. Works with private developers to understand their needs and address their concerns. Provides education about TOD and helps developers find funding sources. Tad Read
Linkage Program City, DeveloperCDCs, Developer
X X X
The linkage program is meant to balance large-scale commercial development with needed residential construction. Linkage is a fee ($7.87 per square foot for housing programs and $1.57 for jobs programs) exacted from all new large-scale commercial real estate development exceeding 100,000 square feet. The linkage requirement can be fulfilled with a cash payment or through direct creation of housing or a job-training program. The housing is to be built within a mile and a half of the commercial development that generated the funds.
Dudley Village Housing Project is a mixed-use development containing 50 new affordable rental housing units, 7,700 square feet of commercial space, a computer center for the residents, outdoor play space, and bicycle storage. Linkage fees were used to build the affordable units.
Chapter 40R: Smart Growth Incentive Zoning State Municipality
X X X X
Passed into law in 2004, it provides for direct payments to municipalities that adopt smart growth overlay zoning districts in downtowns, commercial centers, and around transit stations and issue building permits in these areas to create new opportunities for housing. The Zoning Incentive Payment is based on the number of net additional housing units allowed by newly adopted zoning. Density bonus payments are tied to the issuance of building permits for new housing units. A payment of $3,000 is made to the municipality for each new unit that is permitted.
On May 20, 2006, the Town of Plymouth approved at Town Meeting a Chapter 40R District for Cordage Park, which will allow for the development of 675 units of housing, 50,000 square feet of retail, and 600,000 square feet of office uses next to Plymouth Station on the Plymouth/Kingston Commuter Rail Line.
Chapter 40B: Comprehensive Permit Law
State / Local Government Developer
X X
Encourages the development of affordable housing in communities that currently lack economic diversity. Allows developers to apply for expedited permit review process. Allows an appeal of a local government decision about permits. Allows developers to build affordable housing at greater densities than is allowed under local zoning.
From 2002-2006, 30% of all new housing construction in the state and 80% of all low and moderate income housing outside of larger cities was built under 40B. Construction of 30,000 affordable units over the past 35 years
Chapter 40S: School Cost Insurance Policy State Municipalities
X X
Designed to cover the unfunded costs of educating any school-age children who move into Chapter 40R Smart Growth Zoning districts. Qualifying communities will be reimbursed for the net cost of educating students living in new housing in smart growth districts No funding for schools from 40S yet
Chapter 90E State DOT
X X
"The [transportation] commissioner shall make all reasonable provisions for the accommodation of bicycle and pedestrian traffic in the planning, design, and construction, reconstruction or maintenance of any project undertaken by the department."
Resulted in a new statewide "Project Development Guide", which takes a "complete streets" approach to street design, with attention paid to pedestrians, cyclists and transit-users.
TABLE B4: TOD & Affordable Housing Policy, Financing & Funding Tools, Fairmount/Indigo Line, Boston, Massachusetts
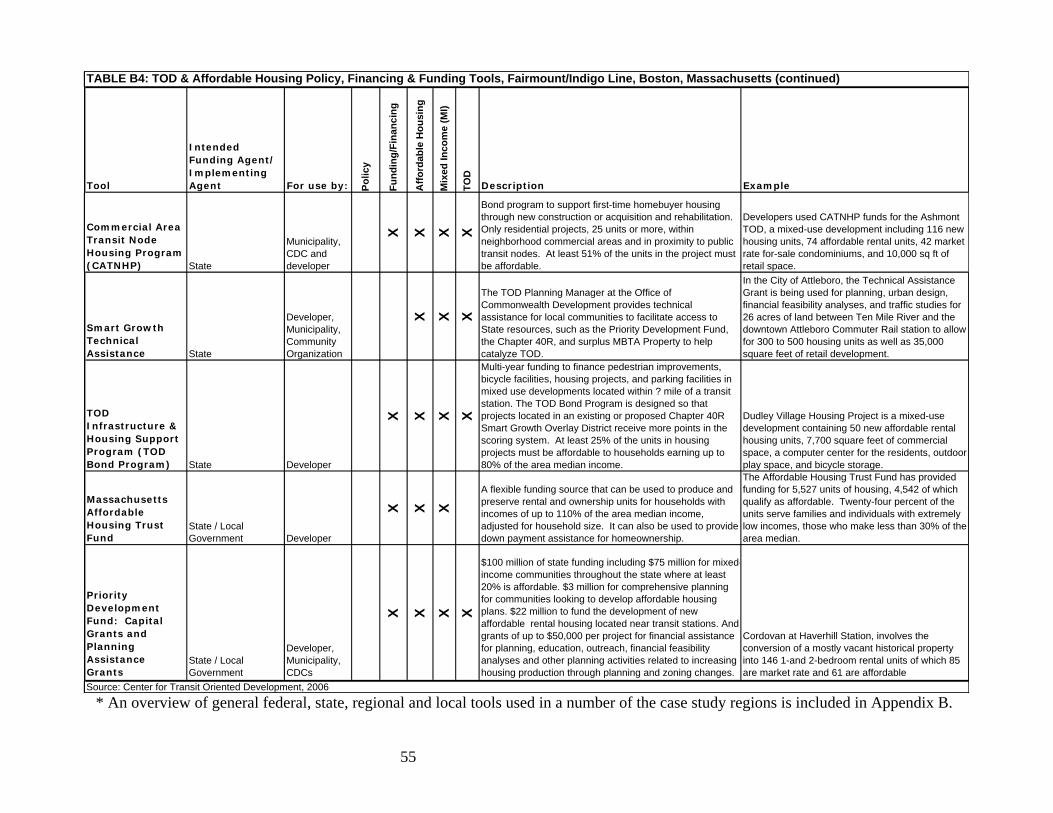
55
* An overview of general federal, state, regional and local tools used in a number of the case study regions is included in Appendix B.
Tool
Intended Funding Agent/ Implementing Agent For use by: P
olic
y
Fu
nd
ing
/Fin
anci
ng
Aff
ord
able
Ho
usi
ng
Mix
ed In
com
e (M
I)
TO
D
Description Example
Commercial Area Transit Node Housing Program (CATNHP) State
Municipality, CDC and developer
X X X X
Bond program to support first-time homebuyer housing through new construction or acquisition and rehabilitation. Only residential projects, 25 units or more, within neighborhood commercial areas and in proximity to public transit nodes. At least 51% of the units in the project must be affordable.
Developers used CATNHP funds for the Ashmont TOD, a mixed-use development including 116 new housing units, 74 affordable rental units, 42 market rate for-sale condominiums, and 10,000 sq ft of retail space.
Smart Growth Technical Assistance State
Developer, Municipality, Community Organization
X X X
The TOD Planning Manager at the Office of Commonwealth Development provides technical assistance for local communities to facilitate access to State resources, such as the Priority Development Fund, the Chapter 40R, and surplus MBTA Property to help catalyze TOD.
In the City of Attleboro, the Technical Assistance Grant is being used for planning, urban design, financial feasibility analyses, and traffic studies for 26 acres of land between Ten Mile River and the downtown Attleboro Commuter Rail station to allow for 300 to 500 housing units as well as 35,000 square feet of retail development.
TOD Infrastructure & Housing Support Program (TOD Bond Program) State Developer
X X X X
Multi-year funding to finance pedestrian improvements, bicycle facilities, housing projects, and parking facilities in mixed use developments located within ? mile of a transit station. The TOD Bond Program is designed so that projects located in an existing or proposed Chapter 40R Smart Growth Overlay District receive more points in the scoring system. At least 25% of the units in housing projects must be affordable to households earning up to 80% of the area median income.
Dudley Village Housing Project is a mixed-use development containing 50 new affordable rental housing units, 7,700 square feet of commercial space, a computer center for the residents, outdoor play space, and bicycle storage.
Massachusetts Affordable Housing Trust Fund
State / Local Government Developer
X X X
A flexible funding source that can be used to produce and preserve rental and ownership units for households with incomes of up to 110% of the area median income, adjusted for household size. It can also be used to provide down payment assistance for homeownership.
The Affordable Housing Trust Fund has provided funding for 5,527 units of housing, 4,542 of which qualify as affordable. Twenty-four percent of the units serve families and individuals with extremely low incomes, those who make less than 30% of the area median.
Priority Development Fund: Capital Grants and Planning Assistance Grants
State / Local Government
Developer, Municipality, CDCs
X X X X
$100 million of state funding including $75 million for mixed-income communities throughout the state where at least 20% is affordable. $3 million for comprehensive planning for communities looking to develop affordable housing plans. $22 million to fund the development of new affordable rental housing located near transit stations. And grants of up to $50,000 per project for financial assistance for planning, education, outreach, financial feasibility analyses and other planning activities related to increasing housing production through planning and zoning changes.
Cordovan at Haverhill Station, involves the conversion of a mostly vacant historical property into 146 1-and 2-bedroom rental units of which 85 are market rate and 61 are affordable
TABLE B4: TOD & Affordable Housing Policy, Financing & Funding Tools, Fairmount/Indigo Line, Boston, Massachusetts (continued)
Source: Center for Transit Oriented Development, 2006
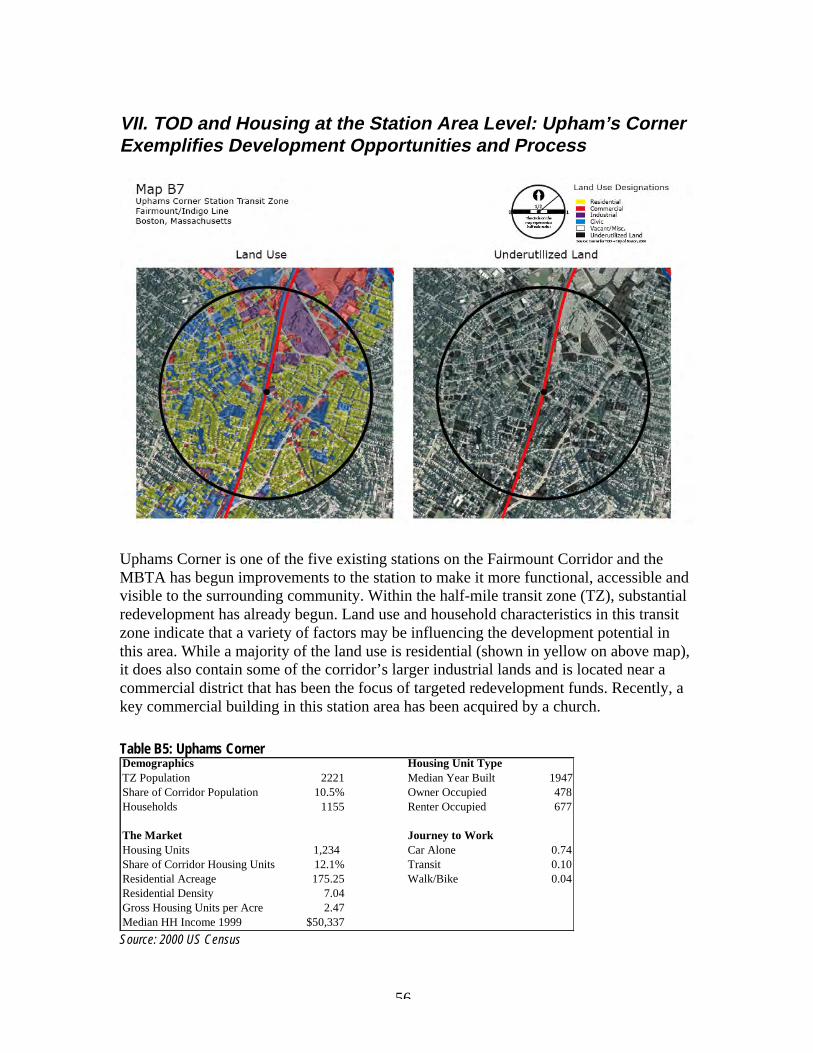
56
VII. TOD and Housing at the Station Area Level: Upham’s CornerExemplifies Development Opportunities and Process
Uphams Corner is one of the five existing stations on the Fairmount Corridor and theMBTA has begun improvements to the station to make it more functional, accessible andvisible to the surrounding community. Within the half-mile transit zone (TZ), substantialredevelopment has already begun. Land use and household characteristics in this transitzone indicate that a variety of factors may be influencing the development potential inthis area. While a majority of the land use is residential (shown in yellow on above map),it does also contain some of the corridor’s larger industrial lands and is located near acommercial district that has been the focus of targeted redevelopment funds. Recently, akey commercial building in this station area has been acquired by a church.
Table B5: Uphams CornerDemographics Housing Unit TypeTZ Population 2221 Median Year Built 1947Share of Corridor Population 10.5% Owner Occupied 478Households 1155 Renter Occupied 677
The Market Journey to WorkHousing Units 1,234 Car Alone 0.74Share of Corridor Housing Units 12.1% Transit 0.10Residential Acreage 175.25 Walk/Bike 0.04Residential Density 7.04Gross Housing Units per Acre 2.47Median HH Income 1999 $50,337Source: 2000 US Census
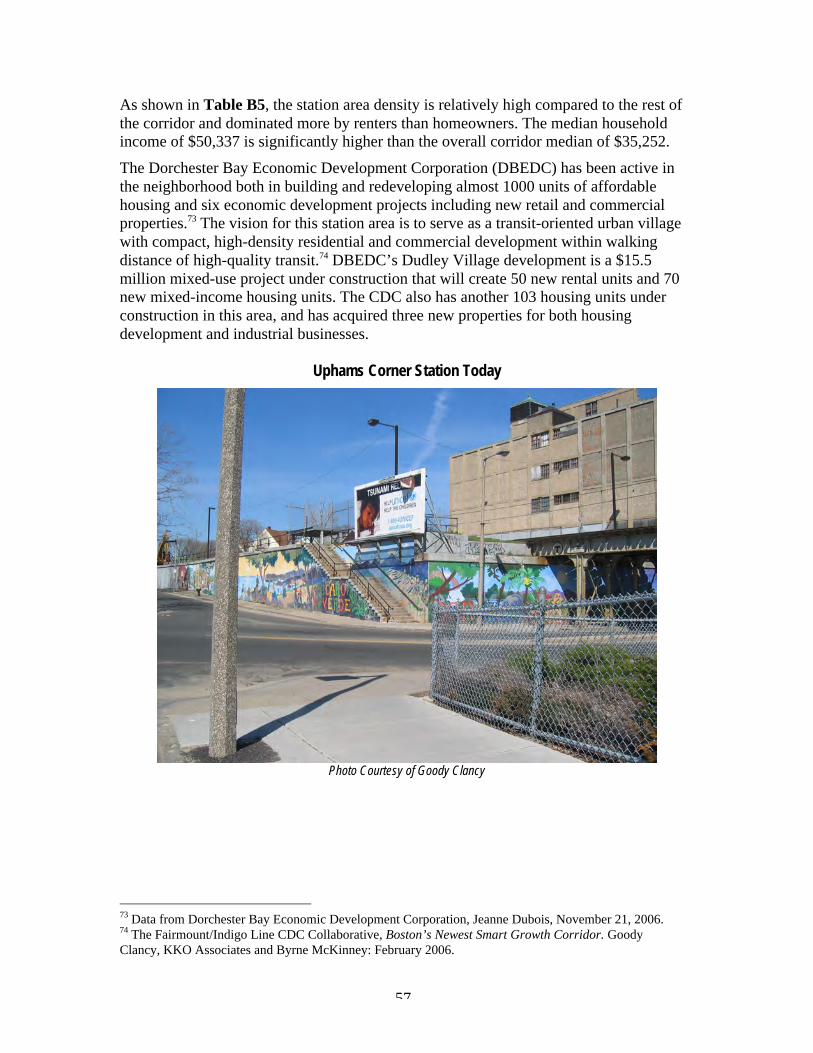
57
As shown in Table B5, the station area density is relatively high compared to the rest ofthe corridor and dominated more by renters than homeowners. The median householdincome of $50,337 is significantly higher than the overall corridor median of $35,252.The Dorchester Bay Economic Development Corporation (DBEDC) has been active inthe neighborhood both in building and redeveloping almost 1000 units of affordablehousing and six economic development projects including new retail and commercialproperties.73 The vision for this station area is to serve as a transit-oriented urban villagewith compact, high-density residential and commercial development within walkingdistance of high-quality transit.74 DBEDC’s Dudley Village development is a $15.5million mixed-use project under construction that will create 50 new rental units and 70new mixed-income housing units. The CDC also has another 103 housing units underconstruction in this area, and has acquired three new properties for both housingdevelopment and industrial businesses.
Uphams Corner Station Today
Photo Courtesy of Goody Clancy
73 Data from Dorchester Bay Economic Development Corporation, Jeanne Dubois, November 21, 2006.74 The Fairmount/Indigo Line CDC Collaborative, Boston’s Newest Smart Growth Corridor. GoodyClancy, KKO Associates and Byrne McKinney: February 2006.
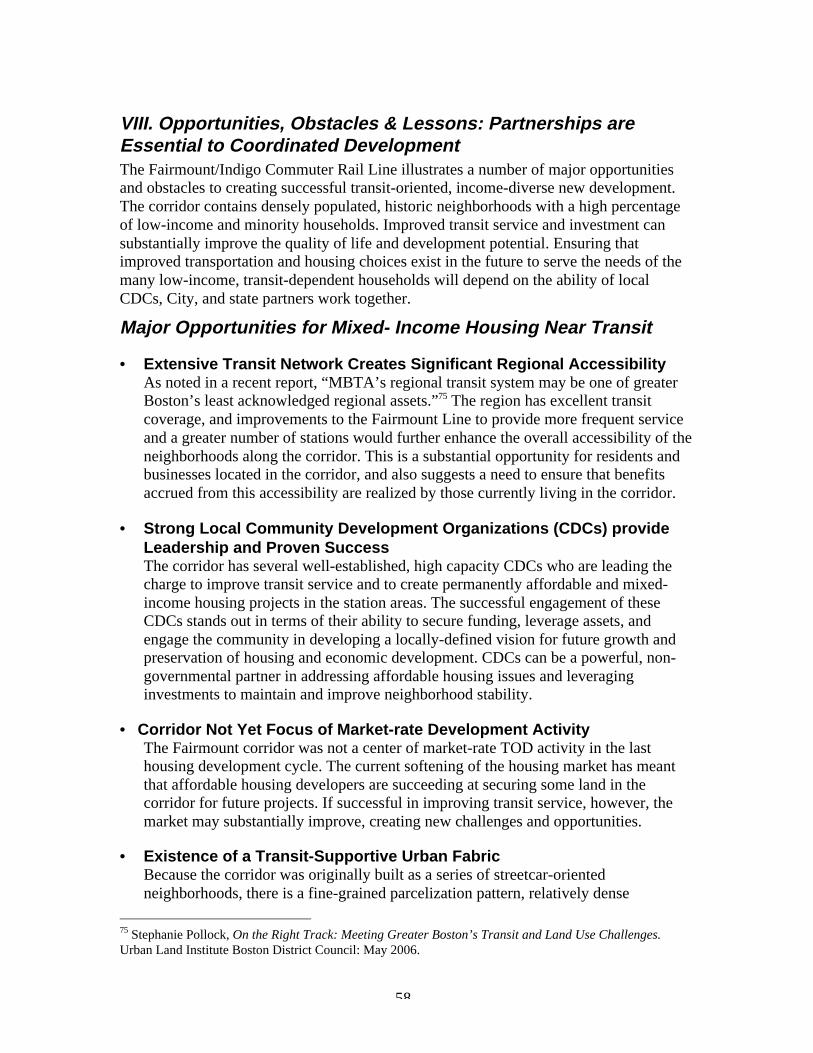
58
VIII. Opportunities, Obstacles & Lessons: Partnerships areEssential to Coordinated DevelopmentThe Fairmount/Indigo Commuter Rail Line illustrates a number of major opportunitiesand obstacles to creating successful transit-oriented, income-diverse new development.The corridor contains densely populated, historic neighborhoods with a high percentageof low-income and minority households. Improved transit service and investment cansubstantially improve the quality of life and development potential. Ensuring thatimproved transportation and housing choices exist in the future to serve the needs of themany low-income, transit-dependent households will depend on the ability of localCDCs, City, and state partners work together.
Major Opportunities for Mixed- Income Housing Near Transit
• Extensive Transit Network Creates Significant Regional AccessibilityAs noted in a recent report, “MBTA’s regional transit system may be one of greaterBoston’s least acknowledged regional assets.”75 The region has excellent transitcoverage, and improvements to the Fairmount Line to provide more frequent serviceand a greater number of stations would further enhance the overall accessibility of theneighborhoods along the corridor. This is a substantial opportunity for residents andbusinesses located in the corridor, and also suggests a need to ensure that benefitsaccrued from this accessibility are realized by those currently living in the corridor.
• Strong Local Community Development Organizations (CDCs) provideLeadership and Proven SuccessThe corridor has several well-established, high capacity CDCs who are leading thecharge to improve transit service and to create permanently affordable and mixed-income housing projects in the station areas. The successful engagement of theseCDCs stands out in terms of their ability to secure funding, leverage assets, andengage the community in developing a locally-defined vision for future growth andpreservation of housing and economic development. CDCs can be a powerful, non-governmental partner in addressing affordable housing issues and leveraginginvestments to maintain and improve neighborhood stability.
• Corridor Not Yet Focus of Market-rate Development ActivityThe Fairmount corridor was not a center of market-rate TOD activity in the lasthousing development cycle. The current softening of the housing market has meantthat affordable housing developers are succeeding at securing some land in thecorridor for future projects. If successful in improving transit service, however, themarket may substantially improve, creating new challenges and opportunities.
• Existence of a Transit-Supportive Urban FabricBecause the corridor was originally built as a series of streetcar-orientedneighborhoods, there is a fine-grained parcelization pattern, relatively dense
75 Stephanie Pollock, On the Right Track: Meeting Greater Boston’s Transit and Land Use Challenges.Urban Land Institute Boston District Council: May 2006.
59
development and existing sidewalks. Already, 35 percent of household work trips inthe corridor are via transit, with substantially higher percentages in the predominatelylow-income neighborhoods. However, there public infrastructure investments areneeded to improve public safety and the pedestrian environment in this corridor.These include sidewalk, streetscape and lighting improvements as well as largercommunity crime and safety enhancements that are needed to address concerns andfears of existing and potential residents, business owners, employers and employees.
Obstacles
• Limited, Fragmented Redevelopment Opportunity Sites throughoutCorridorThe majority of existing underutilized land is contained on numerous small infillparcels, many of which may require environmental remediation. A few pockets oflarger redevelopment opportunity sites exist along the corridor, but the potential forsubstantial redevelopment is limited. The Fairmount CDC Collaborative anticipatesthat 1,200 to 1,400 low- to moderate- and mixed-income multi-family housing unitscan be built near current and future stops along the line. Overall, the new stationscould stimulate the creation of 3,000 to 6,000 new housing units along theFairmount/Indigo Line. This is far short of the projected overall demand for housingnear transit in the region, but would provide an important and much needed newsupply of affordable housing.
• Home Rule Restrictions Encourage Reactive Development Regulation atthe Local LevelA number of those interviewed described the regulatory environment in the City ofBoston as largely reactive. Frustration was voiced concerning the intensive planningefforts that have occurred over the years with little implementation of new zoning orimprovements to regulatory barriers identified by these processes. It is difficult toensure that all proposed development projects will leverage new transit investmentwithout proactive zoning in place that mandates transit-supportive land uses.Focusing on redevelopment at the individual project level has the effect of creatinguncertainty for developers about the scale and amount of development that may bepermitted, adding time and cost to projects and inhibiting the affordability of someprojects. However, the state restrictions on home rule decision-making negates someof the potential benefits of proactive station area planning by limiting the use of valuecapture tools such as impact fees and taxation, as well as limiting local borrowingcapacity that can help stimulate development activity.
• Significant Affordable Housing Needs Must Be Addressed ThroughPreservation and New UnitsThe Fairmount/Indigo Line corridor includes some of Boston’s most denselypopulated, low-income neighborhoods. Several station areas have households withincomes at only 30 to 60 percent of the regional median. Preservation of Section 8affordable housing units set to expire in 2009 is also a priority for the collaborative.
60
More than 2,200 expiring-use units are located just in the Readville and Fairmountstation areas. There is a significant need, and challenge, in preserving existingaffordable housing units, though some may need to be rehabbed or renovated toprovide decent, safe, affordable housing located near transit. New units are alsoneeded to meet the current unmet and growing need for low- to moderate-incomehousing. Costs of new construction begin at $350,000 per unit, presenting asubstantial cost challenge particularly for non-profit developers.
• Transit Funding Crisis Impacts MBTA’s Ability to PartnerThe MBTA faces a $100 million shortfall that severely impacts its ability to providefunds to help leverage TOD and to invest in capital improvements. Additionally, thecurrent fiscal crisis needs to be considered in determining the use and return onMBTA-owned land that could be sold or leased. The MBTA has passed a fareincrease following a series of fare raises over the last six years. Strategies to resolvethe MBTA’s fiscal crisis are being pursued at the state level, but their absenceadversely limits the ability of the agency to be a financial partner with localcommunities. While the MBTA’s transportation mission does not include directlyfunding and developing housing, which is the mission of MassHousing, its strives inother ways to be an effective partner with local communities and MassHousing toproduce affordable and mixed-income TOD projects near transit.
• Industrial Contamination of a Number of Sites Inhibits RedevelopmentThe precious few larger redevelopment sites in the corridor have supported industrialuses for a very long time and are likely to have significant histories of various typesof contamination. A large number of sites are also publicly owned (primarily by theCity of Boston). Environmental clean-up may also be needed at these sites to allowfor redevelopment. The city will need to assess the existence and extent ofcontamination in deciding the cost and potential for clean-up and re-use.
Lessons from the Corridor for Other Places
• The State can be a Powerful TOD PartnerWhile a number of policies and funding sources exist to support TOD and mixed-income housing within the greater Boston region, the Commonwealth plays a majorrole in providing incentives to encourage zoning and regulatory changes to promoteTOD and affordable housing, and funds to address related infrastructure needs,including educating new school-age residents and infrastructure investments. Thedegree of state involvement is unmatched among the case study regions, and exhibitsa significant financial commitment and government leadership. Creating a statewideTOD framework encourages greater regional coordination and helps to level theplaying field between central cities and suburban jurisdictions, all of which are servedby transit, and provides opportunities for creating mixed-income TOD.
The strong state brownfield infrastructure, and the progressive state brownfieldlegislation of 1998, provided both a $30 million assessment and remediation fund aswell as liability protection for non-responsible parties, additional covenants-not-to-
61
sue tools, and ability for even non-profits to access assumable tax credits for theirredevelopment projects. That fund has recently been recapitalized and has beenenthusiastically utilized by non-profit, public, and for-profit developers. In this area,Massachusetts is a real national leader, which bodes well for future TOD.
• CDCs Currently Leading Redevelopment of Small SitesNon-profit developers with a local community base and access to outside funding andgovernment support can play a critical role in redeveloping smaller sites. Thesegroups also possess important community legitimacy that can be extremely helpful inaddressing community concern over density, traffic impacts, and affordable housing –critical elements of successful mixed-income TOD. CDCs also have long experiencein grassroots organizing that leads to more positive vision and consensus thusshortening zoning delays. Ensuring that public resources can be easily used by CDCs,and private for-profit developers, is an important element of public-privatepartnerships. A number of CDCs nationally are pursuing TOD, but some of themrequire some degree of technical assistance with the complex planning and fundingprocess entailed in this type of development. While the availability of a variety offunds to support TOD and mixed- income housing are to be commended, navigatingthe complex and sometimes competing requirements for reporting, use, and timing ofthese funds can add significant cost to a project and may be a burden preventing moresmall CDCs from fully engaging in TOD development.
• Include Local CDCs, Neighborhood Organizations in Planning forTransit Investment & TODLocal governments and transit agencies may not be the primary resources forstimulating affordable or mixed-income development in a transit corridor. In mature,working class urban neighborhoods, local community development organizations canbe potential sources for leadership in integrating housing for different income levels,can help frame community benefits, and can help discourage displacement. As notedby one CDC leader, the expertise and passion for many CDCs is providing housingfor those left out of traditional markets but that are essential to creating diverse, TODcommunities. The Fairmount/Indigo CDC Collaborative gained development andplanning capacity through years of activity. Efforts to actively engage CDCs in localhousing and transportation plans can yield results in other localities. Financial andtechnical support to CDCs from foundations and the public sector can be used tobuild local organizational capacity and TOD expertise particularly focused onaffordable housing and community building.
• Reduce Burdens Created by TOD-Specific Affordable Housing FundsAn extensive menu of TOD and affordable housing funding sources exist inMassachusetts, but for the most part these funds are specialized pots of funding fromexisting affordable housing streams. For affordable housing organizations thisrequires assembling multiple funding sources for a single development project.Because sources have different requirements and timeframes, this increases thecomplexity and overhead costs of financing projects. Before creating small,specialized funding streams, local, regional, and state government should considerhow best to make these funds flexible and easily accessible with limited application

62
and reporting requirements. Consideration should also be given to the efficacy ofadding TOD-related scoring criteria to existing housing funds, which may be a moreeffective and efficient means to target funding resources to housing within transitcorridors, in contrast to creating new, separate funding.
In the next chapter, Charlotte’s mixed-income TOD experience will be examined,focusing on the South Corridor/Blue Line that is anticipated to open in late 2007.
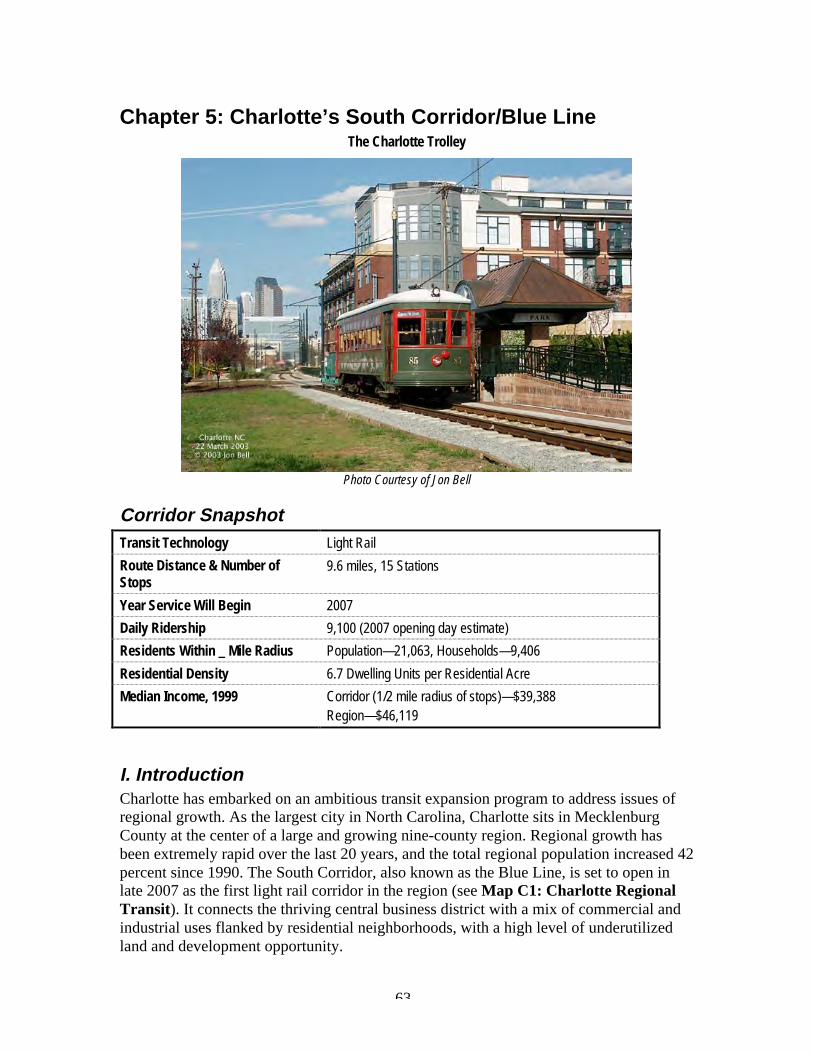
63
Chapter 5: Charlotte’s South Corridor/Blue LineThe Charlotte Trolley
Photo Courtesy of Jon Bell
Corridor SnapshotTransit Technology Light Rail
Route Distance & Number ofStops
9.6 miles, 15 Stations
Year Service Will Begin 2007
Daily Ridership 9,100 (2007 opening day estimate)
Residents Within _ Mile Radius Population—21,063, Households—9,406
Residential Density 6.7 Dwelling Units per Residential Acre
Median Income, 1999 Corridor (1/2 mile radius of stops)—$39,388Region—$46,119
I. IntroductionCharlotte has embarked on an ambitious transit expansion program to address issues ofregional growth. As the largest city in North Carolina, Charlotte sits in MecklenburgCounty at the center of a large and growing nine-county region. Regional growth hasbeen extremely rapid over the last 20 years, and the total regional population increased 42percent since 1990. The South Corridor, also known as the Blue Line, is set to open inlate 2007 as the first light rail corridor in the region (see Map C1: Charlotte RegionalTransit). It connects the thriving central business district with a mix of commercial andindustrial uses flanked by residential neighborhoods, with a high level of underutilizedland and development opportunity.
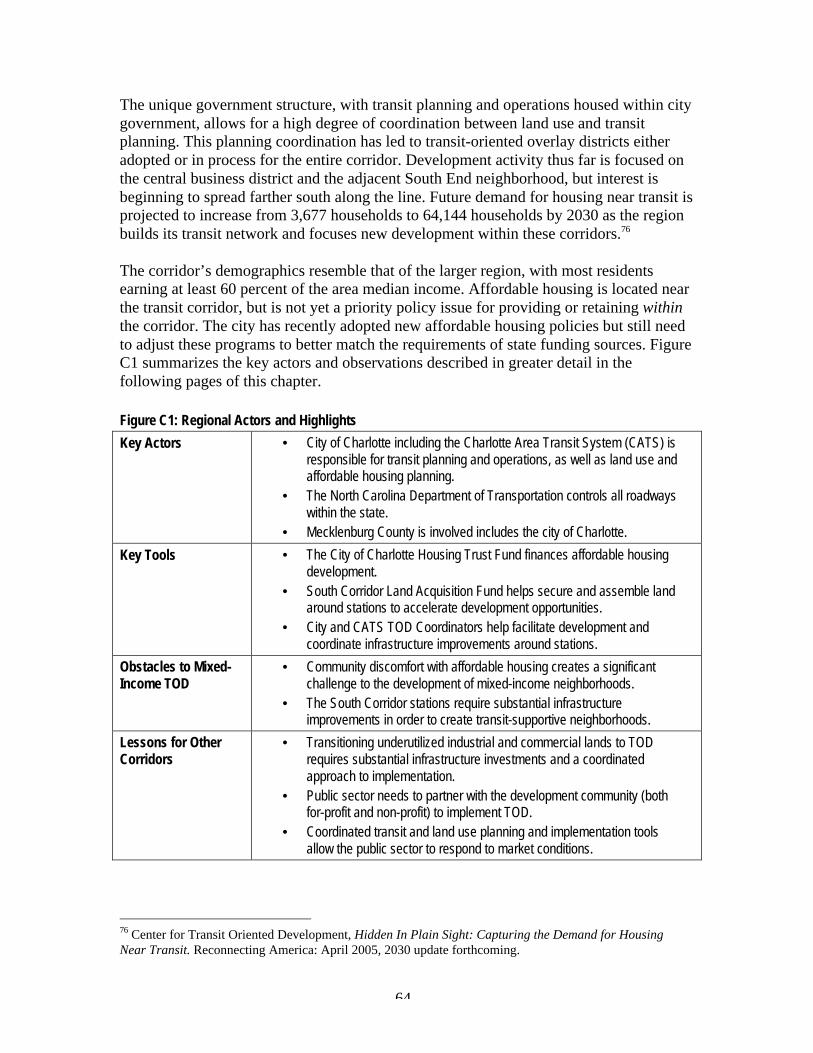
64
The unique government structure, with transit planning and operations housed within citygovernment, allows for a high degree of coordination between land use and transitplanning. This planning coordination has led to transit-oriented overlay districts eitheradopted or in process for the entire corridor. Development activity thus far is focused onthe central business district and the adjacent South End neighborhood, but interest isbeginning to spread farther south along the line. Future demand for housing near transit isprojected to increase from 3,677 households to 64,144 households by 2030 as the regionbuilds its transit network and focuses new development within these corridors.76
The corridor’s demographics resemble that of the larger region, with most residentsearning at least 60 percent of the area median income. Affordable housing is located nearthe transit corridor, but is not yet a priority policy issue for providing or retaining withinthe corridor. The city has recently adopted new affordable housing policies but still needto adjust these programs to better match the requirements of state funding sources. FigureC1 summarizes the key actors and observations described in greater detail in thefollowing pages of this chapter.
Figure C1: Regional Actors and Highlights
Key Actors • City of Charlotte including the Charlotte Area Transit System (CATS) isresponsible for transit planning and operations, as well as land use andaffordable housing planning.
• The North Carolina Department of Transportation controls all roadwayswithin the state.
• Mecklenburg County is involved includes the city of Charlotte.
Key Tools • The City of Charlotte Housing Trust Fund finances affordable housingdevelopment.
• South Corridor Land Acquisition Fund helps secure and assemble landaround stations to accelerate development opportunities.
• City and CATS TOD Coordinators help facilitate development andcoordinate infrastructure improvements around stations.
Obstacles to Mixed-Income TOD
• Community discomfort with affordable housing creates a significantchallenge to the development of mixed-income neighborhoods.
• The South Corridor stations require substantial infrastructureimprovements in order to create transit-supportive neighborhoods.
Lessons for OtherCorridors
• Transitioning underutilized industrial and commercial lands to TODrequires substantial infrastructure investments and a coordinatedapproach to implementation.
• Public sector needs to partner with the development community (bothfor-profit and non-profit) to implement TOD.
• Coordinated transit and land use planning and implementation toolsallow the public sector to respond to market conditions.
76 Center for Transit Oriented Development, Hidden In Plain Sight: Capturing the Demand for HousingNear Transit. Reconnecting America: April 2005, 2030 update forthcoming.
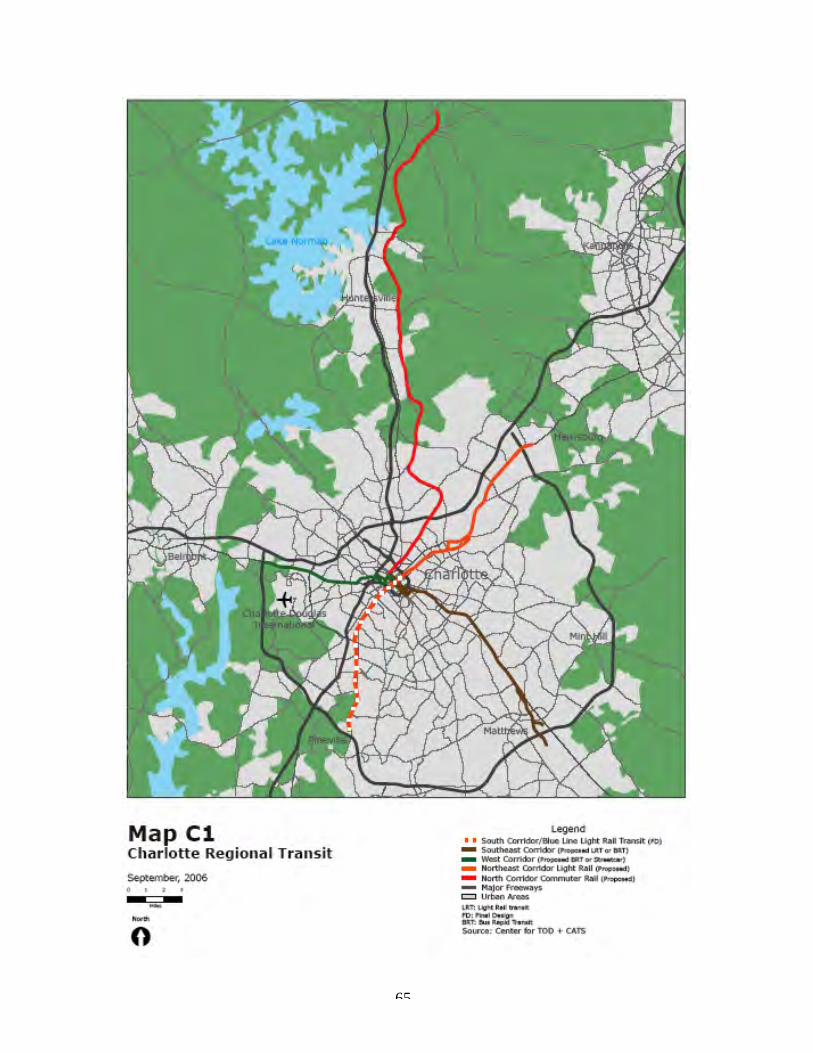
65
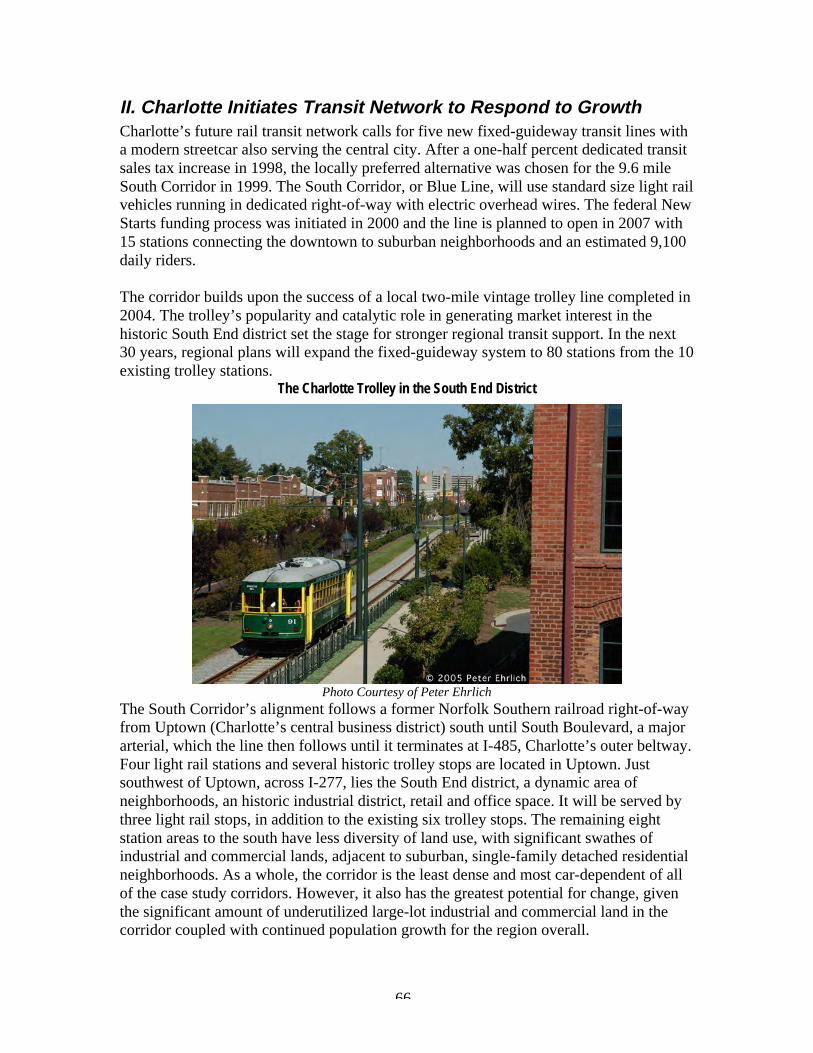
66
II. Charlotte Initiates Transit Network to Respond to GrowthCharlotte’s future rail transit network calls for five new fixed-guideway transit lines witha modern streetcar also serving the central city. After a one-half percent dedicated transitsales tax increase in 1998, the locally preferred alternative was chosen for the 9.6 mileSouth Corridor in 1999. The South Corridor, or Blue Line, will use standard size light railvehicles running in dedicated right-of-way with electric overhead wires. The federal NewStarts funding process was initiated in 2000 and the line is planned to open in 2007 with15 stations connecting the downtown to suburban neighborhoods and an estimated 9,100daily riders.
The corridor builds upon the success of a local two-mile vintage trolley line completed in2004. The trolley’s popularity and catalytic role in generating market interest in thehistoric South End district set the stage for stronger regional transit support. In the next30 years, regional plans will expand the fixed-guideway system to 80 stations from the 10existing trolley stations.
The Charlotte Trolley in the South End District
Photo Courtesy of Peter EhrlichThe South Corridor’s alignment follows a former Norfolk Southern railroad right-of-wayfrom Uptown (Charlotte’s central business district) south until South Boulevard, a majorarterial, which the line then follows until it terminates at I-485, Charlotte’s outer beltway.Four light rail stations and several historic trolley stops are located in Uptown. Justsouthwest of Uptown, across I-277, lies the South End district, a dynamic area ofneighborhoods, an historic industrial district, retail and office space. It will be served bythree light rail stops, in addition to the existing six trolley stops. The remaining eightstation areas to the south have less diversity of land use, with significant swathes ofindustrial and commercial lands, adjacent to suburban, single-family detached residentialneighborhoods. As a whole, the corridor is the least dense and most car-dependent of allof the case study corridors. However, it also has the greatest potential for change, giventhe significant amount of underutilized large-lot industrial and commercial land in thecorridor coupled with continued population growth for the region overall.
67
III. Housing Market Accelerating Along South CorridorCharlotte’s growing population is exerting pressure for more housing throughout theregion. Like many southeastern cities that have experienced rapid growth in the past 25years, Charlotte’s development is lower-density and auto-dependent. The lack of existingtransit options or compact, walkable urban neighborhoods means that in 2000, only onepercent of regional households lived within a one-half mile radius of the future SouthCorridor transit stations.
Prior to the construction of the South Corridor, the City was already focusing affordablehousing in areas served by bus transit and was involved in several exemplary HOPE VIprojects. While the City is taking a proactive role in trying to provide housing forhouseholds at a range of incomes, the need remains significant. In 2004 the City had a netunmet demand of 11,272 affordable housing units for priority needs households,including both rental and owner housing units. The greatest unmet demand is for rentalhousing for the lowest income households.77
New market rate housing along the South Corridor is occurring at a rapid pace. Therecent flurry of development activity is closely associated with the construction of thenew light rail line. Interest by developers is accelerating as the completion of the linedraws near. The City is encouraging high-density housing around the new 15 light railstations, and developers have responded by announcing plans to invest nearly $1 billionin transit-oriented projects.78 Over the past five years, Uptown (the central businessdistrict) has seen a substantial amount of high- and mid-rise residential development,with 3,350 units in 14 condominium towers currently planned or under construction.Despite on-going suburban office development, Uptown remains the economic heart ofthe region, with 55,000 jobs and the Charlotte Convention Center.
IV. Assessing the Development Potential and ExistingCharacteristics Along the South CorridorVibrant Downtown Market Connected to Lower-DensityNeighborhoodsExhibiting higher auto use and lower densities than the other case study corridors, theCity of Charlotte seeks to use new transit investment in concert with transit-supportiveland use policies to attract choice transit riders and steer growth into existing urban areas.The primary function of the South Corridor is to mitigate congestion while alsopromoting a change in development patterns by providing more compact, transit-accessible housing options to this part of the growing market segment.
Apart from the downtown station areas, the South Corridor contains primarilycommercial and industrial land uses, including a number of large size parcels andoutdated uses in underutilized properties (see Map C2). The potential for transformation 77 City of Charlotte, FY2006-2010 Consolidated Plan.78 For the purposes of this study, we are reporting on development as of October 31, 2006.
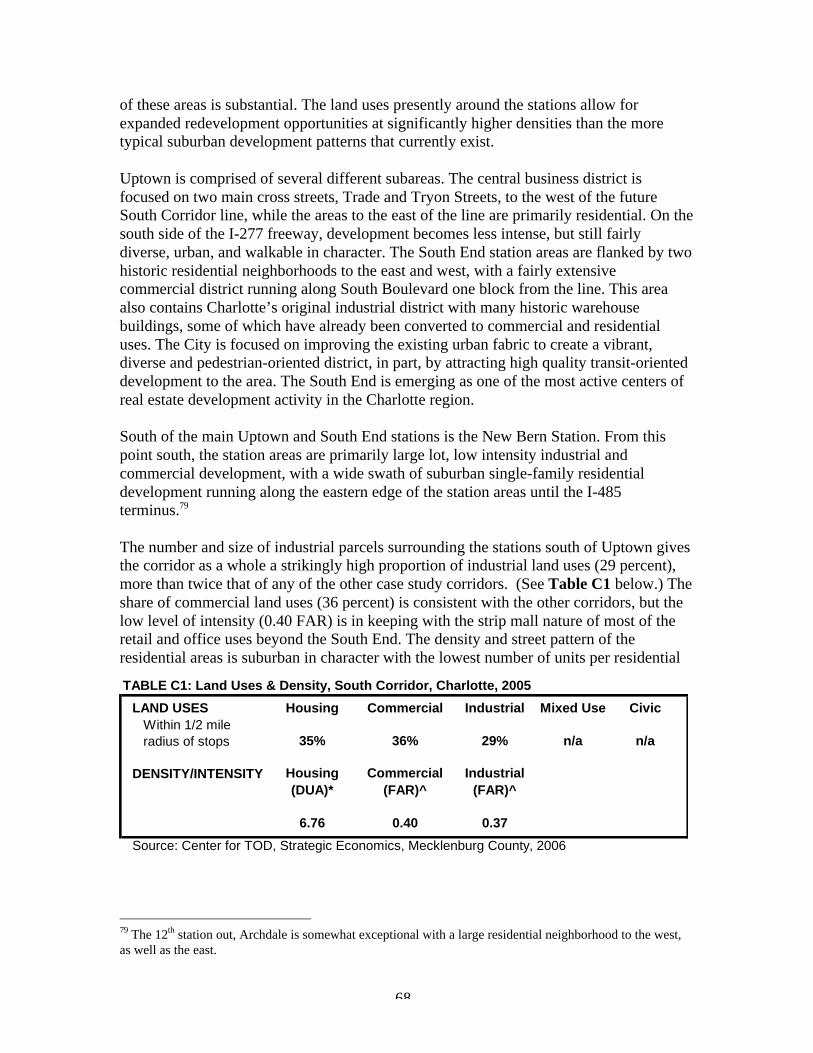
68
of these areas is substantial. The land uses presently around the stations allow forexpanded redevelopment opportunities at significantly higher densities than the moretypical suburban development patterns that currently exist.
Uptown is comprised of several different subareas. The central business district isfocused on two main cross streets, Trade and Tryon Streets, to the west of the futureSouth Corridor line, while the areas to the east of the line are primarily residential. On thesouth side of the I-277 freeway, development becomes less intense, but still fairlydiverse, urban, and walkable in character. The South End station areas are flanked by twohistoric residential neighborhoods to the east and west, with a fairly extensivecommercial district running along South Boulevard one block from the line. This areaalso contains Charlotte’s original industrial district with many historic warehousebuildings, some of which have already been converted to commercial and residentialuses. The City is focused on improving the existing urban fabric to create a vibrant,diverse and pedestrian-oriented district, in part, by attracting high quality transit-orienteddevelopment to the area. The South End is emerging as one of the most active centers ofreal estate development activity in the Charlotte region.
South of the main Uptown and South End stations is the New Bern Station. From thispoint south, the station areas are primarily large lot, low intensity industrial andcommercial development, with a wide swath of suburban single-family residentialdevelopment running along the eastern edge of the station areas until the I-485terminus.79
The number and size of industrial parcels surrounding the stations south of Uptown givesthe corridor as a whole a strikingly high proportion of industrial land uses (29 percent),more than twice that of any of the other case study corridors. (See Table C1 below.) Theshare of commercial land uses (36 percent) is consistent with the other corridors, but thelow level of intensity (0.40 FAR) is in keeping with the strip mall nature of most of theretail and office uses beyond the South End. The density and street pattern of theresidential areas is suburban in character with the lowest number of units per residential
79 The 12th station out, Archdale is somewhat exceptional with a large residential neighborhood to the west,as well as the east.
TABLE C1: Land Uses & Density, South Corridor, Charlotte, 2005
LAND USES Housing Commercial Industrial Mixed Use Civic
35% 36% 29% n/a n/a
DENSITY/INTENSITY
6.76 0.40 0.37
Source: Center for TOD, Strategic Economics, Mecklenburg County, 2006
Within 1/2 mile radius of stops
Commercial (FAR)^
Housing (DUA)*
Industrial (FAR)^
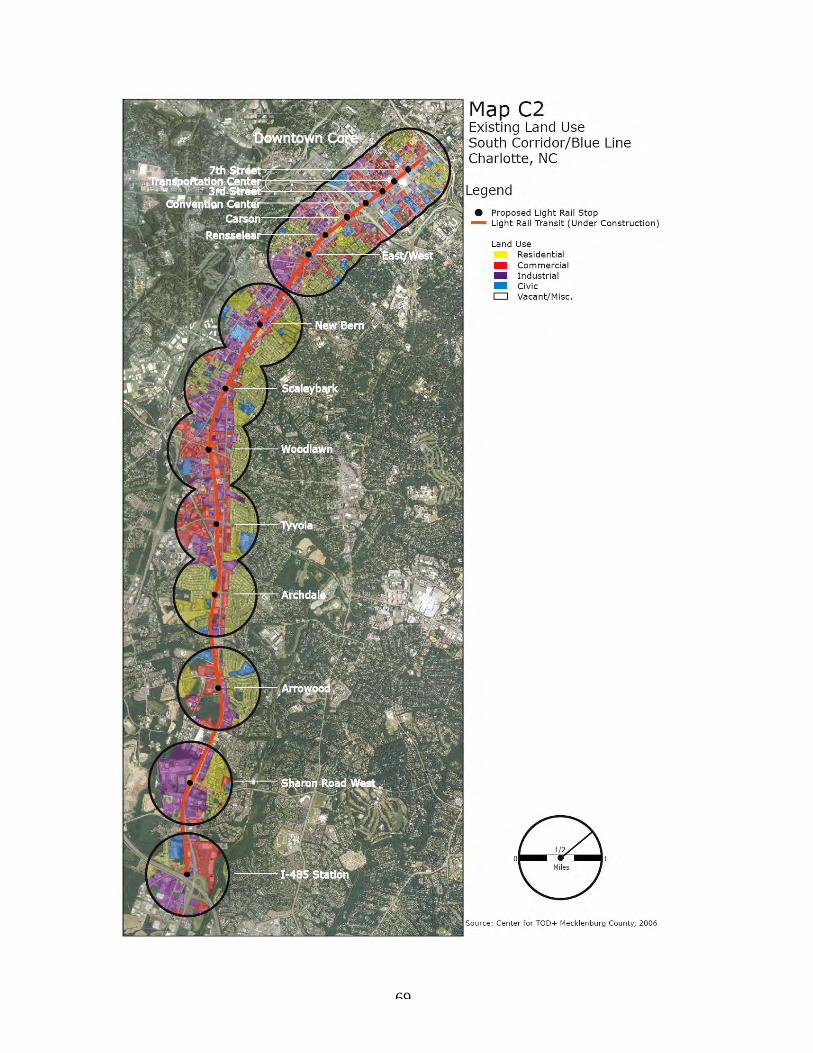
69
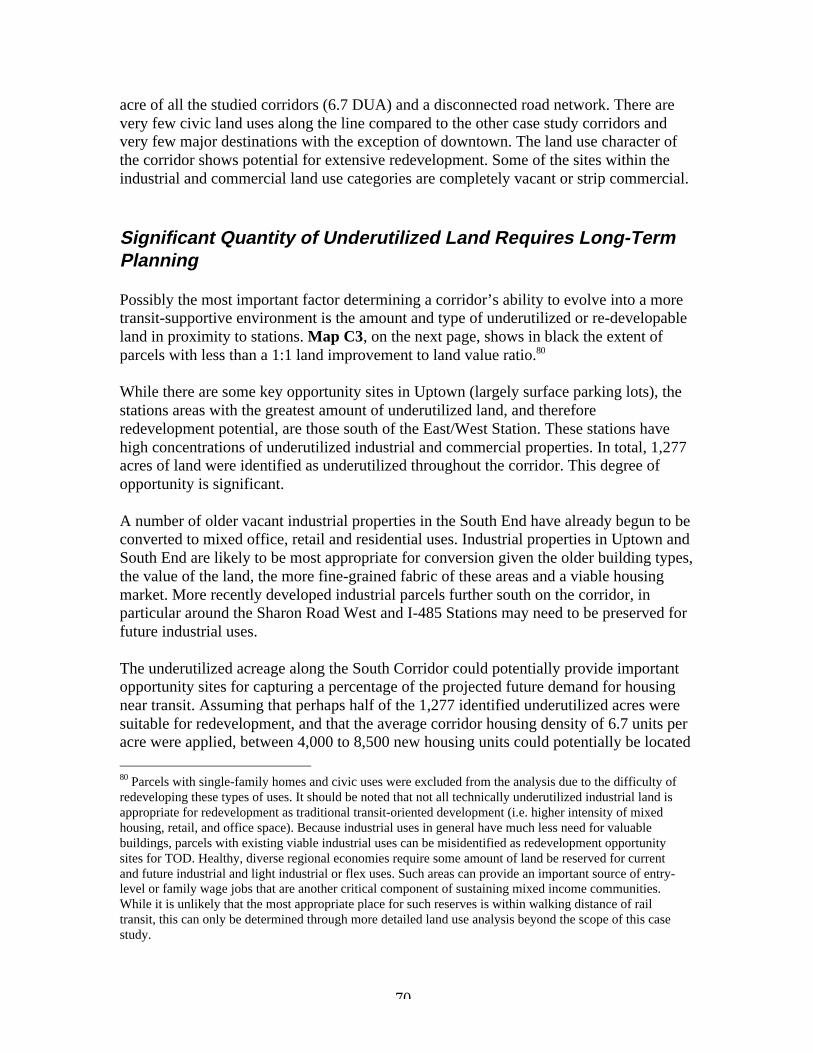
70
acre of all the studied corridors (6.7 DUA) and a disconnected road network. There arevery few civic land uses along the line compared to the other case study corridors andvery few major destinations with the exception of downtown. The land use character ofthe corridor shows potential for extensive redevelopment. Some of the sites within theindustrial and commercial land use categories are completely vacant or strip commercial.
Significant Quantity of Underutilized Land Requires Long-TermPlanning
Possibly the most important factor determining a corridor’s ability to evolve into a moretransit-supportive environment is the amount and type of underutilized or re-developableland in proximity to stations. Map C3, on the next page, shows in black the extent ofparcels with less than a 1:1 land improvement to land value ratio.80
While there are some key opportunity sites in Uptown (largely surface parking lots), thestations areas with the greatest amount of underutilized land, and thereforeredevelopment potential, are those south of the East/West Station. These stations havehigh concentrations of underutilized industrial and commercial properties. In total, 1,277acres of land were identified as underutilized throughout the corridor. This degree ofopportunity is significant.
A number of older vacant industrial properties in the South End have already begun to beconverted to mixed office, retail and residential uses. Industrial properties in Uptown andSouth End are likely to be most appropriate for conversion given the older building types,the value of the land, the more fine-grained fabric of these areas and a viable housingmarket. More recently developed industrial parcels further south on the corridor, inparticular around the Sharon Road West and I-485 Stations may need to be preserved forfuture industrial uses.
The underutilized acreage along the South Corridor could potentially provide importantopportunity sites for capturing a percentage of the projected future demand for housingnear transit. Assuming that perhaps half of the 1,277 identified underutilized acres weresuitable for redevelopment, and that the average corridor housing density of 6.7 units peracre were applied, between 4,000 to 8,500 new housing units could potentially be located 80 Parcels with single-family homes and civic uses were excluded from the analysis due to the difficulty ofredeveloping these types of uses. It should be noted that not all technically underutilized industrial land isappropriate for redevelopment as traditional transit-oriented development (i.e. higher intensity of mixedhousing, retail, and office space). Because industrial uses in general have much less need for valuablebuildings, parcels with existing viable industrial uses can be misidentified as redevelopment opportunitysites for TOD. Healthy, diverse regional economies require some amount of land be reserved for currentand future industrial and light industrial or flex uses. Such areas can provide an important source of entry-level or family wage jobs that are another critical component of sustaining mixed income communities.While it is unlikely that the most appropriate place for such reserves is within walking distance of railtransit, this can only be determined through more detailed land use analysis beyond the scope of this casestudy.
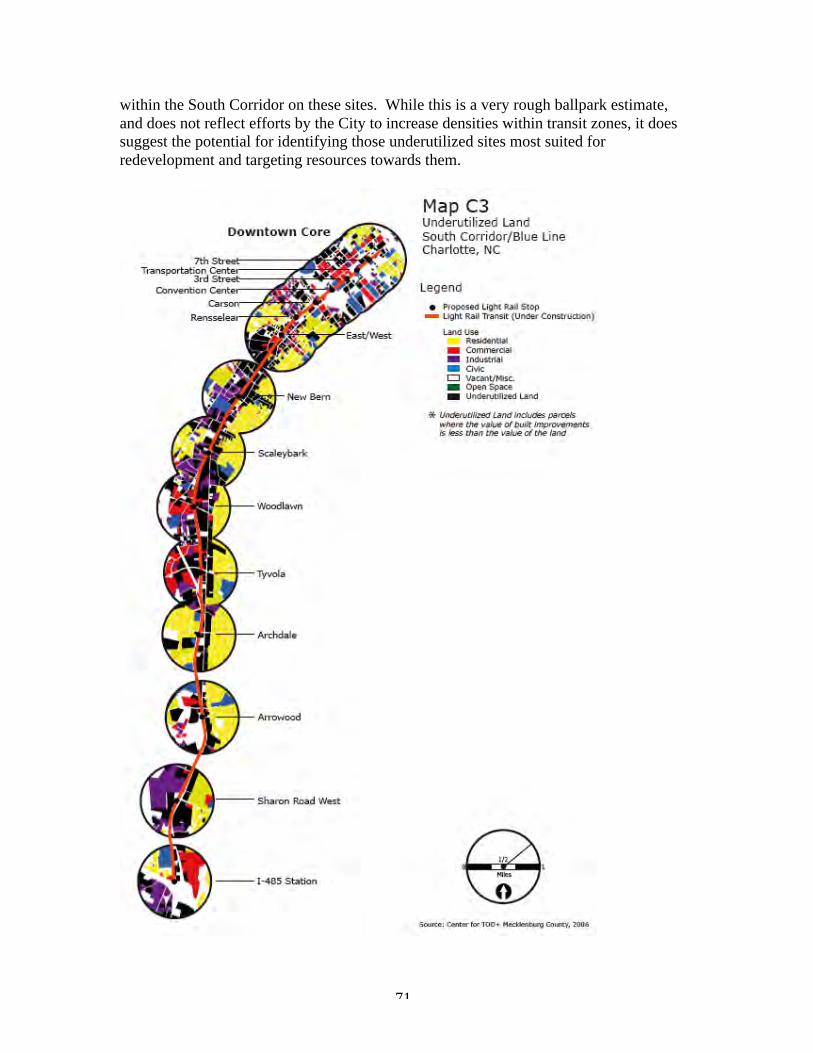
71
within the South Corridor on these sites. While this is a very rough ballpark estimate,and does not reflect efforts by the City to increase densities within transit zones, it doessuggest the potential for identifying those underutilized sites most suited forredevelopment and targeting resources towards them.
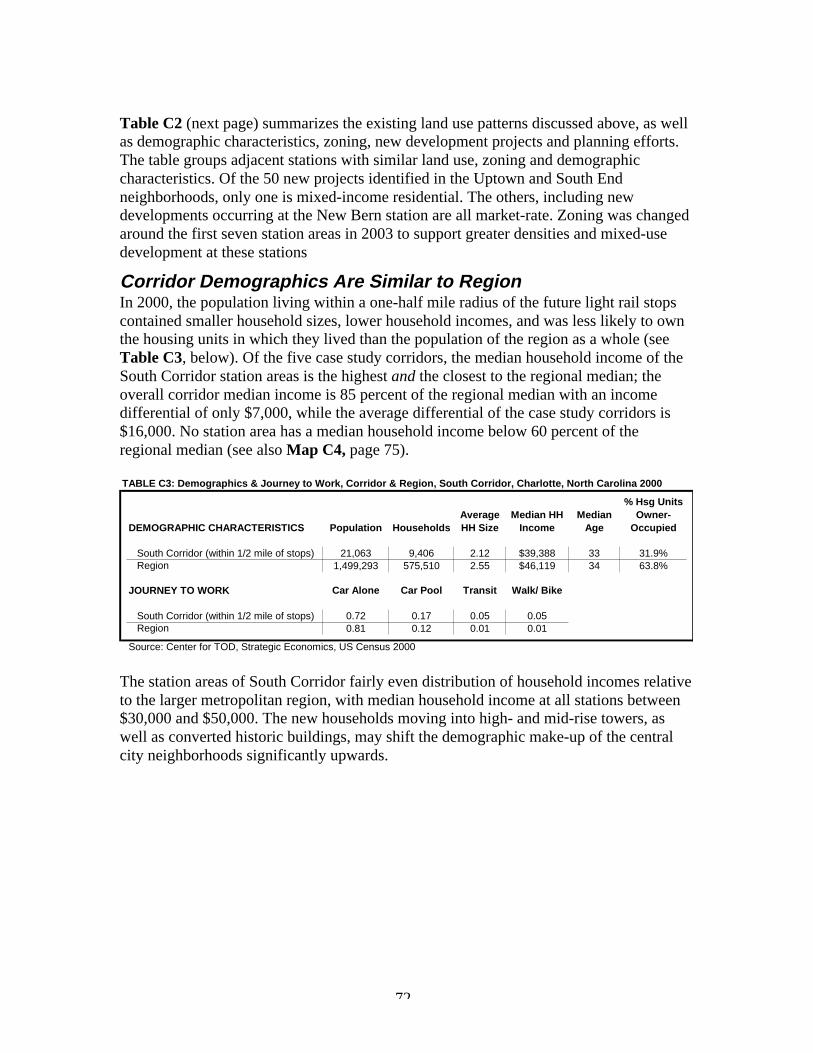
72
Table C2 (next page) summarizes the existing land use patterns discussed above, as wellas demographic characteristics, zoning, new development projects and planning efforts.The table groups adjacent stations with similar land use, zoning and demographiccharacteristics. Of the 50 new projects identified in the Uptown and South Endneighborhoods, only one is mixed-income residential. The others, including newdevelopments occurring at the New Bern station are all market-rate. Zoning was changedaround the first seven station areas in 2003 to support greater densities and mixed-usedevelopment at these stations
Corridor Demographics Are Similar to RegionIn 2000, the population living within a one-half mile radius of the future light rail stopscontained smaller household sizes, lower household incomes, and was less likely to ownthe housing units in which they lived than the population of the region as a whole (seeTable C3, below). Of the five case study corridors, the median household income of theSouth Corridor station areas is the highest and the closest to the regional median; theoverall corridor median income is 85 percent of the regional median with an incomedifferential of only $7,000, while the average differential of the case study corridors is$16,000. No station area has a median household income below 60 percent of theregional median (see also Map C4, page 75).
TABLE C3: Demographics & Journey to Work, Corridor & Region, South Corridor, Charlotte, North Carolina 2000
DEMOGRAPHIC CHARACTERISTICS Population Households
South Corridor (within 1/2 mile of stops) 21,063 9,406 2.12 $39,388 33 31.9%Region 1,499,293 575,510 2.55 $46,119 34 63.8%
JOURNEY TO WORK Car Alone Car Pool Transit Walk/ Bike
South Corridor (within 1/2 mile of stops) 0.72 0.17 0.05 0.05Region 0.81 0.12 0.01 0.01
Source: Center for TOD, Strategic Economics, US Census 2000
Average HH Size
Median HH Income
Median Age
% Hsg Units Owner-
Occupied
The station areas of South Corridor fairly even distribution of household incomes relativeto the larger metropolitan region, with median household income at all stations between$30,000 and $50,000. The new households moving into high- and mid-rise towers, aswell as converted historic buildings, may shift the demographic make-up of the centralcity neighborhoods significantly upwards.
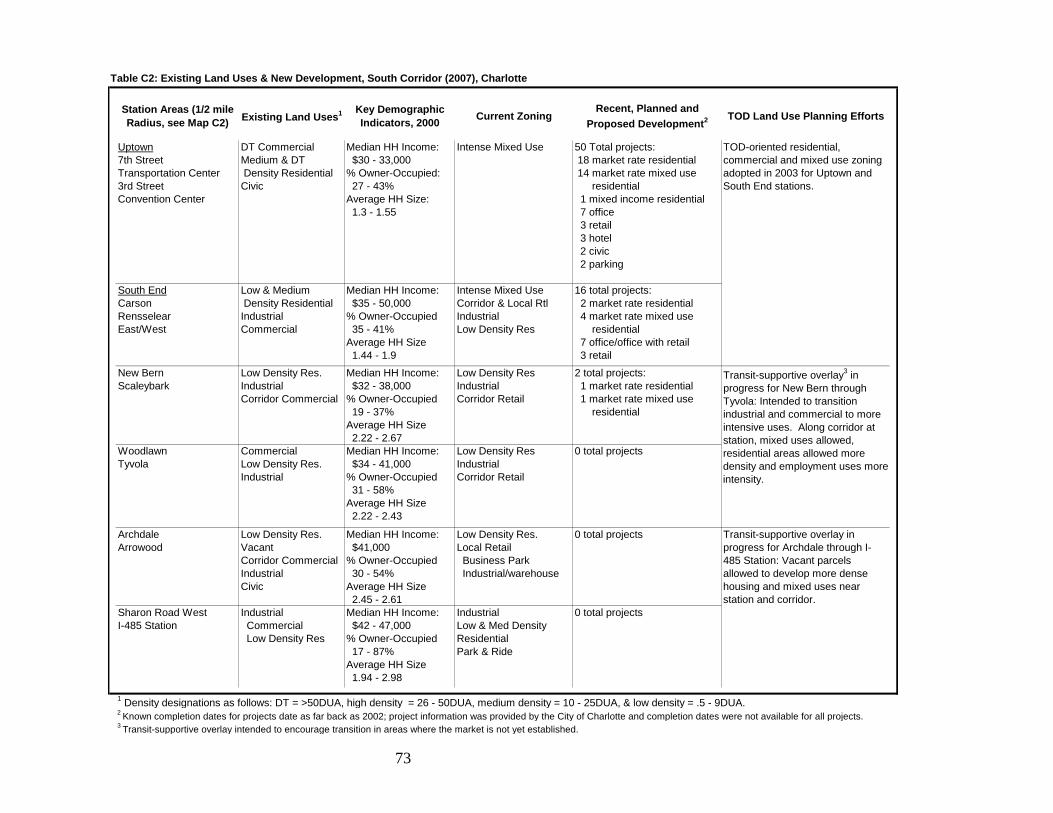
73
Table C2: Existing Land Uses & New Development, South Corridor (2007), Charlotte
Station Areas (1/2 mile Radius, see Map C2) Existing Land Uses1 Key Demographic
Indicators, 2000Current Zoning
Recent, Planned and
Proposed Development2 TOD Land Use Planning Efforts
Uptown7th StreetTransportation Center3rd StreetConvention Center
DT CommercialMedium & DT Density ResidentialCivic
Median HH Income: $30 - 33,000% Owner-Occupied: 27 - 43% Average HH Size: 1.3 - 1.55
Intense Mixed Use 50 Total projects: 18 market rate residential 14 market rate mixed use residential 1 mixed income residential 7 office 3 retail 3 hotel 2 civic 2 parking
South EndCarsonRensselearEast/West
Low & Medium Density ResidentialIndustrialCommercial
Median HH Income: $35 - 50,000 % Owner-Occupied 35 - 41% Average HH Size 1.44 - 1.9
Intense Mixed UseCorridor & Local RtlIndustrialLow Density Res
16 total projects: 2 market rate residential 4 market rate mixed use residential 7 office/office with retail 3 retail
New BernScaleybark
Low Density Res.IndustrialCorridor Commercial
Median HH Income: $32 - 38,000% Owner-Occupied 19 - 37% Average HH Size 2.22 - 2.67
Low Density ResIndustrialCorridor Retail
2 total projects: 1 market rate residential 1 market rate mixed use residential
WoodlawnTyvola
CommercialLow Density Res.Industrial
Median HH Income: $34 - 41,000% Owner-Occupied 31 - 58% Average HH Size 2.22 - 2.43
Low Density ResIndustrialCorridor Retail
0 total projects
ArchdaleArrowood
Low Density Res.VacantCorridor CommercialIndustrialCivic
Median HH Income: $41,000% Owner-Occupied 30 - 54% Average HH Size 2.45 - 2.61
Low Density Res.Local Retail Business Park Industrial/warehouse
0 total projects
Sharon Road WestI-485 Station
Industrial Commercial Low Density Res
Median HH Income: $42 - 47,000% Owner-Occupied 17 - 87% Average HH Size 1.94 - 2.98
IndustrialLow & Med Density ResidentialPark & Ride
0 total projects
TOD-oriented residential, commercial and mixed use zoning adopted in 2003 for Uptown and South End stations.
3 Transit-supportive overlay intended to encourage transition in areas where the market is not yet established.
Transit-supportive overlay3 in progress for New Bern through Tyvola: Intended to transition industrial and commercial to more intensive uses. Along corridor at station, mixed uses allowed, residential areas allowed more density and employment uses more intensity.
Transit-supportive overlay in progress for Archdale through I-485 Station: Vacant parcels allowed to develop more dense housing and mixed uses near station and corridor.
2 Known completion dates for projects date as far back as 2002; project information was provided by the City of Charlotte and completion dates were not available for all projects.
1 Density designations as follows: DT = >50DUA, high density = 26 - 50DUA, medium density = 10 - 25DUA, & low density = .5 - 9DUA.
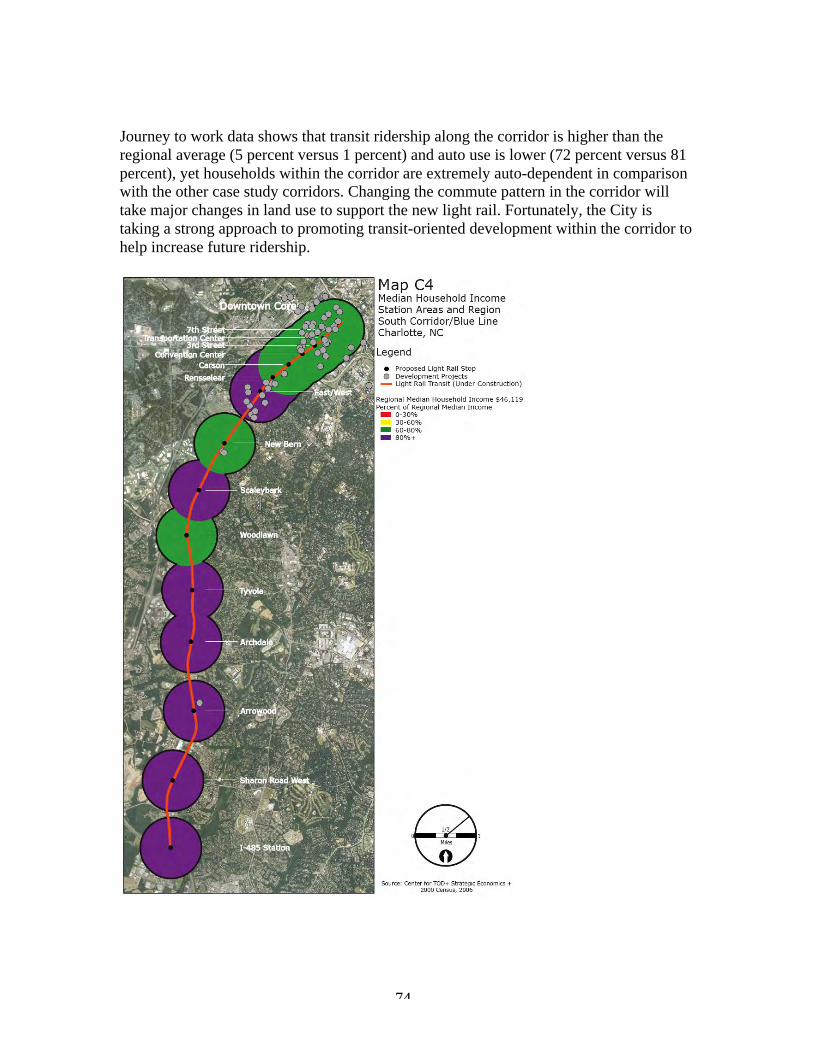
74
Journey to work data shows that transit ridership along the corridor is higher than theregional average (5 percent versus 1 percent) and auto use is lower (72 percent versus 81percent), yet households within the corridor are extremely auto-dependent in comparisonwith the other case study corridors. Changing the commute pattern in the corridor willtake major changes in land use to support the new light rail. Fortunately, the City istaking a strong approach to promoting transit-oriented development within the corridor tohelp increase future ridership.
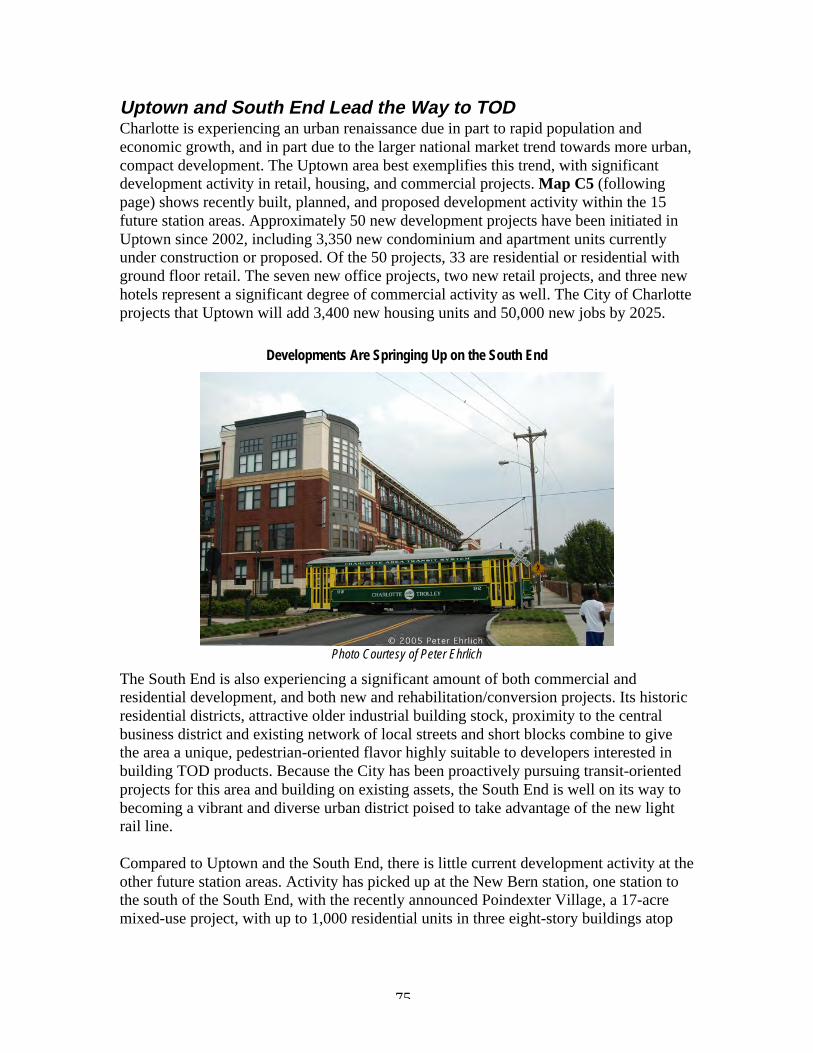
75
Uptown and South End Lead the Way to TODCharlotte is experiencing an urban renaissance due in part to rapid population andeconomic growth, and in part due to the larger national market trend towards more urban,compact development. The Uptown area best exemplifies this trend, with significantdevelopment activity in retail, housing, and commercial projects. Map C5 (followingpage) shows recently built, planned, and proposed development activity within the 15future station areas. Approximately 50 new development projects have been initiated inUptown since 2002, including 3,350 new condominium and apartment units currentlyunder construction or proposed. Of the 50 projects, 33 are residential or residential withground floor retail. The seven new office projects, two new retail projects, and three newhotels represent a significant degree of commercial activity as well. The City of Charlotteprojects that Uptown will add 3,400 new housing units and 50,000 new jobs by 2025.
Developments Are Springing Up on the South End
Photo Courtesy of Peter Ehrlich
The South End is also experiencing a significant amount of both commercial andresidential development, and both new and rehabilitation/conversion projects. Its historicresidential districts, attractive older industrial building stock, proximity to the centralbusiness district and existing network of local streets and short blocks combine to givethe area a unique, pedestrian-oriented flavor highly suitable to developers interested inbuilding TOD products. Because the City has been proactively pursuing transit-orientedprojects for this area and building on existing assets, the South End is well on its way tobecoming a vibrant and diverse urban district poised to take advantage of the new lightrail line.
Compared to Uptown and the South End, there is little current development activity at theother future station areas. Activity has picked up at the New Bern station, one station tothe south of the South End, with the recently announced Poindexter Village, a 17-acremixed-use project, with up to 1,000 residential units in three eight-story buildings atop
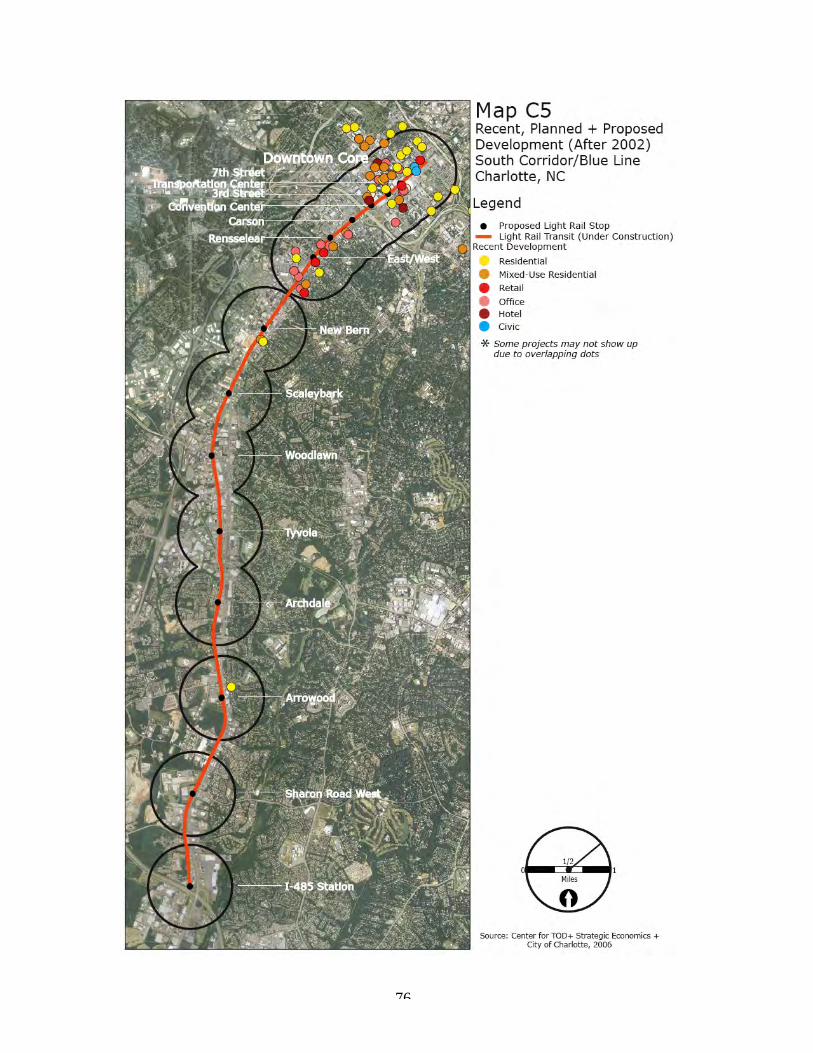
76
77
150,000 square feet of retail.81 While there are significant redevelopment opportunities atmost station areas, none have the extensive infrastructure needed to support atransformation from unconnected, large-scale, single-use development to a morewalkable, multi-use, transit-supportive environment. It will take some time for thesecritical investments, beyond the transit itself, to be put in place. The City’s approach toland use planning around the stations (described in detail in the next section) is a strongstep towards making these transformations.
Proactive City Involvement Creates Comprehensive TODFrameworkBuilding on lessons learned from other communities, the City and CATS are taking astrategic approach towards planning for TOD and creating tools to strengthen its existingurban neighborhoods and build new transit-oriented districts around the future stations.The overall framework for this work was an integrated 2025 transit and land use plan forthe City of Charlotte and other cities in Mecklenburg County. Adopted in 1998, it laid outa general process for planning and implementation of land use regulations and futureinfrastructure improvements. The framework includes the creation of transit station areaprinciples (completed in 2001) for all the future lines,82 general and joint developmentpolicies (2003), transit station area plans (in various stages), zoning updates,infrastructure plans, and implementation.
In anticipation of the South Corridor light rail, defined one-half mile walking areasaround each of the new stations are the focus of new land use and infrastructure planningand re-zoning. The Uptown and South End Stations moved ahead with transit-supportivezoning in 2004-05, as well as “pedscape” and station area plans currently beingimplemented. While the underlying zoning for the stations from New Bern to I-485 hasnot yet been updated, the City has developed proposed transit-supportive overlaysintended to begin transitioning these areas to more appropriate land uses. Equally criticalto improving access and ridership, the City and CATS have identified and begunimplementing other key infrastructure improvements to sidewalks, bike paths, medians,park and ride lots, and water drainage around seven of the outer stations. Theseimprovements are being financed by a $50 million bond for infrastructure projects tosupport the light rail.
The City and CATS have joined together at the Scaleybark Station to purchase 17 acresof land, hoping to see new TOD development transform this area just beyond the SouthEnd into a compact mix of housing and retail that will trigger market interest further
81 Doug Smith. Hip Life Along Light Rail. Charlotte Observer, November 1, 2006.82 Planning principles are divided into three general categories: land use and development, includingmixture of complementary transit-supportive uses and increase land use intensity; mobility, includingpedestrian and bicycle system, street network and parking; and community design, including building andsite design, streetscape and open space. These general principles guide the various station area plans, re-zoning efforts and infrastructure plans that have followed for the each station.
78
south along the line. Several developers have submitted offers in response to a request forproposals currently under review by the City.
V. Creating Mixed-Income Communities: Public Agencies Learnon the Go with Proactive ApproachFrom the outset, affordable housing has been a stated policy goal of the City’s overallapproach to TOD. A comprehensive review of the City’s affordable housing policy beganin 1999, culminating in a 2001 plan to better link transit access and affordability. Initialdevelopment activity has focused more on building a TOD market in Charlotte than onproviding new affordable housing, in part of out the need to demonstrate the legitimacyand demand for an urban, high-density, mixed-use TOD market. The City, however, isdeveloping a set of tools to try and foster both TOD and affordability, particularly giventhe positive development response thus far.
Local Policy TOD and Affordable Housing Tools Need to beCalibratedIn 2001, the City of Charlotte revised its affordable housing policy to reflect the newtransit investment and balance the development of affordable and market-rate housing inthe light rail corridors. The normal local fair-share housing policy limits the share ofpublicly subsidized units in a “neighborhood statistical area” to 10 percent of the totalnumber of housing units. Intensive discussions with community groups resulted in anexception to the local fair share housing policy to allow areas within one-quarter mile oftransit to have up to 20 percent publicly subsidized affordable units. However, thesediscussions also resulted in a policy that only five percent of units within a given newproject should be affordable to households at less than 60 percent area median income.
This rule has proven very challenging for financing of mixed-income or affordableprojects as federal Low-Income Housing Tax Credits require deeper and broader levels ofaffordability and tax credit investors tend to look for projects with maximumaffordability. The City and various agencies involved in financing affordable housing arecurrently trying to resolve these issues and it is likely that further public outreach will benecessary to reach a resolution. In the meantime, the City has been granting exceptions tothe affordability limits, as appropriate. The City is also using its affordable housing trustfund to acquire sites within transit areas and plans to work with developers in theredevelopment of these sites to provide affordable units.
Despite these efforts, there has been very little affordable or mixed-income housingdevelopment activity in the South Corridor since 2002 (see Map C6, following page). Inaddition to a mixed-income project on the edge of the Uptown station areas, a mixed-income project approximately one-quarter mile from the Arrowood station is currently inpredevelopment. It will include 100 units of affordable housing and 92 market rate units.The project received credit enhancement through HUD, tax credits from the NorthCarolina Housing Finance Agency, City of Charlotte affordable housing bonds as well asdebt from the Charlotte Housing Authority.
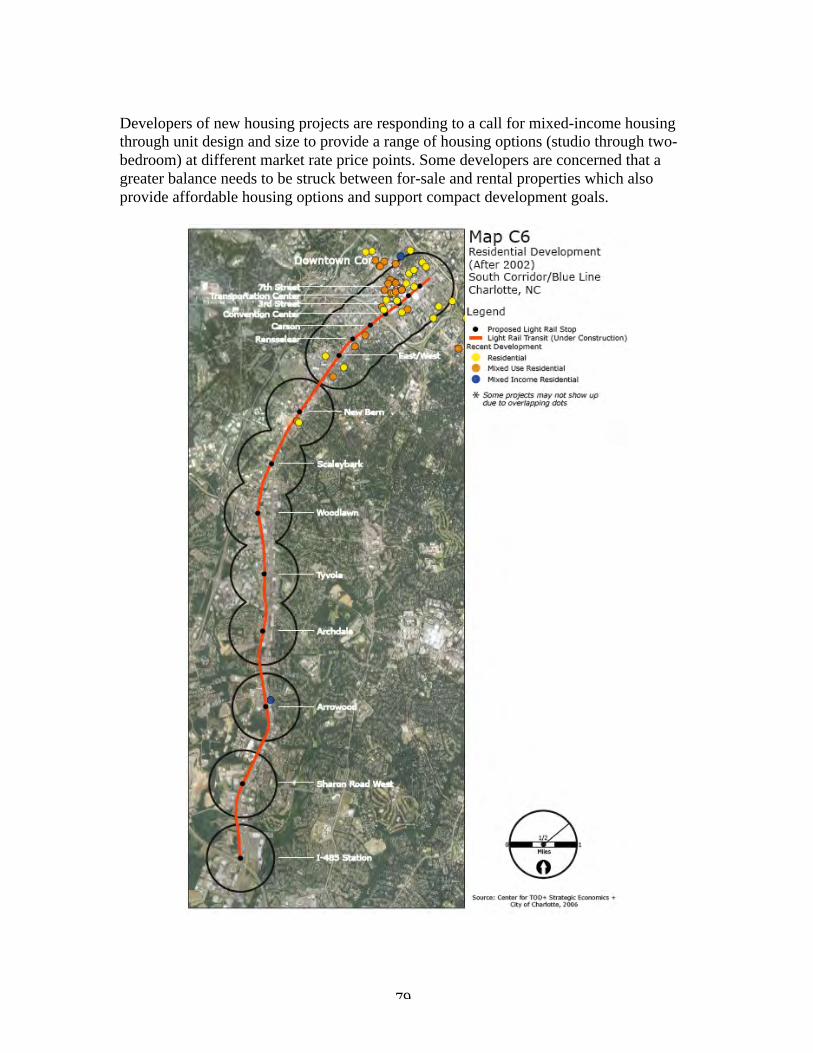
79
Developers of new housing projects are responding to a call for mixed-income housingthrough unit design and size to provide a range of housing options (studio through two-bedroom) at different market rate price points. Some developers are concerned that agreater balance needs to be struck between for-sale and rental properties which alsoprovide affordable housing options and support compact development goals.
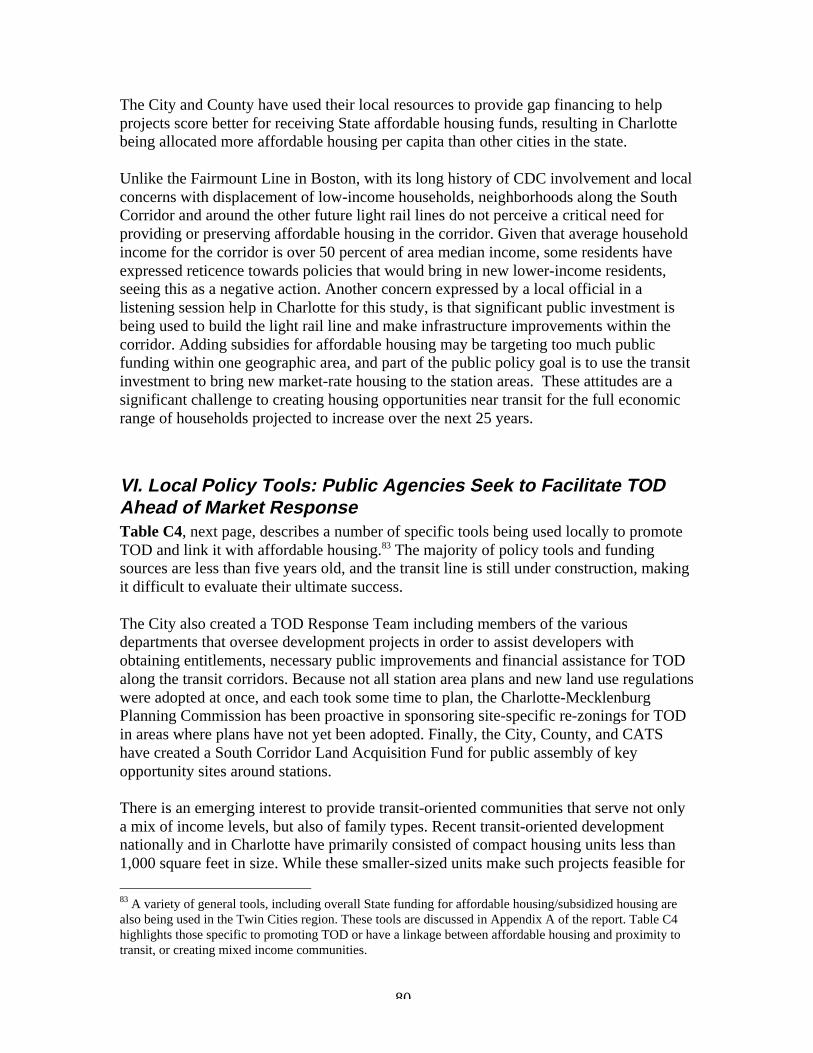
80
The City and County have used their local resources to provide gap financing to helpprojects score better for receiving State affordable housing funds, resulting in Charlottebeing allocated more affordable housing per capita than other cities in the state.
Unlike the Fairmount Line in Boston, with its long history of CDC involvement and localconcerns with displacement of low-income households, neighborhoods along the SouthCorridor and around the other future light rail lines do not perceive a critical need forproviding or preserving affordable housing in the corridor. Given that average householdincome for the corridor is over 50 percent of area median income, some residents haveexpressed reticence towards policies that would bring in new lower-income residents,seeing this as a negative action. Another concern expressed by a local official in alistening session help in Charlotte for this study, is that significant public investment isbeing used to build the light rail line and make infrastructure improvements within thecorridor. Adding subsidies for affordable housing may be targeting too much publicfunding within one geographic area, and part of the public policy goal is to use the transitinvestment to bring new market-rate housing to the station areas. These attitudes are asignificant challenge to creating housing opportunities near transit for the full economicrange of households projected to increase over the next 25 years.
VI. Local Policy Tools: Public Agencies Seek to Facilitate TODAhead of Market ResponseTable C4, next page, describes a number of specific tools being used locally to promoteTOD and link it with affordable housing.83 The majority of policy tools and fundingsources are less than five years old, and the transit line is still under construction, makingit difficult to evaluate their ultimate success.
The City also created a TOD Response Team including members of the variousdepartments that oversee development projects in order to assist developers withobtaining entitlements, necessary public improvements and financial assistance for TODalong the transit corridors. Because not all station area plans and new land use regulationswere adopted at once, and each took some time to plan, the Charlotte-MecklenburgPlanning Commission has been proactive in sponsoring site-specific re-zonings for TODin areas where plans have not yet been adopted. Finally, the City, County, and CATShave created a South Corridor Land Acquisition Fund for public assembly of keyopportunity sites around stations.
There is an emerging interest to provide transit-oriented communities that serve not onlya mix of income levels, but also of family types. Recent transit-oriented developmentnationally and in Charlotte have primarily consisted of compact housing units less than1,000 square feet in size. While these smaller-sized units make such projects feasible for 83 A variety of general tools, including overall State funding for affordable housing/subsidized housing arealso being used in the Twin Cities region. These tools are discussed in Appendix A of the report. Table C4highlights those specific to promoting TOD or have a linkage between affordable housing and proximity totransit, or creating mixed income communities.

81
developers, they may not be appropriate for families with children hoping to live neartransit. The desire in Charlotte to build family-oriented TOD, and the correlatedingredients, such as ample open space and quality schools is a theme emerging locally forplanners to consider in extending the reach of TOD beyond Uptown.
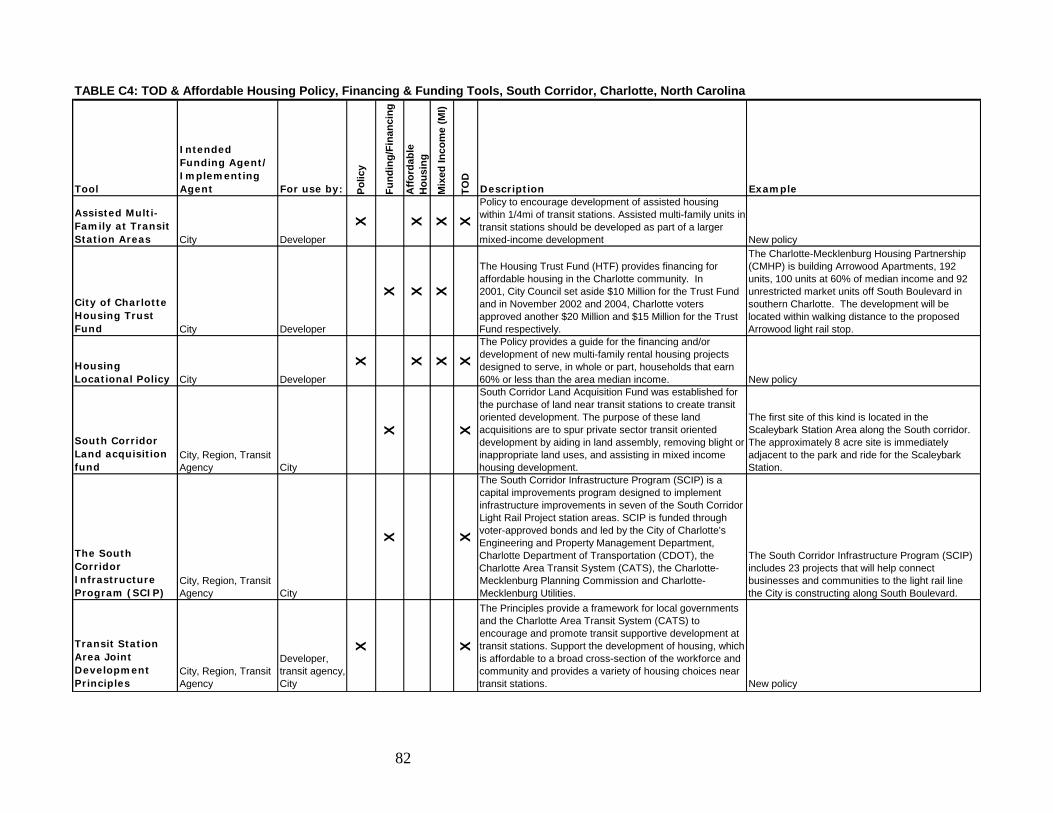
82
Tool
Intended Funding Agent/ Implementing Agent For use by: P
olic
y
Fu
nd
ing
/Fin
anci
ng
Aff
ord
able
H
ou
sin
g
Mix
ed I
nco
me
(MI)
TO
D
Description Example
Assisted Multi-Family at Transit Station Areas City Developer
X X X X
Policy to encourage development of assisted housing within 1/4mi of transit stations. Assisted multi-family units in transit stations should be developed as part of a larger mixed-income development New policy
City of Charlotte Housing Trust Fund City Developer
X X X
The Housing Trust Fund (HTF) provides financing for affordable housing in the Charlotte community. In 2001, City Council set aside $10 Million for the Trust Fund and in November 2002 and 2004, Charlotte voters approved another $20 Million and $15 Million for the Trust Fund respectively.
The Charlotte-Mecklenburg Housing Partnership (CMHP) is building Arrowood Apartments, 192 units, 100 units at 60% of median income and 92 unrestricted market units off South Boulevard in southern Charlotte. The development will be located within walking distance to the proposed Arrowood light rail stop.
Housing Locational Policy City Developer
X X X X
The Policy provides a guide for the financing and/or development of new multi-family rental housing projects designed to serve, in whole or part, households that earn 60% or less than the area median income. New policy
South Corridor Land acquisition fund
City, Region, Transit Agency City
X X
South Corridor Land Acquisition Fund was established for the purchase of land near transit stations to create transit oriented development. The purpose of these land acquisitions are to spur private sector transit oriented development by aiding in land assembly, removing blight or inappropriate land uses, and assisting in mixed income housing development.
The first site of this kind is located in the Scaleybark Station Area along the South corridor. The approximately 8 acre site is immediately adjacent to the park and ride for the Scaleybark Station.
The South Corridor Infrastructure Program (SCIP)
City, Region, Transit Agency City
X XThe South Corridor Infrastructure Program (SCIP) is a capital improvements program designed to implement infrastructure improvements in seven of the South Corridor Light Rail Project station areas. SCIP is funded through voter-approved bonds and led by the City of Charlotte's Engineering and Property Management Department, Charlotte Department of Transportation (CDOT), the Charlotte Area Transit System (CATS), the Charlotte-Mecklenburg Planning Commission and Charlotte-Mecklenburg Utilities.
The South Corridor Infrastructure Program (SCIP) includes 23 projects that will help connect businesses and communities to the light rail line the City is constructing along South Boulevard.
Transit Station Area Joint Development Principles
City, Region, Transit Agency
Developer, transit agency, City
X X
The Principles provide a framework for local governments and the Charlotte Area Transit System (CATS) to encourage and promote transit supportive development at transit stations. Support the development of housing, which is affordable to a broad cross-section of the workforce and community and provides a variety of housing choices near transit stations. New policy
TABLE C4: TOD & Affordable Housing Policy, Financing & Funding Tools, South Corridor, Charlotte, North Carolina
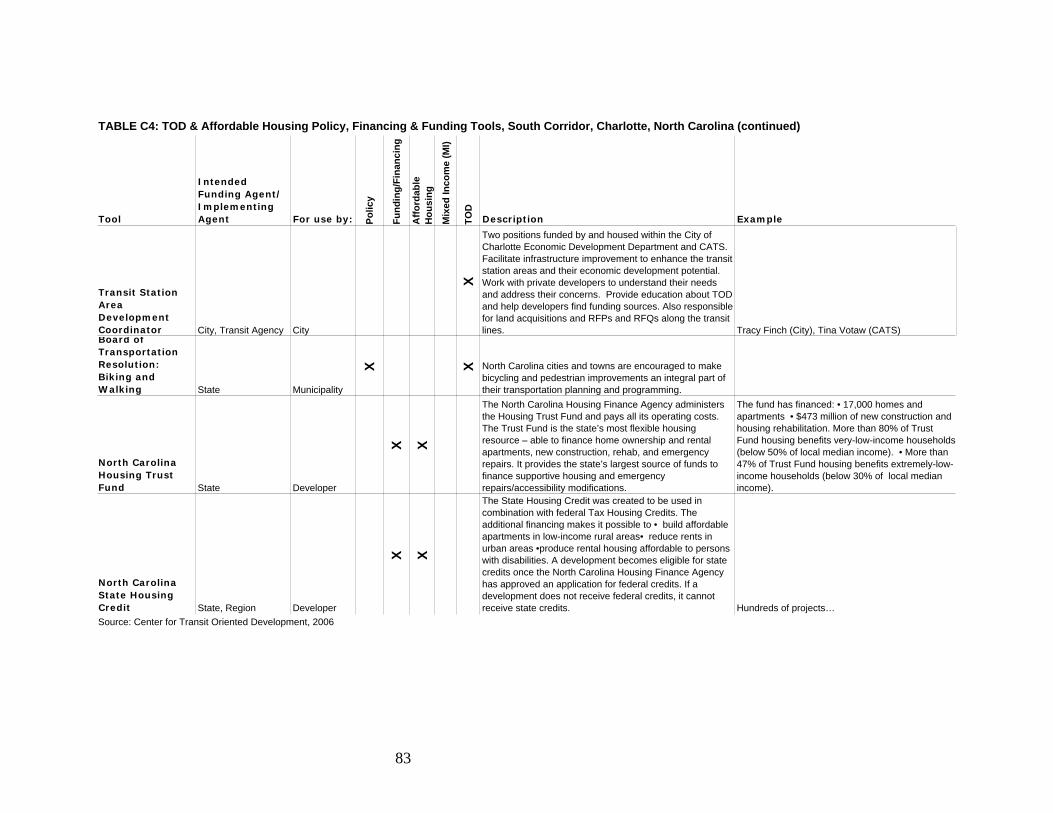
83
Tool
Intended Funding Agent/ Implementing Agent For use by: P
olic
y
Fu
nd
ing
/Fin
anci
ng
Aff
ord
able
H
ou
sin
g
Mix
ed In
com
e (M
I)
TO
D
Description Example
Transit Station Area Development Coordinator City, Transit Agency City
X
Two positions funded by and housed within the City of Charlotte Economic Development Department and CATS. Facilitate infrastructure improvement to enhance the transit station areas and their economic development potential. Work with private developers to understand their needs and address their concerns. Provide education about TOD and help developers find funding sources. Also responsible for land acquisitions and RFPs and RFQs along the transit lines. Tracy Finch (City), Tina Votaw (CATS)
Board of Transportation Resolution: Biking and Walking State Municipality
X X North Carolina cities and towns are encouraged to make bicycling and pedestrian improvements an integral part of their transportation planning and programming.
North Carolina Housing Trust Fund State Developer
X XThe North Carolina Housing Finance Agency administers the Housing Trust Fund and pays all its operating costs. The Trust Fund is the state’s most flexible housing resource – able to finance home ownership and rental apartments, new construction, rehab, and emergency repairs. It provides the state’s largest source of funds to finance supportive housing and emergency repairs/accessibility modifications.
The fund has financed: • 17,000 homes and apartments • $473 million of new construction and housing rehabilitation. More than 80% of Trust Fund housing benefits very-low-income households (below 50% of local median income). • More than 47% of Trust Fund housing benefits extremely-low-income households (below 30% of local median income).
North Carolina State Housing Credit State, Region Developer
X X
The State Housing Credit was created to be used in combination with federal Tax Housing Credits. The additional financing makes it possible to • build affordable apartments in low-income rural areas• reduce rents in urban areas •produce rental housing affordable to persons with disabilities. A development becomes eligible for state credits once the North Carolina Housing Finance Agency has approved an application for federal credits. If a development does not receive federal credits, it cannot receive state credits. Hundreds of projects…
TABLE C4: TOD & Affordable Housing Policy, Financing & Funding Tools, South Corridor, Charlotte, North Carolina (continued)
Source: Center for Transit Oriented Development, 2006
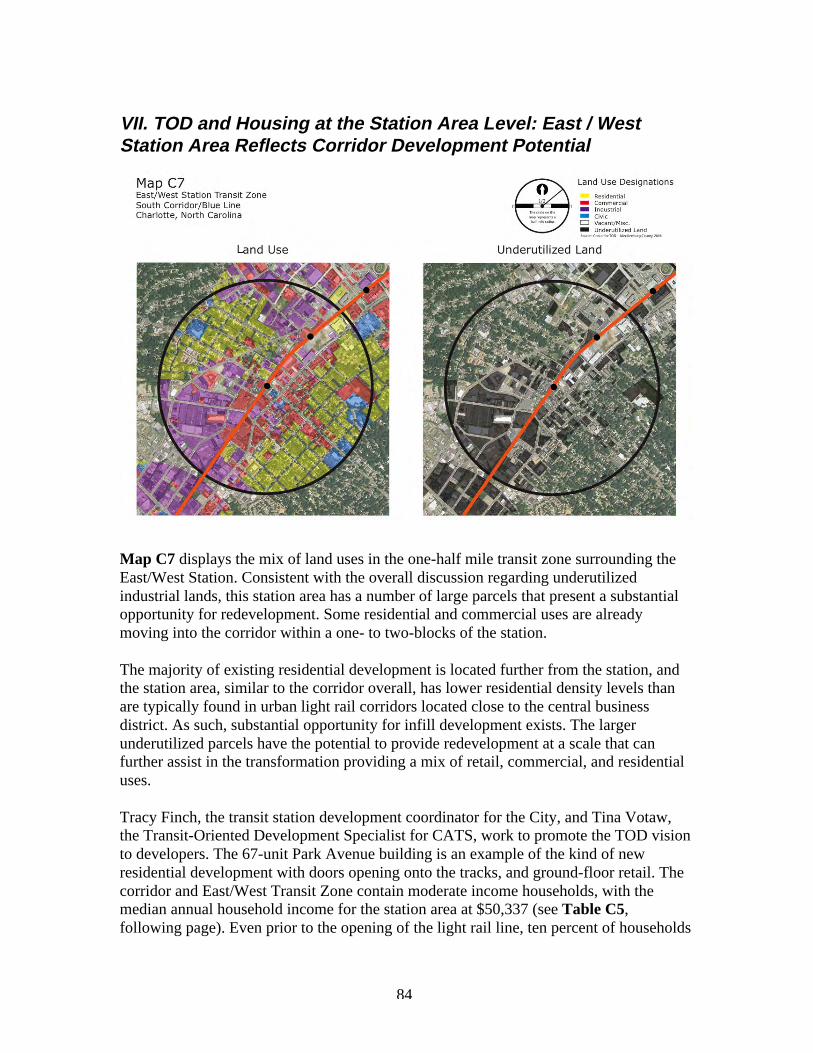
84
VII. TOD and Housing at the Station Area Level: East / WestStation Area Reflects Corridor Development Potential
Map C7 displays the mix of land uses in the one-half mile transit zone surrounding theEast/West Station. Consistent with the overall discussion regarding underutilizedindustrial lands, this station area has a number of large parcels that present a substantialopportunity for redevelopment. Some residential and commercial uses are alreadymoving into the corridor within a one- to two-blocks of the station.
The majority of existing residential development is located further from the station, andthe station area, similar to the corridor overall, has lower residential density levels thanare typically found in urban light rail corridors located close to the central businessdistrict. As such, substantial opportunity for infill development exists. The largerunderutilized parcels have the potential to provide redevelopment at a scale that canfurther assist in the transformation providing a mix of retail, commercial, and residentialuses.
Tracy Finch, the transit station development coordinator for the City, and Tina Votaw,the Transit-Oriented Development Specialist for CATS, work to promote the TOD visionto developers. The 67-unit Park Avenue building is an example of the kind of newresidential development with doors opening onto the tracks, and ground-floor retail. Thecorridor and East/West Transit Zone contain moderate income households, with themedian annual household income for the station area at $50,337 (see Table C5,following page). Even prior to the opening of the light rail line, ten percent of households
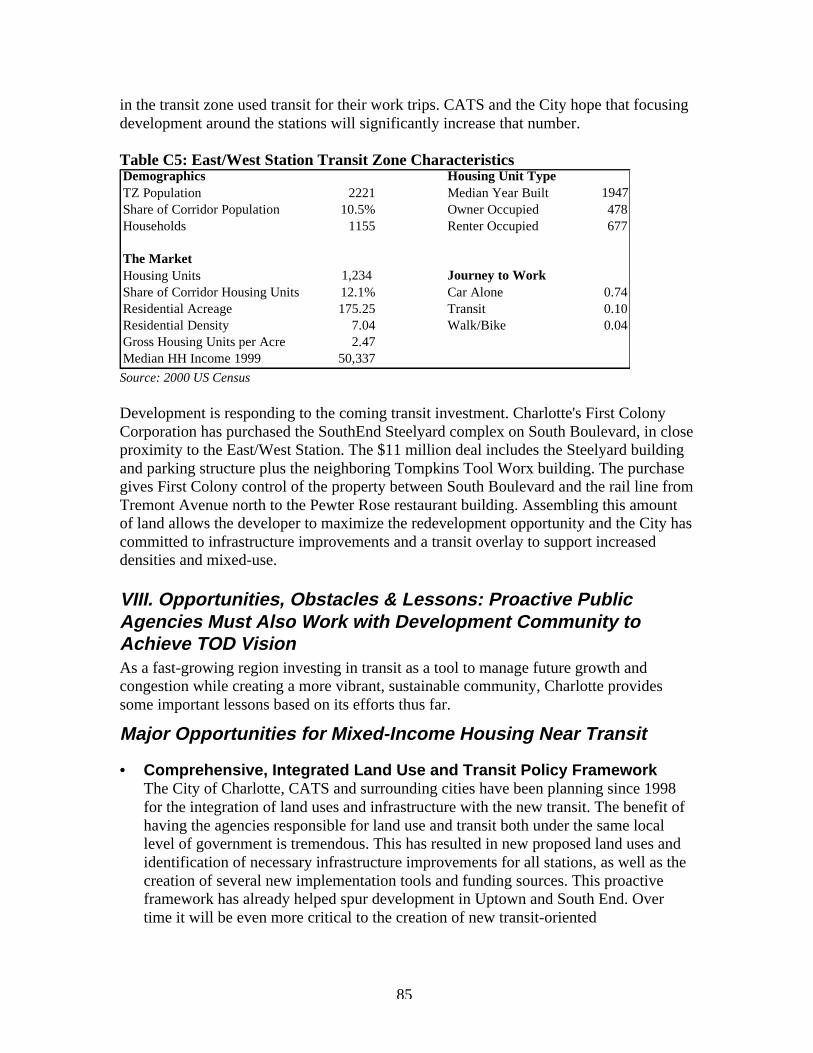
85
in the transit zone used transit for their work trips. CATS and the City hope that focusingdevelopment around the stations will significantly increase that number.
Table C5: East/West Station Transit Zone CharacteristicsDemographics Housing Unit TypeTZ Population 2221 Median Year Built 1947Share of Corridor Population 10.5% Owner Occupied 478Households 1155 Renter Occupied 677
The MarketHousing Units 1,234 Journey to WorkShare of Corridor Housing Units 12.1% Car Alone 0.74Residential Acreage 175.25 Transit 0.10Residential Density 7.04 Walk/Bike 0.04Gross Housing Units per Acre 2.47Median HH Income 1999 50,337Source: 2000 US Census
Development is responding to the coming transit investment. Charlotte's First ColonyCorporation has purchased the SouthEnd Steelyard complex on South Boulevard, in closeproximity to the East/West Station. The $11 million deal includes the Steelyard buildingand parking structure plus the neighboring Tompkins Tool Worx building. The purchasegives First Colony control of the property between South Boulevard and the rail line fromTremont Avenue north to the Pewter Rose restaurant building. Assembling this amountof land allows the developer to maximize the redevelopment opportunity and the City hascommitted to infrastructure improvements and a transit overlay to support increaseddensities and mixed-use.
VIII. Opportunities, Obstacles & Lessons: Proactive PublicAgencies Must Also Work with Development Community toAchieve TOD VisionAs a fast-growing region investing in transit as a tool to manage future growth andcongestion while creating a more vibrant, sustainable community, Charlotte providessome important lessons based on its efforts thus far.
Major Opportunities for Mixed-Income Housing Near Transit
• Comprehensive, Integrated Land Use and Transit Policy FrameworkThe City of Charlotte, CATS and surrounding cities have been planning since 1998for the integration of land uses and infrastructure with the new transit. The benefit ofhaving the agencies responsible for land use and transit both under the same locallevel of government is tremendous. This has resulted in new proposed land uses andidentification of necessary infrastructure improvements for all stations, as well as thecreation of several new implementation tools and funding sources. This proactiveframework has already helped spur development in Uptown and South End. Overtime it will be even more critical to the creation of new transit-oriented
86
neighborhoods around the southern stations with more typically suburbandevelopment patterns and industrial land uses.
• Existing Urban Fabric in Uptown and South End Creates Significant InfillOpportunitiesThe areas around the stations in both Uptown and the South End are alreadyestablished as complex urban environments with multiple uses, street networks, andphysical character. At the same time, there are many redevelopment and re-useopportunity sites that will allow for infill development and conversion of obsoleteuses to TOD of greater intensity. The size of properties in this corridor presents aparticularly advantageous setting for larger, mixed-use developments.
• Strong Housing and Commercial Markets in Central CityRenewed interest in downtown living and significant public and private investments,particularly by Bank of America and Wachovia, in revitalizing downtown Charlottehave generated a wave of new real estate development activity. Charlotte is alreadyexperiencing a major upsurge in both residential and commercial developmentactivity in Uptown and South End with 50 recent and proposed projects in Uptownalone. The rail line should bolster this trend, bringing more TOD to these areas.
• Major Redevelopment Potential around Southern StationsThe eight stations located south of the South End are surrounded by an enormousamount of underutilized land, due to the amount of low intensity industrial andcommercial uses in the corridor. While maximizing the transit investment in theseareas must be balanced with Charlotte’s need to preserve a diverse and healthyeconomy, some portion of these large parcels can be redeveloped as TOD.
Obstacles
• Lack of Public Infrastructure and Existing Housing Market AroundSouthern StationsTransforming the areas along the southern stations into walkable, multi-modal,mixed-use places will require significant investments that improve the connectivity,safety and character of neighborhoods before transit-oriented development can fullysucceed. Without them it will be difficult to attract development to these locations, letalone TOD. Successful TOD will take significant public improvements, excellenturban design directives, and time to transition these areas to transit-supportive places.Over time, as public improvements are made around these stations, there should be anopportunity to pull the momentum of the downtown housing market southward. Oneconcern is that the substantial public investment in place-making and connectivityinfrastructure will tap out any funds that would have otherwise been available foraffordable housing.
87
• Community Discomfort with Affordable HousingExisting neighborhoods surrounding the new stations on the South Corridor arerelatively higher income than those in the other case study corridors. New affordablehousing is not perceived as a community benefit, but as a burden, creating asignificant challenge for building of mixed-income communities. While the City istaking steps to be proactive in this regard, the public will need to be engaged indiscussions involving prioritizing public funding for affordable housing,infrastructure improvements, parking requirements, and community benefits toevaluate the trade-offs of each.
• Auto-Dominated Development Patterns and Travel Trends Need to beReversed in Transit ZonesRegionally, less than one percent of commute trips are made by transit, residentialdensities are low and commercial uses are more suburban in nature. This presents achallenge for public agencies to address through re-zoning and identifying otherregulatory or infrastructure barriers to transit-supportive development. Incentives maybe necessary, particularly at the more suburban southern stations. Perhaps moresignificant a challenge, is demonstrating transit’s viability as a mode for commutingand the desirability of living in transit-accessible, walkable, mixed-use communities.
Lessons from the Corridor for Charlotte and Other Communities
• Plan for Success with TOD-Supportive Zoning and Public ImprovementsThe City of Charlotte, CATS and other partners have done an extensive amount ofwork creating an integrated policy framework to support TOD and mixed-incomehousing in the new light rail corridors. These efforts include the creation of stationarea plans, updating local zoning, identifying critical infrastructure improvements,and revising the city-wide affordable housing policy. The overall framework andindividual components provide a model for forward-looking planning around lightrail investments, especially for other cities and regions inserting transit into non-urbansettings.
• Planned Growth Corridors Necessitate Comprehensive ImplementationToolsThe City and it partners have created a number of important implementation tools,without which transit-oriented, mixed-income development could not move forward.The voter-approved $50 million infrastructure bonds to implement the South CorridorInfrastructure Plan, the South Corridor Land Acquisition Fund, creation of a TODResponse Team including dedicated staff at both the City and CATS, and formulationof a Joint Development program are critical aids in bringing TOD to the corridor. Theperformance of these tools should be evaluated over time, as the line is complete andimprovements and development move forward.
88
• Consider Financing and Funding Challenges in Developing LocalAffordable Housing PolicyThe City of Charlotte’s affordable housing policy, while to be commended foridentifying early on the need to link affordable housing to quality transit service, hasstumbled in its implementation. Recently revised, in conjunction with extensivecommunity discussion, to target the new station areas, the existing policy does nottake into consideration the major restrictions and requirements imposed by theaffordable housing finance industry, including State and Federal thresholds forallocating tax credits. For mixed-income policies to be effective, they mustacknowledge the reality of these funding sources, without which affordable housingwill not be built. Mixed-income housing involves multiple decision makers and needsto be closely coordinated to allow for greater and easier use by private for-profit andnon-profit developers. Ensuring comparable definitions, thresholds, and timelines canhelp alleviate inconsistencies.
• Successful TOD is Not Just the Responsibility of the Public SectorGiven the significant increase in demand for housing near transit and the extent ofadditional infrastructure improvements needed beyond just constructing the light rail,the City and CATS will need to work with interested private sector developers tomake the necessary accessibility and urban design improvements. Already a numberof local and national developers have expressed interest in redeveloping parcelsaround future stations, and even in contributing to future infrastructure investmentsincluding streetscape and station area improvements, and potentially partnering tobuild future stations or streetcar service. These types of public-private partnershipshave the potential to yield substantial community benefits and accelerateinfrastructure improvements that can further spur redevelopment. Portland’s PearlDistrict might be a model for public-private partnerships to help deliver mixed-income housing.
• Create Activity Centers Beyond the DowntownThe strength of the housing and commercial markets in the Uptown and South Enddistricts correlates with the presence in both areas of destination stops and activitycenters. As the line moves further south there is a lack of existing commercial orpublic activity around stations. A challenge for this corridor will be to provide mixedhousing, retail, and commercial space that will create activity centers both forresidents living within station areas and in surrounding neighborhoods. SuccessfulTOD corridors require a mix of station area types and locating future regionaldestination activities along the corridor may help increase development opportunitiesand generate additional non-peak hour ridership.
The next chapter discusses TOD efforts underway in the Denver metropolitan region’sWest Corridor, scheduled to open in 2013 as one of five new transit lines being plannedfor the region over the next 15 years.
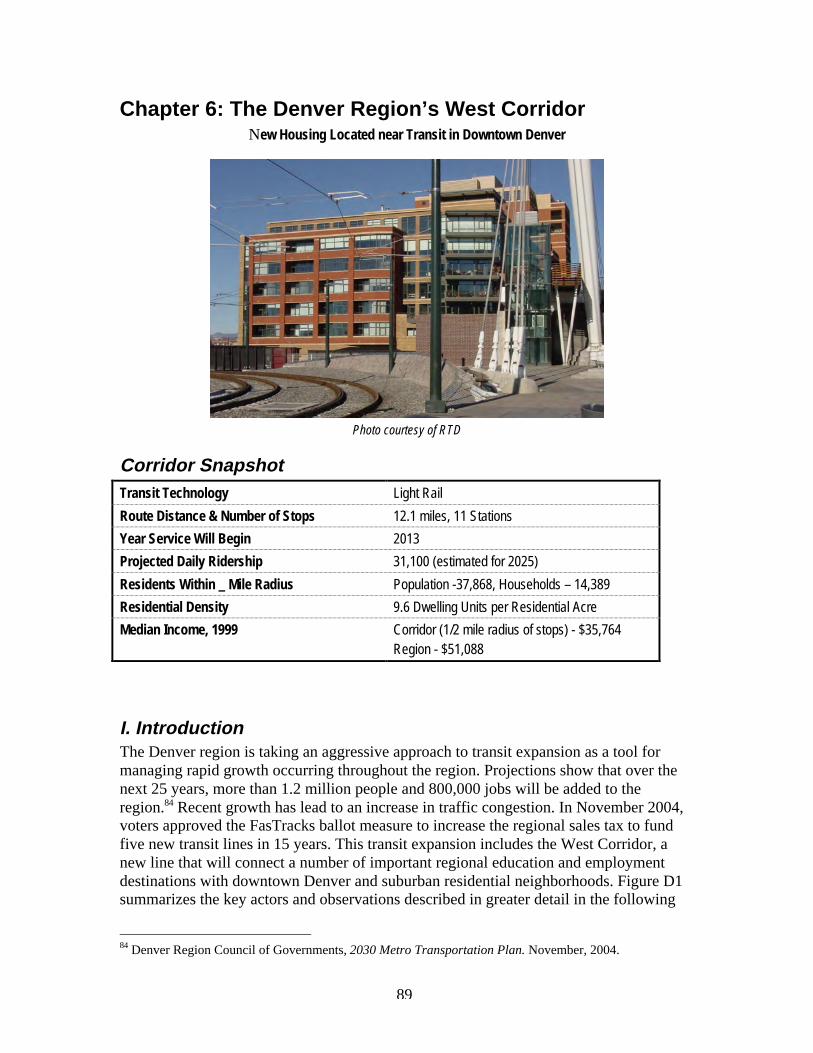
89
Chapter 6: The Denver Region’s West CorridorNew Housing Located near Transit in Downtown Denver
Photo courtesy of RTD
Corridor SnapshotTransit Technology Light Rail
Route Distance & Number of Stops 12.1 miles, 11 Stations
Year Service Will Begin 2013
Projected Daily Ridership 31,100 (estimated for 2025)
Residents Within _ Mile Radius Population -37,868, Households – 14,389
Residential Density 9.6 Dwelling Units per Residential Acre
Median Income, 1999 Corridor (1/2 mile radius of stops) - $35,764Region - $51,088
I. IntroductionThe Denver region is taking an aggressive approach to transit expansion as a tool formanaging rapid growth occurring throughout the region. Projections show that over thenext 25 years, more than 1.2 million people and 800,000 jobs will be added to theregion.84 Recent growth has lead to an increase in traffic congestion. In November 2004,voters approved the FasTracks ballot measure to increase the regional sales tax to fundfive new transit lines in 15 years. This transit expansion includes the West Corridor, anew line that will connect a number of important regional education and employmentdestinations with downtown Denver and suburban residential neighborhoods. Figure D1summarizes the key actors and observations described in greater detail in the following
84 Denver Region Council of Governments, 2030 Metro Transportation Plan. November, 2004.
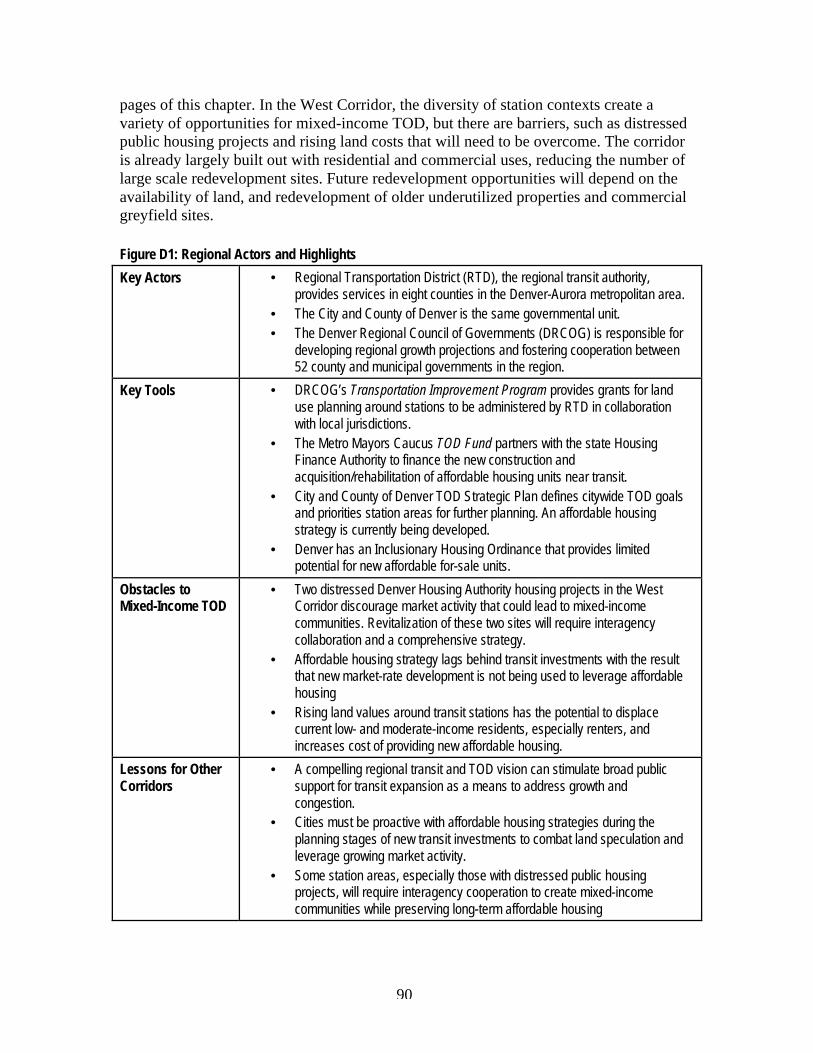
90
pages of this chapter. In the West Corridor, the diversity of station contexts create avariety of opportunities for mixed-income TOD, but there are barriers, such as distressedpublic housing projects and rising land costs that will need to be overcome. The corridoris already largely built out with residential and commercial uses, reducing the number oflarge scale redevelopment sites. Future redevelopment opportunities will depend on theavailability of land, and redevelopment of older underutilized properties and commercialgreyfield sites.
Figure D1: Regional Actors and Highlights
Key Actors • Regional Transportation District (RTD), the regional transit authority,provides services in eight counties in the Denver-Aurora metropolitan area.
• The City and County of Denver is the same governmental unit.• The Denver Regional Council of Governments (DRCOG) is responsible for
developing regional growth projections and fostering cooperation between52 county and municipal governments in the region.
Key Tools • DRCOG’s Transportation Improvement Program provides grants for landuse planning around stations to be administered by RTD in collaborationwith local jurisdictions.
• The Metro Mayors Caucus TOD Fund partners with the state HousingFinance Authority to finance the new construction andacquisition/rehabilitation of affordable housing units near transit.
• City and County of Denver TOD Strategic Plan defines citywide TOD goalsand priorities station areas for further planning. An affordable housingstrategy is currently being developed.
• Denver has an Inclusionary Housing Ordinance that provides limitedpotential for new affordable for-sale units.
Obstacles toMixed-Income TOD
• Two distressed Denver Housing Authority housing projects in the WestCorridor discourage market activity that could lead to mixed-incomecommunities. Revitalization of these two sites will require interagencycollaboration and a comprehensive strategy.
• Affordable housing strategy lags behind transit investments with the resultthat new market-rate development is not being used to leverage affordablehousing
• Rising land values around transit stations has the potential to displacecurrent low- and moderate-income residents, especially renters, andincreases cost of providing new affordable housing.
Lessons for OtherCorridors
• A compelling regional transit and TOD vision can stimulate broad publicsupport for transit expansion as a means to address growth andcongestion.
• Cities must be proactive with affordable housing strategies during theplanning stages of new transit investments to combat land speculation andleverage growing market activity.
• Some station areas, especially those with distressed public housingprojects, will require interagency cooperation to create mixed-incomecommunities while preserving long-term affordable housing
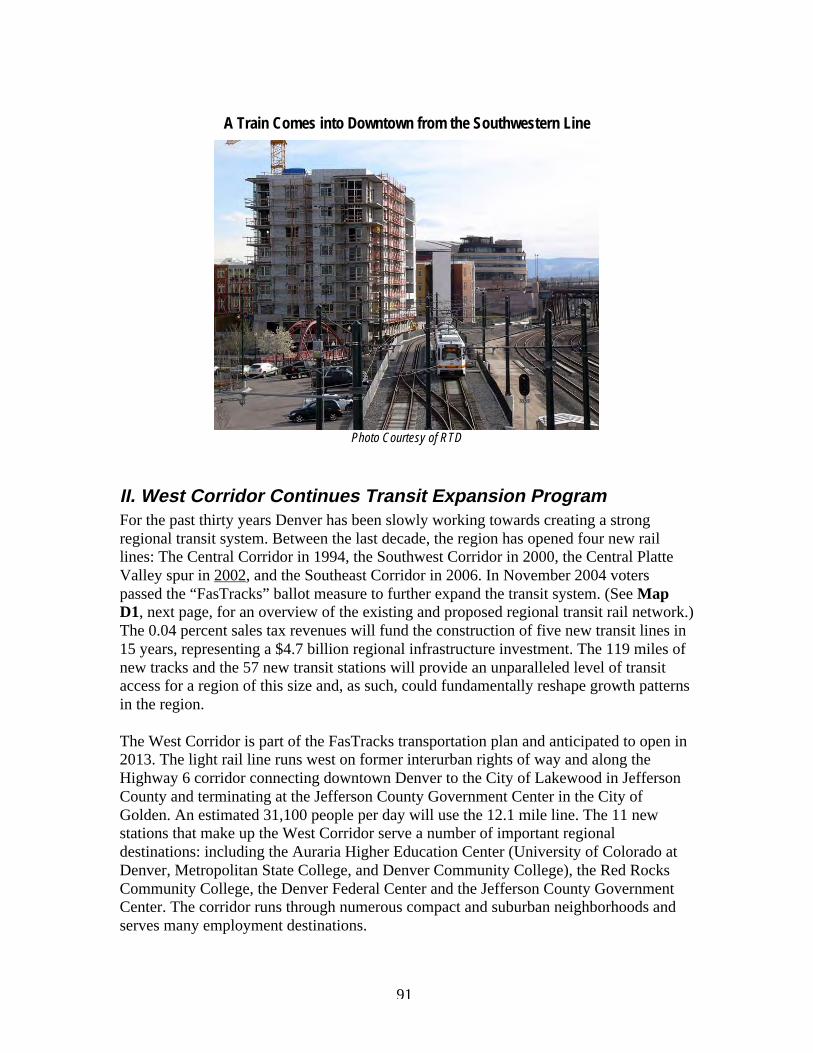
91
A Train Comes into Downtown from the Southwestern Line
Photo Courtesy of RTD
II. West Corridor Continues Transit Expansion ProgramFor the past thirty years Denver has been slowly working towards creating a strongregional transit system. Between the last decade, the region has opened four new raillines: The Central Corridor in 1994, the Southwest Corridor in 2000, the Central PlatteValley spur in 2002, and the Southeast Corridor in 2006. In November 2004 voterspassed the “FasTracks” ballot measure to further expand the transit system. (See MapD1, next page, for an overview of the existing and proposed regional transit rail network.)The 0.04 percent sales tax revenues will fund the construction of five new transit lines in15 years, representing a $4.7 billion regional infrastructure investment. The 119 miles ofnew tracks and the 57 new transit stations will provide an unparalleled level of transitaccess for a region of this size and, as such, could fundamentally reshape growth patternsin the region.
The West Corridor is part of the FasTracks transportation plan and anticipated to open in2013. The light rail line runs west on former interurban rights of way and along theHighway 6 corridor connecting downtown Denver to the City of Lakewood in JeffersonCounty and terminating at the Jefferson County Government Center in the City ofGolden. An estimated 31,100 people per day will use the 12.1 mile line. The 11 newstations that make up the West Corridor serve a number of important regionaldestinations: including the Auraria Higher Education Center (University of Colorado atDenver, Metropolitan State College, and Denver Community College), the Red RocksCommunity College, the Denver Federal Center and the Jefferson County GovernmentCenter. The corridor runs through numerous compact and suburban neighborhoods andserves many employment destinations.
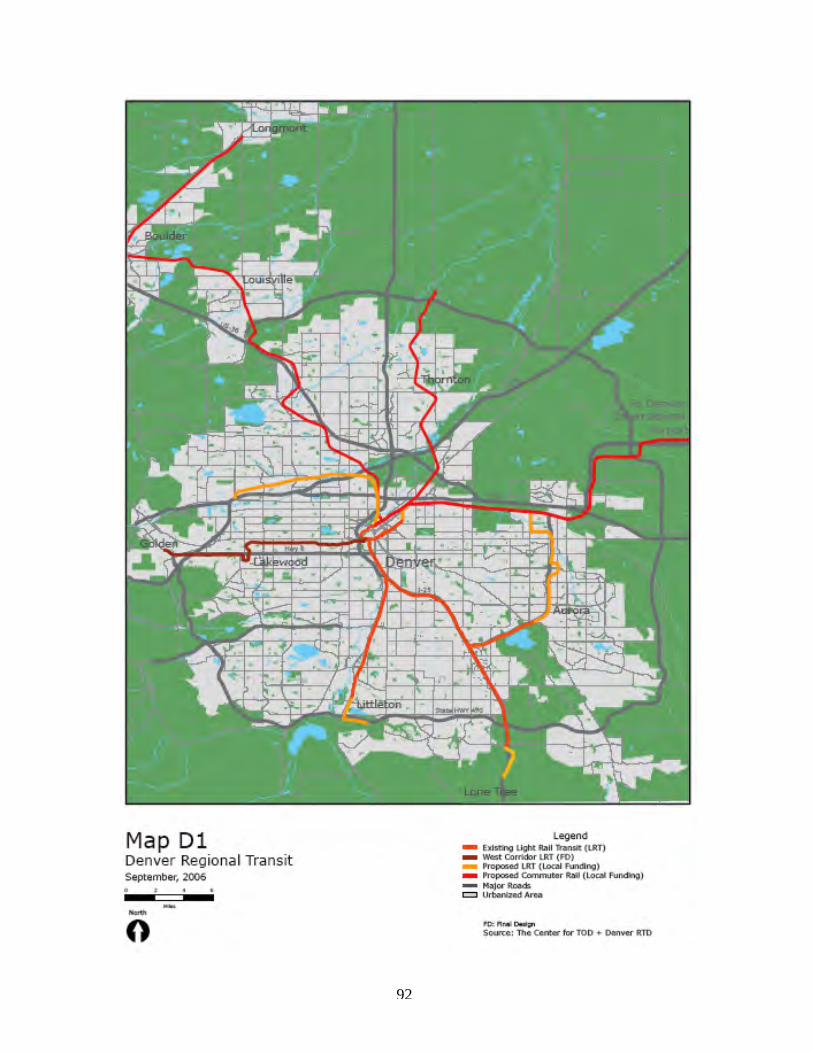
92
93
III. Warm Regional Housing Market with Growth in Urban AreasThe Denver region has a “warm” housing market, reflecting the growth in populationoccurring throughout the region, which is also driving up housing prices. The averageprice of a housing unit in Denver is $239,500, significantly above the national average of$167,000. The housing market has been trying to meet the growing demand, and single-family housing starts have proceeded at a record pace.85
In 2005, 30.7 percent of owner-occupied households spent over 30 percent of theirincome on housing, up 4.4 percent from 2000. For renter-occupied households, theincrease was much more pronounced, with 47.7 percent of rental households spending atleast 30 percent of income on housing in 2005, compared with 38.6 percent in 200086.The increase in both housing and transportation costs is placing a significant burden onlow- and middle-income households in the Denver region.
While there are roughly 45,000 households in the region today who live within one half-mile of an existing light rail stop, a conservative estimate is that by 2030, the potentialdemand for housing near transit could be close to 155,000 households.87 At least 40percent of those desiring to live near transit will come from households with incomesbelow $41,864 (80 percent of area median household income) in 2004. Singles andcouples without children making annual incomes between $60,000 and $125,000 willcomprise a significant part of the projected demand.
The development community is responding. Completed in 2002, Englewood City Centeris considered the region's first real TOD project. It transformed a dying indoor shoppingcenter into a thriving mix of civic buildings, homes, offices, and stores, all served bylight-rail trains. It has come to be seen as a model for a public-private partnership in theregion, and its success has spurred more demand for TOD locally.88 Since the completionof Englewood City The newly opened Southeast Corridor has 18 TOD projects alreadybuilt or under construction, with a total value of nearly $750 million.89
85 Harvard Joint Center for Housing Study, State of the Nation’s Housing 2005.86 US Census, 2005 American Community Survey, Selected Housing Characteristics.87 Center for Transit-Oriented Development, 2006. CTOD’s demand analysis was calculated by combiningdemographic information on households that have shown a preference for living in Denver’s transit-oriented communities with regional population projections and research on national real estate andconsumer trends. For more information on this methodology, see: CTOD, Hidden in Plain Sight: Capturingthe Demand for Housing Near Transit, April 2005.88 Margaret Jackson, “Development worth bragging about?” Denver Post: October 17, 2006.89 Information shared by the Regional Transportation District staff.
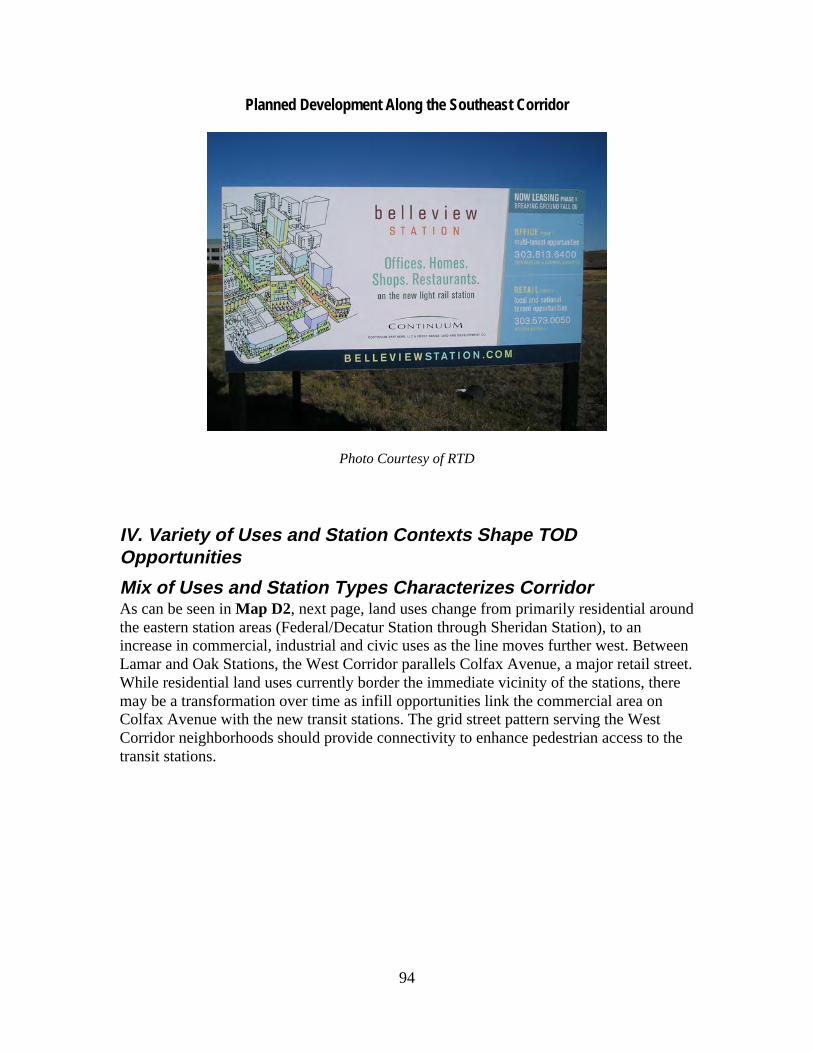
94
Planned Development Along the Southeast Corridor
Photo Courtesy of RTD
IV. Variety of Uses and Station Contexts Shape TODOpportunitiesMix of Uses and Station Types Characterizes CorridorAs can be seen in Map D2, next page, land uses change from primarily residential aroundthe eastern station areas (Federal/Decatur Station through Sheridan Station), to anincrease in commercial, industrial and civic uses as the line moves further west. BetweenLamar and Oak Stations, the West Corridor parallels Colfax Avenue, a major retail street.While residential land uses currently border the immediate vicinity of the stations, theremay be a transformation over time as infill opportunities link the commercial area onColfax Avenue with the new transit stations. The grid street pattern serving the WestCorridor neighborhoods should provide connectivity to enhance pedestrian access to thetransit stations.
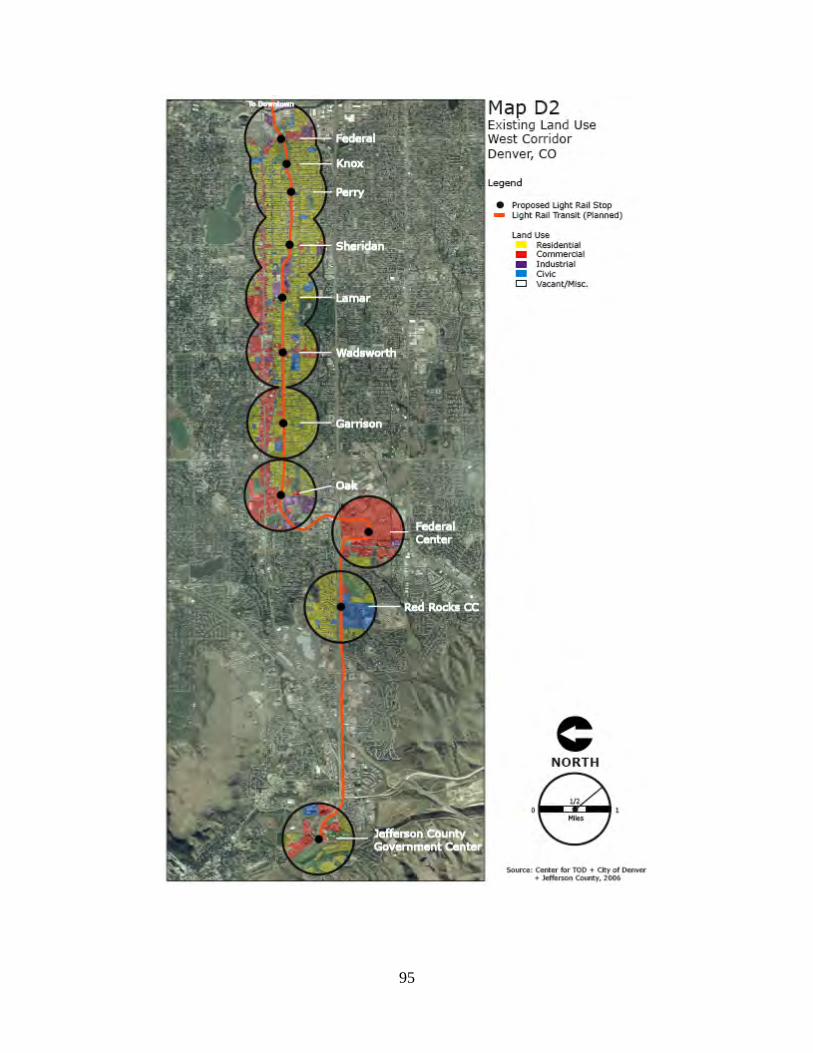
95
96
The Federal Center is a major destination and there are plans to develop the mostlyvacant property around this station. The next station, Red Rocks, serves both residentialneighborhoods and the Red Rocks Community College campus. A park-and-ride lot isplanned for this station. The western terminal station is located near the Jefferson CountyGovernment Center on the edge of the Golden city limits. As shown on Map D2, thisstation area has a much more typical suburban land use and street pattern. Recently,increased residential development has taken place in this station area, and some of thecorridor’s larger open parcels are located here.
Table D1 summarizes the land uses and density within the corridor. Fairly low residentialand commercial densities exist, the second lowest among the case study corridors. Thecorridor does include a mix of uses, as discussed above with plans underway to rezone atmost of the stations along the corridor. While most of the station areas are built-out, thereare pockets of vacant and underutilized properties.
TABLE D1: Land Uses & Density, Denver West Corridor, 2005
LAND USES Housing Commercial Industrial Mixed Use Civic
57% 28% 7% n/a 6%
DENSITY/INTENSITY
9.63 0.59 0.32
Source: Center for TOD, Strategic Economics, City and County of Denver, Jefferson County, 2006^ Only Jefferson County Available
Within 1/2 mile radius of stops
Housing (DUA)*
Commercial (FAR)^
Industrial (FAR)^
The City of Lakewood is currently undergoing a re-zoning effort around its proposedstations. Currently these areas have some big-box retail which is not designed to betransit-supportive. The industrial portions of the Lamar and Wadsworth station areas willlikely be re-zoned to higher intensity employment and residential uses. The Oak andFederal Center station areas will also have more intense employment uses, includingoffice and industrial research and development. The Garrison and Red Rock station areashave well established single-family residential and civic uses, and it is unlikely that theseareas will change significantly with the implementation of the West Corridor. Newzoning for these two stations will reinforce existing uses.
Table D2, on the next page, summarizes the above-discussed existing land use patterns,as well as demographics and new development projects and planning efforts around the11 stations. New development projects are emerging but response is still slow given thatthe line won’t open for another six years, and a series of new lines have openedelsewhere in the region. Of the 18 projects identified, most are located within Denver,and all of the proposed housing projects are market-rate.
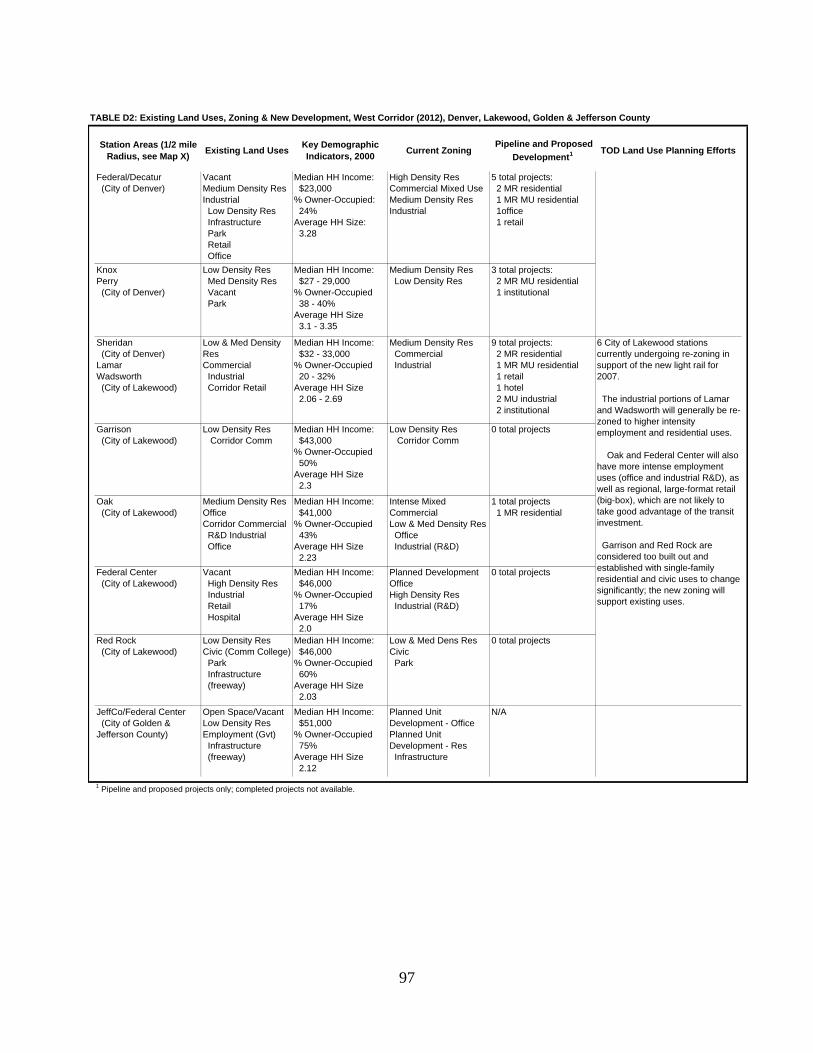
97
TABLE D2: Existing Land Uses, Zoning & New Development, West Corridor (2012), Denver, Lakewood, Golden & Jefferson County
Station Areas (1/2 mile Radius, see Map X)
Existing Land UsesKey Demographic Indicators, 2000
Current Zoning Pipeline and Proposed
Development1 TOD Land Use Planning Efforts
Federal/Decatur (City of Denver)
VacantMedium Density ResIndustrial Low Density Res Infrastructure Park Retail Office
Median HH Income: $23,000% Owner-Occupied: 24% Average HH Size: 3.28
High Density ResCommercial Mixed UseMedium Density ResIndustrial
5 total projects: 2 MR residential 1 MR MU residential 1office 1 retail
KnoxPerry (City of Denver)
Low Density Res Med Density Res Vacant Park
Median HH Income: $27 - 29,000 % Owner-Occupied 38 - 40% Average HH Size 3.1 - 3.35
Medium Density Res Low Density Res
3 total projects: 2 MR MU residential 1 institutional
Sheridan (City of Denver)LamarWadsworth (City of Lakewood)
Low & Med Density ResCommercial Industrial Corridor Retail
Median HH Income: $32 - 33,000% Owner-Occupied 20 - 32% Average HH Size 2.06 - 2.69
Medium Density Res Commercial Industrial
9 total projects: 2 MR residential 1 MR MU residential 1 retail 1 hotel 2 MU industrial 2 institutional
Garrison (City of Lakewood)
Low Density Res Corridor Comm
Median HH Income: $43,000% Owner-Occupied 50% Average HH Size 2.3
Low Density Res Corridor Comm
0 total projects
Oak (City of Lakewood)
Medium Density ResOfficeCorridor Commercial R&D Industrial Office
Median HH Income: $41,000% Owner-Occupied 43% Average HH Size 2.23
Intense Mixed CommercialLow & Med Density Res Office Industrial (R&D)
1 total projects 1 MR residential
Federal Center (City of Lakewood)
Vacant High Density Res Industrial Retail Hospital
Median HH Income: $46,000% Owner-Occupied 17% Average HH Size 2.0
Planned DevelopmentOfficeHigh Density Res Industrial (R&D)
0 total projects
Red Rock (City of Lakewood)
Low Density ResCivic (Comm College) Park Infrastructure (freeway)
Median HH Income: $46,000% Owner-Occupied 60% Average HH Size 2.03
Low & Med Dens ResCivic Park
0 total projects
JeffCo/Federal Center (City of Golden & Jefferson County)
Open Space/VacantLow Density ResEmployment (Gvt) Infrastructure (freeway)
Median HH Income: $51,000% Owner-Occupied 75% Average HH Size 2.12
Planned Unit Development - OfficePlanned Unit Development - Res Infrastructure
N/A
1 Pipeline and proposed projects only; completed projects not available.
6 City of Lakewood stations currently undergoing re-zoning in support of the new light rail for 2007. The industrial portions of Lamar and Wadsworth will generally be re-zoned to higher intensity employment and residential uses. Oak and Federal Center will also have more intense employment uses (office and industrial R&D), as well as regional, large-format retail (big-box), which are not likely to take good advantage of the transit investment. Garrison and Red Rock are considered too built out and established with single-family residential and civic uses to change significantly; the new zoning will support existing uses.
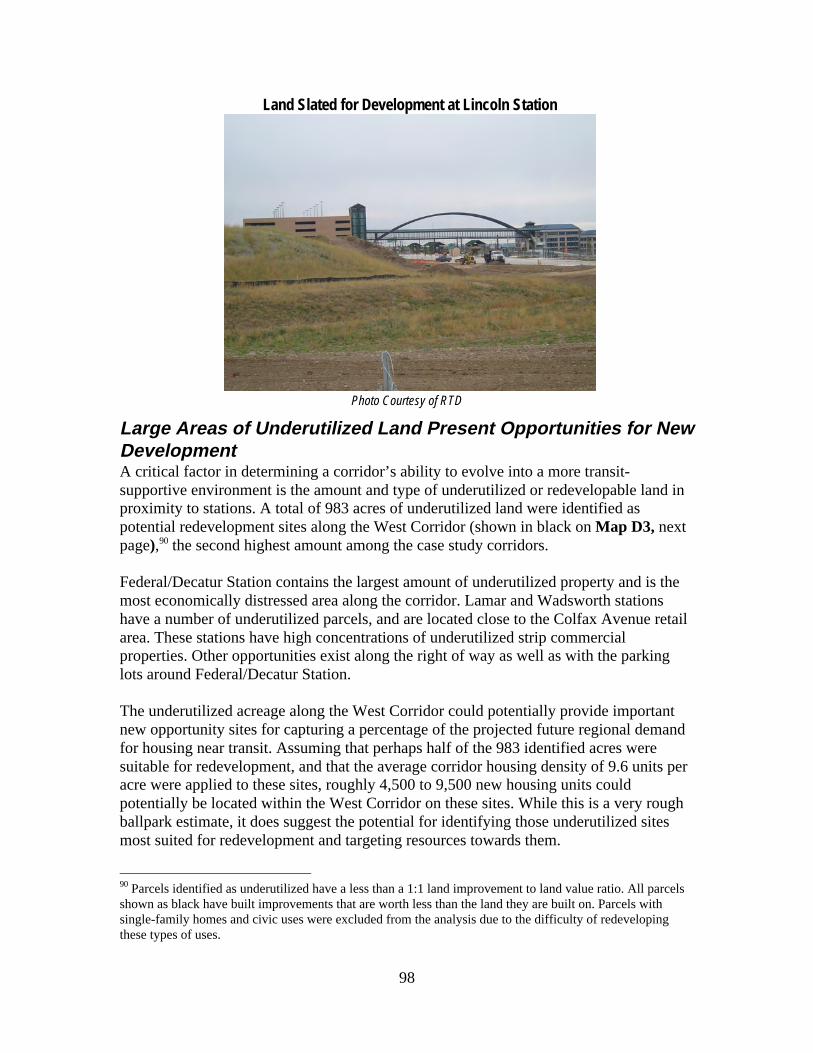
98
Land Slated for Development at Lincoln Station
Photo Courtesy of RTD
Large Areas of Underutilized Land Present Opportunities for NewDevelopmentA critical factor in determining a corridor’s ability to evolve into a more transit-supportive environment is the amount and type of underutilized or redevelopable land inproximity to stations. A total of 983 acres of underutilized land were identified aspotential redevelopment sites along the West Corridor (shown in black on Map D3, nextpage),90 the second highest amount among the case study corridors.
Federal/Decatur Station contains the largest amount of underutilized property and is themost economically distressed area along the corridor. Lamar and Wadsworth stationshave a number of underutilized parcels, and are located close to the Colfax Avenue retailarea. These stations have high concentrations of underutilized strip commercialproperties. Other opportunities exist along the right of way as well as with the parkinglots around Federal/Decatur Station.
The underutilized acreage along the West Corridor could potentially provide importantnew opportunity sites for capturing a percentage of the projected future regional demandfor housing near transit. Assuming that perhaps half of the 983 identified acres weresuitable for redevelopment, and that the average corridor housing density of 9.6 units peracre were applied to these sites, roughly 4,500 to 9,500 new housing units couldpotentially be located within the West Corridor on these sites. While this is a very roughballpark estimate, it does suggest the potential for identifying those underutilized sitesmost suited for redevelopment and targeting resources towards them.
90 Parcels identified as underutilized have a less than a 1:1 land improvement to land value ratio. All parcelsshown as black have built improvements that are worth less than the land they are built on. Parcels withsingle-family homes and civic uses were excluded from the analysis due to the difficulty of redevelopingthese types of uses.
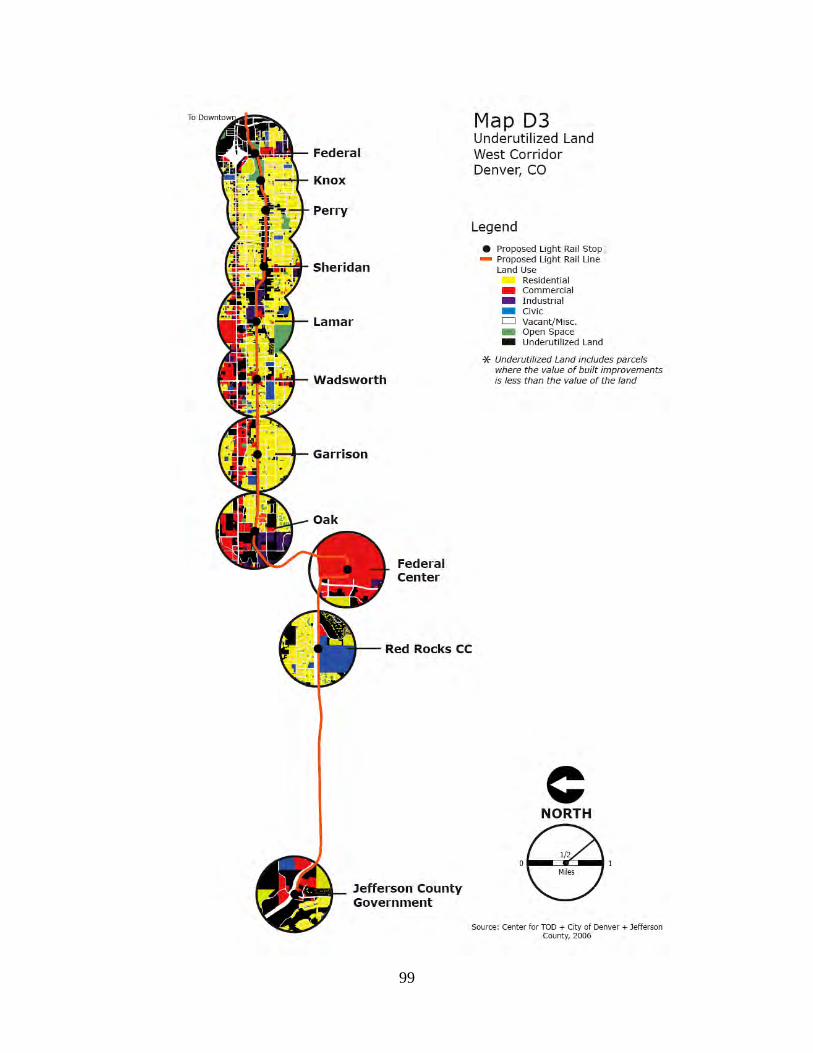
99
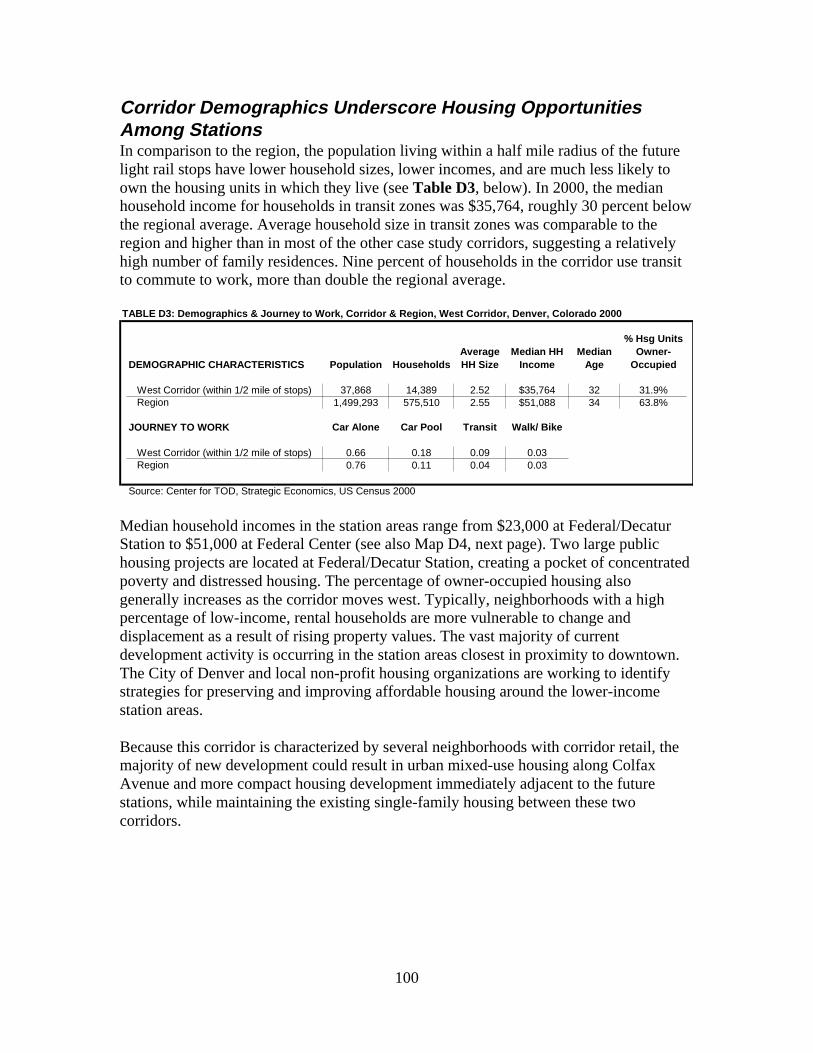
100
Corridor Demographics Underscore Housing OpportunitiesAmong StationsIn comparison to the region, the population living within a half mile radius of the futurelight rail stops have lower household sizes, lower incomes, and are much less likely toown the housing units in which they live (see Table D3, below). In 2000, the medianhousehold income for households in transit zones was $35,764, roughly 30 percent belowthe regional average. Average household size in transit zones was comparable to theregion and higher than in most of the other case study corridors, suggesting a relativelyhigh number of family residences. Nine percent of households in the corridor use transitto commute to work, more than double the regional average.
TABLE D3: Demographics & Journey to Work, Corridor & Region, West Corridor, Denver, Colorado 2000
DEMOGRAPHIC CHARACTERISTICS Population Households
West Corridor (within 1/2 mile of stops) 37,868 14,389 2.52 $35,764 32 31.9%Region 1,499,293 575,510 2.55 $51,088 34 63.8%
JOURNEY TO WORK Car Alone Car Pool Transit Walk/ Bike
West Corridor (within 1/2 mile of stops) 0.66 0.18 0.09 0.03Region 0.76 0.11 0.04 0.03
Source: Center for TOD, Strategic Economics, US Census 2000
% Hsg Units Owner-
OccupiedAverage HH Size
Median HH Income
Median Age
Median household incomes in the station areas range from $23,000 at Federal/DecaturStation to $51,000 at Federal Center (see also Map D4, next page). Two large publichousing projects are located at Federal/Decatur Station, creating a pocket of concentratedpoverty and distressed housing. The percentage of owner-occupied housing alsogenerally increases as the corridor moves west. Typically, neighborhoods with a highpercentage of low-income, rental households are more vulnerable to change anddisplacement as a result of rising property values. The vast majority of currentdevelopment activity is occurring in the station areas closest in proximity to downtown.The City of Denver and local non-profit housing organizations are working to identifystrategies for preserving and improving affordable housing around the lower-incomestation areas.
Because this corridor is characterized by several neighborhoods with corridor retail, themajority of new development could result in urban mixed-use housing along ColfaxAvenue and more compact housing development immediately adjacent to the futurestations, while maintaining the existing single-family housing between these twocorridors.
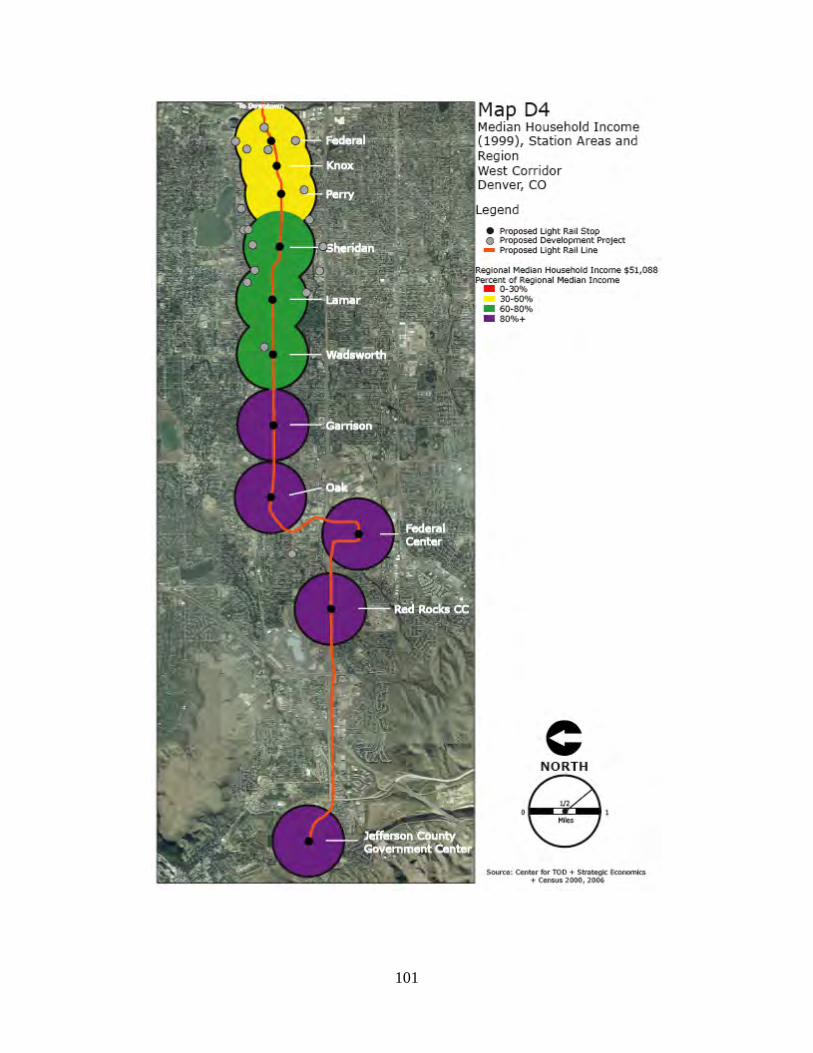
101
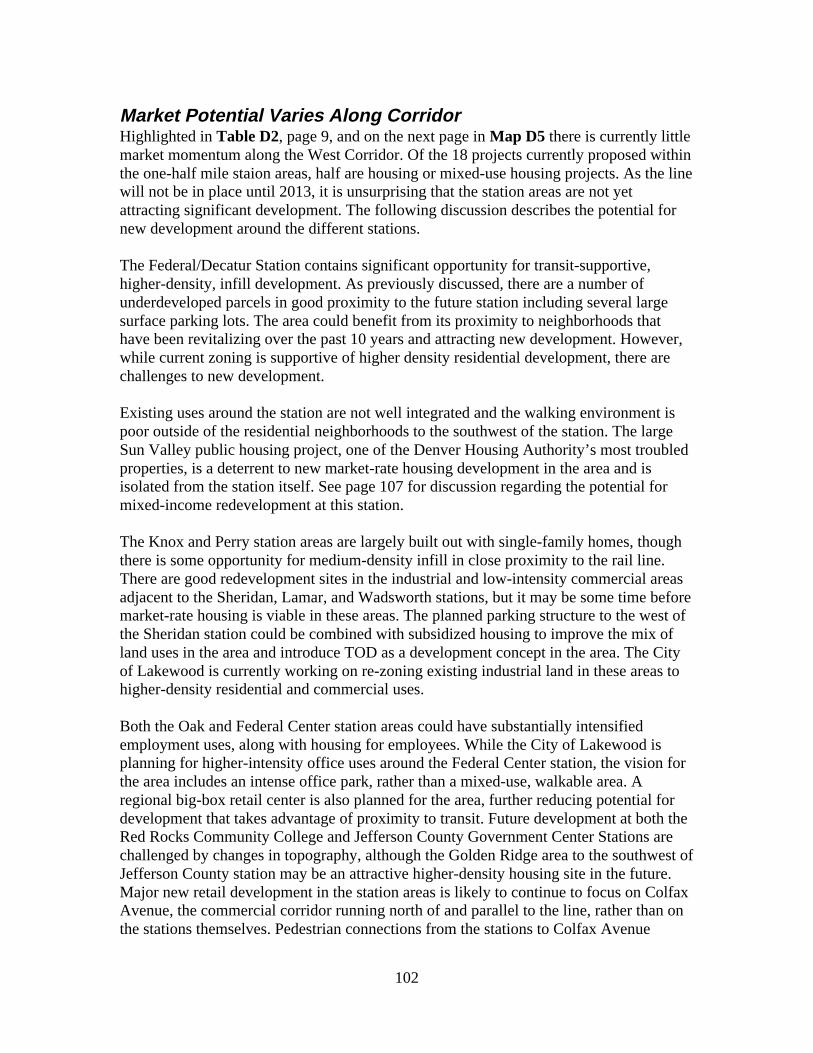
102
Market Potential Varies Along CorridorHighlighted in Table D2, page 9, and on the next page in Map D5 there is currently littlemarket momentum along the West Corridor. Of the 18 projects currently proposed withinthe one-half mile staion areas, half are housing or mixed-use housing projects. As the linewill not be in place until 2013, it is unsurprising that the station areas are not yetattracting significant development. The following discussion describes the potential fornew development around the different stations.
The Federal/Decatur Station contains significant opportunity for transit-supportive,higher-density, infill development. As previously discussed, there are a number ofunderdeveloped parcels in good proximity to the future station including several largesurface parking lots. The area could benefit from its proximity to neighborhoods thathave been revitalizing over the past 10 years and attracting new development. However,while current zoning is supportive of higher density residential development, there arechallenges to new development.
Existing uses around the station are not well integrated and the walking environment ispoor outside of the residential neighborhoods to the southwest of the station. The largeSun Valley public housing project, one of the Denver Housing Authority’s most troubledproperties, is a deterrent to new market-rate housing development in the area and isisolated from the station itself. See page 107 for discussion regarding the potential formixed-income redevelopment at this station.
The Knox and Perry station areas are largely built out with single-family homes, thoughthere is some opportunity for medium-density infill in close proximity to the rail line.There are good redevelopment sites in the industrial and low-intensity commercial areasadjacent to the Sheridan, Lamar, and Wadsworth stations, but it may be some time beforemarket-rate housing is viable in these areas. The planned parking structure to the west ofthe Sheridan station could be combined with subsidized housing to improve the mix ofland uses in the area and introduce TOD as a development concept in the area. The Cityof Lakewood is currently working on re-zoning existing industrial land in these areas tohigher-density residential and commercial uses.
Both the Oak and Federal Center station areas could have substantially intensifiedemployment uses, along with housing for employees. While the City of Lakewood isplanning for higher-intensity office uses around the Federal Center station, the vision forthe area includes an intense office park, rather than a mixed-use, walkable area. Aregional big-box retail center is also planned for the area, further reducing potential fordevelopment that takes advantage of proximity to transit. Future development at both theRed Rocks Community College and Jefferson County Government Center Stations arechallenged by changes in topography, although the Golden Ridge area to the southwest ofJefferson County station may be an attractive higher-density housing site in the future.Major new retail development in the station areas is likely to continue to focus on ColfaxAvenue, the commercial corridor running north of and parallel to the line, rather than onthe stations themselves. Pedestrian connections from the stations to Colfax Avenue
103
should be improved all along the corridor, particularly at Oak Station, where there areplans for the intensification of the existing retail concentration at Oak and Colfax.
104
V. Comprehensive Affordable Housing Corridor Strategy wouldAid in Creating Mixed-Income CommunitiesWhile the corridor includes a number of very low-income households, none of the currentplanned or recently constructed projects include affordable housing. Given the desire tobreak up concentrated poverty in areas like Federal/Decatur Station, strategies to improveintroduce market rate housing should be pursued. As the value of transit is reflected in thereal estate market within the corridor, there will be pressure for single-family rentalhomes in the area to revert to ownership, with the potential to displace much of theexisting low-income rental community.
Pursuing mixed-income TOD in areas where transit runs through existing low-incomeneighborhoods can offer permanently affordable housing units to counterbalance thelikelihood that some renters in existing homes are displaced. The Denver office ofEnterprise Community Partners, Inc. and Housing Denver recently commissioned a studyto evaluate the need for mixed-income TOD, and suggest a set of strategies for meetingthis goal.91
Relocation, reconstruction, and/or substantial improvement to the public housing projectsat Federal/Decatur Station is warranted both in terms of improving the quality of life forthose low-income households living within these developments, and to improve the largerredevelopment potential of this station area. While the City and region are developingnew tools to promote TOD, ensuring that low-income households are not left out of theopportunity to live near transit is important. Denver’s low-income households arestrained by rising housing prices and bear a higher burden in transportation costs as apercentage of their household income than other households. Low-income householdscan manage housing or transportation costs, but not both. Together these two costsaccount for between 67-115 percent of household income for low-income families, versusonly 23-31 percent for high-income households.92
Because of the different opportunities and contexts in the corridor, creating mixed-income communities may require different strategies in different parts of the corridor. Inthe Federal/Decatur station, a comprehensive strategy is needed to revitalize the twodistressed public housing projects in order to catalyze market-rate housing. In otherstation areas, such as Knox, Perry and Sheridan, there is a need to secure affordability inneighborhoods dominated by single-family rental housing. And, in still other locations,where there is an opportunity to transition to TOD, but the local jurisdictions do not haveaffordable housing programs, there is a need to devise site-specific mixed-incomehousing strategies.
91 Center for Transit-Oriented Development, The Case for Mixed-Income TOD in the Denver Region.CTOD: October 2006.92 Ibid.
105
VI. Local Policy Tools: Tools for Deep, Long-Term AffordabilityAre LackingIn preparation for the future construction of the West Corridor light rail, a number ofplanning and rezoning efforts are underway. A planning effort focused on the re-use ofSaint Anthony’s Hospital, just north of Colfax Avenue and in the Perry station area, isexamining the concentration of commercial activity on Colfax Avenue and theintroduction of higher intensity housing along Colfax between commercial nodes. Thiseffort is explicitly addressing pedestrian linkages from the north to the future stations.RTD has also sponsored a West Corridor Value Engineering/TOD Planning Charrettethat considered the location and design of station facilities from the perspective of howthese improvements could catalyze or inhibit new development in the station areas.
Table D4, next page, summarizes some specific policies available in the Denver regionto promote TOD, affordable housing or mixed-income development within the WestCorridor.93 The Denver region, in conjunction with building an expanding transitnetwork, is also developing a number of new tools to provide incentives for building newhousing along transit. DRCOG and RTD also provide support to local governments doingstation area planning through the Transportation Improvement Program and by providingtechnical assistance documents.
Denver is one of a few cities in Colorado with an inclusionary zoning ordinance, thoughit is limited in its overall effectiveness. The City’s inclusionary policy only pertains tonew homeownership units and serves households at 80-95 percent of Area MedianIncome (AMI), which limits the depth of affordability that can be created through thismechanism. Units are required to remain affordable for 15 years, after which they can beresold at market-rate prices, making long-term affordability a challenge.
The new Metro Mayors’ Caucus TOD Fund has created substantial new bonding capacityfor affordable housing at TOD sites. Partnering with the Colorado Housing and FinanceAuthority, the fund includes $53 million in tax-exempt Private Activity Bond authority tofinance the new construction, acquisition and rehabilitation of multifamily housingprojects near transit. This fund does not require income targeting below 50 percent AMIso the housing needs of the very lowest-income households wanting to live near transitmay not be met.
93 A variety of general tools, including overall State funding for affordable housing/subsidized housing arealso being used in the Twin Cities region. These tools are discussed in Appendix A of the report. Table D4highlights those specific to promoting TOD or have a linkage between affordable housing and proximity totransit, or creating mixed income communities.
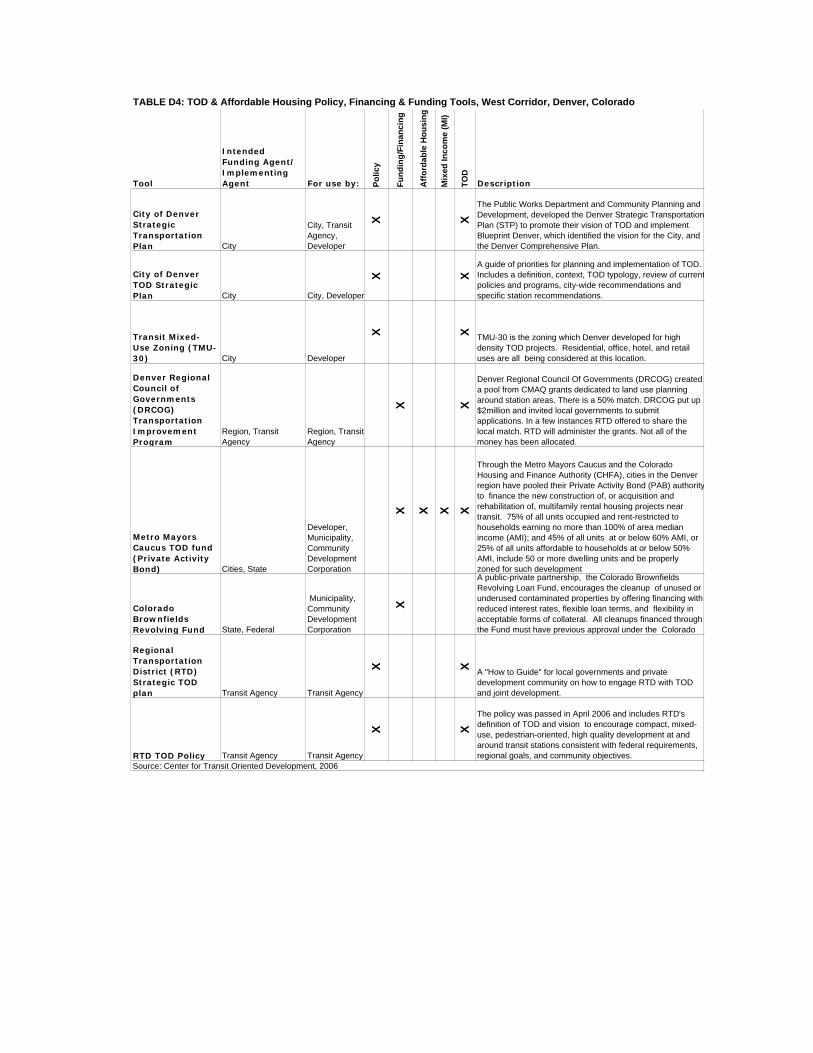
106
Tool
Intended Funding Agent/ Implementing Agent For use by: P
olic
y
Fu
nd
ing
/Fin
anci
ng
Aff
ord
able
Ho
usi
ng
Mix
ed In
com
e (M
I)
TO
D
Description
City of Denver Strategic Transportation Plan City
City, Transit Agency, Developer
X X
The Public Works Department and Community Planning and Development, developed the Denver Strategic Transportation Plan (STP) to promote their vision of TOD and implement Blueprint Denver, which identified the vision for the City, and the Denver Comprehensive Plan.
City of Denver TOD Strategic Plan City City, Developer
X X
A guide of priorities for planning and implementation of TOD. Includes a definition, context, TOD typology, review of current policies and programs, city-wide recommendations and specific station recommendations.
Transit Mixed-Use Zoning (TMU-30) City Developer
X X TMU-30 is the zoning which Denver developed for high density TOD projects. Residential, office, hotel, and retail uses are all being considered at this location.
Denver Regional Council of Governments (DRCOG) Transportation Improvement Program
Region, Transit Agency
Region, Transit Agency
X X
Denver Regional Council Of Governments (DRCOG) created a pool from CMAQ grants dedicated to land use planning around station areas. There is a 50% match. DRCOG put up $2million and invited local governments to submit applications. In a few instances RTD offered to share the local match. RTD will administer the grants. Not all of the money has been allocated.
Metro Mayors Caucus TOD fund (Private Activity Bond) Cities, State
Developer, Municipality, Community Development Corporation
X X X XThrough the Metro Mayors Caucus and the Colorado Housing and Finance Authority (CHFA), cities in the Denver region have pooled their Private Activity Bond (PAB) authority to finance the new construction of, or acquisition and rehabilitation of, multifamily rental housing projects near transit. 75% of all units occupied and rent-restricted to households earning no more than 100% of area median income (AMI); and 45% of all units at or below 60% AMI, or 25% of all units affordable to households at or below 50% AMI, include 50 or more dwelling units and be properly zoned for such development
Colorado Brownfields Revolving Fund State, Federal
Municipality, Community Development Corporation
X
A public-private partnership, the Colorado Brownfields Revolving Loan Fund, encourages the cleanup of unused or underused contaminated properties by offering financing with reduced interest rates, flexible loan terms, and flexibility in acceptable forms of collateral. All cleanups financed through the Fund must have previous approval under the Colorado
Regional Transportation District (RTD) Strategic TOD plan Transit Agency Transit Agency
X X A "How to Guide" for local governments and private development community on how to engage RTD with TOD and joint development.
RTD TOD Policy Transit Agency Transit Agency
X X
The policy was passed in April 2006 and includes RTD's definition of TOD and vision to encourage compact, mixed-use, pedestrian-oriented, high quality development at and around transit stations consistent with federal requirements, regional goals, and community objectives.
TABLE D4: TOD & Affordable Housing Policy, Financing & Funding Tools, West Corridor, Denver, Colorado
Source: Center for Transit Oriented Development, 2006
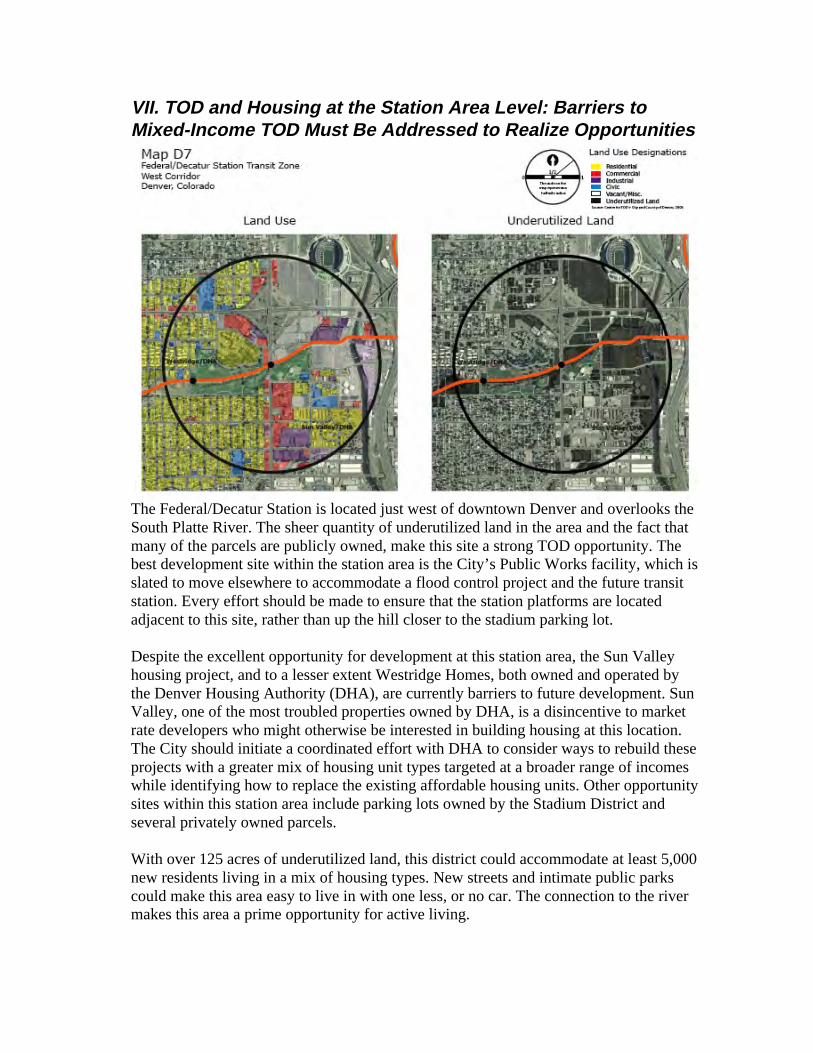
107
VII. TOD and Housing at the Station Area Level: Barriers toMixed-Income TOD Must Be Addressed to Realize Opportunities
The Federal/Decatur Station is located just west of downtown Denver and overlooks theSouth Platte River. The sheer quantity of underutilized land in the area and the fact thatmany of the parcels are publicly owned, make this site a strong TOD opportunity. Thebest development site within the station area is the City’s Public Works facility, which isslated to move elsewhere to accommodate a flood control project and the future transitstation. Every effort should be made to ensure that the station platforms are locatedadjacent to this site, rather than up the hill closer to the stadium parking lot.
Despite the excellent opportunity for development at this station area, the Sun Valleyhousing project, and to a lesser extent Westridge Homes, both owned and operated bythe Denver Housing Authority (DHA), are currently barriers to future development. SunValley, one of the most troubled properties owned by DHA, is a disincentive to marketrate developers who might otherwise be interested in building housing at this location.The City should initiate a coordinated effort with DHA to consider ways to rebuild theseprojects with a greater mix of housing unit types targeted at a broader range of incomeswhile identifying how to replace the existing affordable housing units. Other opportunitysites within this station area include parking lots owned by the Stadium District andseveral privately owned parcels.
With over 125 acres of underutilized land, this district could accommodate at least 5,000new residents living in a mix of housing types. New streets and intimate public parkscould make this area easy to live in with one less, or no car. The connection to the rivermakes this area a prime opportunity for active living.
108
VIII. Opportunities, Obstacles & Lessons: Transit Framework Ahead ofAffordable Housing StrategyAs the Denver region moves forward with implementing its FasTracks regional transitplan, the opportunity to significantly impact development throughout the new transitcorridors is profound. Denver is to be commended for its proactive efforts to develop aTOD Strategic Plan to help station area planning, rezoning and development.Simultaneous to the transit investment, the regional actors are beginning to explore howto provide assistance and incentives to help ensure that a portion of future developmentreinforces the transit investment and provides mixed-income housing.
Major Opportunities for Mixed-Income Housing near Transit
• Regional Transit Investment Plan Provides Development FrameworkMost regions in this country investing in transit are doing so with a piecemealapproach, focusing resources on individual corridors without a broader frameworkfor overall improvements to accessibility and mobility. As builds five additional newlines over the next 15 years, it is in a unique position of creating a well-connected,integrated transportation system that will provide a framework for future landdevelopment. Indeed, the 119 miles of new tracks and the 57 new transit stations willprovide an unparalleled level of transit access for a region of this size, and, as such,could fundamentally reshape growth patterns in the region.
• The West Corridor Contains A Mix Of Redevelopment OpportunitiesAs the corridor connects a variety of uses—downtown, residential, commercial,educational, and employment—it has the potential for variation throughout thealignment, with different stations serving different purposes to reflect their uniqueassets. Federal/Decatur Station can provide an excellent redevelopment opportunitythat can set the tone for future development along the line, and also be leveraged tocreate mixed-income TOD. Oak Street and Federal Center already are employmentcenters that can have a greater intensity of job activity with good transit connections.RTD, the cities of Denver and Lakewood, and Jefferson County are beginning towork together to prepare a corridor-wide strategy to help guide development at futurestations and inform station areas that may need targeted support to promote mixed-income housing near transit.
• Regional Tools Being Developed To Promote TODThe Denver region has endorsed TOD in a variety of important long range planningdocuments, from the City of Denver’s TOD Strategic Plan to the RTD’s TOD Policyand funding support by DRCOG. Building on the success of existing transit lines andthe new development that has been focused around them, the City’s residents andelected officials are stepping forward to provide policy guidance, funding, andtechnical assistance to build a more sustainable future for the region.
109
Obstacles
• TOD Market Not Yet Established in the West CorridorQuite simply, given that the line is still only in the planning stages and won’t openfor another six years, the market has yet to respond. Given the overall high landprices in the Denver region and the strong interest by developers in TOD, thisobstacle may actually prove beneficial for those wanting to provide affordable andmixed-income housing along the West Corridor. Land speculation has already begun,but there is still an opportunity to acquire sites for future mixed-incomedevelopments, and to develop tools to help current low-income renters become homeowners.
• TOD Involves Expensive InfrastructureGiven high land prices at TOD sites, significant residential density is not onlydesirable but financially necessary for projects to pencil out. This translates intosignificant infrastructure costs. For example, upgrading the capacity of sewer linesfor high density developments can be expensive, particularly for older communitieslike the City of Lakewood, which may lack overall system capacity. Generally,affordable housing developers are not capable of taking on these infrastructure costson their own and so require some form of subsidies.
• Transit Improvements Can Cause Displacement of Existing Low-IncomeResidentsThe West Corridor includes a high percentage of low-income households,particularly within the eastern Transit Zones. Assuring long-term housingaffordability and access to affordable transportation is important. This must bebalanced with the need and desire to reduce concentrated poverty in certainneighborhoods and to provide more vibrant, safe, mixed-income communities.Without targeted strategies and coordinated policies, there is substantial likelihoodthat current low-income households may be displaced as the corridor redevelops,particularly given its proximity to downtown and multiple important regionaldestinations.
Lessons from the Corridor for Other Places
• Transit and TOD Play an Important Role in Addressing RegionalCongestion and DevelopmentThe success of the FasTracks ballot measure sends a stunning signal to other regionsfor the need and opportunity to generate wide regional support for transit investment.The scale of this initiative is resulting in both a rapid expansion of local transitplanning, design and construction expertise but also has attracted the attention ofnational development firms. The Denver region’s investment in a coordinatedhighway and transit strategy to address congestion and environmental qualitypositions it well to remain an economically competitive region.
110
• Don’t Underestimate Potential Impact of Land SpeculationIn the Denver region, developers already pay a premium on land at many plannedand existing TOD sites. This presents a formidable obstacle to providing housingproducts at affordable prices. Land prices are being driven up by speculativepressures. Acquiring and holding land, also known as land banking, requiresconsiderable capital outlays, especially when it may be 10 or more years before a railstation is built. This presents steep holding costs for developers and puts land out ofthe reach of affordable housing developers by the time the transit service is in place.Furthermore, many traditional funding sources—including CDBG, HOME and thenew Metro Mayors Caucus TOD fund—cannot be used to purchase land. For regionslike Denver that have adopted extensive transit expansion plans, strategies should bepursued in tandem to provide tools for public or private organizations to acquire andhold land within transit zones.
• Strategies Needed to Transition Distressed Public Housing ProjectsMany transit corridors contain concentrations of poverty, often in public housingprojects. These concentrations can discourage market investment, and cause thebenefits of transit-oriented development to pass by these communities. Due to thelack of an effective affordable housing strategy and cohesive approach to distressedpublic housing projects in the Denver region, it has been difficult to catalyzerevitalization in some low-income station areas. To alleviate this, the City andCounty of Denver should lead a Station Area Planning effort for the area surroundingthe Federal/Decatur Station, including both Sun Valley and Westridge Homes. Theaim of this effort should be to define a compelling vision for the future of this transitdistrict, bring together the various public and private stakeholders, including DenverHousing Association (DHA), Public Works, Economic Development, Denver UrbanRedevelopment Authority, Parks and Recreation, RTD and the HUD regional office.Preservation of existing affordable housing is needed, but could be done to provideimproved housing conditions for low-income households and help to reduceconcentrated poverty.
As part of the Station Area Plan, DHA should be tasked with developing a publichousing transition strategy that allows redevelopment of Sun Valley in the near termand a longer term effort to place public housing residents in mixed-income housing.Every effort should be made to maintain the overall supply of public housing units.DHA should explore the value/feasibility of purchasing additional property in thesurrounding area as temporary housing. Were HOPE VI funding available for thisarea, it would be a terrific candidate. Technical assistance from HUD should besought to share information on how other communities have transitioned from theHOPE VI program to other strategies to achieve similar goals.
The next chapter discusses mixed-income TOD efforts in the Twin Cities metropolitanregion along the newly opened Hiawatha Corridor.
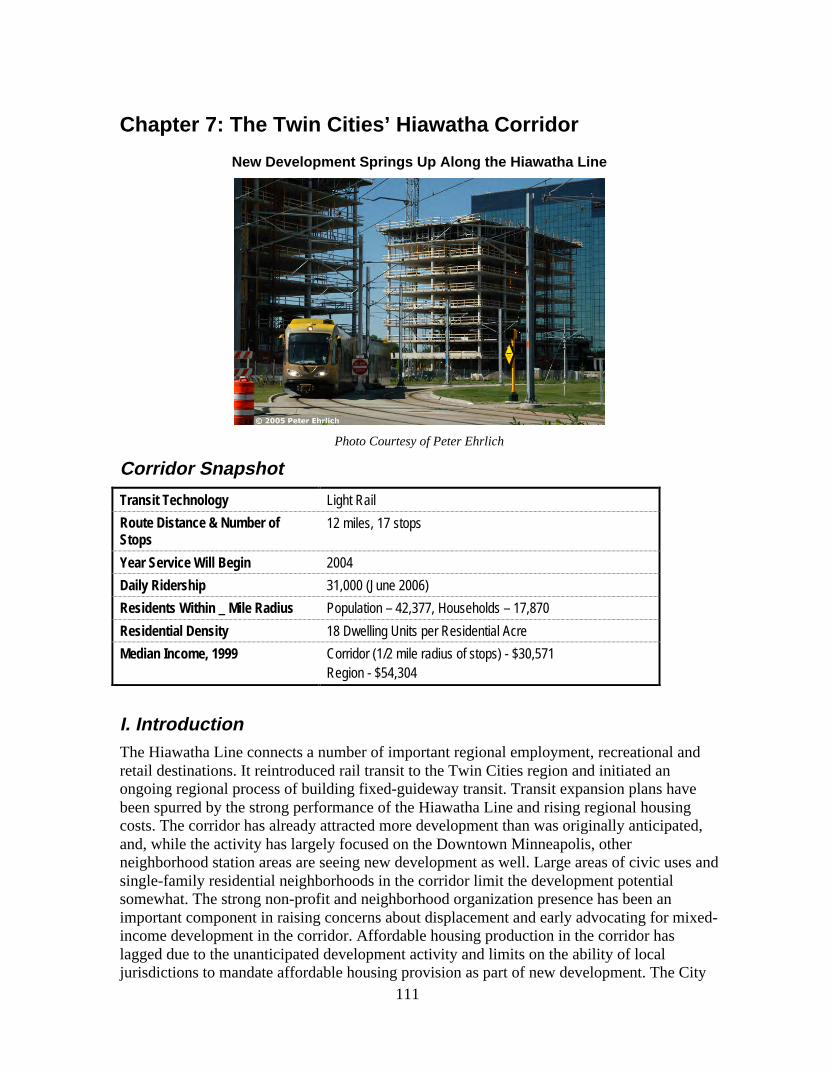
111
Chapter 7: The Twin Cities’ Hiawatha CorridorNew Development Springs Up Along the Hiawatha Line
Photo Courtesy of Peter Ehrlich
Corridor SnapshotTransit Technology Light Rail
Route Distance & Number ofStops
12 miles, 17 stops
Year Service Will Begin 2004
Daily Ridership 31,000 (June 2006)
Residents Within _ Mile Radius Population – 42,377, Households – 17,870
Residential Density 18 Dwelling Units per Residential Acre
Median Income, 1999 Corridor (1/2 mile radius of stops) - $30,571Region - $54,304
I. IntroductionThe Hiawatha Line connects a number of important regional employment, recreational andretail destinations. It reintroduced rail transit to the Twin Cities region and initiated anongoing regional process of building fixed-guideway transit. Transit expansion plans havebeen spurred by the strong performance of the Hiawatha Line and rising regional housingcosts. The corridor has already attracted more development than was originally anticipated,and, while the activity has largely focused on the Downtown Minneapolis, otherneighborhood station areas are seeing new development as well. Large areas of civic uses andsingle-family residential neighborhoods in the corridor limit the development potentialsomewhat. The strong non-profit and neighborhood organization presence has been animportant component in raising concerns about displacement and early advocating for mixed-income development in the corridor. Affordable housing production in the corridor haslagged due to the unanticipated development activity and limits on the ability of localjurisdictions to mandate affordable housing provision as part of new development. The City
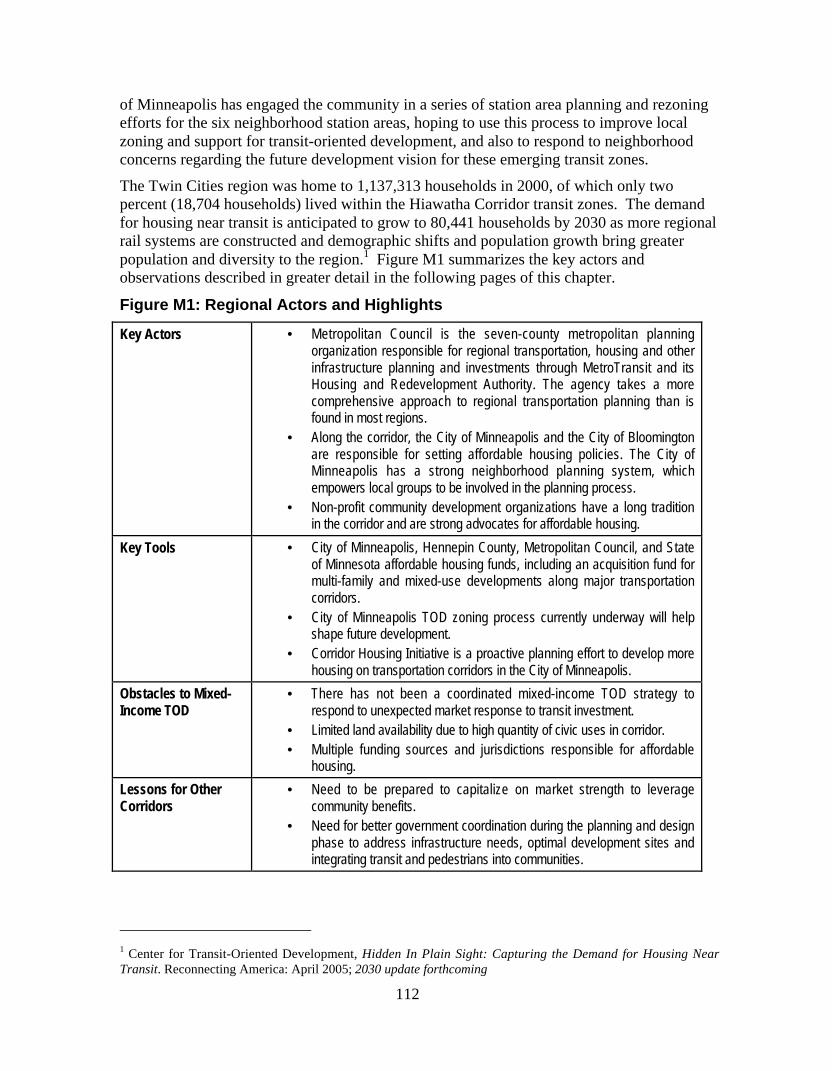
112
of Minneapolis has engaged the community in a series of station area planning and rezoningefforts for the six neighborhood station areas, hoping to use this process to improve localzoning and support for transit-oriented development, and also to respond to neighborhoodconcerns regarding the future development vision for these emerging transit zones.
The Twin Cities region was home to 1,137,313 households in 2000, of which only twopercent (18,704 households) lived within the Hiawatha Corridor transit zones. The demandfor housing near transit is anticipated to grow to 80,441 households by 2030 as more regionalrail systems are constructed and demographic shifts and population growth bring greaterpopulation and diversity to the region.1 Figure M1 summarizes the key actors andobservations described in greater detail in the following pages of this chapter.
Figure M1: Regional Actors and HighlightsKey Actors • Metropolitan Council is the seven-county metropolitan planning
organization responsible for regional transportation, housing and otherinfrastructure planning and investments through MetroTransit and itsHousing and Redevelopment Authority. The agency takes a morecomprehensive approach to regional transportation planning than isfound in most regions.
• Along the corridor, the City of Minneapolis and the City of Bloomingtonare responsible for setting affordable housing policies. The City ofMinneapolis has a strong neighborhood planning system, whichempowers local groups to be involved in the planning process.
• Non-profit community development organizations have a long traditionin the corridor and are strong advocates for affordable housing.
Key Tools • City of Minneapolis, Hennepin County, Metropolitan Council, and Stateof Minnesota affordable housing funds, including an acquisition fund formulti-family and mixed-use developments along major transportationcorridors.
• City of Minneapolis TOD zoning process currently underway will helpshape future development.
• Corridor Housing Initiative is a proactive planning effort to develop morehousing on transportation corridors in the City of Minneapolis.
Obstacles to Mixed-Income TOD
• There has not been a coordinated mixed-income TOD strategy torespond to unexpected market response to transit investment.
• Limited land availability due to high quantity of civic uses in corridor.• Multiple funding sources and jurisdictions responsible for affordable
housing.
Lessons for OtherCorridors
• Need to be prepared to capitalize on market strength to leveragecommunity benefits.
• Need for better government coordination during the planning and designphase to address infrastructure needs, optimal development sites andintegrating transit and pedestrians into communities.
1 Center for Transit-Oriented Development, Hidden In Plain Sight: Capturing the Demand for Housing NearTransit. Reconnecting America: April 2005; 2030 update forthcoming
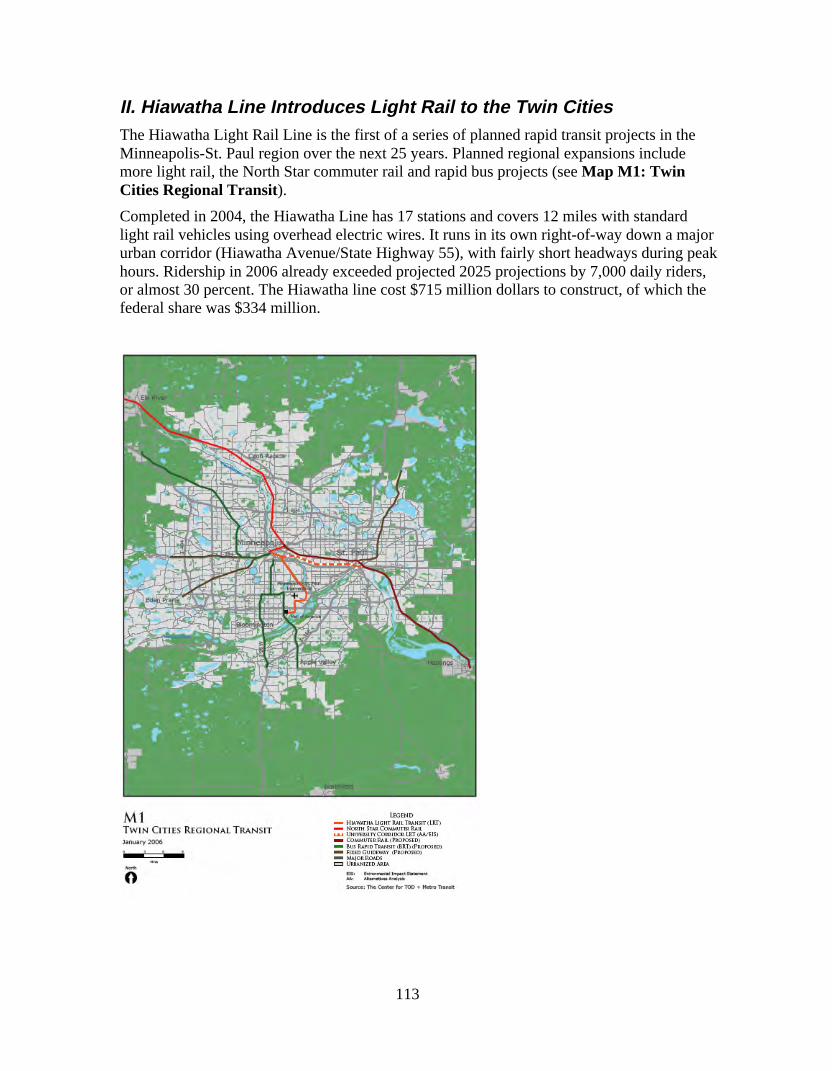
113
II. Hiawatha Line Introduces Light Rail to the Twin CitiesThe Hiawatha Light Rail Line is the first of a series of planned rapid transit projects in theMinneapolis-St. Paul region over the next 25 years. Planned regional expansions includemore light rail, the North Star commuter rail and rapid bus projects (see Map M1: TwinCities Regional Transit).
Completed in 2004, the Hiawatha Line has 17 stations and covers 12 miles with standardlight rail vehicles using overhead electric wires. It runs in its own right-of-way down a majorurban corridor (Hiawatha Avenue/State Highway 55), with fairly short headways during peakhours. Ridership in 2006 already exceeded projected 2025 projections by 7,000 daily riders,or almost 30 percent. The Hiawatha line cost $715 million dollars to construct, of which thefederal share was $334 million.
114
The line connects multiple destinations, running from downtown Minneapolis through aseries of residential neighborhoods, the Metrodome,2 the Veterans Administration medicalcenter, the Minneapolis-St. Paul International Airport, and retail and office centers in the Cityof Bloomington, including the Mall of America, while traveling through a mix of industrialand residential neighborhoods. This connection between the residential neighborhoods andmajor job and entertainment centers has fueled the strong ridership performance of the line.
The corridor includes connections to other modes, including feeder bus service, and runsparallel to a newly expanded Hiawatha Avenue/State Highway 55. According to US Census2000 Journey to Work data, residents along the line used transit, bicycling and walking ingreater numbers than other households throughout the region even before construction of theline, and auto ownership rates remain lower. The primary function of the corridor is tomitigate congestion on parallel roads, including two highly congested nearby interstates (I-35and I-94), while connecting important regional destinations.
III. Housing Prices Heat Up During the late 1990sBetween 2000 and 2005, the overall number of housing units in the Twin Cities regionincreased from 168,624 to 171,614, but the number of occupied units fell from 162,363 to156,9703. Even while this trend towards increased vacancy was taking place, Minneapoliswas one a few cities in the nation to add population to its urban core in the 1990’s4. At thesame time, the median cost for housing nearly doubled in the region over the five year period,increasing from $113,500 in 2000 to $226,900 in 2005.5
The rapid price escalation is a cause of concern for many communities and elected officialsin the region. Whereas in 2000, 21 percent of households who owned their homes spent over30 percent on housing, in 2005 the percentage had increased to 28. For renters, the situationwas even more dramatic, with 50 percent of rental households spending at least 30 percent ofhousehold income on housing in 20056.
In the last five years, downtown Minneapolis has seen significant new or converted higher-density housing. In particular, the Warehouse District, which contains a number of obsoleteindustrial buildings prime for conversion, has seen a large number of new residential ormixed-use development projects. The growing market for more compact urban livingcoupled with industrial properties available for conversion and the introduction of light railhave already catalyzed the redevelopment of a mixed-use, higher-density, transit-supportivedowntown.
The TOD housing boom in Minneapolis has exceeded all expectations. A market studycompleted for the city in 1999 had projected there would be a demand for 7,150 housingunits near transit by 2020.7 The city estimates that the number of units either proposed, under
2 In October 2006, Metro Transit reported that over a quarter of Twins fans rode light rail to the playoff gamesat the Metrodome.3 US Census Bureau, 2005 American Community Survey, Selected Housing Characteristics.4 Harvard Joint Center for Housing Study, State of the Nation’s Housing 2005.5 US Census Bureau, 2005 American Community Survey, Selected Housing Characteristics.6 Ibid.
7 Presentation by Mike Christenson, Director of Economic Development, Minneapolis Community Planning andEconomic Development (CPED) Department, City of Minneapolis, “The Emerging Real Estate Market and
115
construction or built already exceed that number—including 5,000 units in the boomingdowntown market and another 2,000 from Cedar Riverside to Bloomington. This wouldsuggest that TOD is a valid real estate product niche in the Twin Cities, as elsewhere.
IV. Assessing the Development Potential and ExistingCharacteristics Along Hiawatha Corridor
Varied Land Uses and Underutilized Sites Shape Future Development PotentialAlong the Hiawatha CorridorGiven the diversity of housing type and mix of uses along the Hiawatha Corridor, thedevelopment response should be expected to show similar diversity dependent on the scaleand type of redevelopment potential that exists around station areas.
A variety of distinct land use patterns are included in the half mile radii surrounding thestations on the Hiawatha Corridor (see Map M2: Existing Land Uses, next page). The fourdowntown station areas contain higher-intensity commercial, civic, residential, and mixed-uses, along with parking lots and some industry.8 Some of the originally industrial parcelshave already converted to higher-density residential and mixed-use buildings. The residentialdensity around these station areas is very high, ranging from 87 to 265 units per netresidential acre (as compared with an average 18 units per acre for the region).
The three stations just southeast of Downtown across I-35W/I-94—Cedar/Riverside9,Franklin Avenue and Lake Street—contain a mix of existing development types. All threestation areas contain a significant amount of existing highway infrastructure and a mix ofindustrial, commercial, and civic uses. Surrounding the stations are residential areas ofattached and single-family homes of varying densities, scattered with some commercial andindustrial uses. The next two stations are predominantly single-family residentialneighborhoods built on a historic grid block pattern.
Moving further south, the 50th Street/Minnehaha Park and VA Medical Center stations areapproximately half built-out single-family neighborhoods and half civic uses, including anational park and major medical center. The next three stations are either within theMinneapolis-St. Paul International Airport or are surrounded by uses supporting the airport.None of these station areas present much opportunity for change. The final three stations arewithin the City of Bloomington, and contain primarily large-scale retail, office, and lightindustrial uses, including the Mall of America.
Policy Framework in Minneapolis,” March 2005,http://www.ci.minneapolis.mn.us/cped/plans_home.asp#P79_4285
8 Because much of the residential development in the area is quite recent, it is underrepresented in the existingland use data that the CTOD obtained from the Metropolitan Council.9 Cedar/Riverside is somewhat unique in that this large-scale mixed-use residential neighborhood wasconstructed was constructed thirty years ago as part of the New Town/In Town federal housing program.
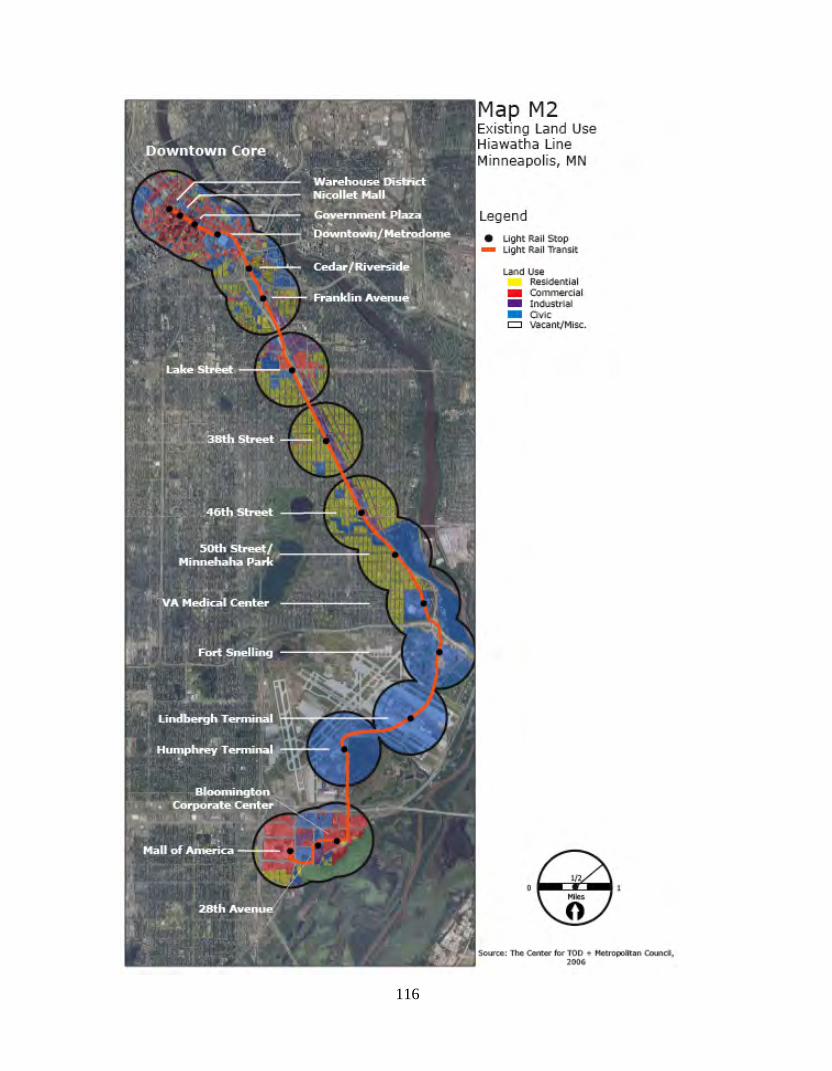
116
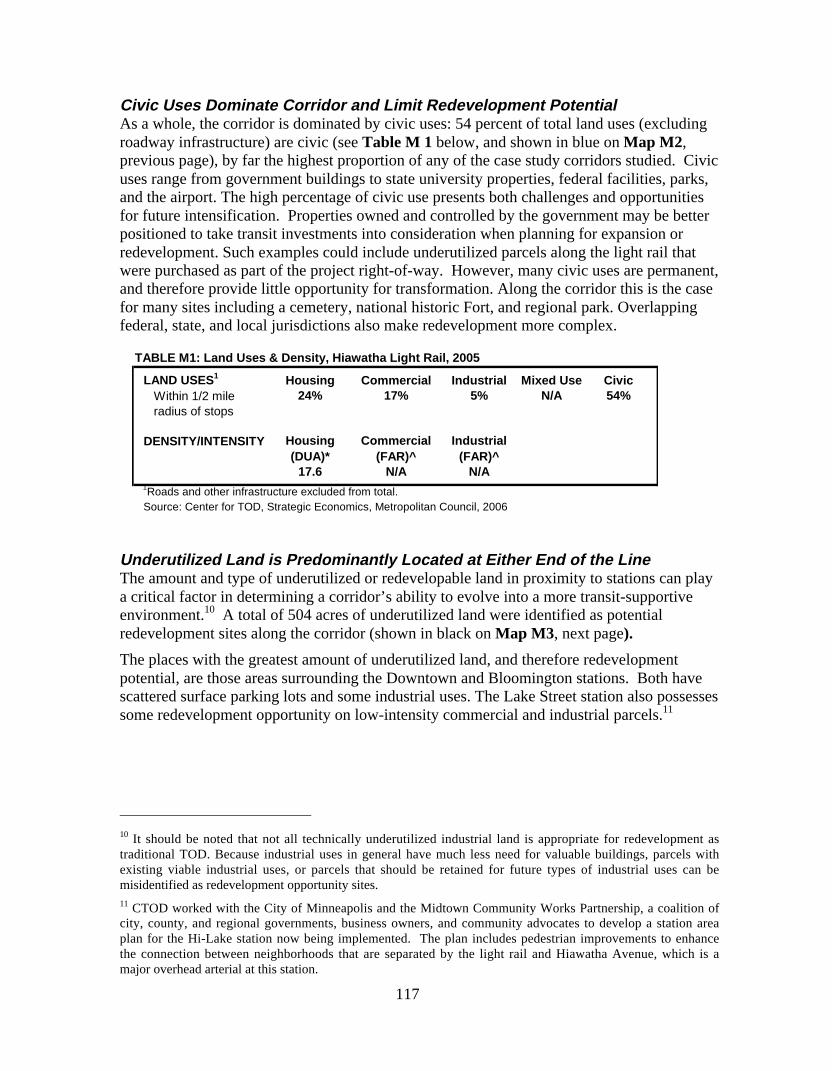
117
Civic Uses Dominate Corridor and Limit Redevelopment PotentialAs a whole, the corridor is dominated by civic uses: 54 percent of total land uses (excludingroadway infrastructure) are civic (see Table M 1 below, and shown in blue on Map M2,previous page), by far the highest proportion of any of the case study corridors studied. Civicuses range from government buildings to state university properties, federal facilities, parks,and the airport. The high percentage of civic use presents both challenges and opportunitiesfor future intensification. Properties owned and controlled by the government may be betterpositioned to take transit investments into consideration when planning for expansion orredevelopment. Such examples could include underutilized parcels along the light rail thatwere purchased as part of the project right-of-way. However, many civic uses are permanent,and therefore provide little opportunity for transformation. Along the corridor this is the casefor many sites including a cemetery, national historic Fort, and regional park. Overlappingfederal, state, and local jurisdictions also make redevelopment more complex.
Underutilized Land is Predominantly Located at Either End of the LineThe amount and type of underutilized or redevelopable land in proximity to stations can playa critical factor in determining a corridor’s ability to evolve into a more transit-supportiveenvironment.10 A total of 504 acres of underutilized land were identified as potentialredevelopment sites along the corridor (shown in black on Map M3, next page).
The places with the greatest amount of underutilized land, and therefore redevelopmentpotential, are those areas surrounding the Downtown and Bloomington stations. Both havescattered surface parking lots and some industrial uses. The Lake Street station also possessessome redevelopment opportunity on low-intensity commercial and industrial parcels.11
10 It should be noted that not all technically underutilized industrial land is appropriate for redevelopment astraditional TOD. Because industrial uses in general have much less need for valuable buildings, parcels withexisting viable industrial uses, or parcels that should be retained for future types of industrial uses can bemisidentified as redevelopment opportunity sites.11 CTOD worked with the City of Minneapolis and the Midtown Community Works Partnership, a coalition ofcity, county, and regional governments, business owners, and community advocates to develop a station areaplan for the Hi-Lake station now being implemented. The plan includes pedestrian improvements to enhancethe connection between neighborhoods that are separated by the light rail and Hiawatha Avenue, which is amajor overhead arterial at this station.
TABLE M1: Land Uses & Density, Hiawatha Light Rail, 2005
LAND USES1 Housing Commercial Industrial Mixed Use Civic24% 17% 5% N/A 54%
DENSITY/INTENSITY
17.6 N/A N/A1Roads and other infrastructure excluded from total.Source: Center for TOD, Strategic Economics, Metropolitan Council, 2006
Within 1/2 mile radius of stops
Commercial (FAR)^
Housing (DUA)*
Industrial (FAR)^
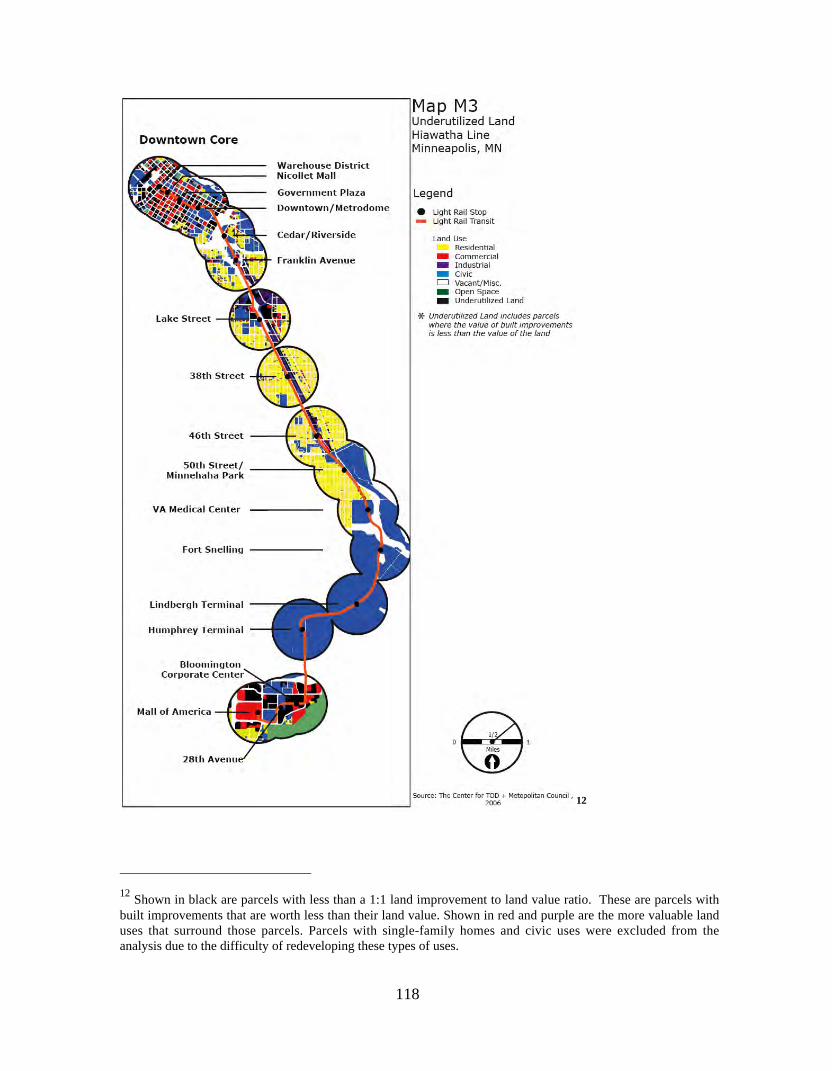
118
12
12 Shown in black are parcels with less than a 1:1 land improvement to land value ratio. These are parcels withbuilt improvements that are worth less than their land value. Shown in red and purple are the more valuable landuses that surround those parcels. Parcels with single-family homes and civic uses were excluded from theanalysis due to the difficulty of redeveloping these types of uses.
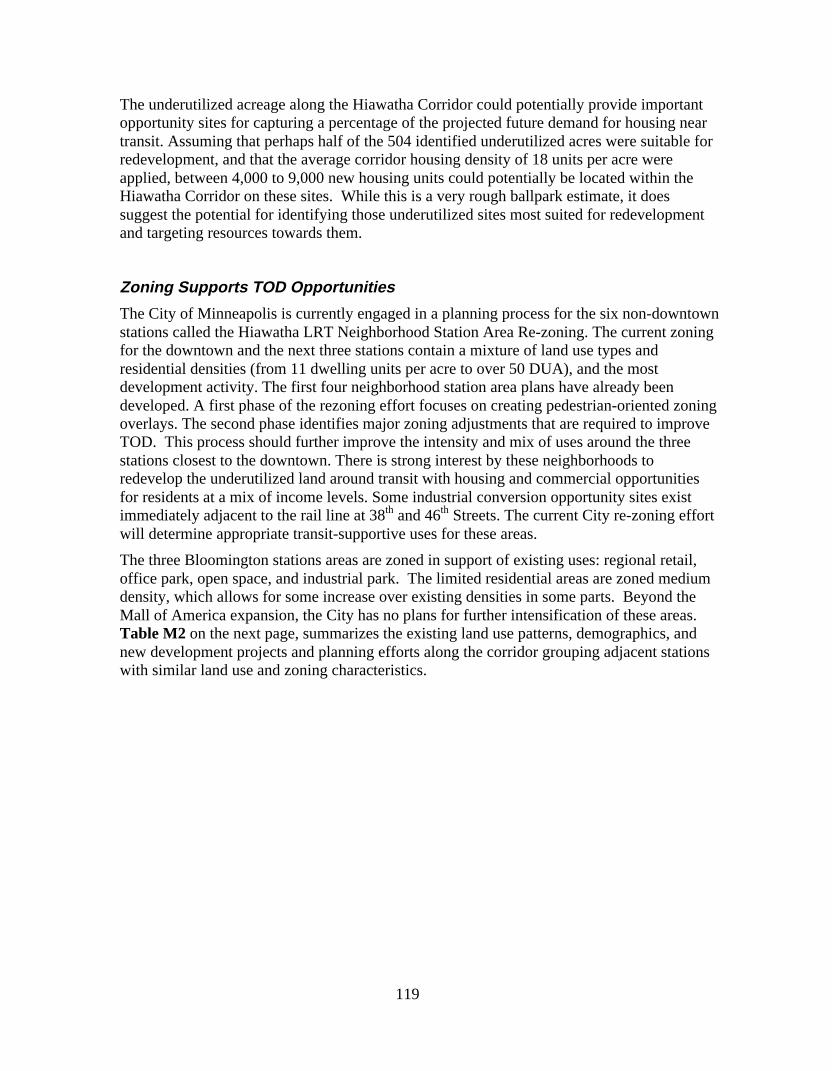
119
The underutilized acreage along the Hiawatha Corridor could potentially provide importantopportunity sites for capturing a percentage of the projected future demand for housing neartransit. Assuming that perhaps half of the 504 identified underutilized acres were suitable forredevelopment, and that the average corridor housing density of 18 units per acre wereapplied, between 4,000 to 9,000 new housing units could potentially be located within theHiawatha Corridor on these sites. While this is a very rough ballpark estimate, it doessuggest the potential for identifying those underutilized sites most suited for redevelopmentand targeting resources towards them.
Zoning Supports TOD OpportunitiesThe City of Minneapolis is currently engaged in a planning process for the six non-downtownstations called the Hiawatha LRT Neighborhood Station Area Re-zoning. The current zoningfor the downtown and the next three stations contain a mixture of land use types andresidential densities (from 11 dwelling units per acre to over 50 DUA), and the mostdevelopment activity. The first four neighborhood station area plans have already beendeveloped. A first phase of the rezoning effort focuses on creating pedestrian-oriented zoningoverlays. The second phase identifies major zoning adjustments that are required to improveTOD. This process should further improve the intensity and mix of uses around the threestations closest to the downtown. There is strong interest by these neighborhoods toredevelop the underutilized land around transit with housing and commercial opportunitiesfor residents at a mix of income levels. Some industrial conversion opportunity sites existimmediately adjacent to the rail line at 38th and 46th Streets. The current City re-zoning effortwill determine appropriate transit-supportive uses for these areas.
The three Bloomington stations areas are zoned in support of existing uses: regional retail,office park, open space, and industrial park. The limited residential areas are zoned mediumdensity, which allows for some increase over existing densities in some parts. Beyond theMall of America expansion, the City has no plans for further intensification of these areas.Table M2 on the next page, summarizes the existing land use patterns, demographics, andnew development projects and planning efforts along the corridor grouping adjacent stationswith similar land use and zoning characteristics.
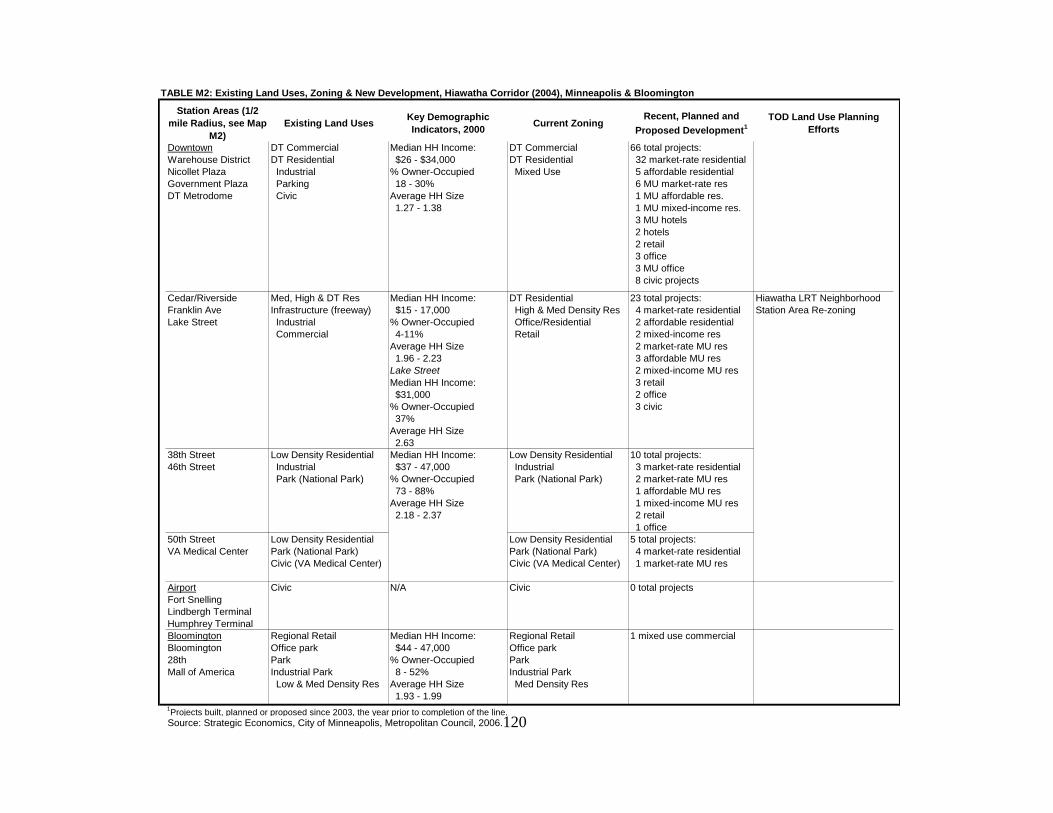
120
TABLE M2: Existing Land Uses, Zoning & New Development, Hiawatha Corridor (2004), Minneapolis & Bloomington
Station Areas (1/2 mile Radius, see Map
M2)Existing Land Uses
Key Demographic Indicators, 2000
Current ZoningRecent, Planned and
Proposed Development1TOD Land Use Planning
Efforts
DowntownWarehouse DistrictNicollet PlazaGovernment PlazaDT Metrodome
DT CommercialDT Residential Industrial Parking Civic
Median HH Income: $26 - $34,000 % Owner-Occupied 18 - 30% Average HH Size 1.27 - 1.38
DT CommercialDT Residential Mixed Use
66 total projects: 32 market-rate residential 5 affordable residential 6 MU market-rate res 1 MU affordable res. 1 MU mixed-income res. 3 MU hotels 2 hotels 2 retail 3 office 3 MU office 8 civic projects
Cedar/RiversideFranklin AveLake Street
Med, High & DT ResInfrastructure (freeway) Industrial Commercial
Median HH Income: $15 - 17,000 % Owner-Occupied 4-11% Average HH Size 1.96 - 2.23 Lake StreetMedian HH Income: $31,000% Owner-Occupied 37% Average HH Size 2.63
DT Residential High & Med Density Res Office/Residential Retail
23 total projects: 4 market-rate residential 2 affordable residential 2 mixed-income res 2 market-rate MU res 3 affordable MU res 2 mixed-income MU res 3 retail 2 office 3 civic
38th Street46th Street
Low Density Residential Industrial Park (National Park)
Low Density Residential Industrial Park (National Park)
10 total projects: 3 market-rate residential 2 market-rate MU res 1 affordable MU res 1 mixed-income MU res 2 retail 1 office
50th StreetVA Medical Center
Low Density ResidentialPark (National Park)Civic (VA Medical Center)
Low Density ResidentialPark (National Park)Civic (VA Medical Center)
5 total projects: 4 market-rate residential 1 market-rate MU res
AirportFort SnellingLindbergh TerminalHumphrey Terminal
Civic N/A Civic 0 total projects
BloomingtonBloomington28thMall of America
Regional RetailOffice parkParkIndustrial Park Low & Med Density Res
Median HH Income: $44 - 47,000% Owner-Occupied 8 - 52% Average HH Size 1.93 - 1.99
Regional RetailOffice parkParkIndustrial Park Med Density Res
1 mixed use commercial
Source: Strategic Economics, City of Minneapolis, Metropolitan Council, 2006.
1Projects built, planned or proposed since 2003, the year prior to completion of the line.
Hiawatha LRT Neighborhood Station Area Re-zoning
Median HH Income: $37 - 47,000% Owner-Occupied 73 - 88% Average HH Size 2.18 - 2.37
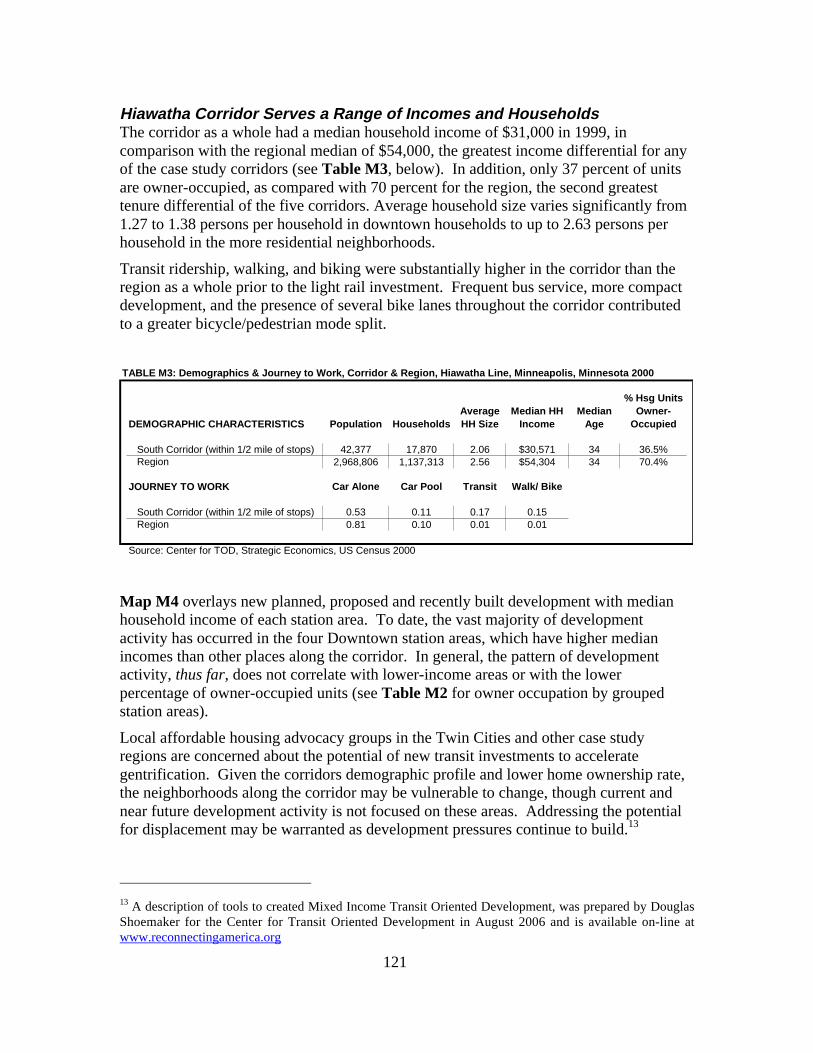
121
Hiawatha Corridor Serves a Range of Incomes and HouseholdsThe corridor as a whole had a median household income of $31,000 in 1999, incomparison with the regional median of $54,000, the greatest income differential for anyof the case study corridors (see Table M3, below). In addition, only 37 percent of unitsare owner-occupied, as compared with 70 percent for the region, the second greatesttenure differential of the five corridors. Average household size varies significantly from1.27 to 1.38 persons per household in downtown households to up to 2.63 persons perhousehold in the more residential neighborhoods.
Transit ridership, walking, and biking were substantially higher in the corridor than theregion as a whole prior to the light rail investment. Frequent bus service, more compactdevelopment, and the presence of several bike lanes throughout the corridor contributedto a greater bicycle/pedestrian mode split.
TABLE M3: Demographics & Journey to Work, Corridor & Region, Hiawatha Line, Minneapolis, Minnesota 2000
DEMOGRAPHIC CHARACTERISTICS Population Households
South Corridor (within 1/2 mile of stops) 42,377 17,870 2.06 $30,571 34 36.5%Region 2,968,806 1,137,313 2.56 $54,304 34 70.4%
JOURNEY TO WORK Car Alone Car Pool Transit Walk/ Bike
South Corridor (within 1/2 mile of stops) 0.53 0.11 0.17 0.15Region 0.81 0.10 0.01 0.01
Source: Center for TOD, Strategic Economics, US Census 2000
% Hsg Units Owner-
OccupiedAverage HH Size
Median HH Income
Median Age
Map M4 overlays new planned, proposed and recently built development with medianhousehold income of each station area. To date, the vast majority of developmentactivity has occurred in the four Downtown station areas, which have higher medianincomes than other places along the corridor. In general, the pattern of developmentactivity, thus far, does not correlate with lower-income areas or with the lowerpercentage of owner-occupied units (see Table M2 for owner occupation by groupedstation areas).
Local affordable housing advocacy groups in the Twin Cities and other case studyregions are concerned about the potential of new transit investments to accelerategentrification. Given the corridors demographic profile and lower home ownership rate,the neighborhoods along the corridor may be vulnerable to change, though current andnear future development activity is not focused on these areas. Addressing the potentialfor displacement may be warranted as development pressures continue to build.13
13 A description of tools to created Mixed Income Transit Oriented Development, was prepared by DouglasShoemaker for the Center for Transit Oriented Development in August 2006 and is available on-line atwww.reconnectingamerica.org
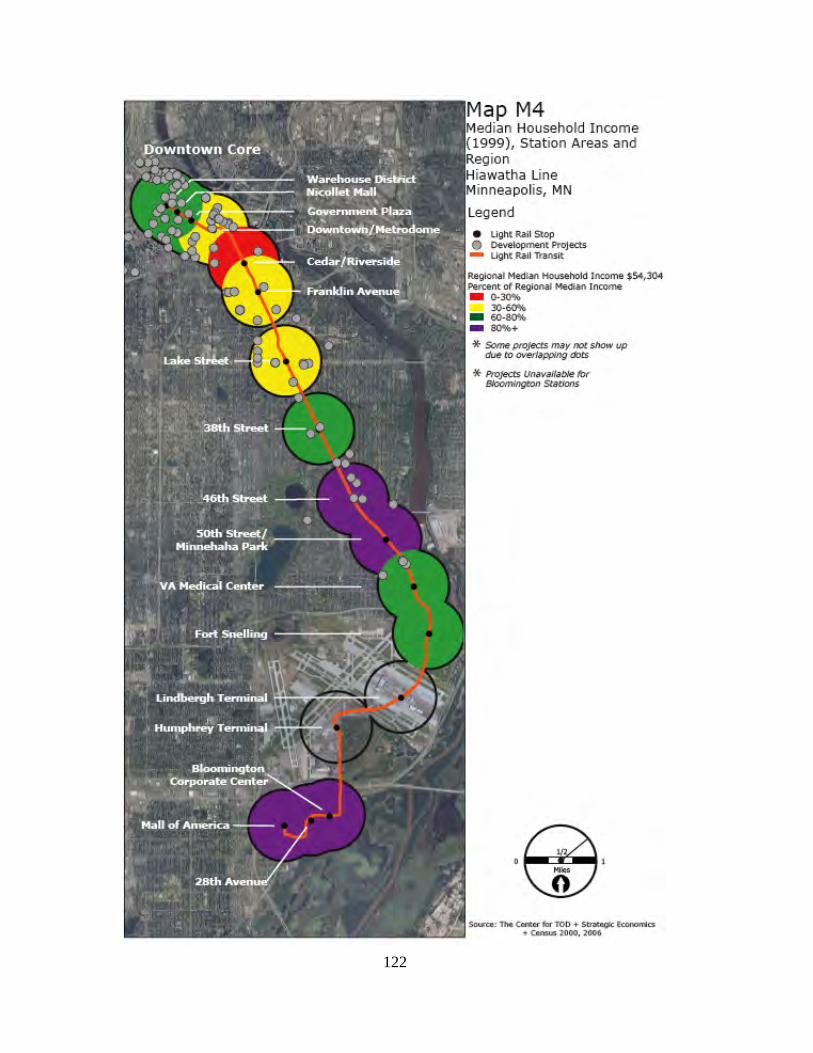
122
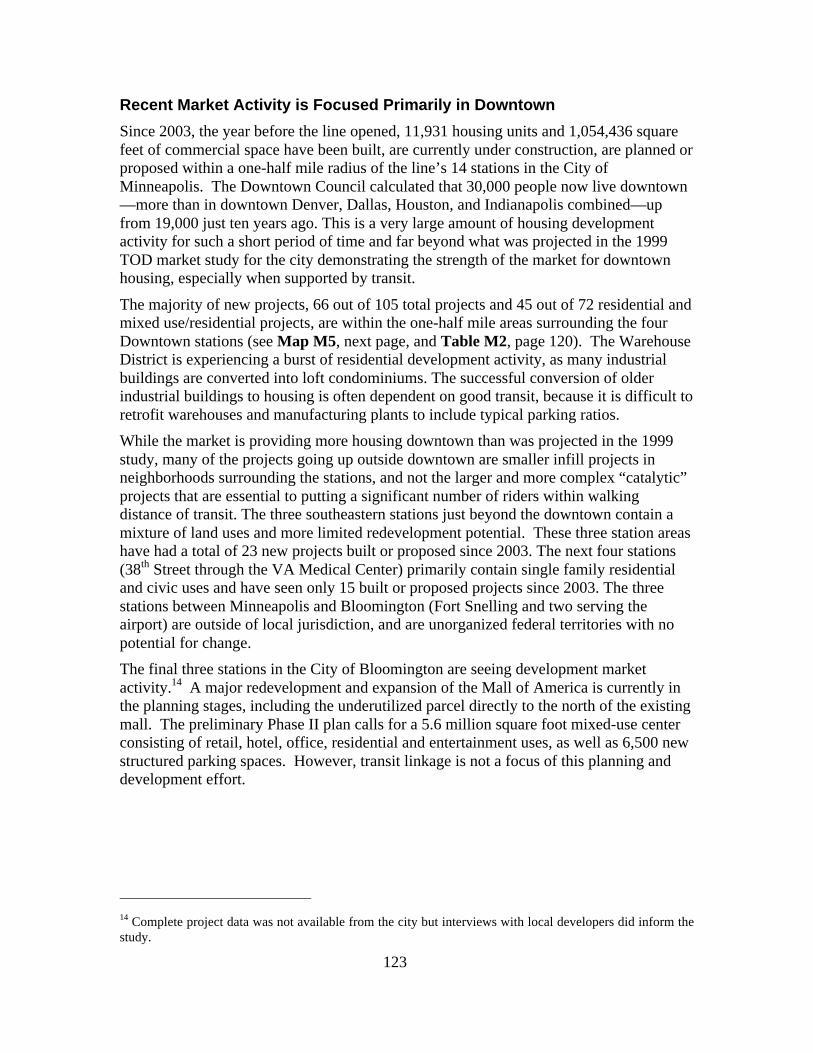
123
Recent Market Activity is Focused Primarily in Downtown
Since 2003, the year before the line opened, 11,931 housing units and 1,054,436 squarefeet of commercial space have been built, are currently under construction, are planned orproposed within a one-half mile radius of the line’s 14 stations in the City ofMinneapolis. The Downtown Council calculated that 30,000 people now live downtown—more than in downtown Denver, Dallas, Houston, and Indianapolis combined—upfrom 19,000 just ten years ago. This is a very large amount of housing developmentactivity for such a short period of time and far beyond what was projected in the 1999TOD market study for the city demonstrating the strength of the market for downtownhousing, especially when supported by transit.
The majority of new projects, 66 out of 105 total projects and 45 out of 72 residential andmixed use/residential projects, are within the one-half mile areas surrounding the fourDowntown stations (see Map M5, next page, and Table M2, page 120). The WarehouseDistrict is experiencing a burst of residential development activity, as many industrialbuildings are converted into loft condominiums. The successful conversion of olderindustrial buildings to housing is often dependent on good transit, because it is difficult toretrofit warehouses and manufacturing plants to include typical parking ratios.
While the market is providing more housing downtown than was projected in the 1999study, many of the projects going up outside downtown are smaller infill projects inneighborhoods surrounding the stations, and not the larger and more complex “catalytic”projects that are essential to putting a significant number of riders within walkingdistance of transit. The three southeastern stations just beyond the downtown contain amixture of land uses and more limited redevelopment potential. These three station areashave had a total of 23 new projects built or proposed since 2003. The next four stations(38th Street through the VA Medical Center) primarily contain single family residentialand civic uses and have seen only 15 built or proposed projects since 2003. The threestations between Minneapolis and Bloomington (Fort Snelling and two serving theairport) are outside of local jurisdiction, and are unorganized federal territories with nopotential for change.
The final three stations in the City of Bloomington are seeing development marketactivity.14 A major redevelopment and expansion of the Mall of America is currently inthe planning stages, including the underutilized parcel directly to the north of the existingmall. The preliminary Phase II plan calls for a 5.6 million square foot mixed-use centerconsisting of retail, hotel, office, residential and entertainment uses, as well as 6,500 newstructured parking spaces. However, transit linkage is not a focus of this planning anddevelopment effort.
14 Complete project data was not available from the city but interviews with local developers did inform thestudy.
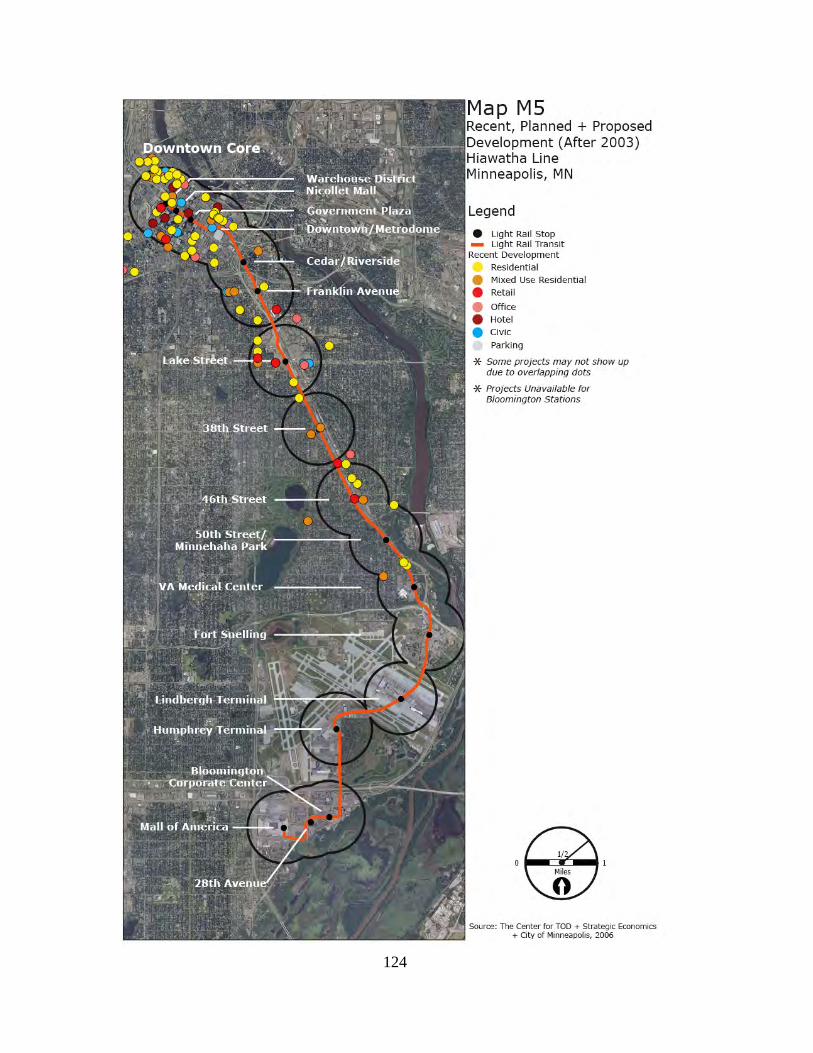
124
125
V. Mixed-Income TOD Focuses on Preservation of Mixed-IncomeNeighborhoods in Partnership with Community-Based EffortsAs previously noted, the corridor overall contains households at a range of incomes, witha significant number of low-income households residing within the transit zonesimmediately adjacent to the downtown. The downtown housing market has seen the mostoverall development in the corridor, much of it high-end. Not all new housing isaffordable only to those with high incomes. Twenty-five percent of the 72 new residentialor mixed-use residential projects since 2003 are affordable or mixed-income. Thedistribution of projects can be seen in Map M6 and in Table M2. Seven out of the 18projects containing affordable units are in the downtown station areas, while nine are inthe three next station areas. The concentration of affordable projects aroundCedar/Riverside, Franklin, and Hiawatha-Lake Street (Hi-Lake) correspond with thelower median household incomes and focus of community development corporationsactive within these areas. The neighborhood organizations along the corridor are keenlyfocused on advocating for the housing needs of current low-income residents and areconcerned that more focused policies need to be adopted to ensure that rental and homeownership opportunities will remain along the corridor as new development occurs.
The Center for Neighborhoods is one non-profit organization that is working with otherneighborhood and housing advocates, as well as the City’s multi-family housing staff tobetter educate residents on opportunities for home ownership, the benefits of transit, andtrying to ensure that affordable housing is part of the future development efforts along thecorridor. The City’s Corridor Housing Initiative is a partnership between the Center forNeighborhoods and the City of Minneapolis, and focused on preserving and increasingaffordable housing along transit corridors. The Corridor Housing Initiative reduces front-end costs for developers by providing community support for development throughsuggested development guidelines, neighborhood and City support for higher densitydevelopment through zoning recommendations, and increased access to available Cityfunding cycles.
The Midtown Community Works Partnership (MCWP) is another organization active inthe corridor, focused specifically on the Hi-Lake station area. MCWP is a collaborationbetween neighborhood organizations, business owners, and local governments to developand support TOD redevelopment plans and pedestrian improvements around the Hi-LakeStation. The City of Minneapolis has also partnered with local realtors to developmaterials for prospective homeowners that highlight the benefits of living near transit.Strong neighborhood organizations remain actively involved in station area plans andimplementation efforts along the corridor, working with the City to track developmentand demographic trends to help shape future development and incorporate neighborhoodpriorities into the development approval process and any future rezoning.
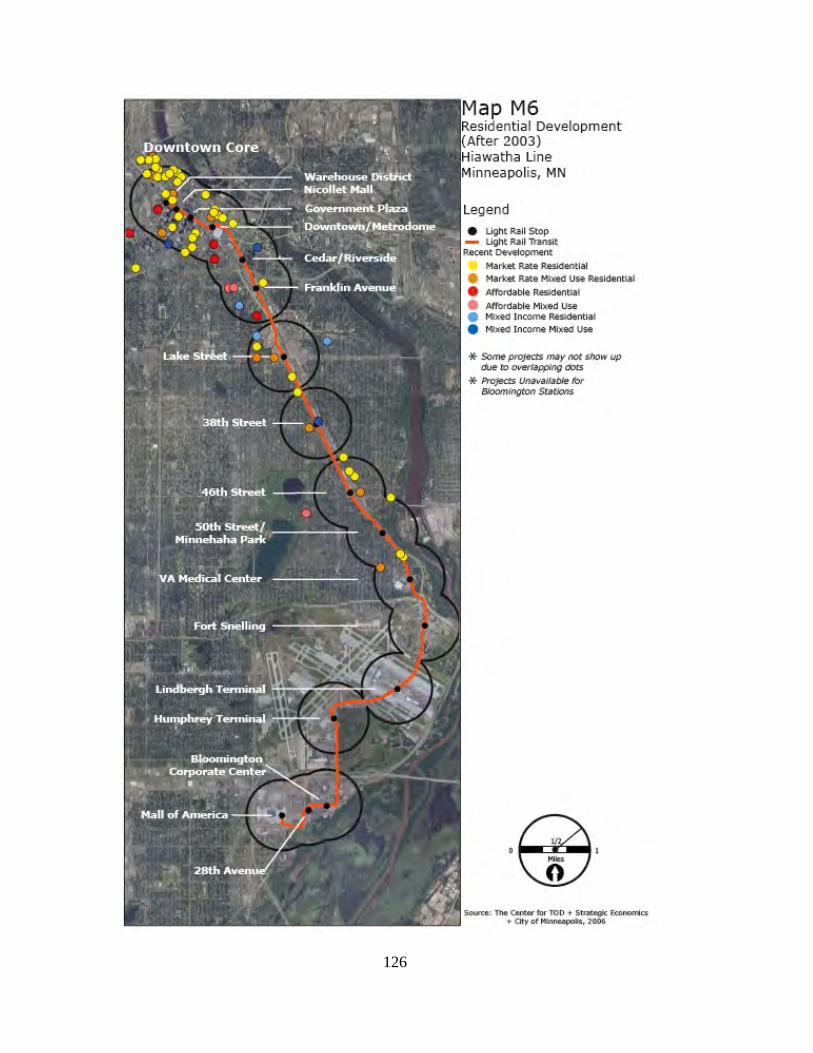
126
127
VI. Local Policy Tools: Multiple Funding Sources Lack ClearLinkagesThe degree of development interest along the corridor has surprised local planners andneighborhood residents. The Metropolitan Council provided planning funds early in theconstruction of the light rail project, and the City has been working to catch up anddevelop station area plans with strong neighborhood input. While overall response to theHiawatha light rail has been extremely positive, there is growing anxiety over potentialneighborhood change and displacement. In part, this may reflect a need for governmentto explicitly state a commitment to maintaining affordable housing and creating mixed-income neighborhoods within transit corridors.
The City of Minneapolis, Hennepin County, the Metropolitan Council, and even the Statehave a variety of TOD and affordable housing programs available to householdsthroughout the region, including in this corridor (described in Table M4, next page).15
Gap financing is provided by Minneapolis and Hennepin County for building affordablehousing for low-income groups, and includes an incentive for proximity to transit. TheCounty also has a TOD program for redevelopment and construction within or adjacentto the County’s transit corridors. A relatively new program, it is helping to construct anumber of new projects beyond just the Hiawatha corridor. A majority of projects usingthese funds have been market rate. The City’s Corridor Housing Initiative, mentionedpreviously, is viewed as another innovative strategy for engaging neighborhoods andeducating citizens on the planning process and trade-offs associated with higher densities,mixed use, and access to affordable housing.
The Metropolitan Council, together with the County and State, provide funds to clean uppolluted land for redevelopment. A number of parcels along the corridor would qualifyfor brownfield clean-up funds, particularly in the older mixed-use residential and olderindustrial areas. Several vacant parcels of land remaining from the construction of theHiawatha line are publicly owned by the Minnesota Department of Transportation andthe Metropolitan Council. The transfer and potential use of these parcels by the Citywould be a powerful tool for providing mixed income housing and serving as a marketcatalyst in the Hi-Lake station area for shaping new TOD development.
While a variety of affordable housing and TOD tools exist, the linkage between themneeds to be strengthened and better articulated. Given the rate of development andgrowing public interest in equitable development along the corridor, the City and Countyare currently working to address this need and provide new tools and information.
15 A variety of general tools, including overall State funding for affordable housing/subsidized housing arealso being used in the Twin Cities region. These tools are discussed in Appendix A of the report. Table M4highlights those specific to promoting TOD or have a linkage between affordable housing and proximity totransit, or creating mixed income communities.
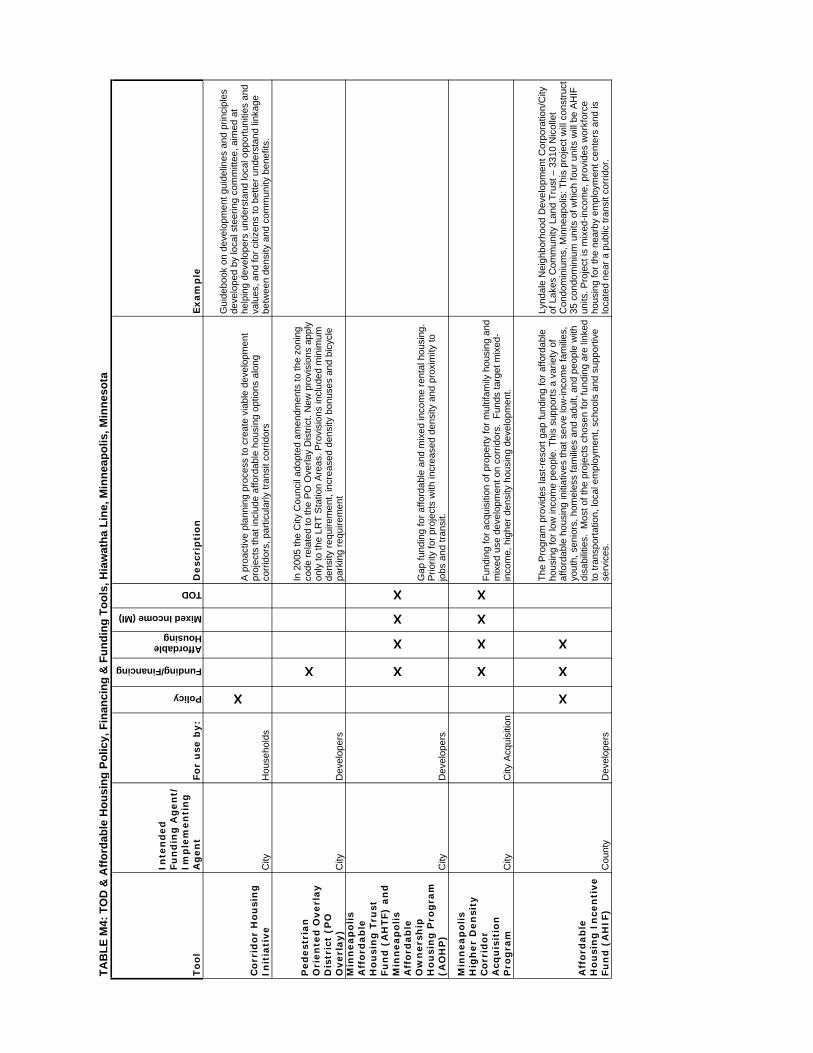
To
ol
Inte
nd
ed
Fu
nd
ing
Ag
en
t/
Imp
lem
en
tin
g
Ag
en
tFo
r u
se b
y:
Policy
Funding/Financing
Affordable Housing
Mixed Income (MI)
TOD
Desc
rip
tio
nExam
ple
Co
rrid
or
Ho
usi
ng
In
itia
tive
City
Hou
seho
lds
X
A p
roac
tive
plan
ning
pro
cess
to c
reat
e vi
able
dev
elop
men
t pr
ojec
ts th
at in
clud
e af
ford
able
hou
sing
opt
ions
alo
ng
corr
idor
s, p
artic
ular
ly tr
ansi
t cor
ridor
s
Gui
debo
ok o
n de
velo
pmen
t gui
delin
es a
nd p
rinci
ples
de
velo
ped
by lo
cal s
teer
ing
com
mitt
ee, a
imed
at
help
ing
deve
lope
rs u
nder
stan
d lo
cal o
ppor
tuni
ties
and
valu
es, a
nd fo
r ci
tizen
s to
bet
ter
unde
rsta
nd li
nkag
e be
twee
n de
nsity
and
com
mun
ity b
enef
its.
Ped
est
rian
O
rien
ted
Overl
ay
Dis
tric
t (P
O
Overl
ay)
City
Dev
elop
ers
X
In 2
005
the
City
Cou
ncil
adop
ted
amen
dmen
ts to
the
zoni
ng
code
rel
ated
to th
e P
O O
verla
y D
istr
ict.
New
pro
visi
ons
appl
y on
ly to
the
LRT
Sta
tion
Are
as. P
rovi
sion
s in
clud
ed m
inim
um
dens
ity r
equi
rem
ent,
incr
ease
d de
nsity
bon
uses
and
bic
ycle
pa
rkin
g re
quire
men
tM
inn
eap
olis
Aff
ord
ab
le
Ho
usi
ng
Tru
st
Fu
nd
(A
HTF)
an
d
Min
neap
olis
Aff
ord
ab
le
Ow
ners
hip
H
ou
sin
g P
rog
ram
(A
OH
P)
City
Dev
elop
ers
X
X
X
X
Gap
fund
ing
for
affo
rdab
le a
nd m
ixed
inco
me
rent
al h
ousi
ng.
Prio
rity
for
proj
ects
with
incr
ease
d de
nsity
and
pro
xim
ity to
jo
bs a
nd tr
ansi
t.
Min
neap
olis
Hig
her
Den
sity
C
orr
ido
r A
cqu
isit
ion
P
rog
ram
City
City
Acq
uisi
tion
X
X
X
X
Fun
ding
for
acqu
isiti
on o
f pro
pert
y fo
r m
ultif
amily
hou
sing
and
m
ixed
use
dev
elop
men
t on
corr
idor
s. F
unds
targ
et m
ixed
-in
com
e, h
ighe
r de
nsity
hou
sing
dev
elop
men
t.
Aff
ord
ab
le
Ho
usi
ng
In
cen
tive
Fu
nd
(A
HIF
) C
ount
yD
evel
oper
s
X
X
X
The
Pro
gram
pro
vide
s la
st-r
esor
t gap
fund
ing
for
affo
rdab
le
hous
ing
for
low
inco
me
peop
le. T
his
supp
orts
a v
arie
ty o
f af
ford
able
hou
sing
initi
ativ
es th
at s
erve
low
-inco
me
fam
ilies
, yo
uth,
sen
iors
, hom
eles
s fa
mili
es a
nd a
dult,
and
peo
ple
with
di
sabi
litie
s. M
ost o
f the
pro
ject
s ch
osen
for
fund
ing
are
linke
d to
tran
spor
tatio
n, lo
cal e
mpl
oym
ent,
scho
ols
and
supp
ortiv
e se
rvic
es.
Lynd
ale
Nei
ghbo
rhoo
d D
evel
opm
ent C
orpo
ratio
n/C
ity
of L
akes
Com
mun
ity L
and
Tru
st –
331
0 N
icol
let
Con
dom
iniu
ms,
Min
neap
olis
: Thi
s pr
ojec
t will
con
stru
ct
35 c
ondo
min
ium
uni
ts o
f whi
ch fo
ur u
nits
will
be
AH
IF
units
. Pro
ject
is m
ixed
-inco
me,
pro
vide
s w
orkf
orce
ho
usin
g fo
r th
e ne
arby
em
ploy
men
t cen
ters
and
is
loca
ted
near
a p
ublic
tran
sit c
orrid
or.
TA
BL
E M
4: T
OD
& A
ffo
rdab
le H
ou
sin
g P
olic
y, F
inan
cin
g &
Fu
nd
ing
To
ols
, Hia
wat
ha
Lin
e, M
inn
eap
olis
, Min
nes
ota
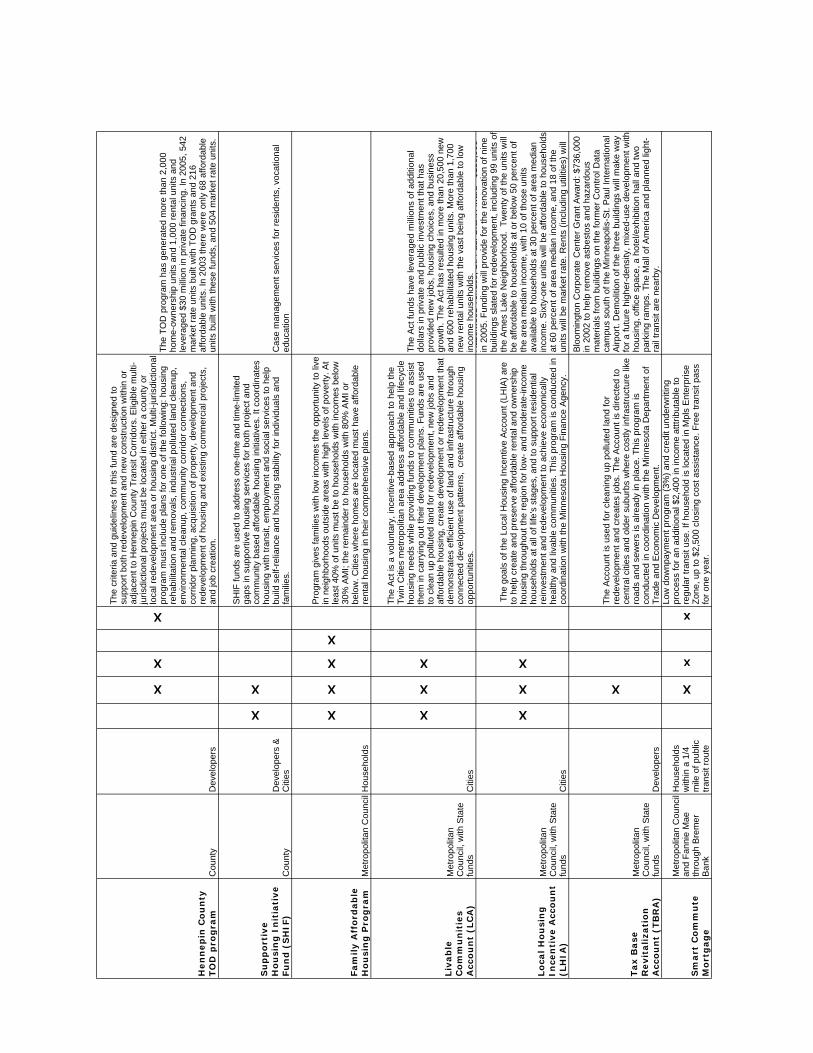
Hen
nep
in C
ou
nty
TO
D p
rog
ram
C
ount
yD
evel
oper
s
X
X
X
The
crit
eria
and
gui
delin
es fo
r th
is fu
nd a
re d
esig
ned
to
supp
ort b
oth
rede
velo
pmen
t and
new
con
stru
ctio
n w
ithin
or
adja
cent
to H
enne
pin
Cou
nty
Tra
nsit
Cor
ridor
s. E
ligib
le m
ulti-
juris
dict
iona
l pro
ject
s m
ust b
e lo
cate
d in
eith
er a
cou
nty
or
loca
l red
evel
opm
ent a
rea
or h
ousi
ng d
istr
ict.
Mul
ti-ju
risdi
ctio
nal
prog
ram
mus
t inc
lude
pla
ns fo
r on
e of
the
follo
win
g: h
ousi
ng
reha
bilit
atio
n an
d re
mov
als,
indu
stria
l pol
lute
d la
nd c
lean
up,
envi
ronm
enta
l cle
anup
, com
mun
ity c
orrid
or c
onne
ctio
ns,
corr
idor
pla
nnin
g, a
cqui
sitio
n of
pro
pert
y, d
evel
opm
ent a
nd
rede
velo
pmen
t of h
ousi
ng a
nd e
xist
ing
com
mer
cial
pro
ject
s,
and
job
crea
tion.
The
TO
D p
rogr
am h
as g
ener
ated
mor
e th
an 2
,000
ho
me-
owne
rshi
p un
its a
nd 1
,000
ren
tal u
nits
and
le
vera
ged
$30
mill
ion
in p
rivat
e fin
anci
ng. I
n 20
05, 5
42
mar
ket r
ate
units
bui
lt w
ith T
OD
gra
nts
and
216
affo
rdab
le u
nits
. In
2003
ther
e w
ere
only
68
affo
rdab
le
units
bui
lt w
ith th
ese
fund
s, a
nd 5
04 m
arke
t rat
e un
its.
Su
pp
ort
ive
Ho
usi
ng
In
itia
tive
Fu
nd
(S
HIF
) C
ount
yD
evel
oper
s &
C
ities
X
X
SH
IF fu
nds
are
used
to a
ddre
ss o
ne-t
ime
and
time-
limite
d ga
ps in
sup
port
ive
hous
ing
serv
ices
for
both
pro
ject
and
co
mm
unity
bas
ed a
fford
able
hou
sing
initi
ativ
es. I
t coo
rdin
ates
ho
usin
g w
ith tr
ansi
t, em
ploy
men
t and
soc
ial s
ervi
ces
to h
elp
build
sel
f-re
lianc
e an
d ho
usin
g st
abili
ty fo
r in
divi
dual
s an
d fa
mili
es.
Cas
e m
anag
emen
t ser
vice
s fo
r re
side
nts,
voc
atio
nal
educ
atio
n
Fam
ily A
ffo
rdab
le
Ho
usi
ng
Pro
gra
mM
etro
polit
an C
ounc
ilH
ouse
hold
s
X
X
X
X
Pro
gram
giv
es fa
mili
es w
ith lo
w in
com
es th
e op
port
unity
to li
ve
in n
eigh
borh
oods
out
side
are
as w
ith h
igh
leve
ls o
f pov
erty
. At
leas
t 40%
of u
nits
mus
t be
to h
ouse
hold
s w
ith in
com
es b
elow
30
% A
MI;
the
rem
aind
er to
hou
seho
lds
with
80%
AM
I or
belo
w. C
ities
whe
re h
omes
are
loca
ted
mus
t hav
e af
ford
able
re
ntal
hou
sing
in th
eir
com
preh
ensi
ve p
lans
.
Liv
ab
le
Co
mm
un
itie
s A
cco
un
t (L
CA
)
Met
ropo
litan
C
ounc
il, w
ith S
tate
fu
nds
Citi
es
X
X
XT
he A
ct is
a v
olun
tary
, inc
entiv
e-ba
sed
appr
oach
to h
elp
the
Tw
in C
ities
met
ropo
litan
are
a ad
dres
s af
ford
able
and
life
cycl
e ho
usin
g ne
eds
whi
le p
rovi
ding
fund
s to
com
mun
ities
to a
ssis
t th
em in
car
ryin
g ou
t the
ir de
velo
pmen
t pla
ns. F
unds
are
use
d to
cle
an u
p po
llute
d la
nd fo
r re
deve
lopm
ent,
new
jobs
and
af
ford
able
hou
sing
, cre
ate
deve
lopm
ent o
r re
deve
lopm
ent t
hat
dem
onst
rate
s ef
ficie
nt u
se o
f lan
d an
d in
fras
truc
ture
thro
ugh
conn
ecte
d de
velo
pmen
t pat
tern
s, c
reat
e af
ford
able
hou
sing
op
port
uniti
es.
The
Act
fund
s ha
ve le
vera
ged
mill
ions
of a
dditi
onal
do
llars
in p
rivat
e an
d pu
blic
inve
stm
ent t
hat h
as
prov
ided
new
jobs
, hou
sing
cho
ices
, and
bus
ines
s gr
owth
. The
Act
has
res
ulte
d in
mor
e th
an 2
0,50
0 ne
w
and
600
reha
bilit
ated
hou
sing
uni
ts. M
ore
than
1,7
00
new
ren
tal u
nits
with
the
vast
bei
ng a
fford
able
to lo
w
inco
me
hous
ehol
ds.
Lo
cal
Ho
usi
ng
In
cen
tive A
cco
un
t (L
HIA
)
Met
ropo
litan
C
ounc
il, w
ith S
tate
fu
nds
Citi
es
X
X
X
The
goa
ls o
f the
Loc
al H
ousi
ng In
cent
ive
Acc
ount
(LH
IA)
are
to h
elp
crea
te a
nd p
rese
rve
affo
rdab
le r
enta
l and
ow
ners
hip
hous
ing
thro
ugho
ut th
e re
gion
for
low
- an
d m
oder
ate-
inco
me
hous
ehol
ds a
t all
of li
fe's
sta
ges,
and
to s
uppo
rt r
esid
entia
l re
inve
stm
ent a
nd r
edev
elop
men
t to
achi
eve
econ
omic
ally
he
alth
y an
d liv
able
com
mun
ities
. Thi
s pr
ogra
m is
con
duct
ed in
co
ordi
natio
n w
ith th
e M
inne
sota
Hou
sing
Fin
ance
Age
ncy.
Haz
elw
ood
Ter
race
, St.
Pau
l Gra
nt A
war
d -
$150
,000
in
200
5. F
undi
ng w
ill p
rovi
de fo
r th
e re
nova
tion
of n
ine
build
ings
sla
ted
for
rede
velo
pmen
t, in
clud
ing
99 u
nits
of
the
Am
es L
ake
Nei
ghbo
rhoo
d. T
wen
ty o
f the
uni
ts w
ill
be a
fford
able
to h
ouse
hold
s at
or
belo
w 5
0 pe
rcen
t of
the
area
med
ian
inco
me,
with
10
of th
ose
units
av
aila
ble
to h
ouse
hold
s at
30
perc
ent o
f are
a m
edia
n in
com
e. S
ixty
-one
uni
ts w
ill b
e af
ford
able
to h
ouse
hold
s at
60
perc
ent o
f are
a m
edia
n in
com
e, a
nd 1
8 of
the
units
will
be
mar
ket r
ate.
Ren
ts (
incl
udin
g ut
ilitie
s) w
ill
Tax B
ase
R
evit
ali
zati
on
A
cco
un
t (T
BR
A)
Met
ropo
litan
C
ounc
il, w
ith S
tate
fu
nds
Dev
elop
ers
X
The
Acc
ount
is u
sed
for
clea
ning
up
pollu
ted
land
for
rede
velo
pmen
t and
cre
ates
jobs
. The
Acc
ount
is d
irect
ed to
ce
ntra
l citi
es a
nd o
lder
sub
urbs
whe
re c
ostly
infr
astr
uctu
re li
ke
road
s an
d se
wer
s is
alre
ady
in p
lace
. Thi
s pr
ogra
m is
co
nduc
ted
in c
oord
inat
ion
with
the
Min
neso
ta D
epar
tmen
t of
Tra
de a
nd E
cono
mic
Dev
elop
men
t.
Blo
omin
gton
Cor
pora
te C
ente
r G
rant
Aw
ard:
$73
6,00
0 in
200
2 to
hel
p re
mov
e as
best
os a
nd h
azar
dous
m
ater
ials
from
bui
ldin
gs o
n th
e fo
rmer
Con
trol
Dat
a ca
mpu
s so
uth
of th
e M
inne
apol
is-S
t. P
aul I
nter
natio
nal
Airp
ort.
Dem
oliti
on o
f the
thre
e bu
ildin
gs w
ill m
ake
way
fo
r a
futu
re h
ighe
r-de
nsity
, mix
ed-u
se d
evel
opm
ent w
ith
hous
ing,
offi
ce s
pace
, a h
otel
/exh
ibiti
on h
all a
nd tw
o pa
rkin
g ra
mps
. The
Mal
l of A
mer
ica
and
plan
ned
light
-ra
il tr
ansi
t are
nea
rby.
Sm
art
Co
mm
ute
M
ort
gag
e
Met
ropo
litan
Cou
ncil
and
Fan
nie
Mae
th
roug
h B
rem
er
Ban
k
Hou
seho
lds
with
in a
1/4
m
ile o
f pub
lic
tran
sit r
oute
X
x
x
Low
dow
npay
men
t pro
gram
(3%
) an
d cr
edit
unde
rwrit
ing
proc
ess
for
an a
dditi
onal
$2,
400
in in
com
e at
ttrib
utab
le to
re
gula
r tr
ansi
t use
. If h
ouse
hold
is lo
cate
d in
Mpl
s E
nter
pris
e Z
one,
up
to $
2,50
0 cl
osin
g co
st a
ssis
tanc
e. F
ree
tran
sit p
ass
for
one
year
.
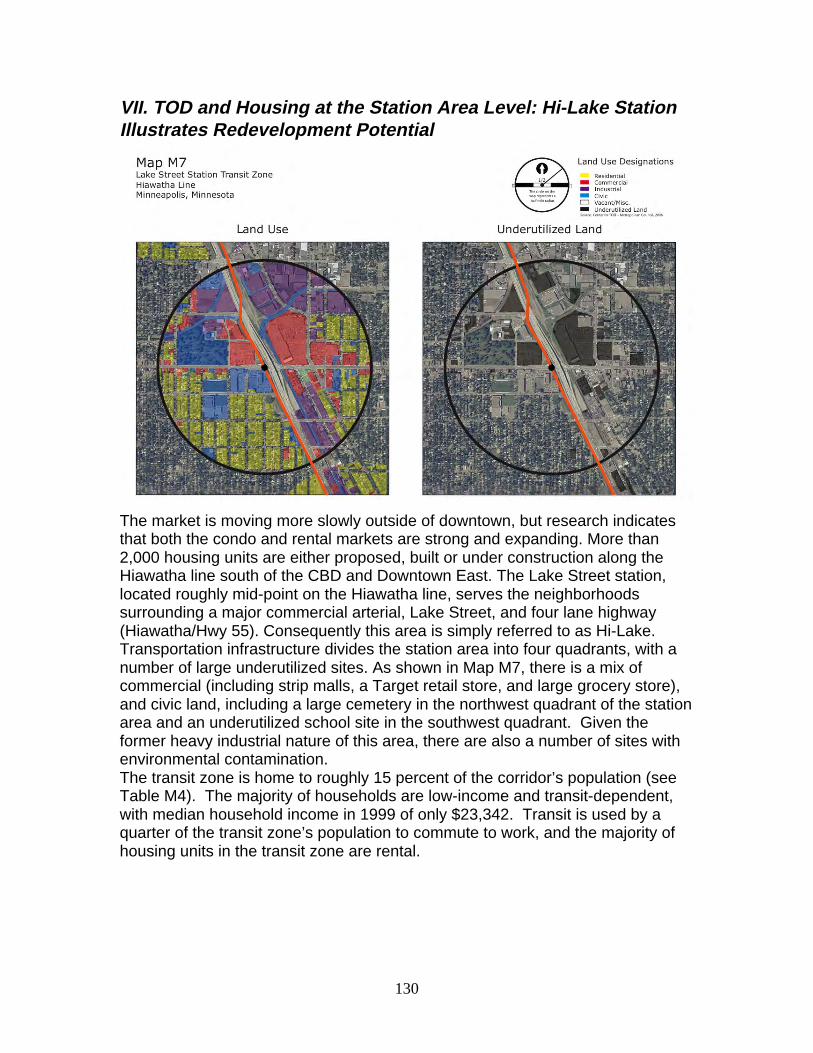
130
VII. TOD and Housing at the Station Area Level: Hi-Lake StationIllustrates Redevelopment Potential
The market is moving more slowly outside of downtown, but research indicatesthat both the condo and rental markets are strong and expanding. More than2,000 housing units are either proposed, built or under construction along theHiawatha line south of the CBD and Downtown East. The Lake Street station,located roughly mid-point on the Hiawatha line, serves the neighborhoodssurrounding a major commercial arterial, Lake Street, and four lane highway(Hiawatha/Hwy 55). Consequently this area is simply referred to as Hi-Lake.Transportation infrastructure divides the station area into four quadrants, with anumber of large underutilized sites. As shown in Map M7, there is a mix ofcommercial (including strip malls, a Target retail store, and large grocery store),and civic land, including a large cemetery in the northwest quadrant of the stationarea and an underutilized school site in the southwest quadrant. Given theformer heavy industrial nature of this area, there are also a number of sites withenvironmental contamination.The transit zone is home to roughly 15 percent of the corridor’s population (seeTable M4). The majority of households are low-income and transit-dependent,with median household income in 1999 of only $23,342. Transit is used by aquarter of the transit zone’s population to commute to work, and the majority ofhousing units in the transit zone are rental.
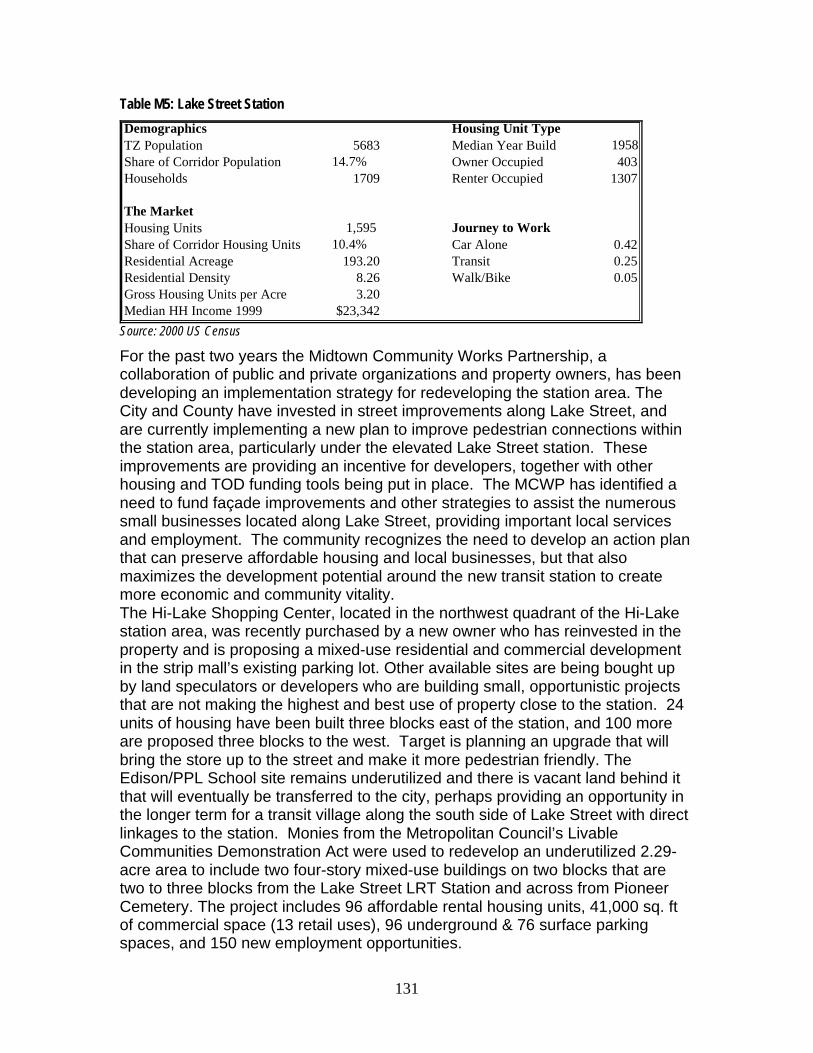
131
Table M5: Lake Street Station
Demographics Housing Unit TypeTZ Population 5683 Median Year Build 1958Share of Corridor Population 14.7% Owner Occupied 403Households 1709 Renter Occupied 1307
The MarketHousing Units 1,595 Journey to WorkShare of Corridor Housing Units 10.4% Car Alone 0.42Residential Acreage 193.20 Transit 0.25Residential Density 8.26 Walk/Bike 0.05Gross Housing Units per Acre 3.20Median HH Income 1999 $23,342
Source: 2000 US Census
For the past two years the Midtown Community Works Partnership, acollaboration of public and private organizations and property owners, has beendeveloping an implementation strategy for redeveloping the station area. TheCity and County have invested in street improvements along Lake Street, andare currently implementing a new plan to improve pedestrian connections withinthe station area, particularly under the elevated Lake Street station. Theseimprovements are providing an incentive for developers, together with otherhousing and TOD funding tools being put in place. The MCWP has identified aneed to fund façade improvements and other strategies to assist the numeroussmall businesses located along Lake Street, providing important local servicesand employment. The community recognizes the need to develop an action planthat can preserve affordable housing and local businesses, but that alsomaximizes the development potential around the new transit station to createmore economic and community vitality.The Hi-Lake Shopping Center, located in the northwest quadrant of the Hi-Lakestation area, was recently purchased by a new owner who has reinvested in theproperty and is proposing a mixed-use residential and commercial developmentin the strip mall’s existing parking lot. Other available sites are being bought upby land speculators or developers who are building small, opportunistic projectsthat are not making the highest and best use of property close to the station. 24units of housing have been built three blocks east of the station, and 100 moreare proposed three blocks to the west. Target is planning an upgrade that willbring the store up to the street and make it more pedestrian friendly. TheEdison/PPL School site remains underutilized and there is vacant land behind itthat will eventually be transferred to the city, perhaps providing an opportunity inthe longer term for a transit village along the south side of Lake Street with directlinkages to the station. Monies from the Metropolitan Council’s LivableCommunities Demonstration Act were used to redevelop an underutilized 2.29-acre area to include two four-story mixed-use buildings on two blocks that aretwo to three blocks from the Lake Street LRT Station and across from PioneerCemetery. The project includes 96 affordable rental housing units, 41,000 sq. ftof commercial space (13 retail uses), 96 underground & 76 surface parkingspaces, and 150 new employment opportunities.
132
VII. Opportunities, Obstacles & Lessons: Development Response to TransitInvestments Can Be Difficult to AnticipateThe Minnesota light rail experience provides some fascinating observations andconclusions. Local city planners will be the first to say that the positive responseto light rail by riders and developers has far exceeded their expectations.Planning for success is an extremely important lesson for local governments whoare often not fully engaged in early project development and engineering, butwho will play a critical role in the line’s ultimate success and in addressing thechallenges that face communities after opening day.
Major Opportunities for Mixed-Income Housing near Transit
• Transitioning Industrial Space Near Downtown; Strong Urban HousingMarketMuch of the recent development activity along the Hiawatha Line is located aroundthe four stations in Downtown. The investment in the light rail bolstered marketmomentum towards the conversion of a formerly industrial area to higher densityresidential and mixed use, and the integration of mid and high rise condominiumtowers into the broader Downtown. The result is development oriented towardstransit, greater activity throughout the day and evening, and a more walkable, vibrantplace to live and work.
• Well-established Bus Transit Ridership Prior to Building of Light RailPrior to the building of the Hiawatha Line, a significant proportion of commute tripsin the station areas were conducted by bus transit or walking (17 percent and 15percent, respectively). The familiarity of the local population with transit helpedbolster ridership on the Hiawatha to projected 2025 levels within two years ofopening.
• Corridors that Link Regional Destinations Contain Powerful Ridershipand Development Potential.The ability of the Hiawatha Corridor to link suburban and urban commuters todowntown jobs, sports and theater events, medical treatment, and major retail andopen space destinations has been central to the line’s success. Integrating the travelneeds of urban neighborhoods with suburban commuters has resulted in a dynamicline with ridership throughout the day and week. The region identified proximity totransit as an important factor in building a new baseball stadium near the proposedNorthstar Commuter Rail line. The ridership characteristics associated withdestinations like sports stadiums and airports is not well captured by currenttransportation models, yet they comprise an important part of this line’s success bothin terms of generating ridership, but also in terms of generating interest bydevelopers. Proximity to these regional attractions, now better connected throughtransit, positively impact land values and real estate potential.
133
• Station Area Planning and Active Community Participation Already inPlace to Guide Future Development.The City of Minneapolis and Met Council took early steps to support localplanning efforts along the corridor. The City’s Corridor Housing Initiative,Pedestrian Overlay District, and Station Area Rezoning efforts provideinformation and opportunity to engage neighborhoods in definingredevelopment, identifying needed zoning changes, and understanding thelinkages between density, design, affordability, and transit-orienteddevelopment. Strong and active neighborhood organizations and communitydevelopment corporations exist along the corridor and remain active inapproving future development and ensuring that community goals areachieved.
Obstacles
• Very High Proportion of Existing Civic Land Uses in CorridorOver fifty percent of existing land uses along the corridor are classified as civic. Thepreponderance of civic uses is both a potential obstacle and an opportunity: civicowners should have more resources and more of a mandate to consider transitamenities in redeveloping their properties, but civic uses tend to be more fixed, arecomplicated to redevelop and are challenging to integrate with other uses. Civicowners and uses are also often indifferent to market influences and can be very slowin moving forward with planning and development. In particular, the three stationsthat are unincorporated federal territories have essentially no redevelopment potentialas one is a national historic site and the other two are airport serving.
• Multiple Jurisdictions Require Greater Regional CoordinationIn addition to connecting two cities, the line also includes the metropolitan airportauthority and federal government. Strategic planning for balanced and inter-relatedland uses along the line is complicated by these divisions. The Metropolitan Council,as regional government, can play a role in addressing the coordination oftransportation and affordable housing along the alignment. Housing andtransportation challenges are regional in nature and can greatly benefit from effortsthat better coordinate the policies and tools being developed by local jurisdictions,including county governments. The Metropolitan Council, as the regional entity thatplays both a housing and transportation role, may be uniquely positioned to identifywhere gaps may exist and to help citizens and developers better navigate publicresources to preserve and create mixed-income housing near transit.
Lessons from the Corridor for Other Places
• Better Government Coordination During the Planning and DesignPhasesThe State Department of Transportation played a critical role in the engineering,design and construction of the Hiawatha Light Rail line. While they quickly met thechallenge of successfully building a new form of transportation in the region, stronger
134
inclusion of local city staff, community residents, and the private sector could havehelped in siting some critical infrastructure. The location and design of the FranklinAvenue station, for instance, which limits neighborhood access and includes majorutilities, limits redevelopment opportunity at this site and creates a significant costbarrier. Similarly, efforts are underway at the Hi-Lake station to make necessarypedestrian improvements to improve the access and safety of this area. Further alongthe corridor, neighborhoods are exploring ways to provide better pedestrian accessand connectivity across the four-lane Hiawatha Highway that separates stations,located on the western right-of-way from neighborhoods located to the east. Thealignment also resulted in some irregularly shaped land parcels that by themselveswill be difficult to redevelop as TOD without some larger land assembly assistance.
• Planning for Success and Proactively Addressing NeighborhoodChangeThe majority of new development projects have thus far focused on the Downtownarea given redevelopment opportunity and market momentum. Public intervention tomaintain and provide new affordable housing opportunity is warranted if the marketmoves south into the low-income neighborhoods of Seward, Longfellow and Phillips.These communities have pockets of concentrated poverty and could benefit fromstrategies to build more mixed-income neighborhoods. The City and County shouldseize the opportunity to capture the value created by TOD and the market momentumto address concentrated poverty and to provide more affordable housing. Such astrategy requires policy tools that engage the private sector, and also a publiccommitment of funds for gap financing, rental subsidies, or other incentives beforesubstantial redevelopment occurs. While recent development trends do not indicatethat displacement is taking place yet in these neighborhoods, public, private and non-profit partners do need to develop coordinated policies to ensure equitabledevelopment along the corridor.
• Capitalize on Market Strength to Leverage Community BenefitsIn downtown Minneapolis, 66 new projects have been planned or built since 2003.Forty-five of these are residential and seven contain some number of income-restricted and rent-subsidized units. While impact fees are illegal in Minnesota, it ispossible to leverage community benefits from large development projects throughdeveloper agreements that link changes in use (i.e. increased density) and otherentitlements to local community investments such as affordable housing. These typesof programs need to be put in place prior to major rezoning and coordinated withpublic infrastructure improvements to be successful.
• Create Incentives for More Compact Development and Inclusion ofAffordable HousingSuccessful transit-oriented development requires large-scale projects as well assmaller infill projects in order to bring density, pedestrian activity, and mixed-useactivities to neighborhoods. A high percentage of future development along thecorridor will be on smaller parcels, much of it infill development. For these sites,density bonuses associated with community benefits such as inclusion of affordablehousing units, green building techniques, preservation or creation of open space, and
135
sidewalk/streetscape improvements should be pursued. Such a strategy has beensuccessfully used in a number of communities to capture the value of TOD andensure that new development helps to build stronger neighborhoods benefiting newand existing residents. Providing incentives for increased density is a powerful way toalso generate additional transit ridership and should be coordinated with reducedparking requirements for TOD projects.
• Regional Leadership on Housing and Transit is Necessary Ingredient forLong-Term SuccessAs the Twin Cities region seeks to make additional investments in fixed guidewaytransit, tremendous potential exists to meet the projected increased demand forhousing near transit. However, retrofitting a region with transit service anddevelopment oriented towards transit requires tools and strategies beyond what anyone jurisdiction can provide. A number of different regional actors are steppingforward to provide important pieces of the puzzle, but stronger regional coordinationof investments and policies is important to the overall efficacy of transit-orienteddevelopment.
The next chapter discusses mixed-income TOD efforts occurring withinPortland’s streetcar corridor, connecting the Pearl District to the South Waterfrontarea via downtown and Portland State University.
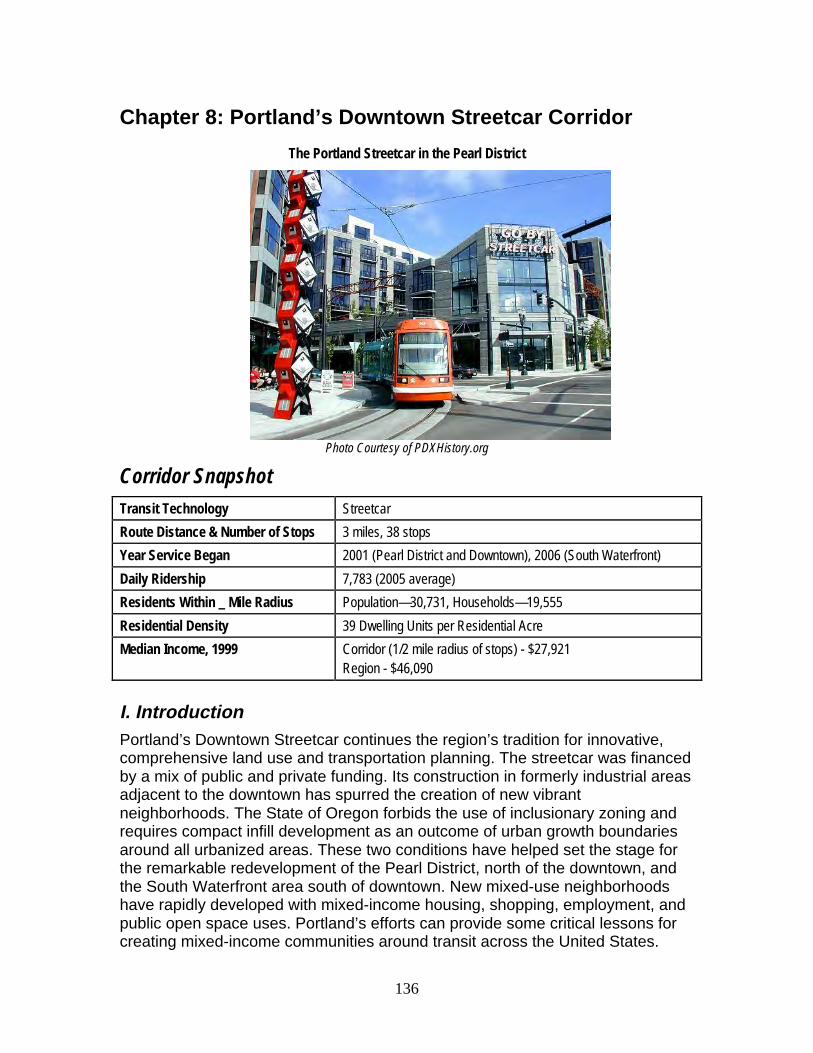
136
Chapter 8: Portland’s Downtown Streetcar CorridorThe Portland Streetcar in the Pearl District
Photo Courtesy of PDXHistory.org
Corridor Snapshot
Transit Technology Streetcar
Route Distance & Number of Stops 3 miles, 38 stops
Year Service Began 2001 (Pearl District and Downtown), 2006 (South Waterfront)
Daily Ridership 7,783 (2005 average)
Residents Within _ Mile Radius Population—30,731, Households—19,555
Residential Density 39 Dwelling Units per Residential Acre
Median Income, 1999 Corridor (1/2 mile radius of stops) - $27,921Region - $46,090
I. IntroductionPortland’s Downtown Streetcar continues the region’s tradition for innovative,comprehensive land use and transportation planning. The streetcar was financedby a mix of public and private funding. Its construction in formerly industrial areasadjacent to the downtown has spurred the creation of new vibrantneighborhoods. The State of Oregon forbids the use of inclusionary zoning andrequires compact infill development as an outcome of urban growth boundariesaround all urbanized areas. These two conditions have helped set the stage forthe remarkable redevelopment of the Pearl District, north of the downtown, andthe South Waterfront area south of downtown. New mixed-use neighborhoodshave rapidly developed with mixed-income housing, shopping, employment, andpublic open space uses. Portland’s efforts can provide some critical lessons forcreating mixed-income communities around transit across the United States.
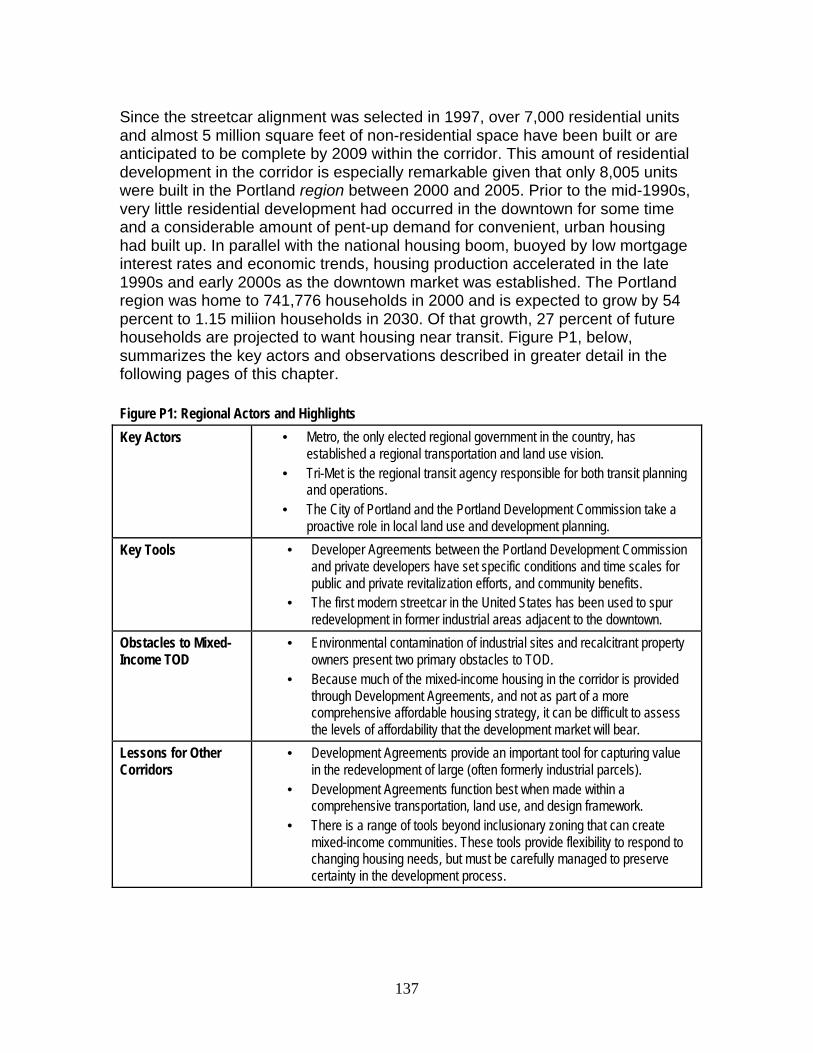
137
Since the streetcar alignment was selected in 1997, over 7,000 residential unitsand almost 5 million square feet of non-residential space have been built or areanticipated to be complete by 2009 within the corridor. This amount of residentialdevelopment in the corridor is especially remarkable given that only 8,005 unitswere built in the Portland region between 2000 and 2005. Prior to the mid-1990s,very little residential development had occurred in the downtown for some timeand a considerable amount of pent-up demand for convenient, urban housinghad built up. In parallel with the national housing boom, buoyed by low mortgageinterest rates and economic trends, housing production accelerated in the late1990s and early 2000s as the downtown market was established. The Portlandregion was home to 741,776 households in 2000 and is expected to grow by 54percent to 1.15 miliion households in 2030. Of that growth, 27 percent of futurehouseholds are projected to want housing near transit. Figure P1, below,summarizes the key actors and observations described in greater detail in thefollowing pages of this chapter.
Figure P1: Regional Actors and Highlights
Key Actors • Metro, the only elected regional government in the country, hasestablished a regional transportation and land use vision.
• Tri-Met is the regional transit agency responsible for both transit planningand operations.
• The City of Portland and the Portland Development Commission take aproactive role in local land use and development planning.
Key Tools • Developer Agreements between the Portland Development Commissionand private developers have set specific conditions and time scales forpublic and private revitalization efforts, and community benefits.
• The first modern streetcar in the United States has been used to spurredevelopment in former industrial areas adjacent to the downtown.
Obstacles to Mixed-Income TOD
• Environmental contamination of industrial sites and recalcitrant propertyowners present two primary obstacles to TOD.
• Because much of the mixed-income housing in the corridor is providedthrough Development Agreements, and not as part of a morecomprehensive affordable housing strategy, it can be difficult to assessthe levels of affordability that the development market will bear.
Lessons for OtherCorridors
• Development Agreements provide an important tool for capturing valuein the redevelopment of large (often formerly industrial parcels).
• Development Agreements function best when made within acomprehensive transportation, land use, and design framework.
• There is a range of tools beyond inclusionary zoning that can createmixed-income communities. These tools provide flexibility to respond tochanging housing needs, but must be carefully managed to preservecertainty in the development process.
138
II. Modern Streetcar Supports Housing and RedevelopmentEffortPortland’s central city, particularly the neighborhood known as the Pearl District,has undergone a major transformation since 1990. The Pearl District lies east ofthe I-405 freeway and west of the North Park Blocks and runs north fromBurnside Street to the Willamette River. Land uses have both diversified andintensified in the past two decades. The Portland Streetcar has played asignificant role in this transformation. Physically, the streetcar has enabled agreater density of development with lower parking ratios. Psychologically, theselection of the streetcar alignment in 1997 is pointed to by many as the keyturning point in pushing development to a greater level of urbanism.The Portland Streetcar is the first modern streetcar system to be built in theUnited States. As a part of Portland’s broader strategy to improve mass transitthroughout the region, the streetcar was built as a downtown circulator (see MapP1, next page for an overview of the regional transit rail network). The initial 2.4mile segment of the line was completed in 2001 and subsequently extendedtwice: first to River Place south of downtown, and then to the South Waterfrontarea. The line now has 38 closely spaced stations, each a few blocks apart,allowing the streetcar to serve as a “pedestrian accelerator” and resulting in morewalking trips and less demand for parking. During the spring of 2006, averageweekday ridership exceeded 7,000, almost double the ridership number in 2001.As a transit application, the Portland Streetcar is smaller than typical light railvehicles, but still use overhead electrical wires. Vehicles operate on the streetmixed with traffic. Headways are short to medium in length and projectedridership is lower than other types of larger-capacity rail investments servinglonger distances. Journey-to-work travel within the streetcar district consistslargely of transit and walking trips (30 percent) without many auto trips (40percent of total), verifying the circulatory role it plays both within the downtownarea and between other transit options.Portland used creative approaches to fund the streetcar construction. The cost ofparking was increased from 75 cents to 95 cents per hour and the city issuedbonds backed by future parking revenues to raise $28.5 million. Property ownersalong the alignment agreed to form a local improvement district (LID), whichprovided another $10 million. Tax increment financing contributed $7.5 million,and a mix of other sources provided another $11 million.The streetcar connects major destinations within the central city, includingPortland State University and Good Samaritan Hospital, and links to the regionallight rail and bus system. In 2006 streetcar service was extended to the SouthWaterfront, another abandoned industrial site like the Pearl District but locatedsouth of downtown, in order to improve connectivity. While the Pearl District wasbeing called this country’s most successful redevelopment project, SouthWaterfront is almost double the size with twice the potential. Construction wasalready underway in 2006 on the first neighborhood, the $2 billion CentralDistrict, covering 31 acres. The South Waterfront is now connected to theOregon Health and Sciences University atop a nearby hill via aerial tram.
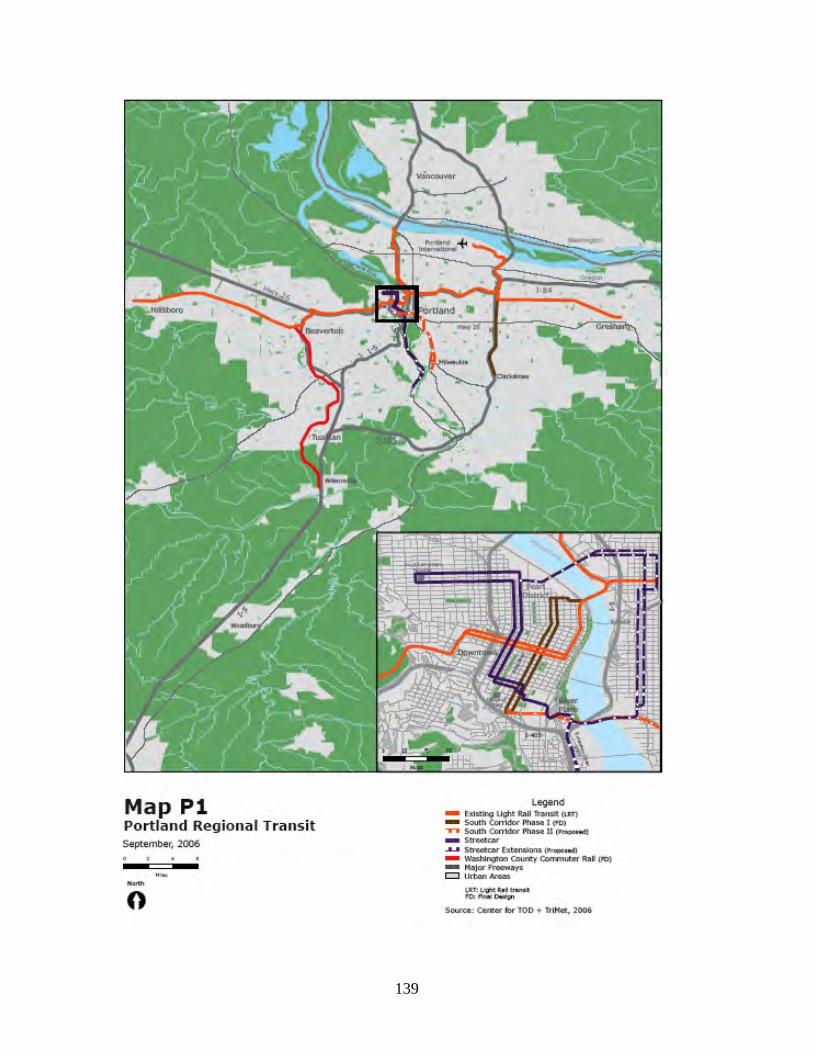
139
140
III. Strong Regional Market Leads to Rising Housing PricesBetween 2000 and 2005 the Portland region added 8,005 housing units, whileoccupancy rates remained relatively steady during that time period.1 During thesame period, median housing prices increased by $71,000 to $225,900; a 46percent increase2. This increase in cost is reflected in the number of householdsspending 30 percent or more of their income on housing. The percentage ofproperty owners in Portland spending that amount increased to more than 30percent in 2005, up from less than 28 percent in 2000. Renters weredisproportionately affected by the increases. In 2005, almost 53 percent ofrenters in the region spent more than 30 percent of their household income onhousing3. Some researchers contend that housing costs have increased becausethe urban growth boundary has limited the land supply in the region. Regardless,Portland’s housing prices are within the lower range of average home prices forWest Coast cities.The State’s Metropolitan Housing Rule requires jurisdictions to set aside enoughbuildable land so that at least 50 percent of new residential units are attachedsingle-family housing or multiple-family housing, or to justify an alternativepercentage based on their particular circumstances. This rule, coupled withdecreasing household size and increasing market demand for urban living, hascaused an increase in the availability of multi-family housing. However, the Statealso adopted legislation forbidding inclusionary zoning. Thus, there’s noregulatory mechanism to impose mixed-income requirements on newdevelopment.
The Portland Development Commission (PDC) consistently and effectively usedland acquisition, public investments, and development agreements to forgepublic-private partnerships and achieve ambitious planning goals. These includethe production of affordable housing, transit, and transit-oriented development aswell as economic development and urban recreation. Most of the central city isincluded in one of several urban renewal areas and most new development hasbenefited from PDC investment either directly or indirectly.
IV. “Perfect Storm” of Transit, Land Use, and Market ReadinessFuels Redevelopment of Streetcar CorridorThe streetcar wasn’t solely responsible for leveraging the tremendous amount ofdevelopment that occurred in the Pearl District. Rather, the streetcar is part of a“perfect storm” of planning and policy, development opportunities, and public-private investment. The following sections describe previous and current landuses, underutilized land, demographic characteristics, market conditions, localland use regulations, and transit-oriented development and affordable housingpolicies that have shaped downtown Portland’s transformation.
1 Harvard Joint Center for Housing Study, State of the Nation’s Housing 2005.2 Ibid.3 US Census, 2005 American Community Survey, Selected Housing Characteristics.
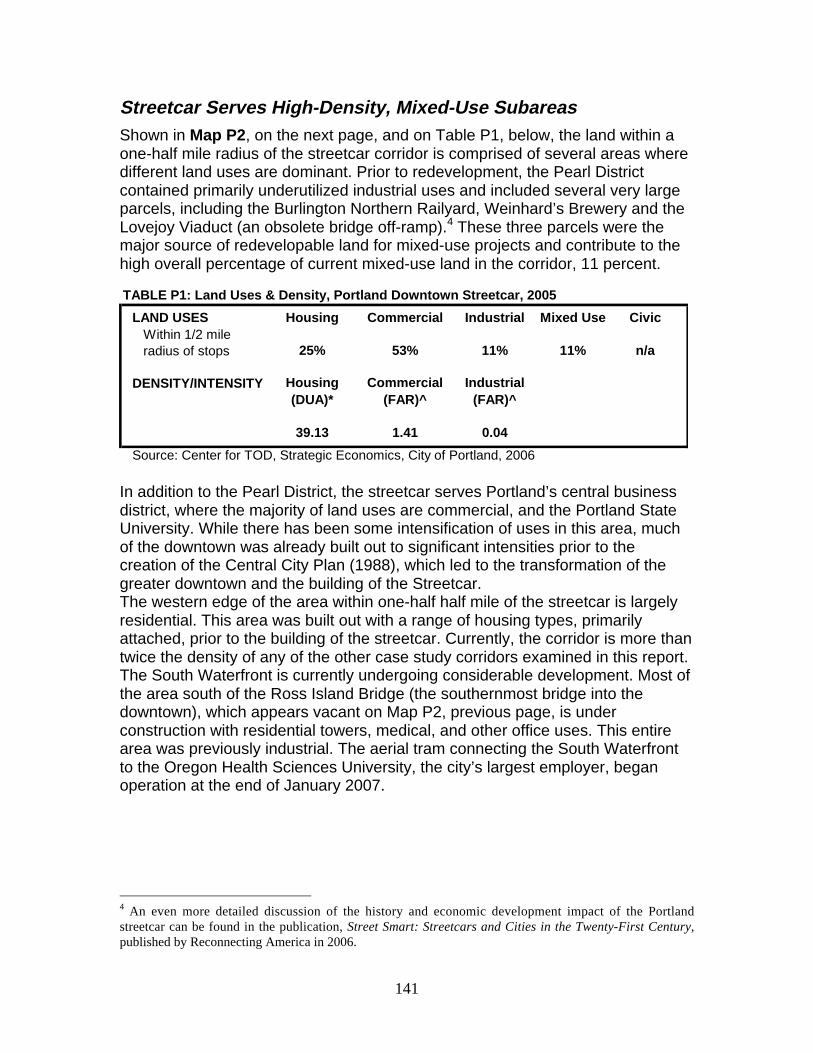
141
Streetcar Serves High-Density, Mixed-Use SubareasShown in Map P2, on the next page, and on Table P1, below, the land within aone-half mile radius of the streetcar corridor is comprised of several areas wheredifferent land uses are dominant. Prior to redevelopment, the Pearl Districtcontained primarily underutilized industrial uses and included several very largeparcels, including the Burlington Northern Railyard, Weinhard’s Brewery and theLovejoy Viaduct (an obsolete bridge off-ramp).4 These three parcels were themajor source of redevelopable land for mixed-use projects and contribute to thehigh overall percentage of current mixed-use land in the corridor, 11 percent.
In addition to the Pearl District, the streetcar serves Portland’s central businessdistrict, where the majority of land uses are commercial, and the Portland StateUniversity. While there has been some intensification of uses in this area, muchof the downtown was already built out to significant intensities prior to thecreation of the Central City Plan (1988), which led to the transformation of thegreater downtown and the building of the Streetcar.The western edge of the area within one-half half mile of the streetcar is largelyresidential. This area was built out with a range of housing types, primarilyattached, prior to the building of the streetcar. Currently, the corridor is more thantwice the density of any of the other case study corridors examined in this report.The South Waterfront is currently undergoing considerable development. Most ofthe area south of the Ross Island Bridge (the southernmost bridge into thedowntown), which appears vacant on Map P2, previous page, is underconstruction with residential towers, medical, and other office uses. This entirearea was previously industrial. The aerial tram connecting the South Waterfrontto the Oregon Health Sciences University, the city’s largest employer, beganoperation at the end of January 2007.
4 An even more detailed discussion of the history and economic development impact of the Portlandstreetcar can be found in the publication, Street Smart: Streetcars and Cities in the Twenty-First Century,published by Reconnecting America in 2006.
TABLE P1: Land Uses & Density, Portland Downtown Streetcar, 2005
LAND USES Housing Commercial Industrial Mixed Use Civic
25% 53% 11% 11% n/a
DENSITY/INTENSITY
39.13 1.41 0.04
Source: Center for TOD, Strategic Economics, City of Portland, 2006
Within 1/2 mile radius of stops
Commercial (FAR)^
Housing (DUA)*
Industrial (FAR)^
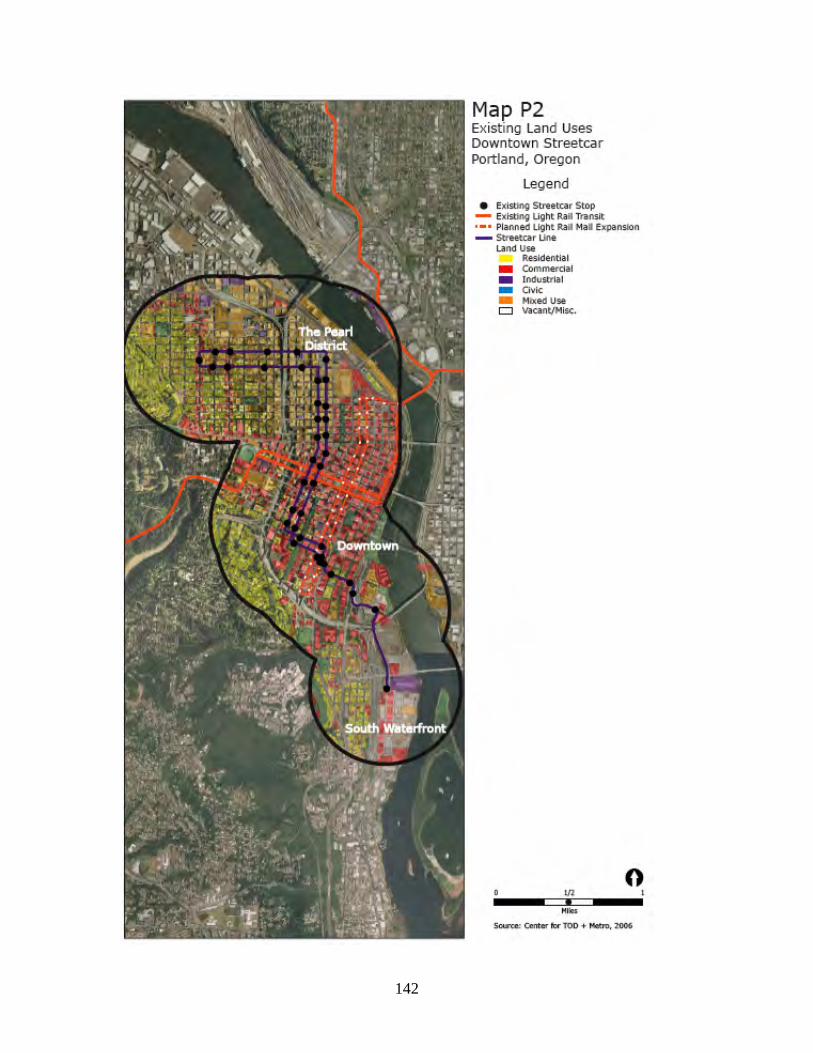
142
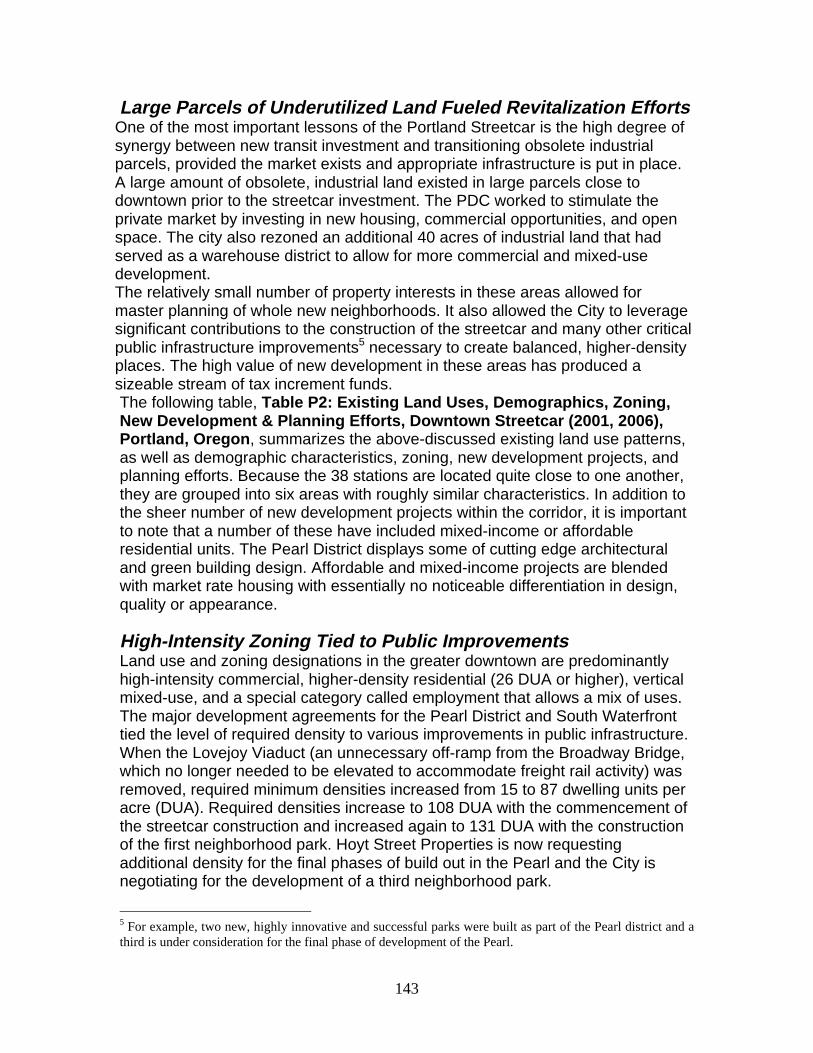
143
Large Parcels of Underutilized Land Fueled Revitalization EffortsOne of the most important lessons of the Portland Streetcar is the high degree ofsynergy between new transit investment and transitioning obsolete industrialparcels, provided the market exists and appropriate infrastructure is put in place.A large amount of obsolete, industrial land existed in large parcels close todowntown prior to the streetcar investment. The PDC worked to stimulate theprivate market by investing in new housing, commercial opportunities, and openspace. The city also rezoned an additional 40 acres of industrial land that hadserved as a warehouse district to allow for more commercial and mixed-usedevelopment.The relatively small number of property interests in these areas allowed formaster planning of whole new neighborhoods. It also allowed the City to leveragesignificant contributions to the construction of the streetcar and many other criticalpublic infrastructure improvements5 necessary to create balanced, higher-densityplaces. The high value of new development in these areas has produced asizeable stream of tax increment funds.The following table, Table P2: Existing Land Uses, Demographics, Zoning,New Development & Planning Efforts, Downtown Streetcar (2001, 2006),Portland, Oregon, summarizes the above-discussed existing land use patterns,as well as demographic characteristics, zoning, new development projects, andplanning efforts. Because the 38 stations are located quite close to one another,they are grouped into six areas with roughly similar characteristics. In addition tothe sheer number of new development projects within the corridor, it is importantto note that a number of these have included mixed-income or affordableresidential units. The Pearl District displays some of cutting edge architecturaland green building design. Affordable and mixed-income projects are blendedwith market rate housing with essentially no noticeable differentiation in design,quality or appearance.
High-Intensity Zoning Tied to Public ImprovementsLand use and zoning designations in the greater downtown are predominantlyhigh-intensity commercial, higher-density residential (26 DUA or higher), verticalmixed-use, and a special category called employment that allows a mix of uses.The major development agreements for the Pearl District and South Waterfronttied the level of required density to various improvements in public infrastructure.When the Lovejoy Viaduct (an unnecessary off-ramp from the Broadway Bridge,which no longer needed to be elevated to accommodate freight rail activity) wasremoved, required minimum densities increased from 15 to 87 dwelling units peracre (DUA). Required densities increase to 108 DUA with the commencement ofthe streetcar construction and increased again to 131 DUA with the constructionof the first neighborhood park. Hoyt Street Properties is now requestingadditional density for the final phases of build out in the Pearl and the City isnegotiating for the development of a third neighborhood park.
5 For example, two new, highly innovative and successful parks were built as part of the Pearl district and athird is under consideration for the final phase of development of the Pearl.

144
145
TABLE P2: Existing Land Uses, Demographics, Zoning, New Development & Planning Efforts, Downtown Streetcar (2001, 2006), Portland, Oregon
Grouped Stations (see Map P3)
Existing Land UsesKey Demographic
Indicators, 20001 Current ZoningRecent, Planned and
Proposed Development2 TOD Land Use Planning Efforts
Station Group #1 (Northwest Portland)
Vertical Mixed UseResidentialCorridor Retail
High Density Res Medium Density Res Vertical Mixed Use
5 projects total: 2 market-rate residential 1 MR mixed-use res 1 hotel 1 retail
Station Group #2 (Pearl District)
Vertical Mixed Use Residential
EmploymentDT Residential
21 projects total: 5 residential (1 affordable) 8 mixed-use residential (2 mixed income) 4 mixed-use office 1 retail 1 office 1 hotel 1 parking Station Group #3
(Pearl District)Vertical Mixed UseDT Commercial
EmploymentDT Commercial
20 projects total: 5 residential 8 mixed-use residential (1 affordable) 5 mixed-use office 1 mixed-use industrial 1 civic
Station Group #4 (CBD)
DT Commercial DT Commercial 8 projects total: 1 MU affordable res 5 civic 1 office 1 mixed-use office
Station Group #5 (Museum Blocks, Portland State U & CBD)
DT CommercialMedium Residential
DT Commercial High, Medium & Low Density Residential
19 projects total: 4 residential (1 affordable) 5 mixed-use residential (1 affordable, 1 mixed-income) 2 mixed-use office 7 civic 1 parking
Station Group #6 (RiverPlace & South Waterfront, 2006 Streetcar extension)
Vacant LandCommercialResidentialIndustrial
CommercialMedium Density Res Low Density Res Vertical Mixed Use Industrial
6 projects total: 4 mixed-use MR res 1 civic 1 hotel
Source: Strategic Economics, City of Portland, Portland Streetcar, Inc., 2006.
Numerous extensive and intensive planning and re-zoning project were conducted through out greater downtown Portland from the e. 1990s to e. 2000s in support of the streetcar improvements and creation of new downtown neighborhoods and job centers. Although many of the ultimate uses changed over time, the Central City Plan (1988) was the major comprehensive plan for the greater downtown that introduced the idea of significant intensification and expansion of the downtown into the adjacent industrial areas.
Median HH Income: $28,000% Owner-Occupied: 13% Average HH Size: 1.39
1Demographic characteristics are for the entire line, as stops are quite close to one another.2Projects included are within 2 blocks of a streetcar stop and were built, planned or proposed since 1997, when the alignment was chosen. Map P3 shows fewer projects than this matrix, as several projects are immediately adjacent to one another and overlap when mapped.
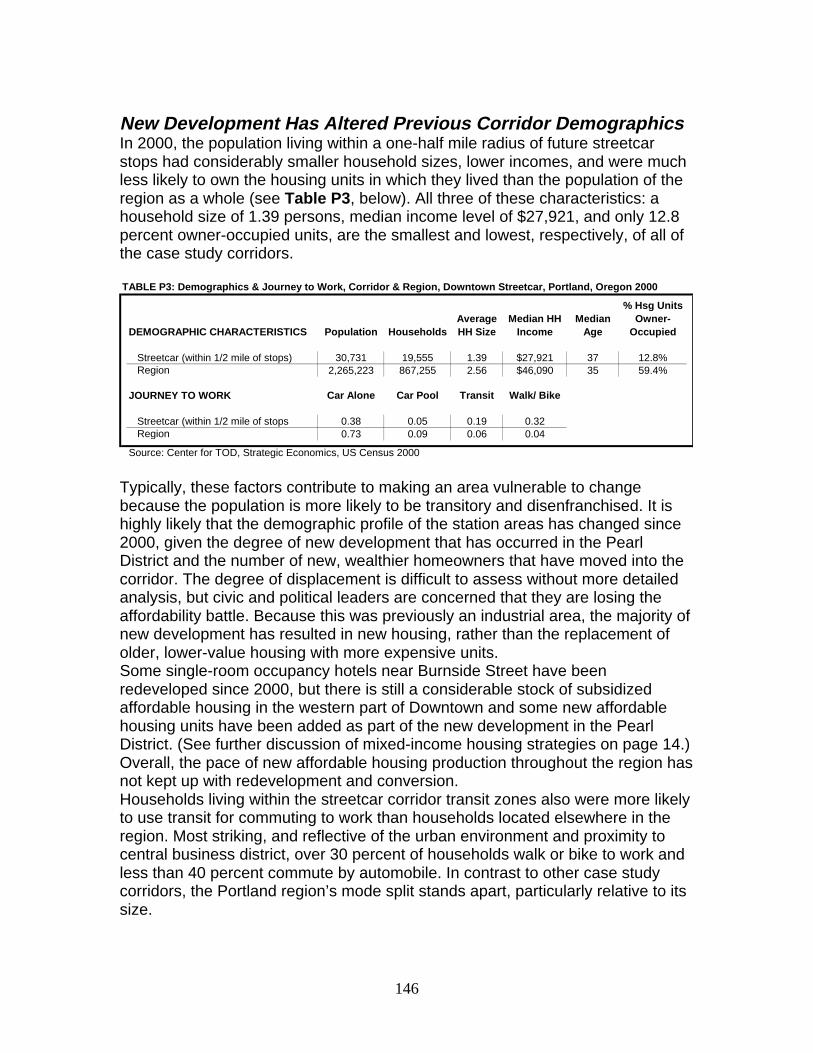
146
New Development Has Altered Previous Corridor DemographicsIn 2000, the population living within a one-half mile radius of future streetcarstops had considerably smaller household sizes, lower incomes, and were muchless likely to own the housing units in which they lived than the population of theregion as a whole (see Table P3, below). All three of these characteristics: ahousehold size of 1.39 persons, median income level of $27,921, and only 12.8percent owner-occupied units, are the smallest and lowest, respectively, of all ofthe case study corridors.
TABLE P3: Demographics & Journey to Work, Corridor & Region, Downtown Streetcar, Portland, Oregon 2000
DEMOGRAPHIC CHARACTERISTICS Population Households
Streetcar (within 1/2 mile of stops) 30,731 19,555 1.39 $27,921 37 12.8%Region 2,265,223 867,255 2.56 $46,090 35 59.4%
JOURNEY TO WORK Car Alone Car Pool Transit Walk/ Bike
Streetcar (within 1/2 mile of stops 0.38 0.05 0.19 0.32Region 0.73 0.09 0.06 0.04
Source: Center for TOD, Strategic Economics, US Census 2000
Average HH Size
Median HH Income
Median Age
% Hsg Units Owner-
Occupied
Typically, these factors contribute to making an area vulnerable to changebecause the population is more likely to be transitory and disenfranchised. It ishighly likely that the demographic profile of the station areas has changed since2000, given the degree of new development that has occurred in the PearlDistrict and the number of new, wealthier homeowners that have moved into thecorridor. The degree of displacement is difficult to assess without more detailedanalysis, but civic and political leaders are concerned that they are losing theaffordability battle. Because this was previously an industrial area, the majority ofnew development has resulted in new housing, rather than the replacement ofolder, lower-value housing with more expensive units.Some single-room occupancy hotels near Burnside Street have beenredeveloped since 2000, but there is still a considerable stock of subsidizedaffordable housing in the western part of Downtown and some new affordablehousing units have been added as part of the new development in the PearlDistrict. (See further discussion of mixed-income housing strategies on page 14.)Overall, the pace of new affordable housing production throughout the region hasnot kept up with redevelopment and conversion.Households living within the streetcar corridor transit zones also were more likelyto use transit for commuting to work than households located elsewhere in theregion. Most striking, and reflective of the urban environment and proximity tocentral business district, over 30 percent of households walk or bike to work andless than 40 percent commute by automobile. In contrast to other case studycorridors, the Portland region’s mode split stands apart, particularly relative to itssize.
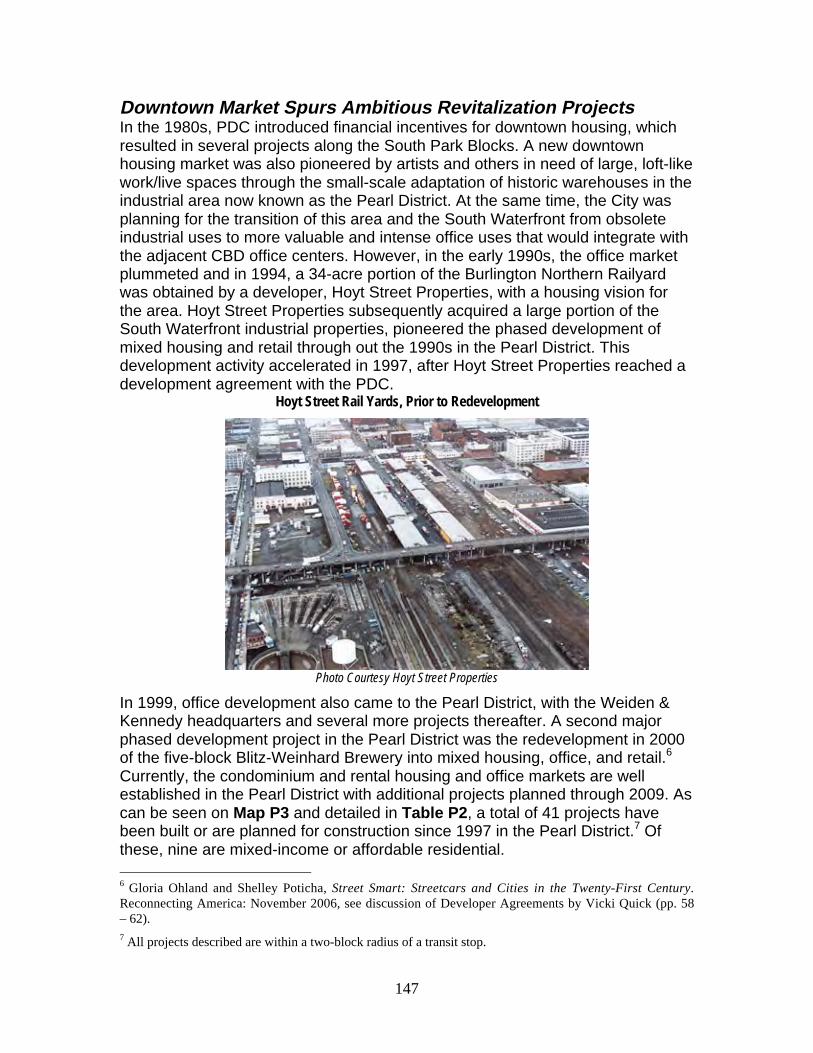
147
Downtown Market Spurs Ambitious Revitalization ProjectsIn the 1980s, PDC introduced financial incentives for downtown housing, whichresulted in several projects along the South Park Blocks. A new downtownhousing market was also pioneered by artists and others in need of large, loft-likework/live spaces through the small-scale adaptation of historic warehouses in theindustrial area now known as the Pearl District. At the same time, the City wasplanning for the transition of this area and the South Waterfront from obsoleteindustrial uses to more valuable and intense office uses that would integrate withthe adjacent CBD office centers. However, in the early 1990s, the office marketplummeted and in 1994, a 34-acre portion of the Burlington Northern Railyardwas obtained by a developer, Hoyt Street Properties, with a housing vision forthe area. Hoyt Street Properties subsequently acquired a large portion of theSouth Waterfront industrial properties, pioneered the phased development ofmixed housing and retail through out the 1990s in the Pearl District. Thisdevelopment activity accelerated in 1997, after Hoyt Street Properties reached adevelopment agreement with the PDC.
Hoyt Street Rail Yards, Prior to Redevelopment
Photo Courtesy Hoyt Street Properties
In 1999, office development also came to the Pearl District, with the Weiden &Kennedy headquarters and several more projects thereafter. A second majorphased development project in the Pearl District was the redevelopment in 2000of the five-block Blitz-Weinhard Brewery into mixed housing, office, and retail.6
Currently, the condominium and rental housing and office markets are wellestablished in the Pearl District with additional projects planned through 2009. Ascan be seen on Map P3 and detailed in Table P2, a total of 41 projects havebeen built or are planned for construction since 1997 in the Pearl District.7 Ofthese, nine are mixed-income or affordable residential. 6 Gloria Ohland and Shelley Poticha, Street Smart: Streetcars and Cities in the Twenty-First Century.Reconnecting America: November 2006, see discussion of Developer Agreements by Vicki Quick (pp. 58– 62).7 All projects described are within a two-block radius of a transit stop.

148
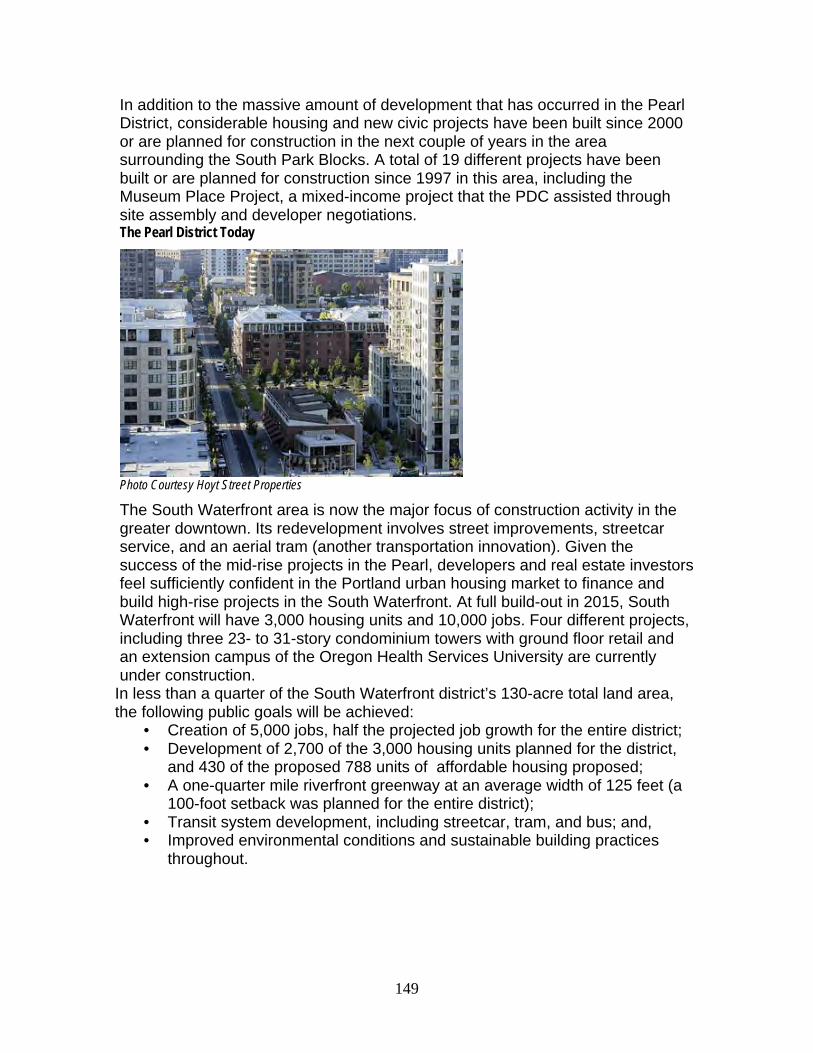
149
In addition to the massive amount of development that has occurred in the PearlDistrict, considerable housing and new civic projects have been built since 2000or are planned for construction in the next couple of years in the areasurrounding the South Park Blocks. A total of 19 different projects have beenbuilt or are planned for construction since 1997 in this area, including theMuseum Place Project, a mixed-income project that the PDC assisted throughsite assembly and developer negotiations.The Pearl District Today
Photo Courtesy Hoyt Street Properties
The South Waterfront area is now the major focus of construction activity in thegreater downtown. Its redevelopment involves street improvements, streetcarservice, and an aerial tram (another transportation innovation). Given thesuccess of the mid-rise projects in the Pearl, developers and real estate investorsfeel sufficiently confident in the Portland urban housing market to finance andbuild high-rise projects in the South Waterfront. At full build-out in 2015, SouthWaterfront will have 3,000 housing units and 10,000 jobs. Four different projects,including three 23- to 31-story condominium towers with ground floor retail andan extension campus of the Oregon Health Services University are currentlyunder construction.
In less than a quarter of the South Waterfront district’s 130-acre total land area,the following public goals will be achieved:
• Creation of 5,000 jobs, half the projected job growth for the entire district;• Development of 2,700 of the 3,000 housing units planned for the district,
and 430 of the proposed 788 units of affordable housing proposed;• A one-quarter mile riverfront greenway at an average width of 125 feet (a
100-foot setback was planned for the entire district);• Transit system development, including streetcar, tram, and bus; and,• Improved environmental conditions and sustainable building practices
throughout.
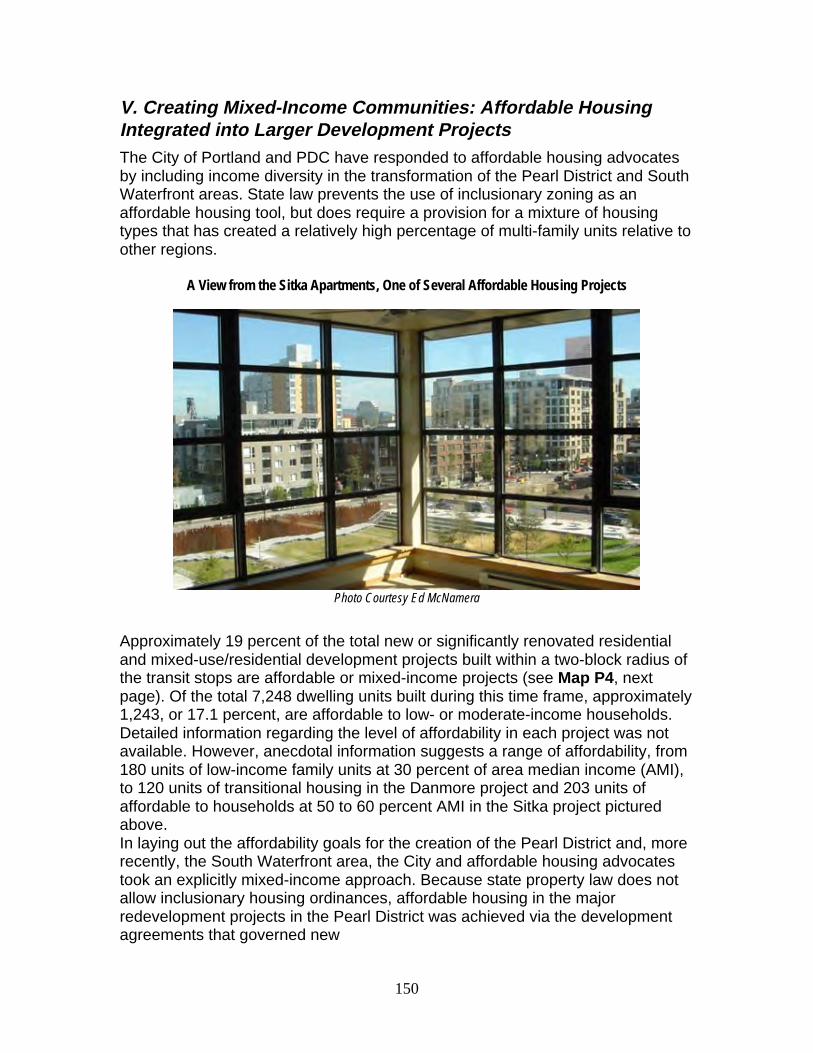
150
V. Creating Mixed-Income Communities: Affordable HousingIntegrated into Larger Development ProjectsThe City of Portland and PDC have responded to affordable housing advocatesby including income diversity in the transformation of the Pearl District and SouthWaterfront areas. State law prevents the use of inclusionary zoning as anaffordable housing tool, but does require a provision for a mixture of housingtypes that has created a relatively high percentage of multi-family units relative toother regions.
A View from the Sitka Apartments, One of Several Affordable Housing Projects
Photo Courtesy Ed McNamera
Approximately 19 percent of the total new or significantly renovated residentialand mixed-use/residential development projects built within a two-block radius ofthe transit stops are affordable or mixed-income projects (see Map P4, nextpage). Of the total 7,248 dwelling units built during this time frame, approximately1,243, or 17.1 percent, are affordable to low- or moderate-income households.Detailed information regarding the level of affordability in each project was notavailable. However, anecdotal information suggests a range of affordability, from180 units of low-income family units at 30 percent of area median income (AMI),to 120 units of transitional housing in the Danmore project and 203 units ofaffordable to households at 50 to 60 percent AMI in the Sitka project picturedabove.In laying out the affordability goals for the creation of the Pearl District and, morerecently, the South Waterfront area, the City and affordable housing advocatestook an explicitly mixed-income approach. Because state property law does notallow inclusionary housing ordinances, affordable housing in the majorredevelopment projects in the Pearl District was achieved via the developmentagreements that governed new
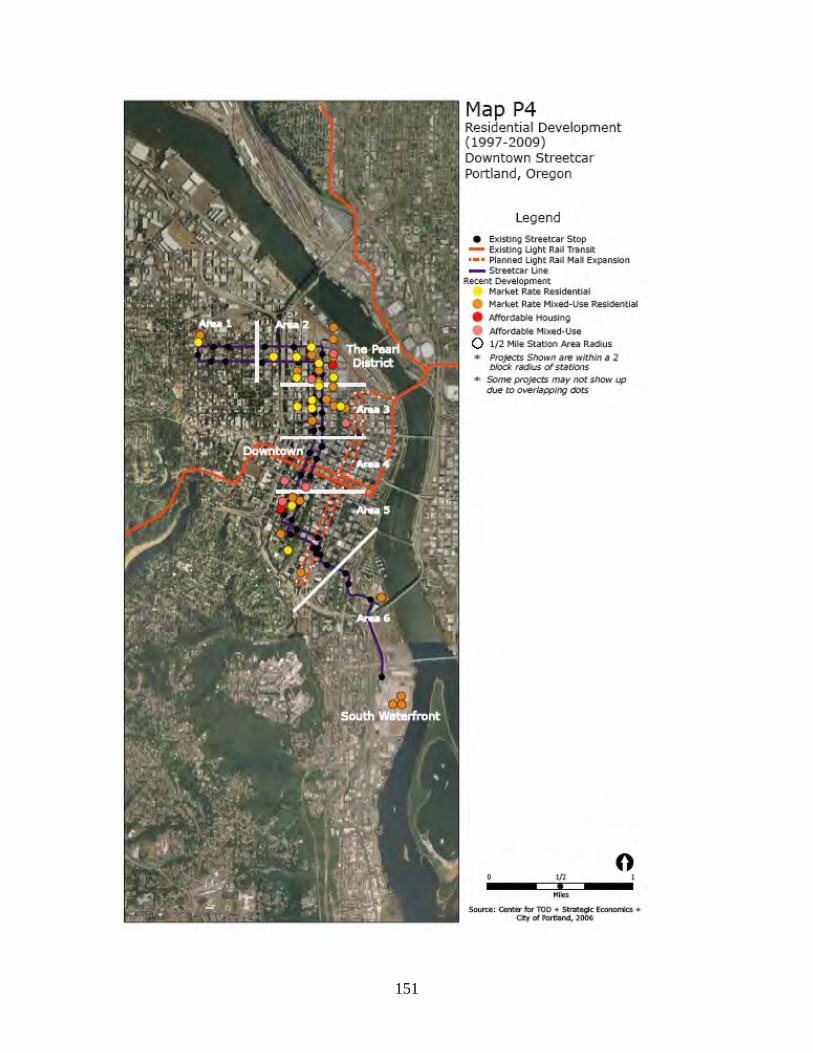
151
152
development.8 Negotiations over the development agreement with Hoyt StreetProperties included city-wide affordable housing advocates, such as the PortlandOrganizing Project. It was agreed that the ratio of affordable- to-market-ratehousing should mirror the income distribution of the city as whole over time, witheach new phase of development to be matched to current city demographics.While in hindsight some affordable housing groups feel that greater levels ofaffordability could have been achieved given the success of Hoyt Street’sprojects, at the time, there was a concentration of affordable housing in westerndowntown and very little market-rate housing in downtown as a whole, and thedepth of the market for high-end housing was unknown. Based on the success ofthe Pearl District, the PDC in 2003, negotiated a development agreement withNorth Macadam Investors (NMI), which controls much of the South Waterfrontarea. It is arguably the biggest developer agreement in Portland’s history, giventhe area and money involved, the number of players, and the complexity andscope of the commitments. The same guiding principle of matching therequirement to existing city-wide income categories is being applied in the SouthWaterfront. Included in the developer agreement between PDC and NMI is theconstruction of 400 to 480 market rate condominiums and 30 affordablecondominiums, as well as 100-150 market rate apartments and 200 affordableapartments.
VI. Local Policy Tools: PDC Leads Coordination of Public andPrivate EntitiesNationally, the Portland region is seen as a model of coordinated land use andtransportation planning that is based on significant community involvement andvision. While public sector actors and organizations have played a key role in thecity’s establishment of a vision for redevelopment, implementation of the visioncan be credited to private sector players committed to an environmentally andsocially sustainable future.The streetcar’s success results from a number of factors, including Portland’sinvestment in pedestrian, bicycle, and transit improvements, and historiccommitment to urban planning detailed in the 1988 Central City Plan andreinforced by regional and state land use policies and law. A network of powerfulactivist neighborhood associations, together with strong local political leadershipand a group of forward-looking developers, all worked together to implementpolicies supportive of both the planning and finance of the urban redevelopment,including the streetcar.The PDC has taken a lead role in coordination of development activity in alongthe streetcar corridor. Created by Portland voters in 1958 as a special purposegovernment agency, the PDC serves as the city’s urban renewal, housing, andeconomic development agency. A board of five volunteer citizens appointed by 8 Affordable units at low and median income affordability levels were paid for by Hoyt Street via subsidyfrom the market rate units; very low income units provided at rents affordable to households at below 50%local family median income received some public subsidy.
153
the Mayor and approved by the City Council governs the PDC. The agency’sexecutive director reports to the board on the work of 200 PDC professionals inan array of relevant areas, including real estate development, finance,construction, urban planning, project management, economic and communitydevelopment, architecture, and law.The PDC’s urban renewal work is funded primarily by tax increment financing bywhich future tax revenues pay for revitalization efforts in designated areas of thecity. Based on extensive input from the community and PDC, the City Councilcreates an Urban Renewal Area by establishing its boundaries, adopting a planfor improvements, and setting the baseline tax revenues that will continue to becollected as normal. The city then issues urban renewal bonds to pay for thoseimprovements based on the expected property value increases. As propertyvalues increase with new investment, the increase in property tax revenues isused to pay off the bonds. Once they are paid off, all tax revenues within thedistrict become part of normal property tax collections.9
Equally critical were the establishment of the River District (includes the Pearl District)and North Macadam (includes South Waterfront) Urban Renewal Areas in 1998 and1999, respectively.10 The Streetcar Local Improvement District, a property assessment onnon-owner occupied residences, was created to help fund the Downtown Streetcar andother improvements.
Various other local policy, financing, and funding tools with potential applicationin other places are summarized in Table P4, on the following page.11 Theyrepresent a variety of tools available both to subsidize affordable housing and topromote transit-oriented development. TriMet, the regional transit authority, is anational leader in joint development of properties along its multiple transitcorridors. The City is also a strong player in supporting TOD, and TOD taxabatements are authorized by the State to provide additional incentives fordeveloping near transit.
9 Gloria Ohland and Shelley Poticha, Street Smart: Streetcars and Cities in the Twenty-First Century.Reconnecting America: November 2006.10 The new URAs also benefited from the funding available from the Downtown Waterfront URA,established in 1974 in the central waterfront portion of the Downtown, and Portland’s most successfulURA district.11 A variety of general tools, including overall State funding for affordable housing/subsidized housing arealso being used in the Twin Cities region. These tools are discussed in Appendix A of the report. Table P4highlights those specific to promoting TOD or have a linkage between affordable housing and proximity totransit, or creating mixed income communities.
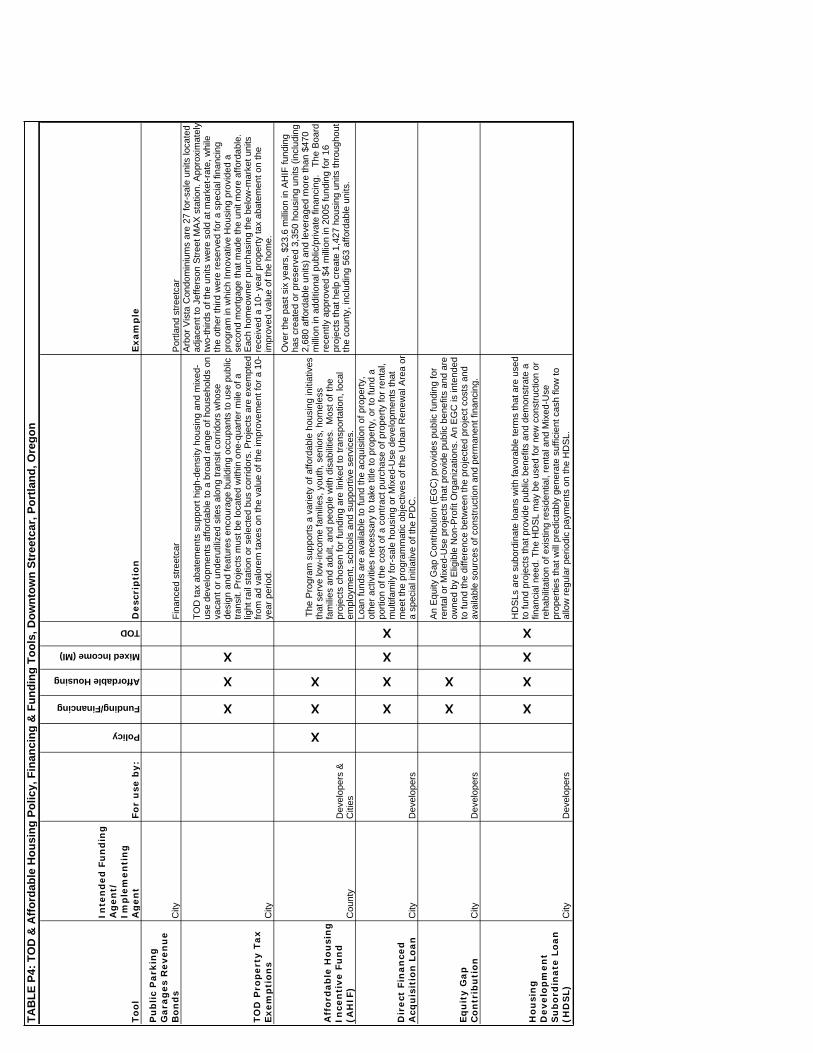
To
ol
Inte
nd
ed
Fu
nd
ing
A
gen
t/
Imp
lem
en
tin
g
Ag
en
tFo
r u
se b
y:
Policy
Funding/Financing
Affordable Housing
Mixed Income (MI)
TOD
Desc
rip
tio
nExam
ple
Pu
blic
Park
ing
G
ara
ges
Reven
ue
Bo
nd
sC
ityF
inan
ced
stre
etca
rP
ortla
nd s
tree
tcar
TO
D P
rop
ert
y T
ax
Exem
pti
on
sC
ity
X
X
X
TO
D ta
x ab
atem
ents
sup
port
hig
h-de
nsity
hou
sing
and
mix
ed-
use
deve
lopm
ents
affo
rdab
le to
a b
road
ran
ge o
f hou
seho
lds
on
vaca
nt o
r un
deru
tiliz
ed s
ites
alon
g tr
ansi
t cor
ridor
s w
hose
de
sign
and
feat
ures
enc
oura
ge b
uild
ing
occu
pant
s to
use
pub
lic
tran
sit.
Pro
ject
s m
ust b
e lo
cate
d w
ithin
one
-qua
rter
mile
of a
lig
ht r
ail s
tatio
n or
sel
ecte
d bu
s co
rrid
ors.
Pro
ject
s ar
e ex
empt
ed
from
ad
valo
rem
taxe
s on
the
valu
e of
the
impr
ovem
ent f
or a
10-
year
per
iod.
Arb
or V
ista
Con
dom
iniu
ms
are
27 fo
r-sa
le u
nits
loca
ted
adja
cent
to J
effe
rson
Str
eet M
AX
sta
tion.
App
roxi
mat
ely
two-
third
s of
the
units
wer
e so
ld a
t mar
ket-
rate
, whi
le
the
othe
r th
ird w
ere
rese
rved
for
a sp
ecia
l fin
anci
ng
prog
ram
in w
hich
Inno
vativ
e H
ousi
ng p
rovi
ded
a se
cond
mor
tgag
e th
at m
ade
the
unit
mor
e af
ford
able
. E
ach
hom
eow
ner
purc
hasi
ng th
e be
low
-mar
ket u
nits
re
ceiv
ed a
10-
yea
r pr
oper
ty ta
x ab
atem
ent o
n th
e im
prov
ed v
alue
of t
he h
ome.
Aff
ord
ab
le H
ou
sin
g
Ince
nti
ve F
un
d
(AH
IF)
Cou
nty
Dev
elop
ers
&
Citi
es
X
X
X
The
Pro
gram
sup
port
s a
varie
ty o
f affo
rdab
le h
ousi
ng in
itiat
ives
th
at s
erve
low
-inco
me
fam
ilies
, you
th, s
enio
rs, h
omel
ess
fam
ilies
and
adu
lt, a
nd p
eopl
e w
ith d
isab
ilitie
s. M
ost o
f the
pr
ojec
ts c
hose
n fo
r fu
ndin
g ar
e lin
ked
to tr
ansp
orta
tion,
loca
l em
ploy
men
t, sc
hool
s an
d su
ppor
tive
serv
ices
.
Ove
r th
e pa
st s
ix y
ears
, $23
.6 m
illio
n in
AH
IF fu
ndin
g ha
s cr
eate
d or
pre
serv
ed 3
,350
hou
sing
uni
ts (
incl
udin
g 2,
680
affo
rdab
le u
nits
) an
d le
vera
ged
mor
e th
an $
470
mill
ion
in a
dditi
onal
pub
lic/p
rivat
e fin
anci
ng.
The
Boa
rd
rece
ntly
app
rove
d $4
mill
ion
in 2
005
fund
ing
for
16
proj
ects
that
hel
p cr
eate
1,4
27 h
ousi
ng u
nits
thro
ugho
ut
the
coun
ty, i
nclu
ding
563
affo
rdab
le u
nits
.
Dir
ect
Fin
an
ced
A
cqu
isit
ion
Lo
an
City
Dev
elop
ers
X
X
X
X
Loan
fund
s ar
e av
aila
ble
to fu
nd th
e ac
quis
ition
of p
rope
rty,
ot
her
activ
ities
nec
essa
ry to
take
title
to p
rope
rty,
or
to fu
nd a
po
rtio
n of
the
cost
of a
con
trac
t pur
chas
e of
pro
pert
y fo
r re
ntal
, m
ultif
amily
for-
sale
hou
sing
or
Mix
ed-U
se d
evel
opm
ents
that
m
eet t
he p
rogr
amm
atic
obj
ectiv
es o
f the
Urb
an R
enew
al A
rea
or
a sp
ecia
l ini
tiativ
e of
the
PD
C.
Eq
uit
y G
ap
C
on
trib
uti
on
City
Dev
elop
ers
X
X
An
Equ
ity G
ap C
ontr
ibut
ion
(EG
C)
prov
ides
pub
lic fu
ndin
g fo
r re
ntal
or
Mix
ed-U
se p
roje
cts
that
pro
vide
pub
lic b
enef
its a
nd a
re
owne
d by
Elig
ible
Non
-Pro
fit O
rgan
izat
ions
. An
EG
C is
inte
nded
to
fund
the
diffe
renc
e be
twee
n th
e pr
ojec
ted
proj
ect c
osts
and
av
aila
ble
sour
ces
of c
onst
ruct
ion
and
perm
anen
t fin
anci
ng.
Ho
usi
ng
D
evelo
pm
en
t S
ub
ord
inate
Lo
an
(H
DS
L)
City
Dev
elop
ers
X
X
X
X
HD
SLs
are
sub
ordi
nate
loan
s w
ith fa
vora
ble
term
s th
at a
re u
sed
to fu
nd p
roje
cts
that
pro
vide
pub
lic b
enef
its a
nd d
emon
stra
te a
fin
anci
al n
eed.
The
HD
SL
may
be
used
for
new
con
stru
ctio
n or
re
habi
litat
ion
of e
xist
ing
resi
dent
ial,
rent
al a
nd M
ixed
-Use
pr
oper
ties
that
will
pre
dict
ably
gen
erat
e su
ffici
ent c
ash
flow
to
allo
w r
egul
ar p
erio
dic
paym
ents
on
the
HD
SL.
TA
BL
E P
4: T
OD
& A
ffo
rdab
le H
ou
sin
g P
olic
y, F
inan
cin
g &
Fu
nd
ing
To
ols
, Do
wn
tow
n S
tree
tcar
, Po
rtla
nd
, Ore
go
n
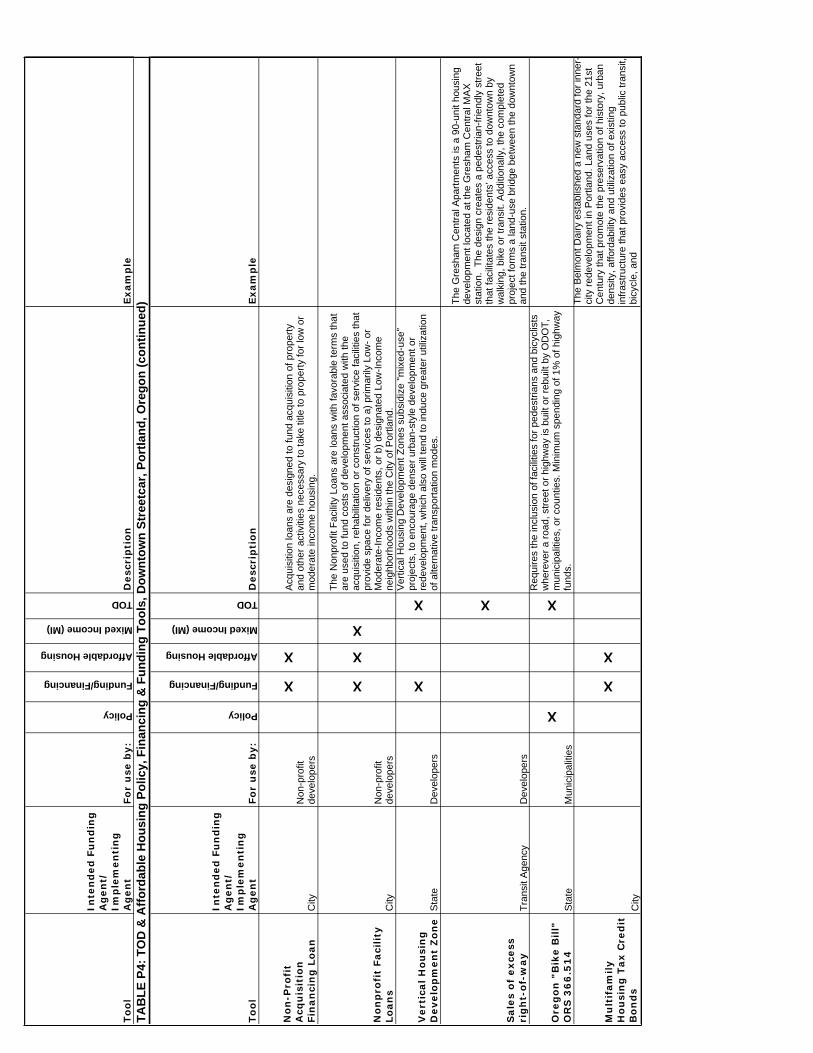
To
ol
Inte
nd
ed
Fu
nd
ing
A
gen
t/
Imp
lem
en
tin
g
Ag
en
tFo
r u
se b
y:
Policy
Funding/Financing
Affordable Housing
Mixed Income (MI)
TOD
Desc
rip
tio
nExam
ple
To
ol
Inte
nd
ed
Fu
nd
ing
A
gen
t/
Imp
lem
en
tin
g
Ag
en
tFo
r u
se b
y:
Policy
Funding/Financing
Affordable Housing
Mixed Income (MI)
TOD
Desc
rip
tio
nExam
ple
No
n-P
rofi
t A
cqu
isit
ion
Fin
an
cin
g L
oan
City
Non
-pro
fit
deve
lope
rs
X
X
Acq
uisi
tion
loan
s ar
e de
sign
ed to
fund
acq
uisi
tion
of p
rope
rty
and
othe
r ac
tiviti
es n
eces
sary
to ta
ke ti
tle to
pro
pert
y fo
r lo
w o
r m
oder
ate
inco
me
hous
ing.
No
np
rofi
t Faci
lity
Lo
an
sC
ityN
on-p
rofit
de
velo
pers
X
X
X
The
Non
prof
it F
acili
ty L
oans
are
loan
s w
ith fa
vora
ble
term
s th
at
are
used
to fu
nd c
osts
of d
evel
opm
ent a
ssoc
iate
d w
ith th
e ac
quis
ition
, reh
abili
tatio
n or
con
stru
ctio
n of
ser
vice
faci
litie
s th
at
prov
ide
spac
e fo
r de
liver
y of
ser
vice
s to
a)
prim
arily
Low
- or
M
oder
ate-
Inco
me
resi
dent
s, o
r b)
des
igna
ted
Low
-Inc
ome
neig
hbor
hood
s w
ithin
the
City
of P
ortla
nd.
Vert
ical H
ou
sin
g
Develo
pm
en
t Z
on
eS
tate
Dev
elop
ers
X
X
Ver
tical
Hou
sing
Dev
elop
men
t Zon
es s
ubsi
dize
"m
ixed
-use
" pr
ojec
ts, t
o en
cour
age
dens
er u
rban
-sty
le d
evel
opm
ent o
r re
deve
lopm
ent,
whi
ch a
lso
will
tend
to in
duce
gre
ater
util
izat
ion
of a
ltern
ativ
e tr
ansp
orta
tion
mod
es.
Sale
s o
f exce
ss
rig
ht-
of-
way
Tra
nsit
Age
ncy
Dev
elop
ers
XT
he G
resh
am C
entr
al A
part
men
ts is
a 9
0-un
it ho
usin
g de
velo
pmen
t loc
ated
at t
he G
resh
am C
entr
al M
AX
st
atio
n. T
he d
esig
n cr
eate
s a
pede
stria
n-fr
iend
ly s
tree
t th
at fa
cilit
ates
the
resi
dent
s’ a
cces
s to
dow
ntow
n by
w
alki
ng, b
ike
or tr
ansi
t. A
dditi
onal
ly, t
he c
ompl
eted
pr
ojec
t for
ms
a la
nd-u
se b
ridge
bet
wee
n th
e do
wnt
own
and
the
tran
sit s
tatio
n.
Ore
go
n "
Bik
e B
ill"
O
RS
36
6.5
14
Sta
teM
unic
ipal
ities
X
X
Req
uire
s th
e in
clus
ion
of fa
cilit
ies
for
pede
stria
ns a
nd b
icyc
lists
w
here
ver
a ro
ad, s
tree
t or
high
way
is b
uilt
or r
ebui
lt by
OD
OT
, m
unic
ipal
ities
, or
coun
ties.
Min
imum
spe
ndin
g of
1%
of h
ighw
ay
fund
s.
Mu
ltif
am
ily
Ho
usi
ng
Tax C
red
it
Bo
nd
sC
ity
X
X
The
Bel
mon
t Dai
ry e
stab
lishe
d a
new
sta
ndar
d fo
r in
ner-
city
red
evel
opm
ent i
n P
ortla
nd. L
and
uses
for
the
21st
C
entu
ry th
at p
rom
ote
the
pres
erva
tion
of h
isto
ry, u
rban
de
nsity
, affo
rdab
ility
and
util
izat
ion
of e
xist
ing
infr
astr
uctu
re th
at p
rovi
des
easy
acc
ess
to p
ublic
tran
sit,
bicy
cle,
and
TA
BL
E P
4: T
OD
& A
ffo
rdab
le H
ou
sin
g P
olic
y, F
inan
cin
g &
Fu
nd
ing
To
ols
, Do
wn
tow
n S
tree
tcar
, Po
rtla
nd
, Ore
go
n (
con
tin
ued
)
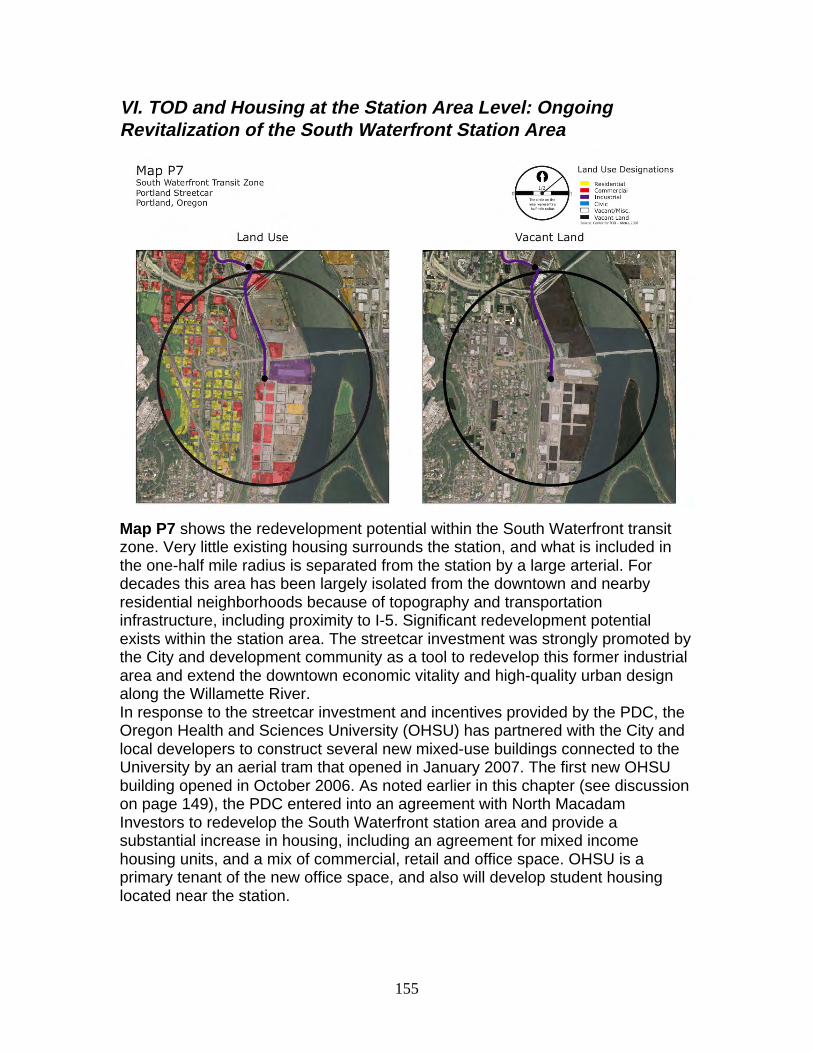
155
VI. TOD and Housing at the Station Area Level: OngoingRevitalization of the South Waterfront Station Area
Map P7 shows the redevelopment potential within the South Waterfront transitzone. Very little existing housing surrounds the station, and what is included inthe one-half mile radius is separated from the station by a large arterial. Fordecades this area has been largely isolated from the downtown and nearbyresidential neighborhoods because of topography and transportationinfrastructure, including proximity to I-5. Significant redevelopment potentialexists within the station area. The streetcar investment was strongly promoted bythe City and development community as a tool to redevelop this former industrialarea and extend the downtown economic vitality and high-quality urban designalong the Willamette River.In response to the streetcar investment and incentives provided by the PDC, theOregon Health and Sciences University (OHSU) has partnered with the City andlocal developers to construct several new mixed-use buildings connected to theUniversity by an aerial tram that opened in January 2007. The first new OHSUbuilding opened in October 2006. As noted earlier in this chapter (see discussionon page 149), the PDC entered into an agreement with North MacadamInvestors to redevelop the South Waterfront station area and provide asubstantial increase in housing, including an agreement for mixed incomehousing units, and a mix of commercial, retail and office space. OHSU is aprimary tenant of the new office space, and also will develop student housinglocated near the station.
156
VII. Opportunities, Obstacles & Lessons: ComprehensivePlanning and Favorable Conditions Facilitate Implementationand Allow for Value CaptureOne of the most significant findings from the Portland Streetcar Case Study, is thepowerful role that developer agreements can play in stimulating developer that supports arange of community benefits, including creating transit-supportive development. HoytStreet Properties has stated that the levels of density could not have been achieved in thePearl District without the streetcar, given the amount of parking that would otherwisehave been necessary. Planning staff emphasized that the speed with which developmentmoved forward in the Pearl District after the negotiation of the developer agreement wasin part due to an unusual amount of flexibility allowed in the agreement and the goodfaith of all parties in implementing its requirements.
Major Opportunities for Mixed-Income Housing Near Transit
• Large Obsolete Industrial Parcels Create Opportunities for NewNeighborhoodsThe extent of large, single-owner parcels with obsolete industrial uses adjacent to thedowntown in both the Pearl District and the South Waterfront is an extremelysignificant opportunity. Portland wasn’t just planning for in-fill development, it wascreating whole new neighborhoods and was able to design new infrastructure andurban amenities accordingly. These parcels created the framework for developingpublic-private agreements that included affordable and mixed-income housing goals.
• Pent-up Demand for Urban Housing Creates Market for UrbanHousingPrior to the development of the Pearl District, very little housing existed in thedowntown. High-quality, high-density housing and urban amenities were largelyabsent as a product type in Portland.1 The streetcar and coordinated redevelopmentbenefited from pent-up demand that coincided with demographic trends such asdown-sizing baby boomers and population growth to make a new type of urbanhousing type viable, and in fact, highly sought after.
• Developer Acquisition of Land Prior to Up-Zoning Allows for PublicAmenities
1 Prior to the development of the Pearl District, Homer Williams, the major visionary in the Williams & Dame-leddevelopment team at Hoyt Street Properties, had done primarily single-family development projects. However,after looking at the many potential amenities of the area and evolving demographic shifts, he and the rest of thedevelopment team took a significant risk in building a higher-density, transit-oriented product type new to themand to Portland. Mr. Williams is now also a key property owner/developer in the South Waterfront, leading the firstprojects being built in the North Macadam areas. PDC has been the conduit for millions of dollars in publicinvestment throughout the districts served by streetcar.
157
Hoyt Street Properties and the City of Portland were able to acquire large portions ofthe Burlington Northern Railyard prior to the significant escalation in property valuethat accompanies up-zoning. Because the purchase of the land did not absorb themajority of value to be created by new development, as it typically does, developmentwas able to contribute more to local amenities and affordable housing production.
• Streetcar Technology Has Lower Costs and Simpler ImplementationThe total cost of the first three phases of the Downtown Streetcar, including theDowntown, Pearl District and extensions to South Waterfront was $88.7 million, withthe average cost per track-mile ranging from $13 to $25 million for each phase. Thisis significantly less expensive than light rail, which has ranged from $20 to $60million per track-mile in recent projects. Additionally, because construction ofstreetcar track is less intensive and the cars are smaller, the design preserved on-streetparking and allowed shared use of the streetcar lane with autos, all of whichminimized the impact of construction and encouraged local business and propertyowner support of the project.
• Creative Financing of TransitThe Portland Streetcar was largely financed through local sources (revenue bonds ona public parking garage rate increase, tax increment financing from the UrbanRenewal Aareas and property assessment through a local improvement district), anunusual approach that allowed more local control and flexibility in planning andimplementation.
• Lack of Significant Numbers of Existing Residents in RedevelopmentAreasOne of Portland’s significant opportunities in planning for and implementing newhigher-density downtown neighborhoods was the relative lack of population in theindustrial areas that were being redeveloped. The lack of existing residents has meantlittle or no community opposition to adjacent development projects or higherresidential densities, and has also not created significant displacement of low-incomehouseholds.
Obstacles
• Lack of Existing Infrastructure Increases Cost of RedevelopmentGiven the industrial nature of the uses in these areas and the large parcelizationpattern prior to the streetcar investment, few of the amenities and basic infrastructurenecessary to quality residential or mixed-use neighborhoods existed in the Pearl orSouth Waterfront. Public funding was required to provide improved road networks,open space or civic amenities prior to redevelopment. Requirements were alsoincluded in the developer agreements to require a private sector contribution, andwhile necessary to successfully redevelop the area, significant cost from both privateand public sectors was required.
158
• Contamination on Large Industrial Sites Adds to Legal and CostBarriersMuch of the former railroad property proved to be contaminated, though the extent ofcontamination was not known until detailed testing was performed in 1997.Developers and the PDC worked with the Oregon Department of EnvironmentalQuality to determine appropriate levels of abatement and were ultimately allowed tocap the soil and build on top, rather than remove any contamination, which wouldhave been cost-prohibitive. The abatement process created additional costs and delaysthat were ultimately recovered from the former railroad owners.
• Recalcitrant Property Owners Can Delay or Alter Alignment andRedevelopmentWhile the most visionary property owners helped mold and achieve the vision foreach new neighborhood, several property owners in the North Macadam/SouthWaterfront area have been unenthusiastic about the City’s high-density goals for thearea. In 1993, a group of property owners proposed a suburban development conceptfor the area featuring cul-de-sacs, which was rejected by the City. In order to reachthe area south of Ross Island Bridge (South Waterfront) where OHSU and Williams& Dame (Hoyt Street Properties) and Gerding/Edlund (Brewery Blocks developer)are currently developing projects, the streetcar alignment currently skirts a hold-outproperty leaving a potential stop unbuilt until the ownership of the property changes.
• High Housing Prices and Construction Costs Challenge AffordableHousingWhile a number of new affordable housing projects have been built, and mixed-income housing also exists in the corridor, the cost of subsidizing these units is high.As land prices has escalated with the growth in demand, and prestige, of urban livingwithin the corridor, continuing to provide new affordable housing units, and preservethose that have been created through developer agreements remains a challenge.Regional housing advocates and policy makers are struggling to meet the growingneed for housing affordable to households at a range of incomes, particularly intransit corridors where reduced transportation savings particularly benefit lower-income residents.
Lessons from the Corridor for Other Places
• Strength of Development Agreements as Tool For Value CaptureComprehensive development agreements that specifically outline the responsibilitiesof all parties are essential to the success of complex public/private projects, especiallyat this large a scale. Effectively executed, they enable the developer to beappropriately supported, motivated, and rewarded, while ensuring the public trust iskept and urban planning goals are honored. In exchange for entitlements and varioustypes of public support, large-scale development projects can help pay for newinfrastructure, affordable housing, and other amenities.
• TOD Land Use and Design Framework Critical
159
The 1988 Central City Plan established the initial framing plan that laid out thestructure of the new neighborhoods and the general vision for the expansion ofDowntown. Having a clear redevelopment plan and appropriate zoning in place priorto new development and infrastructure investment was critical to the developernegotiations, the implementation of the streetcar and successful placemaking.
• Flexibility is Key in Accommodating Market ChangesWhile the Central City Plan and the development agreements for the major parcelsstructured the project’s implementation, the ultimate outcomes didn’t conform exactlyto the concepts laid out in each. Changes in the market and additional unexpectedcosts (e.g. contamination abatement) were accommodated over time with the resultsperhaps being better than originally anticipated. Such flexibility is necessary torespond to changing market pressures and allowing for profitable return fordevelopers and changing community needs. Much of the redeveloping areas servedby streetcar are “performance” zones, where a broad range of uses are allowed, butthe building must respond to design standards.
• Underutilized Industrial Land Presents Significant TOD OpportunityThere is great potential for successful TOD in previously industrial areas locatedclose to urban cores. Large parcels used for obsolete, or misplaced industrial useshold promise for the creation of whole new urban, higher-density mixed-use, transit-oriented districts with appropriate planning and investment.2 Successfulredevelopment requires supportive land use and infrastructure planning. Significantinvestment is likely needed, allowing for partnerships between public and privateactors to meet a multitude of transportation, open space, and housing improvements
• Degree of Redevelopment Opportunity Points to Different ToolsPortland utilized a variety of finance and planning tools to address environmentalclean-up, subsidized housing and creation of mixed-income projects, support of TOD,and a continued focus on mixed-use development and transportation choice. Thedevelopment agreement is of particular use in dealing with large transitioning parcelsthat require considerable infrastructure, but it is a less appropriate tool for use in builtout areas where small infill projects make up the majority of new developmentopportunity. Jurisdiction must develop a set of tools that correspond to the uniquechallenges and opportunities that exist within each setting.
• Affordability Tools Exist Beyond Inclusionary RequirementsStates without affordable housing inclusionary requirements can require affordableunits through negotiated development agreements, and other approaches that capturethe value created by higher-density, market rate TOD housing. The Portland approachof matching the affordability of units to household income distribution city-wide is an
2 Not all industrial land is appropriate for development with higher value uses. Depending on the types ofuses and built space located in an industrial area, the importance of maintaining a healthy, diverse regionaleconomy may require preservation of some amount of space for evolving industrial, and light industrialuses with convenient access to the urban core.
160
innovative way to achieve mixed-income housing inclusive of the community as awhole.
• Value Capture Strategies Must Balance Array of Community BenefitsIn dealing with major development projects, many different public goods are neededto make a place work. Affordable housing goals must be balanced with goals for openspace, transit, and other public facilities and goods necessary to create quality urbandistricts. Community dialogue is required to determine these benefits, and any trade-offs or priorities that may shift over time.
• Create Equal Opportunity for Development PlayersDeveloper agreements and tax abatements have been two powerful tools in thePortland region to shape development around transit and meet public benefits.However, some of the tax abatement incentives available to affordable housingprojects in the central city applied differently to for-profit or non-profit developments.Tax abatements aimed at stimulating the production of affordable housing should beavailable equally to achieve the maximum amount of housing possible, rather thanrewarding certain types of organizations over others. The City’s tax abatement policyis being currently being modified to address this discrepancy. Realizing the potentialof both the for-profit and non-profit development community to provide affordablehousing and economic development opportunities is important to success. Ensuringthat incentives and policies can be used by each is necessary.
The next chapter summarizes the key findings from the case studies specific to theshared challenges and opportunities for creating mixed-income housing near transit.
161
Chapter 9: Putting Mixed-Income TOD into Practice –Lessons from the Five Case StudiesThere is no single effective approach to promoting mixed-income housing inneighborhoods near transit. Rather, all stakeholders – federal, state, regional,local and private-sector – are grappling with the challenges of simultaneouslyremoving barriers to building mixed-use neighborhoods where transit isconvenient and ensuring that a full range of households can access the lifestyleand affordability benefits of TOD.The geographic diversity of the case study regions and the differing levels ofmaturity of their transit systems provide insights regarding the market responseto new transit investments, the challenges of preserving and creating mixed-income housing near transit, and the strategies for capturing the value creatingby TOD to achieve community benefits. A host of innovative strategies is beingtried in these five very different places, with varying degrees of success. And,though this study has generated substantial new and interesting informationabout the linkages between housing and transit, much more work is needed torefine this methodology and provide practitioners with strong analytic tools andpredictive models.Throughout this report we have distinguished between the different challenges,opportunities and players at the regional, corridor and station area levels. Thefollowing discussion of lessons learned from the case studies follows this sameformat.Lessons from the RegionsThe five case study regions vary in size, extent of transit service and strength ofthe housing market. This in turn, affects the degree to which transit-orienteddevelopment serves as an organizing framework for growth and the extent towhich mixed-income housing can be included in new TOD projects.
• Travel Characteristics in Transit Zones are Unique from the RegionAs shown in Table 9.1, next page, residents of transit zones are three timesas likely to take transit to work than residents of the region as a whole.Residents of transit zones are also three or more times likely to bike or walkto work than are residents of the region as a whole.
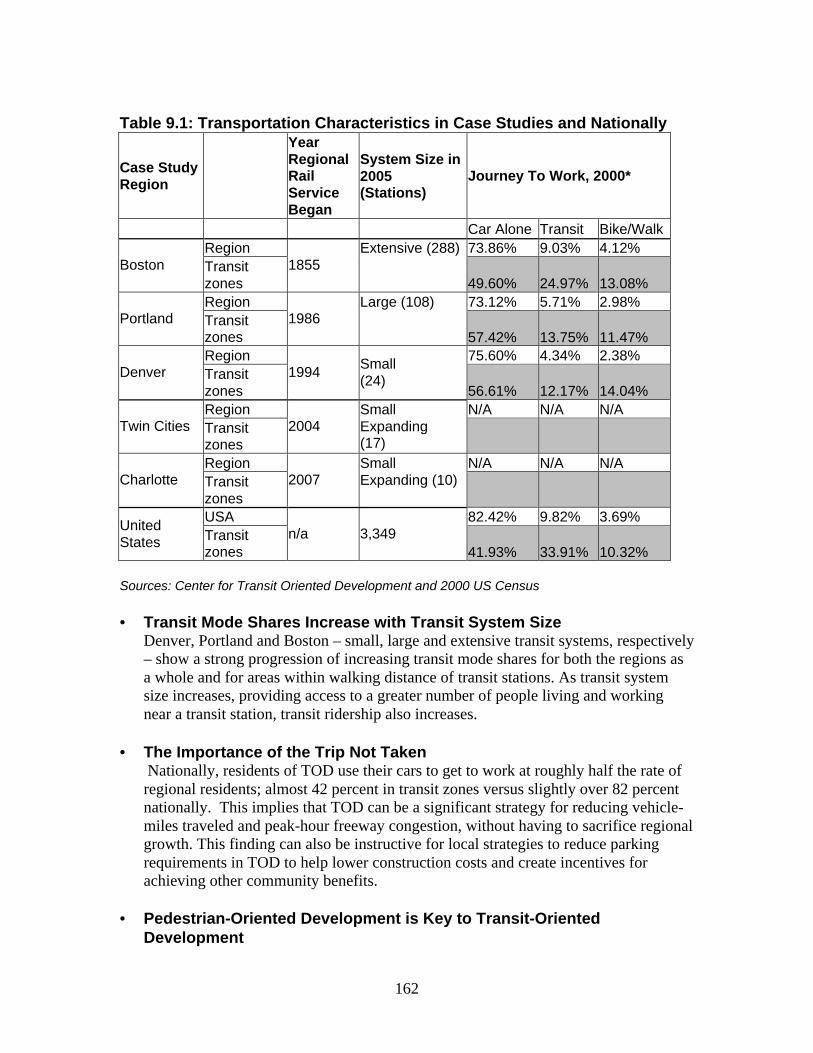
162
Table 9.1: Transportation Characteristics in Case Studies and Nationally
Case StudyRegion
YearRegionalRailServiceBegan
System Size in2005(Stations)
Journey To Work, 2000*
Car Alone Transit Bike/WalkRegion 73.86% 9.03% 4.12%
Boston Transitzones
1855Extensive (288)
49.60% 24.97% 13.08%Region 73.12% 5.71% 2.98%
Portland Transitzones
1986Large (108)
57.42% 13.75% 11.47%Region 75.60% 4.34% 2.38%
Denver Transitzones
1994Small(24)
56.61% 12.17% 14.04%Region N/A N/A N/A
Twin Cities Transitzones
2004SmallExpanding(17)
Region N/A N/A N/ACharlotte Transit
zones2007
SmallExpanding (10)
USA 82.42% 9.82% 3.69%
UnitedStates Transit
zonesn/a 3,349
41.93% 33.91% 10.32%
Sources: Center for Transit Oriented Development and 2000 US Census
• Transit Mode Shares Increase with Transit System SizeDenver, Portland and Boston – small, large and extensive transit systems, respectively– show a strong progression of increasing transit mode shares for both the regions asa whole and for areas within walking distance of transit stations. As transit systemsize increases, providing access to a greater number of people living and workingnear a transit station, transit ridership also increases.
• The Importance of the Trip Not Taken Nationally, residents of TOD use their cars to get to work at roughly half the rate ofregional residents; almost 42 percent in transit zones versus slightly over 82 percentnationally. This implies that TOD can be a significant strategy for reducing vehicle-miles traveled and peak-hour freeway congestion, without having to sacrifice regionalgrowth. This finding can also be instructive for local strategies to reduce parkingrequirements in TOD to help lower construction costs and create incentives forachieving other community benefits.
• Pedestrian-Oriented Development is Key to Transit-OrientedDevelopment
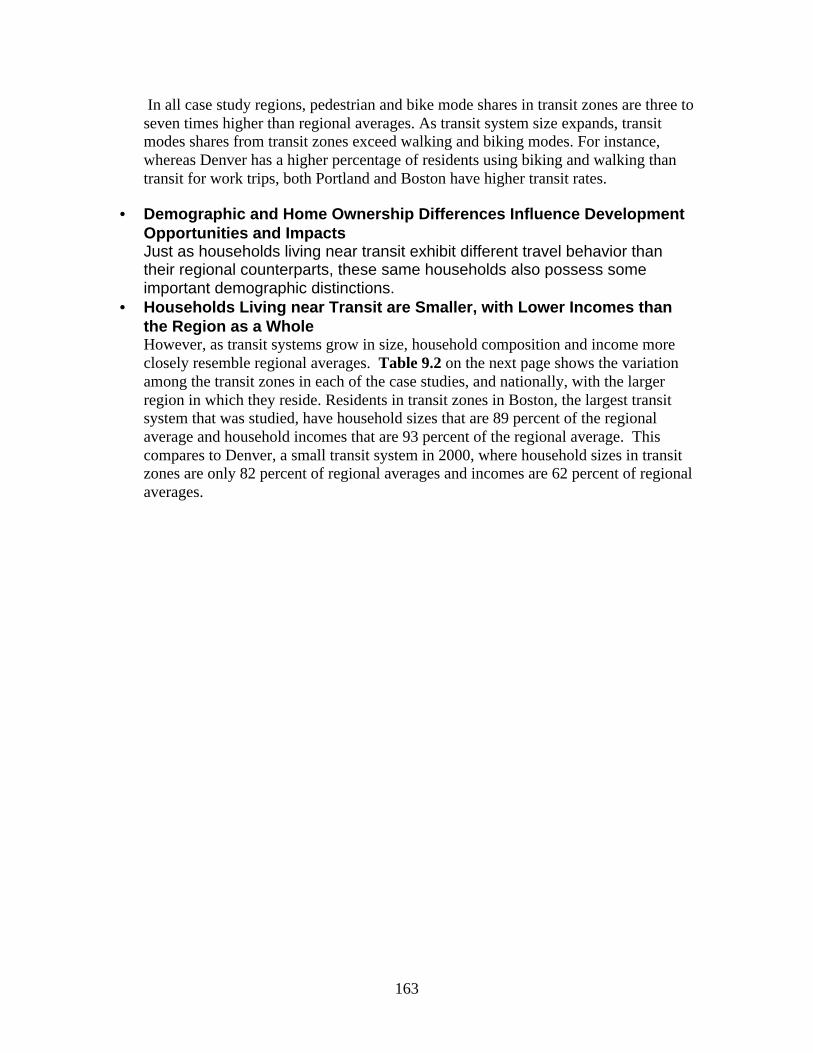
163
In all case study regions, pedestrian and bike mode shares in transit zones are three toseven times higher than regional averages. As transit system size expands, transitmodes shares from transit zones exceed walking and biking modes. For instance,whereas Denver has a higher percentage of residents using biking and walking thantransit for work trips, both Portland and Boston have higher transit rates.
• Demographic and Home Ownership Differences Influence DevelopmentOpportunities and ImpactsJust as households living near transit exhibit different travel behavior thantheir regional counterparts, these same households also possess someimportant demographic distinctions.
• Households Living near Transit are Smaller, with Lower Incomes thanthe Region as a WholeHowever, as transit systems grow in size, household composition and income moreclosely resemble regional averages. Table 9.2 on the next page shows the variationamong the transit zones in each of the case studies, and nationally, with the largerregion in which they reside. Residents in transit zones in Boston, the largest transitsystem that was studied, have household sizes that are 89 percent of the regionalaverage and household incomes that are 93 percent of the regional average. Thiscompares to Denver, a small transit system in 2000, where household sizes in transitzones are only 82 percent of regional averages and incomes are 62 percent of regionalaverages.
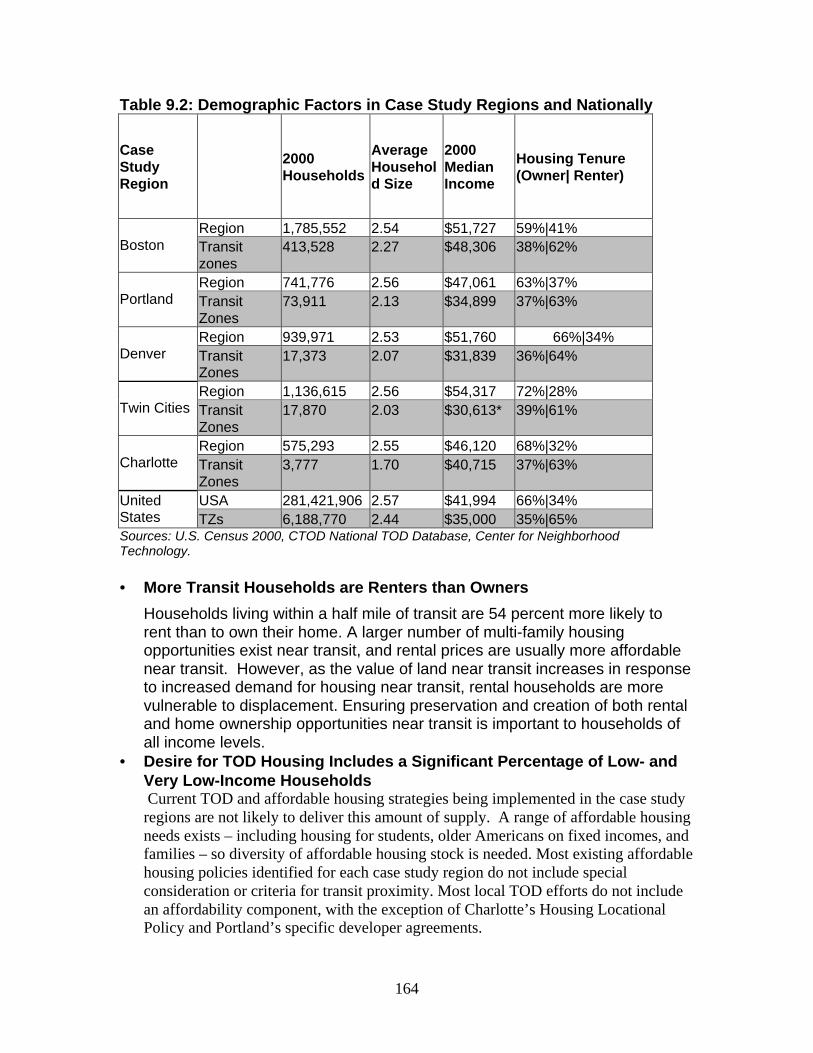
164
Table 9.2: Demographic Factors in Case Study Regions and Nationally
CaseStudyRegion
2000Households
AverageHousehold Size
2000MedianIncome
Housing Tenure(Owner| Renter)
Region 1,785,552 2.54 $51,727 59%|41%Boston Transit
zones413,528 2.27 $48,306 38%|62%
Region 741,776 2.56 $47,061 63%|37%Portland Transit
Zones73,911 2.13 $34,899 37%|63%
Region 939,971 2.53 $51,760 66%|34%Denver Transit
Zones17,373 2.07 $31,839 36%|64%
Region 1,136,615 2.56 $54,317 72%|28%Twin Cities Transit
Zones17,870 2.03 $30,613* 39%|61%
Region 575,293 2.55 $46,120 68%|32%Charlotte Transit
Zones3,777 1.70 $40,715 37%|63%
USA 281,421,906 2.57 $41,994 66%|34%UnitedStates TZs 6,188,770 2.44 $35,000 35%|65%Sources: U.S. Census 2000, CTOD National TOD Database, Center for NeighborhoodTechnology.
• More Transit Households are Renters than OwnersHouseholds living within a half mile of transit are 54 percent more likely torent than to own their home. A larger number of multi-family housingopportunities exist near transit, and rental prices are usually more affordablenear transit. However, as the value of land near transit increases in responseto increased demand for housing near transit, rental households are morevulnerable to displacement. Ensuring preservation and creation of both rentaland home ownership opportunities near transit is important to households ofall income levels.
• Desire for TOD Housing Includes a Significant Percentage of Low- andVery Low-Income Households Current TOD and affordable housing strategies being implemented in the case studyregions are not likely to deliver this amount of supply. A range of affordable housingneeds exists – including housing for students, older Americans on fixed incomes, andfamilies – so diversity of affordable housing stock is needed. Most existing affordablehousing policies identified for each case study region do not include specialconsideration or criteria for transit proximity. Most local TOD efforts do not includean affordability component, with the exception of Charlotte’s Housing LocationalPolicy and Portland’s specific developer agreements.
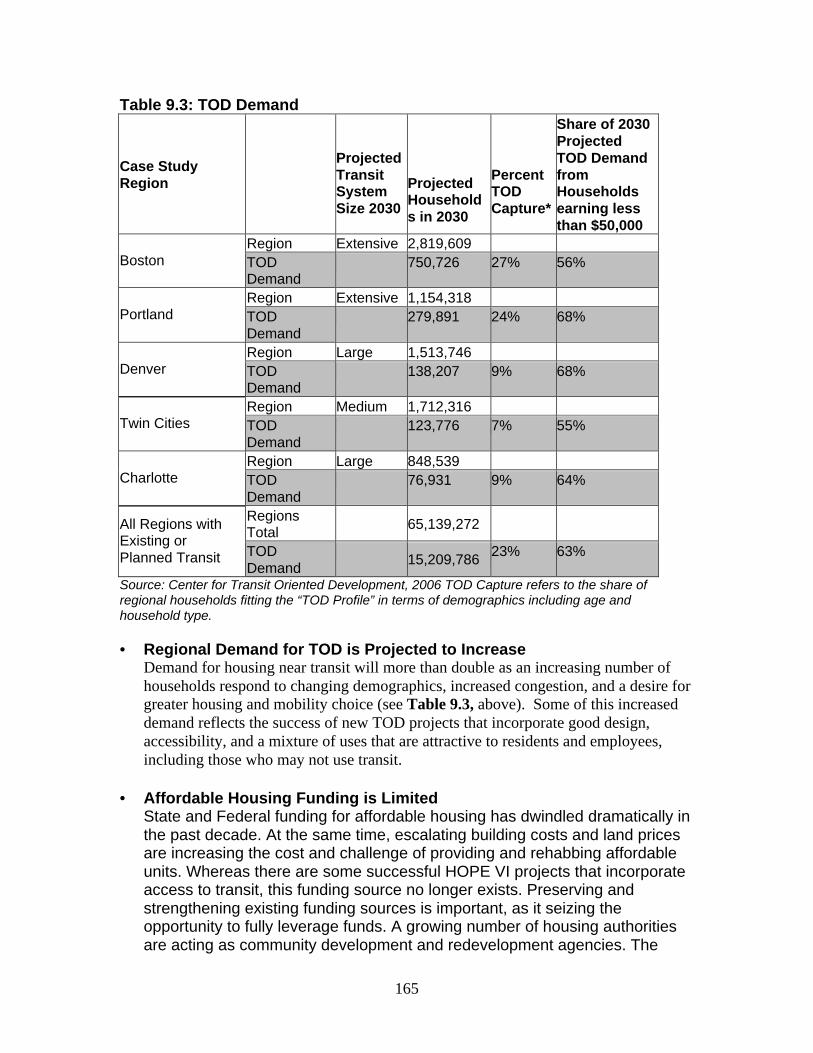
165
Table 9.3: TOD Demand
Case StudyRegion
ProjectedTransitSystemSize 2030
ProjectedHouseholds in 2030
PercentTODCapture*
Share of 2030ProjectedTOD DemandfromHouseholdsearning lessthan $50,000
Region Extensive 2,819,609Boston TOD
Demand750,726 27% 56%
Region Extensive 1,154,318Portland TOD
Demand279,891 24% 68%
Region Large 1,513,746Denver TOD
Demand138,207 9% 68%
Region Medium 1,712,316Twin Cities TOD
Demand123,776 7% 55%
Region Large 848,539Charlotte TOD
Demand76,931 9% 64%
RegionsTotal
65,139,272All Regions withExisting orPlanned Transit TOD
Demand15,209,786
23% 63%
Source: Center for Transit Oriented Development, 2006 TOD Capture refers to the share ofregional households fitting the “TOD Profile” in terms of demographics including age andhousehold type.
• Regional Demand for TOD is Projected to IncreaseDemand for housing near transit will more than double as an increasing number ofhouseholds respond to changing demographics, increased congestion, and a desire forgreater housing and mobility choice (see Table 9.3, above). Some of this increaseddemand reflects the success of new TOD projects that incorporate good design,accessibility, and a mixture of uses that are attractive to residents and employees,including those who may not use transit.
• Affordable Housing Funding is LimitedState and Federal funding for affordable housing has dwindled dramatically inthe past decade. At the same time, escalating building costs and land pricesare increasing the cost and challenge of providing and rehabbing affordableunits. Whereas there are some successful HOPE VI projects that incorporateaccess to transit, this funding source no longer exists. Preserving andstrengthening existing funding sources is important, as it seizing theopportunity to fully leverage funds. A growing number of housing authoritiesare acting as community development and redevelopment agencies. The
166
leadership and creativity demonstrated by the Portland DevelopmentCommission and MassHousing illustrate the importance of meeting affordablehousing objectives through larger redevelopment strategies. Similarly,prioritizing tax credits and other affordable housing subsidies for locating neartransit can help to address TOD affordability challenges and help to ensurestable transit ridership.
Partnership, Leadership and Innovation are NecessaryIngredientsAn overarching observation from this study is that better coordination of housingand transportation policies is needed. Transit investments and housing marketsare influenced at the corridor level, whereas housing and transportation policiesare often made at the State and regional levels. Given the different scales ofinvestment and policy decisions, transportation and housing needs to be moreclosely aligned. While transit agencies are not responsible for local land use orregional housing policies, transit investments should be closely coordinated witheach.Charlotte and Portland have staff within transit agencies and the city to work withdevelopers to identify key TOD opportunity sites. Hennepin County in the TwinCities region has developed a TOD program to create incentives for housing inexisting and proposed transit corridors. Preservation and creation of new housingis a priority for consideration in allocation of these funds. These are importantfirst steps, but still insufficient to meeting the challenges identified in each regionfor creating mixed-income housing near transit.
• Government Leadership is KeyGovernment leadership can take many forms. In Massachusets, the formerGovernor stepped forward to propose new funding and policies to supportTOD. In Portland, the Portland Development Commission took earlyleadership to redevelop around the streetcar. In Charlotte, the City and transitagency work together to coordinate land use and transit planning. In everyinstance, leadership by at least one level of government was critical toproviding the commitment necessary to provide new funding sources, policiesand change existing regulatory barriers.
• Public-Private Partnerships can Yield Impressive ResultsIn Boston, a group of four community development corporations have cometogether to advocate for improved transit service and affordable housingwithin the Fairmount/Indigo Line. The CDC collaborative is partnering with theCity, MBTA and MassHousing to try and achieve results. In Portland, localfor-profit developers were early leaders in creating an urban, infill marketlocated near the proposed streetcar alignment. Their leadership and financialcommitment, and willingness to try a new market product yielded substantialbenefits to the developer and to the public. Business and community leaders
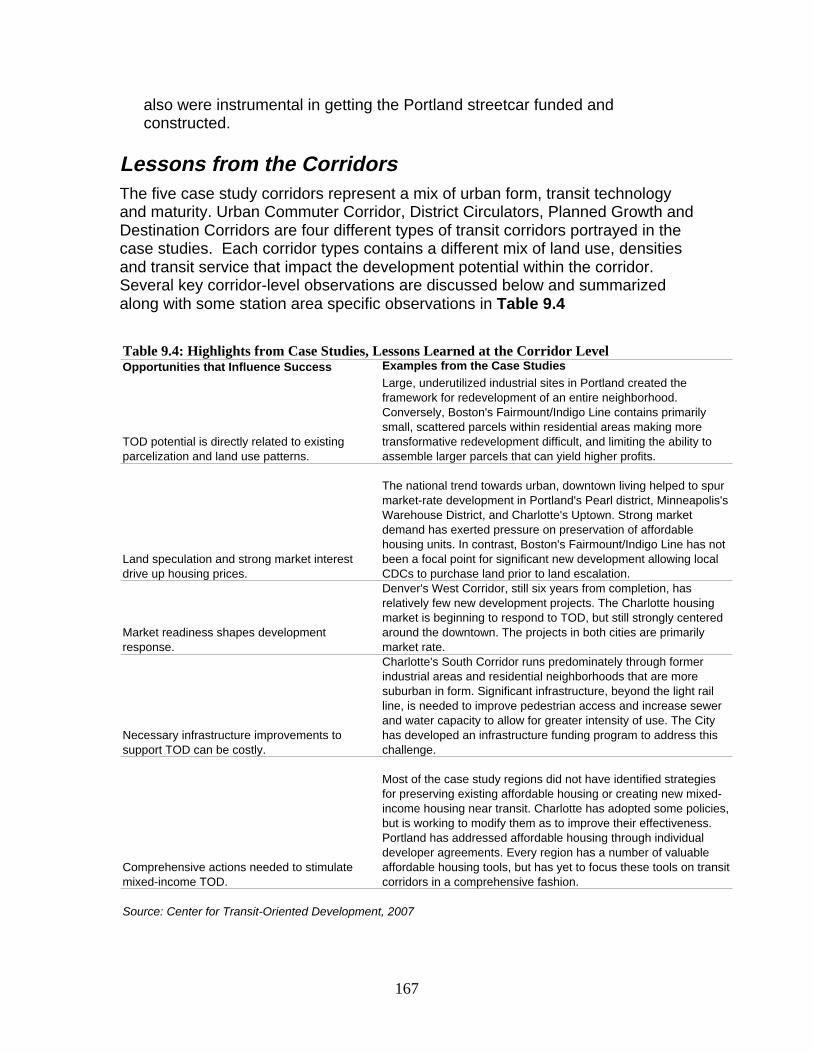
167
also were instrumental in getting the Portland streetcar funded andconstructed.
Lessons from the CorridorsThe five case study corridors represent a mix of urban form, transit technologyand maturity. Urban Commuter Corridor, District Circulators, Planned Growth andDestination Corridors are four different types of transit corridors portrayed in thecase studies. Each corridor types contains a different mix of land use, densitiesand transit service that impact the development potential within the corridor.Several key corridor-level observations are discussed below and summarizedalong with some station area specific observations in Table 9.4
Opportunities that Influence Success Examples from the Case Studies
TOD potential is directly related to existing parcelization and land use patterns.
Large, underutilized industrial sites in Portland created the framework for redevelopment of an entire neighborhood. Conversely, Boston's Fairmount/Indigo Line contains primarily small, scattered parcels within residential areas making more transformative redevelopment difficult, and limiting the ability to assemble larger parcels that can yield higher profits.
Land speculation and strong market interest drive up housing prices.
The national trend towards urban, downtown living helped to spur market-rate development in Portland's Pearl district, Minneapolis's Warehouse District, and Charlotte's Uptown. Strong market demand has exerted pressure on preservation of affordable housing units. In contrast, Boston's Fairmount/Indigo Line has not been a focal point for significant new development allowing local CDCs to purchase land prior to land escalation.
Market readiness shapes development response.
Denver's West Corridor, still six years from completion, has relatively few new development projects. The Charlotte housing market is beginning to respond to TOD, but still strongly centered around the downtown. The projects in both cities are primarily market rate.
Necessary infrastructure improvements to support TOD can be costly.
Charlotte's South Corridor runs predominately through former industrial areas and residential neighborhoods that are more suburban in form. Significant infrastructure, beyond the light rail line, is needed to improve pedestrian access and increase sewer and water capacity to allow for greater intensity of use. The City has developed an infrastructure funding program to address this challenge.
Comprehensive actions needed to stimulate mixed-income TOD.
Most of the case study regions did not have identified strategies for preserving existing affordable housing or creating new mixed-income housing near transit. Charlotte has adopted some policies, but is working to modify them as to improve their effectiveness. Portland has addressed affordable housing through individual developer agreements. Every region has a number of valuable affordable housing tools, but has yet to focus these tools on transit corridors in a comprehensive fashion.
Table 9.4: Highlights from Case Studies, Lessons Learned at the Corridor Level
Source: Center for Transit-Oriented Development, 2007
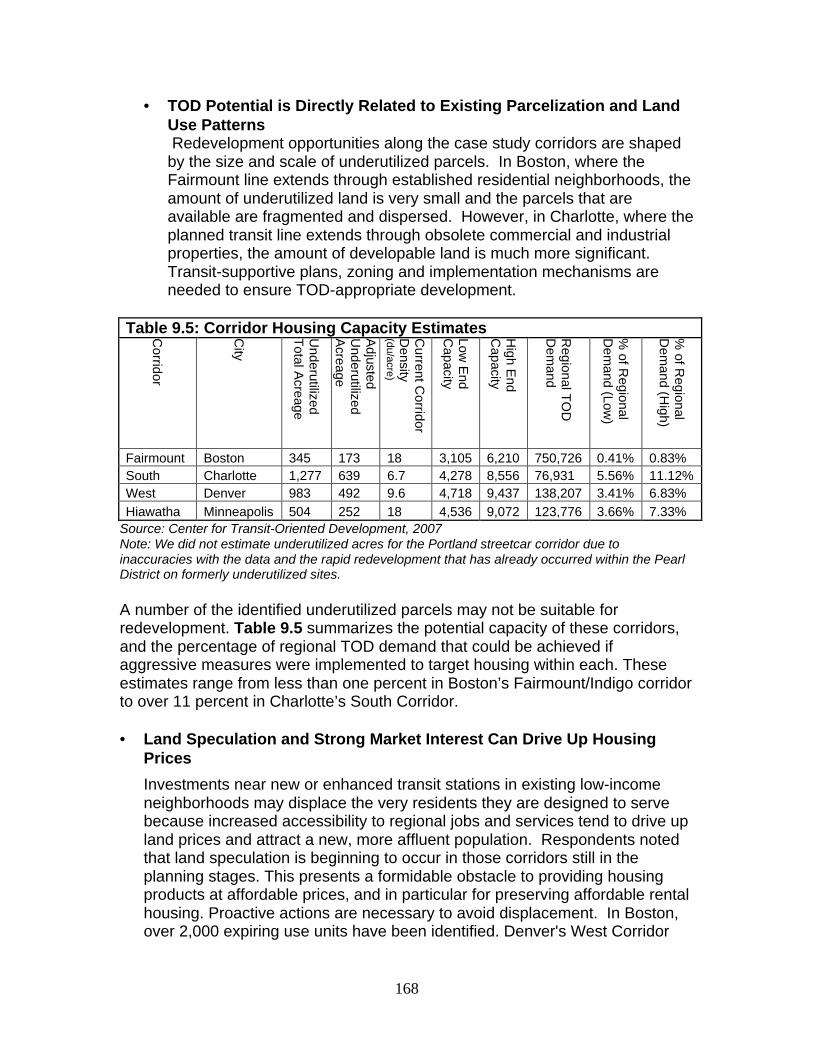
168
• TOD Potential is Directly Related to Existing Parcelization and LandUse Patterns Redevelopment opportunities along the case study corridors are shapedby the size and scale of underutilized parcels. In Boston, where theFairmount line extends through established residential neighborhoods, theamount of underutilized land is very small and the parcels that areavailable are fragmented and dispersed. However, in Charlotte, where theplanned transit line extends through obsolete commercial and industrialproperties, the amount of developable land is much more significant.Transit-supportive plans, zoning and implementation mechanisms areneeded to ensure TOD-appropriate development.
Table 9.5: Corridor Housing Capacity EstimatesCorridor
City
Underutilized
Total A
creage
Adjusted
Underutilized
Acreage
Current C
orridorD
ensity(du/acre)
Low E
ndC
apacity
High E
ndC
apacity
Regional T
OD
Dem
and
% of R
egionalD
emand (Low
)
% of R
egionalD
emand (H
igh)
Fairmount Boston 345 173 18 3,105 6,210 750,726 0.41% 0.83%South Charlotte 1,277 639 6.7 4,278 8,556 76,931 5.56% 11.12%West Denver 983 492 9.6 4,718 9,437 138,207 3.41% 6.83%
Hiawatha Minneapolis 504 252 18 4,536 9,072 123,776 3.66% 7.33%Source: Center for Transit-Oriented Development, 2007Note: We did not estimate underutilized acres for the Portland streetcar corridor due toinaccuracies with the data and the rapid redevelopment that has already occurred within the PearlDistrict on formerly underutilized sites.
A number of the identified underutilized parcels may not be suitable forredevelopment. Table 9.5 summarizes the potential capacity of these corridors,and the percentage of regional TOD demand that could be achieved ifaggressive measures were implemented to target housing within each. Theseestimates range from less than one percent in Boston’s Fairmount/Indigo corridorto over 11 percent in Charlotte’s South Corridor.
• Land Speculation and Strong Market Interest Can Drive Up HousingPricesInvestments near new or enhanced transit stations in existing low-incomeneighborhoods may displace the very residents they are designed to servebecause increased accessibility to regional jobs and services tend to drive upland prices and attract a new, more affluent population. Respondents notedthat land speculation is beginning to occur in those corridors still in theplanning stages. This presents a formidable obstacle to providing housingproducts at affordable prices, and in particular for preserving affordable rentalhousing. Proactive actions are necessary to avoid displacement. In Boston,over 2,000 expiring use units have been identified. Denver's West Corridor
169
has several distressed public housing properties close to proposed newstations. Improving and preserving housing choices for low-incomehouseholds can help to ensure that both housing and transportation costs aremore affordable to these residents.
• Market Readiness Shapes Development Response and Impacts LandValues The national trend towards urban, downtown living helped to spur market-rate development in Portland's Pearl district, Minneapolis's WarehouseDistrict, and Charlotte's Uptown. Experience along the Hiawatha line showsthat once the downtown housing market strengthened and becameexpensive, developers sought out housing sites at stations further fromdowntown. Developers say their clients are seeking less expensive housingwith easy access to downtown amenities. Boston also displays this trend,particularly as new development is beginning to emerge along theFairmount/Indigo Corridor as it contains some of the region’s last remainingaffordable housing. Improved transit service may accelerate the market forhousing in the corridor. Both the Denver and Charlotte systems could providesimilar experiences once their systems are built.
• Necessary infrastructure improvements to support TOD can be costlyThe ability to channel market forces to create a vision of change is a verypowerful tool that determines the success of a transit-oriented district.Additional new infrastructure, beyond the transit investment, may be needed,particularly for former industrial properties that are being redeveloped asresidential or mixed-use. Charlotte developed the South CorridorInfrastructure Program to address this challenge. In Massachusetts, theCommonwealth is taking the unusual step of reimbursing localities for the netcost of educating students in new housing located in smart growth districts, ofwhich include proximity to rail transit.
• Comprehensive Housing and Transportation Efforts Needed toStimulate Mixed-Income TOD In the Boston’s Fairmount corridor there has been quite a bit of affordablehousing development, largely led by four Community DevelopmentCorporations. In Portland, the City was able to use its entitlements process toleverage affordable housing through a series of development agreements thatlinked approvals to inclusionary housing. In Minneapolis, State legislationproactively links funding of affordable housing to efficient land use andtransportation infrastructure which has had the effect of channeling projectstoward the Hiawatha light rail corridor. Each of these examples is instructive,though none of the regions studied possess a comprehensive strategy forcreating and preserving housing for a range of incomes within the existingand proposed transit corridors. Such a strategy seems warranted to ensurethat a full range of housing choices exist, and that existing low-incomeresidents are not forced into other areas of the region that do not includetransit options that can help to reduce their overall household transportationcosts.
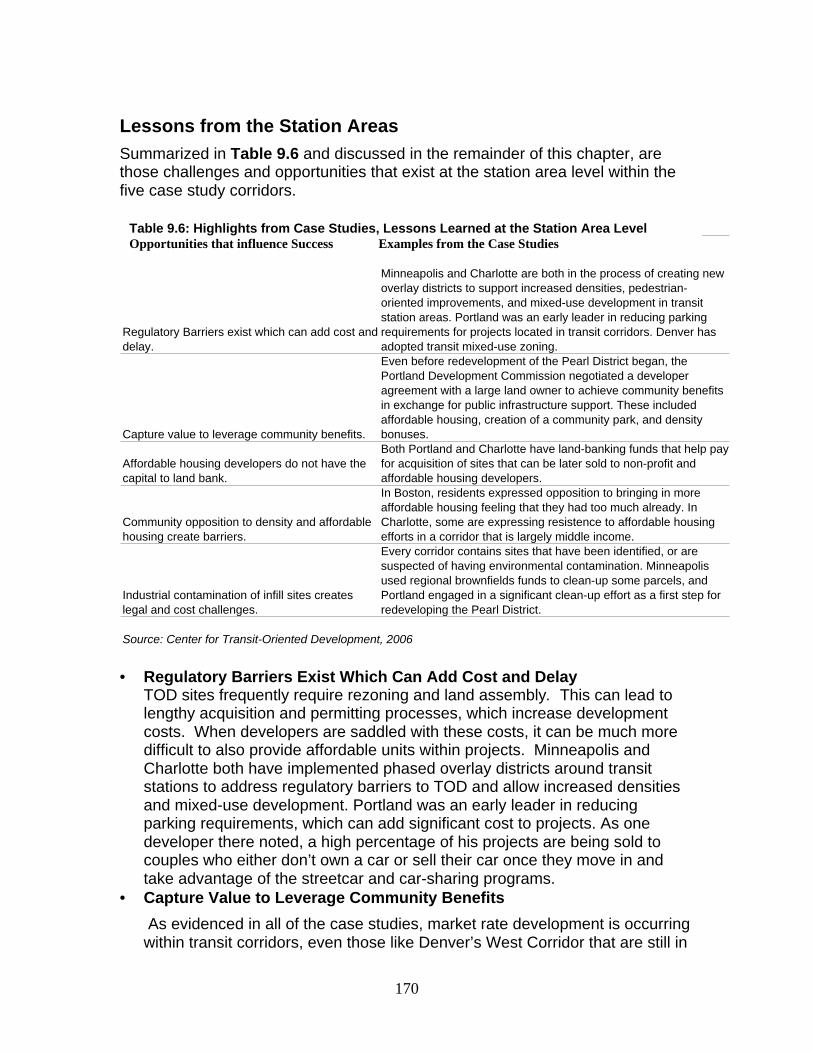
170
Lessons from the Station AreasSummarized in Table 9.6 and discussed in the remainder of this chapter, arethose challenges and opportunities that exist at the station area level within thefive case study corridors.
Opportunities that Influence Success Examples from the Case Studies
Regulatory Barriers exist which can add cost and delay.
Minneapolis and Charlotte are both in the process of creating new overlay districts to support increased densities, pedestrian-oriented improvements, and mixed-use development in transit station areas. Portland was an early leader in reducing parking requirements for projects located in transit corridors. Denver has adopted transit mixed-use zoning.
Capture value to leverage community benefits.
Even before redevelopment of the Pearl District began, the Portland Development Commission negotiated a developer agreement with a large land owner to achieve community benefits in exchange for public infrastructure support. These included affordable housing, creation of a community park, and density bonuses.
Affordable housing developers do not have the capital to land bank.
Both Portland and Charlotte have land-banking funds that help pay for acquisition of sites that can be later sold to non-profit and affordable housing developers.
Community opposition to density and affordable housing create barriers.
In Boston, residents expressed opposition to bringing in more affordable housing feeling that they had too much already. In Charlotte, some are expressing resistence to affordable housing efforts in a corridor that is largely middle income.
Industrial contamination of infill sites creates legal and cost challenges.
Every corridor contains sites that have been identified, or are suspected of having environmental contamination. Minneapolis used regional brownfields funds to clean-up some parcels, and Portland engaged in a significant clean-up effort as a first step for redeveloping the Pearl District.
Source: Center for Transit-Oriented Development, 2006
Table 9.5: Highlights from Case Studies, Lessons Learned at the Station Area Level
• Regulatory Barriers Exist Which Can Add Cost and DelayTOD sites frequently require rezoning and land assembly. This can lead tolengthy acquisition and permitting processes, which increase developmentcosts. When developers are saddled with these costs, it can be much moredifficult to also provide affordable units within projects. Minneapolis andCharlotte both have implemented phased overlay districts around transitstations to address regulatory barriers to TOD and allow increased densitiesand mixed-use development. Portland was an early leader in reducingparking requirements, which can add significant cost to projects. As onedeveloper there noted, a high percentage of his projects are being sold tocouples who either don’t own a car or sell their car once they move in andtake advantage of the streetcar and car-sharing programs.
• Capture Value to Leverage Community Benefits As evidenced in all of the case studies, market rate development is occurringwithin transit corridors, even those like Denver’s West Corridor that are still in
Table 9.6: Highlights from Case Studies, Lessons Learned at the Station Area LevelOpportunities that influence Success Examples from the Case Studies
171
the planning stage. As the local TOD market becomes more established thereare opportunities to provide incentives to developers through densitybonuses, reduced parking requirements, and infrastructure improvements thatcan create value which allow projects to be financially viable. Capturing thevalue created through these public incentives by requiring developercontributions in return can be an effective tool for achieving transit-supportiveland uses and intensities, and also community benefits. Even beforeredevelopment of the Pearl District began, the Portland DevelopmentCommission negotiated a developer agreement with a large land owner toachieve community benefits in exchange for public infrastructure support andincentives.
• Affordable Housing Developers Do Not Have the Capital to Land Bank Acquiring and holding land, also known as land banking, requiresconsiderable capital, especially when it may be 5 to 10 years before a railstation is built. This presents steep holding costs for any developer,particularly nonprofit developers that are most likely to produce below-market-rate housing. Furthermore, many traditional funding sources – includingCDBG, HOME and other federal housing funds – cannot be used to purchaseland, whereas transit properties are increasingly reluctant to purchase excessland during project construction out of concerns that increased project costscan negatively affect their chances at federal funding. Both Portland andCharlotte have land-banking funds that help pay for acquisition of sites thatcan be later sold to non-profit and affordable housing developers.
• Community Opposition to Density and Affordable Housing CreateBarriers Residents of established communities may be particularly resistant tochanges that are perceived as negatively impacting their property values orcommunity character. Initial resistance and development delays can beexpected with higher density projects, particularly without an inclusive,community planning process at the outset. Engaging the public is essential inthe planning and implementation phases. A number of new planning toolsfrom visual preference surveys to charrettes to design tools that engage,educate and excite the public. Federal transportation planning funds areavailable for many of these types of new planning tools.
• Industrial Contamination of Infill Sites Creates Legal and CostChallengesEvery corridor contains sites that have been identified, or are suspected ofhaving environmental contamination. Likely a number of the corridor-levelunderutilized parcels identified in this study are environmentallycontaminated. These “brownfields” present a cost hurdle to theirredevelopment, and include potential liability issues that need to be assessed.However, most states and regions provide specific funds for brownfieldsredevelopment that may actually create incentives and make them moredesirable properties to developers that can take advantage of theseprograms. Minneapolis used regional brownfields funds to clean-up some

172
parcels, and Portland engaged in a significant clean-up effort as a first stepfor redeveloping the Pearl District.
The final chapter builds off of the key findings from the case studies describedhere. It suggests a series of recommended actions by the local, regional, Stateand Federal partners that can help to promote more mixed-income housing neartransit.
173
Chapter 10: RecommendationsThe previous chapters of this study described the efforts being taken in fivedifferent regions to better link housing and transportation, indicating the promiseof and barriers to implementing mixed-income transit-oriented development.Chapter Nine summarized the lessons learned in terms of challenges,opportunities and market response to TOD that is occurring in Boston, Charlotte,Denver, the Twin Cities and Portland. This chapter provides recommendationsfor policymakers and practitioners pursuing mixed-income TOD based on thefindings from the five case studies and general observations about the maturingTOD marketplace.While there are challenges to providing mixed-income TOD, the experience ofthese five case study regions, and other emerging TOD markets, find thatsuccessful TOD requires proactive strategies to provide transit-supportive landuse conditions and catalysts for market response. Among the strategies to bepursued:
• Identify and utilize opportunities for TOD within the region and transitcorridors;
• Provide incentives for mixed-income market response;• Remove regulatory barriers to higher density, mixed-use development;• Coordinate long-range housing and transportation plans and investments;
and,• Improve local capacity and partnerships.
Table 10.1 on the next page illustrates recommended policies at the state,regional and/or local level to strengthen opportunities for creating mixed-incomehousing near transit. The table indicates the various governmental actors andopportunities for partnering with private sector actors, be they for-profit or non-profit. Each region has a unique set of public and private entities with a role toplay in supporting mixed-income housing near transit. These recommendationsprovide a guide for initiating the implementation process and identifyingopportunities for collaboration among several partners.3
The federal government is also an important partner. Improved coordination ofaffordable housing and transit investments can advance or be impeded throughits policies and financial assistance. This chapter concludes with a discussion ofpotential actions that should be considered at the federal level to improvecollaboration between federal agencies, to reward those communities investing in
3 One example of multi-agency collaboration is the effort to jump-start development along the Hiawathalight rail line in the Twin Cities. The Minnesota Department of Transportation was the primary agencyinvolved in building the Hiawatha line and had ownership of several acres of “left over” land after projectconstruction. These state owned parcels have for the most part, been transferred to the MetropolitanCouncil who is working with the City of Minneapolis to determine their future redevelopment potential. Inthis case, the state, region and local governments have all played a role in identifying and leveragingtransit-oriented opportunity sites.
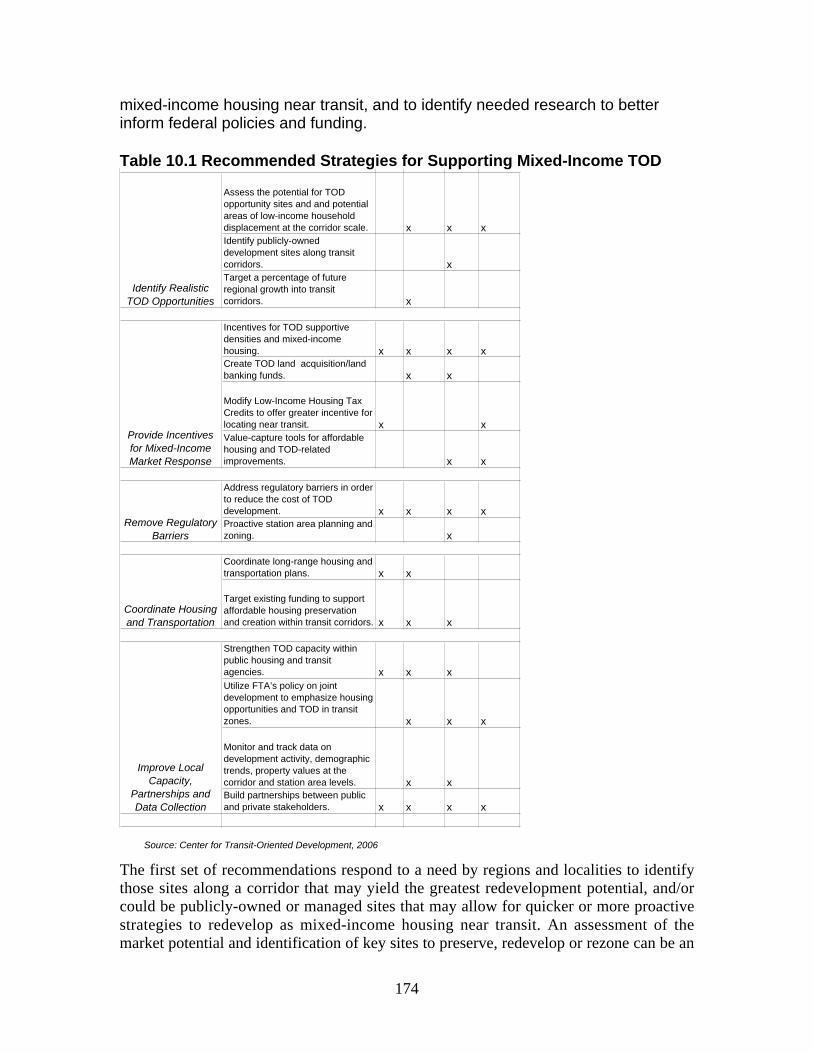
174
mixed-income housing near transit, and to identify needed research to betterinform federal policies and funding.
Table 10.1 Recommended Strategies for Supporting Mixed-Income TODState Regional Local Private Sector
Assess the potential for TOD opportunity sites and and potential areas of low-income household displacement at the corridor scale. x x xIdentify publicly-owned development sites along transit corridors. xTarget a percentage of future regional growth into transit corridors. x
Incentives for TOD supportive densities and mixed-income housing. x x x xCreate TOD land acquisition/land banking funds. x x
Modify Low-Income Housing Tax Credits to offer greater incentive for locating near transit. x xValue-capture tools for affordable housing and TOD-related improvements. x x
Address regulatory barriers in order to reduce the cost of TOD development. x x x xProactive station area planning and zoning. x
Coordinate long-range housing and transportation plans. x x
Target existing funding to support affordable housing preservation and creation within transit corridors. x x x
Strengthen TOD capacity within public housing and transit agencies. x x xUtilize FTA’s policy on joint development to emphasize housing opportunities and TOD in transit zones. x x x
Monitor and track data on development activity, demographic trends, property values at the corridor and station area levels. x xBuild partnerships between public and private stakeholders. x x x x
Mixed-Income Housing Strategy
Source: Center for Transit-Oriented Development, 2006
Identify Realistic TOD Opportunities
Provide Incentives for Mixed-Income Market Response
Remove Regulatory Barriers
Coordinate Housing and Transportation
Improve Local Capacity,
Partnerships and Data Collection
The first set of recommendations respond to a need by regions and localities to identifythose sites along a corridor that may yield the greatest redevelopment potential, and/orcould be publicly-owned or managed sites that may allow for quicker or more proactivestrategies to redevelop as mixed-income housing near transit. An assessment of themarket potential and identification of key sites to preserve, redevelop or rezone can be an
175
important first step in developing a comprehensive strategy to guide public investmentsand policies, and inform private housing developers.
I. Identify and Utilize Opportunities for TOD within the Regionand Transit Corridors• Target a significant percentage of future regional growth into transit
corridorsThe results of this study indicate that as transit systems expand and touch a largenumber of regional workplaces and destinations, they can encourage a wider rangeand number of household types. When developing regional long-range transportationplans, MPOs should be encouraged to study the demographics and market demand forfocusing a significant portion of regional housing growth into transit-accessiblelocations and providing new transit service to underserved areas.4
• Assess the potential for TOD opportunity sites and potential areas oflow-income household displacement at the corridor scale.The Corridor Typology and the methodology for identifying (re)developmentopportunities – looking at where new and proposed development is occurringand identifying underutilized sites – should be used by Cities to identifypotential TOD sites, inform regulatory reform and focus policy tools. Wheretransit corridors cross multiple local jurisdictional boundaries, corridor workinggroups should be formed to ensure consistent use of analytical tools andcoordinated strategies for catalyzing development on opportunity sites.5 Thesteps practitioners should take to identify opportunity sites include:• Identify the “type” of transit corridor according to the Corridor Typology
presented in this study;
• Identify transit zones and the market demand for new housing and jobs;
• Identify potential for (re)development within the transit zones;
• Identify the barriers to encouraging or attracting housing and affordablehousing development in transit zones; and
• Identify available tools (and try to develop missing tools) to help withattracting mixed-income housing in transit zones.
• Identify and utilize publicly-owned properties along transit corridors for mixed-income housing
4 The Southern California Association of Governments (SCAG) has developed a Compass Blueprint whichincludes its Two Percentage Strategy to focus new development within transit corridors, defined as GrowthOpportunity Areas.” http://www.compassblueprint.org/5 Multi-jurisdictional Corridor Working Groups are being used in the San Francisco Bay Area to respond tothe Metropolitan Transportation Commission’s TOD Policy, which requires local governments todemonstrate how they plan to meet identified thresholds for housing along transit corridors before capitalfunds are released. http://www.mtc.ca.gov/planning/smart_growth/
176
Housing authorities, cities, counties, state departments of transportation, and transitagencies often have property assets, ranging from land, buildings and excess facilitiesthat could be redeveloped to preserve public housing and create new affordablehousing for a range of underserved populations.6 Where feasible, these sites should beidentified and used to provide mixed-income housing, and to signal marketredevelopment potential. Enabling legislation may be necessary in those states thatprohibit public agencies from actively engaging in development activities.
II. Provide Incentives for Mixed-Income Market ResponseThe next set of recommendations address the frequent need for targeted publicintervention to address any existing barriers that may impede development,particularly of mixed-income housing near transit.• Create incentives for local jurisdictions to build at transit-appropriate
densitiesTransit and affordable housing are two significant public investments. Some regionsare tying the allocation of transit, infrastructure, and housing funds to agreements bylocal jurisdictions to deliver plans, zoning and other implementation tools thatdemonstrate a commitment to TOD.7 A number of potential incentives exist thatcould be developed and implemented at various governmental levels. Portland hasutilized developer agreements to achieve public benefits through density increases.Density bonuses are a common tool used in communities to provide incentives todevelopers to improve the rate of return on development in exchange for locally-determined benefits such as affordable housing, green space, historic preservation,streetscape improvements, etc. Reducing parking requirements for development neartransit can also provide developers an incentive to locate in a TOD. Some states, suchas Massachusetts, provide specific funds for development in existing transitcorridors.8
• Facilitate the Use of Value Capture Tools for Affordable Housing andTOD-related ImprovementsHigh infrastructure costs, land assembly, brownfield clean up and lengthypermitting processes often make building in transit zones very expensive.Adding the cost of providing income-restricted affordable housing units canmake projects infeasible. Tools such as Tax Increment Financing, BusinessImprovement Districts, assessment districts and developer agreements can
6 Public housing leaders Henry Cisneros, Jack Kemp, Kent Colton and Nicolas Retsinas are in the processof writing a new publication highlighting opportunities for improved state and local affordable housingpolicies. Opportunity and Progress: A Bipartisan Platform for State and Local Housing Policy is scheduledfor release in 2007 and preliminary materials indicate that it will be an important new resource.7 See the Regional TOD Policy of the San Francisco Bay Area’s Metropolitan Transportation Commission,http://www.mtc.ca.gov/planning/smart_growth/.8 Chapters 4-8 of this report describe a variety of incentives being used in the case study regions. TheCenter for Transit-Oriented Development website (www.reconnectingamerica.org) provides acomprehensive list of resources and examples.
177
generate funds to help pay for housing and infrastructure improvements thatbenefit the greater community. The administering agency bonds againstprojected revenue streams to finance public improvements, such as newsewers, streets, sidewalks, site clearance, removal of hazardous conditions,site assembly, shared parking and parks. By helping to upgrade localinfrastructure and ready sites for development, an Urban Renewal Authorityor other similar local entity can lower the cost of private development neartransit, making the provision of affordable housing more feasible.
• Create TOD Land Acquisition/Land Banking FundsA TOD land acquisition or land banking fund can enable the early purchase ofland around transit facilities, or corridors, where transit enhancements areplanned to safeguard land for affordable and mixed-income housing. Thesefunds can also serve a second purpose of acquiring existing housing andrequiring that it be kept affordable in perpetuity in neighborhoods that maybecome gentrified as higher-income individuals and families take advantageof transit proximity. Development fees, flexible use of some statetransportation or housing funds, foundation support, or other strategies couldbe used to create such local or regional funds.9
• Modify Low Income Housing Tax Credits to offer greater incentive forlocating near transitThe Low Income Housing Tax Credit program (LIHTC) is the greatest single sourceof funding for affordable housing at the state and regional levels. Twenty-eight statesalready give preference or require proximity to transit as criteria for distributed thesecredits. Four key changes by states in distributing their LIHTCs would go a long wayto making mixed-income TOD more feasible and far-reaching:
1. Points for Transit Proximity – help TOD projects score morecompetitively.
2. Basis Boost for TOD – increase the available subsidy for TODprojects.
3. Project Allotment Cap Increase – enable larger projects at TODsites to benefit from the LIHTC.
4. Prioritize tax credits for Preservation and Consolidate theUnderwriting processes to allow developers to apply for tax creditsand other resources simultaneously – help preserve rental TOD,and expedite TOD projects.
III. Remove Regulatory Barriers that Prevent Mixed-Income,Mixed-Use Development
9 A coalition of banks, foundations the City and housing providers has come together to fund an affordablehousing land acquisition fund for New York City. This new fund was announced by the City in 2006.
178
Regulatory barriers, be it zoning that does not allow for mixed-use development,densities that do not support transit service, inappropriate parking standards, orlack of pedestrian access to station areas, to name only a few, can stifle the TODmarket and add significant costs to projects. The next set of recommendations isaimed at identifying and addressing potential barriers that may impede the abilityto produce affordable housing within TOD projects.
• Address regulatory barriers in order to reduce the cost of TODdevelopment Too often, regulatory barriers stand in the way of delivering affordable ormixed-income housing. These include: (1) Local zoning codes that often donot allow for mixed-use, higher density development; (2) parkingrequirements that do not reflect the lower rates of auto ownership and use inthese types of projects and infrastructure standards do not reflect the multi-modal nature of TOD; (3) a complex and lengthy development process thatresults in many cases in high-end housing projects that are able to absorb thetime, uncertainty (or risk), and infrastructure costs of TOD. State, regionaland local government agencies should evaluate the rules that governdevelopment in transit zones and determine if barriers exist to building mixed-income TOD. Incentives and funding tools should be provided to help makeappropriate reforms and monitor performance.10
• Encourage proactive station area planning and zoning Developing a clear vision for redevelopment of a station area can help toprovide a more transparent process for both developers and communityresidents when projects are proposed. Often though, development projectsare approved on an incremental basis, without the guidance provided by along-range plan. This can lead to community opposition and unnecessarydelay of potentially appropriate projects. A TOD Strategic Plan that identifiesdesired place types at each transit station could be a first step to clarify goalsand expectations.11 Priority development locations should be targeted formore detailed station area planning efforts that are prepared in concert withthe community and define public infrastructure, building sites, open space anddesign standards. Once station area plans and zoning are put in place,individual development proposals can be evaluated against their compliancewith the plan, often with expedited approvals.12
10 The Atlanta Regional Commission, San Francisco Bay Area Metropolitan Transportation Commission,Southern California Association of Government and Oregon Department of Transportation each haveprograms in place to provide resources to local governments seeking to remove regulatory barriers forTOD. Often, transportation funds from the Congestion Mitigation and Air Quality (CMAQ) program areused to make grants for zoning code reform efforts and other activities that help pave the way for higherdensity development near transit.11 The City of Denver has developed a TOD Strategic Plan, available on-line to the public athttp://denvergov.org/TODStrategicPlan/tabid/395267/Default.aspx12 As mentioned in Chapter Seven, the City of Minneapolis has engaged residents along the HiawathaCorridor in a series of station area planning efforts for the six neighborhood station areas. The first four
179
IV. Coordinate Housing and Transportation Plans andInvestmentsA key recommendation resulting from this study is the need to better coordinatehousing and transportation planning and investments, at all levels of government.There are a variety of strategies that could be implemented ranging fromcoordination of Federally- required planning documents to local efforts to andencourage mixed-income housing near transit when possible.• Coordinate long-range housing and transportation plans
HUD and FTA require regions to prepare long and short range plans as key elementsof the federal housing and transportation funding process. As a condition to receiveCommunity Development Block Grants and other housing formula grants13, HUDrequires states, cities and counties to prepare a five-year Consolidated Plan, as wellas an annual Action Plan specifying the expenditure of funds in support of their longrange plans. Cities with populations of 50,000 or more, urban counties of 200,000 ormore and each state must provide a summary of the jurisdiction's estimated housingneeds for the ensuing five-year period, including an estimate of the number and typeof families in need of housing assistance and a summary of the cost burdenexperienced by extremely low-income, low-income, moderate-income, and middle-income renters and owners. At the same time, the U.S. Department of Transportation(DOT) requires states and metropolitan areas to develop a 20-year long rangetransportation plan and a four-year Transportation Improvement Program (TIP).Better coordination between these plans could result in more effective use of housingand transportation funds, and improved planning to address regional housing andtransportation needs. The primary obstacle to better coordination is the fact that theTIP is a metropolitan area-wide document, while the Consolidated Plan is undertakenby individual jurisdictions within metropolitan areas. Working together with MPOs,cities and counties may be able to identify particular projects that benefit in terms ofcost-efficiencies and impact by a coordinated approach.
• Target existing funding to support affordable housing preservation andcreation of new affordable housing within transit corridors
States, regions and cities utilize a variety of programs to finance affordablehousing and supportive services. (See matrix of TOD and affordable housingtools and funds within each case study chapter and in Appendix A.) Where
neighborhood station areas have completed detailed plans for pedestrian-oriented zoning overlays andrecommendations to change zoning, where appropriate. Efforts are underway to develop similar plans forthe remaining two neighborhood station areas. The City’s Corridor Housing Initiative helps withimplementation of these plans, focusing on preserving affordable housing along transit corridors.13 Home Investment Partnership (HOME) grants, and Emergency Shelter Grants (ESG)
180
there are substantial needs to preserve existing affordable housing, purchaserental properties for permanent use as affordable housing and/or build newaffordable housing, an effort should be made to determine if existingprograms can be targeted to transit-oriented locations. This approach makesit possible to direct resources to locations that provide substantial affordabilitybenefits to low income residents without necessarily expanding fundingsources.
V. Improve Local Capacity, Partnerships and Data CollectionThe final set of recommendations for state, regional and local actors speak to theneed to build staff and information capacity within agencies and to partner at avariety of levels. The case studies demonstrated a number of different methodsto achieving these recommendations be it assigning staff to focus on real estateissues, tracking development trends within corridors and using this information toengage citizens in station area planning, or taking advantage of Federal jointdevelopment authority where appropriate.• Strengthen the TOD capacity within public housing, cities and transit
agencies Massachusetts created a state-level TOD specialist to help coordinate state housing and
transit programs to support infill development around transit. Charlotte and Portlandboth have staff within their local transit agencies whose primary responsibilitiesinclude monitoring and supporting development around stations. These kinds ofpositions help create the capacity within public agencies to interface with the realestate and development communities, and to coordinate with other related publicagencies.
• Utilize FTA’s policy on joint development, to emphasize housingopportunities and TOD in transit zones
Real estate acquired by the transit agency for its stations, park-and-ride lots,and staging areas represents a significant opportunity to support localdevelopment plans for transit-oriented and mixed-income housing. Even theair rights above the transit station may be used for TOD. FTA’s new jointdevelopment policy provides unprecedented flexibility to the transit agencies tolease, or even sell, their property to facilitate joint development. Suchproperties could form the basis for significant new transit-orienteddevelopment that meets both the transit agency’s goals for increased ridershipand the local community’s goals for affordable, mixed-income housing.14
• Monitor and track data on development activity, demographic trends,and property values at the corridor and station area levelsThese kinds of data can be powerful tools to fine-tune policies aimed atpromoting TOD and mixed-income housing, educate members of thecommunity about trends in the area, and direct developers to (re)development
14 Examples of such “dual purpose” joint developments include Goose Hollow, in Portland, Oregon,Dublin/Pleasanton on the BART system in San Francisco, or Bethel New Life, in Chicago, Illinois.
181
opportunities. Keeping lines of communication open and based on facts, notrumor, can be enormously helpful as members of the public watch changehappen in their communities. Cities and regional agencies should beencouraged to build geographic-based databases to track this data and makeit publicly available.15
• Encourage Partnerships Between Public and Private StakeholdersAt the heart of all of these recommendations is a need for enhancedpartnerships between public agencies that intersect with housing and transitinvestments and policies, and between the public sector and private sectorstakeholders. Engaging the community as a full partner in the planning andimplementation of transit and housing investments can better affect the abilityof these investments to achieve community goals and visions, and to buildtrust. Partnering with the development, real estate and business communitiesmay result in projects that create enhanced development opportunities, butmay also create funding partnerships that leverage public and private dollars.Ensuring everyone is at the table to discuss where development is and shouldoccur in the future can result in an improved process and better projects.
Specific Federal RecommendationsThe Federal government is an important partner in building mixed-incomehousing near transit. Through its policies and investments, it can help shapeopportunities at the local level. There are a number of recommendations that theFederal Transit Administration and US Department of Housing and UrbanDevelopment could consider to improve the coordination between the twoagencies that would encourage similar cooperation at the state, regional andlocal levels. These recommendations address both how the two agencies couldwork together, as well as potential adjustments to existing policies and fundingprograms that could create greater incentives for communities to develophousing for a range of incomes near transit.• Continue to coordinate transportation and housing programs at the
federal levelFTA and HUD should establish an interagency working group responsible forfollowing through on the recommendations of this study. A primary function ofthis group would be to develop a Five-Year Research and Action Plan forMixed-Income TOD. The plan would identify the tools that are needed toimprove coordination of transportation and housing programs and the mostappropriate ways to develop them; potentially identifying specific projectsseeking federal funding on which to coordinate. Initial efforts might focus onhow to: track housing trends in transit-served regions, monitor the efficacy of
15 The City of Minneapolis is tracking development along the Hiawatha Corridor and using their datacollection effort to inform property owners, developers and neighborhood residents about developmenttrends and opportunities. A series of data and maps are available to the public via the Internet, seehttp://www.ci.minneapolis.mn.us/cped/projects_list.asp
182
the various policies and tools that have been deployed, identify performancemeasures for transit corridors and mixed-income TOD, identify and fundneeded research on best practices, and provide technical assistance.
• Use transportation and housing policies and funding to encouragemixed-income housing near transitHUD should explore regulatory and policy approaches that may increase the supplyof affordable or mixed-income housing within transit corridors. These would focus onpreservation of existing rental housing near transit, and new construction ofaffordable and mixed-income housing. One approach is to encourage this as anelement to be addressed in each community’s Consolidated Plan submittal. Anotherapproach could be to provide incentives in its competitive grant awards, such as thosefor Section 202 housing for the elderly or Section 811 for disabled persons, or HOPEVI, for projects that maximize access to transit, or are located adjacent to transit.
FTA will continue to evaluate and rate proposed major transit investmentsknown as New Starts and Small Starts (49 USC 5309) underCongressionally- mandated criteria. Under FTA’s current evaluativeprocedures, projects in areas with high population densities tend to earnbetter ratings because more people can walk to transit leading to higherridership and resulting benefits. FTA also gives higher ratings to projects thatserve higher numbers of lower income, transit-dependent people.Consequently, the net effect is that the higher the population of lower-incomeresidents near a transit station, the better the project’s anticipated ridershipand mobility benefits. FTA should explore other approaches for ratingprojects that demonstrate the potential for higher ridership by transitdependent populations.
• Consider implementing a federal affordability measurement (or Index)that reports on the combined costs of housing and transportation
Affordability is impacted both by housing and transportation, the two highesthousehold expenditures. For households earning $50,000 or less,transportation now costs more than housing in most metropolitan areas, andthis cost is highly dependent on the character of the location of housing.16
The Federal government should act to ensure that housing consumers(renters, homeseekers) and suppliers (investors, builders, regulators anddevelopers) are made aware of the full direct costs of housing. Only thefederal government can assure the multi-agency coordination necessary tokeep the data bases that such disclosure is dependent on, of high quality andup-to-date. HUD and FTA should consider whether or not, a measurementthat included these combined costs could be used by localities and regions toreport on metropolitan affordability at the regional and Census tract levels,and work to ensure that these costs are fully disclosed by the marketplace.
16 Barbara J. Lipman, A Heavy Load: The Combined Housing and Transportation Burdens of WorkingFamilies. Center for Housing Policy: October 2006.
183
One potential index that could be tested by FTA and HUD to determine itsapplicability is the Housing and Transportation Affordability Index, describedearlier in this study.17 A pilot program that uses the Affordability Index toevaluate planned investments and their impact on enhancing a region andneighborhood’s overall affordability could help determine the effectiveness ofsuch a tool.
• Accelerate efforts to preserve existing rental housing near transit, bothaffordable and market rateToday’s transit zones provide a large stock of rental housing, which generallyyield affordable housing for many segments of the population. Within thesupply of rental housing near transit, there is also a substantial stock ofaffordable-subsidized rental housing. Special efforts by HUD and localauthorities could be undertaken in order to identify the number HUD-fundedunits near transit and seek to protect those units with expiring affordabilityclauses. The next large expiration of HUD units will happen in 2009, andincludes thousands of units in regions with some of the worst housingaffordability crises.18 The cost for rehabbing and preserving existingaffordable units is 30 to 50 percent of the cost of building new and acquiringland for more rental housing near transit would be even more costly. HUD isencouraged to consider providing technical assistance and guidance to localcommunities before these units are lost to this market.
• Direct HUD funding sources to build housing near transit facilitiesHUD’s Community Development Block Grant (CDBG) funds are an importantsource of providing new affordable housing units. Previously the HOPE VI programhelped transform distressed public housing and integrate rental and home ownershipopportunities. These programs do not specifically identify transit-oriented locationsas priority sites for funding, nor do they recognize the affordability merits ofproviding housing near transit facilities. HUD should conduct a feasibility study todetermine the potential for directing existing programs such as CDBG, Market-to-Market, and other housing credit and bond programs toward developing newaffordable units in new and existing fixed-guideway transit corridors. HUD could alsodetermine the extent to which new funding sources are necessary to address theunique conditions present in TOD, such as higher land costs and rents.
• Continue to study the causal relationships between housing marketsand transit investmentsThis study is the first in many years to study the linkages between housing markets,transit investments, travel patterns and development trends. FTA and HUD should
17 Center for Transit-Oriented Development and Center for Neighborhood Technology, The AffordabilityIndex: A New Tool for Measuring the True Affordability of a Housing Choice. Brookings Institution, UrbanMarkets Initiative, Market Innovation Brief: January 2006. Also discussed in Chapter Two of this study,footnote 5.18 In Boston’s Fairmount/Indigo Line corridor, 2,200 expiring uses are set to expire in 2009. Local CDCsare concerned about the impact to these households, many of whom are older Americans, who have a needto be located near affordable transportation. This is an issue that came up in the other case studycommunities, but for which data was not readily available.
184
consider what, if any, funding sources, including the use of TransportationCooperative Research Program, HUD research program and the Center for TransitOriented Development’s federal funds, are available to provide guidance to policy-makers and practitioners.
Priority research items include:• Tracking development trends and transit ridership patterns in transit-served
regions;• Monitoring the efficacy of the various policies and tools that have been deployed
to promote or retain mixed-income housing in transit zones;• Identifying performance measures for transit corridors and mixed-income TOD
that can be used by state, regional and local agencies; and,• Further research on best practices and case studies on the benefits of mixed-
income TOD.
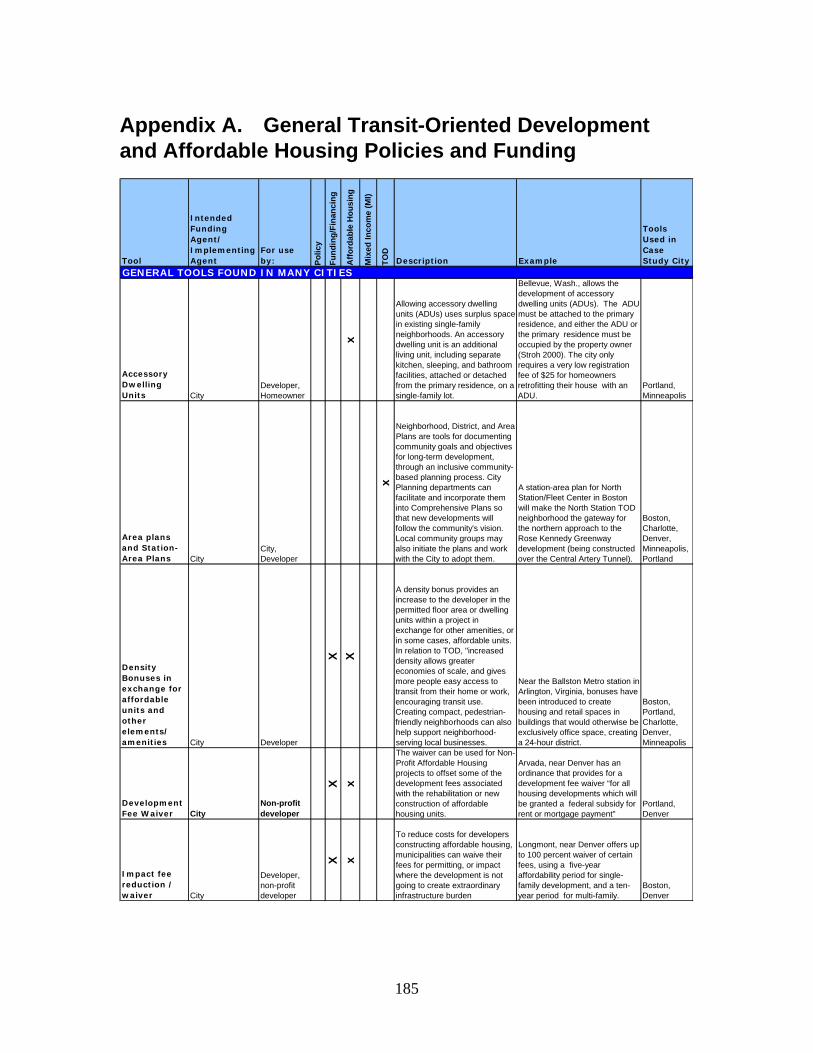
185
Appendix A. General Transit-Oriented Developmentand Affordable Housing Policies and Funding
Tool
Intended Funding Agent/ Implementing Agent
For use by: P
olic
y
Fu
nd
ing
/Fin
anci
ng
Aff
ord
able
Ho
usi
ng
Mix
ed I
nco
me
(MI)
TO
D
Description Example
Tools Used in Case Study City
GENERAL TOOLS FOUND IN MANY CITIES
Accessory Dwelling Units City
Developer, Homeowner
x
Allowing accessory dwelling units (ADUs) uses surplus space in existing single-family neighborhoods. An accessory dwelling unit is an additional living unit, including separate kitchen, sleeping, and bathroom facilities, attached or detached from the primary residence, on a single-family lot.
Bellevue, Wash., allows the development of accessory dwelling units (ADUs). The ADU must be attached to the primary residence, and either the ADU or the primary residence must be occupied by the property owner (Stroh 2000). The city only requires a very low registration fee of $25 for homeowners retrofitting their house with an ADU.
Portland, Minneapolis
Area plans and Station-Area Plans City
City, Developer
x
Neighborhood, District, and Area Plans are tools for documenting community goals and objectives for long-term development, through an inclusive community-based planning process. City Planning departments can facilitate and incorporate them into Comprehensive Plans so that new developments will follow the community's vision. Local community groups may also initiate the plans and work with the City to adopt them.
A station-area plan for North Station/Fleet Center in Boston will make the North Station TOD neighborhood the gateway for the northern approach to the Rose Kennedy Greenway development (being constructed over the Central Artery Tunnel).
Boston, Charlotte, Denver, Minneapolis, Portland
Density Bonuses in exchange for affordable units and other elements/ amenities City Developer
X X
A density bonus provides an increase to the developer in the permitted floor area or dwelling units within a project in exchange for other amenities, or in some cases, affordable units. In relation to TOD, "increased density allows greater economies of scale, and gives more people easy access to transit from their home or work, encouraging transit use. Creating compact, pedestrian-friendly neighborhoods can also help support neighborhood-serving local businesses.
Near the Ballston Metro station in Arlington, Virginia, bonuses have been introduced to create housing and retail spaces in buildings that would otherwise be exclusively office space, creating a 24-hour district.
Boston, Portland, Charlotte, Denver, Minneapolis
Development Fee Waiver City
Non-profit developer
X x
The waiver can be used for Non-Profit Affordable Housing projects to offset some of the development fees associated with the rehabilitation or new construction of affordable housing units.
Arvada, near Denver has an ordinance that provides for a development fee waiver “for all housing developments which will be granted a federal subsidy for rent or mortgage payment"
Portland, Denver
Impact fee reduction / waiver City
Developer, non-profit developer
X x
To reduce costs for developers constructing affordable housing, municipalities can waive their fees for permitting, or impact where the development is not going to create extraordinary infrastructure burden
Longmont, near Denver offers up to 100 percent waiver of certain fees, using a five-year affordability period for single-family development, and a ten-year period for multi-family.
Boston, Denver
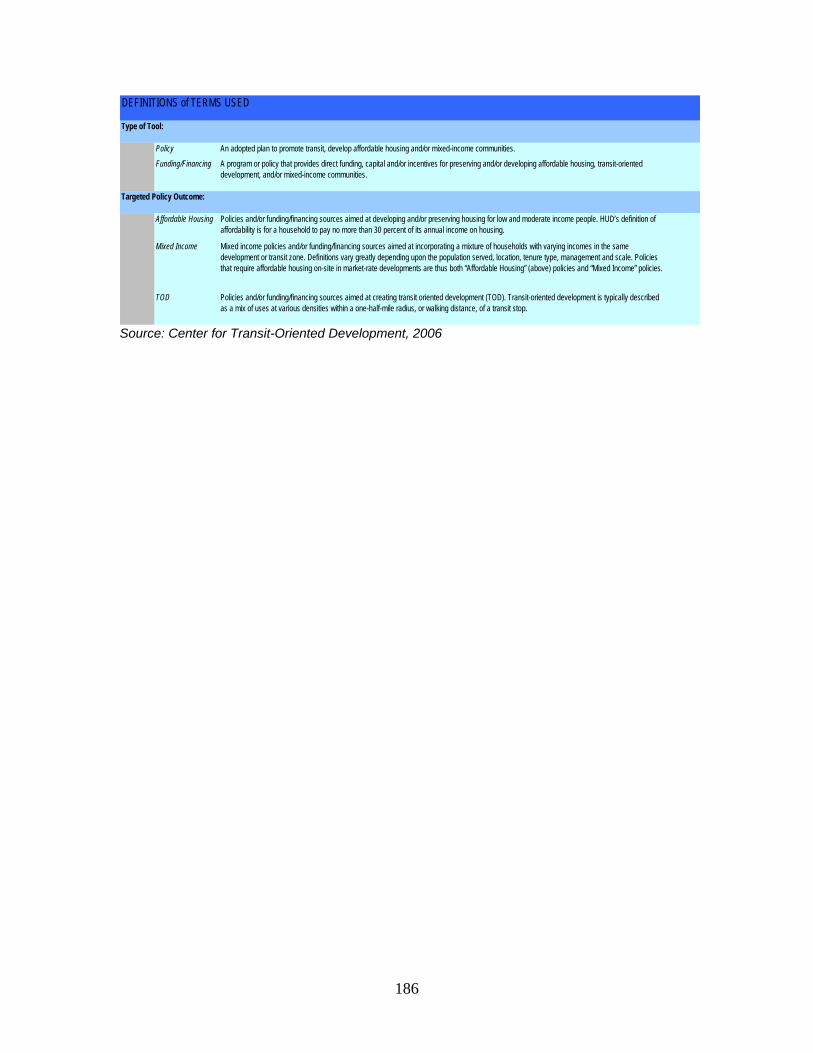
186
DEFINITIONS of TERMS USED
Type of Tool:
Policy An adopted plan to promote transit, develop affordable housing and/or mixed-income communities.
Funding/Financing A program or policy that provides direct funding, capital and/or incentives for preserving and/or developing affordable housing, transit-oriented development, and/or mixed-income communities.
Targeted Policy Outcome:
Affordable Housing Policies and/or funding/financing sources aimed at developing and/or preserving housing for low and moderate income people. HUD’s definition of affordability is for a household to pay no more than 30 percent of its annual income on housing.
Mixed Income Mixed income policies and/or funding/financing sources aimed at incorporating a mixture of households with varying incomes in the same development or transit zone. Definitions vary greatly depending upon the population served, location, tenure type, management and scale. Policies that require affordable housing on-site in market-rate developments are thus both “Affordable Housing” (above) policies and “Mixed Income” policies.
TOD Policies and/or funding/financing sources aimed at creating transit oriented development (TOD). Transit-oriented development is typically described as a mix of uses at various densities within a one-half-mile radius, or walking distance, of a transit stop.
Source: Center for Transit-Oriented Development, 2006
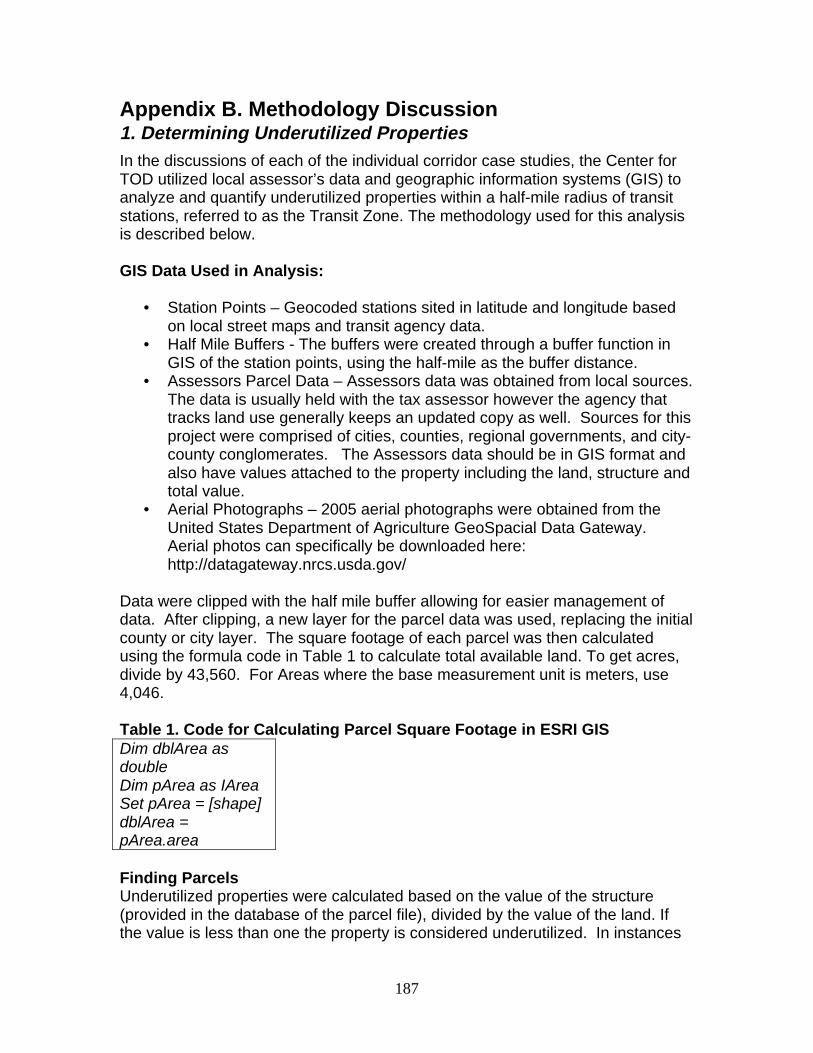
187
Appendix B. Methodology Discussion1. Determining Underutilized PropertiesIn the discussions of each of the individual corridor case studies, the Center forTOD utilized local assessor’s data and geographic information systems (GIS) toanalyze and quantify underutilized properties within a half-mile radius of transitstations, referred to as the Transit Zone. The methodology used for this analysisis described below.
GIS Data Used in Analysis:
• Station Points – Geocoded stations sited in latitude and longitude basedon local street maps and transit agency data.
• Half Mile Buffers - The buffers were created through a buffer function inGIS of the station points, using the half-mile as the buffer distance.
• Assessors Parcel Data – Assessors data was obtained from local sources.The data is usually held with the tax assessor however the agency thattracks land use generally keeps an updated copy as well. Sources for thisproject were comprised of cities, counties, regional governments, and city-county conglomerates. The Assessors data should be in GIS format andalso have values attached to the property including the land, structure andtotal value.
• Aerial Photographs – 2005 aerial photographs were obtained from theUnited States Department of Agriculture GeoSpacial Data Gateway.Aerial photos can specifically be downloaded here:http://datagateway.nrcs.usda.gov/
Data were clipped with the half mile buffer allowing for easier management ofdata. After clipping, a new layer for the parcel data was used, replacing the initialcounty or city layer. The square footage of each parcel was then calculatedusing the formula code in Table 1 to calculate total available land. To get acres,divide by 43,560. For Areas where the base measurement unit is meters, use4,046.
Table 1. Code for Calculating Parcel Square Footage in ESRI GISDim dblArea asdoubleDim pArea as IAreaSet pArea = [shape]dblArea =pArea.area
Finding ParcelsUnderutilized properties were calculated based on the value of the structure(provided in the database of the parcel file), divided by the value of the land. Ifthe value is less than one the property is considered underutilized. In instances
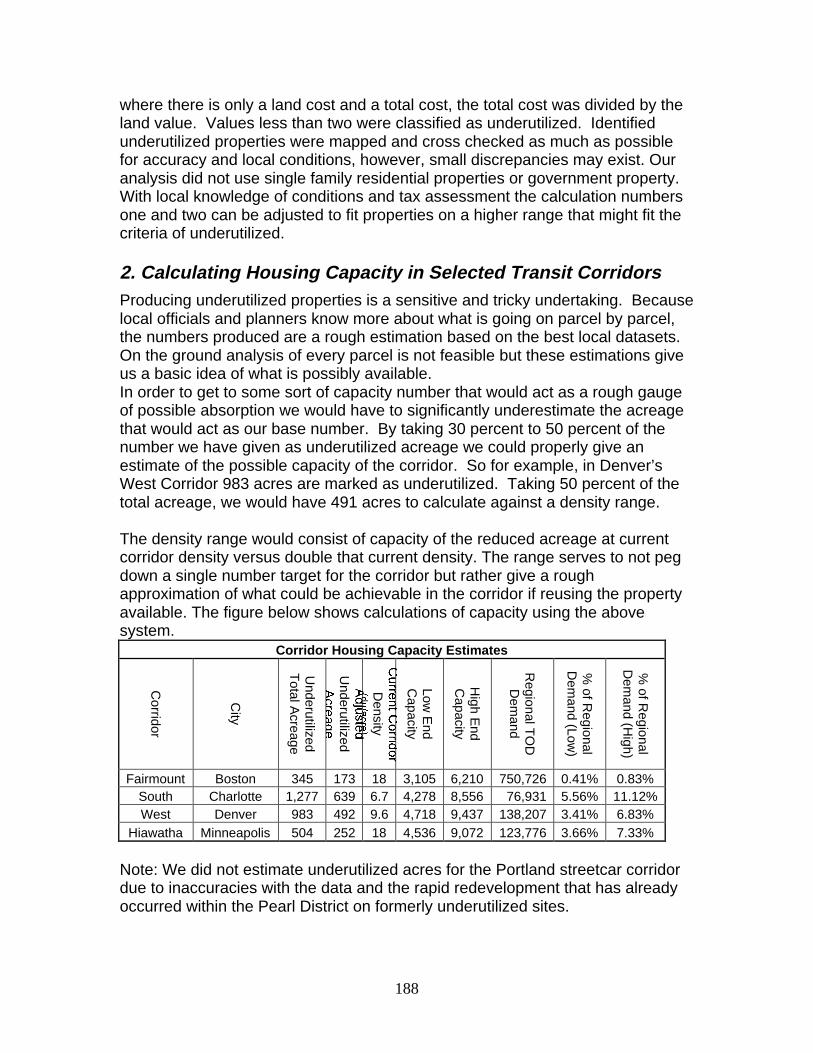
188
where there is only a land cost and a total cost, the total cost was divided by theland value. Values less than two were classified as underutilized. Identifiedunderutilized properties were mapped and cross checked as much as possiblefor accuracy and local conditions, however, small discrepancies may exist. Ouranalysis did not use single family residential properties or government property.With local knowledge of conditions and tax assessment the calculation numbersone and two can be adjusted to fit properties on a higher range that might fit thecriteria of underutilized.
2. Calculating Housing Capacity in Selected Transit CorridorsProducing underutilized properties is a sensitive and tricky undertaking. Becauselocal officials and planners know more about what is going on parcel by parcel,the numbers produced are a rough estimation based on the best local datasets.On the ground analysis of every parcel is not feasible but these estimations giveus a basic idea of what is possibly available.In order to get to some sort of capacity number that would act as a rough gaugeof possible absorption we would have to significantly underestimate the acreagethat would act as our base number. By taking 30 percent to 50 percent of thenumber we have given as underutilized acreage we could properly give anestimate of the possible capacity of the corridor. So for example, in Denver’sWest Corridor 983 acres are marked as underutilized. Taking 50 percent of thetotal acreage, we would have 491 acres to calculate against a density range.
The density range would consist of capacity of the reduced acreage at currentcorridor density versus double that current density. The range serves to not pegdown a single number target for the corridor but rather give a roughapproximation of what could be achievable in the corridor if reusing the propertyavailable. The figure below shows calculations of capacity using the abovesystem.
Corridor Housing Capacity EstimatesC
orridor
City
Underutilized
Total A
creage
Underutilized
Density
Low E
ndC
apacity
High E
ndC
apacity
Regional T
OD
Dem
and
% of R
egionalD
emand (Low
)
% of R
egionalD
emand (H
igh)
Fairmount Boston 345 173 18 3,105 6,210 750,726 0.41% 0.83%South Charlotte 1,277 639 6.7 4,278 8,556 76,931 5.56% 11.12%West Denver 983 492 9.6 4,718 9,437 138,207 3.41% 6.83%
Hiawatha Minneapolis 504 252 18 4,536 9,072 123,776 3.66% 7.33%
Note: We did not estimate underutilized acres for the Portland streetcar corridordue to inaccuracies with the data and the rapid redevelopment that has alreadyoccurred within the Pearl District on formerly underutilized sites.
189
Glossary of TermsADA Compliance - The Americans with Disabilities Act (ADA) is a wide-rangingcivil rights law that prohibits discrimination based on disabilityAffordable Housing – Defined as housing that costs no more than 30 percent of ahousehold’s annual income. Families who pay more than 30 percent of theirincome for housing are considered cost burdened and may have difficultyaffording necessities such as food, clothing, transportation and medical careAPTA - American Public Transportation Association, a national membershiporganization comprised of transit agency and industry representatives andadvocates.Area Median Income (AMI) - State and MSA-level calculations of median income,completed on a year-by-year basis by HUD, to establish maximum income limitsfor affordable housing programsAssessment Districts - District created by local jurisdiction or businesses tocollect taxes or other fees; many different types of assessment districtsBoston Redevelopment Authority (BRA) - Boston's planning and developmentagencyBus Rapid Transit (BRT) - Buses running in dedicated lanes that have increasedstation visibility and specific ITS (Intelligent Transportation Systems) capabilitiesBusiness Improvement District (BID) - See Assessment DistrictsCapacity – The approximate number of housing units that could beaccommodated on underutilized landCATS - Charlotte Area Transit SystemCBD - Central Business DistrictCDBG or Community Development Block Program - The largest Federal sourceof financial assistance for supporting neighborhood revitalization, housingrehabilitation and economic development activities; program is administered bythe US Department of Housing and Urban DevelopmentCommunity Development Corporation (CDC) - Non-profit entities that providebenefits and services to surrounding communities such as affordable housing,job training, or economic development projectsCharrette - A collaborative community planning and design process that bringsstakeholders together in intensive work sessions to develop plans for theirneighborhoods or regionsChoice Rider - Transit riders who could afford to own and operate a personalautomobile but choose to take transitCirculator - Term describing the transit function of streetcars, which oftencirculate people through a district rather than providing point to pointtransportationCommuter Rail - Class of transit vehicle; these passenger vehicles are requiredto be larger than light rail or heavy rail by the Federal Railroad Administrationbecause they run in similar right of ways as freight linesConsolidated Metropolitan Statistical Area (CMSA) - A geographic entitydesignated by the Federal Office of Management and Budget (OMB) for use byFederal statistical agencies; an area becomes a consolidated metropolitanstatistical area (CMSA) if it qualifies as a metropolitan area (MA), has a census
190
population of 1,000,000 or more, has component parts that qualify as primarymetropolitan statistical areas (PMSAs) based on official standards, and localopinion favors the designation. CMSAs consist of whole counties except in NewEngland, where they consist of county subdivisions (primarily cities and towns)Context Sensitive Design - An interdisciplinary design that involves allstakeholders to develop a multi-modal transportation facility that fits its physicalsetting and preserves scenic, aesthetic, historic and environmental resources,while promoting pedestrian safety and mobilityCorridor - The area served by a transit line from end to end; specifically definedin this study as the half-mile distance from the stations to the surroundingneighborhoods along the transit alignmentCTOD - Center for Transit-Oriented DevelopmentDHA- Denver Housing AssociationDisplacement - A process where land values increase in an existingneighborhood to the point that existing residents can no longer afford rents, salesprices, or taxes and are forced to seek housing elsewhereDRCOG - Denver Regional Council of GovernmentsDUA - Dwelling units per acre; or units per acreEconomic Development Corporation (EDC) - A non-profit entity that promoteseconomic development within a regionEntitlement Process - The range of steps that a developer must go through toobtain approvals for a proposed developmentEOT Massachusetts - Executive Office of Transportation for the Commonwealthof MassachusettsEuclidian Zoning - Standard zoning that promotes the separation of usesFAR - The floor to area ratio; buildings are regulated using FAR meaning that thearea of the building can be a certain size over the base land on which it sits,often by a multiplier such as 3:1Fastracks - Denver regional tax measure passed in 2005 to raise money fortransit expansionFinal Design - Phase in the New Starts or Small Starts process which includesright-of-way acquisition, utility relocation, and the preparation of final constructionplansFixed-Guideway Transit/Fixed-Route Transit - Transit vehicles operating in aseparated grade or lane specifically created for that transportation modeForm-Based Code - Development Code that prescribes the building typesinstead of usesFTA - Federal Transit AdministrationGrade Separation - See Fixed Guideway TransitGreyfields - Term used for an area that is not yet blighted but suffering fromexcess vacancies, that could be redeveloped for multiple usesHalf-Mile Radius - Typical Distance of the impact of fixed-guideway transit; alsoknown as 10 minute walkHeadway - The time between buses or trains operating on an identified routeHeavy Rail - Also known as metro systems, this rapid transit technology is fullygrade-separated and operates using electricity pulled from a third rail. Examples
191
of metro systems include the New York City subway, the Washington Metro andBART in San FranciscoHOME Grants - The largest Federal block grant given by the US Department ofHousing and Urban Development to State and local governments designedexclusively to produce affordable housing for low-income families.Home Rule - Resisting regulation by the State government in favor of selflegislation and regulationHOPE VI - A Federal housing program that began in 1992 to transform andreplace severely distressed public housing with innovative urban neighborhoodsthat tried to lessen concentrations of poverty and promoted mixed-incomecommunitiesHousers - Term coined for workers and practitioners in the housing industryHUD - The U.S. Department of Housing and Urban DevelopmentIn-Fill - Projects where underdeveloped or vacant properties in an existing urbanenvironment are redevelopedIntelligent Transportation Systems (ITS) - A worldwide initiative to addinformation and communications technology to transport infrastructure andvehiclesLand Assembly – Acquiring adjacent parcels of land for single ownership in orderto do a larger redevelopment projectLand Bank - To buy and hold land from speculative and developmentalpressures, potentially for a use that benefits the larger public such as affordablehousing or open spaceLight Rail Transit (LRT) - A range of rail transit that encompasses streetcarsthrough larger weight vehicles on mostly grade-separated systemsLocal Improvement District (LID) - See Assessment DistrictsLocation Efficiency - The conscious placement of homes, jobs, shopping,entertainment, parks and other amenities close to transit stations to promotewalking, biking and transit useLow- to Moderate-Income Working Families – Households in which at least onewage earner works the equivalent of a full-time job and earns from the minimumwage of $1,700 per month and up to 120 percent of the median income in theirareaMBTA - Massachusetts Bay Transportation AuthorityMetro HRA - Housing and Redevelopment Authority for the Twin Cities RegionMetro Transit - Transit Authority of the Twin Cities RegionMetropolitan Council - The Twin Cities Metropolitan Planning Organization thatmakes regional transportation, land use and public housing decisions andoperates the regional transit authorityMetropolitan Planning Organization (MPO) - The policy board of an organizationcreated and designated to carry out the metropolitan transportation planningprocess.Metropolitan Region - A major city center and surrounding cities and suburbs,generally defined in this report as the standard, Federally-defined MetropolitanStatistical Area (MSA) or Consolidated Metropolitan Statistical Area (CMSA)
192
Metropolitan Statistical Area (MSA) - A geographic entity designated by theFederal Office of Management and Budget for use by Federal statisticalagencies; a metropolitan statistical area (MSA) is a metropolitan area (MA) that isnot closely associated with another MA. An MSA consists of one or morecounties, except in New England, where MSAs are defined in terms of countysubdivisions (primarily cities and towns)Mixed-Income - A single neighborhood or development offering a range ofhousing pricesMode Share - The amount of people that use a particular mode of transportationNDC - Neighborhood Development CorporationNew Starts - A U.S. Department of Transportation program, authorized as part ofSAFETEA-LU, which serves as the Federal government’s primary financialresource for supporting locally-planned, implemented, and operated major transitcapital investments, including light rail, streetcars, commuter rail and bus rapidtransit systemsNIMBY - "Not in My Backyard" residents who oppose development in their areaOn-Street Parking - Parking that is located in the public right of wayParcelization - The division of land into smaller pieces; land owners with largeparcels might want to parcelize their property and sell off the smaller piecesParking Requirements/Ratios - The amount of parking that is required bydevelopment codes associated often with the square footage of a space; e.g.One parking space for 250 Square Feet of a developmentPDC - Portland Development CommissionPedestrian-Orientation - Specifically building to cater to the needs of pedestriansinstead of automobilesPedscape - The landscape as designed for pedestriansPlace-Making - The creation of place through pedestrian orientation and publicspaces in the public realm of a districtPortland Metro - The Portland Metropolitan Planning Organization that makesregional transportation, land use and public housing decisions; it is the onlyelected regional government in the countryPotential Demand - The projectednumber of households that are likely to prefer relatively compact housing in atransit zone if such housing exists with the characteristics they deem important,including but not limited to neighborhood amenities such as retail, unit size, andcompetitive pricingPrimary Metropolitan Statistical Area (PMSA) - A geographic entity designated bythe Federal Office of Management and Budget for use by Federal statisticalagencies. If an area that qualifies as a metropolitan area (MA) has a censuspopulation of one million or more, two or more primary metropolitan statisticalareas (PMSAs) may be defined within it if they meet official standards and localopinion favors the designation. When PMSAs are established within an MA, thatMA is designated a consolidated metropolitan statistical area (CMSA)Public/Private Partnership - A system in which a government service or privatebusiness venture is funded and operated through a partnership of governmentand one or more private sector companiesPUMS - Public Use Microdata Series
193
Rapid Transit – High-capacity, high-frequency transit operation that often runs inits own guideway or right-of-wayRegion - In this report the region refers to the metropolitan region, but can alsorefer to much larger land areas such as the southeast region of the United Statesor other geographic areasResidential Density - Housing Units per Acre of residential landRidership - Amount of riders on a system, often calculated by year or averageweekdayRight-of-Way (ROW) - The path owned by government agencies through whichtransportation whether road or rail passesRTD Denver - Regional Transportation District, Denver’s regional transit agencySmart Growth - Well-planned development that protects open space andfarmland, revitalizes communities, keeps housing affordable, promotes economicdevelopment and provides more transportation choices. Smart Growth promotescooperation between often diverse groups to arrive at sustainable long-termstrategies for managing growthStreetcar - A subset of light rail in which the primary operations of the vehiclesare in the street mixed with trafficStreetcar Suburbs - Communities that were shaped and served by streetcarsduring the late 19th to early 20th Centuries at which time streetcars were mostpopularStreetscaping - The addition of special attributes to a street such as trees,benches and other amenitiesSurface Parking - Parking located on the surface of a property; a surface parkinglotTax Increment Financing (TIF) - A tool used to capture the future tax benefits ofreal eState improvements in a designated area to pay the present cost of thoseimprovementsTransit Corridor – (See Corridor)Transit Region - A metropolitan area, according to standard Census definedareas, with a fixed-guideway transit system. Depending on the region and thesize of the system, the metropolitan areas are either Metropolitan StatisticalAreas (MSAs), Primary Metropolitan Statistical Areas (PMSAs), or ConsolidatedMetropolitan Statistical Areas (CMSAs).Transit Zone (TZ) - The area around a transit station consisting of everythingwithin a half-mile radius of that stationTransit-Oriented Development (TOD) - Includes the whole district surroundingthe station, comprised of several projects and a mix of uses, the streetscape andwalking environment, and integrated design, land use and activity that supporttransportation choiceTri-Met or Tri-County Metropolitan Transportation Authority - Transit Authority forthe Portland regionTwin Cities - Name of the region that refers to the cities of Minneapolis and St.Paul and the surrounding seven- county metropolitan areaULI - Urban Land Institute
194
Urban Mass Transportation Administration (UMTA) - now the Federal TransitAdministration or FTAUnderutilized Properties - In this study, underutilized property means parcels withless than a 1:1 land improvement to land value ratio, meaning the properties areworth less than the land on which they are builtValue Capture - For local governments, value capture can mean higher taxrevenues from increased sales and property values; for the transit agency, valuecapture means lease revenues from joint development, increased fareboxrevenues, and lower costs for providing accessVehicle Miles Traveled (VMT) - The total number of miles traveled in automobileand other vehicles for a specified areaWorkforce Housing - Residential units that are offered at the going market rate,but that are affordable to the typical household with at least one full-time wageearner; often contrasted with luxury housing