2007 Nigeria Telecommunications Sector … Nigeria Telecommunications Sector Performance Review a...
58
2007 Nigeria Telecommunications Sector Performance Review a supply side analysis of policy outcomes IKE MOWETE
Transcript of 2007 Nigeria Telecommunications Sector … Nigeria Telecommunications Sector Performance Review a...

2007 Nigeria Telecommunications
Sector Performance Reviewaa ssuuppppllyy ssiiddee aannaallyyssiiss ooff ppoolliiccyy oouuttccoommeess
IKE MOWETE
This Policy Research Paper Series is madepossible through the support of the International Development Research Centre(IDRC)
For further information see http://link.wits.ac.za
Tel:+27 11 7173913
Fax:+27 11 7173910
LINK Centre
Graduate School of Public Development Management
Witwatersrand University
Johannesburg
Box 601, Wits, 2050
http://link.wits.ac.za
nigeria country profile alt 1.qxp 2008/03/31 10:17 AM Page 1

NNiiggeerriiaa
1 2007 Telecommunications Sector Performance Review
12. newnigeria.qxp 2008/03/28 11:37 AM Page 1

NNiiggeerriiaa
2 2007 Telecommunications Sector Performance Review
12. newnigeria.qxp 2008/03/28 11:37 AM Page 2
2007 Nigeria
Telecommunications Sector Performance Review
a supply side analysis of policy outcomes
A Ike Mowete
Associate Professor of Telecommunications Engineering
and Nodal Member for RIA! Network, Nigeria
Faculty of Engineering, University of Lagos, Nigeria
12. newnigeria.qxp 2008/03/28 11:37 AM Page 3
NNiiggeerriiaa
4 2007 Telecommunications Sector Performance Review
SERIES EDITOR:
Alison Gillwald
Other country studies in this series are available on
www.researchICTafrica.com.
Proof reading: Beki Nkala
This research is made possible by the support of the Independent Development Research
Centre, (IDRC), Ottawa, Canada.
Senior Programme Manager:
Heloise Emdon, [email protected]
South Africa
For further information contact the RIA! coordinator Beki Nkala on
[email protected] or go to www.researchICTafrica.net
! Benin: Augustin Chabossou
! Botswana: Sebusang Sebusang, MP Makepe andTD Botlhole
! Burkina Faso: Pam Zahonogo
! Cameroon: Olivier Nana Nzèpa and Robertine Tankeu
! Côte d'Ivoire: Arsene Kouadio
! Ethiopia: Lishan Adam
! Ghana: Godfred Frempong
! Kenya: Tim Waema
! Mozambique: Americo Muchanga and Francisco Mabila
! Namibia: Christoph Stork and Mariama Deen-Swarray
! Rwanda: Albert Nsengiyumva and Annet B Baingana
! South Africa: Steve Esselaar and Alison Gillwald
! Tanzania: Ray Mfungayma and Haji Semboja
! Uganda: FF Tusubira, Irene Kaggwa-Sewankambo, Apolo
Kyeyune, Ali Ndiwalana, Annrita Ssemboga
! Zambia: Sikaaba Malavu
12. newnigeria.qxp 2008/03/28 11:37 AM Page 4

NNiiggeerriiaa
52007 Telecommunications Sector Performance Review
RESEARCH ICT AFRICA!(www.researchICTafrica.net)
Research ICT Africa! (RIA!) seeks to fill a strategic gap in the develop-
ment of a sustainable information society and network economy by building the ICT policy and regulatory
research capacity needed to inform effective ICT governance in Africa.
The establishment of the Research ICT Africa! network emanates from the growing demand for data and
analysis necessary for appropriate but visionary policy required to catapult the continent into the infor-
mation age. Through network development RIA! has started to build an African knowledge base in sup-
port of ICT policy and regulatory design processes, and to monitoring and review policy and regulatory
developments on the continent.
The research, arising from a public interest agenda, is made available in the public domain and individ-
uals and entities from the public and private sector and civil society are encouraged to use it for teach-
ing, further research or to enable them to participate more effectively in national, regional and global ICT
policy formulation and governance.
RIA! seeks to extend its activities through national, regional, continental and global partnerships. It is
part of the research and training collaborative LIRNE (www.lirne.net) and peers with other networks in
the South, specifically LIRNEasia (www.lirneasia.net) and DIRSI (www.dirsi.net) in Latin America.
The network currently consists of nodal members from 17 African institutions:
Benin – CEFRED, Université d'Abomey Calavi
Botswana – University of Botswana
Burkina Faso – CEDRES, University of Ouagadougou
Cameroon – University of Yaounde II
Côte d'Ivoire – CIRES, l'Université Nationale de Côte d'Ivoire
Ethiopia – University of Addis Ababa
Ghana – STEPRI of CSIR
Kenya – University of Nairobi
Mozambique – Universidade Eduardo Mondlane
Namibia – Namibia Economic and Policy Research Unit
Nigeria – University of Lagos
Rwanda – KIST (Kigali Institute of Science, Technology and Management
Senegal – CRES
South Africa – LINK Centre, University of Witwatersrand
Tanzania – Tanzania Communications Regulatory Authority
Uganda – University of Makerere
Zambia – University of Zambia
East Africa Regional Manager: Dr Lishan Adam
West Africa Regional Manager: Dr Olivier Nana Nzépa
COUNTRY PROFILE SERIES
12. newnigeria.qxp 2008/03/28 11:37 AM Page 5

NNiiggeerriiaa
6 2007 Telecommunications Sector Performance Review
12. newnigeria.qxp 2008/03/28 11:37 AM Page 6

NNiiggeerriiaa
72007 Telecommunications Sector Performance Review
TABLE OF CONTENTS
Executive Summary 9
Introduction 12
Policy and Regulatory Environment 13
Market Structure 31
Access to ICTs 27
Cost of ICT usage 34
Sector Achievements and Regulatory Challenges 41
Conclusion and Recommendations 44
References 47
Annexe A 48
Annexe B 52
Annexe C 55
12. newnigeria.qxp 2008/03/28 11:37 AM Page 7

NNiiggeerriiaa
8 2007 Telecommunications Sector Performance Review
12. newnigeria.qxp 2008/03/28 11:37 AM Page 8
NNiiggeerriiaa
92007 Telecommunications Sector Performance Review
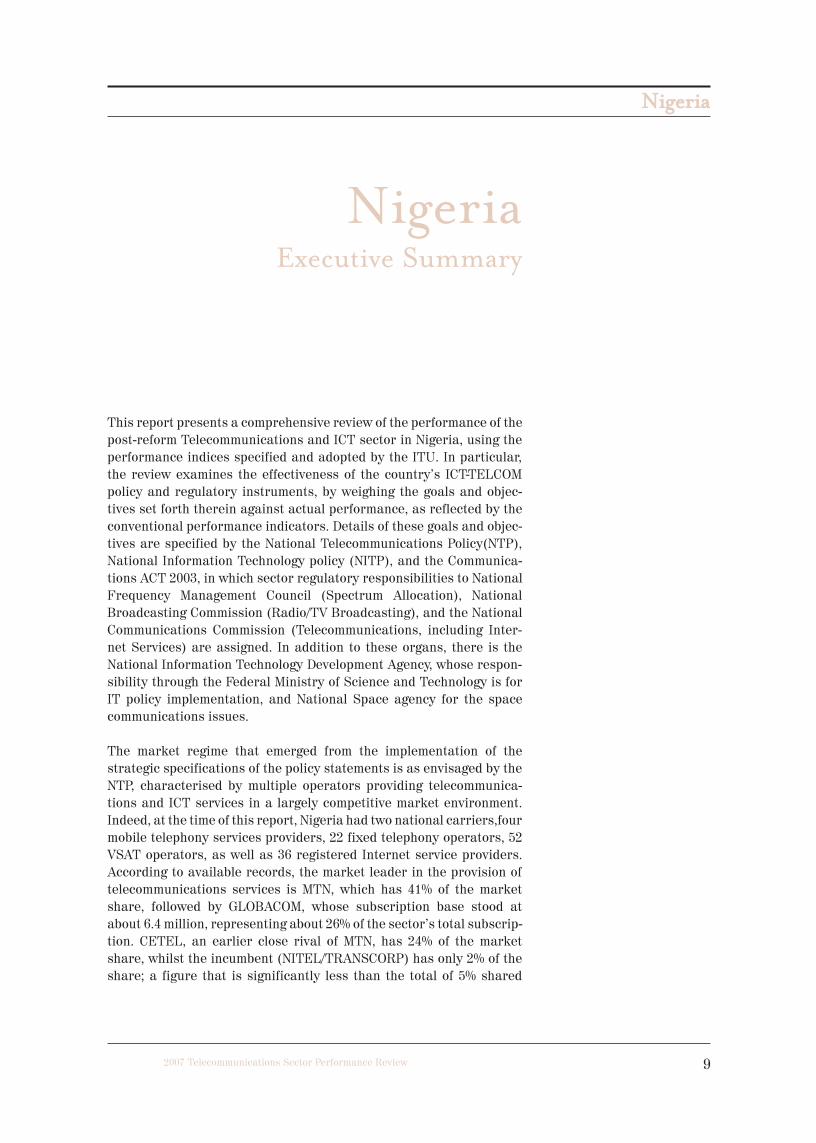
This report presents a comprehensive review of the performance of the
post-reform Telecommunications and ICT sector in Nigeria, using the
performance indices specified and adopted by the ITU. In particular,
the review examines the effectiveness of the country’s ICT-TELCOM
policy and regulatory instruments, by weighing the goals and objec-
tives set forth therein against actual performance, as reflected by the
conventional performance indicators. Details of these goals and objec-
tives are specified by the National Telecommunications Policy(NTP),
National Information Technology policy (NITP), and the Communica-
tions ACT 2003, in which sector regulatory responsibilities to National
Frequency Management Council (Spectrum Allocation), National
Broadcasting Commission (Radio/TV Broadcasting), and the National
Communications Commission (Telecommunications, including Inter-
net Services) are assigned. In addition to these organs, there is the
National Information Technology Development Agency, whose respon-
sibility through the Federal Ministry of Science and Technology is for
IT policy implementation, and National Space agency for the space
communications issues.
The market regime that emerged from the implementation of the
strategic specifications of the policy statements is as envisaged by the
NTP, characterised by multiple operators providing telecommunica-
tions and ICT services in a largely competitive market environment.
Indeed, at the time of this report, Nigeria had two national carriers,four
mobile telephony services providers, 22 fixed telephony operators, 52
VSAT operators, as well as 36 registered Internet service providers.
According to available records, the market leader in the provision of
telecommunications services is MTN, which has 41% of the market
share, followed by GLOBACOM, whose subscription base stood at
about 6.4 million, representing about 26% of the sector’s total subscrip-
tion. CETEL, an earlier close rival of MTN, has 24% of the market
share, whilst the incumbent (NITEL/TRANSCORP) has only 2% of the
share; a figure that is significantly less than the total of 5% shared
NigeriaExecutive Summary
12. newnigeria.qxp 2008/03/28 11:37 AM Page 9

NNiiggeerriiaa
10 2007 Telecommunications Sector Performance Review
among the Private Telephone Operators (PTOs), who offer fixed wire-
less services, using the TDMA standard in the main.
The review’s finding revealed that private investments in the telecommu-
nications sector, which stood at US$50million in 1999 rose to US$1 200
million in 2001 and was in excess of US$10 billion by the end of 2006. Indi-
cations are that this trend will continue in 2007, particularly with the
imminence of a “unified licence” regime, under which, with the termina-
tion of the exclusivity period granted to pioneering operators of mobile
telecommunications services, operators can obtain licences to offer the
range of services available within the sector. As may be expected, this
growth in private investment impacted positively , and proportionately,
on the sector’s employment profile. For example, in 1999, the total num-
ber of employees in the communications sector was 17,409, representing
0.48% of the total employment figure, but by 2005, the figures had
increased respectively, to 467,260 and 10.32%. From the point of view of
real growth in access to ICTs, the sector performance may be rated as
satisfactory because penetration statistics suggest that the penetration
rate, particularly for the rural areas where majority of the citizens
reside, is still rather low. Data obtained from the National Bureau of Sta-
tistics (NBS) and the National Communications Commission show that
the total number of Internet users in Nigeria was as low as 107,194, and
that whereas this number increased ten-fold to 1,769,661 in 2004, and to
2,040,814 in 2006, the penetration rate has yet to approach 5%. Even
then, the majority of the users are urban dwellers, most of whom (close
to 80%) reside in Lagos, Nigeria’s commercial capital. On the other hand,
the telephony penetration rate (teledensity increased from less than 2%
in 2000 to close to 25% by 2006) has steadily increased, evidently due to
subscriptions to mobile communications services, which in 2006
accounted for some 95% of the total telephony subscription base. It is
noteworthy that over the years, pre-paid subscribers have consistently
outnumbered contract subscribers, the figure in 2006 being some
21,000,000 for pre-paid compared with about 200,000 contract sub-
scribers. One of the main achievements of the reform model in use con-
cerns the significant reduction in call tariffs, typified by the fact that in
2000, before the introduction of market reforms, international calls cost
an average of NDN130 per minute; but by 2006 the rate had fallen to less
than NDN30 per minute, with indications that more reductions will be
recorded in future.
The review concludes that, in the main, market entry in the sector has
become much easier than before, and that this has not only attracted
remarkable increases in the level of investment, but that the resulting
level of competition has contributed to significant reductions in teleph-
ony tariff regimes. Although some 520 operators were granted licences
to operate as Internet Service Providers (ISPs), most of them using
VSAT technologies to support about 2,350 Cybercafés nationwide, the
12. newnigeria.qxp 2008/03/28 11:37 AM Page 10

NNiiggeerriiaa
112007 Telecommunications Sector Performance Review
Internet penetration rate has remained low, evidently because of the
cost of acquiring personal computers. Most Nigerians perceive the
main sector regulator (NCC) as effective in several areas, but that
effectiveness has yet to translate into compelling the mobile communi-
cations operators to improve the quality of voice communications serv-
ices, which is poor indeed. Access to the ICTs in rural areas remains a
big issue some five years after market liberalisation; nonetheless, it
would appear that the Universal Access policies, which were being
implemented at the time of this review, have the potential of making the
difference and hence realising one of the core objectives of market
reforms.
On average, the review finds that the sector in Nigeria has performed
satisfactorily when rated in terms of the conventional performance
indicators, but that there is a lot of room for improvement, particularly
in the areas of quality of service and universal service.
12. newnigeria.qxp 2008/03/28 11:37 AM Page 11

NNiiggeerriiaa
12 2007 Telecommunications Sector Performance Review
Introduction
For the developing countries of the world, the most compelling argu-
ments for the adoption of policy reform models for the telecommunica-
tions and ICT sectors are those concerning predictions of accelerated
socio-economic development with the potential of alleviating poverty and
more generally, improving standards of living. It follows therefore, that
any assessment of the performance of a developing country’s ICT sector
necessarily measures the extent to which the sector has contributed to
growth and associated national development aspirations. This is done
using the metrics of performance indicators, including cost, spread, den-
sity, quality, and depth of use in daily living, of the telecommunications
and ICT services in that country. As pointed out by Ndukwe (2005), the
ability of market reform models to eventually deliver on the promises of
growth is not in doubt, but the experiences of several developing nations
indicate that the degree of success depends significantly on the nature
and peculiarities of the market environment. In the case of Nigeria
Ndukwe suggests that the delay in the privatisation of the incumbent had
some negative impacts, which, nonetheless, did not adversely affect net
performance, mainly because of a “fair, firm, and forthright regulatory
environment”. In a related contribution, Wills and Daniels (2003) took
the position that the “extensive cost distribution model” adopted by
Nigeria for the deregulation of the telecommunications market, and
which witnessed the licensing of several small operators as a tool for
effectively meeting market demands, has been largely successful, but at
the cost of certain regulatory challenges, including managing a rather
complex market. One important implication of the foregoing observa-
tions is the view that when the regulatory environment is well-organised,
the ICT sector can grow and contribute to economic growth, even if the
policy framework is lacking is some other desirable respects.
It is the main objective of this presentation to review the performance of
the ICT sector in Nigeria (as part of a continent-wide review1
), towards
establishing, to the extent that as it is possible to do so, a measure of how
policy implementation has reflected set specific policy objectives. The
review starts with a brief description of the policy and regulatory envi-
ronment as defined by the existing policy framework, institutional
arrangements, nature of competition issues, regional and GATS commit-
ments, and new policy developments. Attention is then focused on the
country’s market structure and examines the status of access to the
ICTs, as measured in terms of the rural/urban divide profiles of mobile
communications and Internet use data. After reviewing the cost of ICT
usage, an analysis is undertaken to determine the extent to which per-
formance compares with planned objectives, and based on that analysis,
challenges faced by sector regulation in the country are identified and
briefly described. This is followed by concluding remarks , including indi-
cated recommendations for the improved performance of the sector.
1See Telecommunications Sector Performance in 16 African Countries; a supply-side analysis of
policy outcomes www.researchICTafrica.com
12. newnigeria.qxp 2008/03/28 11:37 AM Page 12

NNiiggeerriiaa
132007 Telecommunications Sector Performance Review
Policy and Regulatory Environment
It may be said that the protracted process of market reform in Nigeria’s
ICT sector effectively began in 1999, when the Privatisation and Com-
mercialisation Act was passed into law. This event was quickly fol-
lowed by the establishment of the Bureau of Public Enterprises (BPE)
as the policy implementation organ. Prior to that, the promulgation of
Decree 75 of 1992 established the Nigerian Communications Commis-
sion (NCC). Its mandate at the time included supervising the telecom-
munications sector, establishing and maintaining technical standards,
ensuring fair play and competitiveness, protecting licensees and con-
sumers, and ensuring rapid growth in the sector. But it was not until
the advent of the Telecommunications Act (passed into law in 2003),
which reformed the NCC, that the drive towards significant privatisa-
tion began to yield fruitful results. The focus of this section is on the
policy and regulatory environment of the sector, starting with a review
of the existing policy instruments.
POLICY FRAMEWORKA national Information Technology Policy was approved by the Federal
Executive Council of Nigeria in March 2001. This policy (FGN, 2001)
essentially formulated the e-strategies and governance model in use
today in the country. The policy specified a vision of making Nigeria an
“IT-capable country in Africa and a key player in the information soci-
ety by the year 2005, using IT as the engine for sustainable develop-
ment and global competitiveness”. The policy’s general objectives and
strategies for implementation are set forth in the policy document
(FGN, 2003) and include the following:
! establishing institutional frameworks at all tiers of government
(Federal, State, and Local);
! adopting open standards as a means of achieving eventual complete
sector liberalisation, and instituting fiscal measures (including
incentives towards the improvement of teledensity figures), which
will make IT affordable and available to all citizens;
! forging a formal, organised, and sustainable public/private collabo-
ration, focused on the attainment of national self-reliance in ICT;
and
! utilising the opportunities offered by IT to enhance access to gov-
ernment information and facilitate interaction between citizens and
government..
Another notable development in the evolution of the policy framework
occurred in July 2003, when the Nigerian Communications Act 2003
12. newnigeria.qxp 2008/03/28 11:37 AM Page 13

NNiiggeerriiaa
14 2007 Telecommunications Sector Performance Review
was signed into law to reconstitute the NCC as the main regulatory
organ responsible for policy implementation in that sector. The Act
specifically requires the NCC to promote ”fair competition in the com-
munications industry”, protect communication services and infra-
structure, and enforce compliance by all operators with their licence
conditions.
INSTITUTIONAL ARRANGEMENTSThe institutional arrangements in place for the implementation of the
policy objectives recognise the NCC as the regulator of the telecommuni-
cations sector and the Nigerian Broadcasting Commission (NBC) as the
regulatory body for radio and television broadcasting. Frequency man-
agement is the responsibility of the National Frequency Management
Council, and the National Information Technology Development Agency
(NITDA) is assigned the responsibility of implementing the objectives of
the National Policy on Information Technology, USEIT (FGN, 2001).
THE NATIONAL INFORMATION TECHNOLOGY DEVELOPMENT
AGENCY (NITDA)
The National Information Technology Development Agency (NITDA)
came into being in March 2001, when the Federal Executive Council for-
mally approved its establishment with the main responsibility of imple-
menting policy objectives. According to the Agency’s pioneering Direc-
tor General, (Ajayi, 2002), NITDA faced an initial challenge of devising
a means of attracting significant contributions from the private sector,
general public, and international institutions, particularly in carrying
out a baseline study in various areas of IT development. This challenge,
and the agency’s interpretation of its assigned responsibilities evi-
dently informed NITDA’s Strategic Plan for Implementation’ (NITDA,
2005), whose stated main focus is on capacity building; human
resources, infrastructural, and institutional. According to Ajayi (2005),
the expectation of the agency is that by replicating NITDA at the other
two tiers of government (local and state), the objectives of institutional
capacity-building can be attained. By instituting a Public Services Net-
work at all tiers of government, e-government can be brought about,
and thus, the strategic goal of institutional capacity-building can be
achieved. In addition to these implementation strategic objectives,
NITDA constituted a committee of professionals representing various
sections of the civil society and Nigerians in Diaspora (notably NITPA)
which prepared a long-term national strategic plan of action. In partic-
ular, the committee recommended the “use of the strategy to plug into
global, regional, and sub-regional debates or initiatives” particularly
advancing human development.
THE NATIONAL FREQUENCY MANAGEMENT COUNCIL
Under the provisions of the Communications Act 2003 the organs of
government responsible for the management of the radio frequency
12. newnigeria.qxp 2008/03/28 11:37 AM Page 14

NNiiggeerriiaa
152007 Telecommunications Sector Performance Review
spectrum are the Ministry of Communications, the National Frequency
Management Council(NFMC), the Nigerian Communications Commis-
sion, and the National Broadcasting Commission. The Act specifies the
functions of the NFMC as including the development of the national fre-
quency plan and the allocation of frequencies.
THE MINISTRY OF COMMUNICATIONS
All frequencies in Nigeria are under the custody of the Ministry of Com-
munications under the Communications Act. And it is this ministry that
is responsible for spectrum use issues at the sub-regional, regional,
and international levels, particularly the ITU (FGN, 2003).
NATIONAL BROADCASTING COMMISSION
This organisation was established by Decree number 38 of 1992, as
amended by Decree 55 of 1999, with responsibilities extending to the
ownership and operation of radio and television stations, including
cable TV services and any other media of broadcasting, as well as the
spectrum management issues associated with them.
NATIONAL COMMUNICATIONS COMMISSION
The NCC was established during the military government era of 1992
when Decree 75 was promulgated to vest regulatory authority for Nige-
ria’s telecommunications industry in the NCC. That enabling decree
gave the NCC, as it was then constituted, the responsibility of supervis-
ing telecommunications services provision, establishing technical
standards, ensuring fair play and competitiveness, protecting
licensees and the consumer alike, and generally ensuring the efficient
growth of telecommunications in the country. In July 2003, the Niger-
ian Communications Act was signed into law by the President, and in
addition to effectively reforming the NCC, the Act created the National
Frequency Management Committee, which as earlier noted, has the
responsibility of management of the radio frequency spectrum in the
country. The Act assigns to the NCC, “the management and administra-
tion of frequency spectrum for the communications sector”. It is also to
assist the frequency management council in developing a national fre-
quency plan”, among several other functions, including representing
the country at proceedings of international organisations and forums
on matters of interest to the regulation of communications and related
issues, (FGN, 2003).
There are a number of other provisions of the Act that are of relevance to
this report, ,the most important of which concerns Universal Access/ Uni-
versal Service, for which the Act specifies the development of a regulatory
regime, “which shall provide the widespread availability and usage of net-
work services and applications services throughout Nigeria” particularly
for underserved areas, or for unserved groups within the community.
12. newnigeria.qxp 2008/03/28 11:37 AM Page 15

NNiiggeerriiaa
16 2007 Telecommunications Sector Performance Review
COMPETITION ISSUES AND GATS COMMITMENTSNigeria’s membership of the WTO resumed on 01 January 1995, after
the ratification of the WTO agreement on 06 December 1994, though as
pointed out by a WTO Trade Policy Review (WTO, 2005) the instrument
that established the WTO (Marrakech agreement) has yet to be incor-
porated into the country’s law. This has created ambiguities about the
legal status of WTO obligations. The WTO’s review under reference
here suggests that traders and investors find themselves unable to
invoke provisions of the WTO agreements in local courts because the
agreements have not been accorded the force of law in the country. It
is noteworthy that although a number of notifications were required to
be sent to the WTO by the country under agreement, obligations remain
outstanding: notifications concerning Nigeria’s specific commitments
(as indicated in Table I below) (WTO, 2005).
TABLE 1: NIGERIA’S SCHEDULE GATS COMMITMENTS- COMMUNICATIONS SER-
VICES
Source: http://www.wto.org/english/tratop_e/serv_e/telecom_e/telecom_commit_exempt_list_e.htm
Notes: The numerals in column three of this table refer to issues concerning “cross-border supply” (1), “consumption
abroad” (2), “commercial presence” (3), and “presence of natural persons” (4) as described in the reference
cited above. In column two, the number 2 refers to a footnote, which observes “that provisions of any service
across the border by passing the network or diverting international traffic from NITEL is not permitted, and
such measures can only be done in cooperation with NITEL”.
Competition issues are addressed by a recent publication of the NCC’s
Competition Practices Regulations 2006, which the Commission describes
as “the regulatory framework for the promotion of fair competition in the
communications sector, and protection against misuse of market power or
other anti-competitive practices” including definitions of market domi-
nance and abuse as well as merger procedures NCC (2006).
SECTOR-SPECIFIC COMMITMENTS
Coding Sector or Sub-sector Limitations on Market access Limitations on national
treatment
2. COMMUNICATION
SERVICES
C. Telecommunication
Services
7521 Sale/installation 1), 2), 3), 4) None 1), 2), 3), 4) None
of terminal equipment
7522
7523
7521 Operating pay phones 1), 2) Not applicable 1), 2) Not applicable
3), 4) None 3), 4) None
7521 Mobile communications 1), 2) Unbound 1), 2) Unbound
cellular, paging, etc.
7523 (– voice and data)2
3), 4) None 3), 4) None
7523 Value added services2
1), 2), 3), 4) None 1), 2), 3), 4) None
12. newnigeria.qxp 2008/03/28 11:37 AM Page 16

NNiiggeerriiaa
172007 Telecommunications Sector Performance Review
In addition to these regulations, the NCC, through another publication
(NCC, 2003) gave specific attention to interconnection of telecommuni-
cations networks. The commission’s guidelines on the issue (NCC,
2003) provide a detailed set of rules meant for application during inter-
connection negotiations and dispute resolution. The guidelines extend
over the general responsibilities of the commission, definitions for
interconnection and dominant market position, rights and obligations
(including significant obligations imposed on dominant operators) of
interconnection, interconnection principles - transparency, non-dis-
crimination, and cost orientation, good faith negotiations, accounting
separation, and interconnection charges and costs, to mention a few.
These guidelines inform, among several other things, (NCC, 2003), that:
! during the period of transition to full competition, the NCC will limit
the extent of the obligations of the dominant operators, so as to
avoid the possibility of over-regulation;
! asymmetric regulation will be utilised as a tool for guaranteeing
access by non-dominant operators to interconnection services. As
soon as the market becomes completely competitive in terms of
interconnection, arrangements with the hitherto dominant opera-
tors for interconnection will be deregulated;
! interconnection with other operators is the right of every operator,
regardless of type of technology employed, and operators are
obliged, when requested to do so, to negotiate with other operators
that demand interconnection; except in the event that technical lim-
itations make it impossible to accommodate the request.
It is expected that further improvements in the policy and regulatory
environment will be recorded when the Federal Competition Bill, which
proposes to establish a Federal Competition Commission is passed into
law. According to its authors, the bill is designed to “provide the neces-
sary conditions for market competition and to stimulate creative busi-
ness activities, protect consumers and promote the balanced develop-
ment of the national economy by prohibiting restrictive contracts and
business practices that substantially lessen competition and prevent-
ing the abuse of dominant position of market power and anti-competi-
tive business combines, and to establish the Federal Competition Com-
mission for the effective implementation and enforcement of this bill
and for matters concerned therewith”.
(http://www.bpeng.org/docs/Competition%20Bill%20(Draft).doc)
12. newnigeria.qxp 2008/03/28 11:37 AM Page 17

NNiiggeerriiaa
18 2007 Telecommunications Sector Performance Review
NEW POLICY DEVELOPMENTSThe main policy development during the period under review concerns
the termination of the exclusivity period for digital mobile licences, and
the consequent introduction of unified licences. In February 2005, the
NCC served notice of its intention to introduce a unified licensing
regime, explaining that the measure is to facilitate the opening up of
the market by allowing existing fixed wireless and mobile licensees to
provide both service types, subject to the geographical / regional limi-
tations imposed by their licences. Furthermore, the commission stipu-
lated that the post-exclusivity period will be characterised by licences
that permit the licensee to offer voice, data, or multimedia services, as
deemed fit, once spectrum is assigned, with all wireless licences
awarded before the expiry of exclusivity amended to reflect the new
position, (NCC, 2005). After the expiry of the consultation period on the
10 January 2006, a framework (see Annexure I) for the unified licence
was issued by the NCC. The provisions of that framework acknowledge
“the current trend of increasing convergence of telecommunications
services” as well as recent developments in sector regulatory prac-
tices, which indicate bias in favour of the use of general authorisations
and class licences as tools for regulating market entry. It is further
noted by the NCC that conventional wisdom suggests that as markets
become more mature, regulators should become more disposed
towards reducing regulatory intervention at the point of market entry,
relying instead on general conditions and ex post regulatory remedial
action, and industry self-regulation. The new licensing framework
encourages the growth of new applications and services through a sim-
plification of existing licensing procedures to ease market entry and
operations, regulatory flexibility to enable ready accommodation of
market and technological developments and promotes efficient utilisa-
tion of network resources by encouraging the use of individual net-
works for the provision of a broad range of services.
It is worth noting that during the final consultation period, the Commis-
sion invited comments and suggestions from the existing operators and
other industry stake holders. As may be expected, the operators of
fixed wireless services welcomed the development, whilst the mobile
wireless service operators had several objections. For example, MTN
and V-mobile both suggested that NCC’s declaration of intention was in
reality a move towards restructuring the market as defined by the
national telecommunications policy, to which the NCC responded that
it was not only consistent with the objectives of liberalisation, easy
market entry, and modernisation in accordance with international best
practices; but also with the National Telecommunications Policy, which
has provisions for Multi Services Access operators’ licences. The com-
mission also disagreed with a suggestion by CELTEL (then known as
V-Mobile) that the proposed regime will send negative signals to
investors, because of the operator’s opinion that it will distort business
12. newnigeria.qxp 2008/03/28 11:37 AM Page 18
NNiiggeerriiaa
192007 Telecommunications Sector Performance Review
plans. In its response, the NCC observed that the exclusivity period was
for five years to the knowledge of the international community, and that
the fact that Government kept faith in that regard should make
investors favorably disposed towards the country. However, it appears
to be in agreement with MTN’s position that the capital outlay required
for meaningful participation in the unified licence era makes a strong
case for the “provision of subsidies, concessions, and / or financial
incentives to operators” that are found deserving, in terms of previous
contributions to national transmission capacity.
REGIONAL COOPERATION ON POLICY ANDREGULATORY ISSUESAfrica remains the main focus of Nigeria’s foreign policy, and this has
informed the nature and scope of the country’s regional cooperation on
policy and regulatory issues. Thus apart from her membership of the
African Telecommunication Union and the International Telecommuni-
cation Union, policy and regulatory issues often focus on sub-regional
(ECOWAS, WATRA) and regional cooperation and policy integration.
In this section, the report gives brief descriptions of these issues from
the WATRA and ECOWAS points of view, as representative examples of
the issues of interests.
ECOWAS
The main forum for regional cooperation and economic integration in
the West African Sub-region, is provided by the Economic Community
of West African States (ECOWAS), a regional organisation of 15 mem-
ber states that was established in 1975. In December 2000 the West
African states that form the membership of ECOWAS adopted decision
A/DEC.7/12/00 (ECOWAS, 2004), as the ECOWAS information commu-
nication policy. This decision abrogated decision C/DEC./5/90 (concern-
ing an ECOWAS priority program of action on information) and
includes a number of provisions, which define the region’s formal poli-
cies for regional cooperation in telecommunications and Information
Technology. In 2001 the West African Economic and Monetary Union
(UEMO) adopted a recommendation, whose objectives centered on the
improvement of ICT infrastructures and services in member states.
The recommendation in question identified a need for the harmonisa-
tion of regulatory frameworks through a committee of regulators to
serve as a platform for interaction between operators and service
providers necessary for the liberalisation of telecommunications mar-
kets and provision of new ICTs. This was echoed by another resolution
of ECOWAS ministers (ECOWAS, 2004) to harmonise regulatory frame-
works and institutions, develop a regional regulatory organ, and to
facilitate the installation of a regional backbone, reliable and robust
enough to support seamless connectivity in West Africa. As part of the
policy implementation process, ECOWAS, as an organisation, has
embarked upon a number of projects aimed at physical integration,
12. newnigeria.qxp 2008/03/28 11:37 AM Page 19

NNiiggeerriiaa
20 2007 Telecommunications Sector Performance Review
including efforts towards the interconnection of existing networks in
the areas of telecommunications, transport, and energy.
WEST AFRICAN TELECOMMUNICATIONS REGULATORS ASSO-
CIATION /ASSEMBLY (WATRA)
One of the key provisions of the ECOWAS revised treaty is informed by
the recognition of a need for cooperation at regional level in order to
develop essential infrastructure that will enhance the level of socio-
economic activities in the region. As noted by Ndukwe (2003), because
telecommunications is considered pivotal to the promotion of socio-
economic development, the building of technical capacity required for
an effective regulatory regime is an imperative, which need, can be met
through the exercising of the option of sharing resources, facilities, and
experience as a means of instituting affordable but effective regulatory
organisations. Ndukwe (2003) further observes that in addition to cost
considerations, investors are known to be favorably disposed to those
regions where standards and regulatory processes are uniform. Evi-
dently persuaded by these and similar arguments, Telecommunica-
tions / ICT regulators in the sub-region came together in September
2000 to form the West African Telecommunications Regulators Associ-
ation (WATRA), which is now known as the West African Telecommu-
nications Regulators Assembly.
Nigeria, which through the NCC has almost single-handedly funded
WATRA from inception, is very strongly committed to the ideals of the
organisation, which include the establishment of modern legal and reg-
ulatory structures in all member states, and encouragement of the cre-
ation of independent regulatory organisations in countries where none
exists. It also works towards the harmonisation of regulations concern-
ing service pricing and delivery across the region, and encourages ini-
tiatives directed at increased market liberalisation and introduction of
competition. It aims to facilitate the exchange of ideas and contribu-
tions to the development of policies that will promote universal access
in the region. as well as the conceptualisation and formulation of an
eventual recommendation for an ICT master plan that will set policy
objectives and milestones for the modernisation of ICT infrastructure
and service delivery (WATRA, 2000).
12. newnigeria.qxp 2008/03/28 11:37 AM Page 20

NNiiggeerriiaa
212007 Telecommunications Sector Performance Review
Market Structure
The market structure that evolved in Nigeria was informed by the main
objective of the country’s National Telecommunications Policy, “to
establish a long-term telecommunications market structure in which
multiple operators provide service on a competitive basis to the broad-
est range of customer” (FGN, 1992). The policy envisaged that with
such a structure, the appropriate and sustainable levels of prices
charged by carriers for access to their services would be determined by
market forces. In implementing this policy, the NCC in endeavoring to
ensure that the objective of increasing telephony is achieved, utilised
what Wills and Daniels (2003) refer to as “infrastructure licensing”.
Today, the market is characterised by a positive impact of liberalisa-
tion occasioned by a relatively fair and stable policy and regulatory
regime with intense participation by the private sector. Many observers
such as INTELCON (2006) hold the view that with a large and sophisti-
cated young population, the opportunities offered by the country are
huge, and that increasing competition has yet to satisfy the strong
demand for services.
MARKET SHAREThere are two national carriers in Nigeria, namely: NITEL, in which
TRANSCORP has acquired majority shares in a recent conclusion of a
drawn-out privatisation process, and Globacom, which is deploying a
fiber optic backbone along specific routes. Of the four licensed long dis-
tance operators, SEPSKOM has had its licence revoked whilst the three
others have yet to commence operations. At the time of this report, four
mobile communications concerns (MTN, CELTEL (V-Mobile), MTEL,
and GLOBACOM) were in operation, but a fifth licence had been
awarded to the UAE-based Mubadala Development Company. In addi-
tion to these operators, there are quite a few private telephone opera-
tors (PTOs) mainly offering fixed wireless services (Table 2).
TABLE 2. TELECOMMUNICATIONS AND INTERNET SERVICES PROVIDERS
OPERATING IN NIGERIA (SOURCE; NCC)
SERVICE CATEGORY NUMBER OF OPERATORS & SERVICE PROVIDERS
1999 2000 2001 2002 2003 2004
National Carriers 1 1 1 2 2 2
Mobile (GSM) 1 1 3 3 4 4
Telephony
Fixed Telephony 9 16 16 17 20* 22**
VSAT Networks N/A N/A N/A N/A 51 52
Internet Services 18 30 30 35 35 36
*Including three Fixed Wireless Access (FWA) Operators**Including four Fixed Wireless Access (FWA) Operators
12. newnigeria.qxp 2008/03/28 11:37 AM Page 21

NNiiggeerriiaa
22 2007 Telecommunications Sector Performance Review
As can be seen from Table 2, the number of national carriers and
mobile telephony operators has remained unchanged since 2001, but
the number of fixed telephony operators has increased steadily from 16
in 2001 to 22 in 2004. 51 VSAT networks were licensed in 2003 and an
additional network came into existence in 2004. Figures 1(a) and 1(b)
reveal that MTN (with a subscription base of about 10,376 million reg-
istered subscribers) has about 41% of the market share, followed by
Globacom, whose subscription base of about 6.4 million subscribers,
represents 26% of the total subscription, as at September 2006 (Far-
roukh, 2006).
FIGURE 1(A): MARKET SHARE OF TELECOMMUNICATIONS SERVICES
PROVIDERS IN NIGERIA (FIGURES OBTAINED FROM FAROUKH, 2006)
These figures are only slightly different from those provided by Odu-
fuwa (2006), whose figures indicate, as shown in Figure 1(b), that
Globacom may have a slightly lesser market share, and MTEL, a
slightly bigger share than what Figure 1(a) suggests.
FIGURE 1(B): TELEPHONY MARKET SHARE AS REPORTED BY ODUFUWA(2006)
12. newnigeria.qxp 2008/03/28 11:37 AM Page 22

NNiiggeerriiaa
232007 Telecommunications Sector Performance Review
MARKET INVESTMENTS
The investment climate continues to improve steadily, with private
investments increasing from a value of US$50 million in 1999 through
US$1 200 million in 2001 to some US$6 080 million in 2005, according
to the figures released by the Federal Government, (Ogbu, 2006). The
investment displayed in Figure 12.2 below includes a projection that by
the end of 2007, private investments should have risen in excess of
US$12bn.
FIGURE 12.2: PRIVATE INVESTMENTS IN TELECOMMUNICATIONS IN NIGERIA
(Source: Odufuwa, 2006; Ogbu, 2006)
This prediction is supported by available data (NCC, 2005), which
reveal that recent massive investments include US$43m invested in
STARCOMMS by ARCTIS and Emerging Market Partnerships, the
US$1.4bn representing MTN’s capital expenditure on network roll-out
in 2004, a financing deal to the tune of US$1.2bn put together by V-
Mobile, (CELTEL) for the expansion of its network nationwide, and the
US$675m contract that Globacom awarded to ALCATEL for the instal-
lation of mobile lines, switches and 100,000 fixed lines. It should also
be noted that Ahmad Farroukh, MTN (Nigeria)’s Chief Executive Offi-
cer reported (Farroukh, 2006) that the company’s financing situation
as at September 2006 is characterised by the following facilities:
Foreign Facilities:
5.4bn, a long-term facility from Standard Corporate Merchant Bank
(SCMB)
9bn, a long term facility from the International Finance Corporation
(IFC)
4bn., a long term facility from the Development Finance Institutions
(DFI)
Local Facilities:
49.1bn, offered as a long term facility by a consortium of local banks.
– N=
– N=
– N=
– N=
12. newnigeria.qxp 2008/03/28 11:37 AM Page 23

NNiiggeerriiaa
24 2007 Telecommunications Sector Performance Review
EMPLOYMENT PROFILE
One of the surprising findings of the research is that operators of
mobile services are unwilling to give information about their com-
pany’s employment profiles, which explains the absence of readily
available and reliable data about employment statistics in the
telecommunications and ICT sector. What appears certain is that the
telecommunications industry ranks as the fastest growing employer of
labour, which in 2004 was reported to have created some 5,000 new
jobs and over 400,000 indirect jobs through dealerships, retail outlets,
one-man phone shops, recharge card business, and phone technicians,
(IM Diversity 2005, quoting the NCC as source of information). Far-
roukh (2006) indicates that MTN has between 167 and 230 registered
distributors, 10,000 sub-dealers, 30,000 sub-sub-dealers, and 50,000
retail points / hawkers.
Data obtained from some fixed services operators are as follows:
– MTS first 200 full-time staff
– MONARCH 76 full-time staff
– CELLCOM 119 full time staff
– STARCOMMS about 580 full-time staff
– NITEL about 20 000 full-time staff
(with retrenchments pending after recent
privatisation)
– MTEL 922 full-time staff
However, statistical data obtained from the National Bureau of Statis-
tics (NBS 2006) reveal that the telecommunications sector has been the
biggest single source of employment generation in Nigeria. As seen
from Table 3 below, the total number of employees in the telecommuni-
cations sector increased from 17,409 in 1999 to 19,682 in 2001, and rose
from this figure to 1,545,674 in 2005.
12. newnigeria.qxp 2008/03/28 11:37 AM Page 24

NNiiggeerriiaa
252007 Telecommunications Sector Performance Review
TABLE 3. TOTAL NUMBER OF EMPLOYEES IN SOME SECTORS OF THE NIGER-
IAN ECONOMY 1999-2005
1999 2000 2001 2002 2003 2004 2005
Agriculture 76 540 79 926 80 702 81 254 88 386 109 513 12 3761
Manufacturing 1 916 781 1 835 130 1 905 077 1 849 207 1 944 024 1 987 518 1 912 906
and Production
Building 29 0574 307 896 476 454 409 933 398 798 431 731 459 023
and Construction
Hotels, 537 067 509 664 572 939 556 216 544 291 538 214 520 556
Restaurants & Tourism
Transport 154 693 158 178 179 180 192 873 203 266 189 142 241 354
Communications 17 409 28 342 193 682 198 897 315 039 325 047 467 260
Educational Services 8 228 8 857 12 444 18 402 20 394 21 887 25 781
Mining & Quarrying 56 137 18 737 18 737 19 934 31 940 33 697 35 867
Utilities 14 896 14 510 14 565 14 841 15 172 15 448 14 896
Banking 28 263 17 111 24 274 2 896 24 453 25 312 29 883
Distributive Trade 146 577 145 501 162 478 177 094 183 549 190948 196 511
Private 7 047 8 449 7 639 7 797 8 804 9 594 10 206
Professional Services
Real Estate & 75 004 77 810 85 552 92 982 94 203 93 996 103 348
Business Services
Health 305 880 301 616 318 367 346 082 347 300 355 726 330 042
Finance 24 108 28 164 28 189 28 747 25 350 26 846 52 398
Total 3 659 203 3 539 891 4 079 381 4 019 156 4 244 968 4 354 617 4 523 782
(Source: NBS 2006)
A graphical comparison of the numbers for selected sectors is dis-
played in Figure 3(a), whilst Figure 3(b) graphically describes the real
growth rate associated with employment in some key sectors.
FIGURE 3(A). COMPARISON OF TOTAL NUMBER OF EMPLOYEES IN SOME
KEY SECTORS
12. newnigeria.qxp 2008/03/28 11:37 AM Page 25

NNiiggeerriiaa
26 2007 Telecommunications Sector Performance Review
Evidently, the employment growth rate in the communications sector far
outstripped that recorded by the other sectors, including the banking
sector, for which employment growth rate became comparable with that
obtained in the communications sector between 2004 and 2005, when
mergers of banks came about on account of a Central Bank requirement
on minimum financial bases for commercial and other banks.
FIGURE 3(B): COMPARISON OF REAL EMPLOYMENT GROWTH RATE IN SOME
KEY SECTORS
In terms of gender distribution of employment, we find from available
data (NBS, 2006) that the percentage of female employees in the com-
munications industry fell from 16.43% in 1999 to 15.13% in 2000, only
to increase sharply in 2001 to 31.05%. The percentage, as can be seen
from figure 3(c), has remained, since then, at close to 30%.
FIGURE 3(C): GENDER DISTRIBUTION OF EMPLOYMENT IN THE COMMUNICA-
TIONS INDUSTRY IN NIGERIA (1999-2005) (SOURCE OF DATA: NBS, 2006)
12. newnigeria.qxp 2008/03/28 11:37 AM Page 26
NNiiggeerriiaa
272007 Telecommunications Sector Performance Review
Access To ICTs
Access to the ICTs in Nigeria may be said to be defined by an emerging
trend, in which the mobile phone has emerged as the most indispensa-
ble personal life style device (Odufuwa, 2006). Predictions are that by
2007, at least a quarter of the population would own mobile phones,
with 96.4% of the urban population having mobile phones. According to
the results of a survey conducted by the National Bureau of Statistics
(NBS, 2006) the indices for household personal computer ownership in
the country is 1.3%, with a figure of 2.7% for the urban areas, and 0.6%
for rural dwellers. Although about the same figures were recorded for
access to fixed telephones, the figures for mobile telephony were much
higher, standing at 28% nationally, with 58% of the urban households
indicating ownership of mobile phones, against a figure of 15.2% for
rural households. Data for zonal distributions revealed that the South
West zone of the country had the highest figures, whilst the lowest fig-
ures were recorded in the North East zone, where only 8.8% of the
households interviewed claimed ownership of mobile phones.
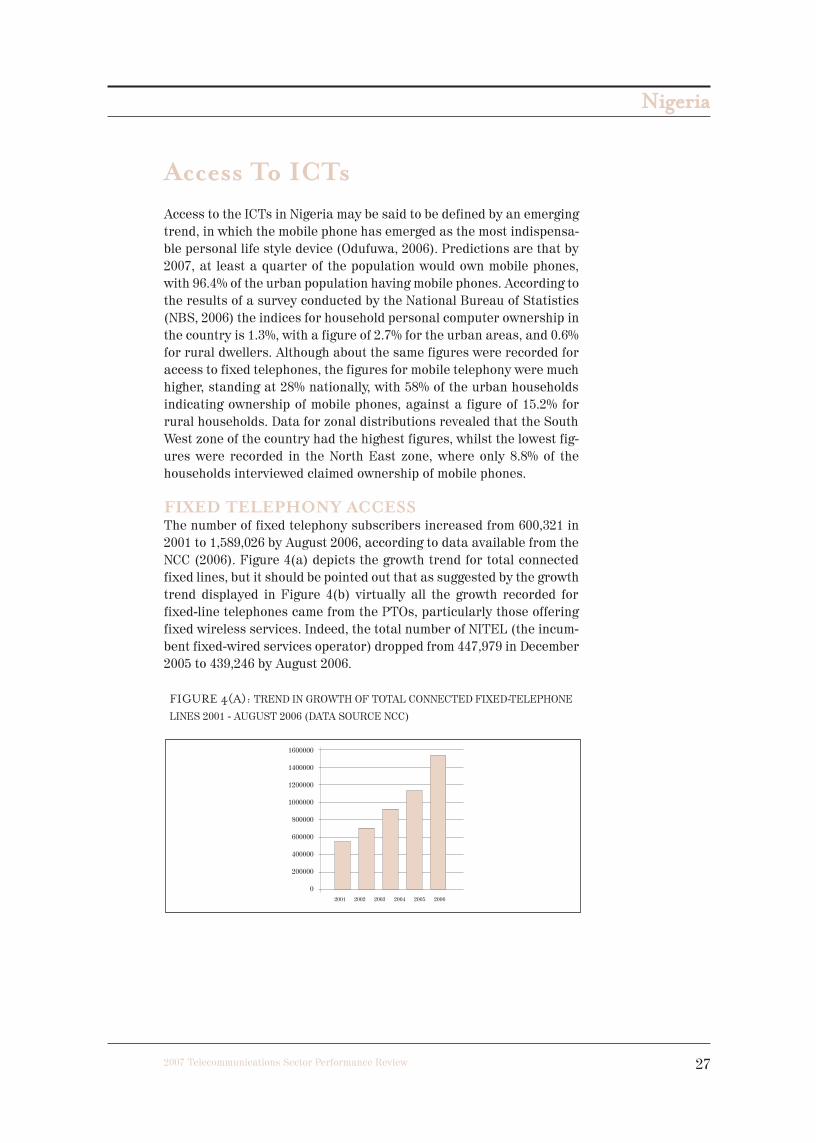
FIXED TELEPHONY ACCESSThe number of fixed telephony subscribers increased from 600,321 in
2001 to 1,589,026 by August 2006, according to data available from the
NCC (2006). Figure 4(a) depicts the growth trend for total connected
fixed lines, but it should be pointed out that as suggested by the growth
trend displayed in Figure 4(b) virtually all the growth recorded for
fixed-line telephones came from the PTOs, particularly those offering
fixed wireless services. Indeed, the total number of NITEL (the incum-
bent fixed-wired services operator) dropped from 447,979 in December
2005 to 439,246 by August 2006.
FIGURE 4(A): TREND IN GROWTH OF TOTAL CONNECTED FIXED-TELEPHONE
LINES 2001 - AUGUST 2006 (DATA SOURCE NCC)
12. newnigeria.qxp 2008/03/28 11:37 AM Page 27

NNiiggeerriiaa
28 2007 Telecommunications Sector Performance Review
FIGURE 4(B): DISTRIBUTION OF TOTAL FIXED CONNECTED LINES DECEM-
BER 2005 - AUGUST 2006 (DATA SOURCE, NCC)
It is also interesting to observe that the growth rate for 2006 is signifi-
cantly higher than the corresponding figures for 2005 (see Figure 4(a)),
which might be an indication of a period of boom for that sector.
Another interesting fact revealed by Figure 5 is that whereas total
fixed connected lines experienced a growth rate of about 6% in Janu-
ary 2004 - 2005 a negative figure was recorded for January 2005 - 2006.
This development might not be unconnected with the fact that a num-
ber of NITEL subscribers (many of them corporate subscribers) did not
renew their subscriptions during the period in question, opting in most
cases for the use of mobile and fixed wireless subscriptions.
FIGURE 5: GROWTH RATE OF TOTAL FIXED CONNECTED LINES, SEPT. 2005 –
AUG. 2006 (SOURCE: NCC)
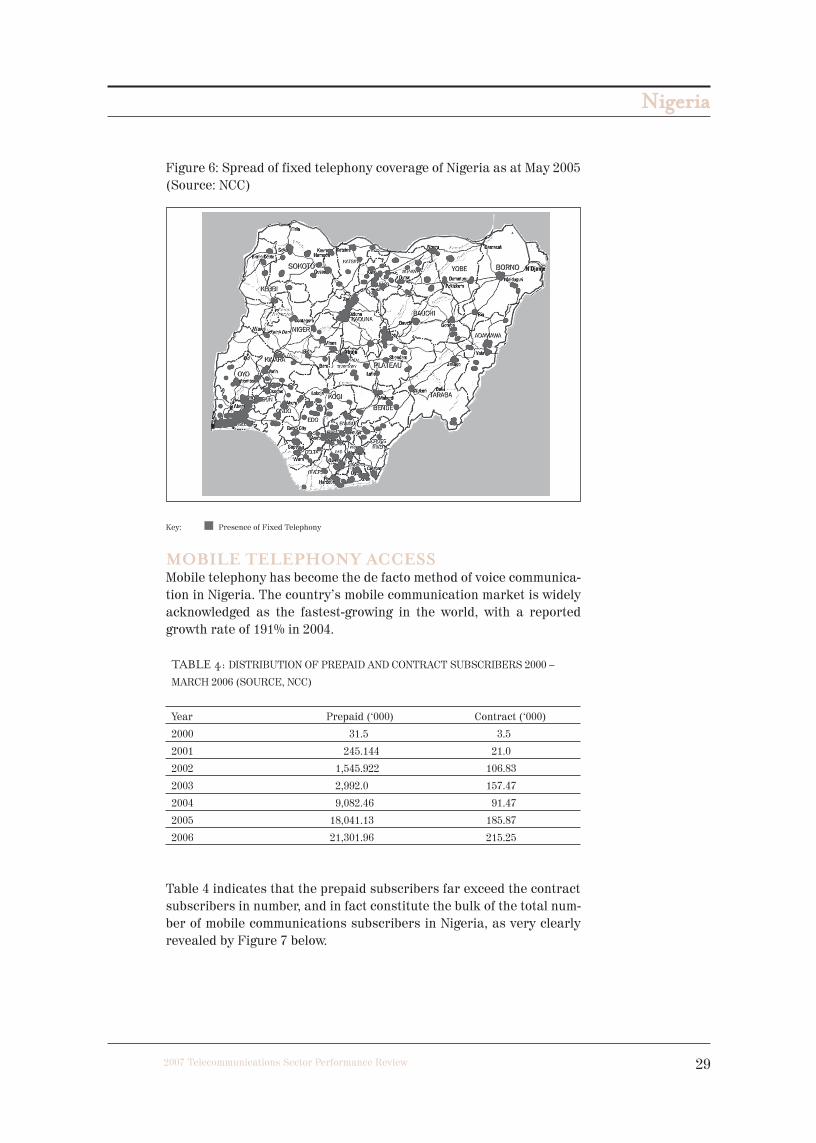
Figure 6 pictorially describes the scope of fixed telephony coverage of
the country as at May, 2005, and it suggests that the spread covers most
of the country, with the highest density around the country’s south west
areas, particularly Lagos, the commercial centre.
12. newnigeria.qxp 2008/03/28 11:37 AM Page 28
NNiiggeerriiaa
292007 Telecommunications Sector Performance Review
Figure 6: Spread of fixed telephony coverage of Nigeria as at May 2005
(Source: NCC)
Key: Presence of Fixed Telephony
MOBILE TELEPHONY ACCESSMobile telephony has become the de facto method of voice communica-
tion in Nigeria. The country’s mobile communication market is widely
acknowledged as the fastest-growing in the world, with a reported
growth rate of 191% in 2004.
TABLE 4: DISTRIBUTION OF PREPAID AND CONTRACT SUBSCRIBERS 2000 –
MARCH 2006 (SOURCE, NCC)
Year Prepaid (‘000) Contract (‘000)
2000 31.5 3.5
2001 245.144 21.0
2002 1,545.922 106.83
2003 2,992.0 157.47
2004 9,082.46 91.47
2005 18,041.13 185.87
2006 21,301.96 215.25
Table 4 indicates that the prepaid subscribers far exceed the contract
subscribers in number, and in fact constitute the bulk of the total num-
ber of mobile communications subscribers in Nigeria, as very clearly
revealed by Figure 7 below.
12. newnigeria.qxp 2008/03/28 11:37 AM Page 29

NNiiggeerriiaa
30 2007 Telecommunications Sector Performance Review
FIGURE 7: DISTRIBUTION OF MOBILE TELEPHONY SUBSCRIPTIONS 2000-2006
FIGURE .8 : GROWTH RATE OF MOBILE SUBSCRIPTIONS 2004 – 2006
(SOURCE: NCC)
We find from Figure 7 that the growth rate of this sector appears to be
witnessing a decline, and in particular, that a drop from a rate of about
700% in 2001 to about 50% was recorded in 2003, after which it rose
close to 200% in 2004 and dropped steadily thereafter to a value of just
below 50% in mid-2006. This may not be an indication that the market
is becoming saturated, because a comparison of the penetration rate
provided below suggests that even as at 2004, when the growth rate
was declining, the penetration rate was on the increase.
Source: ITU World Teleommunication Indicators Database
12. newnigeria.qxp 2008/03/28 11:37 AM Page 30

NNiiggeerriiaa
312007 Telecommunications Sector Performance Review
The urban / rural divide of the penetration rate is not apparent from
the data described earlier in this section. A measure of the extent of the
divide is provided by the outcome of a survey carried out on behalf of
the NCC by INTELCON (2005). According to the survey findings, there
are a number of rural areas that are ordinarily unreached by the
mobile communication spread, but whose citizens still contrive to sub-
scribe to the services of the operators. Those concerned install bamboo
poles to heights of between 5 m and 8 m, mount antennas on the poles,
and attach the antennas to mobile handsets to receive signals from
base stations located up to 50 km away. About 33% of respondents in
rural areas claim to have family members abroad, and some 89% fam-
ily members in Abuja, Lagos and other major urban centres outside
their states. These observations tend to explain the finding of the sur-
vey that 26% of rural dwellers, for lack of access to phones go in per-
son to communicate as against the corresponding figures of 16% for
urban dwellers and 18% for semi-urban dwellers.
ACCESS TO BROADBAND AND THE INTERNETAt the time of this report, 522 operators had been granted licences to
operate as Internet Service Providers (ISPs) whilst 110 VSAT licences
had also been awarded. Of these, only a combined total (ISP and VSAT
operators) of 98 were operational, servicing 2,350 cybercafés and an
estimated 3.5 million users including some 88,000 (wired and wireless)
dial-up accounts, with an international bandwidth estimated at 4GB, to
give a penetration of 2%, (INTELCON, 2005).
Despite the fact that Internet awareness is increasing in the country,
the penetration rate is much slower than should be expected because
of a myriad problems, the more prominent of which are, (Omo-Ettu,
2006) high costs of individual equipment, a small number of available
T1 bandwidth, poor status of national infrastructural facilities (partic-
ularly electric power supply) and predatory pricing in the market, forc-
ing some providers to close their businesses as being unviable.
Rural/Urban use distribution is typified by the figures on Table 4, which
are pictorially represented in Figure 7.
12. newnigeria.qxp 2008/03/28 11:37 AM Page 31
NNiiggeerriiaa
32 2007 Telecommunications Sector Performance Review
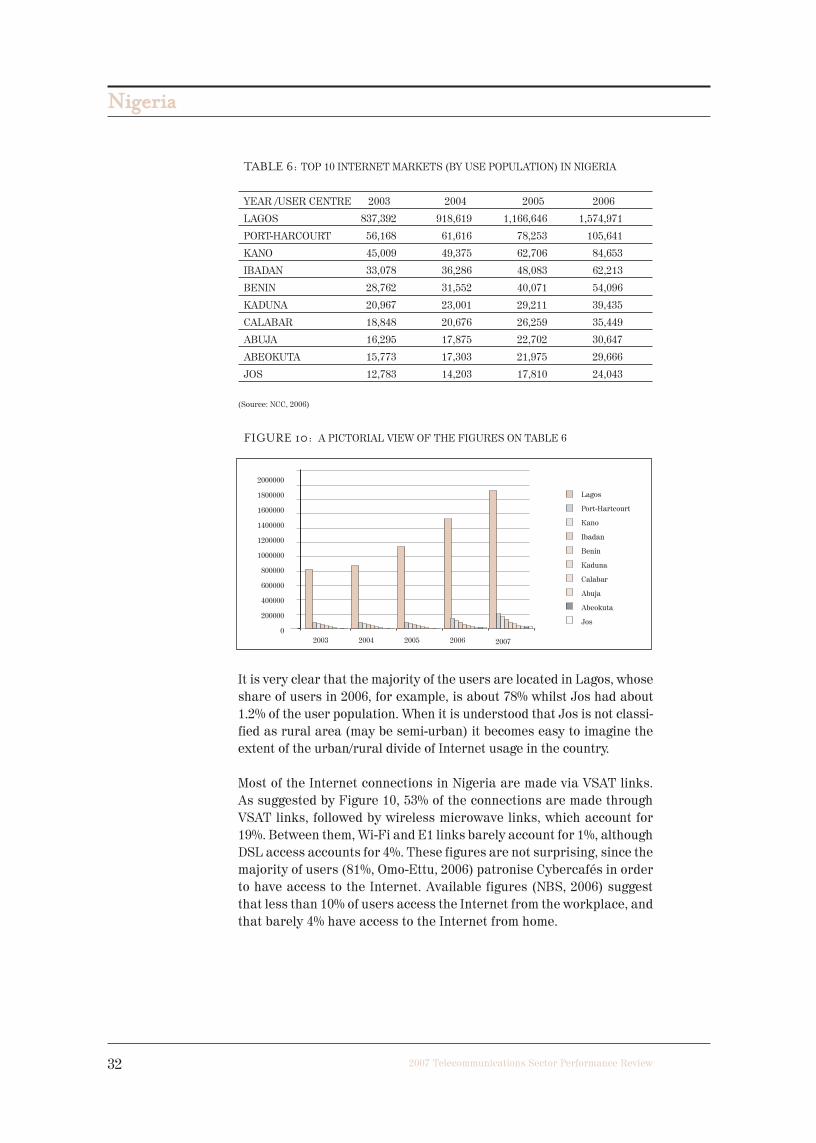
TABLE 6: TOP 10 INTERNET MARKETS (BY USE POPULATION) IN NIGERIA
YEAR /USER CENTRE 2003 2004 2005 2006
LAGOS 837,392 918,619 1,166,646 1,574,971
PORT-HARCOURT 56,168 61,616 78,253 105,641
KANO 45,009 49,375 62,706 84,653
IBADAN 33,078 36,286 48,083 62,213
BENIN 28,762 31,552 40,071 54,096
KADUNA 20,967 23,001 29,211 39,435
CALABAR 18,848 20,676 26,259 35,449
ABUJA 16,295 17,875 22,702 30,647
ABEOKUTA 15,773 17,303 21,975 29,666
JOS 12,783 14,203 17,810 24,043
(Source: NCC, 2006)
FIGURE 10: A PICTORIAL VIEW OF THE FIGURES ON TABLE 6
It is very clear that the majority of the users are located in Lagos, whose
share of users in 2006, for example, is about 78% whilst Jos had about
1.2% of the user population. When it is understood that Jos is not classi-
fied as rural area (may be semi-urban) it becomes easy to imagine the
extent of the urban/rural divide of Internet usage in the country.
Most of the Internet connections in Nigeria are made via VSAT links.
As suggested by Figure 10, 53% of the connections are made through
VSAT links, followed by wireless microwave links, which account for
19%. Between them, Wi-Fi and E1 links barely account for 1%, although
DSL access accounts for 4%. These figures are not surprising, since the
majority of users (81%, Omo-Ettu, 2006) patronise Cybercafés in order
to have access to the Internet. Available figures (NBS, 2006) suggest
that less than 10% of users access the Internet from the workplace, and
that barely 4% have access to the Internet from home.
12. newnigeria.qxp 2008/03/28 11:37 AM Page 32

NNiiggeerriiaa
332007 Telecommunications Sector Performance Review
These observations are consistent with the figures obtained for PC
usage in the country, as reported by an NBS survey (NBS, 2006).
According to the said figures, PC penetration was at about 0.84% in
2003, and increased almost linearly, to a value of about 0.97% (corre-
sponding to about 120,000 PCs) in 2006. The implication is therefore
that even if providers are able to extend services to homes and work-
places, relatively few people would be able to take advantage because
of lack of personal computers. Field survey results reported by NBS
(2006), (also Odufuwa 2006) indicate that there is a significant demand
for access to the Internet from home. For example, the surveys in ques-
tion discovered that 100% of respondents in Bauchi State (not featured
in the list of top 10 use population centers) would want to access the
Internet from home, whilst the corresponding figure for respondents in
Kano State, which ranked third in the list of use population centres,
was 91.5%.
FIGURE 9: DISTRIBUTION OF INTERNET ACCESS METHODS
Source: Omu-Etu, 2006
These figures, it should be pointed out, do not include firm data on gov-
ernment usage because no such data was available from the different
government sources approached, despite promises made.
12. newnigeria.qxp 2008/03/28 11:37 AM Page 33

NNiiggeerriiaa
34 2007 Telecommunications Sector Performance Review
Cost of ICT Usage
One of the main achievements of the market reform model adopted by
Nigeria concerns reductions in tariffs for phone calls in the country. For
example, in 2000. prior to the introduction of the reforms, the cost of
making international calls was as high as NGN130 per minute, on aver-
age; this has decreased to an average of less than NGN30 per minute in
2006. This section reviews the going rates for use of telecommunica-
tions and ICT services in Nigeria, using representative data, and start-
ing with fixed services.
COST OF FIXED VOICE COMMUNICATIONSSERVICESTable 7(a) displays the going rates for calls made with the use of fixed
wireless services. Connection charges for business subscriptions
range from NGN8,000 (approx. US$62) (Intercellular) to NGN20,500 (or
about US$157) for MULTILINKS, where the current exchange rate is
US$1 = NGN130. The corresponding charges for residential phones are
about the same. It is to be observed that while business users of these
services pay either NGN1,000 access charge or NGN10,000 usage
charge / month, the same does not apply to residential users.
TABLE 7(A): COST OF ACCESS TO FIXED (WIRELESS) VOICE COMMUNICA-
TIONS SERVICES
Operator Business phone Residential Phone Cost of 3 min Cost of 3 min Cost of 3 min
local call national call US call
Connection Monthly Connection Monthly Peak Off-peak Peak Off-peak Peak Off-peak
Charge Subscription Charge Subscription
CELLCOM 17,000.00 1,000.00 17,000.00 Zero 20.55 14.25 94.50 79.50 120.00 120.00
Plus Access Plus Access
table Charge table Charge
phone set phone set
MULTILINKS 20,500.00 1,500.00 20,500.00 1,000.00 19.50 19.50 66.00 66.00 105.00 105.00
Plus Access Plus Access
table Charge table Charge
phone set phone set
INTER- 8,000.00 Zero 8,000.00 Zero 34.50 27.60 81.00 64.80 132.00 117.00
CELLULAR Plus Access Plus Access
phone set Charge phone set Charge
10 000
usage charge
per.month
ITN 9,000.00 Zero 9,000.00 Zero 19.50 19.50 66.00 66.00 45.00 45.00
Plus Access Plus Access
phone set Charge phone set Charge
10 000
usage charge
per.month
Source: Operators (Note: US$1= NGN130)
(Plus Table phone
set)
12. newnigeria.qxp 2008/03/28 11:37 AM Page 34

NNiiggeerriiaa
352007 Telecommunications Sector Performance Review
TABLE 7(B): COST OF ACCESS TO FIXED (WIRELESS) VOICE COMMUNICA-
TIONS SERVICES
Operator Business phone Residential Phone Cost of 3 min Cost of 3 min Cost of 3 min
local call national call US call
Connection Monthly Connection Monthly Peak Off-peak Peak Off-peak Peak Off-peak
Charge Subscription Charge Subscription
NITEL 15,000.00 750 15,000.00 750 19.50 19.50 66.00 66.00 105.00 105.00
MONACOM 10,500.00 1,500.00 10,500.00 1,500.00 19.50 19.50 66.00 66.00 120.00 120.00
Access Access
Charge Charge
VGC COM- 15,250.00 2,000.00 15,250.00 2.000.00 19.50 19.50 66.00 66.00 54.00 54.00
MUNICATIONS Access Access
Charge Charge
21st 20,500.00 1,000.00 20,500.00 1,000.00 19.50 19.50 66.00 66.00 105.00 105.00
CENTURY Access Access
Charge Charge
Source: Operators (Note: US$1= NGN130)
A rather surprising development is that connection charges for fixed-
wire access compare with those for fixed wireless access, ranging from
NGN10,500 (MONACOM) to NGN20,500 (21st Century). The call rates,
however, differ significantly. For example, the average cost of 3-minute
peak-period local calls using fixed wireless services is NGN23.3,
whereas the use of fixed-wire services attracts an average of NGN19.50
for a 3-minute call. Corresponding charges for trunk (national) calls
are NGN76.9 and NGN66.0, respectively.
COSTS OF MOBILE VOICE COMMUNICA-TIONS SERVICESRepresentative data concerning call rates for the four mobile operators
is displayed in Table 6 below.
12. newnigeria.qxp 2008/03/28 11:37 AM Page 35
NNiiggeerriiaa
36 2007 Telecommunications Sector Performance Review
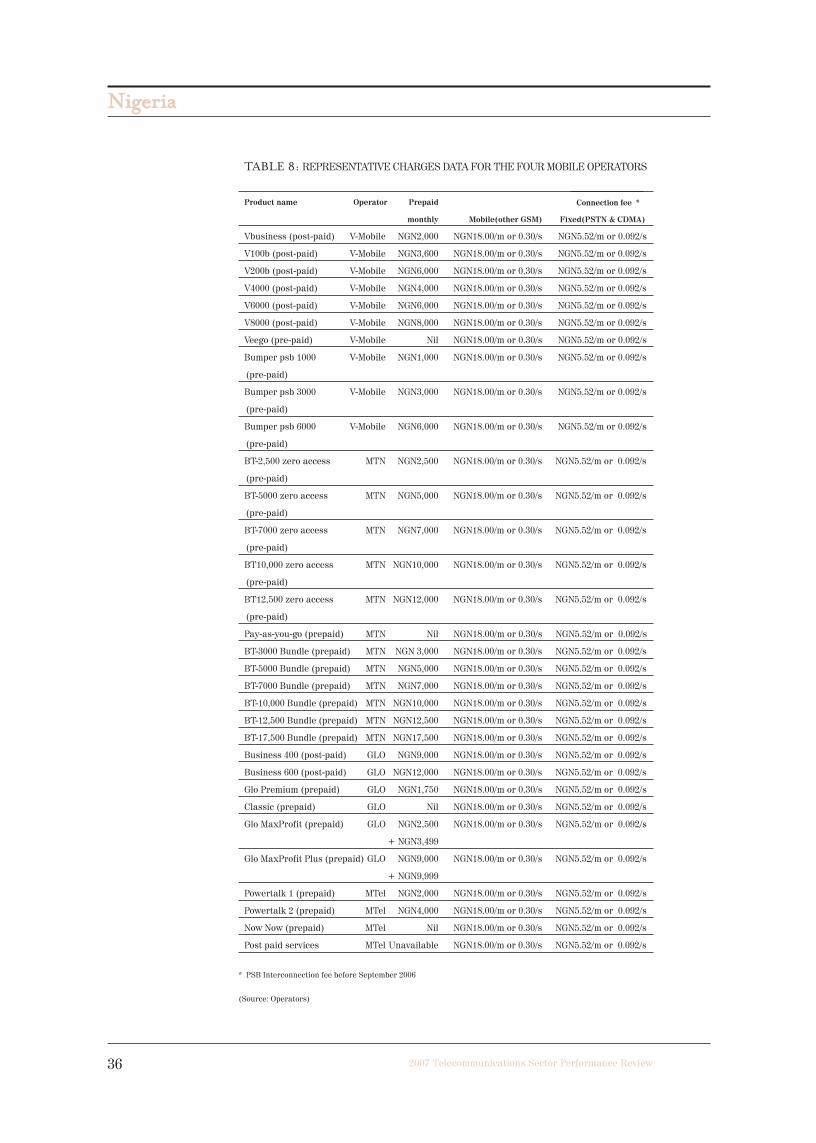
TABLE 8: REPRESENTATIVE CHARGES DATA FOR THE FOUR MOBILE OPERATORS
Product name Operator Prepaid
monthly Mobile(other GSM) Fixed(PSTN & CDMA)
Vbusiness (post-paid) V-Mobile NGN2,000 NGN18.00/m or 0.30/s NGN5.52/m or 0.092/s
V100b (post-paid) V-Mobile NGN3,600 NGN18.00/m or 0.30/s NGN5.52/m or 0.092/s
V200b (post-paid) V-Mobile NGN6,000 NGN18.00/m or 0.30/s NGN5.52/m or 0.092/s
V4000 (post-paid) V-Mobile NGN4,000 NGN18.00/m or 0.30/s NGN5.52/m or 0.092/s
V6000 (post-paid) V-Mobile NGN6,000 NGN18.00/m or 0.30/s NGN5.52/m or 0.092/s
V8000 (post-paid) V-Mobile NGN8,000 NGN18.00/m or 0.30/s NGN5.52/m or 0.092/s
Veego (pre-paid) V-Mobile Nil NGN18.00/m or 0.30/s NGN5.52/m or 0.092/s
Bumper psb 1000 V-Mobile NGN1,000 NGN18.00/m or 0.30/s NGN5.52/m or 0.092/s
(pre-paid)
Bumper psb 3000 V-Mobile NGN3,000 NGN18.00/m or 0.30/s NGN5.52/m or 0.092/s
(pre-paid)
Bumper psb 6000 V-Mobile NGN6,000 NGN18.00/m or 0.30/s NGN5.52/m or 0.092/s
(pre-paid)
BT-2,500 zero access MTN NGN2,500 NGN18.00/m or 0.30/s NGN5.52/m or 0.092/s
(pre-paid)
BT-5000 zero access MTN NGN5,000 NGN18.00/m or 0.30/s NGN5.52/m or 0.092/s
(pre-paid)
BT-7000 zero access MTN NGN7,000 NGN18.00/m or 0.30/s NGN5.52/m or 0.092/s
(pre-paid)
BT10,000 zero access MTN NGN10,000 NGN18.00/m or 0.30/s NGN5.52/m or 0.092/s
(pre-paid)
BT12,500 zero access MTN NGN12,000 NGN18.00/m or 0.30/s NGN5.52/m or 0.092/s
(pre-paid)
Pay-as-you-go (prepaid) MTN Nil NGN18.00/m or 0.30/s NGN5.52/m or 0.092/s
BT-3000 Bundle (prepaid) MTN NGN 3,000 NGN18.00/m or 0.30/s NGN5.52/m or 0.092/s
BT-5000 Bundle (prepaid) MTN NGN5,000 NGN18.00/m or 0.30/s NGN5.52/m or 0.092/s
BT-7000 Bundle (prepaid) MTN NGN7,000 NGN18.00/m or 0.30/s NGN5.52/m or 0.092/s
BT-10,000 Bundle (prepaid) MTN NGN10,000 NGN18.00/m or 0.30/s NGN5.52/m or 0.092/s
BT-12,500 Bundle (prepaid) MTN NGN12,500 NGN18.00/m or 0.30/s NGN5.52/m or 0.092/s
BT-17,500 Bundle (prepaid) MTN NGN17,500 NGN18.00/m or 0.30/s NGN5.52/m or 0.092/s
Business 400 (post-paid) GLO NGN9,000 NGN18.00/m or 0.30/s NGN5.52/m or 0.092/s
Business 600 (post-paid) GLO NGN12,000 NGN18.00/m or 0.30/s NGN5.52/m or 0.092/s
Glo Premium (prepaid) GLO NGN1,750 NGN18.00/m or 0.30/s NGN5.52/m or 0.092/s
Classic (prepaid) GLO Nil NGN18.00/m or 0.30/s NGN5.52/m or 0.092/s
Glo MaxProfit (prepaid) GLO NGN2,500 NGN18.00/m or 0.30/s NGN5.52/m or 0.092/s
+ NGN3,499
Glo MaxProfit Plus (prepaid) GLO NGN9,000 NGN18.00/m or 0.30/s NGN5.52/m or 0.092/s
+ NGN9,999
Powertalk 1 (prepaid) MTel NGN2,000 NGN18.00/m or 0.30/s NGN5.52/m or 0.092/s
Powertalk 2 (prepaid) MTel NGN4,000 NGN18.00/m or 0.30/s NGN5.52/m or 0.092/s
Now Now (prepaid) MTel Nil NGN18.00/m or 0.30/s NGN5.52/m or 0.092/s
Post paid services MTel Unavailable NGN18.00/m or 0.30/s NGN5.52/m or 0.092/s
* PSB Interconnection fee before September 2006
(Source: Operators)
Connection fee *
12. newnigeria.qxp 2008/03/28 11:37 AM Page 36

NNiiggeerriiaa
372007 Telecommunications Sector Performance Review
It can be seen from the table that call rates are about the same from
operator to operator, though higher than corresponding rates for sim-
ilar services offered by fixed-wire and wireless operators. A compari-
son of the costs, which also describes the fall in different tariff regimes,
is displayed in Figure 11 (Odufuwa, 2006).
FIGURE 11: TELECOMMUNICATIONS TARIFF TRENDS-2000-2006
(Source: Odufuwa, 2006)
The illustration reveals that the lowest recorded declines were in the
costs of GSM calls (6.9%) and local calls (6.7%).
An estimate of the average monthly expenditure on telephone calls as
reported by NBS (2006) is provided in Table 9 below.
TABLE 9: AVERAGE MONTHLY TELEPHONE EXPENDITURE AS A PERCENTAGE
OF HOUSEHOLD INCOME
Adjusted for income (PPP) Adjusted with expenditure
cap of 15%
Average Average Current Projected
HHLD income HHLD income expenditure expenditure
(NGN) (US$) (% of Income) (% of Income)
Urban 42.287 3,903 7.4 8.8
Semi-Urban 40.209 3,712 7.3 9.2
Rural 31.711 2,927 7.0 8.0
Total 36.394 3,359 7.0 8.0
(Source: NBS, 2006)
12. newnigeria.qxp 2008/03/28 11:37 AM Page 37

NNiiggeerriiaa
38 2007 Telecommunications Sector Performance Review
The data suggests that the average monthly expenditure of rural
households is only some 4% lower than for urban households, though
cost components in the case of rural households include costs of trav-
elling to nearest phone booth or phone access point.
TABLE 10A: 2006 LOW OECD USER BASKET – COST IN US$ USING NOMINAL
END OF 2006 EXHANGE
Esselaar, Gillwald and Stork (2007)
TABLE 10B: 2006 LOW OECD USER BASKET – COST IN US$ USING IMPLIED PPP
CONVERSION RATES
Esselaar, Gillwald and Stork (2007)
12. newnigeria.qxp 2008/03/28 11:37 AM Page 38

NNiiggeerriiaa
392007 Telecommunications Sector Performance Review
COST OF INTERNET ACCESSTariffs for Internet access, like those for voice communications serv-
ices use have, on average, steadily declined from 2000 to date, as sug-
gested by available data (NCC, 2006). The figures indicate that the most
significant drops were recorded in the monthly charges for VSAT con-
nections (by far the most popular), which dropped from NGN120,000 in
2000 to just about NGN40,000 in 2006. Dial-up connection charges have
remained significantly lower, recording insignificant changes. On the
other, the cost of access through microwave links, which, in 2000 stood
at about NGN120,000 per annum (NGN10,000 per month) have fallen to
about NGN85,000 per annum or NGN7 000 per month in 2006.
Typical charges obtained from two leading Internet Services Providers
(ISPs) in the country are provided in the following tables.
TABLE 11A: BILLING RATE: HOME USERS CATEGORY
Subscription Type Bandwidth Volume Limit Price (NGN)
24hrs access 80K 0.5GB 2,625
Night time access (8pm - 8am) 80K 0.5GB 2,500
SKANNET Charges:
Equipment NGN45,000 (= US$350) (inclusive of VAT charges)
Account Activation fee NGN 3,517.50
TABLE 11B: BILLING RATE: BUSINESS/OFFICE CATEGORY
Subscription Type Bandwidth Volume Limit Price (NGN)
24-hr access 96K 1.3GB 5,250
24-hr access 128K 2.8GB 10,500
24-hr access 160K 4.0GB 15,750
24-hr access 192K 7.5GB 26,250
24-hr access 224K 11GB 38,050
24-hr access 256K 15GB 52,030
24-hr access 288K 23GB 76,500
24-hr access 320K 30GB 103,650
SKANNET Charges:
Equipment NGN45,000 (= US$350) (inclusive of VAT charges)
Account Activation fee NGN 3,517.50
12. newnigeria.qxp 2008/03/28 11:37 AM Page 39

NNiiggeerriiaa
40 2007 Telecommunications Sector Performance Review
WEB ACCESS RESOURCES LIMITED
a) Dial-up Internet Access
Duration Charges (NGN)
Monthly 5,900
Quarterly 17,000
Bi-annually 34,000
Yearly 45,000
Yearly (Corporate) 52,000
b) Enterprise Solution
– Equipment cost Point–to–Multi-point without amplifier
NGN600,000
– Equipment cost Point–to– Multi-point with 1 amplifier
NGN705,000
– Equipment cost Point–to–Multi-point with 2 amplifiers
NGN1,000,000
c) Wireless Internet Service Charge (Monthly, exclusive of VAT)
– Dedicated 32/32KBps
NGN100,000.00
– Dedicated 64/64KBps
NGN200,000.00
12. newnigeria.qxp 2008/03/28 11:37 AM Page 40
NNiiggeerriiaa
412007 Telecommunications Sector Performance Review
Sector Achievements and Regulatory Challenges
The main objective in this section is to assess the achievements of the
ICT sector against performance measures specified by policy and reg-
ulatory objectives. As noted by the NCC, the overall performance
objective centers around the creation of a competitive telecommunica-
tions market capable of meeting the specific objectives set forth by the
National Telecommunications Policy, which may be summarised as fol-
lows (NCC, 2002):
! to facilitate the institution of an information rich and communications-
technology-based economy;
! to ensure the emergence of a seamless national network and optimised
telecommunication infrastructure;
! to enable efficient service delivery..
To further these objectives, the NCC in 2002 published a five-year
strategic management plan, with the goals and targets summarised
briefly below. Details of these goals and targets are available in the NCC
publication referred to here (NCC, 2002), but it suffices for the purpose
of this report to point out that the document also specifies measures
with which the organisation’s performance in terms of meeting the set
objectives are to be measured.
The Commission’s strategic plan of action focuses on the promotion of
market entry in the telecommunication’s sector as its primary goal,
with the objective of providing reliable, affordable and efficient serv-
ices for the citizens. From this goal, other goals and objectives may
derive, including:
! establishing an effective and efficient enforcement mechanism and
ensuring consumer protection;
! ensuring the effective and economically and technologically effi-
cient use of the radio spectrum;
! establishing standards comparable to the best in the world for
telecommunications services;
! developing a sustainable institutional framework for the achieve-
ment of universal services and universal access;
! promoting cooperation with other government agencies, the private
sector, and international organisations;
! instituting an effective and efficient organisational framework
towards the continuous improvement of regulatory capacity.
The telecommunications regulatory environment survey, which does
not simply assess the regulator but the entire telecommunications reg-
12. newnigeria.qxp 2008/03/28 11:37 AM Page 41

NNiiggeerriiaa
42 2007 Telecommunications Sector Performance Review
ulatory environment including the policy framework and regulatory
effectiveness, was run across several other African countries as part
of a wider RIA! project. Nigeria was one of the few countries to score
positively in terms of regulatory effectiveness, a tribute to the gains
made by the NCC over the last few years, the other with a positive out-
come being Côte d’Ivoire.
FIGURE 12: TRE SCORES: AVERAGE SCORE ACROSS ALL CATEGORIES
Source: Esselaar, Gillwald and Stork (2007)
REGULATORY CHALLENGESThe analysis undertaken and described in Annexe A clearly reveals
that the NCC, as the main sector regulator in Nigeria, has performed
well above average in most areas of sector regulation endeavors.
Indeed liberalisation has attracted very many gains, including expo-
nentially improving teledensity measures, increasing awareness and
use of the Internet, and increasing levels of investment in the sector.
There are nonetheless several areas in which performance could be
better. Industry stakeholders and commentators all share the view that
there are certain key policy and regulatory challenges that need atten-
tion in order to further improve the sector performance landscape.
These challenges may be summarised as follows ( Omo-Ettu, 2006;
Intelcom, 2005; Farroukh, 2006)):
! Effectiveness of liberalisation has yet to be fully felt in all sub-sectors;
! Policies appear to be technology biased. Commonly cited examples
include high licence fees for satellite frequencies and the yet-to-be
12. newnigeria.qxp 2008/03/28 11:37 AM Page 42

NNiiggeerriiaa
432007 Telecommunications Sector Performance Review
resolved issue of formal ruling on the status of VoIP, WiMax,
and WiFi2;
! High lending rates coupled with limited availability of local funds;
! Slow local rate of skills acquisition / limited local ICT equipment
production capacity;
! Limitations imposed by high import duties for telecommunication
and ICT equipment;
! Poor state of the public electric power supply industry, leading to
ordinarily avoidable overheads and attendant effects on service
pricing;
! Poor state of roads;
! General insecurity;
! Inability / refusal of some operators to quickly settle interconnec-
tion debts;
! Network challenges( mainly uptime and quality issues) in the South
Eastern areas of the country;
! Quality of mobile communications services which have not
improved significantly from the status in 2001.
These challenges combine either directly or indirectly to undermine
the commendable efforts of the regulator and the adequacy of the
framework, with the result that ownership of basic ICT devices
(phones, PCs, etc) is still at a very low level. Indications are that the
regulator is aware of these challenges and is addressing them through
consultations with appropriate agencies of government, with a view to
finding lasting solutions.
12. newnigeria.qxp 2008/03/28 11:37 AM Page 43

NNiiggeerriiaa
44 2007 Telecommunications Sector Performance Review
Conclusions and Recommendations
This report has reviewed the performance of the ICT sector in Nigeria,
using standard performance metrics as indices for performance meas-
urement. A brief overview of the policy and regulatory environment is
given in the first section of the report, and with this definition of the
reform model adopted for use by the country, it becomes possible to
assess the performance of the market in terms of operators’ market
share, investors’ perception (as measured by level of investments), and
the capacity of the market to generate employment. One important sec-
tor performance indicator is the level of access to ICTs, and for a devel-
oping country like Nigeria, the extent to which access is available in the
rural areas is of critical importance. Available data reveals that
whereas access to telephones is increasing at a tremendous rate in the
country, most of the impact of the market reforms in that regard, is lim-
ited to urban and semi-urban areas of the country. On the other hand,
Internet penetration is at the low level of 2%, and the majority of the
Internet users (some 78%) are to be found in Lagos, the country’s com-
mercial centre. The use of broadband for access is still in its infancy,
but it would appear that with the coming on stream of a unified licence
regime, broadband use will experience an exponential growth. Without
doubt, market reforms have impacted hugely on the tariff regimes for
access to ICTs. Average costs of local calls on fixed lines, which stood
at well over NGN100 before the advent of liberalisation, have fallen to
below NGN80, though the drop in mobile telephony calls stands at 6.9%,
despite increasing competition.
Using strategies set forth by the NCC’s strategic management plan as
an analytical tool, the review examined the extent to which policy
objectives had been met over the period of the review. The analysis
revealed that the regulatory body has performed better than average,
in spite of unavoidable limitations. In particular, the Commission’s
notable achievements include the publication of interconnection rules
and guidelines, development of a viable spectrum plan for the country,
the institution of a consumer affairs bureau, and development of vari-
ous regulations directed at promoting fair industry market practices.
A survey carried out during the course of the review examined the per-
ception of the regulatory environment by industry stakeholders. The
findings of that survey (Annexure II of this report) clearly support the
foregoing conclusions about the performance of the sector and the
main sector regulator.
In terms of penetration in the rural areas, it is to be observed that
mobile communications services are now available in all of the coun-
try’s 36 states, covering half of the 776 local governments, and a mini-
12. newnigeria.qxp 2008/03/28 11:37 AM Page 44

NNiiggeerriiaa
452007 Telecommunications Sector Performance Review
mum of 15,000 towns, villages, and communities. A perusal of the list
of regulatory challenges presented in the previous section of this
report will show that a good number of these challenges (poor infra-
structure, lending rates, import duty rates, security issues) are outside
the jurisdiction of the ICT regulator; but in addition to being well-posi-
tioned to influence and catalyse positive action from those government
agencies concerned, the commission is also well-advised to review
implementation strategies on matters concerning full liberalisation of
the sector, legislation on VoIP, Wifi, etc, bad interconnection debts, poor
quality of mobile communications services, and network challenges
(particularly security issues).
KEY RECOMMENDATIONS
The recommendations indicated by the outcomes of the foregoing
review of the performance of the ICT sector in Nigeria are as follows:
! One of the most critical challenges in the sector concerns owner-
ship of basic ICT devices and costs of services. A policy review that
will facilitate the lowering of costs for PCs, mobile handsets, fixed
(wired and wireless) handsets, cost of bandwidth and ICT services
in general, is indicated. The Universal Service Provision Fund
offers a number of possibilities in this regard;
! The commission should find means of effectively enforcing the pro-
visions of its quality of service regulations as a means of attracting
improvements;
! Consumer demands appear greater than anticipated by the strate-
gic measures in place. A comprehensive study to clearly identify
the demands (if not already done, as appears to be the case) should
be carried out before the Universal Access Projects move too far in
the direction in of implementation;
! Initiatives directed at skills acquisition, capacity building, and
micro-financing in the ICT sector should be reinforced;Power sup-
ply in the country has been rather unreliable, forcing operators to
seek alternative solutions, thus attracting significant and avoid-
able overheads. It is expected that remedial actions will come from
the ongoing restructuring of that sector, and the NCC’s continuing
contributions, based on its experience in the ICT sector, should
prove invaluable;
! So-called illegal operations by ISPs who offer voice services remain
a vexing issue. A clearer legal position is desirable;
12. newnigeria.qxp 2008/03/28 11:37 AM Page 45

NNiiggeerriiaa
46 2007 Telecommunications Sector Performance Review
! Special concessions should be obtained from government on
import duties for imported telecommunications and ICT equip-
ment. Such concessions should be readily forthcoming, if well-
articulated arguments are put together;
! Consultations with local finance houses should continue in order to
find mutually satisfactory solutions to the problem of high lending
rates;
! Finally, the general security situation in the country is alarming,
and not conducive to investment, but the issue needs to be
addressed at the wider national level.
12. newnigeria.qxp 2008/03/28 11:37 AM Page 46

NNiiggeerriiaa
472007 Telecommunications Sector Performance Review
References
Ndukwe, Ernest (2005): “Country experience in Telecoms Market Reforms/Nigeria”,
www.ncc.gov.ng/country experience 2006 0705.pdf
Wills, A and Daniels, G (2005): “Nigeria Telecommunications Market, a Snap-View” White
Paper, Africa Analysis, pp1-8, April, 200
Federal Republic of Nigeria (2003): “Nigerian Communications Act 2003”, www.ncc.gov.ng
Ajayi, GO (2002):”Bridging the digital divide; the Nigerian case study”, Presented at the developing 2002
Federal Republic of Nigeria (2001): “National Policy for Information Technology, USEIT”,
www.uneca.org/nici/documents/IT%20policy%fornigeria.pdf
National Information Technology Development Agency NITDA (2005): “NITDA begin strategic plan for
the implementation of Nigeria IT policy”, www.nitda.org
World Trade Organisation (WTO, 2004): Trade Policy Review: report by secretariat”,
www.wto.org/english/trupt_e/tpr_e/s147-2e.doc
Nigerian Communications Commission (2006): “Competition Practices Regulations 2006”,
www.ncc.gov.ng
Nigerian Communications Commission (2003): “Guidelines on interconnection of telecommunications
networks”, www.ncc.gov.ng
Nigerian Communications Commission (2005): “Licensing framework for unified access services in
Nigeria” www.ncc.gov.ng
Economic Community of West African States (2005): “Achievements of ECOWAS; development of
physical infrastructure, roads, telecommunications and energy”
http://www.sec.ecowas.int/sitecedeao/english/achievements-2.htm
Ndukwe, E (2003): “In furtherance of regional cooperation”, presented at the global symposium for
regulators Hong Ku, China, 7-8 December 2003. Document 27
West African Telecommunications Regulators Association (WATRA): “Constitution of the West African
Telecommunications Association, WATRA”, www.ncc.gov.ng
Federal Republic of Nigeria(2002): “National Telecommunications Policy”, www.nigerian-laws.org
Farroukh, A (2006):”Country overview, Nigeria”, MTN (Nigeria)
http://www.mtn.com/mtn.group.web/Uploads/d8eec89f-5254-4234-96ef-c0727ff2d5cb.pdf
Odufuwa, F (2006): “Nigeria ICT Outlook and Forecasts”, Presentation at the CTO 2006, MUSON Cen-
ter, Lagos, Nigeria
Federal Government of Nigeria (2006): “Draft Competition Bill”’, http://www.bpeng.org/docs/Competi-
tion%20Bill%20(Draft).doc
National Bureau of Statistics (2006): “Core Welfare Indicators Questionnaire Survey, Final Statistical
Report”, August, 2006. www.bpeng.org/docs/Competition%20Bill%20(Draft).doc
Nigerian Communications Commission (2006):”Industry Statistics”. www.ncc.gov.ng
Omo-Ettu, T (2006): “Report of audit/verification of the operations of Internet Service Providers in Nige-
ria” Submitted to the NCC, October, 2006
INTELCON (2006): “Final report on expanded national demand study for Universal Access Project; Part
1 Household Survey” Submitted to the NCC, December 16, 2005.
Nigerian Communications Commission (2002): “Five-year Strategic Management Plan 2003-2007,
Final”, www.ncc.gov.ng
12. newnigeria.qxp 2008/03/28 11:37 AM Page 47

NNiiggeerriiaa
48 2007 Telecommunications Sector Performance Review
Annex A
TABLE 12.13: PLANNED (NCC, 2002) VS. ACHIEVED ANALYSIS
Performance Indicators and Measures3
Indicator:
Promote Market Entry and Cooperation in the Telecommunications Sector
Performance Metrics
! Number and experience of organisations attracted to supply telecommunications services
! Public perception of transparency in telecommunications regulation
! Public perception of effectiveness of telecommunication regulations
! Significant rise in investments in industry leading to improved distribution and quality of ser-
vice
! Promote as required by Government, the privatisation of NITEL
! Issuance of contracts and licences in connection with Wire Nigeria (WIN) project
! Mix and balance of licensed operators in each market sector, contributing to improved delivery
! Downward trend in tariffs
! Teledensity growth nationally
! Reduction in consumer complaints
! Existence of a tariff policy for all industry sectors
Corresponding findings of the review exercise
Regulator is perceived by the public as being transparent and effective. Investments in the
sector have increased dramatically, and whilst distribution has also improved, there is a lot
of room for improvement of quality of service. NITEL has since been privatised, but WIN has
yet to make any significant impact. The mix and balance of licensed operators is good, and
there is a definite downward trend in tariffs.
Teledensity is improving at a commendable rate, but it is debatable whether consumer complaints
have been reduced to any significant extent.
Performance Indicators and Measures3
Indicator:
Establish an effective and efficient enforcement mechanism and ensure consumer protection:
Performance Metrics
! Availability of compliance information, including consequences for non-compliance with licence
obligations
! Creation of an adequately resourced enforcement team
! Adequacy of legal powers to ensure compliance or punitive action
! Reduction in, and eventual removal of illegal operators or service provision
! Availability of terms of reference for the commission to make a determination in the case of dis-
pute between licensed operators or service providers
! Effectiveness of a code of conduct on the performance of licensed operators or service providers
! Reduction in turn around time of dispute resolution through the introduction of a standard for
resolution mechanisms
! Effectiveness of consumer education programmes and interest groups and interaction (feed-
back) procedures
! Reduction in turn around time resulting from the introduction of an automated complaint reso-
lution process
12. newnigeria.qxp 2008/03/28 11:37 AM Page 48
NNiiggeerriiaa
492007 Telecommunications Sector Performance Review
Corresponding findings of the review exercise
Compliance information is readily available and widely publicised, but it is doubtful that
the enforcement team is as effective as it should be. Despite the adequacy of the Commissi-
on’s legal powers, it has proved difficult to significantly reduce the extent of illegal opera-
tions, due on the one hand to the ingenuity of illegal operators and on the other hand, to
breadth and spread of the operations. The conflict resolution mechanisms have been tested
and proved fairly effective, though they have yet to be automated as planned. Consumers,
through the consumers’ parliament, are receiving desirable education, and have in the
parliament an effective platform for getting reactions for their complaints.
Performance Indicators and Measures3
Indicator:
Ensure optimal use of spectrum
Performance Metrics
! Degree of frequency reuse applied to the transmission system deployed throughout Nigeria rela-
tive to accepted global practice
! Increase in the number of spectrum-based services and the introduction of new services and
technologies requiring spectrum allocation
! Reduction in the number of (or where feasible, elimination) of unlicensed commercial service
providers
! Publication of a policy on spectrum management
! Publication and industry acceptance of a spectrum plan for the telecommunications industry
! Reduction in the reported cases of harmful interference of licensed operators
! Reduced response time in dealing with interference complaints
! Progressive increase in spectrum occupancy data made available to frequency licensing unit
! Degree to which the commission is prepared with respect to making spectrum available to ser-
vices as they apply in the global environment
! Report on the investigations of the possibilities and potentials of broadband wireless services in
Nigeria
! Report on the studies of the potentials and implications of introducing commercial land mobile
radio services in Nigeria
Corresponding findings of the review exercise
The spectrum management capabilities of the Commission in terms of these metrics are quite
good. The frequency plan published has been widely accepted by industry players, and with
imminent auction of licences for the 2GHz band, a reduction is expected in the number of
unlicensed commercial services providers.
Performance Indicators and Measures3
Indicator:
Ensure standards for telecommunications services that are comparable to international
telecommunications union (ITU) recommendations and other relevant standards.
Performance Metrics
! Improvement in the grade of service supplied to consumers including but not limited to a higher
number of call completions and reduction in call drop outs
! Improvement in the quality of service supplied to consumers including but not limited to reduc-
tion in waiting lists, accuracy of consumer service information, reduction in fault handling
times, etc
! Reliability of systems and components through compliance with minimum availability criteria
set by the commission
! Difference in actual performance of Nigerian operators when benchmarked against other coun-
tries with regard to technical and operational standards
! Creation of a revised numbering plan capable of addressing the numbering requirements for
Nigeria to 2010
12. newnigeria.qxp 2008/03/28 11:37 AM Page 49

NNiiggeerriiaa
50 2007 Telecommunications Sector Performance Review
Corresponding findings of the review exercise
The call drop out rates and particularly call incompletion rates have yet to satisfactorily
reduce, even if there is a downward trend. Waiting lists are now virtually non-existent (par-
ticularly for fixed wireless and mobile wireless services) but there is room for improvement
in the area of fault handling. A revised numbering plan has been published, and it meets the
stated specifications. Whereas operators in Nigeria have put in place commendable opera-
tional and technical services, there are just too many local constraints working against their
meeting the best of international connection standards.
Performance Indicators and Measures3
Indicator:
Promote Universal Access and Rural Telecommunications Services:
Performance Metrics
! Completion and articulation of an instrument for universal access
! Completion and articulation of a universal access strategy for Nigeria
! Establishment of a universal access fund and articulation of the processes to manage the fund
! Establishment of policies and strategies on disbursement and investment mechanism for the
universal access fund
! Effectiveness of micro-financing arrangements
! Availability of cost-effective interconnection capacity for university access applications
! Economic benefits of incentives for rural operators
! Availability and teledensity of telephones in rural communities with a minimum population of
500
! Increased telephone access in underserved areas
! Steady reduction in the number of rural communities without access to telephone
! Availability of telephone access to all local government areas throughout Nigeria
Corresponding findings of the review exercise
The Universal Access and Universal Service Regulations published by the NCC certainly satisfy
the first performance metrics listed. Local banks have bought the concept of micro-financing, and
it is most likely that suitable arrangements will be made when UA projects eventually take off.
Though arrangements have been concluded for the implementation of the articulated UA policy
(the Universal Service Provision Fund began operations earlier in 2006, with the appointment of
a team including an Executive Secretary, and applications have been invited and received from
would-be contractors and operators) the projects have yet to commence at the time of this report.
Performance Indicators and Measures3
Indicator:
Promote cooperation with other government agencies, local communities, private sector, and
international organisations:
Performance Metrics
! Creation of regular constructive working relationships with Ministries and government agen-
cies
! Effective and productive relationships with private sector
! Regular consultation with stakeholders including local community groups
! Increased influence of commission in relevant inter-governmental activities and policy develop-
ment bodies and feedback of knowledge to wider telecoms community within Nigeria
! Creation of regular, constructive working relationships with influential international and regio-
nal representative bodies
! Effective and productive relationships with other national regulatory authorities
! Increase in the number of requests for Commission’s staff to attend and present papers or
points of view at international meetings
12. newnigeria.qxp 2008/03/28 11:37 AM Page 50

NNiiggeerriiaa
512007 Telecommunications Sector Performance Review
! Degree of technical, commercial, and / or operational benefits accruing to Nigeria of wider
regional representation
! Increase in the range and frequency of training and development programs available to the
commission and its peers
! Effectiveness of established interactive forums with and between regional and international
organisations
! Increased influence of Commission in relevant international bodies as a contributor to setting
both agenda and deliverables
Corresponding findings of the review exercise
This is one area in which the NCC has performed excellently. All listed performance metrics
were assiduously pursued, and results were outstanding.
Performance Indicators and Measures3
Indicator:
Establish an effective and efficient organisational framework to increase regulatory capacity.
Performance Metrics
! Increased level of consultations with all interested parties in key decision-making processes
! Enhancement of draft communication law (or pending legislation)
! Establishment of a central library and knowledge management system
! Existence of a performance management system
! Creation of a budgetary control system for budget setting and regular financial reporting
! Timely production of annual activity reports
! Opening of commission’s telecommunications training institute
! Establishment of new zonal offices
! Establishment of appropriate data gathering and feedback mechanisms in respect of consumer
and industry education
Corresponding findings of the review exercise
The NCC has certainly over the years increased its level of consultation with industry stakehold-
ers through the organisation of workshops, serving notices of intended rule-making, etc. With the
passing of the Communication ACT 2003, the NCC can claim a major achievement in addition to
that, due to the commencement of training at the Digital Bridge Institute, Abuja. New zonal
offices have been created in the country’s 6 geo-political zones, and although the data gathering
mechanisms appear adequate, the same cannot be said of the data dissemination process; for
example, no annual activities report has been produced, to the best of our knowledge.
12. newnigeria.qxp 2008/03/28 11:37 AM Page 51
NNiiggeerriiaa
52 2007 Telecommunications Sector Performance Review
Annexe BLICENCE FRAMEWORK (NCC, 2006)
Objectives
! Encouragement of the growth of new applications and services;
! Simplification of existing licensing procedures to ease market entry and operations;
! Regulatory flexibility to address market and technological developments;
! Efficient utilisation of network resources, so that individual networks may be used to provide a
broad range of ICT services;
! Encouragement of a full range of operators, including large scale and micro entrepreneurs.
To ensure that the transition to a converged licensing regime fosters a level playing field among all
competitors,countries have introduced new licensing approaches and opted for different models.
These include:
! Distinguishing between facilities-based and service-based licences;
! Distinguishing between network facilities providers, network service providers, application ser-
vice providers and content application service providers;
! Unifying licences to encompass all ICT services or defined licence clusters under a single licen-
sing classification;
! Establishing a general authorisation process, eliminating licences except for scarce resources
such as spectrum and numbers.
In Nigeria, the law provides for the categorisation of licences as individual or class licences. In the
current setup, licensing covers a broad variety of network operations and service provisions.
OPTIONS FOR UNIFIED LICENSING
In deciding the framework for Unified Licensing, the following aspects were considered:
! The mapping of existing service specific licences into Unified licensing model
! The scope of Unified licence
! The limits of Unified licensing
! The desired level of regulation
! Licence fees
! Implementation strategy for Unified licensing regime: Phased or one-step implementation.
Keeping the above in mind, several options on how to shape the new licensing regime were consid-
ered, taking into consideration the Nigerian environment. These options were varied in terms of serv-
ices to be covered by licence, types of licences and time-schedule for implementation. At the conclu-
sion of this exercise the following option emerged as the best for unified licence at this time.
THE LICENCE
The Commission is introducing a Unified Access Service licence as an individual licence under the
powers granted to it by section 32 of the Nigerian Communications Act, 2003.
TENURE
The Licence will be valid for a period of ten years from the date it is issued with an option for renewal
for the same term.
SCOPE OF THE LICENCE
The Unified Service licence will cover the following services:
! Fixed Telephony whether wired or wireless;
! Digital Mobile Services; International Gateway Services
! National Long Distance Services;
! Regional Long Distance Services.
In the Unified Access Service licence, the following services will be allowed;
! FWA and PNL licensees (Fixed Telephony and LEO) will be allowed to provide mobile services
subject to the frequency assignment and geographical limitations in the original licence;
! Digital Mobile licensees will be allowed to provide fixed and data services;
! All Unified Licensees will be able to provide ISP, VAS and Payphone services;
! International Gateway for own use and third party will be allowed.
12. newnigeria.qxp 2008/03/28 11:37 AM Page 52
NNiiggeerriiaa
532007 Telecommunications Sector Performance Review
Please note that National carrier licences and all other existing licences will remain unchanged.
QUALIFICATION CRITERIA
To be eligible for unified licence existing licensees must meet the following criteria;
! Have an existing and operating network infrastructure;
! Have a customer base of at least 10,000 connected subscribers or justifiable evidence of financial
capability for substantial network rollout;
! Be up to date Payment of all fees and charges due to the Commission such as Annual Operating
Levy (AOL), Spectrum and Numbering fees;
! Be up to date on submission of annual audited accounts;
! Be up to date on payment of company tax;
! Be up to date with equipment type approval;
! Be up to date in settlement of Interconnection obligations;
! New applicants will be subject to the usual licensing application requirement.
SERVICE AREA
The service area will be as in the original licences issued by the Commission to the applicant. A
nationwide mobile or FWA licence will be converted in a nationwide Unified licence and a regional
FWA or PNL licence will be converted into a Unified licence that covers the same region.
ROLLOUT OBLIGATIONS
In line with technological advancements, many regulators are reviewing their universal access poli-
cies for the new converged environment, It is no longer thought necessary to apply rollout obliga-
tions to licensees. To spur the growth of rural service provision, regulators are rethinking their
strategies and it has been found that reduced entry barriers, lower entry fees, infrastructure shar-
ing and unhindered use of new wireless broadband technologies are more effective measures to
promote cost-effective and rapid deployment of last-mile network technologies in rural and
unserved areas.
However, a purely market-based approach to universal service has its limits, and if resources become
stretched, remote and rural areas face the risk of remaining significantly underserved. Therefore, it
is important to define national universal access targets and to develop mechanisms, such as estab-
lishing a universal access fund, designation of universal access operators or service areas subject to
special treatment under a universal service approach. The Commission is developing universal access
regulations in order to achieve service penetration that also includes marginalised groups and disad-
vantaged regions.
The Commission will not impose separate rollout obligations on unified licensees, but rather deal with
universal access issues in a separate universal access regulation, in which universal access targets
and respective designation mechanisms are defined.
NUMBERING
As a guiding principle, numbering blocs assigned to the operators will take into consideration the dif-
ferent needs of operators and provide distinctive numbering assignments for nation-wide and local
service providers. Interconnection problems will otherwise emerge, as fixed services may not be dis-
tinguishable from mobile services.
One important question in implementing the Unified licence is the category of numbers an FWA oper-
ator providing full mobility services should use.
It is recommended that FWA operators be obliged to provide fixed services on demand. FWA sub-
scribers who use this service will retain fixed numbers while new subscribers to fully mobile services
of these operators will use a new mobile number.
It is also recommended that fixed line operators retain fixed numbers while new subscribers to fully
mobile services will use new mobile numbers.
Numbering fees are to be paid for the allocation of numbering and for annual renewal.
12. newnigeria.qxp 2008/03/28 11:37 AM Page 53

NNiiggeerriiaa
54 2007 Telecommunications Sector Performance Review
INTERCONNECTION
Under the Communications Act, 2003 there is an obligation for interconnection. Most FWA and PNL
operators interconnect directly with the fixed and mobile operators.
The move to the Unified licence regime will therefore not change the structure of interconnection.
The interconnection obligation remains mandatory for all operators. Dominant operators will be man-
dated to publish a list of local and tandem exchanges on which interconnection is possible and also
publish a Reference Interconnection Offer (RIO).
FREQUENCY MANAGEMENT
Frequency Spectrum issues will be dealt with separately as provided for under the Act and Spectrum
licences. Frequency Spectrum fees will be paid in accordance to the Frequency Spectrum (Fees and
Pricing, etc) Regulations, 2004.
NUMBER OF UNIFIED LICENCES TO BE ISSUED
In the new framework, unified licence operations would be open to competition, subject however to
the availabibilty of frequency spectrum.
The Commission may, however, consider issuing a new licence if it determines that the competitive
environment is inadequate.
QUALITY OF SERVICE
Unified Licensees will be mandated to maintain the quality of service standard prescribed by the
Commission and other quality of service thresholds mandated.
OPERATING LICENCE FEES (A)
The Commission proposes the following fee schedule for National and Regional Mobile service.
National Mobility (Based on the tier structure in table below):
Tier 1. NGN33,000,000
Tier 2. NGN20,000,000
Tier 3. NGN16,000,000
Tier 4. NGN14,000,000
Tier 5. NGN9,000,000
OPERATING LICENCE FEES (B)
The following fee schedule is proposed for any fixed telephony operator wishing to migrate to a Uni-
fied licence:
Operating licence fee for mobile service as appropriate
Operating licence fee for International Data Access (Gateway) NGN25,000,000
Operating licence fee for National long Distance NGN20,000,000
Operating licence fee for regional long Distance (within a state) NGN1,000,000
Note: Any PTO wishing to migrate to Unified Licensing should surrender its existing licence and would be credited with
the unexpired portion of its licence fees and issued a unified licence of 10 years’ tenure.
OPERATING LICENCE FEES (C)
Fees to be paid by existing mobile operators wishing to migrate to Unified licence
Operating licence fee for Fixed Telephony N44,600,000
Operating Licence fee for International Gateway N 50,000,000
Operating Licence fee for National Long Distance N20,000,000
12. newnigeria.qxp 2008/03/28 11:37 AM Page 54
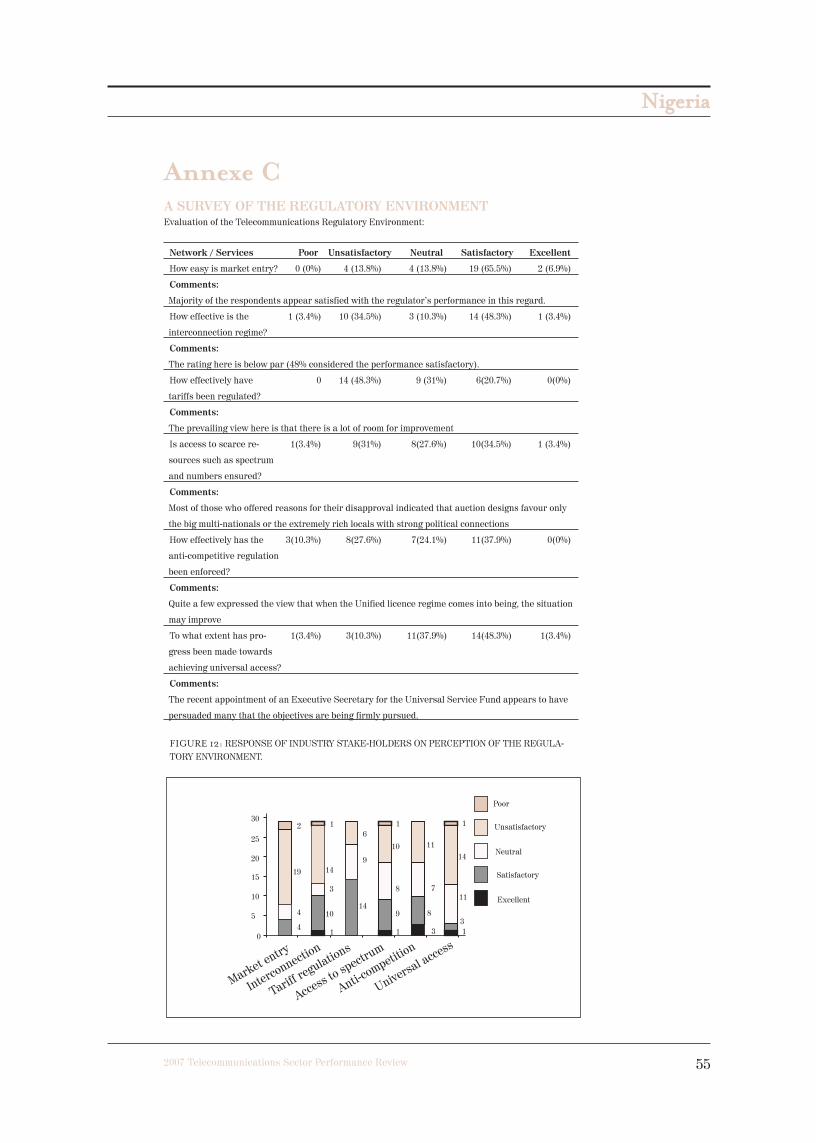
NNiiggeerriiaa
552007 Telecommunications Sector Performance Review
Annexe CA SURVEY OF THE REGULATORY ENVIRONMENT
Evaluation of the Telecommunications Regulatory Environment:
Network / Services Poor Unsatisfactory Neutral Satisfactory Excellent
How easy is market entry? 0 (0%) 4 (13.8%) 4 (13.8%) 19 (65.5%) 2 (6.9%)
Comments:
Majority of the respondents appear satisfied with the regulator’s performance in this regard.
How effective is the 1 (3.4%) 10 (34.5%) 3 (10.3%) 14 (48.3%) 1 (3.4%)
interconnection regime?
Comments:
The rating here is below par (48% considered the performance satisfactory).
How effectively have 0 14 (48.3%) 9 (31%) 6(20.7%) 0(0%)
tariffs been regulated?
Comments:
The prevailing view here is that there is a lot of room for improvement
Is access to scarce re- 1(3.4%) 9(31%) 8(27.6%) 10(34.5%) 1 (3.4%)
sources such as spectrum
and numbers ensured?
Comments:
Most of those who offered reasons for their disapproval indicated that auction designs favour only
the big multi-nationals or the extremely rich locals with strong political connections
How effectively has the 3(10.3%) 8(27.6%) 7(24.1%) 11(37.9%) 0(0%)
anti-competitive regulation
been enforced?
Comments:
Quite a few expressed the view that when the Unified licence regime comes into being, the situation
may improve
To what extent has pro- 1(3.4%) 3(10.3%) 11(37.9%) 14(48.3%) 1(3.4%)
gress been made towards
achieving universal access?
Comments:
The recent appointment of an Executive Secretary for the Universal Service Fund appears to have
persuaded many that the objectives are being firmly pursued.
FIGURE 12: RESPONSE OF INDUSTRY STAKE-HOLDERS ON PERCEPTION OF THE REGULA-
TORY ENVIRONMENT.
12. newnigeria.qxp 2008/03/28 11:37 AM Page 55

NNiiggeerriiaa
56 2007 Telecommunications Sector Performance Review
A total of 70 questionnaires were distributed (physically and electronically by e-mail) to respondents
in academics, the press, and in the telecommunications services provision industry. Of these, only
29 (about 41%) were completed and returned. It is noteworthy that all nine respondents who accepted
e-mail deliveries completed and returned the questionnaires.
As suggested by numbers in the table and the graphical display of the responses, the following conclu-
sions may be drawn:
a) Most of the respondents are satisfied that the environment makes for easy market entry;
b) Whilst 48% of the respondents expressed satisfaction with the effectiveness of the interconnection
regulations, 34.5% of them were not satisfied, and 10% were undecided;
c) Tariff regulations attracted the worst rating, with 48.3% of respondents expressing dissatisfac-
tion, and about 21% satisfaction.
d) This is followed by the anti-competition regulations, which 28% regard as not being effective,
though 24% were undecided, whilst some 40% felt that the regulations were effective.
12. newnigeria.qxp 2008/03/28 11:37 AM Page 56

Towards an
African e-Index 2007Telecommunications Sector
Performance in 16 African countries
a supply side analysis of policy outcomes
STEVE ESSELAAR
ALISON GILLWALD
CHRISTOPH STORK
This Policy Research Paper Series is madepossible through the support of the International Development Research Centre(IDRC)
For further information see http://link.wits.ac.za
Tel:+27 11 7173913
Fax:+27 11 7173910
LINK Centre
Graduate School of Public Development Management
Witwatersrand University
Johannesburg
Box 601, Wits, 2050
http://link.wits.ac.za
African comparative country profile.qxp 2008/02/13 04:02 PM Page 1